
Click to Download PDF -
168
VOLUME NO. 2 (2012), ISSUE NO. 12 (DECEMBER) ISSN 2231-1009 A Monthly Double-Blind Peer Reviewed (Refereed/Juried) Open Access International e-Journal - Included in the International Serial Directories Indexed & Listed at: Ulrich's Periodicals Directory ©, ProQuest, U.S.A., EBSCO Publishing, U.S.A., Cabell’s Directories of Publishing Opportunities, U.S.A., Open J-Gage, India [link of the same is duly available at Inflibnet of University Grants Commission (U.G.C.)], Index Copernicus Publishers Panel, Poland with IC Value of 5.09 & number of libraries all around the world. Circulated all over the world & Google has verified that scholars of more than 1866 Cities in 152 countries/territories are visiting our journal on regular basis. Ground Floor, Building No. 1041-C-1, Devi Bhawan Bazar, JAGADHRI – 135 003, Yamunanagar, Haryana, INDIA http://ijrcm.org.in/
-
Upload
khangminh22 -
Category
Documents
-
view
0 -
download
0
Transcript of Click to Download PDF -

VOLUME NO. 2 (2012), ISSUE NO. 12 (DECEMBER) ISSN 2231-1009
A Monthly Double-Blind Peer Reviewed (Refereed/Juried) Open Access International e-Journal - Included in the International Serial Directories Indexed & Listed at:
Ulrich's Periodicals Directory ©, ProQuest, U.S.A., EBSCO Publishing, U.S.A., Cabell’s Directories of Publishing Opportunities, U.S.A., Open J-Gage, India [link of the same is duly available at Inflibnet of University Grants Commission (U.G.C.)], Index Copernicus Publishers Panel, Poland with IC Value of 5.09 & number of libraries all around the world.
Circulated all over the world & Google has verified that scholars of more than 1866 Cities in 152 countries/territories are visiting our journal on regular basis.
Ground Floor, Building No. 1041-C-1, Devi Bhawan Bazar, JAGADHRI – 135 003, Yamunanagar, Haryana, INDIA
http://ijrcm.org.in/

VOLUME NO. 2 (2012), ISSUE NO. 12 (DECEMBER) ISSN 2231-1009
INTERNATIONAL JOURNAL OF RESEARCH IN COMPUTER APPLICATION & MANAGEMENT A Monthly Double-Blind Peer Reviewed (Refereed/Juried) Open Access International e-Journal - Included in the International Serial Directories
http://ijrcm.org.in/
ii
CONTENTSCONTENTSCONTENTSCONTENTS
Sr.
No. TITLE & NAME OF THE AUTHOR (S) Page No.
1. FACTORS INFLUENCING KNOWLEDGE SHARING BEHAVIOUR: DEVELOPING A THEORETICAL FRAMEWORK SOOFI ANWAR & DR. K. DURGA PRASAD
1
2. THE IMPACT OF DIRECT AND INDIRECT FACTORS INFLUENCING BRAND EQUITY FOR ONLINE COMPANIES SEYED ALIAKBAR AHMADI, MOHAMMADREZA DARAEI & EHSAN POUSTIAN
4
3. INTEGRATION OF TECHNOLOGY IN TEACHING SENIOR HIGH SCHOOL SOCIAL STUDIES: THE COMPUTER ASSISTED INSTRUCTION EFFECT ON STUDENTS’ PERFORMANCE PAUL DELA AHIATROGAH, BRANDFORD BERVELL & AUGUSTINE YAKUBU
9
4. USING THE ANALYTIC HIERARCHY PROCESS TO ENHANCE PARTICIPATORY DECISION-MAKING IN MULTI-STAKEHOLDER INFRASTRUCTURE PROJECTS: A PIPELINE PROJECT CASE STUDY VICTOR. A. AKUJURU & BANKOLE. O. AWUZIE
16
5. PRACTICAL IMPLEMENTATION OF THE MODEL FOR ‘ORGANIZING, MEASURING, ANALYZING STUDENTS’ KNOWLEDGE AND PERFORMANCE’ ROY MATHEW
24
6. DETERMINANTS OF SMALLHOLDERS’ PARTICIPATION IN LOCAL BASED SEED PRODUCTION SYSTEM: THE CASE OF ONION SEED IN EAST SHOA ZONE OF THE OROMIYA NATIONAL REGIONAL STATE, ETHIOPIA FREAW DEMISE & DAWIT ALEMU
34
7. COINTEGRATION OF KARACHI STOCK MARKET WITH OTHER ASIAN STOCK MARKETS FEHMIDA AKRAM, AISHA AKRAM, SHANZA ARSHAD & MAZHAR IQBAL
43
8. SURVEY ON FACTORS INFLUENCING THE PERFORMANCE OF PLM SYSTEM IN AUTO INDUSTRY M. S. GOPINATHA, DR. VISHNUKANTH S. CHATPALLI & DR. K.S. SRIDHAR
47
9. A STUDY ON QUALITY WORK LIFE WITH REFERENCE TO ENGINEERING COLLEGES AT BANGALORE SUNIL RASHINKAR, SRI HARI.V, DR.SREENIVAS.D.L, LAKSHMI NARAYANA.K & SHAZIA KAUSAR
53
10. POWER & AREA EFFICIENT ROUTER IN 2-D MESH NETWORK-ON-CHIP USING LOW POWER METHODOLOGY – GATE LEVEL POWER OPTIMIZATION SUDHIR N. SHELKE & PRAMOD B. PATIL
61
11. THE STATISTICAL ANALYSIS OF STRUCTURE OF MANUFACTURING SECTOR – WITH SPECIAL REFERENCE TO BANGALORE INDUSTRIAL REGION A. T. SRINIVASA & DR. MUNIVENKATAPPA
68
12. A STUDY ON CONSUMER PERCEPTION OF TATA LPT 3118 12 TYRE VEHICLE OVER 10 TYRE VEHICLES WITH REFERENCE TO THOOTHUKUDI S. JEBASEELI NOVALEENA & DR. A. RANGAWSAMY
75
13. EMPLOYEE ABSENTEEISM IN HEALTH CARE INDUSTRY: A CONCERN FOR THE ORGANIZATION DR. C. SWARNALATHA & T.S. PRASANNA
83
14. WEB CONTENT TRUST ASSESSMENT MODEL USING ADVANCE WEB MINING TECHNIQUES KETAN.J.PATEL, KETAN.D.PATEL & DR. V. R. RATHOD
86
15. PERFORMANCE OF PROFITABILITY MANAGEMENT IN AMARA RAJA BATTERIES LIMITED”, TIRUPATI - AN EVALUATION K.KALYANI & DR. P. MOHAN REDDY
89
16. AN ELABORATION LIKELIHOOD MODEL APPROACH TO PACKAGING AND CHILD-PARENT INTERACTION SURAJ KUSHE SHEKHAR & DR. P.T RAVEENDRAN
93
17. RELATIONSHIP OF FINANCIAL REPORTING QUALITY WITH SALES VOLATILITY AND BOOK TO MARKET VALUE MOHAMMAD REZA RAZDAR & DR. B. H. SURESH
97
18. WORKING CAPITAL MANAGEMENT IN MANUFACTURING INDUSTRY: A STUDY WITH REFERENCE TO SELECTED MANUFACTURING INDUSTRIES IN INDIA KUSHALAPPA. S & SHARMILA KUNDER
101
19. TALENT ACQUISITION AND RETENTION: A STUDY IN INDIAN SMALL AND MEDIUM ENTERPRISES DR. SNIGDHARANI MISHRA & JASMINE T. JHA
106
20. MONITORING SYSTEM FOR TERRORISTS AND DANGEROUS PRISONERS DR. PRAMOD BUBNA
111
21. TRENDS OF FOREIGN DIRECT INVESTMENT IN INDIA DR. KARAMVIR SINGH SHEOKAND, PRIYANKA & RAJESH BHARDWAJ
114
22. CONCURRENCY CONTROL IN DBMS WITH TIMESTAMPS GEETIKA
119
23. A STUDY ON PERFORMANCE MANAGEMENT SYSTEM (PMS) WITH SPECIAL REFERENCE TO COTELLIGENT P SWETHA
121
24. AN ANALYSIS OF CHILD’S INFLUENCE IN CHOOSING THE SNACKS ITEMS WITH SPECIAL REFERENCES TO SIVAKASI AREA IN TAMILNADU T. DHANALAKSHMI
125
25. MEASURING SERVICE QUALITY OF RAILWAY PLATFORMS IN INDIA: A CASE-STUDY OF EAST-COAST RAILWAYS DR. SRINIBASH DASH, SRI SISIR RANJAN DASH & SRI SUBRAT KUMAR PRADHAN
129
26. A COMPARATIVE STUDY OF FINANCIAL STATEMENT OF DISTRICT CO-OPERATIVE DAIRIES OF NORTH GUJARAT PATEL RAJESHKUMAR G., PRAJAPATI RASIKBHAI I. & PATEL NITINKUMAR P.
135
27. WORLD WIDE MIDDLE WARE TECHNOLOGIES M.DHANAMALAR & B.AYSHWARYA
139
28. CRITICAL FACTORS FOR SUCCESSFUL SC COLLABORATION: AN INTERPRETIVE STRUCTURAL MODELING APPROACH KAUSTUBH JOSHI & ANIKET JADHAV
143
29. AN EMPIRICAL INVESTIGATION OF INVENTORY MANAGEMENT PRACTICES OF MYSORE PAPER MILLS LIMITED BHADRAVATHI – A CASE STUDY BASAVARAJAPPA M T
150
30. A STUDY ON PERFORMANCE OF MOBILE BAKING SERVICES AND MODELS IN INDIA M.GANGU NAIDU
156
REQUEST FOR FEEDBACK 161

VOLUME NO. 2 (2012), ISSUE NO. 12 (DECEMBER) ISSN 2231-1009
INTERNATIONAL JOURNAL OF RESEARCH IN COMPUTER APPLICATION & MANAGEMENT A Monthly Double-Blind Peer Reviewed (Refereed/Juried) Open Access International e-Journal - Included in the International Serial Directories
http://ijrcm.org.in/
iii
CHIEF PATRONCHIEF PATRONCHIEF PATRONCHIEF PATRON PROF. K. K. AGGARWAL
Chancellor, Lingaya’s University, Delhi Founder Vice-Chancellor, Guru Gobind Singh Indraprastha University, Delhi
Ex. Pro Vice-Chancellor, Guru Jambheshwar University, Hisar
FOUNDER FOUNDER FOUNDER FOUNDER PATRONPATRONPATRONPATRON
LATE SH. RAM BHAJAN AGGARWAL Former State Minister for Home & Tourism, Government of Haryana
Former Vice-President, Dadri Education Society, Charkhi Dadri Former President, Chinar Syntex Ltd. (Textile Mills), Bhiwani
COCOCOCO----ORDINATORORDINATORORDINATORORDINATOR
DR. SAMBHAV GARG Faculty, M. M. Institute of Management, MaharishiMarkandeshwarUniversity, Mullana
ADVISORSADVISORSADVISORSADVISORS
DR. PRIYA RANJAN TRIVEDI Chancellor, The Global Open University, Nagaland
PROF. M. S. SENAM RAJU Director A. C. D., School of Management Studies, I.G.N.O.U., New Delhi
PROF. S. L. MAHANDRU Principal (Retd.), MaharajaAgrasenCollege, Jagadhri
EDITOREDITOREDITOREDITOR
PROF. R. K. SHARMA Professor, Bharti Vidyapeeth University Institute of Management & Research, New Delhi
EDITORIAL ADVISORY BOARDEDITORIAL ADVISORY BOARDEDITORIAL ADVISORY BOARDEDITORIAL ADVISORY BOARD
DR. RAJESH MODI Faculty, YanbuIndustrialCollege, Kingdom of Saudi Arabia
PROF. PARVEEN KUMAR Director, M.C.A., Meerut Institute of Engineering & Technology, Meerut, U. P.
PROF. H. R. SHARMA Director, Chhatarpati Shivaji Institute of Technology, Durg, C.G.
PROF. MANOHAR LAL Director & Chairman, School of Information & Computer Sciences, I.G.N.O.U., New Delhi
PROF. ANIL K. SAINI Chairperson (CRC), Guru Gobind Singh I. P. University, Delhi
PROF. R. K. CHOUDHARY Director, Asia Pacific Institute of Information Technology, Panipat
DR. ASHWANI KUSH Head, Computer Science, UniversityCollege, KurukshetraUniversity, Kurukshetra

VOLUME NO. 2 (2012), ISSUE NO. 12 (DECEMBER) ISSN 2231-1009
INTERNATIONAL JOURNAL OF RESEARCH IN COMPUTER APPLICATION & MANAGEMENT A Monthly Double-Blind Peer Reviewed (Refereed/Juried) Open Access International e-Journal - Included in the International Serial Directories
http://ijrcm.org.in/
iv
DR. BHARAT BHUSHAN Head, Department of Computer Science & Applications, Guru Nanak Khalsa College, Yamunanagar
DR. VIJAYPAL SINGH DHAKA Dean (Academics), Rajasthan Institute of Engineering & Technology, Jaipur
DR. SAMBHAVNA Faculty, I.I.T.M., Delhi
DR. MOHINDER CHAND Associate Professor, KurukshetraUniversity, Kurukshetra
DR. MOHENDER KUMAR GUPTA Associate Professor, P.J.L.N.GovernmentCollege, Faridabad
DR. SAMBHAV GARG Faculty, M. M. Institute of Management, MaharishiMarkandeshwarUniversity, Mullana
DR. SHIVAKUMAR DEENE Asst. Professor, Dept. of Commerce, School of Business Studies, Central University of Karnataka, Gulbarga
DR. BHAVET Faculty, M. M. Institute of Management, MaharishiMarkandeshwarUniversity, Mullana
ASSOCIATE EDITORSASSOCIATE EDITORSASSOCIATE EDITORSASSOCIATE EDITORS
PROF. ABHAY BANSAL Head, Department of Information Technology, Amity School of Engineering & Technology, Amity University, Noida
PROF. NAWAB ALI KHAN Department of Commerce, AligarhMuslimUniversity, Aligarh, U.P.
ASHISH CHOPRA Sr. Lecturer, Doon Valley Institute of Engineering & Technology, Karnal
TECHNICAL ADVISORTECHNICAL ADVISORTECHNICAL ADVISORTECHNICAL ADVISOR
AMITA Faculty, Government M. S., Mohali
FINANCIAL ADVISORSFINANCIAL ADVISORSFINANCIAL ADVISORSFINANCIAL ADVISORS
DICKIN GOYAL Advocate & Tax Adviser, Panchkula
NEENA Investment Consultant, Chambaghat, Solan, Himachal Pradesh
LEGAL ADVISORSLEGAL ADVISORSLEGAL ADVISORSLEGAL ADVISORS
JITENDER S. CHAHAL Advocate, Punjab & Haryana High Court, Chandigarh U.T.
CHANDER BHUSHAN SHARMA Advocate & Consultant, District Courts, Yamunanagar at Jagadhri
SUPERINTENDENTSUPERINTENDENTSUPERINTENDENTSUPERINTENDENT
SURENDER KUMAR POONIA

VOLUME NO. 2 (2012), ISSUE NO. 12 (DECEMBER) ISSN 2231-1009
INTERNATIONAL JOURNAL OF RESEARCH IN COMPUTER APPLICATION & MANAGEMENT A Monthly Double-Blind Peer Reviewed (Refereed/Juried) Open Access International e-Journal - Included in the International Serial Directories
http://ijrcm.org.in/
v
CALL FOR MANUSCRIPTSCALL FOR MANUSCRIPTSCALL FOR MANUSCRIPTSCALL FOR MANUSCRIPTS We invite unpublished novel, original, empirical and high quality research work pertaining to recent developments & practices in the area of Computer, Business, Finance, Marketing, Human Resource Management, General Management, Banking, Insurance, Corporate Governance and emerging paradigms in allied subjects like Accounting Education; Accounting Information Systems; Accounting Theory & Practice; Auditing; Behavioral Accounting; Behavioral Economics; Corporate Finance; Cost Accounting; Econometrics; Economic Development; Economic History; Financial Institutions & Markets; Financial Services; Fiscal Policy; Government & Non Profit Accounting; Industrial Organization; International Economics & Trade; International Finance; Macro Economics; Micro Economics; Monetary Policy; Portfolio & Security Analysis; Public Policy Economics; Real Estate; Regional Economics; Tax Accounting; Advertising & Promotion Management; Business Education; Management Information Systems (MIS); Business Law, Public Responsibility & Ethics; Communication; Direct Marketing; E-Commerce; Global Business; Health Care Administration; Labor Relations & Human Resource Management; Marketing Research; Marketing Theory & Applications; Non-Profit Organizations; Office Administration/Management; Operations Research/Statistics; Organizational Behavior & Theory; Organizational Development; Production/Operations; Public Administration; Purchasing/Materials Management; Retailing; Sales/Selling; Services; Small Business Entrepreneurship; Strategic Management Policy; Technology/Innovation; Tourism, Hospitality & Leisure; Transportation/Physical Distribution; Algorithms; Artificial Intelligence; Compilers & Translation; Computer Aided Design (CAD); Computer Aided Manufacturing; Computer Graphics; Computer Organization & Architecture; Database Structures & Systems; Digital Logic; Discrete Structures; Internet; Management Information Systems; Modeling & Simulation; Multimedia; Neural Systems/Neural Networks; Numerical Analysis/Scientific Computing; Object Oriented Programming; Operating Systems; Programming Languages; Robotics; Symbolic & Formal Logic and Web Design. The above mentioned tracks are only indicative, and not exhaustive.
Anybody can submit the soft copy of his/her manuscript anytime in M.S. Word format after preparing the same as per our submission guidelines duly available on our website under the heading guidelines for submission, at the email address: [email protected].
GUIDELINES FOR SUBMISSION OF MANUSCRIPTGUIDELINES FOR SUBMISSION OF MANUSCRIPTGUIDELINES FOR SUBMISSION OF MANUSCRIPTGUIDELINES FOR SUBMISSION OF MANUSCRIPT
1. COVERING LETTER FOR SUBMISSION: DATED: _____________
THE EDITOR
IJRCM
Subject: SUBMISSION OF MANUSCRIPT IN THE AREA OF .
(e.g. Finance/Marketing/HRM/General Management/Economics/Psychology/Law/Computer/IT/Engineering/Mathematics/other, please specify)
DEAR SIR/MADAM
Please find my submission of manuscript entitled ‘___________________________________________’ for possible publication in your journals.
I hereby affirm that the contents of this manuscript are original. Furthermore, it has neither been published elsewhere in any language fully or partly, nor is it under review for publication elsewhere.
I affirm that all the author (s) have seen and agreed to the submitted version of the manuscript and their inclusion of name (s) as co-author (s).
Also, if my/our manuscript is accepted, I/We agree to comply with the formalities as given on the website of the journal & you are free to publish our contribution in any of your journals.
NAME OF CORRESPONDING AUTHOR: Designation: Affiliation with full address, contact numbers & Pin Code: Residential address with Pin Code: Mobile Number (s): Landline Number (s): E-mail Address: Alternate E-mail Address:
NOTES: a) The whole manuscript is required to be in ONE MS WORD FILE only (pdf. version is liable to be rejected without any consideration), which will start from
the covering letter, inside the manuscript. b) The sender is required to mention the following in the SUBJECT COLUMN of the mail:
New Manuscript for Review in the area of (Finance/Marketing/HRM/General Management/Economics/Psychology/Law/Computer/IT/ Engineering/Mathematics/other, please specify)
c) There is no need to give any text in the body of mail, except the cases where the author wishes to give any specific message w.r.t. to the manuscript. d) The total size of the file containing the manuscript is required to be below 500 KB. e) Abstract alone will not be considered for review, and the author is required to submit the complete manuscript in the first instance. f) The journal gives acknowledgement w.r.t. the receipt of every email and in case of non-receipt of acknowledgment from the journal, w.r.t. the submission
of manuscript, within two days of submission, the corresponding author is required to demand for the same by sending separate mail to the journal.
2. MANUSCRIPT TITLE: The title of the paper should be in a 12 point Calibri Font. It should be bold typed, centered and fully capitalised.
3. AUTHOR NAME (S) & AFFILIATIONS: The author (s) full name, designation, affiliation (s), address, mobile/landline numbers, and email/alternate email address should be in italic & 11-point Calibri Font. It must be centered underneath the title.
4. ABSTRACT: Abstract should be in fully italicized text, not exceeding 250 words. The abstract must be informative and explain the background, aims, methods, results & conclusion in a single para. Abbreviations must be mentioned in full.

VOLUME NO. 2 (2012), ISSUE NO. 12 (DECEMBER) ISSN 2231-1009
INTERNATIONAL JOURNAL OF RESEARCH IN COMPUTER APPLICATION & MANAGEMENT A Monthly Double-Blind Peer Reviewed (Refereed/Juried) Open Access International e-Journal - Included in the International Serial Directories
http://ijrcm.org.in/
vi
5. KEYWORDS: Abstract must be followed by a list of keywords, subject to the maximum of five. These should be arranged in alphabetic order separated by commas and full stops at the end.
6. MANUSCRIPT: Manuscript must be in BRITISH ENGLISH prepared on a standard A4 size PORTRAIT SETTING PAPER. It must be prepared on a single space and single column with 1” margin set for top, bottom, left and right. It should be typed in 8 point Calibri Font with page numbers at the bottom and centre of every page. It should be free from grammatical, spelling and punctuation errors and must be thoroughly edited.
7. HEADINGS: All the headings should be in a 10 point Calibri Font. These must be bold-faced, aligned left and fully capitalised. Leave a blank line before each heading.
8. SUB-HEADINGS: All the sub-headings should be in a 8 point Calibri Font. These must be bold-faced, aligned left and fully capitalised.
9. MAIN TEXT: The main text should follow the following sequence:
INTRODUCTION
REVIEW OF LITERATURE
NEED/IMPORTANCE OF THE STUDY
STATEMENT OF THE PROBLEM
OBJECTIVES
HYPOTHESES
RESEARCH METHODOLOGY
RESULTS & DISCUSSION
FINDINGS
RECOMMENDATIONS/SUGGESTIONS
CONCLUSIONS
SCOPE FOR FURTHER RESEARCH
ACKNOWLEDGMENTS
REFERENCES
APPENDIX/ANNEXURE
It should be in a 8 point Calibri Font, single spaced and justified. The manuscript should preferably not exceed 5000 WORDS.
10. FIGURES & TABLES: These should be simple, crystal clear, centered, separately numbered &self explained, and titles must be above the table/figure. Sources of data should be mentioned below the table/figure. It should be ensured that the tables/figures are referred to from the main text.
11. EQUATIONS:These should be consecutively numbered in parentheses, horizontally centered with equation number placed at the right.
12. REFERENCES: The list of all references should be alphabetically arranged. The author (s) should mention only the actually utilised references in the preparation of manuscript and they are supposed to follow Harvard Style of Referencing. The author (s) are supposed to follow the references as per the following:
• All works cited in the text (including sources for tables and figures) should be listed alphabetically.
• Use (ed.) for one editor, and (ed.s) for multiple editors.
• When listing two or more works by one author, use --- (20xx), such as after Kohl (1997), use --- (2001), etc, in chronologically ascending order.
• Indicate (opening and closing) page numbers for articles in journals and for chapters in books.
• The title of books and journals should be in italics. Double quotation marks are used for titles of journal articles, book chapters, dissertations, reports, working papers, unpublished material, etc.
• For titles in a language other than English, provide an English translation in parentheses.
• The location of endnotes within the text should be indicated by superscript numbers.
PLEASE USE THE FOLLOWING FOR STYLE AND PUNCTUATION IN REFERENCES: BOOKS
• Bowersox, Donald J., Closs, David J., (1996), "Logistical Management." Tata McGraw, Hill, New Delhi.
• Hunker, H.L. and A.J. Wright (1963), "Factors of Industrial Location in Ohio" Ohio State University, Nigeria. CONTRIBUTIONS TO BOOKS
• Sharma T., Kwatra, G. (2008) Effectiveness of Social Advertising: A Study of Selected Campaigns, Corporate Social Responsibility, Edited by David Crowther & Nicholas Capaldi, Ashgate Research Companion to Corporate Social Responsibility, Chapter 15, pp 287-303.
JOURNAL AND OTHER ARTICLES
• Schemenner, R.W., Huber, J.C. and Cook, R.L. (1987), "Geographic Differences and the Location of New Manufacturing Facilities," Journal of Urban Economics, Vol. 21, No. 1, pp. 83-104.
CONFERENCE PAPERS
• Garg, Sambhav (2011): "Business Ethics" Paper presented at the Annual International Conference for the All India Management Association, New Delhi, India, 19–22 June.
UNPUBLISHED DISSERTATIONS AND THESES
• Kumar S. (2011): "Customer Value: A Comparative Study of Rural and Urban Customers," Thesis, KurukshetraUniversity, Kurukshetra. ONLINE RESOURCES
• Always indicate the date that the source was accessed, as online resources are frequently updated or removed. WEBSITES
• Garg, Bhavet (2011): Towards a New Natural Gas Policy, Political Weekly, Viewed on January 01, 2012 http://epw.in/user/viewabstract.jsp

VOLUME NO. 2 (2012), ISSUE NO. 12 (DECEMBER) ISSN 2231-1009
INTERNATIONAL JOURNAL OF RESEARCH IN COMPUTER APPLICATION & MANAGEMENT A Monthly Double-Blind Peer Reviewed (Refereed/Juried) Open Access International e-Journal - Included in the International Serial Directories
http://ijrcm.org.in/
1
FACTORS INFLUENCING KNOWLEDGE SHARING BEHAVIOUR: DEVELOPING A THEORETICAL FRAMEWORK
SOOFI ANWAR
ASST. PROFESSOR
DEPARTMENT OF MANAGEMENT
BIRLA INSTITUTE OF TECHNOLOGY- INTERNATIONAL CENTRE
UNITED ARAB EMIRATES
DR. K. DURGA PRASAD
HEAD
DEPARTMENT OF MANAGEMENT
BIRLA INSTITUTE OF TECHNOLOGY- INTERNATIONAL CENTRE
UNITED ARAB EMIRATES
ABSTRACT
In today’s knowledge driven economy, creating a pro knowledge sharing environment and reinforcing actual knowledge sharing behavior is central to the success
of any knowledge management (KM) initiative. Universities and Higher Education Institutes have an enormous scope to apply KM to acquire, use and leverage
knowledge. This paper attempts to explore the factors that encourage or inhibit faculty knowledge sharing behaviour. The various factors influencing knowledge
sharing have been categorized into individual, organizational and technological factors. Understanding of these motivators and barriers to knowledge sharing
will help the top management of knowledge based organizations such as Universities and Higher Education Institutes to develop appropriate knowledge sharing
strategies to instill knowledge sharing culture within the organization and foster the knowledge sharing behaviour of its faculty .
KEYWORDS knowledge sharing behaviour, knowledge management.
INTRODUCTION n recent years, attempts to capture and leverage a firm's knowledge resources have become a major drive to the success of any organization. In today’s knowledge driven economy, knowledge has become the strategic asset of an organization and especially in high knowledge intensive organizations, knowledge related competencies are the primary source of competitive advantage (Kankanhalli et al., 2005, Ried, 2003). Organizations are now attempting
to manage knowledge in a more systematic and effective way. Knowledge Management (KM) initiatives are widely applied by the organizations to encourage the creation and sharing of knowledge. Effective implementation of knowledge management (KM) depends on several factors which include leadership, organizational culture, IT infrastructure, positive attitudes of the employees to share expertise and so on. A successful KM implies a good combination of both human participation and IT collaboration tools. Within the overall KM domain, a critical area that needs more attention is knowledge sharing (KS). Knowledge sharing is central to the success of any knowledge management program. In the literature concerning KM within an organization, most researchers acknowledge the role of knowledge sharing and the need to foster knowledge sharing (Davenport and Prusak, 1998; Alavi and Leidner, 2001, Bartol and Srivastava, 2002, Cabrera and Cabrera, 2002, Bock et al, 2005). Although there are many benefits associated with knowledge sharing (Kautz and Mahnke, 2003), for the most part its facilitators are unknown (Szulanski, 1996; Wiig, 1997) and the organizational and individual enablers of knowledge sharing are not properly clarified (Connelly and Kelloway, 2003). Unfortunately, people do not share their knowledge under all circumstances and they enough reasons not to share their knowledge as much as the organization would like them to (Cho, Li, and Su, 2007). Knowledge resides within individuals (Nonaka and Konno 1998) and, more specifically, in the employees who create, recognize, archive, access, and apply knowledge in carrying out their tasks. Consequently, the movement of knowledge across individual and organizational boundaries, into and from repositories, and into organizational routines and practices is ultimately dependent on employees' knowledge-sharing behaviours. When knowledge sharing is limited across an organization, the likelihood increases that knowledge gaps will arise, and these gaps are likely to produce less-than-desirable work outcomes (Baird and Henderson 2001). Even with the codification of knowledge, knowledge objects remain unexposed to (and hence unrecognizable by) others until the knowledge owner makes the objects available. In a practical sense, knowledge sharing cannot be forced but can only be encouraged and facilitated (Gibbert and Krause 2002). When people are motivated enough to share, a KM initiative will find its success (Connelly & Kelloway, 2001).
KNOWLEDGE One of the most common ways to define knowledge is by differentiating it by what it is not by using the components of data, information and knowledge. Data is considered to include numbers, images, words and sounds that are derived from observation and measurement and is still “raw”, not analyzed. Information is then perceived as data that has been analyzed and arranged in a meaningful pattern, meaning that some intellectual input has been added to the raw data. Knowledge is considered to be information that has interpretation and meaning attached to it, adding a further layer of intellectual analysis. Davenport and Prusak (1998), defines knowledge as a fluid mix of framed experience, values, contextual information and expert insights that provides a framework for evaluating and incorporating new experiences and information. Bartol and Srivastava (2002) consider knowledge a broad concept which “includes information, ideas and expertise relevant for tasks performed by individuals, teams, work units and the organization as a whole”. Awad and Ghaziri(2004) define knowledge as human understanding of a specialized field of interest that has been acquired through study and experience.
TYPES OF KNOWLEDGE The most commonly used classification of knowledge in KM literature is the one between explicit knowledge and tacit knowledge (Ein-Dor 2006; Hislop, 2005). Explicit is knowledge is regarded as objective, composed of facts that can be codified into a tangible form like words and graphs, and is separate from individual and social values(Hislop, 2005). Explicit knowledge can be easily transferred to be available for enquirer and thus can produce greater value (McKenzie and Van Winkelen, 2004). In contrast, tacit knowledge is personal, intuitive, insightful, context-sensitive, dynamically created and experienced-based, subjective and experiential (Nonaka, Toyama and Nagata, 2000; Greiner et al., 2007), and resides within the minds of people (Steward, 1999). It is hard to formalize and communicate to others. Tacit knowledge is deeply rooted in an individual's actions and experience, as well as in the ideals, values or emotions he or she embraces (Nonaka and Konno, 1998). It is something known but not easily articulated (Dixon, 2000). It is more problematic because it is not so easily disseminated (Mullin, 2005). This suggests that tacit knowledge is non-transferable without the exchange of key personnel and all the systems that support them, and may be best transferred through more interpersonal means and using processes that are less structured.
I

VOLUME NO. 2 (2012), ISSUE NO. 12 (DECEMBER) ISSN 2231-1009
INTERNATIONAL JOURNAL OF RESEARCH IN COMPUTER APPLICATION & MANAGEMENT A Monthly Double-Blind Peer Reviewed (Refereed/Juried) Open Access International e-Journal - Included in the International Serial Directories
http://ijrcm.org.in/
2
KNOWLEDGE MANAGEMENT Knowledge management has been defined as the process of capturing, storing, sharing, and using knowledge (Davenport and Prusak 1998). Rowley (2000) describes the term KM as follows: “Knowledge management is concerned with the exploitation and development of the knowledge assets of an organization with a view to furthering the organization’s objectives. The knowledge to be managed includes both explicit, documented knowledge, and tacit, subjective knowledge. Management entails all of those processes associated with the identification, sharing, and creation of knowledge. This requires systems for the creation and maintenance of knowledge repositories, and to cultivate and facilitate the sharing of knowledge and organizational learning. Organizations that succeed in knowledge management are likely to view knowledge as an asset and to develop organizational norms and values, which support the creation and sharing of knowledge”. In brief, KM is the management of processes that govern the creation, dissemination, and utilization of knowledge by merging technologies, organizational structures and people to create the most effective learning, problem solving, and decision-making in an organization.
KNOWLEDGE SHARING Knowledge sharing means the methods and willingness of individuals in an organization to share the knowledge they have with others in the organization. Knowledge can be shared between and among individuals, within and among teams and organizational units and among organizations (King 2006). According to King (2006) sharing behaviour can be different whether tacit or explicit knowledge is shared. Knowledge sharing cannot be forced or mandated, but instead the behaviour should be facilitated and encouraged (Bock et al, 2005). Knowledge sharing concerns the willingness of individuals in an organization to share with others the knowledge they have acquired or created (Gibbert and Krause, 2002). A firm can successfully promote a knowledge sharing culture not only by directly incorporating knowledge in its business strategy, but also by changing employee attitudes and behaviours to promote willing and consistent knowledge sharing (Connelly and Kelloway, 2003; Lin and Lee, 2004).The sharing could be done directly via communication or indirectly via some knowledge archive. Sharing of tacit knowledge mainly takes place through socialization, but the knowledge does not become explicit and the organization as a whole cannot not easily use it. Making tacit knowledge explicit allows it to be shared within the organization and can be stored or formalized.
REVIEW OF LITERATURE The extensive review of previous literature on knowledge sharing recognizes the existence of different influences on employee knowledge sharing activities, such as individual, organizational, and technology factors (Lee and Choi, 2003; Connelly and Kelloway, 2003; Taylor and Wright, 2004). Referring to the individual dimension, most authors agree that knowledge sharing depends on individual characteristics, including experience, values, motivation, and beliefs. Wasko and Faraj (2005) suggested that individual motivators may enable employee willingness to share knowledge. Employees are motivated when they think that knowledge sharing behaviours will be worth the effort and able to help others. Therefore, the expectation of individual benefits can promote employees to share knowledge with colleagues. Furthermore, referring to the organizational dimension, organizational climate is usually made to capture efficiently the benefits of innovation-supportive culture (Saleh and Wang, 1993). In the context of knowledge sharing, the different aspects of organizational climate are critical drivers of knowledge sharing, such as reward systems linked to knowledge sharing (Bartol and Srivastava, 2002), open leadership climate (Taylor and Wright, 2004), and top management support (MacNeil, 2003; MacNeil, 2004). Finally, referring the technology dimension, ICT can be effectively used to facilitate the codification, integration, and dissemination of organizational knowledge (Song, 2002).
PREVIOUS EMPIRICAL STUDIES ON KNOWLEDGE SHARING Block, Zmud, Kim and Lee (2005) studied factors influencing an individual’s knowledge sharing behaviour in corporate in respect of extrinsic motivators, social-psychological forces and organizational climate factors. The motivational drivers found were anticipated extrinsic rewards (montetary incentives or points towards promotion), anticipated reciprocal relationships (desire to maintain relationship with others), sense of self worth(sense of value brought by knowledge sharing through competence or power), fairness (trusting organizational climate), innovativeness (organizational climate that is tolerant of well-reasoned failure and where information flows freely) and affiliation (organizational climate with pro-social norms and willingness to help others). Bock et al (2005) summarizes the factors of organizational climate that have an influence on individual’s knowledge sharing behaviour to be climate where individuals highly trust each other and the organization, climate that is open with free flowing information, climate that is tolerant of failure and climate where pro social norms and willingness to help are valued. Kim and Lee (2006) studied the impact of organizational context and IT on employees’ perception of knowledge sharing. Research showed that social networks, centralization of organization structure, performance based reward systems, employee usage of IT applications and user friendly IT systems significantly affect employee knowledge sharing capabilities in both public and private sector. Social networks, performance based reward systems, employee usage of IT applications and user friendly IT systems influence positively on sharing knowledge, while centralization of organizational structure was seen to negatively influence the behaviour. So and Bolloju (2005) researched the intention of IT professionals to share and reuse knowledge. All direct determinants of intention to share knowledge, except for subjective norm and intention to reuse knowledge were significant. All direct determinants except for subjective norm and intention to reuse knowledge were significant. The strongest significance was in the attitude towards intention to share knowledge, thus indicating that management should build positive attitude in their employees through improving relationships and recognition of their contributions. Szulanki (1996) states that motivational forces derives from one of two bases: personal belief structure and institutional structures meaning the organizational climate including norms and values. In individual level knowledge sharing can be impacted by concerns over the individual’s status or ‘competitive advantage’ over others being lost by sharing the valuable knowledge one possess (Huber 2001; Riege 2005; Hislop 2005; Fink and Disterer 2006). Riege (2005), Rugullies (2003), Garfield (2006) highlighted the importance of time in knowledge sharing, referring to lack of contact time and interaction between other knowledge workers in the organization and also lack of time to share knowledge in general when priorities are elsewhere. In order to motivate employees to share their knowledge, making sure they know the benefit it can bring to them and the entire organization is also important (Rugullies 2003; Garfield 2006). Lu, Leung and Koch (2006) conducted two studies in the People’s Republic of China to understand factors influencing knowledge sharing behaviour within an organization. The result indicated that knowledge sharing behaviour is influenced by individual, interpersonal and organizational factors. From individual factors, greed (non cooperative behaviour, desire to use others’ knowledge without reciprocation) was shown to reduce knowledge sharing and self efficacy (perception of person’s ability to valuable contributions and their criticality) to increase it. Co-worker collegiality (interpersonal trust and teamwork) was shown to indirectly influence knowledge sharing in interpersonal level by lowering greed and increasing self efficacy. At organizational level, organizational support was proven to increase knowledge sharing by resulting in higher use of IT. The use of IT was related to sharing explicit knowledge than tacit knowledge, proving that technology alone does not support efficient knowledge sharing. Neo (2002) in a study of knowledge sharing practices in a Singapore news company found that cultural factors have significant impact on individual’s decision to share or hoard knowledge. His study revealed that lack of motivation; management support, trust, and teamwork spirit were considered as major barriers to knowledge sharing. It was also observed that ‘knowledge is power’ mentality was hindering to promote a knowledge sharing culture in the company. Incentives and reward mechanisms were considered favourable components of organizational culture for creating knowledge friendly environment. Meenakshi (2002) and Sundari (2003) surveyed the perceptions of teachers in Singapore schools about sharing knowledge in schools. They reported that teachers perceived sharing with their colleagues very helpful in enhancing learning and also viewed their own knowledge worthy of sharing with other colleagues. Teachers were willing to share and preferred knowledge sharing through casual meetings with their colleagues, online communication, peer coaching, and interactive workshops. They took full advantage of information technology for knowledge sharing but found them stressed because of time pressure. These studies stressed that to make knowledge sharing popular in schools KM practices must be embedded into teaching and learning activities.

VOLUME NO. 2 (2012), ISSUE NO. 12 (DECEMBER) ISSN 2231-1009
INTERNATIONAL JOURNAL OF RESEARCH IN COMPUTER APPLICATION & MANAGEMENT A Monthly Double-Blind Peer Reviewed (Refereed/Juried) Open Access International e-Journal - Included in the International Serial Directories
http://ijrcm.org.in/
3
Lim, Tang, and Yang (20004) reviewed the factors affecting the individual’s knowledge sharing behaviour in the organizational context focusing on the impact of financial rewards and organizational behaviour on knowledge sharing. They noted that the knowledge sharing attitudes were more evident in a face-to-face context rather than the electronic medium. Employees were found to be more willing to share knowledge with increased rewards. The study recommended customizing the reward systems and knowledge sharing contexts in order to facilitate a smoother flow of knowledge in the enterprise. Sun and Scott (2005) investigated barriers in knowledge transfer in four different levels in organizational learning: individual, team, organizational and inter-organizational. Factors found to be more significant barrier were, fear of loss of ownership, fear of loss of control of knowledge, individual values in respect of team values, personality differences and skills of communication and persuasion.
SUMMARY OF FACTORS INFLUENCING KNOWLEDGE SHARING BEHAVIOUR Based on the extensive review of previous literature on knowledge sharing, the factors influencing knowledge sharing may be summarised as individual, organizational, and technology factors (Lee and Choi, 2003; Connelly and Kelloway, 2003; Taylor and Wright, 2004).
ROLE OF INDIVIDUAL FACTORS IN KNOWLEDGE SHARING Individual factors play a significant role in either encouraging or discouraging knowledge sharing behaviour. Some of the major individual factors influencing knowledge sharing are the perceived reciprocal benefits, reputation enhancement, rewards and incentives for knowledge sharing, fear of loss of knowledge power, enjoyment in helping others, degree of competition and seniority in the hierarchy, self efficacy and attitude towards knowledge sharing.
ROLE OF PERCEIVED ORGANIZATIONAL CLIMATE ON KNOWLEDGE SHARING Organizational climate guides the employee behaviour by conveying to them what behaviour is appropriate and desirable. Numerous studies have recognized the role of organizational climate as a critical driver of knowledge sharing behaviour and emphasized the need to create knowledge sharing organizational climate. The major organizational factors contributing to knowledge sharing may be summarised as top management leadership and support, teamwork, fairness, affiliation and innovativeness, organizational rewards for knowledge sharing and facilities for knowledge sharing available in the organizations.
ROLE OF TECHNOLOGICAL FACTORS ON KNOWLEDGE SHARING Information and communication technology (ICT) use and knowledge sharing are closely linked, because ICT can enable rapid search, access and retrieval and sharing of knowledge. Past empirical findings emphasise the role of technological factors on influencing knowledge sharing behaviour. The role of technological factors in positively or negatively influencing knowledge sharing can be summarised in terms of perceived usefulness of technology, availability of technology and the degree of usage of ICT.
SUMMARY AND CONCLUSION For any organization to stay ahead of their competition, they must be able to exploit the internal knowledge that resides within the human memory of their skilled employees. To convert individual knowledge into organizational knowledge, individuals must consciously undertake the task of sharing their knowledge. Therefore an understanding of factors influencing knowledge sharing will help the organization to build knowledge sharing climate and encourage knowledge sharing. From the overall analysis of previous empirical findings on knowledge sharing behaviour, the factors influencing knowledge sharing can be broadly categorized into individual, organizational and technological factors. Knowledge sharing behaviour is a complex process that is determined by multiple factors ranging from soft factors (organizational culture and climate, individual attitude etc) and hard factors (IT, organizational incentive systems etc). Thus understanding of these factors influencing knowledge sharing behaviour will help the top management and leadership of knowledge intensive organizations such as Universities and Higher Education Institutes to contribute towards formulating motivational strategies to enhance knowledge sharing behaviour of its faculties and build knowledge sharing climate within the organization through effective strategies to foster, facilitate and reinforce the knowledge sharing behaviour of its faculty members.
REFERENCES 1. Al-Alawi, A. I., Al-Marzooqi, N. Y., Mohammed, Y. F. (2007). “Organizational Culture and Knowledge Sharing: Critical Success Factors”, Journal of Knowledge
Management, 11 (2): 22-42. 2. Ardichvili, A., Page, V., & Wentling, T. (2003). Motivation and barriers to participation in virtual knowledge-sharing communities of practice. Journal of
Knowledge Management, 7(1), 64-77. 3. Bock, G. W., Zmud, R. W., Kim, Y. G. & Lee, Jae-Nam. (2005). Behavioral intention formation in knowledge sharing: examining the roles of extrinsic
motivators, social-psychological forces, and organizational climate. MIS Quarterly, 29(1), 87-111. 4. Bock, G.W., & Kim, Y. G. (2002). Breaking the myths of rewards: an exploratory study of attitudes about knowledge sharing. Information Resources
Management Journal, 15(2), 14-21 5. Cabrera, Á., Collins, W. C., Salgado, J. F. (2006). “Determinants of Individual Engagement in Knowledge Sharing”, International Journal of Human Resource
Management, 17 (2): 245-264. 6. Chennamaneni, A. (2006). “Determinants of Knowledge Sharing Behaviors: Developing and Testing an Integrated Theoretical Model”, Unpublished Doctoral
Thesis 7. Cummings, J. (2003). “Knowledge Sharing: A Review of the Literature”, The World Bank, Washington, D.C, OECD Working Paper 8. Davenport, T. H. & Prusak, L. (1998). Working knowledge: How organizations manage what they know. Boston: Harvard Business School Press 9. Dvenport Thomas H (2005) Thinking for a living-How to get better performance and results from knowledge workers, Boston Mass, Harvard Business
School Press 10. Fink, Dieter and Distere, Georg (2006). Knowledge Management in Professional Service Firms. In David G Schwartz ed. Encyclopedia of Knowledge
Management London; Idea Group 381-388 11. Garfield S. (2006): 10 reasons why people don’t share their knowledge, KM Review Volume 9, No. 2, May/June 2006 PP. 10-11 12. Gold, A. H., Malhotra, A., Segars, A. H. (2001). “Knowledge Management: An Organizational Capabilities Perspective”, Journal of Management Information
Systems, 18(1): 185-214. 13. Hislop, Donald (2005). Knowledge Management in Organizations- A Critical Introduction, New York: Oxford University Pres 14. Huber G.P. (2001): Transfer of Knowledge in Knowledge Management System: Unexplored Issues and Suggested Studies. European Journal of Information
Systems(10) pp. 72-79 15. Kankahalli, A., Tanudidjaja, F., Sutanto, J., Tan, B. C. Y. (2003). “The Role of IT in Successful Knowledge Management Initiatives”, Communication of the
ACM, 46 (9): 69-73. 16. Kim S. Lee, H (2006): The impact of organizational context and information technology on employee information sharing capabilities. Public Administration
Review, May/June 2006, pp. 370-385 17. Lee, H. and Choi, B. (2003), “Knowledge management enablers, processes, and organizational performance: an integrative view and empirical
examination”, Journal of Management Information Systems, Vol. 20 No. 1, pp. 179-228. 18. Lee, J. H., Kim, Y. G. and Kim, M. Y. (2006), “Effects of managerial drivers and climate maturity on knowledge-management performance: empirical
validation”, Information Resources Management Journal, Vol. 19 No. 3, pp. 48-60. 19. Riege, A. (2005). “Three-dozen Knowledge-sharing Barriers Managers Must Consider”, Journal of Knowledge Management, 9 (3): 18-35.

VOLUME NO. 2 (2012), ISSUE NO. 12 (DECEMBER) ISSN 2231-1009
INTERNATIONAL JOURNAL OF RESEARCH IN COMPUTER APPLICATION & MANAGEMENT A Monthly Double-Blind Peer Reviewed (Refereed/Juried) Open Access International e-Journal - Included in the International Serial Directories
http://ijrcm.org.in/
4
THE IMPACT OF DIRECT AND INDIRECT FACTORS INFLUENCING BRAND EQUITY FOR ONLINE COMPANIES
SEYED ALIAKBAR AHMADI
ASSOCIATE PROFESSOR
DEPARTMENT OF MANAGEMENT
PAYAMENOOR UNIVERSITY
IRAN
MOHAMMADREZA DARAEI
STUDENT
DEPARTMENT OF MANAGEMENT
PAYAMENOOR UNIVERSITY
IRAN
EHSAN POUSTIAN
MBA STUDENT
PAYAMENOOR UNIVERSITY
DAMAVAND BRANCH
IRAN
ABSTRACT
Brand equity is a key issue in marketing. A crucial communication task for unknown brands is to build the knowledge in consumers’ minds necessary to become
established. The conceptual framework presented here derives from a thorough analytical and critical review of the literature on branding in the conventional
and virtual marketing environments. This study uses a model of brand equity to examine and measure brand equity applies to online business. The statistical
population consists of customers who have used services offered by Parsian Insurance Company in Esfahan. Random sampling method has been applied to select
the appropriate sample. The examinations were done through 195 available questionnaires. In order to test the conceptual model, Structural Equations' Model
has been used. Results based on SEM outputs demonstrate acceptance and confirmation of all studied factors. These findings indicate that Value, Awareness,
Trust and Loyalty have a positive impact on Brand Equity.
KEYWORDS Awareness, Brand equity, Internet, Loyalty, Trust, Value.
INTRODUCTION esearches on marketing topics have frequently addressed brand equity in recent years. Positive brand equity leads to competitive advantage (Wang and associates, 2008). It heightens company’s negotiation power (Rios and Riquelme, 2008), helps the company gain higher margins (Buill and associates, 2008) and generate higher revenues, and it also allows higher price premiums (Simmons and associates, 2008). Although the majority of brands is
growing online (Christodoulides and Chernatony, 2004) and thus making online brands is an important part of e- business (Rowley, 2004); yet most of the researches to date have focused on offline brands of bricks and mortar companies. They rarely have addressed the way online companies develop brand equity (Rios and Riquelme (2009), Rios and Riquelme, 2008). Some scholars assert that brand equity models for brick and mortar companies apply to online companies as well, while others reject this assertion due to specific characteristics of e-business such as free access to a bunch of information about price (Rios and Riquelme, 2008, 2009). This paper aims to find out if traditional brand equity measures and concepts can be applied to online business as well. Online brand equity is more challenging than traditional branding. Lack of transaction between customer and sales person (Simmons, 2007; Rios and Riquelme, 2008; Rowley, 2009), data privacy and transaction security (Christodoulides and Chernatony, 2004) and fragile trust in depersonalized internet setting (Rowley,2009), all contribute to make online branding more challenging. Additionally, online business are mainly services and also the nature of web environment makes customers experience a context different from that of traditional branding (Rowley, 2009). This study uses a model of brand equity to examine if traditional approach to measuring brand equity applies to online business. In the next sections of this paper, current literature of brand equity is discussed, then the foundations of hypothesis are presented, followed by a description of research methodology and at the end, research findings are reported and discussed.
REVIEW OF LITERATURE Resource based school emphasizes the role of firm resources and competences such as management talent, access to capital markets and brand equity in the extent to which a company successfully implements its strategies and outperforms its rivals(Parnell, 2000). Brand equity,as an important intangible asset of a firm (Rios and Riquelme, 2009), is among slow-cycle resources (hanger and willen) and therefore, a source of sustainable competitive advantage. Hence, it is a wise investment to create brand equity (Rios and Riquelme, 2009). On the other hand, web has become an inseparable part of today world and many brands are growing online (Christodoulides and Chernatony, 2004) rather than offline. Nevertheless, in spite of fast growing of online sales(Park and Stoel, 2005) and the important role of online branding (Rowley,2004), little has been done to identify sources of online brand equity and factors influencing it(Rios and Riquelme, 2008). Rios and Riquelme, (2008, 2009) believe that traditional brand equity models can apply to online business. Their model defines brand awareness, brand associates (perception of value and trust) and loyalty as sources of brand equity. Many scholars (e.g. Rios and Riquelme, 2008; Rauyruen and associates, 2009) consider brand equity as the premium price a customer is willing to pay for a particular brand in comparison to unbranded products. Ha (2004) believes that internet and its works including online brand equity remain as “ modern marvel” for the current generation of marketers and they don’t know whether or not, techniques for developing brand equity in the traditional setting transfer directly to the online world. Christodoulides and Chernatony (2004) agree with Rios and Riquelme (2008& 2009) in that traditional brand equity measures apply to online world but assert there are more factors contributing to build online brand equity However traditional brand equity models introduce various dimensions and sources of brand equity. Many have adopted Aaker(1991,1996) model of brand equity (eg Bamert, and Wehrli,2005; Atilgan and associates 2005;Tong and Hawley ,2009; Pappu , 2005;Hung & Fu, 2010) which introduces brand loyalty, awareness, perceived quality, brand association, and other proprietary and assets as sources of brand equity. Kim and Hyun(2011 ) model of brand equity
R

VOLUME NO. 2 (2012), ISSUE NO. 12 (DECEMBER) ISSN 2231-1009
INTERNATIONAL JOURNAL OF RESEARCH IN COMPUTER APPLICATION & MANAGEMENT A Monthly Double-Blind Peer Reviewed (Refereed/Juried) Open Access International e-Journal - Included in the International Serial Directories
http://ijrcm.org.in/
5
considers brand image as an indirect source of brand equity through its effects on perceived quality. They introduce some marketing mix as antecedents of brand equity sources (Kim and Hyun, 2011). Xu and Chan (2010) Assert that brand loyalty as an outcome of brand awareness, brand associations and quality experience, all contribute to create b rand equity. Their study also defines advertising efforts, word of Mouth and service performance as antecedents of brand equity. AWARENESS In their study, Rios and Riquelme (2009) found that awareness is a determinant of e-brand equity for online retailers. Park and Stoel (2005) also believe that internet shoppers are more likely to purchase appeals from e-shops which they can recognize their brand name because, customers substitute information for “in-store- experience”. Many scholars(Casalo´and associates, 2009; Pappu and Associates, 2005; Davis and associates, 2009) follow Keller’s( 1993) view to define awareness as the ability to recognize a brand when being exposed to it and to recall that the brand is a member of a certain category. Xu and Chan (2010) consider brand awareness as a critical determinant of brand loyalty and also brand equity. In their study of the internet retailers, Park and Stoel (2005) found that domestic and global e-tailers with high brand awareness among customers enjoy more customer purchase intention. In turn, these purchase intentions in favor of the brand contribute to build brand equity (Yasin and associates, 2007).Several studies (eg. Yasin and associates, 2007; Kim and Hyun, 2011; Anselmsson and associates, 2007; Rios and Riquelme, 2008& 2009; Pappu and associates, 2005) have confirmed the positive effects of brand awareness on brand equity. Based on findings of previous studies and the literature review, the first two hypotheses are suggested as: H1: Brand Equity of online companies is positively related to awareness. H2: Brand Loyalty of online companies is positively related to awareness
VALUE In a study of online retailers, Rios and Riquelme (2008) found perceived value to be a direct source of brand equity.They Suggest that value judgments are formed similar to quality judgment and these two variables re highly correlated. Many research have proven the contribution of perceived quality/value in creating brand equity (e.g. Kim and Hyun, 2011; So and King, 2010; Atilgan and associates, 2005; Tong and Hawley, 2009). So and King (2010)’s study of hotel industry shows that perceived value as a dimension of brand meaning, contributes in creating brand equity. Chiu and associates (2009)’s findings also indicate that online shopping value is pivotal to repetitive customer purchase intention and so increased customer loyalty. Tasi (2005)’s research results also show that repurchase intention of the brand is directly affected by brand value. Based on the above literature, two hypotheses are drawn; H3: Brand equity is positively affective by perceived brand value H4: Loyalty is positively affected by perceived value TRUST In their research study, Rios and Riquelme (2008) emphasize the concept of trust for online companies and use it as a distinctive source of brand equity. Lack of personal interaction with sales persons in the virtual world (Rowley, 2009; Durkan and Durkin, 2003; Yup and associates, 2010), security and privacy concerns(Rios and Riquelme, 2008,Durkan and Durkin, 2003 ;Chen and Barnes,2007; Yup and associates ,2010), electronic fraud and disreputable new merchants (Rios and Riquelme, 2008) contribute to make trust more fragile in virtual world. Thus e- trust is even more important in virtual stores than in brick and mortal stores (Rowley, 2009). Thus web sites able to build e-trust will create brand equity (Rios and Riquelme, 2008). Rowley (2009) also assert that online loyalty is dependent on online trust. The results of Rios and Riquelme (2008) study also prove a strong positive relationship between e-trust and loyalty. Ribbink and associates (2004) in their study of 184 e-buyers found a positive relationship between e-tailer trust and e-loyalty. Above literature about e-trust leads us to the following hypotheses: H5: Brand loyalty is positively related to the extent to which customers perceive online business brand trustable. LOYALTY Strong brands with high customer loyalty allow premium price (Simmons and associates, 2008) and therefore create brand equity. Many studies (e.g. Rios and Riquelme, 2009; Rios and Riquelme, 2008; Kim and Hyun, 2011; Xu and Chan, 2010; Rauyruen and associates, 2009; Atilgan and associates, 2005; Yasin and associates, 2007; Tong and Hawley, 2009) have found brand loyalty as a direct source of brand equity. Customer loyalty has been defined as a customer positive attitude towards an online business, leading to repetitive purchase behavior (Ribbinik and associates, 2004; Gummerus and associates, 2004; Rios and Riquelme, 2008; Lin and Sun, 2009). E-loyalty increases customers willingness to pay more for online brand and has a positive effect on word of mouth (Rios and Riquelme, 2008; Rafiq and Fulford, 2005). Loyal online customers demonstrate a high level of commitment to their favorable online brand when exposed to marketing efforts for similar competitive brands which satisfy the same need (Rowley, 2009) with the potential to cause “switching behavior”(Rafiq and Fulford 2005). Above statements lead to the following hypothesis: H6: brand equity is positively related to the extent to which loyalty is evident in online business. The framework of this study depicted in Fig1, is Based on the above literature and proposed hypothesis:
FIG. 1: CONCEPTUAL FRAME WORK OF STUDY
RESEARCH METHODOLOGY In order to collect the required data for the study, a self-administered survey was used to collect data on insurance customer's perceptions of the six constructs: Value, Awareness, Trust, Loyalty and Brand equity. The questionnaires include 36 items in which 33 items were assigned to 5 latent variables (Value, Awareness, Trust, Loyalty and Brand equity), and 3 items to demographics variables. In this study, Likert’s five-point scale has been used to assess the concepts. Measures assessing Value were adopted from So and King (2010), assessing respondents' perception of the Value offered by the company. Items measuring Awareness were modified from Rios and Riquelme( 2008& 2009) Pappu and associates( 2005) in order to extract the perceptions of perceived and experienced Awareness by the customers . To capture customer's perception of Trust, items were partly adapted from Rios and Riquelme( 2008). the items measuring overall brand
Awareness
Trust
Perceived
value
Brand
Loyalty
Brand
Equity

VOLUME NO. 2 (2012), ISSUE NO. 12 (DECEMBER) ISSN 2231-1009
INTERNATIONAL JOURNAL OF RESEARCH IN COMPUTER APPLICATION & MANAGEMENT A Monthly Double-Blind Peer Reviewed (Refereed/Juried) Open Access International e-Journal - Included in the International Serial Directories
http://ijrcm.org.in/
6
equity were adapted from Rauyruen and associates, (2009). Finally the items measuring Loyalty were adapted from Simmons and associates (2008). The reliability of the questionnaire was calculated by means of Cronbach alpha coefficient and estimated to be 0.905 shown in table 1.
TABLE 1: RESEARCH MEASURES AND CONSTRUCTS RELIABILITY
Construct Cronbach's Alpha
Value 0.854
Awareness 0.912
Trust 0.930
Loyalty 0.943
Brand equity 0.957
Total 0.905
SAMPLE SELECTION AND DATE COLLECTION The research population contains of customers who have used Parsian Insurance Company services. Random sampling method was used to have a sample of 210 respondents. A total of 195 questionnaires out of 210 were returned, demonstrating a response rate of 92 percent. Table 2 addresses the demographic characteristics of the respondents.
TABLE 2: SAMPLE DEMOGRAPHIC CHARACTERISTICS
Variable Type Frequency Percent
Gender Male 140 66.7
Female 70 33.3
Age 21-30 45 .21
31-40 58 .27
41-50 67 .31
More than 50 40 .20
Educational status High school 30 15.2
Diploma 65 30.2
Bachelors 85 .40
Masters and Ph.D 30 14.3
RESULTS The validity of the constructs was determined through Confirmatory Factor Analyses. CFA on Perceived Value with 5 items (question 1 to 5), Trust with 4 items (question 6 to 9), Awareness with 6 items (question 10 to 15), Brand Loyalty with 6 items (question 16 to 21), Brand Equity with 12 items (question 22 to 33) produced following results, representing suitability of the measures to be used for further analysis (table 3):
TABLE 3: RESULTS OF THE CONFIRMATORY FACTOR ANALYSIS
The research hypotheses were tested by Structural Equation Analyses (SEM) using LISREL software. The structural equation modeling technique enables the simultaneous estimation of multiple regression equations in a single framework. Notably; all direct and indirect relationships in the model are estimated simultaneously, and thus the method allows all the interrelationships among the variables to be assessed in the same decision context. Researchers recommend that a sample size 100 to 200 is appropriate for Structure Equation Model (SEM) analysis, (Bollen, 1989). The sample size in this study was 210, so SEM analysis could be applied. Covariance matrices were analyzed in all cases using LISREL software. The correlation matrix of data is shown in table 5.The result indicates chi-
square is 243.9 calculated by LISREL. As degree of freedom is 120,2/ df= 2.02. Other results based on LISREL's output are:
TABLE 4: FIT INDICES FOR THE PATH MODEL
Goodness of Fit Index (GFI) 0.94
Root Mean Square Error of Approximation (RSMEA) 0.004
Comparative Fit Index (CFI) 0.96
Standardized Root Mean Square Residual (SRMR) 0.0045
NFI 0.94
Such results prove that the proposed model exhibits a reasonably good fit to the data. Figure 2 shows the principal model of research and figure 3 illustrates the results of the hypothesis testing. Circumstantial evidence t is used to find out if proposed relationships are significant or not. This circumstantial evidence refers to the proportion of each parameter's coefficient to the standard deviation error of that parameter which will be significant when it is higher than 2 (t ≥2) in t-test and higher than 1.96 (z ≥ 1.96) in z-test. According to what is mentioned, following results can be extracted: As expected in the first hypothesis, Awareness was found to influence Brand Equity positively (H1: γ1=0.60, p<0.05), in second hypothesis Awareness has a positive influence on Brand Loyalty (H2: γ2= 0.72, p<0.05). The third hypothesis predicted that Percived Value has a positive impact on Brand Equity, statistic results confirmed this prediction as well (H3: γ3=0.67, p<0.05). As proposed by hypothesis 4 Perceived Value was also found to influence Brand Loyalty positively (H4: γ4=0.49, p<0.05), Trust has a positive impact on Brand Loyalty, statistic results confirmed this prediction as well (H5: γ3=0.48, p<0.05). Finally, in a same way, the significant and positive relation between Brand Loyalty and overall brand equity was supported (H6:γ5=0.86, p<0.05). Generally all of research hypotheses were confirmed statistically. The results are shown in table 5.
chi-square 243.9
df 120
p-value 0.11
RMSEA 0.09

VOLUME NO. 2 (2012), ISSUE NO. 12 (DECEMBER) ISSN 2231-1009
INTERNATIONAL JOURNAL OF RESEARCH IN COMPUTER APPLICATION & MANAGEMENT A Monthly Double-Blind Peer Reviewed (Refereed/Juried) Open Access International e-Journal - Included in the International Serial Directories
http://ijrcm.org.in/
7
FIGURE 2: PRINCIPAL MODEL OF RESEARCH
FIGURE 3: MODEL OF ADJUSTED INDEX OF T
TABLE 5: ANALYSIS OF THE RESULTS
Path Hypotheses Coefficient T- value p
Awareness Brand Equity H1 0.60 4.3 <0.05
Awarness Brand Loyalty H2 0.72 14.4 <0.05
Percived Value Brand Equity H3 0.67 4.5 <0.05
Percived Value Brand Loyalty H4 0.49 6.6 <0.05
Trust Brand Loyalty H5 0.48 3.8 <0.05
Brand Loyalty Brand Equity H5 0.86 5.5 <0.05
CONCLUSIONS This article has elaborated on the concept of brand equity and provided a theoretical framework of the factors affecting on line brand equity based on customer's point of view. The brand equity sources were derived from traditional models based on knowledge consumers have of an internet brand measured in terms of awareness, trust, value associations and loyalty. The empirical test supports a reduced model based on just three brand assets: brand recognition, trust association and loyalty. These sources are influenced by creating activities related to customer support online and web functionality and fulfilment.The model cross-validation, although across subjects that had not bought products from the retailers under study, performed reasonably well. From this perspective, the structural model serves also as a strong support for the final model derived from respondents who had bought from the online retailers under study.

VOLUME NO. 2 (2012), ISSUE NO. 12 (DECEMBER) ISSN 2231-1009
INTERNATIONAL JOURNAL OF RESEARCH IN COMPUTER APPLICATION & MANAGEMENT A Monthly Double-Blind Peer Reviewed (Refereed/Juried) Open Access International e-Journal - Included in the International Serial Directories
http://ijrcm.org.in/
8
Taking all evidence provided, the study supports the use of a traditional approach to explain brand equity. Perceived value, trust and awareness positively affected brand loyalty and Perceived value, awareness and brand loyalty create brand equity for internet brands such as Persian Insurance Company in Esfahan. In order to test the conceptual model, structural equations' model (SEM) has been used. Results based on SEM outputs demonstrate acceptance and confirmation of all studied factors. These findings indicate that Value, Awareness, Trust and Loyalty have a positive impact on Brand Equity. These sources of brand equity can be built by developing marketing activities that create fulfillment, web functionality and customer service online.
REFERENCES 1. ---. (2009),” Online branding strategies of UK fashion retailers” Internet Research ,Vol. 19 No. 3, pp. 348-369. 2. Anselmsson, J., Johansson, U., & Persson, N.(2007), “Understanding price premium for grocery products: a conceptual model of customer-based brand
equity”, Journal of Product & Brand Management, Vol. 16, No.6, pp. 401–414. 3. Atilgan, E., Aksoy, S., & Akinci, S., (2005), “Determinants of the brand equity, A verification approach in the beverage industry in Turkey”, Marketing
Intelligence & Planning, Vol. 23 No. 3, 2005, pp. 237-248. 4. Bamert, T., & Wehrli, H.P., (2005). “Service quality as an important dimension of brand equity in Swiss services industries", Managing Service Quality, Vol.
15, No. 2, pp. 132-141. 5. Buill, I., Chernatony. L.D. and Marinez, E. (2008),”A cross-national validation of the consumer-based brand equity scale”, Journal of Product & Brand
Management, Vol. 6, No. 17,pp. 384–392. 6. Casalo´, L.V., Cisneros, J., Flavia´n,C. & Guinalı´u, M. (2009), “Determinants of success in open source software networks”, Industrial Management & Data
Systems, Vol. 109 No. 4 , pp. 532-549. 7. Chang, H.H. and Chen, S. W.(2008). “The impact of online store environment cues on purchase intention Trust and perceived risk as a mediator", Online
Information Review, Vol. 32 No. 6, pp. 818-841. 8. Chen, Y.H., & Barnes, S., (2007), “Initial trust and online buyer Behavior”, Industrial Management & Data Systems, Vol. 107 No. 1, 2007, pp. 21-36. 9. Chiu, C.M., Chang, C.C., Cheng, H.L., & Fang Y.H., (2009), “Determinants of customer repurchase intention in online shopping,” Online Information Review
,Vol. 33, No. 4, pp. 761-784. 10. Christodoulides, G. and Chernatony, L. D., (2004), “Dimensionalising on- and offline brands’ composite equity”, Journal of Product & Brand Management,
Vol.13 · No. 3, pp. 168-179. 11. Davis, D.F., Golicic, S.L.,& Marquardt,A.(2009), “Measuring brand equity for logistics services”, The International Journal of Logistics Management ,Vol. 20
No. 2, ,pp. 201-212. 12. Durkan, O., & Durkin, M., (2003), “Exploring efforts to engender on-line trust”, International Journal of Entrepreneurial Behaviour & Research, Vol. 9, No. 3,
pp. 93-110. 13. Gummerus,J., Liljander, V. Pura, M., & Riel, V.,(2004), “Customer loyalty to content-basedWeb sites: the case of an online health-care service”, Journal of
Services Marketing, Vol. 18, No. 3, pp. 175-186. 14. Ha, H.Y., (2004), “Factors influencing consumer perceptions of brand trust online”, Journal of Product & Brand Management, Vol.13, No. 5, pp. 329–342. 15. Hung,Y.L., & Fu, C.S.(2010), “Brand management model of vocational high schools in Taiwan”, Procedia Social and Behavioral Sciences , Vol. 2 pp. 4229–
4233 16. Kim, J. H., & Hyun, Y.J ,(2011) “A model to investigate the influence of marketing-mix efforts and corporate image on brand equity in the IT software
sector”, Journal of Industrial Marketing Management, Vol. 40, pp. 424–438. 17. Lin, G.T.R., & Sun, C.C.,(2009), “Factors influencing satisfaction and loyalty in online shopping: an integrated model”, Online Information Review ,Vol. 33 No.
3, pp. 458-475. 18. Mukherjee,A., & Nath, P. (2007), “Role of electronic trust in online Retailing A re-examination of the commitment-trust Theory”, European Journal of
Marketing, Vol. 41 No. 9/10, pp. 1173-1202. 19. Pappu, R.&, Quester, P.G.,(2008), “ Does brand equity vary between department stores and clothing stores? Results of an empirical investigation”, Journal
of Product & Brand Management, Vol. 17, No., 7, pp. 425–435. 20. Pappu, R., Quester, P.G., & Cooksey, R.W., (2005), “Consumer-based brand equity: improving the measurement – empirical evidence”, Journal of Product &
Brand Management, Vol. 14, No. 3, pp.143–154. 21. Park, J. and Stoel, L.(2005), “Effect of brand familiarity, experience and information on online apparel purchase”, International Journal of Retail &
Distribution Management ,Vol. 33, No. 2, pp. 148-160. 22. Rafiq, M., & Fulford, H.(2005), “Loyalty transfer from offline to online stores in the UK grocery industry”, International Journal of Retail & Distribution
Management ,Vol. 33 No. 6, 2005. 23. Rauyruen, P., Miller, K.E., & Groth, M. (2009), “B2B services: linking service loyalty and brand Equity”, Journal of Services Marketing, Vol. 23, No. 3, pp.
175–186. 24. Ribbink, D., Riel, A.C.R.V., Liljander, V and Streukens, S., (2004), “Comfort your online customer: quality, trust and loyalty on the internet”, Managing
Service Quality ,Vol. 14, No. 6, pp. 446-456. 25. Rios, R. E. and Riquelme, H. E. (2009), “Sources of brand equity for online companies”, Journal of Research in Interactive Marketing, Vol. 4, No. 3, pp. 214-
240. 26. Rowley, J. (2004), ‘‘Online branding: the case of McDonald’s’’, British Food Journal, Vol. 106 No. 3, pp. 228-37. 27. Simmons, G., Thomas, B. and Truong, Y. (2008), “Managing i-branding to create brand equity”, European Journal of Marketing, Vol. 44, No. 9, pp. 1260-
1285. 28. Simmons, G.J. (2007), “i-Branding: developing the internet as a branding tool”, Marketing Intelligence & Planning .Vol. 25, No. 6, pp. 544-562. 29. So, K. K. F., & King, C., (2010). “When experience matters: building and measuring hotel brand equity, the customers’ perspective”, International Journal of
Contemporary Hospitality Management, Vol. 22 No. 5, pp. 589-608. 30. Tong, X., & Hawley, J.M. (2009), “Measuring customer-based brand equity: empirical evidence from the sportswear market in China” Journal of Product &
Brand Management, Vol. 18, No.4, pp. 262–271. 31. Tsai, S.P, (2005), “Utility, cultural symbolism and emotion: A comprehensive model of brand purchase value”, Intern. Journal. of Research in Marketing ,
Vol. 22, pp.277–291. 32. Wang, H, Wei, Y. and Yu, C (2008), “Global brand equity model: combining customer-based with product-market outcome approaches”. Journal of Product
& Brand Management, Vol. 17, No. 5 pp. 305-316. 33. XU, J.B., Chan, A., (2010), “A conceptual framework of hotel experience and customer-based brand equity, Some research questions and implications”,
International Journal of Contemporary Hospitality Management Vol. 22, No. 2, pp. 174-193. 34. Yasin, N.M., Noor, M.N., & Mohamad, O, (2007), “Does image of country-of-origin matter to brand equity?”, Journal of Product & Brand Management, Vol.
16, No. 1, PP. 38–48. 35. Yup, K.B., Wong, D.H., Loh,C., &Bak, R. (2010), “Offline and online banking –where to draw the line when building trust in e-banking?”, International
Journal of Bank Marketing, Vol. 28 No. 1, pp. 27-46.

VOLUME NO. 2 (2012), ISSUE NO. 12 (DECEMBER) ISSN 2231-1009
INTERNATIONAL JOURNAL OF RESEARCH IN COMPUTER APPLICATION & MANAGEMENT A Monthly Double-Blind Peer Reviewed (Refereed/Juried) Open Access International e-Journal - Included in the International Serial Directories
http://ijrcm.org.in/
9
INTEGRATION OF TECHNOLOGY IN TEACHING SENIOR HIGH SCHOOL SOCIAL STUDIES: THE COMPUTER ASSISTED INSTRUCTION EFFECT ON STUDENTS’ PERFORMANCE
PAUL DELA AHIATROGAH
SENIOR LECTURER
CENTRE FOR CONTINUING EDUCATION
UNIVERSITY OF CAPE COAST
GHANA
BRANDFORD BERVELL
SR. RESEARCH ASST.
CENTRE FOR CONTINUING EDUCATION
UNIVERSITY OF CAPE COAST
GHANA
AUGUSTINE YAKUBU
TUTOR
GARU TEMPANI SENIOR HIGH SCHOOL
GHANA
ABSTRACT
Social studies educators increasingly support the use of computer-assisted instruction to transform social studies education from a traditional mode to a more
constructivist, student-centered, and active mode. This study investigates the impact of computer assisted instruction (CAI) on students’ performance in social
studies. The study was a true experimental research involving a pretest and posttest analyses. Learning package was used as the instrument to examine students’
performance when using computer assisted instruction rather than the traditional method of instruction. The sample for the study comprised 40 first year
students of Bawku Senior High in Bawku Municipal Assembly in Upper East Region of Ghana. The students’ pre-test and post test scores were analyzed using
independent-samples t-test. The findings of the study showed that the performance of students exposed to CAI (experimental group) was better than that of their
counterparts exposed to the conventional classroom instruction (control group). Based on the research findings, recommendations were made on the need to
develop relevant CAI packages for teaching social studies in Ghanaian Senior High Schools.
KEYWORDS Computer Assisted Instruction, Social Studies, Students’ Performance, Traditional Method of Instruction.
INTRODUCTION t the beginning of the millennium, education authorities in Ghana embarked on a number of projects to introduce Information and Communication Technologies (ICTs) into the Ghanaian education set up especially, at the basic and secondary school levels. For instance, in the middle of the 1990s, educational providers realized that Ghanaian professionals could not compete on the global market for jobs, because they were limited in skill, especially
in the area of Information Technology (Dadebo, 2003). Subsequently, the authorities incorporated the study of ICT as part of the study of science. The government of Ghana with the collaboration of Non-Governmental Organizations (NGOs), philanthropists and Parent-Teacher Associations (PTAs) built about one hundred and ten science resource centres to aid the teaching of science and ICT. However, the initiators found that the various programmes were disintegrated, unstructured and did not cover all the schools. Thus, at the end of the 1990s Ghana was host to a number of ICT initiatives supported by the government and NGOs. The Ministry of Education in conjunction with the Ghana Education Service (GES) and other partners undertook a critical analysis and review of the utilization of ICTs in education under the auspices of the United Nations Global E-Schools and Community Initiatives (Dadebo , 2003). Pelgrum (2001) states that using computers could revolutionize an outmoded educational system, better prepare student for the information age and accelerate national development efforts. Cuban (2001) considers computers a vehicle for reforming educational practices, to be used as an instructional tool by teachers at all levels of education. McAllister and Mitchell (2002) add that using computers will make the learning process exciting for both students and teachers. Jonassen (1996) explains this global proliferation by saying that when students use databases, spreadsheets, multimedia, e-mail, and network search engines to complete their projects, such processes provide greater potential to promote cognitive development. Also according to Thomas (2003), computers raise the potential to equip students with higher-order skills such as inquiry, reasoning, problem solving and decision making abilities, critical and creative thinking and learning how to learn. Research also showed that using computers has a positive effect on students achievement compared to traditional methods (Lewis 1995; Christensen & Knezek, 2001) In the past few years, technology has been an integral part in the reformation of mathematics education (McCoy, 1996). For Social Studies, technology offers a new way to reach out for the world. Many social studies educators have argued that preparing students for the responsibility of the office of a citizen is in fact the perfect place to let students learn to critically explore their world through the use of interactive technologies (Braun & Risinger, 1999; Cogan, Grossman, & Lei, 2000). That is, having access to up-to-date knowledge resources, archives, and experts via information technology can only benefit a teaching field that (a) has begun to recognize the important implications for teaching and learning social studies from a constructivist perspective (Alleman & Brophy, 1998; NCSS, 1994) and (b) stresses the importance of allowing students to develop the intellectual skills necessary to critically unpack primary sources and to work with data sets, while investigating and inquiring into past and present issues (White, 1997). Much of the Social Studies curriculum is based around the idea of learning about the world around us and the myriad ways that people across the globe function and live differently but effectively. With technology, social studies teachers, have a chance to allow students to explore and experience the world in a new virtual way and create knowledge by themselves and improve upon their academic prowers. This fosters the much emphasized constructivist paradigm.
REVIEW OF LITERATURE MEANING OF COMPUTER ASSISTED INSTRUCTION (CAI) Computer Assisted Instruction (CAI) can be referred to as a self-learning technique usually offline or online, involving interaction of students with programmed instructional materials. CAI is an interactive instructional technique whereby a computer is used to present the instructional material and monitor the learning
A

VOLUME NO. 2 (2012), ISSUE NO. 12 (DECEMBER) ISSN 2231-1009
INTERNATIONAL JOURNAL OF RESEARCH IN COMPUTER APPLICATION & MANAGEMENT A Monthly Double-Blind Peer Reviewed (Refereed/Juried) Open Access International e-Journal - Included in the International Serial Directories
http://ijrcm.org.in/
10
that takes place. CAI uses a combination of text, graphic sound and video in enhancing the learning process. CAI also bothers on the use of the computer as a tool to facilitate and improve instruction. CAI programs use tutorials, drill and practice, simulation and problem solving approaches to present topics and they best test the students’ understanding. Computer assisted instruction is concerned with the use of computers not only as a choice but to mediate the flow of information in the instruction process and the complementary means ( Usun, 2000). CAI was utilized in the education as an educational medium which delivers instructional activities in the late 1950s. Papert (1993) stated that “…programming the computer to administer the kinds of exercises traditionally given by a teacher at blackboard, a textbook, or a worksheet” (p. 5). Although the technology has been changing rapidly over the twenty years, computer-assisted instruction is still utilized in education. Drill-and practice, Tutorial, Games, and Simulation are commonly used CAI applications for educational purposes. Drill-and-practice programs lead learners through a series of examples to increase dexterity and fluency in a skill. Drill-and-practice is used predominantly for math drills, foreign language translation and vocabulary building. In these programs the student is allowed several tries before the computer presents the correct answer. Another type of computer application in education is simulating experimentations. In the simulation environment, students investigate simulations on the computer screen as a replacement for observing and doing something real, either in a laboratory or in the field. For instance, one program popular in the early ‘90s was simulated natural ecosystem. In this ecosystem simulation software, the students could change a number of characteristics of the habitat, the consequences of which were then played out for them to observe and from which they were to draw conclusions (Setzer & Monke, 2001).In social studies, rain and volcanic formation can be simulated to promote procedural knowledge. In the tutorial mode, computers act as the teacher by presenting information in small units to the students and then reinforcing it with questions or tasks. Then computer analyzes the student’s responses and gives feedback or remedial instruction based on his or her response. For example Mavis Beacon Teaches Typing
is a tutorial program which guides students to learn touch-typing skills (Smaldino, Russell, Heinich, & Molenda, 2005). In computer-assisted tutorial applications that provide student different methods of answering a problem and immediate answers, exploratory software programs allow students opportunities to engage in mathematical investigations, and programming skills that develop logical reasoning in students. The final mode is games. Smaldino et al. (2005) defines game as “…an activity in which participants follow prescribed rules that differ from those of real life as they strive to attain a challenging goal” (p. 121). Therefore, a game may or may not be instructional. If it contains academic skill practice then it is defined as an educational game. Game software provides elements of competition into learning activities. With computer games, students are competing against their own previous scores or against the designer of the game as they indicate their understanding of educational content. This fosters students’ motivation. Game assumes that students have already gained the knowledge of the content and generally it is designed based on the time-limitation to encourage students to respond quickly (Ugwu, 2005). As an example, King Arthur’s Magic Castle educational game was designed based on the problem solving strategies to emphasize entertainment (Smaldino et al. 2005). The above modes of CAI are the ones that are widely used in the educational practices. However there are other utilization methods of CAI: such as Discovery and Problems Solving programs. The goal of quality education seems to have the computers as new learning and teaching resource rather than a teacher’s aid in the future. With the usefulness of Internet since 1990s, Distance Education, Virtual Reality (VR), Electronic-Books (e-Books), and Electronic Learning (e-Learning) have become the future of learning (Robertson, 2004). The computer has many purposes in the classroom, and it can be utilized to help a student in all areas of the curriculum.
CAI AND ACADEMIC ACHIEVEMENT The widespread usage of computers by educators to support teaching has been dramatic over the last thirty years. A lot of research have been conducted on the effects of computer use on students’ achievement, attitude, and other variables. However, many educational stakeholders still continue to search the evidence on the positive effects of CAI on student learning before implementing the computer technologies into educational settings. There is a large enough data to show the usefulness of educational technologies that, they are capable to improve the students’ achievement. Most of the studies of computer use in mathematics education have largely examined clearly pioneering situations, usually linked to development projects of same type. Equally, the focus of these studies has been mainly on student cognition and computer interaction. The meta-analyses of the 1980s, produced the conclusion that, programs of computer-based instruction have positive evidence in the evaluation literature (Kulik, 1994). Similarly, Burns and Bozeman (1981) provided the results of a meta-analysis of 40 studies that compared the effectiveness of traditional instruction alone with a combination of traditional instruction and computer-assisted instruction on students' 39 mathematics achievement. Results showed that the combined traditional-CAI approach was significantly more effective. Specifically they drew the following conclusions: 1. A mathematics instruction combined with the CAI was significantly more effective in developing student achievement, than was an instruction only traditional teaching methods with raising arithmetic achievement by .37 standard deviation 2. CAI with drill and practice were significantly more effective in promoting increased student achievement among high achievers and low achievers and in both elementary and secondary graders. Whereas the moderate achievers were effected by the supplementary CAI. (p.37) Likewise, Hasselbring (1984) summarized results of research studies and meta-analyses on the effects of computer-based instruction on students’ achievement and attitudes, where results favor the use of Computer Based Instruction over traditional instruction. Mevarech and Rich (1985), also conducted a three-year study on the effects of CAI on disadvantaged third, fourth, and fifth grade Israeli students. The study divided the participants into two groups; one group receiving traditional instruction supplemented by CAI and the other receiving traditional instruction only. Results which compared the type of instruction to grade level and gender on the Israeli Ministry of Education’s Arithmetic Achievement Test showed that at all three grade levels, CAI students scored significantly higher on arithmetic achievement than students who received traditional instruction only. In a related research, Mokros and Tinker (1987) conducted studies to conclude how middle school students learn graphing skills through microcomputer-based laboratories. Results of the study pointed out that the scores on graphing items were significantly improved in students’ ability to interpret and use graphs from pretests to posttests when the microcomputer-based laboratory were used. In addition, Ganguli (1990) explored the effectiveness of the microcomputer in the form of demonstration tool on the achievement and attitudes. Participants of the study were college students in the intermediate algebra class in which two classes were taught chosen units with teacher-demonstrated microcomputer graphs and two classes were taught the same chosen units with graphs drawn by the teacher on the chalkboard. After completion of five weeks of teaching, a 16-item multiple-choice posttest was conducted; at the end of the quarter, a two-hour comprehensive examination was administered. Results of the study indicated that the treatment effect was significant for the comprehensive examination but not for the posttest. The results of Cotton’s study in the year 1997 (cited in Tran, 2001) was that the use of computer-assisted instruction, as a supplement to traditional, teacher-directed instruction, produces higher achievement compared to those to traditional instruction. Moreover, results were also valid for students of different ages and learning abilities in different subject matters. Randel, Morris, Wetzel, & Whithill (1992) examined 68 studies in their review research conducted before 1984 on the difference between games or simulation and traditional instruction in student performance.. Results revealed that, in seven out of eight studies, use of games in statistics lessons is superior to traditional instruction for improving achievement. Kulik (1994) indicated that use of certain computer based instruction programs raised student achievement at least 1.4 years after 10 months of use. Barnett (2006), in a study of the effect of Computer Assisted Instruction on the reading skills of emergent readers, students using Destination Reading (Riverdeep, 2001) did not benefit significantly from the use of the program compared to nonusers. The CAI group scored significantly lower on the initial sound fluency measure. Factorial ANOVA were used to compare DIBELS scores for effectiveness of the treatment, pre and post test comparisons and interaction of treatment with test scores for the CAI compared with the nonuser group. Two distributions were used to analyze data from the Reading Running Record and

VOLUME NO. 2 (2012), ISSUE NO. 12 (DECEMBER) ISSN 2231-1009
INTERNATIONAL JOURNAL OF RESEARCH IN COMPUTER APPLICATION & MANAGEMENT A Monthly Double-Blind Peer Reviewed (Refereed/Juried) Open Access International e-Journal - Included in the International Serial Directories
http://ijrcm.org.in/
11
Word Recognition assessments. There were no significant differences between the CAI and comparison schools on these two measures. Teacher attitude toward computer did not affect students’ acquisitions of reading skills, as survey responses were in the positive range for all participants. Kulik (2003), a researcher at the University of Michigan, reviewed the evaluation studies in elementary and secondary levels published during 1990s. His research integrated the findings in 61 controlled evaluation studies in six areas: (a) integrated learning systems; (b) reading management systems; (c) writing programs for teaching reading; (d) word processing and Internet resources; (e) microcomputer based laboratories; and (f) science tutoring and simulations. Only 16 studies are reviewed for conclusions about the effectiveness of CAI using integrated learning systems (ILSs) on reading and mathematics achievement of elementary and secondary grade students. Seven of those studies examined mathematics learning alone whereas the remaining nine studies examined effects in both mathematics and reading. Kulik found ILS was at least as effective as traditional instruction. Effect sizes were changes between 0.14 and 1.05. In Social Studies, Adeyemi (2012) found that students who used Computer Assisted Instruction did not perform better in Social Studies achievement than those students taught with conventional method. Furthermore, this study found that there was no significant interaction effect of treatment on students’ academic ability and their achievement in Social Studies. This implies that treatment (Computer Assisted Instruction and Conventional Methods) are not sensitive to students’ achievement in Social Studies. Since Social studies is an integration of Geography, Economics, History etc., it is imperative to find out the effect of CAI on some of these integrated subjects. For instance, Egunjobi (2002) in geography teaching confirmed that CAI seem to be effective in enhancing students’ performance in other subjects than the conventional classroom instruction, a finding opposed to that of Adeyemi (2012). George P. L. and Barry J. Fraser (1994), in a study of CAI in Geography teaching, found that, in contrast to past research, the use of CAI led to a large impact in terms of achievement (effect size of 3.5 standard deviations), attitudes (1.4 standard deviations) and classroom environment (ranging from 1.0 to 1.9 standard deviations). The large effect sizes arising from this study could be attributed to the peculiar situation inherent in the Singapore education system. That is, the highly meritocratic, technologically-biased, centrally-controlled and achievement-oriented system might produce students who perform well. The large effect sizes seem to suggest that appropriate computer-based teaching can be effective with slow learners (ie., the Normal students), a finding which is consistent with the meta-analysis of CAL effectiveness reviewed by Kulik & Kulik (1991). Looking at gender of students’ performance at secondary school level Ash (2005), Basturk (2005) and Dantala (2006) found no significant difference between male and female students taught history using computer-assisted instructional package. However, Collier (2004) described that instruction supplemented by properly designed Computer-Assisted Instruction is more effective than instruction without Computer-Assisted Instruction. This was confirmed by Bergman and Cheney (1996) who found Computer-Assisted Instruction increased learner knowledge when it involves the synergy of multiple senses. Learners were found to retain new knowledge better when the curriculum was presented with a combination of formats of text, sound, graphics and video. Similarly, Haley (1991) experimented Computer-Assisted Instruction in Macroeconomics Education. Results of the regression analysis showed no significant positive relationship between students' cognitive achievement in Principles of Macroeconomics and their use of computer-assisted instruction. The only independent variable that was consistently positively related to students' cognitive achievement in Principles of Macroeconomics was college grade point average. Males were shown to be superior to females in terms of cognitive achievement in macroeconomics. Ehman and Glenn (1987) provide a most useful and timely review of the research literature concerning the effects of computer use in K-12 Social Studies. In general, research that focuses explicitly on computers in social studies has proceeded very slowly. In fact, Ehman and Glenn note that much of what they report is highly impressionistic, based on limited or non-existent empirical evidence. Across curriculum areas, researchers have found drill and tutorial programs to be moderately effective in producing cognitive gains at all grade levels, but especially at the elementary level of schooling (Niemiec and Walberg 1987). With respect to drills and tutorials in social studies, the picture is sketchy at best. Ehman and Glenn (1987) characterized the available research findings as "scattered and mixed" with respect to drill programs, tending somewhat to show a small impact on affective and lower-level cognitive outcomes. Studies involving tutorial programs linked to videodisc (Glenn, Kozen, and Pollak 1984) revealed positive effects on knowledge acquisition and application. Overall, much more research is needed to obtain a clearer picture of drill and tutorial effects in social studies. Early research appeared to confirm the instructional effectiveness of computer-based simulations across all subject areas. Later meta-analyses of simulation research contradicted this view (Bangert-Drowns et al. 1985), finding little support for cognitive gains attributable to simulation use. For social studies simulations, the Ehman and Glenn (1987) review of the literature pointed to positive affective outcomes and gains in cooperative learning capabilities of students. The literature reviewed suggests a positive impact of CAI on academic achievement and favours its usage in the teaching and learning process. However, the above literature indicates that, there is a limited empirical literature on the effects of CAI in social studies education. Among all of the above studies, only few focused on social studies. Little evidence derived from rigorous studies supports the kinds of intellectual outcomes often associated with CAI use in Social Studies, but anecdotal reports of such outcomes (Roessler 1987) suggest that further research is warranted. This reveals the importance and need of the present study to unravel the efficacy of CAI on the performance of students in social studies.
STATEMENT OF THE PROBLEM There is no doubt that, ICT has become a driving force of educational reforms and it is an integral part of national education polices and plans. During the last decade, the Ghana Government in collaboration with the Ghana Education Service has invested heavily in information and communication technology (ICT). ICT has had a major impact in educational context, in organization and in teaching and learning methods. During the 1980s, computer-assisted instruction (CAI) was an important part of classroom computer use. Teachers, department chairs, and district technology coordinators purchased commercial and public domain programs in the subject areas, stored on one or more floppy disks, including drill and practice programs, tutorials, simulations and games. During the next decade there were four major changes that improved CAI: the decline in the use of floppy disks, replaced by the enhanced storage capability of CD-ROM and video disc; enhanced interactivity in software in which students play a more active role; sophisticated graphics, video clips, color and sound, creating a multimedia presentation no longer dominated by screens of text; and the growing marriage of CAI and telecommunications, allowing a seamless transition from single-computer use to collaborative work with distant partners and access to Internet-based resources. The use of CAI in the social studies classroom continues to be strong, although such use is being eclipsed by the tool uses of computers: word processing, communications, research, and multimedia production. CAI has greatly improved in creativity and quality; many programs offer motivating experiences for students in analysis, problem solving and decision making. Recent developments have created new opportunities for powerful social studies teaching assisted by technology and major improvements have taken place in both hardware and software. Computers are much more powerful and versatile than they were a decade ago and although many educational programs at that time were oriented toward drill and practice, it is now easy to find interactive and engaging programs. Using the right combination of hardware and software, teachers can develop lessons that enhance student skills in information retrieval, the presentation of data, the comparison and evaluation of different perspectives, and critical reflection and decision making. Social studies, having been taught the traditional way for years, it is envisaged that the use of ICT in social studies can promote teaching and learning and further improve students’ achievement. This research therefore, aims at looking at how the use of computer assisted instruction (CAI) in the teaching and learning of social studies has had an effect on students’ academic performance.
PURPOSE OF THE STUDY This research aims at looking at how the use of Computer- Assisted Instruction (CAI) in the teaching and learning of social studies can improve students’ performance. Specifically, the study examined whether computer-assisted instruction will raise the performance of students in the learning of social studies as compared to traditional method.

VOLUME NO. 2 (2012), ISSUE NO. 12 (DECEMBER) ISSN 2231-1009
INTERNATIONAL JOURNAL OF RESEARCH IN COMPUTER APPLICATION & MANAGEMENT A Monthly Double-Blind Peer Reviewed (Refereed/Juried) Open Access International e-Journal - Included in the International Serial Directories
http://ijrcm.org.in/
12
OBJECTIVES OF THE STUDY Based upon the purpose, the objectives of the study were to: 1. Find out the potential impact of Computer Assisted Instructions on the teaching of social studies in the Senior High School. 2. Examine the impact of the traditional method of instruction on the performance of students in social studies in Senior High Schools. 3. Compare the performance of students with respect to computer-assisted instruction and the traditional method.
HYPOTHESES 1. Ho: There is no statistically significant difference in the pretest scores of the control group and the experimental group. 2. Ho: There is no statistically significant difference in performance between the control group exposed to the traditional method of teaching and the
experimental group exposed to CAI. 3. Ho: There is no statistically significant difference in the pretest scores and posttest scores of the control group. 4. Ho: There is no statistically significant difference in the pretest scores and posttest scores of the experimental group.
RESEARCH METHODOLOGY This research used the true experimental design (pretest-posttest) on a sample population of 40 students from the Bawku Senior High School. Traditional teaching method and Social Studies tutorial software were used as instruments to collect assessment data and a t-test used as a statistical tool for data analysis.
ANALYSIS AND DISCUSSION OF RESULTS HYPOTHESIS 1 Ho: There is no statistically significant difference in the pretest scores of the control group and the experimental group. The two groups involved in the study were given a pretest to assess how similar in ability the students in each of the groups were. The result of the independent sample t-test is presented in Table 1.
TABLE 1: INDEPENDENT SAMPLE T-TEST FOR THE PRETEST
Group Mean Mean Difference Std.Deviation t-value sig (2-tailed)
Control 6.65 2.681 .000 . 000 1.000 Experimental 6.65 2.870
Significant p< 0.05
Source- Field Data 2011 To test the hypothesis, the independent sample t- test was performed comparing the mean score for the control group (M = 6.65, SD = 2.681) with that of the experimental group (M = 6.65, SD = 2.870). With alpha set at .05, the test was shown to be not statistically significant, t (38) = 1.000, p > .05. Based on the result the null hypothesis is therefore, accepted, that is, there is no significant difference in the pretest scores of the control group and the experimental group. POSTTEST After both classes received four weeks of instruction in a unit in social studies, the classes were administered a posttest. The posttest was designed to evaluate the progress made after introducing the interventions and to compare the results of the instruction received by both groups. HYPOTHESIS 2 Ho: There is no statistically significant difference in performance between the control group exposed to the traditional method of teaching and the experimental group exposed to computer–assisted instruction. The hypothesis was designed to ascertain whether the use of computer- assisted instruction (CAI) in the teaching and learning of social studies can improve students’ performance as compared to the traditional classroom method. The result is depicted in Table 2.
TABLE 2: INDEPENDENT SAMPLES T-TEST FOR POSTTEST
Group Mean Mean Difference Std.Deviation t-value sig (2-tailed)
Control 14.20 2.353 -4.600 -7.913 000 Experimental 18.80 1.105
Significant p< 0.05
Source- Field Data 2011 To test the hypothesis, the independent sample t- test was performed comparing the mean score for the control group (M = 14.20, SD = 2.353) with that of the experimental group (M = 18.80, SD = 1.105) with alpha set at 0.05, the test was shown to be statistically significant, t (38) = 000, p < 0.05. The results of the t-test shown in Table 2 indicate that, there is a significant difference between the posttest score of the control group and that of the experimental group. The effect size for the difference was calculated using Cohen’s (1988) criteria for determining effect size. The effect size for this analysis (d = .87) was large as it was found to exceed Cohen’s (1988) convention for a large effect (d = .80). This is further illustrated in Figure 1 for quick and pictorial presentation.
FIGURE 1: BOX PLOT SHOWING THE MEDIAN AND INTER-QUARTILE RANGES OF BAWKU SHS (POSTTEST)
Control group Experimental group
Control group Experimental group

VOLUME NO. 2 (2012), ISSUE NO. 12 (DECEMBER) ISSN 2231-1009
INTERNATIONAL JOURNAL OF RESEARCH IN COMPUTER APPLICATION & MANAGEMENT A Monthly Double-Blind Peer Reviewed (Refereed/Juried) Open Access International e-Journal - Included in the International Serial Directories
http://ijrcm.org.in/
13
Figure 1, illustrates the median and the inter-quartile ranges of the raw scores of students from the two groups in the study. As depicted in figure 1, the experimental group had median value of 19 with lower and upper quartile value of 18 & 20 respectively, with the control group having median value of 15, lower and upper quartile value of 12 and 16 respectively. This confirms that the experimental group did better in the posttest as compared to the control group. Collier (2004) found that instruction supplemented by properly designed Computer-Assisted Instruction is more effective than instruction without Computer-Assisted Instruction. This contradicts findings by Adeyemi (2012) , who found that students who used Computer Assisted Instruction did not perform better in Social Studies achievement than those students taught with conventional method. A further disagreement was that there was no significant interaction effect of treatment on students’ academic ability and their achievement in Social Studies. However, the finding in this study was confirmed by Bergman and Cheney (1996) who found Computer-Assisted Instruction to increase learner knowledge when it involves the synergy of multiple senses. Learners were found to retain new knowledge better when the curriculum was presented with a combination of formats of text, sound, graphics and video. Furthermore, Egunjobi (2002) in Geography Education, confirmed the findings in this study that CAI seem to be effective in enhancing students’ performance in other subjects than the conventional classroom instruction. HYPOTHESIS 3 Ho: There is no statistically significant difference in the pretest scores and posttest scores of the control group. To test the hypothesis, the independent sample t- test was performed comparing the mean score for the pretest and post test of the control group. The results of the t-test showed in Table 3.
TABLE 3: INDEPENDENT SAMPLES T-TEST ON GROUP MEAN SCORES FOR THE CONTROL GROUP PRETEST AND POSTTEST
Group Mean Mean Difference Std.Deviation t-value sig (2-tailed)
Pretest 6.65 2.270 -7.550 -9.427 000 Posttest 14.20 2.353
Significant p< 0.05
Source- Field Data 2011 Table 3 shows that there is a significant difference between the posttest score and that of the pretest of the control group. Thus pretest (M = 6.65 SD = 2.270) and posttest (M = 14.20, SD = 2.353) with alpha set at 0.05, the test was shown to be statistically significant, t (38) = 000, p < 0.05. The mean score for the post test was higher and significant than the mean score for the pretest. This may be as a result of improved method in teaching or, the introduction of appropriate teaching and learning materials. HYPOTHESIS 4 Ho: There is no statistically significant difference in the pretest scores and posttest scores of the experimental group. To test the hypothesis, the independent sample t- test was performed comparing the mean score for the pretest results (M = 6.65, SD = 2.270) with that of the posttest results (M = 18.80, SD = 1.105) with alpha set at 0.05, the test was shown to be statistically significant, t (38) = 000, p < 0.05. The results of the t-test is showed in Table 4.
TABLE 4: INDEPENDENT SAMPLES T-TEST ON GROUP MEAN SCORES FOR THE EXPERIMENTAL GROUP PRETEST AND POSTTEST RESULTS
Group Mean Mean Difference Std.Deviation t-value sig (2-tailed)
Pretest 6.65 2.353 -12.150 -17.666 000 Posttest 18.80 1.105
Significant p< 0.05
Source- Field Data 2011 From Table 3 and 4 it is observed that, there was statistically significant difference in the performance after the treatment for both groups; however it was much greater with the experimental group who were exposed to Computer-Assisted Instruction than the Control group who were exposed to the traditional method of teaching with a mean difference of 12.15 and 7.55 respectively. This is an indication that students exposed to Computer-Assisted Instruction performed better than those exposed to the traditional method of teaching. This confirms the assertion of Collier (2004) that instruction supplemented by properly designed Computer-Assisted Instruction is more effective than traditional method of instruction. Furthermore, the results indicates that the same students who were exposed to the different forms of learning ( CAI and traditional) produced varied results. The posttest results obtained by the same experimental group was higher than their pretest results and the variation was highly significant. This means that the same group performed better learning with CAI than the ‘chalk and talk’. The above results confirms findings of George & Fraser (1994), in a study of CAI in Geography teaching, that, in contrast to past research, the use of CAI led to a large impact in terms of achievement (effect size of 3.5 standard deviations), attitudes (1.4 standard deviations) and classroom environment (ranging from 1.0 to 1.9 standard deviations). The large effect sizes was attributed to the peculiar technologically-biased, centrally-controlled and achievement-oriented system which produce students who perform well. The large effect sizes seem to suggest that appropriate computer-based teaching can be effective with learners (ie. the Normal students), a finding which is consistent with the meta-analysis of CAL effectiveness reviewed by Kulik & Kulik (1991). This was confirmed by Bergman and Cheney (1996) who found Computer-Assisted Instruction increased learner knowledge when it involves the synergy of multiple senses. Learners were found to retain new knowledge better when the curriculum was presented with a combination of formats of text, sound, graphics and video. Traynor (2003) stated that computers are used not only as a means of helping schools analyze data, but computers have also become a pervasive tool toward optimizing student learning. The computer assisted instruction module may enable students to process information at their own pace which is usually rigidly controlled by the instructor in a traditional objectivist learning environment, hence making the leaning process more individually tailored and achievement oriented.
SUMMARY OF FINDINGS The major findings of the study are as follows: 1. The study found no significant difference in the pretest scores of the control and the experimental groups who were all taught using traditional method. 2. The study found that there was significant difference in the mean scores of students who were exposed to the Computer-Assisted Instruction and those
who were exposed to the traditional method of teaching. The result showed that the experimental group performed better than those exposed to the traditional method of teaching.
3. The study further found that there was statistically significant difference in the performance after the treatment for both groups; however it was much greater with the experimental group who were exposed to Computer-Assisted Instruction than the Control group who were exposed to the traditional method of teaching. This is an indication that students exposed to Computer-Assisted Instruction perform better than those exposed to the traditional method of teaching
RECOMMENDATIONS In the light of the findings of the study, the following recommendations have been made: 1. Ghana Education Service should organize training for teachers on how to use ICT applications in the delivery of lessons at all levels of the educational
ladder and in Senior High schools in particular. 2. Teachers in social studies should incorporate the skills learned in ICT into their lessons delivery as that will motivate students to learn better.

VOLUME NO. 2 (2012), ISSUE NO. 12 (DECEMBER) ISSN 2231-1009
INTERNATIONAL JOURNAL OF RESEARCH IN COMPUTER APPLICATION & MANAGEMENT A Monthly Double-Blind Peer Reviewed (Refereed/Juried) Open Access International e-Journal - Included in the International Serial Directories
http://ijrcm.org.in/
14
3. All schools with computer laboratories should as much as possible not use it for only information and communication technology lessons. Teachers of other subjects should be encouraged to use them for their lessons.
4. Since the use of computer assisted instruction requires students to be conversant with the use of computers, the one laptop per child proposed by the Government of Ghana should be encouraged to come to reality soon.
5. The government and the policy implementers such as Ghana Education Service should put priority on ICT education at all levels of the educational ladder especially at the basic level so that students will be abreast of the use of computers at the early stages.
6. There is the need for the government and all the stakeholders to help develop relevant computer-assisted instruction packages for teaching social studies as well as all other subjects in Senior High Schools in Ghana.
CONCLUSIONS On the basis of the findings of the study the following conclusions are drawn: 1. The introduction of computer assisted instruction in Social Studies is likely to improve the quality of teaching and learning and promote high academic
achievement. 2. Students like learning through concrete materials such as computer assisted instruction medium, which arouse their interest and get them more actively
involved in Social Studies lessons. 3. Learning Social Studies through CAI will make the subject matter real and understandable to students which will later reflect positively in their academic
performance.
SCOPE FOR FURTHER STUDY In view of the findings of this study, it is suggested that the following areas should be inquired into: 1. The effect of CAI on students’ performance in Social Studies with respect to gender. 2. The effect of using CAI together with teacher guided instruction on students’ performance.
ACKNOWLEDGEMENTS We express our sincere gratitude to the Headmaster and Staff of Bawku Senior High School for their kind support extended to us during the collection of data in their school.
REFERENCES 1. Adeyemi B. A. (2012), “Effects of Computer Assisted Instruction (CAI) on Students’ Achievement in Social Studies in Osun State, Nigeria,” Mediterranean
Journal of Social Sciences, Vol. 3, No. 2. 2. Alleman, J. and Brophy, J. (1998), “Assessment in a social constructivist classroom,” Social Education, Vol. 6, pp. 32-34. 3. Ash, J. E. (2005). The effectiveness of computer-assisted instruction on middle school mathematics achievement. Retrieved on 30th March, 2011, from
http://www.research Enstae.edu/dissertation/AA 13187984. 4. Bangert-Drowns, R., W., Kulik, J. A. and. Kulik, C., C. (1985). "Effectiveness of Computer-Based Education in Secondary Schools," Journal of Computer-Based
Instruction, Vol. No. 12, pp. 59-68. 5. Barnett, L. B. (2006): “The effect of computer-assisted instruction on the reading skills of emergent readers,“ Dissertation, Florida Atlantic University,
Florida. 6. Basturk, R. (2005), “The effectiveness of Computer-Assisted Instruction in teaching introductory statistics,” Educational Technology and Society, Vol. 8
No.2, pp. 170-128. 7. Bergman, T. and Cheney, S. (1996). Delivering Cost Effective Services to Small and Mid-Sized Companies: A Guide for Workforce and Workplace
Development Providers. Retrieved June 20, 2010 from http:// search eric.org/ericdb/ed402481.htm (ERIC Document Reproduction Service No. ED 402 481).
8. Braun, J. B., Fernlund, F. and White, C. S., (1999), “Technology tools in the social studies curriculum.” OR: Franklin, Beedle & Associates, Wilsonville. 9. Burns, P.K. and Bozeman, W.C. (1981), “Computer-assisted instruction and mathematics achievement: Is there a relationship?” Educational Technology,
Vol.21, pp. 32-39. 10. Christensen, R. and Knezek, G. (2001),” Instruments for assessing the impact of technology in education,” Computers in the Schools, Vol. 18 No. (2/3, pp.
5-25. 11. Cogan, J.J., Grossman, D. and Lei, M. (2000), “Citizenship: The democratic imagination in a global context,” Social Education, Vol.64, No. 1, pp. 48-52. 12. Cohen, J.,(1988), “Statistical power analysis for the behavioural sciences.” NJ, Erlbaum, Hillsdale. 13. Collier, E. S. O. (2004): The enhancement of the teaching and the learning of the sciences in secondary schools using computer assisted instruction,
Viewed on July 2, 2009 from http:// members’.aol.com/esocollier/computer assistedinstruction.html.approach. California: Sage Publications. 14. Cotton, K. (1997): Computer-assisted instruction, North West Regional Educational Laboratory. Viewed on June 12, 2009, from
http://www.borg.com/~rparkany/PromOriginal/ETAP778/CAI.html 15. Cuban, L. (2001) Oversold and underused: computers in the classroom. Cambridge,MA: Harvard University Press. 16. Dadebo, K. (2003): Development of ICT in Ghanaian Schools. Viewed on June 5, 2011, from http:// www .ghananewsagency .org. 17. Dantala, N. M. (2006): Effect of Computer-Assisted Instruction (CAI) package for individualized learning of history in the senior secondary school in Niger
State, Nigeria,” Thesis, Science Education Department, Federal University of Technology, Minna. 18. Egunjobi, A. O. (2002): The efficacy of two computer-assisted instructional modes on learners’ practical geography achievement at the secondary school
level in Ibadan metropolis, Nigeria” Paper delivered at NAEMT conference, Ibadan, Nigeria, 20-23 November. 19. Fraser, B., J. and Teh, G.,P.,L.(1994), “ Effect Sizes Associated with Micro-PROLOG-Based Computer-Assisted Learning,” Computers & Education,
Vol.23,No.3, pp.187-196. 20. Ganguli, A. B. (1990), “The microcomputer as a demonstration tool for instruction in mathematics,” Journal for Research in Mathematics Education, Vol.
21, pp. 154-159. 21. Glenn, A., D., Kozen, N., A. and Pollak, R.,A. (March 1984), "Teaching Economics: Research Findings from a Microcomputer Videodisc Project," Educational
Technology Vol.24, pp. 30-32. EJ 298 444. 22. Haley, M., L., P. (1991): “Effects of Computer-Assisted Instruction in macroeconomics education: an experimental course design”. Thesis, Middle Tennessee
State University, Tennessee. 23. Hasselbring, T. (1984), “Research on the Effectiveness of Computer-Based Instruction: A review,”. Technical Report No. 84.1.3. Nashville, TN: George
Peabody College for Teachers, Learning Technology Center. 24. Jonassen, D. (1996), “Computers In The Classroom: Mindtools For Critical Thinking. “Merrill Publications, Englewood Cliffs, New Jersey. 25. Karper, C., Robinson, E. H. and Casado-Kehoe, M. (2005), “Computer-assisted instruction and academic achievement in counselor education,” Journal of
Technology in Counselling, Vol.4, No. 1. 26. Kulik, C. C. and Kulik, J. A. (1991), “Effectiveness of computer-based instruction: An updated analysis,” Computers in Human Behavior, Vol.7, No.1-2, pp. 75-
94.

VOLUME NO. 2 (2012), ISSUE NO. 12 (DECEMBER) ISSN 2231-1009
INTERNATIONAL JOURNAL OF RESEARCH IN COMPUTER APPLICATION & MANAGEMENT A Monthly Double-Blind Peer Reviewed (Refereed/Juried) Open Access International e-Journal - Included in the International Serial Directories
http://ijrcm.org.in/
15
27. Kulik, J. (1994), “Meta-analytic studies of findings on computer-based instruction.” In Baker, E.L. and O'Neil, H.F. Jr. (Eds.), Technology Assessment in Education and Training. Lawrence Erlbaum, Hillsdale, NJ.
28. Kulik, J.,A. (2003), “Effects of using instructional technology in elementary and secondary schools: What controlled evaluation studies say.” Final Report (SRI Project No. P10446.001). Arlington, VA: SRI International.
29. Lewis, S. (1995), “Student-created virtual tours,” Learning and Leading with Technology, Vol.23, No. 2, pp. 35-39. 30. McAllister, M. and Mitchell, M. (2002), “Enriching learning using web and computer technologies: how not to throw caution to the wind,” Nurse Education
in Practice, Vol.2, p. 125 – 132. 31. McCoy, L.P. (1996), “Computer-based mathematics learning,” Journal of Research on Computing in Education, Vol.28, No.4, pp.438-460. 32. Mevarech, Z. and Rich, Y. (1985), “Effects of computer-assisted mathematics instruction on disadvantaged pupils' cognitive and affective development,”
Journal of Educational Research, Vol. 79, No.1, pp. 5-11. 33. Mokros, J. and Tinker, R. (1987), “The impact of microcomputers-based labs on children’s ability to interpret graphs,” Journal of Research in Science
Teaching, Vol. 24, pp. 369-383. 34. National Council for the Social Studies. (1994), “Curriculum standards for social studies Expectations of excellence.” Washington, D. C.: Author. 35. Niemiec, R., & Walberg, H., J. (1987), "Comparative Effects of Computer-Assisted Instruction: A Synthesis of Reviews," Journal of Educational Computing
Research, Vol. 3, pp. 19-37. EJ 349 632. 36. Papert, S. , (1993), “ The Children’s Machine: Rethinking the Schools in the Age of the Computers.“ Basic Books , NY: New York. 37. Pelgrum, W. (2001), “Obstacles to the integration of ICT in education: results from a worldwide educational assessment,” Computer and Education, Vol.37,
pp. 163 – 178. 38. Randel, J. M., Morris, B. A., Wetzel, C. D. and Whitehill, B. V. (1992), “The effectiveness of games for educational purposes: A review of recent research,”
Simulation & Gaming, Vol. 23, pp. 261–276. 39. Riverdeep, J., (2000), “Riverdeep user manual.” Riverdeep Interactive Learning, MA: Cambridge. 40. Robertson, J. A. (2004), “ An evaluation to determine the effectiveness of students in learning to add, subtract, multiply and divide integers using a CAI
programs,” Thesis, California State University, Dominguez Hills, United States, California. 41. Roessler, M. (1987), "Students Design a Depression Simulation," Social Education, Vol. 51, pp. 48-51. 42. Setzer, W. V. and Monke L. (2001), “Challenging the applications: An alternative view on why, when and how computers should be used in education.” In R.
Muffoletto, (Ed.), Education and technology: Critical and reflective practices (pp. 141-172). Cresskill, Hampton Press New Jersey. 43. Smaldino, S., Russell, J., Heinich, R., and Molenda, M. , (2004), “Instructional technology and media for learning.” Pearson Books, New York. 44. Thomas, D. B. (2003, spring), “The effectiveness of computer-assisted instruction in secondary schools,” AEDS Journal, Vol.12, No.3, pp.103-116. 45. Traysnor, P.L.(2003), “ Effects of computer-assisted-instruction on different learners,” Journal of Instructional Psychology. Vol. 3, No.1, p. 1. 46. Ugwu, R. (2005), “A field test of CAI software: Velospeedo,” Thesis, California State University, Dominguez Hills, United States, California. 47. Usun, S., (2000), “Computer assisted instruction in the World and Turkey.” Pegam A Yayıncılık, Ankara. 48. White, C. S. (1997), “Technology and social studies: An introduction,” Social Education, Vol. 61, No. 3, pp.147-148.

VOLUME NO. 2 (2012), ISSUE NO. 12 (DECEMBER) ISSN 2231-1009
INTERNATIONAL JOURNAL OF RESEARCH IN COMPUTER APPLICATION & MANAGEMENT A Monthly Double-Blind Peer Reviewed (Refereed/Juried) Open Access International e-Journal - Included in the International Serial Directories
http://ijrcm.org.in/
16
USING THE ANALYTIC HIERARCHY PROCESS TO ENHANCE PARTICIPATORY DECISION-MAKING IN MULTI-STAKEHOLDER INFRASTRUCTURE PROJECTS: A PIPELINE PROJECT CASE STUDY
VICTOR. A. AKUJURU
SR. LECTURER
FACULTY OF ENVIRONMENTAL SCIENCES
RIVERS STATE UNIVERSITY OF SCIENCE & TECHNOLOGY
PORT-HARCOURT
NIGERIA
BANKOLE. O. AWUZIE
PROJECT CONSULTANT
NETWORK PROJECTS
NIGERIA
ABSTRACT
There has been a noticeable increase in the incidence of failed and abandoned infrastructure projects in developing countries in recent times. This is despite the
introduction of several project management techniques and decision making tools for the management of such projects. This has led the developing countries to
suffer from acute infrastructure deficit. In Africa for instance decisions to embark on infrastructure delivery and development are based on political whims and
self-interest. Whereas several researchers have maintained the importance of the early stakeholder involvement in the project delivery cycles especially in the
decision-making process, they have concentrated their effort on collaborative decision making among the project teams neglecting the external stakeholders,
whose immediate environment is been exploited and who don’t derive the expected utility from the development exercise. This article adopts an organisational
perspective in studying the infrastructure delivery process. It utilizes a case study approach alongside a focus group session to understudy the significance of
participatory decision-making and its impact on project delivery success in developing countries. The research findings establish that participatory decision
making is pivotal to the attainment of project success. It points to the dearth of a scientific procedure for conducting participatory decision making processes in
developing countries. This conceptual paper makes a case for the adoption of the Analytic Hierarchy Process (AHP) as a viable tool for conducting participatory
decision making procedures in a credible, structured and transparent manner.
KEYWORDS Analytic Hierarchy Process, Developing countries, Infrastructure delivery system, Participatory Decision making, Stakeholder management.
INTRODUCTION here has been a noticeable increase in the incidence of failed and abandoned infrastructure projects in developing countries, despite the introduction of several project management techniques. This has led the developing countries to suffer from acute infrastructure deficit. Decision making has been identified as one of the significant factors inhibiting the delivery of functional infrastructure (Aibinu & Jagboro, 2002; Ogbonna, 2007), especially in Africa
where decisions to embark on infrastructure delivery and development are taken based on political whims and self-interest (Dessy, 2007). Whereas several researchers have maintained the importance of the early stakeholder involvement in project delivery cycles especially in the decision-making process, they have concentrated on collaborative decision making among the project teams neglecting the external stakeholders-the wider public- whose immediate environment is being exploited and who don’t derive the expected utility from the development exercise. Participatory decision making can be described as an end product of effective stakeholder management process. In developing countries, the lack of effective procedures for selecting and implementing projects has been variously referred to as one of the salient causes of project failure. Researchers have indicated that most projects fail even at their conception stages as they have just been selected for political purposes and for other reasons not necessarily bordering on viability of the intended project. Other projects have failed as a result of the inherent hostility from its host environment as the inhabitants of the community feel removed from the project and work intensely to undermine the success of such project. These reasons have been identified as part of the reasons why the developing world is lagging behind their developed counterparts in infrastructure adequacy and economic growth, especially given the direct relationship between them. The inability of public investment projects to attain sustainability upon completion derive from the lack of key stakeholders’ buy-in into the project objectives; and attendant conflict over project objectives (Klakegg & Haavaldsen, 2011). They ascertain, through the conduct of a survey, that the following reasons, which occur at the front-end, were instrumental to the apparent non-attainment of relevance in major public investment projects namely: poor knowledge about the users’ needs and a misunderstanding of project objectives. Several literatures exist on collaborative decision making among project teams in the project delivery systems of construction projects. A particular school of thought have actually labelled this phenomenon, concurrent engineering. This article realizes that this existential literature dwells on project teams, otherwise described as internal or primary stakeholders without any reference made to the attendant dearth of literature on how to enhance participation of secondary stakeholders in the decision making process as it concerns infrastructure projects in developing countries. It seeks to fill this gap by evaluating the impact of involving external stakeholders, defined in this context as persons affected by the delivery of an infrastructure project, in the decision making process in the attainment of project success. It also suggests the adoption of the Analytic Hierarchy Process (AHP) as an effective medium for enhancing participatory decision making in multi-stakeholder project delivery systems such as the infrastructure delivery systems in developing countries. This article commences by describing the infrastructure delivery system from an organisational perspective, buttressing on the inherent complexity of the system. This complexity arises from the multi-stakeholder and multiplicity of processes involved in the delivery process. It proceeds to review the literature on decision making as a project management skill essential for delivering successful projects within the context of developing countries. The article shall adopt the following steps to arrive at its conclusion: an organisational perspective of an infrastructure delivery system; a review of project stakeholder literature; an insight in decision-making and participatory decision-making; the AHP as a multi-criteria decision making tool; a justification of the methodology adopted for the study; the findings emanating from the study; discussion of findings; and the conclusion
INFRASTRUCTURE DELIVERY SYSTEM: AN ORGANISATIONAL PERSPECTIVE An organization has been described as “a complex network of interpersonal interactions with closure ….emerge when ongoing interactions produce recurrent
coordination of actions among participants, thus creating order out of chaos” (Espejo, 1994: 205). Gallagher, Rose, McClelland, Reynolds, and Tombs (1997) view an organization as a group of people operating within given boundaries, collaborating as it were with the sole aim of achieving a common objective. These definitions acknowledge the authenticity of the argument that organizations arise out of inter- personal and inter-organizational interactions which result in
T

VOLUME NO. 2 (2012), ISSUE NO. 12 (DECEMBER) ISSN 2231-1009
INTERNATIONAL JOURNAL OF RESEARCH IN COMPUTER APPLICATION & MANAGEMENT A Monthly Double-Blind Peer Reviewed (Refereed/Juried) Open Access International e-Journal - Included in the International Serial Directories
http://ijrcm.org.in/
17
complexities given the attendant uniqueness of each individual and organization (Burton, Obel, & Desanctis, 2011; Shirazi, Langford, & Rowlinson, 1996; Stinchcombe, 1965) . Child (1984) posits that the success of a given project is significantly affected by its relationship with the external environment. These structures refer to those avenues within a given organization which influences the manner in which it confronts the task of delivering the organizational objectives and goals. The performance of any organization is greatly affected by the degree of the management’s understanding of the organization as an integrated and dynamic whole (Hoverstadt, 2008; Miles, Snow, Meyer, & Coleman, 1978). This knowledge would enable them to confront future changes in its external environmental conditions. The design of an organization should ensure that the following attributes are factored into the design: need for a framework to assess inter-personal relationships within the organization; need for the inclusion of performance measurement systems to aid assessments of personal achievements and contributions towards the attainment of collective tasks; and most especially the guidelines for choosing the structures and developing them(Child, 1984; Daft, 2009). Eisenhardt and Zbaracki (1992) describe organisations as political systems consisting of various collectives of people with at least partially conflicting goals or objectives. Viewing an organisation from a political prism, they posit that a very critical feature of the political model is the fact that choice as established by the organisation is a mere reflection of the preferences of powerful people. These people also engage in politics from time to time. This leads them to arrive at the conclusion that the people with conflicting preferences engage in politics in order to gain a favourable decision. This is the dominant situation in the developing world where the majority are neglected in the decision making process. According to Lahdenpera and Koppinen (2009) project delivery systems can be described as the organisational framework of a project which defines the control mechanisms and the relationships between the actors and the incentives. In the sphere of infrastructure delivery, project-organizations are prevalent. These project-based organizations have been designed in such a manner that allows their internal structures to confront the attendant complexity within the infrastructure delivery environment. An Infrastructure Delivery System has been described as pivotal to the success of any infrastructure/project development activity (Lahdenpera & Koppinen, 2009). They stress the significance of effective delivery systems to the client as it improves the chances of attaining her objectives. Infrastructure Delivery Systems are complex projects (Baccarini, 1996; Bertelsen, 2003) comprising of several relationships between the various stakeholders. Packendorff (1995) and Turner and Muller (2003) argue that projects should not be studied in isolation from issues such as cultural affinities, conceptions, relationship with the immediate environment, but rather as temporary organizations consisting of goal-fulfilling subsystems dependent on a pivotal and tactically situated parent system for their existence. In delivering infrastructure projects in the developing climes, much consideration has not been accorded to the environment and secondary stakeholders particularly the host communities and end users especially as it concerns the decision making procedures. The decisions are normally handed down authoritatively thus breeding hostile external environments for these project organisations. Arguably this has negated the performance or functionality of these infrastructure projects. Dessy (2007) acknowledges the fact that the performance of African countries in services delivery to the citizenry has continued to dwindle and tether on the edge. He insists that the situation has maintained an unresponsive stance towards the several changes in institutional arrangements, as it continues unabated under centralized and decentralized delivery mechanisms. He highlights the views of several development experts who opine that the main problem with Africa remained the inability of the citizens, especially the poor, to hold the state accountable for its policy making.
MANAGING PROJECT STAKEHOLDERS There is an absence of any broadly accepted definition of the term “stakeholder” as well as reasons for its evolution in academic discourse (Yang, Shen, & Ho, 2009; Yosie & Herbst, 1998). For instance, Clarkson (1995) acknowledges the disparity between Freeman’s (1984) and Preston’s (1990) account of the evolution of the term ‘stakeholders’. Whereas the former asserts that the term was first used by SRI international in 1963, the latter traces its origin to the period of the great depression when the General Electric used the term stakeholders to describe its shareholders; employees; and customers. Freeman (1984:46) in his seminal book entitled ‘Strategic Management; A Stakeholder Approach’ describes the term ‘stakeholder’ as “any group or individual who can affect or is affected by the achievement of the organization’s objectives”. In recent literature, he adjusts his position, stating that anyone who was capable of affecting the survival or the success of any given organization was qualified to be classified as a stakeholder (Freeman, 2004). The term ‘stakeholder’ has been used to describe all persons or groups who lay claims to a certain degree of ownership or rights or interests in a particular organization and the inherent activities of that organization, either in the past, the present or the future (Clarkson, 1995). PMI (2008) defines stakeholders as those persons or organizations (e.g. customers, sponsors, the performing organization, or the public) who are actively involved in the project or whose interests may be positively or negatively affected by the performance of or completion of the project. This article finds the definition rendered by Walker, Bourne, and Rowlinson (2008)as being most appropriate for the ensuing discourse on the significance of stakeholder involvement in decision making within the context of developing nations. Walker et al.(2008:73) define stakeholder as “individuals or groups who
have an interest or some aspect of rights or ownership in the project , and can contribute to, or be impacted by either the work or the outcomes of the project.” In developing countries, most infrastructure projects are intended for the public good and are termed as being owned by the public sector on behalf of the citizenry. Whereas Freeman (1984)and Mitchell, Agle, and Wood (1997) identify the existence of two classes of stakeholders: primary and secondary stakeholders respectively, Cleland (1998) Olander (2007) and PMI (2008) jointly agree with the classification of stakeholders into two distinct groupings: internal and external stakeholders respectively. Walker et al. (2008) adopts a different categorization, classifying stakeholders into four distinct groups. The primary stakeholders are those stakeholders whose activities constitute the lifeline of the organization and without which the organization would cease to exist (Clarkson, 1995).The secondary stakeholders are those stakeholders whose activities affect or are affected by the operations of the organization even though they are not actively engaged in any direct transaction with the organization, thus not affecting the organization’s survival. This group of stakeholders whilst not having a direct effect on the survival ability of the organization can actually affect the organization’s image negatively or positively. Walker et al. (2008) identify four stakeholder groups: upstream stakeholders (paying customer or end user), down- stream stakeholders (supply chain); external stakeholders (the host community, independent minded persons who feel that the project will eventually affect them in one way or the other. This typology of stakeholders was deemed fit for the purpose of this research article as the focus of the paper lies within the ambit of the external stakeholders. In furtherance to the adopted typology, Karlsen (2002) maintains that the following could be categorized as stakeholders within a construction project environment: clients, contractors, labour unions, Non-governmental organizations, end users, controlling organizations, public authorities, financial institutions, media, and third parties among others. Meredith and Mantel (2000) in highlighting the importance of stakeholders maintains that many project managers end up delivering objectives which are outside the scope of stakeholder demands thus resulting in project failure. Poor communication, assignment of inadequate resources to the execution of the project, incessant changes in project scope, unfavourable media attention, and negative community reactions to the project have been identified as the problems caused by project stakeholders which directly increases the degree of uncertainty on projects (Karlsen, 2002). This increase in uncertainty makes the project more susceptible to failure. Regrettably despite the established influence of stakeholders on project outcomes, Karlsen (2002) laments the fact that reactions by the project management team to these influences is typified by causal actions. The absence of any clearly defined strategies for confronting the impact of these influences has led to the development of the stakeholder management theory/concept. Under the concept of stakeholder management, different stakeholder management methods and approaches have evolved. The theory of stakeholder management is, admittedly, central to the success of any project. Project managers should set about their projects by identifying these stakeholders and determining the degree of influence which they wield either collectively or individually. The stakeholder management process commences with the process of identifying the stakeholders and understanding the kind of influence which these stakeholders wield upon the project organization and designing a means of effectively managing these influences for the attainment of the project’s objectives. Stakeholders exert tremendous impact on the project organization. Mitchell et al. (1997) assert that the essential nature of stakeholder management within contemporary management

VOLUME NO. 2 (2012), ISSUE NO. 12 (DECEMBER) ISSN 2231-1009
INTERNATIONAL JOURNAL OF RESEARCH IN COMPUTER APPLICATION & MANAGEMENT A Monthly Double-Blind Peer Reviewed (Refereed/Juried) Open Access International e-Journal - Included in the International Serial Directories
http://ijrcm.org.in/
18
environment whilst Olander (2007) agrees that the effective management of stakeholder interests in a given project remains a daunting challenge for most project mangement teams and continually remains crucial for the attainment of project success. The daunting nature of this task lies in the existence of divergent expectations arising from diverse stakeholders. This makes the creation of a platform for enhanced particpiation of a diverse range of stakeholders in the decision making process desireable.
DECISON MAKING PROCESSES IN INFRASTRUCTURE PROJECTS There is no broadly acceptable definition of the term “decision” within the plethora of decision making theory literature ((Eilon, 1969; Eisenhardt & Zbaracki, 1992; Kiker, Bridges, Varghese, Seager, & Linkov, 2005). Keren (1996) maintains that Edwards’ seminal piece on the theory of decision making in 1954 marked the turning point in the evolution of the behavioural decision making theory. Edwards (1954) established that economists and others, over the years have been developing mathematical theories about how people make choices among desirable alter-natives. These theories, he insists, centre on the notion of the subjective value, or utility, of the alternatives among which the decider must choose. Eilon (1969) rather cites Ofstad (1961) as inferring that an individual could be referred to as having made a decision when he; “has started a series of behavioural
reactions in favour of something, or it may mean that he has made up his mind to do a certain action, which he has no doubts that he ought to do, or to make
judgement regarding what one ought to do in a certain situation after having deliberated on some alternative courses of action”. From these words credited to Ofstad (1961), Eilon highlights three cardinal points, namely: that the decision maker has several alternatives; that his choice involves a comparison between these alternatives and the evaluation of their outcomes. He defines the decision process as consisting of a series of steps, starting with information output and analysis and culminating in resolution, namely a selection from a set of available alternatives. The resolution serves as the decision made by the decision maker from a list of likely alternatives. Eisenhardt and Zbaracki (1992) in their bid to highlight the significance of decision making processes within organisations, agree that the manner of strategic decision making processes adopted by an entity is central to its entire strategic process. Decision making process in environmental projects can be complex due to the inherent trade-offs between socio-political, environmental, ecological, and economic factors (Kiker et al., 2005). Mustajoki, Hämäläinen, and Marttunen (2004) further accentuate the inherent difficulty encountered in decision making processes relating environmental projects such as the pipeline project being studied in this article. Environmental decisions are often complex and multi-faceted involving various stakeholders with different priorities or objectives-presenting exactly the same type of problem that behavioural decision research has shown humans as poorly equipped to solve unaided (Kiker et al., 2005). For projects which have the potential of distorting the attendant environmental harmony in the developing world, decision makers normally depend upon four types of generalized technical input for their decision making: the results of modelling and monitoring studies; risk assessment; cost-benefit analysis; and stakeholder preferences (Kiker et al. 2005). They maintain that the manner in which the decision makers handle these matters, usually in a heuristic and subjective manner leads to a situation where the decision so made cannot be defended due to the unstructured manner in which the decisions might have been made. They maintain that even when a structured approach is employed, it may be seen as lacking the needed flexibility to adapt to localized concerns or faithfully represent minority viewpoints thus undermining the end decision. This is apparently the problem encountered in the decision making process. Artunes et al (2006) state that the inherent difficulty in multi-stakeholder projects is also noticeable in: the evaluation of the environmental impacts of a specific project, the environmental assessment of a programme, or the development of sustainability pathways. They cite Forester (1999) as identifying the need to consider not only the facts, but also values, asking questions as it concerns what ought to be honoured, protected, sustained, or developed. They maintain that this inquiry which leads to a specific decision requires the active involvement of all relevant stakeholders and at early stages too. Kiker et al (2005) and Antunes et al. (2006) also maintain that the difficult nature of the decision making process in project based organisations concerned with projects with huge socio-economic and technological consequence on the environment and its inhabitants has been seemingly aggravated by the ad-hoc posture adopted by several decision makers in contemporary times. This apparent loss of faith in this ad-hoc procedure for decision making has led to a gradually evolving decision making protocol based on a systematic procedure as depicted in the Figure 1.
FIGURE 1
Source: Kiker et al. (2005)
Most of the decisions made in developing countries are based on this ad-hoc procedure as shown in the current decision making process in diagram 1. From the diagram, it can be deduced that the opinions of the stakeholders particularly the external stakeholders are considered non-important and not usually heeded by the decision-makers or policy makers. This culminates into the delivery of projects that are not in tandem with the expectations of these stakeholders. The use of the cloud boundary for the current decision-making process, buttresses the lack of firm structure in the decision making process thus making it susceptible to manipulations along tribal, religious and political lines. The clamour for the use of a structured decision making procedure for major infrastructure projects in the developing world stems from the inability of the structured approach to maintain an objective stand rather than a subjective one. Kiker et al. (2005) makes a rather strong case for the adoption of Multi-Criteria Decision Analysis (MCDA) techniques in the conduct of structured decision making in complex environmental projects including major infrastructure delivery.

VOLUME NO. 2 (2012), ISSUE NO. 12 (DECEMBER) ISSN 2231-1009
INTERNATIONAL JOURNAL OF RESEARCH IN COMPUTER APPLICATION & MANAGEMENT A Monthly Double-Blind Peer Reviewed (Refereed/Juried) Open Access International e-Journal - Included in the International Serial Directories
http://ijrcm.org.in/
19
They admit that several researches in the area of multi-criteria decision analysis (MCDA) have made available practical methods for applying scientific decision theoretical approaches to complex multi-criteria problems such as the AHP. They posit that for group problems, the process of quantifying stakeholder preferences may be more intensive, often incorporating aspects of group decision making necessary for stakeholder involvement in decision-making for the intended project. MCDA approaches possess the capability to call attention to similarities or potential areas of conflict between stakeholders with different views, thus resulting in a more complete understanding of the values held by others. Kiker et al. (2005) argue that the purpose of MCDAs’ is not to always single out the best decisions, but to help improve understanding in a way that facilitates a decision-making process involving risk, multiple criteria, and conflicting interests. It visualizes trade-offs among multiple conflicting criteria and quantifies the uncertainties necessary for comparison of available remedial and abatement alternatives. Mustajoki et al. (2004) maintain that MCDA provides a transparent way to structure problems and support the elicitation of preferences in participatory decision making. It is a systematic process where different elements of the problem are identified and modelled, and the stakeholders’ preferences elicited within a structured framework. They stress the conflicting interests of these stakeholders and the need for the employment of transparent methods to settle the differences.
INTEGRATING EXTERNAL STAKEHOLDERS INTO DECISION-MAKING: THE ART OF PARTICIPATORY DECISION MAKING Kiker et al. (2005) admit the increasing significance of stakeholders involvement in the decision making process as an essential element for decision making processes. Yosie and Herbst (1998) posit that the stakeholder involvement in decision making as it concerns the environment by government and industry is inevitable and will continue to expand. They observe that the increased use of stakeholder processes over the past decade was actually representative of societal interest in more interactive forms of decision making. Kiker et al. (2005) assert that the current decision making process actually limits stakeholder participation within the decide and defend paradigm that positions stakeholders as constraints to be tested rather than the source of core values that should drive the decision making process. Arguably, this is the case in most project-based decision-making processes especially in developing countries. According to Edelenbos and Klijn (2004), reasons for the increased advocacy for participatory decision making involving stakeholders range from an attempt to drastically reduce the veto power of various societal participants by involving them in decision making, the need to improve the quality of decision making by using information and solutions of various actors and bridging the perceived broadening gap between citizens and politicians. This has been the case in developing countries where active early stakeholder involvement in the decision-making processes as it concerns infrastructure delivery activities have been at the lowest ebb thus resulting in the delivery of unwanted assets (Dessy, 2007). Artunes et al (2006) whilst reviewing the works of Gregory (2000) and Hammond et al., (1999) posited that a structured decision-making strategy for supporting wider participation in the process should be imbued with the requisite attributes to perform the following tasks: Framing the decision; defining the problem to make sure the ‘‘right’’ problem is addressed; defining key objectives and criteria: identifying what values matter most to stakeholders; establishing alternatives and considering the relevant constraints: viewing these alternatives as portfolios of actions rather than individual options, since for most sustainability issues there is no such thing as a single ‘‘best action’’, but rather a ‘‘more desirable policy mix’’; identifying consequences-the most important impacts that can affect the stated objectives and associated uncertainties; evaluating the desirability of the consequences according to the proposed criteria; clarifying trade-offs: identifying important conflicts across the desired objectives to use this knowledge for decision making and to create new and better alternatives. The ability of the MCDAs to achieve these tasks has led to increased advocacy for its adoption in contemporary participatory decision-making discourse (Mustajoki et al., 2004). Arnstein (1969) puts forward a typology of eight levels of participation to assist with understanding what actually consists of citizenship participation. This typology can be found in below. FIGURE 2 below.
FIGURE 2
Source: Arnstein (1969)
Although this typology as developed by Armstein has been used in various societal spheres such as urban renewal and anti-poverty initiatives, he maintains that the illustration of the typology could easily be described as analogous to what obtains in various situations such as;- churches currently facing demands for power from priests and laymen seeking to bring about change within the organisation; colleges and universities which have assumed the status of literal battle fields over salient issues concerning student power and rights; or public schools, city halls, and police departments. The underlying issues remain fundamentally the same – the ‘have-nots’ trying to upset the cart and assume the positions of the ‘haves’ thereby possessing enough power to render the target organisations submissive to their views, aspirations, and needs. This situation can be described from the developing country context of the typical project-based Infrastructure Delivery System (IDS) and the subsequent interaction with its host communities who represent a majority of its external environment-external stakeholders. Following from the various stages of an

VOLUME NO. 2 (2012), ISSUE NO. 12 (DECEMBER) ISSN 2231-1009
INTERNATIONAL JOURNAL OF RESEARCH IN COMPUTER APPLICATION & MANAGEMENT A Monthly Double-Blind Peer Reviewed (Refereed/Juried) Open Access International e-Journal - Included in the International Serial Directories
http://ijrcm.org.in/
20
infrastructure project lifecycle as identified by Fewings (2005) especially at the inception and the strategy stage, the citizens are usually overlooked and at best, viewed as being on the lower rungs of the tokenism strata of the participation ladder described above-informing and consulting. This often results in decisions taken to benefit a few power brokers as against the views of the majority of the citizens whose socio-economic and geographical landscape such a project would have a tremendous impact on. This culminates into the delivery of projects which do not agree with the values and norms held as being sacrosanct within that particular locality. This article argues that this is a major cause of project failure as planning is a crucial part of the project delivery process and if it’s not dependent on an inclusive decision-making process which is transparent and structured, it would lead to numerous acts of sabotage and apathy by the external stakeholders who ideally should be interested in ensuring accountability, probity and that the project is fit for the intended purpose. The advocacy for an all-inclusive stakeholder is premised upon the numerous advantages associated with this phenomenon. Edelenbos and Klijn (2006) in making a case for interactive decision making assert that interactive decision making should be viewed as a way of achieving an increment in the degree of citizen involvement in governance thus reducing the gap between government and its citizens. As if to buttress their points, they cite several authors as maintaining that the interactive decisions have been employed in the Netherlands as a new type of horizontal steering for solving problems (Klijn & Koppenjan, 2006) In their own contribution, Irvin and Stansbury (2004)) identify the advantages of citizen involvement in decision making as including: education; political suasion; empowerment; breaking the gridlock; avoiding litigation costs; environmental management. They also highlighted the demerits: the difficulty of diffusing citizen goodwill; complacency; representation; lack of authority; the power of wrong decisions; persistent selfishness. They maintain that the argument for enhanced citizenship participation often rests on the merits of the process and the belief that an engaged citizenry is better than a passive citizenry as postulated in King, Feltey, and Susel (1998). Vroom and Jago (1988) insist that “a policy that is well grounded in citizen preferences
might be implemented in a smoother, less costly fashion because the public is more cooperative when the policy is implemented.” Having reviewed the various literatures which have revealed the pros of the participatory decision-making tool and make a case for the adoption of an approach that enhances the integrity of the decision made by the various stakeholders, attention is drawn to the quality of the decisions made through the participatory process by Beierle (2002). He admits the existence of little or inadequate literature on the quality of stakeholder-based decisions. Whereas Edelenbos and Klijn (2006) argue that there is no standard procedure for evaluating the strengths and weakness of different modelling approaches for sustainable development decision-making, Beierle (2002) embarks on an investigation to unravel the quality of these decisions in a systematic manner. After a thorough analysis of data emanating from a sample size of two hundred and thirty nine cases, he came to the conclusion that the stakeholder-based decision making processes where replete with making sound decisions. This makes it critical that this study is contextualized to developing countries in the continued search for variables likely to positively influence project performance within those climes, especially as it affects infrastructure projects.
ANALYTICAL HIERARCHY PROCESS (AHP) AS AN MCDA One of the basic problems affecting effective decision making in multi-stakeholder project environments such as the infrastructure delivery project environment has been identified by Saaty (1994). He maintains that the prevalence of several stakeholders within a particular project environment interested in achieving their own objectives without any consideration for other stakeholders in the environment made effective decision making by the project leader a difficult task. Good decisions, he insists, must take cognizance of the complexities of the environment for it to be able to withstand the hazardous nature of the environment. To be able to survive the environment as mentioned above , a decision making approach should have the following characteristics: simple to construct; be adaptable to both groups and individuals alike; be natural to our intuition and general thinking; encourage compromise and consensus building; and not require inordinate specialization to master and communicate (Saaty & Vargas, 2001). This is in tandem to the characteristics enumerated earlier in this article. The AHP, a decision making tool developed by Saaty in 1980 (Palcic & Lalic, 2009) possesses the aforementioned characteristics thus making it most suitable for decision-making in multi-actor environments. The AHP was designed as a tool for solving technical and managerial problems through the quantification of the a relative priorities for a given set of alternatives on a ratio-scale based on the decision-makers judgement, stressing as it were the significance of the intuitive judgements of a decision-maker as well as the consistency of the comparison of alternatives in the decision making process. The AHP contributes to solving complex problems by structuring a hierarchy of criteria, stakeholders, and outcomes and by eliciting judgements to develop priorities. He maintains that systems theorists have pointed out that we can better understand an entire system by examining it from a general, holistic perspective that does not give as much attention to the function of its parts. The AHP allows researchers and decision makers to “structure a system and its environment into mutually interacting parts and then to synthesize them by
measuring and ranking the impact of these parts on the entire system (Saaty & Vargas, 2001). They further posit that the AHP assists leaders with socially responsible decision making by enabling them avoid oversimplification, identify and evaluate costs and benefits, to plan for the future, and to adapt to change. Steps for the application of the AHP in decision making: - planners have to initially develop a hierarchy of all details and likely outcomes; they then judge the relative importance of these details and accord them numbers to quantify them. The principles of analytic thinking include: - the principles of constructing hierarchies; the principle of establishing priorities, and the principle of logical consistency. He argues that words limit the perspectives of our feelings and justifies the use of numbers for measuring physical experiences. AHP enables decision makers to determine priorities and to make trade-offs. He opines that the AHP has evolved out of the need to incorporate the basic observations on human nature, analytic thinking, and measurement for quantitative approach to problem solving. The AHP is a powerful model for tackling complex political and socioeconomic problems. It furthermore provides a framework for group participation in decision making or problem solving. He argues that to shape unstructured reality requires collective participation, bargaining and compromise. Saaty (1994) maintains that the AHP can be used to “stimulate ideas for creative courses of action and to evaluate their effectiveness. It helps leaders determine what information is worth acquiring to evaluate the impact of relevant factors in complex situations. And it tracks the inconsistencies in the participant’s judgements and preferences, thereby enabling leaders to assess the quality of their assistants’ knowledge and the stability of the solution. The AHP understands the limitations posed by the absence of measureable scales for attaching value to the socio-economic characteristics and strives to adopt a quantitative approach to affix numbers to these characteristics to aid measurability. Complex systems can best be understood by breaking them down into constituent elements, structuring the elements hierarchically, and then composing or synthesizing, judgements on the relative importance of the elements at each level of the hierarchy into a set of overall priorities. Basic considerations in constructing a hierarchy include: identification of the overall aim; identification of the sub-aims; identification of criteria which must be satisfied to fulfil the sub-aims of the overall aim; identification of the sub-criteria under each criterion; identification of actors involved; identification of the actor’s goals; identification of the actors’ policies; identification of the options and outcomes; for yes-no decisions, take the most preferred outcome and compare the benefits and costs of making the decision with those of not making it; and then do a benefit/cost analysis using marginal values . Structuring a hierarchy requires substantial knowledge of the system or problem in question. Saaty (2001)accepts that the modelling of a problem is the most creative part of decision making and is one which has a significant effect upon the outcome of such decisions. He opines that most of the problems encountered in various systems stem out of our inability to understand the internal dynamics of a system in enough detail so as to be able to identify cause-and-effect relationships. He maintains that if we are able to do so then the , the problem would be reduced to one of social engineering, as we would know at what points in the system intervention is necessary to bring about the desired objective. Various applications of the AHP include: setting priorities; generating a set of alternatives; choosing the best policy alternatives; determining requirements; allocating resources; predicting outcomes and assessing risks; measuring performance; designing a system; ensuring system stability; optimizing ; planning; and resolving conflicts.
RESEARCH METHODOLOGY Yin (1994:59) defines case study as an “empirical inquiry that investigates a contemporary phenomenon within its real-life context and addresses a situation in
which the boundaries between phenomenon and context are not clearly evident.” He maintains that this approach is of essence when the research has to do with

VOLUME NO. 2 (2012), ISSUE NO. 12 (DECEMBER) ISSN 2231-1009
INTERNATIONAL JOURNAL OF RESEARCH IN COMPUTER APPLICATION & MANAGEMENT A Monthly Double-Blind Peer Reviewed (Refereed/Juried) Open Access International e-Journal - Included in the International Serial Directories
http://ijrcm.org.in/
21
the examination of contemporary events, in situations where the relevant behaviours cannot be manipulated. This article seeks to understudy the significance of participatory decision making on project delivery success and to make a case for the adoption of the AHP to enhance such decision making processes. It does not seek to unravel and discuss all other variables which might be responsible for project failure in developing countries as there abounds extensive literature on that topical issue. The case study approach relies upon multiple evidences (Yin, 1994) with data needing to converge in a triangulating fashion and as another result. This enables the researcher to utilize multiple methods in the conduct of his investigation as is the case in this particular research. For this particular study, focus groups arranged at workshops involving stakeholders and documentary evidence were employed alongside observation. This study employs a single case design. Yin attempts to justify this approach by insisting that single case designs are most viable when: the single case represents the critical case in testing a well-formulated theory; when the single case represents an extreme or unique case; and when the single case is a revelatory one. This opinion was supported by Jefferies, Gameson, and Rowlinson (2002) in their study of the Olympics stadium project. This particular study is a revelatory one and thus finds it expedient to use a single case design. Data was collected through multiple sources namely: Interviews were held initially with selected stakeholders in a bid to identify the particular classes which several stakeholders belonged to with regards to project X. Afterwards; a focus group interview was held. During this, participants were selected from a wider sample of stakeholders. They were invited to a stakeholder forum and asked to express their views as it concerns the phenomenon being understudied. The stakeholders were selected on the basis of their influence on the entire project delivery process. Primary and secondary stakeholders alike were asked to share personal experiences about their involvement in various decisions taken at various stages of the project lifecycle. They were also asked to identify what the critical success factors were for project X. Subsequently, they were also asked to rank these critical success factors in terms of priority.
CASE DESCRIPTION The case study utilized in this study shall be referred to as project X. The case study was carefully selected based on the case study selection criteria enumerated in the preceding section. Project X involves the laying of a 42” diameter pipeline measuring a distance of approximately 50kilometers (Km). Upon completion, project X is expected to transverse twenty (20) major communities situated in four different local government areas of a state in the Niger Delta region of Nigeria. It is also hoped to boost export and domestic gas supply. The contract for the construction of project X was awarded in 2010 by an oil prospecting and development JV (Joint venture) company owned by the Nigerian government and an oil prospecting and exploration multinational. The main contractor for the project was an indigenous contracting concern, in line with the government’s drive towards local content development within the oil and gas sector of the economy. The length of the pipeline and the numerous communities it transverses increased its degree of complexity as it brought along with it, various stakeholders each possessing their peculiar expectations and objectives. Project X was deemed appropriate for the investigation into the manner of decision making approaches adopted by the project team and its impact on the progress of the project. Project X has commenced and is currently on-going at the time of this study.
FINDINGS As had been stated earlier the members of the project team, described as internal stakeholders were initially interviewed with a view to ascertaining their approach to the planning of the project. Members of this group of stakeholders were drawn from the project sponsor, the main contractor and the project manager in charge of the project. After this round of interviews, the investigators shifted their focus to the group of stakeholders critical to the study-the external stakeholders. These stakeholders were invited to a workshop where a focus group was conducted with an experienced moderator mandated to preside over the session. From these two data collection sources employed for the course of this investigation, the following findings were obtained: IDENTIFICATION OF STAKEHOLDERS During the interview sessions, most of the interviewees agreed with classification rendered within the existing literature. They ascribed the external stakeholder status to members host communities through which project X was expected to pass through. They saw themselves as those who were solely responsible for the delivery of the project and understood that the significance of gaining the support of the host communities if they were to succeed in the achieving project success. Focus group participants drawn from the various host communities were also aware of their position as external stakeholders. IDENTIFICATION OF CRITICAL SUCCESS FACTORS Critical success factors have been described by Rowlinson (1999) as those fundamental issues inherent in the project which must be maintained for the enhanced team-working to take place in an efficient and effective manner. In an attempt to define CSFs, Freund (1988) traces its origin to John Rockard’s definition. John Rockard defines CSFs as “those things that must be done if a company is to be successful”. Characteristics of CSFs are identified as including; their significance in the attainment of the overall corporate goals and objectives; they should remain measurable and controllable within the context where they are applicable; ideally, they should be relatively few in number; they should also be expressed as activities which must be carried out during the process and not at the end of the process; they should also be applicable to companies operating within a particular sector which possess similar strategies and objectives; they should also be hierarchical in nature (Freund 1988). In the context of this study as it pertains to the delivery of a pipeline project, the CSFs would ideally be associated with the attainment of the stakeholder expectations. During the inquest, it was discovered that the internal stakeholders agreed that apart from successful delivery of the project according to the key success criteria of the timely completion, under-budget, and to the required condition to perform the tasks required by the project sponsor; the expectations of the external stakeholders was of prime importance. To this effect they maintained that they developed CSFs relative to the attainment of these expectations. External stakeholders maintained, during the focus group sessions, that they were asked to list in order of importance, their various expectations during workshops and town hall meetings. The most important expectations highlighted were the need for adequate compensation for the acquired property along the routes through which the pipelines would run and the need for the engagement of local labour and resources in the delivery process-local content. The project team maintained that they developed CSFs which were geared towards ensuring the attainment of these expectations whereas the external stakeholders insisted that they were being neglected. They admitted that instead of the skill development activities, they were being engaged as surveillance contractors to secure and protect the constructed pipeline and project sites. THE DECISION MAKING PROCESS AND EXTERNAL STAKEHOLDER INVOLVEMENT Upon further scrutiny, it was discovered that decision on the CSFs to be adopted and the order in which they were to be adopted were done without the actual involvement of the external stakeholders. The internal project stakeholders adopted a generic view of what should be paid as compensation and also on how to deliver local content development without any input from the host communities. Apparently this negates the principle of citizen power in participatory decision making, especially as ensconced by Armstein in his citizen participation ladder framework but rather depicting manipulation and at best tokenism in arriving at the decision-making. PERCEPTIONS OF EXTERNAL STAKEHOLDERS ON THE DECISION-MAKING APPROACH EMPLOYED IN ARRIVING AT THE COMPENSATION VALUE Most of the participants in the focus group representing the project host communities insisted that the workshops were one-sided as their opinions were sought but not adopted by the project team. They insisted that they made no input in the modalities in deciding what constitutes adequate and fair compensation for acquisition of their landed properties and the inherent loss of livelihood. Whereas the project team insisted that they took these wider socio-economic criteria for project success into consideration in the decisions made as it concerns the CSFs in project X, they could not identify any structured approach that would enable the investigators establish that these expectations were considered at all. The World Bank recommends that in assessing compensation, (a) attention should be paid to the adequacy of the legal title, registration and site occupation; (b) the affected people should be notified of the prevailing laws and regulations on valuation and compensation involved; (c) establishment of the requisite criteria for resettlement eligibility of the affected households; and (d) the development of mechanisms for the prevention of illegal encroachers and squatters from participating in the compensation arrangements. There was no evidence that this guideline was adopted as the stakeholders had no knowledge of these and could not demand for their adoption. This belief that that their

VOLUME NO. 2 (2012), ISSUE NO. 12 (DECEMBER) ISSN 2231-1009
INTERNATIONAL JOURNAL OF RESEARCH IN COMPUTER APPLICATION & MANAGEMENT A Monthly Double-Blind Peer Reviewed (Refereed/Juried) Open Access International e-Journal - Included in the International Serial Directories
http://ijrcm.org.in/
22
contributions were not adopted in the decisions invariably leads to increased hostility within the host communities thus denigrating the eventual success of the project. This is why the AHP becomes imperative. If it had been adopted, the external stakeholders would have no difficulty in assessing the manner in which their contributions were considered due to the transparent and structured approach it brings to the act of decision making.
DISCUSSION Although this study focuses on the early planning stages, project X has commenced and is in its early construction stages. Pockets of dissenting voices from the host communities are being heard. Considering Mitchell et al. (1997) typology of stakeholder influence on projects based on the kind of attributes they possess and the dynamic nature of this typology, it becomes likely that these pockets of dissent against the project might result in massive protestations against the project if the communities feel that their expectations are not being attained by the project team at any time as a result of their non-participation in the decision-making process. This shows the need for the significance of citizen power and the fact that most persons would take ownership of the project, ensuring its success, if they feel that they have made major inputs into the project. An AHP remains a better way to create such an unbiased atmosphere despite the admittance of Saaty (2001) that the end decision taken might not be the right one and the dependence of the end decision on the judgement of the project team-decision-maker.
CONCLUSION This conceptual paper set out to make a case for the adoption of a systematic mode of decision-making within infrastructure projects in developing countries. It relies on a synthesis of literature initially to prove the significance of effective stakeholder management and transparent and structured decision making process in the attainment of project success. The failure of many infrastructure projects in developing countries was attributed to several causes chief among which was the non-participatory means of decision making at various stages of the project delivery lifecycle. A more structured approach to participatory decision making was advocated with special emphasis on the AHP. To buttress the impact of unstructured, spontaneous and unilateral decision making approaches adopted by planners in developing countries, this article adopts a single case method to highlight the approach utilized in a particular infrastructure project labelled project X. Project X is a gas pipeline project situated in Nigeria’s Niger Delta region. It was discovered that the approaches adopted by the project planners/team was not perceived as allowing for the influence of citizen power in the decision making process by the host communities especially with regards to the expectations on compensation and local engagement. This scenario, which is similar to most projects of similar magnitude within the comity of developing countries, possesses the capability of generating hostility to the project from its host environment and thus undermines the ability to achieve its objectives and goals. Arising from these findings, this article highlights the significance of a structured approach to participatory decision making within infrastructure projects. This is premised upon the belief that such a structured approach such as the AHP would enhance the chances of achieving project success especially in developing countries. It recommends that the future studies attempt applying the AHP to specific projects through means such as longitudinal case studies to establish its ability to resolve the imbroglio associated with participatory decision-making in such countries.
REFERENCES 1. Aibinu, A. A., & Jagboro, G. O. (2002). The Effects of Construction Delays on Project Delivery in Nigerian Construction Industry. International Journal of
Project Management, 20, 7. 2. Arnstein, S. R. (1969). A ladder of citizen participation. Journal of the American Institute of planners, 35(4), 216-224. 3. Baccarini, D. (1996). The concept of Project Complexity-a review. International Journal of Project Management, 14(4), 4. 4. Beierle, T. C. (2002). The quality of stakeholder-based decisions. Risk Analysis, 22(4), 739-749. 5. Bertelsen, S. (2003). Complexity- Construction in a new perspective. Paper presented at the IGLC-11, Blacksburg. 6. Burton, R. M., Obel, B., & Desanctis, G. (2011). Organizational Design: A Step By Step Approach (Second ed.). Cambridge.: Cambridge University Press. 7. Child, J. (1984). Organization: A Guide to Problems and Practice. London Paul Chapman Publishing Ltd. 8. Clarkson, M. E. (1995). A stakeholder framework for analyzing and evaluating corporate social performance. Academy of Management Review, 20(1), 92-
117. 9. Cleland, D. I. (1998). Field guide to project management: Wiley Online Library. 10. Daft, R. L. (2009). Organization Theory and Design (Tenth ed.). Mason, U.S.A: Cengage Learning. 11. Dessy, S. (2007). Client power, citizen participation, institutions and services delivery: Theory and Evidence with special emphasis on Africa. AERC Project
on Institutions and Service Delivery. http://aercafrica. org/documents/isd_workingpapers/DessyS_ClientPowerCitizenParticipationISD. pdf. 12. Edelenbos, J., & Klijn, E. H. (2006). Managing stakeholder involvement in decision making: A comparative analysis of six interactive processes in the
Netherlands. Journal of public administration research and theory, 16(3), 417-446. 13. Eilon, S. (1969). What is a Decision? Management Science, 172-189. 14. Eisenhardt, K. M., & Zbaracki, M. J. (1992). Strategic decision making. Strategic Management Journal, 13(S2), 17-37. 15. Espejo, R. (1994). What is systemic thinking? System Dynamics Review, 10(2-3), 14. 16. Fewings, P. (2005). Construction project management: Taylor & Francis. 17. Freeman, R. E. (1984). Strategic Management: A Stakeholder Approach. Boston: Pitman. 18. Freeman, R. E. (2004). The stakeholder approach revisited. Zeitschrift für Wirtschafts-und Unternehmensethik, 5(3), 228-241. 19. Freund, Y. P. (1988). Critical success factors. Strategy & Leadership, 16(4), 20-23. 20. Gallagher, K., Rose, E., McClelland, B., Reynolds, J., & Tombs, S. (1997). People in Organizations: An active learning approach London: Blackwell Publishers. 21. Hoverstadt, P. (2008). The Fractal Organization: Creating sustainable organizations with the viable system model. West Sussex , UK John Wiley and Sons
Ltd. 22. Irvin, R. A., & Stansbury, J. (2004). Citizen participation in decision making: is it worth the effort? Public Administration Review, 64(1), 55-65. 23. Jefferies, M., Gameson, R., & Rowlinson, S. (2002). Critical success factors of the BOOT procurement system: reflections from the Stadium Australia case
study. Engineering Construction and Architectural Management, 9(4), 352-361. 24. Karlsen, J. T. (2002). Project Stakeholders Management. Engineering Management Journal, 14(4), 5. 25. Keren, G. (1996). Perspectives of Behavioural Decision Making: Some Critical Notes. Organizational Behavior and Human Decision Processes, 65, 10. 26. Kiker, G. A., Bridges, T. S., Varghese, A., Seager, T. P., & Linkov, I. (2005). Application of multicriteria decision analysis in environmental decision making.
Integrated Environmental Assessment and Management, 1(2), 95-108. 27. King, C. S., Feltey, K. M., & Susel, B. O. N. (1998). The question of participation: Toward authentic public participation in public administration. Public
Administration Review, 317-326. 28. Klakegg, O. J., & Haavaldsen, T. (2011). Governance of major public investment projects: in pursuit of relevance and sustainability. International Journal of
Managing Projects in Business, 4(1), 157-167. 29. Klijn, E. H., & Koppenjan, J. (2006). Institutional design. Public management review, 8(1), 141-160. 30. Lahdenpera, P., & Koppinen, T. (2009). Financial analysis of road project delivery systems. Journal of Financial Management of Property and Construction,
14(1), 18. doi: 10.1108/13664380910942644 31. Meredith, J. R., & Mantel, S. J. (2000). Project management: a managerial approach: Wiley. 32. Miles, R. E., Snow, C. C., Meyer, A. D., & Coleman, H. J. (1978). Organizational Strategy, Structure, and Process. Academy of Management Review 3(3), 18. 33. Mitchell, R. K., Agle, B. R., & Wood, D. J. (1997). Toward a theory of stakeholder identification and salience: Defining the principle of who and what really
counts. Academy of Management Review, 853-886.

VOLUME NO. 2 (2012), ISSUE NO. 12 (DECEMBER) ISSN 2231-1009
INTERNATIONAL JOURNAL OF RESEARCH IN COMPUTER APPLICATION & MANAGEMENT A Monthly Double-Blind Peer Reviewed (Refereed/Juried) Open Access International e-Journal - Included in the International Serial Directories
http://ijrcm.org.in/
23
34. Mustajoki, J., Hämäläinen, R. P., & Marttunen, M. (2004). Participatory multicriteria decision analysis with Web-HIPRE: a case of lake regulation policy. Environmental Modelling & Software, 19(6), 537-547.
35. Ogbonna, A. C. (2007). Success Measurement in Construction Projects: Understanding the Quantitative Criteria used by Stakeholders in Nigeria. Advances in Science and Technology, 1(2/3), 9.
36. Olander, S. (2007). Stakeholder impact analysis in construction project management. Construction Management and Economics, 25(3), 277-287. 37. Packendorff, J. (1995). Inquiring into the temporary organization: New directions for Project Management Research Scandinavian Journal of Management,
11(4), 15. 38. Palcic, I., & Lalic, B. (2009). Analytical hierarchy process as a tool for selecting and evaluating projects. Int. J. Simulat. Model, 8(1), 16-26. 39. PMI. (2008). A Guide to the Project Management Body of Knowledge (4th ed.): Project Management Institute. 40. Rowlinson, S. (1999). Selection Criteria. In S. Rowlinson & P. McDermott (Eds.), Procurement Systems: A Guide to Best Practice. London: E and F.N Spon. 41. Saaty, T. L. (1994). How to make a decision: the analytic hierarchy process. Interfaces, 24(6), 19-43. 42. Saaty, T. L. (2001). Decision Making for Leaders: The Analytic Hierarchy Process for Decisions in a Complex World. Pittsburgh, US..A: RWS Publications. 43. Saaty, T. L., & Vargas, L. G. (2001). Models, methods, concepts & applications of the analytic hierarchy process (Vol. 34): Springer. 44. Shirazi, B., Langford, D. A., & Rowlinson, S. M. (1996). Organizational structures in the construction industry. Construction Management and Economics, 14,
14. 45. Stinchcombe, A. L. (1965). Social Structure and Organizations. In J. G. March (Ed.), Handbook of Organizations (pp. 142-193). Chicago, Illinois: Rand McNally
and Company. 46. Turner, J. R., & Muller, R. (2003). On the nature of the project as a temporary organization. International Journal of Project Management, 21, 8. 47. Vroom, V. H., & Jago, A. G. (1988). The new leadership: Managing participation in organizations: Prentice-Hall, Inc. 48. Walker, D. H. T., Bourne, L., & Rowlinson, S. M. (2008). Stakeholders and the Supply Chain. In D. H. T. Walker, L. Bourne & S. M. Rowlinson (Eds.),
Procurement systems: A cross-industry project management perspective. Oxford/New York: Taylor and Francis. 49. Yang, J., Shen, Q., & Ho, M. (2009). An overview of previous studies in stakeholder management and its implications for the construction industry. Journal
of facilities management, 7(2), 159-175. 50. Yin, R. K. (1994). Case study research: Design and methods (Second ed.). Thousand Oaks, Ca: Sage Publications. 51. Yosie, T. F., & Herbst, T. D. (1998). Using Stakeholder Processes in Environmental Decision making. Ruder Finn and ICF Incorporated. September,
Washington. DC.

VOLUME NO. 2 (2012), ISSUE NO. 12 (DECEMBER) ISSN 2231-1009
INTERNATIONAL JOURNAL OF RESEARCH IN COMPUTER APPLICATION & MANAGEMENT A Monthly Double-Blind Peer Reviewed (Refereed/Juried) Open Access International e-Journal - Included in the International Serial Directories
http://ijrcm.org.in/
24
PRACTICAL IMPLEMENTATION OF THE MODEL FOR ‘ORGANIZING, MEASURING, ANALYZING STUDENTS’ KNOWLEDGE AND PERFORMANCE’
ROY MATHEW
LECTURER
I.T. DEPARTMENT
BURAIMI UNIVERSITY COLLEGE
AL BURAIMI
ABSTRACT
Present work tries to offer a new view on the current, vastly discussed and successfully engaged concept of a Data Warehouse. This view presents it in the light of
Knowledge Management that includes knowledge sharing and knowledge reuse. i.e., a Data Warehouse can serve as a storage medium for keeping the business
memory, or at least involving certain varieties of data. It helps to get new knowledge by presenting well integrated data to analysis tools and then becomes an
important part of Executive Information Systems or Decision Support Systems. Sharing and reuse of relevant knowledge during project could prove significant
benefits. Data Warehouse by storing, managing and sharing data contributes to the growth of knowledge and may show the way to improve the institution’s
quality and success. Data mining can be used for the purpose of discovering new knowledge from large databases. New knowledge may be further managed by
the applications of knowledge sharing and reuse. Data mining as a new technology allows the user to access or process large amount of information generated
mainly from large databases using its latest database technologies. Thus the present work relates Data Warehousing and Data Mining to Knowledge Discovery
and Knowledge Management including knowledge sharing and knowledge reuse. The intention is to apply this problem to the higher education sector and
compare their results to diagnose pros and cons.
KEYWORDS Achievement Measure, Course Objectives, Performance Analysis, Students’ Assignments.
1. INTRODUCTION he suitability in systems of education requires detailed reports about students’ performance to take appropriate actions. A well developed set of information regarding students’ knowledge and their performances, helps to make a diagnosis with fair accuracy what the student knows and how much a student knows, in order to conclude what a student does not know i.e., a student’s learning gaps. The set of information regarding students’ knowledge
and their performances obtained through an assessment process of their several assignments specify, with reasonable precision, whether the courses selected were appropriate for them or not. And if not, the areas for improvement have to be identified for its remedy, in case students decide to go ahead with their study in that field. This work presents an implementation of a model for organizing, measuring, analyzing students’ knowledge and performance in systems of education with the support of Data Mining tools. The continuous learning assessment process of different assignments in a course allows to have a better understanding of the students’ knowledge in a particular course (current student knowledge), in order to guide the instruction in that area of the course. The phrase “current student knowledge” means that what someone knows is always changing. The knowledge representation in a knowledge domain allows ontology knowledge units with many objectives and its measurements in a hierarchical way, through interconnections between the objectives and its measurements. The word ontology means a specialized type of knowledge that consists of definitions or descriptions of special kinds of things and it is frequently mystified with knowledge base. This corresponds roughly to Gruber’s definition, which is: “a specification of a conceptualization: the objects and relations that exist for an agent” [13] [14]. The following figure shows an architecture of the Knowledge Unit with the hierarchical organization of the objectives and its various related assignments for a course. A course may have many objectives (n number of objectives: O1, O2, O3… On) and it could be measured using several assignments (A1, A2, A3… An).
FIGURE 1: KNOWLEDGE UNIT
According Self J. [31], a detailed student model preferably contains information about previous student knowledge prior to the application of educational system, like the student’s interests, objectives, preferences, progress and all other information related to student. In addition to the Knowledge Unit of the knowledge organization, other important points are the Objective Units and Marks Units, i.e., the units to organize the way students’ performances will be updated. Brusilovsky [6] considered Student Knowledge Model as a part of the main model which symbolizes a manifestation of the student’s mental state and level of knowledge and abilities in terms of a particular course and its output. The Assessments Unit could be configured with measurements from various assignments of the course. The process of acquiring knowledge from various such Assignments is done by its accumulation and dynamic updation in the Objectives Unit and Marks Unit. After organizing the Knowledge Domain, Assignments can be created in order to refer objective items from the Knowledge Unit. The Assignment grading will show the measurement for each objective item in detail, and its accumulation in the Objectives Unit and Marks Units, making it possible to show the students’ main learning gaps, i.e., it identifies in which course objective, the student displays better or worse performance.
T

VOLUME NO. 2 (2012), ISSUE NO. 12 (DECEMBER) ISSN 2231-1009
INTERNATIONAL JOURNAL OF RESEARCH IN COMPUTER APPLICATION & MANAGEMENT A Monthly Double-Blind Peer Reviewed (Refereed/Juried) Open Access International e-Journal - Included in the International Serial Directories
http://ijrcm.org.in/
25
2. DATA MINING IN HIGHER EDUCATION SECTOR Data mining can be used for the purpose of discovering new knowledge from databases. Data mining as a new technology allows the user to access or process large amount of information extracted mainly from large databases using its latest database technologies. The process of data mining uses its techniques to create automatic tools to investigate and then to generate new information from large databases. The generated new knowledge is then offered with the help of certain rules using different variables and then presented as a model. Data mining is used to predict new data, based on a set of rules or models extracted from databases. Data mining uses its techniques and powerful tools to describe database in a summarized way by capturing its important properties. Due to their multidisciplinary application, a multitude of data mining techniques have been studied, applied and proposed in a variety of different fields and visual data mining can be considered a data mining process enriched by visualization methods [29] [10]. Some works that apply Data Mining techniques in education concentrate on the data gathered during student interaction with communication tools: chat, forum and e-mail [31]. Data mining is applied on students ‘performance-data’ obtained from several of his Assignments (for example, Test 1 [A1], Test 2 [A2], Take-home-assignment [A3] and Final Examination [A4]). The main idea is to prepare the data collected from all of his assignments related with different objectives of a course and relate them by using their hierarchical organization of study, in order to discover new knowledge about students learning by using data mining tools. Assessments Unit of the Relational Model presents data from the database that contains Assignment data showing students’ performance in various assignments stored in relational database model. Students’ knowledge is measured based on the different objectives of the course using different assignments and the findings are recorded using a relational database.
FIGURE 2: TABLE OF RELATIONAL ASSESSMENT UNIT
This data from the relational model is then summarized to get another data for a multidimensional model of Objectives Unit, as shown in the table below. It shows students’ summarized performance in different objectives that were measured previously using various assignments.
FIGURE 3: TABLE OF MULTIDIMENSIONAL OBJECTIVE UNIT
Each objective (O1 for example) can be measured in several Assignments. The Knowledge Acquisition Level indicates the student knowledge level in a specific objective item of the knowledge domain and it could be computed using appropriate formula. For example, the knowledge acquisition level for the objective O1 can be calculated from three assignments (A1, A3, and A4) as 10 + 2 + 12 = 24 getting by adding all separate marks obtained in all different assignments testing that particular objective of the course. Another way of calculation is computing the arithmetic average of the percentages of marks obtained in various assignments of the course testing that objective. In the multidimensional table of the Objectives Unit, the knowledge acquisition level for each objective (O1, O2,…,On) is displayed. This data corresponds to the objective evaluated (each respective line of the table in relational model) and the measures correspond to respective knowledge acquisition level for the objectives. (The objectives are all specified clearly and distributed to the students normally at the beginning of the course’s training along with the syllabus for that course.) Marks obtained in various assignments during the continuous evaluation process are summarized in Marks Unit as shown in the given table below. This is same as the summation of marks obtained in all the objectives for that course. (For example O1+O2+O3+O4=24+23+21+22=90) The student with ID: 1001 scored 90 marks and the grade ‘A-‘ is awarded to that student according to the assessment criteria for the marks. (Assessment criteria are also specified in the syllabus of the course.)

VOLUME NO. 2 (2012), ISSUE NO. 12 (DECEMBER) ISSN 2231-1009
INTERNATIONAL JOURNAL OF RESEARCH IN COMPUTER APPLICATION & MANAGEMENT A Monthly Double-Blind Peer Reviewed (Refereed/Juried) Open Access International e-Journal - Included in the International Serial Directories
http://ijrcm.org.in/
26
FIGURE 4: TABLE OF MULTIDIMENSIONAL MARKS UNIT
Apply visual data mining tools along with other data mining techniques like clusterization, segmentation, classification and association on the data for knowledge discovery. Historical data must be kept and utilized for new knowledge discovery for a continuous assessment learning model. The conclusion based on historical data helps the teachers to see what qualities and problems their students face and who their students are. An improvement in education is possible by the implementation of a program of such data and analysis. A model for organizing, measuring, analyzing students’ knowledge and performance with the help of data mining is discussed next.
3. A MODEL FOR ORGANIZING, MEASURING, ANALYZING STUDENTS’ KNOWLEDGE AND PERFORMANCE It is very important to find out continuously what the student knows by measuring their performance and knowledge. Keep this information in a database for its investigation, so that the new knowledge can be used for improvement of teaching by instructors as well as for improved understanding and study by students. This work proposes a model for knowledge organization, measurement and analysis based on ontology knowledge domain, and with the help of data mining techniques; the model makes discovery of new information from the data collected with the several assignments. This model is based on knowledge organization representing the learning hierarchies, uses ontology knowledge domain with different objectives and its measurements using several assignments. Each problem or question in an Assignment must be associated with an objective of the course and the objective must be clearly indicated for each question specifying very clearly which objective is tested with that question. It is possible to establish a knowledge measure for each ontology objective item specified in the model. The establishment of knowledge measure in each objective item will allow the selection of more adjusted evaluations to the students’ knowledge acquisition levels and it might trigger an adjusted guidance in accordance with the student learning gaps due to students’ learning necessities. Based on knowledge organization using Knowledge Unit and the current student knowledge calculated in the Objectives Unit and Marks Unit, the proposal is to apply data mining techniques for new knowledge discovery concerned with students’ knowledge to get new information regarding them. The use of visual tools will help in the new knowledge reading and its interpretation. Successful knowledge management (including knowledge sharing and reuse) needs to integrate data bases, information systems, and knowledge based systems. These kinds of systems can be connected based on the Data Ware-house of the architecture shown in the figure below. It provides an extensive basis of integrated data. This data can be presented and utilized via proper knowledge management; knowledge sharing and knowledge reuse activities with the help of data discovery or related tools. Knowledge-based support for decision-making is becoming a key element of a Higher Educational setting. Traditional data warehouses with the combinations of knowledge management environments and its related tools may influence Higher Educational decision-makers. The knowledge oriented model together with a collection of services, can be used to manage and encourage knowledge activities within the Higher education sector, through the data mining and data warehousing techniques.
FIGURE 5: MODEL ARCHITECTURE FOR ORGANIZING, MEASURING, ANALYZING STUDENTS’ KNOWLEDGE AND PERFORMANCE

VOLUME NO. 2 (2012), ISSUE NO. 12 (DECEMBER) ISSN 2231-1009
INTERNATIONAL JOURNAL OF RESEARCH IN COMPUTER APPLICATION & MANAGEMENT A Monthly Double-Blind Peer Reviewed (Refereed/Juried) Open Access International e-Journal - Included in the International Serial Directories
http://ijrcm.org.in/
27
The continuous learning assessment process aims to find out the learning gaps to improve the training, can create a huge amount of data. The collected data need to be recorded and analyzed so as to provide new and necessary information concerning the current student knowledge level and measure how much they know about the course and evaluate it to take decisions to improve the situation. The model for organizing, measuring, analyzing students’ knowledge and performance in systems of education with the help of Data Mining tools generates new information from the collected assessment data automatically. The model is based on knowledge organization using ontology of course objectives that represents the learning hierarchies and it makes possible to establish the knowledge acquisition level in each objective item of the knowledge domain. The model helps to organize, measure, analyze students’ knowledge and performance and thus used to improve both students’ as well as teachers’ performances.
FIGURE 6: VISUAL DATA MINING
The model for organizing, measuring, analyzing students’ knowledge and performance must be tested with some data mining techniques on the real data and implement the model after its validation.
4. PRACTICAL IMPLEMENTATION OF THE MODEL: EXPLAINED The course instructor must have a syllabus to follow the teaching of the course or any particular subject. The syllabus of the course may contain many items like, course description, course objectives or outcomes, course plan, course assessment, grading criteria, etc. Students are expected to achieve all the course objectives on successful completion of that course. A short description about the course should also definitely be specified as a part the syllabus. The table below shows Course Description and Course Objectives that specified as a part of the syllabus.
FIGURE 7: PART OF THE COURSE SYLLABUS - I The table below shows Course Assessment Methods, Assessment Weightings and Assessment Criteria that specified as a part of the syllabus:
FIGURE 8: PART OF THE COURSE SYLLABUS - II

VOLUME NO. 2 (2012), ISSUE NO. 12 (DECEMBER) ISSN 2231-1009
INTERNATIONAL JOURNAL OF RESEARCH IN COMPUTER APPLICATION & MANAGEMENT A Monthly Double-Blind Peer Reviewed (Refereed/Juried) Open Access International e-Journal - Included in the International Serial Directories
http://ijrcm.org.in/
28
On successful completion of the course, students are expected to achieve all the course objectives. So it is the duty of the course instructor to make sure that all the course objectives are achieved by each student to get the course successfully completed. So when the course instructor designs various assignments, care must be taken to assess the objectives specified in the course syllabus. The front cover page of a typical assignment at least should contain the following data as shown in the table below, along with the course details like course code, course name, section number, instructor code or instructor name, day, date, time and duration, etc.
FIGURE 9: PART OF THE ASSIGNMENT’S FRONT COVERING SHEET
Each question specified inside the assignment must be clearly stated and should also be indicated with the objective or objective number that is being tested or assessed for that question. The table below gives that idea and the questions specified in it clearly indicate which objectives are being assessed for it. It is also advisable to specify the objectives being tested, at the beginning of the assignment to give a clear picture to all candidates about the purpose of the assignment. These objectives are already specified in the syllabus and discussed much before the class begins for the course.
FIGURE 10: PART OF THE ASSIGNMENT’S QUESTIONS: A TEMPLATE
There can be many assignments to assess various objectives of a course. It is not always necessary that each assignment measure all the objectives of a course. The following example given in the figure below assesses only the objectives O1 and O2 for the course during its first assessment called Test1 (T1). The section (class) of the course consists of 19 students. The section average is shown on the right hand side of the graphical representation of the distribution of Grades (G) achieved by the students for this assessment of Test1. (Note that the range of marks for different grades is specified as per the assessment criteria mentioned already in the syllabus earlier.) Data Mining is done on the marks achieved by the students in the section of the course. 4 clusters are identified as Fail, Low, Mid and High grades of marks obtained and the number of students in each cluster is measured with its percentage for that section. The section average for the objectives being tested also measured and indicated.

VOLUME NO. 2 (2012), ISSUE NO. 12 (DECEMBER) ISSN 2231-1009
INTERNATIONAL JOURNAL OF RESEARCH IN COMPUTER APPLICATION & MANAGEMENT A Monthly Double-Blind Peer Reviewed (Refereed/Juried) Open Access International e-Journal - Included in the International Serial Directories
http://ijrcm.org.in/
29
FIGURE 11: ASSESSMENT FOR ASSIGNMENT NO.1 (TEST1 T1) RECORDED FOR ONE SECTION OF A CLASS
The same procedure is repeated to record all measured data for all the sections of different courses taught by the same instructor for that assignment of Test1. Repeat these whole procedures of assessments again in a similar way for all assignments like Test2 (T2), Take-home-Assignment (A), and Final Examination (T3). (Data mining can be further done after accumulating all such data for different assignments of different sections taught by the same instructor.) The figure below shows the data (marks) accumulated from all different assignments (Test1 T1, Test2 T2, Take-home-Assignment A and Test3 T3) in the same section of students for the same course. It also shows the accumulated data for different objectives measured through all different assignments in the section of students for that course.
FIGURE 12: ASSESSMENT FOR VARIOUS ASSIGNMENTS (TEST1 T1, TEST2 T2, HOME-ASSIGNMENT A, TEST3 T3) RECORDED FOR ONE SECTION OF A CLASS

VOLUME NO. 2 (2012), ISSUE NO. 12 (DECEMBER) ISSN 2231-1009
INTERNATIONAL JOURNAL OF RESEARCH IN COMPUTER APPLICATION & MANAGEMENT A Monthly Double-Blind Peer Reviewed (Refereed/Juried) Open Access International e-Journal - Included in the International Serial Directories
http://ijrcm.org.in/
30
Data mining is done to those data and it is also shown separately in the figure below. Graphical representation for the distribution of grades obtained for the whole course as well for the objectives achieved through all assignments are also shown below. Section averages for Test3 and for the accumulated data from all the assignments are calculated. Section averages for the objectives accumulated through all assignments are represented by both quantitatively and graphically.
FIGURE 13: NEW INFORMATION: QUANTITATIVE AD GRAPHICAL DISPLAY
Data mining is further done after collecting all data for different assignments from all different sections taught by the same instructor. Accumulated Students’ performances for all the sections taught by the same instructor during various assessments like Test1, Test2 and Final Examination are represented by both quantitatively and graphically in the figure given below.
FIGURE 14: SUMMARY OF ASSESSMENTS FOR VARIOUS ASSIGNMENTS IN DIFFERENT SECTIONS OF CLASSES TAUGHT BY AN INSTRUCTOR

VOLUME NO. 2 (2012), ISSUE NO. 12 (DECEMBER) ISSN 2231-1009
INTERNATIONAL JOURNAL OF RESEARCH IN COMPUTER APPLICATION & MANAGEMENT A Monthly Double-Blind Peer Reviewed (Refereed/Juried) Open Access International e-Journal - Included in the International Serial Directories
http://ijrcm.org.in/
31
The data for 4 clusters Fail, Low, Mid and High grades of accumulated marks from all the sections taught by the same instructor form different assessments (Test1, Test2 and Final examination) are shown in the given figure below. Graphical representations of that data and its percentages are also shown.
FIGURE 15: NEW INFORMATION: QUANTITATIVE AD GRAPHICAL DISPLAY AFTER CLUSTERIZATION
The same assessment process can be repeated in a similar way for all the instructors teaching different sections of different courses from the same department. The table below shows the performance of all the instructors in the same department while assessing different assignments.

VOLUME NO. 2 (2012), ISSUE NO. 12 (DECEMBER) ISSN 2231-1009
INTERNATIONAL JOURNAL OF RESEARCH IN COMPUTER APPLICATION & MANAGEMENT A Monthly Double-Blind Peer Reviewed (Refereed/Juried) Open Access International e-Journal - Included in the International Serial Directories
http://ijrcm.org.in/
32
FIGURE 36: SUMMARY OF ASSESSMENTS FOR VARIOUS ASSIGNMENTS TAUGHT BY DIFFERENT INSTRUCTORS IN A DEPARTMENT
The performance of one instructor can thus be used to compare with another instructor in the same department or even with another department because of the percentage representation of data. Hence the performance of the whole department is measured and analyzed using this model. Thus the model can be used and applied for the improvement of the department and for the higher education institution. But the main beneficiaries of this model are the students themselves.
5. CONCLUSION Measurement of Students’ achievements in each objective of the course is displayed. The achievements are measured for all the sections of various courses. A prediction or projection of performance in other assignments for the same section of class could also follow the same pattern as displayed in the current assignment. Therefore care and intense training could be given separately to those who are week to improve their performance.

VOLUME NO. 2 (2012), ISSUE NO. 12 (DECEMBER) ISSN 2231-1009
INTERNATIONAL JOURNAL OF RESEARCH IN COMPUTER APPLICATION & MANAGEMENT A Monthly Double-Blind Peer Reviewed (Refereed/Juried) Open Access International e-Journal - Included in the International Serial Directories
http://ijrcm.org.in/
33
Performance of one student in one section can be compared with other students in the same or even with other sections. Comparison of achievements can also be done with all assignments of different students in the same section as well as with others in another section because of the percentage representation of data. It helps to study the projected trend for future assignments for the same group of students in a section. Performance of teachers teaching the same course can be compared. Even those who are teaching different sections with different number of students as well as with sections of different courses can also be compared using this model because of its percentage analysis. Performance of various instructors in a department and hence the performance of the whole department itself can be measured and analyzed in an organized way using this model. Student knowledge is measured and performance is analyzed after organizing the course with different objectives that are assessed using different assignments for the course. Teachers’ performance in a department is also reflected while using this model and hence the performance of the whole department itself is very much evident in this model. So based on the new information received using this model, future action plan and other appropriate decisions can be taken for improvement of the higher education institution.
REFERENCES [1] Benjamins V. R., Fensel, D., Pérez, A. G., Knowledge Management through Ontologies”, Proc. of the 2nd International Conference on Practical Aspects of
Knowledge Management (PAKM98), Switzerland, 1998. [2] Berners-Lee T. R., Cailliau, A. Loutonen, H. F. Nielsen, and A. Secret, “The World- Wide Web,” Communications of the ACM, vol. 37, pp. 76—82, 1994. [3] Black P. and D. William, Assessment and classroom learning. Assessment in Education: principles, policy & practice, 5(1):7–71, March 1998. Academic
Research Library. [4] Borges L.M.S., Falbo, R.A., “Managing Software Process Knowledge”, Proc. of the CSITeA’2002, June 2002. [5] Broadfoot P. R., Daugherty, J. Gardner, C. Gipps,W. Harlen, M. James, and G. Stobart. Assessment for learning: Beyond the black box. Technical report,
University of Cambridge, School of Education, 1999. Assessment Reform Group -ARG. [6] Brusilovsky P. The construction and application of student models in intelligent tutoring systems. Journal of computer and systems sciences international,,
32(1):70–89, 1994. [7] Council N. R. Knowing what students know: The science and design of educational assessment. National Academy Press, Washington, D.C., 2001. [8] Cross R., Parker, A., Prusak, L., & Borgatti, S. P. (2001). Knowing What We Know: Supporting Knowledge Creation and Sharing in Social Networks.
Organizational Dynamics, 30(2), 100-120. [9] Davenport T. H., & Prusak, L. (2000). Working Knowledge: How Organizations Manage What They Know. Harvard Business School Press. Boston,
Massachusets. [10] Fayyad U., G. G. Grinstein, and A. Wierse. Information Visualization In Data Mining And Knowledge Discovery. Morgan Kaufmann Publishers Inc, SAN
FRANCISCO, CA, USA, 2002. [11] Firestone J.M., “DKMS Brief No. Nine: Enterprise Integration, Data Federation, and DKMS: A Commentary,” Executive Information Systems, 1999. [12] Gagne R. M., The Conditions of Learning. Holt, Rinehart and Winston, New York, 4th edition, 1985. [13] Gruber T. R., Toward principles for the design of ontologies used for knowledge sharing. In Formal Ontology in Conceptual Analysis and Knowledge
Representation. Kluwer Academic Publishers., Netherlands, 1993. [14] Guarino N., Some organizing principles for a unified toplevel ontology. In Proceedings of AAAI Spring Symposium on Ontological Engineering, Stanford, CA,
1997. AAAI Press. [15] Hansen M. T. (2002), Knowledge Networks: Explaining Effective Knowledge Sharing in Multiunit Companies. Organization Science, 13(3), 232-248. [16] Harsh O. K, Three Dimensional Explicit Knowledge Management and Reuse. Presented in International Conference on Knowledge Management in
Organization held in Lecee, Italy, Sept 10-11, 2007. [17] Harsh O. K. and Sadiq Sohail, M An Experiment on Course Design, Delivery and Effective Interaction in Distance Technical Education. Malaysian Journal of
Distance Education. Vol. 5, No. 1 ISSN 1511-6433 June 2003. [18] Harsh O. K. and Sadiq Sohail, M. "Role of delivery, course design and teacher-student interaction: Experiment on adult distance-education" O. International
Review of Research in Open and Distance Learning", Canada Published. Available at: http://www.irrodl.org/content/v3.2/harsh.html [19] Henninger S. "Tools supporting the creation and evolution of software development knowledge," ase, p. 46, 12th IEEE International Conference on
Automated Software Engineering (ASE'97) (formerly: KBSE), 1997. [20] Huemer, L., von Krogh, G., & Roos, J. (1998). Knowledge and the Concept of Trust. In G. von Krogh, J. Roos, & D. Klein (eds), Knowing In Firms:
Understanding, Managing and Measuring Knowledge. London, UK: Sage, 123-145. [21] Ichijo, K., von Krogh, G., & Nonaka, I. (1998). Knowledge Enablers. In G. von Krogh, J. Roos, & D. Klein (eds), Knowing In Firms: Understanding, Managing
and Measuring Knowledge. London, UK: Sage, 173-203. [22] Johnson J. H. Data-driven school improvement. Technical Report 109, The Education Resources Information Center (ERIC), USA, 1997. ERIC Clearinghouse
on Educational Management Eugene. [23] Kerschberg L. and D. Weishar, “Conceptual Models and Architectures for Advanced Information Systems,” Applied Intelligence, vol. 13, pp. 149-164, 2000. [24] Markkula, M., “Knowledge Management in Software Engineering Projects”, In: Proc. of the 11th International Conference on Software Engineering and
Knowledge Engineering, Kaiserslautern, Germany, June, 1999. [25] Martensson, M. (2000). A critical review of knowledge management as a management tool. Journal of Knowledge Management, 4(3), 204-212. [26] Nonaka, I, & Takeuchi, H. (1995). The Knowledge-Creating Company: How Japanese Companies Create the Dynamics for Innovation. Oxford University
Press, New York, NY. [27] O’Leary D.E., Studer, R., “Knowledge Management: An Interdisciplinary Approach”, IEEE Intelligent Systems, January/February, Vol. 16, No. 1, 2001. [28] Pimentel E. and Omar N. Towards a model for organizing and measuring knowledge upgrade in education with data mining, pages 56–60, Published by IEEE
15-17 Aug. 2005. [29] Pimentel E., Omar N. and V. Franca. Monitoring the knowledge acquisition level in distance learning education. In Methods and Technologies for Learning,
pages 173–179, March 2005,Palermo, Italy. [30] Rud O. P. Data Mining Cookbook: Modeling Data for Marketing, Risk and Customer Relationship Management. Willey Computer Publishing, New York,
2001. [31] Self J. Formal approaches to student modelling. In Student Modelling: The Key to Individualized Knowledge-Based Instruction, pages 295–352. Springer-
Verlag, Berlin, 1994. [32] Silva D. R. and M. T. P. Vieira. Using data warehouse and data mining resources for ongoing assessment in distance learning. In The Second IEEE
International Conference on Advanced Learning Technologies, Kazan, Russia, September 2002. [33] Small CT, J Tatalias - The Edge: The MITRE Advanced Technology Newsletter, 2000-mitre.org, “Application of Domain Analysis to Knowledge Reuse”, Eighth
Annual Workshop on Institutionalizing Software Reuse (WISR), held at the Ohio State University, March 23-26, 1997. [34] Steyn GM. (2002). Creating Knowledge Through Management Education: A Case Study of Human Resources Management. Education, 123(3), 514-531. [35] Todd R. J. (1999). Knowledge Management: Utilizing the knowledge capital of a learning community. Access, 13(3), 11-14. [36] VanLehn K., Student modeling. In Foundations of Intelligent Tutoring Systems, pages 55–78. Lawrence Erlbaum Associates, New Jersey, 1988. [37] Woods P. J. and J. R. Warren. Rapid prototyping of an intelligent tutorial system. In Annual Conference Australian Society for Computers in Learning In
Tertiary Education, Melbourne, 1995. [38] Wu M. C., A.P. Buchmann: Research Issues in Data Warehousing: Proceedings of the BTW 1996.

VOLUME NO. 2 (2012), ISSUE NO. 12 (DECEMBER) ISSN 2231-1009
INTERNATIONAL JOURNAL OF RESEARCH IN COMPUTER APPLICATION & MANAGEMENT A Monthly Double-Blind Peer Reviewed (Refereed/Juried) Open Access International e-Journal - Included in the International Serial Directories
http://ijrcm.org.in/
34
DETERMINANTS OF SMALLHOLDERS’ PARTICIPATION IN LOCAL BASED SEED PRODUCTION SYSTEM: THE CASE OF ONION SEED IN EAST SHOA ZONE OF THE OROMIYA NATIONAL REGIONAL STATE, ETHIOPIA
FREAW DEMISE
LECTURER
DEPARTMENT OF AGRICULTURAL BUSINESS MANAGEMENT, MARKETING & TRADE
ASSELA SCHOOL OF AGRICULTURE
ADAMA SCIENCE AND TECHNOLOGY UNIVERSITY
ETHIOPIA
DAWIT ALEMU
HEAD
SOCIO-ECONOMICS DEPARTMENT
ETHIOPIAN INSTITUTE OF AGRICULTURAL RESEARCH
ETHIOPIA
ABSTRACT
Lack of access to improved seed is one of factor for low adoption and thus low crop productivity of farmer in Ethiopia. In order to solve farmer access to improved
varieties of vegetable seed, Ethiopian Institute of Agricultural Research involved in facilitating a relatively easily accessible source by improving farmer seed
systems through which improved varieties of vegetable seed produced locally by farmer. However, seed supply from this seed system is still low to meet the
demand of farmer the region. This study aim to examine determinates of small-scale vegetable producing farm households’ decision to participate in improved
onion seed production in East Shoa Zone of the Oromia regional state, Ethiopia. The article makes use of data obtained from a random cross-section sample of 80
small-scale farmers and apply Heckman econometric model to analyze the data. This model helps us to incorporate possible sample self-selection bias and to
separate the decision made by farmer. Results of the study show that, experience in cultivation of improved onion varieties, access to credit, land and livestock
holding play a significant role in determining household decision to participate. Once household decide to participate, an increase in the land allocation to onion
seed took place when the area under irrigation increased, when the household had access to training, when an incentive from market through price increased
and increase in family size. An increase in age of household head decrease both the likelihood of participation and land allocated to onion seed production.
Improving marketing outlet for seed and vegetable, access to credit and training is important to promote seed production by small scale farmer.
KEYWORDS local based seed production; Hickman model; improved onion seed varieties.
1. INTRODUCTION 1.1. BACKGROUND OF THE STUDY
ncreasing agricultural productivity perhaps remains the most important determinant of economic growth and poverty reduction, and hence, provides a key to millennium development goal (Solomon et al., 2010). This is especially important in Sub-Saharan countries of Africa, where agriculture underpins the livelihood of the majority of poor but agricultural productivity has continued to decline over the last decades and poverty levels have increased
(Olwande et al., 2009). Thus, the path out of poverty trap in these counters depends on the growth and development of the agriculture sector. Achieving agricultural growth and development will not be possible without yield enhancing technical options because it is no longer possible to meet the needs of increasing numbers of people by expanding areas under cultivation (Shiferaw et al., 2008). Fertilizer and improved seed are generally most important yield enhancing technologies. Of all technologies, improved seed is critical basic input in agriculture (Monyo et al., 2003). Failure to use appropriate seed, while investing sufficiently on other inputs and management practices, usually yields against expectations. Since the physical and genetic quality of seed can affect production, positively or negatively, for many seasons into the future (Tripp, 2003). Therefore, as a powerful agent of change, improving the genetic and physical properties of seed can be a means of overcoming production constraints, thereby making a difference in the lives of the poor (Pichop, 2007). Availability of quality seed of improved varieties at required amount and affordable prices to farmer is important to accelerate the adoption of these varieties. Hence, the programs that multiply and market improved seed need to ensures that quality, availability, and affordability to smallholder (Jones, 2007). Empirical evidence also indicate that enhancing access to improved varieties of seed to farmer is an integral factor for stimulating technology uptake and increasing agriculture productivity in smallholder agriculture (Asfaw et al., 2010). Nevertheless, smallholders striving to benefit from this improvement in technology and to respond to increasing demand for food are often frustrated by lack of access to quality seed of preferred types and varieties. According to Tripp, (2003) weak seed supply system in many Sub-Saharan countries of Africa has been identified as limiting factors for widespread adoption of improved varieties. In smallholder agriculture, the seed supply system comprised of two sources. The primary seed source is what farmers save from previous harvests and others, usually local varieties. It comprises all forms of seed production, exchange, storage and savings through which farmers produce, disseminate and access seed (Cooper & Cromwell, 1994). The advantage of informal seed sources are that seed quality is known, the seed is readily available and it is cheap (Tripp, 1994). Another component of the seed system is the modern component (formal seed system), associated with the provision of improved varieties. Even though informal seed systems prove very valuable to supply large quantities of seed, they appear to have neglected some quality aspects (Lipper et al., 2005) and characterized by costly storage (Lewis & Mulvany, 1997). Modern component of the seed system is also characterized by positive transaction costs to access, indicated by factors like costly supplementary inputs, costly experimentation, seasonal liquidity and family labour constraints (Moser & Barrett, 2003). It also confined to only a few crops, or supplies inappropriate varieties. Positive transaction costs in the already existing seed system constitute an imperfect seed system, which leaves room for improvement in terms of provision of a relatively easily accessible source. Recent literature has identified a number of strategies for overcoming the high transaction costs smallholders face to access improved seed (Dawit et al., 2006; Tripp, 2003 and Mintewab, 2005). One example of such strategy is local based seed production, an institutional arrangement that offer farmers’ participation in production and distribution of improved seed for local market. The method is based on the assumption that production of improved varieties by farmer can contribute in alleviation of poverty in many way; One, by producing improved seed in environment that the crop grow will improve the adaptability of crop to the environment Second; it increase the seed security by improving access to seed, Third; improve the income of the farmer who are involved in production of seed by generating lucrative profit. In the case of Ethiopia, Melkassa Agricultural Research Center (MARC) of the Ethiopian Institute of Agricultural Research (EIAR) has been promoting vegetable seed production in East Shoa. The Institute provides training to farmers in vegetable seed production and organizes them in Farmers Research Group so that they can engage in seed production ((Dawit et al., 2005). The aim was to improve farmer seed systems through which improved varieties of vegetable seed is
I

VOLUME NO. 2 (2012), ISSUE NO. 12 (DECEMBER) ISSN 2231-1009
INTERNATIONAL JOURNAL OF RESEARCH IN COMPUTER APPLICATION & MANAGEMENT A Monthly Double-Blind Peer Reviewed (Refereed/Juried) Open Access International e-Journal - Included in the International Serial Directories
http://ijrcm.org.in/
35
accessible to farmer vicinity. The benefit of local based seed production for country like Ethiopia, under which the dominant part of vegetables are produced from imported seeds is more, by saving foreign currency, reducing seed price, increasing farmer income from increased crop productivity (Dawit et al., 2005). Besides improving, availability vegetable seed, to address the long-term need, to improve food security and livelihood of poor farmers in remote areas of Ethiopia, production of high-value commodities such as vegetable seeds, is also promising strategies to promote economic growth and poverty reduction (Moti, 2007). As use of farmer based seed production approaches grows, there is a need to understand how they affect the smallholder. There has been little empirical verification to date. However, a recent review found mixed evidence of the effectiveness of farmer based seed multiplication in facilitating poor farmers’ access to seed and poverty reduction. As noted by Tripp (1994), the existence of the seed scheme may do little to local community in improving the price of seed supply in their immediate vicinity, because the seed is usually transported out of the area for processing and distributed using the national input distribution network, which may or may not cover the local area. Subsistence agricultural producers also face several barriers that make it difficult for them from participating in seed production. According Tripp (2003), smallholders’ capacity to produce seed efficiently and on a modest scale may be limited by their lack of resources (land, labor, time, and capital). For example, to cultivate one ha of onion seed, it requires 80-90 qt of mother bulb as input (Lemma, 1998) which is expensive. Moreover, the availability of training and extension service which could make an endeavor more likely to succeed, which may also present additional barriers to participate as vegetable seed production is a highly technical and skillful operation. According to FAO (2004), local based vegetable seed enterprises have contributed to increase in production by 20-30% and have generated 2-3 times more income than cereal crops from the same piece of land, other production factors remaining the same. Similar result is also found in India by Sudha et al (2006), where Commercial vegetable Seed Production by farmer increase income of producer and provide employment generation. Seed has also enhanced the family welfare through increased income to the family, helping the farmers to reinvest into agriculture, providing better living and health conditions to the family and attaining better status in the society. Therefore, small and poor farmers in remote areas are motivated to engage in vegetable seed production and marketing. Hence, it is fact that the seed sector appears to hold enormous untapped potential for smallholder seed producers and, in particular, opportunities to alleviate poverty trap through devising strategies that will enable increased entry and sustained profitability from emerging seed markets. Thus, it is imperative to create favorable conditions so that a greater number of farmers can take advantage. One of the most important steps towards this goal is understand factors that determine whether households are participating or not and, how this factor affect level of participation would, help to design policy that aim to motivate and increase the participation of farmer in the seed sector. Nevertheless, so far studies on the determinants of farm household decision to participate in local based vegetable seed production in Ethiopian are limited to support policy makers. Thus, identifying these factors is necessary if there is a need to address and to create a capacity that will enable to realize the advantage of local based vegetable seed production in the country. 1.2. OBJECTIVES OF THE STUDY The general objective of this study is to understand the factors that increase farm household decision to participate in local based onion seed production by small-scale vegetable production systems. Accordingly the specific objectives are: � To identify factors that determine the probability of farmers` decisions in the participation local based onion seed production. � To identify factors that affect the intensity of participation in local based onion seed production by vegetable producing farm household.
2. METHODOLOGY 2.1 STUDY AREA The study was conducted in two districts of East Showa Zone of Oromia Regional State of Ethiopia. East Shoa zone is located in the southern parts of Oromia Region State. East Shoa Zone has an area about 14,050 km2 that is divided into 11 districts and three administrative towns. The estimated population of the zone in 2006 was about 1,357,522 2,475,945 (economically active age group 15-64 was about 52.4%); and the average family size per household was about 5.2 person (CSA, 2006). The two study areas, Adama and Dugda broa districts are located in the eastern and southern parts of Oromia regional state of Ethiopia. Dugda bura is located between 8001’to 8025'N Latitude and 38032'to 390 04'E Longitude, and Adama distract lies between 8014’-8014’N latitude and 3904’-39025’E longitude. The 2008 national census reported a total population for Adama and Dugda bura distract of 155,321 and 144.849, respectively. Their total areas are respectively 1,007.66 and 73657 square kilometers. These zones are among the surplus producing parts of the country and they supply a considerable volume of vegetables to other parts of the country and for the export markets. They have relatively better marketing networks due to their proximity to better roads and irrigation sources 2.2. DATA AND SAMPLING To identify the factors that influence household decisions to participate and the level of participation in local based onion seed production, a multistage stratified random sampling technique were used to select districts, Kebeles and draw farm households. In the first stage, purposive sampling was used to select sample districts from Eastern Shoa Zone. Accordingly, Adama and Dugda Bora were selected as the study site, where onion and onion seed is an important cash crop. These districts represent one of the major vegetable crop growing areas in the country where improved varieties are adopted by farmers. However, smallholder producer in Ethiopia particularly, district face challenge due to low productivity and high price of imported seed. Under the current situation, the dominant part of vegetables is produced from imported seeds, which have low quality and high price. Even if, research results showed that almost all types of vegetable seed can be produced in the country, production and productivity by smallholder constrained lack of access to quality seed (Lemma, 1998). Vegetable seed production depends on location and growing season, and these districts were identified as ideal place for onion seed production in Ethiopia based on experimental result found by MARC. In the second stage, from selected districts, five Kebeles with onion seed production experience is selected. In this process all Kebele administrations with experience in seed multiplication were first identified in consultation with MARC and woreda BoARD in Adama and Dugda Bora. Then, two Kebeles from Adama and three Kebeles from Dugda Bora district were selected for the study using simple random sampling. Sampling of households was carried out considering two sampling frame: participant and non- participant categories giving the relative homogeneity of the sample respondents in terms of their participation status in onion seed production. A farmer who is engaged in onion seed production in 2008/9 production season is considered as participant in seed production. Finally, 40 sample respondents from each stratum were selected randomly with a total sample size of 80 households. Both primary and secondary data sources were used for this study. The primary data were collected from farmers using a semi structured questionnaire. Information on household, farm and institutional characteristics, which are expected to explain farmer decision behavior regarding participation in local based onion seed production, was collected. Secondary information that could supplement the primary data was also collected from published and unpublished documents. 2.3. METHODS OF DATA ANALYSIS 2.3.1 ECONOMETRIC MODEL SPECIFICATION The main aim of the study is to examine factor that increase farm household decision to participate in local based onion seed production. The decision to participate and the extent of participation in improved seed production represent two decisions, although they might simultaneous in time. Accordingly, the decision taken by household on “how much land to allocate in seed production?” follows the decision to produce onion seed (participation) along with respective potential determinant factors. However, land allocated to cultivate onion seed is observed only for a subset of the sample population, the potential exists for the sample selection problem referred to as incidental truncation, i.e., households with seed production observations are likely not to be a random subsample of the population. Statistical analyses based on those non-randomly selected samples can lead to erroneous conclusions and poor policy. For the purpose of identification of the determinant factors Tobit and Heckman’s sample selection model can be employed.

VOLUME NO. 2 (2012), ISSUE NO. 12 (DECEMBER) ISSN 2231-1009
INTERNATIONAL JOURNAL OF RESEARCH IN COMPUTER APPLICATION & MANAGEMENT A Monthly Double-Blind Peer Reviewed (Refereed/Juried) Open Access International e-Journal - Included in the International Serial Directories
http://ijrcm.org.in/
36
The traditional approaches to deal with data that have too many zeros, yielding a censored dependent variable, has been to use the standard Tobit model, originally formulated by Tobin (1958). The model permits incorporation of all observations including those censored at zero, without considering the sources of the zeros. As this ignores the zero observations due to respondents’ non-participation decisions, applying the Tobit model imposes the assumption that all the zeros arise from other factors alone (such as economic and demographic characteristics of the respondents) (Newman et al., 2003) Heckman (1979) proposes a model that addresses the problem associated with the zero observations generated by non-participation decisions, arguing that an estimation on a selected subsample (i.e., censored estimation) results in sample selection bias. The model overcomes this problem by undertaking a two-step estimation procedure (known as heckit). In this estimation, a full sample probit estimation is followed by a censored estimation carried out on the selected subsample. While the first estimates the probability of observing a positive outcome (known as the selection or participation equation), the second estimates the level of participation conditional on observing positive values (known as the conditional equation) (Wooldridge, 2006). The model assumes that different sets of variables could be used in the two-step estimations. As opposed to the Tobit model, Heckman’s (1979) model considers the zero observations to arise mainly from respondents’ self-selection. In other words, this means that all the zeros come from the respondents’ deliberate choices. Hence, in this study, the specifications of the empirical models used to determine the factors influencing households’ decision to enter into local based onion seed production and their level of participation in the seed production conditional upon their entry into the participation follows the selectivity models. In selectivity models, the decision to participate in the local based seed production can be seen as a sequential two-stage decision-making process. In the first stage, the probability of participation was modeled by Maximum Likelihood, from which inverse Mill’s ratio is estimated. In the second-stage, the estimated inverse Mill’s ratio (IMR) is included as right-hand variable in the corresponding intensity of participation model (Maddala, 1983). Specifications for the empirical probit and regression models are discussed next. Standard probit model to assess the household decision to participate or not in local base seed production follows random utility model and its specification is given below following Wooldridge (2006). The Probit model is specified as;
= 1 if >0
= 0 if < 0 Where, Zi* is a latent (unobservable) variable representing households’ discrete decision whether or not to participate in the local based seed production, it is associated with the desired level of participation or utility derived from seed production; Zi : is a discrete response (dependent) variable for status of households’ participation in the local based onion seed production which takes on the value of 1 if the household participates and, 0 otherwise; β is a vector of parameters to be estimated which measure the effects of various explanatory variables on the household’s decision whether to participate or not: Ui random error term with zero mean and constant standard deviation. The sample selection bias, what Heckman (1979) refers to as the inverse of Mill’s ratio, is computed from the parameter estimates of the selection equation for each observation in the selected sample (Greene, 2003), and is represented by:
= (2)
Where, and are the density and distribution functions, respectively. The estimated Inverse Mills Ratio ( ), used as an additional regressor in the second stage, in the model of level of participation in local based seed production using land allocated to seed. The significance of the inverse mills ratio in the level of
participation model is the test for sample selection bias. The null hypothesis is that there is no sample selection bias, i.e. =0. If a simple t-test suggests that is not statistically significantly different from zero, then we can conclude that sample selection bias is not a problem. More precisely level of participation model is specified:
(3)
Where; is the amount land allocated to onion seed production, are the explanatory variables determining the amount land allocated to seed
production; and unknown parameter to be estimated; the error term in the second stage. According to Wooldridge (2006) the first stage of Hickman model must contain at least one explanatory variable that is not included in the second stage of model, which is known as identification restriction; therefore, a variable must be found which affects the decision to participate on seed production activities but does not affect the level participation (land allocated). The purpose of exclusion variables is to reduce the correlation among the regressors in the second-step estimation. Variance inflation factor (VIF) and Contingency Coefficients (CC) were used to test for collinearity among continuous independent variables and for dummy or discrete variables respectively (Gujarati, 1995). 2.3.2 VARIABLES USED FOR THE EMPIRICAL MODEL Once the analytical procedures and their requirements are known, it is necessary to identify the potential explanatory variables and describe their measurements. Accordingly, key variables that are expected to have influence on households’ decision to participate in production of improved onion seed, and condition on participation, their level of participation are explained below.

VOLUME NO. 2 (2012), ISSUE NO. 12 (DECEMBER) ISSN 2231-1009
INTERNATIONAL JOURNAL OF RESEARCH IN COMPUTER APPLICATION & MANAGEMENT A Monthly Double-Blind Peer Reviewed (Refereed/Juried) Open Access International e-Journal - Included in the International Serial Directories
http://ijrcm.org.in/
37
TABLE 1: DESCRIPTION OF VARIABLES INCLUDED IN THE MODEL
Variable Variable Description Variable Measurement
AGE Age of the households head Number of years
EDUCATION Education level of households head In grade level
EXPERIENCE Experience in production of improved onion varieties Number of years
FMSIZ Household size In man-equivalent
CREDIT Whether a household received credit during the cropping year. Dummy(1=Received,0 otherwise)
LAND Size of cultivated land owned Hectares
Leasd Land Total size of Land leased-in during cropping season. Hectares
TLU Total livestock owned excluding oxen. Tropical livestock unit
OXEN Oxen owned by respondent. Number
TRAINING Whether a household participate in training Dummy (1=Received, 0 otherwise)
NON/OFF-INCOME Amount of annual income from Non/off farm actives. Birr
PRICE Lagged price of seed in the market Birr
MARKET Distance from the household to nearest market. Kilometers
IRRGLAND Proportion land under irrigation Hectares
Woreda Whether a household live in Adama or Dugda Bora district. Dummy(1=Adama,0 otherwise)
3. LITERATURE REVIEW There is a large empirical literature showing that socio-economic characteristics of farm decision makers and farm households influence production decision making. One strand of the literature uses various measures of human capital (experience, years of schooling) as explanatory variables (Huffman, 2001). A second strand of literature introduced farmers’ risk attitudes as a factor influencing decision making, and researchers have hypothesized that attitudes toward risk and other attitudes that affect decision making vary across farmers, perhaps systematically with wealth, education, experience and other personal characteristics (Sunding and Zilberman, 2001). Another strand of literature is based on the household production model, where in production decisions are modeled as non separable from other household decisions (Strauss and Thomas, 1995). According to this approach, any feature of the farm household (e.g., family size and composition, demographic characteristics, financial characteristics, etc.) could impact farm production decisions. In this section, we review some empirical studies undertaken in the past that related to this study is presented. Gezahagn (2008) in his is study in the SNNP region in Ethiopia identifies major factors that determine the seed multiplication by farmers using Tobit econometric model for four major crops (wheat, coffee, apple and potato). The study found that access to credit and oxen ownership is important factors that increase the propensity to participate in seed production. In same way, human capital variables such as literacy; information sources such as agricultural extension, and distance from market and main road influence significantly farmers’ participation decisions and intensity in seed multiplication. Farmers with more land had a higher probability of adoption, probably because they are wealthier and have more land to experiment with improved seed multiplication. Extension visits also resulted in a higher probability of adoption by raising farmers' awareness of new wheat varieties. However, this study did not recognize the potential sample selection bias and the difference in key variable influencing two decisions. Teklewold et al. (2006) conducted a study using Cragg’s double hurdle model to determine factors influencing the rate and intensity of adoption of poultry technology by assuming that the two decisions processes were separate. Results of the studies indicate that there were different sets of factors behind the decision to adopt and the decision about to which extent to do so.. In the same way Shiferaw et al. (2008), uses the augmented double-hurdle model for technology adoption under seed access constraints and the economic impacts of improved pigeon pea varieties in Tanzania. The study identifies the crucial role of seed access (local supply), extension, education, participatory decision making, capital, and household assets in determining adoption decision of farmers. Asfaw et al. (2010), follow the same analytical model to analyze the determinants of adoption and intensity of Chickpea technologies in Ethiopia. They also estimate the causal impact of technology adoption on market integration by utilizing treatment effect model; regression based on propensity score as well as matching techniques to assess results robustness. The result of the analysis demonstrated that knowledge of existing varieties, perception about the attributes of improved varieties, household wealth (livestock and land) and availability of active family labor force play a significant role in enhancing the level of adoption of improved chickpea varieties. The study also revealed that integration into output market is also positively associated with household wealth and availability of active family labor force and negatively associated with age of household head and distance to main market. The factors that influence household decisions to produce cooking banana for market in southeast Nigeria were examined by Tshiunza et al. (2001) using Tobit. Tobit regression analysis revealed that the price and the ripening stage at sale of cooking banana, as well as the presence of middlemen in the marketing chain were the most important determinants of the proportion of cooking banana planted for market. This indicates that cooking banana growers readily respond to market forces. Age and gender ownership of cooking bananas also influenced the proportion of the crop planted for market. Increased involvement of wholesalers and processors in the marketing chain of the crop will probably enhance its market in the region. A study by Ouma (2006) was undertaken to identify key factors in the adoption of improved maize seed and fertilizer as well as the intensity of use of improved maize seed and fertilizer. Logit econometric models were used to explore factors influencing adoption and Tobit models for intensity of use of the improved varieties and fertilizer. Access to credit was positively related to adoption and intensity of use of the two inputs. Extension contacts positively influenced the likelihood of adoption of improved maize seed, while amount of planting fertilizer used positively influenced both the adoption and intensity of use of improved varieties. Distance to market negatively determined the adoption and intensity of use of fertilizer. In addition gender and access to hired labour had negative impacts on the intensity of use of fertilizer. More recently, Messay (2010), employed the double-hurdle model to analyze the determinants of household decision to participate in local seed multiplication, and the level of participation decision, once they decide to participate in seed multiplication. According to this study access to hired labour, distance to the main road, access to input supply and field day visit impacted the first binary decision of whether or not to participate in wheat seed multiplication farming. Only distance to the main road were found to determinants of farmers’ participation negatively and significantly related to the in seed multiplication. On the other hand, intensity of farmers' decision to participate on the seed multiplication was influenced by number of oxen owned, access to complementary input and field day visit.
4. RESULTS AND DISCUSSION 4.1. HOUSEHOLD, FARM AND INSTITUTIONAL CHARACTERISTICS Table1 presents the descriptive statistics of selected household, farm and institutional characteristics of sampled households by participation status in seed production. Some of these characteristics are explanatory variables of the estimated models that we will be presented further on. From total sampled (80) farm households about 50% are participants i.e. planted improved onion seed varieties for seed production during 2008/9 cropping season. The amount of land that used to produce improved onion seed varieties is about 0.36 ha for seed producer households. Average age of sample households head is about 43.31 years and 7.5% female- headed. The results show the existence of significant difference in the age and gender of the household head between participants and non-participants although the group does not vary in terms of their marital status and family size. The average years of farming experience in the production of improved onion varieties is 7.80 years and the difference is statically significant suggesting the importance of previous experience with the yield enhancing technology or familiarity with the onion seed production for participation in seed production. Since improved varieties crops

VOLUME NO. 2 (2012), ISSUE NO. 12 (DECEMBER) ISSN 2231-1009
INTERNATIONAL JOURNAL OF RESEARCH IN COMPUTER APPLICATION & MANAGEMENT A Monthly Double-Blind Peer Reviewed (Refereed/Juried) Open Access International e-Journal - Included in the International Serial Directories
http://ijrcm.org.in/
38
have been produced for a longer period, it is believed that smallholders have the technical know-how and experience in the production of these commodities. Thus, new seed production enterprise selection for this crop could not constrained by lack of knowledge.
TABLE 2: DESCRIPTIVE STATISTICS OF SAMPLE HOUSEHOLDS
Variables unit Non-participants Participant t-value
Household characteristic
Age years 46.6 40.02 -2.65***
Family size count 6.37 7.16 1.16
Education level count 3.9 6.72 3.61***
sex 1/0 0.88 98 2.85**
Experience in onion years 6 7.8 2.5***
Experience in seed years 3.03
Farm characteristic
Labor availability AEV 2.96 3.51 1.71
Non/Off income Birr 1532.2 4968.25 3.21***
Rain fed land ha 0.74 1.39 2.40**
Irrigated land ha 0.45 0.9 3.40***
Non oxen tropical livestock unit TLU 4.47 6.46 2.33**
Oxen number 2.13 2.6 1.66
Ownership of pump 1/0
seed land ha 0.36
Institutional characteristics 1/0
Access to extension 1/0 55 72.5 2.61
Training 1/0 27.5 52.5 5.20**
Formal Credit 1/0 35 55 3.23*
Market distance Km 7.75 8.2 -0.43
***, ** and * indicate statistically significant at 1%, 5% and 10% probability levels, respectively. Education level of the heads of households is also important in influencing production decision by farm households. The result depicts that there is statistically significant difference between them, where participant have better level of education achievement, on average about 6.72 years of formal schooling, than non participant who had on average 3.90 years of formal schooling. The participants groups are also distinguishable in terms of productive assets holding whereby by participants own more irrigated land, ran-fed land, livestock and ownership of water pump. And households with larger asset holding are likely to be wealthier. This suggests that household wealth might be correlated with decision to participate. No significant difference is observed in number of oxen. Farmers’ knowledge and technical skills regarding seed production might be one of important factors that influence decision to involve in this sector. Hence, Access to training is one means to impart knowledge and develop skill of farm household and result also depict a systematic association between decision to participate and access to these services. However, there is no significant difference in terms of access to extension that usually involves in general agriculture although non participant households were located relatively nearer to market places. Fifty seven percent of participants had access to credit from formal institution compared to 45% of non participants in the year of 2008/9 GC. The chi-square test showed a significant difference between access to credit and participation in seed production. Moreover, significantly larger proportion of seed produce also engages in off-farm employment. The simple comparison of the two groups of smallholder suggests that participants and non-participants differ significantly in terms of some proxy household, farm and institutional characteristics. 4.2. SEED PRICE AND QUALITY ADVANTAGE OF ONION SEED BY FARMER Table 3 (appendices) summarizes the relative advantage of locally produced seed in terms of price and germination. The farmers in the study area have expressed different views about the importance of the vegetable seed production in reducing price. From total seed producer, about 58% of them claimed that their seed price low as compared to the available seed on the market while only 47.5% of the non producers claimed the same response. Their differences were found to be statistically insignificant. The survey also indicated that 27 percent of participant and 30 percent of non participants considered the locally produced seed price expensive. However, almost all farmers prefer seed produced by farmer due to high germination rate as compared to market seed (Table 2). Study by Mulugeta (2007) in East Shoa indicates that poor quality of seed forced farmer to use high seedling rate, aiming to compensate for poor germination. Hence, to avoid additional cost from using high seed rate and possible lose due to poor germination, farmer are willing to pay high price to those farmer who are recognized by community as best seed producer. According to Table 3, only six of the farmers were observed to show they are indifferent as far as the seed are of good quality. 4.3. ECONOMETRICS RESULT 4.3.1. DETERMINANTS OF PARTICIPATION IN LOCAL BASED ONION SEED PRODUCTION Prior to the estimation of the model parameters, the presence of multicollinearity problem among the independent variables was checked. This was done using variance inflation factor (for all variables) and contingency coefficient (only for dummy variables). The result shows that the data had no serious problem of multicollinearity, and then the data analyses were carried out using STATA version 9. The results of probit model for determinants of household decisions to participate in onion seed production is presented in Table 4. The table reports the estimated coefficients, Z-value, Marginal effects (the effect of a unit change in each independent variable on the probability of participation) and some goodness of fit measures for the model.
TABLE 4: MAXIMUM LIKELIHOOD ESTIMATES OF THE PROBIT MODEL
Category Variables Coefficient Z - Value Marginal Effect
Household Age -0.1652*** -2.6100 -0.0624
characteristic Education 0.0262 0.2700 0.0099
Experience 0.2289** 1.9100 0.0865
Non/Off-Income 0.0001 0.9100 0.0000
Labor availability 0.3144 0.9800 0.1188
Farm Leased-in Land 1.0625 1.6400 0.4016
characteristics Irrigated land 1.2736 1.2500 0.4814
Land 1.0663** 2.2900 0.4031
Oxen -0.5606 -1.2500 -0.2119
TLU 0.2543** 2.2300 0.0961
Institutional Training -0.2588 -0.3800 -0.0984
characteristics Credit 1.3748** 1.9800 0.4751
Extension 0.3339 0.5100 0.1273
Market -0.0148 -0.2300 -0.0056

VOLUME NO. 2 (2012), ISSUE NO. 12 (DECEMBER) ISSN 2231-1009
INTERNATIONAL JOURNAL OF RESEARCH IN COMPUTER APPLICATION & MANAGEMENT A Monthly Double-Blind Peer Reviewed (Refereed/Juried) Open Access International e-Journal - Included in the International Serial Directories
http://ijrcm.org.in/
39
Woreda 1.9257*** 1.7800 0.6350
Cons -0.0627 -0.0300 0.0000
Number of observation = 80 Prob > chi2 = 0.0000 LR chi2 (15) = 69.58 Log likelihood = -20.659906 Pseudo R2 = 0.6274 Predicted success: Participants =85.71%, Over all predicted Success = 87.50% Non-participants =89.47% ***, ** and * indicate statistically significant at 1%, 5% and 10% probability levels, respectively. Various goodness of fit measure was checked and validate that the model fits the data. First, the log-likelihood ratio test is applied to assess overall joint significance of the independent variables in explaining the variations in farm household likelihood to participate in seed production. The null hypothesis for the log-likelihood ratio test is that all coefficients are jointly zero. The model chi-square tests applying appropriate degrees of freedom indicate that the overall goodness-of-fit of the probit model are statistically significant at 1% probability level. This shows that jointly the independent variables included in the probit regression model explain the variations in the household’s probability to participate in seed production. Second, the McFadden’s Pseudo-R2 is calculated and the obtained values indicate that the independent variables included in the regression explain significant proportion of the variations in the household’s likelihood to participate. The probit model explains 63% of the variations in the likelihood of households’ decision to participate. Third, the correct prediction rate of the probit model is obtained. The results also showed that probit model predicts about 87.5% of cases correctly in to participant and non-participant categories. The correctly predicted participants and non-participants of the model were 85.71% and 89.47%, respectively. The probit regression estimates confirm that the probability of participation is influenced by a wide range of factors. From household characteristics, age of the household head is observed to decrease the likelihood of household decision to participate. This implies as age of the head increase, the propensity to participate in production of onion seed decrease. The logic for negative effects of age on propensity of participate is not unreasonable, given the notation of life cycle in which younger people tend to be more innovative, motivated, and energetic, whereas older people become satisfied with the status quo (Doss, 2006). This negative effect of HHH age is consistent with Yami (2010) for wheat seed varieties in Ethiopia. Experiences in improved onion production were used as proxy in farming experience in terms of modern technology and familiarity to onion seed technology, and turned out be as expected, a positive relationship with likelihood of household decision to participate in seed production. Those households who have been engaged in cultivation of improved crop varieties for longer period of time are more willing to participate in seed production of this crop variety than farmer with short experience or late adopter. Since those farmer with longer previous experience in production of improved varieties of crops it is believed to have the technical knowhow and experience in the production of these commodities. Thus, introduction of new seed production enterprise of this crop is more likely to happen, because they gain more benefit as they are in better position to understand the production method/technique and the advantage of seed cultivation than inexperienced households. As noted by Marra et al. (2003) risk associated with adopting a new technology can be associated to a lack of knowledge on how to use it, a lack of experience using it, and uncertainty about the potential benefit of the innovation. Farm characteristics measure wealth, both in terms of capital endowment of factors of production and as a buffer to mitigate any production and market related shocks, are cited as influential determinants of agricultural production (Schultz, 1964). In this study, two of the farm characteristics variables were found to be significant, namely, farm size, and total livestock owned. The likelihood of cultivating onion seed increases with landholdings. This is consistence with hypothesis, households with larger farm size are likely to be wealthier, with the ability to self finance the purchase farm input and can afford to take greater chance which makes investment in new technology feasible, such as onion seed production (Moser & Barrett, 2003). A 1% increase in farm size increases the probability of participation in seed production by 40 percent. The coefficient of total livestock holding is observed to influence positively the decision to participate in onion seed production and statistically significant at 5% probability levels. Livestock ownership can serves the farmer as buffer against any unexpected risk that might associated with the participation in new enterprise like onion seed production and also helps farmers to minimize their liquidity constraint to participate. These results for total available land and livestock are in agreement with similar studies by Gezahagn (2008), who identified size of cultivated land and livestock as the most prominent variable explaining participation decisions by farm household in wheat and apple seedling multiplication. Participation in capital market (borrowing from formal institution) has positive correlation and significant at 5% level; suggesting that relaxing liquidity binding constraints among vegetable producing households through access to credit will significantly increase their probability of participation in local based onion seed production. The most important implication related to the impact of access to credit is related to nature of onion seed production which is characterized by longer gestation period and cash intensive enterprise. This further aggravated by need to purchase the mother bulb, which is normally more costly than the onion seed (amount required to plant per ha). This indicates why access to credit is observed as an important determinant of participation in onion seed production. Similar results were found by Gezahagn (2008) for improved wheat seed and Yami (2010) for improved potato variety by farmer. Finally, District dummy coefficients have a negative sign and statistically significant. Farm household who live in Dugda Bora district are less likely to participate in seed production than farmers in Adama district, as indicated by the negative coefficient on WOREDA. This may be related to the existence of Melkassa Agricultural Research Center (MARC) in the Adama district and this makes the farmers in this district beneficiary of training, pre-extension demonstration and improved seed distribution trials. Moreover, Adama district is strategically located in terms of its geographic proximity to the major vegetable market in Ethiopia. Since an increase access to market for vegetable drive to increase demand to seed and existence for market may motivate farmer to participate in seed production. 4.3.2. FACTORS AFFECTING THE INTENSITY OF ONION SEED PRODUCTION This section presents the second stage of Hickman’s econometric model estimation results and presented in Table 4. With a Heckman two-step approach, the first step is to estimates a Probit model of participation in the seed production as a function of those variables that likely also determine level of land allocated, conditional on participation, as well as one or more exclusion restriction variables (Wooldridge, 2006). Thus, the first stage must contain at least one explanatory variable that is not included in the second stage, which is known as the identification restriction; therefore, a variable must be found which affects the decision to participate but does not affect the level of land allocated to seed production. The econometric identification is made possible in the study by inclusion household characteristic variable namely access to extension. This variable is not expected to influence level participation. Justification for the Heckman procedure is found in the study as the Inverse Mill’s Ratio coefficient is significantly positive, indicating unobserved characteristics in the farmers’ decisions to participate in local based onion seed influencing the intensity of participation. A series of household related factors were found to be significant in explaining the intensity participation once the decision to participate is made by household. The amount of land allocated to onion seed production is found to be a decreasing function of the household head’s age and increasing function of the number of active labour force. The positive effect of labour availability on the amount of land allocated to seed production can be explained by the fact that onion seed production is labor intensive agricultural enterprise which demands good deal of labor as major input. In the study area, given poor labour market functioning, households with relatively more active labour force would encourage them to cultivate more land under onion seed than households with less active labor force. For instance, every additional member in the household (AEV) causes about a 0.102 ha increase in the amount of land allocated to onion seed production by keeping all other variables constant. The significant positive effect of this variable also suggests how family labour is important in developing countries (Solomon et al. 2010).

VOLUME NO. 2 (2012), ISSUE NO. 12 (DECEMBER) ISSN 2231-1009
INTERNATIONAL JOURNAL OF RESEARCH IN COMPUTER APPLICATION & MANAGEMENT A Monthly Double-Blind Peer Reviewed (Refereed/Juried) Open Access International e-Journal - Included in the International Serial Directories
http://ijrcm.org.in/
40
TABLE 5: SECOND STAGE ESTIMATION RESULTS OF HECKMAN MODEL
Category Regressor Coefficients Z – Value
Household Age -0.0221*** -3.3100
characteristics Experience 0.0231 1.6300
Off income 0.0000*** 3.8900
Labour availability 0.1030** 2.6500
Farm characteristics Irrigated land 0.4547*** 3.9700
Farm size -0.0131 -0.4600
Oxen 0.0066 0.1700
TLU -0.0081 -0.8200
Leased-in land -0.0153 -0.4500
Market 0.0077 0.8200
Institutional Credit 0.0743 0.8800
Characteristics Seed price 0.0031*** 4.6500
Training 0.2897*** 3.6200
Woreda -0.2350 -1.2500
_Cons -0.3753** -1.8200
Lamda 0.17424** 1.76
N = 40 Probability value = 0.0000 Wald chi2(15) = 76.29 Rho = 1.0277 ***, ** and * indicate statistically significant at 1%, 5% and 10% probability levels, respectively. As expected, the study found household resources endowment (share of irrigated land) to have a highly significant influence on the decision to allocate land to onion seed production by seed producer. This imply that participant who own larger share of farm size with irrigated land will allocate more land to seed production than who own small irrigated land for example a percentage increase in the ratio of irrigated land owned increase land allocated to onion seed by 0.45 ha, holding other variables constant. Market price of onion seed was also found to increase the land allocated to seed production, once participation decisions are made. This result supports hypothesis that land allocated to onion seed production is indeed responsive to market signals. Higher seed prices can be expected to lead a higher land allocation for seed by participant, since farmer cultivation effort responds positively to expected prices. An interesting result is that household’s participation in training influenced the land allocated to seed production positively. This is mostly due to the reality that participants who are involved in seed production training would get more knowledge and skill related to agronomic practices, harvesting, storing and handling methods of onion seed production. Training also enhances farmer’s ability to distinguish technologies that generate opportunities for economic gain from those that do not (Wozniak, 1984). This in turn increases their ability to manage more amount of land allocated to seed. This evidence suggests that the existence of appropriate farmers’ institutions promoting training is an essential component to enhance farmers’ participation in seed multiplication. This finding is in conformity with earlier studies conducted elsewhere in Ethiopia (Yami, 2010; Gezhaegn, 2008).The availability of off farm income was found to have positive and significant influence on intensity of participation in onion seed production. The result confirms the hypothesis, in the case were income earned by household members, with the assumption this diversification may lead to risk reduction in household decision making and, with it, increased propensity to undertake higher-risk activities, notably allocate more land to seed. As risk and desire to invest in the farm are inversely related, such diversification can increase incentive to invest.
5. CONCLUSIONS The general goal of the study is to understand the factors that increase vegetable producing farm household decision to participate in cultivation onion seed with intention to supply for local market. By doing so, the study went to assess factors that can help in identifying key growers who could be encouraged and supported to emerge as individual small-scale entrepreneurs dealing in seed production and distribution. It is not likely that all farmers will end up as successful growers. For this purpose, primary data were collected from 80 farm households drawn purposively and randomly from two districts of East Shoa Zone. Hickman’s two-stage econometric model is utilized in the study to analyze determinants of participation and intensity of participation decision made by farm household. Using these model have advantages, it separates the first discrete decision of whether or not to engage in production of onion seed from the continuous decision of how much land is needed by the household. Furthermore, the model helps to overcome the possible sample selection bias. Farmer participation decision model (Probit) result showed that the likelihood of participating in onion seed production was significantly influenced by household characteristics related variables such as age of the household head and farming experience in terms of improved varieties cultivation. Farming experience was associated positively whereas age of the head associated negatively with participation decision. Those households who are headed by young farmer with longer year of experience in cultivation of improved onion varieties were found to be fast participant to seed production. Results from participation decision model also confirm that the decision to participate related to household wealth indicator variable. Those households with more cultivated land and livestock were found to have high propensity to participate in onion seed production. Ownership of this asset helps to relax the household’s liquidity constraints. Moreover, households with large farm size can experiment by allocating small land to seed production. Participation in capital market had positive correlation to the decision to participate; suggesting that relaxing liquidity binding constraints among vegetable producing households through access to credit will induce the cultivation onion seed to market by households. This is mostly related to nature of onion seed production which characterized by longer gestation period and regular cash out flow to purchase agrochemical /or farm operation. Once household decide to participate an increase in the land allocation to onion seed took place when the area under irrigation increased, when the household had access to training, when an incentive from market through price increased and increase in family size. An increase in age of seed producer decrease the land allocated to onion seed production. Moreover, the coefficient associated with the inverse Mills’ ratio was found to be significant, indicating that the influence of unobservable factors in the farmers’ decisions to participate in local based onion seed production.
6. IMPLICATION From household characteristics, age and farming experience is found to explain the heterogeneous household decision to participate in local based onion seed production. Those farmers who have long experience in cultivation of improved onion varieties were found to be fast participant and allocate more land to seed production. This imply knowledge of improved crop varieties is important pre requests to participate in local based improved seed production, since farmer who knew and cultivate improved seed for long period may probably have good knowledge. Thus, targeting young and experienced farmers in the intervention of local based seed production is probably advisable, as young and experienced farmers tend to be more flexible in their decisions to participate new ideas and agricultural enterprise more rapidly. The results of the study indicate that although credit access increases the likelihood of participation, it did not influence the amount of land allocated to onion seed production. This have two implication, at first the importance of credit as it increased framer participation in seed production, but it also indicates that loan sizes may be too small for making a significant impact on the cultivated area or loan used for other activates. This may be related to nature of vegetable seed production which is characterized by cash intensive, long gestation periods and risky entrepreneur. Consequently, small scale seed producer may experience long periods of cash flow deficit during the seed production phase, and they require long term financing of operations. However, most of credits providing

VOLUME NO. 2 (2012), ISSUE NO. 12 (DECEMBER) ISSN 2231-1009
INTERNATIONAL JOURNAL OF RESEARCH IN COMPUTER APPLICATION & MANAGEMENT A Monthly Double-Blind Peer Reviewed (Refereed/Juried) Open Access International e-Journal - Included in the International Serial Directories
http://ijrcm.org.in/
41
institution offer small and short-term loan to the farmer. This may not induce in allocating more land to seed production. Thus, In order to improve farmer participation in local based seed would require making credit available to farmers to address the long gestation period and high mother bulb costs. The decision to allocate more land under seed production is found to be influenced by market price of seed. This implies market forces are relevant in explaining the intensity of local based seed production and that farmer become more willing to participate in production of improved seed to market when they expect to receive better price. The effects of seed prices have potentially important implications for the design of local based seed production. Policies and project design that can affect seed price may increase participation, and thus land allocated to seed and supply too. Thus, improving marketing out let for seed produced and crop output is important. Farmers’ associations that specialized in seed production should be promoted to enable seed farmers to compete for better market prices. The results also suggest us for organization involved in project aimed at promoting seed production by small scale farmer should endeavor to create awareness for participating in the way that they consider local based seed production project as commercial enterprise rather than development project. The transfer of knowledge and information concerning seed technology including training that could to develop the skill of farmers found to be important in increasing the land allocated to seed multiplication activity. This implies capacity development of producer will bring significant change in land allocated to seed as it enhances the ability to cultivate more land. Smallholder farmers who multiply seed need to be thoroughly trained in all aspects of seed multiplication. Access to irrigation is found to influence the intensity of participation. This implies lack of irrigated land and equipment inhabited farmer from increasing land under seed production. The most important conclusion that can be drawn from the results of the thesis is that there is a pressing need for more water resource development efforts in the region. Thus, supporting farmer either in building small scale irrigation scheme and/or providing loan to purchase farm equipment needed to irrigate land improve the producer amount of seed production. The results also have an implication that farmers with smaller acreage under irrigation are likely to require special participation incentives such as training to improve their access to technical information. This may encourage them to allocate more land.
7. REFERENCES 1. Alemu, D. and Spillman, D.J. (2006): ``The Ethiopian Seed Systems: Regulation, Institutions and Stakeholders,`` Paper submitted for ESSP polices
conference. “Birding, balancing and scaling up”, advancing the rural growth agenda in Ethiopia 6-8 June 2006, Addis Ababa Ethiopia. 2. Alemu, D., Abera D., lemma D., & Anchala, C. (2005), ``Domestic Vegetable Seed Production and Marketing, `` Research Report No. 57., Ethiopian
Agricultural Research Organization. 3. Alemu, D., Mwangi, W., Nigussie, M. and Spillman, D.J. (2008), ``The Maize Seed System in Ethiopia: Challenges and Opportunities in drought prone areas,
`` African Journal of Agricultural Research, 3 (4): 305-314. 4. Asfaw, S., Shiferaw, B and Franklin, S, (2010), ``Does Technology Adoption Promote commercialization? Evidence from chickpea technology in Ethiopia`` 5. Cooper, D., and Cromwell, E. (1994). `` In Situ Conservation of Crop Genetic Resources in Developing Countries: The Influence Of Economic, Policy, and
Institutional Factors. London: Overseas Development Institute. RPRRP Discussion Paper. 6. CSA (Central Statistical Authority), 2006. Annual statistical abstract, Addis Ababa, Ethiopia. 7. Doss, C.R., (2006) `` Analyzing Technology Adoption Using Microstudies: Limitations, Challenges and Opportunities for Improvement`. Agricultural
Economics, 35:207-219. 8. FAO, (2004); ``Seed Multiplication by Resource Poor Farmers.`` Food and Agricultural Organization of the United Nations, Rome. 9. Gezahagn W. (2008): ``Determinants and Role of Farmers’ Seed and Seedling Multiplication in the SNNP Region,`` M.Sc Thesis presented to School of
Graduate Studies of Haramaya University, Ethiopia. 10. Greene, W.H. (2003). Econometric Analysis, 5th Edition, Prentice Hall, Inc, London. 11. Gujarati, D. N., (1995). Basic Econometrics. 3rd edition. McGraw-Hill, New York. 12. Heckman, J., (1979) ``Sample selection as a specification error,`` Econometrica 47, 153-161. 13. Jaleta M. (2007): ``Econometric Analysis of Horticultural Production and Marketing in Central and Eastern Ethiopia,`` PhD Dissertation. Wageningen
University, Netherlands. 101p. 14. Jones, K. M., (2005): ``Technology Adoption in West Africa: adoption and dis-adoption of soybeans on the Togo-Benin border.`` An Msc Thesis submitted to
the Graduate Faculty of North Carolina State University. 15. Jones, R., (2007):``Seed Enterprise Enhancement and Development Services (SEEDS) to Support the Commercialization of Publicly-Developed Varieties in
Africa,`` Biotechnology, Breeding and Seed Systems for African Crops. 3rd General Meeting, March 26-29, 2007. 16. Lewis, V., and Mulvany, P., (1997): ``A Typology if Community Seed Banks.`` Natural Resources Institute. University of Greenwich. Kent: Natural Resources
Institute. University of Greenwich. 17. Lipper, L., Romina, C. and Paul C.., (2005), ``Seed System, Households’ Welfare and an Economic Methodology Applied in Ethiopia,` ESA technical paper.
Agricultural and Development Economics Division, the Food and Agricultural Organization of United Nation. 18. Maddala, G.S., (1983). Limited Dependant and Qualitative Variables In Econometrics. Cambridge, UK: Cambridge University press. 19. Marra, M., Pannell, D.J. and Ghadim, A.A. (2003), `The Economics of Risk, Uncertainty and Learning in the Adoption of New Agricultural Technologies:
Where Are We on the Learning Curve?` Agricultural Systems, 75(2/3): 215-234. 20. Mintewab B. (2005): ``Biodiversity Conservation under an Imperfect Seed System: the Role of Community Seed Banking Scheme.`` Thesis, Göteborg
University, German. 21. Monyo, E.S., Mgonja, M.A. and Rohrbach, D.D. (2003), ``An Analysis of Seed Systems Development, With Special Reference to Smallholder Farmers in
Southern Africa: Issues and challenges,`` Paper presented at the workshop on Successful community based seed production strategies, co-organised by CIMMYT and ICRISAT, 3-6 August 2003, Harare, Zimbabwe.
22. Moser, C., and Barrett, C. (2003) `The Complex Dynamics of Smallholder Technology Adoption: The Case of SRI in Madagascar` Cornell University, Applied Economics and Management, Working Paper No. 2003-20
23. Mulugeta T., (2007), `The Roles of Farmer Research Group in Technology Generation and Adoption: the case of onion producing farmers` research groups at Adama and Dodota Sire Woredas,` Thesis Alemaya University, Ethiopia.
24. Olwande, J., Sikei, G.& Mathenge, M. (2009) ``Agricultural Technology Adoption: A Panel Analysis of Smallholder Farmers’ Fertilizer use in Kenya. `` Contributed paper prepared for presentation at the African Economic Research Consortium Conference on Agriculture for Development, May 28th and 29th, Mombasa, Kenya.
25. Ouma, J.O., Groote H.D. and Owuor, G., (2006) ``Determinants of Improved Maize Seed and Fertilizer use In Kenya: Policy Implications`` Contributed paper prepared for presentation at the International Association of Agricultural Economists Conference, Gold Coast, Australia, August 12-18, 2006.
26. Pichop, R.C., Tonapi V.A., Bezkorowajnyj, P.G. Navi, S.S. and Seetharama, N. (2007). Seed System Innovations in the semi-arid Tropics of Andhra Pradesh, International Livestock Research Institute (ILRI), ICRISAT, Patancheru, Andhra Pradesh, 502, 324, India.
27. Schultz, T.W. (1975) `The Value of the Ability to Deal with Disequilibrium,` Journal of Economic Literature, 13: 827-846. 28. Shiferaw B, Kebede TA, You L (2008). ``Technology Adoption under Seed Access Constraints and the Economic Impacts of Improved Pigeonpea Varieties in
Tanzania. `` Journal of Agricultural Economics, 39(3): 309-323. 29. Sudha, M., Gajanana T.M. and Murthy D. S. (2006) Economic Impact of Commercial Hybrid Seed Production in Vegetables on Farm Income, Employment
and Farm Welfare; A Case of Tomato and Okra in Karnataka. Paper presented in Agricultural Economics Research Review Vol. 19 July-December 2006 pp 251-268.
30. Sunding, D., and Zilberman,D., (2001). “The agricultural innovation process: research and technology adoption in a changing agricultural sector.” G. Rausser and B Gardner, eds., Handbook of Agricultural Economics, Volume 1A. Amsterdam,

VOLUME NO. 2 (2012), ISSUE NO. 12 (DECEMBER) ISSN 2231-1009
INTERNATIONAL JOURNAL OF RESEARCH IN COMPUTER APPLICATION & MANAGEMENT A Monthly Double-Blind Peer Reviewed (Refereed/Juried) Open Access International e-Journal - Included in the International Serial Directories
http://ijrcm.org.in/
42
31. Teklewold, H., Legesse D., Yami A., and Dana N., (2006) ``Determinant of Adoption of Poultry Technology: Double–Hurdle approach, Debrezeit Agricultural Research Center, Debrezeit, Ethiopia.
32. Tobin, J., 1958, Estimation of relationships for limited dependent variables, Econometrica 26, 24-36. 33. Tripp, R., (1994) ``Proximity is Plus: The Economics of Farmer Seed Production and Distribution in Developing Countries. In Seed Production by Smallholder
Farmers: Proceedings of the ILCA/ICARDA Research Planning Workshop held in ILCA, Addis Ababa, Ethiopia, 13-15 June 1994, ed. J. Hanson. Addis Ababa: ILCA. United Nations, Rome, Italy.
34. Tripp, R., (2003): ``How to cultivate a commercial seed sector, Overseas Development Institute``, London, Paper Presented for Symposium “Sustainable Agriculture in Sahel” Bamako, Mali. December 2003.
35. Weltzien, E., and Brocke, K.V., (2001):``Seed System and their potential for innovation; Conceptual Framework for Analysis, Hohenheim University, ` `Preceding presented on Workshop Targeted Seed and Seed-System interventions; Strengthening Small-Farmers Seed Systems in East and Central Africa, Kampala, Uganda.112p.
36. Wooldridge, J.M. (2006). Introductory Econometrics: A Modern Approach. 3rd Edition. South-Western College Publishing. 37. Wubalem G. (2006): `Farmers Participation in Contract Farming: the case of bread wheat (triticumaestivum) production in womberma woreda, Amhara
National regional state,` thesis Presented to School of Graduate Studies of Haramaya University. 38. Yami M. (2010): `Analysis of Factors Determining Farmers’ Participation in Local Seed Multiplication: the case of Womberma and Guagusa Shekudad
Woredas of Amhara National Regional State, ` Thesis, Haramaya University, Ethiopia.

VOLUME NO. 2 (2012), ISSUE NO. 12 (DECEMBER) ISSN 2231-1009
INTERNATIONAL JOURNAL OF RESEARCH IN COMPUTER APPLICATION & MANAGEMENT A Monthly Double-Blind Peer Reviewed (Refereed/Juried) Open Access International e-Journal - Included in the International Serial Directories
http://ijrcm.org.in/
43
COINTEGRATION OF KARACHI STOCK MARKET WITH OTHER ASIAN STOCK MARKETS
FEHMIDA AKRAM
EX. STUDENT
INSTITUTE OF MANAGEMENT SCIENCES
BAHAUDDIN ZAKARIYA UNIVERSITY
MULTAN
AISHA AKRAM
EX. STUDENT
INSTITUTE OF MANAGEMENT SCIENCES
BAHAUDDIN ZAKARIYA UNIVERSITY
MULTAN
SHANZA ARSHAD
EX. STUDENT
INSTITUTE OF MANAGEMENT SCIENCES
BAHAUDDIN ZAKARIYA UNIVERSITY
MULTAN
MAZHAR IQBAL
EX. STUDENT
INSTITUTE OF MANAGEMENT SCIENCES
BAHAUDDIN ZAKARIYA UNIVERSITY
MULTAN
ABSTRACT
This paper investigates the cointegration between the stock market price indices of Karachi stock exchange and the major stock exchanges of Malaysia (FTSE),
India (BSE 30) and South Korea (KOSPI) using daily data spanning January 2001 to January 2010. The Engle-Granger two step procedure shows that there is
cointegration between KSE and BSE 30 index as well as between KSE and KOSPI. While the Engle-Granger procedure shows that the linear combination of FTSF
and KSE 100 index is non stationary. Based on the empirical results obtained from these two residual-based cointegration tests, it is found that investors should
not diversify their funds in the Indian and south Korean markets while they could diversify in the Malaysian markets. By doing this they can reduce the associated
systematic risks across these countries.
KEYWORDS cointegration, stock market, KSE, BSE 30, stationary, Engle-Granger
1) INTRODUCTION oday is the world of globalization which is leading it to a new direction. So the financial world is also reshaping itself. Due to financial liberalization and advancement of technology, new market structures and practices are required. So we are entering in a new world that is financially integrated. So the more opportunities for portfolio diversification are arising.
The interest of various policymakers and investors lie in taking the benefit of efficiency increasing characteristics of market interaction. The co integration of stock markets of various countries can be due to many reasons. For example, global capital movements and the presence of economic ties and regional policy coordination among countries can directly or indirectly interconnect their stock prices through time. Due to the various factors, interaction of the financial markets of the world has become a hot topic of study in the financial literature. These factors are introduction of new innovative financial products; scientific trading and settlement systems, extensive inter border movement of funds and numerous technological innovations. The aim of the study is to understand the dynamic inter-linkages between Karachi stock exchange and the major stock exchanges of Malaysia (FTSE), India (BSE 30) and South Korea (KOSPI). The work on these markets is not conducted before. So if no cointegration is fond then the investors of these countries can take the benefit of diversification. Therefore the policy makers and regulators in these countries will not be worried about any contagious effects. The paper is divided into four sections. Section II describes the previous literature on the inter-linkages and cointegration of the financial markets. Section III describes data and methodology adopted in the study. Section IV elaborates the empirical results. The Section V consists of conclusion, limitations as well as future recommendations.
2) LITERATURE REVIEW In academic journal of finance, the issue of co integration between Asian markets is studied by using co integration techniques. The main issue that is being addresses is that either market is highly correlated or not. Markets integration benefits the region by providing efficient allocation of capital flow, through diversification of risk factors and lower probability of shocks. There is large growing literature on stock market interdependence and integration. But according to data, methodology and theoretical model, there is no clear cut solution. Some previous work has have found that international stock markets are integrated (Arshanapalli & Doukas, 1993) (Eduardo, 1999). Some other researchers have found that stock markets are not interlinked (Smyth & Nandha, 2003) (Hamao, Masulis, & Ng, 1990). Karachi stock exchange is not correlated with the equity markets of the developed world it means opportunities of diversification exist. It is also evident that USA’s stock index S& P 500 is strongly correlated with the indices of European countries like UK, France and Germany. This may be because of free flow of funds between these countries and elimination of barriers. But strong correlation exists between European markets. Correlation analysis is weak technique as it does not discuss the cause and effect relationship so Cointegration and Granger causality is tested. Before application of Johansen-Juselius maximum likelihood ratio test, stationary of index series is tested by using Augmented Dickey Fuller test and Phillips-Perron test (Hassan, Saleem, & Abdullah, 2008).
T

VOLUME NO. 2 (2012), ISSUE NO. 12 (DECEMBER) ISSN 2231-1009
INTERNATIONAL JOURNAL OF RESEARCH IN COMPUTER APPLICATION & MANAGEMENT A Monthly Double-Blind Peer Reviewed (Refereed/Juried) Open Access International e-Journal - Included in the International Serial Directories
http://ijrcm.org.in/
44
Most of the studies on stock market interdependence in emerging markets have been done on the basis of geographical groups of markets, such as in the Asian or Latin American countries. Stock market interdependence in the emerging markets in Asia seems to be a widely accepted fact. (Masih & Masih, 1997) found a high level of interdependence among the stock markets of Thailand, Malaysia, the US, the UK, Japan, Hong Kong and Singapore from 1992 to 1997. Consistent with their later findings (Masih & Masih, 1999), (Masih & Masih, 1997)found a high level of interdependence among the markets of Taiwan, South Korea, Singapore, Hong Kong, the US, the UK, Germany and Japan for 1982 to 1994. (Gupta & Guidi, 2012) has explored the relationship between Indian and Asian developed equity markets over the 1999-2009 periods. No co integration is found between Indian and other Asian markets and there is no long run relationship. This offers the diversification benefits to the investors. (Singh, Kumar, & Pandey, 2009) have studied long run and short sun integration in 15 countries with special focus on India. The countries and their respective stock index are BSE 30 (India), France (CAC 40), Germany (DAX 30), United Kingdom (FTSE 100), Hong Kong (Hang Seng), Indonesia (JSX Composite), Malaysia (KLSE), Korea (KOSPI), Pakistan (KSE 100), United States (NASDAQ), Japan (Nikkei 225), China (SSE Composite), Singapore (STI), Canada (S&P/TSX 60) and Taiwan (TSEC).from cointegration analysis it is concluded that BSE30 index has no cointegration with any of market. So investor can get benefits by diversifying their investment.
3) DATA AND METHODOLOGY 3.1. DATA DESCRIPTION Our selected sample consists of KSE 100 Index, BSE 30 Index, KOSPI index and FTSE. The Bombay Stock Exchange (BSE) equity market capitalization of the companies listed on the BSE was US$1.63 trillion as of December 2010, making it the 4th largest stock exchange in Asia and the 8th largest in the world.. The BSE SENSEX, also called "BSE 30", is a widely used market index in India and Asia. Though many other exchanges exist, BSE and the National Stock Exchange of India account for the majority of the equity trading in India. Korea has sole stock exchange which has market capitalization of $ 1.1 trillion. It has listed 1757 companies and major index is KOSPI. Kuala Lumpur Stock Exchange was renamed Bursa Malaysia Berhad has total market capitalization of MYR700 billion (US$189 billion). Karachi Stock Exchange 100 Index (KSE-100 Index) is a stock index acting as a benchmark to compare prices on the Karachi Stock Exchange (KSE) over a period of time. KSE 100 index is capital weighted index and these top 100 companies has ninety percent share in market capitalization. The Data consists of daily closing prices of Karachi Stock Exchange 100 Index and the following equity market indices of one South Asian Country named India and Asia–Pacific equity market indices: FTSE Bursa Malaysia Index and Korea Stock Exchange KOSPI Index and it is being collected from Yahoo Finance. The prices are taken from 1st January 2000 to 31st December 2010. To investigate the possibilities of cointegrational relationships between these stock markets, different pairs have been made: · Cointegration between KSE 100 Index and Indian BSE SENSEX 30 · Cointegration between KSE 100 Index and FTSE Bursa Malaysia Index · Cointegration between KSE 100 Index and KOSPI All the data is being converted into the log form. Then to check cointegration, Engle-Granger procedure is being used. The first step to do this is to check the stationarity of the variables and then test cointegration between them. If these variables are non-stationary, then we will check whether their linear relationship must be stationary if the markets are to be co-integrated. If their relationship is non-linear, then there will be spurious regression situation. STATIONARITY TEST We perform unit root tests on these four time series in the 1st step to investigate whether they are stationary or not. The Augmented Dickey-Fuller (ADF) unit root test is used for this purpose. The ADF regression equations are: ∆Yt= bYt-1+ et ……………. τ statistics ∆Yt= a+ bYt-1+ et ……………. τμ statistics ∆Yt= a+ b0 + bYt-1+ et ……………. ττ statistics Where εt is white noise. The null hypothesis to check whether the variables are stationary or not, the following hypothesis is being developed: H0: r= 1 Ha: r< 1 If null hypothesis is rejected, it means that the data is stationary and if it is accepted it means data is non-stationary. COINTEGRATION In the 2nd step we will perform cointegration. If the variables are non-stationary, then we will run the regression of one variable on another and calculate their residuals. Then their residuals are being tested using ADF test, if they are stationary, it means there is cointegration, but if their residuals are non-stationary, it means there is no cointegration. For this, following hypothesis is being developed: H0: there is no cointegration. Ha: there is cointegration. To check cointegration, t-adf calculated value is being compared with t-adf critical values. These critical values are being determined by the formula: C (p) =Φ∞ + Φ1/T + Φ2/T²
4) EMPIRICAL RESULTS Using the ADF test, stationarity is being checked. And KSE 100 Index, BSE 30 index, FTSE Index and KOSPI are non- stationary. This non-stationarity is being checked by comparing ADF value with DF critical values. After comparing the values of ADF with DF table, null hypothesis is accepted leading to conclusion that data is non-stationary.

VOLUME NO. 2 (2012), ISSUE NO. 12 (DECEMBER) ISSN 2231-1009
INTERNATIONAL JOURNAL OF RESEARCH IN COMPUTER APPLICATION & MANAGEMENT A Monthly Double-Blind Peer Reviewed (Refereed/Juried) Open Access International e-Journal - Included in the International Serial Directories
http://ijrcm.org.in/
45
The level of significance being taken is 5%. The DF table value for τ distribution at 5% is -1.65. After this, cointegration test is being applied and for this, we have made the pairs that first we will check cointegration between KSE 100 Index and BSE 30 Index and KSE 100 Index with KOSPI and KSE 100 Index with FTSE Index.
4.1. KSE 100 INDEX WITH BSE 30 INDEX KSE 100 Index and BSE 30 Index show non-stationary properties. Then we will use OLS method where KSE 100 Index is taken as dependent variable and BSE 30 Index is taken as independent variable. After fitting the model, residuals εt are being estimated. Then unit root is being applied on these residuals to check whether these two stock exchanges are co integrated or not.
After performing the unit root test, it is revealed that the linear combination of KSE 100 Index and BSE 30 Index is stationary. To further verify, the t-adf value is being compared with t-adf critical value. The critical value of t-adf at 5 % is -1.9394 which less than t-adf calculated value is. So the null hypothesis is rejected i.e. there is cointegration between these two stock markets. 4.2. KSE 100 INDEX WITH FTSE INDEX FSTE index and BSE 30 index show non–stationary property. Then to check co integration OLS is applied KSE 100 index is taken as dependent variable and FTSE is independent variable.
After applying the unit root test with no constant and no trend results shows that the linear combination of these two indexes is non-stationary. To further check this result-adf (t-statistic) is being compared with t-adf critical value. As calculated value is less than table value. So it lies in acceptance region so null hypothesis is accepted i.e. there is no cointegration in these two stock exchanges. 4.3. KSE 100 INDEX WITH KOSPI INDEX KSE 100 Index and KOSPI Index exhibit non-stationary properties. Then residuals are being estimated by fitting the model using OLS method where KSE 100 Index is taken as Y variable while KOSPI is taken as X variable. To check cointegration, unit root is being applied.
VOLUME NO. 2 (2012), ISSUE NO. 12 (DECEMBER) ISSN 2231-1009
INTERNATIONAL JOURNAL OF RESEARCH IN COMPUTER APPLICATION & MANAGEMENT A Monthly Double-Blind Peer Reviewed (Refereed/Juried) Open Access International e-Journal - Included in the International Serial Directories
http://ijrcm.org.in/
46
By performing ADF test, the linear combination between KSE 100 Index and KOSPI appears to be stationary. It is further verified by comparing t-adf value with t-adf critical value. The critical value of t-adf at 5 % with no constant and no trend is -1.9394 that is less than calculated value i.e. -3.452. So the null hypothesis is rejected i.e. there is cointegration between these two stock markets.
5) CONCLUSION This study examines the co integration between KSE 100 index with Malaysia (FTSE), India (BSE 30) and South Korea (KOSPI). To examine cointegration between stock exchanges we taken sample period of 2000 to 2010, firstly ADF test is applied to check stationary and non-stationarity. After fitting model we analyzed that all the series have non-stationary property. To check the cointegration residuals are founded and model is fitted using Eagle Granger process. After it we have founded that there is cointegration between KSE 100 index and BSE 30 Indexes. It did not offer an opportunity to diversify the investment. This contradicts with our literature review. If we see the results of cointegration between KSE 100 index and KOSPI there is also co integration persists between these markets. So investors cannot ripen the benefits of diversification because both markets move side by side. If we analyze the results of cointegration between KSE 100 index and FTSE there is no cointegration in these markets. These two markets offer the benefits of diversification. Investors should flow the funds in these markets.
6. FUTURE RECOMMENDATIONS As this study is conducted in a limited span of time and to check the cointegration, only Engle Granger procedure is applied. After studying the previous researches on cointegration in Asian markets especially in our selected sample there is little work being available in which these markets are studied together. So it can be emerging topic for further research to analyze cointegration and volatility in these markets by using different econometric techniques like Johansen cointegration as well as Granger Casualty test.
7. BIBLIOGRAPHY 1. Arshanapalli, B., & Doukas, J. (1993). International stock market linkages: Evidance from the pre- and post October 1987 period. Journal of banking and
finance, 193-208. 2. Eduardo, R. (1999). Short-term and long-term linkages between the equity markets of Australia and its major trading partners. applied finance
econometrics, 501-511. 3. Gupta, R., & Guidi, F. (2012). Cointegration relationship and time varying co-movements among Indian and Asian developed stock markets. International
review of Financial Analysis, 21, 10-22. 4. Hamao, Y., Masulis, R. W., & Ng, V. (1990). Correlation in price changes and volatity across international stock markets. Review of Financial Studies, 281-
307. 5. Hassan, A., Saleem, H., & Abdullah, M. S. (2008). Long-Run Relationships between an Emerging Equity Market and Equity Markets of the Developed World
an Empirical Analysis of Karachi Stock Exchange. International Research Journal of Finance and Economics(16). 6. Masih, R., & Masih, A. M. (1997). Dynamic linkages and the propagation mechanism driving major international stock markets: An analysis of Pre- and Post-
crash Eras. The Quarterly Review of Economics and Finance Journal, 37, 859-885. 7. Masih, R., & Masih, A. M. (1999). Are Asian stock market fluctuations due mainly to intra-regional contagion effects? Evidence based on Asian emerging
stock markets. Pacific-Basin Finance Journal. 8. Singh, P., Kumar, B., & Pandey, A. (2009). price volatility and spillover across North Amercian, European and Asian Stock Markets: With Special Focus on
Indian Stock Market. 9. Smyth, R., & Nandha, M. (2003). Bivariate causality between exchange rates and stock prices in South Asia. Applied Economics Letters, 699-704.

VOLUME NO. 2 (2012), ISSUE NO. 12 (DECEMBER) ISSN 2231-1009
INTERNATIONAL JOURNAL OF RESEARCH IN COMPUTER APPLICATION & MANAGEMENT A Monthly Double-Blind Peer Reviewed (Refereed/Juried) Open Access International e-Journal - Included in the International Serial Directories
http://ijrcm.org.in/
47
SURVEY ON FACTORS INFLUENCING THE PERFORMANCE OF PLM SYSTEM IN AUTO INDUSTRY
M. S. GOPINATHA
SR. EXPERT SPECIALIST, PLM COMPETENCY CENTRE (ASIA PACIFIC), SIEMENS PLM SOFTWARE; &
RESEARCH SCHOLAR
PES INSTITUTE OF TECHNOLOGY (VTU)
BANGALORE
DR. VISHNUKANTH S. CHATPALLI
ADVISOR
KARNATAKA VOCATIONAL TRAINING & SKILL DEVELOPMENT CORPORATION
BANGALORE
DR. K.S. SRIDHAR
PROFESSOR OF MECHANICAL ENGINEERING
PES INSTITUTE OF TECHNOLOGY
BANGALORE
ABSTRACT
Present day automotive industry is global, both in terms of customers spread across multiple regions (from mature and emerging markets) and manufacturers
and suppliers scattered around the world. The issue from an original equipment manufacturers’ (OEM) perspective is how to respond to and best satisfy
complicated demands while at the same time delivering attractive vehicles at higher quality levels, at the right time, and at a reasonable price. Most of the Auto
OEMs have an appropriate answer to achieving these goals through product and process innovation enabled by a sound Product Lifecycle Management (PLM)
approach and solution. A typical PLM system in automobile industry consists of the PLM Application server which hosts the PDM system, CAD system, Digital
Simulation system, BOM system etc. Database server stores all metadata of PLM system while the bulk data is stored in the file volume server. Web server helps
in connecting the PLM Application server with client machines, ERP systems, CRM/SCM systems, legacy systems etc. [Ref. 4 and 5]. Interview based survey is
conducted to identify potential areas to optimize product design system performance by Interviewing many practicing managers/engineers from Indian and
global automobile companies. A structured questionnaire was administered with the purpose of collecting necessary information regarding potential areas to be
focused for optimization of the PLM system performance in automobile industry. This survey results are published in this research paper highlighting the major
factors influencing the performance optimization of the PLM system in automobile industries. It provides details about how each factor influences the system
performance and its significance in optimizing the overall system performance.
KEYWORDS system performance, PLM System, performance optimization, automobile industry.
1. INTRODUCTION hroughout the history of computers, a primary design goal in all systems has been to achieve maximum performance. In many real life systems, including PLM systems, the application performance is far from optimal. A lot of improvement can often be achieved by measuring how the system behaves and configuring the system optimally. Optimization will generally focus on improving just one or two aspects of performance: execution time,
memory usage, disk space, bandwidth, power consumption or some other resource. This will usually require a trade-off - where one factor is optimized at the expense of others. [Ref. 3] The performance optimization basically consists of the following steps 1. Define the performance problem and identify the key transactions facing performance issues. 2. Identify the bottlenecks and possible causes. 3. Carryout “root cause analysis” using fish bone diagram. 4. Eliminate the root causes one by one using “cause elimination approach” to narrow down to specific root causes. 5. Remove the root cause bottlenecks by appropriate performance optimization methodologies. 6. Repeat steps 2 to 5, until we have a satisfactory optimum performance. It is important to note here that bottlenecks occur at various points in a product design system. Determining the bottlenecks is a step-by-step procedure of narrowing down the root causes. Root-Cause analysis involves analysis diagrams such as fish bone diagram, including “Cause Elimination Algorithms”. Performance optimization is relatively a complex process that requires correlating many types of information, to locate and analyze performance problem bottlenecks. An attempt is made in this interview based research survey to study the current status of product design systems in automobile industry in detail and identify the potential areas/topics for optimizing the product design system performance.
2. SURVEY METHODOLOGY Interview discussions based survey was conducted with PLM system administrators and IT Managers at different auto industries across Asia-pacific countries. Discussions were held with pre-defined questionnaire with the purpose of collecting necessary information reg current status of PLM system performance. The interview discussions were focused on current performance issues and potential areas to be focused for optimization of the PLM system performance. PLM system administrators and IT Managers from following automobile companies were included in the interview discussions:
• India: TATA Motors Limited Maruti Suzuki India Limited Mahindra & Mahindra Automobiles Limited
• Malaysia: Proton Automobiles Company Limited
• Japan: Nissan Automobiles Company
T

VOLUME NO. 2 (2012), ISSUE NO. 12 (DECEMBER) ISSN 2231-1009
INTERNATIONAL JOURNAL OF RESEARCH IN COMPUTER APPLICATION & MANAGEMENT A Monthly Double-Blind Peer Reviewed (Refereed/Juried) Open Access International e-Journal - Included in the International Serial Directories
http://ijrcm.org.in/
48
Toyota Motor Corporation
• Korea Hyundai Kia Motor Corporation
• China Cherry Automobiles Company Shanghai Automobiles
Total number of respondents were around 96 from all the 9 companies listed above. All the 15 questions from the pre-defined questionnaire were discussed in detail with the respondents on a face-to-face interview mode. All the additional details needed were collected post interview from the respondents. 2.1. INTERVIEW SURVEY QUESTIONNAIRE The questionnaire used during the interview consisted of the following questions: 1. Do you feel that the PLM system is running in a healthy condition? 2. Are you facing any specific system performance issue? Please describe the specific issue in terms that describe who experiences the issue, what is
experienced, and when and where it happens. 3. What are the possible root causes of the performance issue? a. Insufficient RAM b. Insufficient CPU capacity c. Improper deployment architecture d. Parameters need tuning e. Insufficient network infrastructure connectivity (Bandwidth/Latency) f. Bug in software application g. Software version compatibility h. Improper storage and distribution architecture of PLM data i. Change in Business process needed j. Any other cause 4. Please explain the analysis done to find out the root cause of the issue. Please provide any test data that was generated while previously trying to debug
this issue. This may include data from times/locations/client types where performance was bad and times/locations/client types where performance was good. Data may include transaction times, logs, server metrics, etc.
5. Which are the most effective and contributing areas of the root cause analysis results, which result in optimizing the system performance. Please rank them in decreasing order of importance/effect.
6. What actions are initiated to resolve the performance issue? 7. Please highlight any additional planned changes/activities that you feel may improve the PLM system performance further. 8. Are there any other known constraints that may impact further optimization of PLM system performance? If there are any hardware constraints
mandated by corporate procurement policies, please explain and detail how these would impact the PLM system deployment 9. High Availability: Is this a design concern at your site? If so, how is it implemented and on which tiers is it implemented? 10. Disaster Recovery: Do you have a Disaster Recovery plan? If so, when was the last time the plan was executed / tested? 11. Do you have a “day in the life” test script which exercises the actions performed by users during a typical workday? 12. Please provide the current and historical performance metrics which you have gathered for your PLM environment. This should include the timing data for
your “day in the life” use cases from question11,Error! Reference source not found. as well as any corresponding server metrics (CPU, RAM,
I/O, Network, etc) or other supporting data gathered from the time of the tests. 13. If one has been maintained, please provide the list of configuration changes executed on the production system since the go-live date. 13. If one has been maintained, please provide the list of configuration changes executed on the production system since the go-live date. 14. If there is a service level agreement (SLA) related to PLM system performance between the user community and either your IT organization or an external
service provider, please provide the same. 15. Please provide any additional information, issues, requirements or constraints that you feel are relevant and were not covered in the previous questions.
3. SURVEY RESULTS Answers received from the respondents by the interview survey are compiled in this section. Detailed analysis of these results is presented in the next section along with specific interpretation from this research context. As per the answer to the first question of the questionnaire, only 7 respondents felt that their PLM system is running in a healthy condition. More than 90% of the interviewees (89 out of 96) felt that the PLM system is not healthy enough and there is scope for further optimization of system performance. Answering the second question of the questionnaire, administrators informed that there are many issues un-resolved and many more issues are managed by temporary work-around solutions. Answering the third and fourth question of the questionnaire, many of the respondents highlighted that they are involved with the root cause analysis of the PLM system performance issues. Following are the possible root causes of the performance issues as listed by the respondents. 1. Insufficient RAM 2. Insufficient CPU capacity 3. Improper deployment architecture 4. Software parameters need tuning 5. Insufficient network infrastructure connectivity (Bandwidth/Latency) 6. Bug in software application 7. Software version compatibility issues 8. Improper storage and distribution architecture of PLM data 9. Change in Business process needed Number of respondents who voted for specific possible root cause to be applicable to their case is listed in Table1 below. Percentage number of respondents who voted for these specific root causes is computed and shown in Table1. Graphical representation of the percentage number of respondents voted for the possible root causes for PLM performance issue is shown in Figure1 below.

VOLUME NO. 2 (2012), ISSUE NO. 12 (DECEMBER
INTERNATIONAL JOURNAL OF RESEARCH IN COMA Monthly Double-Blind Peer Reviewed (Refereed
TABLE 1: RESPONSE DETAILS
Sl. No. Possible root causes
1 Software parameters need tuning
2 Improper deployment architecture
3 Insufficient network infrastructure connectivity
4 Insufficient RAM
5 Insufficient CPU capacity
6 Improper storage and distribution architecture of PLM data
7 Bug in software application
8 Software version compatibility issues
9 Change in Business process needed
FIGURE 1: PERCENTAGE NUMBER
Answering the fifth question of the questionnaire, the respondents listed the most effective and contributing areas which will help in optimizing the PLM performance. The respondents also ranked their list with decreasing order of impact/effect such that the maximum impact areNumber of respondents who voted for specific ranking of the possible root cause is listed in Table2 below. Percentage numbethese ranking of the possible root causes is computed and shown in Table2.Graphical representation of the percentage number of respondents voted for specific ranking of the possible root causes is sh
TABLE2: RESPONSE DET
Rank No. Possible root causes
1 Software parameters need tuning
2 Improper deployment architecture
3 Bug in software application
4 Insufficient CPU capacity
5 Improper storage and distribution architecture of PLM data
6 Insufficient RAM
7 Software version compatibility issues
8 Change in Business process needed
9 Insufficient network infrastructure connectivity
0102030405060708090
100
Soft
war
e p
aram
eter
s n
eed
tu
nin
g
Imp
rop
er d
eplo
ymen
t ar
chit
ectu
re
1 2
Percentage of respondents
ECEMBER)
INTERNATIONAL JOURNAL OF RESEARCH IN COMPUTER APPLICATION Refereed/Juried) Open Access International e-Journal - Included in the International Serial Directories
http://ijrcm.org.in/
1: RESPONSE DETAILS OF INTERVIEW SURVEY ON POSSIBLE ROOT CAUSES
No. of respondents Percentage of respondents
Software parameters need tuning 89 93
Improper deployment architecture 74 77
Insufficient network infrastructure connectivity 65 68
56 58
53 55
Improper storage and distribution architecture of PLM data 48 50
Bug in software application 41 43
compatibility issues 26 27
Change in Business process needed 18 19
1: PERCENTAGE NUMBER OF RESPONDENTS VOTED FOR THE EACH ROOT CA
of the questionnaire, the respondents listed the most effective and contributing areas which will help in optimizing the PLM performance. The respondents also ranked their list with decreasing order of impact/effect such that the maximum impact areNumber of respondents who voted for specific ranking of the possible root cause is listed in Table2 below. Percentage numbethese ranking of the possible root causes is computed and shown in Table2. Graphical representation of the percentage number of respondents voted for specific ranking of the possible root causes is sh
TABLE2: RESPONSE DETAILS REGARDING IMPACT ON PERFORMANCE OPTIMIZATION
No. of respondents Percentage of Respondents for ranking by impact
83 86
76 79
69 72
65 68
architecture of PLM data 63 66
61 64
Software version compatibility issues 46 48
13 14
Insufficient network infrastructure connectivity 5 5
Insu
ffic
ien
t n
etw
ork
in
fras
tru
ctu
re c
on
nec
tivi
ty
Insu
ffic
ien
t R
AM
Insu
ffic
ien
t C
PU
cap
acit
y
Imp
rop
er s
tora
ge a
nd
d
istr
ibu
tio
n a
rch
itec
ture
of …
Bu
g in
so
ftw
are
app
licat
ion
Soft
war
e ve
rsio
n c
om
pat
ibili
ty
issu
es
3 4 5 6 7 8
Percentage of respondents
ISSN 2231-1009
PUTER APPLICATION & MANAGEMENT Included in the International Serial Directories
49
SES
Percentage of respondents
FOR THE EACH ROOT CAUSE
of the questionnaire, the respondents listed the most effective and contributing areas which will help in optimizing the PLM system
performance. The respondents also ranked their list with decreasing order of impact/effect such that the maximum impact area to be rank number 1. Number of respondents who voted for specific ranking of the possible root cause is listed in Table2 below. Percentage number of respondents who voted for
Graphical representation of the percentage number of respondents voted for specific ranking of the possible root causes is shown in Figure2 below.
IMIZATION
Percentage of Respondents for ranking by impact
Ch
ange
in B
usi
nes
s p
roce
ss
nee
ded
9

VOLUME NO. 2 (2012), ISSUE NO. 12 (DECEMBER
INTERNATIONAL JOURNAL OF RESEARCH IN COMA Monthly Double-Blind Peer Reviewed (Refereed
FIGURE 2: PERCENTAGE NUMBER
Answering the eighth question of the questionnaire, most of the respondents highlighted that there are network infrastructure constraints for remote sites.This is due to the fact that inter-continental network improvement isprovider adapts to a new improved networking technology. Hence PLM system deployment team has to mitigate the network issuedeployment architecture and software application architecture.
4. ANALYSIS AND INTERPRETATION OF INTERVFigure3 below gives the summary of the major potential areasfor PLM system performance issues.
0
10
20
30
40
50
60
70
80
90So
ftw
are
par
amet
ers
nee
d t
un
ing
Imp
rop
er d
eplo
ymen
t ar
chit
ectu
re
1 2
Percentage of Respondents for ranking by
ECEMBER)
INTERNATIONAL JOURNAL OF RESEARCH IN COMPUTER APPLICATION Refereed/Juried) Open Access International e-Journal - Included in the International Serial Directories
http://ijrcm.org.in/
2: PERCENTAGE NUMBER OF RESPONDENTS VOTED FOR THE RANK NUMBER
of the questionnaire, most of the respondents highlighted that there are network infrastructure constraints for remote sites.continental network improvement is not in the control of individual companies. This will improve only when the network
provider adapts to a new improved networking technology. Hence PLM system deployment team has to mitigate the network issueand software application architecture.
RPRETATION OF INTERVIEW SURVEY RESULTS major potential areas which greatly influence the overall PLM system performance and their possibility as root cause
Bu
g in
so
ftw
are
app
licat
ion
Insu
ffic
ien
t C
PU
cap
acit
y
Imp
rop
er s
tora
ge a
nd
dis
trib
uti
on
ar
chit
ectu
re o
f P
LM d
ata
Insu
ffic
ien
t R
AM
Soft
war
e ve
rsio
n c
om
pat
ibili
ty is
sues
Ch
ange
in B
usi
nes
s p
roce
ss n
eed
ed
3 4 5 6 7 8
Percentage of Respondents for ranking by impact
ISSN 2231-1009
PUTER APPLICATION & MANAGEMENT Included in the International Serial Directories
50
UMBER
of the questionnaire, most of the respondents highlighted that there are network infrastructure constraints for remote sites.
not in the control of individual companies. This will improve only when the network provider adapts to a new improved networking technology. Hence PLM system deployment team has to mitigate the network issue by designing proper
which greatly influence the overall PLM system performance and their possibility as root cause
Insu
ffic
ien
t n
etw
ork
infr
astr
uct
ure
co
nn
ecti
vity
9
Percentage of Respondents for ranking by

VOLUME NO. 2 (2012), ISSUE NO. 12 (DECEMBER
INTERNATIONAL JOURNAL OF RESEARCH IN COMA Monthly Double-Blind Peer Reviewed (Refereed
FIGURE By reviewing the interview survey results presented in the previous section, the root cause “area which has maximum potential in optimizing the PLM system performance. This has been voted as the possible root cause issues by more than 90% of the respondents. The number two ranked area which has high impact on system performance optimization is “the possible root cause for the current performance issues by nearly 80% of the respondents. The spedata distribution namely, “Improper storage and distribution architecture of PLM dataselected this as one of the possible root causes for their current performance issues.Two sub-areas in the Hardware Infrastructure sizingperformance issues. “Insufficient CPU capacity” is ranked fourth and performance. “Bug in software application” is ranked third based on its potential in achieving optimized system performance. Around 40% of the respondents voted thias a possible root cause for their current performance issues. “Software Version compatibility issues” is ranked seventh on its potential in achieving optimized system performance and only around 25% of the respondents voted this area as a possible root cause for their current performance issues. “Insufficient Network Infrastructure” area has been listed as possible root cause by nearly 70% of the respondents. But its impact on optimization of performance has been ranked the lowest. This is due to thecontrol of the auto companies. Network will improve only when the network provider adapts to a new improved networking techndeployment team has to mitigate the network issue by designing “Change in Business needed” has been ranked very low and less than 15% of the respondents voted this as the possible root cause. the necessary business process changes are already taken care of by the PLM implementation team during the “Business Process
5. CONCLUSIONS FROM THE SURVEY Based on the interview discussions based survey results analysis and interpretation; optimizing the product design IT system industry, need to deal with optimization of the following
• Hardware infrastructure Sizing – Maximize the usage of available hardware. Most important factors while sizing the hardware infrastructure are:
0
10
20
30
40
50
60
70
80
90
100
ECEMBER)
INTERNATIONAL JOURNAL OF RESEARCH IN COMPUTER APPLICATION Refereed/Juried) Open Access International e-Journal - Included in the International Serial Directories
http://ijrcm.org.in/
FIGURE 3: SUMMARY OF THE MAJOR POTENTIAL AREAS
By reviewing the interview survey results presented in the previous section, the root cause “Software Parameters need Tuningarea which has maximum potential in optimizing the PLM system performance. This has been voted as the possible root cause
The number two ranked area which has high impact on system performance optimization is “Improper Deployment Architecturethe possible root cause for the current performance issues by nearly 80% of the respondents. The specific sub-area of the deployment architecture related to
Improper storage and distribution architecture of PLM data” is ranked as number five. Around 50% of the respondents have for their current performance issues.
sizing area are listed by more than 55% of the respondents as possible root causes for the PLM system ” is ranked fourth and “Insufficient RAM” is ranked as sixth on their impact on optimization of PLM system
” is ranked third based on its potential in achieving optimized system performance. Around 40% of the respondents voted thias a possible root cause for their current performance issues.
” is ranked seventh on its potential in achieving optimized system performance and only around 25% of the respondents cause for their current performance issues.
” area has been listed as possible root cause by nearly 70% of the respondents. But its impact on optimization of performance has been ranked the lowest. This is due to the fact that improving the network infrastructure is practically very difficult and is not under the control of the auto companies. Network will improve only when the network provider adapts to a new improved networking techn
ment team has to mitigate the network issue by designing proper deployment architecture and software application architecture.” has been ranked very low and less than 15% of the respondents voted this as the possible root cause.
the necessary business process changes are already taken care of by the PLM implementation team during the “Business Process
Based on the interview discussions based survey results analysis and interpretation; optimizing the product design IT system industry, need to deal with optimization of the following major potential areas which greatly influence the overall product design system performance:
Maximize the usage of available hardware. Most important factors while sizing the hardware infrastructure are:
Impact %age on optimizationPossibility %age as root cause
Impact %age on optimization
Possibility %age as root cause
ISSN 2231-1009
PUTER APPLICATION & MANAGEMENT Included in the International Serial Directories
51
Software Parameters need Tuning” is ranked as the number one area which has maximum potential in optimizing the PLM system performance. This has been voted as the possible root cause for the current performance
Improper Deployment Architecture”. This area has been voted as area of the deployment architecture related to
” is ranked as number five. Around 50% of the respondents have
area are listed by more than 55% of the respondents as possible root causes for the PLM system ” is ranked as sixth on their impact on optimization of PLM system
” is ranked third based on its potential in achieving optimized system performance. Around 40% of the respondents voted this area
” is ranked seventh on its potential in achieving optimized system performance and only around 25% of the respondents
” area has been listed as possible root cause by nearly 70% of the respondents. But its impact on optimization of fact that improving the network infrastructure is practically very difficult and is not under the
control of the auto companies. Network will improve only when the network provider adapts to a new improved networking technology. Hence PLM system and software application architecture.
” has been ranked very low and less than 15% of the respondents voted this as the possible root cause. This is due to the fact that the necessary business process changes are already taken care of by the PLM implementation team during the “Business Process Re-engineering” step.
Based on the interview discussions based survey results analysis and interpretation; optimizing the product design IT system performance within the automobile luence the overall product design system performance:
Maximize the usage of available hardware. Most important factors while sizing the hardware infrastructure are:
Impact %age on optimizationPossibility %age as root cause
Impact %age on optimization
Possibility %age as root cause
VOLUME NO. 2 (2012), ISSUE NO. 12 (DECEMBER) ISSN 2231-1009
INTERNATIONAL JOURNAL OF RESEARCH IN COMPUTER APPLICATION & MANAGEMENT A Monthly Double-Blind Peer Reviewed (Refereed/Juried) Open Access International e-Journal - Included in the International Serial Directories
http://ijrcm.org.in/
52
• It performs the intended function correctly (correctness)
• Performs it efficiently (performance)
• Does so in a cost-effective manner (Cost). A correct hardware size may not imply that it performs blazingly or is very cost-effective. It is necessary to trade-off performance or perfect correctness to save cost. Hence it calls for development of methods in sizing the hardware, where a trade-off between these three conflicting items in some logical manner is established to achieve optimized system performance.
• Deployment Architecture – Maximize the usage and architect the deployment within the constraints of network. Upgrading network infrastructure is practically very difficult and expensive. Consider end user’s distribution and define the optimal deployment architecture based on available bandwidth and latency of the network. All CAD and other File system items are required to be shared across the all sites. Actual data is stored at Datacenter SAN and is to be shared across the locations. Distributed computing is used to increase the performance of operations that can be performed in parallel, by concurrently executing multiple operations. Operations may be distributed across multiple processes on a single CPU, taking advantage of multitasking, multiple processes across multiple CPUs, or across multiple machines. As operations are executed concurrently, ensuring synchronization between processes is essential to ensure correct results. As the trend of increasing the potential for parallel execution on modern CPU architectures continues, the use of distributed systems is essential to achieve performance benefits from the available parallelism. High performance cluster computing is a well known use of distributed systems for performance improvements. Load balancing is often used to achieve further gains from a distributed system by intelligently selecting which machine to run an operation based on how busy all potential candidates are, and how well suited each machine is to the type of operation that needs to be performed.
• Software system Parameters Tuning – Application software, Database, Operating system and Web server system parameters: Configure these systems with optimal parameters setting for best performance.
• Software version compatibilities – Upgrade to latest version for best performance. Maintaining software version compatibilities is a very challenging task with the fast changing software technology field. Versions become obsolete very fast and upgrading to latest will not always justify the costs involved with the upgrade.
• Software code optimization – Reduce customization and avoid memory lock-up. Switch to more “open” technologies such as SOA (Service Oriented Architecture), Virtualized platform, Cloud computing, J2EE, etc. Software code optimization is not in the control of auto companies. With multiple software applications deployed in the PLM system, it is very difficult to optimize and coordinate with individual software suppliers
6. REFERENCES 1. Börje Lindh - Sun Microsystems AB, Sweden, “Application Performance Optimization“ Sun BluePrints™ OnLine - March 2002 2. http://www.spec.org and http://www.spec.org/cpu2006/results/ 3. M.S.Gopinatha and Dr.Vishnukant S.Chatpalli, “Implications of Globalization on product design IT systems in Automobile Industry” PDMA India IV annual
International conference, NPDC 09 “New Product Development: Challenges in meltdown times”, Department of Mechanical Engineering and Department of Management studies, IIT, Chennai, India, pp. 94-101, 17-19th Dec 2009 (www.npdc.iitm.ac.in).
4. Michael Greaves, Product Lifecycle Management: Driving the Next Generation of Lean Thinking, NewYork, McGraw-Hill, (2006). 5. Stephen Ciullo, HP Senior Technical Consultant and Doug Grumann, HP Performance Technology Center R&D Lead Engineer, HP-UX Performance Cookbook
- revision 10JUN08.

VOLUME NO. 2 (2012), ISSUE NO. 12 (DECEMBER) ISSN 2231-1009
INTERNATIONAL JOURNAL OF RESEARCH IN COMPUTER APPLICATION & MANAGEMENT A Monthly Double-Blind Peer Reviewed (Refereed/Juried) Open Access International e-Journal - Included in the International Serial Directories
http://ijrcm.org.in/
53
A STUDY ON QUALITY WORK LIFE WITH REFERENCE TO ENGINEERING COLLEGES AT BANGALORE
SUNIL RASHINKAR
RESEARCH SCHOLAR, TUMKUR UNIVERSITY; &
ASST. PROFESSOR
DEPARTMENT OF MANAGEMENT STUDIES
K.S.SCHOOL OF ENGINEERING & MANAGEMENT
BANGALORE
SRI HARI.V
RESEARCH SCHOLAR, RAYALASEEMA UNIVERSITY, KURNOOL; &
ASST. PROFESSOR
DEPARTMENT OF MANAGEMENT STUDIES
K.S.SCHOOL OF ENGINEERING & MANAGEMENT
BANGALORE
DR.SREENIVAS.D.L
DEAN
DEPARTMENT OF MANAGEMENT STUDIES
K.S.SCHOOL OF ENGINEERING & MANAGEMENT
BANGALORE
LAKSHMI NARAYANA.K
RESEARCH SCHOLAR, RAYALASEEMA UNIVERSITY, KURNOOL; &
ASST. PROFESSOR
DEPARTMENT OF MANAGEMENT STUDIES
K.S.SCHOOL OF ENGINEERING & MANAGEMENT
BANGALORE
SHAZIA KAUSAR
ASST. PROFESSOR
DEPARTMENT OF MANAGEMENT STUDIES
K.S.SCHOOL OF ENGINEERING & MANAGEMENT
BANGALORE
ABSTRACT
The Quality of work life in Engineering Colleges describes improvements which are defined as any activity which takes place at every level of an organization,
even in educational institutions like engineering colleges which seeks greater organizational effectiveness through the enhancement of human dignity and
growth. A process through which the stockholders in the organization management, unions and employees - learn how to work together better to determine for
themselves what actions, changes and improvements are desirable and workable in order to achieve the twin and simultaneous goals of an improved quality of
life at work for all members of the organization and greater effectiveness for both the company and the unions. The article discusses “A study on quality of work
life with special reference to Engineering Colleges in Bangalore”. For the present study, data was collected with the help of structured questionnaires from a total
of 12 engineering colleges in Bangalore. Participants were working either at the level of Professors or at Assistant Professor Levels. Total 200 employees were
asked to complete the questionnaires, out of which 120 returned the completed questionnaires. Thus, the response rate was 60 per cent. This approach
conducted in the article motivates people by satisfying not only their economic needs but also their social and psychological ones. To satisfy the new generation
workforce, organizations need to concentrate on job designs and organization of work. Further, today’s workforce is realizing the importance of relationships and
is trying to strike a balance between career and personal lives.
KEYWORDS Quality of work life, enhancement, Human dignity.
1) INTRODUCTION uman Resource Development techniques include performance analysis, training, career planning and development, organization change and quality circles. Quality of work life deals with various aspects of work environment, which facilitates the human resource development efficiently. Thus, quality of work life helps for development of human resources. In fact, QWL includes and motivates the employees to learn further for present and future roles.
Employees at the grass-root level experience a sense of frustration because of low level of wages, poor working conditions, unfavorable terms of employment, inhuman treatment by their conditions of employment, inter-personal conflicts, role conflicts, job pressures, lack of freedom in work, absence of challenging work etc. Certain values were attributed to work in the past. Work was worship and people had sincerity and commitment to work. But today’s employee would not believe in such values of work. He works for his salary, he works hard if the conditions of work are conducive and terms of emolument are favorable to him. Where as, norms of work will not be static it keeps changing from time-to-time.
H

VOLUME NO. 2 (2012), ISSUE NO. 12 (DECEMBER) ISSN 2231-1009
INTERNATIONAL JOURNAL OF RESEARCH IN COMPUTER APPLICATION & MANAGEMENT A Monthly Double-Blind Peer Reviewed (Refereed/Juried) Open Access International e-Journal - Included in the International Serial Directories
http://ijrcm.org.in/
54
QUALITY OF WORK LIFE MEANING The term “Quality of work life” has coined during 1970’s there is no generally acceptable definition about this term. However, some attempts were made to describe the term quality of work life which refers to the favorable or unfavorable job environment for people. QWL means different things to different people. Quality of work life improvements are defined as any activity which takes place at every level of an organization, which seeks greater organizational effectiveness through the enhancement of human dignity and growth... a process through which the stockholders in the organization management, unions and employees - learn how to work together better to determine for themselves what actions, changes and improvements are desirable and workable in order to achieve the twin and simultaneous goals of an improved quality of life at work for all members of the organization and greater effectiveness for both the company and the unions. Richard E. Walton explains quality of work life in terms of eight broad conditions of employment that constitute desirable quality of work life. He proposed the same criteria for measuring QWL. Those criteria include: 1) Adequate and Fair Compensation: There are different opinions about adequate compensation the well suited definition of fair wages is ”... the wage
which is above the minimum wage but not below the living wage.” 2) Safe and Healthy Working Conditions: Most of the organization provides safe and healthy working conditions due to humanitarian requirements and for
legal requirement. In fact, these conditions are a matter of enlightened self interest. 3) Opportunity to Use and Develop Human Capacities: QWL provide for opportunity life autonomy in work and participation in planning in order to use
human capabilities. “To the extent that the worker can excise more control over his work, and degree to which the job embraces the entire meaningful task”. but not a part of it.
4) Opportunity for Career Growth: Opportunities for promotions are limited in case of all categories of employees either due to educational barriers or due to limited opening at the higher level. QWL provide further opportunity continued growth and security by expending one’s capabilities, knowledge and qualifications.
5) Social Integration in the Work Force: Social integration in the work force establishing by creating freedom from prejudice, supporting primary work group, a sense of community and inter-personnel openness, egalitarianism and upward mobility.
6) Constitutionalism in the work Organization: QWL provides constitutional protection to the employees only to the level of desirability as it hampers workers. It happens because the management's action is challenged in every action and bureaucratic procedures need to be followed at that level. Constitutional protection is provided to employees on such matters as privacy, free speech, equity and due process.
7) Work and Quality of Life: QWL provides for the balanced relationship among work, non-work and family aspects of life. In other words family life and social life should not be strained by working hours including overtime work, work during inconvenient hours, business travel, transfers, vacations etc.
8) Social Relevance of Work: QWL is concerned about the establishment of social relevance to work in a socially beneficial manner. The workers’ self esteem would be high if his work is useful to the society and the vice versa is also true.
SPECIFIC ISSUES IN QWL Trade Union claims that they are responsible for improvement in various facilities to workers whereas management takes credit for improved salaries, benefits and facilities. However, HR manager has identified specific issues in QWL besides normal wages, salaries; fringe benefits etc. and takes lead in providing them so as to maintain higher order QWL. They are: (i) Pay and Stability of Employment: Good pay still dominates most of the other factors in employee satisfaction. Various alternative means for providing wages should be developed in view of increase in cost of living index, increase in levels and rates of income tax and profession tax. Stability to a greater extent can be provided by enhancing the facilities for human resources development. (ii) Occupational Stress: Stress is a condition of strain on one’s emotions, thought process and physical condition. Stress is determined by the nature of work, working conditions, working hours, pause in the work schedule, worker’s abilities and nature and match with the job requirement. Stress is cause due to irritability, hyper-excitation or depression, unstable behavior, fatigue, stuttering, trembling psychomatic pains, heavy smoking and drug abuse. Stress adversely affects employee’s productivity. The HR manager, in order to minimize the stress, has to identify, prevent and tackle the problem. He may arrange the treatment of the problem with the health unit of the company. (iii) Organizational Health Program: Organizational health programs aim at educating employees about health problems means of maintaining and improving of health etc. These programs cover drinking and smoking cessation, hyper-tension control, other forms of cardiovascular risk reduction, family planning etc. Effective implementation of these programs results in reduction in absenteeism, hospitalization, disability, excessive job turnover and premature death. This program should also cover relaxation, physical exercise, diet control etc. (iv) Alternative Work Schedules: Alternative work schedules including work at home, flexible working hours, staggered hours, reduced work week, part-time employment which may be introduced for the convenience and comfort of the workers as the work schedule which offers the individual the leisure time, flexible hours of work is preferred. (v) Participative Management and Control of Work: Trade unions and workers believe that workers’ participation in management and decision-making improves QWL. Workers also feel that they have control over their work, use their skills and make a real contribution to the job if they are allowed to participate in the creative and decision-making process. (vi) Recognition: Recognizing the employee as a human being rather than as a laborer increase the QWL. Participative management, awarding the rewarding systems, congratulating the employees for their achievement, job enrichment, offering prestigious designations to the jobs, providing well furnished and decent work places, offering membership in clubs or association, providing vehicles. offering vacation trips are some means to recognizing the employees. (vi)Congenial Worker-Supervisor Relations: a harmonious supervisor-worker relation gives the worker a sense of social association, belongingness, achievement of work results etc. This in turn leads to better QWL. (vii) Grievance Procedure: Workers have a sense of fair treatment when the company gives them the opportunity to ventilate their grievance and represent their case succinctly rather than settling the problems arbitrarily. (ix) Adequacy of Resources: Resources should match with stated objectives; otherwise, employees will not be able to attain the objectives. This results in employee dissatisfaction and lower QWL. (x) Seniority and Merit in Promotions: Seniority is generally taken as the basis for promotion in case of operating employees. Merit is considered as the basis for advancement for managerial people whereas seniority cum-merit is preferred for promotion of ministerial employees. The promotional policies and activities should be fair and just in order to ensure higher QWL. (xi) Employment on Permanent Basis: Employment of workers on casual, temporary, probationary basis gives them a sense of insecurity. On the other hand, employment on permanent basis gives them security and leads to higher order QWL.
2. RESEARCH DESIGN 2.1 STATEMENT OF THE PROBLEM A study on quality of work life with special reference to Engineering Colleges in Bangalore. The study pertains to quality of work life and job satisfaction. 2.2 OBJECTIVES OF THE STUDY:
• To know the quality of work life in engineering colleges in Bangalore.
• To know the job satisfaction level of the employees in the Institution.

VOLUME NO. 2 (2012), ISSUE NO. 12 (DECEMBER
INTERNATIONAL JOURNAL OF RESEARCH IN COMA Monthly Double-Blind Peer Reviewed (Refereed
2.3 PARTICIPANTS For the present study, data was collected with the help working either at the level of Professors or at Assistant Professor levels. Total 200 employees were asked to complete the qureturned the completed questionnaires. Thus, the response rate was 60 per cent. METHODOLOGY 2.4 PROCEDURE The first step, in the direction of data collection was to seek approval from the organizational heads for collecting the datrequest letter was prepared mentioning the objective of the research and with the assurance that collected data will not be dexcept this study. This letter was sent to the heads of the concerned organizationgranted, employees were contacted personally and good rapport was established with them. The participants were also informed and assured regarding the confidentiality of their responses. Following this, the questionnaires were distributed to all the subjects with important instructions. Though there was no timequestionnaires but participants were asked to complete in about 5reading the statement because usually the response that comes first in mind is regarded as the best response. Before collectiparticipants were asked to check thoroughly whether they have left any item unanswered. If they left any statement unanswered then they werthe left item with the appropriate response. After completion of this task, all of the completed response sheetsgiven thanks for their help and cooperation. 2.5 LIMITATIONS AND SCOPE FOR FUTURE RESEARCH The present research has certain limitations attached to it. The first limitation is related to the size of the sampleconsidered as large enough to generalize the findings of the study and to reach on some definite conclusions about the relatistudied. A larger sample would have been more appropriateSouth Bangalore, and it still needs to be explored whether the findings of this study can be replicated on a representative s
3. ANALYSIS & INTERPRETATIONS
TABLE 1: EMPLOYEE’S OPINIONS ON FREEDOM
Highly Satisfied
58
48%
Interpretation From the above table 48% of employees were highly satisfied on freedom in dealing the job assignment and 44% of employees were satwere dilemma in justification of their freedom of work.
TABLE 2: OPINION POLL WITH REFEREN
Highly Satisfied
53
44%
Interpretation From the above table 44% of employees were highly satisfied with getting job recognition from their superiors and 12% were neutral in their opinion and 4% in slightly satisfied and not satisfied from su
010203040506070
Highly Satisfied
Re
spo
nd
etn
s
0
50
100
Satisfied
%
ECEMBER)
INTERNATIONAL JOURNAL OF RESEARCH IN COMPUTER APPLICATION Refereed/Juried) Open Access International e-Journal - Included in the International Serial Directories
http://ijrcm.org.in/
For the present study, data was collected with the help of structured questionnaires from a total of 12 engineering colleges in Bangalore. Participants were working either at the level of Professors or at Assistant Professor levels. Total 200 employees were asked to complete the qureturned the completed questionnaires. Thus, the response rate was 60 per cent.
The first step, in the direction of data collection was to seek approval from the organizational heads for collecting the datrequest letter was prepared mentioning the objective of the research and with the assurance that collected data will not be dexcept this study. This letter was sent to the heads of the concerned organizations to seek their approval for collecting the data. After the permission was granted, employees were contacted personally and good rapport was established with them. The participants were also informed
fidentiality of their responses. Following this, the questionnaires were distributed to all the subjects with important instructions. Though there was no timequestionnaires but participants were asked to complete in about 5-6 minutes. Participants were asked to give first response that comes in their mind after reading the statement because usually the response that comes first in mind is regarded as the best response. Before collecti
ere asked to check thoroughly whether they have left any item unanswered. If they left any statement unanswered then they werthe left item with the appropriate response. After completion of this task, all of the completed response sheets were collected back and the respondents were
The present research has certain limitations attached to it. The first limitation is related to the size of the sample studied. A sample of 120 respondents is not considered as large enough to generalize the findings of the study and to reach on some definite conclusions about the relatistudied. A larger sample would have been more appropriate for such kind of studies. Secondly, the sample has been chosen from a particular institutions in South Bangalore, and it still needs to be explored whether the findings of this study can be replicated on a representative s
TABLE 1: EMPLOYEE’S OPINIONS ON FREEDOM IN DEALING WITH JOB ASSIGNMENT
Highly SatisfiedSatisfiedNeutralSlightly SatisfiedNot SatisfiedTotal
53 9 0 0 120
44% 8% 0 0 100%
Source: Primary Data
the above table 48% of employees were highly satisfied on freedom in dealing the job assignment and 44% of employees were sat
TABLE 2: OPINION POLL WITH REFERENCE TO JOB RECOGNITION & REWARDS
Highly SatisfiedSatisfiedNeutralSlightly SatisfiedNot SatisfiedTotal
43 14 5 5 120
36% 12% 4% 4% 100%
Source: Primary Data
From the above table 44% of employees were highly satisfied with getting job recognition and rewards from their superiors and 36% were satisfied with recognition from their superiors and 12% were neutral in their opinion and 4% in slightly satisfied and not satisfied from su
Highly Satisfied Satisfied Neutral Slightly Satisfied Not Satisfied
Parameters
Graph No.1:Freedom with Job Assignment
Highly Satisfied
Satisfied Neutral Slightly Satisfied
Not Satisfied
Parameters
Chart No.2: Job Recognition & Rewards
ISSN 2231-1009
PUTER APPLICATION & MANAGEMENT Included in the International Serial Directories
55
of structured questionnaires from a total of 12 engineering colleges in Bangalore. Participants were working either at the level of Professors or at Assistant Professor levels. Total 200 employees were asked to complete the questionnaires, out of which 120
The first step, in the direction of data collection was to seek approval from the organizational heads for collecting the data from their organization. For this, a request letter was prepared mentioning the objective of the research and with the assurance that collected data will not be disclosed to anyone and anywhere
s to seek their approval for collecting the data. After the permission was granted, employees were contacted personally and good rapport was established with them. The participants were also informed about the research purpose
Following this, the questionnaires were distributed to all the subjects with important instructions. Though there was no time limit for completing the utes. Participants were asked to give first response that comes in their mind after
reading the statement because usually the response that comes first in mind is regarded as the best response. Before collecting the completed questionnaires, ere asked to check thoroughly whether they have left any item unanswered. If they left any statement unanswered then they were asked to fill up
were collected back and the respondents were
studied. A sample of 120 respondents is not considered as large enough to generalize the findings of the study and to reach on some definite conclusions about the relationship between the variables
for such kind of studies. Secondly, the sample has been chosen from a particular institutions in South Bangalore, and it still needs to be explored whether the findings of this study can be replicated on a representative sample from the whole state.
IN DEALING WITH JOB ASSIGNMENT
the above table 48% of employees were highly satisfied on freedom in dealing the job assignment and 44% of employees were satisfied and remaining 8%
recognition and rewards from their superiors and 36% were satisfied with recognition from their superiors and 12% were neutral in their opinion and 4% in slightly satisfied and not satisfied from superiors recognition and rewards.
Not Satisfied

VOLUME NO. 2 (2012), ISSUE NO. 12 (DECEMBER
INTERNATIONAL JOURNAL OF RESEARCH IN COMA Monthly Double-Blind Peer Reviewed (Refereed
Highly Satisfied
43
36%
Interpretation From the above table Majority of the people were satisfied and highly satisfied in terms of their job and remaining 8% in neutral and not satisfied with their job.
TABLE 4: DEGREE OF SATISFACTION WITH
Highly Satisfied
53
44%
Interpretation From the above table 44% of employees were satisfied with superiors for getting the support and guidance fir research work anwere satisfied, 4% were neutral and slightly satisfied and 8% were not satisfied with their superior support and guidelines.
TABLE 5: DEGREE OF SATISFACTION WITH R
Highly Satisfied
53
44%
Interpretation From the above table 44% of employees were satisfied with their remuneration what they have been paid for it, 40% were satisfsatisfied and 8% were not satisfied with their remuneration paid by the organisation.
TABLE 6: DEGREE OF CLARITY IN
Highly Satisfied
19
16%
0
50
100
Highly Satisfied
Highly Satisfied
0
20
40
60
Highly Satisfied Satisfied
ECEMBER)
INTERNATIONAL JOURNAL OF RESEARCH IN COMPUTER APPLICATION Refereed/Juried) Open Access International e-Journal - Included in the International Serial Directories
http://ijrcm.org.in/
TABLE 3: DEGREE OF JOB SATISFACTION
Highly SatisfiedSatisfiedNeutralSlightly SatisfiedNot SatisfiedTotal
67 5 0 5 120
56% 4% 0 4% 100%
Source: Primary Data
From the above table Majority of the people were satisfied and highly satisfied in terms of job satisfaction. It has come 92%of employees were satisfied with their job and remaining 8% in neutral and not satisfied with their job.
DEGREE OF SATISFACTION WITH REFERENCE TO SUPPORT & GUIDANCE
Highly SatisfiedSatisfiedNeutralSlightly SatisfiedNot SatisfiedTotal
48 5 5 9 120
40% 4% 4% 8% 100%
Source: Primary Data
From the above table 44% of employees were satisfied with superiors for getting the support and guidance fir research work anwere satisfied, 4% were neutral and slightly satisfied and 8% were not satisfied with their superior support and guidelines.
TABLE 5: DEGREE OF SATISFACTION WITH REFERENCE TO MONETARY EMOLUMENTS
Highly SatisfiedSatisfiedNeutralSlightly SatisfiedNot SatisfiedTotal
48 5 5 9 120
40% 4% 4% 8% 100%
Source: Primary Data
From the above table 44% of employees were satisfied with their remuneration what they have been paid for it, 40% were satisfsatisfied and 8% were not satisfied with their remuneration paid by the organisation.
TABLE 6: DEGREE OF CLARITY IN THE INSTITUTION’S COMMUNICATION
Highly SatisfiedSatisfiedNeutralSlightly SatisfiedNot SatisfiedTotal
82 0 5 14 120
68% 0 4% 12% 100%
Satisfied Neutral Slightly Satisfied Not Satisfied
%
Parameters
Chart No.3:Job Satisfaction
Chart No.4:Support & Guidance
Highly Satisfied Satisfied Neutral Slightly Satisfied Not Satisfied
Satisfied Neutral Slightly Satisfied Not Satisfied
Parameters
Monetary Emoluments
ISSN 2231-1009
PUTER APPLICATION & MANAGEMENT Included in the International Serial Directories
56
job satisfaction. It has come 92%of employees were satisfied with
REFERENCE TO SUPPORT & GUIDANCE
From the above table 44% of employees were satisfied with superiors for getting the support and guidance fir research work and Excellency in teaching, 40% were satisfied, 4% were neutral and slightly satisfied and 8% were not satisfied with their superior support and guidelines.
EFERENCE TO MONETARY EMOLUMENTS
From the above table 44% of employees were satisfied with their remuneration what they have been paid for it, 40% were satisfied, 4% were neutral and slightly
%
% of Respondents

VOLUME NO. 2 (2012), ISSUE NO. 12 (DECEMBER
INTERNATIONAL JOURNAL OF RESEARCH IN COMA Monthly Double-Blind Peer Reviewed (Refereed
Interpretation From the above table 16% of employees were highly satisfied with the clarity of communication between the superiors and suborwere satisfied between the communication, 4% of employees were slightly satisfied and 12% not satisfied with the communication between the boss and subordinates.
TABLE 7: SATISFACTION L
Highly Satisfied
67
56%
Interpretation From the above table 56% of employees were highly satisfied towards the working condition of an organization and 24% were satcondition of an organization.
TABLE 8: SATISFACTION
Highly Satisfied
38
32%
Interpretation From the above table 80% of employees were satisfied with Information Technology accessibility in their work for updating theregarding the subjects.
0
Highly Satisfied
Neutral
Not Satisfied
Par
ame
ters
1
10
100
Highly Satisfied
%
Graph No. 7:Working Conditions
010203040506070
Highly Satisfied Satisfied
% o
f Res
pond
ents
ECEMBER)
INTERNATIONAL JOURNAL OF RESEARCH IN COMPUTER APPLICATION Refereed/Juried) Open Access International e-Journal - Included in the International Serial Directories
http://ijrcm.org.in/
Source: Primary Data
From the above table 16% of employees were highly satisfied with the clarity of communication between the superiors and subor4% of employees were slightly satisfied and 12% not satisfied with the communication between the boss and
TABLE 7: SATISFACTION LEVEL TOWARDS WORKING CONDITIONS
Highly SatisfiedSatisfiedNeutralSlightly SatisfiedNot SatisfiedTotal
29 14 5 5 120
24% 12% 4% 4% 100%
Source: Primary Data
From the above table 56% of employees were highly satisfied towards the working condition of an organization and 24% were sat
TABLE 8: SATISFACTION LEVEL TOWARDS IT ACCESSIBILITY
Highly SatisfiedSatisfiedNeutralSlightly SatisfiedNot SatisfiedTotal
58 10 5 9 120
48% 8% 4% 8% 100%
Source: Primary Data
From the above table 80% of employees were satisfied with Information Technology accessibility in their work for updating the
20 40 60 80
% of Respondents
Chart No. 6: Clarity of Communication
Satisfied Neutral Slightly Satisfied
Paratemeters
Graph No. 7:Working Conditions
Satisfied Neutral Slightly Satisfied
Parameters
Graph No.8: IT Accessibility
ISSN 2231-1009
PUTER APPLICATION & MANAGEMENT Included in the International Serial Directories
57
From the above table 16% of employees were highly satisfied with the clarity of communication between the superiors and subordinates, 68% of employees 4% of employees were slightly satisfied and 12% not satisfied with the communication between the boss and
From the above table 56% of employees were highly satisfied towards the working condition of an organization and 24% were satisfied with the working
From the above table 80% of employees were satisfied with Information Technology accessibility in their work for updating the knowledge and new information
100
Slightly Satisfied Not Satisfied
Not Satisfied
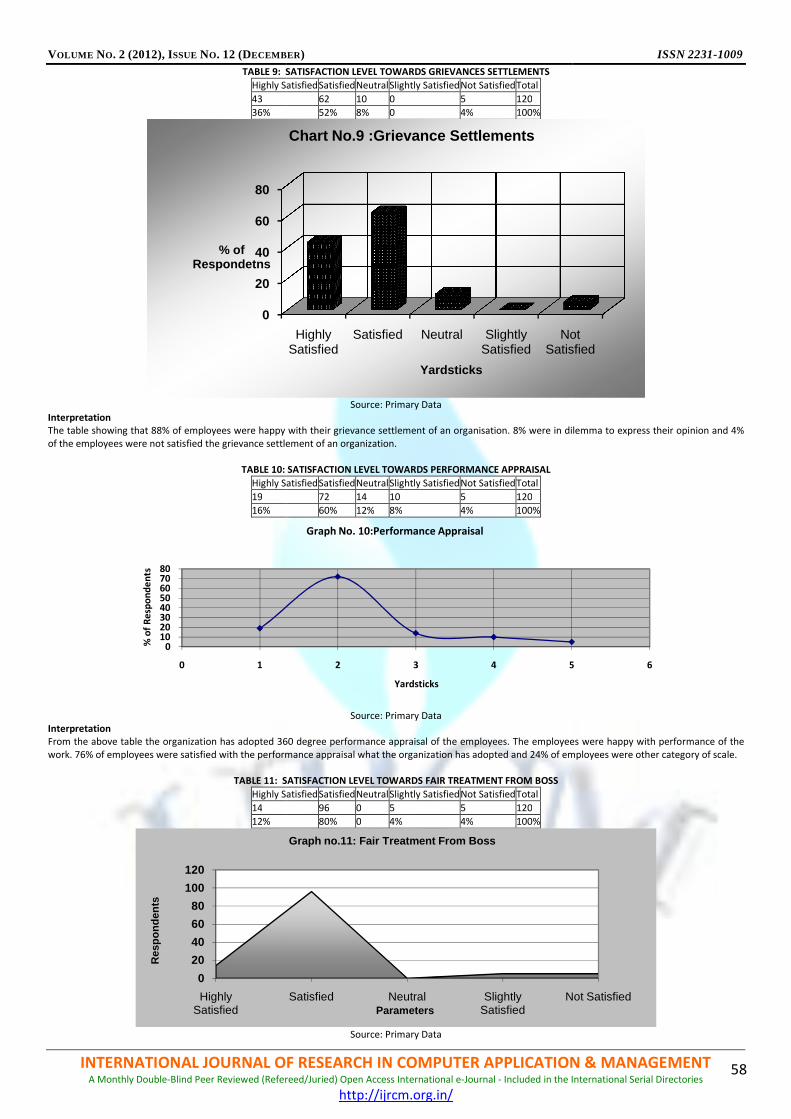
VOLUME NO. 2 (2012), ISSUE NO. 12 (DECEMBER
INTERNATIONAL JOURNAL OF RESEARCH IN COMA Monthly Double-Blind Peer Reviewed (Refereed
TABLE 9: SATISFACTION LEVEL
Highly Satisfied
43
36%
Interpretation The table showing that 88% of employees were happy with their grievance settlement of an organisation. 8% were in dilemma to of the employees were not satisfied the grievance settlement of an organization.
TABLE 10: SATISFACT
Highly Satisfied
19
16%
Interpretation From the above table the organization has adopted 360 degreework. 76% of employees were satisfied with the performance appraisal what the organization has adopted and 24% of employees w
TABLE 11: SATISFACTION LEVEL T
Highly Satisfied
14
12%
0
20
40
60
80
% of Respondetns
01020304050607080
0 1
% o
f R
esp
on
de
nts
0
20
40
60
80
100
120
Highly Satisfied
Res
pond
ents
ECEMBER)
INTERNATIONAL JOURNAL OF RESEARCH IN COMPUTER APPLICATION Refereed/Juried) Open Access International e-Journal - Included in the International Serial Directories
http://ijrcm.org.in/
TABLE 9: SATISFACTION LEVEL TOWARDS GRIEVANCES SETTLEMENTS
SatisfiedSatisfiedNeutralSlightly SatisfiedNot SatisfiedTotal
62 10 0 5 120
52% 8% 0 4% 100%
Source: Primary Data
The table showing that 88% of employees were happy with their grievance settlement of an organisation. 8% were in dilemma to of the employees were not satisfied the grievance settlement of an organization.
TABLE 10: SATISFACTION LEVEL TOWARDS PERFORMANCE APPRAISAL
Highly SatisfiedSatisfiedNeutralSlightly SatisfiedNot SatisfiedTotal
72 14 10 5 120
60% 12% 8% 4% 100%
Source: Primary Data
From the above table the organization has adopted 360 degree performance appraisal of the employees. The employees were happy with performance of the work. 76% of employees were satisfied with the performance appraisal what the organization has adopted and 24% of employees w
SATISFACTION LEVEL TOWARDS FAIR TREATMENT FROM BOSS
Highly SatisfiedSatisfiedNeutralSlightly SatisfiedNot SatisfiedTotal
96 0 5 5 120
80% 0 4% 4% 100%
Source: Primary Data
Highly Satisfied
Satisfied Neutral Slightly Satisfied
Not Satisfied
Yardsticks
Chart No.9 :Grievance Settlements
2 3 4 5
Yardsticks
Graph No. 10:Performance Appraisal
Satisfied Neutral Slightly Satisfied
Not SatisfiedParameters
Graph no.11: Fair Treatment From Boss
ISSN 2231-1009
PUTER APPLICATION & MANAGEMENT Included in the International Serial Directories
58
The table showing that 88% of employees were happy with their grievance settlement of an organisation. 8% were in dilemma to express their opinion and 4%
performance appraisal of the employees. The employees were happy with performance of the work. 76% of employees were satisfied with the performance appraisal what the organization has adopted and 24% of employees were other category of scale.
Not Satisfied
5 6
Not Satisfied
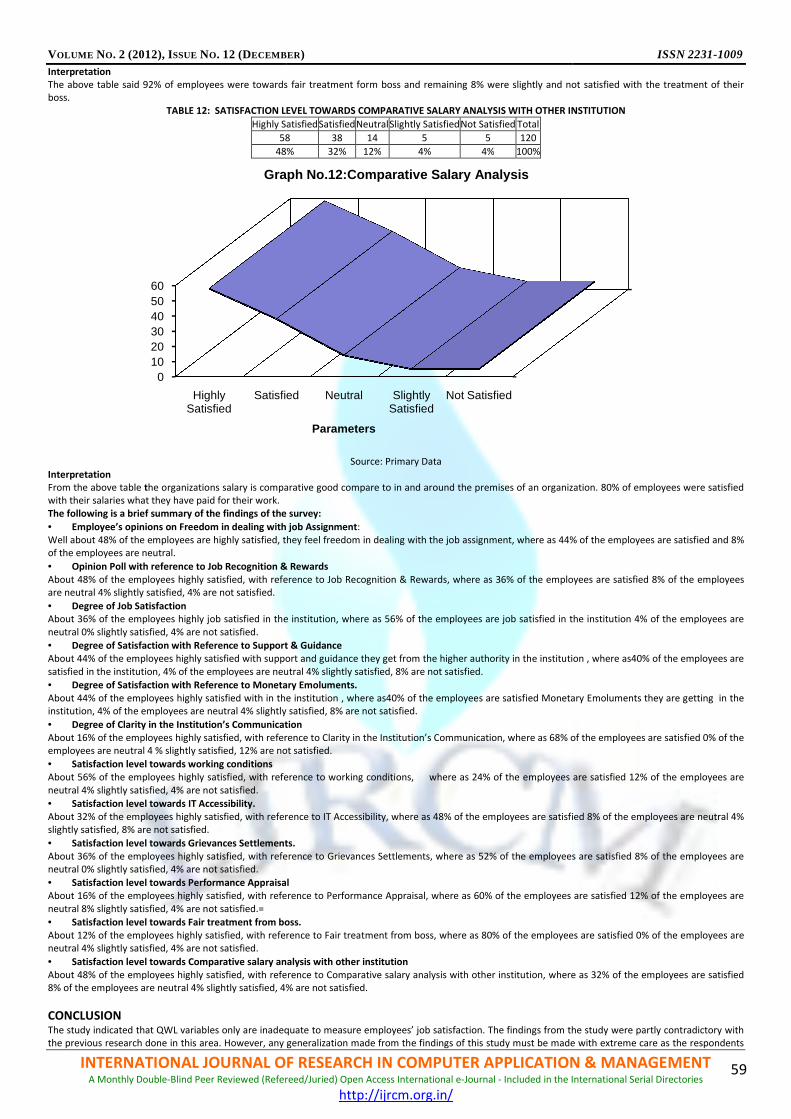
VOLUME NO. 2 (2012), ISSUE NO. 12 (DECEMBER
INTERNATIONAL JOURNAL OF RESEARCH IN COMA Monthly Double-Blind Peer Reviewed (Refereed
Interpretation The above table said 92% of employees were towards boss.
TABLE 12: SATISFACTION LEVEL TOWARDS COMPARATIVE SALARY
Highly Satisfied
58
48%
Interpretation From the above table the organizations salary is comparative good compare to in and around the premises of an organization. 80% of employees were swith their salaries what they have paid for their work. The following is a brief summary of the findings of the survey:
• Employee’s opinions on Freedom in dealing with job AssignmentWell about 48% of the employees are highly satisfied, they feel freedom iof the employees are neutral.
• Opinion Poll with reference to Job Recognition & RewardsAbout 48% of the employees highly satisfied, with reference to Job Recognition & Rare neutral 4% slightly satisfied, 4% are not satisfied.
• Degree of Job Satisfaction About 36% of the employees highly job satisfied in the institution, where as 56% of the employees arneutral 0% slightly satisfied, 4% are not satisfied.
• Degree of Satisfaction with Reference to Support & GuidanceAbout 44% of the employees highly satisfied with support and guidance they get from satisfied in the institution, 4% of the employees are neutral 4% slightly satisfied, 8% are not satisfied.
• Degree of Satisfaction with Reference to Monetary Emoluments.About 44% of the employees highly satisfied with in the institution , where as40% of the employees are satisfied Monetary Emoluments they institution, 4% of the employees are neutral 4% slightly satisfied, 8% are not satisfied.
• Degree of Clarity in the Institution’s CommunicationAbout 16% of the employees highly satisfied, with reference toemployees are neutral 4 % slightly satisfied, 12% are not sati
• Satisfaction level towards working conditions About 56% of the employees highly satisfied, with reference toneutral 4% slightly satisfied, 4% are not satisfied.
• Satisfaction level towards IT Accessibility. About 32% of the employees highly satisfied, with reference to IT Accessibility, where as 48% of the employees are satisfied slightly satisfied, 8% are not satisfied.
• Satisfaction level towards Grievances Settlements.About 36% of the employees highly satisfied, with reference to Grievances Settlements, where as 52% of the employees are satineutral 0% slightly satisfied, 4% are not satisfied.
• Satisfaction level towards Performance AppraisalAbout 16% of the employees highly satisfied, with reference to Performance Appraisal, where as 60% of the employees are satisneutral 8% slightly satisfied, 4% are not satisfied.=
• Satisfaction level towards Fair treatment from boss.About 12% of the employees highly satisfied, with reference to Fair treatment from boss, where as 80% of the employees are saneutral 4% slightly satisfied, 4% are not satisfied.
• Satisfaction level towards Comparative salary analysis with other institutionAbout 48% of the employees highly satisfied, with reference to Comparative salary analysis with other institution, where as 38% of the employees are neutral 4% slightly satisfied, 4% are not satisfied.
CONCLUSION The study indicated that QWL variables only are inadequate to measure employees’ job satisfaction. The findings from the studthe previous research done in this area. However, any generalization made from the findings of this study must be made with extreme care as th
0102030405060
Highly Satisfied
Satisfied
Graph No.12:Comparative Salary Analysis
ECEMBER)
INTERNATIONAL JOURNAL OF RESEARCH IN COMPUTER APPLICATION Refereed/Juried) Open Access International e-Journal - Included in the International Serial Directories
http://ijrcm.org.in/
The above table said 92% of employees were towards fair treatment form boss and remaining 8% were slightly and not satisfied with the treatment of their
TABLE 12: SATISFACTION LEVEL TOWARDS COMPARATIVE SALARY ANALYSIS WITH OTHER INSTITUTION
Highly SatisfiedSatisfiedNeutralSlightly SatisfiedNot Satisfied Total
58 38 14 5 5 120
48% 32% 12% 4% 4% 100%
Source: Primary Data
he organizations salary is comparative good compare to in and around the premises of an organization. 80% of employees were s
The following is a brief summary of the findings of the survey:
Employee’s opinions on Freedom in dealing with job Assignment: Well about 48% of the employees are highly satisfied, they feel freedom in dealing with the job assignment, where as 44% of the employees are satisfied and 8%
Opinion Poll with reference to Job Recognition & Rewards About 48% of the employees highly satisfied, with reference to Job Recognition & Rewards, where as 36% of the employees are satisfied 8% of the employees
About 36% of the employees highly job satisfied in the institution, where as 56% of the employees are job satisfied in the institution 4% of the employees are
Degree of Satisfaction with Reference to Support & Guidance About 44% of the employees highly satisfied with support and guidance they get from the higher authority in the institution , where as40% of the employees are satisfied in the institution, 4% of the employees are neutral 4% slightly satisfied, 8% are not satisfied.
Degree of Satisfaction with Reference to Monetary Emoluments. the employees highly satisfied with in the institution , where as40% of the employees are satisfied Monetary Emoluments they
institution, 4% of the employees are neutral 4% slightly satisfied, 8% are not satisfied.
the Institution’s Communication About 16% of the employees highly satisfied, with reference to Clarity in the Institution’s Communication, where as 68% of the employees are satisfied 0% of the employees are neutral 4 % slightly satisfied, 12% are not satisfied.
About 56% of the employees highly satisfied, with reference to working conditions, where as 24% of the employees are satisfied 12% of the employees are
About 32% of the employees highly satisfied, with reference to IT Accessibility, where as 48% of the employees are satisfied
isfaction level towards Grievances Settlements. About 36% of the employees highly satisfied, with reference to Grievances Settlements, where as 52% of the employees are sati
Satisfaction level towards Performance Appraisal About 16% of the employees highly satisfied, with reference to Performance Appraisal, where as 60% of the employees are satis
Satisfaction level towards Fair treatment from boss. About 12% of the employees highly satisfied, with reference to Fair treatment from boss, where as 80% of the employees are sa
Satisfaction level towards Comparative salary analysis with other institution About 48% of the employees highly satisfied, with reference to Comparative salary analysis with other institution, where as 3
e employees are neutral 4% slightly satisfied, 4% are not satisfied.
The study indicated that QWL variables only are inadequate to measure employees’ job satisfaction. The findings from the studarch done in this area. However, any generalization made from the findings of this study must be made with extreme care as th
Satisfied Neutral Slightly Satisfied
Not Satisfied
Parameters
Graph No.12:Comparative Salary Analysis
ISSN 2231-1009
PUTER APPLICATION & MANAGEMENT Included in the International Serial Directories
59
fair treatment form boss and remaining 8% were slightly and not satisfied with the treatment of their
ANALYSIS WITH OTHER INSTITUTION
he organizations salary is comparative good compare to in and around the premises of an organization. 80% of employees were satisfied
n dealing with the job assignment, where as 44% of the employees are satisfied and 8%
ewards, where as 36% of the employees are satisfied 8% of the employees
e job satisfied in the institution 4% of the employees are
the higher authority in the institution , where as40% of the employees are
the employees highly satisfied with in the institution , where as40% of the employees are satisfied Monetary Emoluments they are getting in the
Clarity in the Institution’s Communication, where as 68% of the employees are satisfied 0% of the
working conditions, where as 24% of the employees are satisfied 12% of the employees are
About 32% of the employees highly satisfied, with reference to IT Accessibility, where as 48% of the employees are satisfied 8% of the employees are neutral 4%
About 36% of the employees highly satisfied, with reference to Grievances Settlements, where as 52% of the employees are satisfied 8% of the employees are
About 16% of the employees highly satisfied, with reference to Performance Appraisal, where as 60% of the employees are satisfied 12% of the employees are
About 12% of the employees highly satisfied, with reference to Fair treatment from boss, where as 80% of the employees are satisfied 0% of the employees are
About 48% of the employees highly satisfied, with reference to Comparative salary analysis with other institution, where as 32% of the employees are satisfied
The study indicated that QWL variables only are inadequate to measure employees’ job satisfaction. The findings from the study were partly contradictory with arch done in this area. However, any generalization made from the findings of this study must be made with extreme care as the respondents

VOLUME NO. 2 (2012), ISSUE NO. 12 (DECEMBER) ISSN 2231-1009
INTERNATIONAL JOURNAL OF RESEARCH IN COMPUTER APPLICATION & MANAGEMENT A Monthly Double-Blind Peer Reviewed (Refereed/Juried) Open Access International e-Journal - Included in the International Serial Directories
http://ijrcm.org.in/
60
seem to be somewhat hesitant in answering the questionnaire. Data collection for this study was done by giving out questionnaire collected through head of departments and through e-mail. We suggest that future studies in this area be made independent of the human resource or any department in the sample institution so that a fair response can be extracted. Future research on job satisfaction in the education industry should also include other dimensions of job satisfaction especially on the fundamental rewards and key performance indicators or the performance evaluation criteria used by the sample institution in evaluating their employees.
REFERENCES BOOKS 1. Aswatappa “Essentials of Human Resource Management”, Himalaya Publishing House. 2. Rao Subba P., (2007), “Personnel and HUMAN RESOURCE MANAGEMENT-Text & Cases”, Himalaya Publishing House, Mumbai, pp. 403-406. JOURNAL AND OTHER RESEARCH ARTICLES 3. Sharma Sanjeev K., and Sharma Geeta (2011), “Perceived Quality of Working Life among Employees in Banks”, International Journal of Management and
International Business Studies, Vol. 1 (2): pp. 95-107. WEBSITES 4. www.Qualitywork.com SEARCH ENGINES 5. www.google.com

VOLUME NO. 2 (2012), ISSUE NO. 12 (DECEMBER) ISSN 2231-1009
INTERNATIONAL JOURNAL OF RESEARCH IN COMPUTER APPLICATION & MANAGEMENT A Monthly Double-Blind Peer Reviewed (Refereed/Juried) Open Access International e-Journal - Included in the International Serial Directories
http://ijrcm.org.in/
61
POWER & AREA EFFICIENT ROUTER IN 2-D MESH NETWORK-ON-CHIP USING LOW POWER METHODOLOGY – GATE LEVEL POWER OPTIMIZATION
SUDHIR N. SHELKE
ASST. PROFESSOR
DEPARTMENT OF ELECTRONICS & TELECOMMUNICATION ENGINEERING
J.D. COLLEGE OF ENGINEERING
NAGPUR
PRAMOD B. PATIL
PRINCIPAL
J.D. COLLEGE OF ENGINEERING
NAGPUR
ABSTRACT
Network-on-Chip (NoC) is the interconnection platform that answers the requirements of the modern on-Chip design. Small optimizations in NoC router
architecture can show a significant improvement in the overall performance of NoC based systems. Power consumption, area overhead and the entire NoC
performance is influenced by the router buffers. Resource sharing for on-chip network is critical to reduce the chip area and power consumption.An area efficient
implementation of a routing node for a NoC is presented. Of the four components of routing node, the input block (mainly consisting of buffers) and scheduler
have been modified to save area requirements. The other two components of the routing node take up negligible area in comparison. The use of custom SRAM in
place of synthesizable flip flops in the input block has resulted in a saving of over 26% of the silicon area and power optimization is 65% when operated at 16 ns
clock. Clock gating is an important high-level technique for reducing the power consumption of a design. Clock gating reduces the clock network power
dissipation, relaxes the datapath timing, and reduces routing congestion by eliminating feedback multiplexer loops. For designs that have large multi-bit
registers, clock gating gate level can save power and reduce the number of gates in the design. In our design case, it has been further observed that the power
optimization with clock gating techniques at gate level saves 67.38%, of power while 32.62 %, 32.71 % & 30.28% silicon area has been saved.
KEYWORDS Clock Gating, Network-on-Chip, Router, SRAM, RTL.
1. INTRODUCTION ver-increasing requirements on electronic systems are one of the key factors for evolution of the integrated circuit technology. Multiprocessing is the solution to meet the requirements of upcoming applications. Multiprocessing over heterogeneous functional units require efficient on chip communication. [1] [2].
Network-on-Chip (NoC) is a general purpose on-chip communication concept that offers high throughput, which is the basic requirement to deal with complexity of modern systems, as shown in Fig 1. All links in NoC can be simultaneously used for data transmission, which provides a high level of parallelism and makes it attractive to replace the typical communication architectures like shared buses or point-to-point dedicated wires.
FIG. 1: NOC ARCHITECTURE
Apart from throughput, NoC platform is scalable and has the potential to keep up with the pace of technology advances [3]. But all these enhancements come at the expense of area and power. In the RAW multiprocessor system, interconnection network consumes 36% of the total chip power [4]. A typical NoC system consists of processing elements (PEs), network interfaces (NIs), routers and channels. The router further contains scheduler, switch and buffers. Buffers consume the 64% of the total node (router + link) leakage power for all process technologies, which makes it the largest power consumer in any NoC system. [5]. Moreover, buffers are dominant for dynamic energy consumption [6].
2. NoC ARCHITECTURE Network-on-Chip has been proposed on various topologies [7] - [10]. A simple NoC architecture consists of three components: the routing nodes, the links, and network interfaces (or network adapters in some literature), as shown in Fig. 2. Routers direct data over several links (hops). Topology defines their logical lay-out (connections) whereas floorplan defines the physical layout. The function of a network interface (adapter) is to decouple computation (the resources) from communication (the network). Routing decides the path taken from source to the destination whereas switching and flow control policies define the timing of transfers. Task scheduling refers to the order in which the application tasks are executed and task mapping defines which processing element (PE) executes certain task. IP mapping, on the other hand, defines how PEs and other resources are connected to the NoC [11].
E

VOLUME NO. 2 (2012), ISSUE NO. 12 (DECEMBER) ISSN 2231-1009
INTERNATIONAL JOURNAL OF RESEARCH IN COMPUTER APPLICATION & MANAGEMENT A Monthly Double-Blind Peer Reviewed (Refereed/Juried) Open Access International e-Journal - Included in the International Serial Directories
http://ijrcm.org.in/
62
FIG. 2: NoC OVERVIEW The major goal of communication-centric design and NoC paradigm is to achieve greater design productivity and performance by handling the increasing parallelism, manufacturing complexity, wiring problems, and reliability. The three critical challenges for NoC. are: power, area, latency, and CAD compatibility. [12].The key research areas in network-on-chip design [13] [14].are as: • Communication infrastructure: topology and link optimization, buffer sizing, floorplanning, clock domains, power. • Communication paradigm: routing, switching, flow control, quality-of-service, network interfaces • Application mapping: task mapping/scheduling and IP component mapping. All of these challenges result in area, power, and performance tradeoffs [13].Area and power can be estimated from hardware requirements. Performance is generally estimated using analytical model. This paper proposes the area and power efficient design of the router as it is the most redundant component which is equal to the no. of PEs on one kind of NoC, as shown in Fig. 2.
3. PROBLEM STATEMENT The implementation of network-on-chip presents certain challenges. Two of the most critical design metrics for networks-on-chip are area requirements and power consumption. Due to the fact that die area per wafer of silicon is limited, the NoC implementation should be carried out using an approach that minimizes area requirement. Also due to likelihood of most SoCs being implemented in battery powered devices, power consumption of the NoC should also be as low as possible. Usually, reduction in area results in a saving in power requirements due to the fact a smaller area is achieved using fewer components on-chip. Fewer components on-chip will consumeless power compared to architecture requiring more components on-chip. Standard-cell based ASIC design methodology is the fastest approach available in the design of complex digital circuits. However, the performance of digital systems can be enhanced by making use of custom IP cores to replace some of the standard-cell components. This performance enhancement comes at the price of increased design time and effort, but is preferred for maximizing performance.
4. DESIGN AND IMPLEMENTATION OF PROPOSED TASK Given an existing implementation of a routing node for on-chip networks, it is the goal of this work to present a modified implementation of the routing node to minimize the area requirements and as a result lower the power requirement. The routing node consists of four basic components: the input ports, the output ports, the crossbar switch, and the scheduler. The components arranged in decreasing order of size are the input blocks, the scheduler, the output blocks, and the crossbar switch as shown in Fig 3.
FIG. 3: ROUTER COMPONENTS
The primary function of the input block is to store incoming packets before they can be routed to their respective output ports. Hence, the majority of the area of the input blocks is used by memory elements. The existing design employs DFF (D flip-flop) elements for memory storage. The modified input block will be based on SRAM memory cells. SRAM memory cells provide the fastest and most compact means of on-chip storage. DRAM is much more compact but suffers in terms of speed due to the constant refresh signals required to maintain memory content. In high performance CPU architectures, memory is implemented as on-chip SRAM to achieve the best possible performance. The function of the scheduler is to arbitrate between conflicting requests for access to the crossbar switch shared medium. The existing scheduler architecture is based on a symmetric implementation of round-robin like algorithm requiring one set of grant arbiters and one set of accept arbiters to perform arbitration. The modified design uses the concept of folding to reduce the area of the scheduler by removing one set of arbiters and using the remaining set of arbiters to perform both grant and accept arbitration in a time multiplexed fashion. The design of the modified routing node is implemented using standard cell based VLSI flow with provision for custom IP core inclusion. The Synopsis tool chain is used to implement the design from RTL coding to synthesis and place and route. Design verification is carried out using hierarchical functional simulation at each level of the design flow. Also, static timing analysis is used to verify timing closure in the final design layout. Area and power are two important parameters which need to be optimized for better NoC performance. The NoC consists of three basic components which are the routing node, the routing links, and network interfaces. Optimization of the routing nodes will lead to improvement in the area and the power requirements of the NoC, as it is the most redundant component which lies in association with every processing element in SOC. Thus, the aim of this work is to present a modified architecture of the routing node to achieve higher area and power efficiency using changes at the RTL architecture level and use of custom IP to boost the performance of standard-cell based ASIC design.
5. THE PROPOSED ROUTER ARCHITECTURE The routing node configuration shown in Fig.4 is 4x4. It is based on a 2D mesh NoC topology where each routing node is connected to four other routing nodes. The NOC infrastructure includes components responsible for packetization, transmission, and de-packetization of data. These components, respectively, are the

VOLUME NO. 2 (2012), ISSUE NO. 12 (DECEMBER) ISSN 2231-1009
INTERNATIONAL JOURNAL OF RESEARCH IN COMPUTER APPLICATION & MANAGEMENT A Monthly Double-Blind Peer Reviewed (Refereed/Juried) Open Access International e-Journal - Included in the International Serial Directories
http://ijrcm.org.in/
63
NI, the VC router, and the links. These components are repeated for every grid element in NOC. So, if we consider a NOC with 3×3 mesh network, then it will have nine sets of components of NI, VC router and links. It can be clearly seen that these components will occupy a significant amount of silicon space on the chip and therefore the cost and the power consumption of the chip would increase. However, it must be noted that serial packet-based communication will still remain an optimum solution as compared to a bus-based system in terms of the power consumption and will reduce the cost of system design in the longer run due to the potential for reuse.
FIG. 4: 4x4 ROUTING NODE
6. AREA OF FOCUS The design of the proposed router has been carried out as follows]: 6.1 PROPOSED SWITCHING TECHNIQUE
FIG. 5: SWITCHING TECHNIQUES
Switching techniques can be classified based on network characteristics. Circuit switched networks reserve a physical path before transmitting the data packets, while packet switched networks transmit the packets without reserving the entire path. Packet switched networks can further be classified as Wormhole, Store and Forward (S&F), and Virtual Cut through Switching (VCT) networks as shown in Fig. 5. In Wormhole switching networks, only the header flit experiences latency. Other flits belonging to the same packet simply follow the path taken by the header flit. If the header flit is blocked then the entire packet is blocked. It does not require any buffering of the packet. Therefore, the size of the chip drastically reduces. However, the major drawback of this switching technique is a higher latency. Thus, it is not a suitable switching technique for real-time data transfers. S&F switching forwards a packet only when there is enough space available in the receiving buffer to hold the entire packet. Thus, there is no need for dividing a packet into flits. This reduces the overhead, as it does not require circuits such as a flit builder, a flit decoder, a flit stripper and a flit sequencer. Store and forward is the easiest policy in terms of implementation complexity. So this implementation is based on store and forward switching. 6.2. PROPOSED FLOW CONTROL MECHANISM Flow control determines how network resources, such as channel bandwidth, buffer capacity, and control state, are allocated to a packet traversing the network. The flow control may be buffered or buffer less as shown in Fig.6. The Buffer less Flow Control has more latency and fewer throughputs than the Buffered Flow Control. The Buffered Flow Control can be classified further as:
FIG. 6: FLOW CONTROL TECHNIQUES
In Credit Based Flow Control, an upstream node keeps count of data transfers, and thus the available free slots are termed as credits. Once the transmitted data packet is either consumed or further transmitted, a credit is sent back and used [15] [16]. In Handshaking Signal Based Flow Control, a VALID signal is sent whenever a sender transmits any flit. The receiver acknowledges by asserting a VALID signal after consuming the data flit and used in SoCIN NOC implementation [17]. To minimize the chances of dropped packets at the receiving end, the credit based flow control mechanism has been incorporated wherein only those output IP blocks take part in the scheduling that has some credit. In addition to this, every input block maintains packet array and the linked list array to maintain the proper flow so as to avoid the out of order delivery. 6.3. PROPOSED BUFFER IMPLEMENTATION IN THE DESIGN OF ROUTER A higher buffer capacity and a larger number of virtual channels in the buffer will reduce network contention, thereby reducing latency. However, buffers are area hungry, and their use needs to be carefully directed [18] [19] therefore proposed a simple implementation of a buffer architecture for NOC buffers using 0.18 μm technology to estimate the cost and area of buffers needed for NOC. Also proposed the trade-off between buffer size and channel bandwidth to secure constant latency and concluded that increasing the channel bandwidth is preferable to reducing the latency in NOC. The input block consists of six major components: the packet array, the linked list array, the destination head array, the destination tail array, the free-list FIFO, and a shift register. Four of these six components are conventional memory elements. In a standard cell based design, memory elements are realized using D flip flops in the standard SYNOPSYS Library. If we consider a NAND gate implementation of a D flip flop with no RESET or SET inputs it requires 28 MOS transistors to realize one D flip flop [20]. A more area efficient implementation of memory is through the use of SRAM cells. Each SRAM cell is implemented using 6 transistors. Therefore, memory realization using SRAM is more efficient compared to D flip flops. However, standard cell based approach to ASIC design does provide SRAM standard cells because of the many possible configurations of width and depth. SRAM design is carried out using full custom approach to ASIC design as shown in Fig. 7. By combining standard cell based and full custom ASIC design, D flip flops can be replaced by SRAM, improving the area efficiency

VOLUME NO. 2 (2012), ISSUE NO. 12 (DECEMBER) ISSN 2231-1009
INTERNATIONAL JOURNAL OF RESEARCH IN COMPUTER APPLICATION & MANAGEMENT A Monthly Double-Blind Peer Reviewed (Refereed/Juried) Open Access International e-Journal - Included in the International Serial Directories
http://ijrcm.org.in/
64
of the input block. Full custom design of SRAMs has been carried out by MILKYWAY of SYNOPSY, while physical implementation of the input module with SRAMs has been carried out by IC Compiler of SYNOPSY.
FIG. 7: INPUT MODULE WITH SRAM BASED ARRAYS
6.4. PROPOSED SCHEDULER IN THE DESIGN The scheduler was modified using a folding approach due to the regular structure and placement of the arbiters. The modified scheduler is as shown in Fig, 8. Each arbiter in the modified scheduler now has to generate both grant and accept signals in a time multiplexed fashion. The arbiter is modified to hold both grant and accept pointers for successive time slots. The proposed scheduler belongs to a Router in 2D Mesh NOC design. So here the value of N is 4.
FIG. 8: MODIFIED SCHEDULER
7. INTRODUCTION TO CLOCK GATING Clock gating [21] - [24] applies to synchronous load-enable registers, which are groups of flip-flops that share the same clock and synchronous control signals and that are inferred from the same HDL variable. Synchronous control signals include synchronous load-enable, synchronous set, synchronous reset, and synchronous toggle. The registers are implemented by Design Compiler by use of feedback loops. However, these registers maintain the same logic value through multiple cycles and unnecessarily use power. Clock gating saves power by eliminating the unnecessary activity associated with reloading register banks. Designs that benefit most from clock gating are those with low-throughput data paths. Designs that benefit less from RTL clock gating include designs with finite state machines or designs with throughput-of-one data paths. Power Compiler allows performing clock gating with the following techniques [21]: 1. RTL-based clock gate insertion on unmapped registers. Clock gating occurs when the register bank size meets certain minimum width constraints. 2. Gate-level clock gate insertion on both unmapped and previously mapped registers. In this case, clock gating is also applied to objects such as IP cores that are already mapped. 3. Power-driven gate-level clock gate insertion, which allows for further power optimizations because all aspects of power savings, such as switching activity and the flip-flop types to which the registers are mapped, are considered. Without clock gating, Design Compiler implements register banks by using a feedback loop and a multiplexer. When such registers maintain the same value through multiple cycles, they use power unnecessarily.
FIG. 9: SHOWS A SIMPLE REGISTER BANK IMPLEMENTATION USING A MULTIPLEXER AND A FEEDBACK LOOP
Fig 9: Synchronous Load-Enable Register With Multiplexer. The multiplexer also consumes power. Clock gating eliminates the feedback net and multiplexer shown in Fig.9 by inserting a 2-input gate in the clock net of the register. Clock gating can insert inverters or buffers to satisfy timing or clock waveform polarity requirements. The 2-input clock gate selectively prevents clock edges, thus preventing the gated-clock signal from clocking the gated register. Fig. 10 shows a latch-based clock-gating style using a 2-input AND gate, however, depending on the type of register and the gating style, gating can use NAND, OR, and NOR gates instead.
FIG. 10: LATCH-BASED CLOCK GATING

VOLUME NO. 2 (2012), ISSUE NO. 12 (DECEMBER
INTERNATIONAL JOURNAL OF RESEARCH IN COMA Monthly Double-Blind Peer Reviewed (Refereed
Clock gating reduces the clock network power dissipation, relaxes the datapath timing, and reduces routing congestion by eliminating feedback multiplexer loops. For designs that have large multi-bit registers, clock gating can save power and reduce the number of gates in the design. However, for smabanks, the overhead of adding logic to the clock tree might not compare favorably to the power saved by eliminating a few fee
TABLE 1: COMPARATIVE
Network Topology Flit Size in bits
Teraflops Mesh 32
Xpipes Custom 32
Dally Torus 256
HIBI Bus 32
Octagon Ext. Ring 32
SPIN Fat- T 16
Aethereal Mesh 96
ANoC Mesh 32
Mango Mesh 32
Hermes Mesh 32
SoCBus Custom 16
ASoC Mesh 32
Avg. 50.1
Present Work Mesh 32
Legends used in above Table:-, Buf.-Buffer, Tech-Technology, LPresent.
8. EXPERIMENTAL RESULTS 1: PHYSICAL IMPL8.1.4x4 Routing Nodes D Flip Flop (DFF) _Physical implementation:
8.2.4x4 Routing Node (SRAM)_Physical implementation
TABLE 2: COMPARISONS SHOWING RESULT OF AR
Post Synthesis DFF based
Area 202704 sq um
Power 10.7 mW
TABLE 3: COMPARISONS SHOWING RESULTS OF A
Post Layout DFF based
Area 205298 sq um
Power 14.29 mW
ECEMBER)
INTERNATIONAL JOURNAL OF RESEARCH IN COMPUTER APPLICATION Refereed/Juried) Open Access International e-Journal - Included in the International Serial Directories
http://ijrcm.org.in/
dissipation, relaxes the datapath timing, and reduces routing congestion by eliminating feedback multiplexer bit registers, clock gating can save power and reduce the number of gates in the design. However, for sma
banks, the overhead of adding logic to the clock tree might not compare favorably to the power saved by eliminating a few fee
TABLE 1: COMPARATIVE RESULTS OF PROPOSED ROUTER WITH EXISTING ROUTER DESIGN
Flit Size in bits Ports Buf Size in flits Tech in nm L in Clk A in
4 16 65 5 0.34
4 -- 100 7 --
5 4 100 3 --
2 2,8 130 4 0.03
4 2,8 130 4 0.04
8 8 130 0.24
5 8 120 0.26
130 0.25
5 1 0.19
5 2,8 130 10 0.05
3 1 180
4 2 180 0.04
4.8 6.4 170 5.2 0.14
4 8 90 4 0.15
Technology, L-Latency, A-Area, F-Frequency, Ext-Extended, R-Ring, , T
LTS 1: PHYSICAL IMPLEMENTATION 8.1.4x4 Routing Nodes D Flip Flop (DFF) _Physical implementation:
8.2.4x4 Routing Node (SRAM)_Physical implementation
SHOWING RESULT OF AREA, POWER OF 4X4 ROUTING NODE AT POST SYNTHESIS
DFF based SRAM based % Reduction in SRAM based Method
202704 sq um 150314 sq um 25.85%
10.7 mW 3.9 mW 63.55%
SHOWING RESULTS OF AREA, POWER OF 4X4 ROUTING NODE AT POST LAYOUT
DFF based SRAM based % Reduction in SRAM based Method
205298 sq um 150756 sq um 26.567%
14.29 mW 4.98 mW 65.15%
ISSN 2231-1009
PUTER APPLICATION & MANAGEMENT Included in the International Serial Directories
65
dissipation, relaxes the datapath timing, and reduces routing congestion by eliminating feedback multiplexer bit registers, clock gating can save power and reduce the number of gates in the design. However, for smaller register
banks, the overhead of adding logic to the clock tree might not compare favorably to the power saved by eliminating a few feedback nets and multiplexers.
UTER DESIGN
A in Sq.mm F in MHz
0.34 4270
--
200 - 2000
0.03 -0.05 435
0.04 - 0.09 435
0.24 200
0.26 500
0.25 500
0.19 795
0.05-0.11 435
0.04-0.08 400
0.14-0.22 328-596
0.15 500
Ring, , T-Tree Cus- Custom, Avg-Average,Pre-
SYNTHESIS # Clock Period: 16ns.
% Reduction in SRAM based Method
POST LAYOUT # Clock Period: 16ns.
% Reduction in SRAM based Method

VOLUME NO. 2 (2012), ISSUE NO. 12 (DECEMBER
INTERNATIONAL JOURNAL OF RESEARCH IN COMA Monthly Double-Blind Peer Reviewed (Refereed
FIG. 11: COMPARISON OF DF
FIG. 12: COMPARISON OF DF
9. INSERTION OF CLOCK GATING TECHNIQUES9.1. INSERTING CLOCK GATES IN GATE-LEVEL DESIGN
To insert clock gating logic in gate-level netlist and to re1. Read the gate-level netlist. 2. Use the compile_ultra -gate_clock command to compile your design.To apply this method, the compiler executes the following tcl commands:# Optional setting
read_ddc interconnect.ddc
compile_ultra -incremental -gate_clock -scan
insert_dft
report_clock_gating
report_power
10. EXPERIMENTAL RESULTS 2: USING CLOCK GATING TE10.1 POWER ANALYSIS AT GATE LEVEL
10.2. COMPARISONS CHART SHOWING RESULT OF ARE# Clock Period: 16 ns
FIG. 13: COMPARISON OF DF
ECEMBER)
INTERNATIONAL JOURNAL OF RESEARCH IN COMPUTER APPLICATION Refereed/Juried) Open Access International e-Journal - Included in the International Serial Directories
http://ijrcm.org.in/
11: COMPARISON OF DFF & SRAM BASED DESIGNS AT POST SYNTHESIS
12: COMPARISON OF DFF & SRAM BASED DESIGNS AT POST LAYOUT
K GATING TECHNIQUES
level netlist and to re-synthesize the design with the clock gating logic at Gate Level Netlist:
gate_clock command to compile your design. To apply this method, the compiler executes the following tcl commands:
SING CLOCK GATING TECHNIQUES
F AREA & POWER
13: COMPARISON OF DFF & GATE LEVEL CLOCK GATING
DFF based Gate-Level C_G
Area 202704 Sq um 146254 Sq um
Power 10.7 mW 3.50 mW
ISSN 2231-1009
PUTER APPLICATION & MANAGEMENT Included in the International Serial Directories
66
the clock gating logic at Gate Level Netlist:

VOLUME NO. 2 (2012), ISSUE NO. 12 (DECEMBER) ISSN 2231-1009
INTERNATIONAL JOURNAL OF RESEARCH IN COMPUTER APPLICATION & MANAGEMENT A Monthly Double-Blind Peer Reviewed (Refereed/Juried) Open Access International e-Journal - Included in the International Serial Directories
http://ijrcm.org.in/
67
FIG. 14: COMPARISON OF DFF & GATE LEVEL CLOCK GATING
11. CONCLUSION 2D-Mesh has been an area efficient implementation of a routing node for an NOC is demonstrated. Of the four components of routing node, the input block (mainly consisting of buffers) and scheduler have been modified to save area requirements. The other two components of the routing node take up negligible area in comparison. The use of custom SRAM in place of synthesizable flip flops in the input block has resulted in a saving of over 26% of the silicon area and power optimization is 65% when operated at 16 ns clock. Clock gating is an important high-level technique for reducing the power consumption of a design. Clock gating reduces the clock network power dissipation, relaxes the datapath timing, and reduces routing congestion by eliminating feedback multiplexer loops. For designs that have large multi-bit registers, clock gating gate level can save power and reduce the number of gates in the design. In our design case, it has been further observed that the power optimization with clock gating techniques at gate level saves 67.38%, of power while 32.62 %, 32.71 % & 30.28% silicon area has been saved.
12. FUTURE SCOPE The existing design has been synthesized using MUX as a crossbar switch more Area efficient crossbar like tristate and sense amps can further make the design efficient. We foresee that Area & Power of existing design can be further optimized by Low Power Design Methodology Likes: 1. Multi VDD - Since dynamic power is proportional to VDD2 lowering VDD on selected blocks helps reduce power significantly. Unfortunately, lowering the voltage also increases the delay of the gates in the design. 2. Multi Threshold Logic- As geometries have shrunk to 130nm, 90nm, and below, using libraries with multiple VT has become a more efficient way of reducing leakage voltage.
13. REFERENCES 1. ARTISAN “A comparison of network-on-chip and busses, “white paper, (2005). 2. C. A. Zeferino and A. A. Susin, “SoCIN: A parametric and scalable network-on- chip”, Proc. 16th Symposium on Integrated Circuits and Systems Design, pp.
169-175, (2003). 3. C. Wang et al, “Area and power efficient innovative NoC Architecture” , Proc. of 18thEuroMicro International Conference, PDP 2010, Pisa, Italy, (2010). 4. E. Beigne, “An asynchronous NOC architecture is providing low latency service and its multi-level design framework”, in ASYNC, Mar., pp. 54–63. (2005) 5. E. Bolotin, A. Morgenshtein, I. Cidon, R. Ginosar, and A. Kolodny, “Automatic hardware-efficient SoC integration by QoS Network-on-Chip”, Proc. 11th
International IEEE Conference on Electronics, Circuits and Systems, pp. 479-482, (2004). 6. E. Bolotin, I. Cidon, R. Ginosar and A. Kolodny, “Cost considerations in Network on Chip Integration”, The VLSI Journal, no. 38, , pp. 19-42. (2004) 7. E. Bolotin, I. Cidon, R. Ginosar, and A. Kolodny, “QNoC: QoS architecture and design process for network on chip” , Journal of Systems Architecture, Volume
50, Issue 2-3 (Special Issue on Network on Chip), pp. 105-128, February (2004). 8. H. Zimmer, S. Zink, T. Hollstein, and M. Glesner, “Buffer-architecture exploration for routers in a hierarchical network-on-chip,” Proc. 19th IEEE International
Symposium on Parallel and Distributed Processing, pp., 1-4, April (2005). 9. J. Owens et al., “Research challenges for on-chip interconnection networks”, IEEE Micro, vol. 27, no. 5, pp. 96–108, Sep-Oct. (2007). 10. Khalid latif, Tiburiu Seceleanu & hannu Tenhunen “Power and Area Efficient Design of Network-on-Chip Router through Utilization of Ideal Buffer”. Proc.17th
IEEE International Conference and workshop on Engineering of Computer based System. (2010). 11. L. Benini and G. de Micheli, “Networks on chips: A new SoC paradigm”, IEEE Computer, vol. 35, no. 1, pp. 70–78, Jan. (2002). 12. Luca Benini and Giovanni De Micheli,” Networks on Chips, Morgan “`Kaufmann Publishers (2006). 13. Michael Keating, David Flynn, Rob Aitken, Alan Gibbons, and Kaijian Shi, “Low Power Methodology Manual: For System-on-Chip Design” Springer, (2007). 14. Michael, Keating “The Future of Low Power”, SNUG, (2007), 15. N. Banerjee, P. Vellanki and K.S. Chatha. “A Power and Performance Model for Network-on-Chip Architectures”. Proc. of the conference on Design,
automation and test in Europe (DATE), pp.1250-1255 (2004), Vol.2, 16. “Power Compiler User Guide”, SYNOPSIS Version F 2011.9, December (2011). 17. Saastamoinen, M. Alho, and J. Nurmi, “Buffer implementation for Proteome network-on-chip”, International IEEE Proceeding on Circuits and Systems, vol.
2, pp. 113-116, May (2003). 18. Sudhir N, Shelke ,Pramod B Patil “Impact of SoC Low Power Design, Power Management Techniques & Physical Challenges “International Journal of
Electrical, Electronics &Computing Technology (IJEECT), Vol1,Issue2,Jan-Apr (2011) 19. T. Bartic, “Topology adaptive network-on-chip design and implementation”, IEEE Proc. Comput. Digit Tech., vol. 152, no. 4, pp. 467–472, Jul. (2005). 20. T. Bjerregaard and J Sparose, “A router architecture for connection oriented service guarantees in the MANGO clockless network-on-chip”, in DATE, vol. 2,
p p. 1226-1231. Mar. (2005) 21. T. Bjerregaard and S. Mahadevan, “A survey of research and practices of network-on-chip, ACM Computing Surveys”, vol. 38, no. 1, p. article No. 1, Jun.
(2006). 22. W. Hangsheng, L. S. Peh, and S. Malik.” Power- driven design of router micro architectures in on-chip networks”. Proc. of the 36th Annual IEEE/ACM
International Symposium on Micro architecture (MI-CRO), pp. 105-116, (2003). 23. W. J. Dally and B. Towles, “Principles and practices of interconnection networks”, Morgan Kaufmann Publishers, (2004). 24. Xuning Chen and Li-ShiuanPeh, “Leakage power modeling and optimization of interconnection net- works.”Proc. of International Symposium on Low Power
Electronics and Design, pp. 9095, (2003).
100% 100%72.15%
32.71%27.85%
67.29%
0%
50%
100%
150%
Area PowerP
erc
en
tage
Comparision of DFF & Gate Level Clock gating …
DFF based
Gate-Level C_G

VOLUME NO. 2 (2012), ISSUE NO. 12 (DECEMBER) ISSN 2231-1009
INTERNATIONAL JOURNAL OF RESEARCH IN COMPUTER APPLICATION & MANAGEMENT A Monthly Double-Blind Peer Reviewed (Refereed/Juried) Open Access International e-Journal - Included in the International Serial Directories
http://ijrcm.org.in/
68
THE STATISTICAL ANALYSIS OF STRUCTURE OF MANUFACTURING SECTOR – WITH SPECIAL REFERENCE TO BANGALORE INDUSTRIAL REGION
A. T. SRINIVASA
ASST. PROFESSOR IN STATISTICS
BLDEA’S BASAVESHWARA ARTS & COMMERCE COLLEGE
BASAVANABAGEWADI
DR. MUNIVENKATAPPA
HEAD
DEPARTMENT OF COMMERCE & MANAGEMENT
SMT. VHD CENTRAL INSTITUTE OF HOME SCIENCE
BANGALORE
ABSTRACT
This recent spurt in growth is propelled by radical reforms such as the removal of restrictions on foreign investment and industrial de-licensing. Tailoring the EXIM
policy to promote exports and aligning the import duties to meet WTO commitments further contributed to this development. This trend is expected to continue
over the next five years, driven by a favorable business policy environment in terms of tax cuts, broadening tax base, and reduced interest rates. Thus it is
observed that both development (commercial) enterprises and manufacturing enterprises are loss-making sectors in the aggregate sense. Therefore, pressure is
mounting on the ground that from revenue point of view also, government should try to reduce its share from these sectors, Furthermore, financial institution
sector and the development (noncommercial) sector are also incurring net losses. INDIAN industrial policy operates within the framework of overall economic and
planning policies. A brief discussion of the background of such policies and recent development in the growth process and structural change may be useful so that
the framework in which industrial policies operate can be appreciated.The major industrial sectors are registering high growth as a result of the economic
reforms. In tune with India’s progress, the state of Karnataka has played an important role in various spheres. The per capita income of Karnataka has more than
doubled in the last 50 years. In the post-1991 era, Bangalore has emerged as the “Destination City” for fresh investments, gaining the reputation of being the
“Silicon Valley of India.” At present, there is cause for optimism due to the favorable industrial climate of Karnataka and its human resources.
KEYWORDS Reforms, development, Manufacturing, Statistical, Policy, Economic planning.
INTRODUCTION here is something very basic about manufacturing – value is added by taking raw materials and labor, and producing products that can be sold in high quantities, with quality, to generate good return on the investment. In the past decade, manufacturing technology has expanded rapidly on a global scale. Many countries have mastered the methods, the quality processes, the execution systems and software. In this new century, the global spread of
manufacturing knowledge is having far-reaching consequences. We are seeing fundamental changes in international business structures and deployment of global capital. Manufacturing's share of the US economy, as measured by real GDP, has been stable since the 1940s. During this entire time, the ratio of manufacturing output to GDP has ranged from 16 to 19%. As of 2002, it was 16%. During this same 50-year time span, with alternating booms and recessions, the number of manufacturing employees has remained fairly constant, oscillating at around 16.5 million. In the recent downturn, manufacturing employment fell to about 14.2 million. At the start of April 2009 the Department of Innovation, Industry, Science and Research (DIISR) began collecting data on Australian firms facing restructuring or difficulty during (and immediately after) the GFC. Over the subsequent year (comprising the June, September and December quarters of 2009 and the March quarter of 2010) DIISR gathered detailed information on 760 firms. For the purposes of the study, references to the past year refer to this period. While this is a very limited sample, some interesting trends and observations emerge from an analysis of the data. The Indian economy is firmly on the path of steady growth. Even during the last decade when other countries were in the grip of a massive slowdown, India continued to enjoy a comfortable economic position. This recent spurt in growth is propelled by radical reforms such as the removal of restrictions on foreign investment and industrial de-licensing. Tailoring the EXIM policy to promote exports and aligning the import duties to meet WTO commitments further contributed to this development. This trend is expected to continue over the next five years, driven by a favorable business policy environment in terms of tax cuts, broadening tax base, and reduced interest rates. Karnataka’s industrialization got off to a start as early as in 1884 when the first textile mill was set up in the state. However, the sugar industry came into existence prior to this—in 1800 itself. The commencement of the flow of electricity from Shivasamudram in 1902 marked the beginning of a new era in the state’s industrial development. Within a decade after the commissioning of the electricity generating station, the number of industrial establishments using electric power had risen to 80 which was a significant achievement in those days.
INDUSTRIAL SCENARIO IN KARNATAKA The growth rates of states varied widely and the range was quite significant- Growth rates of gross state domestic product (SDP) for different states are given below: ANNUAL GROWTH RATE COMPARISONS (In per Cent)
___________________________________________________ State 1980-81 to 90-91 1991-92 to 1997-98 _________________________________________________________ Andhra Pradesh 5.65 5.03 Tamil Nadu 5.38 6.22 Kerala 5.37 5.81 Karnataka 5.29 5.29 Gujarath 5.08 9.57 Maharastra 6.02 8.01 GDP (Nat. Accounts) 5.55 6.89 ________________________________________________________ Source Ahluwalia, 2000: 1638.
T

VOLUME NO. 2 (2012), ISSUE NO. 12 (DECEMBER) ISSN 2231-1009
INTERNATIONAL JOURNAL OF RESEARCH IN COMPUTER APPLICATION & MANAGEMENT A Monthly Double-Blind Peer Reviewed (Refereed/Juried) Open Access International e-Journal - Included in the International Serial Directories
http://ijrcm.org.in/
69
"PSEs, whose activities are commercial in nature or which produce consumer goods, and where there exists a strong private sector presence, would be restructured through privatization or closure." 1) To evaluate the state PSEs and suggest measures which would promote greater productivity and profitability within the next five years. 2) Suggest measures, which could promote autonomy and reduce or preferably remove budgetary support. 3) Evolve a long-term reform programme, which would enable government to identify PSEs that need alternative forms of management such as complete
privatization or disinvestment or merger etc. If any PSE needs government support to enhance its long-term profitability, strategies should be evolved to identify them.
Accordingly, during the first phase of reform drive, 20 commercial enterprises were selected and the second phase consists of another 20 enterprises.
REVIEW OF LITERATURE The perusal of past research programmes is very important in order to comprehend the concepts of statistical analysis of structure of manufacturing sector. Further, going deeper and understanding the intricacies of the topic entail the review of literature. The literature includes books, articles, reports, news bulletin, newspapers, annual reports of the Group-A companies, orders, notices and reports, Company Law, International Stock Market Journals, CD ROM, micro-films, annual reports and Government and private publications. The literature survey phenomenon is morefully arrayed in the following. Rajiv Kumar and Abhijit Sen. Gupta (2008)1 This paper is attempted about The Indian manufacturing sector has grown at an impressive average rate of 9.5 per cent annually since 2003-04. Its sustained growth is crucial for generating employment opportunities needed to absorb the rapidly expanding workforce. In this context, this paper reviews the current state of the sector and focuses on determinants of its competitiveness. The paper finds that Indian manufacturing sector exhibits a great deal of regional variation and a marked dualism between the organized and the unorganized segments in terms of both productivity and wage levels. The level of labour absorption in the organized manufacturing sector has been weak as reflected in the declining labour intensity in this sector. This does not augur well for achieving inclusive growth. We also find that although there have been significant changes in the composition of exports in the last 20 years; India is still a very small player at the global level, especially in knowledge intensive and advanced technology products. Finally, the paper explores India’s potential for transforming itself into a hub of mass manufacturing. We find that the main constraints in doing so have been the low level of R&D, relative lack of skilled personnel and relatively low FDI levels. Graham Hall, Patrick Hutchinson and Nicos Michaelas5 (2000)2, undertook a study titled “East and west: Differences in SME capital structure between former Soviet- Bloc and Non Soviet – Bloc European countries.” to analyse of the determinants of capital structure. The esults for the former Soviet-bloc SME‟S show that they have lower levels of debt, both short term and long-term than the non Soviet-bloc countries. The results also show that the SB SME‟S have lower profitability, higher growth rates, are younger, have higher non-debt tax shields, higher stocks and lower risk compared to non Soviet-bloc countries, all of which suggest higher levels of short-term debt and at the same time they have more fixed assets, are smaller, have fewer growth options and lower levels of net debtors which suggests lower STD. Similarly, for long-term debt, SB SME‟S have lower profit, higher growth rates, more fixed assets, more stock and lower risk which are associated with high LTD but are smaller, younger and have lower levels of net debtors that are associated with lower LTD. Francisco Sogorb Mira6 (2001)3, undertook a study titled “How SME uniqueness affects capital structure: Evidence from a 1994-1998 Spanish data panel” to obtain the main determinants of debt policy decisions in small firms. The principal aim is to test how firm characteristics affect Small and Medium Enterprise (SME) capital structure. The study concluded leverage was negatively related to alternative tax shields like depreciation and taxes. Size and asset structure are both positively correlated with firm debt level. However, regarding asset structure a positive correlation was obtained with long term debt level but negative with short term debt level. Thirdly, SME‟S with more growth options seem to employ more debt, although this relationship becomes negative with short term debt. Finally, predictions of Pecking Order Theory seem to explain debt policy in SME‟S relatively well, although the underlying justification of this theory in this case may resemble managers propensity to not losing part of their control in the firm. Put another way, the financing of SME‟S relies on internal resources instead of external means. Susana Menendez Requejo7 (2002)4, conducted a study entitled “SME vs. Large enterprise leverage: Determinants and Structural Relations” to examine the importance of the different theoretical proposals that explain a firm’s capital structure in relation to the existence of an optimal ratio that balances the firm’s tax benefits and financial risk (Tradeoff Theory), besides considering their interdependence with the investment decision. The results from the Structural Equation Model reveal that both the preference for internal financing and sectorial debt ratio are determinants of capital structure in a similar proportion. Business features linked to financial constraints are also significant and have a greater incidence. The interpretation of the relation found shows the lesser possibility of SME‟S, together with firms not belonging to a business group, more recently created firms and firms with a lower market share, to defer investment and leverage. These results also agree with the significantly higher leverage level observed in SME‟S versus large enterprises in Spain, having also significantly higher financial costs. Francisco Sogorb-Mira and Francisco Sogorb-Mira8 (2003)5, conducted a study titled “Pecking order Versus Trade off: An empirical approach to the small and medium enterprise capital structure” to examine the financing of small and medium sized companies (SME‟S) and explore whether the main theories of firm financing can explain the capital structure of these firms. Regarding trade-off theory, the results clearly indicate the existence of an optimal or target debt level where firms partially converge – the transaction costs not being excessively high. The evidence seems to confirm that Spanish SME‟S adjust their target ratio very quickly – faster than publicly listed companies. Small Spanish firms seem to find the costs of an unbalanced position higher than the costs of the process of adjustment. As a result, it is confirmed that bank financing, typical in these companies, offers more advantages than obtaining funds from the capital markets. With respect to pecking order theory, small Spanish firms do not adjust their level of debt to their financial needs. Maria Psillaki and Nikolaos Daskalakis (2007)6 , undertook a study titled “Are the Determinants of Capital Structure Country or Firm Specific? Evidence from SME‟S” to investigate the capital structure determinants of Greek, French, Italian and Portuguese small and medium sized enterprises (SME‟S) and to compare their capital structures and consider if differences in country characteristics such as financial development and institutional features may impact on capital structure choices. The study shows that the four countries present similar financial and institutional characteristics.. There seem to be similarities in the determinants of capital structure across sample countries. Italian SME‟S seem to maintain the highest leverage in their capital structure, whereas the French SME‟S have the lowest debt ratio. The size is positively related to leverage. Asset structure is negatively correlated with leverage. Thus, firms that maintain a large proportion of tangible assets in their total assets tend to use less debt than those which do not. Profitability is also negatively related to leverage which is consistent with the pecking order theory that argues that firms prefer internal financing from external. The leverage and risk are negatively related. Finally, the results show that growth variable is not statistically significant for any of the four countries in our sample. It is found that firm rather than country factors explain differences in the intensity of capital structure choices.
1 Rajiv KumarAbhijit Sen. Gupta, Towards A Competitive Manufacturing Sector, Working Paper No. 203, INDIAN COUNCIL FOR RESEARCH ON INTERNATIONAL ECONOMIC RELATIONS. 2008 2 Graham Hall, Patrick Hutchinson and Nicos Michaelas52 (2000), “East and west: Differences in SME capital structure between former Soviet- Bloc and Non Soviet – Bloc European countries.” International Journal of the Economics of Business, Volume 7, Issue 3, 2000. p 297 – 312. 3 Francisco Sogorb Mira54 (2001), undertook a study titled “How SME uniqueness affects capital structure: Evidence from a 1994-1998 Spanish data panel” Small Business Economics, Vol. 25, No. 5, Dec., 2005, (pp. 447-457) 4 7 http://papers.ssrn.com/sol3/papers.cfm?abstract_id=313981 5 8http://www.ivie.es/downloads/docs/wpasec/wpasec-2003-09.pdf 6 12 http://papers.ssrn.com/sol3/papers.cfm?abstract_id=1341860

VOLUME NO. 2 (2012), ISSUE NO. 12 (DECEMBER) ISSN 2231-1009
INTERNATIONAL JOURNAL OF RESEARCH IN COMPUTER APPLICATION & MANAGEMENT A Monthly Double-Blind Peer Reviewed (Refereed/Juried) Open Access International e-Journal - Included in the International Serial Directories
http://ijrcm.org.in/
70
Joshua Abor80 (2008)7, conducted a research titled Determinants of the Capital Structure of Ghanaian Firms with the objective -compare the capital structures of publicly quoted firms, large unquoted firms, and small and medium enterprises (SME‟S) in Ghana. Examine the determinants of financing choices (capital structure) of Ghanaian firms. Publicly quoted and large unquoted firms were found to have higher debt ratios than SME‟S. Overall, listed and unquoted firms exhibit different financing behaviour from that of SME‟S. Older SME‟S are more likely to rely on long-term debt finance. Firm growth was found to have a positive association with long-term debt for the unquoted firms‟ sample and short-term debt ratio for SME‟S. Firms with high risk profile avoid taking more financial risk by using less long-term debt. SME‟S with high managerial shareholding rely less on short-term debt. Industry was found to be important in explaining the SME‟S‟ capital structure. SME‟S located outside the capital city depend less on debt finance. Limited liability companies are more likely to obtain long-term debt finance relative to sole-proprietorship businesses. The pecking order theory appears to dominate the Ghanaian capital structure story.
IMPORTANCE OF THE STUDY The present study is confined to manufacturing sector with specific reference to public sector and private sector undertakings. The study reviews the manifestation and magnitude of manufacturing in public and private sectors. The present study aims to analyses that the sectors in terms of statistical tools and techniques. The existing study will analysis overall performance of manufacturing sector in Karnataka State.
STATEMENT OF THE PROBLEM Manufacturing sector in our country, have worked as important tool of the overall strategy of national economic growth and planning. Despite present more of economic liberalization nobody can deny the vital role of those manufacturing sector play in our economy. Taking up of statistical analysis of manufacturing sector potential has become one of the major strategic management initiatives to sustain and grow in the present contest globalization. Understanding under effective change in the manufacturing sector based on forms of organization is made under their affects upon the reinforcement of statistical analysis. The competition among organization is increasing creating greater pace than ever. Therefore, every organization trying to get the competitive advantages over its competitor. The statistical analysis will gives them a definite edge over their rival firms. So the statistical analysis of manufacturing sector will become stand practice rather than a specialized area and it holds the key in deciding success. The present study aims to view and analyses the manufacturing sector potential and growth in Karnataka State.
OBJECTIVES OF THE STUDY Among the other objectives, the study embarked upon the following 1. To study industrial potential in Karnataka. 2. To study critical analysis of industrial policy in Karnataka since 1950. 3. To study of regional disparities in industrialization in Karnataka. 4. To study the correlation between economic growth and change in industrial structure –manufacturing sector 5. To validate the data and offer constructive suggestions
HYPOTHESES The present study relied on the following conjectures or the tentative statements, which form the hypotheses of the study 1. Karnataka has high industrial potential 2. The industrial policy of government of Karnataka is very favorable for the growth of manufacturing sector than other sectors of the industry. 3. The industrialization brought balanced regional industrial growth. 4. there is a correlation between economic growth and structure of industrialization ( Manufacturing sector)
METHODOLOGY The proposed study will be a case study and it adopts analytical approached. It is based on secondary data. The secondary required for the study is going to be collected from different official sources and journals and from published sources such as annual reports, prospectus etc.
DATA ANALYSIS The researcher aims to apply various statistical tools techniques for the purpose of drawing inferences and valid findings some the techniques contemplated to use are given bellow.
• Descriptive
• Percentages
• Chi-Square test
• Co-efficient of variance
• Rank correlation
RESULTS & DISCUSSION The Results will display what was calculated through using the aforesaid method. The results will be presented in the form of tables and graphs, with some interpretation of the data. This section will mainly be descriptive and explanatory; most of the analysis in concert with the theory will be done in the Discussion section. The Results section will be divided into a number of subsections. The first subsection will present the structural change calculated using the procedure described in the Methods section. The other three sections will to support these results through economic indicators including; total factor productivity, capital-output ratio, and investments.
7 13 http://ideas.repec.org/p/aer/rpaper/rp_176.html

VOLUME NO. 2 (2012), ISSUE NO. 12 (DECEMBER) ISSN 2231-1009
INTERNATIONAL JOURNAL OF RESEARCH IN COMPUTER APPLICATION & MANAGEMENT A Monthly Double-Blind Peer Reviewed (Refereed/Juried) Open Access International e-Journal - Included in the International Serial Directories
http://ijrcm.org.in/
71
FIGURE 1: STRUCTURAL CHANGE IN THE INDIAN ECONOMY WITH AND WITHOU THE TERTIARY SECTOR 1970-2002
Source: Calculated by author using data from (Timmer and de Vries, 2007).
From Figure 1, it is apparent that these two variables follow very similar trajectories. These figures are almost identical during the 1970’s, and do not really diverge until after 1981. There is a spike in the late 1970’s that suggests that the economy would have done better had the tertiary sector not existed. This suggests that the tertiary sector, in the mid to late 1970’s was absorbing more capital than it was producing. However, from 1981 until 2002, the economy with the tertiary sector included (the blue line), was more productive. Therefore it can be concluded that the reallocation of labour into the tertiary sector had a positive effect on the economy. To see the effects of the tertiary sector more clearly, The structural change without the tertiary sector is thus subtracted from the entire structural change, leaving on the change that can be attributed to the tertiary sector.
TABLE 1: STRUCTURAL CHANGE WITH AND WITHOUT TERTIARY SECTOR, PERCENTAGE DUE TO THE TERTIARY SECTOR. BY DECADE FROM 1970-2004
Structural Change Without Tertiary Due to Tertiary % due to Tertiary
1971-1980 -0.190 -.262 0.072 -37.6%
1981-1990 0.993 0.752 0.242 24.3%
1991-2000 1.423 1.068 0.355 24.9%
Source: Calculated by author using data from (Timmer and de Vries, 2007). The negative contribution of the tertiary sector is expected during the 1970’s. With GPT’s there is a productivity lag, where it takes time for a country and/or region to absorb and adapt the new technology. During the onset of a new technology, there is an initial cost, which accounts for reorganization, re-education and redistribution of resources. Since 1980, the structural change has becoming more effective, suggesting that the reallocation of labour is having a positive effect on the society. Furthermore, the tertiary sector, which was negatively affecting the economy in the 1970’s, has become a great contributor to the structural change during the 1980’s and 1990’s. TOTAL FACTOR PRODUCTIVITY As discussed in the Theoretical Background section, technology is seen by economic historians as the prime impetus for structural change. One way to investigate technological change in economic history is to look at the total factor productivity (TFP). This number is a residual; it is what labour and capital cannot account for in the output. Since it is a residual, it is not definite that it is due to technology. The difficulties surrounding the strength of TFP coupled with data complications, have kept the TFP out of the scope of this essay. However, the author recognizes the importance given to TFP in the realm of economic history and believes that it would be a valuable future addition to this essay. The total factor productivity is a measurement of technological progress. It is the amount of growth that cannot be accounted for by labour and machinery. This number is a residual: Equation 10: Total factor productivity � = �*�a∗ �b
Where: Y= GDP a= Capital elasticity (.3) K= Capital input A= TFP b= Labour elasticity (.7) L= Labour input There have been many criticisms of the use of TFP as an indicator of technological change. The main concern has been that since it is a residual, it reflects everything that is not accounted for by labour and machinery, ie. fluctuations in weather…. However, when the TFP is looked at on the long term, these fluctuations even out. Therefore, I believe that when taking an average over a long period of time, the TFP represents mainly technological change. When a new technology is introduced into a society, we expect there to be changes to occur in order to adapt and adopt the new innovation.
TABLE 2: TOTAL FACTOR PRODUCTIVITY IN INDIA- AGGREGATED AND SECTORAL CONTRIBUTIONS Sector/Period Year GDP GDP/Worker Contribution of: Capital Land Education TFP Total Economy 1960-81 3.4 1.3 1.0 -0.2 0.2 0.2
1981-00 5.8 3.8 1.4 0.0 0.4 2.0
Agriculture 1960-81 1.9 0.1 0.2 -0.2 0.1 -0.1 1981-00 2.8 1.8 0.5 -0.1 0.3 1.1
Industry 1960-81 4.7 1.6 1.8 - 0.3 -0.4 1981-00 6.4 2.9 1.6 - 0.3 1.0
Services 1960-81 4.9 2.0 1.1 - 0.5 0.4 1981-00 7.6 4.0 0.7 - 0.4 2.9
Source: (Boswort, Collis, Vlramani, 2007)
-2
0
2
4
6
8
10
19
71
19
73
19
75
19
77
19
79
19
81
19
83
19
85
19
87
19
89
19
91
19
93
19
95
19
97
19
99
20
01
Structual Change (%)
Strucutal Change without Tertiary (%)

VOLUME NO. 2 (2012), ISSUE NO. 12 (DECEMBER) ISSN 2231-1009
INTERNATIONAL JOURNAL OF RESEARCH IN COMPUTER APPLICATION & MANAGEMENT A Monthly Double-Blind Peer Reviewed (Refereed/Juried) Open Access International e-Journal - Included in the International Serial Directories
http://ijrcm.org.in/
72
From the results that Boswort, Colis and Vramani it is clear that the TFP became a significant source of growth after the 1980’s. The high TFP suggests that ‘knowledge and competence have diffused among the employees, leading to improved conditions to technological diffusion’. In short, the people have become more competent at exploiting the technology and this has in turn accelerated the new technologies importance in society. In this case the TFP contributes to more than 1/3 of India’s GDP growth. It is also important to note from Table 2 is the differences at a sectoral level in the TFP results. The TFP contribution was most impressive in the service sector at 2.9%. Therefore, the total economy is benefiting from the technology between 1981 and 2000; the advantages are felt greatest in the service sector. INVESTMENTS To analyze the investment pattern in India the capital-output ratio was calculated and presented in Figure 2. The Capital-Output Ratio depicts the amount of investment (in fixed capital) in relation to the overall output (GDP). Therefore, when the curve is rising, it means that more is being invested into the economy than is being produced. Similarly, where the figure is decreasing, the GDP is higher than the investments. The graph is shown in constant 1999 INR prices with 1990 being the base year; equaling one. Thus each of the values can be seen in relation to the base year of 1990.
FIGURE 2: CAPITAL-OUTPUT RATIO IN THE INDIAN ECONOMY 1950-2007 AT FIXED 1999 IN INR PRICES. INDEX 1990=1
Source: Calculated by author from Data found in Handbook of Statistics on the Indian Economy, Reserve Bank of India 2008-2009 p.5
From Figure 2 it is evident that between 1965 and 1984 there was a steady increase in investments to output. This suggests there is development in infrastructure, such as roads, airports, science parks, and other infrastructure to support and encourage the growth of the new technology. This high expenditure in physical capital is characteristic of the transformation stage, as companies, firms and cities are forced to transform their economy to incorporate the newly introduced General Purpose Technology into their fields. From the mid-1980s, the investment is higher than the base year of 1990 however, it has stabilized. While investment to output continues to grow, it is at a much slower rate of change. This suggests a rationalization economic phase. The investment shifts from large, expensive projects, to more small scale projects that improve the production and quality of what is already being produced. Growth begins again in high investments in the early 2000’s. Since the curve stops at 2007; it is difficult to make any real conclusive observations from this. For Bangalore, the detailed data necessary to calculate the capital-output ratio was not available. Instead to investigate investments in Bangalore, Foreign Direct Investment has been chosen as an indicator. Below is a table of the major contributors to the investments in Bangalore:
TABLE 3: INVESTMENT IN BANGALORE (Rs. Billion)
1995 1996 1997 1998 1999 2000 2001 2002 2003 2004
Central Government 1.32 1.32 3.15 3.15 4.78 4.78 5.53 7.03 9.21 10.93
State Government 0.3 0.3 1.09 2.36 2.76 3.46
Private (Domestic) 0.08 2.43 3.86 4.29 26.89 31.34 39.66 45.61 52.39 56.38
Private(Foreign) 0.45 3.85 3.85 3.85 28.54 40.1 43 49.93 67.17 68.13
Total 1.85 7.6 12.17 12.59 61.81 78.2 90.95 116.13 142.72 150.11
Source: Shaw and Satish 2007 Over the 10 years, between 1995 and 2004, the FDI increased by 15,040 %. Furthermore, since 1999, every year the amount of foreign domestic investment has been relatively higher than private domestic investment. The table below compares the percentage share of these two forms of investment in Bangalore:
TABLE 4: SHARE OF INVESTMENT IN BANGALORE (%)
1995 1996 1997 1998 1999 2000 2001 2002 2003 2004
Private (Domestic) 4.32 31.97 31.72 34.07 43.50 40.08 43.61 39.27 36.71 37.56
Private(Foreign) 24.32 50.66 31.64 30.58 46.17 51.28 47.28 42.99 47.06 45.39
Source: Calculated by author using data from: Shaw and Satish 2007 The fact that FDI has a higher percentage share than any other form of investment is a tribute to the influence that global forces have on Bangalore today. The potential that can be gained from these investments in high; spillovers and transfers, both physical and knowledge based will occur. However, if the FDI dominates investment, then the negative results of FDI are accentuated. This becomes apparent in the structure of the nongovernment organizations. These groups have been are described by Jalal as having an ‘increasing voice, weight and significances in the urban area’ (Jalal, 2005). The non-government political influencers are supported by the elite, the middle class and the ex-government officials, thus these voices have to the forefront. Some have argued that this is
0.3
0.4
0.5
0.6
0.7
0.8
0.9
1
1.1
1.2
19
50
19
53
19
56
19
59
19
62
19
65
19
68
19
71
19
74
19
77
19
80
19
83
19
86
19
89
19
92
19
95
19
98
20
01
20
04
20
07
Capital Output Ratio

VOLUME NO. 2 (2012), ISSUE NO. 12 (DECEMBER) ISSN 2231-1009
INTERNATIONAL JOURNAL OF RESEARCH IN COMPUTER APPLICATION & MANAGEMENT A Monthly Double-Blind Peer Reviewed (Refereed/Juried) Open Access International e-Journal - Included in the International Serial Directories
http://ijrcm.org.in/
73
good and that the middle class has been given a greater voice, while others have been skeptical of this newly established undemocratic power (Shaw and Satish 2007)
DISSCUSSION AND RESULTS The Discussion aims at analyzing the results presented in the previous section, as well as underlying the implications that arise from these results. The first two subsections of the Discussion will pertain to the analysis of the data, and the last two will make some generalizations and potential policy implications. This analysis will be done through three broad categories. The first will look at how applicable the Schön Cycle is to the case of India. THE SCHÖN CYCLE From the results it is, however, unclear what stage of the Schön Cycle India is currently in. The Total Factor Productivity results as well as the conclusions made from the Capital-Output ratio indicator, suggest that India is currently undergoing Rationalization. This is logical temporally to the introduction of the GTP. If we accept the Schön Cycle then the Transformation phase should last approximately 25 years, and would have begun at the introduction of a the GTP, around 1970. During those 25 years changes occurred in the economy, investment was high in order to create the infrastructure and means to exploiting the new technology. Then around 1991-1995, the Rationalization phase should begin, where the investments to capital stabilize, and the TFP is exceptionally high. Throughout the 1990’s, labour has been successfully being reallocated into areas with higher value added. Thus the productivity of the economy has been rising at a rapid rate. Yet, this deduction does not really follow the theory, for the structural change was still positive throughout the 1980’s, and accelerated in the 1990’s. Therefore, using 1991 as the marking point of Transformation does not seem very logical. These results therefore do not completely support the Schön Cycle. This has two implications; the first is that this study is flawed, and further research, for a longer period of time will support the Schön Cycle. The alternative explanation is that the Schön Cycle is in fact not applicable for all cases. While it describes the Swedish situation in a very compact and impressive form, it is not however a universal model. If the Schön Cycle is not universal, and the phases cannot be predicted, exactly, then policies suggestions become less simple to make. THE INFERENCES FOR BANGALORE From the results of India in the shift share analysis, it is clear that the movement of labour since 1980, has had a positive effect on the economy. The structural change has increased in the 1990s even more so, suggesting that there are more people moving into areas of higher value added sectors. As described in the Historical Background section, the movement of workers to high value added sectors has been slow. For city of Bangalore, it is believed that the movement of labour would have occurred faster than other areas of India. This is because Bangalore is home to some of the best universities in the country, the first research park was set up in Bangalore and the city has undergone industrialization under British rule. For these reasons, it is thought that Bangalore would adopt to value added shifts much faster than India as a whole. For example, in India there is a much faster decline in agriculture’s contribution of GDP, from 40% in 1980 to 27% in 2004, as compared to the movement of employment, from 73% in 1980 to 63% in 2004. This suggests that there are a higher proportion of people dependent on agricultural incomes for their livelihood without any growth in productivity. Thus there is higher reliance with less capital; this should consequently cause an increase in poverty throughout the society. Furthermore, while the tertiary sector contributes 53% of India’s GDP, in Bangalore, the tertiary sector supplies 63%. Moreover, since Bangalore is progressing at a much faster rate than India, it is logical that there is a divergence going on within the country. While Bangalore ‘takes-off’ and moves into the forefront of the global stage, there are other cities that do not succeed in the same way. The divergence burrows deeper however. Bangalore has undergone a process of urban growth through agglomeration. The formation of urban agglomerations causes the economic activity of the region to concentrate and centralize. There is a divergence occurring within Bangalore at present. However, as discussed above, there is an expectation of self correction.
POLICY IMPLICATIONS The Indian economy can be seen as a pendulum swinging. Between 1950 and 1984, it was an extremely closed economy slowly moving into a more liberal system. From 1984 on, we can see the economy progressing as the protectionist laws have more or less disappeared. What is expected from here is another swing back into a more government controlled system. However, with this swing there is less velocity than last time, and the restrictions are expected to be less radical than the ones previous to 1984. At present the Indian economy is being dictated by liberal values, however as wages increase, it is likely that citizens will demand more social welfare, and safety nets. It is important to recognize the significance that cultural and social norms have on the diffusion and alteration of technology. In the Swedish example, discussed by Schön, Swedish workers were able to effectively adopt and adapt the technology from Britain, as the two cultures were quite similar. Thus using the Swedish model, has its flaws when analyzing Bangalore. Most of the ‘revolutionary’ technologies were incremental; the product was not perfect when it entered the market. Rather with time, these products diffused and were altered depending on the demands of the society.
CONCLUSIONS This paper has presented an overview of theoretical arguments and empirical evidence for the proposition that in the past 50 years, manufacturing has functioned as an important engine of growth in developing countries. There is no doubt that manufacturing has been an important driver of growth and catch-up. But not all expectations of the engine of growth hypotheses are supported by the statistical evidence, in particular not with regard to the presumed higher capital-intensity in manufacturing and the productivity dynamics of manufacturing. In more recent years, productivity growth in agriculture has even been higher than in manufacturing. Given this economic structure, we find the reforms suggested by the government and various economists do not address themselves to the following important issues. Ability of the Indian state to integrate the unincorporated sector with the national market, both product markets and capital markets. If the proposition that the Indian State is in search of a nation is true then one of the basis of such a nation state is the recognition of the role of the unincorporated sector which has become a dominant player in the national economy and the need to integrate it in an orderly fashion, into the regulatory system. From these results it is clear that both India, and to a greater extent Bangalore, have been expanding and developing at a rapid rate. Throughout the 1990’s Bangalore has transformed into a sophisticated high-tech centre. This city has become an exemplar of 21st century growth; it is a newly globalized city which exemplifies the success and wealth that can be obtained through liberalization. The structural change within India suggests that there has been a positive shift of the economy from the primary sector into the secondary and tertiary sectors. Moreover, since the tertiary sector has the highest value added, it can be assumed that the structural change is mainly a product of labour movement into the tertiary sector. Bangalore has undergone an economic boom, which has given hope to other industrializing megacities. However, the need for a domestic market appears to be necessary for Bangalore’s future success. Furthermore, the inconsistent results question the relevance of the Schön Cycle and highlights problems of generalizations and invoke a need for future research.
SCOPE FOR FURTHER RESEARCH After carrying out an extensive survey of existing research on Indian manufacturing, and supplementing it with our own research, we find that there is a strong need to address additional research questions to understand how different firms’ different strategic and operational choices lead to different performance outcomes. Most of the existing empirical studies were based on industry-level data and were focused on more macro-level issues. We believe that the implications and learning that can be derived by studying the following firm-level issues can contribute significantly to understanding and guiding the future growth and success of Indian manufacturers in global competition.

VOLUME NO. 2 (2012), ISSUE NO. 12 (DECEMBER) ISSN 2231-1009
INTERNATIONAL JOURNAL OF RESEARCH IN COMPUTER APPLICATION & MANAGEMENT A Monthly Double-Blind Peer Reviewed (Refereed/Juried) Open Access International e-Journal - Included in the International Serial Directories
http://ijrcm.org.in/
74
• How did firms react to the relaxation of restrictions on vertical integration? Did the larger firms manage to become more efficient by backward and/or forward integration of operations? How did the firm strategies of cost efficiency and differentiation prior to liberalization affect the opportunities to vertically integrate post-liberalization? How did the vertical integration decisions by larger firms affect smaller firms, which were the suppliers of raw materials and intermediate goods before the restrictions were removed?
• How did firms react to competition after the trade liberalization? Did the hangover from pre-liberalization inhibit growth? What kind of operational and manufacturing strategies did they use to counter competition and protect their market shares? Were they able to raise enough capital in order to scale-up the facilities and import state-of-the-art technologies? Did the smaller firms manage to survive competition from low cost and high volume producers like China, particularly in industries such as consumer goods, garments, leather, toys etc.? What kind of support and opportunities did the liberalized economy offer the small-scale firms that could not upgrade? For the former research project, major cities in countries such as; Israel, Taiwan or China, would be optimal. Since these countries have similar growth processes in relation to IT technology, this analysis help to draw conclusions. If these centers followed similar economic growth then the correlation between IT, and economic success is further strengthened, however, if these cities do not follow similar growth then there is probably a third variable for Bangalore ‘forging ahead’. To further test these conclusions a comparison between Bangalore and dissimilar cities should be compared. It would be optimal to be able to compare Bangalore to a city that is the same in every way except where clustering did not occur. There are inherent difficulties in finding such a city since the fact that clustering did occur in Bangalore, as well as Hyderabad and Prune suggests that these cities have a comparative advantage. Therefore, it is unlikely that a comparison to a city without clustering would truly be the same in every other aspect. The problem of the third variable thus is much stronger in a cross-city analysis
ACKNOWLEDGMENTS This paper would not have been possible without the support of many people. Many thanks to my colleagues, Sri. V.Samboji Rao, Dr.C.G.Lakshmipathi, who offered guidance and support. And finally, thanks to brother A.C. Narayanappa and my wife Smt. Renuka. I Asode, parents, and numerous friends who endured this long process with me, always offering support and love.
REFERENCES 1. Alcorta, L., The Impact of New Technologies on Scale in Manufacturing Industry: Issues and Evidence, World Development, 22 (5), May 1994. 2. Badiane, O., Macroeconomic Policies and Inter-country Trade in West Africa, IFPRI, Washington, D.C., 1992. 3. Bagchi, A.K., Public Intervention and Industrial Restructuring in China India and the Republic of Korea, Geneva, IL-ARTEP, 1987. 4. Balassa, B. and Bauwens, L., Changing Trade Patterns in Manufactured Goods, Amsterdam, North-Holland, 1988. 5. Baumol, W.J., Panzar, J.C. and Willig, R. D., Contestable Markets and the Theory of Industrial Structure, New York, Harcourt Brace Jovanovich, 1982. 6. Brander, J.A. and Krugman, P.A., A Reciprocal Dumping Model of International Trade,. 7. Brander, J.A., Intra-industry Trade in Identical Commodities, Journal of International Economies, 11, 1981. 8. Buckley, P. and Casson, M., The Future of the Multinational Enterprise, London, Macmillan, 1976. 9. Ethier, W.J., Internationally Decreasing Costs and World Trade, Journal of International Economics, 9, 1979. 10. Hiey, P.J., Stabilization and Adjustment Policies and Programmes WIDER Country Study 16, Helsinki, 1988. 11. ITC, Supply and Demand Surveys: Indicative Value of Imports and Export Trade in Selected Products for Member Countries of the PTA (1981-85), Geneva,
ITC/UNCTAD/GATT, December 1985. 12. Kaldor, M., The Case for Regional Policies, Scottish Journal of Political Economy, 17, 1970. 13. Kendrick, J.W. and Grossman, E.S., Productivity in the United States: Trends and Cycles Baltimore, Johns Hopkins University Press, 1980. 14. Kierzkowski, H. (ed.), Monopolistic Competition and International Trade, Oxford, Clarendon Press, 1984. 15. Pasinetti, L.L., Structural Change and Economic Growth, A Theoretical Essay on the Dynamics of the Wealth of Nations Cambridge, Cambridge University
Press, 1981. 16. Pavitt, K. and Patel, P., Technological Strategies of the World's Largest Companies, Science and Public Policy, 18 (6), December 1991 17. Piore. M. and Sabel, C., The Second Industrial Divide: Possibilities for Prosperity, New York, Basic Books, 1984. 18. Porter, M., The Competitive Advantage of Nations, London and Basingstoke, Macmillan, 1 990. 19. Rasmussen, J., Schmitz, H. and Dijk, M.P. van, Introduction - Exploring a New Approach to Small-scale Industry, IDS Bulletin, 23 (3) July 1992. 20. Salam, M.A., Science and Technology: Challenge for the South, Trieste, Third World Academy of Sciences and Third World Network of Scientific Institutions,
1992. 21. Scherer, F., industrial Market Structure and Economic Performance, Chicago etc., Houghton Mifflin, 1980. 22. Sharma, R., The 'Missing Middle' in Sub-Saharan Africa: Role of South-South Cooperation, Research and Information for the Non-Aligned and Other
Developing

VOLUME NO. 2 (2012), ISSUE NO. 12 (DECEMBER) ISSN 2231-1009
INTERNATIONAL JOURNAL OF RESEARCH IN COMPUTER APPLICATION & MANAGEMENT A Monthly Double-Blind Peer Reviewed (Refereed/Juried) Open Access International e-Journal - Included in the International Serial Directories
http://ijrcm.org.in/
75
A STUDY ON CONSUMER PERCEPTION OF TATA LPT 3118 12 TYRE VEHICLE OVER 10 TYRE VEHICLES WITH REFERENCE TO THOOTHUKUDI
S. JEBASEELI NOVALEENA
ASST. PROFESSOR
DEPARTMENT OF MANAGEMENT STUDIES
SRM UNIVERSITY
RAMAPURAM
DR. A. RANGAWSAMY
HEAD
DEPARTMENT OF MANAGEMENT STUDIES
INFANT JESUS COLLEGE OF ENGINEERING
KEELA VALLANADU
ABSTRACT
The study entitled consumer perception of TATA LPT 3118 12 tyre vehicle over 10 tyre vehicles in TATA Motors Limited was under taken to know the perception
level of the LPT 3118 users and other basic segment of truck users in relation to perception on various aspects. The survey was conducted to collect information
from various consumers. Many have preferred to buy LPT 3118 because of Tyre mileage, diesel mileage Lift Axle mechanism aspects. But some extend many have
not preferred TATA LPT 3118 truck because of non availability of spare parts and services so proper steps should be taken to improve more awareness of Lpt 3118
truck. The respondents who are using Lpt 3118 truck are more satisfied. The expectation of the consumers is quite high. Many people expect high product quality,
high design, comfort and mileage in lower cost investment. The experience of the consumers and their rating of the trucks are moderate, proper awareness
campaigns should was limited to Thoothukudi city only, it was possible for the researcher to understand the demographic profiles of the consumer. The
perception of individual consumers depends mainly on annual income, expected actual performance of the product as well as external influencing factors like
society and etc, consumer prefer to advice of other also consistency in performance level of satisfaction also has a major impact. The study of consumer
perception towards LPT 3118 trucks gives on idea of individual performance towards the product based on various influencing factors like price, group influence,
social influence and psychological influence and also gives an idea on rating of product done by consumer generally, etc , particularly relating to Thoothukudi city.
The main objectives of the study were to analyze the position of the TATA LPT 3118 12 tyre truck and other basic segment trucks in the consumers mind, to
measure the perception level with regard to price, financial availability, non-availability of spare parts, brand reputation, safety, mileage, comfort, design, and
etc., to know the reason for preferring the particular brand over the other brands and finally to receive suggestions for the further improvement.
KEYWORDS 12 tyre vehicle, TATA LPT 3118, Consumer Perception.
INTRODUCTION customer refers to individual or households that purchase goods and services generated within the economy. The word historically derives from “custom”, meaning “habit” a customer was someone who frequented a particular shop, who made it a habit to purchase goods there, and with whom the shopkeeper had to maintain a relationship to keep his or her “custom” meaning expected purchases in the future. Customer needs may be defined as the
goods and services a customer requires to achieve specific goals. Different needs are of varying importance to the customer. Customer expectations are influenced by cultural values, advertising, marketing, and other communications, both with the supplier and with other sources. Perception gives rise to two types of consciousness; phenomenal and psychological. The difference everybody can demonstrate to himself/herself by simple opening and closing his/her eyes. Phenomenal consciousness is full of rich sensations that are hardly present when eyes are closed.
OBJECTIVE OF THE STUDY � To find out the customer perception on 12 tyre vehicle of TATA Limited � To compare 12 tyre vehicle with10 tyre vehicle with regard to customer perception. � To identify the maintenance handling system adopted by user. � To identify the real opinion of TATALPT3118 truck towards the consumers � To give suggestion on marketing activity to be carried out based on the customer’s perception.
SCOPE OF THE STUDY � To understand the knowledge and perception of customer on 12 tyre vehicle 10 tyre vehicle in the territory. � The analysis of data and recommendations should result in the intensity of marketing activity to be carried for penetrating the multi axle segment using the
12 tyre vehicle. � The study helps us to know about the customer perception towards TATA truck and other competing brands.
REVIEW OF LITERATURE Mandeep Kaur and Sandhu (2006) attempted to find out the important features which a customer considers while going for the purchase of a new car. The study covers the owners of passenger cars living in the major cities of the State of Punjab and the Union Territory of Chandigarh. The respondents perceive that safety and comfort are the most important features of the passenger car followed by luxuriousness. So the manufacturers must design the product giving maximum weightage to these factors. Chidambaram and Alfread (2007) postulates that there are certain factors which influence the brand preferences of the customers. Within this framework, the study reveals that customers give more importance to fuel efficiency than other factors. They believe that the brand name tells them something about product quality, utility, technology and they prefer to purchase the passenger cars which offer high fuel efficiency, good quality, technology, durability and reasonable price. Satya Sundaram (2008) analyzed how the competition makes the automobile manufacturer to launch at least one new model or a variant of the model every year. This survey also pointed out that diesel cars are becoming popular in India and the announcement of reductions in excise duties by the government has helped to some extent to boost the demand. Clement Sudhakar and Venkatapathy (2009) studied the influence of peer group in the purchase of car with reference to Coimbatore District. It was also found that the influence of friends is higher for the purchase of small sized and mid sized cars.
A

VOLUME NO. 2 (2012), ISSUE NO. 12 (DECEMBER) ISSN 2231-1009
INTERNATIONAL JOURNAL OF RESEARCH IN COMPUTER APPLICATION & MANAGEMENT A Monthly Double-Blind Peer Reviewed (Refereed/Juried) Open Access International e-Journal - Included in the International Serial Directories
http://ijrcm.org.in/
76
Brown et al (2010) analyzed the consumers‟ attitude towards European, Japanese and the US cars. The country – of – origin plays a significant role in the consumers‟ behaviour. The brand name, lower price and distributor‟s reputation completely have a significant impact on the sale of passengers‟ car. However, the present study differs from the above, in that, the buyer behaviour in Namakkal in Tamil Nadu is sought to be analyzed here. The scope and the area of the study are unique in nature. Dr. S. Subadra, Dr. K. M. Murugesan, Dr. R. Ganapathi,(2010)studied “The consumer perceptions and behaviour” with special reference to car owners in namakkal district .This study throws light on various features that the manufacturers should concentrate on to attract the prospective buyers. This study concludes that consumer behaviour plays a vital role in marketing cars and there is more scope for extensive research in this area.
RESEARCH METHODOLOGY SOURCES OF DATA PRIMARY DATA Here the primary data collected from retailers with appropriate questionnaire method. Questionnaire through contact and phone calls. SECONDARY DATA The secondary data that have already collected and published are referred through the company sales guide and web sites. RESEARCH TYPE DESCRIPTIVE RESEARCH Descriptive research was used. Research that uses a set of scientific methods and procedures to collect raw data and create data structures that describe the existing characteristics [eg: attitudes, intentions, preferences, purchase behaviors, evaluations of current marketing mix strategies] of a defined target population or market structure. QUESTIONNARE Research workers, private and public organizations and even by government in this method a questionnaire is sent to the persons concerned with the request to answer the questionnaire and return them. � For identify the demographic profiles of the respondents. � To study the interest and perception level towards the various attributes of TATALPT3118 compared to other trucks SAMPLE A randomly selected sub group of people or objects from over all membership pool of a defined target population. Here the sample size is 80 AREA OF STUDY The data collected from the following areas in and around Thoothukudi. SAMPLING UNITS The sampling unit consists of the one hundred respondents was decided taking into account the area of coverage and time available for the study in the district of Thoothukudi. SAMPLING METHOD The type of sampling conducted is Random sampling based on the convenience. DATA ANALYSIS AND INTERPRETATION STATISTICAL TOOLS � Chi square method � Percentage method LIMITATION OF THE STUDY The survey was limited to particular circle only. The respondents were less interested in answering the questionnaire, as they felt that it was an interruption to their regular work. The number of respondents was limited to 80 only. Some of the respondents are not open in giving their opinions. This is normal in any field study
INDUSTRY PROFILE Tata Motors is India’s largest automobile company. Established in 1945, it is also among the world’s top five manufacturers of medium and heavy trucks and the world's second largest medium and heavy bus manufacturer. It entered the passenger vehicles segment in 1991 and now ranks second in India's in this market. The company, formerly known as Tata Engineering and Locomotive Company, began manufacturing commercial vehicles in 1954 with a 15-year collaboration agreement with Daimler Benz of Germany. It has, since, developed Tata Ace, India's first indigenous light commercial vehicle, Tata Safari, India's first sports utility vehicle, Tata Indica, India's first indigenously manufactured passenger car, and the Nano, the world's cheapest car. Tata Motors has over 1,400 engineers and scientists in six R&D centres in India, South Korea, Spain and the UK. Its vehicles are exported to Europe, Africa, the Middle East, South and Southeast Asia and South America. Tata Motors' plants are located at Jamshedpur (eastern India), Pune (west), and Lucknow and Pantnagar (north). Tata Motors and Fiat have set up a common manufacturing facility at Ranjangaon, near Pune. The company is establishing a new plant at Sanand, Gujarat (western India). VST MOTORS The VST Motors Group is a well recognized brand name in India’s automobile dealership fraternity. The various companies in the group have long standing associations with multiple automobile manufacturers, generations of loyal customers, the local community and workforce and the finance and banking industry. The group comprises of various companies that deal in the retail and servicing of passenger cars, multi-utility vehicles and commercial vehicle across Tamilnadu. The relationship between an automobile dealer and its customers is an on-going relationship. It begins during the sales process and continues through with after sales support. Efficient and cost effective after-sales service and spare-parts availability is an important differentiator between a successful dealership and others. Government Investments and Finance company was started in 1983 to provide auto finance and loan options to our customers. We provide our new and existing customers with in-house finance options for the purchase of their vehicles throughout our branch network. TATA MOTORS VST Motors Pvt. Ltd was incorporated on 11th July, 1949 and is an authorized dealer for TATA Motors Ltd. Until 1956 the company was the distributor for Austin and Studebaker cars. In 1956 we were appointed as TELCO commercial vehicle dealers. Over the last five decades they have opened multiple branches across the state of Tamilnadu. The timeline is as follows: � 1949 VST Motors Pvt. Ltd commenced operations dealing in AUSTIN and STUDEBAKER Cars � 1956 Appointed as a TELCO dealer (presently Tata Motors), one of the first to be appointed in the country � 1957 VST Motors branch opened at Salem � 1958 VST Motors branch opened at Vellore � 1961 VST Motors branch opened at Thoothukudi � 1962 VST Motors branch opened at Cuddalore � 1978 VST Motors branch opened at Pondicherry � 1992 Commenced Tata Motors Passenger Car sales in Chennai and Thiruchirapalli PRODUCT PROFILE TATA LPT 3118 12 TYRE VECHICLE BRIEF TECHNICAL SPECIFICATION OF TATA LPT 3118 Engine 180 hp @ 2500 RPM Cummins Torque 650Nm @ 1500-1700 RPM

VOLUME NO. 2 (2012), ISSUE NO. 12 (DECEMBER
INTERNATIONAL JOURNAL OF RESEARCH IN COMA Monthly Double-Blind Peer Reviewed (Refereed
GVW 31000 kg Fuel Tank 400 ltr Front Axle weight 12000 kg (Front + Lift Axle)Rear Axle 19000 kg Gear Box G 750 Max Speed 77 kmph Battery 2X12 V, 150 Ah Unladen weight 7220 for Bare Chassis with Cowl
DATA ANALYSIS AND INTERPRETATION
Inference From the above table it’s found that, 31.25 % of the respondents using TATA LPT 3118 and 30 % of the respondents using other 40.
Inference: From the above table it’s found that, in TATA LPT 3118 most of the the respondents (21.25%) are 10th qualification
Inference From the above table it’s found that, in TATA LPT 3118 most of the respondents 35% are under the income level 226.25 % earning are in the income range above 6lakhs
TABLE 4 AWARENESS LE
Inference From the above table it’s found that, 81.25 % of the respondents comes under awareness of the product category and 18.75% of the respondents comes under awareness of the product category.
S. No
1
2
3
4
5
6
S.No
1
2
3
4
5
6
S. No
1
2
3
4
5
6
S.No
1
2
3
0
200
ECEMBER)
INTERNATIONAL JOURNAL OF RESEARCH IN COMPUTER APPLICATION Refereed/Juried) Open Access International e-Journal - Included in the International Serial Directories
http://ijrcm.org.in/
Front Axle weight 12000 kg (Front + Lift Axle)
7220 for Bare Chassis with Cowl
TABLE 1: AGE LEVEL OF THE RESPONDENTS
(Source: Primary Data)
From the above table it’s found that, 31.25 % of the respondents using TATA LPT 3118 and 30 % of the respondents using other
TABLE 2: QUALIFICATION OF THE RESPONDENTS
(Source: Primary Data)
From the above table it’s found that, in TATA LPT 3118 most of the respondents (40%) are 12th qualification, (22.5%) are
TABLE 3: INCOME LEVEL OF THE RESPONDENTS
(Source: Primary Data)
From the above table it’s found that, in TATA LPT 3118 most of the respondents 35% are under the income level 2-3lakhs and TABLE 4 AWARENESS LEVEL OF THE RESPONDENTS
(Source: Primary Data)
% of the respondents comes under awareness of the product category and 18.75% of the respondents comes under
S. No Age No.of Respondents Percentage
20-30 10 12.5
30-40 24 30
40-50 21 26.25
50-60 25 31.25
Above 60 0 0
Total 80 100
S.No Qualification No.of Respondents Percentage
10th 17 21.25
12th 32 40
UG 18 22.5
PG 13 16.25
Others 0 0
Total 80 100
S. No Income Level No of respondents Percentage
Below 2lakhs 10 12.5
2-3 lakhs 28 35
3-4 lakhs 21 26.25
Above 6lakhs 21 26.25
Others 0 0
Total 80 100
S.No Awareness No of Respondents Percentage
Yes 65 81.25
No 15 18.75
Total 80 100
0
200
yes no
Percentage
no of respondents
ISSN 2231-1009
PUTER APPLICATION & MANAGEMENT Included in the International Serial Directories
77
From the above table it’s found that, 31.25 % of the respondents using TATA LPT 3118 and 30 % of the respondents using other truck belong to age group of 30-
(22.5%) are Under Graduates and in other most of
3lakhs and in other most of the respondents
% of the respondents comes under awareness of the product category and 18.75% of the respondents comes under

VOLUME NO. 2 (2012), ISSUE NO. 12 (DECEMBER
INTERNATIONAL JOURNAL OF RESEARCH IN COMA Monthly Double-Blind Peer Reviewed (Refereed
TABLE 5: TATA LPT 2515 DIESEL
Inference From the above table it’s found that,36.25 % of the respondents comes under good diesel mileage and 25 % of the respondents comes under very good diesel mileage and 25 % of the respondents comes under not bad diesel mileage and 13.75 % of the respondents comes under poor diese
TABLE 6: TATA LPT
TABLE 7: TATA LPT 2515 PROFIT
Inference From the above table it’s found that, 52 % of the respondents comes level of profit margin and 21.25 % of the respondents comes under high level of profit margin.
S.NO AVAILABLE SPARE PART
1 VERY GOOD
2 GOOD
3 NOT BAD
4 POOR
5 OTHERS
S.No
1
2
3
4
5
S.No
1
2
3
ECEMBER)
INTERNATIONAL JOURNAL OF RESEARCH IN COMPUTER APPLICATION Refereed/Juried) Open Access International e-Journal - Included in the International Serial Directories
http://ijrcm.org.in/
TATA LPT 2515 DIESEL MILEAGE LEVEL OF THE RESPONDENTS
Source: Primary Data
respondents comes under good diesel mileage and 25 % of the respondents comes under very good diesel mileage and 25 % of the respondents comes under not bad diesel mileage and 13.75 % of the respondents comes under poor diese
TATA LPT 2515 MAINTENANCE LEVEL OF THE RESPONDENTS
Source: Primary data
TATA LPT 2515 PROFIT MARGIN LEVEL OF THE RESPONDENTS
Source: Primary Data
From the above table it’s found that, 52 % of the respondents comes under medium level of profit margin and 26.25 % of the respondents comes under low level of profit margin and 21.25 % of the respondents comes under high level of profit margin.
AVAILABLE SPARE PARTS NO.OF RESPONDENTS PERCENTAGE
VERY GOOD 24 30
GOOD 36 45
NOT BAD 17 21.2
POOR 3 3.75
OTHERS 0 0
S.No Maintenance No.of Respondents Percentage
Very good 15 18.75
Good 37 46.25
Not bad 18 22.5
Poor 10 12.5
Others 0 0
S.No Profit margin No.of Respondents percentage
High 17 21.25
Medium 42 52.5
Low 21 26.25
05
10152025303540
very
goo
d
goo
d
no
tbad
po
or
oth
ers
no of respondents
Percentage
01020304050
no of respondents
Percentage
0
50
100
hig
h
low
no of respondents
ISSN 2231-1009
PUTER APPLICATION & MANAGEMENT Included in the International Serial Directories
78
respondents comes under good diesel mileage and 25 % of the respondents comes under very good diesel mileage and 25 % of the respondents comes under not bad diesel mileage and 13.75 % of the respondents comes under poor diesel mileage.
under medium level of profit margin and 26.25 % of the respondents comes under low

VOLUME NO. 2 (2012), ISSUE NO. 12 (DECEMBER) ISSN 2231-1009
INTERNATIONAL JOURNAL OF RESEARCH IN COMPUTER APPLICATION & MANAGEMENT A Monthly Double-Blind Peer Reviewed (Refereed/Juried) Open Access International e-Journal - Included in the International Serial Directories
http://ijrcm.org.in/
79
TABLE 8: TATA LPT 3118 MAINTENANCE LEVEL OF THE RESPONDENTS
Source: Primary Data Inference From the above table it’s found that 19 of the respondents comes under very good level of maintenance and 35 % of the respondents comes under good level of maintenance and 6 of the respondents comes poor level of maintenance. 43.75 % of the respondents comes under good maintenance level and 25 % of the respondents comes under not bad maintenance level and23.75 % of the respondents comes under very good maintenance level and 7.5 % of the respondents comes under poor maintenance level.
TABLE 9: TATA LPT 3118 COMFORTNESS LEVEL OF THE RESPONDENTS
Source: Primary Data Inference From the above table it’s found that,56.25% of the respondents comes under good comfort level and 23.75% of the respondents comes under not bad level and 12.5 % of the respondents comes under very good comfort level 7.5% of the respondents comes under poor level
TABLE 10: TATA LPT 3118 AVAILABLABILITY OF SPARE PARTS
Inference From the above table it’s found that, 47.5 % of the respondents comes under not bad level and 25% of the respondents comes under good level and17.5 % of the respondents comes under poor level and10 % of the respondents comes under very good level
S No Maintenance No .of Respondents Percentage
1 Very good 19 23.75
2 Good 35 43.75
3 Not bad 20 25
4 Poor 6 7.5
5 Others 0 0
SNo Comfort No. of Respondents percentage
1 Very good 10 12.5
2 Good 45 56.25
3 Not bad 19 23.75
4 Poor 6 7.5
5 Others 0 0
S .NO AVAILABILITY OF SPARE PARTS NO.OF RESPONDENTS PERCENTAGE
1 VERY GOOD 8 10
2 GOOD 20 25
3 NOT BAD 38 47.5
4 POOR 14 17.5
5 OTHERS 0 0
verygood
good
No of respondents
verygood
good
notbad
poor

VOLUME NO. 2 (2012), ISSUE NO. 12 (DECEMBER) ISSN 2231-1009
INTERNATIONAL JOURNAL OF RESEARCH IN COMPUTER APPLICATION & MANAGEMENT A Monthly Double-Blind Peer Reviewed (Refereed/Juried) Open Access International e-Journal - Included in the International Serial Directories
http://ijrcm.org.in/
80
TABLE 11: YEARS OF USING THE TRUCK
Source: Primary Data Inference From the above table it’s found that, 36.25 % of the respondents comes under 6-9 years of using the truck and 30 % of the respondents comes under 3-6 years of using the truck and 26.25 % of the respondents comes under 1-3 years of using the truck and 7.2 % of the respondents comes under below 1 year of using the truck
STATISTICAL TOOLS - CHI-SUQUARE METHOD TABLE 1: Association between qualification level of the respondents and their awareness of vehicle Research hypothesis There is an association between qualification level of the respondents and their awareness of vehicle. Null hypothesis There is no association between qualification level of the respondents and their awareness of vehicle.
S.No Qualification Awareness of vehicle Statistical inference
Yes (n=65) No (n=15)
1 10th 15 (88.2%) 2 (11.8%) X2=4.655 Df = 3 P > 0.05 Not Significant
2 12th 24 (75%) 8 (25%)
3 UG 17 (94.4%) 1 (5.6%)
4 PG 9 (69.2%) 4 (30.8%)
Source: Primary Data Inference The above table shows that , there is no significant association between qualification level of the respondents and their awareness of vehicle since the calculated value was greater than table value.So the research hypothesis was rejected and the null hypothesis was accepted. TABLE 2: Association between income level of the respondents and their awareness of vehicle Research hypothesis There is a significant association between income level of the respondents and their awareness of vehicle. Null hypothesis There is no significant association between income level of the respondents and their awareness of vehicle.
S.No Income level Awareness of vehicle Statistical inference
Yes (n=65) No (n=15)
1 Below 2 6 (60%) 4 (40%) X2=9.545 Df = 3 P > 0.05 Not Significant
2 2 to 4l 26 (92.9%) 2 (7.1%)
3 4 to 6l 19 (90.5%) 2 (9.5%)
4 6 to 8l 14 (66.7%) 7 (33.3%)
Source: Primary Data Inference The above table shows that there is no significant association between income level of the respondents and their awareness of vehicle since the calculated value was greater than table value. So the research hypothesis rejected and the null hypothesis accepted. TABLE 3: Association between age level of the respondents and maintenance of their vehicle Research hypothesis There is an association between age level of the respondents and maintenance of their vehicle. Null hypothesis There is no significant association between age level of the respondents and maintenance of their vehicle.
S. No Years of using No.of Respondents Percentage
1 Below 1 year 6 7.2
2 1-3 years 21 26.25
3 3-6 years 24 30
4 6-9 years 29 36.25
5 Above 9 years 0 0
0
10
20
30
40
Below one year1-3 years3-6 years6-9 yearsabove 9 years
no fo respondece
average

VOLUME NO. 2 (2012), ISSUE NO. 12 (DECEMBER) ISSN 2231-1009
INTERNATIONAL JOURNAL OF RESEARCH IN COMPUTER APPLICATION & MANAGEMENT A Monthly Double-Blind Peer Reviewed (Refereed/Juried) Open Access International e-Journal - Included in the International Serial Directories
http://ijrcm.org.in/
81
S.No age Maintenance of their vehicle Statistical inference
Very good (n=15) Good (n=37) Not bad (n=17) Poor (n=11)
1 30 to 40 2 (20%) 3 (30%) 5 (50%) 0 X2=8.723 Df = 9 P > 0.05Not Significant
2 40 to 50 6 (25%) 12 (50%) 3 (12.5%) 3 (12.5%)
3 50 to 60 4 (19%) 10 (47.6%) 4 (19%) 3 (14.3%)
4 Above 60 3 (12%) 12 (48%) 5 (20%) 5 (20%)
Source: Primary Data Inference The above table shows that there is no significant association between age level of the respondents and maintenance of their vehicle since, the calculated value was greater than the table value. So the research hypothesis rejected and the null hypothesis accepted TABLE 4: Association between income level of the respondents and profit margin of their vehicle
Sl.no Income level Profit margin of their vehicle Statistical inference
Very good (n=35) Good (n=33) Not bad (n=12)
1 Below 2 4 (40%) 5 (50%) 1 (10%) X2=2.811 Df = 6 P > 0.05 Not Significant
2 2 to 4l 14 (50%) 9 (32.1%) 5 (17.9%)
3 4 to 6l 7 (33.3%) 10 (47.6%) 4 (19%)
4 6 to 8l 10 (47.6%) 9 (42.9%) 2 (9.5%)
Source: Primary Data Inference The above table shows that there is no significant association between income level of the respondents and profit margin of their vehicle since the calculated value was greater than the table value. TABLE 5: Association between qualification level of the respondents and comfort of their vehicle Research hypothesis There is a significant association between qualification of the respondents and their satisfaction of track comfort. Null hypothesis There is no significant association between qualification of the respondents and their satisfaction of track comfort.
S.No Qualification comfort of their vehicle Statistical inference
Satisfied (n=20) Dissatisfied (n=42) High satisfied (n=18)
1 10th 8 (47.1%) 9 (52.9%) 0 X2=21.328 Df = 6 P < 0.05 Significant
2 12th 3 (9.4%) 17 (53.1%) 12 (37.5%)
3 UG 2 (11.1%) 12 (66.7%) 4 (22.2%)
4 PG 7 (53.8%) 4 (30.8%) 2 (15.4%)
Source: Primary Data Inference The above table shows that there is a significant association between qualification level of the respondents and their satisfaction of track comfort since the calculated value was less than the table value. TABLE 6: Association between awareness about 12 tyre of the respondents and brand reputation of their vehicle. Research hypothesis There is a significant association between awareness about 12 tyre of the respondents and brand reputation of their vehicle. Null hypothesis There is no significant association between awareness about 12 tyre of the respondents and brand reputation of their vehicle.
S.No Awareness of 12 tyre Brand reputation Statistical inference
Excellent (n=47) Very good (n=33)
1 Yes 37 (56.9%) 28 (43.1%) X2=.477 Df = 1 P > 0.05 Not Significant
2 No 10 (66.7%) 5 (33.3%)
Source: Primary Data Inference The above table shows that there is no significant association between awareness about 12 tyre of the respondents and brand reputation of their vehicle since the calculated value was greater than the table value. TABLE 7: Association between awareness about 12 tyre of the respondents and new model variety of their vehicle Research hypothesis There is a significant association between awareness about 12 tyre of the respondents and new model variety of their vehicle. Null hypothesis There is no significant association between awareness about 12 tyre of the respondents and new model variety of their vehicle.
S.No Q7 Q27 Statistical inference
Certainly (n=53) Uncertain (n=27)
1 Yes 45 (69.2%) 20 (30.8%) X2=1.378 Df = 1 P > 0.05 Not Significant 2 No 8 (53.3%) 7 (46.7%)
Source: Primary Data

VOLUME NO. 2 (2012), ISSUE NO. 12 (DECEMBER) ISSN 2231-1009
INTERNATIONAL JOURNAL OF RESEARCH IN COMPUTER APPLICATION & MANAGEMENT A Monthly Double-Blind Peer Reviewed (Refereed/Juried) Open Access International e-Journal - Included in the International Serial Directories
http://ijrcm.org.in/
82
Inference The above table shows that there is no significant association between awareness about 12 tyre of the respondents and new model variety of their vehicle. Since the calculated value greater than table value.
3.1 FINDINGS OF THE STUDY 31.3% of the respondents using TATA LPT 3118 truck being surveyed are among the age above 60years.22.5% of the respondent who are belongs under graduates and 22.1% of the respondent are belong below higher secondary are using TATA LPT 3118.The respondent who belongs to the income level of 4lakhs-6lakhs constitutes 26.3% are using tatalpt3118.The respondents who have already aware about tatalpt3118 12 tyre trucks are 81.3%.36.3% of the respondent are good intend about tatalpt2515.46.3% of the respondent is good maintenance in tatalpt2515.56.5% of the respondent is medium level of profit margin and 26.3% of the respondent is low level.37.3% of the respondent is not bad about comfort in tatalpt2515 and 33.3% of the respondent is good about comfort. 30% of the respondent are very good spare parts and 45% are good about spare parts. 42.5% of the respondent has accepted good diesel mileage in tatalpt3118and beyond 5% of the respondent only not accept.43.8% of the respondent has agreed tatalpt3118 is good maintenance free truck. The respondents who have high level of profit margin in tatalpt3118 are 43.8%. 56.3% of the respondent is good about comfort in tatalpt3118 and 7.5% of the respondent is only bad about comfort. 47.5% of the respondent is not bad spare parts in tatalpt3118 and 25% are good about spare parts.38.3% of the respondents are good about lpt3118‘s tyre mileage and 25% of the respondents are very good of tyre mileage. 25% of the respondents are satisfied and 18% of the respondents are highly satisfied about comfort in tatalpt3118. 50.5% of the respondent are having very good opinion on after sales service offered by the dealer. The respondent who have been agreed about the price is medium are 68.5%. While purchasing tatalpt3118 the major factor considered by the respondent is BRAND REPUTATION (58.9%).While driver preferring the truck most important to note is safeness but in tatalpt3118 is highly safe71%.Financial availability for tatalpt3118is high 60% of the respondent.66% of the respondents have highly recommended Tatalpt3118.
SUGGESTION TATA LPT 3118 truck provide more benefits to customer the Lift Axle mechanism and Cummins engine- British oriented facility to satisfy the more customer expectation. The customer expect more services from TATA motors the customer desire to maintain the customer relationship between the dealers and it should improve the availability of spare parts and other service. The company needs to create more product awareness through conduct awareness programme, frequent mechanic service and how to handle the tools of TATA spare parts and also increase the after sales service to customer. The company has to provide more product advertisement and have to increase more free trails and demonstration methods. In this way they can easily achieve their revenue and improve their sales.
CONCLUSION The most of the consumer have preferred TATA LPT 3118 12 tyre truck because of , Lift Axle mechanism, good mileage, tyre mileage, comfortness, price, heavy duty carrying capacity etc, even though they are expecting more services from the company. They are expecting adequate spare parts usage, more mechanic service and dealership relation from the TATA limited. The company has to improve spare parts supply in local market and need to create the product and tools awareness to customer and local mechanics. The company has to implement more innovational ideas to improve their sales and revenues.
REFERENCES 1. Bruner, Gordon C., “The Effect of Problem Recognition Style an Information Seeking”, Journal of the Academy of Marketing Science, Vol.15, Winter, 1987,
p.67. 2. Chidambaram and Alfread, “A Study on Brand Preference of Passenger Car with Reference to Coimbatore City”, Indian Journal of Marketing, Vol.34, No.9,
September 2007, p.30. 3. Clement Sudhakar J., and Venkatapathy R., “A Study on Automobile Purchase – Peer Influence in Decision Making”, Indian Journal of Marketing, Vol.35,
No.6, June 2009, p.16. 4. Dr. S. Subadra, Dr. K. M. Murugesan, Dr. R. Ganapathi, “The consumer perceptions and behaviour” with special reference to car owners in Namakkal
district ,APJRBM Volume 1, Issue 3 (December, 2010) 5. Punj, Girish N. and Richard Staelin, “A Model of Consumer Information Search behavior for New Automobiles”, Journal of Consumer Research, Vol.9,
March 1983, p.51. 6. Traylor, Mark and B.Benoy Joseph, “Measuring Consumer Involvement in products; Developing a General Scale”, Psychology and Marketing, Vol.1,
(summer) 1984, p.16. 7. Vikas Mehra, “Analysis of Consumer‟s Purchase Behaviour in Indian Mid-sized Car Segment”, Apeejay Business Review, Vol.5, No.1, January – June 2004,
p.19.

VOLUME NO. 2 (2012), ISSUE NO. 12 (DECEMBER) ISSN 2231-1009
INTERNATIONAL JOURNAL OF RESEARCH IN COMPUTER APPLICATION & MANAGEMENT A Monthly Double-Blind Peer Reviewed (Refereed/Juried) Open Access International e-Journal - Included in the International Serial Directories
http://ijrcm.org.in/
83
EMPLOYEE ABSENTEEISM IN HEALTH CARE INDUSTRY: A CONCERN FOR THE ORGANIZATION
DR. C. SWARNALATHA
HEAD
DEPARTMENT OF MANAGEMENT STUDIES
ANNA UNIVERSITY OF TECHNOLOGY
MADURAI
T.S. PRASANNA
RESEARCH SCHOLAR
ANNA UNIVERSITY OF TECHNOLOGY
MADURAI
ABSTRACT
Employee’s presence at work place during the scheduled time is highly essential for the smooth running of the production process in particular and the
organization in general. Despite the significance of their presence, employees sometime fail to report at the work place during the scheduled time, which is
known as ‘absenteeism’. Labour bureau, Simla, defined the term ‘absenteeism’ as “the failure of a worker to report for work when he is scheduled to work”. It
also states that “absenteeism is the total man-shifts lost because of absence as a percentage of the total number of man-shifts scheduled to work”. According to
Webster’s Dictionary, “absenteeism is the practice or habit of being an ‘absence’ and an absentee is one who habitually stays away”. This paper provides a
theoretical framework for “Employee Absenteeism”.
KEYWORDS Absence; Failure of work; Absenteeism Cost; Absenteeism Rate; Frequency Rate; Severity Rate.
INTRODUCTION n any human resource costing application, it is important first to define exactly what is being measured. From a business standpoint, absenteeism is any failure of an employee to report for or to remain at work as scheduled, regardless of reason. The term “as scheduled” is very significant, for it automatically excludes vacations, holidays, jury duty, and the like. It also eliminates the problem of determining whether an absence is “excusable” or not.
Medically verified illness is a good example. From a business perspective, the employee is absent and is simply not available to perform his or her job; that absence will cost money.
TYPES OF ABSENTEEISM Absenteeism is of four types. They are, (i) Authorized Absenteeism If an employee absents himself from work by taking permission from his superior and applying for leave, such absenteeism is called authorized absenteeism. (ii) Unauthorized Absenteeism If an employee absents himself from work without informing or taking permission and without applying for leave, such absenteeism is called unauthorized absenteeism. (iii) Willful Absenteeism If an employee absents himself from duty willfully, such absenteeism is said to be willful absenteeism. (iv) Absenteeism caused by circumstances beyond one’s control It is absenteeism where an employee absents himself from duty owing to the circumstances beyond his control like involvement in accidents or sudden sickness.
FEATURES OF ABSENTEEISM Research studies undertaken by different authors reveal the following. (i) The rate of absenteeism is the lowest on pay day; it increases considerably on the days following the payment of wages and bonus. (ii) Absenteeism is generally high among the workers below 25 years of age and those above 40 years of age. (iii) The rate of absenteeism varies from department to department within an organization. Generally, it is high in the production department. (iv) Absenteeism in traditional industries is seasonal in character.
CALCULATION OF ABSENTEEISM RATE Absenteeism can be calculated with the help of the following formula. Absenteeism Rate = Number of Man days lost -------------------------------------------------- * 100 Number of Man days scheduled to work Absenteeism rate can be calculated for different employees and for different time periods like month and year. The frequency rate reflects the incidence of absence and is usually expressed as the number of separate absence in a given period, irrespective of length of absences. The frequency rate represents the average number of absences per worker in a given period. Frequency Rate = Total number of times in which the leave was availed ------------------------------------------------------------------ * 100 Total number of Man days scheduled to work Severity Rate is the average length of time lost per absence and is calculated by using the following formula. Severity Rate = Total number of days absent during a period ------------------------------------------------------------ * 100 Total number of times absent during that period
I

VOLUME NO. 2 (2012), ISSUE NO. 12 (DECEMBER
INTERNATIONAL JOURNAL OF RESEARCH IN COMA Monthly Double-Blind Peer Reviewed (Refereed
A high severity rate indicates that the employee is absent for longer durations each time. High frequency and severity rates more frequently and for longer durations each time resulting in high
CATEGORIES OF ABSENTEEISM K.N. Vaid classifies chronic absentees in to five categories.A. ENTREPRENEURS These absentees consider that their jobs are very small for their total interest and personal goals. They engage themto fulfill their goals. B. THE STATUS SEEKERS They enjoy or perceive a higher ascribed social status and are keen on maintaining it.C. THE EPICUREANS These classes of absentees do not like to take up the jobs whichand status but are unwilling to work for their achievement.D. FAMILY-ORIENTED They are often identified with the family activities. E. THE SICK AND OLD These categories of absentees are mostly unhealthy, with a weak constitution or old people.
FIGURE 1
INTERPRETATION The above figure explains that personal illness contributes for 40%, family issues to 21%, personal needs to 20%, Ent5% of the causes for unscheduled absences.
CAUSES OF ABSENTEEISM There are contrasting views on the causes of absenteeism. According to one school of thought, absenteeism is due to lack of cworkers. Various research studies on absenteeism have revealed different causes of absenteeism. The causes can be grouped intOrganizational factors, environmental factors and personal factors.I. ORGANIZATIONAL FACTORS The following organizational factors have found to be responsible for absenteeism.a. Monotonous work. b. Leniency towards absenteeism causes high rate of absenteeism.c. Appointment of temporary/ casual workers leads to high absenteeism.d. Militant attitude of trade union also cause high absenteeism as workers become frustrated because of these attitudes.II. ENVIRONMENTAL FACTORS The environmental factors can further be classified to Socioa. Socio-Economic Factors 1. Due to migratory nature of labour force in India, workers do not develop emotional belongingness with their workplaces, hence their high absence.2. Workers generally live in unhygienic and poor economic conditions. Because of these conditions, they lack commitment to their
absence. 3. Workers generally have more number of dependent children. Coupled with unhygienic living conditions, they face the problem of
which results in to absenteeism. b. Religious and cultural factors Indian population consists of muli-religious and cultural groups with each group having its own religious festivals, customs and traditions. Often, these festivtake considerable time to celebrate. It has been observed that during these festivals, absenteeism rate is quiteIII. PERSONAL FACTORS Personal causes for absenteeism are as follows. a. Unskilled and young workers have higher rate of absence because of their own personal problems.b. Woman workers are more prone to absenteeism because of their personal and family c. Workers who are alcoholic and drug addict show higher tendency of absenteeism.d. Indebtedness of workers causes absenteeism. e. Some workers tend to be chronically absentees because of their personality factors or because of their other problems.
Stress5%
Entitlement Mentality
14%
Personal Needs20%
Reasons for Unscheduled Absences
ECEMBER)
INTERNATIONAL JOURNAL OF RESEARCH IN COMPUTER APPLICATION Refereed/Juried) Open Access International e-Journal - Included in the International Serial Directories
http://ijrcm.org.in/
A high severity rate indicates that the employee is absent for longer durations each time. High frequency and severity rates more frequently and for longer durations each time resulting in high absenteeism even in absolute terms.
K.N. Vaid classifies chronic absentees in to five categories.
These absentees consider that their jobs are very small for their total interest and personal goals. They engage themselves in other social and economic activities
They enjoy or perceive a higher ascribed social status and are keen on maintaining it.
These classes of absentees do not like to take up the jobs which demand initiative, responsibility, discipline and discomfort. They wish to have money, power, and status but are unwilling to work for their achievement.
es of absentees are mostly unhealthy, with a weak constitution or old people.
FIGURE 1: REASONS FOR UNSCHEDULED ABSENCES
The above figure explains that personal illness contributes for 40%, family issues to 21%, personal needs to 20%, Entitlement mentality 14% and stress for about
There are contrasting views on the causes of absenteeism. According to one school of thought, absenteeism is due to lack of cworkers. Various research studies on absenteeism have revealed different causes of absenteeism. The causes can be grouped intOrganizational factors, environmental factors and personal factors.
organizational factors have found to be responsible for absenteeism.
Leniency towards absenteeism causes high rate of absenteeism. Appointment of temporary/ casual workers leads to high absenteeism.
use high absenteeism as workers become frustrated because of these attitudes.
The environmental factors can further be classified to Socio-economic factors and Religious-cultural factors.
of labour force in India, workers do not develop emotional belongingness with their workplaces, hence their high absence.Workers generally live in unhygienic and poor economic conditions. Because of these conditions, they lack commitment to their
Workers generally have more number of dependent children. Coupled with unhygienic living conditions, they face the problem of
religious and cultural groups with each group having its own religious festivals, customs and traditions. Often, these festivtake considerable time to celebrate. It has been observed that during these festivals, absenteeism rate is quite high.
Unskilled and young workers have higher rate of absence because of their own personal problems. Woman workers are more prone to absenteeism because of their personal and family problems. Workers who are alcoholic and drug addict show higher tendency of absenteeism.
Some workers tend to be chronically absentees because of their personality factors or because of their other problems.
Family Issues21%
Personal Illness40%
Reasons for Unscheduled Absences
Family Issues
Personal Illness
Stress
Entitlement Mentality
Personal Needs
ISSN 2231-1009
PUTER APPLICATION & MANAGEMENT Included in the International Serial Directories
84
A high severity rate indicates that the employee is absent for longer durations each time. High frequency and severity rates indicate that the employee is absent
selves in other social and economic activities
demand initiative, responsibility, discipline and discomfort. They wish to have money, power,
itlement mentality 14% and stress for about
There are contrasting views on the causes of absenteeism. According to one school of thought, absenteeism is due to lack of commitment on the part of workers. Various research studies on absenteeism have revealed different causes of absenteeism. The causes can be grouped into three categories.
use high absenteeism as workers become frustrated because of these attitudes.
of labour force in India, workers do not develop emotional belongingness with their workplaces, hence their high absence. Workers generally live in unhygienic and poor economic conditions. Because of these conditions, they lack commitment to their work which causes
Workers generally have more number of dependent children. Coupled with unhygienic living conditions, they face the problem of sickness quite frequently
religious and cultural groups with each group having its own religious festivals, customs and traditions. Often, these festivals
Some workers tend to be chronically absentees because of their personality factors or because of their other problems.
Family Issues
Personal Illness
Stress
Entitlement Mentality
Personal Needs

VOLUME NO. 2 (2012), ISSUE NO. 12 (DECEMBER) ISSN 2231-1009
INTERNATIONAL JOURNAL OF RESEARCH IN COMPUTER APPLICATION & MANAGEMENT A Monthly Double-Blind Peer Reviewed (Refereed/Juried) Open Access International e-Journal - Included in the International Serial Directories
http://ijrcm.org.in/
85
MEASURES TO CONTROL ABSENTEEISM Absenteeism is a serious problem which affects both organizations and employees. While organizations have to bear extra costs, employees have to suffer in the form of lower earnings because of absenteeism. From the national point of view, absenteeism is a negative factor because it affects national output adversely. Therefore, measures should be adopted to control absenteeism so as to bring it to the lowest possible level. (I) ADOPTION OF SUITABLE RECRUITMENT PROCEDURE The magnitude of absenteeism can be reduced to some extent by adopting a suitable recruitment and selection procedure which can eliminate those candidates who are likely to show the tendency of being chronic absentees. For this purpose, more emphasis should be given on aptitude and personality factors rather than merely on knowledge and ability factors. (II) CONGENIAL WORK ENVIRONMENT Lack of congenial work environment, both physical and emotional, is one of the major factors for absenteeism. Poor working conditions lead to tardiness, disinterest, and work alienation. In order to overcome these, employees try to seek satisfaction elsewhere. Therefore, absenteeism can be controlled by providing good physical conditions at the workplace. Besides, the employees should be provided emotional support through good leadership and supervision, interpersonal relations, and development of healthy work groups. (III) TRAINING AND COUNSELING Employee should be provided training for developing their competence and modifying their attitudes towards work. Similarly, those employees who show higher level of absenteeism should be provided counseling to overcome their personal and family problems since these problems cause absenteeism. (IV) EMPLOYEE WELFARE MEASURES Absenteeism can be controlled by providing various welfare measures such as housing around the workplace, educational facilities, and facilities to their children, etc. Similarly, other welfare measures to overcome employee’s occasional problems such as illness, marriages in their families, and any other hardships. Similarly, social security measures such as provident fund, superannuation fund, gratuity, etc., should be provided to develop belongingness to the organization. Special awards and incentives may be provided to employees showing higher level of attendance. (V) TWO-WAY COMMUNICATION AND PROMPT REDRESSAL OF GRIEVANCES There should be emphasis on two-way communication – upward and downward – so that employees get opportunity to air their views and feelings. This encourages them to develop positive attitudes towards the organization. Similarly, if employees have grievances, there should be prompt redressal of these which provides them satisfaction. If possible, grievances should be redressed at the initial stage itself. (VI) OTHER MEASURES Besides the above measures, organizations can adopt the following measures to control absenteeism. a. Organizations can seek the cooperation of trade unions to control excessive absenteeism. b. Disciplinary actions and other penal provisions should be made in consultation with trade unions to control the chronic absentees. c. Leave provisions should be made in such a way that these fulfill the genuine requirements of the employees. d. Proper records of absence along with causes of absence should be maintained and analyzed to develop measures for controlling absenteeism.
CONCLUSION Absenteeism affects the organization from multiple angles. It severely affects the production process and the business process. The effect of unauthorized absenteeism is more compared to other types of absenteeism. However, it would be difficult to completely avoid absenteeism. The management can minimize absenteeism by employing measures to control it. However, the loss so generated as a result of absenteeism remains a vital concern for the management.
REFERENCES 1. C.M. Mason & M.A. Griffin, (2003), “Group absenteeism and positive affective tone: A longitudinal study”, Journal of organizational behavior, 24, pp 667-
687. 2. D.R. Dalton & D.J. Mesch, (1991), “On the extent and reduction of avoidable absenteeism: An assessment of absence policy provisions”, Journal of Applied
Psychology, 76, pp 810-817. 3. D.R. Ilgen & J.H. Hollenback, (1977), “The role of job satisfaction in absence behavior”, Organizational behavior and human performance, 19, pp 148-161. 4. E.W. Larson & C.V. Fukami, (1985), “Employee Absenteeism: The role of ease of movement”, Academy of management journal, 28, pp 464-471. 5. G. Chen, (2005), “Newcomer adaptation in teams: Antecedents and outcomes”, Academy of management journal, 48, pp 101-116. 6. G.J. Blau, (1986), “Job involvement and organizational commitment as interactive predictors of tardiness and absenteeism”, Journal of Management, 12,
pp 577-584. 7. I.R. Gellatly, (1995), “Individual and group determinants of employee absenteeism: Test of a causal model”, Journal of organizational behavior, 16, pp 469-
485. 8. J. Harvey & N. Nicholson, (1999), “Minor illness as a legitimate reason for absence”, Journal of Organizational behavior, 20, pp 979-993. 9. J.P. Leigh, (1985), “The effects of unemployment and the business cycle on absenteeism”, Journal of economics and business, 37, pp 159-170. 10. J.P. Meyer & N.J. Allen, (1991), “A three-component conceptualization of organizational commitment”, Human Resource Management Review, 1, pp 61-89. 11. L.M. Prasad, (2005), Human Resource Management, 5th Edition, Sultan Chand & Sons, pp 683-687. 12. M. Fichman, (1989), “Attendance makes the heart grow fonder: A hazard rate approach to modeling attendance”, Journal of Applied Psychology, 74, pp
325-335. 13. N. Nicholson & G. Johns, (1985), “The absence culture and the psychological contract: Who’s in control of absence?” Academy of management review, 10,
pp 397-407. 14. P. Bamberger & M. Biron, (2007), “Group norms and excessive absenteeism: The role of peer referent others”, Organizational behavior and human decision
processes, 103, pp 179-196. 15. P. Subba Rao, (2007), Essentials of Human Resource Management and Industrial Relations, 3rd revised edition, Himalaya Publishing House, pp 265-268. 16. P.M. Muchinsky, (1977), “Employee absenteeism: A review of the literature”, Journal of vocational behavior, 10, pp 316-340. 17. P.P. Brooke, (1986), “Beyond the Steers and Rhodes model of employee attendance”, Academy of Management Review, 11, pp 345-361. 18. P.R. Monge, (1990), “Theoretical and analytical issues in studying organizational processes”, Organizational science, 1, pp 406-430. 19. R.D. Hackett, (1989), “Work attitudes and employee absenteeism: A synthesis of the literature”, Journal of Occupational Psychology, 62, pp 235-248. 20. R.M. Steers & S.R. Rhodes, (1978), “Major influences on employee attendance: A process model”, Journal of applied psychology, 63, pp 391-407. 21. Robert L. Mathis & John H. Jackson, (2003), Human Resource Management, 10th Edition, Thomson South – Western, pp 75-79. 22. S.E. Markham, (1985), “An investigation of the relationship between unemployment and absenteeism: a multi-level approach”, Academy of management
journal, 28, pp 228-234. 23. S.E. Markham, F. Dansereau & J.A. Alutto, (1982), “Group size and absenteeism rates: A longitudinal analysis”, Academy of management journal, 25, pp
921-927. 24. S.P. Brown, (1996), “A meta-analysis and review of organizational research on job involvement”, Psychological bulletin, 120, pp 235-255. 25. T.E. Becker, (1992), “Foci and bases of commitment: Are they distinctions worth making?” Academy of Management Journal, 35, pp 232-244. 26. T.H. Hammer & J. Landau, (1981), “Methodological issues in the use of absence data”, Journal of Applied Psychology, 66, pp 574-581. 27. Wayne F. Cascio & Ranjeet Nambudiri, (2008), Managing Human Resources, Productivity, Quality of Work life, Profits, 8th Edition, Tata Mc Graw Hill Edition,
pp 49-53.

VOLUME NO. 2 (2012), ISSUE NO. 12 (DECEMBER) ISSN 2231-1009
INTERNATIONAL JOURNAL OF RESEARCH IN COMPUTER APPLICATION & MANAGEMENT A Monthly Double-Blind Peer Reviewed (Refereed/Juried) Open Access International e-Journal - Included in the International Serial Directories
http://ijrcm.org.in/
86
WEB CONTENT TRUST ASSESSMENT MODEL USING ADVANCE WEB MINING TECHNIQUES
KETAN.J.PATEL
ASST. PROFESSOR
ACHARYA MOTIBHAI PATEL INSTITUTE OF COMPUTER STUDIES
GANPAT UNIVERSITY
GANPAT VIDYANAGAR
KETAN.D.PATEL
ASST. PROFESSOR
ACHARYA MOTIBHAI PATEL INSTITUTE OF COMPUTER STUDIES
GANPAT UNIVERSITY
GANPAT VIDYANAGAR
DR. V. R. RATHOD
HEAD (RETD.)
DEPARTMENT OF MCA
BHAVANGAR UNIVERSITY
BHAVANGAR
ABSTRACT
The growth of internet is phenomenal. However the growth of e-commerce and online business activities are low compared to other activities such as increasing
the speed, email, chat, surfing, etc. The main reason behind the low online e-commerce & business activities is the lack of online security and trust. People in the
country like India are afraid to transfer their personal data online because of lack of security and trust on the web site. There is no perfect automated model
available where one can review the trustworthiness of web sites based on contents. Through this paper, researchers have tried to fill the gap by proposing a
model which analyses the web site contents and generate accuracy level of web site trustworthiness.
KEYWORDS Trustability, Web Content Mining, Web Trust.
INTRODUCTION nternet is a giant network which connects world through computers. The Internet was introduced by ARPANET in 1969 [9]. The use of the internet has increased in structure and usages. Total growth of the internet usage from year 2000 to 2010 is 1520 %. [9] Internet usage is increased but no change in information trustworthiness is observed. Research communities continue to work on web trust including user online security, integrity and trustworthiness
of web content [8]. Trustworthiness is more than merely an important attribute of a website. This paper proposes an effective web content trust assessment model (WCTAM) for evaluation of web sites for its trust ability using web mining techniques. Web mining is an application of data mining. Web mining is a technique to extract knowledge from web data. Web mining has three categories like Web content mining, Web structure mining and Web usage mining. Using Web content mining extracts and integrates useful data, information and knowledge from web page contents. An effective trust assessment tool must be able to correctly identify and determine the trustworthiness level of sites. Web site contents, such as text and other meta-data are analyzed using Web content mining then after assessment techniques are applied on that data. After that, WCTAM will classify the web site according to its contents in three categories like high trust worthy, mid trust worthy and low trust worthy.
RELATED WORK MODEL OF TRUST IN ECOMMERCE Florian N. Egger developed a model of trust in eCommerce which is known as MoTEC (model of trust in eCommerce) which classifies the characteristics of trust in e-commerce in terms of company, security policy, product , usability , policy, return policy, and warranty policy. [8] THIRD PARTY REGULATION In any web site the online trade communities’ is self regulated. Such self-regulation increases the growth of trust among consumers. By participation in status-based scheme which provides a seal (i.e. proving trustmarks or log). Once the web site satisfies minimum trust criteria, seal is provided. In website any violation done then the seal is withdraw. There are two most popular trust label programs such as:
• TRUSTe ( www.trust.org)
• BBBOnLine (www.bbbonline.org). TRUSTe organization mission is to build trust in the Internet by promoting principal of disclosure. TRUSTe organization is non-profitable organization. Privacy is main trust criteria in TRUSTe system. If any online organization requests, TRUSTe checks the organization’s web site.[3]. If web site establishes privacy principles, meets the core criteria and is willing to fulfill with oversight the consumer resolutions procedures, the TRUSTe seal can be provided to the website. Similarly, the BBBOnLine Privacy program offers a ‘seal’ to websites which post online privacy policies and meet the principles of the Better Business Bureau (disclosure, choice and security). It also monitors compliance and applies specific sanctions for non-compliance [4]. Trust label programs require vigilance in their monitoring to ensure whether the privacy standards are upheld. However, a recent survey shows that people do not seem to understand privacy seal programs [1]. W3 TRUST MODEL W3 Trust model (W3TM) approach is to utilize a metadata mechanism to extract hidden trust information from web documents and other sources to enable trust assessments. Based on the result of trust assessments, Web users can be made informed about business decisions. Hence, user confidence can be enhanced. Figure 1 shows how W3TM calculates the trust weight. W3TM use three categories like Category A (Service Information), Category B (Reputation, legal requirement) and Category C (Digital certificate information) for calculation of TT. [11]
I

VOLUME NO. 2 (2012), ISSUE NO. 12 (DECEMBER) ISSN 2231-1009
INTERNATIONAL JOURNAL OF RESEARCH IN COMPUTER APPLICATION & MANAGEMENT A Monthly Double-Blind Peer Reviewed (Refereed/Juried) Open Access International e-Journal - Included in the International Serial Directories
http://ijrcm.org.in/
87
FIGURE 4: W3TM: TRUST WEIGHT ASSESSMENT CALCULATION
Formal Trust calculation base on TT=tt(P,Q,S)=[A+(B+C)/2+S]/3 The main disadvantage of this approach is that W3TM is only prototype not implementation tool and W3TM uses only meta-data.
PROPOSED APPROACH From the above discussion it is clear that existing models work on policy statements and seal programs to validate trust on web site. But there is no proper model which will validate the trust based on the contents of web site. Our model WCTAM validates the web site for trust worthiness based on the contents. WCTAM is used to collect information from web source and then information repository is prepared. Then we apply the content processing and generate score. Here, automated classified techniques are used for trust evaluations. Figure 3 shows the steps of WCTAM.
INFORMATION COLLECTION
Web information study has its root in information retrieval (IR). For such study it requires large collection of information from web documents. Traditional IR assumes that the basic information unit is document or a large collection of documents is available to form text data base [6]. For web, the large collection of documents is web pages. As a result, we can use web crawler for collection of information. Web crawlers are used to prepare information repository.
CONTENT PROCESSING The web page data are unstructured so, it requires preprocessing. Techniques like content processing are used for data preprocessing. Figure 2 shows the steps of content processing. In Figure 2, Parsing means (I) to remove noisy information like HTML tags such as font, table, heading etc., (II) stop word removal process (III) tokenization of documents. After parsing, the process for extraction of term is applied on clean documents and the data are represented in vector space model. The term frequency (TF) approach is used to normalize the document length. For each term ti and each document dj, the TF (ti ,dj ) measure is computed. For calculation of TF we can use the techniques like Sum of terms counts overall term, Maximum of term count over all terms in document and Log scale condition the term count. We use log scale condition the term count.[6,7] technique because the complexity of this approach is O(log n).
��� , �� = � 0 if ��� = 01 + log1 + log ���� if ��� > 0�
FIGURE 2: CONTENT PROCESSING
��� , �� = � 0 if ��� = 01 + log1 + log ���� if ��� > 0�
The basic idea of the inverse document frequency (IDF) approach is to scale down the coordinates for some axes, corresponding to terms occurring in many documents. So, according to their occurrences we can assign the weight to each term.[6,7]
����� = !"# 1 + |�||�%&|
In the TFIDF representation each coordinate of the document vector is computed as a product of its TF and IDF components [6].
�� = ��� , �� �����
The basic idea of the Inverse Document Frequency (IDF) approach is to scale down the coordinates for some axes, corresponding to terms occurring in many documents. In such case, if IDF value is minimum, it indicates that it occurs frequently. According to the occurrence of number of documents (Nod), the weight (Wi) is assigned to each term.
SCORE GENERATION After calculating the weight of each document (Wi), Total of Trust Document (TTD) is calculated. We can apply the classification techniques for assessment of each document based on TTD value. TTD value can be calculated by following equation

VOLUME NO. 2 (2012), ISSUE NO. 12 (DECEMBER) ISSN 2231-1009
INTERNATIONAL JOURNAL OF RESEARCH IN COMPUTER APPLICATION & MANAGEMENT A Monthly Double-Blind Peer Reviewed (Refereed/Juried) Open Access International e-Journal - Included in the International Serial Directories
http://ijrcm.org.in/
88
��� = ' (� ∗ ���)*
�)+
Ti indicates each term of document. Wi indicates weight of each term of document.
TRUST EVALUATION After calculation of TTD value, web documents are automatically classified into high trust, mid trust and low trust categories. For this categorization supervised techniques like classification is used. First the model will be trained by training data and then test data will be applied on the model to assess the accuracy of the model. It will generate the confusion matrix. Based on the confusion matrix we can derive precision, recall, F-Score and accuracy level. Confusion matrix can be generated by various supervised machine learning algorithms like Naïve Bayesian, Support Vector Machines and K-Nearest Neighbor to major the accuracy level [5]. This accuracy level is used to improve the website content credential.
EXPERIMENTAL SETUP A C#.Net program is used in this model for content processing and score generation. It will generate classified document data in excel file that will be used by Weka machine learning algorithm [10] for evolution of classification accuracy.
FIGURE 3: WEB CONTENT TRUST ASSESSMENT MODEL (WCTAM)
CONCLUSION AND FUTURE WORK The WCTAM aims to verify the trustworthiness and credibility of web sites in terms of its contents. This will help to improve the contents of web site. This model is also helpful to check whether the contents of site are highly trustable, low trustable or semi trustable. This model allows user to major trust percentage based on its contents and advice to improve the contents of web sites. In future such model can be used in any e-commerce site and other sites to measure the trustworthiness of such sites.
REFERENCES 1. Anthony D. Miyazaki, University of Miami, Sandeep Krishnamurthy, University of Washington. “Internet Seals of Approval:Effects on Online Privacy Policies
and Consumer Perceptions” viewed online 20 may 2012 http://faculty.washington.edu/sandeep/d/seal.pdf 2. Egger (2003),”Designing the Trust Experience for Business to Consumer Electronic Commerce.”, Ph. D. Thesis., pp. 124-137. 3. http://www.bbb.org/us/bbb-online-business/ Viewed on online may 20 2012 4. http://www.internetworldstats.com/stats3.htm Viewed on online april 10 2012 5. http://www.truste.com/ Viewed on online may 20 2012 6. Ian H. Witten and Eibe Frank (2005) “Data Mining:Practical Machine Learning Tools and Techniques”. Elsevier Inc. 7. Larose, By Zdravko Markov and Daniel T (2007). “Data Mining the Web: Uncovering Patterns in Web Content, Structure, and Usage”. John Wiley & Sons,
Inc. 8. Liu, Bing.(2007) “Web Data Ming Exploring Hyperlinks, Contents and Usage Data”. Springer. 9. Myrthe Swaak, Menno de Jong, Peter de Vries (2009),”Effects of Information Usefulness, Visual Attractiveness, and Usability on Web Visitors’ Trust and
Behavioral Intentions”.IEEE Explorer 10. www.cs.waikato.ac.nz/ml/weka/ view on online april 10 2012 11. Yang, Y. 2004 “, W3 Trust Model (W3TM): A trust-profiling framework to assess trust and transitivity of trust of Web-base service in a heterogeneous Web
environment.” Ph.D. Thesis.

VOLUME NO. 2 (2012), ISSUE NO. 12 (DECEMBER) ISSN 2231-1009
INTERNATIONAL JOURNAL OF RESEARCH IN COMPUTER APPLICATION & MANAGEMENT A Monthly Double-Blind Peer Reviewed (Refereed/Juried) Open Access International e-Journal - Included in the International Serial Directories
http://ijrcm.org.in/
89
PERFORMANCE OF PROFITABILITY MANAGEMENT IN AMARA RAJA BATTERIES LIMITED”, TIRUPATI - AN EVALUATION
K.KALYANI
RESEARCH SCHOLAR
DEPARTMENT OF COMMERCE
S.V. UNIVERSITY
TIRUPATI
DR. P. MOHAN REDDY
PROFESSOR
DEPARTMENT OF COMMERCE
S.V. UNIVERSITY
TIRUPATI
ABSTRACT
An attempt has been made to study the “Performance of Profitability Management in Amara Raja Batteries Limited”, Tirupati. An analysis of profitability
performance, assessment of gross profit margin, net profit margin, return on equity and return on investment in ARBL through the application of ratio analysis
and statistical tests has been undertaken. The time period considered for evaluating the study is six years i.e. from 2004 to 2009. It is found that the gross profit
ratio declined due to the fact that the gross profit margin ratio had not increased to the levels of sales revenue. Despite declined ratio, gross profit margin was
comfortable as it was more than 25 per cent over the study period. The profitability performance was thin in beginning two years and in later years the net profit
performance was improved. The management of ARBL has made sincere efforts in cutting down the operating cost so as to improve the profit performance. The
profitability in terms of owner’s equity was well reflected in the later part of the study period. This provides keen interest to the prospective shareholders also. It
may be said that the management of the ARBL took greater responsibility in the maximisation of share holders’ equity. The overall return on capital employed
ratio of the company shows the increasing trend. It indicates a good sign of making capital budgeting decisions and encouraging management to obtain assets
that would provide a satisfactory return on investment and to dispose of assets that are not providing an acceptable return to Amara Raja Batteries Limited.
KEYWORDS Gross profit margin, net profit margin, return on equity and return on investment ratio in Amara Raja Batteries Limited.
INTRODUCTION rofit is the primary motivating force for any economic activity. Business enterprise is essentially being an economic organization, it has to maximize the welfare or the interest of its stakeholders. To this end, the business undertaking has to earn profit from its operations. In other words, its receipts from operations should be more than the expenses over a period of time usually an accounting year. Infact, profits are useful intermediate beacon towards
which a firm’s capital should be directed (Bradley). In this connection, McAlpine rightly remarked that profit cannot be ignored since it is both a measure of the success of business and the means of its survival and growth (McAlpine). Profit is the report card of the past and the incentive gold star for the future. It acts as a yardstick to measure the effectiveness and efficiency of business efforts. Profit is the positive and fruitful difference between revenues and expenses of a business enterprise over a period of time (Jain).
OBJECTIVES The present research paper aims at endeavouring the following objectives:
• to analyse the profitability performance from the sales point of view; and
• to assess the profitability performance from the investment point of view.
TOOLS OF ANALYSIS The data drawn from the annual reports of ARBL have been carefully analysed, tabulated and interpreted by using well established financial tools. The analysis of data is carried out through profitability ratios such as gross profit margin, net profit margin, return on equity and return on investment ratio. Statistical tools like mean, standard deviation, coefficient of variation and coefficient of correlation are also applied. Graphs and diagrams are presented to illuminate the facts and figures.
SCOPE AND COVERAGE The present study is confined to Amara Raja Batteries Limited. The Amara Raja Batteries Limited, Tirupati in Andhra Pradesh, India has been selected because of the proximity to the investigator. This study is restricted to assess the performance of profitability management in ARBL with the help of the ratio analysis. The time period considered for evaluating the study is six years i.e. from 2004 to 2009.
THE IMPORTANCE OF PROFIT Modern business has various responsibilities all of which can be met only when the firm makes profit. Over the long term, a loss making firm will go out of existence. Profit planning is a systematic and formalized approach of determining the effect of management’s plans upon the company’s profitability (Srivastava). A well organized profit planning programme will help towards maintaining a level of profit which will ensure the concentration of the business and fulfillment of other responsibilities. Certainly, profit growth coupled with high level of profit and the ability to maintain reasonable profit will help towards (Townsend).
• Ensuring that shareholders receive an adequate dividend;
• Preserving the assets worth of the business;
• Generating a sufficient cash flow out of profits to provide capital for expansion; and
• Providing funds for the search for, and development of new and improved products to replace existing products before they go into decline. “In the short-run, even without any management action the concern may get good financial results due to some favourable conditions. But in the long-run management actions have a strong and continuous impact on financial results” (Wilson). Every business undertaking should be interested in long-run prosperity
P

VOLUME NO. 2 (2012), ISSUE NO. 12 (DECEMBER) ISSN 2231-1009
INTERNATIONAL JOURNAL OF RESEARCH IN COMPUTER APPLICATION & MANAGEMENT A Monthly Double-Blind Peer Reviewed (Refereed/Juried) Open Access International e-Journal - Included in the International Serial Directories
http://ijrcm.org.in/
90
which can be achieved through planning and control. Planning for profits is an important management responsibility but it is not given much importance as it warrants (Thomas).
CONCEPT OF PROFITABILITY Profitability implies profit-making ability of a business enterprise. The term profitability is a combination of two words profit and ability. To obtain profit, from accounting point of view, total expenses are deducted from the total revenues for a given period. The word ability means the earning power or operating performance of the concern on its investment. Therefore, profitability may be defined as the ability of a given investment to earn a return from its use (Harward and Upton). Profits are the soul of the business without which it is lifeless. Lord Keynes remarked. “Profit is the engine that drives the business enterprise” (Kulshrestha). Profit is indeed a magic eye that mirrors all aspects of an enterprise operations including quality of output (Kulshrestha). To the management and the owners, actual or potential perhaps the single most important statistic is the figure of net profit. In this measure lie the results of past decisions, the indicium of management’s performance, the basis for valuing the owner’s equity in the firm (Curran).
MEASUREMENT OF PROFITABILITY Profitability is analysed through the computation of profit ratios. Profitability ratios are calculated to measure the operating efficiency and financial performance. It can be measured based on different components of income statement and balance sheet. Van Horne opines that the profitability ratios are of two types (Van Horne): those showing profitability in relation to sales and those showing profitability in relation to investment. The profitability in relation to sales is evaluated through gross profit margin and net profit margin. The profitability in relation to investment is measured by the return on shareholders’ equity and the return on investment.
GROSS PROFIT MARGIN The gross profit margin reflects the efficiency with which management produces each unit of product. This ratio indicates the average spread between the cost of goods sold and the sales revenue. When we subtract the gross profit margin from 100 percent, we obtain the ratio of cost of goods sold to sales. A high gross profit margin ratio is a sign of good management. A low gross profit margin may reflect higher cost of goods sold due to the firm’s inability to purchase raw materials at favourable terms, inefficient utilization of plant and machinery, or over investment in plant and machinery, resulting in higher cost of production or due to fall in prices in the market. GROSS PROFIT MARGIN = GROSS PROFIT / SALES X 100. The gross profit margin ratio of the Amara Raja Batteries Limited is provided in the Table - 1 and Figure - 1.
TABLE – 1: GROSS PROFIT MARGIN RATIO OF ARBL
Year Gross Profit (Rs. in crores) Sales (Rs. in crores) Ratio (in %)
2004 70.25 177.60 39.56
2005 78.29 237.79 32.92
2006 135.97 396.96 34.25
2007 167.14 602.49 27.74
2008 285.32 1100.68 25.92
2009 339.69 1337.52 25.40
Mean 179.44 642.17 30.97
Standard Deviation 110.53 476.40 5.57
C.V. (%) 61.60 74.19 18.00
Co-efficient of Correlation between debt and equity (r) = 0.998
Source: Compiled from Annual Reports of Amara Raja Batteries Limited
FIGURE – 1: GROSS PROFIT MARGIN RATIO OF ARBL
It is observed that the quantum of sales had remarkably increased from Rs.177.60 crores in 2004 to Rs.1337.52 crores in 2009. The other variable gross profit had strikingly moved from Rs.70.25 crores in 2004 to Rs.339.69 crores in 2009. It may be noticed that both these variables have tended to arise over the study period. The gross profit margin ratio had declined from 39.56 per cent in 2004 to 25.40 per cent in 2009. The ratio declined due to the fact that the gross profit margin ratio had not increased to the levels of sales revenue. Despite declined ratio, gross profit margin was comfortable as it was more than 25 per cent over the study period. The mean, standard deviation and co-efficient of variation (C.V) of gross profit margin ratio in ARBL are 30.97, 5.57 and 18 per cent respectively. The coefficient of correlation between gross profit and sales in ARBL was 0.998 and thereby indicating that there was highly positive relation between gross profit and sales. It may be concluded that the profitability performance in terms of gross profit margin was satisfactory in ARBL.
NET PROFIT MARGIN Net profit is obtained when operating expenses, interest and taxes are subtracted from the gross profit. Net profit margin ratio establishes a relationship between net profit and sales and indicates management’s efficiency in manufacturing, administering and selling the products. This ratio is the overall measure of the firm’s ability to turn each rupee sales into net profit. This ratio also indicates the firm’s capacity to withstand adverse economic conditions. A firm with a high net margin ratio would be in an advantageous position to survive in the face of falling selling prices, rising costs of production or declining demand for the product. Net profit margin ratio is calculated by using the following formula: NET PROFIT MARGIN = PROFIT AFTER TAX / SALES X 100. The net profit margin ratio of the Amara Raja Batteries Limited is shown in the Table - 2 and Figure - 2.
0.00
10.00
20.00
30.00
40.00
50.00
2004 2005 2006 2007 2008 2009
RA
TIO
S (i
n p
erc
en
tage
)
YEARS

VOLUME NO. 2 (2012), ISSUE NO. 12 (DECEMBER) ISSN 2231-1009
INTERNATIONAL JOURNAL OF RESEARCH IN COMPUTER APPLICATION & MANAGEMENT A Monthly Double-Blind Peer Reviewed (Refereed/Juried) Open Access International e-Journal - Included in the International Serial Directories
http://ijrcm.org.in/
91
TABLE – 2: NET PROFIT MARGIN RATIO OF ARBL
Year Net Profit (Rs. in crores) Sales (Rs. in crores) Ratio (in %)
2004 1.64 177.60 0.92
2005 9.06 237.79 3.81
2006 24.33 396.96 6.13
2007 47.71 602.49 7.92
2008 94.88 1100.68 8.62
2009 82.45 1337.52 6.16
Mean 43.35 642.17 5.59
Standard Deviation 38.68 476.40 2.83
C.V. (%) 89.24 74.19 50.67
Co-efficient of Correlation between debt and equity (r) = 0.96
Source: Compiled from Annual Reports of Amara Raja Batteries Limited
FIGURE – 2: NET PROFIT MARGIN RATIO OF ARBL
It is obvious that profit after tax had depicted arise over the study period. In other words the net profit margin had jumped from Rs.1.64 crores in 2004 to Rs.82.45 crores in 2009. Subsequently the ratio had gone up from 0.92 per cent in 2004 to 6.16 per cent in 2009 with mild fluctuations. Barring first two years the ratio was more than the standard norm of 6 times. It means that the profitability performance was thin in beginning two years and in later years the net profit performance was improved. The mean, standard deviation and co-efficient of variation (C.V) of net profit margin ratio in ARBL are 5.59, 2.83 and 50.67 percent respectively. The coefficient of correlation between net profit and sales in ARBL was 0.96 and thereby indicating that there was highly positive relation between net profit and sales. It may be concluded that the management of ARBL has made sincere efforts in cutting down the operating cost so as to improve the profit performance.
RETURN ON EQUITY RATIO (ROE) A return on shareholder’s equity is calculated to see the profitability of owner’s investment. Return on equity ratio indicates how well the firm has used the resources of owners. This ratio is one of the most important relationships in financial analysis. The earning of satisfactory return is the most desirable objective of a business. The ratio of net profit to owner’s equity reflects the extent to which this objective has been accomplished. This ratio is of great interest to the present as well as prospective shareholders and also of great concern to management which has the responsibility of maximizing the owner’s welfare. Return on equity ratio is calculated by using the following formula: RETURN ON EQUITY = PROFIT AFTER TAXES / NETWORTH X 100. The return on equity ratio of the Amara Raja Batteries Limited is presented in the Table - 3 and Figure - 3.
TABLE – 3: RETURN ON EQUITY RATIO OF ARBL
Year Net Profit (Rs. in crores) Net Worth (Rs. in crores) Ratio (in %)
2004 1.64 174.59 0.94
2005 9.06 180.69 5.01
2006 24.33 201.29 12.09
2007 47.71 243.67 19.58
2008 94.88 333.10 28.48
2009 82.45 405.59 20.33
Mean 43.35 256.49 14.41
Standard Deviation 38.68 93.56 10.34
C.V. (%) 89.24 36.48 71.80
Co-efficient of Correlation between debt and equity (r) = 0.93
Source: Compiled from Annual Reports of Amara Raja Batteries Limited
FIGURE – 3: RETURN ON EQUITY RATIO OF ARBL
It is obvious that equity and profit after tax have reported to increase over the study period. Equity had increased from the Rs. 174.59 crores in 2004 to Rs. 405.59 crores in 2009. Return on equity ratio had also depicted arise over the study period. It had spurted from near 0.94 per cent in 2004 to 20.33 per cent in 2009. It is clear that in the first three years of the study the ratio did not reach the standard norm of 12 per cent. Thereafter, the ratio had out weighed the standard norm. The mean, standard deviation and co-efficient of variation (C.V) of return on equity ratio in ARBL are 14.41, 10.34 and 71.80 percent respectively. The co-efficient of correlation between net profit and net worth in ARBL was 0.93 and thereby indicating that there was highly positive relation
0.00
2.00
4.00
6.00
8.00
10.00
2004 2005 2006 2007 2008 2009
RA
TIO
S (i
n %
)
YEARS
0.00
10.00
20.00
30.00
2004 2005 2006 2007 2008 2009
RA
TIO
S (i
n %
)
YEARS

VOLUME NO. 2 (2012), ISSUE NO. 12 (DECEMBER) ISSN 2231-1009
INTERNATIONAL JOURNAL OF RESEARCH IN COMPUTER APPLICATION & MANAGEMENT A Monthly Double-Blind Peer Reviewed (Refereed/Juried) Open Access International e-Journal - Included in the International Serial Directories
http://ijrcm.org.in/
92
between net profit and net worth. It may be concluded that the profitability in terms of owner’s investment was not satisfactory upto 2006. The profitability in terms of owner’s equity was well reflected in the later part of the study period. This provides keen interest to the prospective shareholders also. It may be said that the management of the ARBL took greater responsibility in the maximisation of share holders’ equity.
RETURN ON INVESTMENT RATIO The term investment may refer to total assets or net assets. The fund employed in net assets is known as capital employed. Investment represent pool of a funds supplied by shareholders and lenders. Net assets equal net fixed assets plus current assets minus current liabilities excluding bank loans. Alternatively, capital employed is equal to net worth plus total debt. The conventional approach of calculating return on investment (ROI) is to divide profit after tax by investment. Where ROTA and RONA are respectively return on total assets and return on net assets. RONA is equivalent of return on capital employed. Return on investment ratio is calculated by using the following formula: RETURN ON INVESTMENT = EBIT / NET ASSETS x 100 The return on investment ratio of the Amara Raja Batteries Limited is presented in the Table - 4 and Figure - 4.
TABLE – 4: RETURN ON INVESTMENT RATIO OF ARBL
Source: Compiled from Annual Reports of Amara Raja Batteries Limited
FIGURE – 4: RETURN ON INVESTMENT RATIO OF ARBL
Net assets and EBIT tended to increase over the study period. The quantum of net assets had increased from Rs.189.48 crores in 2004 to Rs.691.46 crores in 2009. The ratio had varied between 1.10 per cent in 2004 and 24.88 per cent in 2008. The ratio was higher than the standard norm of 12 per cent in four out of six years of the study period. Return on investment ratio was more attractive during the last four years of the study to the prospective investors which is a welcoming feature. The mean, standard deviation and co-efficient of variation (C.V) of return on investment ratio in ARBL are 14.96, 9.16 and 61.25 percent respectively. The co-efficient of correlation between EBIT and net assets in ARBL was 0.98 and thereby indicating that there was highly positive relation between EBIT and net assets. It may be concluded that the overall return on capital employed ratio of the company shows the increasing trend from 2004 to 2008. It indicates a good sign of making capital budgeting decisions and encouraging management to obtain assets that would provide a satisfactory return on investment and to dispose of assets that are not providing an acceptable return.
CONCLUSION It is observed that the gross profit ratio had declined due to the fact that the gross profit margin ratio had not increased to the levels of sales revenue. Despite declined ratio, gross profit margin was comfortable as it was more than 25 per cent over the study period. The profitability performance was thin in beginning two years and in later years the net profit performance was improved. The management of ARBL has made sincere efforts in cutting down the operating cost so as to improve the profit performance. The profitability in terms of owner’s equity was well reflected in the later part of the study period. This provides keen interest to the prospective shareholders also. It may be said that the management of the ARBL took greater responsibility in the maximisation of share holders’ equity. The overall return on capital employed ratio of the company shows the increasing trend. It indicates a good sign of making capital budgeting decisions and encouraging management to obtain assets that would provide a satisfactory return on investment and to dispose of assets that are not providing an acceptable return. Hence, it is suggested that the profit performance can still be improved by taking effective operating financial measures by the management of ARBL. The overall profit performance further can be improved through the modern capital budgeting techniques, effective credit and collection policies, new inventory management techniques, the best cash management practices and effective cost control techniques.
REFERENCES 1. Bradley Joseph, F., “Administrative Financial Management”, New York: Holt, Rinehart and Winston, 1966, P.104. 2. Curran Ward S., “Principles of Financial Management”, New York: McGraw Hill Book Company, 1970, P34. 3. Harward, B.B. and Upton, M., “Introduction to Business Finance”, New York: McGraw Hill Book Company, 1961, P150. 4. Jain, S.C., “Financial Management of Indian Industries”, Jaipur: Prateeksha Publications, 1986, P91. 5. Kulshrestha, N.K., “Analysis of Financial Statements of Indian Paper Industry”, Alighar: Navman Prakashan, 1988, P74. 6. Kulshrestha, N.K., “Theory and Practice of Management Accounting”, Aligarh: Navman Prakashan, 1976, P232. 7. McAlpine, T.S., “Profit Planning and Control”, London: Business Book Ltd., 1969, P108. 8. Srivastava, R.M., “Essentials of Business Finance”, Bombay: Himalaya Publishing House, 1986, P79. 9. Thomas, S.D., “Profile for Profitability”, New York: John Wiley and Sons, 1972, P3. 10. Townsend, C., “Financial Management”, Hand Book, Essex: Gower Press Limited, 1972, P13. 11. Van Horne, J.C., “Fundamentals of Financial Management”, New Delhi: Prentice Hall of India Pvt. Ltd., 1996, P139. 12. Wilson, S.R. and John, O.Tomb., “Improving Profits Through Integrated Planning and Control”, Englewood Cliffs, N.T. Prentice-Hall Inc., 1968, Pp4-6.
0.00
10.00
20.00
30.00
2004 2005 2006 2007 2008 2009
RA
TIO
S (i
n %
)
YEARS
Year EBIT (Rs. in crores) Net Assets (Rs. in crores) Ratio (in %)
2004 2.08 189.48 1.10
2005 13.75 204.00 6.74
2006 38.79 239.14 16.22
2007 76.15 384.36 19.81
2008 161.54 649.35 24.88
2009 145.23 691.46 21.00
Mean 72.92 392.97 14.96
Standard Deviation 67.49 226.13 9.16
C.V. (%) 92.55 57.55 61.25
Co-efficient of Correlation between debt and equity (r) = 0.98

VOLUME NO. 2 (2012), ISSUE NO. 12 (DECEMBER) ISSN 2231-1009
INTERNATIONAL JOURNAL OF RESEARCH IN COMPUTER APPLICATION & MANAGEMENT A Monthly Double-Blind Peer Reviewed (Refereed/Juried) Open Access International e-Journal - Included in the International Serial Directories
http://ijrcm.org.in/
93
AN ELABORATION LIKELIHOOD MODEL APPROACH TO PACKAGING AND CHILD-PARENT INTERACTION
SURAJ KUSHE SHEKHAR
RESEARCH SCHOLAR
DEPARTMENT OF MANAGEMENT STUDIES
KANNUR UNIVERSITY
THALASSERY CAMPUS
KANNUR
DR. P.T RAVEENDRAN
PROFESSOR
DEPARTMENT OF MANAGEMENT STUDIES
KANNUR UNIVERSITY
THALASSERY CAMPUS
KANNUR
ABSTRACT
This paper illustrates a situation confronting child and the parent when making a purchase decision at the checkouts for high impulse purchase categories;
chocolates. An Elaboration Likelihood Model approach is used to describe the decision making process. The paper examines the significance of packaging cues;
pester power and the time pressure in bifurcation of the persuasive process into central and peripheral routes. The ‘central route’ is used to process information
due to high package relevance, high personal motivation and high cognitive communication of the child resulting in the purchase of the chocolate. In the
‘peripheral route’, the child or the parent has low personal interests and low product involvement. The end result may be a ‘purchase’ or ‘no purchase’. The paper
concludes with limitations in mapping to the model, implications and scope for future research.
KEYWORDS Children, Elaboration Likelihood Model, Packaging, Parent.
INTRODUCTION ackaging is any container or wrapping in which the product is offered for sale and can consist of variety of materials such as glass, paper, metal or plastic, depending upon what is to be contained (Brassington and Petit, 2002). Packaging is defined as an extrinsic element of the product (Olson and Jacoby, 1972); an attribute that is related to the product but does not form part of the physical product itself. Packaging is a structure prepared to contain a
commercial food product, i.e. enabling it easier and safer to transport, protecting the product against contamination or loss, degradation or damage and maintaining a convenient way to dispose of the product (Sacharow and Griffin, 1980). Stewart (1995) described the basic function of food packaging as to ‘preserve product integrity’ by protecting the actual food product against potential damage from ‘climate, bacteriological and transit hazards’. However, the first to define packs as the ‘silent salesman’ was Pilditch (1961). Vazquez, Bruce and Studd (2003) argued that the pack must come alive at the point of purchase, in order to represent the salesman. About 30 years later, (Lewis, 1991) expanded further on Pilditch’s views, stating that ‘good packaging is far more than a salesman; it is a flag of recognition and a symbol of values’.
REVIEW OF LITERATURE PACKAGING & MARKETING Packaging plays an important role in the marketing of any product. It is an integral part in the process of communicating the marketing objective of a specific product to the consumer (Stem 1981, Meyer and Herbert 1981). To perform its role, packaging must be attractive, informative, and clearly identify the product and communicate its real benefits. Many marketers have called the packaging a fifth ‘P’; the other four Ps being Product, Price, Place and Promotion (Kotler, 2004). Well-designed packages can create convenience and promotional values (Kotler, 2004). Prendergast and Pitt (1996) discussed pacakging as one of the most important factors in purchase decisions made at the point of sale where it becomes an essential part of the selling process (Rettie and Brewer, 2000). Silayoi and Speece (2007) argued that when the consumer is undecided, the package becomes a critical factor in the purchase choice because it communicates to consumers at the decision making time. Silayoi and Speece (2007) further suggested on how consumers perceived the subjective entity of products as presented through communication elements in the package, influenced choice and as the key to success for many marketing strategies Lo¨ fgren (2008) called this as ‘the first moment of truth’ when the package functioned as a silent salesman. Underwood et al. (2001) demonstrated that visuals on the package can be a strategic method of differentiation as pictures are much more effective stimuli compared to words. In addition, consumers processed visual information faster and easier, particularly in low involvement situation. The right selection of package colors also played a very important role in purchase decisions (Kauppinen-Ra¨isa¨nen and Luomala, 2010). As the retail environment becomes saturated with competitors vying for consumers’ attention, packaging has to work harder than ever if the product is to be noticed through the congestion of competitive products (Milton, 1991). PACKAGING AND CHILDREN Children have growing spending power in terms of being customers in their own right (Pettersson and Fjellstrom, 2006). Children are also major influencers within the family decision making unit. This unique power of children has resulted as an increasingly attractive target segments for marketers (Coughlin and Wong, 2002). In a study of the nutritional content of products targeted to children, Fitzhugh and Lobstein (2000) defined and classified children’s food product as one which used familiar cartoon characters appealing to children (e.g. Tony the Tiger, Mr Men); tie-ins with children’s TV programmes or films (e.g. Postman Pat, Star Wars); child-oriented animals or creatures (e.g. dinosaurs, sharks); child-oriented product shapes (e.g. alphabet pasta); free gifts or special promotional offers suitable for children; use of words such as ‘kids’ or ‘ideal children’s snack’ or ‘perfect for school lunch boxes’. The world loves chocolate and there is some truth in a popular remark like, ‘nine out of 10 people like chocolate, the tenth person always lies’ or ‘Chocolate makes everyone smile even bankers’ (Doherty and Tranchell, 2007). Children are the major segments having a high affinity towards chocolates. ‘Chocolate affinity’ factor combines the cost and purpose due to which consumers buy a particular chocolate; it has emerged out to be one of the important factors that affect consumers’ buying behaviour (Doherty and Tranchell, 2007). In a study conducted by Patwardhan et.al (2010) the major factor that affected consumer’s buying behaviour is the attractive look of the product which particularly attracted children, and the ingredient of chocolate. In correlation analysis, a high correlation was observed between buying behaviour and packaging of chocolates. They also opined that different customers have different likings and preferences for chocolates. Some people might prefer dark chocolates with high cocoa content, whereas others go for chocolates with more milk and nuts. They also argued that shape and design of chocolate attracted consumers. In a similar study, Roberts (2005) investigated into children’s perception and attitude to
P

VOLUME NO. 2 (2012), ISSUE NO. 12 (DECEMBER) ISSN 2231-1009
INTERNATIONAL JOURNAL OF RESEARCH IN COMPUTER APPLICATION & MANAGEMENT A Monthly Double-Blind Peer Reviewed (Refereed/Juried) Open Access International e-Journal - Included in the International Serial Directories
http://ijrcm.org.in/
94
food and referred to children’s food as that which is a combination of food and fun. In other words, children’s food was perceived as ‘eatertainment’. Roberts (2005) observed specific ‘eatertainment’ techniques employed by marketers like: premium offers, i.e. offers of free gifts such as free toys, stickers, trading cards, etc. inside packages of snack foods, cereals and convenience foods; children’s licensed characters and movie tie-ins on food packaging; ‘Kids meals’ combining child-sized portions of food with soft drinks and free toys or confectionery; fun product designs that incorporate interactive play value, often incorporating unusual shapes, textures, colors, tastes and smells, and characters printed directly onto the food. From the above discussions, it can be inferred that packaging targeted to children is crucial and can be very vital in chocolate industry. PACKAGING AND PARENT Food packaging can be very attractive with regard to color, typography, graphical shapes and images, text, design, logo and illustration (Ampuero and Vila, 2006).These factors may tempt any consumer to try out a product. However, parents are becoming increasingly aware of the relationship between their diet and their health over the last decade, and this trend is likely to continue to influence consumers’ buying patterns (Bartlam, 1993). But the increasing influence of children in family decision making for food purchases (Children’s Food and Drinks Report, 1992) and the ‘pester power’ for most food products are representing a threat to mothers’ willingness to make their children eat more healthily. Hence parents confront a dilemma when they shop along with their kids and make a purchase decision with respect to their children. PACKAGING AND PURCHASING BEHAVIOUR: CHILD-PARENT INTERACTION Gelperowic and Beharrell (1994) identified that children were attracted by ‘nice looking’ packaging. They concluded that in order for an item of food to be purchased by the mother, it must look appealing to the child so that the mother could be assured that the child will eat it and unnecessary waste be avoided. Therefore, it was clear from their study that mothers believed that packaging could have an effect on their children’s requests and also that mother’s often succumbed to these requests in order to avoid a conflict situation. Kelly, Turner and McKenna (2006) identified that parents found it increasingly difficult to deny their children food products that were endorsed by their favorite celebrities. Nicholls and Cullen (2004) found that the most stressful environment for a parent and child to enter is a supermarket because the child is most likely to be there as an ‘unavoidable companion rather than as a pre-selected choice-maker’ and all products are displayed and readily available for the child to see. Gelperowic and Beharrell (1994) also claimed that children have increasing influence in family purchase decisions and although mothers may wish their children to eat healthily, the lack of appeal of non-HFSS foods counteract this, as children are attracted to unhealthy HFSS foods. Manufacturers are increasingly using developed technology to create products that appeal to children through fun packaging and new shapes. Unfortunately these products are not always healthy and more often mothers give into ‘pester power’ in order to avoid conflict. They found that 33 percent of respondents admitted that their children did have an influence on purchase behavior and only 6 percent said that they had no influence at all. McNeal and Ji ( 2003) estimated that 34 percent of sales in the food category are driven by children ‘nagging’. They further added that children make an average of 15 purchase requests on a given shopping trip; they estimated that between 40 percent and 80 percent of these requests were granted. McNeal and Ji ( 2003) also opined about children’s preference for confectionery such as chocolates. Their outcome validates the findings that packaging affects children’s product preferences and influences their choice. However Ogba and Johnson ( 2010) in their study concluded that parents do not routinely give into their children’s request. ELABORATION LIKELIHOOD MODEL (ELM) Developed by Cacioppo and Petty (1984), the ELM was an extension on the theory of message involvement in the role of persuasion and attitude formation. Central to this model is the ‘elaboration continuum’, which ranges from low elaboration (low thought) to high elaboration (high thought) .Motivation and ability are the two factors determining how a consumer will attend to and consider a message (Cacioppo and Petty, 1984). Motivational factors include (among others) the personal relevance of the message topic, accountability, and a person's ‘need for cognition’ (their innate desire to enjoy thinking). Ability factors include the availability of cognitive resources (e.g., the presence or absence of time pressures (Silayoi & Speece, 2004) or distractions) or relevant knowledge needed to carefully scrutinize the arguments. Two routes of information processing were proposed in ELM including the central and the peripheral route. It is through either of these routes that persuasion will occur (Bitner and Obermiller, 1985). Elaboration likelihood is high if conditions promote increased motivation to attend to a message and ability to develop relevant thoughts are present (Petty and Cacioppo, 1984). A high level of elaboration indicates that consumers will critically analyze the message and subsequently develop an attitude regarding the stimulus (Cacioppo & Petty, 1984). Attitudes formed through this route are considered to be enduring and strong (Rucker and Petty, 2006). In conditions in which elaboration likelihood is low, the peripheral route of processing is utilized and proper consideration is absent from thought processes. The resulting attitudes are formed by cues derived from the stimulus (Bitner and Obermiller, 1985). Despite the use of cues rather than carefully constructed thought processes in attending to the message, attitudes formed through the peripheral route are still predictive of resulting behaviour in the short term (Rucker and Petty, 2006).The subject's general education level, as well as their education and experience with the topic at hand greatly affect their ability to be persuaded. Under conditions of moderate elaboration, a mixture of central and peripheral route processes will guide information processing.
NEED/ IMPORTANCE OF THE STUDY Packaging has established itself as an important factor influencing purchase decisions. Chocolates are product categories which are consumed irrespective of any age groups. Today, packaging of chocolates are considered as highly critical. Children are the target groups who are highly influenced by chocolates .Chocolate packaging plays a crucial role in their influential and purchase process. Although previous studies dictates chocolate consumption behaviour and in - store buying behaviour, very less literature focus on how purchase mechanism takes place at the point of purchase particularly when the child -parent interaction is considered. This article explains one such situation using an Elaboration Likelihood Model. The paper examines the significance of packaging cues; pester power and the impact of time pressure in mapping the purchase situation to such a model.
OBJECTIVES 1. To study the child-parent purchase interaction (chocolate bars) at the point of purchase using an Elaboration Likelihood Model. 2. To study the impact of packaging cues; pester power and the impact of time pressure in mapping the purchase situation to such a model.
RESEARCH METHODOLOGY The researcher used the existing literature to identify the variables influencing child-parent at the point of purchase and develops a conceptual ELM model to initiate discussion.
RESULTS AND DISCUSSION CHILD –PARENT BEHAVIOUR, AN ELM APPROACH Advertising is used as a ‘persuasive’ tool to encourage product take up. Nowadays advertising campaigns are linking packaging and advertising together, even though they promote the product, strengthen the brand image and attract the consumers. Hence packaging is equally turning out to be a ‘persuasive’ tool at the point of sale. This proposition holds true for impulse purchases such as chocolates. The following model details the situation confronting child- parent interaction from the perspective of an ELM. It is needless to mention that consumers are persuaded by the attractive packages at the point of sales (Ampuero and Vila, 2006; Aziz, Kadir, Rahimah and Yacob, 2011; Barnes, Southee and Henson, 2003; Ogba and Johnson, 2010). Chocolates are product categories which are mostly arranged at the billing counter (checkouts) and thus making it a highly impulse purchase good. An attractive look of a ‘chocolate bar’ not only attracts children but adults too. When a child or a parent scrolls their eyes at chocolate packages, undoubtedly it is the child who gets motivated to initiate purchase. This persuasive message gets elaborated across two levels: high level and low level. Children normally fall into in the high involvement category because they have a high personal interest and product

VOLUME NO. 2 (2012), ISSUE NO. 12 (DECEMBER) ISSN 2231-1009
INTERNATIONAL JOURNAL OF RESEARCH IN COMPUTER APPLICATION & MANAGEMENT A Monthly Double-Blind Peer Reviewed (Refereed/Juried) Open Access International e-Journal - Included in the International Serial Directories
http://ijrcm.org.in/
95
involvement with the chocolates. The various ‘eatertainment’ techniques (Roberts, 2005) and packaging cues coupled with the affects of advertising of chocolates on various media makes the child highly vibrant and thus the ‘pester power’ scores over ‘healthy eating’ (fallacy of the parent) in this situation. This is backed up the ‘time pressure’ to leave the billing counter which further makes the parent succumb to the child’s request. From an ELM point of view, the ‘central route’ is used to process information due to high package relevance, high personal motivation and high cognitive communication of the child. Therefore the attitude of the child gets transferred to the parent and thus a purchase is made. When the child or the parent is less interested in making a chocolate purchase, it is the peripheral route that they take up. In the ‘peripheral route’, child or the parent have low personal interests and low product involvement. Major reason for low product involvement from parent’s point of view can take up the fallacy of ‘healthy eating’ (Gelperowic and Beharrell, 1994). Hence in the absence of a strong pester power, personal interests and the presence of time pressure, their attitude is not certain to be changed even by the product’s packaging cues. The end result can be a ‘purchase’ or ‘no purchase’. However certain peripheral cues such as visual graphics, curiosity etc may engage the consumer to try out new category of chocolates or sometimes ‘chocolate affinity’ factor (Doherty and Tranchell, 2007) may lead to purchase of any chocolate (random pick up) before they leave the point of purchase. This is because consumers do not want to get involved with the information which they do not have the abilities and interests to process. In a nut shell, the ‘peripheral route’ is an alternative way to allow low involvement consumers to be persuaded by the packaging. The conceptual child –parent purchase mechanism through an ELM approach is developed as shown in Fig 1 below
FIG. 1: CHOCOLATE PACKAGING & CHILD-PARENT PURCHASE BEHAVIOUR: AN ELM APPROACH
Source: Developed from the present study
LIMITATIONS As the model takes into account of the involvement levels, the model doesn’t gives a robust explanation of a ‘moderate involvement level’ and the path they follow; central or peripheral. As Bitner and Obermiller (1985) mentioned, when there is no other central cues, a peripheral cue may turn out to be a central cue. This result highlights a limitation of ELM; the model does not clearly specify apriori what will be peripheral cue and what will be a central cue (Bitner and Obermiller 1985).
CONCLUSIONS A typical child-parent purchase situation was visualized and ELM approach was applied to interpret the purchase behavior. A highly involved and highly motivated child will over score his/her parent’s ‘healthy eating’ fallacy by his/her pester power and take the ‘central route’. This will change the attitude of the parent and they will be succumbed to make a purchase as per child’s request. When the child or the parent is less interested in making a chocolate purchase, it’s the ‘peripheral route’ that they take up. The nullified effects of pester power, absence of a strong peripheral cue, ‘healthy eating’ fallacy may or may not lead to a purchase.
SCOPE FOR FUTURE RESEARCH The proposed idea described in the model must be validated and also tested with an empirical research across various product categories making impulse purchases. Theoretically, this study extends the current literature and examines the ELM by pointing the ‘nagging factor’ (Ogba and Johnson, 2010) , ‘time pressure’ (Silayoi and Speece, 2004) etc. However, it will also be interesting to delve into whether ‘consumer decision making models’ can be integrated with this model so as to bring a more robust explanation of the concept explained above. Further studies can also be taken up by using ‘path analysis’ or ‘structural equation modeling’ (SEM), can also be employed to analyze the conceptual model described above. Future studies must also examine the impact of ‘brand loyalty’ and ‘emotional appeal’ on chocolate packaging. Investigating into the effects of packaging and repeated purchase behaviour should also provide some interesting results.
REFERENCES 1. Ampuero, O. and Vila, N. (2006),"Consumer perceptions of product packaging", Journal of Consumer Marketing, Vol.23, No. 2, pp. 102-114. 2. Aziz, A., Kadir, A., Rahimah, N. and Yacob, N. (2011): Importance of packaging in consumer purchasing decisions, Viewed on September 13, 2011,
http://mgv.mim.edu.my/MMR/9112/911205.Htm 3. Barnes, C., Southee, C. and Henson, B. (2003): “The Impact of Affective Design of Product Packaging upon Consumer Purchase Decisions", Paper presented
at the Annual conference for the DPPI, London, UK, 23-26 June. 4. Bartlam, M. (1993),"Healthy and Light Foods – Understanding the Consumer”, British Food Journal, Vol. 95, No. 3, pp. 3-11. 5. Bitner, M. J. and Obermiller,C. (1985),"The Elaboration Likelihood Model: Limitations and Extensions in Marketing",Advances in Consumer Research ,Vol.
12, No.1, pp. 420-425. 6. Brassington, F. and Petit, S. (2002),"Principles of marketing ", Financial Times Management, Harlow. 7. Cacioppo, J. T. and Petty, R. E. (1984),"The Elaboration Likelihood Model of Persuasion", Advances in Consumer Research , Vol.11 ,No.1, pp. 673-675. 8. Children’s Food and Drinks Report. (1992): "Children’s Food and Drinks Report:Industry and Market Review",Report,Leatherhead Food Research
Association,London 9. Coughlin, R. and Wong, T. (2002),"The retail world from a kid’s perspective", Advertising and Marketing to children , Vol. 4 ,No.1, pp. 3-8.

VOLUME NO. 2 (2012), ISSUE NO. 12 (DECEMBER) ISSN 2231-1009
INTERNATIONAL JOURNAL OF RESEARCH IN COMPUTER APPLICATION & MANAGEMENT A Monthly Double-Blind Peer Reviewed (Refereed/Juried) Open Access International e-Journal - Included in the International Serial Directories
http://ijrcm.org.in/
96
10. Doherty, B. and Tranchell, S. (2007),"Radical Mainstreaming’ of Fairtrade:The Case of The Day Chocolate Equal Opportunities", Equal Opportunities International , Vol. 26, No. 7, pp. 693-711.
11. Fitzhugh, K. and Lobstein, T. (2000),"Children’s Food Examined: An Analysis of 358 Products Targeted at children",The Food Commission,London 12. Gelperowic, R. and Beharrell, B. (1994),"Healthy Food Products for Children: Packaging and Mothers’ Purchase Decisions", British Food Journal,Vol. 96,
No.11, pp. 4-8. 13. Kauppinen-Ra¨isa¨nen, H. and Luomala, H. T. (2010),"Exploring consumers’ product-specific colour meanings",Qualitative Market Research , Vol. 13 ,No.3,
pp. 287-308. 14. Kelly, J., Turner, J. and McKenna, K. (2006),"What parents think: children and healthy eating", British Food Journal , Vol. 108,No.5,pp. 413-423. 15. Kotler, P. (2004),"Marketing Management: Analysis, Planning" ,Prentice Hall of India Private Limited ,New Delhi. 16. Lewis, M. (1991),"Understanding Brands" ,Kogan Page,London. 17. Lo¨ fgren, M. (2008),"Customer satisfaction in the first and second moments of truth",Journal of Product & Brand Management , Vol. 17 ,No.7, pp. 463-
474. 18. McNeal, J. U. and Ji, M. F. (2003),"Childrens visual memory of packaging.", Journal of consumer marketing , Vol.20,No.5, pp. 400-427. 19. Meyers and Herbert, M. (1981),"Determining Communication Objectives for Package Designs", John Wiley & Sons,New York. 20. Milton, H. (1991),"Packaging Design", Bourne Press Ltd, Bournemouth. 21. Nicholls, A. and Cullen, B. (2004),"The child–parent purchase relationship: pester power, human rights and retail ethics", Journal of Retailing and Consumer
Services, Vol. 11, No.2, pp. 75-86. 22. Ogba, I.-E. and Johnson, R. (2010),"How packaging affects the product preferences of children and the buyer behaviour of their parents in the food
industry",Young Consumers: Insight and Ideas for Responsible Marketers , Vol. 11,No.1,pp. 77 - 89. 23. Olson, J. C. and Jacoby, J. (1972): "Cue utilization in the quality perception process",Paper presented at the 3rd Annual Conference of the Association for
Consumer Research,Lowa City,IA. 24. Patwardhan, M., Flora, P. and Gupta, A. (2010),"Identification of Secondary Factors that Influence Consumer’s Buying Behavior for Soaps and
Chocolates",The IUP Journal of Marketing Management ,Vol.9,No.2,pp. 55-72. 25. Pettersson, A. and Fjellstrom, C. (2006),"Responsible marketing to children and their families.",Young Consumers: Insights and Ideas for Responsible
Marketers , Vol.6 ,No.4, pp.13-18. 26. Pilditch, J. (1961),"The silent salesman: how to develop packaging that sells", Business Publications. 27. Prendergast, P. G. and Pitt, L. (1996),"Packaging, marketing, logistics and the environment: are there trade-offs? ",International Journal of Physical
Distribution & Logistics Management ,Vol. 26 ,No.6,pp. 60-72. 28. Rettie, R. and Brewer, C. (2000),"The verbal and visual components of package design.",The Journal of Product and Brand Management , Vol.9,No.1,pp. 56-
68. 29. Roberts, M. (2005),"Parenting in an obesogenic environment.", Journal of Research for Consumers ,Vol 9,pp 122-129. 30. Rucker, D. D. and Petty, R. E. (2006),"Increasing the Effectiveness of Communications to Consumers: Recommendations Based on Elaboration Likelihood
and Attitude Certainty Perspectives", Journal of Public Policy & Marketing, Vol. 25, No.1, pp. 39-52. 31. Sacharow, S. and Griffin, R. C. (1980),"Basic Food Processes. In Food packaging-Its Background “, AVI Publishing Company, Westport. 32. Silayoi, P. and Speece, M. (2004),"Packaging and purchase decisions-An exploratory study on the impact of involvement level and time pressure", British
Food Journal , Vol.106 ,No.8,pp. 607-628. 33. Silayoi, P. and Speece, M. (2007).,"The importance of packaging attributes: a conjoint analysis approach",European Journal of Marketing , Vol.41,No.12,pp.
1495-1517. 34. Stem, W. (1981),"Package Design Research: The State of the Art", John Wiley & Sons, New York. 35. Stewart, B. (1995),"Packaging as an Effective Marketing Tool", Pira International Survey. 36. Underwood, R. L., Klein, N. M. and Burke, R. R. (2001),"Packaging communication: Attentional effects of product imagery", Journal of Product and brand
Management, Vol. 10, No.7, pp. 403-422. 37. Vazquez, D., Bruce, M. and Studd, R. (2003),"A case study exploring the packaging design management process within a UK food retailer." British Food
Journal, Vol.105, No.9, pp. 602-617.

VOLUME NO. 2 (2012), ISSUE NO. 12 (DECEMBER) ISSN 2231-1009
INTERNATIONAL JOURNAL OF RESEARCH IN COMPUTER APPLICATION & MANAGEMENT A Monthly Double-Blind Peer Reviewed (Refereed/Juried) Open Access International e-Journal - Included in the International Serial Directories
http://ijrcm.org.in/
97
RELATIONSHIP OF FINANCIAL REPORTING QUALITY WITH SALES VOLATILITY AND BOOK TO MARKET VALUE
MOHAMMAD REZA RAZDAR
RESEARCH SCHOLAR
UNIVERSITY OF MYSORE
MYSORE
DR. B. H. SURESH
PROFESSOR
DOS IN COMMERCE
UNIVERSITY OF MYSORE
MYSORE
ABSTRACT
Financial reporting quality has some implication such improving of economic growth and investment efficiency. But there are some factors that can have affect
on financial reporting quality such sales volatility. In this paper we study the effect of sales volatility on financial reporting quality. Financial reporting quality also
can have effect on some of firm ratio such book to market value ratio. In this study we hypothesize that financial reporting quality can increase the book to
market value. The numbers of observations in this study are 2608 observations among 218 companies listed in Tehran stock exchange. In This research we find
that there is negative significant relationship between financial reporting quality and sales volatility and also there is positive significant relationship between
financial reporting quality and book to market value.
KEYWORDS Financial reporting quality, accruals, sales volatility, book to market value.
INTRODUCTION ecent researches (e.g., Bushman and Smith, 2001; Lambert, Leuz, and Verrecchia, 2007) suggested that enhanced financial reporting can have important economic implications like increased investment efficiency. Another recent study (Rodrigo S. Verdi, 2006) hypothesized that higher financial reporting quality can improve investment efficiency by reducing information asymmetry in two ways: First, it reduces the information asymmetry between the
firm and investors. Second, it reduces information asymmetry between investors and the manager. In other studies (Daniel A. Cohen, 2003) found evidence of a positive association between investors' demands for firm-specific information and financial reporting quality. For the economic consequences, the evidence suggests that firms with high quality financial reporting policies have reduced information asymmetries. This study define financial reporting quality as the precision with which financial reporting conveys information about the firms operations, in particular its expected cash flow, in order to inform equity investors. This definition is consistent with the Financial Accounting Standards Board, Statement of Financial Accounting Concepts No. 1 (1978), which states that one objective of financial reporting is to inform present and potential investors in making rational investment decisions and in assessing the expected firm cash flow. Financial reporting mitigates adverse selection costs by reducing the information asymmetry between the firm and investors, and among investors (Verrecchia, 2001). On the other hand, the existence of information asymmetry between the firm and investors could lead suppliers of capital to discount the stock price and to increase the cost of raising capital because investors would infer that firms raising money is of a bad type (Myers and Majluf, 1984). Thus if financial reporting quality reduce adverse selection costs, it can improve investment efficiency by reducing the costs of external financing. But there are some factors that can have affect on financial reporting quality such sales volatility. In this paper we study the effect of sales volatility on financial reporting quality. A large literature in accounting suggests that financial reporting plays a critical role in mitigating agency problems. For instance, financial accounting information is commonly used as a direct input into compensation contracts (Lambert, 2001) and is an important source of information used by shareholders to monitor managers (Bushman and smith, 2001). Firms with higher book to market ratio are more prone to bear risks because with a small shake in market, the market value gets closer or becomes equal to book value. Therefore, it can be understood that a high book to market ratio is riskier and high risk brings higher efficiency. Additionally, the lower the book to market ratio, the higher financial power and lower risk will be faced by firms, hence, lower revenue. According to this discussion and according to financial reporting quality implications, financial reporting quality can have effect on book to market value and in this study we hypothesizes that financial reporting quality can increase the book to market value. The statistical population of this study included all of companies listed in Tehran stock exchange that they were in stock exchange at least from years 1998 to 2009. The numbers of observations in this study are 2908 observations among 28 industries. In This research we find that there is negative significant relationship between financial reporting quality and sales volatility and also there is positive significant relationship between financial reporting quality and book to market value.
REVIEW OF LITERATURE Improving disclosures and the quality of financial reporting mitigate information asymmetries about a firm’s performance and reduce the volatility of stock prices (Diamond, d., Verrecchia, R, 1991); (Healy,P., Hutton, A., Palepu, K, 1999). An increase in stock return volatility is likely to increase the information asymmetric component of the cost of capital (Leuz, C., Verrecchia, R, 2000), (Froot, K., Perold, A.,Stein, J, 1992). (Leuz, C., Verrecchia, R, 2000) examined the consequences of improved disclosure quality on a firm’s bid-ask spreads, trading volume and stock-return volatility in the context of German firms that switched from German GAAP to U.S. GAAP or IAS. They hypothesized that these German firms switch to an arguably better financial reporting regime, commit to increased disclosure, and hence experience a reduction in the asymmetric information component of the cost of capital. The authors found that bid-ask spreads decline and trading volume improves when German firms switch to an international reporting regime. (Pastor, L., Veronesi, P, 2003) posited that significant uncertainty about a firm’s average profitability influences stock return volatility. To the extent that financial reporting quality is poor, uncertainty about a firm’s future profitability is likely to be high. Thus, the Pastor and Veronesi (2003) model is also consistent with the hypothesis that poor information quality is associated with increased idiosyncratic volatility. (Shiva Rajgopal a,. MohanVenkatachalam, 2010) claimed that an increase in earnings management reduces the precision of the earnings signal and is thus related to increased idiosyncratic return volatility. However, one could counter-argue that earnings management, if detectable by investors, could also provide additional information to investors (Watts and Zimmerman, 1986).
R

VOLUME NO. 2 (2012), ISSUE NO. 12 (DECEMBER) ISSN 2231-1009
INTERNATIONAL JOURNAL OF RESEARCH IN COMPUTER APPLICATION & MANAGEMENT A Monthly Double-Blind Peer Reviewed (Refereed/Juried) Open Access International e-Journal - Included in the International Serial Directories
http://ijrcm.org.in/
98
OBJECTIVES OF THE STUDY 1- To study and evaluate the quality of financial reporting in Tehran stock exchange (TSE); 2- To measure the effects of firm characteristics factors such as: book value to market value, and sale volatility, on financial reporting quality;
HYPOTHESES FOR THE STUDY Based on the above discussion and according to the effect of sales volatility on financial reporting quality and also according to financial reporting quality implications such increase of book to market value we hypothesized: H1: There is a negative relationship between the sales volatility and financial reporting quality; H2: There is positive relationship between the book to market value and financial reporting quality;
RESEARCH METHODOLOGY The research methodology of the present study involves the use of secondary data and we used from historical information. The statistical population of this study included all of companies listed in Tehran stock exchange that they were in stock exchange at least from years 1998 to 2009. In this study the data are from the annual file of companies that listed in Tehran stock exchange during the years 1998 to 2009. The numbers of selected companies in this study are 218 firms From 28 industries. This research define Financial Reporting Quality as the precision with which financial reporting conveys information about the firms operation, in particular its expected cash flows, in order to inform investors in terms of equity investment decision. This study follow prior literature and we used a measure of accruals quality derived in Dechow & Dichev (2002) model as a proxy for Financial Reporting Quality. This measure is based on the idea that accruals improve the in formativeness of earnings by smoothing out transitory fluctuations in cash flows and has been used extensively in the prior literature. The model which used in this study for measuring financial reporting quality is a regression of working capital accruals of the past, current, and future cash flows plus the changes in revenue and property, plant and equipment (PPE).
�,,-./!0�,% = 1 + ' 2�3
�)45��% + 26 ∗ ∆8�,% + 29 ∗ ::;�,% + <�,%
EQUATION 1: DECHOW & DICHEV (2002) MODEL Where, Accruals = (∆CA - ∆Cash) – (∆CL - ∆STD) – Dep, ∆CA = Change in current assets ∆Cash = Change in cash/cash equivalents ∆CL = Change in current liabilities ∆STD = Change in short-term debt Dep = Depreciation and amortization expense C F = Net income before extraordinary items minus Accruals ∆R = Change in revenue, and PPE = Gross property, plant, and equipment All variables deflated by average total assets. In the model of Dechow and Dichev (2002) the researchers developed a model of working capital accruals where accruals correct the timing problems of cash flow at the cost of including errors in estimation. Based on this model they drive an empirical measure of accrual quality as the residual from firm-specific regressions of change in working capital measure of past, present, and future operating cash flow realizations. Therefore when the value of residual obtained from this regression (|ε>??|) is lower, quality of accrual and resulting financial reporting quality is higher. With multiply positive residuals by negative one (-1), we can use of these residuals as index for calculating of financial reporting quality. In other word, symmetric of bigger (smaller) errors value will show higher (lower) financial reporting quality. Accrual quality at year t is the standard deviation of the firm-level residuals from the model during the years t-4 to t-1, assuring that all explanatory variables are measured before period t for the computation of accruals quality in that year. In this research, the standard deviation of residuals multiplied by negative one so that this variable becomes increasing in financial reporting quality, its means that bigger (smaller) standard deviation of residuals value multiply negative one will be consider as higher ( lower) financial reporting quality. In this study for calculation of sale volatility we have calculated the standard deviation of sales changes over years t-4 to t. the sale change is sale growth measured at the end of year and also for calculation of book to market value we have calculated the book value of equity divided by the market value of equity.
FINDINGS
As described in previous section in this study for measuring of financial reporting quality following previous studies used Dechow & Dichev (2002) model. After calculation of all variables we estimated significant and explanatory power of predictor variables for accruals. ‘Mean’ for the accruals residuals in these 12 years for 2608 observations is -0.09% (-0.00089). ‘Standard deviation’ for the same is 11.2% (0.11256). ‘Maximum’ and ‘Minimum’ amount of the calculated accruals residuals in this period are respectively -1.25 and 1.14. The following table shows the statistical test information such as: P-value, t-statistic, coefficients and et.al. According to this table all variables are significant. The coefficient of multiple determination (R2) is 0.604; therefore, about 60.4% of the variation in the accruals is explained by cash flow of past, current, and next year, changes in revenue and gross property, plant and equipment. According to this table the value of Durbin-Watson of this model is 1.779 and it is close to 2, therefore evidence of positive serial correlation is very low. If Durbin–Watson is less than 1.0, there may be cause for alarm.
TABLE1: STATISTICAL SUMMARY OF DECHOW & DICHEV (2002) MODEL
P-value t-statistic coefficients Tolerance f-test R square Durbin-Watson
@A 0.000 15.827 0.067 1017.125 0.604 1.779
BCD,EFA 0.000 23.226 0.269 0.873
BCD,E 0.000 -68.055 0-.844 0.763
BCD,EGA 0.000 27.603 0.334 0.799
∆HD,E 0.000 24.592 0.284 0.878
IIJD,E 0.000 -13.875 -0.151 0.984
Source: Author According to above beta coefficients the model for estimation of financial reporting quality will be as following: �,,-./!0�,% = 0.067 + 0.269 ∗ 5��,%F4 − 0.844 ∗ 5��,% + 0.334 ∗ 5��,%G4 + 0.284 ∗ ∆8�,% − 0.151 ∗ ::;�,% + <�,% The first hypothesis shows that there is a negative relationship between financial reporting quality and sale volatility. For calculation of sale volatility we have calculated the standard deviation of sales changes over years t-4 to t. the sale change is sale growth measured at the end of year. For test of this hypothesis first we need to test following hypothesis to see that whether it is significant or not. Then we have following:

VOLUME NO. 2 (2012), ISSUE NO. 12 (DECEMBER) ISSN 2231-1009
INTERNATIONAL JOURNAL OF RESEARCH IN COMPUTER APPLICATION & MANAGEMENT A Monthly Double-Blind Peer Reviewed (Refereed/Juried) Open Access International e-Journal - Included in the International Serial Directories
http://ijrcm.org.in/
99
U+: - = 0 U4: - < 0 After survey and statistical tests we obtained the below results. As we can see the correlation of coefficient is significant and P < 0.05. The following table reports statistical results of this hypothesis.
TABLE 2: STATISTICAL INFORMATION SUMMARY OF FIRST HYPOTHESIS TESTING
2+ Sale volatility
Coefficient -.039 -.201
P-value 0.000 0.000
t-statistic -28.047 -10.477
F-test 109.757
R .201
R Square .040
Adjusted R Square .040
Durbin-Watson 1.865
Number of observation 2608
Dependent variable: financial reporting quality Independent variable: sales volatility
Source: Author According to this table the 24= - 0.201 with P < 0.0001, therefore U+ is rejected and U4 is accepted. Therefore this hypothesis is accepted and financial reporting quality has negative relationship with sales volatility. According to this result the regression of this hypothesis is as follows: XY�/�,Y/! -Z["-Y�# \./!Y]�,% = −0.039 − ^. _^A ∗ 0/!Z0 `"!/Y!Y]�,%F4 + <�,%
The second hypothesis in this study shows that there is positive relationship between financial reporting quality and book to market value. For calculation of book to market value we have calculated the book value of equity divided by the market value of equity. For test of this hypothesis also first we need to test following hypothesis to see that whether it is significant or not. Then we have following: U+: - = 0 U4: - > 0 After survey and statistical tests we obtained the below results. As we can see the correlation of coefficient is significant and P < 0.05. The following table reports statistical results of this hypothesis.
TABLE 3: STATISTICAL INFORMATION SUMMARY OF SECOND HYPOTHESIS
2+ Financial Reporting Quality
Coefficient 0.559 0.075
P-value 0.000 0.000
t-statistic 36.555 3.668
F-test 13.454
R 0.075
R Square .006
Adjusted R Square .005
Durbin-Watson 1.870
Number of observation 2608
Dependent variable: book to market value Independent variable: financial reporting quality
Source: Author According to above table the 24= 0.075 with P < 0.0001, therefore U+ is rejected and U4 is accepted. Therefore this hypothesis is accepted and financial reporting quality has positive relationship with book to market value. According to this result the regression of this hypothesis is as follows: a""b " c/-bZ `/!.Z�,% = 2+ + ^. ^de ∗ XY�/�,Y/! -Z["-Y�# \./!Y]�,%F4 + <�,%
CONCLUSION This research we have shown that there is a negative significant relationship between financial reporting quality and sales fluctuations. Hence, managers increase financial reporting quality by decreasing sales fluctuations which eventually leads to better investment efficiency. In this research it is also proved that the relationship between book to market ratio and financial reporting quality is positively significant. Firms with higher book to market ratio are more prone to bear risks because with a small shake in market, the market value gets closer or becomes equal to book value. Therefore, it can be understood that a high book to market ratio is riskier and high risk brings higher efficiency. Additionally, the lower the book to market ratio, the higher financial power and lower risk will be faced by firms, hence, lower revenue. Taking into account the positive significant relationship between book to market ratio and financial reporting quality, we can conclude that higher financial reporting quality leads to an increase in book to market ratio, and since value managers look for firms with higher book to market ratio, it would be easier for firms to attract investors and resources than those firms with lower book to market ratio.
REFERENCES
1. Asheq Rahman, Jira Yammeesri, Hector Perera. (2010). Financial reporting quality in international settings: A comparative study of the USA, Japan, Thailand, France and Germany. the international journal accounting , 45, 1–34.
2. Ball, R., and L. Shivakumar. (2005). Earnings quality in UK private firms: Comparative loss recognition timeliness. Journal of Accounting and Economics , 39, 83-128.
3. Ball, R.,S .P. Kothari and A. Robin. (2000). The effect of international institutional factors on properties of accounting earnings. Journal of accounting and
economics, 29(1), 1-51. 4. Bushman, Robert and Abbie Smith. (2001). financial accounting information and corporate governance. Journal of acounting and economics, 32, 237_333. 5. Dechow, P., and I. Dichev. (2002). The quality of accruals and earnings: The role of accrual estimation errors. the accounting review , 77, 35-59. 6. Diamond, d., Verrecchia, R. (1991). Disclosure, liquidity, and the cost of capital. Journal , 46, 1325-1360.

VOLUME NO. 2 (2012), ISSUE NO. 12 (DECEMBER) ISSN 2231-1009
INTERNATIONAL JOURNAL OF RESEARCH IN COMPUTER APPLICATION & MANAGEMENT A Monthly Double-Blind Peer Reviewed (Refereed/Juried) Open Access International e-Journal - Included in the International Serial Directories
http://ijrcm.org.in/
100
7. Fan, J., & Wong, T. J. (2002). Corporate ownership structure and the informativeness of accounting earnings in East Asia. Journal of Accounting and
Economics, 33 (3), 401−425. 8. Feng Chen., Ole-Kristian Hope,. Qingyuan Li,. Xin Wang. (2010, July 6). Financial Reporting Quality and Investment Efficiency of Private Firms in Emerging
Markets. Working paper . 9. Froot, K., Perold, A., Stein, J. (1992, september / october). Shareholder trading practices and corporate. Journal of applied corporate finance, 42-58. 10. Healy,P., Hutton, A., Palepu, K. (1999). Stock performance and intermediation change surrounding sustained increase in disclosure. Contemporary
accounting research, 458-520. 11. Lambert, R. 2. (2001). Contracting theory and accounting. Journal of accounting and economics, 32, 3-87. 12. Lambert, R., C. Leuz, and R. Verrecchia. (2007). Accounting information, disclosure, and the cost. Journal of accounting research, 45, 385-420. 13. Leuz, C., Verrecchia, R. (2000). Economic consequences of increased disclosure. Journal of accounting research, 37, 353-385. 14. Morck, R., A. Shleifer, and R.W. Vishny. (1988). Management ownership and market valuation: an empirical analysis. Journal of Financial Economics, 20,
293–315. 15. Myers, S. and N. Majluf. (1984). Corporate financing and investment decisions when firms have information that investors do not have. Journal of financial
economics, 13 (2), 187-221. 16. Pastor, L., Veronesi, P. (2003). Stock valuation and learning about profitability. Journal of finance, 58, 1749-1789. 17. Rodrigo S verdy and Catherine schrand. (2006). financial reporting quality and invesment efficiency. Pennsylvania, united stat. 18. Shiva Rajgopal a,. MohanVenkatachalam. (2010). Financial reportingqualityandidiosyncraticreturnvolatility. Journal of Accounting and Economics. 19. Verrecchia, R. 2. (2001). Essays on disclosure. Journal of Accounting and Economics, 32, 91_180.

VOLUME NO. 2 (2012), ISSUE NO. 12 (DECEMBER) ISSN 2231-1009
INTERNATIONAL JOURNAL OF RESEARCH IN COMPUTER APPLICATION & MANAGEMENT A Monthly Double-Blind Peer Reviewed (Refereed/Juried) Open Access International e-Journal - Included in the International Serial Directories
http://ijrcm.org.in/
101
WORKING CAPITAL MANAGEMENT IN MANUFACTURING INDUSTRY: A STUDY WITH REFERENCE TO SELECTED MANUFACTURING INDUSTRIES IN INDIA
KUSHALAPPA. S
ASST. PROFESSOR
DEPARTMENT OF MBA
ALVA’S COLLEGE
MOODBDRI
SHARMILA KUNDER
ASST. PROFESSOR
DEPARTMENT OF COMMERCE & MANAGEMENT
ALVA’S COLLEGE
MOODBDRI
ABSTRACT
One of the most important areas in the day to day management of the firm is the management of working capital. Working capital management is the
functional area of finance that covers all the current accounts of the firm. It is concerned with management of the level of individual current assets as well as the
management of total working capital. The goal of working capital management is to ensure that the firm is able to continue its operations and that it has
sufficient cash flow to satisfy both maturing short-term debt and upcoming operational expenses. The interaction between current assets and current liabilities
is, therefore, the main theme of working capital management. The study aims to evaluate the working capital position of manufacturing industries in India. The
study deals with working capital management in Indian manufacturing industries. Study covers five manufacturing industries. They are; Cement Industry, FMCG
Industry, Oil and Gas Industry, Automobile Industry and Pharmaceutical Industry. Under each industry five companies have been taken for the purpose of
analyzing the working capital position of each industry. The entire study is based on the secondary data, procured and extracted from the financial statements of
the selected companies of the selected industries covering a period of five years from 2007-08 to 2011-12. For the purpose of analyzing the liquidity position of
the selected companies under each industry and to evaluate the working capital position of selected manufacturing industries and to test the hypotheses, two
kinds of tools have been used. They are statistical tools and financial ratios.
KEYWORDS Working capital, Liquidity, Manufacturing Industry, Current Ratio, Quick Ratio.
INTRODUCTION ne of the most important areas in the day to day management of the firm is the management of working capital. Working capital management is the functional area of finance that covers all the current accounts of the firm. It is concerned with management of the level of individual current assets as well as the management of total working capital. Working capital refers to the funds invested in current assets, i.e., investment in stocks, sundry
debtors, cash and other current assets. Current assets are essential for effective utilization of the fixed assets. Working capital management involves managing the balance between firm’s short-term assets and its short-term liabilities. The goal of working capital management is to ensure that the firm is able to continue its operations and that it has sufficient cash flow to satisfy both maturing short-term debt and upcoming operational expenses. The interaction between current assets and current liabilities is, therefore, the main theme of working capital management. There are many aspects of working capital management which makes it important function of financial management. � Time: working capital management requires much of the finance manager’s time. � Investment: working capital represents a large portion of the total investment in assets. � Credibility: working capital management has great significance for all firms but it is very critical for small firms. � Growth: The need for working capital is directly related to the firm’s growth. The present study deals with the working capital management in manufacturing industries in India. In a country like India where infrastructure is not well developed, most of the manufacturing firms are not able to adopt Just In Time management system. Therefore it is inevitable for the firms to invest large amount of funds in the form of inventories. Similarly, firms are forced sell the goods on credit basis. All these enforce the manufacturing and trading firms to invest large amount in the form of current assets. Inadequate investment in working capital reduce the liquidity position of the firm and thereby suffers from cost of illiquidity and excess investment in working capital reduce the profitability of the firm because of high opportunity cost and other costs of liquidity. Here an attempt is made by the researchers to analyse and evaluate the liquidity position of selected manufacturing industries in India.
OBJECTIVES OF THE STUDY The core objective of this study is to evaluate the working capital position of manufacturing industries in India. However in order to achieve the main objectives, the following subsidiary objectives have been framed by the researchers:
• To examine the liquidity position of selected companies under each manufacturing industry
• To compare the liquidity position of different companies under each industry
• To compare the liquidity position of different manufacturing industries
• To find out the correlation between liquidity position of various manufacturing industries
• To offer meaningful suggestions, if necessary, to the manufacturing industries
HYPOTHESIS In addition to the above objectives, the researchers formulated the following Hypothesis: H0: There is no significant difference among the liquidity position of selected manufacturing industries
SCOPE OF THE STUDY The study deals with working capital management in Indian manufacturing industries. Study covers five manufacturing industries. They are; Cement Industry, FMCG Industry, Oil and Gas Industry, Automobile Industry and Pharmaceutical Industry. Under each industry five companies have been taken for the purpose of
O

VOLUME NO. 2 (2012), ISSUE NO. 12 (DECEMBER) ISSN 2231-1009
INTERNATIONAL JOURNAL OF RESEARCH IN COMPUTER APPLICATION & MANAGEMENT A Monthly Double-Blind Peer Reviewed (Refereed/Juried) Open Access International e-Journal - Included in the International Serial Directories
http://ijrcm.org.in/
102
analyzing the working capital position of each industry. Even though there are many more manufacturing industries in India, the scope of the study confined to only five manufacturing industries.
METHODOLOGY The entire study is based on the secondary data, procured and extracted from the financial statements of the selected companies of the selected industries covering a period of five years from 2007-08 to 2011-12. For the purpose of analyzing the liquidity position of the selected companies under each industry and to evaluate the working capital position of selected manufacturing industries and to test the hypotheses, two kinds of tools have been used. They are statistical tools and financial ratios. The tests have been conducted at 5% level of significance. The critical value of F with 4 and 20 degrees of freedom is 2.87. The statistical tools used in this study are: Arithmetic Mean, Correlation and Analysis of Variance (ANOVA) have been used extensively. Various kinds of liquidity ratios have been used as the financial tools for the purpose of analysis.
RESULTS AND DISCUSSION It is clear from Table 1 that Tata motors have invested maximum amount in inventories, i.e., 53% of the total current assets in inventory and Bajaj Motors have invested only 22% of the current assets in inventory. Mahindra and Mahindra has invested maximum, i.e., 40% of the current assets in trade receivables and Hero Motors have invested least, i.e, only 17% of the current assets in trade receivables. Hero Motors have invested maximum of 42% of the current assets in the form of cash in hand and bank and Tata Motors have invested the least, i.e., 12 of the current assets in cash in hand and bank. It is found that all the companies of Automobile Industry have negative working capital and the average net working capital of the industry is -2382.65. As per Table2, it is crystal clear that Ultratech Cement has invested maximum amount in inventories, i.e., 70% of the total current assets in inventory and Grasim cement and India cement have invested only 57% of the current assets in inventory. India Cement has invested maximum, i.e., 41% of the current assets in trade receivables and J.K. cement have invested least, i.e, only 18% of the current assets in trade receivables. J.K cement has invested 19% of the current assets in the form of cash in hand and bank and India Cement has invested the least, i.e., 1% of the current assets in cash in hand and bank. It is found that all the companies of Cement Industry have negative working capital and it is highest in Madras Cement (92%) and the average net working capital of the industry is -567.48. It is found in Table 3 that ITC has invested maximum amount in inventories, i.e., 84% of the total current assets in inventory and Dauber has invested only 59% of the current assets in inventory. Asian paint has invested maximum, i.e., 27% of the current assets in trade receivables and Britannia Industries have invested least, i.e, only 18% of the current assets in trade receivables. Among the companies Dauber has invested 15% of the current assets in the form of cash in hand and bank and ITC has invested the least, i.e., 2% of the current assets in cash in hand and bank. It is found that HUL and Britania Industries have negative net working capital and rests of the sample companies under FMCG industry have positive net working capital. From Table 4 it is found that among the companies Indian Oil has invested maximum amount in inventories, i.e., 81% of the total current assets and GAIL has invested only 32% of the current assets in inventory. GAIL has invested maximum, i.e., 63% of the current assets in trade receivables compared to other companies and Indian Oil has invested the least, i.e., only 18% of the current assets in trade receivables. Again GAIL has invested 5% of the current assets in the form of cash in hand and bank, which is highest, compared to other companies, Reliance Industries have invested the least, i.e., 1% of the current assets in cash in hand and bank. It is found that all the companies of Oil and Gas Industry have negative working capital and it is highest in ONGC (242% of current assets) and the average net working capital of the industry is -7820.38. It is understood from the Table 5 that compared to other companies in the industry Cipla has invested maximum amount in inventories, i.e., 49% of the total current assets in inventory and Dr. Reddy’s have invested only 39% of the current assets in inventory. Among the companies Dr.Reddy’s has invested maximum, i.e., 59% of the current assets in trade receivables and Cipla has invested the least, i.e, only 49% of the current assets in trade receivables. Dr. Reddy’s have invested 3% of the current assets in the form of cash in hand and bank whereas Arabindo pharma has invested the least, i.e., 0.9% of the current assets in cash in hand and bank. It is found that all the companies of Pharmaceutical Industry have positive net working capital and it is highest in Cipla and Arabindo Pharma and the average net working capital of the industry is 1213.56. Table 6 shows that except Pharmaceutical Industry, none of the sample manufacturing industries have standard current ratio of 2:1. Among the sample manufacturing industries, Oil and Natural Gas industry is the least liquid industry and Pharmaceutical industry is the most liquid industry. It is also clear from the above table that overall average current ratio of the manufacturing industry is less than the standard ratio. It is understood from Table 7 shows that except Pharmaceutical Industry, none of the sample manufacturing industries have standard quick ratio of 1:1. In terms of quick ratio, again it is proved that Oil and Natural Gas industry is the least liquid industry and Pharmaceutical industry is the most liquid industry and it is also clear from the above table that overall average quick ratio of the manufacturing industry is less than the standard ratio. As per Table 8, it is clear that the Current Assets to Total Assets ratio of Pharmaceutical Industry is highest (0.35) and Oil and Natural Gas Industry has the least ratio (0.11). It is also found that the overall average Current Assets to Total Assets ratio is 0.22. It is crystal clear from the Table 9 that Oil and Natural Gas Industry has the highest (11.34) Current Assets Turnover Ratio and Pharmaceutical Industry has the least (1.897) Current Assets Turnover ratio. The average Current Assets Turnover Ratio of the manufacturing industry is 6.84. The Current Assets Turnover Ratio of Cement Industry, FMCG Industry and Pharmaceutical Industry is less than the average ratio of the manufacturing industry and remaining industries have more than the average ratio of the manufacturing industry. From Table 10 it is found that the correlation between the current ratios of Cement Industry and FMCG Industry, FMCG and Oil and Natural Gas Industry is strong negative, between Automobile and Cement Industry, Automobile and Oil and Natural Gas Industry it is weak negative. The correlation between the current ratios of all other industries with Pharmaceutical Industry is weak negative and the correlation between the ratios of FMCG and Automobile Industry, Cement and Oil and Gas Industry is strong positive.
TABLE 1: WORKING CAPITAL POSITION OF AUTOMOBILE COMPANIES (Rs. in crores)
Particulars Tata M&M Maruti Suz Hero Mot Bajaj Average
Current assets (Five years average form 2007-08 -2011-12)
Inventory 3,213.37 1,477.23 1,272.12 456.166 472.094 1,436.22
% of TCA 53% 45% 49% 41% 22% 50%
Trade receivables 2,077.81 1,329.94 843.04 191.734 338.552 955.89
% of TCA 34% 40% 32% 17% 26% 33%
Cash & Bank balances 750.87 499.91 506.56 463.08 501.138 471.34
% of TCA 12% 15% 19% 42% 38% 16%
Total Current Assets 6,042.05 3,307.08 2,621.72 1110.98 1311.784 2,863.46
Current liabilities (Five years average form 2007-08 -2011-12)
Total Current Liab. 14,986.15 4,415.88 3,671.10 3187.45 2066.266 5,246.11
% of TCA 248% 134% 140% 287% 158% 183%
Net Working Capital -8944.10 -1108.80 -1049.38 -2076.47 -754.48 -2382.65
% of Current Assets -34% -40% -40% -58% -13% -34%
Source: Annual reports of the companies

VOLUME NO. 2 (2012), ISSUE NO. 12 (DECEMBER) ISSN 2231-1009
INTERNATIONAL JOURNAL OF RESEARCH IN COMPUTER APPLICATION & MANAGEMENT A Monthly Double-Blind Peer Reviewed (Refereed/Juried) Open Access International e-Journal - Included in the International Serial Directories
http://ijrcm.org.in/
103
TABLE 2: WORKING CAPITAL POSITION OF CEMENT COMPANIES (Rs. in crores)
Particulars Ultratech cement Grasim cement India cement J.K. cement Madras cement Average
Current Assets (Five years average form 2007-08 -2011-12)
Inventory 1,223.18 765.296 450.658 234.432 373.498 609.41
% of TCA 70% 57% 57% 63% 68% 64%
Trade receivables 397.37 520.97 322.906 67.33 140.138 289.74
% of TCA 23% 39% 41% 18% 25% 30%
Cash & Bank balances 121.97 55.898 10.214 69.87 36.834 58.96
% of TCA 7% 4% 1% 19% 7% 6%
Total Current Assets 1,742.52 1342.164 783.778 371.632 550.47 958.11
Current Liabilities (Five years average form 2007-08 -2011-12)
Total Current Liab. 3,186.79 1377.69 1411.222 596.704 1055.558 1,525.59
% of TCL 183% 103% 180% 161% 192% 159%
Net Working Capital -1,444.27 -35.53 -627.44 -225.07 -505.09 -567.48
% of Current Assets -83% -3% -80% -61% -92% -59%
Source: Annual reports of the companies
TABLE 3: WORKING CAPITAL POSITION OF FMCG COMPANIES (Rs. in crores)
Particulars HUL ITC Dabur Asian paint Britannia Industries Average
Current Assets (Five years average form 2007-08 -2011-12)
Inventory 2,398.06 4,820.93 350.092 837.00 303.396 1,741.90
% of TCA 72% 84% 59% 63% 79% 76%
Trade receivables 656.18 831.61 153.986 352.25 48.968 408.60
% of TCA 20% 14% 26% 27% 13% 18%
Cash & Bank balances 282.81 116.30 87.12 133.84 32.08 130.43
% of TCA 8% 2% 15% 10% 8% 6%
Total Current Assets 3,337.04 5,768.84 591.198 1,323.09 384.444 2,280.92
Current Liabilities (Five years average form 2007-08 -2011-12)
Total current liab. 5183.02 4827.52 486.702 1273.89 438.79 2441.984
% of TCA 155% 84% 82% 96% 114% 107%
Net Working Capital -1,845.98 941.32 104.50 49.20 -54.35 -161.06
% of Current Assets -55% 16% 18% 4% -14% -7%
Source: Annual Reports of the companies
TABLE 4: WORKING CAPITAL POSITION OF OIL AND GAS COMPANIES (Rs. in crores)
Particulars Reliance industries ONGC GAIL Bharath Petrolium Indian oil Average
Current Assets (Five years average form 2007-08 -2011-12)
Inventory 24,369.25 3,874.52 815.55 12,155.95 39,721.78 16,187.41
% of TCA 67% 50% 32% 77% 81% 73%
Trade receivables 11,665.02 3,621.63 1,590.87 2,947.94 8,585.78 5,682.25
% of TCA 32% 47% 63% 19% 18% 25%
Cash & Bank balances 514.77 219.50 132.16 620.12 695.82 436.47
% of TCA 1% 3% 5% 4% 1% 2%
Total Current Assets 36,549.04 7,715.66 2,538.58 15,724.02 49,003.37 22,306.13
Current Liabilities (Five years average form 2007-08 -2011-12)
Total current liab. 49511.17 26360.38 6893.08 18670.52 49197.41 30126.51
% of TCA 135% 342% 272% 119% 100% 135%
Net Working Capital -12962.13 -18644.72 -4354.50 -2946.50 -194.04 -7820.38
% of Current Assets -35% -242% -172% -19% -0.3% -35%
Source: Annual Reports of the companies
TABLE 5: WORKING CAPITAL POSITION OF PHARMA COMPANIES (Rs. in crores)
Particulars Dr.Reddy’s Cipla Sun pharma Lupin Arabindo pharma Average
Current Assets (Five years average form 2007-08 -2011-12)
Inventory 932.67 1,547.81 479.63 804.02 962.37 945.3
% of TCA 39% 49% 42% 44% 44% 44%
Trade receivables 1,418.38 1,560.02 628.276 996.69 1,192.60 1159.193
% of TCA 59% 49% 55% 55% 55% 54%
Cash & Bank balances 71.74 65.93 25.696 22.34 20.94 41.3292
% of TCA 3% 2% 2% 1% 0.9% 2%
Total Current Assets 2,422.79 3,173.77 1133.60 1,823.06 2,175.90 2145.82
Current Liabilities (Five years average form 2007-08 -2011-12)
Total current liab. 1,318.59 1,135.13 545.02 883.70 778.89 932.27
% of TCA 54% 36% 48% 48% 36% 43%
Net Working Capial 1,104.20 2,038.64 588.58 939.36 1,397.01 1,213.56
% of Current Assets 46% 64% 52% 55% 64% 57%
Source: Annual Reports of the companies

VOLUME NO. 2 (2012), ISSUE NO. 12 (DECEMBER) ISSN 2231-1009
INTERNATIONAL JOURNAL OF RESEARCH IN COMPUTER APPLICATION & MANAGEMENT A Monthly Double-Blind Peer Reviewed (Refereed/Juried) Open Access International e-Journal - Included in the International Serial Directories
http://ijrcm.org.in/
104
TABLE 6: CURRENT RATIO OF THE SAMPLE MANUFACTURING COMPANIES
Year/Industry Automobile Cement FMCG Oil and Gas Pharma Mean
March 2012 0.754084 0.657251 0.98 0.673313 2.419031 1.096736
March 2011 0.783979 0.781924 0.99 0.6716993 2.63423 1.172366
March 2010 0.759158 0.770684 0.93 0.6766392 2.139593 1.055215
March 2009 0.794258 0.60093 1.09 0.54238678 2.246985 1.054912
March 2008 0.827024 0.632627 1.10 0.642141 2.353166 1.110992
Mean 0.783701 0.688683 1.018 0.641236 2.358601 1.098044
Source: Annual Reports of the company
TABLE 7: QUICK RATIO OF THE SAMPLE MANUFACTURING COMPANIES
Year/Industry Automobile Cement FMCG Oil and Gas Pharma Mean
March 2012 0.372468 0.242589 0.34 0.226995 1.2731426 0.491039
March 2011 0.23807 0.317157 0.25 0.205147 1.4148127 0.485037
March 2010 0.316885 0.315364 0.24 0.191451 1.1823729 0.449215
March 2009 0.322313 0.217879 0.31 0.18616 1.3886068 0.484992
March 2008 0.328431 0.271051 0.31 0.195043 1.2903375 0.478973
Mean 0.315633 0.272808 0.29 0.200959 1.3098545 0.477851
Source: Annual Reports of the companies
TABLE 8: CURRENT ASSETS TO TOTAL ASSETS OF THE SAMPLE MANUFACTURING COMPANIES
Year/Industry Automobile Cement FMCG Oil and Gas Pharma Mean
March 2012 0.2125394 0.1178706 0.3274886 0.13507395 0.34244336 0.227083
March 2011 0.1908128 0.1136735 0.31177 0.12609239 0.34366437 0.217203
March 2010 0.2125592 0.1174604 0.2863 0.1108786 0.32710606 0.210861
March 2009 0.1968757 0.1142564 0.3259029 0.08263231 0.39021227 0.221976
March 2008 0.2130726 0.1216362 0.342049 0.11366063 0.3422902 0.226542
Mean 0.2051719 0.1169794 0.3187021 0.11366758 0.34914325 0.220733
Source: Annual Reports of the companies
TABLE 9: CURRENT ASSETS TURNOVER RATIO OF MANUFACTURING INDUSTRY
Year/Industry Automobile Cement FMCG Oil and Gas Pharma Mean
March 2012 10.48018 5.697793 6.0788167 10.58341 1.895667 6.94717334
March 2011 12.88311 5.276733 6.1448607 10.03349 1.798105 7.22725974
March 2010 7.914375 6.695587 6.54510046 10.1873 2.048129 6.67809829
March 2009 9.310667 6.487055 6.31424731 14.88671 1.735643 7.74686446
March 2008 9.05708 6.595039 5.53009105 11.01516 2.008109 6.84109581
Mean 9.929083 6.150442 6.12262324 11.34121 1.897131 7.08809785
Source: Annual Reports of the companies
TABLE 10: CORRELATION BETWEEN THE CURRENT RATIOS OF VARIOUS INDUSTRIES
Industry Automobile Cement FMCG Oil and Gas Pharma
Automobile 1 -0.45372 0.871334 -0.4195 0.102004
Cement 1 -0.80055 0.710263 0.258023
FMCG 1 -0.72567 0.01403
Oil and Gas 1 0.319146
Pharma 1
Source: Annual Reports of the companies
TESTING OF HYPOTHESIS H0: There is no significant difference among the liquidity position of selected manufacturing industries
TABLE 11: ONE WAY ANALYSIS OF VARIANCE BETWEEN SELECTED MANUFACTURING INDUSTRIES (DATA OF 5 YEARS FROM 2006-2010) AND (CRITICAL VALUE OF F=2.86608)
Ratio Sources of Variation SS df MS F
Current ratio Between Sample 274.626 4 68.66 41.85 Within Sample 32.74 20 1.64
Table 11 shows that the calculated F value is higher than the critical value of F. Hence the null hypothesis; there is no significant difference among the liquidity position of selected manufacturing industries, is rejected.
FINDINGS OF THE STUDY An attempt is made here to present a succinct report of what has been discussed and analysed in results and discussions. The analysis and interpretation of the field data resulted in the following major findings: AUTOMOBILE INDUSTRY
• Among the sample automobile companies, Tata motors have invested maximum amount in inventories i.e., 53% of the total current assets in inventory
• Mahindra and Mahindra has invested maximum ( 40%) proportion of the current assets in trade receivables
• Hero Motors have invested maximum of 42% of the current assets in the form of cash in hand and bank
• It is found that all the companies of Automobile Industry have negative working capital and the average net working capital of the industry is -2382.65. CEMENT INDUSTRY
• Among the sample cement industries, Ultratech Cement has invested maximum amount in inventories, i.e., 70% of the total current assets in inventory
• India Cement has invested maximum, i.e., 41% of the current assets in trade receivables
• Compared to other companies , J.K cement has invested more (19% of the current assets) in the form of cash in hand and bank
• It is found that all the companies of Cement Industry have negative working capital and the average net working capital of the industry is -567.48.

VOLUME NO. 2 (2012), ISSUE NO. 12 (DECEMBER) ISSN 2231-1009
INTERNATIONAL JOURNAL OF RESEARCH IN COMPUTER APPLICATION & MANAGEMENT A Monthly Double-Blind Peer Reviewed (Refereed/Juried) Open Access International e-Journal - Included in the International Serial Directories
http://ijrcm.org.in/
105
FMCG INDUSTRY
• As per the study, ITC has invested maximum amount in inventories, i.e., 84% of the total current assets in inventory
• Compared to other companies Asian paint has invested maximum, i.e., 27% of the current assets in trade receivables
• Among the companies Dauber has invested more i.e., 15% of the current assets in the form of cash in hand and bank
• It is found that HUL and Britania Industries have negative net working capital and rests of the sample companies under FMCG industry have positive net working capital.
OIL AND GAS INDUSTRY
• Among the oil companies Indian Oil has invested maximum amount in inventories, i.e., 81% of the total current assets
• GAIL has invested maximum, i.e., 63% of the current assets in trade receivables compared to other companies
• It is found that all the companies of Oil and Gas Industry have negative working capital and it is highest in ONGC and the average net working capital of the industry is -7820.38.
PHARMACEUTICAL INDUSTRY
• As compared to other companies in the industry Cipla has invested maximum amount in inventories, i.e., 49% of the total current assets in inventory
• Among the companies Dr.Reddy’s has invested maximum, i.e., 59% of the current assets in trade receivables
• It is found that all the companies of Pharmaceutical Industry have positive net working capital and it is highest in Cipla and Arabindo Pharma and the average net working capital of the industry is 1213.56.
CONCLUSION On the basis of the findings of the study, it can be concluded that except Pharmaceutical Industry, none of the sample manufacturing industries have positive working capiatal. Among the sample manufacturing industries, Oil and Natural Gas industry is the least liquid industry and Pharmaceutical industry is the most liquid industry. Even though investment in current assets is a dead investment, companies, especially trading and manufacturing industries are supposed to have 2:1 current ratio, to meet all its current obligations in time. As per the study it is clear that most of the manufacturing industries do not have such capacity because most of the manufacturing companies have invested larger part of their current assets investment in the least liquid current asset, i.e., inventories. In case of Pharmaceutical Industry the investment in current assets is more than the standard investment. It shows that even though its liquidity position is strong, profitability point of view, excess investment in current assets is not good for the wealth of the firm. Therefore, the authors herewith suggest the manufacturing companies that they have to maintain a trade-off between the liquidity and profitability while managing the working capital.
REFERENCES 1. Agrawal, N.K, (2003) Management of Working Capital, Sterling Publishers Pvt. Ltd., New Delhi 2. Agrawal, N.P, (1983) Analysis of Financial Statements. National Publishing House. New Delhi 3. Brigham E F and Gapenski L C (1991), Financial Management: Theory and Practice, 6th Edition, The Dryden Press, Orlando, Fl. 4. Chandra Prasanna (2010),Fundamentals of Financial Management, Tata McGraw Hill Education Pvt. Ltd., New Delhi 5. Chandra Prasanna, (2008) Financial Management, Seventh edition, Tata McGraw–Hill, New Delhi 6. Ghosh S K and Maji S G (2004), “Working Capital Management Efficiency: A Study on the Indian Cement Industry”, Management Accountant, Vol. 39, No. 5,
pp. 363-372. 7. Gupta. S. C., (1991), Fundamentals of Statistics, 6th revised and enlarged edition, Himalaya Publishing House, New Delhi 8. Harris A (2005), Working Capital Management: Difficult, but Rewarding, Financial Executive, Vol. 21, No. 4, pp. 52-53. 9. Khan M Y and Jain P K, (2010) Financial Management, Fifth edition, Tata McGraw –Hill, New Delhi 10. Khan M.Y., Jain P.K.(2002), Cost Accounting and Financial Management, Tata McGraw Hill, New Delhi. 11. Kuchhal, S.C., (1985), Financial Management, Chitanya Publishing, Allahabad. 12. Kulkarni, P.V., Sathya Prasad B.G.(1999), Financial Management, Himalaya Publishing, Bombay. 13. Maheshwari S N (1996), Management Accounting and Financial Control, Sultan Chand & Sons, New Delhi. 14. Pandey I. M, (2004) Financial Management, Ninth edition, Vikas Publishing House, New Delhi 15. Van Horne J C and Wachowicz J M (2004), Fundamentals of Financial Management, 12th Edition, Prentice Hall Publishers, New York 16. Van Horne, James C. (2002), Financial Management and Policy, Prentice-Hall of India: New Delhi.

VOLUME NO. 2 (2012), ISSUE NO. 12 (DECEMBER) ISSN 2231-1009
INTERNATIONAL JOURNAL OF RESEARCH IN COMPUTER APPLICATION & MANAGEMENT A Monthly Double-Blind Peer Reviewed (Refereed/Juried) Open Access International e-Journal - Included in the International Serial Directories
http://ijrcm.org.in/
106
TALENT ACQUISITION AND RETENTION: A STUDY IN INDIAN SMALL AND MEDIUM ENTERPRISES
DR. SNIGDHARANI MISHRA
ASSOCIATE PROFESSOR
ITM BUSINESS SCHOOL
KHARGHAR
JASMINE T. JHA
MANAGER RESEARCH
ITM BUSINESS SCHOOL
KHARGHAR
ABSTRACT
This paper attempts to study the challenges of HR practices in Small and Medium Scale Enterprises (SME). It was found that SME’s have to still go a long way to
recognize the importance of human resource practices, which may help the organizations to attract better talent and make strategies to retain those talents.
This study conducted showed that SME focus on talent acquisition through internal referrals which also proved to be an inexpensive method for talent hunt.
Talent acquisition is the process of attracting, finding, selecting and retaining skilled individuals. Talent acquisition and retention are the major challenges faced
by SME’s. The importance of acquiring talent is well recognized within SME’s in today’s economic environment. Hiring retired personnel and associating closely
with Colleges offering Master’s in Business Administration (MBA), so that the management professionals can be hired for a short-term internship program by
SME’s will help in cost cutting and SME’s will be the ultimate gainers.
KEYWORDS Small and Medium Scale Enterprises, Talent acquisition, Talent Retention, HR Practices, Recruitment.
INTRODUCTION he change in the world economy has given a chance to Small and Medium Scale Enterprises to grow. There is an enormous growth in the Indian Economy. The Government of India has also shown interest in the growth of small and medium enterprises (SME). Small and medium sized enterprises (SMEs) sector in India has been the pivot of sustenance of all major Industries. Many policies have been formulated to achieve various objectives such as:
1. Contribution in Defence production 2. Export Income 3. Increase in Manufacturing Products in India 4. Less investments 5. Competition in the export and domestic markets All India censuses for the SME sector show that there are 26100797 SME’s as per their survey conducted in the year 2006-2007 (http://www.smeworld.org/story /top-stories /number-of-smes-in-india.php).
Sr. No. State/UT No. of Enterprises (2006-07)
Registered Sector Unregistered Sector Total
01 Jammu and Kashmir 14534 246803 261337
02 Himachal Pradesh 11937 172914 184851
03 Punjab 50113 753872 803985
04 Chandigarh 1001 30746 31747
05 Uttarakhand 23767 202746 226513
06 Haryana 33783 570312 604095
07 Delhi 728 616749 612207
08 Rajasthan 55108 1216355 1271463
09 Uttar Pradesh 187522 2925794 3113316
10 Bihar 52188 950071 1002259
11 Sikkim 123 11716 11839
12 Arunachal Pradesh 452 19971 20423
13 Nagaland 1331 25807 27138
14 Manipur 4507 60295 64802
15 Mizoram 3714 18665 22379
16 Tripura 1253 108412 109665
17 Meghalaya 3063 45627 48690
18 Assam 18671 584870 603541
19 West Bengal 42635 2470668 2513303
20 Jharkhand 18200 357433 375633
21 Orissa 19587 1042099 1061686
22 Chhattisgarh 26235 338316 364551
23 Madhya Pradesh 108804 1181732 1290536
24 Gujarat 229830 867271 1097101
25 Daman & Diu 595 6612 7207
26 Dadra & Nagar Haveli 1715 4412 6127
27 Maharashtra 86635 2496235 2582870
28 Andhra Pradesh 24892 1980152 2005044
29 Karnataka 139640 1472015 1611655
30 Goa 3137 48354 51491
31 Lakshadweep 89 1097 1186
32 Kerala 149847 1318257 1468104
33 Tamil Nadu 233996 2361131 2595127
34 Puducherry 2109 32300 34409
35 Andaman & Nicobar Island 750 8767 9517
ALL INDIA 1552491 24548306 26100797
Source: http://www.smeworld.org/story/top-stories/number-of-smes-in-india.php)
T

VOLUME NO. 2 (2012), ISSUE NO. 12 (DECEMBER) ISSN 2231-1009
INTERNATIONAL JOURNAL OF RESEARCH IN COMPUTER APPLICATION & MANAGEMENT A Monthly Double-Blind Peer Reviewed (Refereed/Juried) Open Access International e-Journal - Included in the International Serial Directories
http://ijrcm.org.in/
107
A not so talked about, but “to be accepted” fact - SME’s account for almost 90% of industrial units in India and 40% of value addition in the manufacturing sector (Raju, 2008). There is a body of SME’s named as SME Chamber of India which states that “45% of industrial output, 40% of exports, employing 60 million people, create 1.3 million jobs every year and produce more than 8000 quality products for the Indian and international markets. SME's Contribution towards GDP in 2011 was 17%, which is expected to increase to 22% by 2012. There are approximately 30 million MSME Units in India and 12 million persons are expected to join the workforce in the next 3 years” ((http://www.smechamberofindia.com/PDF/SME_brochure.pdf). The major sectors in SME’s are food processing, electrical supplies, agricultural equipment manufacturing, automotive parts manufacturing, handicrafts, sports goods, textiles etc. It’s a big challenge for the government and for the leaders of the industry to develop the small and medium enterprises by putting in place an independent and self-sustainable eco-system that encourages the growth of the economy. A study by a researcher showed that small and medium scale enterprises also face the challenge of the non-availability of technically trained human resource professional (Kharbanda, 2001). World Bank has approved US$120 million loan to the Small Industries Development Bank of India (SIDBI), backed by a Government of India guarantee. This loan is aimed at improving SME access to finance and business development services, thereby fostering SME growth, competitiveness and employment creation. (Press release by World Bank in the year 2005 entitled “India: World Bank to Support Small and Medium Enterprises”, Press Release No: 2005/188/SAR). From the macro-economic point of view, SME’s can be a major growth factor for the Indian economy. SME’s can be a center for providing employment and SME’s can be a route to entrepreneurship. It also creates an environment where in the SME’s can grow into larger companies.
DEFINITION OF SME Definition of SME’s varies differently in different countries. Some definitions of various countries are described in Table 1.
TABLE 1: DEFINITIONS OF SME IN VARIOUS COUNTRIES
Category Country Category of Industry Criteria
Developed economies Australia Manufacturing services 100 employees <20 employees
Germany SME <500 employees
France SME 10-499 employees
Japan Manufacturing < 200 employees
Canada Manufacturing < 200 employees
USA Very small <20 employees
Small 20-99 employees
Medium 100-499 employees
Developing economies China SME Depends on product group
Usually 100 employees
Investment ceiling US$8 million
Indonesia SME <100 employees
Malaysia SME’s <175 full time workers
Investment US$1 million
Thailand Labor intensive <200 employees
Capital Intensive <100 employees
India SME Upto Rs. 10 million in plant and machinery
Source: Dangayach and Deshmukh, 2005
HR IN SME SECTOR As Charles Darwin (1859) once said it’s not necessarily the strongest and largest species that survive but the ones that are most responsive to change. This applies to corporate sector organizations as well.In order to meet the steps with the bigger organizations, SME’s need to change their outlook, creative ideas and their practices by achieving management expertise and adopting new management practices. It is essential that small business obtains and maintains the best possible staff to sustain their competitiveness. This has been confirmed by Crompton, Morrissey and Nankervis (2002) when they suggest that the enhancement of work performance and positive contribution to business success can be made through the identification and successful recruitment, selection and retention of staff (Crompton, Morrissey and Nankervis 2002). Recruitment, Relationship and Retention are intuitive as a means of creating sustainable entrepreneurship in SME’s (Cameron and Miller, 2008). To achieve the desired goals, the SME’s will have to build strategies as the first significant step. These strategies have to be implemented and then only the desired goals can be achieved. SME’s have to collaborate with bigger organizations by providing them the whole information of their strategies which will help them to understand how their role can have an impact on the performance of the organization. Therefore it is necessary that SME’s also collaborate with their employees, customers and suppliers to increase their efficiencies. The management in SME’s is keenly interested to keep the employee matters with themselves rather than creating an HR department to handle the issues related to employees. This survey also showed that most of the SME’s do not have HR department and are not willing to spend their resources on HR. Be it SME or some bigger corporate organization most of these organizations are employee centered and it revolves around them. Hence it is important for the management to be in constant touch with their employees for smooth functioning of the organization. The emotional bonding between the management and the employees will help the SME to achieve the maximum benefits. Today, proper well-defined human resource management team can help an organization in finding solutions to a wide range of issues in Human Resource Management. This will help the organization to find new talents and put them in the right jobs, develop their skills, reward them with incentives on their good performance, provide good support system and retain them and increase their efficiency. This will eventually lead to low cost and increase the profits of the organization. As the size of an SME organization has its limitations they cannot justify full-time HR professionals in their organizations. Thus, the complex and time-consuming nature of many HR activities can result in a significant drain on existing managerial resources (Klaas, McClendon and Gainey, 2000).
HR CHALLENGES IN SME SECTOR When bigger organizations go on a rampage, smaller ones have to think smart. This is the wisdom for India’s small and medium enterprises (SME’s) that fail to keep pace with the growth juggernaut (Bhatt and Reddy, 2011). Lot of internal competition is prevailing within the SME’s and it is very important for them to benchmark various processes to remain competitive and ensure they can gain some advantage from their competitors by staying a step ahead. One of the growth indicators of utmost importance to the SME’s is Human Resource. The larger organizations which desire for speedy growth have understood the importance of Human Resources (HR) and pay the HR professionals with a big pay packet further making it difficult for the SME’s to cope up with the same salaries. The employees working in the SME’s work in an informal environment and also communicate informally. Hence, the management in an SME organization faces difficulty in maintaining the organizational climate. As the organization grows it becomes more difficult to involve the employees in the decision making process. Day-by-day it becomes more difficult in a growing SME to keep a close partnership with each and every employee. There is lack of clarity on training and rewards amongst the employees. There should be transparent policies on training and compensation and induction procedure for new employees. There should be uniformity in the strategy and the functional organizational structure. HR functions are not well-defined in the SME’s and hence the efforts in building a team are wasted due to high attrition rate. The main reasons for attrition in SME’s are Salary, Unsuitable HR Policies and Practices, Lack of Employee Loyalty, career advancement etc.

VOLUME NO. 2 (2012), ISSUE NO. 12 (DECEMBER) ISSN 2231-1009
INTERNATIONAL JOURNAL OF RESEARCH IN COMPUTER APPLICATION & MANAGEMENT A Monthly Double-Blind Peer Reviewed (Refereed/Juried) Open Access International e-Journal - Included in the International Serial Directories
http://ijrcm.org.in/
108
TALENT MANAGEMENT ISSUES IN SME SECTOR Michael Armstrong characterizes talent management as the “war for talent”. However, he argues that this definition downplays the role of the talent, which is already within the company.
TALENT ATTRACTION There are several issues faced by SME’s to attract talent. It is difficult for the SME’s to attract and retain talent as highly qualified people are reluctant to work in SME’s. The expectations of getting higher perks also refrains them to work in SME. Uncertainty in job also restricts the good talent from joining SME’s and also results in low commitment and low motivation levels. People those who survive in the “cut-throat competition” face higher workload and stress with same or even smaller benefits. Out of these “survivors” it is safe to assume that most would be considered as talent. This raises a problem, during downturn economy. These people are the ones who get a chance to switch over to a job with a better deal (Baublyte (2010). The SME’s do not maintain the database of job seekers and hence the vacancies are passed on to known person only. SME’s also do not hire through recruitment agencies, college placements, etc. Lack of hiring policies is one of the issues faced by SME’s. The detailed job analysis is not performed and this leads to ineffective hiring of personnel. The criteria for recruitment and key success factors for that particular job are not studied and hence lacks in proper recruitment. Employer branding is not done and hence the candidates do not get enough information about the organization and then they show lack of interest in joining the organization. The rewards and recognition policies are not implemented in a proper manner and hence the employee attrition rate is very high.
TALENT ACQUISITION Hiring good talent is a challenge in the SME sector. Following factors contribute towards that challenge:
• Job opportunities: If you do not pay the candidate the desired salary then maybe the candidate will join some other organization that meets his expectations. In this case, the company will be at loss for losing good talent. There is a war of talent in the current market and good talent is hard to find at low cost. Bigger organizations are hunting for good talents and as soon as they get them they are ready to meet the desired salary expectations. Since they are capable to spend more they may increase the salary and would cross the desired expectations of the candidates also. The IT companies are the booming sectors and pay well to the talented candidates as they would like to retain them. They not only pay them high salary but also offer them challenging job profile and exposure at various management levels, corporate culture, good work ambience, career advancement opportunities and higher job responsibilities due to which the employee is willing to give his full efforts and energy and at the same time he feels proud to be a member of that organization.
• Salary expectations: After conducting several rounds of interviews when a suitable candidate is being found out, it is being noticed that his salary expectations are much higher than the budgeted salary. This is happening in most of the small and medium enterprise organizations. After all good talent cannot be hired on a nominal salary. Talent comes at a heavy price. A talented person has high salary expectations. If you are willing to meet his expectations by giving him the desired salary the candidate will join the organization or else, you are prone to lose the chosen candidate.
• Talent shortage: Talent shortage is the key area. This is an area of fundamental importance to the SME sector, and is a key area for human resource management (Vinten, 1996). Talent shortage exists in SME’s in most of the countries. There are many jobs available but the candidates are not willing to apply in SME’s. This scenario is prevailing in different industry sectors. This can be attributed to unemployability. Employer Branding and Work Culture: Employer brand was first used in the early 1990s to denote an organization’s reputation as an employer (Barrow and Mosley, 2005). Since then, it has become widely adopted by the global management community. Minchington (2005) defines employer brand as “the image of your organization as a ‘great place to work’". Employer branding is creating this image. It is very important for an organization to create its branding as this is an important aspect for a job seeker. In the current market candidates would like to work for an organization where they get better pay and flexible work culture. Candidates look for joining an organization with a long-term prospect and hence they are choosy about joining an organization. The work culture should be attractive for the candidate. SME’s have limited resources and hence it is difficult for them to provide attractive work culture as compared to larger corporate.
• Ineffective Recruitments: The suitable talents have to be sought after and they will come at a price. Now a days the candidates do not hang around for jobs and they take time in choosing their employers and will only join the jobs where there are opportunities for career advancement and they have enough job security. SME’s will have to look into their recruiting policies and strategies to attract good talent. Hiring graduates in SME’s is a difficult task, as they tend to do job-hopping and change their jobs frequently either for better salary or for better career prospects.
TALENT ENGAGEMENT – RETENTION AND ATTRITION TRENDS IN SME SECTOR TALENT RETENTION The talent retention strategies lacking in the SME’s are given below:
• Career Advancement opportunities are not highlighted by the organisation.
• The vision and mission of the organization is not communicated to the employees.
• A proper training is not given to the employee in an SME however a special induction training is given to a new employee in larger corporate. An employee is often tired doing the same job in an SME since there is no concept of job rotation and hence the employee loses his interest in working in the same organisation.
• SME’s need to invest more in training and development of the staff.
TALENT MANAGEMENT ISSUES There is a vast similarity between the issues faced in talent management by SME’s and the larger corporates. The SME’s need to attract talent, deploy them, develop and then retain them. SME’s have some constraint in hiring talents:
• Low Turnover: Low turnover has a direct impact on all the departments in SME’s. If a SME has a very low turnover and for example the marketing person leaves the organization then it has direct impact on all the relationships handled by that person such as relationship with the ad agency or relationship with clients etc. Low turnover means low quality employees.
• Lack of skilled employees: Larger corporates hire skilled employees and pay well deserved remunerations however; in SME’s they do not have subject specific employees.
• Lesser Economies of Scale: Bigger corporates do a lot of research in hiring talent. They outsource to professionals and get the psychometric testing done to assure that the best talent is being hired. However, in SME’s companies cannot afford for outsourcing and neither for getting the in-depth assessment of talent as they cannot afford the expensive tools that are used for such kind of testing.
• Effect of each employee that is hired: An SME with 1,000 or less than 1000 representatives will not affect much by good recruitment or bad recruitment. However, if they have only five representatives then each individual is touching 20 per cent of the client base.
ROAD AHEAD Outsourcing: Outsourcing by SME’s has started taking shape in the recent scenario. SME’s have become popular in outsourcing non-core activities. Following are the benefits that can be gained by the SME’s by outsourcing:

VOLUME NO. 2 (2012), ISSUE NO. 12 (DECEMBER) ISSN 2231-1009
INTERNATIONAL JOURNAL OF RESEARCH IN COMPUTER APPLICATION & MANAGEMENT A Monthly Double-Blind Peer Reviewed (Refereed/Juried) Open Access International e-Journal - Included in the International Serial Directories
http://ijrcm.org.in/
109
• Creating Employer Branding
• Reduce Operating Cost
• Improve Focus on various strategic functions
• World-class recruitment/retention strategies
• Improvement in Hiring Quality talent Employer Branding: Employer branding represents a firm's efforts to promote, both within and outside the firm, a clear view of what makes it different and desirable as an employer (Backhaus and Tikoo, 2004). Creating employer branding is one of the strategies in hiring talents. The company needs to create its brand and portray as a company of choice to new talents to attract them. There are many advantages of joining an SME and this has to be propagated amongst the job seekers. Since the employee strength is low the organization is more flexible as compared to larger corporate where implementing changes in the HR Policies and practices takes time.
RESEARCH DESIGN The study was exploratory in nature with survey being used as a method to complete the study.
DATA ANALYSIS AND INTERPRETATION A survey was conducted among professionals of different hierarchical levels working in different small-scale industry sectors and different types of organization. Convenience sampling was followed for the selection of sample. The first part of the questionnaire consisted of demographic details such as type of organization, Industry Sector, Hierarchical level of the employee, Current functional area of the employee, Educational Qualification and Salary of the employee. The second part of the questionnaire was based on talent acquisition. The data collected was analyzed using statistical software SPSS. Various statistical tools were also used for analysis. The demographical details showed the following: The target population consisted of 62% employees from the manufacturing industry and 38% from Service industry. There were 21% employees from Engineering sector, 16% from IT sector, 11% each from Auto and Auto ancillary sector and 5 % each were from various other sectors such as power, finance, logistics, medicine, pharmaceutical and banking. The survey consisted of 45% of male respondents and 55% female respondents. The hierarchical levels of the respondents were 43% from junior management level, 38% from middle management and 19% from top management. The respondents were from organizations consisting of 23% organizations having employee strength of >500, 36% organizations having employee strength of <100 and 41% organizations having employee strength of <100 and >500. The importance of an HR Department is not been recognized by the SME sector and hence 95% of the respondents confirmed the non-existence of an HR Department in their organizations. We also studied the various ways that the organizations follow to acquire new talents. The various ways for recruiting employees are as mentioned below:
• Campus recruiting
• Advertisements in newspapers
• Through Head hunting agencies
• Internal Referrals
• External Referrals
• Organization’s Web portal In today’s scenario it was found that 59% of the organizations hire through internal referrals. Since the employee working in the organization is aware of the skills required for a particular profile the candidate referred by him will belong to the best-fit category for the profile and thus the chances of selection is high. This helps the organization cutting their cost for talent hunting. The costs associated with hiring highly trained HR professionals on a full-time basis are likely to be prohibitive for many smaller organizations. The process of conducting the selection of a candidate comprises of methods such as:
• Single Personal Interview
• Multiple Personal Interview
• Panel Interview
• Written test
• Personality tests
• Assessment Center The above process is followed to reduce the rate of attrition. In this study we found that multiple personal interviews are conducted by 81% of the organizations to acquire new talents. Followed on by written test conducted by 38% organization and 19% organizations conducted single personal interviews. The strategy adapted for negotiating compensation and benefits for employees were strictly adhering to the ongoing market rate rather than the educational qualification, work experience or criticality of role offered to the candidate. It was also seen that SME’s could attract new talent even though the perks were not so good but still since the candidates thought that they could gain faster career growth as compared to larger organizations they prefer joining SME’s. Even though high performance organizations are emphasizing more value on their ‘recruitment and selection’ processes, majority of the small and medium enterprises (SME) attach low criticality in developing a strategic knowledge based talent acquisition process (Haas, 2008; Hubbard, 2007; and HR Practices Survey Bangladesh 2007).
STEPS TO BE UNDERTAKEN FOR ATTRACTING TALENT The main focus should be on strengths such as regional strength, growth in career and innovativeness.
• We need to calculate the effectiveness for hiring such as the cost involved, time taken to recruit, mode of hiring and the work experience of the candidate to improve the recruiting process in SME’s.
• Personalized and flexible reward structure and benefits have to be designed to cater the needs of an individual while attracting new talent in SME’s.
• Provide good opportunity for career advancement in SME’s.
• Give a regional working environment so that it attracts young generation to join SME. RETAINING TALENT
• Motivating staff and engaging them in their work, which leads to better work quality and helps in retention.
• HR can give flexible and personalized attention to the employees and bring in HR policies that will be beneficial to the employee in terms of career growth and opportunities for better rewards.

VOLUME NO. 2 (2012), ISSUE NO. 12 (DECEMBER) ISSN 2231-1009
INTERNATIONAL JOURNAL OF RESEARCH IN COMPUTER APPLICATION & MANAGEMENT A Monthly Double-Blind Peer Reviewed (Refereed/Juried) Open Access International e-Journal - Included in the International Serial Directories
http://ijrcm.org.in/
110
• The SME’s need to invest in Training and Development for their staff to retain them, which will lead to their personal growth and also improve their performance.
• HR should communicate the vision and mission to the employees so that the employees work towards achieving the goals.
• Once the HR policies, retention strategies and career advancement opportunities are implemented by the HR in smaller and medium enterprise word of mouth spreads and the company is promoted as a choice employer attracting new talents and retaining them thereafter. This will leave the employees with high satisfaction levels and enhances employer branding.
LIMITATIONS This study has been conducted with a smaller sample and if conducted with a larger sample the results may vary. This study can be also conducted taking into consideration different countries.
RECOMMENDATION AND CONCLUSION • Most of these SME’s are run by technocrats and operate from lip tight financial budgets. Hence they really do not have the luxury to afford full time HR
professionals. And it is here the consulting fraternity can certainly add value.
• Some of the SME’s can tap into innovative ways of hiring o Retired professionals who want to have a more relaxed number of hours. Imagine the wealth of experience-even at say 20hrs a week. o Temporary or small term projects to design and implement special initiatives-utilizing some flextime employees. o Working closely with MBA/Engineering colleges and get interns to handle short-term projects. From the literature survey we found that there’s a lot for our Indian SME’s to learn from SME’s in US. When the whole world is reeling in the economic downturn, SME’s can be said to be one of the biggest gainers. It is because some of SME’s, who have tapped the opportunity of engaging 'interim' managers '. i.e. a manager downsized' from ironically large corporate. Even as they were looking for new employment opportunities, which aren't easy to come by considering the current economic trend, SME’s can continue to utilize their experience for value addition for their own firm.
REFERENCES 1. Armstrong, M. (2006) “A Handbook of Human Resource Management Practice”, “Chapter 26 - Talent Management”, London: Kogan Page Limited: pp.389-
408. 2. Backhaus, Kristin and Tikoo, Surinder (2004), "Conceptualizing and researching employer branding", Career Development International, Vol. 9, No. 5, pp.
501 – 517. 3. Barrow, S. and Mosley, R. (2005), The Employer Brand, Bringing the Best of Brand Management to People at Work, John Wiley & Sons, Chichester (ISBN:
978-0-470-01273-4). 4. Baublyte, Daiva (2010) “TALENT MANAGEMENT: Myth or Reality in Today’s SMEs?” Research Project in International Business and Management Studies,
Hogeschool In Holland, School of Economics, Amsterdam/Diemen, The Netherlands, and European Business Administration studies, Metropolia University of Applied Sciences, Vantaa, Finland.
5. Bhatt, Puja and Reddy, Chinnam (2011), “Exploring HRM practices in SME’s”, International Journal of Research in Commerce, Economics and Management, Vol. 1, No. 5, September.
6. Cameron, L. and Miller, P. (2008), “Improving HRM practice in SMEs: how to apply relationship marketing concepts”, Australasian Journal of Business and
Social Inquiry, vol. 6, no. 3, pp. 1-22. 7. Crompton, R. L., Morrissey, W.J. & Nankervis, A.R. 2002, Effective Recruitment & Selection Practices. Sydney, CCH Australia Limited. 8. Dangayach, G.S. and Deshmukh, S.G. (2005), "Advanced manufacturing technology implementation: Evidence from Indian small and medium enterprises
(SME’s)", Journal of Manufacturing Technology Management, Vol. 16, No. 5, pp. 483 – 496. 9. Darwin, Charles (1859), Origin of Species, John Murray, Albemarle Street, London. 10. Edwards, M. R. (2010), An integrative review of employer branding and OB theory, Personnel Review Vol.39, No.1, pp.5-23 11. Haas, M. (2008), “Know Better”, HR Monthly, Vol. 2, pp. 40-43. 12. HR Practices Survey Bangladesh 2006-2007, (2007), Human Capital Ernst & Young Private Limited India and Metropolitan Chamber of Commerce and
Industry, Bangladesh. 13. http://www.smechamberofindia.com/PDF/SME_brochure.pdf 14. http://www.smeworld.org/story/top-stories/number-of-smes-in-india.php. 15. Hubbard, G., (2007), “Wheel of Fortune”, HR Monthly, Vol. 7, pp. 30-32. 16. Kharbanda, V. K. (2001), “Facilitating innovation in Indian small and medium enterprises – The role of clusters”, Current Science, Vol. 80 No. 3. 17. Klaas, Brian S., Mcclendon, John and Gainey, Thomas W. (2000), “Managing HR in the Small and Medium Enterprise: The Impact of Professional Employer
Organizations”, Entrepreneurship: Theory and Practice, Vol. 25. 18. Martin, G. (2009), Employer Branding and corporate reputation management, The Peak Performing Organization, Chapter 13, pp 252, Routledge, London. 19. Minchington, B (2010), Employer Brand Leadership – A Global Perspective, Collective Learning Australia. 20. Minchington, B. (2010), Employer Brand Leadership – A Global Perspective, Collective Learning Australia. 21. Overcome HR Challenges, http://www.financialexpress.com/news/overcome-hr-challenges/115204/1 22. Raju, Dr. K. D. (2008),“Small and Medium Enterprises (SME’s) in India: Past, Present and Future” (January). PHDCCI Working Paper. Available at SSRN:
http://ssrn.com/abstract=1080505 / http://dx.doi.org/10.2139/ssrn.1080505 23. Vinten, G. (1996), “Spotlight on small firms”, Internal Auditing, July, Vol. 24, pp.24-24. 24. Vinten, Gerald (1998), “Skills shortage and recruitment in the SME sector”, Career Development International, Vol. 3, No. 6, pp.238 – 242.

VOLUME NO. 2 (2012), ISSUE NO. 12 (DECEMBER) ISSN 2231-1009
INTERNATIONAL JOURNAL OF RESEARCH IN COMPUTER APPLICATION & MANAGEMENT A Monthly Double-Blind Peer Reviewed (Refereed/Juried) Open Access International e-Journal - Included in the International Serial Directories
http://ijrcm.org.in/
111
MONITORING SYSTEM FOR TERRORISTS AND DANGEROUS PRISONERS
DR. PRAMOD BUBNA
ASST. REGISTRAR
DEPARTMENT OF MANAGEMENT
BIRLA INSTITUTE OF TECHNOLOGY
JAIPUR
ABSTRACT
To day security, safety and monitoring of terrorist and prisoners in jails and in the way of court is very big problem for police and administration across the world.
Using Radio Frequency Identification (RFID) technology minimises this problem. RFID is a technology that enables the electronic and wireless labeling and
identification of object, human as well as animals. RFID, which means it doesn't provide much value on its own, but it enables organizations to develop
applications that create value. The first disturbing fact is that RFID is not a new technology. It was first used over sixty years ago by Britain to identify aircraft in
World War II and was part of the refinement of radar. It was during the 1960s that RFID was first considered as a solution for the commercial world. The first
commercial applications involving RFID followed during the 70s and 80s. These commercial applications were concerned with identifying some asset inside a
single location. They were based on proprietary infrastructures. The Internet is another enabling technology, and just as the Internet enables companies to
communicate, collaborate, educate, sell, entertain and distribute products, RFID enables organizations to do develop secure tracing , watching and monitoring
prisoners in jails and many different things This paper focus on the ways RFID is being used by organizations today to create value and at some of the ways it
might be applied in the future.
KEYWORDS Monitoring, Safety, Searching, Security, Tracing.
INTRODUCTION FID is evolving as a major technology enabler for identifying and tracking goods and assets around the world. It can help hospitals locate expensive equipment more quickly to improve patient care, pharmaceutical companies to reduce counterfeiting, and logistics providers to improve the management of moveable assets. It also promises to enable new efficiencies in the supply chain by tracking goods from the point of manufacture
through to the retail point of sale (POS). RFID is the reading of physical tags on single products, cases, pallets, or re-usable containers that emit radio signals to be picked up by reader devices. These devices and software must be supported by a sophisticated software architecture that enables the collection and distribution of location-based information in near real time. The complete RFID picture combines the technology of the tags and readers with access to global standardized databases, ensuring real time access to up-to-date information about relevant products at any point in the supply chain
ELEMENTS OF THE SYSTEM INFORMATION TECHNOLOGY The information technology is revolutionizing the way, in which we live and work. It is changing all aspects of our life and lifestyle. The digital revolution has given mankind the ability to treat information with mathematical precisions, to transmit it at very high accuracy and to manipulate it at will. These capabilities are bringing into being a whole world within and around the physical worlds. The amount of calculation of computerized information and its length is no limit now. Computer and fast communication are becoming integral parts of our lives. So computer system with communication technology is the main element of this proposed system. RFID Tags can be either passive, active or battery assisted passive. An active tag has an on-board battery that periodically transmits its ID signal. A battery assisted passive (BAP) has a small battery on board that is activated when in the presence of a RFID reader. A passive tag is cheaper and smaller because it has no battery. Instead, the tag uses the radio energy transmitted by the reader as its energy source. The interrogator must be close for RF field to be strong enough to transfer sufficient power to the tag. Since tags have individual serial numbers, the RFID system design can discriminate several tags that might be within the range of the RFID reader and read them simultaneously. Tags may either be read-only, having a factory-assigned serial number that is used as a key into a database, or may be read/write, where the system user can write object-specific data into the tag. Field programmable tags may be write-once, read-multiple; the user may write “blank” tags with an electronic product code. Logistics and transportation are major areas of implementation for RFID technology. Yard management, shipping and freight and distribution centers use RFID tracking technology. In the railroad industry, RFID tags mounted on locomotives and rolling stock identify the owner, identification number and type of equipment and its characteristics. This can be used with a database to identify the lading, origin, destination, etc. of the commodities being carried.In commercial aviation, RFID technology is being incorporated to support maintenance on commercial aircraft. RFID tags are used to identify baggage and cargo at several airports and airlines. Some countries are using RFID technology for vehicle registration and enforcement. RFID can help detect and retrieve stolen cars.
ANTENNA RFID READER ANTENNA The RFID reader antenna transmits a wave that has both electrical and magnetic properties and is known as an electromagnetic wave. There are 3 different types of RFID antennas: Linear Polarization (dipole antennas) - the electromagnetic wave propagates entirely in one plane (Vertical or Horizontal) in the direction of the signal propagation. This is the best wave propagation when the tag orientation is known and fixed. The RFID antenna and RFID tag should be matched in polarization to obtain the best read rates. Circular Polarization the electromagnetic wave propagates in two planes creating a circular effect (like a corkscrew) making one complete revolution in a single wavelength timeframe. Since the RFID antenna continuously emits a wavelength the rotational field will eventually cover any tag that is in its path. This is best to use when tag orientation is unknown, but you lose at least 3dB when compared to a linear polarized antenna. Circular polarization can be right or left handed hence the RHCP and LHCP options for circular polarized antenna. Monostatic Circular or Bistatic Circular (2 Right Hand, 2 Left Hand or Right Hand + Left Hand)
• Monostatic is the most common RFID antenna and uses a single common port to transmit and receive signals
• Bistatic uses 2 RFID antennas in the same physical housing and uses one port to transmit and the other port to receive
FREQUENCY BANDS Frequency Range Application
100-500 KHZ Short range, law reading speed Animal, Human identification
10-15 MHZ Medium range, average reading speed Access control, Smart cards
850-950 MHZ Long range, very high reading speed Rail, Road, Car Monitoring , Toll Collection
R
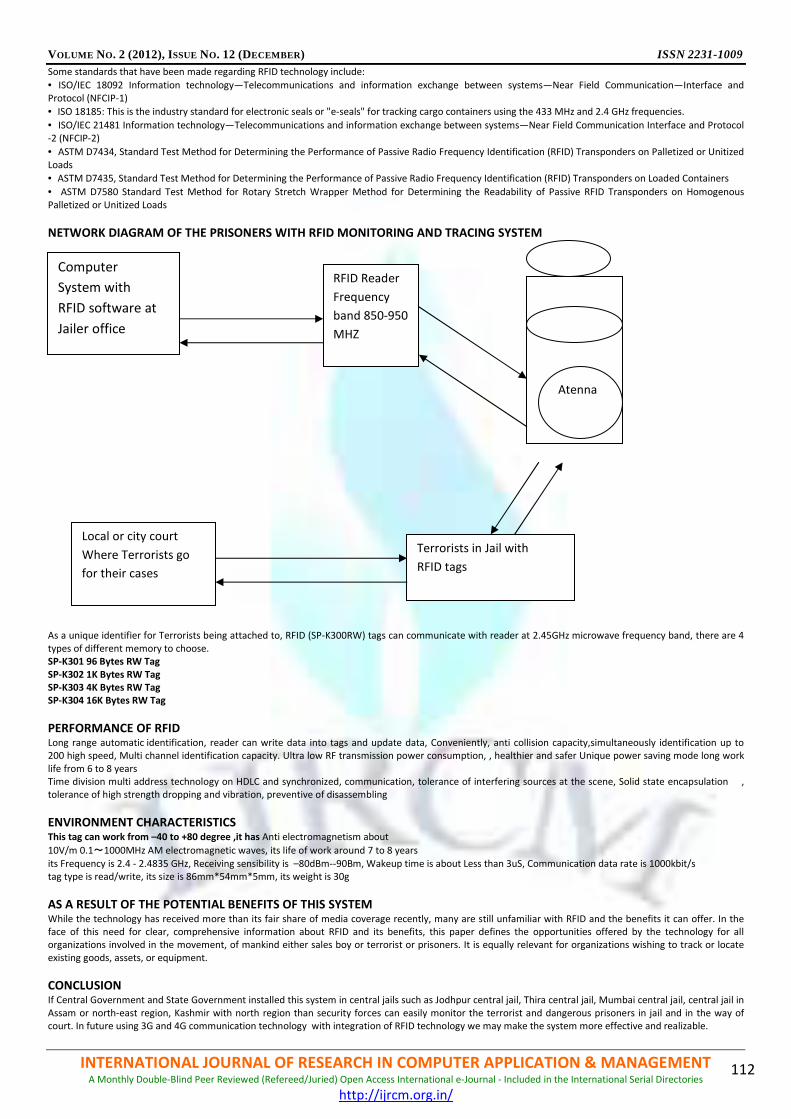
VOLUME NO. 2 (2012), ISSUE NO. 12 (DECEMBER) ISSN 2231-1009
INTERNATIONAL JOURNAL OF RESEARCH IN COMPUTER APPLICATION & MANAGEMENT A Monthly Double-Blind Peer Reviewed (Refereed/Juried) Open Access International e-Journal - Included in the International Serial Directories
http://ijrcm.org.in/
112
Some standards that have been made regarding RFID technology include:
• ISO/IEC 18092 Information technology—Telecommunications and information exchange between systems—Near Field Communication—Interface and Protocol (NFCIP-1)
• ISO 18185: This is the industry standard for electronic seals or "e-seals" for tracking cargo containers using the 433 MHz and 2.4 GHz frequencies.
• ISO/IEC 21481 Information technology—Telecommunications and information exchange between systems—Near Field Communication Interface and Protocol -2 (NFCIP-2)
• ASTM D7434, Standard Test Method for Determining the Performance of Passive Radio Frequency Identification (RFID) Transponders on Palletized or Unitized Loads
• ASTM D7435, Standard Test Method for Determining the Performance of Passive Radio Frequency Identification (RFID) Transponders on Loaded Containers
• ASTM D7580 Standard Test Method for Rotary Stretch Wrapper Method for Determining the Readability of Passive RFID Transponders on Homogenous Palletized or Unitized Loads
NETWORK DIAGRAM OF THE PRISONERS WITH RFID MONITORING AND TRACING SYSTEM
As a unique identifier for Terrorists being attached to, RFID (SP-K300RW) tags can communicate with reader at 2.45GHz microwave frequency band, there are 4 types of different memory to choose. SP-K301 96 Bytes RW Tag SP-K302 1K Bytes RW Tag SP-K303 4K Bytes RW Tag SP-K304 16K Bytes RW Tag
PERFORMANCE OF RFID Long range automatic identification, reader can write data into tags and update data, Conveniently, anti collision capacity,simultaneously identification up to 200 high speed, Multi channel identification capacity. Ultra low RF transmission power consumption, , healthier and safer Unique power saving mode long work life from 6 to 8 years Time division multi address technology on HDLC and synchronized, communication, tolerance of interfering sources at the scene, Solid state encapsulation , tolerance of high strength dropping and vibration, preventive of disassembling
ENVIRONMENT CHARACTERISTICS This tag can work from –40 to +80 degree ,it has Anti electromagnetism about
10V/m 0.1~1000MHz AM electromagnetic waves, its life of work around 7 to 8 years its Frequency is 2.4 - 2.4835 GHz, Receiving sensibility is –80dBm--90Bm, Wakeup time is about Less than 3uS, Communication data rate is 1000kbit/s tag type is read/write, its size is 86mm*54mm*5mm, its weight is 30g
AS A RESULT OF THE POTENTIAL BENEFITS OF THIS SYSTEM While the technology has received more than its fair share of media coverage recently, many are still unfamiliar with RFID and the benefits it can offer. In the face of this need for clear, comprehensive information about RFID and its benefits, this paper defines the opportunities offered by the technology for all organizations involved in the movement, of mankind either sales boy or terrorist or prisoners. It is equally relevant for organizations wishing to track or locate existing goods, assets, or equipment.
CONCLUSION If Central Government and State Government installed this system in central jails such as Jodhpur central jail, Thira central jail, Mumbai central jail, central jail in Assam or north-east region, Kashmir with north region than security forces can easily monitor the terrorist and dangerous prisoners in jail and in the way of court. In future using 3G and 4G communication technology with integration of RFID technology we may make the system more effective and realizable.
Computer
System with
RFID software at
Jailer office
RFID Reader
Frequency
band 850-950
MHZ
Atenna
Terrorists in Jail with
RFID tags
Local or city court
Where Terrorists go
for their cases

VOLUME NO. 2 (2012), ISSUE NO. 12 (DECEMBER) ISSN 2231-1009
INTERNATIONAL JOURNAL OF RESEARCH IN COMPUTER APPLICATION & MANAGEMENT A Monthly Double-Blind Peer Reviewed (Refereed/Juried) Open Access International e-Journal - Included in the International Serial Directories
http://ijrcm.org.in/
113
REFERENCES 1. Alexis Leon, mathews leon, Fundamentals of Information Technology,Vikash Publication, New Delhi Page 1-3 2. Bill Glover, Himanshu Bhatt ,RFID essentials , O'Reilly Media, Inc., 2006 ISBN 0-596-00944-5, pages 88-89 3. Daniel M. Dobkin, The RF in RFID: Passive UHF RFID In Practice, Newnes 2008 ISBN 978-0-7506-8209-1, chapter 8 4. Hacking Exposed Linux: Linux Security Secrets & Solutions (third ed.). McGraw-Hill Osborne Media. 2008. p. 298. ISBN 978-0-07-226257-5.
http://books.google.com/?id=f5Vz08spzw8C&printsec=frontcover. 5. Introduction to RFID, disc 4397-section 12977 6. John R. Vacca Computer and information security handbook, Morgan Kaufmann, 2009 ISBN 0-12-374354-0, page 208 7. Martein Meints (2007), D3.7 A Structured Collection on Information and Literature on Technological and Usability Aspects of Radio Frequency
Identification (RFID), FIDIS deliverable 3(7), June 2007. 8. Paolo Magrassi (2001). "A World Of Smart Objects: The Role Of Auto Identification Technologies". http://www.gartner.com. Retrieved 2007-06-24. 9. Pete Harrison (2009-07-28). "EU considers overhauling rules for lost air luggage". Reuters. http://www.reuters.com/article/rbssIndustryMaterials
UtilitiesNe ws/idUSLS636313 20090728. Retrieved 2009-09-09. 10. RFID : An introduction simon holloway 11. RFID handbook 12. Sen, Dipankar; Sen, Prosenjit; Das, Anand M. (2009), RFID For Energy and Utility Industries, PennWell, ISBN 978-1-59370-105-5, pp. 1-48 13. The RFID technology and its current application: Elisabeth ILIE-ZUDOR Zsolt kemeny, Peter Egri, Laszio Monostori 14. www.computerworld.com 15. www.rfidjournal.com 16. www.rfidusa.com 17. www.uh.edugartner

VOLUME NO. 2 (2012), ISSUE NO. 12 (DECEMBER) ISSN 2231-1009
INTERNATIONAL JOURNAL OF RESEARCH IN COMPUTER APPLICATION & MANAGEMENT A Monthly Double-Blind Peer Reviewed (Refereed/Juried) Open Access International e-Journal - Included in the International Serial Directories
http://ijrcm.org.in/
114
TRENDS OF FOREIGN DIRECT INVESTMENT IN INDIA
DR. KARAMVIR SINGH SHEOKAND
ASST. PROFESSOR
IMSAR
M. D. UNIVERISTY
ROHTAK
PRIYANKA
ASST. PROFESSOR
DEPARTMENT OF BUSINESS ADMINISTRATION
HINDU COLLEGE
SONEPAT
RAJESH BHARDWAJ
ASST. PROFESSOR
DEPARTMENT OF COMMERCE
GOVERNMENT COLLEGE
GHARAUNDA
ABSTRACT Foreign direct investment (FDI) policies play a major role in the economic growth of developing countries around the world. Attracting FDI inflows with the
conductive policies has therefore become a key battleground in the emerging markets. And this has led to competition among the states in formulation flexible
policies and providing incentives to woo private investors. In the light of the above the paper highlights the trends of FDI in India after the economic reforms,
Sector wise and Country wise share of FDI. Various factors which play a significant role in attracting FDI into particular state are also examined. The study is
descriptive cum analytical in nature. The data was collected from the website of industrial Policy & Promotion and planning commission. In the current financial
year (April2011 to Jan 2012) Mauritius, Singapore, Japan USA and UK are the top five investors in India. The paper found that Service Sector is one of the most
attractive sector for FDI inflow. Some of the states in India which have witnessed a massive upsurge in FDI (April 2011 to Jan 2012) inflows include Maharashtra,
Delhi, Karnataka, and Tamil Nadu. Other states which are in the receipt of FDI inflows in India include Gujarat, Andhra Pradesh, West Bengal, Haryana, Kerala
and Uttar Pradesh. (With reference to the website of Business Maps of India) States like Jharkhand and Bihar have not attracted enough FDI when compared with
other states.
KEYWORDS finance, FDI.
INTRODUCTION oday, in the era of globalization and liberalization, FDI is looked upon by the countries (both developed and developing) as an engine for raising the economic growth and development. As per the available studies and researches FDI envelops with it many advantages. They are:
• New capital inflow and technology
• Increased competitiveness
• Transfer of knowledge and skills
• Increase in overall productivity
• Managerial efficiency
• Creates more employment opportunities All these are very useful tools for an all around development and future of any country. India has emerged as a major recipient of FDI in South Asia after China. Though we cannot compare the FDI inflow in China to that of India, as China is much ahead of us and we have to still burn midnight oil to get maximum FDI in our country. No doubt, the pace with which Indian economy is moving, it will sooner transform from a developing country to a developed country. And this road to transformation will need huge amount of resources (both financial and managerial). Under this transformation process, Foreign Direct Investment remains the most convenient and effective option for financial resources in India. According to the Planning Commission, FDI is “usually preferred over other forms of external finance because they are non-debt creating, non-volatile and their returns depend on the performance of the projects financed by the investors. FDI also facilitates international trade and transfer of knowledge, skills and technology.” It is the duty of the government of a country to formulate, implement and administer the FDI policies. To a large extent the size and amount of FDI inflows in any country depends upon its macroeconomic policies. India is a resourceful country where there is an adequate market for both capital and consumer goods. The availability of large amount of natural resources in the country as well as excellent market surroundings and highly trained and experienced resources, provide a better platform for investments. India is projected to become the second most attractive destination for FDI in 2010-12, as per UNCTAD’s World Investment Report, 2010. The FDI had become important in India in the backdrop of the adoption of the economic reforms initiated in 1991. It was only after the reforms of 1991 wherein the liberalization process was also introduced by the then Prime Minister Mr. Narsimha Rao that India started getting foreign inflow of funds. This was followed by liberalization of the FDI policies also.
OBJECTIVES OF STUDY 1. To analyze the growth of Indian states in context of FDI inflow. 2. To study the factors contributing to the flow of FDI in a particular state
T

VOLUME NO. 2 (2012), ISSUE NO. 12 (DECEMBER) ISSN 2231-1009
INTERNATIONAL JOURNAL OF RESEARCH IN COMPUTER APPLICATION & MANAGEMENT A Monthly Double-Blind Peer Reviewed (Refereed/Juried) Open Access International e-Journal - Included in the International Serial Directories
http://ijrcm.org.in/
115
RESEARCH METHODOLOGY Various descriptive and analytical tools have been used in the research paper. Secondary data from the website of Industrial Policy & Promotion and Planning commission have been used for the analysis. (www.dipp.nic.in)
FDI EQUITY INFLOWS (MONTH-WISE) DURING THE FINANCIAL YEAR 2011-120
TABLE NO. 1
Financial Year 2011-12 (April- March) Amount of FDI (In US$ mn)
April 2011 3,121
May 2011 4,664
June 2011 5,656
July 2011 1,099
August 2011 2,830
September 2011 1,766
October 2011 1,161
November 2011 2,538
December 2011 1,353
January 2012 2,004
2011-12(up to January 2012)# 26,192
2010-11(up to January 2011) 17,081
%age growth over last year (+) 53%
Source: www.dipp.nic.in The FDI inflow of each month in the financial year 2011-12(April-Jan2012) in India and its growth rate are depicted in table1. It is very much evident from the table that the inflow of FDI has not remained consistent. In the financial year 2011-12 (up to January 2012), the total amount of FDI is US$ 26,192 and percentage growth over last year is 53%.
SECTORS ATTRACTING HIGHEST FDI EQUITY INFLOWS It is clear from the table no. 2 that service sector tops the list by having the FDI inflow US$ 31,971 (from April 2000 to Jan 2012). On the second position is telecommunications with total FDI inflow of US$ 12,547 (from April 2000 to Jan 2012). On the third position is computer software and hardware with total FDI inflow of US$ 11,107(from April 2000 to Jan 2012). After these top ten sectors further table shows that defence industries, coir and mathematical, surveying and drawing instruments etc. are of not very much interest to the investors and showed no growth rate. We can conclude that service sector is found to be the most beneficent sector and at the same time one of the attractive sectors for FDI inflow.
TABLE NO. 2: STATEMENT ON SECTOR WISE FDI INFLOWS (FROM APRIL 2000 TO JANUARY 2012) Amount in Rs. Crores (US$ in millions)
Rank Sector 2009-10(April-March)
2010-11(April-March)
2011-12(April-Jan)
Cumulative inflows (April’00-Jan’12)
%age to total inflows(in terms of US$)
1 Service Sector (financial & non-financial)
19,945 (4,176)
15,053 (3,296)
22,771 (4,836)
143,878 (31,971)
20%
2 Telecommunication
12,270 (2,539)
7,542 (1,665)
8,984 (1,992)
57,050 (12,547)
8%
3 Computer Software &Hardware
4,127 (872)
3,551 (780)
3,312 (698)
49,626 (11,107)
7%
4 Housing & Real Estate 14,027 (2,935)
5,600 (1,227)
2,750 (591)
49,025 (10,973)
7%
5 Construction Activities 13,469 (2,852)
4,979 (1,103)
10,859 (2,230)
49,440 (10,867)
7%
6 Drug & Pharmaceuticals 1,006 (213)
961 (209)
14,482 (3,208)
42,745 (9,170)
6%
7 Power
6,138 (1,272)
5,796 (1,272)
7,262 (1,569)
32,798 (7,215)
5%
8 Automobile Industry
5,893 (1,236)
5,864 (1,299)
2,916 (635)
29,354 (6,470)
4%
9 Metallurgical Industries 1,999 (420)
5,023 (1,098)
7,700 (1,655)
26,287 (5,909)
4%
10 Petroleum & Natural Gas 1,297 (266)
2,543 (556)
951 (202)
14,612 (3,339)
2%
Source:-www.dipp.nic.in
COUNTRY-WISE SHARE OF FDI IN INDIA An analysis of the origin of FDI inflows into India reveals that the new policy measure introduced broadened their sources. There were more than 100 countries which contributed to FDI inflow. The number of countries investing in India had increased since the liberalization of the Indian economy, a major share of the FDI inflow came from only a few countries (www.rbi.org.in). From table 3, it is very clear that Mauritius remains the highest investor in India with a total FDI inflow of US$ 63,146 (April ’00-Jan ’12), while the Singapore and the Japan are on the second and third position respectively with a total investment of US$ 16,203 and US$ 12,095 (April ’00-Jan ’12). On the other hand, investment from U.A.E, France, Italy and China remain very low. The fact due to which Mauritius is the highest investor in India is that the Double Taxation Avoidance Agreement (DTAA). Under this agreement the investors from Mauritius are protected from taxation in India. In reality, Americans are the biggest investors in our IT sector because most investor from Mauritius are Americans. Japan’s major investment is in the automobile sector. Thus it can be concluded that Mauritius, the Singapore, the Japan, the USA and the UK are the top five investor in India.

VOLUME NO. 2 (2012), ISSUE NO. 12 (DECEMBER) ISSN 2231-1009
INTERNATIONAL JOURNAL OF RESEARCH IN COMPUTER APPLICATION & MANAGEMENT A Monthly Double-Blind Peer Reviewed (Refereed/Juried) Open Access International e-Journal - Included in the International Serial Directories
http://ijrcm.org.in/
116
TABLE 3: STATEMENT OF COUNTRY-WISE FDI INFLOWS (FROM APRIL 2000 TO JANUARY 2012) Amount Rupees in crores (US$ in millions)
Rank Country 2009-10 (April- March)
2010-11 (April- March)
2011-12 (April- March)
Cumulative Inflows (April ’00- Jan. ’12)
%age to total inflows (in terms of US$)
1 Mauritius 49,633 (10,376)
31,855 (6,987)
41,621 (8,919)
284,381 (63,146)
39%
2 Singapore 11,295 (2,379)
7,730 (1,705)
20,020 (4,307)
72,896 (16,203)
10%
3 Japan 5,670 (1,183)
7,063 (1,562)
13,007 (2,754)
56,769 (12,095)
8%
4 U.S.A 9,230 (1,943)
5,353 (1,170)
4,338 (913)
46,880 (10,362)
6%
5 U.K 3,094 (657)
3,434 (755)
12,484 (2,750)
41,916 (9,389)
6%
6 Netherlands 4,283 (899)
5,501 (1,213)
5,487 (1,167)
31,114 (6,867)
4%
7 Cyprus 7,728 (1,627)
4,171 (913)
6,378 (1,318)
28,326 (6,130)
4%
8 Germany 2,980 (626)
908 (200)
6,672 (1,465)
20,048 (4,464)
3%
9 France 1,437 (303)
3,349 (734)
2,180 (475)
12,447 (2,739)
2%
10 U.A.E 3,017 (629)
1,569 (341)
1,614 (330)
10,206 (2,220)
1%
Total FDI inflows 123,120 (25,834)
88,520 (19,427)
122,307 (26,192)
723,367 (160,094)
-
Source:-www.dipp.nic.in
DETERMINANTS OF FDI INFLOW INTO THE STATE OF INDIA Looking at the inflow of FDI, we can observe a wide variation across the Indian states. Though, some of the Foreign Direct Investment is in strict adherence to geographical locations due to the availability of natural resources or the closeness to the market area; it is the states with metropolitan cities which are the major hub of Foreign Direct Investment in India. For example the state of Maharashtra has an advantage of two metropolitan cities i.e. Mumbai and Pune, if we go down in the south of India, the states of Andhra Pradesh, Karnataka and Tamil Nadu all have metro cities- Hyderabad, Banglore and Chennai. If we compare the same with Gujarat it has a disadvantage of not having any metropolitan city. Due to this reason it attracts less FDI compared to the above states. Other reason can be a weak physical infrastructure. Through the introduction of reforms and improvement in infrastructure facilities many states in India have been successful in getting FDI’s. They are Gujarat, Maharashtra, Andhra Pradesh, Karnataka, Orissa, Madhya Pradesh, Punjab, Rajasthan and West Bengal. Still, states like Jharkhand and Bihar have not attracted enough FDI when compared with other states. The perception of governance in these states is a major hindrance in the way of attracting FDI. In a way these states are a mix and match of weak and careless governance which makes the investors not very enthusiastic in going forward with their investment in these states. As per the available studies and researches there are many factors which determine the FDI inflow into a particular state. They are:
• Quality and adequate availability of infrastructure services
• Availability of skilled and cheap labor,
• Continuous and uninterrupted supply of power,
• Proportion of subsidies given by the government.

VOLUME NO. 2 (2012), ISSUE NO. 12 (DECEMBER) ISSN 2231-1009
INTERNATIONAL JOURNAL OF RESEARCH IN COMPUTER APPLICATION & MANAGEMENT A Monthly Double-Blind Peer Reviewed (Refereed/Juried) Open Access International e-Journal - Included in the International Serial Directories
http://ijrcm.org.in/
117
TABLE NO. 4: STATEMENT ON RBI’S REGIONAL OFFICES (WITH STATE COVERED) RECEIVED FDI EQUITY INFLOW1 (FROM APRIL 2000 TO JANUARY 2012)
S. No.
RBI’s Regional Office2
State covered 2011-12 (April- Jan.)
Cumulative inflows (April ’00- Jan. ’12)
%age to total inflows (in terms of US$
1 Mumbai Maharashtra, Dadra & Nagar Haveli, Daman & Diu 39,758 (8,564)
241,228 (53,632)
34
2 New Delhi Delhi, Part of UP and Haryana 33,089 (7,114)
146,778 (32,202)
20
3 Bangalore Karnataka 5,776 (1,240)
42,434 (9,468)
6
4. Chennai Tamil Nadu, Pondicherry 5,754 (1,231)
36,602 (8,082)
5
5. Ahmadabad Gujarat 4,234 (902)
35,927 (8,058)
5
6 Hyderabad Andhra Pradesh 3,697 (779)
30,259 (6,740)
4
7 Kolkata West Bengal, Sikkim, Andaman & Nicobar islands 1,732 (377)
8,100 (1,864)
1
8 Chandigarh Chandigarh, Punjab, Haryana, Himachal Pradesh 203 (44)
4,888 (1,068)
1
9 Bhopal Madhya Pradesh, Chhattisgarh 527 (114)
3537 (768)
1
10 Panaji Goa 123 (26)
3,449 (751)
1
11 Kochi Kerala, Lakshadweep 1,731 (363)
3,389 (730)
1
12 Jaipur Rajasthan 111 (23)
2,561 (544)
0.3
13 Kanpur Uttar Pradesh, Uttaranchal 602 (133)
1,414 (310)
0.2
14 Bhubaneswar Orissa 122 (27)
1,329 (288)
0.2
15 Guwahati Assam, Arunachal Pradesh, Manipur, Meghalaya, Mizoram, Nagaland, Tripura
5 (1)
321 (73)
0.1
16 Patna Bihar, Jharkhand 58 (11)
85 (17)
0
17 Region not indicated3 24,786 (5,241)
160,533 (35,376)
20
Sub-total 122,307 (26,192)
722,834 (159,973)
100
18 RBI’s-NRI scheme 0 533 (121)
-
Grand Total 122,307 (26,192)
723,367 (160,094)
-
1 includes equity capital components only.
2 The region wise FDI inflows are classified as per RBI’s- Regional office received FDI inflows, furnished by RBI, Mumbai. 3 Represents, FDI inflow through acquisition of existing shares by transfer from residents to non-residents. For this, RBI Regional wise information is not provided by RBI.
Source: www.dipp.nic.in From the available data (Table 4) it appears that most of the FDI in India has gone to the richer states and a meager or nothing is left for the poorer states. But the scenario is changing for better and FDI is making its footing in every state of India as more and more initiatives are being taken by the respective state governments to attract maximum FDI. Let us now examine the amount of FDI inflow as per the region made by the RBI into particular state of India. Table 4 indicates the amount of FDI inflow into the states. It is very much evident from the table that the state of Maharashtra is the highest receiver of FDI (Rs. 241,228 crores), followed by Delhi and Haryana and parts of the Uttar Pradesh (Rs. 146,778 crores). Bihar and north-eastern states are the lowest with an amount of Rs. 85 crores and Rs.321 crores respectively. Bangalore, Chennai and Ahmadabad stand on the third, fourth and fifth position with an amount of Rs. 42,434 crores, Rs. 36,602 crores and Rs. 35,927 crores respectively. There are different factors on which the FDI inflow makes its impact on different states. Maharashtra has excellent physical, social and financial infrastructure and a relative abundance of entrepreneurs. It is the most industrialized, the second most urbanized and judged by the per capita income, the third richest state in India (www.planningcommission.nic.in). The impact of FDI on Maharashtra’s economy has been very strong and impressive.FDI in this state has led to the introduction of new technologies in the industrial sector. Apart from this the sectors which have received a robust growth due to inflow of FDI are electronics hardware, automobiles and auto components, consumer durables, chemicals, information technology engineering and biotechnology.
CONCLUSION From the available data and information about the states of India it is clear that FDI has not only gone to richer states but has also gone to poorer states, though in less proportion. States like Maharashtra, Delhi and Bangalore have received sufficiently more. At the same time FDI has proved very much helpful in the growth of the poor states like Bihar and Jharkhand. It is because of FDI which has led to competition among the states, that the state government of Bihar has made efforts to attract FDI. The state government of Madhya Pradesh, Rajasthan, Orissa, Bihar, Jharkhand and north eastern states should alter the norms for FDI in the direction of giving a boost to sales, acquiring resources, improving infrastructure, increasing the supply in the market and making it less risk oriented. Keeping in view the global crisis which may hit investments badly, such policies should be adopted which aim at sustainable development of the state at the macro level and gives a more cohesive and pragmatic atmosphere for FDI.

VOLUME NO. 2 (2012), ISSUE NO. 12 (DECEMBER) ISSN 2231-1009
INTERNATIONAL JOURNAL OF RESEARCH IN COMPUTER APPLICATION & MANAGEMENT A Monthly Double-Blind Peer Reviewed (Refereed/Juried) Open Access International e-Journal - Included in the International Serial Directories
http://ijrcm.org.in/
118
REFERENCES 1. http://business.gov.in/indian_economy/capital_inflows.php 2. Kulwinder Singh, “Foreign Direct Investment in India: A critical Analysis of FDI from 1991-2005”, The ICFAI Journal of Public Finance, Vol IV, No.3,2006 3. Mohd Ashraf Ali and Shahid Alam, “FDI in India: An overview”, Investment Climate, ICFAI, 2008. 4. Rohit Kumar and Gagandeep Singh, “A Study on Foreign Direct Investment (FDI) and Growth of States in India”, Handbook of management and behavioral
science, Vol IV, p300. 5. UNCTAD Report on Investment, Press Information Bureau: Mar 14, 2011 6. www.dipp.nic.in 7. www.planningcommission.nic.in

VOLUME NO. 2 (2012), ISSUE NO. 12 (DECEMBER
INTERNATIONAL JOURNAL OF RESEARCH IN COMA Monthly Double-Blind Peer Reviewed (Refereed
CONCURRENCY CONTROL
ASST
In this paper I have discussed the why Time stamping technique is used in concurrency control in DBMS and how it can be imple
technique problem of deadlock is found which is very important to resolve. So time stamping can resolve
ways Formal and Informal. Timestamping refers to the use of an electronic
techniques are used in a variety of computing fields, from
control. The timestamp ordering protocol ensures that any pair of conflictin
an alternative solution to using locks.
KEYWORDS time stamping, multiversion concurrency control, formal timestamping, informal timestamping.
INTRODUCTION ultiversion concurrency control (MVCC), in the management systems to provide concurrent access to the database and in programming languages to implement transactional memory .Here, a database will implement updates not by deleting an old piece of data and overwriting it with a new one, but instead by markin
obsolete and adding the newer version. Thus there are multiple versions stored, but only one is the latest. This allows the database to avoid overhead of filling holes in memory or disk structures but requires generally the system to periodicallprovides potential point in time consistent views. In fact read transactions under MVCC typically use a timestamp or transaction ID to determine what state ofthe DB to read, and read these versions of the data. This avoids managing locks for read transactions because writes can be being maintained, rather than through a process of locks. Writes affect future guaranteed to be consistent because the writes are occurring at a later transaction ID. In other words, MVCC provida snapshot of the database for that person to work with. Any changes made will not be seen by other users of the database until the trancommitted.
TIMESTAMP One of the techniques used in MVCC is time stamping. In among a set of events. Time stamping techniques are used in a variety of computing fields, from control. Here, I will discuss its role in concurrency control in DBMS.or a transaction. A larger timestamp indicates a more recent transaction .
• Basic Timestamp Ordering
• Strict Timestamp Ordering
• Thomas's Write Rule
OPERATION Following assumptions are made here.
• Every timestamp value is unique and accurately represents an instant in time.
• No two timestamps can be the same.
• A higher-valued timestamp occurs later in time than a lowerTimestamps can be generated in several ways. 1. One possibility is to use a counter that is incremented each time its value is assigned to a transaction. The transaction tim
. in this scheme. A computer counter has a finite maximum value, so the system must periodicallyexecuting for some short period of time.
2. Another way to implement timestamps is to use the current date/time value of the system clock and ensure that no two timestamduring the same tick of the clock.
3. A combination of the above two methods. Time stamping technique is operated by two ways. 1. Formal 2. Informal 1. FORMALl (Here TS is time stamp,A is action, T is transation,O is object,WTS is write timestamp and RTS is write time stamp.)
Each transaction ( ) is an ordered list of actions (
any other strictly totally ordered sequence:
it depends, , and an initially empty set of old objects which it updated,
Each object in the database is given two timestamp fields which are not used other than for concurrency control:
the value of object was last used by a transaction,
For all :
For each action :
If wishes to use the value of :
M
ECEMBER)
INTERNATIONAL JOURNAL OF RESEARCH IN COMPUTER APPLICATION Refereed/Juried) Open Access International e-Journal - Included in the International Serial Directories
http://ijrcm.org.in/
CONCURRENCY CONTROL IN DBMS WITH TIMESTAMPS
GEETIKA
ASST. PROFESSOR IN COMPUTER SCIENCE
GOVERNMENT COLLEGE
GURGAON
ABSTRACT
In this paper I have discussed the why Time stamping technique is used in concurrency control in DBMS and how it can be imple
technique problem of deadlock is found which is very important to resolve. So time stamping can resolve this issue to some extent. It can be implemented by two
ways Formal and Informal. Timestamping refers to the use of an electronic timestamp to provide a temporal order among a set of even
techniques are used in a variety of computing fields, from network management and computer security to concurrency control
The timestamp ordering protocol ensures that any pair of conflicting read/write operations will be executed in their respective timestamp order. This is
time stamping, multiversion concurrency control, formal timestamping, informal timestamping.
ultiversion concurrency control (MVCC), in the database field of computer science, is a concurrency controlto provide concurrent access to the database and in programming languages to implement transactional memory .Here, a
database will implement updates not by deleting an old piece of data and overwriting it with a new one, but instead by markin. Thus there are multiple versions stored, but only one is the latest. This allows the database to avoid overhead of filling
holes in memory or disk structures but requires generally the system to periodically sweep through and delete the old, obsolete data objects. MVCC also consistent views. In fact read transactions under MVCC typically use a timestamp or transaction ID to determine what state of
of the data. This avoids managing locks for read transactions because writes can be d, rather than through a process of locks. Writes affect future version but at the transaction ID that the read is working at, everything is
guaranteed to be consistent because the writes are occurring at a later transaction ID. In other words, MVCC provides each user connected to the database with of the database for that person to work with. Any changes made will not be seen by other users of the database until the tran
time stamping. In computing timestamping refers to the use of an electronic timestampa set of events. Time stamping techniques are used in a variety of computing fields, from network management
control in DBMS. Time stamp is a monotonically increasing variable (integer) indicating the age of an operation or a transaction. A larger timestamp indicates a more recent transaction . Timestamp Ordering Algorithm: Basically three algorithms are used .
Every timestamp value is unique and accurately represents an instant in time.
timestamp occurs later in time than a lower-valued timestamp.
One possibility is to use a counter that is incremented each time its value is assigned to a transaction. The transaction tim. in this scheme. A computer counter has a finite maximum value, so the system must periodically reset the counter to zero when no transactions are
Another way to implement timestamps is to use the current date/time value of the system clock and ensure that no two timestam
(Here TS is time stamp,A is action, T is transation,O is object,WTS is write timestamp and RTS is write time stamp.)
). Before the transaction performs its first action ( ), it is marked with the current
. Every transaction is also given an initially empty set of transactions upon which
, and an initially empty set of old objects which it updated,
in the database is given two timestamp fields which are not used other than for concurrency control:
is the time at which the value of the object was last updated by a transaction.
ISSN 2231-1009
PUTER APPLICATION & MANAGEMENT Included in the International Serial Directories
119
MPS
In this paper I have discussed the why Time stamping technique is used in concurrency control in DBMS and how it can be implemented. Here, as in locking
this issue to some extent. It can be implemented by two
to provide a temporal order among a set of events. Timestamping
concurrency control. Here, I will discuss in concurrency
g read/write operations will be executed in their respective timestamp order. This is
concurrency control method commonly used by database to provide concurrent access to the database and in programming languages to implement transactional memory .Here, a
database will implement updates not by deleting an old piece of data and overwriting it with a new one, but instead by marking the old data as . Thus there are multiple versions stored, but only one is the latest. This allows the database to avoid overhead of filling in
y sweep through and delete the old, obsolete data objects. MVCC also consistent views. In fact read transactions under MVCC typically use a timestamp or transaction ID to determine what state of
of the data. This avoids managing locks for read transactions because writes can be isolated by virtue of the old versions but at the transaction ID that the read is working at, everything is
es each user connected to the database with of the database for that person to work with. Any changes made will not be seen by other users of the database until the transaction has been
timestamp to provide a temporal order network management and computer security to concurrency
Time stamp is a monotonically increasing variable (integer) indicating the age of an operation Timestamp Ordering Algorithm: Basically three algorithms are used .
One possibility is to use a counter that is incremented each time its value is assigned to a transaction. The transaction timestamps are numbered 1, 2, 3, . . reset the counter to zero when no transactions are
Another way to implement timestamps is to use the current date/time value of the system clock and ensure that no two timestamp values are generated
), it is marked with the current timestamp, or
. Every transaction is also given an initially empty set of transactions upon which
.
in the database is given two timestamp fields which are not used other than for concurrency control: is the time at which
is the time at which the value of the object was last updated by a transaction.

VOLUME NO. 2 (2012), ISSUE NO. 12 (DECEMBER
INTERNATIONAL JOURNAL OF RESEARCH IN COMA Monthly Double-Blind Peer Reviewed (Refereed
If then abort (a more recent thread has overwritten the value),
Otherwise update the set of dependencies
If wishes to update the value of :
If then abort (a more recent thread is already relying on the old value),
If then skip (the Thomas Write Rule),
Otherwise store the previous values,
value of .
While there is a transaction in that has not ended:
If there is a transaction in that aborted then Otherwise: commit. To abort:
For each in
If equals then restore 2. INFORMAL Whenever a transaction starts, it is given a timestamp. This is so we can tell which order that the transactions are supposed to be applied in. So given twotransactions that affect the same object, the transaction that has the earlier timestamp is meant to be applied before the ottransaction is actually presented first, it is aborted and must be restarted.Every object in the database has a read timestamp, which is updated whenever the object's data is read, and a write timestampobject's data is changed. If a transaction wants to read an object,
• but the transaction started before the object's write timestamp it means that something changed the object's data after the transaction started. In this case, the transaction is canceled and must be restarted.
• and the transaction started after the object's write timestamp, it means that it is the object's read timestamp, the read timestamp is set to the trans
If a transaction wants to write to an object,
• but the transaction started before the object's read timestamp it means that something has had a look at the object, and we assume it took a copy of the object's data. So we can't write to the object as that would make any copied data invalid, so the transaction is aborted and must be restarted.
• and the transaction started before the object's write timestamp it means that something has changed the object since we started our transaction. In this case we use the Thomas Write Rule and simply skip our
• otherwise, the transaction writes to the object, and the object's write timestamp is set to the transaction's timestamp.
CONCLUSION Multi-version concurrency control (MVCC) is a common way today to increase concurrency and performance by generating a new version each time the object is written, and allowing transactions' read operations of several last relevant vertimestamp is a unique identifier created by the DBMS to identify a transaction. Typically, timestamp values are assigned in tare submitted to the system, so a timestamp can be thought of as the Concurrency control techniques based on timestamp ordering do not use locks; hence,
REFERENCES 1. http://community.ingres.com/wiki/MVCC 2. http://discovery.csc.ncsu.edu/Courses/csc742-S02/T14_CControl_TO_6.pdf3. http://en.wikipedia.org/wiki/Multiversion_concurrency_control4. http://en.wikipedia.org/wiki/Serializability#Enforcing_conflict_serializability5. http://www.cs.ucy.ac.cy/~dzeina/courses/epl446/lectures/16.pdf6. http://www.scribd.com/doc/8782868/DBMSch167. https://www.classle.net/book/timestamp-based-protocol8. Multi-Version Concurrency Control in the H2 Database Engine9. Philip A. Bernstein, Vassos Hadzilacos, Nathan Goodman (1987):
Wesley Publishing Company, ISBN 0-201-10715-5 10. White paper by Roman Rokytsky Firebird and Multi Version Concurrency Control11. www.slideshare.net/votis/timestamp-based-protocol
ECEMBER)
INTERNATIONAL JOURNAL OF RESEARCH IN COMPUTER APPLICATION Refereed/Juried) Open Access International e-Journal - Included in the International Serial Directories
http://ijrcm.org.in/
(a more recent thread has overwritten the value),
Otherwise update the set of dependencies
;
(a more recent thread is already relying on the old value),
(the Thomas Write Rule),
, set
that has not ended: wait
that aborted then abort
then restore and
it is given a timestamp. This is so we can tell which order that the transactions are supposed to be applied in. So given twotransactions that affect the same object, the transaction that has the earlier timestamp is meant to be applied before the ottransaction is actually presented first, it is aborted and must be restarted. Every object in the database has a read timestamp, which is updated whenever the object's data is read, and a write timestamp
the object's write timestamp it means that something changed the object's data after the transaction started. In this eled and must be restarted.
the object's write timestamp, it means that it is safe to read the object. In this case, if the transaction timestamp is after the object's read timestamp, the read timestamp is set to the transaction timestamp.
the object's read timestamp it means that something has had a look at the object, and we assume it took a copy of the object as that would make any copied data invalid, so the transaction is aborted and must be restarted.
the object's write timestamp it means that something has changed the object since we started our transaction. In this and simply skip our write operation and continue as normal; the transaction does not have to be aborted or restarted
otherwise, the transaction writes to the object, and the object's write timestamp is set to the transaction's timestamp.
version concurrency control (MVCC) is a common way today to increase concurrency and performance by generating a new version each time the object is written, and allowing transactions' read operations of several last relevant versions (of each object), depending on scheduling method. A timestamp is a unique identifier created by the DBMS to identify a transaction. Typically, timestamp values are assigned in t
stamp can be thought of as the transaction start time. We will refer to the timestamp of transaction T as TS(T). Concurrency control techniques based on timestamp ordering do not use locks; hence, deadlocks cannot occur.
S02/T14_CControl_TO_6.pdf http://en.wikipedia.org/wiki/Multiversion_concurrency_control
rg/wiki/Serializability#Enforcing_conflict_serializability http://www.cs.ucy.ac.cy/~dzeina/courses/epl446/lectures/16.pdf http://www.scribd.com/doc/8782868/DBMSch16
protocol Version Concurrency Control in the H2 Database Engine
, Vassos Hadzilacos, Nathan Goodman (1987): Concurrency Control and Recovery in Database Systems
Firebird and Multi Version Concurrency Control protocol
ISSN 2231-1009
PUTER APPLICATION & MANAGEMENT Included in the International Serial Directories
120
and set
, and update the
it is given a timestamp. This is so we can tell which order that the transactions are supposed to be applied in. So given two transactions that affect the same object, the transaction that has the earlier timestamp is meant to be applied before the other one. However, if the wrong
Every object in the database has a read timestamp, which is updated whenever the object's data is read, and a write timestamp, which is updated whenever the
the object's write timestamp it means that something changed the object's data after the transaction started. In this
to read the object. In this case, if the transaction timestamp is after
the object's read timestamp it means that something has had a look at the object, and we assume it took a copy of the object as that would make any copied data invalid, so the transaction is aborted and must be restarted.
the object's write timestamp it means that something has changed the object since we started our transaction. In this write operation and continue as normal; the transaction does not have to be aborted or restarted
otherwise, the transaction writes to the object, and the object's write timestamp is set to the transaction's timestamp.
version concurrency control (MVCC) is a common way today to increase concurrency and performance by generating a new version of a database object sions (of each object), depending on scheduling method. A
timestamp is a unique identifier created by the DBMS to identify a transaction. Typically, timestamp values are assigned in the order in which the transactions We will refer to the timestamp of transaction T as TS(T).
Concurrency Control and Recovery in Database Systems (free PDF download), Addison

VOLUME NO. 2 (2012), ISSUE NO. 12 (DECEMBER) ISSN 2231-1009
INTERNATIONAL JOURNAL OF RESEARCH IN COMPUTER APPLICATION & MANAGEMENT A Monthly Double-Blind Peer Reviewed (Refereed/Juried) Open Access International e-Journal - Included in the International Serial Directories
http://ijrcm.org.in/
121
A STUDY ON PERFORMANCE MANAGEMENT SYSTEM (PMS) WITH SPECIAL REFERENCE TO COTELLIGENT
P SWETHA
ASST. PROFESSOR
DEPARTMENT OF BUSINESS MANAGEMENT
BADRUKA COLLEGE PG CENTRE
KACHIGUDA
ABSTRACT Performance Management System (PMS) makes a very important contribution to the development of the organization’s human resources and hence to the
achievement of its aims and objectives. The purpose of this paper is to examine the impact of PMS on organizational effectiveness by enhancing personal
performance using appropriate performance measures. The study focuses on the factors responsible for effectiveness of the performance management systems
and its alignment with organizatioal goals. Performance management is a much broader and a complicated function of HR, as it encompasses activities such as
joint goal setting, continuous progress review and frequent communication, feedback and coaching for improved performance, implementation of employee
development programmes and rewarding achievements. It is a means for promoting superior performance by communicating expectations, defining roles within
a required competence framework and establishing achievable benchmarks. The study is been taken up in Cotelligent to study how PMS works in their
organization and its transparency by involving the employees at the same time, to know the process, its transparency and employee expectations from the
organization. A sample of 74 respondents (employees) was considered for collection of data.Percentile method is used to analyze the data and observations. it is
observed that the employees believe that an effective PMS in the organization leads to reduction in employee turnover; it ensures that goals are consistently
being met in an effective and efficient manner.
KEYWORDS Performance Management System (PMS), 360 degree appraisal system, Performance Management process, Employee performance, Employee development.
INTRODUCTION he performance process within many organizations is fragmented and inconsistent, time consuming and arduous for everyone involved, and often supported by outdated legacy systems and spreadsheets. This lack of standardization often results in reduced employee morale and engagement, ineffective communication at all levels of the organization, and severe misalignment between the workforce and the overall strategy of the organization.
Organizations succeed when they continuously nourish the top performers and improve (or weed out) the poor performers. The big challenges of following this strategy are identifying the real performers, provide a competitive compensation to retain & motivate them and improve employee skills & competencies to maintain the business competitiveness. An Effective Performance Management System can help to meet these big challenges of improving employee performance. Performance Management System is an integrated tool to improve organizational performance by setting SMART Goals for employee, evaluating employee performance, recommending highly competitive compensation plans, managing employee trainings & development and promoting right employees to critical positions. Based on globally followed HR practices and principles, this performance management system provides right tools to engage employees in productive work, help employee achieve their goals, bring objectivity & transparency in employee evaluations, manage employee trainings, manage employee compensations, promotion and careers.
REVIEW OF LITERATURE According to Armstrong and Baron Performance Management is both a strategic and an integrated approach to delivering successful results in organizations by improving the performance and developing the capabilities of teams and individuals. The term performance management gained its popularity in early 1980’s when total quality management programs received utmost importance for achievement of superior standards and quality performance. Tools such as job design, leadership development, training and reward system received an equal impetus along with the traditional performance appraisal process in the new comprehensive and a much wider framework. Performance management is an ongoing communication process which is carried between the supervisors and the employees throughout the year. The process is very much cyclical and continuous in nature. A performance management system includes the following actions.
• Developing clear job descriptions and employee performance plans which includes the key result areas (KRA') and performance indicators.
• Selection of right set of people by implementing an appropriate selection process.
• Negotiating requirements and performance standards for measuring the outcome and overall productivity against the predefined benchmarks.
• Providing continuous coaching and feedback during the period of delivery of performance.
• Identifying the training and development needs by measuring the outcomes achieved against the set standards and implementing effective development programs for improvement.
• Holding quarterly performance development discussions and evaluating employee performance on the basis of performance plans.
• Designing effective compensation and reward systems for recognizing those employees who excel in their jobs by achieving the set standards in accordance with the performance plans or rather exceed the performance benchmarks.
• Providing promotional/career development support and guidance to the employees.
• Performing exit interviews for understanding the cause of employee discontentment and thereafter exit from an organization. A performance management process sets the platform for rewarding excellence by aligning individual employee accomplishments with the organization’s mission and objectives and making the employee and the organization understand the importance of a specific job in realizing outcomes. By establishing clear performance expectations which includes results, actions and behaviors, it helps the employees in understanding what exactly is expected out of their jobs and setting of standards help in eliminating those jobs which are of no use any longer. Through regular feedback and coaching, it provides an advantage of diagnosing the problems at an early stage and taking corrective actions. To conclude, performance management can be regarded as a proactive system of managing employee performance for driving the individuals and the organizations towards desired performance and results. It’s about striking a harmonious alignment between individual and organizational objectives for accomplishment of excellence in performance. David Creelman, CEO of Creelman Research in his article “New Forces in Performance Management” said Performance management is routine. HR departments tend to change the process a bit every few years, but the fundamental annual cycle of setting goals, appraising people and giving pay increases is standard. The processes look pretty much the same from company to company. The biggest difference is how seriously the organization takes the process—some invest a lot of effort while others just go through the motions. The performance management process is supposed to be about goal setting, motivation, coaching, reward and development. However, in America there are two underlying reasons why HR wants performance management. One is that they need a piece of paper justifying any pay increases. Secondly, they want a paper trail in case they want to fire someone for poor performance. Everything else is secondary.
T

VOLUME NO. 2 (2012), ISSUE NO. 12 (DECEMBER) ISSN 2231-1009
INTERNATIONAL JOURNAL OF RESEARCH IN COMPUTER APPLICATION & MANAGEMENT A Monthly Double-Blind Peer Reviewed (Refereed/Juried) Open Access International e-Journal - Included in the International Serial Directories
http://ijrcm.org.in/
122
NEED FOR THE STUDY To achieve its purpose, PMS needs to be effectively managed. The project mainly aims at studying the PMS at COTELLIGENT. The study is needed to know:
• The present PMS of the organization.
• The views and attitudes of the employees towards the existing Performance management system in the organization.
• It gives an opportunity to the employees to voice their views about the change in the current PMS.
OBJECTIVES OF THE STUDY Objectives are the tactical applications of the strategic aims. They are statements of intent written in clear, unambiguous, specific and precise terms. The following are the specific objectives of the study:-
• To study the process of managing employee performance at COTELLIGENT.
• To study how employee performance is reviewed.
• To determine the effectiveness of the existing performance appraisal process with special reference to the modern approaches used in the system of performance management.
• To determine employee expectations from the existing PMS and to identify gaps, if any and hence find out its strengths and weaknesses.
• To develop an effective PMS at Cotelligent.
SCOPE OF THE STUDY The study covers various aspects like employee details, work nature, job specification, knowledge and personality development of employees of the organization. It also covers job nature of technical, behavioral, awareness and various aspects Performance Appraisals conducted by the personnel department. It has a scope of learning about the various programs organized by the personnel department till date and the methods which they are going to implement and also the analytical based methods which we will suggest based upon the survey. To know the function of the organization as a whole and as well to know how the policies are made and implemented and conveyed to the employees.
RESEARCH METHODOLOGY Research methodology is a way to systematically solve the problem. In it we study the various steps that are generally adopted by a researcher in studying the research problem along with the logic behind them. A structured questionnaire is used as the primary data collection instrument for the study. All the questions in the questionnaire are organized in such a way that elicits all the relevant information that is needed for the study. The secondary data for the study have been obtained from the text books, and organization records. It was also collected from websites, Library, past documents related to Performance management system of HR department. Convenience sampling method was selected for the study and the information is collected from the respondents. The sampling frame for the study consists of all employees in the organization and the sample size constitutes 60 respondents of Cotelligent. The collected data was tabulated and analyzed using percentage analysis.
DATA ANALYSIS & INTREPRETATION A survey was conducted to understand the present PMS based on the below given questionnaire. A sample of 74 employees was taken for the observation part. Although the size may appear to look very small , it was sufficient to collect the views of employees and form a conclusion. Random selection of employees was done and both the Executives and Non-Executives were given the same Questionnaire to express their views. 1. Level of satisfaction with the current Performance Management System
Options Highly Satisfied Satisfied Dissatisfied Highly Dissatisfied
Response of employees in % 40 25 25 10
INTERPRETATON The above observation shows that 40 % of employees are satisfied with the current PMS.25% of them are not satisfied with it. Out of rest, 25% are not convinced and 10% have no idea about it. As less proportion is satisfied with the present system, it is advisable to bring out some more modifications to satisfy the employees. 2. Change is required in the current PMS
Options Strongly agree Agree Disagree Strongly Disagree
Response of employees in % 50 20 10 20
INTERPRETATON From the above observation, it is clearly shown that 50% of employees are willing to accept for a change in the current PMS. They feel that there must be some modifications in the present system. Since the majority of the employees are showing their willingness, it is advisable to HR department to bring out some effective changes in current PMS. 3. Awareness on the basis of which performance is being measured
Options Completely aware Partially aware Partially unaware Completely unaware
Response of employees in % 60 20 20 0
INTERPRETATON The analysis shows that 60% of them knows very well whereas 20% of them are partially aware and 20% of them are partially unaware. This interpretation clearly shows that the majority of employees knows how exactly their performance is being appreciated. 4. Factors on which performance getting appreciated
Options Time period of work completion Quality of work Experience Behavior
Response of employees in % 55 45 0 0
INTERPRETATON In the previous statement, 60% respondents stated that they are aware of the factor on which their performance being measured. Out of which 55% of the employees strongly believes that they are given appreciation based on time constraint and 45% believes in quality of their work. 5. Employee satisfaction with the introduction of 360 degree performance appraisal method
Options Highly satisfied Satisfied Dissatisfied Highly dissatisfied
Response of employees in % 70 0 45 0
INTERPRETATON One of the objectives of the study include development of an effective PMS at Cotelligent.360 degree performance appraisal gives best outcomes if it is maintained effectively. The above interpretation clearly shows that 70% of employees will be satisfied if this method is implemented in the organization. Hence, it is advisable to the HR department to implement 360 degree performance appraisal method in the organization.

VOLUME NO. 2 (2012), ISSUE NO. 12 (DECEMBER) ISSN 2231-1009
INTERNATIONAL JOURNAL OF RESEARCH IN COMPUTER APPLICATION & MANAGEMENT A Monthly Double-Blind Peer Reviewed (Refereed/Juried) Open Access International e-Journal - Included in the International Serial Directories
http://ijrcm.org.in/
123
6. Use of self-rating for PMS
Options Very useful Partially useful No use
Response of employees in % 80 5 15
INTERPRETATON The above observation shows that 80% of employees strongly feels that self-rating is very useful for PMS.15% respondents feels that it will be of no use and 5% of them feels that it might be partially useful. 7. PMS system will be useful for career planning.
Options Strongly agree Agree Disagree Strongly disagree
Response of employees in % 60 20 10 10
INTERPRETATON It is observed that 60% of the sample feels that PMS is very useful for their career development.20% of employees agree, 10% disagree and 10% of them strongly disagree. The unawareness on PMS could lead to negative outcomes. 8. PMS is directly related to employee turnover
Options Strongly agree Agree Disagree Strongly Disagree
Response of employees in % 40 20 35 5
INTERPRETATON The above observation proved that 40% of employees strongly believes that PMS and employee turnover are directly related.35% of disagree. Many organizations show interest in motivating high performance employees in order to prevent them from leaving the organization. 9. If right job is not given to a right person, it leads to increase in employee turnover
Options Strongly agree Agree Disagree Strongly Disagree
Response of employees in % 60 5 10 25
INTERPRETATON The above interpretation shows that 60% of employees feel that right persons must be placed in right jobs in order to reduce employee turnover.25% shows that they disagree to the question. Reducing the employee turnover should be the main concern for any employer. And this can be done by hiring the right person at the right time for the job. 10. Assistance is provided by the superiors at the time of the need
Options Strongly agree Agree Disagree Strongly Disagree
Response of employees in % 85 0 15 0
INTERPRETATON From the above interpretation,85% of employees are clear that they are always assisted by their superiors at the time of need whereas the rest 15% disagree. These employees might be felt that they acquired an insufficient guidance at times. 11. People with potentials are identified & developed for the future at the time of conducting PMS
Options Strongly agree Agree Disagree Strongly Disagree
Response of employees in % 60 15 25 0
INTERPRETATON The present performance appraisal method being followed in the organization is appreciating employees annually.60% of employees says that their potentials are spotted and developed at the time of their performance appraisals.15% feels that their potentials might be spotted and developed, whereas 25% have no idea about it. 12. Recognition of high performer helps in motivating the employees
Options Strongly agree Agree Disagree Strongly Disagree
Response of employees in % 80 5 15 0
INTERPRETATON 80% of the employees agree that the employees get motivated at the when they are recognized for their work. The above interpretation shows that 15% feels that they do not agree to the question. 13. Enough freedom is given to discuss all the matters of work
Options Strongly agree Agree Disagree Strongly Disagree
Response of employees in % 85 15 0 0
INTERPRETATON Employees will be assigned to different projects based on their skills and abilities. They must be able to discuss all the matters of their objectives with their manager or team lead. From the above interpretation, 85% of employees say that they have enough courage to discuss all matters regarding their goals. The rest 15% felt that they might not discuss sometimes regarding their objectives. This outcome might be resulted because of two reasons. Either some of the employees feel that they are very much aware of their objectives or they may think that the team lead guides them in every step till the achievement of goals. 14. The best strategy for reducing the employee turnover especially among the high performers
Options Increase benefit Freedom for work Recognition for work
Response of employees in % 60 10 30
INTERPRETATON The above interpretation clearly shows that 60% of employees feel that recognition for work reduces the employee turnover. Out of rest of the sample,10% feels freedom for work might be the reason.30% of employees believe that increase benefits to employees reduces the employee turnover. 15. The single most compelling factor of employee turnover
Options Unclear job role Poor recruitment standards Less growth Dissatisfaction with pay
Response of employees in % 25 35 25 15
INTERPRETATON The above observation shows that 35% of employees feel poor recruitment standard is the single most compelling factor for employee turnover,25% believe that it is less growth of the organization,15% feels that dissatisfaction with pay and 25% of sample thinks the factor might be the unclear job role

VOLUME NO. 2 (2012), ISSUE NO. 12 (DECEMBER) ISSN 2231-1009
INTERNATIONAL JOURNAL OF RESEARCH IN COMPUTER APPLICATION & MANAGEMENT A Monthly Double-Blind Peer Reviewed (Refereed/Juried) Open Access International e-Journal - Included in the International Serial Directories
http://ijrcm.org.in/
124
16. My work is very well defined
Options Strongly agree Agree Disagree Strongly Disagree
Response of employees in % 65 5 5 25
INTERPRETATON From the above observation, 65% of the sample feels that their work is very well defined. 25% of employees disagrees to the statement. 17. Type of stress that you feel in the organization
Options Work burden Less work for appreciation Criticism from superiors Less support from subordinates
Response of employees in % 25 60 0 15
INTERPRETATON The above observation clearly defines 25% of employees believes that they feel stress due to work burden, 60% feel less work for appreciation,15% feels less support from the subordinates. Work related stress is the response people may have when presented with work demands and pressures that are not matched to their knowledge and abilities and which challenge their ability to cope.
FINDINGS After conducting the survey on Performance Management System, it is observed that the following requirements can be implemented to some extent and improved further.
• Most of the employees are not satisfied with the current PMS and they need a change in the system.
• The majority of employees believe that their performance is getting appreciated based on time constraint and quality of work.
• Most of them feel that 360 degree feedback serves the purpose and they expressed that they might be able to rate others’ performance.
• The employees of the company are clear that PMS is very useful for self rating and career planning .They feels that PMS and employee turnover are directly related.
• At times, some of the employees are not properly assisted by their superiors, and some of them feel that their potentials are not being identified at the time of recognition. An effective PMS in the organization satisfies these people in a best way.
• Increasing benefits will be the best strategy in order to reduce employee turnover.
SUGGESTIONS Following are the suggestions, which are found to be relevant to improve the efficiency of Cotelligent.
• It is advisable to maintain a balanced scorecard (a tool to measure employee performance) and make sure that all the employees give feedback on time.
• The manager should check all performance reviews periodically and give the corrective measures.
• The organization must follow any performance appraisal method as there is no particular method being followed presently.
• 360 degree performance appraisal method helps to achieve highest effectiveness, so it can be implemented in the organization.
• This method must be implemented effectively so that the employees get satisfied and motivated.
CONCLUSION Taking into consideration the inputs from the organizational employees, it is concluded that with the introduction of 360 degree performance appraisal system, the PMS runs more efficiently and it increases work efficiency of employees. The effective PMS helps in career planning too. The organization should increase focus on improvement of Role Definition by clearly defining Key Result Areas. Performance management can focus on the performance of an organization, a department, employee, or even the processes to build a product or service and in many other areas as well.
REFERENCES 1. Armstrong, Michael, “A Handbook on HRM Practices”, 2006, Kogan Page Publishers.
2. Aswathappa .K, “Human Resource and Personnel management”, 2010, McGraw-Hill Education. 3. Subbarao. P,” Essentials of HRM & IR”, 2010, Himalaya Publishers. WEBSITES 4. http://www.academicjournals.org/ajbm/pdf/pdf2010/4Aug/Qureshi%20et%20al.pdf 5. http://www.google.co.in/ 6. www.citehr.com 7. www.cotelligent.com

VOLUME NO. 2 (2012), ISSUE NO. 12 (DECEMBER) ISSN 2231-1009
INTERNATIONAL JOURNAL OF RESEARCH IN COMPUTER APPLICATION & MANAGEMENT A Monthly Double-Blind Peer Reviewed (Refereed/Juried) Open Access International e-Journal - Included in the International Serial Directories
http://ijrcm.org.in/
125
AN ANALYSIS OF CHILD’S INFLUENCE IN CHOOSING THE SNACKS ITEMS WITH SPECIAL REFERENCES TO SIVAKASI AREA IN TAMILNADU
T. DHANALAKSHMI
ASST. PROFESSOR IN BUSINESS ADMINISTRATION
AYYA NADAR JANAKI AMMAL COLLEGE
SIVAKASI
ABSTRACT
The marketers are targeting the child for their products. Because the teen age people will be in high proportion in the coming days. This is because; the child also
takes part in purchasing decision in the family while making purchases. This study is about the child’s influences in purchasing snacks items and their preference.
It’s mainly studied with the two factors, namely nature of family system and the nature of purchases and for which items the parents show their acceptance level
even though the child is having full freedom in choosing their product
JEL CODE 31
KEYWORDS Nature of purchases, Nature of family system, Child influences.
INTRODUCTION radionally, women were seen to be the purchasing agents for the family. Increasing participation of women in the workforce has promptly makes a family to shift their purchasing decision to the children in today’s market. Children enjoy greater discretion not only in making routine consumption decisions for the family but also in pestering their parents to buy other products desired by them. Many researches express that the children constitute
major consumer market with direct purchasing power for snacks and sweets. Indian children have recently attracted considerable attention from marketers because the markets for children’s products offer a tremendous potential market in the coming days. Now the children are playing a vital role in the family purchasing decision rather than other roles played by the members in the family. This research paves the way to find the child’s influence in preferring evening snacks items in the family.
IMPORTANCE OF THE STUDY The children are gaining gradual importance in India in the purchasing decision. Many companies are concentrating on teen age people and the growing children. For the snacks items, the children are the most target segment and therefore it is essential to study the role of children played in the purchasing of evening snacks items.
STATEMENT OF THE PROBLEM The fast food items are most attractive to the children. Mainly, the packed snacks items are preferred by the children due to their color of pack, their different tastes, brand name etc. Due to this, our traditional snacks items may go from each family. So, this study helps to reveal the information of the preference of the packed snacks items in the market, the factors influences the children to make an purchases like the nature of purchases and the nature of family system
OBJECTIVES OF THE STUDY The objectives of the study is as follows 1) To examine the factors influencing the purchase of such items 2) To find out the type of snacks items preferred by the children
HYPOTHESIS OF THE STUDY H1: There is a significant relationship between the nature of family system and the nature of purchases. H2: There is a significant relationship that the child influences is high in the nature of purchases H3: There is a significant relationship between the nature of family systems and the child influences.
METHODOLOGY OF THE STUDY This analysis will reveal the fact of dominant role played by children in a family’s purchasing decision in influencing the parents to purchase the evening snacks items. SAMPLE DESIGN OF THIS STUDY The sample design for this analysis is stratified quota sampling. The sample is taken from the four directions as that is considered as strata of North, South, East and West. From each stratum of this direction, 25 respondents are selected for this study to collect the data. LIMITATIONS OF THE STUDY The limitations of the study is as follows 1) Biased information is possible in this study. 2) This study is mainly focused on to determine the child’s influence on snacks items is by considering the two factors nature of family system and nature of
purchases. STATISTICAL TOOLS EMPLOYED The statistical tools employed in this study is a) Percentage analysis b) Chi-square test c) Rating scale. CONCEPTUAL FRAME WORK OF THE STUDY Today the companies are targeting the children and teenagers for marketing the products. Because, today’s children are the future customers for their product in the market. This research paves the way to explore the information about the nature of family system, nature of purchase, different items preferred by the children in the market and the parent’s acceptance level in the child’s preferable items.
T

VOLUME NO. 2 (2012), ISSUE NO. 12 (DECEMBER) ISSN 2231-1009
INTERNATIONAL JOURNAL OF RESEARCH IN COMPUTER APPLICATION & MANAGEMENT A Monthly Double-Blind Peer Reviewed (Refereed/Juried) Open Access International e-Journal - Included in the International Serial Directories
http://ijrcm.org.in/
126
So, the nature of family system may also influence the children to give importance to them. This is happened because in earlier days the purchasing authority was hold by elder members in the family. India act as a base for the joint family system and this system played a backbone role in Indian culture. Due to more economical competition and more opportunities in the market, the purchasing decision has shifted to the children. The decision system may vary according to the types of products purchased by the family. Now the marketers mainly target the teenagers and children for the evening snacks items. So, in choosing the snacks items the children play a vital role as there are only two kids in the family. In the nuclear family systems, the parents give more importance to their kids rather than in the joint family system. The child influences factors is depicted in the below figure
FIG: 1 EXHIBITS THE NATURE OF PURCHASES DONE BY THE FAMILY
In this research, the child influence is predicted and analyzed on the basis of two factors 1) Nature of family system 2) Nature of purchases. Family system Nature of purchases Child’s influence. The table below depicts the nature of purchases done by the family
TABLE 1
S.No Particulars Frequency Percentage
1. Impulsive 53 53
2. Planned 47 47
Total 100 100
SOURCE: PRIMARY DATA The family members may purchase their items based upon impulsive and planned. Impulsive purchases means the purchases done by the family as per their requirements and it may do at frequent intervals in a month like week, fortnight etc. As per the above table, nearly 47 % of the family made planned purchases and the 53 % of the family made the impulsive purchases.
TABLE 2: SHOWS THE NATURE OF FAMILY SYSTEM
S.No Particulars Frequency Percentage
1. Nuclear Family 58 58
2. Joint family 42 42
Total 100 100
SOURCE: PRIMARY DATA It is depicted from the above table that the 58% of the respondents belong to the nuclear family system and the remaining 42% of the respondents are lived in the joint family system. The below table shows the cross tabulation of nature of family system and their nature of purchases
TABLE 3: SHOWS THE NATURE OF FAMILY SYSTEM AND THEIR NATURE OF PURCHASES
S.No Particulars Planned Impulsive Total
1. Nuclear family 25 33 58
2. Joint family 22 20 42
Total 37 53 100
SOURCE: PRIMARY DATA This table is act as a base to assess the relationship between the natures of purchases and nature of family system. The expected frequency of chi-square is depicted in the following table:
TABLE 4: SHOWS THE NATURE OF FAMILY SYSTEM AND THEIR NATURE OF PURCHASES
S.No O E (O-E)2 (O-E)2/E
1. 25 27.26 5.11 0.188
2. 33 30.74 5.11 0.17
3. 22 19.74 5.11 0.2589
4. 20 22.26 5.11 0.23
Total 0.8469
SOURCE: PRIMARY DATA d.f=(r-1) (c-1) =1 @0.05 % level of significance is 3.84 The calculated value of chi-square is less than the table value. Therefore it reveals from the hypothesis testing that there is a significant relation between the nature of family system and the nature of purchases.
TABLE 5: SHOW THE NATURE OF PURCHASES AND THE CHILD’S IMPORTANCE IN MAKING THIS PURCHASE.
S.No Particulars Child’s importance Didn’t give importance Total
1. Planned 25 22 47
2. Impulsive 36 17 53
Total 71 39 100
SOURCE: PRIMARY DATA
Child’s influence Family system
Purchases

VOLUME NO. 2 (2012), ISSUE NO. 12 (DECEMBER) ISSN 2231-1009
INTERNATIONAL JOURNAL OF RESEARCH IN COMPUTER APPLICATION & MANAGEMENT A Monthly Double-Blind Peer Reviewed (Refereed/Juried) Open Access International e-Journal - Included in the International Serial Directories
http://ijrcm.org.in/
127
With the help of this above table, the expected frequency is calculated as follows and it is shown in the above table.
TABLE 6: SHOWS THE NATURE OF PURCHASES AND THE CHILD’S IMPORTANCE IN MAKING THIS PURCHASE
S.No O E (O-E)2 (O-E)2/E
1. 25 33.37 70.0569 2.099
2. 22 18.33 13.4689 0.7348
3. 36 37.63 2.6569 0.071
4. 17 15.37 2.6569 0.173
Total 3.0778
SOURCE: PRIMARY DATA d.f=(r-1) (c-1) =1 @0.05% level of significance is 3.84 In the nature of purchases, the parents are giving more importance to their children’s desire. The nature of purchases also influences the children to choose their needed products while the parents go for shopping. In this hypothesis testing, the calculated value of chi-square is lesser than the table value so the hypothesis is accepted that there is a significant relationship between the nature of purchases and the parents are giving more importance to their child’s desire. The table below shows the fact about the the child’s influence in the nature of family system:
Table 7: NATURE OF FAMILY SYSTEMS AND THE CHILD’S INFLUENCES IN PURCHASING THE ITEMS
S.No Particulars Child’s importance Didn’t give Child’s importance Total
1. Nuclear 40 18 58
2. Joint 31 11 42
Total 71 39 100
SOURCE: PRIMARY DATA The expected frequency of the above figure are calculated and shown it in the form of table.
TABLE 8: NATURE OF FAMILY SYSTEMS AND THE CHILD’S INFLUENCES IN PURCHASING THE ITEMS
S.No O E (O-E)2 (O-E)2/E
1. 40 41.18 1.3924 0.0338
2. 18 22.62 21.3444 0.9436
3. 31 29.82 1.3924 0.0466
4. 11 16.38 28.9444 1.7671
Total 2.7911
SOURCE: PRIMARY DATA d.f=(r-1)(c-1) =1 @0.05% level of significance is 3.84 The calculated value of chi-square is lower than the table value therefore there is a high level of child’s influence in the nature of family system. The above testing of hypothesis helps us to throw a light on the relationship between the nature of family’s system and the child’s importance in it.
RESULTS AND DISCUSSIONS The snacks items like fruits, biscuits, vada, pizza, noodles, and burger items are taken into account to analyze the choice of snacks items to be given to their children. Even though the modern fast food items came into existence in this fast world, our respondents had given more importance to the children’s health by offering our traditional items of vada and fruits. This fact can come to the light that by making rank analysis of these items. Through this analysis, it is found that biscuits and fruits gain an equal importance among the respondents by securing I rank of 5.94 following other evening items like Pizza, noodles occupies the second and third position. But the children are not showing eagerness towards these items to eat. They are fond to eat packet items and fast food items. Because the children are gets influenced to purchase the snacks items due to the external influence from the environment like TV, Radio and their friends through word of mouth communication. The environmental influence is highly affecting the children in choosing the junk food items but due to the parent’s resistance level, the biscuits and fruits secured I rank. The Table 9 below shows the correlation and chi-square of the hypothesis:
TABLE 9
Particulars Correlation Chi-square Value D.F Level of significance Table value Result
Nature of purchases and nature of family system +1 0.8469 1 5% 3.84 Accepted
Nature of purchases and child importance -1 3.0778 1 5% 3.84 Accepted
Nature of family system and Child’s importance +1 2.7911 1 5% 3.84 Accepted
SOURCE: PRIMARY DATA Nature of purchases and child’s importance is highly negatively correlated. It shows the child’s dominant role in purchasing and the parents also give importance to their preferred items.
SUGGESTIONS 1) Due to more influences from the outside world, the child gets more influenced in purchasing their snacks items and also they play a decision making role.
In this situation, the parents should taught their children about the benefits of their chosen evening snacks items in the market to decide themselves 2) In this research due to 88% of the respondent don’t want to scold their children while their children decide the unhealthy items for their evening snacks.
Due to these findings, the parents have to recognize their child’s reference in the initial stage of purchasing and thereby the parents have to continuously counsel and guide their children to choose the healthy item.
3) In doing impulsive purchases’, the children are gaining more importance in purchasing the snacks items and it is better for the family to make planned purchases for every month.
CONCLUSION The nature of purchases and the nature of family system motivates the child to take part in the family decision making process for their routine purchases’. Due to this, the children get more freedom in purchasing their preferable items that they come across through various social influences and thereby it seems to be the most important profitable segment in the market.
REFERENCES 1. Apporva, Palkar 2004, “Consumer preferences in purchase of ready- to-eat snacks-branded potato chips” Ind.j.Marketing 34(9), 34-38

VOLUME NO. 2 (2012), ISSUE NO. 12 (DECEMBER) ISSN 2231-1009
INTERNATIONAL JOURNAL OF RESEARCH IN COMPUTER APPLICATION & MANAGEMENT A Monthly Double-Blind Peer Reviewed (Refereed/Juried) Open Access International e-Journal - Included in the International Serial Directories
http://ijrcm.org.in/
128
2. Jorin, R., 1987, “Consumer behaviour is changing and offering new opportunities”.Berater-information, 26(9):8-14. 3. Kamalaveni, D. and Nirmala, 2000, “Consumer behaviour in instant food products” Ind.j. Marketing, 30 (5-7):12-18. 4. Shanmugsundaram, S., 1990, “Demographic and Psychological factors that influence the pattern and selection in soft drink and tetra pack drinks-A study
inVellore” . Ind.J.Marketing, 20(7):102-106. 5. Vincent, N., 2006, “A study on brand consciousness among children and its effect on family buying behaviour in Bangalore city” Ind.J.Marketing,36(1):12-
18.

VOLUME NO. 2 (2012), ISSUE NO. 12 (DECEMBER) ISSN 2231-1009
INTERNATIONAL JOURNAL OF RESEARCH IN COMPUTER APPLICATION & MANAGEMENT A Monthly Double-Blind Peer Reviewed (Refereed/Juried) Open Access International e-Journal - Included in the International Serial Directories
http://ijrcm.org.in/
129
MEASURING SERVICE QUALITY OF RAILWAY PLATFORMS IN INDIA: A CASE-STUDY OF EAST-COAST RAILWAYS
DR. SRINIBASH DASH
SR. LECTURER
DEPARTMENT OF PROFESSIONAL COURSES
G. M. (AUTONOMOUS) COLLEGE
SAMBALPUR
SRI SISIR RANJAN DASH
LECTURER
DEPARTMENT OF PROFESSIONAL COURSES
G. M. (AUTONOMOUS) COLLEGE
SAMBALPUR
SRI SUBRAT KUMAR PRADHAN
LECTURER
DEPARTMENT OF PROFESSIONAL COURSES
G. M. (AUTONOMOUS) COLLEGE
SAMBALPUR
ABSTRACT
Indian Railways is the major mode of transport in the country for passengers as well as freight due to its large network, number of trains, and affordability.
Railways provide the citizens of India as well as foreign nationals visiting India with a convenient, accessible, and affordable mode of transportation. Though the
railway is the lifeline of Indian economy and society, it cannot be ignored that its services are far from healthy and satisfactory. A thorough review of literature
revealed that scholars have undertaken studies on various aspects of railway services, but platforms have failed to attract much of their attention. In the present
study a survey of passengers (customers) was conducted with the aim to measure their satisfaction towards the services of railway platforms of east-coast
railways on the basis of a few components of service quality of railway platforms. Factor analysis has been employed in this study to identify the most important
factors of customer satisfaction with service quality of railway platforms. The findings of the study reveals that four factors that are considered important by the
passengers for achieving satisfaction with railway platforms are basic facilities, refreshments, information system efficiency and security for and behaviour
towards the passengers. A lot of insights on the managerial and theoretical implications were developed from the survey results and has been discussed in this
paper.
KEYWORDS Indian Railways, Service Quality, Customer Satisfaction, Factor Analysis, Varimax Rotation.
INTRODUCTION ome of the characteristics which differentiate services from physical goods are intangibility, perishability, simultaneity, and heterogeneity which make it difficult to measure the service quality (Zeithaml, Parasuraman and Berry, 1985). Therefore, to control quality and offer consistent service is one of the major problems faced by the service provider. The quality can be technically and statistically specified and also be checked for conformance with the
specified standards much before it reaches to the customer, in case of tangible products. But, in case of a service, since production and consumption occurs simultaneously, the buffer available with a tangible product does not exist for a service. Collier (1987) says that a service has a lot of intangible dimensions including reliability, responsiveness, competence, courtesy, friendliness, security, ambience, etc. which are qualitative by nature and whose value is subjective. The subjectivity makes it imperative for the marketers to take into cognizance the customer perceptions of service quality so that the service package defined and planned by the marketers is close to the one that is expected by the customer. Service quality is characterized by the customer perception of service. What counts in services are the quality as it is perceived by the customers, i.e., the customer is the sole judge of quality (Berry, 1980). This paper is an attempt to assess the quality of railway services through measuring the customer satisfaction in the context of railway platforms, with special reference to platforms in the East Coast Railways.
REVIEW OF LITERATURE Over the last few years, there has been a considerable research on different aspects of service quality leading to a sound conceptual base for both practitioners and researchers. Authors (Parasuraman, Zeithaml and Berry, 1985, 1988; Carman, 1990) agree that service quality is an abstract concept, difficult to define and measure. An article on 'Trends in Management'8 revealed that quality was the top most concern of CEOs across the world. It said: "Quality changed the nature of business competition and, perhaps more than any other factor, dictated how companies make products or deliver services. In the
global economy, quality is just the entry ticket. You'll battle many competitors who have attained it. The next step is figuring out how to differentiate you."
On service quality modelling, Grönroos (1984) model divides the customer’s perceptions of any particular service into two dimensions, namely technical and functional quality. In conceptualizing the basic service quality model, Parasuraman et al. (1985) identified 10 key determinants of service quality as perceived by the service provider and the consumer, namely, reliability, responsiveness, competence, access, courtesy, communication, credibility, security, understanding/knowing the customer, and tangibility to formulate a service quality framework, SERVQUAL. Later (in 1988), they modified the framework to five determinants: reliability, assurance, tangibles, empathy, and responsiveness, or RATER. In the context of transport services, the literature review shows that researchers have identified different factors of quality in the context of different services. Eboli and Mazzulla (2007) measured customer satisfaction in the context of bus service on various factors including availability of shelter and benches at bus stops, cleanliness, overcrowding, information system, safety, personnel security, helpfulness of personnel, and physical condition of bus stops. Vanniarajan and
8 World Executive's Digest, July 1995, pp 14-26.
S

VOLUME NO. 2 (2012), ISSUE NO. 12 (DECEMBER) ISSN 2231-1009
INTERNATIONAL JOURNAL OF RESEARCH IN COMPUTER APPLICATION & MANAGEMENT A Monthly Double-Blind Peer Reviewed (Refereed/Juried) Open Access International e-Journal - Included in the International Serial Directories
http://ijrcm.org.in/
130
Stephen (2008) identified the attributes that passengers use to evaluate the service quality of Indian Railways as reliability, assurance, empathy, tangibles, and responsiveness. It was found that passengers were “moderately satisfied” to “satisfied” on these dimensions. Basis the findings of the above review of literature, in the present research the heterogeneous service contexts are taken for developing a sound theoretical base and for identifying major common attributes of service quality irrespective of the context as well as within the context.
NEED/IMPORTANCE OF THE STUDY If rail travel is to become the mode of choice over air and road, rather than a forced sale, passengers will demand much higher levels of comfort, convenience and environment from their station facilities which gives them the first impression and research also confirms the importance of first impressions. Consumer Research can help to identify the consumer priorities for station upgrading. Indian Railways is the largest rail network in Asia and the world’s second largest under one management. It is a multi-gauge, multi-traction system covering 108,706 kilometers, with 6,853 stations across the length and breadth of the country. It runs over 11,000 trains, of which more than 7,000 are passenger trains that carry about 13 million passengers every day. It is the largest employer in the organized sector in India, with a workforce of approximately 1.54 million. (www.indianrailway.gov.in). Indian Railways is divided into 17 zones for facilitating smooth administration and the East Coast Railways is one of them headquartered at Bhubaneswar and its network extends over a large area of eastern India, covering the states of Andhra Pradesh, Jharkhand, Odisha and West Bengal. The major mode of transport in the country is Indian Railways for passengers as well as freight due to its large network, number of trains, and affordability. It is the only player; a monopoly on the industry front. The majority of its customers are illiterate / semi educated and low/middle income with no/low consciousness for quality aspects of service on the market front. The Indian Railways provide its customers a convenient, accessible, and affordable mode of transportation. The monopoly structure of Indian Railways has created a typical situation for it with the characteristics of the market of zero competition and hence Indian Railways can afford to ignore aspects such as quality of service, customer satisfaction, and product promotion. The Indian Railways is the lifeline of Indian economy and society, but it is far from healthy and satisfactory. Rather than to study the technical and engineering aspects of the railway the focus of this paper is to study and analyze the managerial aspects of services at the platforms of Indian Railways, specifically the East Coast Railways. There are many research scholars who have undertaken studies on various aspects of railway services, but platforms have failed to attract their attention. Railway platforms are an important part of the railway system. Waiting at a platform may range from 15 minutes to several hours (especially in the Indian context, where late running of trains is normal) to wait for a connecting train or due to late running of a train. There are various angles to this situation, but in this paper the premise is that passengers necessarily have to use platform services, and their agony may be mitigated by making their stay at the platforms more comfortable. Hence, a study has been attempted to measure the customer satisfaction in the context of railway platforms of Indian Railways, with special reference to platforms in the East Coast Railways.
RESEARCH OBJECTIVES The research was aimed at finding out the following: 1. To identify the indicators of service quality of Indian Railway platforms that lead to customer satisfaction. 2. To measure the customer perception towards the quality of services of Indian Railway platforms.
RESEARCH METHODOLOGY A survey instrument in the form of closed-ended questionnaire was developed for collecting the main data for the study. A five- point Likert scale ranging from “least satisfied” to “most satisfied” was used to measure user satisfaction level. A Likert scale was used because it allowed the researchers to quantify opinion-based items, and a scale with balanced keying (an equal number of positive and negative statements) could obviate the problem of acquiescence bias. At the initial stage of developing the research instruments, a series of discussions were carried out with the senior academicians in the field of business management employed in the institutions located in the region. Then the questionnaire was circulated among the respondents of the pilot study consisting of 60 samples (they are not included in the main study) to get their opinion on the relevant parameters to be incorporated in the questionnaire. This pilot study was conducted solely at the railway platform of Sambalpur among the regular visitors of this platform. After the questionnaire became fully ready the samples for the main study was initiated to be collected. Choosing the method of personal interview for data collection during the survey has enabled the interviewer not only to screen the eligibility of the respondents but also to assist the respondents when they find difficulty in understanding any of the questions in the questionnaire. The questionnaire contains question on 17 parameters of service quality of railway platforms. The universe in this case is defined as the entire population of the country and foreign nationals visiting India. Hence, a definite, statistically-sound sample was not feasible. Convenience sampling was used for the purpose of the survey, and a research sample was taken to measure customer perception. The survey was carried out on different days in the month of May/June 2012 at seven major railway platforms of East Coast Railways i.e. Balasore (N=46), Bargarh (N=50), Bhubaneswar (N=58), Berhampur (N=50), Bolangir (N=33), Jharsuguda (N=50), Sambalpur (N=50). A total of 337 passengers were contacted. This was simply a research sample and may not truly represent the entire user population; however, the test of significance has been done and shows that the sample size would not affect the results. The table in Annexure I and II shows the demographic profile of the sample.
RESEARCH HYPOTHESES Based on the extant literature and the objectives of the study, the null hypotheses are framed. As service quality is expected to be different based on the platform in which it is going to be measured, hence the hypothesis is developed to measure the overall difference in the perception of travellers on various dimensions of service quality at different platforms of east-coast railways. The null and alternative hypotheses framed for the study are listed below: Null Hypothesis: H0 = Significant differences do not exist in the perceptions regarding factors of service quality of railway platforms of east coast railways based on their location Alternative Hypothesis: H1 = Significant differences exist in the perceptions regarding factors of service quality of railway platforms of east coast railways based on their location Since most of the theoretical distributions in statistics like Binomial, Poisson, Beta, Gamma, t, F, X2, etc. do conform to Normal Distribution asymptotically, the present paper has used the Normal Test of Significance for large sample (Gupta. S. C.; 2009). However, for samples usually less than 30, the exact sample test statistics are applied. In the present study since the sample size is more than 30 for each of the platforms covered, the large sample test is done by using the standard normal variate test (i.e. Z Test). Calculations of descriptive statistics like mean values and standard deviations and testing of hypothesis are conducted using Microsoft Excel. The factor analysis is done with the help of Statistical Package for Social Sciences (SPSS) on the cross-sectional data comprising 17 parameters of service quality of railway platforms.
RESULTS AND DISCUSSIONS The 17 item service quality instrument for the railway platforms prepared and administered in the present study helped to understand the perceived level of service delivery of the platforms basis the various factors. The mean scores of each variable in the instrument could theoretically range from 1 to 5. The mean scores are given in Table – I. As per the travellers’ perceptions, the top three important factors contributing to their satisfaction are, “Clarity of announcement in the platform”, “Accuracy of announcements in the platform” and “Frequency of announcements in the platform” holding the 1st (mean value = 3.4, score = 68.4), 2nd (mean value = 3.2, score = 64.2) and 3rd (mean value = 3.2, score = 64.2) rank in the race respectively. However, there are some other factors which do not score that much: “Security of luggage in the platform”, “Quality of refreshments in the platform” and “Affordability of refreshments in the platform” with their individual mean values of 2.4 (score = 48.3), 2.5 (score = 50.0) and 2.5 (score = 50.3) respectively.
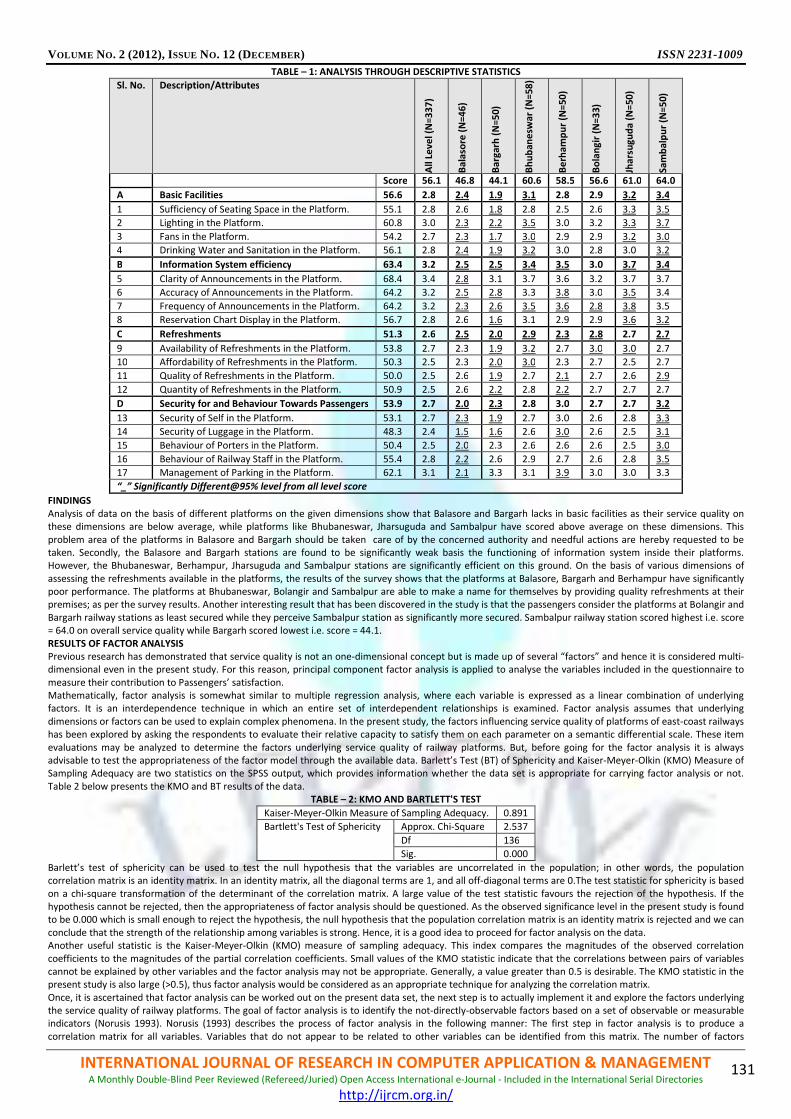
VOLUME NO. 2 (2012), ISSUE NO. 12 (DECEMBER) ISSN 2231-1009
INTERNATIONAL JOURNAL OF RESEARCH IN COMPUTER APPLICATION & MANAGEMENT A Monthly Double-Blind Peer Reviewed (Refereed/Juried) Open Access International e-Journal - Included in the International Serial Directories
http://ijrcm.org.in/
131
TABLE – 1: ANALYSIS THROUGH DESCRIPTIVE STATISTICS
Sl. No. Description/Attributes
All
Leve
l (N
=33
7)
Bal
aso
re (
N=4
6)
Bar
garh
(N
=50)
Bh
ub
ane
swar
(N
=58
)
Be
rham
pu
r (N
=50
)
Bo
lan
gir
(N=3
3)
Jhar
sugu
da
(N=5
0)
Sam
bal
pu
r (N
=50)
Score 56.1 46.8 44.1 60.6 58.5 56.6 61.0 64.0
A Basic Facilities 56.6 2.8 2.4 1.9 3.1 2.8 2.9 3.2 3.4
1 Sufficiency of Seating Space in the Platform. 55.1 2.8 2.6 1.8 2.8 2.5 2.6 3.3 3.5
2 Lighting in the Platform. 60.8 3.0 2.3 2.2 3.5 3.0 3.2 3.3 3.7
3 Fans in the Platform. 54.2 2.7 2.3 1.7 3.0 2.9 2.9 3.2 3.0
4 Drinking Water and Sanitation in the Platform. 56.1 2.8 2.4 1.9 3.2 3.0 2.8 3.0 3.2
B Information System efficiency 63.4 3.2 2.5 2.5 3.4 3.5 3.0 3.7 3.4
5 Clarity of Announcements in the Platform. 68.4 3.4 2.8 3.1 3.7 3.6 3.2 3.7 3.7
6 Accuracy of Announcements in the Platform. 64.2 3.2 2.5 2.8 3.3 3.8 3.0 3.5 3.4
7 Frequency of Announcements in the Platform. 64.2 3.2 2.3 2.6 3.5 3.6 2.8 3.8 3.5
8 Reservation Chart Display in the Platform. 56.7 2.8 2.6 1.6 3.1 2.9 2.9 3.6 3.2
C Refreshments 51.3 2.6 2.5 2.0 2.9 2.3 2.8 2.7 2.7
9 Availability of Refreshments in the Platform. 53.8 2.7 2.3 1.9 3.2 2.7 3.0 3.0 2.7
10 Affordability of Refreshments in the Platform. 50.3 2.5 2.3 2.0 3.0 2.3 2.7 2.5 2.7
11 Quality of Refreshments in the Platform. 50.0 2.5 2.6 1.9 2.7 2.1 2.7 2.6 2.9
12 Quantity of Refreshments in the Platform. 50.9 2.5 2.6 2.2 2.8 2.2 2.7 2.7 2.7
D Security for and Behaviour Towards Passengers 53.9 2.7 2.0 2.3 2.8 3.0 2.7 2.7 3.2
13 Security of Self in the Platform. 53.1 2.7 2.3 1.9 2.7 3.0 2.6 2.8 3.3
14 Security of Luggage in the Platform. 48.3 2.4 1.5 1.6 2.6 3.0 2.6 2.5 3.1
15 Behaviour of Porters in the Platform. 50.4 2.5 2.0 2.3 2.6 2.6 2.6 2.5 3.0
16 Behaviour of Railway Staff in the Platform. 55.4 2.8 2.2 2.6 2.9 2.7 2.6 2.8 3.5
17 Management of Parking in the Platform. 62.1 3.1 2.1 3.3 3.1 3.9 3.0 3.0 3.3
“_” Significantly Different@95% level from all level score
FINDINGS Analysis of data on the basis of different platforms on the given dimensions show that Balasore and Bargarh lacks in basic facilities as their service quality on these dimensions are below average, while platforms like Bhubaneswar, Jharsuguda and Sambalpur have scored above average on these dimensions. This problem area of the platforms in Balasore and Bargarh should be taken care of by the concerned authority and needful actions are hereby requested to be taken. Secondly, the Balasore and Bargarh stations are found to be significantly weak basis the functioning of information system inside their platforms. However, the Bhubaneswar, Berhampur, Jharsuguda and Sambalpur stations are significantly efficient on this ground. On the basis of various dimensions of assessing the refreshments available in the platforms, the results of the survey shows that the platforms at Balasore, Bargarh and Berhampur have significantly poor performance. The platforms at Bhubaneswar, Bolangir and Sambalpur are able to make a name for themselves by providing quality refreshments at their premises; as per the survey results. Another interesting result that has been discovered in the study is that the passengers consider the platforms at Bolangir and Bargarh railway stations as least secured while they perceive Sambalpur station as significantly more secured. Sambalpur railway station scored highest i.e. score = 64.0 on overall service quality while Bargarh scored lowest i.e. score = 44.1. RESULTS OF FACTOR ANALYSIS Previous research has demonstrated that service quality is not an one-dimensional concept but is made up of several “factors” and hence it is considered multi-dimensional even in the present study. For this reason, principal component factor analysis is applied to analyse the variables included in the questionnaire to measure their contribution to Passengers’ satisfaction. Mathematically, factor analysis is somewhat similar to multiple regression analysis, where each variable is expressed as a linear combination of underlying factors. It is an interdependence technique in which an entire set of interdependent relationships is examined. Factor analysis assumes that underlying dimensions or factors can be used to explain complex phenomena. In the present study, the factors influencing service quality of platforms of east-coast railways has been explored by asking the respondents to evaluate their relative capacity to satisfy them on each parameter on a semantic differential scale. These item evaluations may be analyzed to determine the factors underlying service quality of railway platforms. But, before going for the factor analysis it is always advisable to test the appropriateness of the factor model through the available data. Barlett’s Test (BT) of Sphericity and Kaiser-Meyer-Olkin (KMO) Measure of Sampling Adequacy are two statistics on the SPSS output, which provides information whether the data set is appropriate for carrying factor analysis or not. Table 2 below presents the KMO and BT results of the data.
TABLE – 2: KMO AND BARTLETT'S TEST
Kaiser-Meyer-Olkin Measure of Sampling Adequacy. 0.891
Bartlett's Test of Sphericity Approx. Chi-Square 2.537
Df 136
Sig. 0.000
Barlett’s test of sphericity can be used to test the null hypothesis that the variables are uncorrelated in the population; in other words, the population correlation matrix is an identity matrix. In an identity matrix, all the diagonal terms are 1, and all off-diagonal terms are 0.The test statistic for sphericity is based on a chi-square transformation of the determinant of the correlation matrix. A large value of the test statistic favours the rejection of the hypothesis. If the hypothesis cannot be rejected, then the appropriateness of factor analysis should be questioned. As the observed significance level in the present study is found to be 0.000 which is small enough to reject the hypothesis, the null hypothesis that the population correlation matrix is an identity matrix is rejected and we can conclude that the strength of the relationship among variables is strong. Hence, it is a good idea to proceed for factor analysis on the data. Another useful statistic is the Kaiser-Meyer-Olkin (KMO) measure of sampling adequacy. This index compares the magnitudes of the observed correlation coefficients to the magnitudes of the partial correlation coefficients. Small values of the KMO statistic indicate that the correlations between pairs of variables cannot be explained by other variables and the factor analysis may not be appropriate. Generally, a value greater than 0.5 is desirable. The KMO statistic in the present study is also large (>0.5), thus factor analysis would be considered as an appropriate technique for analyzing the correlation matrix. Once, it is ascertained that factor analysis can be worked out on the present data set, the next step is to actually implement it and explore the factors underlying the service quality of railway platforms. The goal of factor analysis is to identify the not-directly-observable factors based on a set of observable or measurable indicators (Norusis 1993). Norusis (1993) describes the process of factor analysis in the following manner: The first step in factor analysis is to produce a correlation matrix for all variables. Variables that do not appear to be related to other variables can be identified from this matrix. The number of factors

VOLUME NO. 2 (2012), ISSUE NO. 12 (DECEMBER) ISSN 2231-1009
INTERNATIONAL JOURNAL OF RESEARCH IN COMPUTER APPLICATION & MANAGEMENT A Monthly Double-Blind Peer Reviewed (Refereed/Juried) Open Access International e-Journal - Included in the International Serial Directories
http://ijrcm.org.in/
132
necessary to represent the data and the method for calculating them must then be determined. Principal components analysis is one method of extracting factors. In principal components analysis, linear combinations of variables are formed. The first principal component is that which accounts for the largest amount of variance in the sample, the second principal component is that which accounts for the next largest amount of variance and is uncorrelated with the first and so on. At this step it is also necessary to ascertain how well the model fits the data. Coefficients (factor loadings), that relate variables to the identified factors, are calculated. In order for a parameter to belong to a given factor it is recommended that the loading value be not less than 0.40. The factor model is then rotated to transform the factors and make them more interpretable. The rotation phase transforms a factor matrix in which most factors are correlated with many variables into one in which each factor has non-zero loadings for only some of the variables. The most commonly used method for rotation is varimax rotation which seeks to minimise the number of variables that have high loadings on a factor thus permitting the factors to be differentiated from one another. Following rotation, scores for each factor can be computed for each case in a sample. These scores can then be used in further data analysis, such as analysis of variance, correlation and regression analysis. The results of the factor analysis of the service quality variables of railway platforms are shown in Table 3.
TABLE – 3: RESULTS OF FACTOR ANALYSIS: THE ROTATED COMPONENT MATRIX
Components
Dimensions/Attributes 1 2 3 4
1 Basic Facilities Sufficiency of Seating Space in the Platform. 0.722 0.172 0.082 0.244
2 Lighting in the Platform. 0.759 0.205 0.176 0.201
3 Fans in the Platform. 0.792 0.202 0.135 0.097
4 Drinking Water and Sanitation in the Platform. 0.653 0.125 0.26 0.272
5 Information System efficiency Clarity of Announcements in the Platform. 0.202 0.14 0.225 0.791
6 Accuracy of Announcements in the Platform. 0.205 0.026 0.213 0.84
7 Frequency of Announcements in the Platform. 0.203 0.184 0.178 0.797
8 Reservation Chart Display in the Platform. 0.268 0.4 0.112 0.404
9 Refreshments Availability of Refreshments in the Platform. 0.361 0.585 0.194 0.152
10 Affordability of Refreshments in the Platform. 0.187 0.777 0.129 0.109
11 Quality of Refreshments in the Platform. 0.176 0.771 0.209 0.087
12 Quantity of Refreshments in the Platform. 0.058 0.801 0.102 0.077
13 Security For and Behaviour Towards Passengers Security of Self in the Platform. 0.371 0.414 0.484 0.108
14 Security of Luggage in the Platform. 0.377 0.297 0.621 0.049
15 Behaviour of Porters in the Platform. 0.123 0.163 0.734 0.17
16 Behaviour of Railway Staff in the Platform. 0.116 0.171 0.709 0.171
17 Management of Parking in the Platform. 0.081 0.031 0.718 0.248
Extraction Method: Principal Component Analysis.
Rotation Method: Varimax with Kaiser Normalization.
a. Rotation converged in 7 iterations.
Table 3 above provides the factorial structure of the behaviour of the variables in the sample. In the present sample, a forced four-factor model of service quality of railway platforms has explained 63.249% of the variance. Based on the factor loadings, the variables of service quality of railway platforms in the present study can be compressed to four important factors and on the basis of the nature of variables included in different factors, it can be designated as basic facilities, information system efficiency, refreshments and security for and behaviour towards passengers. The first factor i.e. basic facilities explaining 39.363% of variance includes a total of four variables such as Sufficiency of Seating Space in the Platform, Lighting in the Platform, Fans in the Platform, Drinking Water and Sanitation in the Platform. This is probably because when first the individual brings himself to the railway platform a set of expectations about the arrangements of basic facilities exists within him. Therefore, the basic facilities inside the platforms which is simply a framework for meeting a set of expectations of someone or a group of consumers need for quality service has come up as the most vital factor in bringing satisfaction among them. The second factor i.e. refreshments explaining 9.783% of variance includes variables like Availability of Refreshments in the Platform, Affordability of Refreshments in the Platform, Quality of Refreshments in the Platform, Quantity of Refreshments in the Platform. It is understandable as it is evident that every railway passenger whether travelling distant or nearby destinations waits in the platforms for catching the desired train and during that time period to satisfy hunger, quality refreshments are most needed else he will be frustrated. The third factor i.e. Security For and Behaviour Towards Passengers explaining 7.577% of variance includes variables like Security of Self in the Platform, Security of Luggage in the Platform, Behaviour of Porters in the Platform, Behaviour of Railway Staff in the Platform, Management of Parking in the Platform Further, the fourth factor i.e. information system efficiency explaining 6.526% of variance includes another four variables which are Clarity of Announcements in the Platform, Accuracy of Announcements in the Platform, Frequency of Announcements in the Platform, Reservation Chart Display in the Platform. Hence, to summarize the results of factor analysis, it can be said that on the passengers’ place there are different degrees of priorities to the variables associated with their satisfaction towards the service quality of railway platforms which can be divided into four major categories based on the factors described by the analysis as; basic facilities, refreshments, security for and behaviour towards passengers and information system efficiency.
RECOMMENDATIONS/SUGGESTIONS AND CONCLUSION What this article is shooting for is to bring a solid understanding of what passengers of east coast railways need in order to achieve satisfaction from the railway platforms of the zone and what the service provider (east-coast railways) can do to help them achieve that. The findings of the survey unveils a lot of “basic truths” about the passengers’ perceptions that incorporates the principles of service quality of railway platforms. According to the consumers in order of preference, the four factors influencing service quality of railway platforms are basic facilities, refreshments, security for and behaviour towards passengers and information system efficiency. Since, when it comes to service quality railway platforms, finding out what service quality means to the passengers is critical for the railway policy to be successful, the management of the service provider is hereby suggested to take into account the above mentioned factors on priority basis in formulating policies. Secondly, the service provider should also track the effectiveness of these policies from time to time and the only way to know what customers want is to ask them. Hence, getting direct customer feedback is the only best known way for accomplishing this task. If the service provider have to allocate the budget and also make alteration in the expenditures for uplifting service quality of platforms, in that case it is recommended to first have a thorough understanding of what passengers value the most, and the least, to minimize any harm to their morale.
CONCLUSION This research has helped identify the broad dimensions which are used by customers in evaluating the service quality of railway platforms. This study has identified the actual determinants of customer satisfaction with quality of service provided on railway platforms. In this respect, this paper suggests certain policy implications for Indian Railways. The proposed model of customer satisfaction may be used as a basis to plan efforts towards increasing customer satisfaction at the railway platforms of east coast railways by the service provider.

VOLUME NO. 2 (2012), ISSUE NO. 12 (DECEMBER) ISSN 2231-1009
INTERNATIONAL JOURNAL OF RESEARCH IN COMPUTER APPLICATION & MANAGEMENT A Monthly Double-Blind Peer Reviewed (Refereed/Juried) Open Access International e-Journal - Included in the International Serial Directories
http://ijrcm.org.in/
133
SCOPE FOR FURTHER RESEARCH Finally, the present research work is an attempt to contribute to theoretically available literature while also proposing a tool for managers of railway platforms in east coast railways that can be used for monitoring and improvement of service quality from customers’ perceptions. It is hoped that the availability of this instrument would stimulate further research focusing on service quality at other railway platforms as well and its impact on customer satisfaction.
REFERENCES 1. Berry, L L (1980). "Service Marketing is Different," Business, Vol 30, May-June, (pp. 24-29). 2. Carman, J M (1990). “Consumer Perceptions of Service Quality: An Assessment of the SERVQUAL Dimensions”, Journal of Retailing, 66(1), (pp. 33-55). 3. Collier, D A (1987). Service Management: Operating Decisions,Englewood Cliffs, NJ: Prentice-Hall. 4. Eboli, L., and G. Mazzulla. (2007). “Service Quality Attributes Affecting Customer Satisfaction for Bus Transit”. Journal of Public Transportation 10 (3), (pp.
21-34). 5. Geetika, Shefali Nandan (2010). “Determinants of Customer Satisfaction on Service Quality: A Study of Railway Platforms of India”, Journal of Public
Transportation, Vol. 13, No. 1, 2010 6. Grönroos, C (1984). “A Service Quality Model and its Market Implications”, European Journal of Marketing, 18(4), (pp. 36-44). 7. Gupta, S.C. (2011). “Fundamentals of Statistics”, Himalaya Publishing House, Mumbai. 8. Malhotra, N.K. (2005). “Marketing Research - An Applied Orientation”, 5th Edition, Pearson Education Inc. 9. Nunnally, J C (1978). “Psychometric Theory”, New York: McGraw-Hill. 10. Parasuraman, A; Zeithaml, V A and Berry, L (1985), "A Conceptual Model of Service Quality and its Implications for Future Research," Journal of Marketing,
Fall, (pp. 41-50). 11. Parasuraman, A; Zeithaml, V A and Berry, L L (1985). “A Conceptual Model of Service Quality and its Implications for Future Research”, Journal of
Marketing, 49(4), (pp. 41-50). 12. Parasuraman, A; Zeithaml, V A and Berry, L L (1988). “SERVQUAL: A Multiple-item Scale for Measuring Consumer Perceptions of Service Quality”, Journal of
Retailing, 64(1), (pp. 12-40). 13. Vanniarajan, T., and A. Stephen. (2008). “Railqual and Passenger Satisfaction: An Empirical Study in Southern Railways”, Asia Pacific Business Review IV(1),
January- March, (pp. 64-75).
ANNEXURE ANNEXURE – I: DEMOGRAPHIC PROFILE OF RESPONDENTS
Respondents' Characteristics % of Respondents (Base : All Respondents = 337)
Gender
Male 90% (302)
Female 10% (35)
Age
< than 35 Years 64% (216)
> than 35 Years 36% (121)
Monthly Household Income (MHI)
< than 20,000 54% (184)
> than 20,000 36% (123)
Education
Graduates 56% (189)
Post Graduates 44% (148)
ANNEXURE – II: PLATFORM-WISE COVERAGE OF SAMPLE
Railway Platforms % of Respondents (Base : All Respondents = 337)
Balasore 14% (46)
Bargarh 14% (50)
Bhubaneswar 17% (58)
Berhampur 15% (50)
Bolangir 10% (33)
Jharsuguda 15% (50)
Sambalpur 15% (50)

VOLUME NO. 2 (2012), ISSUE NO. 12 (DECEMBER) ISSN 2231-1009
INTERNATIONAL JOURNAL OF RESEARCH IN COMPUTER APPLICATION & MANAGEMENT A Monthly Double-Blind Peer Reviewed (Refereed/Juried) Open Access International e-Journal - Included in the International Serial Directories
http://ijrcm.org.in/
134
ANNEXURE – III: TOTAL VARIANCE EXPLAINED
Co
mp
on
ent
Init
ial E
igen
valu
es
Extr
acti
on
Su
ms
of
Squ
ared
Lo
adin
gs
Ro
tati
on
Su
ms
of
Squ
ared
Load
ings
Tota
l
% o
f V
aria
nce
Cu
mu
lati
ve %
Tota
l
% o
f V
aria
nce
Cu
mu
lati
ve %
Tota
l
% o
f V
aria
nce
Cu
mu
lati
ve %
1 6.692 39.363 39.363 6.692 39.363 39.363 2.861 16.832 16.832
2 1.663 9.783 49.146 1.663 9.783 49.146 2.849 16.756 33.588
3 1.288 7.577 56.723 1.288 7.577 56.723 2.548 14.989 48.578
4 1.109 6.526 63.249 1.109 6.526 63.249 2.494 14.671 63.249
5 0.853 5.017 68.266
6 0.768 4.518 72.784
7 0.661 3.891 76.675
8 0.59 3.473 80.148
9 0.525 3.088 83.236
10 0.48 2.822 86.058
11 0.439 2.585 88.643
12 0.426 2.505 91.148
13 0.345 2.032 93.18
14 0.326 1.916 95.096
15 0.319 1.877 96.972
16 0.279 1.642 98.614
17 0.236 1.386 100
Extraction Method: Principal Component Analysis.

VOLUME NO. 2 (2012), ISSUE NO. 12 (DECEMBER) ISSN 2231-1009
INTERNATIONAL JOURNAL OF RESEARCH IN COMPUTER APPLICATION & MANAGEMENT A Monthly Double-Blind Peer Reviewed (Refereed/Juried) Open Access International e-Journal - Included in the International Serial Directories
http://ijrcm.org.in/
135
A COMPARATIVE STUDY OF FINANCIAL STATEMENT OF DISTRICT CO-OPERATIVE DAIRIES OF NORTH GUJARAT
PATEL RAJESHKUMAR G.
LECTURER
SMT.S.B.PATEL INSTITUTE OF BUSINESS MANAGEMENT
VISNAGAR
PRAJAPATI RASIKBHAI I.
LECTURER
SMT.S.B.PATEL INSTITUTE OF BUSINESS MANAGEMENT
VISNAGAR
PATEL NITINKUMAR P.
LECTURER
SMT.S.B.PATEL INSTITUTE OF BUSINESS MANAGEMENT
VISNAGAR
ABSTRACT
District co-operative dairies play very imperative role for enhancing economic growth and promoting equitable regional development. In North Gujarat region of
the Gujarat state, there is a considerable development of co-operative dairies like The Mehsana District Milk Producers Union Ltd. ( Dudh Sagar Dairy), The
Banaskantha District Milk Producers Union Ltd.(Banas Dairy) etc. All these co-operative dairies are working under the guidelines of GCMMF (Gujarat Co-
Operative Milk Marketing Federation). These dairies are not only providing the livelihood to farmers, employment to people but continuously provides milk and
milk related products to Gujarat state and neighboring states. A financial statement furnish information pertaining to strength of particular dairy so here we, as a
researchers, have made sincere efforts to measure the financial position of each co-operative by applying different methods of analysis like comparative
statement, common size statement, trend percentage, statement of change in working capital, cash flow statement, ratio analysis etc.
KEYWORDS Ratio, Co- operative Union, Dairy.
INTRODUCTION n India Dairy Business has been practiced as rural cottage industry over the last couple of the years. Semi-commercial dairy started with the establishment of military dairy farms and co-operative milk unions throughout the country towards the end of the 19th century. Since Independence this Industry has made rapid progress. A large number of modern milk and milk product factories have since been established. The organized dairies in India have been
successfully engaged in the routine commercial production of pasteurized bottled milk for Indian dairy products. This is not a small achievement when we consider the fact that dairying in India is largely stringent that farmers in general keep dairy animals in proportion to their free crop and also are available for family labor with little or no purchased inputs and a minimum of marketed outputs. The existence of restrictive trade policy milk in the Diary Industry and the emergence of Amul type cooperatives have changed the dairy farming practices in the country. In India milk production is dominated by small and marginal land-holding farmers and also by landless laborers. Crop production of the agricultural land still depends on rain, which is prone to both drought and floods, rendering agricultural income is very much uncertain for most of the farmers. Dairying, as a subsidiary source of income and occupation, is real relief to most of the farmers in the society. Usually one or two milk animals enable the farmers to generate sufficient income to break the vicious subsistence agricultural-debt cycle.
DAIRY DEVELOPMENT IN INDIA The dairy cooperative movement has been central to the development of dairying in India. The inspiration for this movement was the success of the Khaira (Kheda) District Cooperative Milk Producers’ Union -- better known as Amul. Founded in 1946 in response to the exploitation of district’s dairy farmers, Amul grew rapidly from its initial base of two societies and two hundred liters of milk. That growth, however, posed a challenge that threatened its existence: flush season production of milk exceeded the demand. Yet the cooperative’s success depended on accepting the farmers’ milk year round. At that time the advanced dairying nations conserved milk by conversion into powder and butter. This could either be sold as products, or combined with fluid milk to extend the supply during the lean season when demand outstripped production. Experts from the North pronounced buffalo milk as unsuitable for conversion into powder. It couldn’t be done, they said. This provided the opportunity for the first major Indian scientific and technological breakthrough.
OBJECTIVES OF THE STUDY The objective of the research work is to do comparative study of the co-operative milk producers’ unions which are lying in the north Gujarat region as far as their Profitability, Liquidity, Efficiency/Activity is concerned.
RESEARCH METHODOLOGY To undertake the study researchers have collected secondary data from the annual report during the period from 2006 to 2011 of selected dairies of the north Gujarat region. Moreover other required information were collected through referring Financial literatures, published articles, related websites, magazines, journals etc. In this study work following dairies have been as sample of study. 1. The Mehsana District Co-operative milk producers’ Union Ltd, (Dudh Sagar dairy) Mehsana. 2. The Sabarkantha District Co-operative milk producers’ Union Ltd, (Sabar dairy) Himatnagar. 3. The Banaskantha District Co-operative milk producers’ Union Ltd, (Banas dairy) Palanpur. According to the objectives researcher has applied the necessary statistical tools like, average mean, percentage, ratio and graphic presentation of data, ANOVA test.
I

VOLUME NO. 2 (2012), ISSUE NO. 12 (DECEMBER) ISSN 2231-1009
INTERNATIONAL JOURNAL OF RESEARCH IN COMPUTER APPLICATION & MANAGEMENT A Monthly Double-Blind Peer Reviewed (Refereed/Juried) Open Access International e-Journal - Included in the International Serial Directories
http://ijrcm.org.in/
136
0.00%5.00%
10.00%15.00%20.00%25.00%30.00%35.00%40.00%
20
06
-07
20
07
-08
20
08
-09
20
09
-10
20
10
-11
Axi
s T
itle
Chart showing GP ratio
Dudhsagar dairy
Sabar dairy
Banas dairy
0.00%0.10%0.20%0.30%0.40%0.50%0.60%0.70%0.80%
Axi
s T
itle
Net Profit Ratio
Dudhsagar dairy
Sabar dairy
Banas dairy
ANALYSIS
• GROSS PROFIT RATIO A Gross Profit ratio is the indicator of the performance of the organization. A high ratio of gross profit is a sign of good management as it implies that the cost of production of the firm is relatively low and low Gross Profit Ratio shows the organization health is not good. It requires more concentration on the organization condition. Table-1 shows the Gross Profit of the selected three dairies from 2006 to 2012.
TABLE 1: GROSS PROFIT RATIO
Name of dairy 2006-07 2007-08 2008-09 2009-10 2010-11 Average
Dudhsagar dairy 26.95% 27.05% 29.24% 31.79% 33.55% 29.72%
Sabar dairy 16.18% 14.64% 13.61% 12.46% 13.20% 14.02%
Banas dairy 16.25% 14.73% 15.99% 13.31% 13.58% 14.77%
Source: Computed from published Annual report of the units
GRAPH -1 Above graph shows that the Gross Profit ratio of the Dudhsagar Dairy is more than the other two selected dairy. moreover it reflect that the GP ratio of the Dudhsagar dairy is consistently increasing while GP ratio line of the SABAR dairy and BANAS dairy is falling down year by year. The gross profit ratio of Dudhsagar dairy is increased because sales increased by higher rate as compare to purchase expenses.
• NET PROFIT RATIO The Net Profit Margin is indicative of management’s ability to operate the business with sufficient success not only to recover from revenues of the period, the cost of merchandise or services, the expenses of operating the business (including depreciation) and the cost of the borrowed funds but also to leave a margins of reasonable compensation to the owners for providing their capital at risk. The ratio of the net profit (after interest and taxes) to sales essentially expresses the cost price effectiveness of the operations.
TABLE 2: NET PROFIT RATIO
Name of dairy 2006-07 2007-08 2008-09 2009-10 2010-11 Average
Dudhsagar dairy 0.30% 0.24% 0.21% 0.31% 0.41% 0.29%
Sabar dairy 0.48% 0.43% 0.33% 0.45% 0.52% 0.44%
Banas dairy 0.73% 0.68% 0.58% 0.72% 0.67% 0.68%
Source: Computed from published Annual report of the units
GRAPH -2
Above table-3 indicates that the net profit ratio for all successive years for the Banas Dairy is quite higher than the Net Profit Ratio of Sabar dairy and Duth sagar dairy which is completely inversely behaving to the Gross Profit ratio of the same dairy. It means Banas Dairy has adequate return to the owners to withstand adverse economic conditions However; a firm with a low profit margin can earn a high rate of return on investments if it has a higher inventory turnover.
• RETURN ON TOTAL ASSETS RATIO The ROA measures the profitability of the total funds/ investments of a firm. It shows the efficiency of management of using the assets.

VOLUME NO. 2 (2012), ISSUE NO. 12 (DECEMBER) ISSN 2231-1009
INTERNATIONAL JOURNAL OF RESEARCH IN COMPUTER APPLICATION & MANAGEMENT A Monthly Double-Blind Peer Reviewed (Refereed/Juried) Open Access International e-Journal - Included in the International Serial Directories
http://ijrcm.org.in/
137
TABLE 3: RETURN ON TOTAL ASSETS RATIO
Name of dairy 2006-07 2007-08 2008-09 2009-10 2010-11 Average
Dudhsagar dairy 0.84% 0.85% 0.37% 0.44% 0.54% 0.58%
Sabar dairy 2.52% 1.99% 1.10% 1.13% 0.91% 1.42%
Banas dairy 2.54% 1.84% 1.37% 1.60% 1.30% 1.68%
Source: Computed from published Annual report of the units From the above table-3, we can say that the Return on Total Assets Ratio of Banas Dairy is higher than the the Sabar dairy and Duth sagar Dairy. But among this the RTAR of Dudh sagar is very low. Hence we depicts that the overall management of the assets in the various field of dairy industry is good.
• RETURN ON CAPITAL EMPLOYED RATIO Below table it shows the return on capital employed ratio of the three selected dairies through year 2006 to 2011.
TABLE 4: RETURN ON CAPITAL EMPLOYED RATIO
Name of dairy 2006-07 2007-08 2008-09 2009-10 2010-11 Mean
Dudhsagar dairy 5.38% 5.12% 2.72% 2.51% 3.72% 3.71%
Sabar dairy 8.07% 9.32% 12.40% 14.71% 3.97% 8.86%
Banas dairy 11.72% 5.96% 6.72% 6.73% 6.96% 7.39%
Source: Computed from published Annual report of the units Here, average return on capital employed ratio of Sabar dairy is higher than the Dudh sagar and Banas Dairy. But return on capital ratio of Duth Sagar dairy is very low than the other two dairies. The return on capital employed ratio of Dudhsagar dairy is reduced because increased in capital employed by higher rate as compare to increase in EBIT. The capital employed of Dudhsagar dairy is increased because expansion of plant.
• RETURN ON SHAREHOLDERS’ FUND RATIO TABLE 5: RETURN ON SHAREHOLDERS’ FUND RATIO (RSFR)
Name of dairy 2006-07 2007-08 2008-09 2009-10 2010-11 Mean
Dudhsagar dairy 7.68% 7.07% 0.90% 1.39% 2.04% 2.68%
Sabar dairy 6.67% 6.73% 6.38% 9.30% 11.13% 7.84%
Banas dairy 13.99% 11.95% 12.08% 15.23% 14.53% 13.49%
Source: Computed from published Annual report of the units If we look at the above table, it depicts that continuously the Banas dairy have good return to their shareholders throughout the one decade than compared to the other two dairy. The Banas dairy PAT is increased by higher rate due to increased in sales by higher rate as compare to increase in total expenses. So, return on shareholders’ fund is increased. ANOVA TEST Ho: There is no any significant difference in Net Profit Ratio (NPR), Return on Total Assets Ratio (RTAR), Return On Capital Employed Ratio (RCER) and Return On Shareholders’ Fund Ratio (RSFR) of selected co-operative dairies.
TABLE-6: ANOVA TEST In the above ANOVA table-6, the two tailed significant test value for Net Profit Ratio (NPR) and Return on Shareholders’ Fund Ratio (RSFR) of selected co-operative dairies is 0.000. Hence, we may say that NPR and RSFR is significantly different between the selected dairie. While the return on shareholders’ fund ratio and Return On Capital Employed Ratio (RCER) is not significantally different. ANALYSIS OF ACTIVITY AND EFFICIENCY
TABLE – 7: AVERAGE RATIO
Name of dairy ITR TATR FATR CATR NWCTR
Dudhsagar dairy 8.86 Times 1.98 Times 6.55 Times 3.07 Times 5.15 Times
Sabar dairy 16.62 Times 3.26 Times 33.06 Times 3.69 Times 15.91 Times
Banas dairy 12.42 Times 2.49 Times 16.75 Times 2.99 Times 5.62 Times
1. Inventory (or Stock) Turnover Ratio: (ITR) Inventory Turnover ratio of Sabar dairy is (16.62 times) higher than the other two dairy which shows that the inventory management of Sabar dairy is quite more efficient than the other two dairies because less average stock. Here, Duthsagar Dairy ITR is very low (8.86times) which implies result of inferior quality goods, overvaluation of closing inventory, stock of obsolete goods and deliberate excessive purchases in anticipation of future increase in their prices and so on. Thus, a firm should have neither too high nor too low inventory turnover.
2. Total Assets Turnover Ratio (TATR) Total turnover ratio measures the efficiency of a firm in managing and utilizing its assets. The higher the turnover ratio, the more efficient is the management and utilization of the assets while low turnover ratios are indicative of underutilization of available resources and presence of idle capacity. In operational terms, it implies that the firm can expand its activity level (in terms production and sales) without requiring additional capital investments.
3. Fixed assets turnover ratio To ascertain the efficiency and profitability of business, the total assets are compared to sales. The more the sales in relation to the amount invested in fixed assets, the more efficient is the use of fixed assets. It indicates higher efficiency. If the sales are less as compared to investment in fixed assets, it means that the fixed assets are not adequately utilized by business. If this ratio is low, it indicates that investments in fixed assets is more than what is necessary and must be reduced. If this ratio is found to be higher, it means the fixed assets are being used effectively to earn profits in the business. It must however be remembered that the fixed assets shown in the denominator is their written down value and hence this ratio for a company using old machinery will have low value in denominator and therefore, its ratio will be high. While the written down value of a company with new machinery will be high and its ratio will, therefore, be low. This fact must be kept in mind while interpreting this ratio.
4. Current Assets Turnover Ratio(CATR) This ratio is determined to know how efficiently the current assets are used by business. Whether this ratio is satisfactory or not can be said only by comparing it with that of other firms in the same business. If the ratio is low, it indicates that current assets are not efficiently used by business and if the ratio is high, it indicates that current assets are efficiently used by business.
5. Net Working Capital Turnover Ratio (NWCTR): Net working capital means excess of current assets over current liabilities. Net working capital shows liquidity of enterprise. More the liquidity better is the capacity to repay current liabilities resulting into less risk. Thus, a higher net working capital turnover ratio shows better position. H06: There is no any significant difference in ITR, TATR, of selected co-operative dairies.
RATIO NPR RTAR RCER RSFR
Sig. (Two Tailed) .000 .010 .022 .000

VOLUME NO. 2 (2012), ISSUE NO. 12 (DECEMBER) ISSN 2231-1009
INTERNATIONAL JOURNAL OF RESEARCH IN COMPUTER APPLICATION & MANAGEMENT A Monthly Double-Blind Peer Reviewed (Refereed/Juried) Open Access International e-Journal - Included in the International Serial Directories
http://ijrcm.org.in/
138
TABLE – 8: ANOVA TEST
Ratio ITR TATR FATR CATR WCATR
sig. value .009 0.155 0.000 0.47 0.033
ANALYSIS OF LIQUIDITY INTRODUCTION Liquidity of business is one the key factors determining its propensity to succeed or fail. Both excess and shortage of liquidity affect the interest of the enterprise and on the profitability. If the enterprise is earning very low rate of return or incurring losses, there would be no funds generated by the operation of the enterprise which are essential to retire the debts. In fact there is a tangle between liquidity and profitability, which eventually determines the optimum level of investment in current assets. if the enterprise losses its face in the market wants or liquidity, it requires Herculean efforts to restore its position. Instances are not lacking of great industrial giants, with comfortable books profits coming to grief for want of liquidity.
TABLE-9
Mean
Name of dairy CR LR ATR
Dudhsagar dairy 2.65:1 1.75:1 0.97:1
Sabar dairy 1.53:1 1.41:1 0.70:1
Banas dairy 2.44:1 1.8:1 1.24:1
CURRENT RATIO (CR) This most widely used ratio shows the proportion of current assets to current liabilities. It is also known as ‘Working Capital Ratio’ as it is a measure of working capital available at a particular time. The ratio is obtained by dividing current assets by the current liabilities. It is measure of short-term financial strength of the business and shows whether the business will be able to meet its current liabilities, as and when they mature. Liability which will mature within a period of 12 months is a current liability. They include creditors, bills payable, bank overdraft, outstanding expenses, provision for taxation etc. Similarly, current assets are in the form of cash or can be readily converted into cash within a short time. They include cash, bank balance, stock, debtors, bills receivables, prepaid expenses, accrued income, readily marketable securities etc. LIQUID RATIO (LR) A variant of current ratio is the liquid ratio or quick ratio which is designed to show the amount of cash available to meet immediate payments. It is obtained by dividing the liquid assets by liquid liabilities. Liquid assets are obtained by deducting stock-in trade from current assets. Stock is not treated as a liquid asset because it cannot be readily converted into cash as and when required, the current ratio of a business does not reflect the true liquid position, if its current assets consist largely of stock-in-trade. The liquid liabilities are obtained by deducting bank overdraft from current liabilities. Bank overdraft is not included in liquid liabilities because bank overdraft is not likely to be called on demand and is treated as a sort of permanent mode of financing. Hence, it is not treated as a quick liability. ACID TEST RATIO (ATR) The measure of absolute liquidity may be obtained by comparing only cash and bank balance as well readily marketable securities with liquid liabilities. This is very exacting standard of liquidity value and it is satisfactory if the ratio is 0.5:1. It is computed by dividing the value of quick assets by liquid liabilities. Here, quick assets do not include both stock and debtors, because payments from debtors would not generally be received immediately when liquid liabilities are to be paid. Thus the quick assets comprise only cash balance, bank balance and readily marketable securities only. H0: There is no any significant difference in CR, LR and ATR of selected co-operative dairies.
TABLE- 10: ANOVA TEST
Ratio CR LR ATR
sig. value .396 .965 .986
5.2 SUGGESTIONS 1. The average processing expenses of Dudhsagr dairy is highest; it is higher than average processing expenses. Dudhsagar dairy has to reduce in processing
expenses by decreasing in depreciation expenses and transportation expenses. 2. The average marketing expense of Sabar dairy is highest; it is higher than average marketing expenses. Sabar dairy has to reduce in marketing expenses by
decreasing in packaging expenses. 3. The average office expense of Banas is highest; it is higher than average office expenses. Banas dairy has to reduce in office expenses by decreasing in co-
operative development expenses. 4. The Gross profit of Sabar dairy is lowest. Sabar dairy has to increase in gross profit by increasing in production of different product with better quality and
by decreasing in purchase expenses. 5. The net profit ratio of Dudhsagar dairy is lowest. Dudhsagar dairy has to increase I net profit by decreasing in processing expenses, marketing expenses and
financial expenses. 6. The return on total assets of Dudhsagar dairy is lowest, so for increasing it to increase in sales and increase in utilization of fixed assets. 7. The return on capital employed of Dudhsagar dairy is lowest, so for increasing it increase in sales. The return on shareholders’ fund of Dudhsagar dairy is
lowest, so for increasing it increase in sales.
REFERENCES BOOKS 1. “Business Statistics,” Sixth edition, B. S. Shah Prakashan, Year 2006-07, P. 403 to P. 411. 2. “Company Accounts,” Third edition, B.S. shah Prakashan, Year 2002-03, P. 341 to P. 407. 3. Khan M Y and Jain P K, “Financial Management,” Fourth edition, Tata Mcgraw Hill publishing company limited, Year 2004, P. 7.1 to P. 7.34. 4. Kothari C. R., “Research Methodology,” Second edition, New age international limited, Year 2004, P. 256 to P. 271. WEBSITES 5. AMUL Dairy : http://www.amul.com 6. Banas Dairy : http://www.banasdairy.coop 7. Department of Animal Husbandry, Dairying & Fisheries: http://www.dahd.nic.in 8. Dudhsagar Dairy Mehsana: http://www.dudhsagardairy.co.in 9. Gujarat Co-operative Milk Marketing Federation: http://www.amul.com/m/gcmmf 10. Indian Dairy Association : http://www.indairyasso.org 11. Information and Library Network: http://inflibnet.ac.in 12. Ministry Of Food Processing Industry: http://www.mofpi.nic.in 13. National Dairy Development Board: http://www.nddb.org

VOLUME NO. 2 (2012), ISSUE NO. 12 (DECEMBER) ISSN 2231-1009
INTERNATIONAL JOURNAL OF RESEARCH IN COMPUTER APPLICATION & MANAGEMENT A Monthly Double-Blind Peer Reviewed (Refereed/Juried) Open Access International e-Journal - Included in the International Serial Directories
http://ijrcm.org.in/
139
WORLD WIDE MIDDLE WARE TECHNOLOGIES
M.DHANAMALAR
LECTURER
DEPARTMENT OF COMPUTER SCIENCE
KRISTU JAYANTI COLLEGE
BANGALORE
B.AYSHWARYA
LECTURER
DEPARTMENT OF COMPUTER SCIENCE
KRISTU JAYANTI COLLEGE
BANGALORE
ABSTRACT
Grid is an infrastructure that involves the integrated and collaborative use of computers, internet and databases managed by organisations. Grid middleware’s
provide users with seamless computing ability and uniform access to resources in the heterogeneous Grid environment. In particular, we discuss the purpose of
grid, its components, its challenges and issues in each level relationship between the Grid and the World Wide Web, its facts and fictions and its web services. It
also includes the overview of web (grid) services, bus of web (grid) services and the necessary security issues.
KEYWORDS Grid Computing, Middleware, Web Services, GSI, Bus Services
1. INTRODUCTION rid computing is a process of connecting computing resources to allocate their computing supremacy. Computer grids permit access to computing resources from many different locations, just as the World Wide Web permit access to information. These computing resources include data storage capacity, computing power, sensors, visualization tools and much, much more. Grids use networks to connect the computing resources of many different
computers. The cyber-glue that binds all of these resources together is called “middleware.” There are many different types of middleware, developed for many different types of grid. Middleware does all the work to connect users’ jobs to computing resources, thereby hiding the grid’s complexity from the user.
2. DIFFERENCES BETWEEN THE GRID, THE INTERNET AND THE WEB The internet is a networking infrastructure, which connects together millions of computer worldwide. There comes from the idea of “interconnected networks”. If both connected to the internet, any computer can communicate with any other one. But “being connected” is not only a question of cables! To talk to each other computers have to speak the same language, i.e. use the same protocol. A protocol is format for transmitting data. The common protocol for the internet is called the transmission control protocol/internet protocol or TCP/IP. The World Wide Web or simply the web is an information-sharing service built on the top of the internet. But it is not only one! The internet is also used for e-mail (SMTP) for file transfer (FTP) and so on. The grid is again a service built on the top of the internet, as the web is. But the grid goes one step supplementary.
FIG. 1: WORLD WIDE GRID COMPUTING
3. FACTS AND FICTIONS ABOUT THE GRID FACT Grid computing, like the World Wide Web, is an application of the Internet. It cannot replace Internet. In order to get such data transfer rates, individuals would have to set-up a dedicated fibre-optic link connecting home and the source of data 9server). If one is able to do that, he/she can download the movie 10,000 times faster even now, without the Grid! With standard dial-up telephone link or shared broad-band connectivity, such speeds will remain a dream. The Grid cannot change the data transfer rate. Today’s grid computing technologies and projects are geared toward research and businesses with highly specific needs, such as vast amounts of data to process and analyze within large, worldwide collaborations, like LHC project of CERN. While other computer users may benefit from grid computing through better weather prediction or more effective medications, they may not be logging onto a computing grid anytime soon. FICTION The Grid will replace the Internet. People will be able to download movies 10,000 times faster using the Grid. The Grid is going to dominate www
4. CHALLENGES AND ISSUES The typical Grid Services include
G

VOLUME NO. 2 (2012), ISSUE NO. 12 (DECEMBER) ISSN 2231-1009
INTERNATIONAL JOURNAL OF RESEARCH IN COMPUTER APPLICATION & MANAGEMENT A Monthly Double-Blind Peer Reviewed (Refereed/Juried) Open Access International e-Journal - Included in the International Serial Directories
http://ijrcm.org.in/
140
• Security services which maintain user substantiation, endorsement and segregation
• Information services, which permit employ to see what resources (machines, software, other services) are accessible for use
• Job submission services, which permit a user to present a job to any compute resource that the user is endorsed to use,
• Co-scheduling services, which permit, multiple resources to be planned parallel,
• User-support services, which offer users, access the systems that cover the resources of an entire grid.
5. PURPOSES OF GRID COMPUTING Applications consist of numerous sub-applications that are sewing up jointly to form one huge circulated application. The complexity lies in making all the bit work together in a reliable and expected manner. The consistency of these assemblages is the cause of the problem. Issues such as organization and announcement across sites to different garbage of application running on different sites. Application demands difficult communications between a variety of grid services, schedulers, precautions systems and network requirements. The complexity lies in handling of Grid programming utensils. With Grid programming utensils, difficult distributed applications can be wrapped and restricted. Also, procedure of Web services in the programming models can deal with some of the difficulties.
6. GRID MIDDLEWARE Grid middleware to work out enormous amount of applications is demanding. Examples of well-liked Grid Middleware are UNICORE, Globus, Legion, and Gridbus
7. GRID ARCHITECTURE FABRIC LEVEL Interfaces to local control, with physical and logical resources such as records, or even a circulated folder system. CONNECTIVITY LEVEL Defines central part of communication and endorsement set of rules supporting Grid-specific network connections.
FIG. 2: GRID ARCHITECTURE
RESOURCE LEVEL Permits the allocation of a distinct resource and it builds on connectivity level communication and endorsement protocols to define set of rules for protected recognition, beginning, monitor, and control of sharing operations on individual resources. COLLECTIVE LEVEL Permits resources to be analysis as gathering and allocation of resources. The collective level contains set of rules and services not connected with any one particular resource but instead of capturing connections across the gathering of resources. APPLICATION LEVEL Use the suitable mechanism of each level to maintain the application Each of these level may contain set of rules, APIs, and software Development Kits (SDKs) to maintain the development of Grid applications.
8. COMPONENTS AND SERVICES OF GLOBUS GRID LAYER GRID FABRIC The fabric of the Grid includes the essential systems, PCs, operating systems, networks, storage systems and routers the building blocks. GRID SERVICES Grid services combine the components of the Grid fabric. GRAM The Globus Resource Allocation Manager (GRAM) is a basic library service that give ability to do remote-submission work begin. GRAM unites Grid machines, given that a frequent user interfaces so that you can submit a work to multiple machines on the Grid fabric. GRAM is a common, ubiquitous service, with particular application toolkit instructions built on top of it. GRID FTP The Grid FTP data transfer protocol, which develop the standard FTP protocol consist of a superset of the features accessible by the different Grid storage systems at present in use. Grid FTP has selected subsets of the accessible FTP protocol with latest features. The FTP protocol is most commonly used for data transmit on the Internet and the most possible entrant for gathering the Grid's needs. FTP is a broadly apply and well-understood IETF standard protocol with a large base of code and capability from which to assemble. An FTP client and server with support for GSSAPI protection following protocol extension defined by the Internet society were implemented. The GSSAPI supports any PKI or Kerberos endorsement. Grid FTP functionality comprises various features that are maintained by FTP expansion to have already been standardized (RFC 959) but are rarely executed in current systems. Other features are new expansion to FTP. Grid Security roads and Kerberos support: Robust and flexible endorsement, honesty, and discretion features are vital when relocating or accessing files. Grid FTP must maintain GSI and Kerberos endorsement, with user restricted setting of various stages of data integrity and/or privacy. Grid FTP implements the

VOLUME NO. 2 (2012), ISSUE NO. 12 (DECEMBER) ISSN 2231-1009
INTERNATIONAL JOURNAL OF RESEARCH IN COMPUTER APPLICATION & MANAGEMENT A Monthly Double-Blind Peer Reviewed (Refereed/Juried) Open Access International e-Journal - Included in the International Serial Directories
http://ijrcm.org.in/
141
endorsement system defined by RFC 2228, "FTP Security Extensions". Grid FTP implements secret and GSSAPI endorsement with elective veracity and /or solitude, as defined by the Existing Generic Security Services (GSS) API enabled FTP standard. GIS The Grid Information Service, GIS, earlier known as the Meta computing Directory Service, MDS, supplies information service. GIS to find out the properties of the technology, computers and networks that you would like to use: how many processors are existing at this instant? What bandwidth is afforded? Is the storage on tape or disk? Using an LDAP (Lightweight Directory Access Protocol) server, GIS provides middleware information in a frequent interface to put a unifying picture on top of dissimilar equipment. GSI The Grid Security Infrastructure, is a library for provide generic protection services for applications that will be run on the Grid. Application programmers use the gss-api library for adding endorsement to a program. GSI provides programs, such as grid-proxy-init, to make possible login to a variety of sites, while each site has its own savor of protection measures. That is, on the fabric level, the a variety of machines you want to use may be managed by different protection policies; GSI afford a way of shorten many remote logins. The GSI afford methods for endorsement of grid users and safe communication. It is based on SSL (Secure Socket Layer), PKI (Public Key Infrastructure) and X.509 certificate architecture. The GSI affords services, procedure, and libraries to complete the following information for grid protection:
• Single Sign-on for using grid services through user certificates
• Resource endorsement through host certificates
• Data encryption
• Endorsement
• Allocation of authority and trust through surrogate and certificate chains of dependence for certificate authorities (CAs) APPLICATION TOOL KIT Application toolkits use Grid Services to offer higher-level abilities, often targeted to specific classes.A number of groups are also budding a variety of other toolkits such as maintain for distributed management of large datasets, combined revelation, and online instrumentation.
FIG. 3
Components of Grid Architecture Specific Applications: A rich variety of applications have been developed that build on services provided by the three layers. For example, Navier-Stokes flow solver for structured grids that has been customized to operate on several supercomputers via the use of Message Passing Programming Environment (MPICH-G2) Other application areas being targeted to the Grid consist of High-Energy Physics, Cosmology, Chemical Engineering, Climate, Combustion, and Astrobiology.
9. WEB SERVICES Most people are well-known with accessing the Web through a Web browser, which afford a human-oriented interface to information and user-oriented services such as on-line mart and retail stores. When a consumer requests a Web page, the request is handled by a remote Web server, which returns the information in HTML a form that allows the browser to present it using a variety of fonts, colors and pictures, all factors that make it more useful and attractive to a human. Web services are distributed software components that afford information to applications rather than to humans, during an application-oriented interface. The information is controlled using eXtensible Markup Language (XML), so that it can be parsed and processed easily rather than being design for display. In a Web-based retail operation, for example, Web services that may be running on commonly separated servers might afford account management, inventory control, shopping cart and credit card endorsement services, all of which may be invoked several times in the course of a single purchase. Web services issues details of their functions and interfaces, but they maintain their performance details private; thus a client and a service that support frequent communication protocols can interact any of the platforms on which they run, or the programming languages in which they are written. It makes Web services mainly applicable to a distributed various environment. The key terms used by Web services are: XML (EXTENSIBLE MARKUP LANGUAGE) A markup language for formatting and replacing structured data.

VOLUME NO. 2 (2012), ISSUE NO. 12 (DECEMBER
INTERNATIONAL JOURNAL OF RESEARCH IN COMA Monthly Double-Blind Peer Reviewed (Refereed
SOAP (SIMPLE OBJECT ACCESS PROTOCOL) An XML-based protocol to indicate wrapping information, contents and processing information for a message. WSDL (WEB SERVICES DESCRIPTION LANGUAGE) An XML based language used to explain the element, interfaces and other belongings of a web service. A WSDL document can be sto study about the service. Web service can maintain any communication protocol, and may offer its consumers an option, the most common is SOAP over either HTTP or HTTPS. This supply to the request of Web services, as HTTP and HTTPS are ubiquitous and usually do not raise problems of firewall traversdirectional HTTP passage.
10. WEB SEMANTICS (GRID) The Semantic Web explains the relationships between things. The purpose of the Semantic Web is motivating the growth of the cto find, share, and mingle information more easily. Information, computing resources and services are explained using the data and metadata are expressed through facts.
11. WEB (GRID) SERVICES The Open Grid Services Architecture explains architecture for a Global Grid Forum (GGF). OGSA is based on several other Web service technologies WSDL and SOAP. It was intended to provide an infrastructure layer Open Grid Services Architecture. OGSI takes the statelessness issues into account by basically expanding web services to contare both temporary and state full
12. BUS (GRID) SERVICES The major condition of the time with respect to the Web services and the Grid computing is to have a Bus Web (Grid) Services, this is a bus of web servthe design of these web services is consists of both the web service contents and the grid.Several Web (Grid) Service will work in a network of Bus, divide the resources with each other in a fast and secure way, for the completion of particular solve a problem in a joint way by making a distributed web (grid) service network, as shown in the figure Bus Web (Grid) The most important issue related to Bus Web (Grid) Service which requires some time to solve and be retaining throughout the Without having a strong protection mechanism now days, it is not possible to have right communicationProtection requires in both the supplier and demand application and services. The major aim of this technology is to improve quick and protected way with in practical environment by ubiquitous having access for the result of a particular problem.
13. CONCLUSION In the end of this report, we are proposing a new concept by merging the already existing concepts of Grid Computing and Weand then elaborate this concept in to the bus of Web Grid) Services. This new concept requires a little more time to make it also requires implementations, to have some experimental results, on the basis of these experim
14. REFERENCES 1. Parvin Asadzadeh, Rajkumar Buyya1, Chun Ling Kei, Deepa Nayar, and Srikumar Venugopal Grid Computing and Distributed Systems
Laboratory,Department of Computer Science and Software Engineering, Study of Four Grid Middleware Technologies
2. David Booth, W3C Fellow / Hewlett-Packard, Hugo Haas W3C, Francis McCabe, Fujitsu Labs of America, Eric Newcomer (until October 2003), Champion (until March 2003), Chris Ferris (until March 2003) IBM and David Orchard (until March 2003) BEA Systems. Web ServicWorking Group Note 11 February 2004
3. Zeeshan Ahmed, Department of Intelligent Software Systems and Compu(Grid) Services.
4. Grigoris Antoniou and Frank van Harmelen: A Semantic Web Primer.5. A Networking Approach to Grid Computing, pp 1-
ECEMBER)
INTERNATIONAL JOURNAL OF RESEARCH IN COMPUTER APPLICATION Refereed/Juried) Open Access International e-Journal - Included in the International Serial Directories
http://ijrcm.org.in/
FIG. 4: WEB SERVICES TECHNOLOGIES
based protocol to indicate wrapping information, contents and processing information for a message.
An XML based language used to explain the element, interfaces and other belongings of a web service. A WSDL document can be s
rotocol, and may offer its consumers an option, the most common is SOAP over either HTTP or HTTPS. This supply to the request of Web services, as HTTP and HTTPS are ubiquitous and usually do not raise problems of firewall travers
The Semantic Web explains the relationships between things. The purpose of the Semantic Web is motivating the growth of the core easily. Information, computing resources and services are explained using the
The Open Grid Services Architecture explains architecture for a service-oriented grid computing location for business and scientific u. OGSA is based on several other Web service technologies WSDL and SOAP. It was intended to provide an infrastructure layer
Open Grid Services Architecture. OGSI takes the statelessness issues into account by basically expanding web services to cont
time with respect to the Web services and the Grid computing is to have a Bus Web (Grid) Services, this is a bus of web servthe design of these web services is consists of both the web service contents and the grid.
ll work in a network of Bus, divide the resources with each other in a fast and secure way, for the completion of particular solve a problem in a joint way by making a distributed web (grid) service network, as shown in the figure Bus Web (Grid) Service.
The most important issue related to Bus Web (Grid) Service which requires some time to solve and be retaining throughout the Without having a strong protection mechanism now days, it is not possible to have right communication, relations, allocation of resources and on time result. Protection requires in both the supplier and demand application and services. The major aim of this technology is to improve
environment by ubiquitous having access for the result of a particular problem.
In the end of this report, we are proposing a new concept by merging the already existing concepts of Grid Computing and Weand then elaborate this concept in to the bus of Web Grid) Services. This new concept requires a little more time to make it also requires implementations, to have some experimental results, on the basis of these experimental results this can be finalised.
Parvin Asadzadeh, Rajkumar Buyya1, Chun Ling Kei, Deepa Nayar, and Srikumar Venugopal Grid Computing and Distributed Systems Laboratory,Department of Computer Science and Software Engineering, The University of Melbourne, Australia. Global Grids and Software Toolkits: A
Packard, Hugo Haas W3C, Francis McCabe, Fujitsu Labs of America, Eric Newcomer (until October 2003), Champion (until March 2003), Chris Ferris (until March 2003) IBM and David Orchard (until March 2003) BEA Systems. Web Servic
Zeeshan Ahmed, Department of Intelligent Software Systems and Computer Science, Blekinge Institute of Technology, A Middleware road towards Web
A Semantic Web Primer. -100, by Daniel Minoli, John Willey and sons
ISSN 2231-1009
PUTER APPLICATION & MANAGEMENT Included in the International Serial Directories
142
An XML based language used to explain the element, interfaces and other belongings of a web service. A WSDL document can be study by a possible consumer
rotocol, and may offer its consumers an option, the most common is SOAP over either HTTP or HTTPS. This supply to the request of Web services, as HTTP and HTTPS are ubiquitous and usually do not raise problems of firewall traversal in an organization that allows bi-
The Semantic Web explains the relationships between things. The purpose of the Semantic Web is motivating the growth of the current Web by enabling users ore easily. Information, computing resources and services are explained using the semantic data model. In this type the
location for business and scientific use, developed within the . OGSA is based on several other Web service technologies WSDL and SOAP. It was intended to provide an infrastructure layer for the
Open Grid Services Architecture. OGSI takes the statelessness issues into account by basically expanding web services to contain grid computing resources that
time with respect to the Web services and the Grid computing is to have a Bus Web (Grid) Services, this is a bus of web services, and
ll work in a network of Bus, divide the resources with each other in a fast and secure way, for the completion of particular task or to Service.
The most important issue related to Bus Web (Grid) Service which requires some time to solve and be retaining throughout the time is the protection issue. , relations, allocation of resources and on time result.
Protection requires in both the supplier and demand application and services. The major aim of this technology is to improve the allocation of resources in a environment by ubiquitous having access for the result of a particular problem.
In the end of this report, we are proposing a new concept by merging the already existing concepts of Grid Computing and Web Services as Web (Grid) Services and then elaborate this concept in to the bus of Web Grid) Services. This new concept requires a little more time to make it into an accurate shape. Further it
ental results this can be finalised.
Parvin Asadzadeh, Rajkumar Buyya1, Chun Ling Kei, Deepa Nayar, and Srikumar Venugopal Grid Computing and Distributed Systems (GRIDS) The University of Melbourne, Australia. Global Grids and Software Toolkits: A
Packard, Hugo Haas W3C, Francis McCabe, Fujitsu Labs of America, Eric Newcomer (until October 2003), Michael Champion (until March 2003), Chris Ferris (until March 2003) IBM and David Orchard (until March 2003) BEA Systems. Web Services Architecture W3C
ter Science, Blekinge Institute of Technology, A Middleware road towards Web

VOLUME NO. 2 (2012), ISSUE NO. 12 (DECEMBER) ISSN 2231-1009
INTERNATIONAL JOURNAL OF RESEARCH IN COMPUTER APPLICATION & MANAGEMENT A Monthly Double-Blind Peer Reviewed (Refereed/Juried) Open Access International e-Journal - Included in the International Serial Directories
http://ijrcm.org.in/
143
CRITICAL FACTORS FOR SUCCESSFUL SC COLLABORATION: AN INTERPRETIVE STRUCTURAL MODELING APPROACH
KAUSTUBH JOSHI
M.TECH STUDENT
DEPARTMENT OF MECHANICAL ENGINEERING
SARDAR VALLABHBHAI NATIONAL INSTITUTE TECHNOLOGY
SURAT
ANIKET JADHAV
LECTURER
DEPARTMENT OF PRODUCTION ENGINEERING
D Y PATIL COLLEGE OF ENGINEERING
AKURDI
ABSTRACT
Interpretive Structural Modelling (ISM) is a methodology for identifying and summarizing relationships among specific SC collaborations, which define an issue or
problem. It provides a means by which order can be imposed on the complexity of such factors. In the present paper the important critical success factors have
been analysed to obtain an ISM, which shows the interrelationships of the variables and their levels. These variables have also been categorized depending on
their driving power and dependence. The research shows that there exists a group of enablers having a high driving power and low dependence requiring
maximum attention and of strategic importance while another group consists of those variables which have high dependence and have the resultant actions.
KEYWORDS Interpretive Structural Modelling, Supply chain Collaboration.
1. INTRODUCTION oday the key issues in supply chain (SC) are the formation of the SC and its efficient coordination with objectives of customer satisfaction and sustaining competency. This requires complex flow of information, materials, and funds across multiple functional areas both within and among organizations. To achieve this organization must identify, evaluate, rank, and manage its SC risks. (Stevenson 2007) The leaner and more integrated SC get the more likely
uncertainties, dynamics and accidents in one link affect the other links in the chain. Organizations obsession with speed and costs also causes SC to break down particularly during the launch of new products (Ravi. V, 2005). Also coordinating actions across organizations is tough because organizations have different cultures and they cannot count on shared beliefs or loyalty to motivate their partners (Yu, 2001). The benefits of SC collaboration include reduction in overall cost, improved delivery service and shorter product development cycles. Despite these benefits organizations who partner in strategic SC continue to encounter barriers. These barriers exist at multiple levels of organizations: the organizational, intra organizational and inter organizational levels. (Stanley 2008). ISM is a well established methodology for identifying relationships among specific items which define a problem or an issue (Warfield 1974). Therefore, in this research, SC collaboration critical success factors (CSFs) have been analyzed using the ISM approach, which shows the interrelationships of various SC collaboration CSFs, their driving power and dependencies. The opinions from a group of experts were used in developing the relationship matrix, which is later used in the development of the ISM model. In this paper, thirteen CSFs have been chosen on the basis of literature review and the opinions of experts from academia (Table 1). The main objectives of this paper are to identify and rank the CSFs, to establish relationships among the identified CSFs using ISM, and to discuss the organizational implications of this research and suggest directions for future research.
2. LITERATURE REVIEW 2.1 DEFINITIONS OF SUPPLY CHAIN MANAGEMENT Cheng (2002) defined SC as an integrative philosophy to manage the total flows of a distribution channel from suppliers level to production, distribution and the ultimately the end customer. The integrative philosophy of SC management eliminates the boundaries of the single organization and puts emphasis on the effectiveness of the SC as a whole and SC that which can quickly support new market opportunities and be synchronized and streamlined to maximize efficiency and effectiveness. (Chan, 2009). SCM is the approach to designing, organizing, and executing all the activities from planning to distribution along the entire value chain, including the network of suppliers, manufacturers and distributors. (IP W. H, 2011). It aims to procure the correct inputs (raw materials, components and capital equipment), convert them into finished products and dispatch them to their final destinations. (Barrat, 2004). Sahay (2003) defined SC management is the integration of key business processes across the SC for the purpose of creating value for customers and stakeholders and it is the management of material, information and finance through a network of organizations (i.e. suppliers, manufacturers, logistics providers, wholesales/distributors and retailers) that aims to produce and deliver products or services for the consumers. (Singh, 2003). The SC is the network of organizations that are involved, through upstream and downstream linkages, in the different processes and activities that produce value in the form of products and services in the hands of the ultimate customer. (Gunasekaran, 2004). 2.2 SC COLLABORATION CRITICAL SUCCESS FACTOR Fawcett et al. (2010) address how organizations mitigate existing forces to achieve the SC collaboration critical success factor (CSF). Seven key theories were used to provide insight into the theoretical framework for the creation of the collaboration CSF. Organizations are beginning to pursue greater collaboration; however, managers are often stymied in their pursuit of collaborative business models. This paper focused on the mitigation of resisting forces and collaboration CSFs. Their organizational structures and cultures are two CSFs which are discussed. Improving collaborative capabilities and higher levels of customer service and productivity are those benefits which are discussed as the benefits of SC collaboration CSF. Vijayasarathy (2010) empirically examined the multi-dimensionality of supply integration and explored its relational antecedents. The research is an empirical field study and has some shortcomings but still it comes with some of the SC collaboration CSFs like information sharing, strategic planning, organization structure, trust and commitment and also discussed the positive effects of these SC collaboration CSFs as the Benefits. Siddiqi (2008) establishes the necessity for collaboration for effective SC management in the age of Internet. In a networked society where everything is connected, collaboration is the word visited and revisited every now and then. The paper shows that when a SC is CSF with the information technology then it can link with all members of the SC to the information network, which improves effectiveness, reduces paperwork and pushes down the cost. Wu and Cheng (2007) attempts to quantify the impact of information sharing on inventory and expected cost in a multiple SC under a general end demand process. This paper states inventory reduction, cost reduction as the benefits of the SC collaboration with CSFs like information sharing and inventory planning, but it is suggested that further studies consider the sensitivity of the results to the assumptions made and simulation of the proposed model using real data. Power (2004) study is a review of the sample of literature relating to the integration and implementation of SC management
T

VOLUME NO. 2 (2012), ISSUE NO. 12 (DECEMBER) ISSN 2231-1009
INTERNATIONAL JOURNAL OF RESEARCH IN COMPUTER APPLICATION & MANAGEMENT A Monthly Double-Blind Peer Reviewed (Refereed/Juried) Open Access International e-Journal - Included in the International Serial Directories
http://ijrcm.org.in/
144
practices from a strategic viewpoint. The intent of this literature review is to document and analyze literature relating to the integration and implementation of SC management practices. Customer needs or customer oriented vision, information sharing and co-operation are some of the SC collaboration enablers which are discussed in this paper with the beneficial effects of them like improved relationship, customer satisfaction with competitive advantage and added cost to business. Jonsson and Zineldin (2003) studied proposes a conceptual model including behavioral dimensions of supplier-dealer relationships and presents hypotheses about how to achieve satisfactory inter-organizational relationships. This paper represents the impact of communication, adaptation, reputation, non-coercive power, coercive power, cooperativeness, relationship bonds, dependency and objective relationship as the enablers of the SC collaboration and shows various benefits of an inter-organizational relationship. Kidd et al (2003) paper deals with the SC management practice of firms in developed nations and their capabilities to progress under the modern regime of harder and faster just in time systems. The paper deals with the leadership, trust and JIT as the enablers for SC collaboration CSF clear and common objectives are explained with these and the various beneficial effects are discussed in this paper. Stanly (2008) paper presents an approach to manage inventory decisions at all stages of the SC in an integrated manner. In this paper the SCM problem has been addressed with particular emphasis on inventory management. Also information communication discussed as an enabler for SC collaboration CSF. Yang (2001) paper studies the effects of information sharing strategies on SC performance. They first consider four common types of information sharing strategies for a SC of a single product. This paper deals with the positive and negative effects of matching the product, demand process, production and distribution process, and SC structure with the right information sharing strategies and comes up with the benefits like reduced bull whip effect.
TABLE 1: SUPPLY CHAIN COLLABORATION CRITICAL SUCCESS FACTOR (CSF)
3. INTERPRETIVE STRUCTURAL MODELING METHODOLOGY AND MODEL DEVELOPMENT ISM starts with an identification of elements which are relevant to the problem or issue and extends with a group problem solving technique. Then a contextually relevant subordinate relation is chosen. Having decided on the element set and the contextual relation, a structural self-interaction matrix (SSIM) is developed based on pair wise comparison of elements. In the next step, the SSIM is converted into a reachability matrix and its transitivity is checked. Once transitivity embedding is complete, a matrix model is obtained. Then, ISM model is derived by the partitioning of the elements. (Suh, 2005) The various steps involved in the ISM technique are 1. Variables are listed down, which can be objectives, actions, and individuals etc., a contextual relationship is established among variables with respect to
which pairs of variables would be examined. 2. A structural self interaction matrix (SSIM) is developed for variables which indicate pair-wise relationship among variables of the system. 3. A reachability matrix is developed from the SSIM and is checked the matrix for transitivity. 4. The reachability matrix is partitioned into different levels. 5. The reachability matrix is developed in its conical form, i.e. with most zero (0) variables in the upper diagonal half of the matrix and most unitary (1)
variables in the lower half. 6. Based on the above, a directed graph (Digraph) is drawn and transitive links are removed and the resultant Digraph is converted into an ISM by replaci
variables nodes with statements. 7. The ISM model is reviewed to check for conceptual inconsistency and incorporate makes the necessary modifications. The various steps, which lead to the development of ISM model, are illustrated as given below. 3.1 Structural Self-Interaction Matrix (SSIM)
Keeping in the mind contextual relationship for each SC collaboration CSF, the existence of relationship between any two SC collaboration CSF (i and j) and associated direction of the relation are questioned. For developing SSIM, the following four symbols have been used to denote the direction of relationship between SC collaboration CSFs (i and j): V for the relation from i to j but not in opposite direction; A for the relation from j to i but not in opposite directions; X for both direction relations from i to j and j to i; and O if the relation between the does not appear valid. Based on contextual relationships, the SSIM is developed (Table 2).
Supply Chain Collaboration CSF Number
CSF Description References
CSF 1 Leadership Chan (2009)
CSF 2 Common Objectives Simatupang et al. (2002), Janssen (2004), Barrat (2005), Fawcett et al (2010)
CSF 3 Strategic Planning Kidd et al (2003)
CSF 4 Organization Structure Kim (2007), Vijayasathi (2010)
CSF 5 Lead Time Cheng et al. (2001), Barrat (2005), Lazarevic et al (2007)
CSF 6 Technology Kollurru and Meredith (2001), Prasaad and Sounderpandian (2003), Ruppel (2004), Lazarevic et al (2007), Fasanghari (2008)
CSF 7 Information Sharing Yu et al. (2001), Simatupang et al. (2002), Jonsson and Zineldin (2003), Simatupang and Sridharan II (2004), Wu and Cheng (2007), Kulchitsky and Larson (2008)
CSF 8 Trust Kollurru and Meredith (2001), Agarwal and Shankar (2003), Ruppel (2004), Kwan and Suh (2005), Fawcett et al (2010)
CSF 9 Openness Baraat (2004), Suh and Kwan (2005), Siddiqi (2008), Chen (2010)
CSF 10 Co-operation Power (2004)
CSF 11 Benefit Sharing Siddiqi (2008)
CSF 12 Decision Synchronization Sridharan and Simatupang (2003), Simatupang and Sridharan II (2004), Min et al. (2005), Weingarten et al. (2010)
CSF 13 Customer Oriented Vision Baraat (2004), Fawcett et al (2010), Lado et al. (2011)

VOLUME NO. 2 (2012), ISSUE NO. 12 (DECEMBER) ISSN 2231-1009
INTERNATIONAL JOURNAL OF RESEARCH IN COMPUTER APPLICATION & MANAGEMENT A Monthly Double-Blind Peer Reviewed (Refereed/Juried) Open Access International e-Journal - Included in the International Serial Directories
http://ijrcm.org.in/
145
TABLE 2: STRUCTURAL SELF-INTERACTION MATRIX 3.2 Reachability Matrix
The SSIM has been converted into a binary matrix, called the initial reachability matrix as shown in Table 3 by substituting V, A, X and O by 1 and 0 as per given case. The substitution of 1s and 0s are as per the following rules:
• If the (i, j) entry in the SSIM is V, the (i, j) entry in the reachability matrix becomes 1 and the (j, i) entry becomes 0;
• If the (i, j) entry in the SSIM is A, the (i, j) entry in the reachability matrix becomes 0 and the (j, i) entry becomes 1;
• If the (i, j) entry in the SSIM is X, the (i, j) entry in the reachability matrix becomes 1 and the (j, i) entry also becomes 1; and
• If the (i, j) entry in the SSIM is 0, the (i, j) entry in the reachability matrix becomes 0 and the (j, i) entry also becomes 0. After incorporating the transitivity as mentioned in step (4) of the ISM technique, the final reachability matrix is shown in Table 4. In Table 4, the driving power and the dependence of each SC collaboration CSF are also shown. The driving power for each SC collaboration CSF is the total number of SC collaboration CSFs (including itself), which it may help achieve. Dependence is the total number of SC collaboration CSFs (including itself), which may help achieving it. These driving powers and dependencies are used in the classification of SC collaboration CSFs into four groups, i.e. autonomous, dependent, linkage, and driver.
TABLE 3: INITIAL REACHABILITY MATRIX
TABLE 4: FINAL REACHABILITY MATRIX
CSF No. 1 2 3 4 5 6 7 8 9 10 11 12 13 DR
CSF 1 1 0 1 1 1 1 1 1 1 1 1 1 1 12
CSF 2 0 1 1 1 1 1 1 1 1 1 1 1 1 12
CSF 3 0 0 1 1 1 1 1 1 1 1 1 1 1 11
CSF 4 0 0 0 1 1 1 1 1 1 1 1 1 1 10
CSF 5 0 0 0 1 1 1 1 1 1 1 1 1 1 10
CSF 6 0 0 0 1 1 1 1 1* 1* 1* 1* 1 1 10
CSF 7 0 0 0 0 0 0 1 0 0 0 0 1 1 3
CSF 8 0 0 0 0 0 0 1 1 1 1 1 1 1 7
CSF 9 0 0 0 0 0 0 1 0 1 1 0 1 1 5
CSF 10 0 0 0 0 0 0 1 0 1 1 0 1 1 5
CSF 11 0 0 0 0 0 0 1 1 1 1 1 1 1 7
CSF 12 0 0 0 0 0 0 1 0 0 0 0 1 1 3
CSF 13 0 0 0 0 0 0 0 0 0 0 0 0 1 1
DP 1 1 3 6 6 6 12 8 10 10 8 12 13
DR= Driving Power DP=Dependence Power 3.3 Level partitions
From the final reachability matrix, the reachability and antecedent set of each SC collaboration CSFs are found (Warfield, 1974). The reachability set consists of the SC collaboration CSF itself and the other SC collaboration CSFs which it may help achieve it. Thereafter, the intersection of these sets is derived for all the SC collaboration CSFs. The SC collaboration CSFs for whom the reachability and the intersection sets are same, occupy the top level in the ISM hierarchy. The top-level CSF in the hierarchy would not help achieve any other SC collaboration CSF above its own level. Once the top-level CSF is identified, it is separated out from the other SC collaboration CSFs. It is seen from the Table 5 that Customer Oriented Vision (CSF 13) is occupied at level I. Hence, this CSF would be positioned at the top of the ISM hierarchy. After omitting the Customer Oriented Vision from Table 6, the next table is prepared. Then, the same process is repeated to find out the CSF in the next level. In the next level i.e. II level the Information Sharing (CSF 7) and Decision Synchronizing (CSF 12), occupied the position and again omitted from the table. This process is continued until the levels of each CSF are found out. These levels (see Table 6) help in building the diagraph and the final model of ISM.
CSF No. 13 12 11 10 9 8 7 6 5 4 3 2
CSF 1 V V V V V V V V V V V V
CSF 2 V V V V V V V V V V V
CSF 3 V V V V V V V V V V
CSF 4 V V V V V V V X X
CSF 5 V V V V V V V X
CSF 6 V V O O O O V
CSF 7 V X A A A A
CSF 8 V V X V V
CSF 9 V V A X
CSF 10 V V A
CSF 11 V V
CSF 12 V
CSF 13
CSF No. 1 2 3 4 5 6 7 8 9 10 11 12 13
CSF 1 1 0 1 1 1 1 1 1 1 1 1 1 1
CSF 2 0 1 1 1 1 1 1 1 1 1 1 1 1
CSF 3 0 0 1 1 1 1 1 1 1 1 1 1 1
CSF 4 0 0 0 1 1 1 1 1 1 1 1 1 1
CSF 5 0 0 0 1 1 1 1 1 1 1 1 1 1
CSF 6 0 0 0 1 1 1 1 0 0 0 0 1 1
CSF 7 0 0 0 0 0 0 1 0 0 0 0 1 1
CSF 8 0 0 0 0 0 0 1 1 1 1 1 1 1
CSF 9 0 0 0 0 0 0 1 0 1 1 0 1 1
CSF 10 0 0 0 0 0 0 1 0 1 1 0 1 1
CSF 11 0 0 0 0 0 0 1 1 1 1 1 1 1
CSF 12 0 0 0 0 0 0 1 0 0 0 0 1 1
CSF 13 0 0 0 0 0 0 0 0 0 0 0 0 1

VOLUME NO. 2 (2012), ISSUE NO. 12 (DECEMBER) ISSN 2231-1009
INTERNATIONAL JOURNAL OF RESEARCH IN COMPUTER APPLICATION & MANAGEMENT A Monthly Double-Blind Peer Reviewed (Refereed/Juried) Open Access International e-Journal - Included in the International Serial Directories
http://ijrcm.org.in/
146
TABLE 5: PARTITIONING OF REACHABILITY MATRIX: 1ST ITERATION
CSF No. Reachability Set Antecedent Set Intersection Set Level
CSF 1 1,3,4,5,6,7,8,9,10,11,12,13 1 1
CSF 2 2,3,4,5,6,7,8,9,10,11,12,13 2 2
CSF 3 3,4,5,6,7,8,9,10,11,12,13 1,2,3 3
CSF 4 4,5,6,7,8,9,10,11,12,13 1,2,3,4,5,6 4
CSF 5 4,5,6,7,8,9,10,11,12,13 1,2,3,4,5,6 5,6
CSF 6 4,5,6,7,8,9,10,11,12,13 1,2,3,4,5,6 5,6
CSF 7 7,12,13 1,2,3,4,5,6,7,8,9,10,11,12 7,12
CSF 8 7,8,9,10,11,12,13 1,2,3,4,5,6,8,11 8,11
CSF 9 7,9,10,12,13 1,2,3,4,5,6,8,9,10,11 9,10
CSF 10 7,9,10,12,13 1,2,3,4,5,6,8,9,10,11 9,10
CSF 11 7,8,9,10,11,12,13 1,2,3,4,5,6,8,11 8,11
CSF 12 7,12,13 1,2,3,4,5,6,7,8,9,10,11,12 7,12
CSF 13 13 1,2,3,4,5,6,7,8,9,10,11,12,13 13 I
TABLE 6: LEVEL OF SC COLLABORATION CSF
CSF No. Reachability Set Antecedent Set Intersection Set Level
1 1 1 1 VII
2 2 2 2 VII
3 3 1,2,3 3 VI
4 4 1,2,3,4,5,6 4 V
5 5,6 1,2,3,4,5,6 5,6 V
6 5,6 1,2,3,5,6,7,8,9,10,11,12 5,6 V
7 7,12 1,2,3,4,5,7,8,9,10,11 7,12 II
8 8,11 1,2,3,4,5,6,8,11 8,11 IV
9 9,10 1,2,3,4,5,6,8,9,10,11 9,10 III
10 9,10 1,2,3,4,5,6,8,9,10,11 9,10 III
11 8,11 1,2,3,4,5,6,8,11 8,11 IV
12 7,12 1,2,3,4,5,6,7,8,9,10,11,12 7,12 II
13 13 1,2,3,4,5,6,7,8,9,10,11,12,13 13 I
3. 4 Formation of ISM-based model
The structural model is generated from final reachability matrix as given in Figure 1. If there is a relationship between the SC collaboration CSF i and j, this is presented by an arrow which points from i to j. This graph is called a directed graph, or digraph. It is a diagram composed of points called vertices and arrows called arcs going from a vertex to another vertex. A digraph is drawn for the results where the factors are placed according to their levels, with level I factors at the top and level IX factors at the bottom. The first level factors are the factors that do not influence any other factor but are influenced easily by other factors. Similarly the second level factors influence level I factors above it but are influenced by level III factors, below it. The initial diagraph is drawn by joining the factor’s node with arrows pointing according to the direction of their antecedent. After removing the transitivity of the ISM methodology, the final digraph is formed (Figure 1) and is converted to ISM-based model by replacing variable nodes with the statements (Figure 2).
FIGURE 1: FINAL DIAGRAPH DEPICTING THE RELATIONSHIP OF SC COLLABORATION CSFs
03
02 01
04 05 06
11 08
10 09
7 12
13

VOLUME NO. 2 (2012), ISSUE NO. 12 (DECEMBER) ISSN 2231-1009
INTERNATIONAL JOURNAL OF RESEARCH IN COMPUTER APPLICATION & MANAGEMENT A Monthly Double-Blind Peer Reviewed (Refereed/Juried) Open Access International e-Journal - Included in the International Serial Directories
http://ijrcm.org.in/
147
FIGURE 2: ISM BASED MODEL OF SC COLLABORATION CSFs
4. ANALYSIS OF ISM MODEL FOR SC COLLABORATION CSF All CSF have been classified, based on their driving power and dependence power, into four categories as autonomous, dependents, linkages, and independent SC collaboration CSFs. The above classification is similar to the classification used by Mandal and Deshmukh (1994). The driving power and dependence power of each SC collaboration CSF are shown in Table 4. The driving power and dependence power diagram for SC collaboration CSFs are shown in Figure 3. It is observed from Table 4 that Lead Time (CSF 5) has a dependence power of 6 and a driving power of 10 and therefore, it is positioned at a place which corresponds to a dependence power of 6 and a driving power of 10 in Figure 3. The objective behind the classification of SC collaboration CSFs is to analyze the driving power and dependence power of the SC collaboration CSFs.
FIGURE 3: CLUSTERS OF SC COLLABORATION CSFs
13
12 1,2 Cluster IV Driver CSFs
Cluster III Linkage CSFs
11 3
10 4,5,6
9
8
7 8,11
6
5 9,10
4 Cluster I Autonomous CSFs
Cluster II Dependent CSFs
3 7,11,12
2
1 13
1 2 3 4 5 6 7 8 9 10 11 12 13
Dependence Power
5. DISCUSSIONS AND CONCLUSION Development of ISM model (Figure 2) and categorization of SC collaboration CSFs (Figure 3) have following managerial implications: The driving power - dependence power diagram (Figure 3) indicates that there are no autonomous CSFs in the process of SC collaboration CSF. Autonomous CSFs are weak drivers and also weak dependent. The autonomous CSFs are relatively disconnected from the system, with which they have only few links, which may
Common Objectives Leadership
Organization Structure
Strategic Planning
Lead Time Technology
Customer Oriented Vision
Information Decision Synchronizing
Co-operation Openness
Trust Benefit Sharing
Dri
vin
g P
ow
er

VOLUME NO. 2 (2012), ISSUE NO. 12 (DECEMBER) ISSN 2231-1009
INTERNATIONAL JOURNAL OF RESEARCH IN COMPUTER APPLICATION & MANAGEMENT A Monthly Double-Blind Peer Reviewed (Refereed/Juried) Open Access International e-Journal - Included in the International Serial Directories
http://ijrcm.org.in/
148
not be strong. Hence, they don’t have much influence on the system. Therefore, among the thirteen selected CSFs, all the CSFs have much influence in the SC collaboration. Hence top management can’t take lightly any of these CSFs, if they are very serious to make SC collaboration successful. Information sharing (CSF 7), Trust (CSF 8), Cooperation (CSF 9), Openness (CSF 10), Benefit sharing (CSF 11), Decision synchronizing (CSF 12) and Customer oriented vision (CSF 13) are weak drivers but are strongly dependent on the others (Figure 3). They are seen at the top of the ISM hierarchy (Figure 2), therefore considered as important SC collaboration CSFs. Their strong dependence indicates that they require all the other SC collaboration CSFs to minimize the effect of these CSFs in SC collaboration. The management should therefore accord high priority in tackling these CSFs. Besides tackling these CSFs, management should also understand the dependence of these CSFs on lower level of the ISM. There are no CSFs in the linkage category that has a strong driver power and also a strong dependence (Figure 3). Any change occurring to these CSFs will have an effect on others and also a feedback on themselves. Hence, these CSFs are unstable in nature which may affect the successful SC collaboration in the organizations either in positive or negative way. The absence of any linkage SC collaboration CSFs in this study indicates that no CSF is unstable among all the twenty CSFs chosen in this study. The driving power and dependence diagram (Figure 3) indicates that independent CSFs such as Leadership (CSF 1), Common objectives (CSF 2), Strategic planning (CSF 3), Organization Structure (CSF 4), Lead Time (CSF 5) and Technology (CSF 6). Thus management needs to address these CSFs more cautiously and may be treated as the root causes of all the CSFs. It has been observed that these CSFs help to achieve the CSFs which appear at the top of the ISM hierarchy. Therefore, it can be anecdotal that management should work out strategies to facilitate these independent CSFs for successful SC collaboration. Those CSFs possessing higher driving power in the ISM need to be taken care on priority basis because there are few other dependent CSFs being affected by them. ISM has capability to develop theoretical model only through managerial techniques such as brain storming, group technique, etc. It is only subjective judgment and doesn’t give any weight age associated with the CSFs. The contextual relation among the SC collaboration CSFs always depends on the user’s knowledge and familiarity with the organization, and its operation. Therefore, any biasing by the person who is judging the SC collaboration CSFs might influence the final result.
REFERENCES 1. Agarwal, A. and Shankar, R. (2003). “On-line trust building in e-enabled supply chain”, Supply Chain Management: An international Journal, Vol.8, No.4, pp
324-334. 2. Barrat, M. (2005). “Understanding the meaning of collaboration in the supply chain”, Supply Chain Management: An International Journal, Vol.9, No.1, pp
30-42. 3. Chan, H. K., Wang, W. Y. C., Luong, L. H. S. and Chan, F. T. S. (2009). “Flexibility and Adaptability in Supply Chains: a Lesson Learnt from a Practitioner”,
Supply Chain Management: An International Journal, vol. 14, no. 6, pp. 407–410. 4. Chen, J. V., Yen, D. C., Rajkumar, T.M. and Tomochko, N. A. (2010). “The Antecedent Factors on Trust and Commitment in Supply Chain Relationships”,
Computer Standards & Interfaces. 5. Cheng, E. W. L., Li, H., Love, P. E. D. and Irani, Z. (2001). “An e-business Model to Support Supply Chain Activities in Construction”, Logistics Information
Management, vol. 14, no. 1/2, pp. 68-77. 6. Fasanghari, M., Roudsari, F. H. and Chaharsooghi, S. K. (2008). “Assessing the Impact of Information Technology on Supply Chain Management”, World
Applied Sciences Journal, vol. 4, no. 1, pp. 87-93. 7. Fawcett, S. E., Magan, G. M. and Fawcett, A. M. (2010). “Mitigating resisting forces to achieve the collaboration-enabled supply chain”, Benchmarking An
International Journal” Vol.12, No.2, pp 269-293. 8. Gunasekaran, A. and Ngai, E.W.T. (2004). “Information Systems in Supply Chain Integration and Management”, European Journal of Operational Research,
vol. 159, pp. 269–295. 9. IP W.H, Chan S. L. and Lam C. Y. (2011). "Modeling supply chain performance and stability", Industrial Management & Data Systems, vol. 111, no. 8,
pp.1332 - 1354. 10. Jonsson, P. and Zineldin, M. (2003). “Achieving high satisfaction in supplier-dealer working relationships”, Supply Chain Management: An International
journal Vol.8, No.3, pp 224-240. 11. Kidd, J., Rlchter, F. and Li, X. (2003). “Learnig and trust in supply chain management”, Management Decision 41/7, pp 603-612. 12. Kim S. W. (2007). “Organizational Structures and the Performance of Supply Chain Management”, International Journal of Production Economics, vol. 106,
pp. 323–345. 13. Kolluru R. and Meredith P. H. (2001). “Security and Trust Management in Supply Chains”, Information Management & Computer Security, vol. 9, no. 5, pp.
233-236. 14. Kulchitsky, J. D. and Larson, P. D. (2007). “Information Sharing: At the Heart of SCM”, 92nd Annual International Supply Management Conference. 15. Lado, A. A., Paulraj, A. and Chen, I. J. (2011). “Customer Focus, Supply-Chain Relational Capabilities and Performance: Evidence from U.S. Manufacturing
Industries”. 16. Lazarevic, S. P., Sohal, A. and Baihaqi, I. (2007). “Supply Chain Management Practice and Supply Chain Performance in Australian Manufacturing
Industries”, Working paper. 17. Lazarevic, S. P., Sohal, A. and Baihaqi, I. (2007). “Supply Chain Management Practice and Supply Chain Performance in Australian Manufacturing
Industries”, Working paper. 18. Mandal, A. and Deshmukh, S. G. (1994). “Vender Selection Using Interpretive Structural Modeling’, International Journal of Operations & Production
Management, Vol. 14, No. 6, pp. 52-59. 19. Min S., Roath A. S. and Daugherty P. J. and Genchev S. E. and Chen H. and Arndt A. D. (2005). “Supply Chain Collaboration: What’s happening?” The
International Journal of Logistics Management, vol. 16, no. 2, pp. 237-256. 20. Power, D. (2004). “Supply chain management integration and implementation: A literature review”, Supply Chain Management: An International Journal,
Vol.10, No.4, pp 252-263. 21. Ravi, V., Shankar, R. and Tiwari, M. K. (2005) ‘Productivity improvement of a computer hardware supply chain’, International Journal of Productivity and
Performance Management, Vol. 54, No. 4, pp. 239-255 22. Ruppel, C. (2004). “An Information Systems Perspective of Supply Chain Tool Compatibility: the Roles of Technology Fit and Relationships”, Business
Process Management Journal, vol. 10 no. 3, pp. 311-324 23. Sahay, B. S. (2003). “Understanding Trust in Supply Chain Relationships”, Industrial Data and Management System, vol. 103, no. 8, pp. 553-563. 24. Sahin, F. and Robinson, P. (2004). “Information sharing and coordination in make-to-order supply chains”, Journal of Operation Management Vol.23, pp
579-598. 25. Siddiq, J. (2008). “Revisiting the art of collaboration in the age of internet”, Communication of the IBIMA, Vol.6. pp 21-24. 26. Simatupang, T. M. and Sridharan, R. (2004). “Benchmarking Supply Chain Collaboration: An Empirical Study”, Benchmarking: An International Journal, vol.
11, no. 5, pp. 484-503. 27. Simatupang, T.M. and Sridharan, R. (2002), “The collaborative supply chain”, International, Journal of Logistics Management, vol. 13, no. 1, pp. 15-30. 28. Singh, M. D., Shankar, R., Narain, R. and Agarwal, A. (2003) ‘An Interpretive Structural Modeling of Knowledge Management in Engineering Industries’,
Journal of Advances in Management Research, Vol. 1, No. 1, pp. 28-40. 29. Sridharan, R. and Simatupang, T M. (2003). “A benchmarking scheme for supply chain collaboration”, Benchmarking: An International Journal, vol.9, no.6. 30. Stanley (2008), “Benefits, barriers and bridges to effective supply chain management”, Supply chain Management: An International Journal, Vol.13, No.1,
pp 35-48.

VOLUME NO. 2 (2012), ISSUE NO. 12 (DECEMBER) ISSN 2231-1009
INTERNATIONAL JOURNAL OF RESEARCH IN COMPUTER APPLICATION & MANAGEMENT A Monthly Double-Blind Peer Reviewed (Refereed/Juried) Open Access International e-Journal - Included in the International Serial Directories
http://ijrcm.org.in/
149
31. Stevenson, M. and Spring, M. (2007). “Flexibility from a Supply Chain Perspective: Definition and Review”, International Journal of Operations & Production Management, vol. 27, no. 7, pp. 685-713.
32. Suh, T. and Kwan, I. (2005). “Trust, commitment and relationships in supply chain management: a path analysis”, Supply chain Management: An International Journal, Vol.10, No.1, pp 26-33.
33. Vijayasarathy, L. R. (2010). “Supply integration: An investigation of its multi dimensionality and relational antecedents”, International Journal of production Economics, Vol.124, pp 489-505.
34. Warfield, J.W. (1974) ‘Developing interconnected matrices in structural modeling’, IEEE Transactions on Systems Men and Cybernetics, Vol. 4, No. 1, pp. 51-81.
35. Wiengarten, F., Humphreys, P. and Cao, G. and Fynes, B. and McKittrick, A. (2010). “Collaborative Supply Chain Practices and Performance: Exploring the Key Role of Information Quality”, Supply Chain Management: An International Journal, vol. 15, no. 6, pp.463 - 473.
36. Wu, Y. N. and Cheng, T. C. E. (2008). “The effect of information sharing in a multiple-echelon supply chain”, International Journal of Production Economics, Vol.115, pp 1-11.
37. Yu, Z., Yan, H and Cheng, T. C. E. (2001). “Benefits of Information Sharing with Supply Chain Partnership”, Industrial Management & Data System, vol. 101, no. 3, pp. 114-119.

VOLUME NO. 2 (2012), ISSUE NO. 12 (DECEMBER) ISSN 2231-1009
INTERNATIONAL JOURNAL OF RESEARCH IN COMPUTER APPLICATION & MANAGEMENT A Monthly Double-Blind Peer Reviewed (Refereed/Juried) Open Access International e-Journal - Included in the International Serial Directories
http://ijrcm.org.in/
150
AN EMPIRICAL INVESTIGATION OF INVENTORY MANAGEMENT PRACTICES OF MYSORE PAPER MILLS LIMITED BHADRAVATHI – A CASE STUDY
BASAVARAJAPPA M T
RESEARCH SCHOLAR
DEPARTMENT OF COMMERCE
SCHOOL OF BUSINESS STUDIES
CENTRAL UNIVERSITY OF KARNATAKA
GULBARGA
ABSTRACT
Inventory Management and Inventory Control must be designed to meet the dictates of the marketplace and support the company's strategic plan. The many
changes in market demand, new opportunities due to worldwide marketing, global sourcing of materials, and new manufacturing technology, means many
companies need to change their Inventory Management approach and change the process for Inventory Control. Despite the many changes that companies go
through, the basic principles of Inventory Management and Inventory Control remain the same. Some of the new approaches and techniques are wrapped in new
terminology, but the underlying principles for accomplishing good Inventory Management and Inventory activities have not changed. The Inventory Management
system and the Inventory Control Process provides information to efficiently manage the flow of materials, effectively utilize people and equipment, coordinate
internal activities. Inventory Management and the activities of Inventory Control do not make decisions or manage operations; they provide the information to
Managers who make more accurate and timely decisions to manage their operations. This study was conducted to investigate the inventory management
practices followed by MPM limited. This study conduct to fill the gap in theoretical and empirical knowledge of Inventory management practices of paper
manufacturing units. The data was collected using in-depth structured and non structured interviews with senior managers, lower level managers, operational
workers, site-observations and analysis of existing documented data sources. Validity of the data is ensured through triangulation. This qualitative research uses
critical analysis of the facts to present aspects of the findings. The research findings reveal that manual operation of the inventory management process.
KEYWORDS inventory management, inventory control, manufacturing industry, paper mills.
INTRODUCTION here are four important components for running an industrial organization i.e., Men, machine, material and money. All these four components have to be employed in an industry in order to make the manufacturing process to extract the finished products and marketing it properly to get sales realization with profit. Profit making is an important goal or an object of any industrial organization. To attain the maximum profitability utilizing the above set Four
M’s to the optimum level. Money is used for procurement of the material which is required for the production. During the time of procurement the requirement of the proper material has to be identified and required quality and quality of material has to be decided in advance. This is nothing but a process of material procurement planning. The very purpose of planning of procurement of material is to purchase the good quality material for a most competitive lowest price. This will help the organization to undertake manufacturing process most effectively with minimum or nil wastage. Many times in an industry organization’s improper planning in material procurement leads to filing up material stock in the form of raw-materials; semi-finished goods (W-I-P) unsold finished goods. The aim of such stock is called inventory. Any unwanted stock leads to debt capital which cannot be appreciated as good financial management. Hence, material and money are playing a vital role in the efficient financial management.
STATEMENT OF THE RESEARCH PROBLEMS Every business firm however big and small has to maintain inventory and it constitutes an integral part of the working capital. It has been estimated what inventory in Indian industries constitute a significant portion of current asset inventories require a significant investment not only to acquire them but also to hold them investment in inventory is said to be idle but it is unavoidable in any organization manufacturing or trading. So inventory cost has become necessary cost. Thus it would be very interesting to throw light upon the structure of inventory or the company in order to point out the degree of efficiency with which funds were utilized in the major component of working capital. If the company having a good control and management than it can reduce the cost it increases the profit. The holding period of inventory is more in the company.
OBJECTIVES OF THE STUDY To study the effectiveness of inventory management. To study the inventory management practices in MPM. To evaluate the inventory control techniques in Mysore paper mills limited (MPM) To offer suggestion for improving the efficiency in inventory management
SCOPE OF STUDY This study was mainly concentrated on inventory management being adopted by the company. The purchase procedure followed by the company and further actions for satisfying the requirement are analyzed. The company’s procedure for stores will influence more on the level of inventory of the company. So the study of purchase has vital role to understand the efficient system of the company.
LIMITATIONS OF THE STUDY 1. The time constraint which the study has been conducted only for six weeks. 2. The expected delivery schedules may not be possible in some monopoly items. The average level can be fixed after an in depth study. 3. Level of accuracy of results of research restricted to the accuracy level. 4. The ABC classifications were done for materials and some materials were selected and studied. The study can be extended to other materials also on the
same lines.
INDIAN PAPER INDUSTRIAL SCENARIO The paper industry is cyclical in nature: its demand is linked to the level of economic activity and the supply is influenced by domestic production and as well as international trade in pulp and paper.USA (over 30%), Western Europe (around 20%), and Japan (12-15%) account for a major portion of the demand. Global
T

VOLUME NO. 2 (2012), ISSUE NO. 12 (DECEMBER) ISSN 2231-1009
INTERNATIONAL JOURNAL OF RESEARCH IN COMPUTER APPLICATION & MANAGEMENT A Monthly Double-Blind Peer Reviewed (Refereed/Juried) Open Access International e-Journal - Included in the International Serial Directories
http://ijrcm.org.in/
151
demands add stagnated in 1990-93 at around 250MN TPA with showing down of economic growth. Per capital consumption actually dropped 3-5% and with dropping demand capacities closed down. The recovery started in 1993-94 with improvement economic outlook. In 1994-95 international pulp and paper prices kept rising on the back of growing demand. India’s per capital consumption is very low at 3 kg against a world average of over 45 kgs, domestic industry has nearly 600 mills with an aggregate capacity of 3.8 MN tons per annum. Out of 600 mills, 30 are large wood/bamboo based mills, 80 are agro based and rest are waste paper based. The effective capacity is about 2.6 million tones as a lot of mills are sick. In the new s print segment total capacity is around0.4million TPA (MTPA), of this 73% is dominated by four major players in the public sector while the rest of the capacity is shared by 14 players.
FUTURE PROSPECTUS OF PAPER INDUSTRY Strong demand from packaging segment will drive demand growth for industrial paper. Establishment of new business area such as telecom and power will lead to increasing literacy levels, thus improving low per capital consumption of paper (3.2 kgs p.a). Besides rapid growth in population, enhanced literacy levels, growing quality consciousness and changing consumer preferences will drive paper demand. In view high capital costs, expansion of existing units and revivals of sick units remain the practical option for capacity addition. Also, paper mills in India have to look for ways to cut down costs to compete with imports. International paper prices are not expected to prices are not expected to price substantially over the short medium term. Domestic paper companies will thus continue to reel under the pressure of reduced margins. However, a depreciating rupee will marginally protect domestic companies from imports. Due to increased supply, some of the companies have put their expansion plans on hold or have reduced their investment opting for lesser capacity expansions.
HISTORICAL PAPER INDUSTRY DEVELOPMENT IN INDIA Indian paper industry is classified broadly into two categories into two categories paper and paper bonds then newsprint. The paper and paperboard segment constitutes of cultural paper, industrial paper and special paper. Paper industry in India has a long history with the first mill being commissioned in 1832. The initial development and growth of paper industry till the early nineteenth century was affected by the shortage of wood (soft wood) in the country. But in 1914, in development of a process based on bamboo lead rapid growth of domestic industry. By the end of sixties, the capacity for paper production lagged, demand and imports increased to approximately 10% of the domestic demand. Most of the domestic production was concentrated in the hands of a few large mills. By the late sixties, bamboo as an input to paper industry came under short supply. Taking this into account, the government of India started encouraging small units based on an agro residue and waste paper in the seventies. Fiscal incentives were also offered. This lead to spurt in the number of mills with small capacities. But from the late eighties industry started facing an oversupply situation lower price realization and plant closures. The downtrend continued till 1992, when demand supply situation improved. From 1993, step with the easing of the worldwide recession in the industry, investments stated increasing. A booming capital market also helped in raising money for new capacities. The industry was in a jolly mood up to 1996. The increase in supply coupled with a worldwide recession has pushed the Indian paper industry back into down trend. The global cycle was further affected by the Asian crises, which has reduced demand considerably. Since 1990 the paper industry in India, is following global cycle with periods of over capacity leading to drop in paper prices, lower capacity utilization and slow down in investments/capacity addition, followed by closure of mill, decreased in demand supply gap and then back full circle to an increase in paper prices.
BACKGROUND AND INCEPTION OF THE COMPANY The MPM situated on the bank of river Bhadra at Bjadravathi, Shimoga Dist., Karnataka state, was incorporated in the year 1936 as a joint sector company. The foundation stone was laid by the then Maharaja of Mysore Sri. Krishanarajendra Wodeyar. It was started with a small capacity of Rs.2.5 million. Since inception, the MPM never looked back. It went from one threshold of progress to another expanding its annual capacity to 8000 MT in 1952, then to 18000 MT in 1964 and to 24000 MT in 1972. In 1976 the company ventured a major expansion project by installing new machinery to produce 75000 MT of news print per annum and increasing the capacity from 24000 MT to 30000 MT per annum of writing and printing varieties of paper. The project was completed during 1981. In 1983, a sugar mill of 2500 TCD was commissioned and thus MPM become the first largest, single location integrated plant in the country manufacturing news, writing and printing paper and sugar at a single location. The integration of sugar mill with paper mill is with the idea of utilizing the by-products of sugar mill i.e., sugar cane baggase for paper production and avoid dependence of forest based raw materials and avoid deforestation. With the commissioning of newsprint project, the company was able to help the country to reduce imports substantially.
BRIEF EXPLANATION ABOUT THE ORGANIZATIONAL STRUCTURE OF MPM The organizational structure of enterprises would depend upon its size, product manufactured and its fictional divisions. The organizational structure may be flexible. The company may change its structure according to the needs and suitability. In MPM Ltd., the Board of directors is having the major position in the company. The chairman is the chairman cum managing Director (CMD) of the company. He is held responsible for formulating and implementing the policies, Procedures and rules with the assistance of Board of Directors appointed by the Government and various financial institutions. Different functional department heads like production, marketing finance, and HRD & A etc., also assists him. The Government appoints the General Manager of HRD & A. He always keeps contact with all other functional departments for routine administration. He also keeps direct contact with C.M.D. Each functional department heads are assisted by the Assistant Managers. The Director of Production is in charge of some divisions’ viz., Material, Paper, Pulp, Sugar, Chemical etc., there is always co-ordination between all functional departments through horizontal communication
INVENTORY MANAGEMENT PRACTICES IN MPM The literary meaning of the word “inventory” is stock of goods. Every enterprise needs inventory for smooth running of its activities. It serves as a link between production and distribution process. The unforeseen fluctuation in demand and supply of goods also necessitates the need for inventory. It also provides a cushion for future price fluctuations. The purpose of inventory management is to ensure availability of materials in sufficient quality and quantities as and when required and allow minimizing investment in inventories. Thus it is very essential to have proper control and management of inventory. Activity Ratios or Turnover Ratios at Mysore paper mills ltd.., Activity ratios are calculated to measure the efficiency with which the resources of a firm have been employed. These ratios are also called turnover ratios because they indicate the speed with which assets are being turned over into sales. Some of the turnover ratios that are used to know the efficiency of inventory management in Mysore paper mills lit…, are as follows: inventory turnover ratio, inventory conversion period, raw material turnover ratio, stores and spares turnover ratio, work-in-process turnover ratio, finished goods turnover ratio, inventory to working capital ratio, fixed asset turnover ratio. Inventory Turnover Ratio at Mysore Paper Mills Ltd Inventory turnover ratio measures the velocity of conversion of stock into sales. Usually, a high inventory turnover velocity indicates efficient management of inventory because more frequently the stocks are sold; the lesser amount of money is required to finance the inventory. A low inventory turnover ratio indicates an inefficient management of inventory. A very high turnover of inventory does not necessarily implies higher profits. The profits may be low due to excessive cost incurred in replacing stock in small lots, stock-out situations, selling inventories at very low prices etc., The different components of inventory are raw materials, work-in-process. store, spares and finished goods.

VOLUME NO. 2 (2012), ISSUE NO. 12 (DECEMBER) ISSN 2231-1009
INTERNATIONAL JOURNAL OF RESEARCH IN COMPUTER APPLICATION & MANAGEMENT A Monthly Double-Blind Peer Reviewed (Refereed/Juried) Open Access International e-Journal - Included in the International Serial Directories
http://ijrcm.org.in/
152
TABLE 1: INVENTORY TURNOVER RATIO (RS IN LAKHS)
Years Cost of goods sold Avg. inventory Ratio
2005 37791.16 11004.83 3.43
2006 40331.81 11274.68 3.577
2007 46860.56 12904.125 3.631
2008 44240.68 14802.155 2.989
2009 45692.28 15617.21 2.926
2010 44667.86 13256.66 3.369
Source: MPM annual reports
FIG. 1: INVENTORY TURNOVER RATIO
The inventory turnover ratio was 3.43 in 2005 and it is decreased to 2.926 in 2009 because inventory consumed and production high but in the 2010 it is increase to 3.369 it is not good compared to previous year and also cost (cost of goods sold) is high.
RAW MATERIAL TURNOVER RATIO It is the ratio with which we can measure the efficiency with which the firm converts raw materials in to work in progress. Materials consumed can be found out as opening balance of raw materials plus purchase minus closing balance of raw materials.
TABLE 2: RAW MATERIAL TURNOVER RATIO (Rs in Lakhs)
Years Sales Raw material Ratio
2005 32128.00 7530.62 4.266
2006 34927.31 9116.53 3.83
2007 41519.00 6609.52 6.282
2008 39405.00 6449.79 6.109
2009 42490.00 9210.67 4.613
2010 33743.00 8139.07 4.146
Source: MPM annual reports
FIG. 2: RAW MATERIAL TURNOVER RATIO
This ratio indicates the relationship between the sales and raw materials. In the year 2005 it was 4.266 and it is increase to 6.282 in 2007 there is strong relationship between sales and raw materials but in 2010 it is decrease to 4.146 it shows decrease the efficiency of the firm.
0
0.5
1
1.5
2
2.5
3
3.5
4
1 2 3 4 5 6
Ratio
Ratio
0
1
2
3
4
5
6
7
1 2 3 4 5 6
Ratio
Ratio

VOLUME NO. 2 (2012), ISSUE NO. 12 (DECEMBER) ISSN 2231-1009
INTERNATIONAL JOURNAL OF RESEARCH IN COMPUTER APPLICATION & MANAGEMENT A Monthly Double-Blind Peer Reviewed (Refereed/Juried) Open Access International e-Journal - Included in the International Serial Directories
http://ijrcm.org.in/
153
STOCK IN PROCESS TURNOVER RATIO TABLE 3: STOCK IN PROCESS TURNOVER RATIO (Rs in Lakhs)
years Sales Stock in progress Ratio
2005 32128.00 86.02 373.49
2006 34927.31 86.82 402.295
2007 41519.00 101.25 410.06
2008 39405.00 134.45 293.08
2009 42490.00 142.56 298.05
2010 33743.00 94.31 357.78
Source: MPM annual reports
FIG. 3: STOCK IN PROCESS TURNOVER RATIO
This ratio shows the relationship between the sales and stock in process. It was 373.49 in the 2005 but it is decreased to 298.05 in the year 2009. But in the 2010 it is increased to 357.78 it is not good to organization because stock in process turnover ratio is should be decrease and stock in process could be increase so it is better to origination.
FIXED ASSET TURNOVER RATIO TABLE 4: FIXED ASSET TURNOVER RATIO (Rs in Lakhs)
Years Sales Fixed assets Ratio
2005 32128.00 16268.63 1.97
2006 34927.31 15409.83 2.27
2007 41519.00 14660.64 2.83
2008 39405.00 13745.73 2.87
2009 42490.00 12914.34 3.29
2010 33743.00 12234.46 2.76
Source: MPM annual reports
FIG. 4: FIXED ASSET TURNOVER RATIO
This ratio indicates the extent, which the investment in fixed assets contribution was 1.97 times in the year 2005. And it has increased to 3.29 in 2009. But in 2010 it is sudden changes (i.e. decreased) in fixed assets turnover ratio that is 2.76 because of huge changes in sales so the fixed assets turnover ratio decreased.
0
50
100
150
200
250
300
350
400
450
1 2 3 4 5 6
Ratio
Ratio
0
0.5
1
1.5
2
2.5
3
3.5
1 2 3 4 5 6
Ratio
Ratio

VOLUME NO. 2 (2012), ISSUE NO. 12 (DECEMBER) ISSN 2231-1009
INTERNATIONAL JOURNAL OF RESEARCH IN COMPUTER APPLICATION & MANAGEMENT A Monthly Double-Blind Peer Reviewed (Refereed/Juried) Open Access International e-Journal - Included in the International Serial Directories
http://ijrcm.org.in/
154
INVENTORY CONTROL TECHNIQUES OF MPM LTD ABC ANALYSIS Large number of firms has to maintain several types of inventories. It is not desirable to keep the same degree of control on all the items. The firm should pay maximum attention to those items whose value is the highest. The firm should therefore classify inventories to identify which items should receive the most effort in controlling. The firm should be selective in its approach to control investment in various types of inventories. The high value items are classified as ‘A’ items and would be under the tightest control. ‘B’ items fall into between these 2 categories and require reasonable attention of management. ‘C’ items represent relatively least value and would be under simple control.
ECONOMIC ORDERING QUANTITY One of the major inventory management problems to be resolved is how much inventory should be added when inventory is replenished. The EOQ should be applied to Mysore paper mills ltd for the purpose of many units should be issued for production department as per production schedule. The will involves the ordering cost and carrying cost. For analyzing the EOQ techniques company’s 2 years raw materials data should be taken it should be presented and calculated. It is the fixed quantity of material which is ordered when the stock comes down to a reorder level, so that cost of purchasing is equal to cost of storage making the total inventory cost minimum. There are various ways of determining the EOQ, such as setting out a tabulation of cost for various order quantities until the minimum cost is determined or by formula or by using a graph. The most convenient way is the following formula: EOQ = √ 2 * Cost of placing an order * Demand for the period Purchase price per unit * cost of storage as % of total landed cost The EOQ applied to Mysore paper mills ltd raw materials for 2 years. The company’s EOW units will be varied in 2 year because of quantities issued to the production department will be change the year after year. If the consumption rates will increase the quantities of raw materials should also be increased for the production. The every item in EOQ techniques presented in table will be used for paper production.
VED ANALYSIS This classification is usually applied for spare parts to be stocked for maintenance of machines and equipment based on the criticality of the spare parts. The stocking policy is based on criticality of the items. The vital spare parts are those which can cause stoppage of the plant if not available usually such spare parts are known as capital or insurance spares.
HML ANALYSIS The high, medium and low classification follows the same procedure as if adopted in ABC classification only difference is that in HML, the classification unit value is a criteria and not the annual consumption value. The items are inventory should be listed in the descending order of unit value and it is up to the management to fix limits for three categories. HML analysis is useful for keeping control or consumption at departmental levels for deciding the frequency of the physical verification and for controlling purchase.
FINDINGS 1. Inventory turnover ratio are increased from 2005 to 2007(3.43 to 3.631) than it decrease in 2008, 2009 finally it increased in the 2010. As same as the
inventory conversion period is decreasing while increased the ratio and increasing while decrease the ratio. 2. Raw material turnover ratio is lowest in 2006 at 3.83 and highest in the year of 2007 at 6.282 it can measure the efficiency of the firm. 3. Stock in process increases in 2007, 2008, 2009 at 101.25, 134.45. 142.56, respectively but it decrease in 2010 at 94.31 it is not better to organization. 4. Stock-in-process ratio should be decrease so it is good to organization but it increase from year to year in 2005 it was 373.49 but it increase 402.295 to in
2008. 5. Investment in fixed asset contribution was 1.97 times in the year 2005, and it has increased in 2009 at 3.29 but in sudden decrease in 2010 at 2.76 times. 6. For making ABC analysis usually companies consider value and consumption. In Mysore paper mill limited, they also consider the value and consumption of
raw materials. This is one of the best evaluations of ABC analysis in which the company has developed.
SUGGESTIONS As per the study inventory management and its implementation in Mysore Paper Mill Ltd., it was revealed that management of the inventories play strong role in the success of the organization 1) There is always a threat from the domestic players and a potential threat from the MNC is for the MPM so it is desirable to contract effective barriers to
reduce competition. 2) The MPM should also concentrate on the diversification so as to ensure expansion and to utilize the unexploited opportunities. 3) As the dealers are not satisfied by the margin offered by the company, it should increase the margin for the dealers who have been utilized both for selling
and collecting marketing information. 4) The company should also target on the high customers who from the customer base from the MNCs. 5) The company should invest on more on R&D to come up with new varieties of paper in a cost effective manner. 6) The company has use various technologically advanced media such as the internet, mobile, advertising and digital displays to promote its products apart
from the conventional media. 7) It should periodically contract its dealers and customer and should review its performance. 8) Implementation of better and new information system entrepreneur resource planning, software packages, as discussed will cater to the additional
information requirements of the company which in turn will improve the efficiency of management of inventory control system. 9) For making ABC analysis usually companies consider value and consumption. In Mysore Paper Mill Ltd.., they also consider the value and consumption of
the raw materials. This is one of the best evaluations of ABC analysis in which the company has developed. 10) The store should be moderate according to the needs of the company. This will provide effective, safe and good storage system. 11) The company is making open order for the whole year to the supplier and the plants according to monthly schedule produce the inventories. 12) The company should follow the first in first in first out method in issuing the materials to the production department. 13) These materials issuing practices are doing well and have more contribution towards effective material management. It helps a lot in achieving effective
inventory control over the materials in the company. 14) The Company which is gives more concentrates on employees benefit for the current year (i.e. the employee’s benefit which increased compared to
previous year) that has to be reduce. 15) The company which gives more cash discount on sales so this is not good for organization. 16) Employers do not use any set of safety helmets and also. So it makes compulsory use of safety helmets while doing the work which helps to the efficiency
and health of employees.

VOLUME NO. 2 (2012), ISSUE NO. 12 (DECEMBER) ISSN 2231-1009
INTERNATIONAL JOURNAL OF RESEARCH IN COMPUTER APPLICATION & MANAGEMENT A Monthly Double-Blind Peer Reviewed (Refereed/Juried) Open Access International e-Journal - Included in the International Serial Directories
http://ijrcm.org.in/
155
17) The company can consider by producing the other varieties of paper like cards, drawing paper etc. 18) Excessive labor in certain department they should try to remove the labor.
REFERENCES 1. Ashayeri, J., Heuts, R., & Jansen, A.,(1996),“Inventory management of repairable service parts for personal computers A case study.”,International Journal
of Operations and Production Management, Vol 16 No.12,pp74-96. 2. Buxey, G., (2009), “Reconstructing inventory management theory”, International Journal of Production and Operations Management, Vol 26 No.9, pp996-
1012. 3. Rajeev, N., 2008, “Inventory management in small & medium enterprises, A study of machine tool enterprises in Bangalore.” Management Research News,
Vol 31, No.9, pp659-669. 4. Williams, B.D., and Tokar, T., 2008, “A review of inventory management research in major logistics journals: Themes and future directions”, The
International Journal of Logistics Management, Vol.19, No.2, pp212-232. 5. http://www.mpm.co.in/annualresults.html accessed on 17th march 2012 6. http://www.mpm.co.in/quarterlyresults.html accessed on 15th march 2012 7. http://www.mpm.co.in/shareholder.html accessed on 17th march 2012

VOLUME NO. 2 (2012), ISSUE NO. 12 (DECEMBER) ISSN 2231-1009
INTERNATIONAL JOURNAL OF RESEARCH IN COMPUTER APPLICATION & MANAGEMENT A Monthly Double-Blind Peer Reviewed (Refereed/Juried) Open Access International e-Journal - Included in the International Serial Directories
http://ijrcm.org.in/
156
A STUDY ON PERFORMANCE OF MOBILE BAKING SERVICES AND MODELS IN INDIA
M.GANGU NAIDU
RESEARCH SCHOLAR
DEPARTMENT OF MANAGEMENT OF STUDIES
K L UNIVERSITY
GREEN FIELDS
ABSTRACT
Mobile banking (M-Banking) has been welcomed in most of the countries as a new branch in electronic banking (E-Banking). Mobile banking (also known as M-
Banking) is a term used for performing balance checks, account transactions, payments, credit applications and other banking transactions through a mobile
device such as a mobile phone or Personal Digital Assistant (PDA). In developing countries such as Iran mobile banking is limited to fields such as SMS due to lack
of infrastructure and because of high costs. In this paper we present a method for developing banking services through mobile phone in the bank area. Customers
inside the bank and also around the bank are connected to the bank system through Bluetooth technology and handle their banking operations through their
mobile phones. This way they won't pay any additional cost and for example they can handle operations while they are inside their car parked near the bank.
Moreover they can handle some of their other banking operations through their mobile phones while they are dealing with other activities inside the bank. This
way they can use their time in an optimal way and the banks can also avoid the rush hours. Since our method using Bluetooth, most of mobile phones can use this
system.
KEYWORDS E-Commerce, Electronic Banking, Mobile baking models, Mobile marketing, perception and Statistics.
INTRODUCTION lectronic commerce, commonly known as e-commerce or e-comm, is the buying and selling of products or services over electronic systems such as the Internet and other computer networks. Electronic commerce draws on such technologies as electronic funds transfer, supply chain management, Internet marketing, online transaction processing, electronic data interchange (EDI), inventory management systems, and automated data collection systems.
Modern electronic commerce typically uses the World Wide Web at least at one point in the transaction's life-cycle, although it may encompass a wider range of technologies such as e-mail, mobile devices and telephones as well. Mobile banking (also known as M-Banking) is a term used for performing balance checks, account transactions, payments, credit applications and other banking transactions through a mobile device such as a mobile phone or Personal Digital Assistant (PDA). Mobile banking and Mobile payments are often, incorrectly, used interchangeably. The two terms are differentiated by their service provider-to-consumer relationship; financial institution-to-consumer versus commercial institution-to-consumer for mobile banking and payments, respectively. Mobile Banking involves using mobile devices gain to access financial services. Mobile payments on the other hand may be defined as the use of mobile devices to pay for goods or services either at the point of purchase or remotely. Bill payment is not considered a form of mobile payment because it does not occur in real time. The earliest mobile banking services were offered over SMS, a service known as SMS banking. With the introduction of the first primitive smart phones with WAP support enabling the use of the mobile web in 1999, the first European banks started to offer mobile banking on this platform to their customers. After Internet Banking, Mobile Banking or M-Banking has become the buzz word in the industry. It's a fact that Internet Banking has given a boost and has shown a successful way to consider it as a good alternative procedure against physical branch banking. Now where ever you are, you can access your bank account and you can do lot more things like checking your account balance, transfer money to some other account, pay your utility bills online and so on, just by comfortably sitting at your home or office. But, the technical disadvantage of Internet Banking is, you have to have internet connectivity and a computer. Definitely it's not a big hindrance in US or Europe or in the other developed countries, but if one considers the developing economies, then it's a genuine problem and more specifically in the tier II cities. And here Mobile Banking comes into the picture to address the basic limitation of Internet Banking. If we only consider Asian developing countries, the availability of mobile connectivity is really huge. Where one may not find out a landline telephone or an internet connection, but still in those remote places getting mobile connectivity is not a major issue today. So, Mobile Banking has given the traditional banking a newer look "Anywhere Banking". Now you don't need a PC or a laptop with internet connectivity, just you need your cell phone with you. Considering the Asian economy countries like China, India and Korea have seen the mobile boom in last one decade. A projected value of mobile connectivity in India shows that it will touch 180 Million subscribers by the end of 2008, where it was pegged at around 2 Million in the year 2000. In Korea, more than 70% of the entire population is carrying mobile devices. The biggest advantage Mobile Banking provides to the banks is that it helps to cut down the costs as it's even more economic than providing tele-banking facilities where banks have to keep hundreds of tele-callers. Additionally, Mobile Banking helps banks to upgrade the quality of services and nature of customer relationship management. Using Mobile Banking, banks can communicate to the defined cluster of clients. The offers can be customized and this personalization can give the banking industry a huge mileage, even at a lower cost. Again, using the same mobile channels, banks can up-sell and cross-sell their highly complex financial products to the specific set of customers which can be coupled with the selling strategies of Credit Cards, Home Loans and Personal Loans etc. On the contrary, the service providers can also accrue more business by providing the Mobile Banking services to their clients. Countries like Japan, Korea or Singapore where the mobile connectivity has already reached its saturation, the service providers can make handsome business by providing additional banking services to the same static client base. In the services front, different banking services can be provided, depending upon the banking regulations in respective countries which may include Account Balance Enquiry, Account Statement Enquiry, Credit/Debit Alerts, Bill Payment Alerts, Cheque Book Requisition, Transaction History, Minimum Balance Alerts, Fund Transfer Facilities, etc. Mobile Banking activities can be categorized in two different manners. 1. By the Nature of Service: It can be any of the two, either Enquiry Based or Transaction Based. For example, Account Balance Enquiry or a Cheque Book Requisition can be the good examples of Enquiry Based Services where a Fund Transfer or a Bill Payment is a Transaction Based activity. 2. Depending on the Originator: Again there can be two different types of services; Push and Pull, depending on the nature of the originator. A Push based service is from the Bank to the Client and vice versa. For example, Bill Payment Alert can be a Push based service, when getting Recent Account History is a Pull based one. In different countries, Mobile Banking has already gained its popularity. For example, in the South Korean market LG Telecom teamed up with Kookmin Bank to provide their Mobile Banking services in 2004 and since then they have seen a nice and steady growth. In India, Reliance InfoComm Ltd. has started providing Mobile banking services to ICICI Bank and HDFC Bank through their R-World environment. The Mobile Banking services will become more popular once the availability of the smart phones or PDA phones shall increase as Smart Phones come with larger screens and bigger memory size. In the application development front, both J2ME and BREW have done excellent work and industry expects by the year 2012, more than 80% of the mobile handsets will be able to run stand alone Mobile Banking applications and that time it will be "Anywhere Banking" in real sense.
E

VOLUME NO. 2 (2012), ISSUE NO. 12 (DECEMBER
INTERNATIONAL JOURNAL OF RESEARCH IN COMA Monthly Double-Blind Peer Reviewed (Refereed
LITERATURE REVIEW Functionalities provided by banks in the developed markets has been incrementally enhanced by various banks which initiated f“viewing” to that of “transactional capabilities” in last few years till 2010. Study conducted by Rsuch as Mobile Payment Mobile account operations, Mobile Brokerage, Mobile based financial Information service suiting to thetechnologies till that period (Tiwari & Buse 2007). Yankee Group’s study indicated Moving Banks from Inquiry to revenue generation including PeerPayments to Attract Generation Y, the Un-banked and UnderBanking to Your Customers” describes the progress of mobile banking in the developed markets with popular functionalities up Inquiries, Funds Transfer, Location finders, Bill Pay, Normal alerts (Riley, Schmidt & Tubin 20View Images, Check reorder, M-statements, personal finance, Action alerts, and Advanced Mobile payments. Celent research report “key trends Key Trends in Mobile Financial Services in the European describes functionalities such as Mobile digital content, Mobile remote purchases, Mobile proximity purchases, Mobilticketing, Mobile P2P and remittances (Florina 2009). Also Blog by Celent Research’s senior analyst Jacob Jegher, describes automated functionalities to positive pay decision, payment approvals esp. in corporate Banking world (Jegher 2010).
THE METHODOLOGY AND OBJETIVES In predicting the multi-dimensional functional I referred various research
• To Understanding the potentials Capabilities of mobile phones to cater to multiple areas suiting the business needs in future
• To study of mobile banking models.
• To study of Growth rate of the Mobile Banking channel.
• To study of Regional trends of Mobile Banking growth and services in world.
MOBILE BANKING MODELS Mobile banking (also known as M-Banking) is a term used for performing balance checks, account transactions, payments, credit applications and other banking transactions through a mobile device such as a mobile phone or Personal Digital Assistant (PDA).Mobile banking and Mobile payments are often, incorrectly, used interchangeably. The two terms are differentiated by their serelationship; financial institution-to-consumer versus commercial institutioninvolves using mobile devices gain to access financial services. Mobile payments on the other hand may be defined as the use or services either at the point of purchase or remotely. Bill payment is not considered a form of mobile payment because it dThe earliest mobile banking services were offered over SMS, a servicWAP support enabling the use of the mobile web in 1999, the first European banks started to offer mobile banking on this platMobile banking has until recently (2010) most often been performed via SMS or the Mobile Web. Apple's initial success with iPhone and the rapid phones based on Google's Android (operating system) have led to increasing use of special client programs, called apps, d
A MOBILE BANKING CONCEPTUAL MODEL Mobile Banking refers to provision and an ailment of bankingservices may include facilities to conduct bank and stock market transactions, to administer accounts and to access customised information."According to this model Mobile Banking can be said to consist of three inter
FIGURE
Most services in the categories designated Accounting and Brokerage are transactionhowever essential for conducting transactions - for instance, balancebrokerage services are therefore offered invariably in combination with information services. Information services, on the otindependent module. Mobile banking may also be used to help in business situations as well as financial.
MOBILE BANKING BUSINESS MODELS A wide spectrum of Mobile/branchless banking models is evolving. However, no matter what business model, if mobile banking isincome populations in often rural locations, the business model will depend on banking agents, i.e., retail or postal outletsbehalf telcos or banks. The banking agent is an important part of the mwill depend on them. Many telcos will work through their local airtime resellers. However, banks in Colombia, Brazil, Peru, abakeries, etc. These models differ primarily on the question that who will establish the relationship (account opening, deposit taking, lendBank or the Non-Bank/Telecommunication Company (Telco). Another difference lies in the naturModels of branchless banking can be classified into three broad categories
ECEMBER)
INTERNATIONAL JOURNAL OF RESEARCH IN COMPUTER APPLICATION Refereed/Juried) Open Access International e-Journal - Included in the International Serial Directories
http://ijrcm.org.in/
Functionalities provided by banks in the developed markets has been incrementally enhanced by various banks which initiated f“viewing” to that of “transactional capabilities” in last few years till 2010. Study conducted by Rajesh Tiwari and Stephen Buse demonstrated the functionalities such as Mobile Payment Mobile account operations, Mobile Brokerage, Mobile based financial Information service suiting to the
7). Yankee Group’s study indicated Moving Banks from Inquiry to revenue generation including Peerbanked and Under-banked (Paisner, Castonguay & Collins 2009). Also the research paper by Tower group on “
Banking to Your Customers” describes the progress of mobile banking in the developed markets with popular functionalities up Inquiries, Funds Transfer, Location finders, Bill Pay, Normal alerts (Riley, Schmidt & Tubin 2009), Further in 2009-1010 advanced functionalities have stabilized.
statements, personal finance, Action alerts, and Advanced Mobile payments. Celent research report “key trends Key Trends in European describes functionalities such as Mobile digital content, Mobile remote purchases, Mobile proximity purchases, Mobil
ticketing, Mobile P2P and remittances (Florina 2009). Also Blog by Celent Research’s senior analyst Jacob Jegher, describes automated functionalities to positive pay decision, payment approvals esp. in corporate Banking world (Jegher 2010).
dimensional functional I referred various research materials in terms of
To Understanding the potentials Capabilities of mobile phones to cater to multiple areas suiting the business needs in future
To study of Growth rate of the Mobile Banking channel.
gional trends of Mobile Banking growth and services in world.
Banking) is a term used for performing balance checks, account transactions, payments, credit applications and other banking hrough a mobile device such as a mobile phone or Personal Digital Assistant (PDA).
Mobile banking and Mobile payments are often, incorrectly, used interchangeably. The two terms are differentiated by their seconsumer versus commercial institution-to-consumer for mobile banking and payments, respectively. Mobile Banking
involves using mobile devices gain to access financial services. Mobile payments on the other hand may be defined as the use or services either at the point of purchase or remotely. Bill payment is not considered a form of mobile payment because it dThe earliest mobile banking services were offered over SMS, a service known as SMS banking. With the introduction of the first primitive smart phones with WAP support enabling the use of the mobile web in 1999, the first European banks started to offer mobile banking on this plat
until recently (2010) most often been performed via SMS or the Mobile Web. Apple's initial success with iPhone and the rapid phones based on Google's Android (operating system) have led to increasing use of special client programs, called apps, d
Mobile Banking refers to provision and an ailment of banking- and financial services with the help of mobile telecommunication devices. The scope of offered
to conduct bank and stock market transactions, to administer accounts and to access customised information."According to this model Mobile Banking can be said to consist of three inter-related concepts:
FIGURE 1: A MOBILE BANKING CONCEPTUAL MODEL
Most services in the categories designated Accounting and Brokerage are transaction-based. The non-transaction-based services of an informational nature are for instance, balance inquiries might be needed before committing a money remittance. The accounting and
brokerage services are therefore offered invariably in combination with information services. Information services, on the otle. Mobile banking may also be used to help in business situations as well as financial.
A wide spectrum of Mobile/branchless banking models is evolving. However, no matter what business model, if mobile banking isincome populations in often rural locations, the business model will depend on banking agents, i.e., retail or postal outletsbehalf telcos or banks. The banking agent is an important part of the mobile banking business model since customer care, service quality, and cash management will depend on them. Many telcos will work through their local airtime resellers. However, banks in Colombia, Brazil, Peru, a
These models differ primarily on the question that who will establish the relationship (account opening, deposit taking, lendBank/Telecommunication Company (Telco). Another difference lies in the nature of agency agreement between bank and the Non
Models of branchless banking can be classified into three broad categories - Bank Focused, Bank-Led and Nonbank-Led.
Mobile Account
Mobile Financial information
servicesMobile Brokerage
ISSN 2231-1009
PUTER APPLICATION & MANAGEMENT Included in the International Serial Directories
157
Functionalities provided by banks in the developed markets has been incrementally enhanced by various banks which initiated from basic information such as ajesh Tiwari and Stephen Buse demonstrated the functionalities
such as Mobile Payment Mobile account operations, Mobile Brokerage, Mobile based financial Information service suiting to the advancement in the 7). Yankee Group’s study indicated Moving Banks from Inquiry to revenue generation including Peer-to-Peer
banked (Paisner, Castonguay & Collins 2009). Also the research paper by Tower group on “Ceiling Banking to Your Customers” describes the progress of mobile banking in the developed markets with popular functionalities up to 2007-2008 such Balance
1010 advanced functionalities have stabilized. statements, personal finance, Action alerts, and Advanced Mobile payments. Celent research report “key trends Key Trends in European describes functionalities such as Mobile digital content, Mobile remote purchases, Mobile proximity purchases, Mobile
ticketing, Mobile P2P and remittances (Florina 2009). Also Blog by Celent Research’s senior analyst Jacob Jegher, describes the functional usage to advance to
To Understanding the potentials Capabilities of mobile phones to cater to multiple areas suiting the business needs in future.
Banking) is a term used for performing balance checks, account transactions, payments, credit applications and other banking
Mobile banking and Mobile payments are often, incorrectly, used interchangeably. The two terms are differentiated by their service provider-to-consumer consumer for mobile banking and payments, respectively. Mobile Banking
involves using mobile devices gain to access financial services. Mobile payments on the other hand may be defined as the use of mobile devices to pay for goods or services either at the point of purchase or remotely. Bill payment is not considered a form of mobile payment because it does not occur in real time.
e known as SMS banking. With the introduction of the first primitive smart phones with WAP support enabling the use of the mobile web in 1999, the first European banks started to offer mobile banking on this platform to their customers.
until recently (2010) most often been performed via SMS or the Mobile Web. Apple's initial success with iPhone and the rapid growth of phones based on Google's Android (operating system) have led to increasing use of special client programs, called apps, downloaded to the mobile device.
and financial services with the help of mobile telecommunication devices. The scope of offered to conduct bank and stock market transactions, to administer accounts and to access customised information."
based services of an informational nature are
inquiries might be needed before committing a money remittance. The accounting and brokerage services are therefore offered invariably in combination with information services. Information services, on the other hand, may be offered as an
A wide spectrum of Mobile/branchless banking models is evolving. However, no matter what business model, if mobile banking is being used to attract low-income populations in often rural locations, the business model will depend on banking agents, i.e., retail or postal outlets that process financial transactions on
obile banking business model since customer care, service quality, and cash management will depend on them. Many telcos will work through their local airtime resellers. However, banks in Colombia, Brazil, Peru, and other markets use pharmacies,
These models differ primarily on the question that who will establish the relationship (account opening, deposit taking, lending etc.) to the end customer, the e of agency agreement between bank and the Non-Bank.

VOLUME NO. 2 (2012), ISSUE NO. 12 (DECEMBER
INTERNATIONAL JOURNAL OF RESEARCH IN COMA Monthly Double-Blind Peer Reviewed (Refereed
1. BANK-FOCUSED MODEL The bank-focused model emerges when a traditional bank uses nonExamples range from use of automatic teller machines (ATMs) to internetcustomers. This model is additive in nature and may be seen as a modest extension of conventional branch2. BANK-LED MODEL The bank-led model offers a distinct alternative to conventional branchagents (or through mobile phone) instead of at bank branches or through bank employees. This model promises the potential to financial services outreach by using a different delivery channel (retailers/ mobile phones), a different trade partner (telctarget market distinct from traditional banks, and may be significaneither using correspondent arrangements or by creating a JV between Bank and Telco/nonbank. 3. NON-BANK-LED MODEL The non-bank-led model is where a bank has a limited role in the dayfunds. Account management functions are conducted by a non
MOBILE BANKING SERVICES A specific sequence of SMS messages will enable the system to verify if the client has sufficient funds in his or her wallet transaction at the agent. When depositing money, the merchant receives cash and the system credits the client's bank account or mobile wallet. In the same way the client can also withdraw money at the merchant: through exchanging SMS to provide authorization, the merchant hands tmerchant's account. Kenya's M-PESA mobile banking service, for example, allows customers of the mobile phone operator Safaricom to hold cash balances whichtheir SIM cards. Cash may be deposited or withdrawn from Melectronically from person to person as well as used to pay bills to companies. One of the most innovative applications of moUS-based nonprofit micro lending platform that allows residents of developing countries to raise small business loans from web umobile banking for loan disbursements and repayments, transferring funds from lenders in the Unithe internet and mobile phones. In Côte d'Ivoire, Orange has a commercial offer which allows subscribers to use ATMs to top up their mobile wallet account. Dsicap software, it is easy to add future options such as the payment of utility bills or insurance premium.
INVESTMENTS Portfolio management services Real-time stock quotes Personalized alerts and notifications on security prices
SUPPORT Status of requests for credit, including mortgage approval, and insurance coverageCheck book and card requests Exchange of data messages and email, including complaint submission and trackingATM Location
CONTENT SERVICES General information such as weather updates, news Loyalty-related offers Location-based services A report by the US Federal Reserve (March 2012) found that 21 percent of mobile phone owners had used mobile banking in the psurvey conducted by Forrester, mobile banking will be attrathat they may consider performing some kind of financial transaction through their mobile phone. But most of the users are intransactions such as querying for account balance and making bill payment.
FUTURE FUNCTIONALITIES IN MOBILE BANKINGBased on the 'International Review of Business Research Papers' from World business Institute, Australia, following are the kworld of Mobile Banking. With the advent of technology and increasing use of Smartphone and tablet based devices, the use of Mobile Banking functionalconnect across entire customer life cycle much comprehensivelreducing cost, achieving new revenue stream will transform to enable new objectives targeting higher level goals such as builorganization. Emerging technology and functionalities would enable to create new ways of lead generation, prospecting as well as deverelationship and mobile banking world would achieve superior customer experience with bi
ECEMBER)
INTERNATIONAL JOURNAL OF RESEARCH IN COMPUTER APPLICATION Refereed/Juried) Open Access International e-Journal - Included in the International Serial Directories
http://ijrcm.org.in/
FIGURE 2: MOBILE BANKING BUSINESS MODELS
focused model emerges when a traditional bank uses non-traditional low-cost delivery channels to provide banking services to its existing customers. Examples range from use of automatic teller machines (ATMs) to internet banking or mobile phone banking to provide certain limited banking services to banks’ customers. This model is additive in nature and may be seen as a modest extension of conventional branch-based banking.
ct alternative to conventional branch-based banking in that customer conducts financial transactions at a whole range of retail agents (or through mobile phone) instead of at bank branches or through bank employees. This model promises the potential to financial services outreach by using a different delivery channel (retailers/ mobile phones), a different trade partner (telctarget market distinct from traditional banks, and may be significantly cheaper than the bank-based alternatives. The bankeither using correspondent arrangements or by creating a JV between Bank and Telco/non-bank. In this model customer account relationship rests with the
led model is where a bank has a limited role in the day-to-day account management. Typically its role in this model is limited to safefunds. Account management functions are conducted by a non-bank (e.g. telco) who has direct contact with individual customers.
A specific sequence of SMS messages will enable the system to verify if the client has sufficient funds in his or her wallet depositing money, the merchant receives cash and the system credits the client's bank account or mobile wallet. In the same
way the client can also withdraw money at the merchant: through exchanging SMS to provide authorization, the merchant hands t
PESA mobile banking service, for example, allows customers of the mobile phone operator Safaricom to hold cash balances whichtheir SIM cards. Cash may be deposited or withdrawn from M-PESA accounts at Safaricom retail outlets located throughout the country, and may be transferred electronically from person to person as well as used to pay bills to companies. One of the most innovative applications of mo
based nonprofit micro lending platform that allows residents of developing countries to raise small business loans from web umobile banking for loan disbursements and repayments, transferring funds from lenders in the United States to the borrowers in rural Africa using nothing but
In Côte d'Ivoire, Orange has a commercial offer which allows subscribers to use ATMs to top up their mobile wallet account. Dsoftware, it is easy to add future options such as the payment of utility bills or insurance premium.
for credit, including mortgage approval, and insurance coverage
Exchange of data messages and email, including complaint submission and tracking
A report by the US Federal Reserve (March 2012) found that 21 percent of mobile phone owners had used mobile banking in the psurvey conducted by Forrester, mobile banking will be attractive mainly to the younger, more "tech-savvy" customer segment. A third of mobile phone users say that they may consider performing some kind of financial transaction through their mobile phone. But most of the users are in
nsactions such as querying for account balance and making bill payment.
FUTURE FUNCTIONALITIES IN MOBILE BANKING Based on the 'International Review of Business Research Papers' from World business Institute, Australia, following are the k
With the advent of technology and increasing use of Smartphone and tablet based devices, the use of Mobile Banking functionalconnect across entire customer life cycle much comprehensively than before. With this scenario, current mobile banking objectives say building relationships, reducing cost, achieving new revenue stream will transform to enable new objectives targeting higher level goals such as buil
tion. Emerging technology and functionalities would enable to create new ways of lead generation, prospecting as well as deverelationship and mobile banking world would achieve superior customer experience with bi-directional communications.
Bank-Focused Model
Non-Bank-led Model
Bank-led Model
ISSN 2231-1009
PUTER APPLICATION & MANAGEMENT Included in the International Serial Directories
158
cost delivery channels to provide banking services to its existing customers. banking or mobile phone banking to provide certain limited banking services to banks’
based banking.
based banking in that customer conducts financial transactions at a whole range of retail agents (or through mobile phone) instead of at bank branches or through bank employees. This model promises the potential to substantially increase the financial services outreach by using a different delivery channel (retailers/ mobile phones), a different trade partner (telco / chain store) having experience and
based alternatives. The bank-led model may be implemented by bank. In this model customer account relationship rests with the
day account management. Typically its role in this model is limited to safe-keeping of ct contact with individual customers.
A specific sequence of SMS messages will enable the system to verify if the client has sufficient funds in his or her wallet and authorize a deposit or withdrawal depositing money, the merchant receives cash and the system credits the client's bank account or mobile wallet. In the same
way the client can also withdraw money at the merchant: through exchanging SMS to provide authorization, the merchant hands the client cash and debits the
PESA mobile banking service, for example, allows customers of the mobile phone operator Safaricom to hold cash balances which are recorded on ESA accounts at Safaricom retail outlets located throughout the country, and may be transferred
electronically from person to person as well as used to pay bills to companies. One of the most innovative applications of mobile banking technology is Zidisha, a based nonprofit micro lending platform that allows residents of developing countries to raise small business loans from web users worldwide. Zidisha uses
ted States to the borrowers in rural Africa using nothing but
In Côte d'Ivoire, Orange has a commercial offer which allows subscribers to use ATMs to top up their mobile wallet account. Due to very flexible and modular
A report by the US Federal Reserve (March 2012) found that 21 percent of mobile phone owners had used mobile banking in the past 12 months. Based on a savvy" customer segment. A third of mobile phone users say
that they may consider performing some kind of financial transaction through their mobile phone. But most of the users are interested in performing basic
Based on the 'International Review of Business Research Papers' from World business Institute, Australia, following are the key functional trends possible in
With the advent of technology and increasing use of Smartphone and tablet based devices, the use of Mobile Banking functionality would enable customer y than before. With this scenario, current mobile banking objectives say building relationships,
reducing cost, achieving new revenue stream will transform to enable new objectives targeting higher level goals such as building brand of the banking tion. Emerging technology and functionalities would enable to create new ways of lead generation, prospecting as well as developing deep customer

VOLUME NO. 2 (2012), ISSUE NO. 12 (DECEMBER) ISSN 2231-1009
INTERNATIONAL JOURNAL OF RESEARCH IN COMPUTER APPLICATION & MANAGEMENT A Monthly Double-Blind Peer Reviewed (Refereed/Juried) Open Access International e-Journal - Included in the International Serial Directories
http://ijrcm.org.in/
159
TABLE 1: OBJECTIVE BASED FUNCTIONALITY ENRICHMENT IN MOBILE BANKING
Communication Enrichment � Video Interaction with agents, advisors.
Pervasive Transactions capabilities � Comprehensive “Mobile wallet”
Customer Education � “Test drive” for demos of banking services
Connect with new customer segment � Connect with Gen Y – Gen Z using games and social network ambushed to surrogate bank’s offerings
Content Monetization � Micro level revenue themes such as music, e-book download
Vertical positioning � Positioning offerings over mobile banking specific industries
Horizontal Positioning � Positioning offerings over mobile banking across all the industries
Personalization of Corporate banking Services
� Personalization experience for multiple roles and hierarchies in corporate banking as against the vanilla based segment based enhancements in the current context.
Build Brand � Built the bank’s brand while enhancing the “Mobile real estate”.
MOBILE BANKING IN THE WORLD Mobile banking is used in many parts of the world with little or no infrastructure, especially remote and rural areas. This aspect of mobile commerce is also popular in countries where most of their population is unbanked. In most of these places, banks can only be found in big cities, and customers have to travel hundreds of miles to the nearest bank. In Iran, banks such as Parsian, Tejarat, Mellat, Saderat, Sepah, Edbi, and Bankmelli offer the service. Banco Industrial provides the service in Guatemala. Citizens of Mexico can access mobile banking with Omnilife, Bancomer and MPower Venture. Kenya's Safaricom (part of the Vodafone Group) has the M-Pesa Service, which is mainly used to transfer limited amounts of money, but increasingly used to pay utility bills as well. In 2009, Zain launched their own mobile money transfer business, known as ZAP, in Kenya and other African countries. In Somalia, the many telecom companies provide mobile banking, the most prominent being Hormuud Telecom and its ZAAD service. Telenor Pakistan has also launched a mobile banking solution, in coordination with Taameer Bank, under the label Easy Paisa, which was begun in Q4 2009. Eko India Financial Services, the business correspondent of State Bank of India (SBI) and ICICI Bank, provides bank accounts, deposit, withdrawal and remittance services, micro-insurance, and micro-finance facilities to its customers (nearly 80% of whom are migrants or the unbanked section of the population) through mobile banking. In a year of 2010, mobile banking users soared over 100 percent in Kenya, China, Brazil and USA with 200 percent, 150 percent, 110 percent and 100 percent respectively. Dutch Bangla Bank launched the very first mobile banking service in Bangladesh on 31 March 2011. This service is launched with ‘Agent’ and ‘Network’ support from mobile operators, Banglalink and Citycell. Sybase 365, a subsidiary of Sybase, Inc. has provided software solution with their local partner Neurosoft Technologies Ltd. There are around 160 million people in Bangladesh, of which, only 13 per cent have bank accounts. With this solution, Dutch-Bangla Bank can now reach out to the rural and unbanked population, of which, 45 per cent are mobile phone users. Under the service, any mobile handset with subscription to any of the six existing mobile operators of Bangladesh would be able to utilize the service. Under the mobile banking services, bank-nominated ‘Agents’ perform banking activities on behalf of the banks, like opening mobile banking account, providing cash services (receipts and payments) and dealing with small credits. Cash withdrawal from a mobile account can also be done from an ATM validating each transaction by ‘mobile phone & PIN’ instead of ‘card & PIN’. Other services that are being delivered through mobile banking system are person-to-person (e.g. fund transfer), person-to-business (e.g. merchant payment, utility bill payment), business-to-person (e.g. salary/commission disbursement), government-to-person (disbursement of government allowance) transactions.
MOBILE BANKING IN INDIA - PERCEPTION AND STATISTICS The Reserve Bank of India has given approval to 32 banks for providing mobile banking facility and of these 21 banks has started providing these services. All banks are now allowed to offer mobile banking service to their customers subject to a daily cap of Rs 50,000 per customer for both funds transfer and transactions involving purchase of goods and services. India has about 207 MM (September’ 2007 TRAI Data) mobile phone subscribers, a number that is larger than the number of bank accounts or Internet users. Given the mobile tele-density of about 20% and development of secure mobile technology solutions, banks are well-positioned bridge the digital divide and introduce the unbanked sector to the financial mainstream. You may be aware that Reserve Bank of India had set up the Mobile Payments Forum of India (MPFI), a ‘Working Group on Mobile Banking’ to examine different aspects of Mobile Banking (M-banking). The Group had focused on three major areas of M-banking, i.e., (i) technology and security issues, (ii) business issues and (iii) regulatory and supervisory issues. In India, Banking sector has become more customers friendly to provide banking services through mobile phone. It has given an opportunity to customers to update themselves about Account balance, transactions and do the transfer of amount from one Account to another. All the public and private sector banks in India have started providing their different services through mobile phone. Currently they are offering banking services through mobile free of cost (Except some bank) but customers have to bear the cost of mobile service providers. Over the last few years, the mobile and wireless market has been one of the fastest growing markets in the world and it is still growing at a rapid pace. Mobile phones have become an essential communication tool for almost every individual. Advent of ecommerce has managed to take mobile VAS to next level, adding tremendous value to telecommunication industry. Mobile banking which is an integral part of ecommerce has become very popular among mobile users ever since its existence in 2007. It creates new, convenient communication and fast financial transactional channel for mobile users which is accessible from anywhere, anytime. Checking account information, balance available, credit/debit card information, cheque status, setting alerts, payment reminders, locating ATMs and bank branches, accessing mini statement, accessing loan and equity statements, insurance policy management, placing orders for cheque books etc via mobile phones are some of the services offered in mobile banking. With multiple access channels such as SMS, downloadable client, mobile Internet (WAP) mobile banking is encouraging mobile users more to explore the service. MOBILE BANKING SERVICES - INSIGHTS AND REPORTS Based on data gathered in April 2009 for Feb/March mobile banking urban Indian customers checking account balance is the most frequently cited reason for using mobile banking. 40 million Urban Indians used their mobile phones to check their bank account balances followed by viewing last three transactions. ICICI bank continues to maintain its leadership extending in mobile space, 42% of all mobile banking users bank with ICICI, followed by HDFC (25.3%).

VOLUME NO. 2 (2012), ISSUE NO. 12 (DECEMBER) ISSN 2231-1009
INTERNATIONAL JOURNAL OF RESEARCH IN COMPUTER APPLICATION & MANAGEMENT A Monthly Double-Blind Peer Reviewed (Refereed/Juried) Open Access International e-Journal - Included in the International Serial Directories
http://ijrcm.org.in/
160
FIGURE 3: MOBILE BANKING REPORT: “MOST POPULAR SERVICES AND INCOME PROFILE”
Sources: http://www.telecomindiaonline.com
Filtering the data further to understand which income groups in urban India use mobile banking more. As depicted in the chart below, mobile banking is most used by subscribers falling in Rs. 1 Lakh to Rs. 2.99 Lakhs income bracket followed by less than Rs 1 Lakh income bracket. Therefore it is observed, mobile banking is more popular among low income group of mobile users than higher income group of mobile users.
FIGURE 4
Sources: http://www.telecomindiaonline.com
Many believe that mobile users have just started to fully utilize data capabilities in their mobile phones. Service providers are every day coming up with new services, providing methods to make the solution more easy to use, implementing techniques to improve security, launch of 3G is providing higher data transfer rate and invention of new phones more frequently is driving mobile users towards subscribing to mobile banking services. In India, where mobile subscribers far exceed fixed line subscribers because of better mobile infrastructure in comparison to fixed line infrastructure has made mobile banking much more appealing in India today. Various players involved in providing mobile banking services (banks, financial institutions, service providers, operators etc) are therefore expecting a potential growth in mobile banking industry in India.
CONCLUSIONS Mobile Banking has been in existence since more than a decade. However in the earlier phase of Mobile Banking was more used for quick reference to the banking transaction and balances esp. in SMS environment. However with the proliferation of multiple technologies in the hardware, infrastructure, network, software segments, the mobile banking has found its due recognition in last couple of recession. Less developed market could adopt transaction based mobile irrespective of the type of handset due to innovative products esp. in “fund transfer” or “remittances” segment with collaboration between telecom companies, payment providers, banks etc and some of the selected features have been effectively utilized in these markets. In contrast to this, developed world excluding Far Eastern market could adopt the mobile Banking in a limited way esp. due to multiplicities of the operators in this segment and heavily developed Internet Banking market. However with the high-featured mobile phones in Smart environment would definitely take mobile banking to the next height in next 3 to 4 years from now. Mobile Banking would be increasingly used from “Building customer relations, reducing cost, achieving new revenue stream” etc to that of “connecting with the new customer segments, enhancing customer relationships to improve loyalty and reduce attrition, create new ways to generate lead in the process of prospecting, real time experience of bi-directional customer experience etc.” And needless to say the technological revolution would play a major role in days to come.
REFERENCES 1. Owens, John and Anna Bantug-Herrera (2006): Catching the Technology Wave: Mobile Phone Banking and Text-A-Payment in the Philippines 2. Tiwari, Rajnish; Buse, Stephan and Herstatt, Cornelius (2006): Customer on the Move: Strategic Implications of Mobile Banking for Banks and Financial
Enterprises, in: CEC/EEE 2006, Proceedings of The 8th IEEE International Conference on E-Commerce Technology and The 3rd IEEE International Conference on Enterprise Computing, E-Commerce, and E-Services (CEC/EEE'06), San Francisco, pp. 522–529.
3. Tiwari, Rajnish; Buse, Stephan and Herstatt, Cornelius (2006): Mobile Banking as Business Strategy: Impact of Mobile Technologies on Customer Behaviour and its Implications for Banks, in: Technology Management for the Global Future - Proceedings of PICMET '06.
4. Vaidya (2011): “Emerging Trends on Functional Utilization of Mobile Banking in Developed Markets in Next 3-4 Years” 5. http://www.telecomindiaonline.com
7.50%
7.30%
8.70%
11.80%
15.90%
Request a cheque book
Payment reminders
Status of cheques/Demand Drafts
View laast three transactions
Cheking Account Balance
Statistics on most popular mobile banking services
18.00%
36.60%
16.20% 17.50%
11.70%
Less than Rs. 1 lakh Rs. 1 Lakh to Rs. 2.99 Lakh Rs. 3 Lakh to Rs. 4.99 Lakh Rs. 5Lakh to Rs. 7.49 Lakh Rs. 7.5 Lakh or more than Rs. 7.5 Lakh
Mobile banking users - Income profile

VOLUME NO. 2 (2012), ISSUE NO. 12 (DECEMBER) ISSN 2231-1009
INTERNATIONAL JOURNAL OF RESEARCH IN COMPUTER APPLICATION & MANAGEMENT A Monthly Double-Blind Peer Reviewed (Refereed/Juried) Open Access International e-Journal - Included in the International Serial Directories
http://ijrcm.org.in/
161
REQUEST FOR FEEDBACK
Dear Readers
At the very outset, International Journal of Research in Computer Application and Management (IJRCM)
acknowledges & appreciates your efforts in showing interest in our present issue under your kind perusal.
I would like to request you to supply your critical comments and suggestions about the material published
in this issue as well as on the journal as a whole, on our E-mail [email protected] for further
improvements in the interest of research.
If you have any queries please feel free to contact us on our E-mail [email protected].
I am sure that your feedback and deliberations would make future issues better – a result of our joint
effort.
Looking forward an appropriate consideration.
With sincere regards
Thanking you profoundly
Academically yours
Sd/-
Co-ordinator

VOLUME NO. 2 (2012), ISSUE NO. 12 (DECEMBER) ISSN 2231-1009
INTERNATIONAL JOURNAL OF RESEARCH IN COMPUTER APPLICATION & MANAGEMENT A Monthly Double-Blind Peer Reviewed (Refereed/Juried) Open Access International e-Journal - Included in the International Serial Directories
http://ijrcm.org.in/
II