
download vol 13, no 3&4, year 2020 - IARIA Journals
189
-
Upload
khangminh22 -
Category
Documents
-
view
2 -
download
0
Transcript of download vol 13, no 3&4, year 2020 - IARIA Journals


The International Journal on Advances in Software is published by IARIA.
ISSN: 1942-2628
journals site: http://www.iariajournals.org
contact: [email protected]
Responsibility for the contents rests upon the authors and not upon IARIA, nor on IARIA volunteers,
staff, or contractors.
IARIA is the owner of the publication and of editorial aspects. IARIA reserves the right to update the
content for quality improvements.
Abstracting is permitted with credit to the source. Libraries are permitted to photocopy or print,
providing the reference is mentioned and that the resulting material is made available at no cost.
Reference should mention:
International Journal on Advances in Software, issn 1942-2628
vol. 13, no. 3 & 4, year 2020, http://www.iariajournals.org/software/
The copyright for each included paper belongs to the authors. Republishing of same material, by authors
or persons or organizations, is not allowed. Reprint rights can be granted by IARIA or by the authors, and
must include proper reference.
Reference to an article in the journal is as follows:
<Author list>, “<Article title>”
International Journal on Advances in Software, issn 1942-2628
vol. 13, no. 3 & 4, year 2020,<start page>:<end page> , http://www.iariajournals.org/software/
IARIA journals are made available for free, proving the appropriate references are made when their
content is used.
Sponsored by IARIA
www.iaria.org
Copyright © 2020 IARIA

International Journal on Advances in Software
Volume 13, Number 3 & 4, 2020
Editor-in-Chief
Petre Dini, IARIA, USA
Editorial Advisory Board
Hermann Kaindl, TU-Wien, AustriaHerwig Mannaert, University of Antwerp, Belgium
Subject-Expert Associated Editors
Sanjay Bhulai, Vrije Universiteit Amsterdam, the Netherlands (DATA ANALYTICS)Stephen Clyde, Utah State University, USA (SOFTENG + ICSEA)Emanuele Covino, Università degli Studi di Bari Aldo Moro, Italy (COMPUTATION TOOLS)Robert (Bob) Duncan, University of Aberdeen, UK (ICCGI & CLOUD COMPUTING)Venkat Naidu Gudivada, East Carolina University, USA (ALLDATA)Andreas Hausotter, Hochschule Hannover - University of Applied Sciences and Arts, Germany (SERVICE COMPUTATION)Sergio Ilarri, University of Zaragoza, Spain (DBKDA + FUTURE COMPUTING)Christopher Ireland, The Open University, UK (FASSI + VALID + SIMUL)Alex Mirnig, University of Salzburg, Austria (CONTENT + PATTERNS)Jaehyun Park, Incheon National University (INU), South Korea (ACHI)Claus-Peter Rückemann, Leibniz Universität Hannover / Westfälische Wilhelms-Universität Münster / North-German Supercomputing Alliance (HLRN), Germany (GEOProcessing + ADVCOMP + INFOCOMP)Markus Ullmann, Federal Office for Information Security / University of Applied Sciences Bonn-Rhine-Sieg, Germany (VEHICULAR + MOBILITY)
Editorial Board
Witold Abramowicz, The Poznan University of Economics, PolandAbdelkader Adla, University of Oran, AlgeriaSyed Nadeem Ahsan, Technical University Graz, Austria / Iqra University, PakistanMarc Aiguier, École Centrale Paris, FranceRajendra Akerkar, Western Norway Research Institute, NorwayZaher Al Aghbari, University of Sharjah, UAERiccardo Albertoni, Istituto per la Matematica Applicata e Tecnologie Informatiche “Enrico Magenes” Consiglio Nazionale delle Ricerche, (IMATI-CNR), Italy / Universidad Politécnica de Madrid, SpainAhmed Al-Moayed, Hochschule Furtwangen University, GermanyGiner Alor Hernández, Instituto Tecnológico de Orizaba, MéxicoZakarya Alzamil, King Saud University, Saudi ArabiaFrederic Amblard, IRIT - Université Toulouse 1, FranceVincenzo Ambriola , Università di Pisa, Italy Andreas S. Andreou, Cyprus University of Technology - Limassol, CyprusAnnalisa Appice, Università degli Studi di Bari Aldo Moro, ItalyPhilip Azariadis, University of the Aegean, GreeceThierry Badard, Université Laval, CanadaMuneera Bano, International Islamic University - Islamabad, PakistanFabian Barbato, Technology University ORT, Montevideo, Uruguay

Peter Baumann, Jacobs University Bremen / Rasdaman GmbH Bremen, GermanyGabriele Bavota, University of Salerno, ItalyGrigorios N. Beligiannis, University of Western Greece, GreeceNoureddine Belkhatir, University of Grenoble, France Jorge Bernardino, ISEC - Institute Polytechnic of Coimbra, PortugalRudolf Berrendorf, Bonn-Rhein-Sieg University of Applied Sciences - Sankt Augustin, GermanyAteet Bhalla, Independent Consultant, India Fernando Boronat Seguí, Universidad Politecnica de Valencia, SpainPierre Borne, Ecole Centrale de Lille, FranceFarid Bourennani, University of Ontario Institute of Technology (UOIT), CanadaNarhimene Boustia, Saad Dahlab University - Blida, AlgeriaHongyu Pei Breivold, ABB Corporate Research, SwedenCarsten Brockmann, Universität Potsdam, GermanyAntonio Bucchiarone, Fondazione Bruno Kessler, ItalyGeorg Buchgeher, Software Competence Center Hagenberg GmbH, AustriaDumitru Burdescu, University of Craiova, RomaniaMartine Cadot, University of Nancy / LORIA, France Isabel Candal-Vicente, Universidad Ana G. Méndez, Puerto RicoJuan-Vicente Capella-Hernández, Universitat Politècnica de València, SpainJose Carlos Metrolho, Polytechnic Institute of Castelo Branco, PortugalAlain Casali, Aix-Marseille University, France Yaser Chaaban, Leibniz University of Hanover, GermanySavvas A. Chatzichristofis, Democritus University of Thrace, GreeceAntonin Chazalet, Orange, FranceJiann-Liang Chen, National Dong Hwa University, ChinaShiping Chen, CSIRO ICT Centre, AustraliaWen-Shiung Chen, National Chi Nan University, TaiwanZhe Chen, College of Computer Science and Technology, Nanjing University of Aeronautics and Astronautics, China PRPo-Hsun Cheng, National Kaohsiung Normal University, TaiwanYoonsik Cheon, The University of Texas at El Paso, USALau Cheuk Lung, INE/UFSC, BrazilRobert Chew, Lien Centre for Social Innovation, SingaporeAndrew Connor, Auckland University of Technology, New ZealandRebeca Cortázar, University of Deusto, SpainNoël Crespi, Institut Telecom, Telecom SudParis, FranceCarlos E. Cuesta, Rey Juan Carlos University, SpainDuilio Curcio, University of Calabria, ItalyMirela Danubianu, "Stefan cel Mare" University of Suceava, RomaniaPaulo Asterio de Castro Guerra, Tapijara Programação de Sistemas Ltda. - Lambari, BrazilCláudio de Souza Baptista, University of Campina Grande, BrazilMaria del Pilar Angeles, Universidad Nacional Autonónoma de México, MéxicoRafael del Vado Vírseda, Universidad Complutense de Madrid, SpainGiovanni Denaro, University of Milano-Bicocca, ItalyNirmit Desai, IBM Research, IndiaVincenzo Deufemia, Università di Salerno, ItalyLeandro Dias da Silva, Universidade Federal de Alagoas, BrazilJavier Diaz, Rutgers University, USANicholas John Dingle, University of Manchester, UKRoland Dodd, CQUniversity, AustraliaAijuan Dong, Hood College, USASuzana Dragicevic, Simon Fraser University- Burnaby, CanadaCédric du Mouza, CNAM, France

Ann Dunkin, Palo Alto Unified School District, USAJana Dvorakova, Comenius University, SlovakiaHans-Dieter Ehrich, Technische Universität Braunschweig, GermanyJorge Ejarque, Barcelona Supercomputing Center, SpainAtilla Elçi, Aksaray University, Turkey Khaled El-Fakih, American University of Sharjah, UAEGledson Elias, Federal University of Paraíba, BrazilSameh Elnikety, Microsoft Research, USAFausto Fasano, University of Molise, ItalyMichael Felderer, University of Innsbruck, AustriaJoão M. Fernandes, Universidade de Minho, PortugalLuis Fernandez-Sanz, University of de Alcala, SpainFelipe Ferraz, C.E.S.A.R, BrazilAdina Magda Florea, University "Politehnica" of Bucharest, RomaniaWolfgang Fohl, Hamburg Universiy, GermanySimon Fong, University of Macau, Macau SARGianluca Franchino, Scuola Superiore Sant'Anna, Pisa, ItalyNaoki Fukuta, Shizuoka University, JapanMartin Gaedke, Chemnitz University of Technology, GermanyFélix J. García Clemente, University of Murcia, SpainJosé García-Fanjul, University of Oviedo, SpainFelipe Garcia-Sanchez, Universidad Politecnica de Cartagena (UPCT), SpainMichael Gebhart, Gebhart Quality Analysis (QA) 82, GermanyTejas R. Gandhi, Virtua Health-Marlton, USAAndrea Giachetti, Università degli Studi di Verona, ItalyAfzal Godil, National Institute of Standards and Technology, USALuis Gomes, Universidade Nova Lisboa, PortugalDiego Gonzalez Aguilera, University of Salamanca - Avila, SpainPascual Gonzalez, University of Castilla-La Mancha, SpainBjörn Gottfried, University of Bremen, GermanyVictor Govindaswamy, Texas A&M University, USAGregor Grambow, AristaFlow GmbH, GermanyCarlos Granell, European Commission / Joint Research Centre, Italy Christoph Grimm, University of Kaiserslautern, AustriaMichael Grottke, University of Erlangen-Nuernberg, GermanyVic Grout, Glyndwr University, UKEnsar Gul, Marmara University, TurkeyRichard Gunstone, Bournemouth University, UKZhensheng Guo, Siemens AG, GermanyIsmail Hababeh, German Jordanian University, JordanShahliza Abd Halim, Lecturer in Universiti Teknologi Malaysia, MalaysiaHerman Hartmann, University of Groningen, The NetherlandsJameleddine Hassine, King Fahd University of Petroleum & Mineral (KFUPM), Saudi ArabiaTzung-Pei Hong, National University of Kaohsiung, TaiwanPeizhao Hu, NICTA, AustraliaChih-Cheng Hung, Southern Polytechnic State University, USAEdward Hung, Hong Kong Polytechnic University, Hong KongNoraini Ibrahim, Universiti Teknologi Malaysia, MalaysiaAnca Daniela Ionita, University "POLITEHNICA" of Bucharest, RomaniaChris Ireland, Open University, UKKyoko Iwasawa, Takushoku University - Tokyo, JapanMehrshid Javanbakht, Azad University - Tehran, IranWassim Jaziri, ISIM Sfax, Tunisia

Dayang Norhayati Abang Jawawi, Universiti Teknologi Malaysia (UTM), MalaysiaJinyuan Jia, Tongji University. Shanghai, ChinaMaria Joao Ferreira, Universidade Portucalense, PortugalAhmed Kamel, Concordia College, Moorhead, Minnesota, USATeemu Kanstrén, VTT Technical Research Centre of Finland, FinlandNittaya Kerdprasop, Suranaree University of Technology, ThailandAyad ali Keshlaf, Newcastle University, UKNhien An Le Khac, University College Dublin, IrelandSadegh Kharazmi, RMIT University - Melbourne, AustraliaKyoung-Sook Kim, National Institute of Information and Communications Technology, JapanYoungjae Kim, Oak Ridge National Laboratory, USACornel Klein, Siemens AG, GermanyAlexander Knapp, University of Augsburg, GermanyRadek Koci, Brno University of Technology, Czech RepublicChristian Kop, University of Klagenfurt, AustriaMichal Krátký, VŠB - Technical University of Ostrava, Czech RepublicNarayanan Kulathuramaiyer, Universiti Malaysia Sarawak, MalaysiaSatoshi Kurihara, Osaka University, JapanEugenijus Kurilovas, Vilnius University, LithuaniaAlla Lake, Linfo Systems, LLC, USAFritz Laux, Reutlingen University, GermanyLuigi Lavazza, Università dell'Insubria, ItalyFábio Luiz Leite Júnior, Universidade Estadual da Paraiba,BrazilAlain Lelu, University of Franche-Comté / LORIA, FranceCynthia Y. Lester, Georgia Perimeter College, USAClement Leung, Hong Kong Baptist University, Hong KongWeidong Li, University of Connecticut, USACorrado Loglisci, University of Bari, ItalyFrancesco Longo, University of Calabria, ItalySérgio F. Lopes, University of Minho, PortugalPericles Loucopoulos, Loughborough University, UKAlen Lovrencic, University of Zagreb, CroatiaQifeng Lu, MacroSys, LLC, USAXun Luo, Qualcomm Inc., USAStephane Maag, Telecom SudParis, FranceRicardo J. Machado, University of Minho, PortugalMaryam Tayefeh Mahmoudi, Research Institute for ICT, IranNicos Malevris, Athens University of Economics and Business, GreeceHerwig Mannaert, University of Antwerp, BelgiumJosé Manuel Molina López, Universidad Carlos III de Madrid, SpainFrancesco Marcelloni, University of Pisa, ItalyEda Marchetti, Consiglio Nazionale delle Ricerche (CNR), ItalyGerasimos Marketos, University of Piraeus, GreeceAbel Marrero, Bombardier Transportation, GermanyAdriana Martin, Universidad Nacional de la Patagonia Austral / Universidad Nacional del Comahue, ArgentinaGoran Martinovic, J.J. Strossmayer University of Osijek, CroatiaPaulo Martins, University of Trás-os-Montes e Alto Douro (UTAD), PortugalStephan Mäs, Technical University of Dresden, GermanyConstandinos Mavromoustakis, University of Nicosia, CyprusJose Merseguer, Universidad de Zaragoza, SpainSeyedeh Leili Mirtaheri, Iran University of Science & Technology, IranLars Moench, University of Hagen, GermanyYasuhiko Morimoto, Hiroshima University, Japan

Antonio Navarro Martín, Universidad Complutense de Madrid, SpainFilippo Neri, University of Naples, Italy Muaz A. Niazi, Bahria University, Islamabad, PakistanNatalja Nikitina, KTH Royal Institute of Technology, Sweden Roy Oberhauser, Aalen University, GermanyPablo Oliveira Antonino, Fraunhofer IESE, GermanyRocco Oliveto, University of Molise, ItalySascha Opletal, Universität Stuttgart, GermanyFlavio Oquendo, European University of Brittany/IRISA-UBS, FranceClaus Pahl, Dublin City University, IrelandMarcos Palacios, University of Oviedo, SpainConstantin Paleologu, University Politehnica of Bucharest, RomaniaKai Pan, UNC Charlotte, USAYiannis Papadopoulos, University of Hull, UKAndreas Papasalouros, University of the Aegean, Greece Rodrigo Paredes, Universidad de Talca, ChilePäivi Parviainen, VTT Technical Research Centre, FinlandJoão Pascoal Faria, Faculty of Engineering of University of Porto / INESC TEC, PortugalFabrizio Pastore, University of Milano - Bicocca, ItalyKunal Patel, Ingenuity Systems, USAÓscar Pereira, Instituto de Telecomunicacoes - University of Aveiro, PortugalWilly Picard, Poznań University of Economics, PolandJose R. Pires Manso, University of Beira Interior, PortugalSören Pirk, Universität Konstanz, GermanyMeikel Poess, Oracle Corporation, USAThomas E. Potok, Oak Ridge National Laboratory, USAChristian Prehofer, Fraunhofer-Einrichtung für Systeme der Kommunikationstechnik ESK, GermanyEla Pustułka-Hunt, Bundesamt für Statistik, Neuchâtel, SwitzerlandMengyu Qiao, South Dakota School of Mines and Technology, USAKornelije Rabuzin, University of Zagreb, CroatiaJ. Javier Rainer Granados, Universidad Politécnica de Madrid, SpainMuthu Ramachandran, Leeds Metropolitan University, UKThurasamy Ramayah, Universiti Sains Malaysia, MalaysiaPrakash Ranganathan, University of North Dakota, USAJosé Raúl Romero, University of Córdoba, SpainHenrique Rebêlo, Federal University of Pernambuco, Brazil Hassan Reza, UND Aerospace, USAElvinia Riccobene, Università degli Studi di Milano, ItalyDaniel Riesco, Universidad Nacional de San Luis, ArgentinaMathieu Roche, LIRMM / CNRS / Univ. Montpellier 2, France José Rouillard, University of Lille, FranceSiegfried Rouvrais, TELECOM Bretagne, FranceClaus-Peter Rückemann, Leibniz Universität Hannover / Westfälische Wilhelms-Universität Münster / North-German Supercomputing Alliance, GermanyDjamel Sadok, Universidade Federal de Pernambuco, Brazil Ismael Sanz, Universitat Jaume I, SpainM. Saravanan, Ericsson India Pvt. Ltd -Tamil Nadu, IndiaIdrissa Sarr, University of Cheikh Anta Diop, Dakar, Senegal / University of Quebec, CanadaPatrizia Scandurra, University of Bergamo, ItalyDaniel Schall, Vienna University of Technology, AustriaRainer Schmidt, Munich University of Applied Sciences, GermanySebastian Senge, TU Dortmund, GermanyIsabel Seruca, Universidade Portucalense - Porto, Portugal

Kewei Sha, Oklahoma City University, USASimeon Simoff, University of Western Sydney, AustraliaJacques Simonin, Institut Telecom / Telecom Bretagne, FranceCosmin Stoica Spahiu, University of Craiova, RomaniaGeorge Spanoudakis, City University London, UKCristian Stanciu, University Politehnica of Bucharest, RomaniaLena Strömbäck, SMHI, Sweden Osamu Takaki, Japan Advanced Institute of Science and Technology, JapanAntonio J. Tallón-Ballesteros, University of Seville, SpainWasif Tanveer, University of Engineering & Technology - Lahore, PakistanErgin Tari, Istanbul Technical University, TurkeySteffen Thiel, Furtwangen University of Applied Sciences, GermanyJean-Claude Thill, Univ. of North Carolina at Charlotte, USAPierre Tiako, Langston University, USABožo Tomas, HT Mostar, Bosnia and HerzegovinaDavide Tosi, Università degli Studi dell'Insubria, Italy Guglielmo Trentin, National Research Council, ItalyDragos Truscan, Åbo Akademi University, FinlandChrisa Tsinaraki, Technical University of Crete, GreeceRoland Ukor, FirstLinq Limited, UKTorsten Ullrich, Fraunhofer Austria Research GmbH, AustriaJosé Valente de Oliveira, Universidade do Algarve, PortugalDieter Van Nuffel, University of Antwerp, BelgiumShirshu Varma, Indian Institute of Information Technology, Allahabad, IndiaKonstantina Vassilopoulou, Harokopio University of Athens, GreeceMiroslav Velev, Aries Design Automation, USATanja E. J. Vos, Universidad Politécnica de Valencia, SpainKrzysztof Walczak, Poznan University of Economics, PolandYandong Wang, Wuhan University, ChinaRainer Weinreich, Johannes Kepler University Linz, AustriaStefan Wesarg, Fraunhofer IGD, Germany Wojciech Wiza, Poznan University of Economics, PolandMartin Wojtczyk, Technische Universität München, GermanyHao Wu, School of Information Science and Engineering, Yunnan University, ChinaMudasser F. Wyne, National University, USAZhengchuan Xu, Fudan University, P.R.ChinaYiping Yao, National University of Defense Technology, Changsha, Hunan, ChinaStoyan Yordanov Garbatov, Instituto de Engenharia de Sistemas e Computadores - Investigação e Desenvolvimento, INESC-ID, PortugalWeihai Yu, University of Tromsø, NorwayWenbing Zhao, Cleveland State University, USAHong Zhu, Oxford Brookes University, UKMartin Zinner, Technische Universität Dresden, Germany

International Journal on Advances in Software
Volume 13, Numbers 3 & 4, 2020
CONTENTS
pages: 116 - 128Finding Better Matches: Improving Image Retrieval with EFM-HOGSugata Banerji, Lake Forest College, USARyan R. Zunker, Lake Forest College, USAAtreyee Sinha, Edgewood College, USA
pages: 129 - 138Requirements Traceability using SysML Diagrams and BPMNCorina Abdelahad, Universidad Nacional de San Luis, ArgentinaDaniel Riesco, Universidad Nacional de San Luis, ArgentinaCarlos Kavka, ESTECO SpA, Italy
pages: 139 - 148Build Comparator: Integrated Semantic Comparison for Continuous Testing of Android-based Devices using SandiffCarlos Eduardo Aguiar, Sidia R&D Institute, BrazilJose Ivan Vilarouca-Filho, Sidia R&D Institute, BrazilAgnaldo Penha-Junior, Sidia R&D Institute, BrazilRodrigo Jose Fernandes, Sidia R&D Institute, BrazilCícero Pahins, Sidia R&D Institute, BrazilPaulo Fonseca, Sidia R&D Institute, Brazil
pages: 149 - 159On the Realization of Meta-Circular Code Generation and Two-Sided Collaborative MetaprogrammingHerwig Mannaert, University of Antwerp, BelgiumKoen De Cock, NSX bv, BelgiumPeter Uhnák, NSX bv, BelgiumJan Verelst, University of Antwerp, Belgium
pages: 160 - 181The Matching Lego(R)-Like Bricks Problem: A Metaheuristic ApproachMartin Zinner, Center for Information Services and High Performance Computing (ZIH) Technische Universität Dresden, GermanyRui Song, Technical Information Systems Technische Universität Dresden, GermanyKim Feldhoff, Center for Information Services and High Performance Computing (ZIH) Technische Universität Dresden, GermanyAndré Gellrich, Conimon, GermanyWolfgang E. Nagel, Center for Information Services and High Performance Computing (ZIH) Technische Universität Dresden, Germany
pages: 182 - 193A Large Scale Empirical Evaluation of the Accuracy of Function Points Estimation MethodsLuigi Lavazza, Università degli Studi dell’Insubria, ItalyGeng Liu, Hangzhou Dianzi University, China

pages: 194 - 206Semaphore Implementations for Testing Concurrent Systems using TTCN-3Bernard Stepien, University of Ottawa, CanadaLiam Peyton, University of Ottawa, CanadaDirk Borowski, Spirent, GermanyJacob Wieland, Spirent, GermanyDirk Tepelmann, Spirent, Germany
pages: 207 - 216Reusing and Deriving Games for Teaching Software ReuseDiego Castro, COPPE/Computer Systems Engineering Program - Federal University of Rio de Janeiro, BrazilCláudia Werner, COPPE/Computer Systems Engineering Program - Federal University of Rio de Janeiro, Brazil
pages: 217 - 228Microservice-Enabled Simulation Platform for Industry-4.0 Dynamic Systems: A Computational Fluid Dynamics Case Study for Underground Coalmine Ventilation NetworksAlexey Cheptsov, High Performance Computing Center Stuttgart (HLRS), GermanyOleg Beljaev, Donetsk National Technical University, Ukraine
pages: 229 - 239Using Natural Language Processing for Extracting GeoSpatial Urban Issues Complaints from TV NewsRich Elton Carvalho Ramalho, Federal University of Campina Grande, BrasilAnderson Almeida Firmino, Federal University of Campina Grande, BrasilCláudio De Souza Baptista, Federal University of Campina Grande, BrasilAna Gabrielle Ramos Falcão, Federal University of Campina Grande, BrasilMaxwell Guimarães de Oliveira, Federal University of Campina Grande, BrasilFabio Gomes de Andrade, Federal Institute of Paraiba, Brasil
pages: 240 - 251Context and Georeferencing of Archaeological, Prehistorical, and Geoscientific Object Entities, Resulting from Integration of Knowledge Resources’ Development and Universal Conceptual Knowledge Pattern MatchingClaus-Peter Rückemann, Westfälische Wilhelms-Universität Münster (WWU) and Unabhängiges Deutsches Institut für Multi-disziplinäre Forschung (DIMF) and Leibniz Universität Hannover, Germany
pages: 252 - 263Managing Patient Records in Complex Systems in Time of Epidemics - The Predominence of Human Aspects for Quality of ProcessesEloria Vigouroux-Zugasti, University of East-Paris Marne-la-Vallée, FranceChristian Bourret, University of East-Paris Marne-la-Vallée, FranceSylvie Parrrini-Alemanno, CNAM, France
pages: 264 - 273Principles and Applications of a Multiresolution Geodata CubeLassi Lehto, Finnish Geospatial Research Institute, FinlandJaakko Kähkönen, Finnish Geospatial Research Institute, FinlandJuha Oksanen, Finnish Geospatial Research Institute, Finland
pages: 274 - 283Facial Mimicry Analysis Based on 3D Morphable Face ModelsOky Dicky Ardiansyah Prima, Graduate School of Software and Information Science, Iwate Prefectural University, JapanYuta Ono, Graduate School of Software and Information Science, Iwate Prefectural University, Japan

Hisayoshi Ito, Graduate School of Software and Information Science, Iwate Prefectural University, JapanTakahiro Tomisawa, Hitachi Ind. & Ctrl. Solutions Yokohama, JapanTakashi Imabuchi, Office of Regional Collaboration, Iwate Pref. Univ., Japan
pages: 284 - 293A Pointing Device for 3D Interactive Spherical DisplaysOky Dicky Ardiansyah Prima, Graduate School of Software and Information Science, Iwate Prefectural University, JapanKatsuyoshi Hotta, Graduate School of Software and Information Science, Iwate Prefectural University, JapanRintaro Takahashi, Graduate School of Software and Information Science, Iwate Prefectural University, JapanHisayoshi Ito, Graduate School of Software and Information Science, Iwate Prefectural University, Japan

116
International Journal on Advances in Software, vol 13 no 3 & 4, year 2020, http://www.iariajournals.org/software/
2020, © Copyright by authors, Published under agreement with IARIA - www.iaria.org
Finding Better Matches: Improving Image Retrieval with EFM-HOG
Sugata Banerji
Mathematics and Computer Science
Lake Forest College
555 North Sheridan Road
Lake Forest, IL 60045, USA
Email: [email protected]
Ryan R. Zunker
Mathematics and Computer Science
Lake Forest College
555 North Sheridan Road
Lake Forest, IL 60045, USA
Email: [email protected]
Atreyee Sinha
Computing and Information Sciences
Edgewood College
1000 Edgewood College Drive
Madison, WI 53711, USA
Email: [email protected]
Abstract—Retrieving images from a dataset, which are similar to aquery image, is an important high-level vision problem. Differenttasks define similarity based on various low-level features, suchas shape, color, or texture. In this article, we focus on theproblem of image retrieval of similarly shaped objects, with thequery being an object selected from a test image at run-time.Towards that end, we propose a novel shape representation andassociated similarity measure, which exploits the dimensionalityreduction and feature extraction methods of Principal ComponentAnalysis (PCA) and Enhanced Fisher Model (EFM). We demon-strate the effectiveness of this representation on three shape-matching problems using multiple large-scale image datasets andalso compare its retrieval performance with the Histograms ofOriented Gradients (HOG). Furthermore, to test the performanceof our presented descriptor on the non-trivial task of image-based geo-localization, we create a large-scale image dataset andconduct extensive experiments on it. Finally, we establish that ourproposed EFM-HOG not only works well on this new dataset, butalso significantly improves upon the conventional HOG results.
Keywords–Histogram of Oriented Gradients; Enhanced FisherModel; Content-Based Image Retrieval; Shape Matching; EFM-HOG.
I. INTRODUCTION
With the enormous popularity of digital devices equippedwith cameras, along with the wide access to high speed Internetand cloud storage, several applications based on image searchand retrieval have emerged. Such applications include aug-mented reality, geo-localization, security and defense, educa-tional uses, to name a few. Billions of images are uploaded andshared over social media and web sharing platforms everyday,giving rise to a greater need for systems that can retrieveimages similar to a query image from a dataset. Traditionalapproaches of content-based image retrieval are based uponlow level cues such as shape, color and texture features. Inthis extended work, we address three image retrieval problems,which are all based on shape similarity. Specifically, we selecta window surrounding an object of interest from a queryimage and want to be able to retrieve other images in thedataset, which have similarly shaped objects. Towards that end,we investigate and propose a novel EFM-HOG representationand retrieval technique [1] that is based on shape features,dimensionality reduction, and discriminant analysis. It is alsorobust to the slight changes in the window object selection.
The Histograms of Oriented Gradients (HOG) feature isvery popular for shape matching. Simple HOG matching, how-ever, poses significant challenges in effective image retrieval
due to the fact that the apparent shape of the query objectmay change considerably between images due to differencesin lighting, camera parameters, viewing angle, scale and occlu-sion. In this work, we introduce a novel technique of improvingthe HOG features to reduce the number of false matches.
Shape matching can be used in a variety of differentscenarios and we demonstrate the effectiveness of the proposedmethod in three such scenarios here. The first is a simpleobject retrieval problem where the goal is to retrieve imagesof objects belonging to the same class as, or more broadlyspeaking, similar in shape to the query image. We use thepublicly available PASCAL VOC 2012 [2] image dataset forthis task. The second task that we use our method for isbuilding image retrieval and landmark recognition. Here itis important to fetch not other similarly-shaped buildings butother pictures of the exact same building. It is also importantto fetch multiple instances of the building in top search resultsso that the building can be identified without doubt usinga k-nearest neighbors method. We use another large publicdatabase, the Oxford Buildings dataset [3] for this task.
The third problem that we try to solve using the proposedmethod is that of image-based geo-localization at the scale ofa city. To make this problem more challenging than landmarkrecognition, we created a new dataset [4] based on GoogleStreetView images of the city of Lake Forest, Illinois, USA.This dataset has 10, 000 images and it is more challengingthan a similar dataset built from a big city due to an extremelyhigh amount of vegetation cover. Here, we had to address theproblem of isolating the buildings in the images and discardmost of the trees and other things. We had to design a form ofcoarse semantic segmentation as a preprocessing step on thisdataset for this purpose.
The rest of this paper is organized as follows. Section IIpresents a short survey of other methods employed in shape-based image retrieval, with a brief mention of other researchersworking on related problems. Section III and its subsectionsoutline in detail the method proposed in this paper. The prob-lems addressed and the datasets used are described in detail inSection IV. The experiments performed and results obtainedare detailed in Section V. Finally, we list our conclusions anddirections for future research in Section VI.
II. RELATED WORK
The HOG feature vector [5], proposed nearly two decadesago for pedestrian detection problems, has been very popular

117
International Journal on Advances in Software, vol 13 no 3 & 4, year 2020, http://www.iariajournals.org/software/
2020, © Copyright by authors, Published under agreement with IARIA - www.iaria.org
Figure 1: The process of generating the retrieval set using the proposed EFM-HOG match technique.
among Computer Vision researchers for representing shape.It has successfully been combined with other techniques [6]and fused with other descriptors [7] for classifying bothindoor and outdoor scene images. HOG has also given rise toother extremely successful object detection techniques, suchas Deformable Part Models (DPM) [8]. More complicateddescriptors [9] [10] [11] have been used for image retrievalwith reasonable success. However, such methods are time con-suming and more processor-intensive as compared to simpleHOG matching. In recent years, handcrafted features havedeclined in popularity due to the success of deep neuralnetworks in object recognition [12] [13], but such methods arenot without their drawbacks. Deep neural networks require alot of processor time and run better on specialized hardware.They also require far greater number of training images thatare available in a small or medium-sized dataset to avoidoverfitting. For these reasons, enhancing simple handcraftedfeatures like HOG can be effective for solving small-scaleretrieval problems more effectively than methods of greatercomplexity.
The use of HOG for shape matching is fraught withchallenges as mentioned above in Section I. The difficultiesof using HOG for shape-based image retrieval are particularlyevident for content generated by users in the wild, but arealso applicable to more controlled images such as GoogleStreetView [14] images due to seasonal differences in vegeta-tion and lighting. In effect, every query image is an exemplarof its own class and a retrieval system must be trained totreat it that way. In [15], this idea is handled using a SupportVector Machine (SVM) [16]. Instead of an SVM, here weintroduce the novel idea of enhancing the HOG features by
the Enhanced Fisher Model (EFM) process [17] because itproduces a low-dimensional representation, which is importantfrom the computational aspect. Principal Component Analysis(PCA) has been widely used to perform dimensionality reduc-tion for image indexing and retrieval [17]. The EFM featureextraction method has achieved good success rates for thetask of image classification and retrieval [7]. In the proposedmethod, which is represented schematically in Figure 1, weshow this method to be effective in isolating the query objectfrom the background clutter as well.
The geo-localization problem has been addressed by manyresearchers with varying degrees of success since the end ofthe last decade. The works range in scale between [18] wherethe authors explore the distinguishable architectural featuresof cities to [19] [20] where the scale is global Earth. But ourwork brings the problem to the scale of identifying individualbuildings on Google StreetView [14] and tries to solve it. Thisis most similar to the work of [21], but our method uses veryfew (< 10) boxes per image using our proposed EFM-HOGrepresentation.
We design a coarse semantic segmentation algorithm anduse it as a preprocessing step on the dataset that we builtfrom Google StreetView images for testing our technique.Semantic segmentation of outdoor scene images into a smallnumber of semantic categories has been addressed successfullyby [22]. While they use color histograms in the RGB and HSVcolor space, texture, shape, perspective and SIFT features atthe superpixel level to assign pixel-level semantic labels, thiswas not necessary in our case. HOG features are extractedfrom rectangular windows and it was sufficient to achieveenough coarse semantic segmentation to draw a rectangular

118
International Journal on Advances in Software, vol 13 no 3 & 4, year 2020, http://www.iariajournals.org/software/
2020, © Copyright by authors, Published under agreement with IARIA - www.iaria.org
Figure 2: Auto-generation of offset windows to be used aspositive training samples during querying. The windowdimensions and offsets shown are only representative.
bounding box around the houses, and hence we used fewerfeatures. Local Binary Patterns (LBP) [23] is known to providegood features for not only texture but also object and sceneclassification [24] [25] and so LBP was chosen as the primaryfeature to represent patches. We also use HSV color histogramand HOG feature vectors and concatenate them to LBP forthis purpose. While deep neural networks have proven verysuccessful for the semantic segmentation task [26] [27] [28][29], they require a large number of training images withlabeled ground truth. Even weakly supervised methods [30]require a large number of images labeled at the bounding-boxlevel and do not work well with non-convex regions such asvegetation. Since we do not have a sufficient number of imageswith labeled ground truth data, and neural networks trained onother cities were found to perform poorly on our new LakeForest StreetView dataset, we do not use deep neural networksfor this work.
III. PROPOSED METHOD
The proposed method, as outlined in Figure 1, works bymatching HOG features [5] from a selected window in a query
Figure 3: Formation of the HOG descriptor from a queryimage window.
Figure 4: The positive and negative weights learned from theHOG features through the EFM discriminative feature
extraction process.
image surrounding an object of interest with the HOG featuresextracted from the similarly shaped objects in other images ofthe dataset. The following few subsections explain in detail thevarious steps needed for the proposed feature extraction andretrieval process.
(a)
(b)
Figure 5: Some sample query images from (a) the PASCALVOC 2012 dataset, and (b) the Oxford Buildings dataset.

119
International Journal on Advances in Software, vol 13 no 3 & 4, year 2020, http://www.iariajournals.org/software/
2020, © Copyright by authors, Published under agreement with IARIA - www.iaria.org
Figure 6: The locations of the images in our dataset. (a) shows the map of Lake Forest. (b) shows the distribution of theGoogle StreetView images collected. (c) shows the locations of our query images.
A. Window Generation
We start with generating objectness windows from eachimage. We use different methods on different datasets for thispurpose. For the PASCAL VOC 2012 dataset [2] and theOxford Buildings dataset [3], the method used by [31] is foundto work well. This method designs an objectness measureand explicitly trains it to distinguish windows containing anobject from background windows. It uses five objectness cues– namely, multi-scale saliency, color contrast, edge density,superpixels straddling, and location and size – and combinesthem in a Bayesian framework. We select the 25 highest-scoring windows from each image in our dataset and extractHOG features from these windows.
For the Lake Forest StreetView dataset introduced by us,the objectness method by [31] does not work well. For thisdataset, we generate windows of interest by a combinationof a patch-wise semantic segmentation and heuristics-basedalgorithm described in more detail in Section IV-C1. Thismethod typically produces less than 10 windows per image.Whatever method we use for generating the windows, thewindow coordinates are pre-calculated and stored for eachimage file in a dataset.
While testing our system, the user generates a windowon the query image manually roughly enclosing the objectof interest. Then, we automatically select 10 slightly offsetversions of this window. Eight of these are generated bymoving the user-selected window to the right, left, up, down,up-right, up-left, down-right and down-left by 5%, respectively.Two windows are generated by expanding and contracting theuser’s selection by 5%, respectively. Features are now extractedfrom these 10 as well as the original window for furtherprocessing. This process is represented in Figure 2.
B. The HOG Descriptor
The idea of HOG rests on the observation that local featuressuch as object appearance and shape can often be characterizedwell by the distribution of local intensity gradients in theimage [5]. HOG features are derived from an image basedon a series of normalized local histograms of image gradientorientations in a dense grid [5]. The final HOG descriptors are
formed by concatenating the normalized histograms from allthe blocks into a single vector.
Figure 3 demonstrates the formation of the HOG vectorfor a window selected from an image. We use the HOGimplementation in [32] for both generating the descriptors andrendering the visualizations used in this paper.
C. Dimensionality Reduction
PCA, which is the optimal feature extraction method in thesense of the mean-square-error, derives the most expressivefeatures for signal and image representation. Specifically, letX ∈ R
N be a random vector whose covariance matrix isdefined as follows [33]:
S = E{[X − E(X )][X − E(X )]t} (1)
where E(·) represents expectation and t the transpose opera-tion. The covariance matrix S is factorized as follows [33]:
S = ΦΛΦt (2)
where Φ = [φ1φ2 · · ·φN ] is an orthogonal eigenvector matrixand
Λ = diag{λ1, λ2, . . . , λN}
a diagonal eigenvalue matrix with diagonal elements in de-creasing order. An important application of PCA is the extrac-tion of the most expressive features of X . Towards that end, wedefine a new vector Y: Y = P tX , where P = [φ1φ2 . . . φK ],and K < N . The most expressive features of X thus definethe new vector Y ∈ R
K , which consists of the most significantprincipal components.
D. EFM
The features obtained after dimensionality reduction byPCA as discussed in Section III-C are the most expressivefeatures for representation. However, they are not the optimumfeatures for classification. Fisher’s Linear Discriminant (FLD),a popular method in pattern recognition, first applies PCAfor dimensionality reduction and then discriminant analysis

120
International Journal on Advances in Software, vol 13 no 3 & 4, year 2020, http://www.iariajournals.org/software/
2020, © Copyright by authors, Published under agreement with IARIA - www.iaria.org
for feature extraction. Discriminant analysis often optimizesa criterion based on the within-class and between-class scattermatrices Sw and Sb, which are defined as follows [33]:
Sw =
L∑
i=1
P (ωi)E{(Y −Mi)(Y −Mi)t|ωi} (3)
Sb =
L∑
i=1
P (ωi)(Mi −M)(Mi −M)t (4)
where P (ωi) is a priori probability, ωi represents the classes,and Mi and M are the means of the classes and the grandmean, respectively. One discriminant analysis criterion is J1:J1 = tr(S−1
wSb), and J1 is maximized when Ψ contains the
eigenvectors of the matrix S−1
w Sb [33]:
S−1
w SbΨ = Ψ∆ (5)
where Ψ,∆ are the eigenvector and eigenvalue matrices ofS−1
wSb, respectively. The discriminating features are defined
by projecting the pattern vector Y onto the eigenvectors of Ψ:
Z = ΨtY (6)
Z thus contains the discriminating features for image classifi-cation.
The FLD method, however, often leads to overfitting whenimplemented in an inappropriate PCA space. To improvethe generalization performance of the FLD method, a properbalance between two criteria should be maintained: the energycriterion for adequate image representation and the magnitudecriterion for eliminating the small-valued trailing eigenvaluesof the within-class scatter matrix. The EFM improves thegeneralization capability of the FLD method by decomposingthe FLD procedure into a simultaneous diagonalization ofthe within-class and between-class scatter matrices [17]. Thesimultaneous diagonalization demonstrates that during whiten-ing, the eigenvalues of the within-class scatter matrix appearin the denominator. As shown by [17], the small eigenvaluestend to encode noise, and they cause the whitening step tofit for misleading variations, leading to poor generalization
TABLE I: The number of images in each class of thePASCAL VOC 2012 dataset
Object Category Number of Images
aeroplane 670
bicycle 552
bird 765
boat 508
bottle 706
bus 421
car 1161
cat 1080
chair 1119
cow 303
dining table 538
dog 1286
horse 482
motorbike 526
person 4087
potted plant 527
sheep 325
sofa 507
train 544
TV/monitor 575
TABLE II: The number of images containing each landmarkin the Oxford Buildings dataset
Landmark Good OK Junk
All Souls Oxford 24 54 33
Ashmolean Oxford 12 13 6
Balliol Oxford 5 7 6
Bodleian Oxford 13 11 6
Christ Church Oxford 51 27 55
Cornmarket Oxford 5 4 4
Hertford Oxford 35 19 7
Keble Oxford 6 1 4
Magdalen Oxford 13 41 49
Pitt Rivers Oxford 3 3 2
Radcliffe Camera Oxford 105 116 127
performance. To enhance performance, the EFM method pre-serves a proper balance between the need that the selectedeigenvalues account for most of the spectral energy of theraw data (for representational adequacy), and the requirementthat the eigenvalues of the within-class scatter matrix (in thereduced PCA space) are not too small (for better generalizationperformance). For this work, the number of eigenvalues wasempirically chosen.
E. Training
The EFM feature extraction method uses positive and neg-ative training samples to find the most discriminative features.In our setting, there is only one query image to be used as apositive sample. This is similar to the Exemplar-SVM trainingscenario used by [15], but to make the training more robustto selection error by the user and to prevent overfitting, weuse 11 windows instead of just the one selected by the user asdescribed in Section III-A.
We rank all region of interest (ROI) windows from allimages in the dataset in terms of Euclidean distance in theHOG space from the original query window. For the negativetraining samples, we use 110 windows that are ranked low, i.e.,are very distant in the HOG space. Experimentally, we foundthat the windows that are ranked last (i.e., farthest from thequery) in the dataset are not very good candidates for negativetraining samples, since they are often outlier windows thatcontain large blank areas like the sky. Instead, windows thathave a rank of 1, 000 to 5, 000 when sorted by increasing HOGdistance were seen to perform well. We also tried training thesystem with different numbers of negative samples and founda number close to 100 performs the best. These windows aremostly background regions like ground and vegetation. Thepositive and negative weights for the HOG features learned bythis method can be seen in Figure 4.
For an n-class problem, the EFM process for discrimina-tory feature extraction reduces the dimensionality of any vectorto n − 1. Since our problem is a two-class problem, EFMproduces one feature per window. We compute the score ofeach window by finding the absolute value of the differencebetween the window EFM feature and the average positivetraining set EFM feature. Ranking the images by their best-scoring windows gives us the retrieval set.
IV. SHAPE RETRIEVAL TASKS AND DATASETS
To prove the effectiveness of our proposed EFM-HOGdescriptor and the associated distance measure, we apply it

121
International Journal on Advances in Software, vol 13 no 3 & 4, year 2020, http://www.iariajournals.org/software/
2020, © Copyright by authors, Published under agreement with IARIA - www.iaria.org
Figure 7: Manually selected training patches used to train the seven SVM classifiers for coarse semantic segmentation.
Figure 8: Some examples of ROI selection from our reference dataset. The left-side images in (a) through (i) show differentsemantic categories by using different colors. The red patches indicate the house category and magenta indicates fence. The
right-side images show the output of our ROI-window generation algorithm. Colors of the rectangles in the right-side imageshave no significance. Note that in (i), no buildings are found, and so no windows are generated.
to three distinct problems. For each of these tasks, we use adifferent dataset with properties suitable for the problem beingaddressed. In this section, we will give a brief description ofthe different problems addressed and datasets used for ourexperiments, and then we will discuss the performance of ournovel EFM-HOG matching algorithm on these datasets in thenext section.
A. Object Search and Retrieval
The first problem that we address is that of object searchand retrieval. In this problem, the user selects a bounding box
around an object in a query image and we attempt to retrievesimilar objects from the dataset. For this task, we use PASCALVOC 2012 dataset [2]. We only use the training/validationdata from this dataset to test our retrieval algorithm. This dataconsists of 11, 540 images from 20 classes (many images havemultiple classes present). The classes in this image dataset areaeroplane, bicycle, bird, boat, bottle, bus, car, cat, chair, cow,dining table, dog, horse, motorbike, person, potted plant, sheep,sofa, train and TV/monitor. The classes and the number ofimages in them are shown in Table I. Figure 5(a) shows someimages from this dataset. We create five randomly selected

122
International Journal on Advances in Software, vol 13 no 3 & 4, year 2020, http://www.iariajournals.org/software/
2020, © Copyright by authors, Published under agreement with IARIA - www.iaria.org
Figure 9: Mean retrieval accuracy (measured by the presenceof a relevant image in the top 10 retrieved images).
100-image test sets from the dataset and perform a five-fold cross-validation. A successful retrieval experiment is onewhere the program retrieves at least one relevant image (animage containing the query object) within the top 10 results.The performance of our descriptor on this dataset is discussedin Section V.
B. Landmark Recognition in the Wild
The second problem that we address is that of landmarkrecognition in the wild. This is more challenging than theobject search and retrieval problem because the images hereare mostly outdoor images, and buildings are not always aseasily distinguishable from their surroundings as object imagesare. The dataset that we use for this problem is the OxfordBuildings dataset [3], which consists of 5, 062 images of11 different Oxford landmarks and distractors collected fromFlickr [34]. 55 images from this dataset were used as queriesfor testing our retrieval system. Flickr images are completely
Figure 10: Landmark image-retrieval accuracy (measured bythe presence of a relevant image in the top 10 retrieved
images) on the Oxford Buildings dataset. The three sets ofvalues show the success rate of HOG and EFM-HOG whilevarying the quality of available matches in the reference set.
Figure 11: The mean landmark-recognition performance onthe Oxford Buildings dataset by using the k-nearest
neighbors method with varying k.
user-generated, which means there is a great variation incamera type, camera angle, scale and lighting conditions. Thismakes this dataset very difficult for image retrieval in generaland landmark-recognition in particular. Figure 5(b) showssome of our query images from this dataset. For each query, theimages that contain the query landmark are further classifiedinto good, OK and junk categories, with progressively poorerviews of the query landmark. Table II shows the landmark-wise distribution of good, OK and junk images in this dataset.
Figure 12: The confusion matrix for thelandmark-recognition performance of the EFM-HOG
descriptor on the Oxford Buildings dataset by using thek-nearest neighbors method with k=3.

123
International Journal on Advances in Software, vol 13 no 3 & 4, year 2020, http://www.iariajournals.org/software/
2020, © Copyright by authors, Published under agreement with IARIA - www.iaria.org
Figure 13: Comparison of image retrieval results for HOG and the proposed EFM-HOG on the PASCAL VOC 2012 dataset.
C. Image-based Geo-Localization
Finally, to test our proposed algorithm for image-basedgeo-localization of buildings within an entire city usingStreetView images, we built a new image dataset [4], whichwe call the Lake Forest StreetView dataset, from the city ofLake Forest, Illinois. We collected two sets of images forthis purpose: one for query images, and one for referenceimages. We acquired our own images for the query datasetby walking around the city and taking photos of buildingswith smartphone cameras. This dataset has 308 images. Forthe reference dataset, we downloaded Google StreetView [14]images from around the city. We downloaded eight overlappingStreetView images from points eight feet apart along everyroad in Lake Forest. This process downloaded 126, 000 images.From our 308 query images, we selected 128 images spreadover the whole city of Lake Forest that contained buildingsthat were also visible in at least one of the reference images.To do this, we wrote a program that uses the GPS tags oneach query image to retrieve the geographically nearest 100images from the reference dataset. We then visually inspectedthis retrieved set to determine if the query image building wasvisible in any of them. Finally, we combined these retrievedsets together, eliminated duplicates, and added a few thousandrandom distractor StreetView images to bring the total upto 10, 000 images. This was our final reference set for theexperiments. Figure 6(a) shows the Google Maps view of LakeForest. Figure 6(b) shows the distribution of our referenceset, which is composed of downloaded Google StreetViewimages. Each blue point in this image represents the locationof a Google StreetView photo. It can be seen that our imagedataset follows the streets and there are large areas withoutany images in between, which are private estates and parks.Finally, Figure 6(c) shows the distribution of our query imagesusing yellow markers. These markers were generated directlyusing the GPS tags of the query images, which were takenusing smartphone cameras.
We ran retrieval experiments on this set using each of
the 128 query images. We manually drew rectangles aroundbuildings in each of the query images, which were then usedto extract the EFM-HOG features for matching. The processof selecting multiple windows that are slightly offset fromthe original reduces the impact of slight variations betweenmanually drawn rectangles in two experiments, but still themanually drawn rectangle boundaries were saved to preserverepeatability between experiments. Degree of success or failureof a retrieval was measured by the mean geographical distanceof retrieved images from the query, and also by the presenceor absence of the query building in the retrieval set.
1) ROI Selection for Geo-localization Problem: HOGmatching starts with selecting a bounding box around the ROI,which in this case would be the buildings. The task of selectingthe buildings in Lake Forest, however, is non-trivial due to acharacteristic of the city itself. The city of Lake Forest has avery large number of trees and most of the houses are farfrom the road in the middle of large estates. The GoogleStreetView images are shot with a wide-angle camera mountedon a moving car. The combination of a wide-angle lens andthe large distance from the road causes the houses to appearvery small in the images, and the vegetation or parts of theroad closer to the camera appear much larger. In majority of thereference images, the buildings occupy only a small portion ofthe image, the rest being filled with vegetation, sky or portionsof the road. Hence, selecting an ROI containing the buildingbecomes an important preprocessing step before features canbe extracted.
The object detection program used on the other twodatasets did not work well on this dataset, and we needed somecoarse form of semantic segmentation to separate the housesfrom the vegetation, road and other objects. We did not use adeep neural network for this purpose because of two reasons.First, we did not need pixel-level separation of categories sinceHOG features are extracted from rectangular windows anyway.Second, we did not have labeled segmentation ground truthtraining images and networks trained on images from other

124
International Journal on Advances in Software, vol 13 no 3 & 4, year 2020, http://www.iariajournals.org/software/
2020, © Copyright by authors, Published under agreement with IARIA - www.iaria.org
Figure 14: Comparison of landmark image retrieval results for HOG and the proposed EFM-HOG on the Oxford Buildingsdataset.
cities did not generalize well to Lake Forest. So, we built ourown semantic segmentation technique for this step.
On visual inspection of the images, we decided there wereseven major semantic classes, namely sky, grass, tree, road,house, fence and vehicles. We manually selected rectangularpatches from each of these classes and extracted three sets offeatures from each patch. These features are color histogramin the HSV color space, HOG and LBP. These three sets offeatures are concatenated to get our feature vector to train theclassifiers for coarse semantic segmentation. For this task, wetrained an SVM [16] classifier for each class.
2) The Linear SVM Classifier: The SVM is a particular re-alization of statistical learning theory. The approach describedby SVM, known as structural risk minimization, minimizesthe risk functional in terms of both the empirical risk andthe confidence interval [16]. The SVM implementation usedfor our experiments is the one that is distributed with theVlFeat package [32]. We use the one-vs-all method to trainan SVM for each semantic category. The parameters of theSVM are tuned empirically using only the training data, andthe parameters that yield the best average precision on thetraining data are used for classification of the test data.
We created the training data for our SVMs in the formof rectangular windows selected manually from the referenceimages. 100 training patches were used per class. Some ofthese patches are shown in Figure 7. We divide each referenceimage into 100 uniformly sized patches over a 10×10 regulargrid and pass each patch through all seven classifiers to
assign one final label to each patch. Finally, we draw minimalbounding boxes around the house and fence category patches(if any) with some padding around them, and extract HOGfeatures from them. This process is shown in the different partsof Figure 8. The bounding boxes in Figure 8(a) look like theyare enclosing vegetation, but there are underlying house andfence outlines visible here through the trees. Bounding boxesare not perfect, and sometimes they either enclose objects otherthan houses, like the blue box in Figure 8(e), or the greenbox in Figure 8(f), or are too large, like the green box inFigure 8(h). False positives, however, are less of a problem toour technique than false negatives, and extra bounding boxesare better than missing houses. Also note that in Figure 8(i),there are no buildings, and no bounding boxes are generated,which is a strong indication that our segmentation algorithmis successful in cutting down on the number of undesirablewindows in a large number of cases. If we had used theobjectness code that we ran on the other two datasets, wewould have got 25 windows from this image as well. Thedifferent colors of the bounding boxes in the right-side imagesin Figure 8 have no special significance. The various colorshave been used to differentiate between the rectangles.
V. EXPERIMENTS AND RESULTS
In this section, we describe in detail the experiments thatwe performed on our three datasets and the results that weobtained in each of the three tasks that we attempted. Foreach of the tasks, we used a different dataset and comparedthe results of our EFM-HOG descriptor with that obtained

125
International Journal on Advances in Software, vol 13 no 3 & 4, year 2020, http://www.iariajournals.org/software/
2020, © Copyright by authors, Published under agreement with IARIA - www.iaria.org
Figure 15: Comparison of image-based geo-localization results for HOG and the proposed EFM-HOG on the Lake ForestStreetView dataset.
by conventional HOG features. We also provide samples ofquery images along with top matching images retrieved by bothalgorithms from all three datasets for a qualitative comparisonof the results.
A. The Object Search and Retrieval Task
The proposed image representation is tested on three differ-ent tasks, the first of which is object search and retrieval. Here,an image is used as a query to retrieve similar scenes from thedataset. For this, the user selects a rectangular ROI from thequery image, and HOG features from this rectangular windoware matched with the 25 highest scoring objectness windowsfrom each image in the database, both in the raw HOG spaceand in the EFM-HOG space after the proposed training andfeature extraction procedure. The closest matches based onEuclidean distance are retrieved in order of their distance fromthe query window. Finding an instance of the query class objectin the top 10 retrieved images is considered a success. Figure 9compares the retrieval success rates of the HOG descriptorand the proposed EFM-HOG representation on the PASCALVOC 2012 dataset. For this dataset, the retrieval experiment isperformed on five random splits and the average success rateis found to be 65.2% for EFM-HOG as compared to 36.8%for HOG. We also find that the conventional HOG performsquite well for clearly segmented objects, such as airplanes inthe sky, but the EFM-HOG performs much better for imagesof objects with a cluttered background.
We also experimented on the Oxford Buildings datasetfrom the retrieval point of view. Figure 9 also comparesthe retrieval success rates of the HOG descriptor and theproposed EFM-HOG representation on this dataset alongsidethe PASCAL VOC 2012 performance. Specifically, in 41 casesout of 55 queries in the Oxford buildings dataset (74.5%cases), the query landmark is retrieved within top 10 imagesby the proposed method, as opposed to 40 by HOG (72.7%cases). This is actually a very small difference, but this can beexplained by the nature of this dataset. For all landmark queryimages in this dataset, there are at least some Good imagesin the dataset that show clear views of the landmarks withno occlusions. HOG is actually pretty effective at retrievingthese images. To better demonstrate the effectiveness of theproposed method, we repeat this experiment with just the OKand Junk images, and then just the Junk images for eachquery. In these experiments, we find that the HOG methodretrieves a relevant image in the top 10 much less frequentlythan the EFM-HOG method. With just the Junk files, EFM-HOG performs more than twice as well as HOG. These resultsare shown in Figure 10.
B. The Landmark-Recognition Task
The second experiment that we performed with the newEFM-HOG descriptor on the Oxford Buildings dataset was alandmark-recognition task where the system tries to label eachquery image with its correct landmark label. Some images

126
International Journal on Advances in Software, vol 13 no 3 & 4, year 2020, http://www.iariajournals.org/software/
2020, © Copyright by authors, Published under agreement with IARIA - www.iaria.org
Figure 16: The means of the top 100 retrieved windows forHOG and EFM-HOG for 4 query images from the PASCAL
VOC 2012 dataset.
in this dataset belong to one of the 11 landmarks listed inTable II, the others belong to none of the classes and areused as distractors. We did this task by retrieving relevantimages in a manner similar to the retrieval task, and thenperforming the k-nearest neighbors (k-NN) classification onthe top k results. The same experiments are repeated for theconventional HOG descriptor as well. As can be seen fromFigure 11, the proposed EFM-HOG outperforms HOG all val-ues of k between 1 and 35. The highest EFM-HOG landmark-recognition performance of 65.5% is achieved at k=3. A furtherbreakdown of the landmark-recognition performance of theEFM-HOG descriptor is seen in Figure 12. Here, the rowsrepresent real landmark labels of the queries and the columnsrepresent predicted labels. The results are averaged over the 5query images for each landmark and the k-NN classifier hasbeen used with k=3.
Some HOG and EFM-HOG retrieval results on the PAS-CAL VOC 2012 dataset are shown in Figure 13. In this figure,the query images are shown on the left of each row with bluebounding boxes followed by the two retrieval sets obtainedby using HOG and EFM-HOG. A red bounding box in aretrieved image indicates that the retrieved image is not fromthe same class from the query image (shown on the left).Correct matches for HOG are shown with green boundingboxes and correct matches for EFM-HOG are shown with cyan
bounding boxes.
Some comparative retrieval results between HOG andEFM-HOG on the Oxford Buildings dataset are shown inFigure 14. In this figure too, the query images are shown onthe left of each row with blue bounding boxes. The retrievalset in the middle of each row is obtained by using HOG andthe retrieval set on the right is obtained by using EFM-HOG.A red bounding box in a retrieved image indicates that theretrieved image has a different landmark building label fromthe query image (shown on the left). Correct label matches forHOG are shown with green bounding boxes and correct labelmatches for EFM-HOG are shown with cyan bounding boxes.
C. The Geo-localization Task
We ran two sets of experiments on our Lake ForestStreetView dataset for this task. The first set does the retrievalwith traditional HOG and the second set uses the proposedEFM-HOG matching. The improvement in retrieved result setsachieved by the proposed EFM-HOG technique can be seenby comparing the results shown in Figure 15. In this figure,the retrieved images have their geographical distance fromthe query written above them. Green text signifies a retrievedimage closer than 0.1 miles, and in all the examples here, anexact match. As can be seen in all the examples, HOG fails tofind even a single match for the building in the query imagein the top 10 retrieval results while EFM-HOG finds one inall three.
Our EFM-HOG match program retrieved (within the top20 results) at least one image that was closer than 100 yards(0.0568 miles) of our query in 40 out of the 128 queries that weused. In 17 of these images the exact building was found andmatched. Three such query images and the top 10 retrievedimages along with their geographic distances are shown inFigure 15. In the result images, a geographic distance writtenin green indicates an actual match. HOG is unable to retrievea match in the top ten results in any of the three queries shownwhile EFM-HOG fetches one result among the top ten in allthree.
D. Qualitative Analysis of Retrieved Image Windows
We also manually inspected our retrieved image windowsand ran some experiments to do a qualitative analysis ofthe results. Figure 16 shows an interesting aspect of ourretrieval technique. Here, we show the image means of thefirst 100 windows retrieved by both HOG and EFM-HOG onthe PASCAL VOC 2012 dataset. The figure shows that theEFM-HOG means contain clearer shapes, which indicates thatthe EFM-HOG retrieves more similar shapes than HOG, evenwhen the results are irrelevant to the query.
A few successfully geo-localized buildings from our re-trieval experiments on the Lake Forest StreetView dataset areshown in Figure 17. In each of the image pairs shown inthis figure, the left image with a red bounding box showsthe query taken with a smartphone camera, and the right onewith a cyan bounding box shows a retrieved image from theLake Forest StreetView dataset. In one of these images, thematch is successful even with only a small section of thefence visible in the query, which shows the technique is quiterobust. The rectangles around the buildings in the retrievedimages themselves were generated by our coarse semantic

127
International Journal on Advances in Software, vol 13 no 3 & 4, year 2020, http://www.iariajournals.org/software/
2020, © Copyright by authors, Published under agreement with IARIA - www.iaria.org
Figure 17: Successfully geo-located query images along with the retrieved Google StreetView images that are exact matchesfor the query.
segmentation algorithm, which is also a qualitative measureof the success of this algorithm.
VI. CONCLUSION AND FUTURE WORK
We have presented in this paper a new image descriptorbased on HOG and discriminant analysis that uses a novelapproach to fetch scenes with similar shaped objects. Wehave conducted experiments using over 5, 000 images fromthe Oxford Buildings dataset and over 11, 500 images fromthe PASCAL VOC 2012 dataset and concluded the following:(i) HOG features are not always sufficiently discriminativeto perform meaningful retrieval, (ii) the discriminative natureof HOG features can be improved with the EFM for featureextraction and dimensionality reduction, and (iii) HOG featuresperform well for clearly isolated objects with little backgroundclutter, but the EFM-HOG performs better for real-worldimages with cluttered backgrounds.
We furthermore demonstrated the effectiveness of our pro-posed EFM-HOG descriptor for geo-localization on a 10, 000-image Lake Forest StreetView dataset that we built fromscratch. We also developed a coarse semantic segmentationstrategy to automatically isolate buildings and draw boundingboxes around them as a preprocessing step before the HOGfeature extraction. Finally, we compare the proposed EFM-HOG representation and the traditional HOG representationto demonstrate that our method is superior for retrieval. Weintend to use this method with other image retrieval tasks in thefuture, so that a more thorough understanding of its strengthsand weaknesses can be achieved.
It is evident that the successful geo-localization in theLake Forest StreetView dataset depends heavily on the qualityof the bounding boxes generated by our coarse semanticsegmentation algorithm, and improving that algorithm willsignificantly improve the results. In future, we plan to developa more robust strategy for semantic segmentation. Superpixel-based and deep neural network-based semantic segmentationmay also be used if we can get a sufficient number of labeledimages. We also plan to extend our dataset to cover other cities.
ACKNOWLEDGMENT
The authors would like to thank Professor Jana Koseckaat the Department of Computer Science, George Mason Uni-versity, Fairfax, Virginia for some valuable input on the EFM-HOG method and the experiments conducted.
The authors would also like to thank the Richter ScholarsProgram at Lake Forest College for partially supporting theresearch presented in this paper.
REFERENCES
[1] S. Banerji and A. Sinha, “EFM-HOG: Improving Image Retrieval inthe Wild,” in Proceedings of the Fourth International Conference onAdvances in Signal, Image and Video Processing (SIGNAL 2019), June2019, pp. 6–11.
[2] M. Everingham, L. J. V. Gool, C. K. I. Williams, J. M. Winn, andA. Zisserman, “The Pascal Visual Object Classes (VOC) Challenge,”International Journal of Computer Vision, vol. 88, no. 2, 2010, pp.303–338.
[3] J. Philbin, O. Chum, M. Isard, J. Sivic, and A. Zisserman, “ObjectRetrieval with Large Vocabularies and Fast Spatial Matching,” inProceedings of the IEEE Conference on Computer Vision and PatternRecognition, 2007, pp. 1–8.
[4] R. R. Zunker, S. Banerji, and A. Sinha, “House Hunting: Image-basedGeo-Localization of Buildings within a City,” in Proceedings of theFifth International Conference on Computing and Data Engineering,2019, pp. 100–104.
[5] N. Dalal and B. Triggs, “Histograms of Oriented Gradients for HumanDetection,” in Proceedings of the IEEE Conference on Computer Visionand Pattern Recognition, vol. 1, 2005, pp. 886–893.
[6] S. Banerji, A. Sinha, and C. Liu, “Scene Image Classification: SomeNovel Descriptors,” in Proceedings of the IEEE International Confer-ence on Systems, Man and Cybernetics, 2012, pp. 2294–2299.
[7] A. Sinha, S. Banerji, and C. Liu, “Novel Color Gabor-LBP-PHOG(GLP) Descriptors for Object and Scene Image Classification,” inProceedings of the Eighth Indian Conference on Computer Vision,Graphics and Image Processing, 2012, pp. 58:1–58:8.
[8] P. F. Felzenszwalb, R. B. Girshick, D. A. McAllester, and D. Ramanan,“Object Detection with Discriminatively Trained Part-Based Models,”IEEE Transactions on Pattern Analysis and Machine Intelligence,vol. 32, no. 9, 2010, pp. 1627–1645.
[9] D. G. Lowe, “Distinctive image features from scale-invariant keypoints,”International Journal of Computer Vision, vol. 60, no. 2, November2004, pp. 91–110.

128
International Journal on Advances in Software, vol 13 no 3 & 4, year 2020, http://www.iariajournals.org/software/
2020, © Copyright by authors, Published under agreement with IARIA - www.iaria.org
[10] H. Bay, T. Tuytelaars, and L. J. V. Gool, “Surf: Speeded up robustfeatures,” in Proceedings of the European Conference on ComputerVision, 2006, pp. 404–417.
[11] K. E. A. Van De Sande, C. G. M. Snoek, and A. W. M. Smeulders,“Fisher and VLAD with FLAIR,” in Proceedings of the IEEE Con-ference on Computer Vision and Pattern Recognition, June 2014, pp.2377–2384.
[12] A. Krizhevsky, I. Sutskever, and G. E. Hinton, “ImageNet Classificationwith Deep Convolutional Neural Networks,” in Proceedings of theTwenty-sixth Conference on Neural Information Processing Systems,2012, pp. 1106–1114.
[13] K. Simonyan and A. Zisserman, “Very deep convolutional networks forlarge-scale image recognition,” in Proceedings of the Third InternationalConference on Learning Representations, 2015.
[14] “Google StreetView,” https://www.google.com/maps, accessed on Mon,December 7, 2020.
[15] T. Malisiewicz, A. Gupta, and A. A. Efros, “Ensemble of Exemplar-SVMs for Object Detection and Beyond,” in Proceedings of the Inter-national Conference on Computer Vision, 2011, pp. 89–96.
[16] V. Vapnik, The Nature of Statistical Learning Theory. Springer-Verlag,1995.
[17] C. Liu and H. Wechsler, “Robust Coding Schemes for Indexing andRetrieval from Large Face Databases,” IEEE Transactions on ImageProcessing, vol. 9, no. 1, 2000, pp. 132–137.
[18] C. Doersch, S. Singh, A. Gupta, J. Sivic, and A. A. Efros, “What makesParis look like Paris?” Communications of the ACM, vol. 58, no. 12,November 2015, pp. 103–110.
[19] J. Hays and A. A. Efros, “IM2GPS: estimating geographic informationfrom a single image,” in Proceedings of the IEEE Conference onComputer Vision and Pattern Recognition, 2008, pp. 1–8.
[20] E. Kalogerakis, O. Vesselova, J. Hays, A. A. Efros, and A. Hertzmann,“Image sequence geolocation with human travel priors,” in Proceedingsof the Twelfth IEEE International Conference on Computer Vision,September 2009, pp. 253–260.
[21] R. Tao, E. Gavves, C. G. M. Snoek, and A. W. M. Smeulders, “Localityin generic instance search from one example,” in Proceedings of theIEEE Conference on Computer Vision and Pattern Recognition, June2014, pp. 2099–2106.
[22] G. Singh and J. Kosecka, “Introspective Semantic Segmentation,”
in Proceedings of the IEEE Winter Conference on Applications ofComputer Vision, 2014, pp. 714–720.
[23] T. Ojala, M. Pietikainen, and D. Harwood, “A comparative study oftexture measures with classification based on featured distributions,”Pattern Recognition, vol. 29, no. 1, 1996, pp. 51–59.
[24] S. Banerji, A. Sinha, and C. Liu, “New image descriptors based on color,texture, shape, and wavelets for object and scene image classification,”Neurocomputing, vol. 117, no. 0, 2013, pp. 173–185.
[25] ——, “A New Bag of Words LBP (BoWL) Descriptor for SceneImage Classification,” in Proceedings of The Fifteenth InternationalConference on Computer Analysis of Images and Patterns, 2013, pp.490–497.
[26] J. Long, E. Shelhamer, and T. Darrell, “Fully convolutional networksfor semantic segmentation,” 2015, pp. 3431–3440.
[27] V. Badrinarayanan, A. Kendall, and R. Cipolla, “Segnet: A deep con-volutional encoder-decoder architecture for image segmentation,” IEEETransactions on Pattern Analysis and Machine Intelligence, vol. 39,no. 12, 2017, pp. 2481–2495.
[28] L. Chen, G. Papandreou, I. Kokkinos, K. Murphy, and A. L. Yuille,“Deeplab: Semantic image segmentation with deep convolutional nets,atrous convolution, and fully connected CRFs,” IEEE Transactions onPattern Analysis and Machine Intelligence, vol. 40, no. 4, 2018, pp.834–848.
[29] W. Wang, Y. Fu, Z. Pan, X. Li, and Y. Zhuang, “Real-time driving scenesemantic segmentation,” IEEE Access, vol. 8, 2020, pp. 36 776–36 788.
[30] G. Papandreou, L. Chen, K. P. Murphy, and A. L. Yuille, “Weakly-and semi-supervised learning of a deep convolutional network forsemantic image segmentation,” in Proceedings of the IEEE InternationalConference on Computer Vision, 2015, pp. 1742–1750.
[31] B. Alexe, T. Deselaers, and V. Ferrari, “Measuring the Objectness ofImage Windows,” IEEE Transactions on Pattern Analysis and MachineIntelligence, vol. 34, no. 11, November 2012, pp. 2189–2202.
[32] A. Vedaldi and B. Fulkerson, “VLFeat: An open and portable libraryof computer vision algorithms,” http://www.vlfeat.org/, 2008, accessedon Mon, December 7, 2020.
[33] K. Fukunaga, Introduction to Statistical Pattern Recognition, 2nd ed.Academic Press, 1990.
[34] “Flickr,” http://www.flickr.com, 2004, accessed on Mon, December 7,2020.

129
International Journal on Advances in Software, vol 13 no 3 & 4, year 2020, http://www.iariajournals.org/software/
2020, © Copyright by authors, Published under agreement with IARIA - www.iaria.org
Requirements Traceability using SysML Diagrams and BPMN
Corina Abdelahad and Daniel Riesco
Departamento de informática
Universidad Nacional de San Luis
San Luis, Argentina
e-mail: [email protected], [email protected]
Carlos Kavka
Research and Development Department
ESTECO SPA
Trieste, Italy
e-mail: [email protected]
Abstract— An important activity in systems development is
ensuring that all system requirements are met. Model-Based
Systems Engineering is a methodology that benefits the
documentation of the requirements and decisions that are
made during the design process. On the other hand, visualizing
different perspectives that focus on different aspects of the
system permits to capture all the details of the design while
refining the level of detail of the models. SysML is a Systems
Modeling Language, which is defined as an extension of the
well-known Unified Modeling Language standard. It is based
on four pillars, which give the possibility to view a system from
four different perspectives, supporting requirements
traceability. Requirements traceability refers to the ability to
describe and follow the life of a requirement in both a forward
and backward direction. This traceability has an important
role in Model-Based Systems Engineering. The central aim of
this paper is to present a traceability approach that supports
decision-making requirements. To carry out this traceability
we propose to combine SysML and Business Process Model
and Notation and Decision Model and Notation. SysML is used
to model some aspects of system, and processes and decision-
making activities are defined in terms of BPMN and DMN
standards, respectively. This proposal seeks to help engineers
to improve their design and enhance traceability starting from
requirements, integrating and covering the different views.
Our contribution is illustrated by means of a case study.
Keywords-SysML; BPMN; DMN; requirements traceability.
I. INTRODUCTION
Abstraction is a technique used by engineers to deal with complexity, permitting them to focus only on the information that is considered significant or relevant. To improve the design of requirements, to understand and cover their different views improving maintenance and verification activities, it is necessary to carry out requirements traceability [1]. International Council on Systems Engineering (INCOSE) [2] indicates that “requirements traceability refers to the ability to describe and follow the life of a requirement in both a forward and backward direction along the design stages”. Traceability plays an important role as part of any Model-Based Systems Engineering (MBSE) methodology. MBSE is a successful methodology for the design of complex systems, which emphasizes the use of models when performing systems engineering activities [3]. These models, which can be executable or not, are used to describe the structure and the behavior of the systems.
With the evolution of systems engineering, the need for a consistent standard modeling language arose. INCOSE
together with the Object Management Group (OMG) [4] defined SysML, a general-purpose modeling language based on UML, which can be used for specifying, analyzing, designing, and verifying complex systems, including hardware, software, information, personnel, procedures, and facilities [5]. SysML is based on four pillars, which give the possibility to view a system from four different perspectives: Requirements, Structure, Behavior and Parametrics, each one of them defined in terms of diagrams [6]. Requirements modeling [7] is implemented in terms of the requirement diagram, which allows for capturing, analyzing and maintaining traceability of requirements in the modeled system. Structure modeling has a block definition diagram as the main diagram, representing structural elements (blocks) with their properties, relationships, and composition. Behavior modeling has different kinds of behavior diagrams like activities diagram, state machine, and sequence diagram. Parametric modeling has a parametric diagram that can be used to identify the system constraints [5]. In SysML, requirements can be related to other requirements, as well as to other model elements via one or more relationships, making possible the traceability of requirements. Furthermore, SysML can be integrated into other tools including spreadsheets and design and simulation software, such as Matlab or Modelica [8], enabling requirements verification.
The specification of business processes also followed the same path requiring standards for its definition. In particular, the Business Process Management Initiative (BPMI) together with the OMG developed the widely used BPMN notation for modeling business processes [9]. BPMN defines an abstract representation for the specification of business processes, which can include human intervention or not. BPMN couples an expressive graphical representation with a rigorous Extensible Markup Language (XML) encoding of processes and the interactions among them, supporting not only modeling activities but also process execution by using appropriate BPMN engines. Several works in the engineering field have shown the value of using BPMN instead of UML activity diagrams. Activity Diagram can be used for business process modeling but BPMN was designed exclusively for modeling business process [9] and OMG adopted BPMN instead of the Activity Diagram (UML AD) as the core standard to create a business modeling framework [10]. BPMN has model elements that, in some cases, do not have a corresponding element in UML 2.0 AD. There are cases when components of the business processes are

130
International Journal on Advances in Software, vol 13 no 3 & 4, year 2020, http://www.iariajournals.org/software/
2020, © Copyright by authors, Published under agreement with IARIA - www.iaria.org
modeled using only one symbol in BPMN and using a group of symbols in UML AD [11]. Since many activities within a business process involve decision-making, the OMG defined recently the Notation and Decision Model and Notation (DMN) standard for the elicitation and representation of decision models, effectively separating decision logic and control flow logic in business processes [12]. DMN was designed to be usable alongside the standard BPMN. At present, many companies have adopted BPMN not only because of its popularity, but because it is strongly related to DMN. This standard is already receiving adoption in the industry, with many tools being developed to assist users in modeling, checking, and applying DMN models.
As the main contribution, this work presents an innovative approach to enhance requirements traceability in the context of MBSE, by combining SysML, BPMN and DMN. This approach can help systems engineers to improve the design of requirements, to understand and cover their different views, improving maintenance and verification activities while contributing to refine the level of detail of the models.
The rest of this paper is organized as follows: Section II introduces related work, while Section III summarizes the basic concepts used in this paper. Section IV addresses the proposed approach with a case study presented in Section V. Section VI shows the conclusion.
II. RELATED WORK
Several works in the field of software engineering are related to the concept of requirements traceability using SysML. For example, the authors in [13] show how requirements traceability for mechatronic design can be achieved using MBSE and SysML. SysML is used for linking system requirements to the system elements of the different domain models while guaranteeing the traceability. This paper presents a case study of a mechatronic system in order to show this traceability.
In [14], the authors propose a Model-Based Systems Engineering approach based on SysML. This approach enables the capture and the definition of functional requirements, validate these functional requirements through functional simulation, and verify efficiently the consistency of these functional requirements. The approach is illustrated by means of a case study of an industrial avionics system.
In [15], a solution for SysML model verification and validation in an industrial context is presented. The authors provide a method and a list of the existing challenges; besides that, they show experimental results. A case study is presented, verification rules are in Object Constraint Language (OCL), while the validation rules are in a formal text format evaluated by a script. The authors mention that the verification of these rules ensures a certain degree of traceability.
In [16], an approach to construct true model-based requirements in SysML is presented. This approach proposes that every requirement can be modeled as an input/output transformation. This proposal uses SysML behavioral and structural models and diagrams, with specific construction rules derived from Wymore’s mathematical framework for
MBSE and taxonomies of requirements and interfaces. The authors consider that this proposal provides several benefits, including traceability, and improved precision over the use of natural language.
In [17], the authors propose a model-based approach to automotive requirements engineering for the general development of vehicles of passengers. The SysML requirement element is extended, through stereotype, to functional and non-functional requirements. The paper validates the advantages that include classified and modeled requirements graphically, as well as their relationships that are explicitly mapped. This article presents a case study that shows the proposed extension and the performed requirements traceability.
In [18], the authors propose a model-driven requirement engineering approach for the embedded software domain. This approach is based on UML, MARTE and SysML standard notations, which are integrated in order to improve requirements specification and traceability. MARTE is used to allow domain-specific non-functional requirements to improve the software specification and SysML is combined with UML/MARTE models to support requirements management, to follow their changes. The approach is illustrated by means of a case study.
In [19], the authors propose a metamodel, which establishes the traceability links among the requirement model, the solution model and the verification and validation model for embedded system design. This approach enables traceability of requirements by considering heterogeneous languages for modeling and verifying real-time embedded systems. A case study illustrates the approach with the use of languages such as SysML, MARTE, SIMULINK, among others.
However, to the best of our knowledge, no research work about requirements traceability has considered the decision requirement, a kind of requirement that involves decision making. This requirement appears in the decision requirement diagram, which represents human decision making or automated decision making within a process. The main motivation of this work is the need to provide support to decision requirements, by offering adequate tools to the systems engineers that improve the design and handling of these types of requirements. Considering this, the approach presented in this paper is a step forward to support decision requirements, completing the different system engineering views by combining of SysML, BPMN and DMN.
III. BASIC CONCEPTS
This section presents the basic concepts on which the proposed approach is based. Section A describes the role of requirements in system engineering, Section B introduces traceability related concepts in SysML, Section C describes the SysML requirements diagram and its relationships with others diagrams like the: use case diagram, block definition diagram and state machine used in the approach. Section D shows some concepts about DMN and its relationship with BPMN.

131
International Journal on Advances in Software, vol 13 no 3 & 4, year 2020, http://www.iariajournals.org/software/
2020, © Copyright by authors, Published under agreement with IARIA - www.iaria.org
A. Requirements
Requirements are the base in system development. They determine what the system has to offer, they can specify a desired feature, property, or behavior of a system, i.e., requirements set out what the system should do and define constraints that it has [20]. The concept of the requirement may also be further classified as [21]:
Business Requirement. A Business Requirement is used to indicate the needs of a business. This impact on the organization and all the projects within it.
Functional Requirement. Functional Requirements produce an observable result to someone, or something, that is using the system, i.e., they are the services that the system should provide.
Non-functional Requirement. A Non-functional Requirement will constrain, or limit in some way, the way in which Functional Requirement may be realized.
B. Traceability in SysML
In [2], INCOSE indicates that “requirements traceability refers to the ability to describe and follow the life of a requirement in both a forward and backward direction along the design stages”. Traceability plays an important role as part of any MBSE methodology [3]. MBSE emphasizes the use of models to perform the systems engineering activities, as mentioned before. In fact, “MBSE is the formalized application of modeling to support system requirements, design, analysis, verification and validation activities beginning in the conceptual design phase and continuing throughout development and later life cycle phases” [22].
Modeling with SysML allows good traceability because it defines relationships between requirements and among other modeling elements [23][24]. Figure 1 describes the approach in which SysML accomplishes traceability by means of the 4 pillars presented in Section I. This figure shows the system model as an interconnected set of model elements. The arrows that cross the pillars, as seen in Figure 1, illustrate how the different elements belonging to the different types of diagrams that participate in the pillars are related, supporting requirements traceability.
C. SysML Requirements diagram and its relationships with
others diagrams
In SysML, the requirements diagram shows the set of requirements and the relationship between them. A requirement specifies a function that must be satisfied or a condition that a system must achieve. Requirements modeling provides a bridge among different SysML diagrams because a requirement can appear on other diagrams to show its relationship to other modeling elements. The relationships that allow relating requirements with other requirements or with other modeling elements are [5]:
Figure 1. A system model example in SysML where requirements
traceability is indicated with the connecting arrows (from [6]).
Containment: a relationship, which is used to represent how a compound requirement can be partitioned into a set of simpler requirements (denoted graphically with a circle containing a + symbol).
«deriveReqt»: a relationship, which describes that a requirement is derived from other requirement.
«satisfy»: a relationship that describes that a design element satisfies a requirement. Usually, a requirement is satisfied by a block.
«verify»: a relationship that connects a test case with the requirement that is verified by that test case.
«refine»: a relationship, which specifies that a model element describes the properties of a requirement in more detail.
«trace»: a general-purpose relationship between a requirement and any other model element.
The requirements can be related to the use cases through the relationship «refine». On the one hand, a use case can be viewed as functionality and/or capacity. On the other hand, a requirement specifies a capability or condition that must be satisfied, as previously mentioned, therefore, a use case diagram may be used to refine one or more functional requirements. In addition, the requirements are related to the blocks through the relationship «satisfy», as mentioned before. The block definition diagram captures the relation between blocks, such as a block hierarchy. Since the activities can be seen as a block, they can have associations between each other, including composition associations. Activities in block definition diagrams appear as regular blocks, except for the «activity» keyword [5]. Depending on the nature of the block, this can have a behavior associated, in that case, states machine can be used to describe its internal states. The state machine diagram is used to specify a behavior, with a focus on the set of states of a block and the possible transitions between those states in response to

132
International Journal on Advances in Software, vol 13 no 3 & 4, year 2020, http://www.iariajournals.org/software/
2020, © Copyright by authors, Published under agreement with IARIA - www.iaria.org
event occurrences, i.e., the state machine diagram presents behavior of an entity, as a block, in terms of its transitions between states triggered by events [25].
SysML enables characterization of any type of requirements for the system, including user, technical or others. A modeler can then define relationships between the specified requirements, providing the opportunity to create traceability among them. There is also an opportunity to create traceability from the logical and structural architecture design to their requirements, one of the most critical activities in systems engineering [26].
D. BPMN and DMN
The OMG provides the DMN notation for modeling decisions, which is not only understandable to stakeholders but it is also designed to be used in conjunction with the BPMN standard notation [12].
DMN provides constructs to both decision requirements and decision logic modeling. For decision requirements modeling, it defines the concept of Decision Requirements Graph (DRG) depicted with the Decision Requirements Diagram (DRD). This latter shows how a set of decisions depends on each other, on input data, and on business knowledge models. A decision element determines an output from the inputs, using decision logic, which may reference one or more business knowledge models. This denotes a function encapsulating business knowledge, e.g., as business rules, a decision table, or an analytic model. A decision table is a representation of decision logic, based on rules that determine the output depending on the inputs [12]. Decision-making modeled in DMN may be mapped to BPMN tasks or activities (Business Rules) within a process modeled with BPMN. The combined use of both thus provides a graphical language for describing decision-making, i.e., the BPMN tasks involving a decision can invoke a DMN decision model.
IV. MBSE AND REQUIREMENTS TRACEABILITY WITH
SYSML
In this section, our contribution of traceability of requirements using SysML, BPMN, and DMN is detailed. Section A presents an extension to SysML for BPMN tasks while Section B describes details on the proposed approach for requirements traceability.
A. SysML extensions for BPMN tasks
In order to support the modeling of BPMN tasks in SysML, the element of SysML block diagram must be extended. As noted above, in block definition diagrams, the activities appear as regular blocks with an «activity» stereotype. The stereotypes are one of the extensibility mechanisms of UML, therefore also of SysML, that enable to extend its vocabulary allowing the creation of new kinds that are derived from existing ones but specific to a problem [27]. Stereotypes are shown as text strings surrounded by the symbols “« »” [28]. The stereotypes change or add semantics to a base SysML element.
Figure 2. Extension of the SysML «Activity» stereotype.
Figure 2 shows the new types of activities through a generalization in order to support all types of BPMN tasks [5].
This extension consists of the following stereotypes:
«serviceTask»: represents a task that uses a web service or an automated application.
«sendTask»: represents a simple task that is designed to send a message to an external participant.
«receiveTask»: represents a simple task that is designed to wait for a message to arrive from an external participant.
«userTask»: represents a task where a person performs the task with the assistance of a software application.
«manualTask»: represents a task that is expected to be performed without the aid of any business process execution engine or any application.
«scriptTask»: represents a task executed by a business process engine.
«businessRuleTask»: represents a task that involves decision-making.
The business rule task was defined in BPMN as a placeholder for (business-rule-driven) decisions, being the natural placeholder for a decision task [12].
B. Requirements Traceability using SysML and BPMN-
DMN
The interaction between the process and the decision models plays a crucial role because a decision can affect the process behavior or flow [9]. Therefore, it is important that decision-making must be considered as a requirement that should be performed and satisfied.
The approach will be illustrated with an example intended to carry out the traceability of the requirements through forward engineering, mainly focusing on those requirements involved in the decision-making activities, in the blocks that have a behavior related with some of these activities, and in the use cases that refine some of those requirements, with the aim of integrating and covering their different views.

133
International Journal on Advances in Software, vol 13 no 3 & 4, year 2020, http://www.iariajournals.org/software/
2020, © Copyright by authors, Published under agreement with IARIA - www.iaria.org
Figure 3. An example of a requirements diagram.
Figure 4. Example of a «satisfy» relationship between an Block and a
Requirement.
Figure 5. Example of a «satisfy» relationship between an Activity and a
Requirement.
Figure 6. Example of a «refine» relationship between a Use Case and a
Requirement
Figure 7. Block definition diagram with activities as blocks.
As it was mentioned before, the SysML requirement diagram has several relationships used to connect requirements. For example, Figure 3 presents a SysML requirements diagram labeled "Example Requirements Diagram", which shows the relationship between requirements. In particular, it can be observed that the requirement with id=“2” has a relationship with the requirement with id=“1.2” through the «deriveReqt» relation. This relation specifies that the requirement with id=“2” is derived from the requirement with id=“1.2”.
Requirements can be related to other requirements and to other modeling elements through a specific set of relationships as mentioned before. Relationships between requirements and other modeling elements can appear on various types of diagrams. Figure 4 shows an example of a «satisfy» relationship between a Block1 block and a Req1.1 requirement, Figure 5 presents an example of a «satisfy» relationship between a SimAct activity and the Req2 requirement, while Figure 6 shows an example of a «refine» relationship between a Use Case and a Req2 requirement. Both requirements appear in the requirement diagram presented in Figure 3.
The interpretation of the «satisfy» relationship is that the
design of the activity depends on the requirement, meaning
that if the requirement changes, the design of the activity
must be changed. The interpretation of the «refine»
relationship is that the Use Case is more concrete than the
requirement, i.e., less abstract. Once the main requirements have been captured, the
elements responsible to satisfy those requirements are modeled through a block definition diagram. As previously mentioned, activities can be seen as a block, except for the «activity» keyword [5]. This later provides a means for representing activity decomposition and allows a requirement to be satisfied with an activity. This activity can then be implemented in terms of the decision requirements diagrams and decision tables DMN. Figure 7 shows an example of decomposition of the SimAct activity, which was presented in Figure 5 by using the stereotypes proposed in Section IV-A. The block definition diagram shown in this

134
International Journal on Advances in Software, vol 13 no 3 & 4, year 2020, http://www.iariajournals.org/software/
2020, © Copyright by authors, Published under agreement with IARIA - www.iaria.org
Figure 8. BPMN diagram of SimAct.
figure indicates that the SimAct is an activity composed of other activities, including Task 1, DecisionMaking Task and Task 2, all these activities being of BPMN activity types.
Finally, in order to cover the different views of the requirements, a BPMN model is constructed and associated to SimAct activity in order to show its behavior, as can be seen in Figure 8. In this figure, the activities that compose SimAct, which were modeled in Figure 7, are explicitated in BPMN format.
To conclude, the decision model related to the business rule task is built, since when BPMN and DMN are used, the BPMN tasks (business rule) have a link associated to the decision model, as mentioned in Section III-D. The DecisionMaking Task can then be implemented in terms of the associated decision requirements diagrams and decision tables.
V. CASE STUDY
To demonstrate our approach, we conducted a case study that includes the partial modeling of a Biodiesel Distiller and its requirements management. This case study illustrates how to carry out the traceability of the requirements through forward engineering.
Biodiesel is a type of biofuel that is similar to petroleum-based diesel, which can replace fossil fuel diesel. It is a sustainable fuel that is produced from fatty acids derived from animals such as beef fat, pork fat, chicken fat; and vegetable oils such as corn oil and cooking oil like those from restaurants that have already been used and disposed of. These oils are converted to diesel fuel through a chemical process.
Distilled biodiesel is a clean fuel that has been purified through the process of distillation. Biofuel distillation is a method that consists of taking a biofuel and removing particles and impurities within the liquid through an evaporation and condensation process.
The requirements diagram in Figure 9 shows the breakdown of the Biodiesel Distiller's requirements into a hierarchy of more refined requirements. This diagram named "Biodiesel Distiller Requirements Diagram" shows the relationship between its elements. In particular, it can be observed that the requirement Initial Statement is partitioned into a set of simpler requirements: Generate Biodiesel, Heat Exchanger, Boiler, Biodiesel Properties and Distill Water. In
addition, two use cases can be seen in the figure: Distill and Change temperature, one of them refines Generate Biodiesel requirement, and the other refines Heat Exchanger requirement. In other words, both use cases are more concrete than the requirements, as was indicated in Section IV-B.
As previously mentioned, requirements can be related to other modeling elements through a specific set of relationships as «satisfy» relationship between a block and a requirement. Furthermore, activities can be seen as blocks. As mentioned in Section III-C, depending on its nature, a block can have a behavior associated and this behavior can be modeled using state machines.
Once the main requirements of Biodiesel Distiller have been captured, the elements responsible to satisfy them are modeled through a block definition diagram.
Figure 10 illustrates how Machine activity is composed of Boiler block, Water block, Generator activity, which satisfies Generate Biodiesel requirement, and Heat Exchanger block, which satisfies Heat Exchanger requirement, both requirements appear in the requirements diagram presented in Figure 9.
Figure 9. Requirements diagram: Biodiesel Distiller Requirements
Diagram

135
International Journal on Advances in Software, vol 13 no 3 & 4, year 2020, http://www.iariajournals.org/software/
2020, © Copyright by authors, Published under agreement with IARIA - www.iaria.org
Figure 10. Generator activity satisfies the Generate Biodiesel requirement,
and Heat Exchanger block satisfies the Heat Exchanger requirement
Figure 11. States machine diagram: States Water
Continuing with the approach, the state machine diagram in Figure 11 shows possible states of Water block presented in Figure 10, which correspond to the states of water during the distillation process shown in Figure 14. Figure 12 illustrates the decomposition of the Generator activity by using the stereotypes proposed in Section IV-A. The block definition diagram shown in this figure indicates that the Generator is an activity composed of other activities such as: Choose method business rule, which involves decision-making, Prepare reactors activity, Notify user task, Heat Water service task, Separate materials service task, Decant activity and Washing by decanting service task, all these activities being of BPMN activity types.
Following the approach presented in this work, a BPMN model is constructed in order to cover the different views of the requirements. This model shows the process, which is carried out to generate biodiesel associated with the Generator activity. Its behavior can be observed in Figure 14. Note that the states of water presented in Figure 11 participate in several of the activities of the BPMN model such as: Decant, Separate materials, Heat Water and Washing by decanting.
The decision model related to the business rule task is built once the BPMN model is generated. To prepare the reactors, the type of method to be used must be known and this depends on the type of material that will be used for the generation of biodiesel. The materials can be beef fat, pork
Figure 12. Decomposition of the Generator activity.
Figure 13. Decision table to Choose method.
fat, chicken fat, and vegetable fat. In the case of study, this decision making is shown in terms of the decision table as shown in Figure 13.
As it was mentioned before, traceability refers to the capability to describe and follow the life of a requirement in both a forward and backward direction along the design stages. Traceability plays an important role in the MBSE methodology. To conclude the study case, and in order to show the requirements traceability presented in this article, Figure 15 shows our approach using three of the four pillars of SysML presented in Section I. This figure shows, through direct engineering, how traceability is carried out, showing how all the models and their elements presented in this section are connected to each other.
As it was mentioned before, the multiple cross-cutting relationships between the model’s elements enable systems engineers to view several different perspectives that focus on different aspects of the system.
The arrows that cross the pillars structure, behavior, and requirements, as seen in Figure 15, illustrate how the different elements belonging to the different types of models that participate in these pillars are interconnected, supporting in this way requirements traceability.
Figure 15 shows the different diagrams presented in this study case: requirement diagram, block definition diagram, state machine diagram, BPMN diagram, and decision table, respectively.
The Requirements pillar contains the requirements model that was initially built for the development of the case study.

136
International Journal on Advances in Software, vol 13 no 3 & 4, year 2020, http://www.iariajournals.org/software/
2020, © Copyright by authors, Published under agreement with IARIA - www.iaria.org
Figure 14. BPMN model of Generator.
Figure 15. Traceability study case.

137
International Journal on Advances in Software, vol 13 no 3 & 4, year 2020, http://www.iariajournals.org/software/
2020, © Copyright by authors, Published under agreement with IARIA - www.iaria.org
The Structure pillar contains two block definition diagrams: the Machine Activity block definition diagram and the Generator Activity block definition diagram. The Machine Activity block definition diagram has four relations. One of them shows the relationship between Heat Exchanger block and Heat Exchanger requirement through a satisfy relationship, as mentioned before. The other relation illustrates the relationship between Generator Activity and Generate Biodiesel requirement through a satisfy relationship, also this diagram has another relation toward Generator Activity block definition diagram, which shows how this activity is decomposed by using the extension proposed in this article. The fourth relation shows how Water block is related with states machine diagram in Behavior pillar. The Generator Activity block definition diagram has a relationship with BPMN model because of model illustrates the process, which is carried out to generate biodiesel associated with the Generator activity.
The Behavior pillar contains three diagrams. A use cases diagram shows the use cases that refine some requirements in the requirement diagram presented, in other words, Distill use case refines Generate Biodiesel requirement, and Change temperature use case refines Heat Exchanger requirement. The other diagram is States Water state machine diagram, which is used to describe the possible states of Water block in Machine Activity block definition diagram being these possible states used in some activities in BPMN model, as mentioned before. These activities are grouped in the model (rounded corner rectangle with a solid dashed line). Finally, this pillar has a BPMN model, which shows the process to generate biodiesel as can be observed in Figure 15 and mentioned before. In addition, the same figure shows the decision model related to the Choose method business rule task.
VI. CONCLUSION
Traceability plays an important role in any Model-Based Systems Engineering methodology. This methodology emphasizes the use of models to perform the systems engineering activities. The objective of this work has been to carry out requirements traceability understanding that requirements traceability is the capability to follow the life-cycle of the requirement. SysML is a general-purpose modeling language, based on UML, which enables traceability because it defines relationships between requirements and other modeling elements. The combination of SysML and BPMN-DMN is attractive and is a step forward that enhances the modeling of the different views of the system to be built including decision requirements. The proposed approach uses the definition of new stereotypes in SysML to support all types of BPMN tasks.
This proposal seeks to integrate and cover the different views of all requirements, helping systems engineers to improve the design of them.
The approach was illustrated through a case study to show how traceability of requirements can be performed.
In future work, we consider analyzing the link among the DMN decision requirements diagram, SysML requirements diagram, and use cases diagram. In addition, we consider
working with parametric diagrams in order to complete the pillars of SysML.
ACKNOWLEDGMENT
The authors thank the reviewers of the ICSEA’19 conference and the IARIA Journal for the very useful comments that have contributed to enhance both the original and the extended versions of the paper.
REFERENCES
[1] C. Abdelahad, D. Riesco, and C. Kavka, “A SysML-based Approach to Requirements Traceability using BPMN and DMN,” ICSEA, pp. 210-216, 2019.
[2] INCOSE https://www.incose.org/ [retrieved: December, 2020].
[3] J. Jacobs and A. C. Simpson, “Towards a process algebra framework for supporting behavioural consistency and requirements traceability in SysML,” in Proceedings of the 15th International Conference on Formal Engineering Methods (ICFEM 2013), Lecture Notes in Computer Science, Springer, vol. 8144, pp. 265-280, 2013.
[4] OMG https://www.omg.org/ [retrieved: December, 2020].
[5] SysML https://www.omg.org/spec/SysML/1.6/PDF [retrieved: December, 2020].
[6] S. Friedenthal, A. Moore, and R. Steiner, “A Practical Guide to SysML: The Systems Modeling Language,” Elsevier, 2014.
[7] P. Spoletini and A. Ferrari, “Requirements elicitation: a look at the future through the lenses of the past,” In 2017 IEEE 25th International Requirements Engineering Conference (RE), IEEE, pp. 476-477, 2017.
[8] Modelica https://www.modelica.org/ [retrieved: December, 2020].
[9] Business process model and notation https://www.omg.org/spec/BPMN/2.0.2/PDF [retrieved: December, 2020].
[10] D. Q. Birkmeier, S. Klöckner, and S. Overhage, “An Empirical Comparison of the Usability of BPMN and UML Activity Diagrams for Business Users,” ECIS 2010 Proceedings 51, 2010.
[11] C. V. Geambaşu, “BPMN vs UML activity diagram for business process modeling,” Accounting and Management Information Systems vol. 11, no. 4, pp. 934-945, 2012.
[12] Decision Model and Notation https://www.omg.org/spec/DMN/1.2/ [retrieved: December, 2020].
[13] E. J. Vidal and E. R. Villota, “SysML as a Tool for Requirements Traceability in Mechatronic Design,” In Proceedings of the 2018 4th International Conference on Mechatronics and Robotics Engineering, ACM, pp. 146-152, 2018.
[14] Z. H. U. Shaofan, T. A. N. G. Jian, J. M. Gauthier, and R. Faudou, “A formal approach using SysML for capturing functional requirements in avionics domain,” Chinese Journal of Aeronautics, vol. 32, no. 12, pp. 2717-2726, 2019.
[15] R. Baduel, M. Chami, J. M. Bruel, and I. Ober, “SysML Models Verification and Validation in an Industrial Context: Challenges and Experimentation,” In European Conference on Modelling Foundations and Applications. Springer, Cham, pp. 132-146, 2018.
[16] A. Salado and P. Wach, “Constructing True Model-Based Requirements in SysML,” Systems, vol. 7, no. 2, 21 pages, 2019.

138
International Journal on Advances in Software, vol 13 no 3 & 4, year 2020, http://www.iariajournals.org/software/
2020, © Copyright by authors, Published under agreement with IARIA - www.iaria.org
[17] K. Gruber, J. Huemer, A. Zimmermann, and R. Maschotta, “Integrated description of functional and non-functional requirements for automotive systems design using SysML,” 2017 7th IEEE Int. Conf. on System Engineering and Technology (ICSET), pp. 27-31, 2017.
[18] M. R. S. Marques, E. Siegert, and L. Brisolara, “Integrating UML, MARTE and SysML to improve requirements specification and traceability in the embedded domain,” In 2014 12th IEEE International Conference on Industrial Informatics (INDIN), IEEE, pp. 176-181, 2014.
[19] H. Dubois, M. A. Peraldi-Frati, and F. Lakhal, “A model for requirements traceability in a heterogeneous model-based design process: Application to automotive embedded systems,” In 2010 15th IEEE International Conference on Engineering of Complex Computer Systems, IEEE, pp. 233-242, 2010.
[20] I. Sommerville, “Software Engineering,” Seventh Edition, Pearson Education, 2004.
[21] J. Holt and S. Perry, “SysML for systems engineering,” vol. 7, IET, 2008.
[22] T. Weilkiens, “Systems engineering with SysML/UML: modeling, analysis, design,” Elsevier, 2011.
[23] O. C. Z. Gotel and A. C. W. Finkelstein, “An Analysis of the Requirements Traceability Problem,” Proc. IEEE Int. Conf. on Requirements Engineering, pp. 94-101, 1994.
[24] K. Hampson, “Technical evaluation of the systems modeling language (SysML),” Procedia Computer Science, vol. 44, pp. 403-412, 2015.
[25] L. Delligatti, “SysML distilled: A brief guide to the systems modeling language,” Addison-Wesley, 2013.
[26] http://www.omgsysml.org/INCOSE-OMGSysML-Tutorial-Final-090901.pdf [retrieved: December, 2020].
[27] UML 2.4 “Infrastructure Specification” https://www.omg.org/spec/UML/2.4.1/ [retrieved: December, 2020].
[28] G. Booch, J. Rumbaugh, and I. Jacobson, “The Unified Modeling Language User Guide,” Addison-Wesley, 1999.

139
International Journal on Advances in Software, vol 13 no 3 & 4, year 2020, http://www.iariajournals.org/software/
2020, © Copyright by authors, Published under agreement with IARIA - www.iaria.org
Build Comparator: Integrated Semantic Comparison for Continuous Testing of
Android-based Devices using Sandiff
Carlos E. S. Aguiar, Jose B. V. Filho, Agnaldo O. P. Junior,Rodrigo J. B. Fernandes, Cıcero A. L. Pahins, Paulo C. R. Fonseca
Sidia R&D InstituteManaus, Brazil
Emails: {carlos.aguiar, jose.vilarouca, agnaldo.junior,rodrigo.fernandes, cicero.pahins, paulo.fonseca}@sidia.com
Abstract—With ever-larger software development systems con-suming more time to perform testing routines, it is necessaryto think about approaches that accelerate continuous testing ofthose systems. This work aims to allow the correlation of semanticmodifications with specific test cases of complex suites, and basedon that correlation, skip time-consuming routines or mount lists ofpriority routines (fail-fast) to improve the productivity of mobiledevelopers and time-sensitive project deliveries and validation. Inorder to facilitate continuous testing of large projects, we proposeSandiff, a solution to efficiently analyze semantic modificationson files that impact domain-specific testing routines of the officialAndroid Test Suite. We also propose the Build Comparator, anintegrated tool that leverages the semantic comparison on real-world use cases. We demonstrate our approach by evaluatingboth semantic coverage and scalability on a set of commercially-available Android images of a large mobile-related company thatcomprises both major and minor versions of the system.
Keywords–Testing; Validation; Content Comparison; Continu-ous Delivery; Tool.
I. INTRODUCTION
As software projects grow up, continuous testing becomescritical, but at the same time, complicated and time-consuming.Consider a project with a million files and intermediate arti-facts. A test suite that offers continuous testing functionalitiesmust perform without creating bottlenecks or impacting projectdeliveries. However, effectively using continuous integrationcan be a problem: tests are time-consuming to execute. Con-sequently, it is impractical to run complete modules of testingon each build. In these scenarios, it is common that teams lacktime-sensitive feedback about their code and compromise userexperience.
The testing of large software projects is typically boundedto robust test suites. Moreover, the quality of testing andevaluation of ubiquitous software can directly impact people’slife, a company’s perceived image, and the relation with itsclients. Companies inserted in the Global Software Develop-ment (GSD) environment, i.e., with a vast amount of develop-ers cooperating across different regions of the world, tend todesign a tedious testing and evaluation process that becomeshighly time-consuming and impacts the productivity of devel-opers. Moreover, continuous testing is a de facto standard inthe software industry. During the planning of large projects, itis common to allocate some portion of the development periodto design testing routines. Test-Driven Development (TDD)is a well-known process that promotes testing before feature
development. Typically, systematic software testing approacheslead to computing and time-intensive tasks.
Sandiff [1] is a tool that helps to reduce the time spent ontesting of large Android projects by enabling to skip domain-specific routines based on the comparison of meaningful datawithout affecting the functionality of the target software.For instance, when comparing two Android Open SourceProject (AOSP) builds generated in different moments, butwith the same source code, create the environment and buildinstructions, the final result is different in byte level (byte-to-byte). Still, it can be semantically equivalent based on itscontext (meaning). In this case, it is expected that these twobuilds perform the same. However, how to guarantee this? Oursolution relies on how to compare and demonstrate that twoAOSP builds are semantically equivalent. Another motivationis the relevance of Sandiff to the continuous testing area,where it can be used to reduce the time to execute the officialAndroid Vendor Test Suite (VTS). As our solution provides alist of semantically equivalent files, it is possible to skip teststhat show the behavior provided by these files. The Figure 1shows the execution official Android Test Suite is execute in acommercially-available build based on AOSP. The executionof all modules exceeded 4 hours, compromising developerperformance and deliveries on a planned schedule.
By comparison of meaningful data, we mean comparisonof sensitive regions of critical files within large software: dif-ferent from a byte-to-byte comparison, a semantic comparisoncan identify domain-related changes, i.e., it compares sensitivecode paths, or key-value attributes that can be related to theoutput of large software. By large, we mean software designedby a vast number of developers inserted in a distributedsoftware development environment; after that, automatic testsuits are necessary.
Another motivation of Sandiff is to enable developers tofind bugs faster on complex software. Take as an example acamera bug in which the component or module is part of acomplex Android subsystem stack covering various architec-tural levels: application framework, vendor framework, nativecode, firmware, and others. With the help of the Sandiff, a de-veloper can analyze the semantic comparison between differentsoftware releases and narrow the source of the problem.
In summary, we present the key research contributions ofour proposal:

140
International Journal on Advances in Software, vol 13 no 3 & 4, year 2020, http://www.iariajournals.org/software/
2020, © Copyright by authors, Published under agreement with IARIA - www.iaria.org
Suite/Plan VTS/VTSSuite/Build 9.0 R9 / 5512091Host Info seltest-66 (Linux - 4.15.0-51-generic)Start Time Tue Jun 25 16:17:23 AMT 2019End Time Tue Jun 25 20:39:46 AMT 2019Tests Passed 9486Tests Failed 633Modules Done 214Modules Total 214Security Patch 2019-06-01Release (SDK) 9 (28)ABIs arm64-v8a,armeabi-v7a,armeabi
Figure 1. Summary of the official Android Test Suite – Vendor TestSuite (VTS) – of a commercially-available AOSP build.
1. An approach to perform semantic comparison and facili-tate continuous testing of large software projects.
2. An integrated Build Comparator tool that leverages se-mantic comparison to support Android-based softwarereleases and DevOps teams.
3. An evaluation of the impact of using Sandiff in real-worldand commercially-available AOSP builds.
Our paper is organized as follows. In Section II, weprovide an overview of binary comparators and their impact oncontinuous testing of large projects. In Section III, we describeSandiff and its main functionalities: (i) input detection, (ii) con-tent recognition, and (iii) specialized semantic comparison. InSection IV, we present the Build Comparator tool and its ar-chitecture, which enables the integration of Sandiff on systemsof the Android development environment. In Section V, wepresent the evaluation of Sandiff in commercially-availablebuilds based on AOSP and discuss the impact of continuoustesting of those builds. We conclude the paper with avenuesfor future work in Section VI.
II. RELATED WORK
To the best of our knowledge, few literature approachespropose comparison of files with different formats and types.Most comparison tools focus on the comparison based on diff(text or, at most, byte position). Araxis [2] is a well-knowncommercial tool that performs three types of file comparison:text files, image files, and binary files. For image files, thecomparison shows the pixels that have been modified. Forbinary files, the comparison is performed by identifying thedifferences in a byte level. Diff-based tools, such as GnuDiff Tools [3] diff and cmp, also perform file comparisonbased on byte-to-byte analysis. The main difference betweendiff and cmp is the output: while diff reports whether filesare different, cmp shows the offsets, line numbers and allcharacters where compared files differs. VBinDiff [4] is anotherdiff-inspired tool that displays the files in hexadecimal andASCII, highlighting the difference between them.
Other approaches to the problem of file comparison, ina semantic context, typically use the notion of change or editdistance [5] [6]. Wang et al. [5] proposed X-Diff, an algorithmthat analyses the structure of an XML file by applying standardtree-to-tree correction techniques that focus on performance.Pawlik et al. [6] also propose a performance-focused algorithm
based on the edit distance between ordered labeled nodes of anXML tree. Both approaches can be used by Sandiff to improveits XML-based semantic comparator. Similarly, with studyapplied on music notations, in [7] implemented a solution tocompare files, like XML, based on a tree representation ofmusic notation combining with sequence and tree distance.Besides, the authors show a tool to visualize the differencesside-by-side.
In [8], is showed a tool named Diffi, which is a diffimproved build to observe the correlation between file formats.So, Diffi verifies the heaps of the files’ reflection levels anddiscovers which file levels can recognize the delta between twofiles correctly.
In [9], the authors explore the use of wavelets for thedivision of documents into fragments of various entropy levels,which made a separation between grouping sections to decidethe similarity of the files, and finally, detect malicious software.Additionally, with a similar objective in [10] is investigated theapplicability of machine learning techniques for recognizingcriminal evidence in activities into file systems, verifyingpossible manipulations caused by different applications.
Different from previous works, the Sandiff also supportsbyte-level and semantic comparison simultaneously. However,the semantic comparison is the main focus of the tool tofacilitate extensive software projects testing since it allows todiscard irrelevant differences in the comparison.
III. SANDIFF
Sandiff aims to compare meaningful data of two artifacts(e.g., directories or files) and report a compatible semanticlist that indicates modifications that can impact the output ofdomain-related on continuous testing setups of large projects.In the context of software testing, syntactically different (byte-to-byte) files can be semantically equivalent. Once the charac-teristics of a context are defined, previously related patterns tothis context can define the compatibility between artifacts fromdifferent builds. By definition, two artifacts are compatiblewhen the artifact A can replace the artifact B without losing itsfunctionality or changing their behavior. As each file type hasits own set of attributes and characteristics, Sandiff employsspecialized semantic comparators that are designed to supportnontrivial circumstances of domain-specific tests. Considerthe comparison of AOSP build output directory and its files.Note that the building process of AOSP in different periodsof time can generate similar outputs (but not byte-to-byteequivalent). Different byte-to-byte artifacts are called syntac-tically dissimilar and typically require validation and testingroutines. However, in the context where these files are used, theposition of key-value pairs do not impact testing either softwarefunctionality. We define these files as semantically compatible,once Sandiff is able to identify them and suggest a list of teststo skip. Take Figure 3 as example. It shows a difference inthe position of the last two lines. When comparing them byte-to-byte, this results in syntactically different files. However,in the execution context where these files are used, this isirrelevant, and the alternate position of lines does not changehow the functionality works. Thus, the files are semanticallycompatible.
Sandiff consists of three main functionalities: (i) inputdetection, (ii) content recognition, and (iii) specialized se-mantic comparison, as shown in Figure 2. During analysis of

141
International Journal on Advances in Software, vol 13 no 3 & 4, year 2020, http://www.iariajournals.org/software/
2020, © Copyright by authors, Published under agreement with IARIA - www.iaria.org
Figure 2. Sandiff verifies the semantic compatibility of two files or directories (list of files) and report their differences.
Configuration 1ro.build.version.preview sdk=0ro.build.version.codename=RELro.build.version.all codenames=RELro.build.version.release=8.0.0ro.build.version.security patch=17-08-05
Configuration 2ro.build.version.preview sdk=0ro.build.version.codename=RELro.build.version.all codenames=RELro.build.version.security patch=17-08-05ro.build.version.release=8.0.0
Figure 3. Example of AOSP configuration files.
TABLE I. SUMMARY OF CONTENT RECOGNITION ANALYSIS FOREACH FILE.
Attribute MeaningTag Represents a file typeAction Action to be taken with the file. (COMPARE or IGNORE)Reason In case of action IGNORE, the reason of ignoreContext Information about context that is used to define the ACTION
directories and files, we can scan image files or archives thatrequire particular read operations. The first step of Sandiffis to identify these files to abstract file systems operationsused to access the data. This task is performed by the InputRecognizer. Then, the Content Recognizers and Comparatorsare instantiated. In order to use the correct Comparator, Sandiffimplements recognizers that are responsible to detect supportedfile types and indicate if a file should be ignored or not basedon a test context. Once Sandiff detects a valid file, it proceedsto the semantic comparison. The Comparators are specializedmethods that take into consideration features and characteris-tics that are able to change the semantic meaning of executionor testing, ignoring irrelevant syntactical differences. Notethat the correct analysis of semantic differences is both filetype and context-sensitive. Sandiff implements two operationmodes: (i) file and (ii) directory-oriented (walkables). In file-oriented mode, the input is two valid comparable files, whereasdirectory-oriented is the recursive execution of file-orientedmode in parallel, using a mechanism called Orchestrator.In the following sections, we describe the functionalities ofSandiff in detail.
A. Content RecognitionThe Sandiff performs the analysis of file contents by
leveraging internal structures, and known patterns to allowthe correct selection of semantic comparators, i.e., artifactextension, headers, type signatures, and internal rules of AOSPto then summarize the results into (i) tag, (ii) action, (iii)
reason, and (iv) context attributes, as shown in Table I. Eachattribute helps the semantic comparators to achieve maximumsemantic coverage over file types inside images embeddedon commercially-available devices. The Android-based devicesinclude several partitions that serve for specific purposes onboot process and general operation, as defined below:
• system.img: contains the Android operating systemframework.
• vendor.img: contains any manufacturer-specific binaryfile that is not available to the AOSP.
• userdata.img: contains user-installed data and appli-cations, including customization data.
To measure the semantic coverage, we gathered the per-centage (amount of files) of file types inside vendor.img.We created a priority list to develop semantic comparators,as shown in the Table II. For instance, both ELF (32 and 64bits) files represent about roughly 60% of total files inside.img files, whereas symbolic link files about 14% and XMLfiles about 6%. This process enables us to achieve about 90%of semantic coverage. As the comparison is performed in asemantic form, it is necessary to know the context in whichthe artifact was used to enable the correlation between filesand test cases. Note that a file can impact one or more tests ina different manner, e.g., performance, security and fuzz tests.The remaining 10% of files are compared using the byte-to-byte comparator.
Each recognizer returns a unique tag from a set of availabletags or a tag with no content to indicate that the file couldnot be recognized. Recognizers can also decide whether afile should be ignored based on context by using the actionattribute and indicating a justification in the reason attribute.Recognizers are evaluated sequentially. The first recognizerruns and tries to tag the file: if the file cannot be tagged,the next recognizer in the list is called, repeating this processuntil a valid recognizer is found or, in the latter case, the fileis tagged to the default comparator (byte-to-byte). Table IIIsummarizes the list of AOSP-based recognizers supported bySandiff.
B. Semantic ComparatorsSandiff was designed to maximize semantic coverage of
the AOSP by supporting the most relevant intermediate filesused for packing artifacts into .img image files, i.e., thebootable binaries used to perform a factory reset and restore theoriginal operating system of AOSP-based devices. To ensure

142
International Journal on Advances in Software, vol 13 no 3 & 4, year 2020, http://www.iariajournals.org/software/
2020, © Copyright by authors, Published under agreement with IARIA - www.iaria.org
TABLE II. SUMMARY OF SANDIFF SEMANTIC COVERAGE.
File Type # Files Percentage (%)ELF-64 320 31.34ELF-32 298 29.19Symbolic link 152 14.89XML document text 63 6.17RC 34 3.33.bin 34 3.33.tlbin 28 2.74.prop 21 2.06.conf 10 0.98ASCII text 8 0.79Exported SGML 6 0.59.dat 6 0.59.hcd 4 0.39JAR 3 0.29.txt 3 0.29.xml 2 0.20Gzip compressed data 1 0.10SE Linux 1 0.10PEM certificate 1 0.10
* Green = Semantic comparison is performed. Red = Semantic comparison notapplicable. Default comparator (checksum) is performed. Orange = Semanticcomparison not supported by Sandiff. Default comparator (checksum) is performed.
TABLE III. LIST OF AOSP-BASED RECOGNIZERS SUPPORTED BYSANDIFF.
Recognizer Tags ActionIgnoredByContextRecognizer ignored by context IngoreContextFileRecognizer zip manifest CompareMagicRecognizer elf, zip, xml, ttf, sepolicy CompareAudioEffectsRecognizer audio effects format CompareSeappContextsRecognizerc seapp contexts ComparePKCS7Recognizer pkcs7 ComparePropRecognizer prop CompareRegexLineRecognizer regex line CompareSEContextRecognizer secontext Compare
ExtensionRecognizerBased on file name.e.g.: file.jpg ? ”jpg”
Compare
the approach assertiveness, we performed an exploratory dataanalysis over each file type and use case to define patternsof the context’s characteristics for each semantic comparator.The exploratory data analysis over each file type relies on threesteps:
1. file type study;2. where these files are used;3. how these files are used (knowledge of its behavior).
The result of this analysis was used to implement eachsemantic comparator. The following subsections describe themain semantic comparators of Sandiff.
1) Default (Fallback) Comparator: Performs byte-to-byte(checksum) comparison and is the default comparator forbinary files (e.g., .bin, .tlbin, and .dat). Acts as a fallback
TABLE IV. EXAMPLE OF COMPARING TWO SEQUENCES OF BYTES.
Position 0 1 2 3 4 5 6 7 8Sequence #1 1D E1 2A DD 5F AE F8 5F 19Sequence #2 1D ED 31 9E 5F 08 F8 5F 2E
alternative, performing comparison for cases where (i) file typeis not recognized or is unsupported and (ii) due to any errorsduring the comparison (e.g., corrupted or malformed files).Sandiff employs the industry standard [11] MD5 checksumalgorithm, as it balances performance and simplicity to verifydata integrity. For security-critical scenarios, Sandiff offers aset of SHA algorithms with improved robustness and reliabilityfor collision attacks, i.e., verification of intentional corruption,despite lower run-time performance. The supported alternativesare: SHA1 [12], SHA224 [13], SHA256 [14], SHA384 [15],and SHA512 [16]. To choose the most suitable algorithm,it is necessary to consider the infrastructure, the applicationrequirements and the knowledge of the developers. A completeoverview and discussion about SHA algorithms is provided in[17], [18] reviews.
When comparing two or more sequences of bytes, eachposition is represented on hexadecimal format, i.e., positionalformat that represents numbers using a base of 16 and usessymbols 0-9 and A-F, representing each byte by two hex-adecimal digits. Table IV illustrates how Sandiff performs thebyte-to-byte comparison. Note that in this case, the comparisonverified that positions 1-3, 5 and 8 are different, summarizingthe result as illustrated in Listing 1.
Difference(s):Differs on range between position 1 and 3Differs on byte at position 5Differs on byte at position 8
Listing 1. Example of checksum comparator output.
2) Audio Effects: AOSP represents audio effects and con-figurations in .conf files that are similar to .xml:
(i) <name>{[sub-elements]}(ii) <name> <value>
Audio files are analysed by an ordered model detectionalgorithm that represents each element (and its sub-elements)as nodes in a tree alphabetically sorted.
3) Executable and Linking Format (ELF): ELF files arecommon containers for binary files in Unix-base systems thatpacks object code, shared libraries, and core dumps. Thiscomparator uses the definition of the ELF format (<elf.h>library) to analyse (i) the files architecture (32 or 64-bit),(ii) the object file type, (iii) the number of section entries inheader, (iv) the number of symbols on .symtab and .dynsymsections, and (v) the mapping of segments to sections bycomparing program headers content.
To correlate sections to test cases, Sandiff detects semanticdifferences for AOSP test-sensitive sections (e.g., .bss, .rodata,.symtab, .dynsym, .text), listing and performing byte-to-bytecomparison on all relevant ELF sections found on targetfiles. Table VI summarizes irrelevant sections to ignore whenimplementing the semantic comparison for ELF files. WhenELF files are Linux loadable kernel modules (.ko extension,

143
International Journal on Advances in Software, vol 13 no 3 & 4, year 2020, http://www.iariajournals.org/software/
2020, © Copyright by authors, Published under agreement with IARIA - www.iaria.org
TABLE V. LIST OF LISTCOMPARATOR OPERATIONS MODES ANDFLAGS SUPPORTED BY SANDIFF.
Flag Description
File Order Indicates if there are difference among the item positionin list and the line number of file
Line TypeIndicates if file lines has only one key ONLY KEY) or are(composed by more elements (MORE THAN KEY), witha value associated to the key
Displacement Indicates if the result refers to differences semanticallyrelevant (true), or differences semantically irrelevant (false)
TABLE VI. LIST OF IRRELEVANT SECTIONS FOR SEMANTICCOMPARISON OF ELF FILES.
Section Reason.debug * holds information for symbolic debugging.comment version control information
.gnu debugdataallows adding a subset of full debugging info to a specialsection of the resulting file so the stack traces can be moreeasily ”symbolicated”
.gnu debuglink contains a file name and a CRC checksum of a separateddebug file
.gnu hash allow fast lookup up of symbols to speed up linking
.ident where GCC puts its stamp on the object file, identifying theGCC version which compiled the code
.shstrtab section names
.got.* provides direct access to the absolute address of a symbolwithout compromising position-independence and sharebility
.note.gnu.build-id unique identification 160-bit SHA-1 string
kernel object), the comparator checks if the module signature ispresent to compare its size and values. Signature differencesare not considered relevant to semantic comparison. In caseof any ELF file is corrupted or malformed, the fallbackcomparison is performed.
4) ListComparator: Base comparator for files structuredas item lists, reporting (i) items that exist only in one of thecompared files, (ii) line displacements (i.e., lines in differentpositions), (iii) comments and empty lines, and (iv) duplicatedlines. To facilitate the correlation between files and test cases,Sandiff implements specific list-based semantic comparatorsfor Prop, Regex Line and SELinux files, as they containproperties and settings that are specific to a particular AOSP-based device or vendor. To support such variety of files, thelist-based comparators offers a list of operation modes totackle specific scenarios, e.g., when the file has empty lines orcomments semantically irrelevant, as summarized in Table V.The following paragraphs describe the list-based comparatorsof Sandiff.
a) Prop: Supports files with .prop extensions andformatted as <key> = <value> patterns. Prior to analysis,each line of a .prop file is categorized in import, include orproperty, as defined below:
1. import: lines with format import <key>, i.e., linescontaining the word ”import”, followed by one key.
2. include: lines with format include <key>, i.e., linescontaining the word ”include”, followed by one key.
3. property: lines with format <key> = [<value>], i.e.,lines containing a pair composed by a key and an asso-ciated value (optional) - separated by ”=” symbol.
After categorization, each line is parsed and added to itsrespective list, i.e., import, include, and property lists. Eachof the three lists is individually compared with the others,generating disjoint results that are later jointed for reporting.
TABLE VII. LIST OF SEMANTIC IRRELEVANT PROPERTIES OFANDROID BUILDS.
Property DescriptionBD Found in system/sepolicy versionro.bootimage.build.* Build property set by android/build/make/core/Makefile
ro.build.* Build property set by android/build/make/tools/buildinfo.shat each new build
ro.expect.recovery id Build property set by android/build/make/core/Makefilero.factory.build id Build property set by android/build/make/core/main.mkro.ss.bid Build property set by android/build/make/core/main.mkro.vendor.build.* Build property set by android/build/make/core/Makefile
The PropComparator also provides a list of properties to bediscarded (considered irrelevant) on the semantic comparison,as summarized in Table VII. A line can be ignored if is emptyor commented.
b) RegexLine: Performs the comparison of files inwhich all lines match a user-defined regex pattern, e.g.,’/system/.’ or ’.so’, offering the flexibility to performsemantic comparison of unusual files.
c) SELinux: Security-Enhanced Linux, or SELinux, is amechanism that implements Mandatory Access Control (MAC)in Linux kernel to control the permissions a subject contexthas over a target object, representing an important securityfeature for modern Linux-based systems. Sandiff supportssemantic comparison of SELinux specification files that arerelevant to security test cases of the VTS suite, i.e., Seappcontexts, SELinux context, and SELinux Policy, summarizing(i) components, (ii) type enforcement rules, (iii) RBAC rules,(iv) MLS rules, (v) constraints, and (vi) labeling statements.
5) RC: The Android Init System is responsible for theAOSP bootup sequence, init and init resources, componentsthat are typically customized for specific AOSP-based devicesand vendors. The initialization of modern systems consists ofseveral phases that can impact a myriad number of test cases(e.g., kernel, performance, fuzz, security). Sandiff supports thesemantic comparison of .rc files that contain instructions usedby the init system:
• imports: analyses the importing calls of the invokingmechanism.
• actions: compares the sequence of commands to test iflogical conditions are met, since commands in differentorder may lead to different results.
• services: tackles operation modes by analysing options(e.g., oneshot, onrestart, etc.) and characteristics (e.g.,critical, priority, etc.) of the init-related services.
6) Symbolic Link: The semantic comparison of symboliclinks is an important feature of Sandiff that allows correlationbetween test cases and absolute or relative paths that canbe differently stored across specific AOSP-based devices orvendors, but result in the same output or execution. Thealgorithm is defined as follows: first it checks if the file statusis a symbolic link, and if so, reads where it points to. Withthis content it verifies if two compared symbolic links pointsto same path. The library used to check the file status dependson the input type and is abstracted by Input Recognizers. Thelibraries are:
File System→ <sys/stat.h>
Image File→ <ext2/ext2fs.h>
ZIP→ <zip.h>

144
International Journal on Advances in Software, vol 13 no 3 & 4, year 2020, http://www.iariajournals.org/software/
2020, © Copyright by authors, Published under agreement with IARIA - www.iaria.org
7) True Type Font: Sandiff uses the Freetype library [19]to extract data from TrueType fonts, which are modeled interms of faces and tables properties. For each property field, thecomparator tags the semantically irrelevant sections to ignoreduring semantic comparison. This is a crucial feature of Sandiffsince is common that vendors design different customizationon top of the default AOSP user interface and experience.
8) XML: XML is the de facto standard format for webpublishing and data transportation, being used across allmodules of AOSP. To support the semantic comparison ofXML files, Sandiff uses the well-known Xerces library [20]by parsing the Document Object Model (DOM), ensuringrobustness to complex hierarchies. The algorithm comparesnodes and checks if they have (i) different attributes length,(ii) different values, (iii) attributes are only in one of the inputs,and (iv) different child nodes (added or removed).
9) Zip and Zip Manifest: During the building pro-cess of AOSP images, zip-based files may contain JavaArchives (.jar), Android Packages (.apk) or ZIP filesitself (.zip). As these files follow the ZIP structure, theyare analysed by the same semantic comparator. Note that, dueto the archive nature of ZIP format, Sandiff covers differentcases:
1. In-place: there is no need to extract files.2. Ignore Metadata: ignore metadata that is related to the
ZIP specification, e.g., archive creation time and archivemodification time.
3. Recursive: files inside ZIP are individually processed bySandiff, so they can be handled by the proper semanticcomparator. The results are summarized to represent theanalysis of the zip archive.
Another important class of files of the AOSP buildingprocess are the ZIP manifests. Manifest files can containproperties that are time-dependent, impacting naive byte-to-byte comparators. Sandiff supports the semantic comparisonof manifests by ignoring header keys entries (e.g., String:”Created-By”, Regex: ”(.+)-Digest”) and files keysentries (e.g., SEC-INF/buildinfo.xml).
Each APK – the package file format used by Android – hasa set of manifest information and other metadata that are partof the signature process. The most relevant for semantic com-parison are META-INF/CERT.SF and MANIFEST.MF files,since it contains integrity checks for files which are includedin the distribution, as shown in Listings 2 and 3. As both filesshare the same structure, it is possible to analyse them withthe same semantic comparator. The ZipManifestComparatorparses both files and compares headers and digests by ignoringirrelevant header and files entries.
Manifest-Version: 1.0Created-By: singlejarName: AndroidManifest.xmlSHA-256-Digest: cEnjm4r95tb8NSMCP6B2Nn+P1G8sIpeXpPtsmuvSnfM=Name: META-INF/services/
com.google.protobuf.GeneratedExtensionRegistryLoaderSHA-256-Digest: AT7RUk9qflHB8mVVceY0Zi7UuRK2bIPMewdxqL2zIBY=Name: android-support-multidex.version.txtSHA-256-Digest: OuJR1NnX1srJFP8Td2Bv9F5nMX3O5iAgxf15egCfa+Q=
Listing 2. The MANIFEST.MF file contains metadata used by the javarun-time when executing the APK.
Build Comparator
Comparator Service WEB Interface12
Sandiff
OrchestratorManage Parallel Jobs
RecognizersRecognize File Types
Semantic ComparatorsSemantic Comparison
Input AdaptersRecognize and Read Input Files
OutputSemantic Compatible List
AndroidBuild System
4 5 6
73
Figure 4. Build Comparator architecture and its relation with Sandiff’ssemantic comparison features.
Signature-Version: 1.0Created-By: 1.0 (Android SignApk)SHA-256-Digest-Manifest: rk0ZXezaawnGF65RmyYEmpqL+
gFdHzRTNb3kr/NeNNQ=X-Android-APK-Signed: 2, 3Name: AndroidManifest.xmlSHA-256-Digest: ZgWkXiulhWzT7qwbAVYgepd5tyGt6D+RQNAeT+AJw1Y=Name: META-INF/services/
com.google.protobuf.GeneratedExtensionRegistryLoaderSHA-256-Digest: ASo5NB1Aa4gclvZke+olzjfErZMzxn/hthDK7Ann56w=Name: android-support-multidex.version.txtSHA-256-Digest: 6/lnFOH7mFVER94rAWcUmubglFFrHR7nf8+7zqQOgQs=
Listing 3. The CERT.SF file contains the whole-file digest of theMANIFEST.MF and its sections.
10) PKCS7: Public Key Cryptography Standards, orPKCS, are a group of public-key cryptography standards thatis used by AOSP to sign and encrypt messages under a PublicKey Infrastructure (PKI) structured as ASN.1 protocols. Tomaximize semantic coverage, Sandiff ignores signatures andcompares only valid ASN.1 elements.
C. OrchestratorThe Orchestrator mechanism is responsible to share the
resources of Sandiff among a variable number of competingcomparison jobs to accelerate the analysis of large softwareprojects. Consider the building process of AOSP. We noticedthat, for regular builds, around 384K intermediate files aregenerated during compilation. In this scenario, running allroutines of the official Android Test Suite, known as VendorTest Suite (VTS), can represent a time consuming process thatimpacts productivity of mobile developers. To mitigate that,the Orchestrator uses the well-known concept of workers andjobs that are managed by a priority queue. A worker is a threadthat executes both recognition and comparison tasks over apair of files, consuming the top-ranked files in the queue. Toaccelerate the analysis of large projects, Sandiff adopts thenotion of a fail greedy sorting metric, i.e., routines with higherprobability of failing are prioritized. The definition of failingpriority is context-sensitive, but usually tends to emphasizecritical and time-consuming routines. After the processing ofall files, the results are aggregated into a structured reportwith the following semantic sections: (i) addition, (ii) removal,(iii) syntactically equality, and (iv) semantic equality.
IV. INTEGRATED BUILD COMPARATOR TOOL
To provide semantic comparison benefits on supportingsoftware releases and DevOps operations, we propose BuildComparator, an integrated tool that abstracts configuration,image management, test execution, and report visualization to

145
International Journal on Advances in Software, vol 13 no 3 & 4, year 2020, http://www.iariajournals.org/software/
2020, © Copyright by authors, Published under agreement with IARIA - www.iaria.org
Figure 5. (A) Main Build Comparator interface. (B) List of jobs with uniqueidentifier (ID), status, user, and job begin time. (C) Creation of comparison
jobs based on (i) build systems, (ii) remote or (iii) local images.
facilitate Android-based development pipelines and processes.The Build Comparator can be integrated with systems thatare commonly used for compilation jobs and managing theconfiguration and execution of Android’s platform scripts, asshown in Figure 4. The proposed integration covers all mainsteps from user input to report visualization, as follows:
1. The user interacts with the tool through the Web Inter-face, which is responsible for providing communicationbetween the user and service.
2. The Comparator Service provides a REST-based servicethat is responsible for managing the whole life-cycle ofscheduled jobs (i.e., creation, management and running)using Sandiff as back-end. The service is also integratedwith the systems responsible for compilation jobs, per-forming the user credential and image downloads.
3. On Sandiff side, the Input Adapters provide the abilityto R/W different input files, abstracting the methods usedto access the data.
4. The Orchestrator is responsible for managing the paral-lel jobs when Sandiff is filled with directories analysis,tracking file additions, removals, and type changes.
5. The Recognizers are responsible for determining thecorrect Semantic Comparator by analysing the (i) filetype, (ii) header, and (iii) general structure.
6. In the last step, Sandiff generates the semantic compatiblelist, making it available to the Comparator Service andWeb Interface.
In Figures 5 and 6, we summarize the main Build Com-parator interfaces. We use a client-server architecture for thecurrent implementation. The browser-based client is writtenin JavaScript, HTML5, and Angular. The server is a C++11template-based implementation that exposes its API for queriesvia HTTP, enabling the comparison of Android builds accord-ing with the source of the artifacts. The architecture supportsthe most common integration methods with continuous testingtools or development pipelines:
• Build Systems: the artifacts are located in continuousintegration and deployment servers, e.g., QuickBuild [21].
• Remote: the artifacts are located in an HTTP server orthe cloud.
• Local: the artifacts are located in the user’s personalcomputer.
Figure 6. Interface that summarizes the semantic comparison results.(A) General statistics of the analysed pair of Android images. (B) List ofsemantic relevant artifacts that are supported by Sandiff. (C) Type of each
semantic modification (add, remove, edit, type edit).
V. EXPERIMENTS
A. Semantic CoverageTo verify the comparison performance of Sandiff, we
did experiments between different branches of commercially-available images of AOSP. The AOSP contains numeroustypes of files (text, audio, video, symbolic links, binary files,among others) that can be compared semantically. The exper-iments consist of comparing the following image pairs:
- Experiment #1: Analysing two major AOSP with minorrevisions: 8.1.0 r64 x 8.1.0 r65.
- Experiment #2: Analysing the last revision of AOSP Oreoand initial release of AOSP Pie: 8.1.0 r65 x 9.0.0 r1.
- Experiment #3: Analysing the last revision of AOSP Pieand its initial release: 9.0.0 r1 x 9.0.0 r45.
- Experiment #4: Analysing two major releases of AOSPOreo and AOSP 10: 8.1.0 r77 x 10.0.0 r39.
- Experiment #5: Analysing two major releases of AOSP Pieand AOSP 10: 9.0.0 r57 x 10.0.0 r39.
These pairs were compared using both semantic (Sandiff)and byte-to-byte (checksum) comparison methods. To demon-strate the robustness of each method, we analysed the files con-tained in system.img, userdata.img and vendor.imgimages, which are mounted in the EXT2 file system under aUNIX system. Note that, differently from Sandiff, the byte-to-byte comparison cannot read empty files and symbolic linktargets. These files are listed as errors, as shown in Table VIII.
Based on the experiments of Table VIII, we can note thatSandiff was able to analyze large software projects like theAOSP. First, the semantic comparison was able to determine

146
International Journal on Advances in Software, vol 13 no 3 & 4, year 2020, http://www.iariajournals.org/software/
2020, © Copyright by authors, Published under agreement with IARIA - www.iaria.org
TABLE VIII. OVERALL SUMMARY OF THE IMPACT OF USING SANDIFF IN REAL-WORLD COMMERCIALLY-AVAILABLE AOSP BUILDS.
ComparisonAdd Remove Edit Type Edit Equal Error Ignored
Semantic Binary Semantic Binary Semantic Binary Semantic Binary Semantic Binary Semantic Binary Semantic BinaryExperiment #1 0 0 0 0 11 12 0 0 2185 2165 0 19 0 0Experiment #2 13 13 27 27 0 0 3 3 0 0 0 0 0 0Experiment #3 23 23 18 18 527 606 0 0 1929 1805 0 45 0 0Experiment #4 179 179 41 41 98 97 5 5 153 154 0 0 0 0Experiment #5 439 439 240 240 839 844 11 11 785 780 0 0 0 0
* Add = file is present on the second input. Remove = file is present in the first input. Edit = file is present in both inputs, but the comparison returned differences. Type Edit = fileis present in both inputs, but there were changes in its metadata (e.g., permissions). Equal = file is present in both inputs, and the comparison returns an equal status. Error = file ispresent in both inputs, but the comparison returns an error status. Ignored = file is present in both inputs, but is not semantically relevant, so it was ignored.
the file type and compare the file contents and its metadata. Incontrast, a byte-to-byte comparison was unable to compare thesymbolic link’s targets and broken links. Second, the semanticcomparison was able to discard irrelevant differences (e.g.,the build time in build.prop) which are no differences infunctionality.
Note that, during experiment #2, Sandiff is unable toperform a full analysis between these trees because there werestructural changes. For instance, in AOSP Oreo, the /bin is adirectory containing many files. In contrast, in AOSP Pie, the/bin is now a symbolic link to another directory path (thatcan be another image). As a result, Sandiff detects this caseas a Type Edit and does not traverse /bin since it is only adirectory in AOSP Oreo.
The experiment #3 is similar to experiment #1, except thatthe number of edited files is significantly more extensive sincethe code has changed due to the different revisions. We noticethat errors occur in symbolic links, as expected for byte-to-byte comparison. Some files only changed in terms of data,but not in semantic meaning, making this the optimal scenariofor Sandiff over the traditional checksum.
Both experiments #4 and #5 evaluate at which point thesemantic comparison becomes irrelevant, i.e., they exploitSandiff performance when analyzing significantly differentAOSP releases. As expected for these scenarios, the resultsof both semantic and byte-to-byte comparisons are similar.In summary, the semantic comparison is inaccurate whenanalyzing files that are not recognized by the rules in thecurrent implementation of Sandiff, making the byte-to-bytemore appropriate in these cases. Nevertheless, Sandiff is ableto support both semantic and non-semantic tasks, despite run-time performance disadvantages when compared with naivesolutions.
B. ScalabilityTo study the behavior of Sandiff when dealing with multi-
threaded AOSP build systems, we performed a scalabilityevaluation that measures the run-time performance on different(i) execution modes, (ii) number of concurrent comparisonjobs, and (iii) AOSP builds. In this experiment, we used aworkstation-based setup with an Intel Core i7-2600 at 3.40GHzwith 16GB of memory, hereafter called Machine #1, and a datacenter server with an Intel Xeon E5-2697 at 2.30GHz with125GB of memory, hereafter called Machine #2.
The execution modes are responsible for defining theparallel and recursive operations of Sandiff’s Orchestrator, asdefined in Section III. In summary, it manages the strategies
for resource sharing and how comparison results are collected.Below we list the evaluated modes:
• Walk First: leverages multi-threading by sequentiallyanalyzing the directories, distributing its files across thecomparison jobs. It is the default mode of the Sandiff.
• Parallel Walk: performs concurrent directory analysis upto the number of comparison jobs. It is the recommendedmode for analyzing directories with a large number offiles.
• Mixed: iterates in both files and directories.• Slice: lists all files before processing, then distributes
them in similar batches across the maximum number ofcomparison jobs.
To minimize the variance between runs, we repeated eachexperiment four times, as shown in Figures 7 and 8. Note that,despite different scenarios, Sandiff achieved its best run-timeperformance when running with four parallel comparison jobs.Due to AOSP nature, Sandiff cannot successfully parallelizethe jobs since the tasks are interdependent. In general, WalkFirst, Parallel Walk, and Mixed modes tend to attain similarscalability.
To cope with the variance, we repeated each experimentfour times, as shown in Figures 7 and 8. Note that, despitedifferent scenarios, run-time performance increases quickly asthe number of jobs grows. Due to the small amount of data inpure AOSP images - not more than 1900 files and 800MB - theorchestration process among multiple jobs creates an overheadthat is not compensated by the parallelization after four paralleljobs. This limitation is overcome when larger images are used.To illustrate the scenario where more data is compared, werun a comparison between two commercially-available buildsbased on AOSP having 4847 files and a total size of 4GB. Ascan be seen in Figure 9, parallel comparison stands up when ahigher amount of data is compared. Execution time decreasesas the number of jobs gets closer to the number of physicalcores available on the machine.
In general, Walk First, Parallel Walk, and Mixed modestend to attain similar scalability, but Slice mode providedbetter performance, relatively and absolutely, when the numberof jobs coincides with the number of available cores ofthe machine. This occurs due to the decreased number ofcontext changes provided by the Slice mode combined withthe maximum usage of available cores.
VI. CONCLUSION
In this paper, we presented Build Comparator, an integratedtool for supporting software releases and DevOps operations

147
International Journal on Advances in Software, vol 13 no 3 & 4, year 2020, http://www.iariajournals.org/software/
2020, © Copyright by authors, Published under agreement with IARIA - www.iaria.org
Build 8.1.0r64 vs. Build 8.1.0r65 Build 9.0.0r1 vs. Build 9.0.0r45
2 4 6 8 2 4 6 8
9
12
15
Number of Parallel Comparison Jobs
Exe
cutio
n T
ime
(in s
ec)
Execution Modes Mixed Parallel Walk Slice Walk FirstWorkstation Setup
Figure 7. Scalability performance when analysing AOSP builds onworkstation-based setups.
Build 8.1.0r64 vs. Build 8.1.0r65 Build 9.0.0r1 vs. Build 9.0.0r45
0 20 40 60 80 0 20 40 60 80
7.5
10.0
12.5
15.0
Number of Parallel Comparison Jobs
Exe
cutio
n T
ime
(in s
ec)
Execution Modes Mixed Parallel Walk Slice Walk FirstData Center Server
Figure 8. Scalability performance when analysing AOSP builds on datacenter servers, i.e., dedicated environments for experimenting.
on Android development pipelines by leveraging Sandiff, asemantic comparator designed to facilitate continuous test-ing of large software projects, specifically those related toAOSP. To the best of our knowledge, Sandiff is the first toallow correlation of test routines of the official Android TestSuite (VTS) with semantic modifications in intermediate filesof AOSP building process. When used to skip time-consumingtest cases or to mount a list of priority tests (fail-fast), Sandiffcan lead to higher productivity of mobile developers. Weshowed that semantic comparison is more robust to analyzelarge projects than binary comparison since the latter cannotdiscard irrelevant modifications to the target software’s outputor execution. As we refine the semantic comparators of Sandiff,more AOSP specific rules will apply, and consequently, moreitems can be classified as ”Equal” in Sandiff’s comparisonreports.
With Build Comparator, we presented and analyzed anarchitecture that enables the integration of semantic compari-son with systems that are commonly used in the developmentof AOSP software, exploiting real-world use cases. In thecontext of making Sandiff domain agnostic, another avenuefor future work is to explore machine learning techniques
100
150
200
0 20 40 60 80Number of Parallel Comparison Jobs
Exe
cutio
n T
ime
(in s
ec)
Execution Modes Mixed Parallel Walk Slice Walk FirstCommercial AOSP
Figure 9. Scalability performance when analysing a large commercial AOSPbuild on a data center server.
to detect how tests are related to different files and formats.We also plan to extend Build Comparator’s reporting featuresby proposing visualizations that highlight relevant semanticdifferences between pairs of files and integrate Sandiff to theofficial Android Test Suite (VTS) to validate our intermediateresults.
ACKNOWLEDGMENTS
We thank both Rafael Melo da Silva and Nick DiegoYamane Pinto for their valuable help during the developmentof the project. This work was partially supported by SamsungEletronica da Amazonia Ltda., under the auspice of the infor-matics law no 8.387/91.
REFERENCES[1] C. E. D. S. Aguiar, J. I. B. V. Filho, A. O. P. Junior, R. J. B.
Fernandes, and C. A. D. L. Pahins, “Sandiff: Semantic file comparatorfor continuous testing of android builds,” VALID 2019 : The EleventhInternational Conference on Advances in System Testing and ValidationLifecycle, Nov. 2019, pp. 51–55.
[2] Araxis Ltd. Araxis: Software. [Online]. Available: https://www.araxis.com/ [retrieved: November, 2020]
[3] Free Software Foundation, Inc. Diffutils. [Online]. Available: https://www.gnu.org/software/diffutils/ [retrieved: October, 2020]
[4] C. J. Madsen. Vbindiff - visual binary diff. [Online]. Available:https://www.cjmweb.net/ [retrieved: October, 2020]
[5] Y. Wang, D. J. DeWitt, and J. Cai, “X-diff: an effective change detec-tion algorithm for xml documents,” in Proceedings 19th InternationalConference on Data Engineering, March 2003, pp. 519–530.
[6] M. Pawlik and N. Augsten, “Efficient computation of the tree editdistance,” ACM Transactions on Database Systems, vol. 40, 2015, pp.3:1–3:40.
[7] F. Foscarin, F. Jacquemard, and R. Fournier-S’niehotta, “A diffprocedure for music score files,” in 6th International Conferenceon Digital Libraries for Musicology, ser. DLfM ’19. New York,NY, USA: Association for Computing Machinery, 2019, pp. 58–64.[Online]. Available: https://doi.org/10.1145/3358664.3358671

148
International Journal on Advances in Software, vol 13 no 3 & 4, year 2020, http://www.iariajournals.org/software/
2020, © Copyright by authors, Published under agreement with IARIA - www.iaria.org
[8] G. Barabucci, “Diffi: Diff improved; a preview,” in Proceedings of theACM Symposium on Document Engineering 2018, ser. DocEng ’18.New York, NY, USA: Association for Computing Machinery, 2018.[Online]. Available: https://doi.org/10.1145/3209280.3229084
[9] I. Sorokin, “Comparing files using structural entropy,” Journalin Computer Virology, vol. 7, 2011. [Online]. Available: https://doi.org/10.1007/s11416-011-0153-9
[10] R. M. A. Mohammad and M. Alqahtani, “A comparison of machinelearning techniques for file system forensics analysis,” Journal ofInformation Security and Applications, vol. 46, 2019, pp. 53 –61. [Online]. Available: http://www.sciencedirect.com/science/article/pii/S2214212618307579
[11] D. Rachmawati, J. T. Tarigan, and A. B. C. Ginting, “A comparativestudy of message digest 5(MD5) and SHA256 algorithm,” Journal ofPhysics: Conference Series, vol. 978, 2018, pp. 1–6.
[12] G. Leurent and T. Peyrin, “From collisions to chosen-prefix collisionsapplication to full sha-1,” in Annual International Conference on theTheory and Applications of Cryptographic Techniques. Springer, 2019,pp. 527–555.
[13] R. Martino and A. Cilardo, “Sha-2 acceleration meeting the needs ofemerging applications: A comparative survey,” IEEE Access, vol. 8,2020, pp. 28 415–28 436.
[14] D. M. A. Cortez, A. M. Sison, and R. P. Medina, “Cryptographic
randomness test of the modified hashing function of sha256 to addresslength extension attack,” in Proceedings of the 2020 8th InternationalConference on Communications and Broadband Networking, 2020, pp.24–28.
[15] P. M. Simanullang, S. Sinurat, and I. Saputra, “Analisa metode sha384untuk mendeteksi orisinalitas citra digital,” KOMIK (Konferensi Na-sional Teknologi Informasi dan Komputer), vol. 3, no. 1, 2019.
[16] A. Jose and K. Subramaniam, “Dna based sha512-ecc cryptographyand cm-csa based steganography for data security,” Materials Today:Proceedings, 2020.
[17] S. Long, “A comparative analysis of the application of hashing encryp-tion algorithms for MD5, SHA-1, and SHA-512,” Journal of Physics:Conference Series, vol. 1314, Oct. 2019, p. 012210.
[18] G. Shaheen, “A robust review of sha: Featuring coherent characteris-tics,” International Journal of Computer Science and Mobile Computing,vol. 9, 2020, p. 111–116.
[19] FreeType Project. Freetype. [Online]. Available: https://www.freetype.org/freetype2/ [retrieved: November, 2020]
[20] Apache Software Foundation. C xml parser. [Online]. Available:https://xerces.apache.org/xerces-c/ [retrieved: October, 2020]
[21] PMEase. Quickbuild. [Online]. Available: https://www.pmease.com/[retrieved: October, 2020]

149
International Journal on Advances in Software, vol 13 no 3 & 4, year 2020, http://www.iariajournals.org/software/
2020, © Copyright by authors, Published under agreement with IARIA - www.iaria.org
On the Realization ofMeta-Circular Code Generation and
Two-Sided Collaborative MetaprogrammingHerwig Mannaert
Normalized Systems InstituteUniversity of Antwerp
Antwerp, [email protected]
Koen De CockResearch & Development
NSX bvNiel, Belgium
Peter UhnakResearch & Development
NSX bvNiel, Belgium
Jan VerelstNormalized Systems Institute
University of AntwerpAntwerp, Belgium
Abstract—The automated generation of source code is a widelyadopted technique to improve the productivity of computerprogramming. Normalized Systems Theory (NST) aims to createsoftware systems exhibiting a proven degree of evolvability. Asoftware implementation exists to create skeletons of NormalizedSystems (NS) applications, based on automatic code generation.This paper describes how the NS model representation, and thecorresponding code generation, has been made meta-circular, andpresents its detailed architecture. It is argued that this featuremay be crucial to improve the productivity of metaprogramming,as it enables scalable collaboration based on two-sided interfaces.Some preliminary results from applying this approach in practiceare presented and discussed.
Index Terms—Evolvability, meta-circularity, normalized systems,automatic programming; case study
I. INTRODUCTION
This paper extends a previous paper that was originally pre-sented at the Fourteenth International Conference on SoftwareEngineering Advances (ICSEA) 2019 [1].
Increasing the productivity in computer programming hasbeen an important and long-term goal of computer science.Though many different approaches have been proposed, dis-cussed, and debated, two of the most fundamental approachestoward this goal are arguably automated code generationand homoiconic programming. Increasing the evolvability ofInformation Systems (IS) on the other hand, is crucial for theproductivity during the maintenance of information systems.Although it is even considered as an important attributedetermining the survival chances of organizations, it has notyet received much attention within the IS research area [2].Normalized Systems Theory (NST) was proposed to providean ex-ante proven approach to build evolvable software byleveraging concepts from systems theory and statistical ther-modynamics. In this paper, we present an integrated approachthat combines both Normalized Systems Theory to provide
improved evolvability, and automated code generation andhomoiconic programming to offer increased productivity. Wealso argue that this combined approach can enable entirelynew levels of productivity and scalable collaboration.
The remainder of this paper is structured as follows. InSection II, we briefly discuss two fundamental approaches toincrease the productivity in computer programming: automaticand homoiconic programming. In Section III, we give anoverview of NST as a theoretical basis to obtain higherlevels of evolvability in information systems, and discuss theNST code generation or expansion. Section IV presents therealization of the meta-circular metaprogramming architecture,and details the declarative control structure. Section V elab-orates on the possibilities that the two-sided interfaces of themetaprogramming architecture offer for scalable collaboration.Finally, we report and discuss some results in Section VI, andpresent our conclusions in Section VII.
II. AUTOMATIC AND HOMOICONIC PROGRAMMING
A. Automatic or Metaprogramming
The automatic generation of code is nearly as old ascoding or software programming itself. One often makes adistinction between code generation, the mechanism wherea compiler generates executable code from a traditional high-level programming language, and automatic programming, theact of automatically generating source code from a modelor template. In fact, one could argue that both mechanismsare quite similar, as David Parnas already concluded in 1985that ”automatic programming has always been a euphemismfor programming in a higher-level language than was thenavailable to the programmer” [3]. In general, automatic pro-gramming performs a transformation from domain and/orintermediate models to programming code.

150
International Journal on Advances in Software, vol 13 no 3 & 4, year 2020, http://www.iariajournals.org/software/
2020, © Copyright by authors, Published under agreement with IARIA - www.iaria.org
Another term used to designate automatic programmingis generative programming, aiming to write programs ”tomanufacture software components in an automated way” [4],in the same way as automation in the industrial revolutionhas improved the production of traditional artifacts. As thisbasically corresponds to an activity at the meta-level, i.e.,writing software programs that write software programs, thisis also referred to as metaprogramming. Essentially, the goalof automatic programming is and has always been to improveprogrammer productivity.
Software development methodologies such as Model-DrivenEngineering (MDE) and Model-Driven Architecture (MDA),focusing on creating and exploiting conceptual domain modelsand ontologies, are also closely related to automatic program-ming. In order to come to full fruition, these methodologiesrequire the availability of tools for the automatic generationof source code. Currently, these model-driven code generationtools are often referred to as Low-Code Development Plat-forms (LCDP), i.e., software that provides an environment forprogrammers to create application software through graphicaluser interfaces and configuration instead of traditional com-puter programming. As before, the goal remains to increasethe productivity of computer programming.
The field is still evolving while facing various challengesand criticisms. Some question whether low-code developmentplatforms are suitable for large-scale and mission-critical en-terprise applications [5], while others even question whetherthese platforms actually make development cheaper or eas-ier [6]. Moreover, defining an intermediate representation orreusing Domain Specific Languages (DSLs) is still a subjectof research today. We mention the contributions of Wortmann[7], presenting a novel conceptual approach for the systematicreuse of Domain Specific Languages, Gusarov et al. [8],proposing an intermediate representation to be used for codegeneration, and Frank [9], pleading for multi-level modeling.Hutchinson et al. elaborate on the importance of organizationalfactors for code generation adoption [10], and suggest that thebenefit of model-driven development has to be found in a moreholistic approach to software architecture [11]. We have arguedin our previous work that some fundamental issues need tobe addressed, like the increasing complexity due to changesduring maintenance, and have proposed to combine automaticprogramming with the evolvability approach of NormalizedSystems Theory (NST) [12].
B. Homoiconicity or Meta-Circularity
Another technique in computer science aimed at the in-crease of the abstraction level of computer programming,thereby aiming to improve the productivity, is homoiconicity.A language is homoiconic if a program written in it canbe manipulated as data using the language, and thus theprogram’s internal representation can be inferred just byreading the program itself. As the primary representationof programs is also a data structure in a primitive type ofthe language itself, reflection in the language depends ona single, homogeneous structure instead of several different
structures. It is this language feature that can make it mucheasier to understand how to manipulate the code, which is anessential part of metaprogramming. The best known exampleof an homoiconic programming language is Lisp, but all VonNeumann architecture systems can implicitly be described ashomoiconic. An early and influential paper describing thedesign of the homoiconic language TRAC [13], traces thefundamental concepts back to an even earlier paper fromMcIlroy [14].
Related to homoiconicity is the concept of a meta-circularevaluator (MCE) or meta-circular interpreter (MCI), a termthat was first coined by Reynolds [15]. Such a meta-circularinterpreter, most prominent in the context of Lisp as well, isan interpreter which defines each feature of the interpretedlanguage using a similar facility of the interpreter’s hostlanguage. The term meta-circular clearly expresses that thereis a connection or feedback loop between the activity at themeta-level, the internal model of the language, and the actualactivity, writing models in the language.
There is a widespread belief that this kind of propertiesincrease the abstraction level and therefore the productivity ofprogramming. We will argue that this is even more relevant forautomatic programming, as the metaprogramming code, i.e.,the programming code generating the code, is often complexand therefore hard to maintain. Moreover, the potential ofmeta-circularity with respect to productivity can be seen inthe context of other technologies. For instance, a transistor isa switch that can be switched by another transistor. Therefore,when a smaller and faster transistor/switch is developed, thereis no need to develop a new version of the switching device, assuch a new version of this device, i.e., the transistor itself, isalready there, and smaller and faster as well. Such a shortcutof the design cycle can clearly foster rapid progress.
III. NORMALIZED SYSTEMS THEORY AND EXPANSION
In this section, we discuss the code generation or expansionbased on Normalized Systems Theory, attempting to addresssome fundamental issues that automatic programming is facingtoday: the lack of evolvability in information systems, and theincreasing complexity due to changes.
A. Evolvability and Normalized Systems
The evolvability of information systems (IS) is consideredas an important attribute determining the survival chances oforganizations, although it has not yet received much attentionwithin the IS research area [2]. Normalized Systems Theory(NST), applying the concept of stability from systems theoryto the design cycle of information systems, was proposedto provide an ex-ante proven approach to build evolvablesoftware [12], [16], [17]. Systems theoretic stability is anessential property of systems, and means that a boundedinput should result in a bounded output. In the context ofinformation systems development and evolution, this impliesthat a bounded set of changes should result in a bounded setof impacts to the software. Put differently, it is demandedthat the impact of changes to an information system should

151
International Journal on Advances in Software, vol 13 no 3 & 4, year 2020, http://www.iariajournals.org/software/
2020, © Copyright by authors, Published under agreement with IARIA - www.iaria.org
not be dependent on the size of the system to which theyare applied, but only on the size of the changes to beperformed. Changes rippling through and causing an impactdependent on the size of the system are called combinatorialeffects, and are considered to be a major factor limiting theevolvability of information systems. The theory prescribes aset of theorems, and formally proves that any violation of anyof the following theorems will result in combinatorial effects,thereby hampering evolvability [12], [16], [17]:
• Separation of Concerns:Every concern, defined as an independent change driver,should be separated in its own class or module.
• Action Version Transparency:Every computing action should be encapsulated to shieldother modules from internal implementation changes.
• Data Version Transparency:Every data structure should be encapsulated to shieldmodules passing this data from internal data changes.
• Separation of States:Every result state from a computing action should bestored, to shield other modules from having to deal withnew types of implementation errors.
The application of the theorems in practice has shown toresult in very fine-grained modular structures within a softwareapplication. In particular, the so-called cross-cutting concerns,i.e., concerns cutting across the functional structure, need to beseparated as well. This is schematically represented for threedomain entities (’Order’, ’Invoice’, and ’Payment’), and threecross-cutting concerns (’Persistency’, ’Access Control’, and’Remote Access’) in Figure 1. Though the actual implemen-tation of the cross-cutting concern is in general provided byan external framework (represented by the colored planes), thecode connecting to that framework (represented by the smallcolored disks), is considered to be a change driver, and needsto be separated and properly encapsulated.
Fig. 1. Representation of domain entities connecting to external frameworks.
As every domain entity needs to connect to various addi-tional external frameworks providing cross-cutting concerns,e.g., ’Transaction’ or ’REST Service’, these entities need tobe implemented by a set of classes. Such a set of classes,schematically represented in Figure 2 for the domain entity’Invoice’, is called an Element in NST.
Fig. 2. Representation of an element for the domain entity ’Invoice’.
Such structures are, in general, difficult to achieve throughmanual programming. Therefore, the theory also proposes a setof patterns to generate significant parts of software systemswhich comply with these theorems. More specifically, NSTdefines five types of elements to provide the main functionalityfor information systems, and proposes five detailed designpatterns to implement these element structures [17] [12]:
• Data element to represent a data or domain entity.• Action element to implement a computing action or task.• Workflow element to orchestrate a flow or state machine.• Connector element to provide a user or service interface.• Trigger element to perform a task or flow periodically.
The implementation or instantiation of the element structuresresults in a codebase with a highly recurring structure. Such arecurring structure is desirable as it increases the consistency,and reduces the complexity of the codebase. However, thisrecurring structure will have to be adapted over time basedon new insights, the discovery of flaws, and/or changesin underlying technologies or frameworks. These structuralchanges may need to be applied in a retroactive way, butthe efforts increase with the frequency of these adaptations.For instance, if one decides to adapt or refactor the elementstructures in a growing system in a retroactive way every timeK additional elements have been created, the total amountof refactored element structures when the system reaches Ndifferent elements, will be equal to:
K + 2K + ...+N =
N/K∑i=1
i.K =N(N +K)
2K(1)
Therefore, the element structures of NST software are gen-erated and regenerated in a —rather straightforward— auto-mated way. First, a model of the considered universe of dis-cussion is defined in terms of a set of data, task and workflowelements. Next, code generation or automated programming isused to generate parametrized copies of the general elementdesign patterns into boiler plate source code. Due to the simpleand deterministic nature of this code generation mechanism,i.e., instantiating parametrized copies, it is referred to as NSexpansion and the generators creating the individual codingartifacts are called NS expanders. This generated code can,

152
International Journal on Advances in Software, vol 13 no 3 & 4, year 2020, http://www.iariajournals.org/software/
2020, © Copyright by authors, Published under agreement with IARIA - www.iaria.org
in general, be complemented with custom code or craftingsto add non-standard functionality that is not provided bythe expanders themselves, at specific places within the boilerplate code marked by anchors. This custom code can beautomatically harvested from within the anchors, and re-injected when the recurring element structures are regenerated.
B. Expansion and Variability Dimensions
In applications generated by a Normalized Systems (NS)expansion process, schematically represented in Figure 3around the symbolic blue icon, we identify four variabilitydimensions. As discussed in [18] [19], the combination ofthese dimensions compose an actual NS application codebase,represented in the lower right of Figure 3, and thereforedetermine how such an application can evolve through time,i.e., how software created in this way exhibits evolvability.
First, as represented at the upper left of the figure, oneshould specify or select the models or mirrors he or she wantsto expand. Such a model is technology agnostic (i.e., definedwithout any reference to a particular technology that should beused) and represented by standard modeling techniques, suchas ERD’s for data elements and BPMN’s for task and flowelements. Such a model can have multiple versions throughouttime (e.g., being updated or complemented) or concurrently(e.g., choosing between a more extensive or summarizedversion). As a consequence, the chosen model represents afirst dimension of variability or evolvability.
Second, as represented on top of the blue icon in the figure,one should provide the parametrized coding templates forthe various classes of the elements according to a specificelement structure as represented in Figure 2. The expanderswill generate (boiler plate) source code by instantiating thevarious class templates or skeletons of the element structures,i.e., the design patterns, taking the specifications of the modelas parameters. For instance, for a data element ’Invoice’, aset of java classes InvoiceDetails, InvoiceProxy, InvoiceData,InvoiceAccess, etcetera will be generated. This code can beconsidered boiler plate code as it provides a set of standardfunctionalities for each of the elements within the model,though they have evolved over time to provide features likestandard finders, master-detail (waterfall) screens, certain dis-play options, document upload/download functionality, childrelations, etcetera. The expanders and corresponding templateskeletons evolve over time as improvements are made and bugsare fixed, and as additional features (e.g., creation of a statusgraph) are provided. Given the fact that the application modelis completely technology agnostic, and that it can be used forany version of the expanders, these bug fixes and additionalfeatures become available for all versions of all applicationmodels: only a re-expansion or “rejuvenation” is required. Asa consequence, the expanders or template skeletons representa second dimension of variability or evolvability.
Third, as represented in the upper right of the figure, oneshould specify infrastructural options to select a number offrameworks or utilities to take care of several generic or so-called cross-cutting concerns. These options consist of global
options (e.g., determining the build automation framework),presentation settings (determining the graphical user interfaceframeworks), business logic settings (determining the databaseand transaction framework to be used) and technical infrastruc-ture (e.g., selecting versions for access control or persistencyframeworks). This means that, given a chosen applicationmodel version and expander version, different variants ofboiler plate code can be generated, depending on the choicesregarding the infrastructural options. As a consequence, thesettings and utility frameworks represent a third dimension ofvariability or evolvability.
Fourth, as represented in the lower left of the figure, “customcode” or craftings can be added to the generated source code.These craftings enrich, i.e., are put upon, the earlier generatedboiler plate code. They can be harvested into a separaterepository before regenerating the software application, afterwhich they can re-injected. The craftings include extensions,i.e., additional classes added to the generated code base,as well as insertions, i.e., additional lines of code addedbetween the foreseen anchors within the code. Craftings canhave multiple versions throughout time (e.g., being updatedor complemented), or concurrently (e.g., choosing between amore advanced or simplified version). These craftings shouldcontain as little technology specific statements within theirsource code as possible (apart from the chosen backgroundtechnology, i.e., the programming language). Indeed, craftingsreferring to (for instance) a specific UI framework will onlybe reusable as long as this particular UI framework is selectedfor the generation of the application. In contrast, craftingsperforming certain validations, but not containing any specificreferences to the transaction framework, e.g., Enterprise JavaBeans (EJB), can simply be reused when applying otherversions or choices regarding such a framework. As a con-sequence, the custom code or craftings represent a fourthdimension of variability or evolvability.
In summary, each part in Figure 3 is a variability dimensionin an NST software development context. It is clear that talkingabout the “version” of an NST application, as is traditionallydone for software systems, becomes more refined in such acontext. Indeed, the eventual software application codebase(the lower right side of the figure) is the result of a specific ver-sion of an application model, expander version, infrastructuraloptions, and a set of craftings [19]. Put differently, with M , E,I and C referring to the number of available application modelversions, the number of expander versions, the number ofinfrastructural option combinations, and the number of craftingsets respectively, the total set of possible versions V of aparticular NST application becomes equal to:
V = M × E × I × C (2)
Whereas the specific values of M and C are different forevery single application, the values of E and I are dependenton the current state of the expanders. Remark that the numberof infrastructural option combinations (I) is equally a product:
I = G× P ×B × T (3)

153
International Journal on Advances in Software, vol 13 no 3 & 4, year 2020, http://www.iariajournals.org/software/
2020, © Copyright by authors, Published under agreement with IARIA - www.iaria.org
Fig. 3. A graphical representation of four variability dimensions within a Normalized Systems application codebase.
In this case, G represents the number of available global optionsettings, P the number of available presentation settings, B thenumber of available business logic settings, and T the numberof available technical infrastructure settings. This general ideain terms of combinatorics corresponds to the overall goal ofNST: enabling evolvability and variability by leveraging thelaw of exponential variation gains by means of the thoroughdecoupling of the various concerns, and the facilitation of theirrecombination potential [12].
IV. META-CIRCULAR EXPANSION SOFTWARE
In this section, we present the meta-circular architecture ofthe NST expansion software, i.e., the automatic programmingcode that is also able to regenerate itself as well. Both thesequential phases toward achieving this meta-circular code(re)generation architecture, and the declarative control struc-ture of the expansion software, are described.
A. Toward Meta-Circular Expansion
1) Phase 1: Standard Code Generation: The original ar-chitecture of the Normalized Systems expansion or codegeneration software is schematically represented in Figure 4.On the right side of the figure, the generated source codeis represented in blue, corresponding to a traditional multi-tier web application. Based on a Java Enterprise Edition(JEE) stack [17] [19], the generated source code classes aredivided over so-called layers, such as the logic, the control,and the view layer. On the left side, we distinguish theinternal structure of the expanders or the code generators,represented in red. This corresponds to a very straightforwardimplementation of code generators, consisting of:
• model files containing the model parameters.• reader classes to read the model files.• model classes to represent the model parameters.
• control classes selecting and invoking the different ex-pander classes based on the parameters.
• expander classes instantiating the source templates, usingthe String Template (ST) library, and feeding the modelparameters to the source templates.
• source templates containing the parametrized code.
Fig. 4. Representation of a basic code generator structure.
2) Phase 2: Generating a Meta-Application: Essentially,code generation models or meta-models — and even all col-lections of configuration parameters — consist of various dataentities with attributes and relationships. As the NormalizedSystems element definitions are quite straightforward [17][19], the same is valid for its meta-models. Moreover, oneof the Normalized Systems elements, i.e., the data element,is basically a data entity with attributes. This means that theNS meta-models, being data entities with attributes, can beexpressed as regular models. For instance, in the same way’Invoice’ and ’Order’ can be specified as NS data elementswith attributes and relationships in an information system

154
International Journal on Advances in Software, vol 13 no 3 & 4, year 2020, http://www.iariajournals.org/software/
2020, © Copyright by authors, Published under agreement with IARIA - www.iaria.org
model, the NS ’data element’ and ’task element’ of the NSmeta-model can be defined as NS data elements with attributesand relationships, just like any other NS model.
Fig. 5. Expansion of a meta-application to define meta-models.
As the NS models can be considered a higher-level languageaccording to Parnas [3], the single structure of its model dataand meta-model language means that the NS model languageis in fact homoiconic in the sense of [14]. This also enables usto expand or generate a meta-application, represented on theleft side of Figure 5 in dark red. This NS meta-application,called the Prime Radiant, is a multi-tier web application,providing the functionality to enter, view, modify, and retrievethe various NS models. As the underlying meta-model isjust another NS model, the Prime Radiant also provides thepossibility to view and manipulate its own internal model.Therefore, by analogy with the meta-circular evaluator ofReynolds [15], the Prime Radiant can be considered to bea meta-circular application.
For obvious reasons, the generated reader and model classes(part of the Prime Radiant on the left side of Figure 5)slightly differ from the reader and model classes that wereoriginally created during the conception of the expansion orcode generation software (on the right side of Figure 5). Thismeans that in order to trigger and control the actual expansionclasses to generate the source code, an integration softwaremodule needed to be developed, represented in the middleof Figure 5 as nsx-prime. Though the Prime Radiant meta-application is auto-generated, and can therefore be regeneratedor rejuvenated as any NS application, this nsx-prime integra-tion module needed to be maintained manually.
3) Phase 3: Closing the Expander Meta-Circle: Thoughthe original reader and model classes of the expander softwarediffered from the generated reader and writer classes, there isno reason that they should remain separate. It was thereforedecided to perform a rewrite of the control and expanderclasses of the expander software (on the right side of Figure 5),to allow for an easier integration with the auto-generatedreader and model classes (on the left side of Figure 5).Enabling such a near-seamless integration would not only
eliminate the need for the reader and model classes of theexpander software, it would also reduce the complexity of thensx-prime integration component to a significant extent.
Fig. 6. Closing the meta-circle for expanders and meta-application.
Originally, the refactoring was only aimed at the eliminationof the reader and control classes of the expander software.During the refactoring however, it became clear that the controland expander classes of the expander software implemen-tation could be eliminated as well. Indeed, by adopting adeclarative structure to define the expander templates andto specify the relevant model parameters, both the controlclasses (selecting and invoking the expander classes) and theexpander classes (instantiating and feeding the parameters tothe source templates) were no longer necessary. Moreover,as schematically represented in Figure 6, the refactoring alsoeliminated the need for the nsx-prime integration module. Asextensions to the meta-model no longer require additionalcoding in the various expander software classes (e.g., reader,model, control, and expander classes), nor to the nsx-primeintegration module, one can say that the expander developmentmeta-circle has been closed. This is symbolically visualizedin Figure 6. Indeed, expander templates can be introduced bysimply defining them, and extensions to the NS meta-modelbecome automatically available after re-running the expansionor code generation on this meta-model.
B. Declarative Expansion Control
The expansion process of an NS element is schematicallyrepresented in Figure 7. The internal structure of an NSelement (data, task, flow, connector, and trigger element) isbased on a detailed design pattern [16] [17] [12], implementedthrough a set of source code templates. We call this set ofcoding templates the Element Template, represented in dashedlines on the left side of Figure 7. During the actual expansionor code generation, for every instance of an NS element, e.g.,a data element ’Invoice’, the set of source code templatesis instantiated, steered by the parameters of the model. Thisresults in the actual element, e.g., Invoice Element, which isrepresented in solid lines and corresponds to Figure 2.

155
International Journal on Advances in Software, vol 13 no 3 & 4, year 2020, http://www.iariajournals.org/software/
2020, © Copyright by authors, Published under agreement with IARIA - www.iaria.org
Fig. 7. Expansion of an Invoice element, zooming in on a single artifact.
1) Declarative Representation of Expanders: On the rightside of Figure 7, we zoom in on the expansion of an individualsource code template into a source code artifact, e.g., a class,applying and inserting the parameters of the model. We referto this unit of code generation as an individual expander, andmention that the NS code generation environment for web-based information systems currently consists of 182 individualexpanders. Every individual expander is declared in an XMLdocument. An example of such an expander declaration,defining various properties, is shown below.<expander name="DataExpander"xmlns="http://normalizedsystems.org/expander"><packageName>expander.jpa.dataElement</packageName><layerType name="DATA_LAYER"/><technology name="JPA"/><sourceType name="SRC"/><elementTypeName>DataElement</elementTypeName><artifact>$dataElement.name$Data.java</artifact><artifactPath>$componentRoot$/$artifactSubFolders$/$dataElement.packageName</artifactPath>
<isApplicable>true</isApplicable><active value="true"/><anchors/>
</expander>
In this declaration, we find the following information.• The identification of the expander, name and package
name, which also identifies in an unambiguous way thesource code template.
• Some technical information, including the tier or layerof the target artifact in the application, the technology itdepends on, and the source type.
• The name and the complete path in the source tree ofthe artifact that will be generated, and the type of NSelement that it belongs to.
• Some control information, stating the model-based con-dition to decide whether the expander gets invoked.
• Some information on the anchors delineating sections ofcustom code that can be harvested and re-injected.
2) Declarative Mapping of Parameters: The instantiationof an individual source code template for an individual in-stance of an NS element, is schematically represented on theright side of Figure 7. It can be considered as a transformationthat combines the parameters of the model with the sourcecode template, and results in a source code artifact. Wetherefore distinguish three types of documents or artifacts.
• The model parameters, represented at the top of Figure 7,consist of the attributes of the element specification, e.g.,the data element ’Invoice’ with its fields or attributes, andthe options and technology settings. All these parametersare available through the auto-generated model classes,e.g., InvoiceDetails, and may either originate from thePrime Radiant database, or from XML files.
• An individual source code template, having a uniquename that corresponds to the one of the expander def-inition as presented above. Such a template, representedin the middle of Figure 7, contains various insertions ofparameter values, and parameter-based conditions on thevalue and/or presence of specific parts of the source code.
• An instantiated source file or artifact, represented at thebottom of Figure 7, where the various values and condi-tions in the source code template have been resolved.
An important design feature is related to the mapping ofthe parameters from the model to the parameters that appearin the source code templates, that are directly guiding thecode instantiation. In order to provide loose coupling betweenthese two levels of parameters, and to ensure a simple andstraightforward relationship, it was decided to implement thismapping in a declarative ExpanderMapping XML file. Asthe entire NS model is made available as a graph of modelclasses, the parameters in the templates can be evaluatedfrom the NS model using Object-Graph Navigation Language(OGNL) expressions. These expressions, e.g., Invoice.number,are declared in the XML mapping file of the expander.

156
International Journal on Advances in Software, vol 13 no 3 & 4, year 2020, http://www.iariajournals.org/software/
2020, © Copyright by authors, Published under agreement with IARIA - www.iaria.org
V. TWO-SIDED SCALABLE COLLABORATION
In this section, we explain how the meta-circular architec-ture of the metaprogramming software enables an open andscalable collaboration based on its two-sided interfaces.
A. The Need for Meta-Level Interfaces
The main purpose of an Application Programming Interface(API) is to enable widespread and scalable collaboration insoftware development. It allows for a structured collaborationbetween developers implementing the interface on one side,and developers using or invoking the programming interfaceon the other side. The collaboration is possible both withincompanies and across companies, and in open source commu-nities. The use of such an API has contributed significantly tothe rich application offering that we have, including desktopapplications and mobile apps, and to the abundant hardwaresupport that we enjoy, providing drivers for a multitude ofperipheral devices on a variety of operating systems.
In order to enable scalable collaboration in metaprogram-ming, we should define meta-level programming interfaces.However, defining meta-level interfaces is still a subject ofresearch today. We have mentioned for instance researchpapers of Wortmann [7], presenting a novel approach for thesystematic reuse of Domain Specific Languages (DSLs), andGusarov et al. [8], proposing an intermediate representationto be used for code generation. We believe that the complexarchitectures of metaprogramming environments, exhibitinghigh degrees of coupling as represented on the left side ofFigure 8 (which is similar to the representation in Figure 4),make it nearly impossible to define clear meta-level interfaces.
Fig. 8. Representation of various metaprogramming silos.
What all implementations of automatic programming ormetaprogramming have in common, is that they perform atransformation from domain models and/or intermediate mod-els to code generators and programming code. This impliesthat (programming) interfaces need to be defined at both endsof the transformation, allowing at the same time to define
or extend domain models, and to implement or replace codegenerators or templates. We argue that the presented meta-circular architecture enables the definition of the interfaces atboth ends of the transformation, as it allows to integrate —orat least accommodate— ever more extensions and alternativesat the two sides of the interface, without entailing the non-scalable burden of adapting the metaprogramming code.
B. Separating Model and Code Interfaces
Similar to the representation in Figure 4, the left hand sideof Figure 8 represents a basic code generator or metaprogram-ming architecture. However, if we consider another metapro-gramming environment (for instance on the right side ofFigure 8), we will almost certainly encounter a duplicationof such an architecture. This will in general result in whatwe could describe as metaprogramming silos, entailing severalsignificant drawbacks. First, it is hard to collaborate betweenthe different metaprogramming silos, as both the nature ofthe models and the code generators will be different. Second,contributing to the metaprogramming environment will requireprogrammers to learn the internal structure of the model andcontrol classes in the metaprogramming code. As metaprogam-ming code is intrinsically abstract, this is in general not a trivialtask. And third, as contributions of individual programmerswill be spread out across the models, readers, control classes,and actual coding templates, it will be a challenge to maintaina consistent decoupling between these different concerns.
The meta-circular environment presented in Section IV-Aand Section IV-B addresses these drawbacks. The architectureestablishes a clear decoupling between the models and thecode generation templates, and removes the need for con-tributors to get acquainted with the internal structure of themetaprogramming environment. It could allow developers tocollaborate in a scalable way at both sides of the metapro-gramming interfaces. And, as schematically represented inFigure 9, the clear decoupling of this horizontal integrationarchitecture could bring the same kind of variability gains asdescribed in Equations (2) and (3). Indeed, in such a decoupledenvironment, it should be possible to combine every versionor variant of the model with every version or variant of thecoding templates to generate a codebase. This implies:
N models +M templates =⇒ N ×M codebases (4)
The use of a metaprogramming environment with a cleardecoupling between models and code (templates) could alsoentail significant productivity gains for regular software de-velopment projects. Consider for instance Figure 10, rep-resenting in a schematic way several collaborative projects,e.g., open source projects, for Enterprise Resource Planning(ERP) software. These application software projects consist ofmodels, configuration data, and source code, and are in generalorganized as silos as well. Thus making it very difficult to col-laborate between different projects. Using a metaprogrammingenvironment that decouples models and coding templates inthe way we have presented, could open up new possibilities.

157
International Journal on Advances in Software, vol 13 no 3 & 4, year 2020, http://www.iariajournals.org/software/
2020, © Copyright by authors, Published under agreement with IARIA - www.iaria.org
Fig. 9. A graphical representation of four variability dimensions within a Normalized Systems application codebase.
Fig. 10. Representation of various ERP software silos.
Modelers and designers would be able to collaborate on do-main models, gradually improving existing model versions andvariants, and adding on a regular basis new functional busi-ness modules, without having to bother about technicalities.(Meta)programmers would collaborate on coding templates,gradually improving and integrating new insights and codingtechniques, adding and improving implementations of cross-cutting concerns, and providing support for modified and/ornew technologies and frameworks. Application software sys-tems would be generated to a large extent for a selectedset of versions of domain models, using a specified set ofcoding templates, being targeted at a specific set of technologyplatforms. This would realize the above mentioned variationgains as described in Equations (2), (3), and (4).
C. Enabling Alternative Meta-Models
The current meta-model of our metaprogramming environ-ment, consists of data, action, workflow, trigger, and connector
elements, and is to a large extent specific for (web-based) in-formation systems. It is not only conceivable to modify and/orextend this meta-model, but one could also imagine to definecompletely different meta-models for other purposes. Suchmeta-models could for instance be created to model traditionalcomputing functions based on sequencing-selection-iteration,or to represent microservices or scripting units running partsof data mining algorithms in the cloud.
The meta-circular architecture presented in Figure 6 sup-ports not only the definition of other models, but enables thedefinition of other meta-models as well. Indeed, the reader,model, control, and view classes could be generated forsuch an alternative meta-model, allowing the specification ofmodels based on this new meta-model, both in XML or ina newly generated meta-application. These model parameterscould then be propagated to new sets of coding templates.This could allow the presented meta-circular architecture togenerate all types of source code or configuration data for allkinds of applications and languages.
VI. SOME RESULTS AND DISCUSSION
In this section, we present and discuss some empirical re-sults regarding the use of the meta-circular expansion software.It is based on qualitative research that has been performedwithin the company, i.e., NSX bv, that develops the expansionsoftware, and relies on nonnumerical data obtained from first-hand observation and interviews.
A. Refactoring of Existing Expanders
The Normalized Systems expander software has been indevelopment since late 2011. Over the years, it was usedby several organizations to generate, and re-generate on aregular basis, tens of information systems [18] [19]. Duringthese years, and often on request of these organizations, manyadditional features and options were built into the source codetemplates. The overall refactoring was triggered by a concern

158
International Journal on Advances in Software, vol 13 no 3 & 4, year 2020, http://www.iariajournals.org/software/
2020, © Copyright by authors, Published under agreement with IARIA - www.iaria.org
over the growing size — and therefore complexity — of themodel and control classes. It was also motivated by a desire toleverage the implicit homoiconicity of the NS (meta-)modelto increase the productivity of improving and extending theexpander software.
The complete refactoring was started in the last quarterof 2018, and performed in six months by two developers.Afterwards, the 182 expanders, each expanding or generatinga specific source code artifact, were cleanly separated, andthe software developers considered the expander codebase tobe much better maintainable. Moreover, the learning curvefor developers to take part in expander development waspreviously considered to be very steep, mainly due to thesize and complexity of the model and control classes. Afterthe refactoring, nearly all of the approximately 20 applicationdevelopers of the company, have stated that the learning curveis considerably less steep, and that they feel comfortable to addfeatures and options to the expander software themselves. Oneyear later, most of them have indeed made such a contribution.The lead time of performing fixes and modifications to theexpander coding templates, and to deliver it to the applicationproject teams, has decreased from weeks to days.
B. Creating Additional Expander Bundles
Besides contributing to the original set of 182 expanders,application developers —even junior developers— are ableto create additional expander bundles implementing a set ofexpanders for a specific functionality. Immediately after therefactoring, a junior developer has created in two monthssuch a bundle of 20 expanders, targeted mainly at the imple-mentation of REST services using Swagger. One year later,this bundle has been used successfully in numerous projects,and has grown significantly. Other —often junior— develop-ers have created in the meantime various expander bundlesproviding valuable functionality. These include a bundle togenerate mobile apps connecting to the expanded web-basedinformation systems, a bundle to define more advanced searchqueries and reporting, and a bundle supporting various typesof authentication. Recently, a newly hired graduate developeda small bundle of expanders to implement row-level security,only a couple of weeks after joining the company.
Currently, two different customers are developing expanderbundles as well. As our goal is to establish a scalablecollaboration in metaprogramming across a wide range oforganizations and developers, we are setting up an exchangemarketplace for expander bundles at exchange.stars-end.net.
C. Supporting Alternative Meta-Models
We have explained that the meta-circular metaprogram-ming architecture also provides the possibility to create andadopt other meta-models. Currently, a first implementation isavailable allowing to define other meta-models and providingcoding templates, while all the code in between (readers,model, and control classes) of this new metaprogrammingenvironment is automatically generated. A collaboration has
been established with another group working on a metapro-gramming environment, to perform a horizontal integrationbetween the two metaprogramming environments. The firstpromising results of this integration have been reported [20].
One could argue that there is an implicit meta-meta-modelunderlying the various possible meta-models, and that thismeta-meta-model could create a silo-effect hampering theintegration of various metaprogramming efforts. However, theimplicit meta-meta-model is based on the data elements of theNS meta-model, containing only data fields or attributes, andlink fields or relationships. This is very similar, if not identical,to both the data entities of Entity Relationship Diagrams(ERD) with their data attributes and relationship links, andthe entities or classes of the Web Ontology Language (OWL)with their datatype properties and object properties. Havingfor instance demonstrated the bi-directional transformationbetween our models and domain ontologies [21], we areconfident that the dependency on the underlying meta-meta-model will not impede scalable collaborations.
VII. CONCLUSION
The increase of productivity and the improvement of evolv-ability are goals that have been pursued for a long time incomputer programming. While more research has traditionallybeen performed on techniques to enhance productivity, ourresearch on Normalized Systems Theory has been focusing onthe evolvability of information systems. This paper presents astrategy to combine both lines of research.
While the technique of automated programming or sourcecode generation was already part of our previous work onNormalized Systems, we have explored in this paper the incor-poration of homoiconicity and meta-circularity to increase theproductivity of our metaprogramming environment. A methodwas presented to turn the metaprogramming environment intoa meta-circular architecture, using an homoiconic representa-tion of the code generation models, and resulting in a consid-erable simplification of the expanders, i.e., the code generationsoftware. We have argued that such a reduction of complexitycould lead to a significant increase in productivity at the levelof the development of the code generation software, and thatthe two-sided interfaces could enable a scalable collaborationon metaprogramming across organizations and developers. Wehave presented some preliminary results, indicating that theincrease in metaprogramming productivity is indeed beingrealized, and have established a first collaborative integrationeffort with another metaprogramming environment.
This paper is believed to make some contributions. First,we show that it is possible to not only adopt code generationtechniques to improve productivity, but to incorporate meta-circularity as well to improve both productivity and main-tainability at the metaprogramming level. Moreover, this isdemonstrated in a framework primarily targeted at evolvability.Second, we have presented a case-based strategy to makea code generation representation homoiconic, and the cor-responding application architecture meta-circular. Finally, wehave argued that the simplified structure of the code generation

159
International Journal on Advances in Software, vol 13 no 3 & 4, year 2020, http://www.iariajournals.org/software/
2020, © Copyright by authors, Published under agreement with IARIA - www.iaria.org
framework improves the possibilities for collaboration at thelevel of metaprogramming software.
Next to these contributions, it is clear that this paper is alsosubject to a number of limitations. It consists of a single caseof making a code generation or metaprogramming environ-ment meta-circular. Moreover, the presented results are bothqualitative and preliminary, and the achieved collaboration onmetaprogramming software is limited to a small amount oforganizations. However, we are currently working to set upa collaboration of developers on a much wider scale at thelevel of metaprogramming, and to prove that this architecturecan lead to new and much higher levels of productivity andcollaboration in the field of automatic programming.
REFERENCES
[1] H. Mannaert, K. De Cock, and P. Uhnak, “On the realization of meta-circular code generation: The case of the normalized systems expanders,”in Proceedings of the Fourteenth International Conference on SoftwareEngineering Advances (ICSEA), November 2019, pp. 171–176.
[2] R. Agarwal and A. Tiwana, “Editorial—evolvable systems: Through thelooking glass of IS,” Information Systems Research, vol. 26, no. 3, pp.473–479, 2015.
[3] D. Parnas, “Software aspects of strategic defense systems,” Communi-cations of the ACM, vol. 28, no. 12, pp. 1326–1335, 1985.
[4] P. Cointe, “Towards generative programming,” Unconventional Pro-gramming Paradigms. Lecture Notes in Computer Science, vol. 3566,pp. 86–100, 2005.
[5] J. R. Rymer and C. Richardson, “Low-code platforms deliver customer-facing apps fast, but will they scale up?” Forrester Research, Tech. Rep.,08 2015.
[6] B. Reselman, “Why the promise of low-code software platforms isdeceiving,” TechTarget, Tech. Rep., 05 2019.
[7] A. Wortmann, “Towards component-based development of textualdomain-specific languages,” in Proceedings of the Fourteenth Interna-tional Conference on Software Engineering Advances (ICSEA), 2019,pp. 68–73.
[8] K. Gusarovs and O. Nikiforova, “An intermediate model for the codegeneration from the two-hemisphere model,” in Proceedings of theFourteenth International Conference on Software Engineering Advances(ICSEA), 2019, pp. 74–82.
[9] U. Frank, “Specification and management of methods - a case for multi-level modelling,” Business Process and Information Systems Modeling,vol. 352, pp. 311–325, 2019.
[10] J. Hutchinson, M. Rouncefield, and J. Whittle, “Model-driven engineer-ing practices in industry,” in Proceedings of the International Conferenceon Software Engineering 2011, 2011, pp. 633–640.
[11] J. Whittle, J. Hutchinson, and M. Rouncefield, “The state of practice inmodel-driven engineering,” IEEE Software, vol. 31, no. 3, pp. 79–85,2014.
[12] H. Mannaert, J. Verelst, and P. De Bruyn, Normalized Systems Theory:From Foundations for Evolvable Software Toward a General Theory forEvolvable Design. Koppa, 2016.
[13] C. Mooers and L. Deutsch, “Trac, a text-handling language,” in ACM ’65Proceedings of the 1965 20th National Conference, 1965, pp. 229–246.
[14] D. McIlroy, “Macro instruction extensions of compiler languages,”Communications of the ACM, vol. 3, no. 4, pp. 214–220, 1960.
[15] J. Reynolds, “Definitional interpreters for higher-order programminglanguages,” Higher-Order and Symbolic Computation, vol. 11, no. 4,pp. 363–397, 1998.
[16] H. Mannaert, J. Verelst, and K. Ven, “The transformation of require-ments into software primitives: Studying evolvability based on systemstheoretic stability,” Science of Computer Programming, vol. 76, no. 12,pp. 1210–1222, 2011, special Issue on Software Evolution, Adaptabilityand Variability.
[17] ——, “Towards evolvable software architectures based on systemstheoretic stability,” Software: Practice and Experience, vol. 42, no. 1,pp. 89–116, 2012.
[18] P. De Bruyn, H. Mannaert, and P. Huysmans, “On the variabilitydimensions of normalized systems applications: Experiences from aneducational case study,” in Proceedings of the Tenth InternationalConference on Pervasive Patterns and Applications (PATTERNS), 2018,pp. 45–50.
[19] ——, “On the variability dimensions of normalized systems applica-tions: experiences from four case studies,” International Journal onAdvances in Systems and Measurements, vol. 11, no. 3, pp. 306–314,2018.
[20] H. Mannaert, C. McGroarty, K. De Cock, and S. Gallant, “Integratingtwo metaprogramming environments : an explorative case study,” inProceedings of the Fifteenth International Conference on SoftwareEngineering Advances (ICSEA), October 2020, pp. 166–172.
[21] M. Suchanek, H. Mannaert, P. Uhnak, and R. Pergl, “Bi-directionaltransformation between normalized systems elements and domain on-tologies in owl,” in Proceedings of the fifteenth International Conferenceon Evaluation of Novel Approaches to Software Engineering (ENASE),May 2020, pp. 1–12.

The Matching Lego(R)-Like Bricks Problem:
A Metaheuristic Approach
Martin Zinner∗, Rui Song†, Kim Feldhoff∗, André Gellrich†, Wolfgang E. Nagel∗∗ Center for Information Services and High Performance Computing (ZIH)
Technische Universität DresdenDresden, Germany
E-mail: {martin.zinner1, kim.feldhoff, wolfgang.nagel}@tu-dresden.de† Technical Information SystemsTechnische Universität Dresden
Dresden, GermanyE-mail: {[email protected], [email protected]}
Abstract—We formulate and transform a real-world combina-torial problem into a constraint satisfaction problem: choosea restricted set of containers from a warehouse, such that theelements contained in the containers satisfy some restrictions andcompatibility criteria. We set up a formal, mathematical model,describe the combinatorial problem and define a (nonlinear)system of equations, which describes the equivalent constraintsatisfaction problem. Next, we use the framework providedby the Apache Commons Mathematics Library in order toimplement a solution based on genetic algorithms. We carry outperformance tests and show that a general approach, havingbusiness logic solely in the definition of the fitness function,can deliver satisfactory results for a real-world use case in themanufacturing industry. To conclude, we use the possibilitiesoffered by the jMetal framework to extend the use case tomulti-objective optimization and and compare different heuristicalgorithms predefined in jMetal applied to our use case.
Keywords–Constraint satisfaction problem; Combinatorial prob-lem; Genetic algorithm; Crossover; Mutation; Multi-objective opti-mization; Apache Commons Math.; jMetal.
I. INTRODUCTION
We formulate a new real-world combinatorial problem,the motivation for our study [1]. Initially, we describe suc-cinctly the real-world problem as it has been identified at asemiconductor company and present the general strategy tosolve it. In addition to the Single-Objective Optimization [1]using Genetic Algorithms based on the Apache Framework, wepresent a Multi-Objective Optimization strategy using GeneticAlgorithms based on the jMetal Framework and compare theresults. In order to avoid the technical difficulties related tothe industrial application, we present the equivalent problembased on LEGO R© bricks.
A. Motivation
Some time ago we were facing a strategic problem at abig semiconductor company. The company produces IntegratedCircuits (ICs), also termed chips, assembles them to moduleson a circuit board according to guidelines and specifications,and ships the modules as the final product to the customer.The ICs are stored in bins before the last technological process(cleaning) is performed.
The difficulties arise due to technical limitations of thetool that assembles the ICs to modules. The tool can handle
at most five bins at once. This means in particular, that theICs required to fulfill an order from the customer have to bein not more than five bins. Once the bins have been identified,the modules are assembled and shipped to the customer. Ifit is not possible to identify five bins in connection with acustomer order, then either cost-intensive methods (rearrangingthe content of some bins) or time-intensive methods (waitingsome days till the production process delivers new ICs) haveto be applied. Hence, identifying the bins necessary to fulfillan order is crucial for the economic success of the company.
B. Current State and Challenge
There has been a selection algorithm in place, basedprimarily on heuristics and inside knowledge regarding thepatterns of the specifications of the modules. Although theexisting selection algorithm delivered satisfactory results inmost of the cases, it runs for days in some cases and is notflexible enough, in particular, it cannot handle slight deviationsfrom the existing specification patterns.
To circumvent the above inconvenient, the main aim ofour study is to determine alternative selection methods, whichalways deliver satisfactory results within an acceptable timeframe, and which are easy adaptable to meet future require-ments. Our main objective is to identify and formalize theindustrial problem as a mathematical model and to transformthe occurring Combinatorial Problem (CP) into a ConstrainedSatisfaction Problem (CSP). The exact method using MAT-LAB did not deliver results within a satisfactory time frame.A suitable heuristic method – including Simulated Annealing(SA), Ant Colony Optimization (ACO), Genetic Algorithms(GA), etc. – to solve the CSP within the requirements had tobe identified and appropriate algorithms had to be developed,which satisfy both the accuracy and performance demands.
If the general task is to find optimal solution to a set ofconstraints, we speak about Constrained Optimization Problem(COP). The primarily purpose of the industrial problem is tofind a satisfactory solution, since from the technical perspectiveundercutting the requirements of the specifications does notlead to better quality. However, a straightforward extensionsof the CSP towards COP is mentioned later.
160
International Journal on Advances in Software, vol 13 no 3 & 4, year 2020, http://www.iariajournals.org/software/
2020, © Copyright by authors, Published under agreement with IARIA - www.iaria.org

C. Problem Description
The following example is artificial, it does not occur in reallife in this manner, although it is very close to it. It is used tobest describe the problem without burden the reader with thetechnical details of a concrete “real life” example. Later on,we will present a “real life” example from the industry andspecify the respective mappings between the two models.
Figure 1: Illustration how two bricks, one of them a corner brick,can be pooled together.
We describe the problem succinctly by using an analogyof building structures out of LEGO R©-like pieces (bricks).LEGO R©-like pieces (also termed blocks or bricks) can beassembled to build sophisticated structures (in the followingtermed objects) like buildings, etc. Figure 1 shows how twobricks can be pooled together. The manufacturer of the brickswants to facilitate and simplify the assembling of the bricksto the final objects as well as to cut manufacturing costs andestablishes a two phases strategy when designing the layoutplans of the final objects. The final object is parsed into com-ponents (termed modules or assemblies) in a straightforwardway, such that these modules can also be reused to assembleother objects. This strategy of representing the final object asa composition of modules is very similar to the constructionof buildings out of prefabricated structural components, i.e.,modules. This way, by using a modular approach, the descrip-tion and the design plans of quite sophisticated objects can bekept relatively simple and manageable and the complexity andthe difficulty of building the final object is delegated to theassembly of the modules. Hence, the building specification ofthe final object is split into two guidelines, one regarding howto assemble the required modules, one regarding how to puttogether the modules to form the final object.
Each brick has numerical and non-numerical character-istics. A non-numerical attribute is, for example, a uniqueID which characterizes the bricks like shape, approximatedimensions, number and the arrangement of the inner tubes,etc. Another non-numerical attribute is the color of the bricks,etc. There are very tight requirements in order to be ableto assemble two or more bricks. In order to cut costs thetechnological process to manufacture the bricks is kept simpleand cost-effective to the detriment of interchangeability. Thus,the pieces are measured after the production process and themeasurement values are persisted in adequate storage systems.
In order to be able to assemble the bricks, they have tofit together, i.e., some measurement values (see Figure 2 foran example) have to fulfill some constraints. The respectivemeasurement values must match in order that the brickscan be assembled. For example, putting four bricks together,side by side and on top of each other, strict restrictionsconcerning perpendicularity and planarity tolerance, have to besatisfied, such that for example, the overall maximum planarity
error is 0.05 mm and the maximum perpendicularity erroris 0.1 angular degree. Unfortunately, these restrictions canonly be evaluated when all the measurement values of thebricks chosen to build the module are at the builder’s disposal.Corresponding calculation prescription are available.
Figure 2: Exemplification of the measurements of a brick.
Once, the modules have been assembled, the object canbe put together out of the pre-assembled modules with nolimitations. Furthermore, all the modules are interchangeablewith similar ones.
The manufacturing of the bricks is continuous, the bricksare packed into bins after the measuring process occurred andstowed in a warehouse. The ID, the non-numerical attributesand the numerical measurement values are stored in a databaseand associated to the bin ID. This way, the manufacturerknows exactly the content of each bin. In order to keep themanufacturing costs low, the bins are never repacked, after abin is full and in the warehouse.
Figure 3: A frame with window as an example for a module.
The assembly plan for a particular structure (for exampleas in Figure 3) is not univocal, i.e., the number and the type ofthe bricks to build the envisaged structure is not unequivocallyspecified, the assembly plan contains more alternatives. Sincethe manufacturer provides detail information in digital formregarding each brick contained in the bins offered for sale, acomputer program could easily verify that a house as givenin Figure 4 could be built up from a particular set of bins.Unfortunately, identifying the set of bins necessary to build anobject (for example the house as in Figure 4) turns out to bea very hard task to accomplish. In order to keep costs down,the number of the bins to be purchased, has to be limited tothe necessary ones.
Let us suppose that the order can be assembled out of5 bins, and the manufacturer offers 1000 bins for sale on hishome page. Regrettably, the computer program can only verifyif a particular set of five bins contains the bricks necessary tobuild the house. The brute force method to verify each setof 5 bins out of 1000 does not deliver a practical solution aselementary combinatorics show. Thus, other methods have tobe applied.
161
International Journal on Advances in Software, vol 13 no 3 & 4, year 2020, http://www.iariajournals.org/software/
2020, © Copyright by authors, Published under agreement with IARIA - www.iaria.org

Figure 4: House as exemplification of an order composed ofmodules.
D. Outline
The remainder of the paper is structured as follows: Sec-tion II gives an overview about existing work related to thedescribed problem. Section III introduces the mathematicalmodel and describes how the combinatorial problem can betransformed into a constrained satisfaction problem. Section IVapplies the proposed selection algorithm based on genetic algo-rithms to an industrial use case and shows the performance ofan implemented solution which is based on genetic algorithms.A short investigation regarding multi objective optimization isconsidered in Section V, these investigations are extended byconsidering the porting and extension of the use case to thejMetal framework in Section VI. Additionally, the possibilityoffered by jMetal to compare different heuristic algorithms istaken advantage of, whereas Section VII concludes this paperand sketches the future work.
II. RELATED WORK
Generally speaking, combinatorial optimization problemsare considered as being difficult [2] [3], which stimulatedthe development of effective approximate methods for theirsolutions. Combinatorial optimization problems appear in amultitude of real world applications, such as routing, as-signment, scheduling, cutting and packing, network design,protein alignment, and in many fields of utmost economic,industrial, and scientific importance. The techniques for solv-ing combinatorial optimization problems can be exact andheuristics. Exact algorithms guarantee optimal solutions, butthe execution time often increases dramatically with the size ofthe underlying data, such that only small size of instances canbe exactly solved. For all other cases, optimality is sacrificedfor solvability in a limited amount of time [4].
The concept of a constraint satisfaction problem has alsobeen formulated in the nineteen seventies by researchers inthe artificial intelligence. Characteristic CSPs are the n queensproblem, the zebra puzzle, the full adder circuit, the crosswordpuzzle, qualitative temporal reasoning, etc. Typical examplesof constrained optimization problems are the knapsack prob-lem and the coins problem [5]. Further examples of combinato-rial optimization problems [6] are: bin packing, the travelingsalesman problem, job scheduling, network routing, vehiclerouting problem, multiprocessor scheduling, etc.
For the last decades, the development of theory andmethods of computational intelligence regarding problems ofcombinatorial optimization was of interest of researchers.Nowadays, a class of evolutionary methods [7]–[10] is of
particular interest, like simulated annealing, ant colony opti-mization, taboo search, particle swarm optimization, to whichgenetic algorithms belong [11]–[14]. Recent publications inthis direction [15]–[21] prove the efficacy of applying geneticand other evolutionary algorithms in solving combinatorialoptimization problems.
A genetic algorithm is an adaptive search technique basedon the principles and mechanism of natural selection and of thesurvival of the fittest from the natural evolution. The geneticalgorithms evolved from Holland’s study [22] of adaptation inartificial and natural systems [6].
Typical examples of using evolutionary algorithms are thegenetic algorithm approach to solve the hospital physicianscheduling problem and an ant colony optimization based ap-proach to solve the split delivery vehicle routing problem [23].
The report [24] offers an approach to use genetic algo-rithms to solve combinatorial optimization problems on aset of euclidean combinatorial configuration. The euclideancombinatorial configuration is a mapping of a finite abstract setinto the euclidean space using the euclidean metric. The classof handled problems includes a problem of balancing massesof rotating parts, occurred in turbine construction, power plantengineering, etc.
III. THE FORMAL MODEL
In the following, we will formalize the description of thecombinatorial problem by introducing a mathematical model.This way, we use the advantages of the rigor of a formalapproach over the inaccuracy and the incompleteness of naturallanguages. First, we introduce and tighten our notation, thenwe present the formal definition of the constraints which areconsidered in our formal model and which are the majorcomponents in the definition of the fitness function usedto control and steer the genetic algorithm. Concluding, thecombinatorial problem is defined as a constraint satisfactionproblem.
A. Notation
In the following, we will formalize the description by in-troducing a mathematical model in order to use the advantagesof the rigor of a formal approach over the inaccuracy and theincompleteness of natural languages.
Let V be an arbitrary set. We notate by P(V) the powerset of V, i.e., the set of all subsets of V, including the emptyset and V itself. We notate by card(V) the cardinality of V.We use a calligraphic font to denote index sets, such that theindex set of V is notated by I V .
The finite sets of bricks, bins, (non-numerical type of)attributes, (numerical type of) and measurements are denotedas follows:
S := {si | i ∈ I S and si is a brick (stone)},
B := {bi | i ∈ I B and bi is a bin (carton)},
A := {Ai | i ∈ I A and Ai is an attribute},
M := {M i | i ∈ I M and M i is a measurement}.
Let i ∈ I A , j ∈ I M , and k ∈ I S . We denote by aik the value
of the attribute Ai of the brick sk and by mjk the value of
162
International Journal on Advances in Software, vol 13 no 3 & 4, year 2020, http://www.iariajournals.org/software/
2020, © Copyright by authors, Published under agreement with IARIA - www.iaria.org

the measurement M j at the brick sk. We denote the list ofassembly units (modules) by
U := {U i | i ∈ I U and U i is an assembly unit (module)}.
The construction (guideline) plan for a module U ∈ Ucontains
a) the (three dimensional) design plan description, i.e., theposition of each brick within the module,
b) the non-numerical attribute values for each brick and
c) prescriptions regarding the measurement values.
Analogously, we denote by
O := {Oi | i ∈ I O and Oi is an object}
the list of objects for which there exists construction plans.
The non-numerical attributes values of the selected brickshave to match the corresponding values in the guideline plan.
We denote by
R := {Ri | i ∈ I R and Ri is a requirement (specification)}
the list of the requirements (specifications) of the objects.
B. Transformation of the CP into a CSP
Let O ∈ O an order. Then, according to the specifications,there exists (proxy) modules M l1 , M l2 , . . . , M lk , such that Ois an ordered list of modules, i.e., O = (M l1 , M l2 , . . . , M lk).The term proxy is used to denote an abstract entity accordingto the specifications. Analogously, each module M i with i ∈{l1, l2, . . . , lk} is an ordered list of proxy bricks (stones),i.e., M i = (si1 , si2 , . . . , sim). Hence, each module can berepresented by an ordered list of proxy bricks, i.e., O =(sk1 , sk2 , . . . , skn). This representation will be used later todefine the individuals within the context of the genetic algo-rithms. Furthermore, we set as card(O) the number of proxybricks associated to the order O, i.e., card(O) = n.
Let O = (sk1 , sk2 , . . . , skn) be an order. We say that
the ordered list (sk1 , sk2 , . . . , skn) with si ∈ S ∀i ∈
{k1, k2, . . . , kn} is an assignment (embodiment) of O. Thismeans especially that the abstract unit of the specification ismaterialized within the production process. We set
E := {Ei | i ∈ I E and Ei is an assignment (embodiment)}.
Let R ∈ R be a requirement (specification) of a specificmodule U ∈ U and let {s1, s2, . . . , sn} be the proxy bricks ofthe specification. The design plan of the specification providesthe three-dimensional assembly plan of the proxy bricks.Additionally, the specifications provide information regardingthe restriction the bricks have to fulfill in order to be eligible.For each j ∈ {1, 2, . . . , n} the specifications contain the values{ai
j | i ∈ I A} of the attributes A := {Ai | i ∈ I A} at theproxy brick sj . We use the symbol ai
j to denote the value ofthe attribute ai of the proxy (placeholder) brick sj .
This means especially, that the brick sj can substitute theproxy brick sj if the values of the corresponding attributescoincide, i.e., ai
j = aij for all i ∈ I A .
More formally, the attributes must satisfy certain con-straints:
CA : A×S→ {yes , no},
{sij | i ∈ I A , j ∈ I S} 7→ CA(ai
j).
CA(aij) = yes if the attribute constraint is satisfied for the
brick sj i.e., aij = ai
j , else CA(aij) = no.
On the other side, the (numerical) measurement valuesmust also satisfy certain constraints (restrictions). For example,the standard deviation of the respective measurement valuesfor some bricks of a specific module should not surpass somegiven limits. Formally, CM can be represented as:
CM :M× U→ {yes , no},
{mij | i ∈ I M , j ∈ I U} 7→ CM (mi
j).
CM (mij) = yes if the constraint is satisfied for the bricks
belonging to the module U j , else CM (mij) = no.
In order to be able to reduce the constraints to brick level,i.e., to be able to decide whether the constraint is satisfiedfor a specific brick or not, we use the restriction CS
M of CM
namely CSM := CM
Ssuch that CS
M (sij) = yes if sj ∈ U j and
CM (mij) = yes ; else CS
M (mij) = no. Let U ∈ U be a module.
The above means especially, that the measurement constrainton brick level is satisfied for s ∈ U if the measurementconstraint is satisfied (on module level) for U .
Since the measurement values do not really characterizethe modules (they must only fulfill the requirements regardingthe constraints), we introduce equivalence classes on the setof modules. Two modules belong to the same class if
a) they have both the same design plan,
b) the component bricks fulfill the same (non-numerical)attributes and
c) the prescriptions regarding the measurement values aresatisfied for both modules.
Accordingly, two modules belonging to the same equiva-lence class are interchangeable.
Hence, all the bricks needed for a module must be selectedin order to be able to finally decide if the constraints aresatisfied or not.
As already mentioned, each object O ∈ O should beassembled out of bricks contained in a reduced number ofbins. We set MaxBO for the maximum number of bins asmentioned above.
Let i ∈ I B , j ∈ I O , let {si1 , si2 , . . . , sik} be the content of
the bin bi and let {sj1 , sj2 , . . . , sjl} be an assignment of Oj ∈
O. We set bj
i := 1 if {si1 , si2 , . . . , sik}∩{sj1 , sj2 , . . . , sjl
} 6= ∅else 0. This means especially, that b
j
i := 1 if the bin containsbricks belonging to the respective assignment of Oj .
Analogously, the constraints regarding the bins (cartons)can be regarded formally as:
CB : P(B) ×O→ {yes , no},
{B ∈ P(B), Oj ∈ O} 7→ CB(B, Oj).
163
International Journal on Advances in Software, vol 13 no 3 & 4, year 2020, http://www.iariajournals.org/software/
2020, © Copyright by authors, Published under agreement with IARIA - www.iaria.org

Let I an index set, such that B = {bi|i ∈ I}. ThenCB(B, Oj) = yes if
∑
i∈I
bj
i ≤ MaxBOj
, (1)
i.e., the bricks of the order Oj are contained in no more thanMaxBOj
bins. Additionally, CB(B, Oj) = no if the abovecondition is not satisfied.
Similar to the measurement constraint CM , we reduce CB
to brick level. Let S := {si1 , si2 , . . . , sik} be an assignment
of Oi. Let B = {bl1 , bl2 , . . . , bln} be a set of bins, such thateach bin contains at least one s ∈ S and there is no bricks ∈ S which is not contained in one of the bins of the set B.In this sense, B is minimal regarding the assignment S. Then,for the restriction CS
B on S of CM we have CSB(s) = yes if
CB(B, Oi) = yes , i.e., all the bricks of the assignment S arestored in no more than MaxBOj
bins. Additionally, CS,UB (s) =
no if CB(B, Oi) is not satisfied.
Until now, we considered the constraints related to thearchitecture of the object, i.e., related to the attributes of a par-ticular brick, the measurement values of the bricks belonging toa module, and the restrictions regarding the bins which containthe bricks. We can condense the constraints mentioned above,such that they relate only to bricks. This means especially, thatthe measurement constraint are satisfied for a brick, if thereis a group of bricks (module, or order), such that the givenmeasurement constraint is satisfied as described above.
We set accordingly:
C := {Ci | i ∈ I C and Ci is a distinct constraint}
the list of distinct constraints.
The constraints can be considered as a function. Pleaserecall that I S is the index set of S.
C : S× I C → {yes , no},
{sik | i ∈ I C , k ∈ I S} 7→ C(si
k).
Please consider, that the above representation can be mis-interpreted, such that the constraint is exclusively a propertyof the respected brick. This is not the case, for examplethe measurement constraints fulfilled or not for the bricksassigned to a module. Hence, if one brick is changed, thenthe constraints of all the bricks belonging to a module can beinvalidated.
We define now formally the weights, (i.e., w is a weightif w > 0 ) which are necessary to be able to model theimportance of the constraints within the genetic algorithm. Weset
W := {wi | i ∈ I C and wi is a weight}
the list of weights. This means especially, that each constrainthas an associated weight.
The fitness function [25] characterizes the quality of anassignment of an order, such that a value closer to 1 meansa better quality. It plays an important role in the decision,whether an assignment fulfills the specifications or not.
The purpose of the following function inv is purely tech-nical, it is used to switch the values of the boolean values1 and 0 to be used in the definition of an example of thefitness function, i.e., inv : {yes , no} → {0, 1} such thatinv(yes) = 0 and inv(no) = 1.
Please find below an example for the fitness function. LetI S ⊂ I S and let wi ∈W for all i ∈ I C . Then:
F : E× I C → (0, 1],
{sik | i ∈ I C , k ∈ I S} 7→
1
1 +∑
i∈I C ,k∈I S
wi ∙ inv(C(sik))
. (2)
Problem formulation (Combinatorial problem)Let O ∈ O a given object and let n ∈ N.
Choose n bins from the warehouse, such that theobject can be assembled out of the bricks containedin these bins according to the existing constructionplans.
The construction plan for an object O ∈ O specifies thelists of (non equivocally determined) modules, including thedesign plan, such that the object can be build out of thesemodules. Hence, it can be unambiguously decided, whetherthe n cartons contain the necessary bricks to assemble themto modules, which can be put together to form the requiredobject. Let us suppose that n � card(C), i.e., the numberof bins in the warehouse exceeds the number of bins to bechosen by orders of magnitude. The difficulties of solving theproblem in a straightforward way lie in the very large numberof possibilities to combine n bins out of card(B). Therefore,other strategies have to be used.
To summarize: the specification of an object (for examplea house composed of bricks), contains very strict requirementsregarding the components. The assembly plan specifies thestrict order in which the bricks have to be assembled. Hence,the bricks must satisfy some attributes (like shape, type, color,etc., in order to satisfy the requirements of the constructionplans. Moreover, some bricks have to fit together (for examplethe window frame) so they can be assembled in the ordergiven by the construction plans. If the above requirementsare satisfied for all the units (modules), the object can beassembled. Furthermore, the selected bricks have to be selectedfrom a restricted number of bins (cartons). The latter makesthe task so difficult.
From a formal point of view, the associated constraintsatisfaction problem of the combinatorial problem can nowbe formulated:
Problem formulation (Constraint satisfaction problem)Let O ∈ O be an order with the representationO = (s1, s2, . . . , sk). Set wi = 1 for all i ∈ I C .
Find an index set {l1, l2, . . . , lk} ⊂ I S such that(sl1 , sl2 , . . . , slk) is an assignment of O, havingF ((sl1 , sl2 , . . . , slk)) = 1.
C. Formulation as a System of Equations
In the following, we will formulate the problem as a Systemof Equations. For readability reasons, we will refresh the some
164
International Journal on Advances in Software, vol 13 no 3 & 4, year 2020, http://www.iariajournals.org/software/
2020, © Copyright by authors, Published under agreement with IARIA - www.iaria.org

of the notations already introduced. Let S ⊂ S a subset of thebricks. We denote – as we have done before – by I S the indexset of S. We recall that I S is the index set of S, i.e., I S ⊂ I S
and I C is the index set of the distinct constraints C. Moreover,we recall that CB are the bin constraints and correspondingly,I CB is the index set of the bin constraints.
Let Oj = (sk1 , sk2 , . . . , skn), j ∈ I O be an order.
Then card(Oj) is equal to the number of proxy bricks, i.e.,card(Oj) = n. Let i ∈ I B . Please recall that b
j
i := 1 if thebin bi contains bricks belonging to the respective assignmentof Oj .
Problem reformulation (Constraint satisfaction problem)Find an assignment S ⊂ S of Oj such that allconstraints are satisfied:
∑
i∈I C , k∈I S
inv(C(sik)) = 0. (3)
Requiring that the sum of chosen bins is minimal, one canformulate the problem as an Optimization Problem (OP)
Problem formulation (Optimization problem)Find an assignment S ⊂ S of Oj such that:
1) all but the bin constraints are satisfied:∑
i∈(I C\I CB ), k∈I S
inv(C(sik)) = 0 (4)
2) and the number of bins is minimal:
minimize∑
i∈I
bj
i (5)
Please recall that according to the description of the assign-ment, the equality
card(S) = card(Oj) (6)
holds, i.e., the number of the bricks we seek is determinedthrough the specification of the order Oj .
Equation (3) means especially that all constraints – includ-ing the bin constraint (i.e., relation (1)) – have to be satisfied.In contrast to the above, the optimization strategy does notrequire that the bin constraint is satisfied (Equation (4)), butthe minimal number of bins (see condition (5)) is seeked.
There are either no solution to CSP / OP or one / multiplesolutions. The multiple solutions are equivalent, i.e., twosolutions which satisfy the constraint are regarded as of thesame quality. Accordingly, only one assignment is seeked.
Let A be an integer matrix; b and c vectors, an IntegerLinear Program (ILP) is expressed as [26]
maxx∈Zn
{cT x | Ax ≤ b, x ≥ 0}. (7)
Unfortunately, the measurement constraints do not apply on thebrick level, moreover it has to be decided for a module (i.e., abunch of bricks) if the measurements values are satisfied. Thismeans especially, that the measurement constraints are satisfiedfor all of the bricks of the module or for none of them. This
means that the reformulated CSP cannot be represented in adirect way as an ILP.
However, in order to linearize the relation (4) the OP can beformally transformed by considering modules instead of bricks.Accordingly, a module M satisfies a specific constraint if allthe bricks composing the module M satisfy the constraint.Hence, the module is contained in a nonempty set of bins andnot anymore in a single bin. Unfortunately, this strategy canbe applied only on very small data set, since the measurementconstraints must verified for all modules which can be buildout of the existing bricks.
To summarize, it does not seem that the relation (4) canbe meaningfully linearized – due to the constraints which acton a bunch of bricks – in such a way that the reformulatedCSP can be transformed into a ILP, thus benefiting from theadvantages of the research in this area.
D. Reformulation as a Nonlinear System of Equations
In the following, we will reformulate the problem as anonlinear system of equations. Therefore, firstly we recall andstrengthen the relating definitions and correlations betweenthem in order to ease the reading of the following section.
• I B is the index set of the set of bins (cartons); obviouslycard(I B) = card(B), where B is the set of bins(cartons),
• I (S i ) is the index set of the bricks (stones) contained inbin bi for all i ∈ I B ,
• Si := {si,k | i ∈ I B , k ∈ I (S i ) and sk,i is a brick(stone) contained in bin bi} ⊆ S, i.e., Si is the setof bricks contained in bin bi, for all i ∈ I B , It followsfrom the definition that card(I (S i )) = card(Si)
• Clearly, card(S) =∑
i∈I B
card(I (S i )), the total number
of bricks (stones) is obtained by summing up the brickscontained in the cartons.
As mentioned, we denote by si,k the brick located at bin bi
having the local index k and introduce the following set ofboolean variables:
si,k :=
{1 if brick si,k has been selected,
0 otherwise
for all i ∈ I B , k ∈ I (S i ).
Please recall that U is the set of all assembly units (modules),i.e., U := {U i | i ∈ I U}; such that I U is the index set of U.We denote:
sUj
i,k :=
{1 if si,k = 1 and brick si,k ∈ U j ,
0 otherwise
for all i ∈ I B , k ∈ I (S i ), j ∈ I U .
and
si :=
{1 if ∃k ∈ I (S i ) such that si,k = 1,
0 otherwise
for all i ∈ I B .
165
International Journal on Advances in Software, vol 13 no 3 & 4, year 2020, http://www.iariajournals.org/software/
2020, © Copyright by authors, Published under agreement with IARIA - www.iaria.org

As already defined, I A be the index set of the set of the non-numerical attributes A. The matching of the non-numericalattributes is modeled by introducing a new set of booleanvariables:
dg
i,k :=
{1 if fg
i,k = fgi,k,
0 otherwise
for all g ∈ I A , i ∈ I B , k ∈ I (S i ).
Unfortunately, the measurement constraints are assemblyunit (module) related, i.e., the measurement values of thebricks belonging to a specific assembly unit as a whole satisfyor not the constraints requirements. For example, the standarddeviation of a specific measurement may not surpass a giventhreshold value for the bricks belonging considered assemblyunit. Accordingly, all bricks belonging to a module have tobe selected before measurement satisfaction decisions can bevalidated.
Let U ∈ U a particular assembly unit (module). Thefulfilling of the constraints is modeled by introducing a newset of boolean variables:
eh,Ui,k :=
{1 if ∀si,k ∈ U : si,k fulfills constraint Eh,
0 otherwise
for all h ∈ I M , i ∈ I B , k ∈ I (S i ).
This means in particular, that opposite to the non-numericalattributes, the measurement constraints do depend on thespecifications of each module.
Let O ∈ O an order. Then, according to the definitionof the order, there exists (proxy) modules {U i | i ∈ I UO},such that O is a ordered list of those modules. Let I UO theindex set of the set of modules and let MaxBO the maximalnumber of bins where the bricks may be located. For the sakeof simplifying the notations, we set p := card(O) as thenumber of the bricks we seek to determine. By defining avector t ∈ {0, 1}card(I B)×card(I (Si )) with elements ti,k := si,k
∀i ∈ I B , k ∈ I (S i ), the problem can be reformulated as asystem of equations:
Problem reformulation (Non-linear system of equations)Given all quantities listed above except for si,k,
i ∈ I B , k ∈ I (S i ), find t ∈ {0, 1}card(I B)×card(I (Si ))
such that
1) p bricks from all cartons are chosen:∑
i∈I B
∑
k∈I (Si )
si,k = p, (8)
2) maximal MaxBO bins are chosen:∑
i∈I B
si ≤ MaxBO, (9)
3) the non-numerical features are matched:∑
i∈I B
∑
k∈I (Si )
dgi,k ∙ si,k ≥ p for all g ∈ I A ,
(10)
4) the measurement constraints are fulfilled:∑
i∈I B
∑
k∈I (Si )
ehi,k ∙ sUj
i,k ≥ p for all h ∈ I M , j ∈ I U ,
(11)
The inequations (10) result as follows: The attributes have tomatch for at least p bricks, thus, the product dg
i,k ∙si,k of at leastp terms has to be one. Each of the remaining terms will beeither one or zero due to the boolean variables. Therefore, thetotal sum will be also greater than or equal to p. The inequa-tions (11) have been determined analogously. In total, thereare one equation from (8), one inequation from (9), card(I A)inequations from (10), and card(I M ) ∙ card(I U) inequationsfrom (11) compared to
∑
i∈I B
card(I (S i )) := card(I S ) unknown
variables.
All equations are linear. Please note that the variables si,k
are boolean ones and thus, have to be integer. We only haveto find one solution of the system. However, if we want tomaximize the number of objects which can be assembled fromthe given set of cartons, then we can formulate an optimizationproblem based on the linear system defined above. It has tobe examined if this optimization problem leads to an integerlinear program (ILP). In case this is possible, then rewriting theILP in standard form will be the basis for solving the problem.
There exists a lot of methods for solving ILPs. Branch-and-bound and branch-and-cut algorithms are two of them. Theywork in a heuristic way.
IV. USE CASE: AN EXCERPT
In the following, we present a real-life use case [27] wecame across at an international semiconductor company. Wedescribe the problem by using the specific terminology inthe semiconductor industry, utilizing them with care and onlywhen it is inevitable and undeniable necessary. We describe thefundamentals of the genetic algorithms and show the way it isused to solve our problem. Finally, we conclude by presentingsome performance tests.
A. Problem Description
The company manufactures integrated circuits (ICs, alsotermed chips), which are subsequently assembled on circuitsboards to salable entities, termed modules. In order to keepproduction cost low, the specification of the ICs do not imposevery tight constraints on the attributes of the ICs, such thatthe same IC can be used for different types of modules. Onthe contrary, the specification regarding the modules are verystringent, in order that the module should be fully functionalat the customer side. As soon as the ICs are manufactured, agood dozen of electrical properties are measured and persistedin a data repository. Figure 5 shows a symbolic representationof an IC.
Usually, four to six ICs are assembled on the module. Thespecification of the modules contains the design (i.e., numberand positioning) of the ICs on the integrated circuit board,the type of the IC (article, number of pins, etc.), and severalconstrains regarding the interaction of the ICs of the module.Figure 6 shows a symbolic representation of a module with
166
International Journal on Advances in Software, vol 13 no 3 & 4, year 2020, http://www.iariajournals.org/software/
2020, © Copyright by authors, Published under agreement with IARIA - www.iaria.org

5 ICs. In order for the module to be fully functional, thecorresponding measurement values of the ICs have to be ina narrow range. For example, for a specific measurement, thevalues of the voltage of the ICs have to be between 2.1 volt and2.5 volt in order that the IC is not scrapped and can be usedfor further processing. Unfortunately, not all the ICs havingthe corresponding measurement value in the range as describedabove, can be assembled to a module. The values differ toomuch from each other, and the module will not work properlyat the customer side. To circumvent this impediment furtherconstraints are needed. These constraints apply on all ICs ofthe module or just on a subset of it. For example, an often usedconstraint is limiting the standard deviation of the voltage to0.1 within one module.
Figure 5: Symbolic representation of an IC.
Figure 6: Symbolic representation of a module with 5 ICs.
The ordering unit (termed work order) contains the de-scription of the modules, the customer expects to be shippedtogether at once. There are no additional constraints on theICs regarding the work order. As soon as the manufacturingprocess of the ICs has been finished, the ICs are packed inboxes. That way the cleaning of the ICs can be performedand the ICs can be assembled to modules. The boxes arethen transferred to the warehouse. Figure 7 shows a symbolicrepresentation of the bins in the warehouse.
ICs Set
···
Bin 1(21 ICs) Bin 2(18 ICs) Bin n(27 ICs)
Figure 7: Symbolic representation of the Warehouse containing thebins and the bins containing the ICs.
The difficulties of the semiconductor company to honoreach the order in general are also due to technological restric-tions, since the tool that assembles the ICs can handle at mostfive boxes, i.e., all the ICs necessary to fulfill a work ordershould be located in five boxes. Due to the fact that the workorders always contain the same number of ICs, independent of
the specification of the modules, the minimal number of boxeswhich are needed to meet the requirement of the work orderis four with 9 percent surplus of ICs.
If we rephrase the above in a more concise form, thechallenge is: Find five boxes in the warehouse, such that itcontains the ICs needed to fulfill the requirements for a workorder.
B. Used Methods
Simple combinatorics show that the brute force method,i.e., go through all the possibilities and check if the selectedboxes fulfill the requirements, is not implementable for prac-tical systems. Fortunately, there is an implementation in placefor the selection strategy, based on heuristics, local optimum,and inside knowledge of the pattern of the modules. This way,we have a very good way to compare the results of the geneticalgorithm with alternative solutions. Regretfully, our attemptto deliver exact solutions on the problem using MATLAB werenot crowned by success due to the large amount of data and tothe restricted computing power of the machines we used. Thedisadvantages of the already existing solution for the selectionstrategy were partly also the issues that made it possible to setup such a solution:
a) the unpredictability that the selection strategy deliversa solution within the expected time frame;
b) the inflexibility to even minor changes in the design andspecifications of the modules, thus, the unpredictabilitythat the software can be used in the future;
c) heavy maintenance efforts due to the sophisticated andarchitecture and implementation;
d) lack of the proprietary knowledge and documentationof the implementation on the low level side;
e) impossibility to reuse the existing code with reasonableefforts for further development and enhancements.
Start
Generate initial population
Is StopCondition met?
Output result
Create next generation
End
No
Yes
Figure 8: Overview of the genetic algorithm.
The concepts of the genetic methods are straightforwardand easy to understand. The main idea is that we start with aninitial population of individuals, and as time goes by, the genesof the descendants are improved, such that at least one indi-vidual satisfies the expectations. The individual incorporates
167
International Journal on Advances in Software, vol 13 no 3 & 4, year 2020, http://www.iariajournals.org/software/
2020, © Copyright by authors, Published under agreement with IARIA - www.iaria.org

the requirements of the problem. The expectation in the endis that these requirements are finally satisfied. Each individualowns genes, part of it is inherited by his descendants.
The principle of the genetic algorithm is straightforward,see Figure 8 for a basic representation. First, the initialpopulation is randomly generated, then subsequent generationsare created as long as the stopping condition is satisfied. Theindividuals with the highest quality characteristics constitutethe main part of the output.
We define the individuals as an abstraction of the work or-der, such that each gene of the individual is the abstraction foran IC of the warehouse. Accordingly, the individual satisfiesthe requirements if the ICs can be assembled to modules, suchthat the corresponding work order is fulfilled.
Figure 9 is a symbolic representation of an individual (alsotermed chromosome) containing three modules. According tothe specifications, each module contains six ICs. The slots ofthe modules – i.e., the plug-in location where the ICs areinserted – are numbered consecutively, from 1 to 18 (upperrow of the table). Generally speaking, the specific slots – eachof them corresponds to the specification of the components ofthe respective module – represent formally the requirementsregarding the ICs composing the modules, hence the structureof the consecutive modules (Module 1 till Module 3) alsodetermines the layout of the individual. Accordingly, the ICsassigned to the slots are the genes of the individual. The middlerow of the table in Figure 9 shows an assignment of the slotswith ICs, for example, the IC with the unique identifier (Id)263 has been assigned to slot No. 1, etc. The bottom rowillustrates the storage of the ICs in the bins, for example the ICwith the Id 263 is stored in the bin No. 6. This latter allocationcannot be changed during the selection process, i.e., it is notpossible to rearrange the content of the bins before or duringthe selection process.
ICs Set
Module 1 Module 2 Module 3654321 121110987 181716151413
62144788251759457235577928437229752417204755246179263
832145792137 453721837979 798383452183
Bin 79(21 ICs) Bin 83(18 ICs) Bin 21(9 ICs) Bin 45(11 ICs)Bin 37(19 ICs)
Figure 9: Symbolic representation of the module based structure ofan individual (chromosome) containing the respective ICs (genes).
The initial population is randomly generated out of theICs in the warehouse. The criterion, which determines to whatdegree the individual fulfills the requirement of the associatedwork order, is the fitness function. The fitness function takesvalues between 0 and 1, a greater value means that theindividual is more close to fulfill the specification of the work
order. To achieve a value of 1 is the ultimate goal. It meansthat the corresponding individual satisfies the requirements tofulfill the associated work order. Hence, the definition of thefitness function is one of the most sensible parts of the geneticalgorithms and the setup of this function should be consideredvery carefully.
Actually, the strategy of the genetic algorithm resemblesvery much to the evolution of the mankind. People marry,have children by passing their genes to them, divorce andremarry again, have children, and so on and so forth. Theexpectation is that the descendants have more “advantageousgenes”, regardless of how the term “advantageous genes” isdefined.
Establishing the fitness function is one of the most im-portant strategical decision to be taken when setting up thegenetic algorithm. In our case, there are a few constraints(more than one) which affect the quality of the individuals.Implementations which try to find a Pareto optimal state [28],[29] (i.e., a state from which it is impossible to make anindividual better, without making at least one individual worse)use strategies as tournament selection [30] or the improvedPareto domination tournament [29].
As already mentioned, the starting population is selectedaleatorically. Once, the first generation is constituted, thepreparations to generate the next generation are met. Unfor-tunately, the Apache Commons Mathematics Library does notsupport multi-objective optimization problems, hence our al-gorithms cannot use the strategy of the Niched Pareto GeneticAlgorithm (NPGA) [29].
Instead, for each individual, the fitness function is calcu-lated such that the suitability to fulfill the expectations, isevaluated for each individual. The higher the computed valueis, the better fitted are the individuals. Let us suppose, that theinitial population is composed of 500 individuals. We use someof the concepts provided by Apache Commons MathematicsLibrary in our implementation, among others the elitism rate,which specifies the percentage of the individuals with thehighest fitness value to be taken over / cloned to the newgeneration. We use an elitism rate of 10 percent, i.e., the 50best individuals will be taken without any changes of the genesto the new generation.
The population of each generation remains constant intime. In order to choose the remaining 450 individuals (par-ents) to generate the next generation, we use the tournamentselection [30] including the implementation of the ApacheCommons Mathematics Library. The tournament strategy canbe configured by the arity of the tournament strategy, whichspecifies the number of individuals who take part in thetournament. For our purpose, five individuals in the tourna-ment proved to be efficient. Accordingly, five individuals areselected randomly out of the total population of 500 individualsto take part in the tournament. Out of the individuals takingpart in the tournament, the fittest individual is selected asa parent for the new generation. This way, 500 parents areselected out of a population of 500 individuals. These parentsare paired aleatorically and they always have two descendants.This way, the next generation is created. Accordingly, the sizeof each generation remains constant.
We use two major strategies in order to improve the quality
168
International Journal on Advances in Software, vol 13 no 3 & 4, year 2020, http://www.iariajournals.org/software/
2020, © Copyright by authors, Published under agreement with IARIA - www.iaria.org

of the genes of the descendants, the crossover strategy de-scribed in [31] and the mutation strategy. Generally speaking,during the crossover phase, the two descendants receive thepartly interchanged genes of their parents. Additionally, someparticular genes can suffer mutations, i.e., the values of thoseparticular genes are modified. The mutation policy can beconfigured, such that it allows or rejects the inclusion of newbins to the descendants. This way, the bin constraints can bereinforced, or the flexibility to mutate to any gene ensured.The general strategy to generate the descendants is based withsome restrictions on random decisions.
BinningGeneticAlgorithm
ICSet
IC
WorkOrder
Module Specification
IC Specification
Bin Constraint
RestrictionMeasurement Constraints
Non-Numerical Constraints
1
1
1
1..*
1
1
1
1 1
1..6
1
1 *
*1
Figure 10: UML class diagram of algorithm and its parameters.
As shown in Figure 10, the genetic algorithm relies onthe work order and the set of ICs as its principal inputparameter. The ICs set holds the primary production resultand the work order identifies the specification of the finalproduct – i.e. set of modules –, which are delivered as the finalproduct to the customer. The specification of the work orderinclude the constraints of the IC, module and work order level.The constraints on the IC level were termed non-numericalconstraints and relate to each particular IC, the constraints onmodule level were termed measurement constraints and theyrelate to the restriction the ICs that form the module have tosatisfy as a group. Similar considerations apply for the binconstraints.
Start
Add a random individual into the arena
Is arena full?
Choose the fittest individual from the arena
End
No
Yes
Figure 11: Tournament selection.
As mentioned above, according to the percentage given bythe elitism rate, a subset of individuals of the current generationhaving promising genes are taken over unmodified to the newgeneration. In order to select the next pair of individuals duringthe process of establishing the new generation, see Figure 12,
two groups of randomly chosen individuals are formed, the sizeof the group is configurable and given by the arity value. Then,the best individual from each arena is selected, circumventingthe disadvantage of random selection. This method is depictedin Figure 11.
We describe in brief the creation strategy of the newgeneration. Some parameters are freely configurable, in orderto assure best performance. Thus, the crossover rate, i.e., thethreshold of the probability that a crossover is performed, hasto be set in advance. Then, a crossover is performed if arandomly generated number is less than the crossover rate.Same is true regarding the mutation rate.
Start
Initialization of the new generation according to the elitism rate
R < mutation rate
Select a pair of individuals from the current generation;
Choose a random number R ∈ [0,1)
R < crossover rate
Cross the pair of individuals
Mutate the pair of individuals
Add pair of individualsto the new generation
Is new generation full?
End
Yes
No
Yes
No
Yes
No
Figure 12: Example of the creation of a new generation.
The crossover policy is quite straightforward. The positionand length of the genes to be crossed over are randomlygenerated and the two descendants have receive the inter-changed genes of their parents. In our case, this policy hasbeen improved, such that by in the end, the number of the binsof at least one descendant is using, is lower than (or if this isnot possible equal to) the number of the bins of their parents.This way, the reduction of the number of bins an individual isusing, is enforced by the crossover policy itself.
The mutation policy is also very intuitive. In addition tothe mutation rate, which defines in the end, whether mutationis applied after the crossover phase or not, the exchange rate
169
International Journal on Advances in Software, vol 13 no 3 & 4, year 2020, http://www.iariajournals.org/software/
2020, © Copyright by authors, Published under agreement with IARIA - www.iaria.org

indicates whether a slot (IC) is to be renewed. Analogously,the mutation policy can be configured such that the numberof bins the descendant is using is reduced or in worst case,kept constant, i.e., using the Bin Reduction Mutation (BRM)policy.
A simplified flowchart regarding the constitution of a newgeneration based on the current one is shown in Figure 12.First, based on the elitism rate, the best individuals of thecurrent generation are cloned into the next generation. Thisway, the genes of the most promising individuals are saved forthe next generation, this way, initializing the new generation.Next, either randomly or by tournament selection a new pair ofindividuals is selected from the current generation. Accordingto a randomly generated number, crossover and mutation isperformed on the pair of the individuals or on the singleindividuals, respectively. The pair of individuals generatedthis way is added to the set of individuals forming the newgeneration. The process of filling up the set of the newgeneration with new pairs is continued until the size of thenew generation equals the size of the current generation.
654321 121110987
654321 121110987
654321 121110987
654321 121110987
599119161151159163 315307295241516550
511111 332255
241505509119115101
255111
612630417407263295
664422
599119417407505509
514455
315307295241516550
332255
241159163119115101
211111
612630161151263295
661122
Figure 13: Example of bin reduction crossover policy.
Next, we illustrate based on a representative example inFigure 13, the Bin Reduction Crossover (BRC) policy. TheBRC policy enhances the classical crossover policy, such thatit uses the inside knowledge regarding the allocation of the ICsto the respective bins. As already mentioned, this allocationis fixed, it cannot be changed during the selection process.The general strategy of the BRC algorithm is to get rid ofbins sparsely represented in exchange of ICs from much betterrepresented bins. The two candidates dispose of ICs stored insome common bins, depicted in blue tones and and of unsharedboxes, depicted in red tones. Some ICs can be found in bothindividuals, for example those with ID = 119, 241, 295. Thebasic idea is to move ICs from the common bins from oneindividual to another and in return to try to reduce the numberof bins by returning ICs from sparsely bins. In our example,the ICs with ID = 136, 159, 151, 161 are moved from thefirst individual to the second, and the ICs with ID = 509,505, 407, 417 are returned in order to balance the contentof the individuals. This way, after the crossover is fulfilled,the second individual has genes from three boxes, which is
a substantial reduction of bins used by the second individual.The overall number of bins composing the two individualshave been reduced this way by one, which corresponds to theenvisaged objective.
An overview of establishing a new generation is depictedin Figure 14, which uses UML sequence for his flow chart. Ituses implementation-related presentation and gives a glimpseof the Java code.
C. Performance Results
The benchmarks were performed on a Intel R© CoreTM
i5-6500 CPU (quad core CPU 3.2 GHz, 16 GB RAM)running on Windows 10 and Eclipse 3.7.0 using Java SERuntime Environment 1.6.0_22. The genetic algorithm wasimplemented using the Apache Common Library, version 3.0.The test data is a subset of the production environment andcontained 5518 ICs in 261 boxes, having 28 measurements onaverage. The restricted test data is a subset of the productionenvironment and contained 27,590 ICs in 1,305 boxes. Dueto the incomplete set of production data, only the two mostcritical modules are considered for selection. After taking intoaccount the attributes corresponding to the specifications ofthe two modules regarding the ICs (article, number of pins,etc.) only eleven boxes contain ICs to be considered for theselection process. We term pre-selection the method to restrictthe number of boxes by excluding those boxes which do notcontain selectable elements. In this way, the search area can bedrastically reduced and thus, the performance of the selectionalgorithm can be substantially improved.
We use a generation size of 500 individuals, an elitismrate of 10 percent and an arity value of 5. The number ofgeneration is limited to 1000 and the runtime of the selectionalgorithm is limited to 300 seconds. The other parameterslike the crossover rate and the mutation rate are configuredon a case by case basis. Regarding the fitness function, thefollowing configuration parameters have proved themselves asgood choice: attribute weight = 1; measurement weight = 2;bin weight = 5. This means especially, that fulfilling the binconstraints is the most difficult one. In summary, we use theconfiguration parameters given in Table I for the performancetests.
TABLE I: SETTINGS OF CONFIGURATION PARAMETERS.
Configuration parameter Value
Population size 500 individualsGeneration limit 1000 generationsCrossover policy Bin reductionCrossover rate 78 %Mutation rate 13 %Runtime limit 300 secondsElitism rate 10 %Arity 5
The prediction of the results of the selection algorithm ishardly possible, since we use random strategies to generate theinitial population, to select the parents for the next generation,to determine the crossover and mutation policy. Moreover,parameters like the elitism rate and the arity have to beconfigured. Hence, the interaction between many factors that
170
International Journal on Advances in Software, vol 13 no 3 & 4, year 2020, http://www.iariajournals.org/software/
2020, © Copyright by authors, Published under agreement with IARIA - www.iaria.org

GeneticAlgorithmPopulation
Generation nPopulation
Generation n+1SelectionPolicy
Tournament selectionCrossoverPolicy
Bin reduction crossoverMutationPolicy
Bin reduction mutation
nextGenerationinitialize the new generation
Loop
[elite areaincomplete]
add individual
select an individual pair
select and choose fittest individual
[should do the crossover] crossover
[should do the mutation] mutate
add individual
[generation incomplete]add individual
Loop
[generation n+1 not full]
Figure 14: UML sequence diagram of a new generation.
can influence the success and performance of the selectionalgorithm is not obvious.
0%
10%
20%
30%
40%
50%
60%
70%
80%
90%
100%
0
25,000
50,000
75,000
100,000
125,000
150,000
175,000
200,000
225,000
250,000
1 2 3 4 5 6 7 8 9 10 11 12 13 14 15 16 17
Success rate
Tim
e us
ed (m
s)
Number of modulesWith preselection, Time used Without preselection, Time usedWith preselection, Success rate Without preselection, Success rate
Figure 15: Apache: Success rate and time used depending on thenumber of modules with and without pre-selection.
It is not the aim of this study to deliver the possible bestsolution in an acceptable time frame and to improve the per-formance of the algorithm. Instead, our objective is to deliveran acceptable solution, i.e., a solution that fulfills the requiredconstraints, for the industry to a crucial problem regarding theirproduction problems. For example, there is no technologicalbenefit of tightening the measurement constraints; the binconstraint was set up in such a way that seeking a lower valueis not possible due to the fixed number of ICs of a work orderand to the maximal capacity of the bins. Hence, the acceptablesolution is also the best possible solution.
Nevertheless, we tried to improve the selection algorithmby testing the influence of the parameters, we find out to bedecisive. This was also the case for the parameters of the fitnessfunction as described above.
As already mentioned, we have an algorithm in place,which can find
a) a suboptimal solution in a heuristic way,
b) determine exactly whether the group of bins containICs which satisfies the specification of a particular workorder.
0%
10%
20%
30%
40%
50%
60%
70%
80%
90%
100%
0
1,000
2,000
3,000
4,000
5,000
6,000
7,000
8,000
9,000
10,000
1 2 3 4 5 6 7 8 9 10 11 12 13 14 15 16 17
Success rate
Tim
e us
ed (m
s)
Number of modulesBin reduction, Time used Random recombination, Time usedBin reduction, Success rate Random recombination, Success rate
Figure 16: Apache: Success rate and time used when selecting therandom recombination crossover policy or the bins reduction policy.
Figure 15 shows that the selection algorithm using pre-selection delivers the expected results, finding individuals
171
International Journal on Advances in Software, vol 13 no 3 & 4, year 2020, http://www.iariajournals.org/software/
2020, © Copyright by authors, Published under agreement with IARIA - www.iaria.org

having 19 modules. The success rate, i.e., the probabilitythat the selection algorithm reaches with an individual thegiven number of modules, is over 60 percent and thus, highenough for practical systems. The pre-selection strategy isvery straightforward and easy to implement. Thus, no practicalsystem would renounce to it. Nevertheless, when neglecting thebenefit of reducing the search space by using pre-selection, theresults of the genetic algorithm are not always as promising aswith pre-selection. In order to evaluate worst-case scenarios,we used work that posed a lot of difficulties to select with theheuristic algorithm in place. As illustrated in Figure 15, thesuccess rate to select 19 modules as in the previous case, is at60 percent. This means especially, that the successful run ofthe genetic algorithm heavily depends on the random numbersthat were generated.
1%
11%
02.5005.0007.50010.00012.50015.00017.50020.00022.50025.000
25%30%35%40%45%50%55%
60%
65%
70%
75%
80%
Mutation rate
Time
use
d (m
s)
Crossover rate
0-2.500 2.500-5.000 5.000-7.500 7.500-10.000
10.000-12.500 12.500-15.000 15.000-17.500 17.500-20.000
Figure 17: Apache: Time used depending on the crossover rate andthe mutation rate.
11%
21%
0%6%12%18%24%30%36%42%48%54%60%
20%
25%
30%
35%
40%
45%
50%
55%
60%
65%
70%
75%
Mutation rate
Succe
ss rate
Crossover rate
0%-6% 6%-12% 12%-18% 18%-24% 24%-30%
30%-36% 36%-42% 42%-48% 48%-54% 54%-60%
Figure 18: Apache: Success rate depending on the crossover rateand the mutation rate.
Figure 16 shows the difference between the random recom-bination crossover policy and the bins reduction policy. Theboxes reduction crossover policy tries to reduce the numberof boxes of the new individuals by focusing on the commonbins of the parents. As a conclusion, using business logic overgeneral approach, the general approach is as expected slower
and has a lower success rate. This is the price to pay for usinga more general solution over a customized one.
-3.5
-3
-2.5
-2
-1.5
-1
-0.5
0
0 10 20 30 40 50 60 70 80 90 100
Lg(fitness)
Generation
Figure 19: Logarithmic representation of the values of the fitnessfunction depending on the number of generations (50 attempts).
Figures 17 and 18 show the influence of the crossoverrate and the mutation rate to the success rate and the wallclock time. As not obvious at first glance, a smaller crossoverrate and a higher mutation rate gives better values for thesuccess rate. Keeping the crossover rate and the mutationrate low, better run time performance is achieved. Generallyspeaking, high mutation rate can destroy the structure of goodchromosomes, if used randomly [32]. The above remark doesnot hold in our case, since we do not exchange ICs randomly,but according to our strategy to minimize the number of bins.We use for the three-dimensional graphics in this paper thebest performing strategy, i.e. the bin reduction policy and pre-selection.
The tendency of the convergence of the fitness functionis visualized in Figure 19. The graph shows that in the endall 50 threads converge after some generations, but only asubset to the envisaged value. Each dot indicates the bestfitness value of a individual within one thread correspondingto a specific generation. Recall that the maximum value ofthe fitness function is per definition equal to 1, the higherthe value of the fitness function, the better the solution. Thevalues of the fitness functions are discrete, {1, 1
2 , 13 , 1
4 , 15 , ...}.
We use a decimal logarithmic representation, as a consequencethe value 0 of lg(fitness) indicates that a solution has beenfound. The best thread found a solution within 43 generationsand the slowest thread - which is not represented in the graphic- found a solution after 228 generations. There are 8 threads intotal which found a solution, the rest - although they converge- were not successful.
V. RESUMING ON MULTI-OBJECTIVE OPTIMIZATION
Our preferred implementation framework is Apache Com-mons Mathematics Library, version 3.0 [33]. However, avery similar combinatorial grouping problem, the Bin PackingProblem (BPP) is investigated [34], by using the off the shelfjMetal framework [35]. The (one-dimensional) BPP [36] isdefined as follows: given an unlimited number of bins with aninteger capacity c > 0 each, a set of n items, N = {1, 2, ..., n},
172
International Journal on Advances in Software, vol 13 no 3 & 4, year 2020, http://www.iariajournals.org/software/
2020, © Copyright by authors, Published under agreement with IARIA - www.iaria.org

and an integer weight wi, 0 < wi ≤ c for each item i ∈ Nassign each item to one bin, such that the total weight of theitems in each bin does not exceed c and the number of binsused is minimized.
Luo et al. [34] extend the base implementation of jMetalto problems with dynamic variables. This was necessary, sincethe number of the genes in chromosomes is fixed in the baseimplementation of jMetal. However, the number of the genesin the specific implementation of the chromosomes for BPP– termed group based representation – is fluctuating; theyvary in length depending on how many bins are used inevery solution. Accordingly, the adopted implementation ofBPP includes specific adaptations and enhancements of thebasic primitives of jMetal, including those for chromosomes,crossover and mutation. The need for dynamic variables isjustified by difficulties to use other solutions due to the fitnessfunction.
In order to evaluate the performance of their algorithms– termed GABP –, Luo et al. [34] use public bench dataas well as self-created big data sets. The performance ofGABP does not differ very much from some of the knownimplementation of BPP. The main benefit of GABP is theimplementation in a generic framework. However, the problemdescribed in this article, the Matching Lego(R)-Like BricksProblem (MLBP) is new to our knowledge, we are now awareof any implementation of a similar problem. The nearestproblem to the MLBP seems to be BPP.
It seems that Luo et al. [34] used the fitness function asgiven below (termed cost function) [37] for their group-basedencoding scheme:
fBPP =1
Nu∙
Nu∑
i=1
(fill ic
)k(12)
with Nu being the number of bins used, fill i the sum of sizes ofthe objects in the bin i, c the bin capacity, and k a constant, k >1. In other words, the cost function to maximize is the averageover all bins used, of the k-th power of the bin’s utilizationof it’s capacity. The authors state that experiments show thatk = 2 gives good results. As Falkenauer and Delchambre [37]point out that one of the major purpose of the fitness functionis to guide the algorithm in the search.
Although, both BPP and MLBP yield a reduction of thenumber of bins, the fitness function of the algorithms aredifferent. The strategy at BPP is to pack the bins as full aspossible, i.e., a bad use of the capacity of the bins leads tothe necessity of supplementary bins [37]. On the contrary, thesuggestion for the fitness function for MLBP is given by theneed to fulfill the constraints.
By comparing the formula (2) for the fitness function ofMLBP with the formula (12) as above, it is obvious that bothformulas are very similar, both are expected to be maximized,contain summation over parameters of the respective prob-lems and the possibility to optimize the execution time ofthe respective algorithms through clever setting of constants.In this respect, both MLBP and BPP substantially benefitfrom an ingeniously designed fitness function to ensure fastconvergence towards the optimization goals [37].
Although, in concept MLBP is merely a constraint satisfac-tion problem, the implementation as described in this article,can be easily adapted to simulate an optimization problem.Within the current algorithm, the number of required binsis fixed. This assumption is perfectly reasonable from anindustrial perspective, since the number of the objects in thebins is more or less the same and as the number of objectsneeded for a work order is known, the minimal number ofbins necessary to fulfill the work order is thus determined.Besides, the maximum number of bins that can be accessedby a machine is fixed, less beans means just a vacant workingplace. However, by setting the bin constraints to a lower value,– while keeping the other constraints unchanged – and bymodifying the exit criteria accordingly, the algorithm will loop– delivering better solutions according to the guidelines of thefitness function – until the new exit criteria are met. Thus, alocal extremum relating to the fitness function is found. Thelocal extremum is not automatically a solution to the constraintsatisfaction problem, this has to be validated. The exit criteriaonly ensure that the best local value of the fitness function andcorresponding physical entities are found. In this respect, theMLBP and BPP are closely related problems.
There are other systems, which provide frameworks of evo-lutionary algorithms, such as EvA2, OPT4j, ECJ, MOEAT, fora discussion and bibliography see [37]. Moreover, a remarkableattempt to obtain a deeper understanding of the structure of theBPP by using Principal Component Analysis and repercussionson the performance of the heuristic approaches to solve them,was undertaken [38].
The aim of jMetal was to set up a Java-based frameworkin order to develop meta heuristics for solving Multi-ObjectiveOptimization Problems (MOOP). jMetal provides a rich setof Java classes as base components, which can be reusedfor the implementation of generic operators, thus making acomparison of different meta heuristics possible [39] [40].
Unfortunately, the Apache Commons Mathematics Librarydeployed in our use case, does not support multi-objectiveoptimization mechanisms. This means especially, that multi-objective optimization have to be simulated by single-objectiveoptimization. For example, optimization criteria for MLBPare a) reducing the number of bins, b) fulfillment of themeasurement constraints, c) fulfillment of the attribute con-straints. These criteria are independent of each other andideally within the multi-objective optimization they can be op-timized independently, such that an improvement of a criteriondoes not lead to a degradation of another one. For practicalpurposes, the fitness function, see formula (2), can be used forsimulating multi-objective optimization by choosing adequateweight function. Thus, by choosing the values w = 5 for thecriterion (a), w = 2 for criterion (b) and w = 1 for criterion (c)we achieve fast convergence and hence reduced execution time,but for example by improving criterion (a) we cannot avoid thedegradation of criterion (b) or (c). By using frameworks whichsupport multi-objective mechanism, better convergence of thegenetic algorithm is expected.
The jMetal project was started in 2006 [39] and since thenit underwent significant improvements and major releases [41],such that the redesigned jMetal should be useful to researchersof the multi-objective optimization community, such as evo-lutionary algorithm, evolution strategies, scatter search, par-
173
International Journal on Advances in Software, vol 13 no 3 & 4, year 2020, http://www.iariajournals.org/software/
2020, © Copyright by authors, Published under agreement with IARIA - www.iaria.org

ticle swarm optimization, ant colony optimization, etc., [42].Improvements regarding a new package for automatic tuningof algorithm parameter settings have been introduced [43] inorder to facilitate accurate Pareto front approximations.
In addition, jMetal in conjunction with Spark – which isbecoming a dominant technology in the Big Data context –have been used to solve Big Data Optimization problems bysetting up a software platform. Accordingly, a dynamic bi-objective instance of the Traveling Salesman Problem basedon near real-time traffic data from New York City has beensolved [44] [45].
VI. PURSUING CONSIDERATIONS ON METAHEURISTICS:AN EXCERPT
This section is a logical continuation of the last twopreceding sections, it extents the approach of the use casein Section IV by considering the jMetal framework presentedin Section V as the natural and fruitful terrain for furtherenhancement and advanced development.
A. General Considerations
We definitely do not intend to analyze in depth the Apacheframework versus the jMetal framework; we restrict our anal-ysis to the algorithm used in Section IV, which is ported to thejMetal framework. The comparison and test results should beinterpreted accordingly, i.e., some other use case could lead todifferent conclusions. Moreover, the Apache and the jMetalframeworks are templates, which the developers can freelymodify according to their needs, hence minor modifications inthe templates could lead to unexpected major improvements.
1 // gGA.java2 //3 // Author:4 // Antonio J. Nebro <[email protected]>5 // Juan J. Durillo <[email protected]>6 //7 // Copyright (c) 2011 Antonio J. Nebro, Juan J. Durillo8 ...9 package jmetal.metaheuristics.singleObjective.
geneticAlgorithm;10 ...11 while (evaluations < maxEvaluations) {12 ...13 // Copy the best two individuals to the offspring
population14 offspringPopulation.add(new Solution(population.get
(0))) ;15 offspringPopulation.add(new Solution(population.get
(1))) ;16 // Reproductive cycle17 ...18 // Crossover; Mutation; Evaluation of the new
individuals; Replacement: the two newindividuals are inserted in the offspringpopulation
19 ...20 // The offspring population becomes the new current
population21 ...22 } // while23 ...
Listing 1: Copy only the two best individuals to the offspringpopulation.
The main objectives of this section are:
a) compare the multi bjective, jMetal framework basedgenetic algorithm versus the single-objective genetic,
Apache framework based algorithm presented in Sec-tion IV,
b) compare the jMetal framework based genetic algorithmwith other heuristic algorithms,
c) record the performance behavior of the investigatedalgorithms,
d) determine pros and cons of the Apache frameworkversus the jMetal framework and the different heuristicalgorithms.
Unfortunately, the Apache framework does not supportmulti-objective optimization, hence in order to get around it,we switch to the jMetal framework, which has been delib-erately developed to allow such comparisons. The best wayto get directly familiar with jMetal or Apache in addition tostudying the scientific literature [34] [35], [39]–[45] , is toread coding [46] [47].
Validation is the methodology to investigate whether in-dividual bricks (ICs) or set of bricks satisfy the specifiedconstraints. The validation fields – i.e., the structure that holdsthe information necessary to perform the decision regardingthe creation of the next generation – is used both in theApache and the jMetal framework based implementation of thegenetic algorithm. The validation results are calculated duringthe validation process, i.e., during the process where it ischecked whether the individual bricks or set of bricks fulfill thegiven constraints. This way, the overall quality of an individualduring the reproduction process can be very well determined.As soon as the validation fields are fully filled, the informationin this structure can be used to calculate the fitness value ofthe individuals and subsequently, it can be used to determinethe unsuitable bricks and exchange them during the crossoverand mutation process. As already presented, the fitness valuecontains the final score of an individual during the validationprocess, in other words, it represents the degree to which theindividual is more closely to fulfill the specification of the workorder. For example, if a brick breaks one of the constraintsregarding the attribute values, it has to be removed during themutation process, since the attributes are specific properties ofeach brick and unlike the measurement constraints, they arenot influenced by the other bricks assigned to an individual.
1 // GeneticAlgorithm.java2 // Licensed to the Apache Software Foundation (ASF) under
one or more contributor license agreements.3 ...4 package org.apache.commons.math3.genetics;5 ...6 //Implementation of a genetic algorithm. All factors that
govern the operation of the algorithm can be cond fora specific problem.
7 ...8 public class GeneticAlgorithm {9 ...
10 //Evolve the given population. Evolution stops when thestopping condition is satisfied.
11 ...12 while (!condition.isSatisfied(current)) {13 current = nextGeneration(current);14 generationsEvolved++;15 }16 ...17 }
Listing 2: Apache Commons Math. Stopping Condition
174
International Journal on Advances in Software, vol 13 no 3 & 4, year 2020, http://www.iariajournals.org/software/
2020, © Copyright by authors, Published under agreement with IARIA - www.iaria.org

Summing up, the validation results of an individual con-tain in addition to the information regarding the final score,also details regarding the genes (bricks) which violate theconstraints. This latter kind of information is necessary forfurther processing. Normally, the validation results of theparents should be determined before the mutation step isperformed. In the Apache framework a pair of two individualsis provided and the crossover and mutation operations areperformed directly on them. Unfortunately, this is not the casefor the jMetal framework, it does not provides pairing, justindividuals. As a consequence, since the validation fields arenot part of the original framework, the validation results arenot properly calculated and some – but not necessary all –of the mutations cannot be performed and are skipped. Inorder to overcome this anomaly, we modified the originalimplementation of the mutation procedure used in the Apachecontext, by adding an additional validation in order ensurethat before mutation is performed, the parents dispose of theappropriate validation results.
Unfortunately, jMetal has only one predefined stoppingcondition, i.e., the algorithm can stop only if the numberof evaluations, i.e., in our case the number of generationssurpasses some threshold – i.e., maxEvaluations – compareListing 1, line 11. In contrast, the Apache framework allowsadditional to the condition above, multiple and flexible stop-ping conditions:
a) exit after some predefined time,
b) exit if the envisaged result has been found, etc., seeListing 2, line 12 for an example,
c) exit according to any user defined conditions, due tothe flexibility of the Apache environment.
1 // ElitisticListPopulation.java2 // Licensed to the Apache Software Foundation (ASF) under
one or more contributor license agreements.3 ...4 package org.apache.commons.math3.genetics;5 ...6 //Population of chromosomes which uses elitism (certain
percentage of the best chromosomes is directly copiedto the next generation).
7 ...8 public class ElitisticListPopulation extends
ListPopulation {9 // percentage of chromosomes copied to the next
generation10 private double elitismRate =10.0;11 ...12 // Creates a new ElitisticListPopulation instance.13 ...14 // Start the population for the next generation.15 ...16 public Population nextGeneration() {17 // initialize a new generation with the same
parameters18 ...19 // index of the last "not good enough" chromosome20 for (int i=boundIndex; i<oldChromosomes.size(); i
++) {21 nextGeneration.addChromosome(oldChromosomes.
get(i));22 }23 ...24 }
Listing 3: Apache Commons Math. Elitism Rate
The jMetal framework also uses a predefined type ofpopulation, characterized by the elitism rate, which specifies
the percentage of individuals with the highest fitness value tobe taken over unmodified to the new generation. This way, thegenetic algorithm will put directly some of his best solutionsunmodified to the next generation. This strategy has been suc-cessfully used with the Apache framework to optimize the runtime of the genetic algorithm. Unfortunately, the elitism rate ishard coded and cannot be configured in the jMetal framework.Only the two best solutions are forwarded unmodified to thenext generation, compare Listing 1, line 17,18. This means byconsidering our population size of 500 individuals, an elitismrate of 0.4%. We obtained best performance results within theApache framework with this rate set to 10 in the benchmarks ofSection IV, see Listing 3. In contrast to the jMetal framework,where it is not possible to create or define a new populationtype, the Apache framework can use a lot of other populationtypes apart from the class ElitisticListPopulation, for examplepopulation types based on random selection of the individualsor based on keeping diversity selection. These new populationtypes can be set up either by the user itself, or the developmentteam of the Apache framework. Of course, random selectioncan be a promising approach, since some of the best genescan be hidden in bad individuals and those individuals mightevolve later. The strategy to diversify means especially, thatno similar individuals will be directly selected for the nextgeneration. Obviously, the concept of similarity has to bespecified accordingly, for example, by trying to have as muchbins involved in the generation of the initial population, weavoid to have a restricted set of bins in the initial populationthat has no solution at all.
As mentioned above, the jMetal framework is less flexiblethan the Apache framework, i.e., the possibility to configurethe jMetal framework is less pronounced. Hence, we cannotcompare the performance of those frameworks directly, insteadwe are obliged to switch to those less efficient configurationparameters that work for both frameworks in order to beable to compare similar runs. We intend to do performancebenchmarks as follows:
a) Apache versus jMetal (Apache and jMetal best per-forming configuration);
b) Apache versus jMetal (Apache and jMetal same con-figuration);
c) jMetal single objective genetic algorithm versus jMetalmulti-objective genetic algorithm;
d) jMetal genetic algorithm versus jMetal other heuristicalgorithms.
B. Used Methods and Strategies
Evolutionary algorithms such as the Non-dominated Sort-ing Genetic Algorithm-II (NSGA-II) [28], [43], [48] andStrength Pareto Evolutionary Algorithm 2 (SPEA-2) [49], [50]have become standard approaches, although some approachesbased on Particle Swarm Optimization (PSO) [51], simulatedannealing, and Scatter Search (SS) [52] are best known.Durillo [39] gives a very good overview of jMetal, describ-ing some of the evolutionary algorithms implemented, forexample NSGA-II, SPEA-2, Pareto Archived Evolution Strat-egy (PAES), Optimal multi-objective Optimization based onParticle Swarm Optimization (OMOPSO) [53], Archive based
175
International Journal on Advances in Software, vol 13 no 3 & 4, year 2020, http://www.iariajournals.org/software/
2020, © Copyright by authors, Published under agreement with IARIA - www.iaria.org

hYbrid Scatter Search (AbYSS), etc. The PSO algorithm hasbeen used successfully not only for continuous optimizationproblems, but also to a combinatorial optimization of a realuniversity course timetabling problem [54], see [55] for a morerecent study regarding non-continuous search spaces.
Besides jMetal there are further frameworks for meta-heuristic optimization, for example Opt4J [56]. This frame-work is modular, i.e., it supports the optimization of complexoptimization tasks by allowing its decomposition into subtasksthat may be designed and developed separately. Additionaloptimization frameworks, java-based and non-java-based arelisted on the SourceForge site [57], where also the latestrelease can be found. Additionally, a framework that worksas a top-level layer over generic optimization frameworks thatimplement a high number of metaheuristics proposed in thetechnical literature, such as jMetal and Opt4J is presentedin [58]. JECoLi, another novel Java-based library for theimplementation of metaheuristic optimization algorithms witha focus on Genetic and Evolutionary Computation basedmethods is introduced [59].
0%
10%
20%
30%
40%
50%
60%
70%
80%
90%
100%
1 2 3 4 5 6 7 8 9 10 11 12 13 14 15 16 17
Succ
ess
rat
e
Number of modules
ER0 ER0.4% ER1% ER2% ER3% ER4% ER5% ER6% ER7%
Figure 20: Success rate depending on the elitism rate.
0%
6%
12%
68%71%74%77%80%83%86%89%92%95%98%
20%
25%
30%
35%
40%
45%
50%
55%
60%
65%
70%
75%
Mutation rate
Succe
ss rate
Crossover rate
68%-71% 71%-74% 74%-77% 77%-80% 80%-83%
83%-86% 86%-89% 89%-92% 92%-95% 95%-98%
Figure 21: jMetal single-objective optimization: Success ratedepending on the crossover rate and the elitism rate.
C. Performance Results
This subsection is aligned with Subsection IV-C as faras the testing strategy is concerned, such that performance
and accuracy comparison are possible. Accordingly, the testscenarios in this subsection are similar to those in Figure 15,Figure 16, Figure 17, Figure 18 as done for the ApacheFramework. The configuration parameter for the test settingsare as in Table I.
1) jMetal Single-Objective Genetic Algorithm: Actually,the naive expectation regarding the similitude between theperformance behavior of the Apache Framework and thesingle-objective optimization part of the jMetal Frameworkhas not been met. Furthermore, for the Apache Framework,the elitism rate is not so sensitive regarding the fluctuation ofthe success rate, whereas for the jMetal Framework this is truefor the mutation rate.
0%
10%
20%
30%
40%
50%
60%
70%
80%
90%
100%
0
20.000
40.000
60.000
80.000
100.000
120.000
140.000
160.000
180.000
200.000
1 2 3 4 5 6 7 8 9 10 11 12 13 14 15 16 17
Succe
ss rate
Tim
e u
sed
(m
s)
Number of module With preselection, Time used Without preselection, Time used
With preselection, Success rate Without preselection, Success rate
Figure 22: jMetal single-objective optimization: Success rate andtime used depending on the number of modules with and without
pre-selection.
0%
10%
20%
30%
40%
50%
60%
70%
80%
90%
100%
0
3.500
7.000
10.500
14.000
17.500
21.000
24.500
28.000
31.500
35.000
1 2 3 4 5 6 7 8 9 10 11 12 13 14 15 16 17
Succe
ss rate
Tim
e u
sed
(m
s)
Number of modules Bin reduction, Time used Random recombination, Time used
Bin reduction, Success rate Random recombination, Success rate
Figure 23: jMetal single-objective optimization: Success rate andtime used when selecting the random recombination crossover
policy or the bins reduction policy.
Figure 22 corresponds to Figure 15 and Figure 23 cor-responds to Figure 16 respectively, generated for geneticalgorithm using the Apache Framework. For a detailed back-ground description see the corresponding explanation in Sub-section IV-C. Figure 24 corresponds to Figure 17 and Figure 25corresponds to Figure 18 respectively, generated for geneticalgorithm using the Apache Framework.
176
International Journal on Advances in Software, vol 13 no 3 & 4, year 2020, http://www.iariajournals.org/software/
2020, © Copyright by authors, Published under agreement with IARIA - www.iaria.org

1%
11%
6.00010.00014.00018.00022.00026.00030.00034.00038.00042.00046.000
25%30%35%40%45%50%55%
60%
65%
70%
75%
80%
Mutation rate
Time
use
d (m
s)
Crossover rate
6.000-10.000 10.000-14.000 14.000-18.000 18.000-22.000
22.000-26.000 26.000-30.000 30.000-34.000 34.000-38.000
Figure 24: jMetal single-objective optimization: Time useddepending on the crossover rate and the mutation rate.
11%
21%
2%7%12%17%22%27%32%37%42%47%52%
20%
25%
30%
35%
40%
45%
50%
55%
60%
65%
70%
75%
Mutation rate
Succe
ss rate
Crossover rate
2%-7% 7%-12% 12%-17% 17%-22% 22%-27%
27%-32% 32%-37% 37%-42% 42%-47% 47%-52%
Figure 25: jMetal single-objective optimization: Success ratedepending on the crossover rate and the mutation rate.
0%
10%
20%
30%
40%
50%
60%
70%
80%
90%
100%
0
27,000
54,000
81,000
108,000
135,000
162,000
189,000
216,000
243,000
270,000
1 2 3 4 5 6 7 8 9 10 11 12 13 14 15 16 17
Success rate
Tim
e us
ed (m
s)
Number of modulesWith preselection, Time used Without preselection, Time usedWith preselection, Succsee rate Without preselection, Succsee rate
Figure 26: jMetal multi-objective optimization using NSGA-II :Success rate and time used depending on the number of modules
with and without pre-selection.
Unexpectedly, the elitism rate has a major influence onthe success rate, even for lower values, see Figure 20 for
a test scenario with the elitism rate ∈ [0%, 7%]. The otherconfiguration parameters for the performance tests are givenin Table I. The optimal value for the elitism rate is around %7,unfortunately the elitism rate is not configurable in the officialrelease of jMetal. As already mentioned, to circumvent thisshortcoming, we have adapted the original open source codeaccordingly. As is Figure 21, increasing the elitism rate doesnot improve the success rate, moreover an appropriate tuple ofcrossover rate and elitism rate seems to be the most effective.
For a detailed description of the corresponding perfor-mance results, see the explanation in Subsection IV-C. A lowcrossover rate and low elitism rate gives the success rate at over95%. Increased crossover rates and increase elitism rates alsodeliver success rates at over 90%. Unfortunately, high successrates also deteriorates considerably its run time aspects.
0%
10%
20%
30%
40%
50%
60%
70%
80%
90%
100%
0
1,500
3,000
4,500
6,000
7,500
9,000
10,500
12,000
13,500
15,000
1 2 3 4 5 6 7 8 9 10 11 12 13 14 15 16 17
Success rate
Tim
e us
ed (m
s)
Number of modulesBin reduction, Time used Random recombination, Time usedBin reduction, Success rate Random recombination, Success rate
Figure 27: jMetal multi-objective optimization using NSGA-II :Success rate and time used when selecting the random
recombination crossover policy or the bins reduction policy.
1%
11%
04.0008.00012.00016.00020.00024.00028.00032.00036.00040.000
25%30%35%40%45%50%55%
60%
65%
70%
75%
80%
Mutation rate
Time
use
d (m
s)
Crossover rate
0-4.000 4.000-8.000 8.000-12.000 12.000-16.000
16.000-20.000 20.000-24.000 24.000-28.000 28.000-32.000
Figure 28: jMetal multi-objective optimization using NSGA-II :Time used depending on the crossover rate and the mutation rate.
2) jMetal multi-objective Genetic Algorithm: Unfortu-nately, NSGA-II does not use the concept of elitism rate toselect offsprings, it uses Pareto front and distance instead.Hence we cannot compare directly the similar tests for single-objective optimization based on crossover rate and elitism rate,see Figure
177
International Journal on Advances in Software, vol 13 no 3 & 4, year 2020, http://www.iariajournals.org/software/
2020, © Copyright by authors, Published under agreement with IARIA - www.iaria.org

11%
21%
0%3%6%10%13%16%19%22%26%29%32%
20%
25%
30%
35%
40%
45%
50%
55%
60%
65%
70%
75%
Mutation rate
Succe
ss rate
Crossover rate
0%-3% 3%-6% 6%-10% 10%-13% 13%-16%
16%-19% 19%-22% 22%-26% 26%-29% 29%-32%
Figure 29: jMetal multi-objective optimization using NSGA-II :Success rate depending on the crossover rate and the mutation rate.
Figure 26 corresponds to Figure 15 and Figure 27 cor-responds to Figure 16 respectively, generated for geneticalgorithm using the Apache Framework. For a detailed back-ground description see the corresponding explanation in Sub-section IV-C. Figure 28 corresponds to the Figure 17 andFigure 29 corresponds to Figure 18 respectively, generated forthe genetic algorithm using the Apache Framework.
3) Other evolutionary algorithms: To conclude, we exam-ine the scatter search template adapted to a hybrid - singleobjective optimization to the multi-objective domain - calledArchive-Based hYbrid Scatter Search (AbYSS) [60]–[63].AbYSS follows the scatter search structure, but uses muta-tion and crossover operators from evolutionary algorithms. Itincorporates typical concepts from the multi-objective field,such as Pareto dominance, etc.
0%
10%
20%
30%
40%
50%
60%
70%
80%
90%
100%
0
25,000
50,000
75,000
100,000
125,000
150,000
175,000
200,000
225,000
250,000
275,000
300,000
325,000
1 2 3 4 5 6 7 8 9 10 11 12 13 14 15
Succe
ss rate
Tim
e u
sed
(m
s)
Number of modulesBin reduction, Time used Random recombination, Time used
Bin reduction, Success rate Random recombination, Success rate
Figure 30: jMetal AbYSS hybrid optimization : Success rate andtime used when selecting the random recombination crossover
policy or the bins reduction policy.
We generate appropriate tests – as represented in Figure 30,see Figure 16 for the Apache counterpart – concerning thesuccess rate and time used by using the random recombination
crossover policy and the bins reduction policy respectively.According to [61] the results of their tests show that AbYSSnot only reaches very accurate solutions, but also it scales wellwith increasingly sized instances. Unfortunately, the perfor-mance and accuracy of our tests is lower than expected, suchthat the AbYSS algorithm finds no more than 15 modules,whereas the number of possible solution is 17, see Figure 30for the Apache Framework genetic algorithm counterpart. Wecease further testing.
4) Final conclusions: Summing up, low crossover andlow elitism rates or high crossover and high elitism ratesdeliver good results for the success rate. On the contrary,high success rates are always achieved with high timed usedrates. The success rate is not very sensitive regarding themutation rates as long as they are low or moderate. Satisfactoryresults have been achieved with elitism rates exceeding 3%.It seems that the higher success rate in the single-objectiveoptimization case is due to a very well balanced fitnessfunction, whereas if no time for performance improvementtests, the multi-objective path delivers satisfactory results withlower implementation effort. The run time performance of ourapplication implemented using the Apache Framework geneticalgorithm is order of magnitudes better than the correspondingimplementation based on the jMetal Framework.
VII. CONCLUSION AND FUTURE WORK
The main challenge, which led to the results of this paper,was to investigate whether a real-life combinatorial problem,which popped up at a semiconductor company, can be solvedwithin a reasonable time. Moreover, the solution should beflexible, such that the solution is not restricted to the existingspecification of the modules.
We established an abstract formal model, such that theimplementation of the use case is fully functional within theboundaries of this model. In this sense, new constraints canbe added to the existing ones, no inside knowledge regardingthe structure of the module is needed, as it is the case for theheuristic algorithm in place.
We set up a genetic algorithmic approach based on theApache Commons Mathematics Library, implemented it andvalidated the results. Some decisive policies like the crossoverand mutation policy have been additionally implemented andnew optimizations like the bin reduction crossover policyhave been set up to improve the convergence of the geneticalgorithm. The performance results were satisfactory for anindustrial application.
The current implementation does not combine good genes(taking into account all the constraints, like measurement,etc.) of the parents. Instead, the crossover strategy is basedon random decisions. Additional research is necessary in thisdirection to find a good balance between a more generalsuitability (random decisions) and good convergence (adjustedcrossover policy). For the time being, only the fitness func-tion contains proprietary information regarding the productionprocess, any other decision is aleatoric.
However, improvements such as the bin reduction crossoverpolicy and improvement of the bin preserving mutation policybased on internal knowledge have in most cases advanta-geous effects on the selection algorithm. Unfortunately, the
178
International Journal on Advances in Software, vol 13 no 3 & 4, year 2020, http://www.iariajournals.org/software/
2020, © Copyright by authors, Published under agreement with IARIA - www.iaria.org

advantages of these improvements, like run time reduction andimproved accuracy, are achieved by less flexibility. Wheneverthe external circumstances change, the corresponding policieshave to be adapted accordingly.
The implemented basic framework is very flexible, it hasmany configuration possibilities like the elitism rate and thearity. As a consequence of the random variables, many conver-gence tests with various configuration assignment have to beperformed, in order to ensure satisfying results. Furthermore,of crucial importance for the successful completion of thealgorithm is the design of the fitness function, especially thevalues of the weights.
The convergence tests show that not every execution willsucceed to find the best solution delivered, this is due tothe random numbers used through out the genetic algorithm.This is exemplified by the success rate. Thus, the selectionalgorithm based on genetic strategies always delivers localmaxima, which may substantially differ from the global one.Our attempt to find the optimal solution using MATLAB fora reduced set of ICs failed due to the long execution time.
As already mentioned, the fitness function plays an out-standing role during the selection of the best candidates forthe next generation. This means especially, that two candidateshaving the same value or fitness function are considered ofthe same quality. This assertion is not accurate enough, due tothe use of three different weights, whose interdependence canhardly be anticipated. Each weight represents the significanceof one aspect of the quality of a candidate. To circumventthis dilemma, Pareto optimality [29] can be used to solve thechallenge of the multi-objective function. In this case, a newframework [39] is needed, since Apache Commons Mathe-matics Library does not support multi-objective mechanism.Genetic algorithms, if configured properly, can be used to solveour constraint satisfaction problem. The delivered solution maysubstantially differ from the optimal one.
The current problem is not defined as an optimizationproblem, the constraints of a work order are either satisfiedor not. Accordingly, two different solutions of the same workorder, which satisfy the constraints, are of the same quality.However, the genetic algorithm is based internally on anoptimization process – the higher the value of the fitnessfunction, the better the solution. The constraints are usedas exit criterion for the genetic algorithm. In this way, theoptimization is stopped arbitrarily, considering that a bettersolution is out of scope.
Moreover, during the production process multiple workorders have to be honored simultaneously. The current strategyat the semiconductor company adopted a sequential one. Wecan reformulate the problem as an optimization problem: Givena list of work orders, find the maximum number of work ordersthat can be satisfied simultaneously.
The elapsed time till the genetic algorithm of MLBPconverges is in range of seconds, by all means satisfactoryfor the investigated industrial application. As expected, not allthe execution threads converge to the same solution, and not allthe threads find an optimal solution, as shown in some casesless than 60 percent. Therefore, starting a bunch of threadswithin the genetic algorithm increases the chance towardsbetter solutions.
To summarize, regarding the configuration possibilities, thejMetal framework is less flexible than the Apache framework,i.e., the Apache framework allows much more alternatives forsettings, in contrast in order to achieve greater adjustabilityin the jMetal framework, the source code has to be adaptedaccordingly. The jMetal framework predefines a lot of heuristicalgorithms, but they have to be refined and improved in orderto reach the profoundness of the Apache framework.
ACKNOWLEDGMENT
We acknowledge the assistance and helpful comments ofthe anonymous referees.
REFERENCES
[1] M. Zinner, K. Feldhoff, R. Song, A. Gellrich, and W. E. Nagel, “TheMatching Lego(R)-Like Bricks Problem: Including a Use Case Study inthe Manufacturing Industry,” ICSEA 2019, The Fourteenth InternationalConference on Software Engineering Advances, 2019, pp. 130–140,Retrieved: December 2020. [Online]. Available: http://www.thinkmind.org/index.php?view=article&articleid=icsea_2019_6_10_10107
[2] B. Korte and J. Vygen, Combinatorial Optimization: Theory and Algo-rithms, ser. Algorithms and Combinatorics. Springer Berlin Heidelberg,2018.
[3] P. M. Pardalos, D.-Z. Du, and R. L. Graham, Handbook of Combina-torial Optimization. Springer, 2013.
[4] J. Puchinger and G. Raidl, “Combining Metaheuristics and Exact Al-gorithms in Combinatorial Optimization: A Survey and Classification,”Lecture Notes in Computer Science, vol. 3562, 06 2005, pp. 41–53,doi: 10.1007/11499305_5.
[5] Krzysztof Apt, Principles of Constraint Programming. CambridgeUniversity Press, 2003, Retrieved: December 2020. [Online]. Available:https://doi.org/10.1017/CBO9780511615320
[6] A. L. Corcoran, Using LibGA to Develop Genetic Algorithms forSolving Combinatorial Optimization Problems. The ApplicationHandbook of Genetic Algorithms, Volume I, Lance Chambers, editor,pages 143-172 CRC Press, 1995.
[7] E. Andrés-Pérez et al., Evolutionary and Deterministic Methods forDesign Optimization and Control With Applications to Industrial andSocietal Problems. Springer, 2018, vol. 49.
[8] D. Greiner et al., Advances in Evolutionary and Deterministic Methodsfor Design, Optimization and Control in Engineering and Sciences.Springer, 2015, vol. 1, no. 1.
[9] D. Simon, Evolutionary Optimization Algorithms. John Wiley & Sons,2013.
[10] A. Pétrowski and S. Ben-Hamida, Evolutionary Algorithms. JohnWiley & Sons, 2017.
[11] O. Kramer, Genetic Algorithm Essentials. Springer, 2017, vol. 679.
[12] T. Bäck, D. B. Fogel, and Z. Michalewicz, Evolutionary Computation1: Basic Algorithms and Operators. CRC press, 2018.
[13] R. K. Belew, Adaptive Individuals in Evolving Populations: Models andAlgorithms. Routledge, 2018.
[14] T. Bäck, D. B. Fogel, and Z. Michalewicz, Evolutionary Computation2 : Advanced Algorithms and Operators. CRC Press, 2000, Textbook- 308 Pages.
[15] K. Hussain, M. N. M. Salleh, S. Cheng, and Y. Shi, “MetaheuristicResearch: a Comprehensive Survey,” Artificial Intelligence Review,2018, pp. 1–43.
[16] T. Jiang and C. Zhang, “Application of Grey Wolf Optimization forSolving Combinatorial Problems: Job Shop and Flexible Job ShopScheduling Cases,” IEEE Access, vol. 6, 2018, pp. 26 231–26 240.
[17] H. Zhang, Y. Liu, and J. Zhou, “Balanced-Evolution Genetic Algorithmfor Combinatorial Optimization Problems: the General Outline and Im-plementation of Balanced-Evolution Strategy Based on Linear DiversityIndex,” Natural Computing, vol. 17, no. 3, 2018, pp. 611–639.
179
International Journal on Advances in Software, vol 13 no 3 & 4, year 2020, http://www.iariajournals.org/software/
2020, © Copyright by authors, Published under agreement with IARIA - www.iaria.org

[18] X. Li, L. Gao, Q. Pan, L. Wan, and K.-M. Chao, “An Effective HybridGenetic Algorithm and Variable Neighborhood Search for IntegratedProcess Planning and Scheduling in a Packaging Machine Workshop,”IEEE Transactions on Systems, Man, and Cybernetics: Systems, 2018.
[19] I. Jackson, J. Tolujevs, and T. Reggelin, “The Combination of Discrete-Event Simulation and Genetic Algorithm for Solving the Stochas-tic Multi-Product Inventory Optimization Problem,” Transport andTelecommunication Journal, vol. 19, no. 3, 2018, pp. 233–243.
[20] J. C. Bansal, P. K. Singh, and N. R. Pal, Evolutionary and SwarmIntelligence Algorithms. Springer, 2019.
[21] G. Raidl, J. Puchinger, and C. Blum, “Metaheuristic hybrids,” Hand-book of Metaheuristics, Vol. 146 of International Series in Opera-tions Research and Management Science, 09 2010, pp. 469–496, doi:10.1007/978-1-4419-1665-5_16.
[22] J. Holland, Adaptation in Natural and Artificial Systems. Universityof Michigan Press, Ann Arbor. 2nd Edition, MIT Press, 1992.
[23] G. P. Rajappa, “Solving Combinatorial Optimization Problems UsingGenetic Algorithms and Ant Colony Optimization,” 2012, PhDdiss., University of Tennessee, Retrieved: December 2020. [Online].Available: https://trace.tennessee.edu/utk_graddiss/1478
[24] S. Yakovlev, O. Kartashov, and O. Pichugina, “Optimization on Com-binatorial Configurations Using Genetic Algorithms,” in CMIS, 2019,pp. 28–40.
[25] T. Weise, “Global Optimization Algorithms – Theory and Application,”2009, Retrieved: December 2020. [Online]. Available: http://www.it-weise.de/projects/book.pdf
[26] H. P. Christos and K. Steiglitz, “Combinatorial Optimization: Algo-rithms and Complexity,” Prentice Hall Inc., 1982.
[27] Rui Song, “Substrate Binning for Semiconductor Manufacturing,” Mas-ter’s thesis, Dresden University of Technology, Faculty of ComputerScience, Institute of Applied Computer Science, Chair of TechnicalInformation Systems, 2013.
[28] K. Deb, A. Pratap, S. Agarwal, and T. Meyarivan, “A Fast and ElitistMultiobjective Genetic Algorithm: NSGA-II,” IEEE transactions onevolutionary computation, vol. 6, no. 2, 2002, pp. 182–197.
[29] J. rey Horn, N. Nafpliotis, and D. E. Goldberg, “A Niched ParetoGenetic Algorithm for Multiobjective Optimization,” in Proceedings ofthe first IEEE conference on evolutionary computation, IEEE worldcongress on computational intelligence, vol. 1. Citeseer, 1994, pp.82–87.
[30] B. L. Miller, D. E. Goldberg et al., “Genetic Algorithms, TournamentSelection, and the Effects of Noise,” Complex systems, vol. 9, no. 3,Champaign, IL, USA: Complex Systems Publications, Inc., 1995, pp.193–212.
[31] R. Poli and W. B. Langdon, “A New Schema Theorem for GeneticProgramming with One-Point Crossover and Point Mutation,” CognitiveScience Research Papers-University of Birmingham CSRP, 1997.
[32] F.-T. Lin, “Evolutionary Computation Part 2: Genetic Algorithms andTheir Three Applications,” Journal of Taiwan Intelligent Technologiesand Applied Statistics, vol. 3, no. 1, 2005, pp. 29–56.
[33] M. Andersen et al., “Commons Math: The Apache Commons Mathe-matics Library,” URL http://commons. apache. org/math/, online, 2011,Retrieved: December 2020.
[34] F. Luo, I. D. Scherson, and J. Fuentes, “A Novel Genetic Algorithm forBin Packing Problem in jMetal,” in 2017 IEEE International Conferenceon Cognitive Computing (ICCC). IEEE, 2017, pp. 17–23.
[35] J. J. Durillo and A. J. Nebro, “jMetal: A Java Framework for Multi-Objective Optimization,” Advances in Engineering Software, vol. 42,no. 10, Elsevier, 2011, pp. 760–771.
[36] K. Fleszar and C. Charalambous, “Average-Weight-Controlled Bin-Oriented Heuristics for the One-Dimensional Bin-Packing Problem,”European Journal of Operational Research, vol. 210, no. 2, Elsevier,2011, pp. 176–184.
[37] E. Falkenauer and A. Delchambre, “A Genetic Algorithm for BinPacking and Line Balancing,” in Proceedings 1992 IEEE InternationalConference on Robotics and Automation. IEEE, 1992, pp. 1186–1192.
[38] E. López-Camacho, H. Terashima-Marín, G. Ochoa, and S. E. Conant-Pablos, “Understanding the Structure of Bin Packing Problems ThroughPrincipal Component Analysis,” International Journal of ProductionEconomics, vol. 145, no. 2, Elsevier, 2013, pp. 488–499.
[39] J. J. Durillo, A. J. Nebro, F. Luna, B. Dorronsoro, and E. Alba, “jMetal:A Java Framework for Developing Multi-Objective Optimization Meta-heuristics,” Departamento de Lenguajes y Ciencias de la Computación,University of Málaga, ETSI Informática, Campus de Teatinos, Tech.Rep. ITI-2006-10, 2006.
[40] A. J. Nebro and J. J. Durillo, “jMetal 4.4 User Manual,”Available from Computer Science Department of the Universityof Malaga, 2013, Retrieved: December 2020. [Online]. Available:http://jmetal.sourceforge.net/resources/jMetalUserManual44.pdf
[41] A. J. Nebro, J. J. Durillo, and M. Vergne, “Redesigning the jMetalMulti-Objective Optimization Framework,” in Proceedings of the Com-panion Publication of the 2015 Annual Conference on Genetic andEvolutionary Computation. ACM, 2015, pp. 1093–1100.
[42] J. J. Durillo, A. J. Nebro, and E. Alba, “The jMetal Frameworkfor Multi-Objective Optimization: Design and Architecture,” in IEEECongress on Evolutionary Computation. IEEE, 2010, pp. 1–8.
[43] A. J. Nebro-Urbaneja et al., “Automatic Configuration of NSGA-II withjMetal and irace,” ACM, 2019.
[44] J. A. Cordero et al., “Dynamic Multi-Objective Optimization withjMetal and Spark: a Case Study,” in International Workshop on MachineLearning, Optimization, and Big Data. Springer, 2016, pp. 106–117.
[45] C. Barba-González, J. García-Nieto, A. J. Nebro, and J. F. A. Montes,“Multi-objective Big Data Optimization with jMetal and Spark,” inEMO, 2017.
[46] Apache Commons Math, “Genetic algorithms,” 2016, Home Page,Retrieved: December 2020. [Online]. Available: https://commons.apache.org/proper/commons-math/userguide/genetics.html
[47] SOURCEFORGE, “jmetal,” 2017, Home Page, Retrieved: December2020. [Online]. Available: https://sourceforge.net/projects/jmetal/
[48] A. J. Nebro, J. J. Durillo, C. A. C. Coello, F. Luna, and E. Alba,“A Study of Convergence Speed in Multi-Objective Metaheuristics,”in International Conference on Parallel Problem Solving from Nature.Springer, 2008, pp. 763–772.
[49] Z. Jalali, E. Noorzai, and S. Heidari, “Design and Optimization of Formand Façade of an Office Building Using the Genetic Algorithm,” Scienceand Technology for the Built Environment, vol. 26, no. 2, 2020, pp.128–140.
[50] I. Miri, M. H. Fotros, and A. Miri, “Comparison of Portfolio Optimiza-tion for Investors at Different Levels of Investors’ Risk Aversion inTehran Stock Exchange with Meta-Heuristic Algorithms,” Advances inMathematical Finance and Applications, vol. 5, no. 1, 2020, pp. 1–12.
[51] T. Hendtlass, “The Particle Swarm Algorithm,” in Computational Intel-ligence: A Compendium. Springer, 2008, pp. 1029–1062.
[52] R. Ba C. Gil, J. Reca, and J. Martz, “Implementation of Scatter Searchfor Multi-Objective Optimization: A Comparative Study,” Computa-tional Optimization and Applications, vol. 42, 04 2009, pp. 421–441.
[53] M. R. Sierra and C. A. C. Coello, “Improving PSO-based Multi-Objective Optimization Using Crowding, Mutation and?-Dominance,”in International conference on evolutionary multi-criterion optimization.Springer, 2005, pp. 505–519.
[54] O. Brodersen and M. Schumann, “Einsatz der Particle Swarm Optimiza-tion zur Optimierung universitärer Stundenpläne,” Techn. Rep, vol. 5,2007.
[55] V. Santucci, M. Baioletti, and A. Milani, “Tackling Permutation-BasedOptimization Problems with an Algebraic Particle Swarm OptimizationAlgorithm,” Fundamenta Informaticae, vol. 167, no. 1-2, 2019, pp. 133–158.
[56] Lukasiewycz, Martin and Glaß, Michael and Reimann, Felix and Teich,Jürgen, “Opt4J: A Modular Framework for Meta-Heuristic Optimiza-tion,” in Proceedings of the 13th annual conference on Genetic andevolutionary computation, 2011, pp. 1723–1730.
[57] SOURCEFORGE, “Opt4j,” 2017, Home Page, Retrieved: December2020. [Online]. Available: http://opt4j.sourceforge.net/
[58] A. D. S. Grande, R. D. F. Rodrigues, and A. C. Dias-Neto, “AFramework to Support the Selection of Software Technologies bySearch-Based Strategy,” in 2014 IEEE 26th International Conferenceon Tools with Artificial Intelligence. IEEE, 2014, pp. 979–983.
[59] P. Evangelista, P. Maia, and M. Rocha, “Implementing MetaheuristicOptimization Algorithms with JECoLi,” in 2009 Ninth International
180
International Journal on Advances in Software, vol 13 no 3 & 4, year 2020, http://www.iariajournals.org/software/
2020, © Copyright by authors, Published under agreement with IARIA - www.iaria.org

Conference on Intelligent Systems Design and Applications, 2009, pp.505–510.
[60] A. J. Nebro et al., “AbYSS: Adapting Scatter Search to Multiobjec-tive Optimization,” IEEE Transactions on Evolutionary Computation,vol. 12, no. 4, 2008, pp. 439–457.
[61] F. Luna, J. J. Durillo, A. J. Nebro, and E. Alba, “A Scatter SearchApproach for Solving the Automatic Cell Planning Problem,” in Large-Scale Scientific Computing, I. Lirkov, S. Margenov, and J. Wasniewski,Eds. Berlin, Heidelberg: Springer Berlin Heidelberg, 2010, pp. 334–342.
[62] A. J. Nebro, “package org.uma.jmetal.algorithm.multiobjective.abyss,”GitHub, Retrieved: December 2020. [Online]. Available:https://github.com/jMetal/jMetal/blob/master/jmetal-algorithm/src/main/java/org/uma/jmetal/algorithm/multiobjective/abyss/ABYSS.java
[63] F. Bourennani, Leadership-Based Multi-Objective Optimizationwith Applications in Energy Systems. University of OntarioInstitute of Technology (Canada), 2013, Retrieved: December 2020.[Online]. Available: https://ir.library.dc-uoit.ca/bitstream/10155/396/1/Bourennani_Farid.pdf
181
International Journal on Advances in Software, vol 13 no 3 & 4, year 2020, http://www.iariajournals.org/software/
2020, © Copyright by authors, Published under agreement with IARIA - www.iaria.org

182
International Journal on Advances in Software, vol 13 no 3 & 4, year 2020, http://www.iariajournals.org/software/
2020, © Copyright by authors, Published under agreement with IARIA - www.iaria.org
A Large Scale Empirical Evaluation of the Accuracy
of Function Points Estimation Methods
Luigi LavazzaDipartimento di Scienze teoriche e Applicate
Universita degli Studi dell’Insubria21100 Varese, Italy
Email: [email protected] Liu
School of Computer Science and TechnologyHangzhou Dianzi University
Hangzhou, ChinaEmail: [email protected]
Abstract—Functional size measures of software—especially Func-tion Points—are widely used, because they provide an objectivequantification of software size in the early stages of development,as soon as functional requirements have been analyzed anddocumented. Unfortunately, in some conditions, performing thestandard Function Point Analysis process may be too long andexpensive. Moreover, functional measures could be needed beforefunctional requirements have been elicited completely and at therequired detail level. To solve this problem, many methods havebeen invented and are being used to estimate the functional sizebased on incomplete or not fully detailed requirements. Usingthese methods involves a trade-off between ease and timelinesson one side and accuracy on the other side. In fact, estimatesare always affected by some error; knowing the magnitude ofestimation errors that characterize the estimates provided by agiven method is of great importance to practitioners. This paperreports the results of an empirical study devoted to evaluate theaccuracy of estimates provided by Function Points estimationmethods. The results of the study show that some of the evaluatedmethods—including the Early & Quick Function Points, theISBSG average and the NESMA estimated method)—provideestimates that are accurate enough for practical usage, whilesome other methods appear quite inaccurate.
Keywords–Function Points; IFPUG; Function point Analy-sis; Functional Size Measurement; Functional Size Estimation;NESMA Estimated; NESMA Indicative; Early Size Estimation.
I. INTRODUCTION
This paper extends the results provided in a previous pa-per [1], in which we started estimating the accuracy methodsfor estimating functional size measures.
The availability of accurate functional size measures canhelp software companies plan, monitor, estimate developmentcosts, and control software development processes. So, theavailability of accurate functional size measures may providesoftware companies with competitive advantages over othercompanies.
Among the functional size measurement methods that havebeen proposed, Function Point Analysis (FPA) [2] is by far the
most popular. The International Function Points User Group(IFPUG) took charge of maintaining FPA and publishes theofficial Function Point counting manual [3].
In some conditions, performing the standard FPA processmay be too long and expensive. Moreover, standard FPA can beapplied only after the completion of the software requirementselicitation stage, while functional measures could be neededearlier, i.e., before functional requirements have been elicitedcompletely and at the required detail level.
Therefore, many methods were invented and used to provideestimates of functional size measures based on less or coarsergrained information than required by standard FPA.
Among the most widely known and used methods arethe NESMA methods [4], Early&Quick Function Points(EQFP) [5], [6], the Tichenor ILF Model [7], the simplifiedFP (sFP) approach [8], the ISBSG distribution model and theISBSG average weights model, the latter two methods beingbased on the analysis of the ISBSG dataset [9]. Actually, theNESMA methods were adopted by IFPUG as the preferredmethods for early estimation of Function Point size [10](IFPUG renamed the NESMA Estimated method ‘High LevelFPA Method’ and the NESMA Indicative method as ‘IndicativeFPA Method’; nonetheless, in this paper we use the originalNESMA names).
Inevitably, all the early functional size estimation methodsinvolve some estimation error. Hence, project managers need toknow—at least approximately—the magnitude of the potentialerror that affects size estimates.
Not surprisingly, several researchers and practitioners eval-uated the accuracy of the proposed functional size estimationmethods (as described in Section VII). However, most eval-uations were based on academic software projects or smalldatasets, hence most evaluations cannot be considered veryreliable, and they are hardly generalizable. In order to assessthe actual value of the FP estimation methods for industry, itis necessary to perform an experimental evaluation based on alarge dataset collecting measures from industrial settings.

183
International Journal on Advances in Software, vol 13 no 3 & 4, year 2020, http://www.iariajournals.org/software/
2020, © Copyright by authors, Published under agreement with IARIA - www.iaria.org
In this paper, we present the experimental evaluation of theaccuracy of several estimation methods, based on a dataset thatincludes data from 479 software development projects in thefinance and banking domain. The size of the dataset and thereal-life nature of the data make the analysis presented here themost exhaustive and reliable published evaluation of FunctionPoint estimation methods.
This paper extends the results provided in a previous pa-per [1], in which we estimated only the accuracy of NESMAmethods. This paper also replicates a previous empiricalstudy [11], in which we evaluated the accuracy of the sameestimation methods studied in this paper. In [11] we were ableto study only 18 project data, while here we analyze a datasetcollecting measures from 479 software projects. The resultsprovided here are relevant in the following respects:
– We were able to confirm that the ‘NESMA Estimated’method is among the most accurate proposed methods.
– Some methods appear definitely not accurate; moreprecisely, their accuracy appears too low, even for usagein the earliest phases of software development.
– Some methods appear even more accurate than theNESMA method, hence project managers can considerusing these methods, instead of the NESMA Estimated,even though the latter was chosen as the ‘official’estimation methods by IFPUG.
The study described in this paper is of practical relevancebecause of the following reasons:
– One of the main hindrances perceived by softwaredevelopers when applying FPA is that it is relativelydifficult and expensive, and requires specifically trainedand certified measurers. To this end, estimation methodswere proposed not only to make FPA applicable be-fore functional requirement specifications are completeand detailed, but also as an easier—hence quicker andcheaper—alternative to FPA, to be applied even whenrequirements have been fully documented.
– The application of standard functional size measurementdoes not fit in agile development processes, which arebeing adopted by software development organizationsto a continuously increasing degree. On the contrary,estimation methods are simple enough to fit into agiledevelopment processes. Consider for instance that thedata required to estimate Function Points using methodslike the Early & Quick Function Points or the NESMAmethods can be easily derived from the ‘stories’ that areoften used to describe requirements in agile contexts.
– Anticipating the moment when (approximated) func-tional measures become available means that develop-ment effort estimations can be anticipated as well. Thisis often of great importance, e.g., in bidding processes.
The rest of the paper is organized as follows. Section IIbriefly describes FPA. Section III gives a concise introductionto the FP estimation measurement methods studied in thispaper. Section IV describes the empirical study. Section Vproposes some considerations on the outcomes of the empirical
study. Section VI discusses the threats to the validity ofthe study. Section VII illustrates the related work. Finally,Section VIII draws some conclusions and outlines future work.
II. FUNCTION POINT ANALYSIS
This section provides a concise introduction to FPA. Readersare referred to the official documentation [3] for further details.
Function Point Analysis was originally introduced by Al-brecht to measure the size of data-processing systems fromthe end-user’s point of view, with the goal of estimating thedevelopment effort [2].
The initial interest sparked by FPA, along with the recog-nition of the need for maintaining FPA counting practices,led to founding the IFPUG (International Function PointsUser Group). The IFPUG (http://www.ifpug.org/) maintainsthe counting practices manual [3], provides guidelines andexamples, and oversees the standardization of the measurementmethod.
The IFPUG method is an ISO standard [12] in its “unad-justed” version. The adjustment factor originally proposed byAlbrecht and endorsed by IFPUG is meant to obtain measuresmore apt for effort estimation, by accounting for factors notdealing with functional requirements, namely with product andprocess features that do not belong to the notion of functionalsize. As such, the adjustment was not accepted by ISO; so,throughout the paper we refer exclusively to unadjusted FP(UFP), even when we omit adjective “unadjusted.”
Albrecht’s basic idea—which is still at the basis of theIFPUG method—is that the “amount of functionality” releasedto the user can be evaluated by taking into account 1) thedata used by the application to provide the required functions,and 2) the transactions (i.e., operations that involve datacrossing the boundaries of the application) through whichthe functionality is delivered to the user. Both data andtransactions are evaluated at the conceptual level, i.e., theyrepresent data and operations that are relevant to the user.Therefore, IFPUG Function Points are counted on the basisof the user requirements specification. The boundary indicatesthe border between the application being measured and theexternal applications and user domain.
FURs are modeled as a set of base functional components(BFCs), which are the measurable elements of FURs: each ofthe identified BFCs is measured, and the size of the wholeapplication is obtained as the sum of the sizes of BFCs.
The IFPUG model of a software application to be measuredis shown in Figure 1. IFPUG BFCs are data functions (alsoknown as logical files), which are classified into internal logicalfiles (ILF) and external interface files (EIF), and elementaryprocesses (EP)—also known as transaction functions—whichare classified into external inputs (EI), external outputs (EO),and external inquiries (EQ), according to the activities carriedout within the process and its main intent.
So, the functional size of a given application, expressed inunadjusted Function Points, SizeUFP , is given by the sum

184
International Journal on Advances in Software, vol 13 no 3 & 4, year 2020, http://www.iariajournals.org/software/
2020, © Copyright by authors, Published under agreement with IARIA - www.iaria.org
Figure 1. The IFPUG model of software.
of the sizes of the different types of functions, as shown inequation (1).
SizeUFP =∑
f∈ILFs
SizeILF (f) +∑
f∈EIFs
SizeEIF (f) + (1)∑f∈EIs
SizeEI(f) +∑
f∈EOs
SizeEO(f) +∑
f∈EQs
SizeEQ(f)
In equation (1), ILFs is the set of all data functions of typeILF , EIs is the set of all transactional functions of type EI , etc.Also, SizeX(f) is the weight of function f , which dependson its complexity, and its type (X ∈ {ILF, EIF, EI, EO, EQ},as described in Table I.
TABLE I. FPA WEIGHT TABLE.
ComplexityFunction type Low Average HighILF 7 10 15EIF 5 7 10EI 3 4 6EO 4 5 7EQ 3 4 6
The complexity of a data function (ILF or EIF) dependson the RETs (Record Element Types), which indicate howmany types of information (e.g., sub-classes, in object-orientedterms) can be contained in the given logical data file, andDETs (Data Element Types), which indicate how many typesof elementary information (e.g., attributes, in object-orientedterms) can be contained in the given logical data file.
The complexity of a transaction depends on the numberof file types references (FTRs)—i.e., the number of typesof logical data files used while performing the requiredoperation—and the number of DETs—i.e., the number of typesof elementary data—that the considered transaction sends andreceives across the boundaries of the application.
Details concerning the determination of complexity can befound in the official documentation [3].
The core of FPA involves three main activities:
1) Identifying data and transaction functions.2) Classifying data functions as ILF or EIF, and transac-
tions as EI, EO or EQ.
3) Determining the complexity of each data or transactionfunction.
The first two of these activities can be carried out even ifthe FUR have not yet been fully detailed. On the contrary, thelast activity requires that all details are available, so that suchdetails can be analyzed, to get the number of RET or FTR andDET involved in every function. In the next section, severalFP estimation methods are presented. All of these method donot require activity 3 above, thus allowing for size estimationwhen FUR are not fully detailed. In addition, since activity 3 isthe most effort- and time-consuming, the presented estimationmethods are relatively fast and cheap, with respect to full-fledged FPA.
III. FUNCTION POINTS ESTIMATION METHODS
In this section we briefly present the FP estimation methodsmentioned in the introduction.
A. The NESMA methods
The NESMA methods were proposed to get an estimate ofthe functional size of a given application without analyzingdata and transactions in detail [4].
There are two NESMA estimation methods: the NESMAIndicative method and the NESMA Estimated method.
The former estimates size (EstSize) based on the number ofILF (#ILF) and the number of EIF (#EIF), as follows:
EstSize = #ILF ×WILF +#EIF ×WEIF
where WILF is 25 or 35 and WEIF is 10 or 15, depending onILF and EIF being identified based on a data model in thirdnormal form or not, respectively.
The process of applying the NESMA indicative methodinvolves only identifying logic data and classifying them asILF or EIF. Accordingly, it requires less time and effort thanstandard FPA. However, the NESMA Indicative method isquite rough in its computation: the official NESMA count-ing manual specifies that errors in functional size with thisapproach can be up to 50%.
The NESMA Estimated method requires the identificationand classification of all data and transaction functions, butdoes not require the assessment of the complexity of eachfunction: Data Functions (ILF and EIF) are assumed to be oflow complexity, transactions (EI, EQ and EO) are assumed tobe of average complexity. Hence, estimated size is computedas follows:
EstSize = 7 #ILF + 5 #EIF + 4 #EI + 5 #EO + 4 #EQ
IFPUG adopted the NESMA methods as the official earlyfunction point analysis methods [10].

185
International Journal on Advances in Software, vol 13 no 3 & 4, year 2020, http://www.iariajournals.org/software/
2020, © Copyright by authors, Published under agreement with IARIA - www.iaria.org
B. The Early & Quick Function Points method
One of the most well-known approach for simplifying theprocess of FP counting is the Early & Quick Function Points(EQFP) method [5], [6]. EQFP descends from the considera-tion that estimates are sometimes needed before requirementsanalysis is completed, when the information on the software tobe measured is incomplete or not sufficiently detailed. Sinceseveral details for performing a correct measurement followingthe rules of the FP manual [3] are not used in EQFP, the resultis a less accurate measure. The trade-off between reducedmeasurement time and costs is also a reason for adopting theEQFP method even when full specifications are available, butthere is the need for completing the measurement in a shorttime, or at a lower cost. An advantage of the method is thatdifferent parts of the system can be measured at different detaillevels: for instance, a part of the system can be measuredfollowing the IFPUG manual rules [3], [12], while other partscan be measured on the basis of coarser-grained information,possibly considering analogy with previously measured soft-ware parts. The EQFP method is based on the classificationof the processes and data of an application according to ahierarchy (see Figure 2 [6]).
Figure 2. Functional hierarchy in the Early & Quick FP technique.
Transactional BFC and Data BFC correspond to IFPUG’selementary processes and LogicData, while the other elementsare aggregations of processes or data groups. The idea is thatif you have enough information at the most detailed levelyou count FP according to IFPUG rules; otherwise, you canestimate the size of larger elements (e.g., General or Macroprocesses) either on the basis of analogy (e.g., a given Generalprocess is “similar” to a known one) or according to thestructured aggregation (e.g., a General process is composedof 3 Transactional BFC). By considering elements that arecoarser-grained than the FPA BFC, the EQFP measurementprocess leads to an approximate measure of size in IFPUGFP.
Tables taking into account the previous experiences with theusage of EQFP are provided to facilitate the task of assigninga minimum, maximum and most likely quantitative size toeach component. For instance, Table II provides minimum,
TABLE II. EQFP: FUNCTION TYPE WEIGHTS FOR GENERIC FUNCTIONS.
WeightFunction type Low Likely HighGeneric ILF 7.4 7.7 8.1Generic EIF 5.2 5.4 5.7Generic EI 4 4.2 4.4Generic EO 4.9 5.2 5.4Generic EQ 3.7 3.9 4.1
maximum and most likely weight values for generic (i.e.,not weighted) functions as given in [6]. The time and effortrequired by the weighting phases are thus saved. Such savingcan be relevant, since weighting a data or transaction functionrequires analyzing it in detail.
C. Tichenor method
The Tichenor ILF Model [7] bases the estimation of thesize on the number of ILF via the following formula fortransactional system (for batch systems, Tichenor proposes asmaller multiplier): EstSize = 14.93 #ILF
This model assumes a distribution of BFC with respect toILF as follows: EI/ILF = 0.33, EO/ILF = 0.39, EQ/ILF = 0.01,EIF/ILF = 0.1. If the considered application features a differentdistribution, the estimation can be inaccurate.
The fact that a method based only on ILF requires a givendistribution for the other BFC is not surprising. In fact, thesize of the application depends on how many transactions areneeded to elaborate those data, and the number of transactioncannot be guessed only on the basis of the number of ILF, asit depend on the number of ILF just very loosely. Instead ofallowing the user to specify the number of transactions thatare needed, the Tichenor method practically imposes that thenumber of transactions complies with the distribution givenabove.
D. Simplified FP
The simplified FP (sFP) approach assumes that all BFC areof average complexity [8], thus:
EstSize = 4 #EI + 5 #EO + 4 #EQ + 10 #ILF + 7 #EIF
E. ISBSG distribution model
The analysis of the ISBSG dataset yielded the followingdistribution of BFC contributions to the size in FP: ILF 22.3%,EIF 3.8%, EI 37.2%, EO 23.5%, EQ 13.2%
The analysis of the ISBSG dataset also shows that theaverage size of ILF is 7.4 UFP. It is thus possible to computethe estimated size on the basis of the number of ILF as follows:EstSize = 7.4 #ILF 100
22.3
The same considerations reported above for the Tichenormodel apply. If the application to be measured does not fitthe distribution assumed by the ISBSG distribution model, itis likely that the estimation will be inaccurate.

186
International Journal on Advances in Software, vol 13 no 3 & 4, year 2020, http://www.iariajournals.org/software/
2020, © Copyright by authors, Published under agreement with IARIA - www.iaria.org
F. ISBSG average weights
This model is based on the average weights for each BFC,as resulting from the analysis of the ISBSG dataset [9], whichcontains data from a few thousand projects. Accordingly, theISBSG average weights model suggests that that the averagefunction complexity is used for each BFC, thus
EstSize = 4.3 #EI + 5.4 #EO + 3.8 #EQ+
7.4 #ILF + 5.5 #EIF
Figure 3. Distribution of projects’ sizes in the studied dataset (note thelogarithmic scale on the x axis).
IV. THE EMPIRICAL STUDY
In this section, we first provide a brief description of thedataset used for the evaluation of functional size estimationmethods; then, we describe the analysis and the resultingaccuracy evaluations.
A. The Dataset
We use a dataset that collects data from 479 software appli-cations developed and used by a Chinese financial enterprise.
Descriptive statistics of the dataset are given in Table III.
TABLE III. DESCRIPTIVE STATISTICS OF DATASET.
Standard UFPMean 3554St. Dev. 6673Median 1155Min 4Max 80880
The distribution of size is given in Figure 3. Specifically,it is worth noting that the studied dataset contains relativelyfew data from small projects (32 projects not greater than 50UFP) and relatively few data concerning very large projects(17 projects bigger than 20000 UFP).
B. The Analysis
For each of the 479 project in the dataset, we computed theestimated size, using each of the estimation method describedin Section III.
To assess the estimates, in Figures 4 and 5 we plot thevalues of the estimates with respect to the actual size mea-sured according to the standard IFPUG counting manual [3].Specifically, Figure 4 illustrates the estimates yielded by themost accurate methods, while Figure 5 shows the estimatesyielded by the less accurate methods.
In Figures 4 and 5, we also draw the estimated size = actualsize line: if the estimates were perfect, all the points would lieon the line.
Looking at Figure 4, it is easy to see that the estimatesprovided by the NESMA Estimated, EQFP, Simplified FP,and ISBSG average methods are close to the x=y line, thusindicating fairly accurate estimates. On the contrary, in Fig-ure 5 it can be observed that the estimates provided by theNESMA indicative (normalized and not normalized), Tichenor,and ISBSG distribution methods are widely spread, with manypoints definitely far from the x=y line, thus indicating thatmany estimates are quite inaccurate.
To better appreciate the accuracy of estimates, in the Ap-pendix, Figures 13 and 14 illustrate estimates for projectshaving size in the [50, 20000] UFP range.
Figures 5 and 14 seem to indicate that the NESMA indica-tive (normalized and not normalized), Tichenor, and ISBSGdistribution methods are rather inaccurate. To better investigatethis indication, in Figure 6 we give the boxplots that illustratethe distributions of errors (errors are defined as the differenceactual size minus estimated size). To keep the figure readable,outliers (i.e., the biggest errors) are not shown.
It is easy to see that NESMA Estimated, EQFP, SimplifiedFP, and ISBSG average weight methods have narrow errorsdistributions, close to the zero-error line. On the contrary, theother methods feature widespread distributions, in some casescentered on positive errors. Specifically, the Tichenor methodprovides the worst accuracy and tends to underestimate (forover 75% of the projects, estimates are smaller than the actualsize). Similar considerations—although to a lesser extent—apply to the NESMA indicative (normalized) and ISBSGdistribution methods. The NESMA indicative (not normalized)method does not tend to underestimate nor overestimate, butits estimation errors are often quite large.
To better study the errors of the best methods, in Figure 7we give the boxplots of the estimation errors of the NESMAEstimated, EQFP, Simplified FP, and ISBSG average weightmethods.
Figure 7 shows that the NESMA Estimated method tendsto underestimates, while the Simplified FP method tends tooverestimate. On the contrary, the EQFP and the ISBSG av-erage weights methods appear symmetrically distributed withrespect to the zero-error line.
It is worth noticing that size underestimation is quite dan-gerous, since it may lead to underestimating development cost

187
International Journal on Advances in Software, vol 13 no 3 & 4, year 2020, http://www.iariajournals.org/software/
2020, © Copyright by authors, Published under agreement with IARIA - www.iaria.org
Figure 4. Standard IFPUG UFP measures vs. estimates provided by most accurate methods.
and duration, hence to defining not realistic plans, that usuallylead to bad project organization, understaffing, overspending,etc.. Accordingly, using the NESMA Estimated method couldbe risky.
This observation concerning the NESMA Estimated methodis particularly interesting because the NESMA Estimatedmethod is also the one that most frequently provides the bestaccuracy in the lot of estimation methods, as shown in Figure 8(the most accurate estimate here is the one characterized bythe least absolute error). So, practitioners must consider thatthe NESMA Estimated method is likely to provide the smallestestimation errors, but is also most frequently underestimating.
C. Accuracy Evaluation
It is now necessary to evaluate quantitatively the accu-racy of estimates. First of all—as suggested by Shepperdand MacDonell [13]—we checked whether estimates performbetter than “baseline” models. Shepperd and MacDonell [13]proposed that the accuracy of a given estimation method bemeasured via the Mean Absolute Residual (MAR): MAR =1n
∑i=1..n |yi − yi|, where yi is the actual value of the ith
observation, and yi is its estimate. Shepperd and MacDonellsuggest to use random estimation, based solely on the known(actual) values of previously measured applications, as abaseline model. Shepperd and MacDonell observed also thatthe value of the 5% quantile of the random estimate MARscan be interpreted like α for conventional statistical inference,that is, any accuracy value that is better than this threshold
has a less than one in twenty chance of being a randomoccurrence. Accordingly, the MAR of a proposed model shouldbe compared with the 5% quantile of the random estimateMARs, to make us reasonably sure that the model is actuallymore accurate than random estimation.
Lavazza and Morasca [14] proposed to use a “constantmodel,” where the estimate of the size of an application isgiven by the mean size of the other applications.
With our dataset, the MAR of the constant model is 3864UFP, while the 5% quantile of absolute residuals for randomestimates is 4566 UFP. The MARs of estimates are given inTable IV, together with MdAR (the median of absolute errors)and MMRE (the mean of relative absolute errors).
TABLE IV. ACCURACY INDICATORS FOR ESTIMATION METHODS.
Method MAR MdAR MMRENESMA Estimated 315 73 0.102NESMA Indic. (not norm.) 2135 435 0.629NESMA Indic. (norm.) 1931 425 0.523EQFP (likely weights) 299 79 0.103Tichenor 2363 638 0.648ISBSG distribution est. 2045 451 0.589ISBSG average weights 298 82 0.103Simplified FP 411 112 0.141
According to Table IV, all the evaluated methods satisfy thenecessary conditions for being considered acceptable estima-tion methods.
Concerning the accuracy of estimates, in Figure 9 thedistribution of absolute errors (excluding the biggest ones,
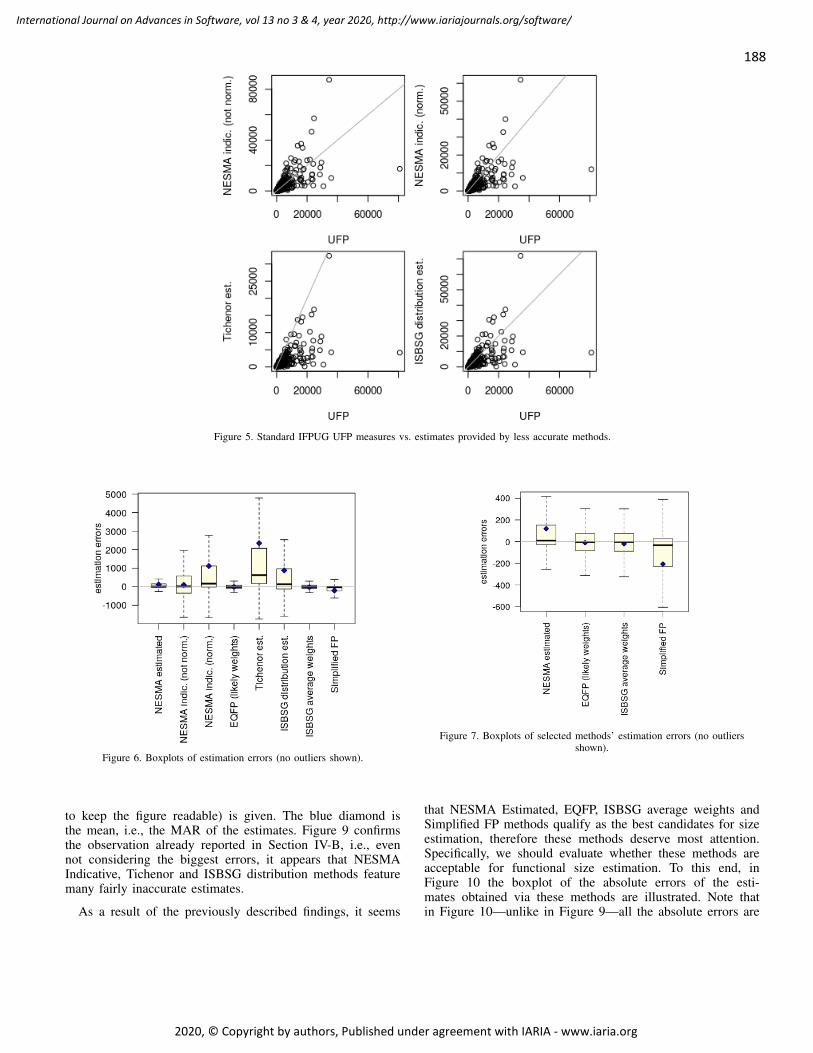
188
International Journal on Advances in Software, vol 13 no 3 & 4, year 2020, http://www.iariajournals.org/software/
2020, © Copyright by authors, Published under agreement with IARIA - www.iaria.org
Figure 5. Standard IFPUG UFP measures vs. estimates provided by less accurate methods.
Figure 6. Boxplots of estimation errors (no outliers shown).
to keep the figure readable) is given. The blue diamond isthe mean, i.e., the MAR of the estimates. Figure 9 confirmsthe observation already reported in Section IV-B, i.e., evennot considering the biggest errors, it appears that NESMAIndicative, Tichenor and ISBSG distribution methods featuremany fairly inaccurate estimates.
As a result of the previously described findings, it seems
Figure 7. Boxplots of selected methods’ estimation errors (no outliersshown).
that NESMA Estimated, EQFP, ISBSG average weights andSimplified FP methods qualify as the best candidates for sizeestimation, therefore these methods deserve most attention.Specifically, we should evaluate whether these methods areacceptable for functional size estimation. To this end, inFigure 10 the boxplot of the absolute errors of the esti-mates obtained via these methods are illustrated. Note thatin Figure 10—unlike in Figure 9—all the absolute errors are

189
International Journal on Advances in Software, vol 13 no 3 & 4, year 2020, http://www.iariajournals.org/software/
2020, © Copyright by authors, Published under agreement with IARIA - www.iaria.org
Figure 8. How many times every method yielded the best estimate.
Figure 9. Boxplots of absolute errors (outliers not shown).
represented.
Figure 10 shows quite clearly that while the consideredmethods feature a fairly small absolute error, all methods arecharacterized by some quite big errors. To evaluate whetherthese errors are acceptable, we can consider that in general,relatively large estimation errors are deemed acceptable in verylarge projects.
To help practitioners appreciate the “importance” of errorswith respect to the size of the estimated project, in Figure 11we give the boxplots representing the distributions of relative
Figure 10. Boxplots of all absolute errors for selected methods.
errors (the relative error of an estimate is the estimation errordivided by the actual size). To keep Figure 11 readable, thebiggest errors are not shown.
Figure 11. Boxplots of relative errors (no outliers).
Figure 11 shows that the estimation errors caused by theNESMA Indicative, Tichenor and ISBSG distribution methodsare quite large also in relative terms. Specifically, these meth-ods feature several relatively large underestimations: all thethree mentioned methods underestimate no less that 25% ofthe projects by 50% or more. Even though the acceptability ofestimates is largely subjective, we have strong doubts that any

190
International Journal on Advances in Software, vol 13 no 3 & 4, year 2020, http://www.iariajournals.org/software/
2020, © Copyright by authors, Published under agreement with IARIA - www.iaria.org
practitioner would find these levels of accuracy acceptable.
Figure 12. Boxplots of all relative errors for selected methods.
Considering the other methods, Figure 12 shows the box-plots of all the relative estimation errors. Figure 12 indicatesthat all the selected methods perform well. For all methods, thegreat majority of errors is in the [-20%, +20%] range, which isgenerally considered acceptable, especially when the estimateis performed in the earliest phases of the software lifecycle,when user requirements have not yet been fully analyzed.
V. CONSIDERATIONS ON THE OUTCOMES OF THEEMPIRICAL STUDY
The results obtained via the empirical study support a fewconsiderations, which we illustrate in the following sections.
A. Methods based on the knowledge of data functions
The NESMA Indicative, Tichenor and ISBSG distributionestimation methods are all based on the knowledge of thenumber of data functions only. The NESMA Indicative methodalso requires that logical data files are classified as ILF orEIF, which is usually quite easy, since one has just to checkwhether the application being measured maintains (i.e., creates,modifies or deletes) the considered data files or not. On thecontrary, the other methods considered in this paper base theirestimates on the knowledge or transactional functions as well.
Since the NESMA Indicative, Tichenor and ISBSG distribu-tion estimation methods use the knowledge of the number ofdata functions only, it is not surprising that they provide a levelof accuracy that is definitely lower with respect to methods thataccount also for transactions.
So, the question is now whether it is reasonable to useestimates that are based exclusively on the knowledge of
logical data files. First of all, we can observe that the questionmakes sense, since in many cases requirements analysis startswith domain analysis, which provides reliable indicationsconcerning the data the software application will have to dealwith. In such conditions, no method appears to yield acceptablyaccurate estimates.
B. Methods based on the knowledge of data and transactionfunctions
In order to estimate size using the NESMA Estimated,EQFP, ISBSG average weights or Simplified FP methods, youhave to know both the number of data functions (and how theyare classified into ILF and EIF) and the number of transactions(and how they are classified in EI, EO and EQ). If you havethis knowledge of functional requirements, you can get sizeestimates whose error is in the [-20%, +20%] range, except ina minority of cases.
Given this, our results show that the Early & Quick FPand the ISBSG average methods are probably preferable, sincethey avoid both underestimation (which affects the NESMAEstimated method) and overestimation (which affects the Sim-plified FP method). In addition, the Early & Quick FP andthe ISBSG average methods a slightly smaller MAR than theNESMA estimated method (see Table IV).
Actually, both the NESMA Estimated method and theSimplified FP method are based on assumptions that havenever been verified. The former method assumes that datafunctions are all of low complexity and all transactions areof average complexity; the latter method assumes that allfunctions are of average complexity. Our study shows thatnone of these assumptions appear totally correct: in fact, theNESMA Estimated method tends to underestimate and theSimplified FP method tends to overestimate (note that, bydefinition, for a given application, the Simplified FP estimatewill always be greater than the NESMA Estimated estimate).
The remaining methods, i.e., the EQFP and the ISBSGaverage weights methods are based on statistical analysis oflarge datasets. They propose for each function type the averageweight observed. As a consequence, the definition of the twomethods are very similar, and the estimates they provide areusually very close. This makes quite hard to choose one ofthe two methods. To this end, an interesting observation isthat the EQFP method provides not only ‘likely’ weights forfunction types, but also low and high values (see Table II).By sizing all functions with the low weights and with the highweights gives a sort of confidence interval that could cope withthe inherent uncertainty of the estimation due to the lack ofdetails concerning functional requirements.
As a final consideration, the fact that both the EQFP andthe ISBSG average weights methods performs well shows thatorganizations that have large enough collections of historicaldata could build their own estimation method following thesame process as the EQFP and the ISBSG average weightsmethods: compute the average weight of each function typefrom the historical dataset and use such weights to estimatethe size of new developments.

191
International Journal on Advances in Software, vol 13 no 3 & 4, year 2020, http://www.iariajournals.org/software/
2020, © Copyright by authors, Published under agreement with IARIA - www.iaria.org
VI. THREATS TO VALIDITY
Given the type of study we presented, there are two mainthreats to validity that need attention.
First, we should consider the correctness of the given data.In fact, the data in the analyzed dataset were derived fromthe analysis and measurement of functional requirements: bothanalysis and measurement could be affected by error, whichwould end up in the dataset. Concerning this threat, we arereasonably sure that the used data are of good quality, sincethey were collected by professionals in industrial contextswhere functional size measures are quite important, hence greatattention is posed in the measurement activities.
Second, we need to consider external validity, i.e., whetherwe can generalize the results of our study outside the scopeand context that characterize the considered software projects.On the one hand, our dataset is much larger than the datasetsusually involved in software engineering empirical studies;besides, our dataset includes data from fairly large projects(e.g., over 20000 FP). In this sense, our dataset representsa large and varied enough sample. On the other hand, allthe considered projects are from the economic, financial andbanking domain, hence we cannot be sure that the resultsof our study apply equally well in other domains. In thisrespect, readers are reminded that previous studies show somedifference in accuracy when estimates concern other types ofsoftware applications, e.g., real-time applications [11].
VII. RELATED WORK
Meli and Santillo were among the first to recognize the needfor comparing the various functional size methods proposedin the literature [15]. To this end, they also provided abenchmarking model.
Popovic and Bojic compared different functional sizemeasures—including NESMA Indicative and Estimated—byevaluating their accuracy in effort estimation in various phasesof the development lifecycle [16]. Not surprisingly, they foundthat the NESMA Indicative method provided the best accuracyat the beginning of the project. With respect to Popovic andBojic, we made two quite different choices: the accuracy ofthe method is evaluated against the actual size of the softwareproduct and—consistently—all the information needed to per-form measurement is available to all processes.
Santillo suggested probabilistic approaches, where the mea-surer can indicate the minimum, medium and maximum weightof each BFC, together with the expected probability that theweight is actually minimum, medium or maximum [17]. Thisleads to estimate not only the size, but also the probability thatthe actual size is equal to the estimate.
NESMA defined the application of FPA in the early phasesof the application life cycle, and recognizes three functionpoint analysis methods: Detailed function point analysis (cur-rently corresponding to IFPUG measurement), Estimated func-tion point analysis, and Indicative function point analysis.Using a database of over 100 developed and implementedapplications, NESMA empirically evaluated the accuracy of
the Estimated and Indicative FPA approximation methods [18].The results showed that size measures of the high-level func-tion point analysis and the detailed function point analysis arevery close. Moreover, Indicative function point analysis givesa surprisingly good estimate of the size of several applications.
van Heeringen described the size accuracy—as well as thedifference in measurement effort—of the NESMA Estimatedand NESMA Indicative methods, by measuring 42 projects [4].The results show that the estimation error of NESMA Es-timated was in the [-6%, +15%] range, with average 1.5%;the estimation error of NESMA Indicative was in the [-15%,+50%] range with average 16.3%. In both cases the estimationerror was evaluated with respect to detailed measurement.
Wilkie et al. [19] used five commercial projects to evaluatethe cost-benefit trade-off of size measurement with respectto size estimation; they concluded that whilst the NESMAIndicative method was insufficiently accurate for the involvedcommercial organization, the NESMA Estimated approach wasdefinitely viable.
IFPUG adopted NESMA methods for early “high-level” sizeestimation [10]. IFPUG suggested that 1) The High Level FPAmethod can be used to size an application early in the softwaredevelopment life cycle; 2) The High Level FPA method canalso be applied as an alternative to standard FPA estimate (theoutcome is not significantly different, while the estimation timeis considerably shorter); 3) The indicative FPA method maybe used to get a very fast, rough indication of the size of anapplication, but it is not suited for contractual commitments.
Lavazza et Liu [11] used 7 real-time applications and 6non real-time applications to evaluate the accuracy of theEQFP [5] and NESMA methods with respect to full-fledgedFunction Point Analysis. The results showed that the NESMAIndicative method yields the greatest errors. On the contrary,the NESMA Estimated method yields size estimates that areclose to the actual size. The NESMA Indicative method isgenerally outperformed by the other methods. The NESMAEstimated method proved fairly good in estimating both Real-Time and non Real-Time applications.
Morrow et al. used a dataset of 11 projects to evaluate thequality of sizing estimates provided by NESMA methods [20].They also adapted NESMA methods’ general principles toenhance their accuracy and extent of relevance, and empiricallyvalidated such an adapted approach using commercial softwareprojects.
The main limitations of the mentioned research are that moststudies used small datasets containing data concerning littleprojects of not industrial nature. In our paper, we evaluatemeasurement accuracy of the NESMA method with respect toFPA method over a dataset containing data from 479 industrialprojects, of which several are above 10000 FP.
Ochodek proposed a method to approximate IFPUG FPAfunctional size in an automatic way, based on given UML use-case diagrams or a list of use-case names [21].
Meli proposed Simple Function Points (SiFP), as an alter-native to standard IFPUG FP [22]. SiFP have been evaluated

192
International Journal on Advances in Software, vol 13 no 3 & 4, year 2020, http://www.iariajournals.org/software/
2020, © Copyright by authors, Published under agreement with IARIA - www.iaria.org
via empirical studies [23], [24] that showed that they appearsuitable replacements of standard FP.
VIII. CONCLUSIONS
In this paper we addressed the evaluation of the accuracyof functional size estimates that can be achieved via severalFunction Points estimation methods. To this end, we comparedfunctional size measures obtained via the standard IFPUGFunction Point Analysis process with estimates obtained viathe considered estimated methods. Both measures and esti-mates were computed for a dataset containing data from 479software projects. Based on the results of the analysis, we candraw a few relevant conclusions:
– The methods that use knowledge of both data andtransaction functions provide estimates that are muchmore accurate than those provided by methods that useonly knowledge of data functions.
– The methods that use knowledge of both data andtransaction functions, namely the NESMA Estimated,Early & Quick FP, ISBSG average weights and theSimplified FP methods, provide estimates that are mostlyin the [-20%, -20%] error range, hence their estimatesare likely accurate enough in most cases.
– The NESMA Estimated method tends to underestimate.This can be dangerous, since at the initial stages ofdevelopment one could be induced to believe that thedevelopment process will be shorter and cheaper thanactually required.
– The Simplified FP method tends to overestimate.– With the Early & Quick FP and the ISBSG average
weights methods, the probabilities of getting underes-timates and overestimates appear approximately equal.
Future work includes experimenting with new estimationmethods that can be derived from the available dataset, andinvestigating whether and how estimation accuracy can beimproved.
ACKNOWLEDGMENT
Parts of this work have been supported by the “Fondodi ricerca d’Ateneo” funded by the Universita degli Studidell’Insubria, by Zhejiang Provincial Science Foundation ofChina under grant no. LY19F020046, and by the ChineseScholarship Council under grant no. 201708330399.
REFERENCES
[1] L. Lavazza and G. Liu, “An Empirical Evaluation of the Accuracy ofNESMA Function Points Estimates,” in International Conference onSoftware Engineering Advances (ICSEA 2019), 2019.
[2] A. J. Albrecht, “Measuring application development productivity,” inProceedings of the joint SHARE/GUIDE/IBM application developmentsymposium, vol. 10, 1979, pp. 83–92.
[3] International Function Point Users Group (IFPUG), “Function pointcounting practices manual, release 4.3.1,” 2010.
[4] H. van Heeringen, E. van Gorp, and T. Prins, “Functional sizemeasurement-accuracy versus costs-is it really worth it?” in SoftwareMeasurement European Forum (SMEF 2009), 2009.
[5] L. Santillo, M. Conte, and R. Meli, “Early & Quick function point:sizing more with less,” in 11th IEEE International Software MetricsSymposium (METRICS’05). IEEE, 2005, pp. 41–41.
[6] DPO, “Early & Quick Function Points for IFPUG methods v.3.1Reference Manual 1.1,” DPO srl, 2012.
[7] C. Tichenor, “The IRS Development and Application of the InternalLogical File Model to Estimate Function Point Counts,” in IFPUG FallConference of Use (ESCOM-ENCRESS 1998). IFPUG, 1998.
[8] L. Bernstein and C. M. Yuhas, Trustworthy Systems Through Quanti-tative Software Engineering. John Wiley & Sons, 2005.
[9] International Software Benchmarking Standards Group, “WorldwideSoftware Development: The Benchmark, release 11,” ISBSG, 2009.
[10] A. Timp, “uTip – Early Function Point Analysis and Consistent CostEstimating,” 2015, uTip # 03 (version # 1.0 2015/07/01).
[11] L. Lavazza and G. Liu, “An empirical evaluation of simplified functionpoint measurement processes,” International Journal on Advances inSoftware, vol. 6, no. 1& 2, 2013.
[12] International Standardization Organization (ISO), “ISO/IEC 20926:2003, Software engineering IFPUG 4.1 Unadjusted functional sizemeasurement method Counting Practices Manual,” 2003.
[13] M. Shepperd and S. MacDonell, “Evaluating prediction systems insoftware project estimation,” Information and Software Technology,vol. 54, no. 8, 2012, pp. 820–827.
[14] L. Lavazza and S. Morasca, “On the evaluation of effort estimationmodels,” in Proceedings of the 21st International Conference on Eval-uation and Assessment in Software Engineering. ACM, 2017, pp.41–50.
[15] R. Meli and L. Santillo, “Function point estimation methods: a compar-ative overview,” in Software Measurement European Forum (FESMA1999), 1999.
[16] J. Popovic and D. Bojic, “A comparative evaluation of effort estimationmethods in the software life cycle,” Computer Science and InformationSystems, vol. 9, 2012.
[17] L. Santillo, “Easy Function Points – ‘Smart’ Approximation Techniquefor the IFPUG and COSMIC Methods,” in Joint Conf. of the 22nd Int.Workshop on Software Measurement and the 7th Int. Conf. on SoftwareProcess and Product Measurement, 2012.
[18] nesma, “Early Function Point Analysis.” [Online]. Avail-able: https://nesma.org/themes/sizing/function-point-analysis/early-function-point-counting/ accessed on November 8, 2020
[19] F. G. Wilkie, I. R. McChesney, P. Morrow, C. Tuxworth, and N. Lester,“The value of software sizing,” Information and Software Technology,vol. 53, no. 11, 2011, pp. 1236–1249.
[20] P. Morrow, F. G. Wilkie, and I. McChesney, “Function point analysisusing nesma: simplifying the sizing without simplifying the size,”Software Quality Journal, vol. 22, no. 4, 2014, pp. 611–660.
[21] M. Ochodek, “Functional size approximation based on use-case names,”Information and Software Technology, vol. 80, 2016, pp. 73–88.
[22] R. Meli, “Simple Function Point: a new functional size measurementmethod fully compliant with ifpug 4. x,” in Software MeasurementEuropean Forum, 2011.
[23] L. Lavazza and R. Meli, “An evaluation of Simple Function Point as areplacement of IFPUG function point,” in 2014 joint conference of theinternational workshop on software measurement and the internationalconference on software process and product measurement. IEEE, 2014,pp. 196–206.
[24] F. Ferrucci, C. Gravino, and L. Lavazza, “Simple function points foreffort estimation: a further assessment,” in Proceedings of the 31stAnnual ACM Symposium on Applied Computing, 2016, pp. 1428–1433.

193
International Journal on Advances in Software, vol 13 no 3 & 4, year 2020, http://www.iariajournals.org/software/
2020, © Copyright by authors, Published under agreement with IARIA - www.iaria.org
APPENDIX
Figures 13 and 14 illustrate estimates vs. actual values,concerning projects in the [50, 20000] UFP range.
Figure 13. Standard IFPUG UFP measures vs. estimates (no smallest andbiggest projects).
Figure 14. Standard IFPUG UFP measures vs. estimates (no smallest andbiggest projects).

194
International Journal on Advances in Software, vol 13 no 3 & 4, year 2020, http://www.iariajournals.org/software/
2020, © Copyright by authors, Published under agreement with IARIA - www.iaria.org
Semaphore Implementations for Testing Concurrent Systems using TTCN-3
Bernard Stepien, Liam Peyton School of Engineering and Computer Science
University of Ottawa, Ottawa, Canada Email: {bstepien | lpeyton}@uottawa.ca;
Jacob Wieland, Dirk Tepelmann, Dirk Borowski
Spirent Communications Berlin, Germany
Email: {Jacob.wieland | dirk.tepelmann | dirk.borowski} @spirent.com
Abstract—Testing concurrent systems is a complex task. In traditional software unit testing, a test sequence is always composed of a stimulus and its corresponding fully predictable response. With concurrent systems, this simple model no longer holds as the state of the system under test (SUT) changes while several users place their requests. Race conditions are a particularly challenging problem for testing, since they will occur and must be identified, but are very disruptive to the test environment. An easy solution to this problem is to use semaphores that avoid race conditions. Since semaphores do not exist in TTCN-3, we have explored solutions using the TTCN-3 concept of external functions. This allows us to define behavior in the run-time language used by the TTCN-3 compiler, in our case Java, without having to modify the TTCN-3 standard. However, Java semaphores can block other parallel processes which may actually defeat parallelism. Thus, we have explored other solutions based on resource blocking rather than process blocking. This allows two or more concurrent processes to perform operations on different resources and thus achieve more sophisticated concurrency testing.
Keywords- software testing-concurrent systems; TTCN-3; test oracles; race conditions; semaphores.
I. INTRODUCTION
This paper is a significant extension and update of our previously published SOFTENG 2020 paper that presented preliminary results for advanced techniques for testing concurrent systems [1].
Testing concurrent systems is complex. In traditional software unit testing, a test sequence is always composed of a stimulus and its corresponding fully predictable response [2]. With concurrent systems, this simple model no longer holds as the state of the system under test (SUT) changes while several users place their requests. Race conditions are a particularly challenging problem for testing, since they will occur and must be identified, but are very disruptive to the test environment.
Some definitions and implementations of parallel testing can be found in [3][4][5][6][7]. Obviously there are different kinds of parallel testing. In the previous references, the main concern is to run sequential tests in parallel in order to save time. Instead, we focus on concurrent testing of states in a (SUT) as the test purpose. There are two main categories of concurrent testing:
Response time testing when a large number of requests are sent to a server as shown in Figure 1. Techniques for addressing this category of concurrent testing using TTCN-3 are presented in [8].
Testing the processing logic of the SUT when confronted by several requests from parallel users where the state of the SUT is changing as a result of requests of the users and thus affecting each user’s behavior.
Figure 1. Parallel system configuration
In this paper, a case study, using the formal test specification language TTCN-3[9], illustrates the challenges for test coordination for this category of testing, especially with respect to race conditions, and proposes techniques to address them. We also propose shared variables and semaphores in the TTCN-3 parallel test component model as a mechanism to implement dynamic test oracles. Overall, the motivation to use a formal test specification language such as TTCN-3 and its related available execution tools to take full advantage of its logging information in order to rapidly detect faults due to race conditions. We also propose enhancements to the TTCN-3 language by introducing semaphores as a built-in language feature to make our testing concurrency problem statement usable.
There are two kinds of race conditions: Shared variables racing Behavior racing
A. Shared variables racing
The only way to predict a state of a SUT when multiple users are present is to use a shared variable to record for example the state of the inventory of a given

195
International Journal on Advances in Software, vol 13 no 3 & 4, year 2020, http://www.iariajournals.org/software/
2020, © Copyright by authors, Published under agreement with IARIA - www.iaria.org
product each user is trying to order. Each time a user orders a product, the inventory is decreased by one unit. However, in concurrency, a user trying to make a decision on the state of the SUT may have the shared variable overwritten by another user, thus producing a wrong result. Here the solution would be to lock the shared variable so that no other user can overwrite it.
B. Behavior racing
We have determined that shared variable locking is actually not sufficient to solve the race condition problem. We determined through experimentation that some sequence of events must also be locked. For instance, once the expected state of the SUT is determined using the shared variable, we must prevent another user to place a request for the same product to the SUT. The SUT also must decrease its inventory of the product. Thus if another user places an order while executing the actual purchase of a product, this will decrease the inventory and the calculated inventory by the first user will be out of synch with the real inventory of the SUT once the second user has interfered.
II. A CASE STUDY
In sub-section A we define the dynamic state problem to be addressed. In sub-section B we propose three methods to specify concurrent systems tests.
A. Defining the problem
Although we have studied extensively testing of concurrency problems in industrial applications [10][11], the following simplified case study is about testing the transition of the state of a system and the kind of responses it should reply with. Here we have parallel users that send a request to a book ordering system and get two kinds of replies depending on the two possible states of the SUT: an invoice and shipping details if it has stock; or an out of stock notification. The problem is that it is impossible to predict the test oracle (predicted response) since each user is independent from each other and thus does not know the state of the SUT individually. This is similar in e-commerce applications like on-line ordering of merchandise and hotel booking and train or airline reservations systems. A typical warning message for a hotel reservation system is to warn the customer that there is only one room left at a given rate. Thus from a tester point of view, it is hard to predict if a response corresponds to a success or a failure. However, if the users are coordinated, the response to a given user can be predicted.
The interesting aspect of this simple example is that we have tried various approaches to coordination and some resulted in race condition problems, thus disturbing the test process altogether. Table I shows the values of test oracles depending on the state of the SUT, in our case: has stock; or out of stock. In short, a test passes if an
invoice and shipping confirmation is received when there is inventory left or when out-of-stock is received and the server is out of stock. All other cases are failures.
Most testers use unit testing that is simple but misses some aspects of the test. Unit testing would consist of putting the SUT in the appropriate state and check the individual responses to a request.
What is missing from a unit test is the dynamic aspect of seeing the state change as the maximum available inventory is reached.
TABLE I. EXPECTED TEST ORACLES DEPENDING ON THE STATE OF THE SUT
Response to the User/state
Has stock Out of stock
Invoice Pass Fail Out of stock Fail Pass
B. TTCN-3 test case implementation
The TTCN-3 implementation of the user parallel test component (PTC) is based on a simple request/response behavior pattern with the response being analyzed with the four possible configurations of two states and two corresponding responses making use of the TTCN-3 alt (alternative) construct. Each alternative is guarded with the predicted state of the SUT. The receive statement contains what the received message from the SUT should match and the predicate between square brackets, the predicted state of the SUT. In Figure 2, the state variable must be provided. This happens either as setting its value while starting the PTC or computing it as the PTCs place their orders. function ptcBehavior() runs on PTCType { p.send("purchase"); alt { [state == "has_stock"] p.receive("invoice") { setverdict(pass); } [state == "out_of_stock"] p.receive("invoice") { setverdict(fail); } [state == "out_of_stock"] p.receive("out_of_stock") { setverdict(pass); } [state == "has_stock"] p.receive("out_of_stock") { setverdict(fail); } }; }
Figure 2. PTC Client test verdicts situations

196
International Journal on Advances in Software, vol 13 no 3 & 4, year 2020, http://www.iariajournals.org/software/
2020, © Copyright by authors, Published under agreement with IARIA - www.iaria.org
Instead, unit testing would break down the problem into two separate test cases and especially without the need for PTCs. Here the unit is represented by a given state. First unit test case: function unitTestBehavior_1() runs on MTCType { p.send("purchase"); alt { [] p.receive("invoice") { setverdict(pass); } [] p.receive("invoice") { setverdict(fail); } Second unit test case: [] p.receive("out_of_stock") { setverdict(pass); } [] p.receive("out_of_stock") { setverdict(fail); } }
The predicates are empty because the state is predictable due to the manipulation of the SUT by the tester by emptying the data base in the first case and populating the database in the second case. Another drawback of unit testing is that the testing process would not be entirely automated since it requires a manual intervention of the tester between the two states.
Assuming that the SUT has three books on hand, the ideal testing results would be to get an invoice response for the first three users and an out of stock response for the remaining users as shown on Figure 3 and an overall pass verdict for the test.
However, the results shown in Figure 3 are only ideal and rarely happen. Instead, we see more results of the kind of Figure 4 that show the full effect of race conditions because each PTC starts at different times.
The failures shown in Figure 4 are the result of
mismatches between expected and received messages when tests are executed without coordination.
Figure 3. Ideal testing responses
This enables the tester to locate rapidly the point of failure and investigate the problem rapidly.
Figure 4. Uncoordinated execution results
Figure 5 shows the TTCN-3 tools data inspection feature that provides detailed message and test oracle contents that enable the tester to understand the reasons for failure especially when complex data types with many fields are used.
Figure 5. Expected vs received values
In this case, one may wonder where the state value
comes from. This is where the test coordination is taking place. TTCN-3 has the concept of main test component (MTC) that precisely looks after that.
In our case the coordination is achieved via abstract coordination ports cp that link the master test component and the PTCs as shown in Figure 6.

197
International Journal on Advances in Software, vol 13 no 3 & 4, year 2020, http://www.iariajournals.org/software/
2020, © Copyright by authors, Published under agreement with IARIA - www.iaria.org
Figure 6. Test coordination with MTC
There are three ways to address test coordination.
1) Using coordination messages
The approach consists in using coordination messages between the MTC and the PTCs that contain the predicted state of the SUT. On the user PTC’s side we need an additional line that receives the state from the MTC before the user attempts to test the SUT: cp.receive(charstring:?)->value state; On the MTC side, we send a message containing the state to the PTC that the tester thinks the server is supposed to be in. In our case this is achieved by changing the state once three requests have been placed as follows: testcase coordinated_msgs_test() runs on MTCType system SystemType { … cp.send("has_stock") to user1; cp.receive("ack") from user1; cp.send("has_stock") to user2; cp.receive("ack") from user2; cp.send("has_stock") to user3; cp.receive("ack") from user3; // after three purchase requests, // the item is now out of stock cp.send("out_of_stock") to user4; cp.receive("ack") from user4; cp.send("out_of_stock") to user5; cp.receive("ack") from user5; … }
Figure 7. Test coordination by MTC
In TTCN-3, the receive statement is blocking. Thus, the rest of the behavior of the PTC will not execute while the coordination message has not been received.
Note the returned ack message. The ack is used to prevent behavior racing. In other words, a new individual test cannot occur before the previous test has fully completed, otherwise more requests are being sent to the server which may change its state before a response is sent back to a user resulting in failure. We have observed that removing the ack effectively produces race conditions. We leave this verification as an exercise for the reader.
2) Coordination using PTC Threads operations PTCs are in fact translated by the TTCN-3 compiler
that produces an executable in a general purpose language (GPL) such as Java or C++ and many others using threads. Thus, one typical thread operation that is available in TTCN-3 is to check if the thread has terminated. This is represented in TTCN-3 with the keyword done. Here, as shown in Figure 8, each PTC is started using a parameter representing the function behavior that carries the predicted state of the SUT.
There are in fact two ways to use this feature: the first one consists in placing the done statement immediately after the corresponding start statement. This would result in transforming a concurrent system into a sequential execution system with effects similar to the coordination messages solution shown in the previous section. testcase thread_operations_test() runs on MTCType system SystemType { … user1.start(purchasingBehavior
("has_stock")); user2.start(purchasingBehavior ("has_stock")); user3.start(purchasingBehavior ("has_stock")); user1.done; user2.done; user3.done; user4.start(purchasingBehavior ("out_of_stock")); user5.start(purchasingBehavior ("out_of_stock")); user6.start(purchasingBehavior ("out_of_stock")); user4.done; user5.done; … }
Figure 8. MTC behavior using PTC threads operations

198
International Journal on Advances in Software, vol 13 no 3 & 4, year 2020, http://www.iariajournals.org/software/
2020, © Copyright by authors, Published under agreement with IARIA - www.iaria.org
In this second approach, we have chosen to place all the done statements after all the start statements for the first three PTCs to simulate the database reaching the zero inventory point. This has the advantage to at least conserve some of the concurrent behavior of the system and thus avoiding a full sequential test execution of PTCs.
3) Introducing semaphores to TTCN-3 In a way the second approach is less sequential than the
first one but still somewhat sequential. Thus, we have explored a third solution that would eliminate some aspects of the sequential aspect of this test behavior. The method consists in using shared variables and Java semaphores among PTCs. The shared variable keeps track of the inventory on hand and enables a PTC to determine the state of the SUT on its own. However, TTCN-3 does not have the concept of shared variables, nor semaphores. We have explored how we could implement semaphores in the Spirent TTworkbench tool [12] using the TTCN-3 concept of external functions to link the TTCN-3 abstract behavior description to functions that are written in a GPL (e.g., Java in our case). This avoids changing the ETSI standard which would require a lengthy approval process.
III. IMPLEMENTING SHARED VARIABLES AND
SEMAPHORES IN TTCN-3
In Java, shared variables are implemented using independent classes that contain the shared variable as an attribute. In TTCN-3, there is a simple way to reproduce this model using TTCN-3 user defined data types that allow the creation of PTCs that are actually translated into Java classes by the compiler. For semaphores, we will use two different types of approaches:
A semaphore data type related to an external function written in Java that creates an instance of the Java Semaphore class.
Our own definition of semaphores directly in TTCN-3.
The second approach is for the purpose of using a
more flexible kind of semaphore as opposed to the Java semaphore that blocks any process that did not acquire the semaphore. The second approach allows blocking individual resources rather than processes (here PTCs).
A. implementing shared variables
This is achieved by creating a datatype to keep track of the inventory. In this case we are trying to keep track of the inventory of two different products, product_A and product_B.
type component InventoryCompType { var integer inventory_A := 3; var integer inventory_B := 4; }
This data type is then used to create an instance of a PTC that will receive requests from users, compute the state of the inventory and reply with that state. Therefore we need to add a communication port that will be used to receive or send messages with the users:
port CoordPortType ip;
The basic inventory component is found on Figure 9. It is composed of two groups of events:
Receive a request from a user Compute the actual state of the inventory Return that state to the user
function InventoryBehavior() runs on InventoryCompType { var InventoryCompType user; alt { [] ip.receive("purchase_A") -> sender user { if (inventory_A > 0) { ip.send("has_stock") to user; inventory_A := inventory_A - 1; } else { ip.send("out_of_stock") to user; } repeat; } [] ip.receive("purchase_B") -> sender user { if (inventory_B > 0) { ip.send("has_stock") to user; inventory_B := inventory_B - 1; } else { ip.send("out_of_stock") to user; } repeat; } [] api.receive("stop") { setverdict(pass); } }
Figure 9. Inventory computation behavior

199
International Journal on Advances in Software, vol 13 no 3 & 4, year 2020, http://www.iariajournals.org/software/
2020, © Copyright by authors, Published under agreement with IARIA - www.iaria.org
B. Test configuration
There are four basic types of parallel test components
as shown in Figure 10:
The master test component (MTC) The inventory component The users components The System Under Test component (SUT)
Figure 10. Shared variable handled in a separate PTC
The SUT component defined as follows: type component SUTType { port MyPortType up; port MyAdminPortType aps;
port MyAdminPortType api; } The port up will carry all the communication messages between the SUT and the individual user PTCs. The admin port aps is used at the very end of the test in order to terminate the SUT that otherwise is in a constant loop trying to receive messages from the users. The port api is used to terminate the inventory PTC that is in a similar continuous loop. The user’s component is defined as follows: type component PTCType { port MyPortType sp; port InventoryPortType ip; } The port sp is used to communicate with the SUT while he port ip is used to communicate with the inventory PTC to inquire about the state of the inventory. Finally, we define the master test component (MTC) as follows:
type component MTCType { port MyAdminPortType aps; port MyAdminPortType api; }
The port aps is used to communicate with the SUT while the port api is used to communicate with the inventory PTC.
C. Testcase configuration under Java semaphores using TTCN-3 external functions
A TTCN-3 test case in our particular PTC
configuration is shown in the following TTCN-3 code. As shown in Figure 11, it consists of creating an instance of a Semaphore object in the MTC that is passed on to each created user PTC and connections between the MTC and each instance of user PTCs. This enables a user to acquire or release that centralized Semaphore object.
Testcase inventory_semaphore_approach() runs on MTCType system SystemType { var Users user; var SemaphoreType semaphore; semaphore := Semaphore.new();
This instance of Semaphore is then passed on to each user PTC when starting their behavior function.
for (var integer i:=0; i <nb_users; i:=i + 1) { user[i].start( purchasingBehaviorSemaphore( semaphore)) }
Figure 11. Java semaphore integration
In creating a SUT PTC and each user PTC and starting them using a specific behavior function, we also create an

200
International Journal on Advances in Software, vol 13 no 3 & 4, year 2020, http://www.iariajournals.org/software/
2020, © Copyright by authors, Published under agreement with IARIA - www.iaria.org
inventory PTC that keeps track of the inventory level for each product and that is connected to each PTC that query it. TTCN-3 is based on strong typing. Thus, while the TTCN-3 source code is converted to Java, semaphores in TTCN-3 need to be typed. The translator then maps the two versions automatically. The definition of TTCN-3 semaphore is based entirely on external functions definitions as follows: First the abstract definition of semaphores: module Semaphore { type integer SemaphoreType; external function new() return SemaphoreType; external function acquire (SemaphoreType semaphore); external function release
(SemaphoreType semaphore); } We have explored the approach of using the existing external functions definition feature of TTCN-3 to link the above abstract semaphore to the underlying Java semaphores as shown in Figure 12.
Figure 12. TTCN-3 external functions The external function Java code is as follows: package com.spirent.externalfunctions. semaphore; import java.util.HashMap;
import java.util.concurrent.Semaphore; import org.etsi.ttcn.tri.TriStatus; import com.testingtech.ttcn.annotation
.ExternalFunction; import com.testingtech.ttcn.tri. AnnotationsExternalFunctionPlugin; @ExternalFunction.Definitions( ExtSemaphore.class) public class ExtSemaphore extends AnnotationsExternalFunctionPlugin { private HashMap<Integer, Semaphore> semaphores = new HashMap<>(); @ExternalFunction(name = "new", module = "Semaphore") public int newSemaphore() { int result = semaphores.size(); semaphores.put(result, new Semaphore(1)); return result; } // external function acquire( SemaphoreType semaphore); @ExternalFunction(name = "acquire", module = "Semaphore") public void acquire(int semaphore) { try { semaphores.get(semaphore). acquire(); } catch (InterruptedException e) {throw new RuntimeException(e); } } // external function release (SemaphoreType semaphore); @ExternalFunction(name = "release", module = "Semaphore") public void release(int semaphore) { semaphores.get(semaphore). release(); } @Override public TriStatus tearDown() { semaphores.clear(); return super.tearDown(); } }

201
International Journal on Advances in Software, vol 13 no 3 & 4, year 2020, http://www.iariajournals.org/software/
2020, © Copyright by authors, Published under agreement with IARIA - www.iaria.org
While executing the test case based on external Java Semaphores, we have noticed that the results look like another type of sequence comparable to our first approach shown on Figure 3, with the only difference a random order of execution of user PTCs behavior and the calculation of the inventory state rather than the hardcoded state used in this first approach.
The user behavior is merely framed by the invocation of the semaphore acquire and release statements as shown in Figure 13. function purchasingBehaviorSemaphore( SemaphoreType semaphore) runs on PTCType { var charstring state; timer t := rnd(); t.start; t.timeout; Semaphore.acquire(semaphore); // communication with inventory PTC ip.send("purchase_A"); ip.receive(charstring:?) -> value state; // communication with SUT sp.send(request_product_A_t); alt { [state == "has_stock"] sp.receive(myInvoiceResponse_t) { setverdict(pass); } [state == "out_of_stock"] sp.receive(myInvoiceResponse_t) { setverdict(fail); } [state == "out_of_stock"] sp.receive(myOutOfStockResponse_t) { setverdict(pass); } [state == "has_stock"] sp.receive(myOutOfStockResponse_t) { setverdict(fail); } }; Semaphore.release(semaphore); }
Figure 13. User behavior with Java semaphore
D. Semaphores defined in TTCN-3
Effectively, the Java semaphore blocks completely the
execution of user PTCs that didn’t acquire the semaphore as of yet. Here we have determined that this does not provide a full concurrency behavior. Thus, instead, we have focused on a resource-oriented semaphore that would block the inventory rather than the user processes. This would allow a user to purchase product A while another user would purchase product B. There are no race condition in such a case.
In this approach, we need a mechanism in the
inventory PTC to block its access by any PTC that did not successfully acquire the semaphore.
The test case is similar to the one used for the Java semaphore example with one major difference, there is no instance of a Java semaphore. Our own semaphore is actually implemented in the Inventory behavior where the inventory shared variables are protected.
1) User behavior
The user no longer uses the Java semaphore but instead invokes our own semaphore using TTCN-3 procedure invocations (call acquire) as shown on Figure 14. Since TTCN-3 procedures are non-blocking, the semaphore call will wait until the resource (inventory) is released again. This is indicated by the getreply statement that is triggered only if the call to acquire is accepted. The rest of the user behavior is identical to the one used for Java semaphores. Function purchasingBehaviorInventoryComp() runs on InventoryPTC { var charstring state; semaphore.call(acquire:{}, 100.0) { [] semaphore.getreply {} [] semaphore.catch(timeout) { setverdict(inconc, "could not acquire semaphore"); return; } } inventory.send("purchase_A"); inventory.receive(charstring:?) -> value state;

202
International Journal on Advances in Software, vol 13 no 3 & 4, year 2020, http://www.iariajournals.org/software/
2020, © Copyright by authors, Published under agreement with IARIA - www.iaria.org
p.send(request_product_A_t); alt { [state == "has_stock"] p.receive(myInvoiceResponse_t) { setverdict(pass); } [state == "out_of_stock"] p.receive(myInvoiceResponse_t) { setverdict(fail); } [state == "out_of_stock"] p.receive(myOutOfStockResponse_t) { setverdict(pass); } [state == "has_stock"] p.receive (myOutOfStockResponse_t) { setverdict(fail); } } } semaphore.call(release:{}); }
Figure 14. user behavior with our definition of semaphores
2) Use of semaphores in the inventory PTC
The procedures acquire_A and release_A and their corresponding names for product B are residing in the inventory behavior. Here we are using the variables inventory_A_blocked and its counterpart for B to control which part of the inventory calculation code can be reached. function InventoryBehavior() runs on SemaphoreInventory { var integer blockedBy_A := -1; var integer blockedBy_B := -1; var InventoryPTC user; var boolean inventory_A_blocked := false; var boolean inventory_B_blocked := false; alt { [inventory_A_blocked == false] any from sem_p.getcall(acquire_A:{}) -> @index value blockedBy_A { inventory_A_blocked := true; sem_p[blockedBy_A].reply( acquire_A:{}); repeat; }
[inventory_A_blocked == true] sem_p[blockedBy_A].getcall( release_A:{}) { blockedBy_A := -1; inventory_A_blocked := false; repeat; } [inventory_B_blocked == false] any from sem_p.getcall(acquire_B:{}) -> @index value blockedBy_B { inventory_B_blocked := true; sem_p[blockedBy_B].reply( acquire_B:{}); repeat; } [inventory_B_blocked == true] sem_p[blockedBy_B].getcall( release_B:{}) { blockedBy_B := -1; inventory_B_blocked := false; repeat; } [inventory_A_blocked == true] inventoryPort.receive( "purchase_A") -> sender user { if (inventory_A > 0) { inventoryPort.send( "has_stock") to user; inventory_A := inventory_A - 1; } else { inventoryPort.send( "out_of_stock") to user; repeat; } [inventory_B_blocked] inventoryPort.receive( "purchase_B") -> sender user { if (inventory_B > 0) { inventoryPort.send("has_stock") to user; inventory_B := inventory_B - 1; } else { inventoryPort.send( "out_of_stock") to user;

203
International Journal on Advances in Software, vol 13 no 3 & 4, year 2020, http://www.iariajournals.org/software/
2020, © Copyright by authors, Published under agreement with IARIA - www.iaria.org
} repeat; } [] api.receive("stop") { setverdict(pass); } } }
Figure 15. Inventory behavior with TTCN-3 semaphores
The execution of a single component’s behavior produces the sequence of events shown on Figure 16. We can clearly observe that when the inventory PTC replies with the has_stock message, the actual purchase message sent to the SUT results in an invoice coming back from the SUT.
Figure 16: Single user sequence of events
E. Mutually Exclusive Behavior Blocks
As can be seen easily, this way of modeling semaphores is very complicated and the code obfuscates the intent, reducing the manageability.
We therefore propose to add a new feature to TTCN-3 that allows controlled, shared access to component variables from the scope of other component behaviors.
This would be syntactically modelled by an on-statement of the following form:
on ComponentRef [@readonly] StatementBlock
The StatementBlock would be allowed to access component variables of the component referenced via ComponentRef via dotted notation.
The on-statement uses an implicit read lock (in case of @readonly) or read-write lock behavior otherwise of a re-entrant lock associated with the referenced component. It is assumed that there is one such re-entrant execution lock associated with every created component. If the read-
write lock is acquired by any component, no other component can acquire the lock of that component. If the read-lock of a component is acquired by any component, the read-write lock of the component can not be acquired.
Components trying to acquire a lock that can currently not be acquired block their execution until the lock becomes available again or their behavior is terminated.
The read-write lock is acquired whenever the component starts executing behavior or when a non-read only on-statement for that component is entered. It is released when the component terminates its current behavior or starts waiting in an alt statement or when the outermost on-statement referencing the component in the behavior of another component is left.
The read-lock of a component is acquired whenever a read-only on-statement for that component is entered. Thus, it is possible that several components read the component variables of one component in parallel or that a single component has read-write access to the referenced components variables at any one time.
The advantage of this more declarative approach is that the code is more readable and that it is possible to statically analyse the types and names of the used variables, whether they are only read in read only on-statements.
Using this construct, the inventory component becomes a simple shared variable container without any executed behavior and is passed as a reference to each PTC for referencing when starting the following behavior. function purchasingBehaviorInventory (InventoryComp inventory) runs on PTCType { on inventory { // acquired read-write lock of // inventory var charstring state; if (inventory.inventory > 0) { state := "has_stock"; inventory.inventory := inventory.inventory - 1; } else { state := "out_of_stock"; } p.send(myRequest_t); alt { [state == "has_stock"] p.receive(myInvoiceResponse_t) { setverdict(pass); } [state == "out_of_stock"]

204
International Journal on Advances in Software, vol 13 no 3 & 4, year 2020, http://www.iariajournals.org/software/
2020, © Copyright by authors, Published under agreement with IARIA - www.iaria.org
p.receive(myInvoiceResponse_t) { setverdict(fail); } [state == "out_of_stock"] p.receive(myOutOfStockResponse_t) { setverdict(pass); } [state == "has_stock"] p.receive(myOutOfStockResponse_t) { setverdict(fail); } } } // release read-write lock of // inventory }
F. Mixing blocked and free behavior
Testing web applications has been studied intensively
for several decades. An early attempt can be found in [14]. However, none of them mention race conditions.
So far, we have shown the simple behavior of users that create race conditions. This is achieved by blocking shared variables and behavior sequences. However, events in an e-commerce application are not always subject to race condition. The race condition occurs only when a user is trying to make a purchase and thus the state of the inventory must be determined. On the other hand, browse events are not subject to race conditions at all. They can occur any time without affecting inventories states. Thus, we have created an example where browse events precede the purchasing event and we have introduced sequences of different purchase events.
With several users and the alternate blocked and unblocked behaviors of users we may end up with various sequences of events interleaving between the users. The sequence in Figure 17 shows that user2 places its order of product A before user1 places its order for product B. The actual specification of a user’s behavior may suggest that a given user may place orders for product A and product b in strict sequence without interruption by another user but this figure clearly shows that this is not the case. Here the unblocked browse event allowed such an interleaved sequence. However, it is to be noted that block portions of behavior remain together and thus cannot be interrupted by another user.
IV. TTCN-3 AS A MODELLING LANGUAGE
Normally, testing activities can take place only once the SUT has been fully developed and is runnable. However, planning and developing automated test cases can be done in parallel to the SUT development phase. More importantly, the missing SUT can be emulated using TTCN-3. This enables us to find any flaws in the
automated test suites before we apply them to the SUT and thus reduce time to market.
Figure 17. Multiple users: possible sequence of events
In our case study, this means finding a way to portray
a behavior that replies with “invoice” when there is inventory on hand and replies “out of stock” when inventory has reached zero. At the abstract level, there is no need to implement a full system, in our case probably a web application and a related database. The implementation of such an abstract system is as follows: function SUTbehavior() runs on SUTType { var integer inventory := 3; var PTCType ptc := null; var MTCType mtc_ := null; alt { [] p.receive("purchase") ->

205
International Journal on Advances in Software, vol 13 no 3 & 4, year 2020, http://www.iariajournals.org/software/
2020, © Copyright by authors, Published under agreement with IARIA - www.iaria.org
sender ptc { if(inventory > 0) { p.send("invoice") to ptc; inventory := inventory -1; } else { p.send("out_of_stock") to ptc; }; repeat } [] ap.receive("stop")
-> sender mtc_ setverdict(pass) } } }
Figure 18. SUT behavior
We use a simple variable to portray the inventory that we set at 3 units. Every time a request to purchase an item comes in, we decrease the inventory. A simple if-then-else statement provides the correct response of invoice or out-of-stock state. At the abstract level, this is all we need.
Also, the test suite is developed in two different levels of abstraction. First, we use simplified messages like simple strings. Once we simulate the abstract system and we are happy with the results, in a second step we merely redefine the abstract data types and its corresponding templates (test oracles for received messages and data content for sent messages) as follows: 1st step: Data types and templates declarations: type charstring RequestType; type charstring ResponseType; template RequestType myRequest_t :=
"purchase"; template ResponseType
myInvoiceResponse_t := "invoice";
template ResponseType myOutOfStockResponse_t:=
"out_of_stock"; Figure 19. Simplified data types and templates
2nd step: Real data types and templates: type record RequestType { charstring bookName, charstring ISBN } type record ResponseType {
charstring bookName, charstring ISBN, charstring status, charstring action } template RequestType myRequest_t := { bookName := “ttcn-3 in a nutshell”, ISBN := “978-2-345-678” } Template ResponseType myResponse_t := {
bookName := “war and peace”, ISBN := “978-2-345-678”, Status := “on hand”, Action := “invoice” }
Figure 20. Fully realistic data types and templates
Note that both datatypes and templates are defined using the same identifiers. Only their content is different.
V. CONCLUSION
Despite its long history, testing concurrent systems remains complex and does not always provide accurate results. In this paper we have shown that using formal methods for testing such as TTCN-3 helps to locate problems accurately because of the wide choice of results visualization features that the various commercial and open source editing, and execution tools provide. We also have experimented with the TTCN-3 external functions concept in order to implement shared variables and Java semaphore features for the MTC and the PTCs. We have discovered that the traditional Java semaphores approach prevents true concurrency testing and we have developed a system that allows blocking resources rather than processes to avoid racing conditions which provides a considerably more flexible concurrency testing.
ACKNOWLEDGMENT
The authors would like to thank NSERC for funding this research.
REFERENCES [1] B. Stepien and L, Peyton, Test Coordination and Dynamic
Test Oracles for Testing Concurrent Systems, in Proceedings of SOFTENG 2020
[2] E. Boros and T. Unluyurt, Sequential Testing of Series-Parallel Systems of Small Depth, in ISBN 978-1-4613-7062-8
[3] A. Bertolino, Software Testing Research: Achievements, Challenges, Dreams in Proceedings of FOSE ’07 pp. 85-103
[4] T. Hanawa, T. Banzai, H. Koyzumi, R. Kanbayashi, T. Imada and M. Sato, Large-Scale Software Testing Environment Using Cloud Computing Technology for

206
International Journal on Advances in Software, vol 13 no 3 & 4, year 2020, http://www.iariajournals.org/software/
2020, © Copyright by authors, Published under agreement with IARIA - www.iaria.org
Dependable Parallel and Distributed Systems in 2010 Third International Conference on Software Testing, Verification and Validation Wokshops Procedings
[5] A. M. Alghamdi and F. Eassa, Software Testing Techniques for Parallel Systems: A Survey in IJCSNS International Journal of Computer Science and Network Security, vol 19, No. 4, April 2019, pp. 176-184
[6] L. Parobek, 7 Reasons to Move to Parallel Testing in white paper on https://devops.com/7-key-reasons-make-move-sequential-parallel-testing/, last accessed December 14th, 2020
[7] B. Rao G. , K. Timmaraju, and T. Weigert, Network Element Testing Using TTCN-3: Benefits and Comparison in SDL 2005, LNCS 3530, pp. 265–280, 2005
[8] G. Din, S. Tolea, and I. Schieferdecker, Distributed Load Test with TTCN-3, in Testcom 2006 Proceedings, pp. 177-196
[9] ETSI ES 201 873-1, The Testing and Test Control Notation version 3 Part 1: TTCN-3 Core Language, May 2017. Accessed March 2018 at
http://www.etsi.org/deliver/etsi_es/201800_201899/20187301/04.09.01_60/es_20187301v040901p.pdf
[10] B. Stepien, K, Mallur, L. Peyton, Testing Business Processes Using TTCN-3, in SDL Forum 2015 proceedings, Lecture Notes in Computer Science, vol 9369. Springer, Cham. Pp. 252-267
[11] B. Stepien, L. Peyton, M. Shang and T. Vassiliou-Gioles, An Integrated TTCN-3 test framework architecture for interconnected object-based applications in IJEB vol. 11, No. 1, 2014
[12] TTworkbench,Spirent, https://www.spirent.com/Products/TTworkbench, last accessed December 14th, 2020
[13] Titan, https://projects.eclipse.org/proposals/titan, last accessed December 14th, 2020
[14] F. Ricca and P. Tonella, Testing Processes of Web Applications in Annals of Software Engineering 14, pp. 93-114 (2002)

207
International Journal on Advances in Software, vol 13 no 3 & 4, year 2020, http://www.iariajournals.org/software/
2020, © Copyright by authors, Published under agreement with IARIA - www.iaria.org
Reusing and Deriving Games for Teaching Software Reuse
Diego Castro, Claudia Werner
COPPE/Computer Systems Engineering ProgramFederal University of Rio de Janeiro{diegocbcastro, werner}@cos.ufrj.br
Rio de Janeiro, Brazil
Abstract—Software Reuse (SR) is a crucial discipline that seeksto create new products using pre-existing artifacts. Companiesare increasingly looking for members with these skills. However,they do not always find them. One of the possible causes isthe lack of dedication of students in the classroom. To increasestudents’ motivation and engagement in the classroom, manyscholars are already using games as a teaching method, dueto the various advantages that this strategy can bring to thecurrent teaching method. SR can be related to several areas,such as Software Engineering, processes, or programming, morecommonly associated with the latter. Based on this, the papersought to identify games that aimed to teach programming butcould also be used to teach the fundamentals of software reuse.Two games were created/derived from those found, and it wasconcluded that games could be derived or reused for more thanone teaching context.
Keywords–game; game-based-learning; software reuse; pro-gramming; systematic mapping.
I. INTRODUCTION
This work is an extension of the paper presented byCastro and Werner [1] at the 6th International Conference onAdvances and Trends in Software Engineering (SOFTENG -IARIA), Lisboa, Portugal.
In general, software is still largely built from scratch.Ideally, existing documents (source code, project documents,etc.) could be copied and adapted to new requirements. How-ever, the goal of reuse is still far from ideal [2]. Reuseis something intrinsic to people, and nothing is made fromscratch - everything is built from something [3]. This is thebasic principle of reuse, creating something from somethingpreviously built.
Software Reuse (SR) is a discipline based on this context,seeking to use existing elements (which were built to bereused) to create new ones. In general, the term SR refersto a situation in which some software is used in more thanone project. In this context, software is defined as one or moreitems that are part of a productive organization’s process. Thus,software can refer to the source code or any other productin its life cycle, such as requirements, designs, test plans,documentation, etc. [4]. With the correct use of this discipline,it can provide several positive impacts in a variety of contexts,such as quality, cost, productivity, code-making performance,rapid prototyping, reduced code writing, reliability, and inter-operability of software [2].
Despite the advantages offered by reuse, discomfort isusually expressed by statements such as: ”We don’t want todo extra work to benefit someone else”; ”We can do it better”;
”We won’t use it if it was created by someone else”; andeven competition within organizations can be an obstacle inthis regard [2]. Despite all these problems mentioned, there isstill one that is seen as the main factor for reuse not beingimplemented, which is the difficulty of learning in this area[5].
One of the biggest obstacles that educators face in theteaching process is the need to use methods that effectivelymake students pay attention in class and learn easily. Manystudents with little class time have already lost their focusin the discipline being taught. This can be a reflection ofthe passive teaching method being strongly centered on theteacher, lectures, and slides without approaches that capturethe student’s attention [6].
Based on this, educators are increasingly looking for inno-vative learning strategies that combine pleasure with educationso that it is possible to solve problems by teaching a subject[6]. Thus, alternative teaching methods are sought with whichthe student can interact and make better use of teaching, in apractical and attractive way. Based on this, a possible solutionto make this learning more pleasurable is the use of gamesas a teaching tool. Most games are interactive, which is oneof the main ways of distraction and pleasure, making them anexcellent way to remind students of what has been taught [7].
The study presented in this paper is part of a more extensivestudy that sought to find and produce games for teaching soft-ware reuse. The study initially did not find any work that madespecific reference to a game for teaching reuse. Still, it wasobserved that SR might be contained in different areas, suchas programming, Software Engineering (SE), among others.However, the programming area is usually the most referenced[8]. Based on the information provided, this study aims toidentify games that have the purpose of teaching programmingwith emphasis/potential for reuse, that is, to find games thatwere developed for teaching programming, but could be usedto teach some of the fundamentals of software reuse, such aslogical reasoning development, function development, objectorientation, among others.
Based on each of the games found, a possible modificationor its use for teaching SR was proposed. Based on theseproposals, it was understood that games could be derived orreused for more than one context. With this, two more gameswere derived from those found for SR teaching.
The remainder of this paper is presented as follows: SectionII presents some related works, Section III describes theresearch method used in the systematic mapping, Section IVshows some results that were found, Section V demonstrates

208
International Journal on Advances in Software, vol 13 no 3 & 4, year 2020, http://www.iariajournals.org/software/
2020, © Copyright by authors, Published under agreement with IARIA - www.iaria.org
an example of how one of the games found could be used toteach SR, and Section VI shows the threats to validity andconcludes with the final remarks.
II. RELATED WORKS
This section aims to briefly present some related worksthat served as inspiration for this study. The papers showstudies on teaching programming through games and makesome observations about this method.
According to Combefis, Beresnevicius, and Dagiene [9]several game-based platforms offer programming teaching. Intheir work, they sought to identify several games that aim toteach programming; each game’s characteristics and elementsare shown in the paper.
Malliarakis et al. [10] sought to review the features thatshould be supported by educational games and which educa-tional games already support these features for programming.In this work, several games were reviewed. Their characteris-tics were demonstrated through a relationship table, showingeach of the observed games’ elements and features.
Miljanovic and Bradbury [11] evaluated 49 games forteaching programming to find characteristics of friendliness,accessibility, learning effect, and involvement. From the tablesof elements presented in the paper it was possible to identifyseveral games that sought to teach concepts involved withSoftware Reuse, such as functions, object orientation, andrecursion. It is worth remembering that the research areasdemonstrated in these papers are part of both Programmingand Software Reuse, and there is an intersection of contentbetween them.
From these works and related information, it was possibleto observe that many of the observed games had essentialcharacteristics that could be used for teaching Software Reuse.
III. RESEARCH METHOD
Systematic mapping is a secondary study method based ona structured and repeatable process or protocol that exploresstudies and provides a result in the form of an overview ofa particular subject [12]. The mapping presented follows theprotocol proposed by Kitchenham [13].
The research process presented in this study covers ar-ticles published by the end of 2018 and aims to conducta systematic mapping to identify games that were built forprogramming teaching but could be used to teach softwarereuse fundamentals, such as logical reasoning development,function development, object orientation, among others.
A. Research Questions• Q1: What is the main advantage / motivation of the use
of games to teaching programming language?• Q2: What is the disadvantage of the use of games to
teaching programming language?• Q3: What is the main characteristic of the game used?• Q4: What was the evaluation method used?
The mapping presented followed well-defined steps so thatit was possible to reach a set of articles that were of interest tothe search [13]. The search string was executed in Scopus asrecommended by other studies [14] [15], and then the inclusionand exclusion criteria were applied to the set of articles thatwere found based on the title, abstract, and full text.
B. Inclusion criteria• The article must be in the context of using games for
programming language teaching;• The article must provide clues about software reuse• The article must provide data to answer at least one of
the research questions;• The article should be written in English.
C. Exclusion criteria• Book chapters, conference call;• Studies that can not be fully accessed (i.e., papers that
could not be downloaded).
D. Search string and AnalysisThe definition of the search string was based on the
Population, Intervention, Comparison, Outcome (PICO) struc-ture [16], using three of the four levels. The search string wasdefined by grouping the keywords of the same domain withthe logical operator “OR” and grouping the two fields withthe logical operator “AND”. However, we chose to use a datefilter, searching only for articles that were published withinfive years, aiming to find more recent works in the area [17].Table I demonstrates the PICO structure used in conjunctionwith the search string. Initially, the search string returned atotal of 507 papers. When analyzed according to the inclusionand exclusion filters, this number dropped to 17 papers.
According to Motta et al. [14] and Matalonga et al. [15],the snowballing procedure can mitigate the lack of other searchengines, complement the strategy. Therefore, to minimize theloss of some articles, the snowballing procedure were chosen,looking at the references and citations of the articles lookingfor relevance [15]. The snowballing process is divided intotwo stages, backward and forward. The backward processaims to identify new articles based on the works that werereferenced in the article that was analyzed, and the forwardrefers to the identification of new papers based on the worksthat referenced the paper that was analyzed [15]. From the useof this procedure, it was possible to include nine more papers,three of them through the forward process, and six throughthe backward process, resulting in a total of 26 papers. Figure2 demonstrates a summary of the data extraction process thatwas used in this work. Table II shows how these 26 articleswere obtained, and Table III shows each of these articles,demonstrating which questions were answered by each paper.
TABLE I. SEARCH STRING
PICO SYNONYMS
PopulationProgramming language, algorithm experience, algorithm skills,algorithm alternative, algorithm method, coding experience,coding skills, coding method, coding alternative
Intervention Tutoring, teach*,instruction, discipline, schooling, education*,mentoring, course, learn*,train*, syllabus
Comparison Not applicable
Outcome Game*, gami*, play*, “serious games”, edutainment,“game based learning”, simulation
SEARCH STRINGTITLE-ABS-KEY ( ( ”programming language” OR ”algorithm experience”OR ”algorithm skills” OR ”algorithm alternative” OR ”algorithm method”
OR ”coding experience” OR ”coding skills” OR ”coding method” OR”coding alternative”) AND ( tutoring OR teach* OR instruction OR
discipline OR schooling OR educat* OR mentoring OR course OR learn*OR train* OR syllabus ) AND ( game* OR play* OR ”serious
games” OR gami* OR edutainment) AND ( LIMIT-TO ( PUBYEAR , 2018 )OR LIMIT-TO ( PUBYEAR , 2017 ) OR LIMIT-TO ( PUBYEAR , 2016 )
OR LIMIT-TO (PUBYEAR , 2015 ) OR LIMIT-TO ( PUBYEAR , 2014 ) ) )

209
International Journal on Advances in Software, vol 13 no 3 & 4, year 2020, http://www.iariajournals.org/software/
2020, © Copyright by authors, Published under agreement with IARIA - www.iaria.org
TABLE II. ANALYSIS OF THE PAPERS
Main Study Snowballing backward Snowballing ForwardActivity Result Number of papers Result Number of papers Result Number of papersFirst Execution 507 added 507 389 added 389 123 added 123Repeated Papers 6 withdraw 501 294 withdraw 95 16 withdraw 107Papers in another language 0 withdraw 501 14 withdraw 81 13 withdraw 94Remove conference / workshops 16 withdraw 485 0 withdraw 81 0 withdraw 94Remove books 0 withdraw 485 0 withdraw 81 0 withdraw 94Remove by title 368 withdraw 117 46 withdraw 35 58 withdraw 36Remove by abstract 83 withdraw 34 17 withdraw 18 18 withdraw 18Papers not found 0 withdraw 34 0 withdraw 18 0 withdraw 18Remove by full paper 17 withdraw 17 12 withdraw 6 13 withdraw 3Total papers included 17 papers 6 papers 3 papersExtracted Papers 26 papers
TABLE III. TRACEABILITY MATRIX.
Title Year Q1 Q2 Q3 Q4Perceptions of Scratch programming among secondary school students in KwaZulu-Natal, South Africa 2018 X X XRobo3: A Puzzle Game to Learn Coding 2018 X X X XImproving programming skills in engineering education through problem-based game projects with Scratch 2018 X X XIntroducing novice programmers to functions and recursion using computer games 2018 X X XIntroducing programming using “scratch” and “greenfoot” 2018 X X XDeveloping Educational 3D Games With StarLogo: The Role of Backwards Fading in the Transfer ofProgramming Experience 2018 X X X X
Learning to think and practice computationally via a 3D simulation game 2018 X X XDesign and implementation of Robo3 : an applied game for teaching introductory programming 2017 X X XA cross-cultural review of lightbot for introducing functions and code reuse 2017 X XUsing Digital Game as Compiler to Motivate C Programming Language Learning in Higher Education 2017 X X XCubely: Virtual reality block-based programming environment 2017 X X XAnalysis of the learning effects between text-based and visual-based beginner programming environments 2017 X X XVisual programming language for model checkers based on google blockly 2017 X X XEducational resource based on games for the reinforcement of engineering learning programmingin mobile devices 2016 X X X
Teaching abstraction, function and reuse in the first class of CS1 - A lightbot experience 2016 X X XFrom Alice to Python Introducing text-based programming in middle schools 2016 X X XVisual programming languages integrated across the curriculum in elementary school: A two year casestudy using Scratch” in five schools 2016 X X X
Building a Scalable Game Engine to Teach Computer Science Languages 2015 X X XA mobile-device based serious gaming approach for teaching and learning Java programming 2015 X XCoding with Scratch: The design of an educational setting for Elementary pre-service teachers 2015 X X XDroplet, a Blocks-based Editor for Text Code 2015 X X XIntegrating Droplet into Applab – Improving the usability of a blocks-based text edit 2015 X X XThe development of a virtual learning platform for teaching concurrent programming languages insecondary education: The use of open Sim and Scratch4OS 2014 X X X X
Effects of using Alice and Scratch in an introductory programming course for corrective instruction 2014 X X XA structured approach to teaching recursion using cargo-bot 2014 X X XThe Effects of Teaching Programming via Scratch on Problem Solving Skills: A Discussion fromLearners, Perspective, Informatics in Education 2014 X X X
IV. RESULTS
The articles found in this study sought to demonstrategames that could be used in teaching some concepts relatedto programming. However, the analysis of the documents wasperformed in search of works that could be used to explainsome of the concepts of SR. From this, works that were notdeveloped with this context but could be used for this purposewere also found. Figure 2 groups the articles by location andyear of publication. It is possible to see an increase in thenumber of publications over the years and that many countriesare looking for improvements in this area.
The bottom of the figure also shows the number of articlesfound grouped by game type. However, some papers used morethan one approach. From Figure 2, it is possible to observe that
the most used way to teach programming is through the useof ”blocks of code”. Although this is not a real game, it usesmany features similar to games, such as the use of graphicalinterfaces, sounds, and tasks to be done. Thus, these paperswere also considered in this work.Q1: What is the main advantage / motivation of the useof games to teaching programming language?
Video games have been in our lives for more than 50 years,quickly becoming one of the most important, profitable, andinfluential forms of entertainment [19]. A game is an activitybetween two or more decision-makers who seek to achievetheir goals in some limited context. A more conventionaldefinition is that games are systems in which users participatein an artificial conflict, defined by rules, which ends in a

210
International Journal on Advances in Software, vol 13 no 3 & 4, year 2020, http://www.iariajournals.org/software/
2020, © Copyright by authors, Published under agreement with IARIA - www.iaria.org
Figure 1. Summarization of the research protocol based on the modelcreated by Calderon et al. [18]
Figure 2. General analysis of the articles found.
quantifiable result [20].Games are a visible and physical representation of a prob-
lematic space, a captured mental model that can be repeated.They are places to: test new ideas and experiment theories;repeat the training as many times as necessary; where timeand space can be contracted or expanded; learn more fromfailure than from success [21] [19].
Many benefits are associated to the use of games ineducation, such as increased collaboration and competition, thecreation of immediate feedback, the possibility of reflecting onthe results achieved and the transfer of content so that learningis an integral part of gameplay, where the student must usethe knowledge acquired in class to solve a problem within the
TABLE IV. Advantages of using games as a teaching technique.
Advantage ReferencesEntertainment [22, 23, 27, 29–37]Practical knowledge [20, 23, 27, 37, 38, 38–44]Engagement and motivation [23, 29, 31, 35, 36]Knowledge retention [22, 23, 35, 36, 45]Interactivity [36]Immediate feedback [29, 31, 32, 35]Reflection [23, 36]Immersion [36]Real Scenery [32, 36]Risk-free experience [36]
game [22] [23] [24].Using games as a reinforcement tool to teach skills can be
a very beneficial strategy for students. They have proven to bea useful tool to complement conventional learning methods.Games allow visualizing concepts that may be too abstract.They also help you get acquainted with the knowledge andmethods that may be tedious to study, offering a cycle ofchallenges and rewards that drives the learning experience [25].
Many authors claim that games have several characteristicsthat can benefit teaching [22] [26]. They have already beenused as successful educational tools in many different fieldsand topics, such as engineering, learning languages, theaterand even health [27]. The advantages include: increased stu-dent motivation and engagement, enhancement of pre-existingknowledge, increased performance in practical activities, im-mediate feedback, fun and satisfaction, among others [25].
Finally, some visual programming languages were alsoidentified that are not directly considered games, but that usevery similar characteristics, such as increased motivation andstudent engagement, use of graphical interfaces, among others.Visual programming is the use of visual expressions in aprogramming environment as an editing shortcut to generatecode that may or may not have a different syntax than thatused in textual coding [28]. There are several advantages tousing visual programming, and the main ones are [5] [12]:Code generation through the combination of blocks; Make pro-gramming more accessible to a specific audience; Improve thequality with which people perform programming tasks; Reducethe number of errors generated by beginning programmers, nothaving to worry about the language syntax; Improve the speedwith which people perform programming tasks; feedback andvisual execution; and Minimize the command set.
Several advantages were found in relation to the use ofgames as a teaching strategy, Table IV demonstrates each oneof these.
Q2: What is the disadvantage of the use of games toteaching programming language?
The limited use of serious games in formal educationmay be related to the issues surrounding the use of leisuregames, such as a view where games can be addictive, arenot productive, and can teach wrong concepts. Another veryrelevant point regarding the non-use of games as a teachingmedium is that players usually learn through repetition, pat-terns, and exploration, which contrasts with the learning of

211
International Journal on Advances in Software, vol 13 no 3 & 4, year 2020, http://www.iariajournals.org/software/
2020, © Copyright by authors, Published under agreement with IARIA - www.iaria.org
discrete amounts of information, as it occurs in schools andundergraduate courses in general [46].
Despite the advantages offered by games as a teachingmethod, there are also some issues involving this approach.The first problem found was the comparison of the level oflearning provided by a game as a teaching method and a classwith textual programming. Despite the advantages offered bygames, textual programming can still convey better content[35]. Despite the advantages offered by visual programming,it was also observed that text-based programming achievedbetter results in relation to knowledge transfer [21].
Another problem identified was the complexity of the gamecreated. If the teaching tool used is too complicated, studentscan reduce the time spent solving problems to focus more onthe tool. This is an unwanted distraction, and any game usedshould be easy to use, allowing the student to focus on solvingthe problem rather than how to use the game [38].
Finally, the last problem identified was that although gamesprovide several advantages, they are not seen as self-sufficient.Professional follow-up and feedback on the course are requiredto solve any problem that may arise throughout the learningprocess [38]. Therefore, it is unlikely to teach students newcontent just by using games. They are mostly used to reinforcecontent that has already been presented by a teacher.
Q3: What is the main characteristic of the game used?This study identified several games that sought to teach
programming through increased motivation and engagementthrough fun. Most of these games were designed to be usedby users with minimal or no knowledge of programminglanguages [45].
The first game found was LightBot, which is a game toteach programming logic and has features such as multi-level,difficulty progression, feedback, challenges, use of similartasks, concepts of functions, abstraction, flow control andrecursion [29] [31] [34]. Another game very similar to the onedescribed above is Cargo-Bot, which has the same characteris-tics, but with other gameplay that revolves around a crane thatmoves and stacks a set of colored boxes. Players write smallprograms to move boxes from one initial setup to another [23].Another game called Robo3 was found that had characteristicsvery similar to those described [25].
Another game very similar to the ones listed above was agame designed to teach Java programming that, to advance thelevels, the player needs to overcome different levels. As theplayer surpasses these levels, he or she can progress throughthe story, unlocking new elements and gaining experiencepoints to unlock new content [45].
Another game found was Lost in Space, which includes,among other components, a game rules system, a physicsengine, and a rendering engine. The game screen is dividedinto two parts. The left side containing the code interpretertext area and a help window and on the other side, the gamephase. Through this game, some features were highlighted,such as obstacles, code interpreter (pseudocode of the game),collisions, movement, enemy and attack system [27].
In this research, we also identified some visual program-ming languages that are not considered as games directly, butthat uses ”block” approach to building programs. The first
TABLE V. Characteristics used in games as teaching techniques.
Characteristics ReferencesScore [17, 23, 25, 27, 29, 31, 45, 50]Levels [23, 25, 27, 29, 31, 45]Checkpoints [23, 25, 29, 31, 45]Competition and collaboration [22]Feedback [23, 25, 27, 29, 31]Simulation [36]Final result [23, 27, 29, 31, 36, 45]Real scenario [36]Challenge [22, 23, 25, 27, 29, 31, 36, 45]Dependence between contents [22, 29]Stimulating graphics [22, 23, 27, 29, 36]
two to be identified were Alice [32] and Scratch [30], whichare block-based visual programming languages designed topromote media manipulation for new programmers. From theselanguages, it is possible to upload media projects and scripts,animated stories, games, book reports, greeting cards, musicvideos, tutorials, simulations, and art and music projects. Twoother languages very similar to those described are StarLogoTNG [35] and Droplet [47] [48], which are also drag-and-dropvisual languages.
Greenfoot is an integrated tool that aims to teach object-oriented programming. Also, the tool allows teachers to intro-duce the most essential and fundamental concepts of objectorientation in an easily understandable way [49]. Finally, thelast visual language found is called Google Blockly [43],which is a library for building visual programming editors.
Finally, another feature that was used to create these gameswas the use of virtual and augmented reality. The Cubely gamemade use of these technologies to develop an idea that blendedblock programming concepts and the Minecraft game [36].
Several characteristics were found in the games that wereevaluated. Table V shows each of them.
Q4: What was the evaluation method used?Several evaluation methods were identified in this research.
However, in general, all evaluations have a questionnaireapplied to a specific population after using the tool to validateit [35] [32] [43].
Another possible means of the evaluation was the use ofcontrol groups where one group used the tool, and the otherdid not, and the same questionnaire was applied to both groups[27]. Through this assessment, it is possible to find out ifthere was a gain of experience through the tool use since it ispossible to compare the results of the two groups.
The last evaluation method found was about the use of thetool as part of the discipline — the tool as a complement tothe teaching of programming [42].
V. DISCUSSION
A. Reusing games to teach SRThis mapping found several games; however, none of them
was produced to teach SR. Nevertheless, these games, withonly a few or no modifications, could be used to explain certainconcepts of SR, such as the importance of reusing, softwarecomponents or code reuse.

212
International Journal on Advances in Software, vol 13 no 3 & 4, year 2020, http://www.iariajournals.org/software/
2020, © Copyright by authors, Published under agreement with IARIA - www.iaria.org
Thinking about this idea of teaching SR, visual languageplatforms, such as Scratch [30], Alice [32], Droplet [47], andGoogle Blockly [43] could, for example, be used to teach codereuse or software components. A software component can beunderstood as a software unit with a well-defined interface andexplicitly specified dependencies. It can have different sizesand can be characterized in different ways, from a small pieceof code, a software package, a web service, a module thatencapsulates a set of functions, or it can even be as large asa program [2]. All the visual languages have a strong base ofreuse, where the user creates programs by joining blocks (i.e.,pre-produced components). Therefore, it is possible to under-stand the “blocks” of visual programming code as softwarecomponents. Both (blocks and components) can be seen aspieces of code that exercise a specific functionality and mustbe reused to produce a new program.
Robo3 [25], CargoBot [23] and Lightbot [29] are gamesof puzzle type and are very similar. The general idea of thesegames is to create sequences of activities (which are describedas functions) that perform a task, such as taking the avatarfrom point A to point B or moving boxes from one initial setupto another. Thinking about this type of games, these functionscan be used in the game several times, teaching the student theconcept and importance of code reuse. Cubely [36] is a gamebased on Minecraft, and its mechanics can be understood ascombining a puzzle game with a bit of visual programming.In this game, the user must create cubes with a pre-definedaction that looks like a software component. With this in mind,it is possible to use the game to teach components and theimportance of reusing software, forcing the user to reuse tocomplete the puzzle.
Lost in Space [27] was another game found that could beused to teach software components. A tittle modification in thegame mechanics would be enough, the idea would be to usecomponents to control the game ship or change the dynamicsof the game and make the player have to create a componentthat aims to destroy the ship.
Finally, a similar puzzle game was also found to teach Javaprogramming [45]. This game has a collection of activitiesdivided into levels where the user needs to write code snippets,taking the character from point A to point B to avoid obstacles.This game with minor modifications could also be used toteach software components, where at each phase, the playerwould need to create a component to reuse throughout theother levels.
B. Derivation gamesMost games are built from derivations of others with minor
modifications to sprites, stories, or mechanics. The reason somany games look similar is that they use the same set ofmechanics with small changes [51].
When discussing modifications and derivations of games, awell-known term in this area is mod. This term can be definedas any form of non-commercial change of a proprietary digitalgame [52]. Through this term, it is possible to notice that manygames are built from others, for example, when entering thewebsite moddb.com, it is possible to find more than 21000modified projects (accessed on June 28, 2020). There are otherterms to define games that were created from others. Thischaracterization depends on the size of the modification thatwas made. Table VII demonstrates each of the categorizations
and presents a discussion of whether such a modification is aderivation or not [52] [53].
Games are formed by different elements that combined givelife to the experience lived by the player. Small changes inthese elements make it possible to derive a new game thatwill provide new experiences. Different authors divide theseelements in different ways, and in the following three ways todivide these elements will be demonstrated.
The first method of dividing game elements is MDA. Thismethod is divided into three essential elements: mechanics,dynamics, and aesthetics. Mechanics can be understood as therules and actions that can happen during the game. Dynamicsrepresent the behavior that occurs as a result of actions. Finally,aesthetics are the emotions experienced by the player [54].
The second method of dividing the elements of games thatwas found was the proposal made by Jesse Schell [51]. Inthis method, every game consists of four essential elements:aesthetics, mechanics, history, and technology. Aesthetics, inthis case, can be understood as what gives the appearanceto the game, anything that interacts with the player, such asimages and sounds. Mechanics is the rules and actions thatcan happen; history is the narrative of the game, the eventsthat are happening throughout the game. Finally, technologyis the junction point of all others; it is where the game is built[51].
The last method found was that proposed by Aki Jarvinen[55]. This method divides the elements into some groups:mechanics that have already been defined; rules that arethe procedures with which the game system restricts andmoderates the game; theme that is the subject of the game,the plot; and information that can be understood as what thesystem stores and presents to the player.
Based on these elements that make up the games, it ispossible to create derivations of existing games by makingsmall changes to parts of these elements. For example, thinkof a simple card game like canasta. This game has severalvariations that use the same technology (the cards), mechanics,aesthetics and dynamics similar to just a few changes in therules. However, it is important to note that it is not any changein an element that generates a new game. For example, achange in technology or appearance (sprites, sounds) in thegame will not create a new game. To try to make it moretransparent to the reader what can be modified to derive onegame from another, Table VII groups the similar elements andpresents a brief discussion about each one.
Based on the idea of derivation, two games were built usingthe main mechanics and characteristics found in this mapping.The idea was to create games derived from those found toteach SR. The first game was a simple quiz to demonstratethe information to be taught in an SR discipline in a way thatwas not only through the reading of books and slides. Thequiz used characteristics such as response time, demonstrationof the right and wrong answers as feedback, progress bar, anddifficulty levels. Thinking about derivation, this game could beeasily modified and applied in other contexts different fromteaching of SR. It would be enough to modify the questionsin the game to satisfy the criteria of another discipline. Thesecond game explored the derivation idea further and wasinspired by the Lightbot, using a similar mechanic with somemodifications. The game created was called CodeBoy and can

213
International Journal on Advances in Software, vol 13 no 3 & 4, year 2020, http://www.iariajournals.org/software/
2020, © Copyright by authors, Published under agreement with IARIA - www.iaria.org
TABLE VI. CATEGORIZATION OF CHANGES, ADAPTED FROM [52, 53]
Name Description DiscussionMutatorsortweaks
Minor modification, such as changing the speed of the game.Mutators can also be additions that do not influence the gameand its mechanism, having only an aesthetic effect.
It is not considered a derivation becauseit has only aesthetic effects, or very smallmodifications.
Add-ons Provides some extensions, such as new maps, new units, andnew skins, among others.
It is not considered a derivation because itis just an extension.
ModsCan include add-ons and mutators, or rather, they also manipulatethe rules system and the visual layer. Often, they try to establisha new version of the game by modifying much of it.
Totalconversions
Manipulate the original game in so many ways that a new game iscreated. Still, these changes can be applied to different levels ofthe game.
Alter the original game significantly, andtherefore considered a derivation.
TABLE VII. DISCUSSION OF ELEMENTS.
Element Discussion
Mechanic(Actions)
Modifications to the actions that the user canperform in a game will create a derivation.For example, think in a chess where the pieceshave different movements.
Mechanic(Rules)
Changes in the rules that the user can execute ina game will create a derivation. For example,think of a target shooting game where the playermust play blindfolded, the game will be moredifficult through this new rule added.
Dynamic
Dynamics represents the behavior that occurs as aresult of actions. To have a change in the dynamicsof the game, you must change part of the mechanics.Therefore, an isolated change in thiselement would not occur.
Aesthetic
Aesthetics are the emotions experienced by theplayer. It will hardly be possible to make anisolated change in this element. It will benecessary to modify another element to influence it.
Aesthetic(Appearance)Information
Modifications in the appearances (sprites, sounds)of games will not create a new game. Playing Zeldawithout music is still the same game.
Story/Theme
Changes in stories or themes of games will result ina new game. Many developers use this approach,creating new games that only change the story.For example, there are several action games withwalking and shooting mechanics but with differentstories.
Technology
The change in technology does not create a newgame. It can change the experiences experiencedby the player. However, it remains the same game.Computer chess remains a game of chess.
be used to demonstrate the importance of SR, showing thestudent that there are certain moments when it is essentialand often indispensable. CodeBoy used movement mechanicssimilar to Lightbot as jumping, rotating, and walking. Thisgame is also integrated with the idea of the FODA (Feature-oriented domain analysis) language tree in the context of SRto permit the construction of functions [56].
The Codeboy derivation process followed three phases,namely: analysis, division, and derivation. The analysis seeksto obtain an understanding of the game to be derived, collectinginformation such as the objective of the game and how itworks. The division aims to separate the game according to theelements of the Table VII, to understand each one separately.Finally, in the derivation phase, each element is reviewed to
understand which elements will be modified or reused. TableVIII shows the division phase with each of the elements of thetwo games. It is worth remembering that when an element wasreused, its discussion will be demonstrated only once. Figure3 demonstrates Lightbot [29] at the top and CodeBoy [56] atthe bottom. A better understanding of the games created andtheir evaluations can be found in Castro and Werner [56].
Figure 3. Lightbot [56] and Codeboy [29]
VI. FINAL REMARKS
A. Threats to ValidityThrough a critical analysis of the mapping, it is possible
to perceive some threats that may have affected the final resultof the work. The first to be highlighted is about the periodin which the mapping was performed, collecting informationfrom just five years. The second threat is the problem ofinterpreting the information found, which is up to the authorto understand the game found and think of a way that couldbe applied in the teaching of SR.

214
International Journal on Advances in Software, vol 13 no 3 & 4, year 2020, http://www.iariajournals.org/software/
2020, © Copyright by authors, Published under agreement with IARIA - www.iaria.org
TABLE VIII. LIGHTBOT VS CODEBOY.
Element LightBot CodeBoy
Objective Teach programming logic through sequenceof movements as an algorithm
Teach reuse through the development of softwarecomponents
Mechanic(Actions)
1 - Drag and drop blocks to move the robot2 - Create functions with a sequence of steps forcharacter movement3 - Turn on the lights along the way
1 - Drag and drop blocks of codes to move the boy andsolve the phase algorithm2 - Create functions with a sequence of steps for charactermovement3 - Catch the gold star4 - Open the magic chest
Mechanic(Rules)
Create the sequence of correct movementsto move the robot
The basis of the game is through the construction ofcomponents. It is worth remembering that these createdcomponents can be saved and reused in later stages
Dynamic Watch the robot move and turn on the lightsalong the route
After creating the algorithm, it will be validated throughmetrics and a score will be calculated for the player,encouraging the user to create better programs to achievehigher grades
Aesthetic The user must think about the correct movementsequence (challenge)
The user must develop his own component (expression)based on the algorithm described in the phase, so that hecan get an adequate grade to advance to the next phase(challenge)
Aesthetic(Appearance)Information
1 - Maps divided into squares where the gamecharacter moves around the squares.2 - Group of commands to be executed positionedon the right side of the screen.
1 - Maps divided into squares where the game charactermoves around the squares.2 - Group of commands to be executed positioned on theright side of the screen, within the tree.
Story/Theme Help the robot to move from point A to point Bby raising the lights along the way.
Help the character move from the start to capture the goldstar and then open the treasure chest.
Technology Mobile Mobile e desktop
B. Conclusion and Future Work
For many people who are not directly linked to the softwarereuse area, they refer to it as just code. Due to this fact,this mapping sought to find programming teaching games thatcould be used to teach reuse concepts that are often abstract tomany students. From this, it was possible to identify six gamesand six block-based programming languages. The game, andthe visual programming language that were identified in morearticles were LightBot [29] and Scratch [30], respectively.The main characteristics found were the use of rules, phases,difficult progression, feedback, challenges, and the use ofsimilar tasks in sequence.
As mentioned before, software reuse is inserted in severalcontexts, and the most common are propagation and engineer-ing. This work sought to identify games that were created toteach programming but could be used to explain some of thefundamentals of software reuse, thus looking at works from thefirst context. To better understand how these games are used asteaching methods, it is intended to perform another mappingto identify games that aim to teach software engineering, sinceas software reuse is inserted in the engineering and possiblysimilar features can be used to the teaching of the two subjects.
Although this work has found some games that could beused to teach some reuse fundamentals such as components,functions, and object orientation, none of these games werespecifically designed to teach software reuse. Based on eachof the games found, a possible modification or use of it forteaching SR was proposed. Based on these proposals, it wasunderstood that games could be derived or reused for morethan one context. Most games are created from others with
minor modifications, this process is called derivation. In orderto test this process, a three-step protocol was built and usedto create a game from it.
Games can be a new method to complement the currentteaching method due to its main advantages, such as increasedpractice and engagement through challenges, rewards, fun,and feedback. However, it is still something new that needsattention due to problems such as the complexity of the gamethat can affect learning, and the level of learning provided bygames is still lower than current teaching methods.
As mentioned before, several block-based programminglanguages have been found, showing that this strategy has alsobeen used on a large scale for teaching programming. Basedon this, it is intended to create games that use this strategy tohelp teaching Software Reuse.
To conclude, it is expected to improve and systematize thegame evolution showed in this paper to continue the derivationof games more transparently and efficiently.
REFERENCES
[1] D. Castro and C. Werner, “Mapping on the use of gamesfor programming teaching with an emphasis on softwarereuse,” The Sixth International Conference on Advancesand Trends in Software Engineering, SOFTENG, Febru-ary, 2020.
[2] J. Sametinger, Software engineering with reusable com-ponents. Springer Science & Business Media, 1997.
[3] O. Serrat, “Harnessing creativity and innovation in theworkplace,” in Knowledge solutions. Springer, 2017,pp. 903–910.

215
International Journal on Advances in Software, vol 13 no 3 & 4, year 2020, http://www.iariajournals.org/software/
2020, © Copyright by authors, Published under agreement with IARIA - www.iaria.org
[4] R. J. Leach, Software Reuse: methods, models, and costs.McGraw-Hill New York, 1997.
[5] N. Niu, D. Reese, K. Xie, and C. Smith, “Reuse a” soft-ware reuse” course,” in American Society for EngineeringEducation. American Society for Engineering Education,2011.
[6] U. Ritterfeld, M. Cody, and P. Vorderer, Serious games:Mechanisms and effects. Routledge, 2009.
[7] H. Ludens, “A study of the play element in culture,”Trans. by RFC Hull.(London, 1949), vol. 168, 1955.
[8] T. Mikkonen and A. Taivalsaari, “Software reuse in theera of opportunistic design,” IEEE Software, vol. 36,no. 3, 2019, pp. 105–111.
[9] S. Combefis, G. Beresnevicius, and V. Dagiene, “Learn-ing programming through games and contests: overview,characterisation and discussion,” Olympiads in Informat-ics, vol. 10, no. 1, 2016, pp. 39–60.
[10] C. Malliarakis, M. Satratzemi, and S. Xinogalos, “Edu-cational games for teaching computer programming,” inResearch on e-Learning and ICT in Education. Springer,2014, pp. 87–98.
[11] M. A. Miljanovic and J. S. Bradbury, “A review ofserious games for programming,” in Joint InternationalConference on Serious Games. Springer, 2018, pp. 204–216.
[12] I. Steinmacher, A. P. Chaves, and M. A. Gerosa, “Aware-ness support in distributed software development: A sys-tematic review and mapping of the literature,” ComputerSupported Cooperative Work (CSCW), vol. 22, no. 2-3,2013, pp. 113–158.
[13] B. Kitchenham, “Procedures for performing systematicreviews,” Keele, UK, Keele University, vol. 33, no. 2004,2004, pp. 1–26.
[14] R. C. Motta, K. M. de Oliveira, and G. H. Travassos,“Characterizing interoperability in context-aware soft-ware systems,” in 2016 VI Brazilian Symposium onComputing Systems Engineering (SBESC). IEEE, 2016,pp. 203–208.
[15] S. Matalonga, F. Rodrigues, and G. H. Travassos, “Char-acterizing testing methods for context-aware softwaresystems: Results from a quasi-systematic literature re-view,” Journal of Systems and Software, vol. 131, 2017,pp. 1–21.
[16] M. Petticrew and H. Roberts, Systematic reviews in thesocial sciences: A practical guide. John Wiley & Sons,2008.
[17] S. Jiang, H. Zhang, C. Gao, D. Shao, and G. Rong,“Process simulation for software engineering education,”in Proceedings of the 2015 International Conference onSoftware and System Process. ACM, 2015, pp. 147–156.
[18] A. Calderon, M. Trinidad, M. Ruiz, and R. V. O’Connor,“Teaching software processes and standards: A review ofserious games approaches,” in International Conferenceon Software Process Improvement and Capability Deter-mination. Springer, 2018, pp. 154–166.
[19] S. Ramırez-Rosales, S. Vazquez-Reyes, J. L. Villa-Cisneros, and M. De Leon-Sigg, “A serious game topromote object oriented programming and software en-gineering basic concepts learning,” in 2016 4th Interna-tional Conference in Software Engineering Research andInnovation (CONISOFT). IEEE, 2016, pp. 97–103.
[20] K. Salen, K. S. Tekinbas, and E. Zimmerman, Rules of
play: Game design fundamentals. MIT press, 2004.[21] C. Caulfield, J. C. Xia, D. Veal, and S. Maj, “A sys-
tematic survey of games used for software engineeringeducation,” Modern Applied Science, vol. 5, no. 6, 2011,pp. 28–43.
[22] T. Jordine, Y. Liang, and E. Ihler, “A mobile-devicebased serious gaming approach for teaching and learningjava programming,” in 2014 IEEE Frontiers in EducationConference (FIE) Proceedings. IEEE, 2014, pp. 1–5.
[23] E. Lee, V. Shan, B. Beth, and C. Lin, “A structuredapproach to teaching recursion using cargo-bot,” in Pro-ceedings of the tenth annual conference on Internationalcomputing education research. ACM, 2014, pp. 59–66.
[24] R. O. Chaves, C. G. von Wangenheim, J. C. C. Furtado,S. R. B. Oliveira, A. Santos, and E. L. Favero, “Exper-imental evaluation of a serious game for teaching soft-ware process modeling,” ieee Transactions on Education,vol. 58, no. 4, 2015, pp. 289–296.
[25] F. Agalbato, “Design and implementation of robo3: anapplied game for teaching introductory programming,”Scuola di Ingegneria Industriale e dell’Informazione,2017.
[26] R. Atal and A. Sureka, “Anukarna: A software engineer-ing simulation game for teaching practical decision mak-ing in peer code review.” in QuASoQ/WAWSE/CMCE@APSEC, 2015, pp. 63–70.
[27] A. Serrano-Laguna, J. Torrente, B. M. Iglesias, andB. Fernandez-Manjon, “Building a scalable game engineto teach computer science languages,” IEEE RevistaIberoamericana de Tecnologias del Aprendizaje, vol. 10,no. 4, 2015, pp. 253–261.
[28] M. M. Burnett, “Visual programming,” Wiley Encyclo-pedia of Electrical and Electronics Engineering, 2001.
[29] E. V. Duarte and J. L. Pearce, “A cross-cultural reviewof lightbot for introducing functions and code reuse,”Journal of Computing Sciences in Colleges, vol. 33, no. 2,2017, pp. 100–105.
[30] D. Topalli and N. E. Cagiltay, “Improving programmingskills in engineering education through problem-basedgame projects with scratch,” Computers & Education,vol. 120, 2018, pp. 64–74.
[31] R. Law, “Introducing novice programmers to functionsand recursion using computer games,” in European Con-ference on Games Based Learning. Academic Confer-ences International Limited, 2018, pp. 325–334.
[32] C.-K. Chang, “Effects of using alice and scratch inan introductory programming course for corrective in-struction,” Journal of Educational Computing Research,vol. 51, no. 2, 2014, pp. 185–204.
[33] N. Pellas and S. Vosinakis, “Learning to think andpractice computationally via a 3d simulation game,”in Interactive Mobile Communication, Technologies andLearning. Springer, 2017, pp. 550–562.
[34] M. Aedo Lopez, E. Vidal Duarte, E. Castro Gutierrez, andA. Paz Valderrama, “Teaching abstraction, function andreuse in the first class of cs1: A lightbot experience,” inProceedings of the 2016 ACM Conference on Innovationand Technology in Computer Science Education. ACM,2016, pp. 256–257.
[35] N. Boldbaatar and E. Sendurur, “Developing educational3d games with starlogo: The role of backwards fading

216
International Journal on Advances in Software, vol 13 no 3 & 4, year 2020, http://www.iariajournals.org/software/
2020, © Copyright by authors, Published under agreement with IARIA - www.iaria.org
in the transfer of programming experience,” Journal ofEducational Computing Research, vol. 57, no. 6, 2019,pp. 1468–1494.
[36] J. Vincur, M. Konopka, J. Tvarozek, M. Hoang,and P. Navrat, “Cubely: Virtual reality block-basedprogramming environment,” in Proceedings of the23rd ACM Symposium on Virtual Reality Softwareand Technology, ser. VRST ’17. New York, NY,USA: ACM, 2017, pp. 84:1–84:2. [Online]. Available:http://doi.acm.org/10.1145/3139131.3141785
[37] M. Marimuthu and P. Govender, “Perceptions of scratchprogramming among secondary school students inkwazulu-natal, south africa,” African Journal of Informa-tion and Communication, vol. 21, 2018, pp. 51–80.
[38] N. Pellas, “The development of a virtual learning plat-form for teaching concurrent programming languagesin the secondary education: The use of open sim andscratch4os,” Journal of e-Learning and Knowledge Soci-ety, vol. 10, no. 1, 2014, pp. 129–143.
[39] H. Potter, M. Schots, L. Duboc, and V. Werneck, “In-spectorx: A game for software inspection training andlearning,” in 2014 IEEE 27th Conference on SoftwareEngineering Education and Training (CSEE&T). IEEE,2014, pp. 55–64.
[40] N. Tabet, H. Gedawy, H. Alshikhabobakr, and S. Razak,“From alice to python. introducing text-based program-ming in middle schools,” in Proceedings of the 2016ACM Conference on innovation and Technology in Com-puter Science Education, 2016, pp. 124–129.
[41] F. Kalelioglu and Y. Gulbahar, “The effects of teachingprogramming via scratch on problem solving skills: Adiscussion from learners’ perspective.” Informatics inEducation, vol. 13, no. 1, 2014, pp. 33–50.
[42] L. A. Vaca-Cardenas, F. Bertacchini, A. Tavernise,L. Gabriele, A. Valenti, D. E. Olmedo, P. Pantano,and E. Bilotta, “Coding with scratch: The design of aneducational setting for elementary pre-service teachers,”in 2015 International Conference on Interactive Collabo-rative Learning (ICL). IEEE, 2015, pp. 1171–1177.
[43] S. Yamashita, M. Tsunoda, and T. Yokogawa, “Visualprogramming language for model checkers based ongoogle blockly,” in International Conference on Product-Focused Software Process Improvement. Springer, 2017,pp. 597–601.
[44] J.-M. Saez-Lopez, M. Roman-Gonzalez, and E. Vazquez-Cano, “Visual programming languages integrated acrossthe curriculum in elementary school: A two year casestudy using “scratch” in five schools,” Computers &Education, vol. 97, 2016, pp. 129–141.
[45] A. Sierra, T. Ariza, F. Fernandez-Jimenez, J. Munoz-Calle, A. Molina, and A. Martın-Rodrıguez, “Educa-tional resource based on games for the reinforcement ofengineering learning programming in mobile devices,”in 2016 Technologies Applied to Electronics Teaching(TAEE). IEEE, 2016, pp. 1–6.
[46] D. Valencia, A. Vizcaino, L. Garcia-Mundo, M. Piattini,and J. P. Soto, “Gsdgame: A serious game for theacquisition of the competencies needed in gsd,” in 2016IEEE 11th International Conference on Global SoftwareEngineering Workshops (ICGSEW). IEEE, 2016, pp.19–24.
[47] D. Bau, “Droplet, a blocks-based editor for text code,”
Journal of Computing Sciences in Colleges, vol. 30, no. 6,2015, pp. 138–144.
[48] D. A. Bau, “Integrating droplet into applab—improvingthe usability of a blocks-based text editor,” in 2015 IEEEBlocks and Beyond Workshop (Blocks and Beyond).IEEE, 2015, pp. 55–57.
[49] H. Chandrashekar, A. G. Kiran, B. Uma, and P. Sunita,“Introducing programming using “scratch” and “green-foot”,” Journal of Engineering Education Transforma-tions, 2018.
[50] R. d. A. Mauricio, L. Veado, R. T. Moreira, E. Figueiredo,and H. Costa, “A systematic mapping study on game-related methods for software engineering education,”Information and software technology, vol. 95, 2018, pp.201–218.
[51] J. Schell, The Art of Game Design: A book of lenses.CRC press, 2008.
[52] A. Unger, “Modding as part of game culture,” in Com-puter Games and New Media Cultures. Springer, 2012,pp. 509–523.
[53] O. Sotamaa, “When the game is not enough: Motivationsand practices among computer game modding culture,”Games and Culture, vol. 5, no. 3, 2010, pp. 239–255.
[54] R. Hunicke, M. LeBlanc, and R. Zubek, “Mda: A formalapproach to game design and game research,” in Proceed-ings of the AAAI Workshop on Challenges in Game AI,vol. 4, no. 1, 2004.
[55] A. Jarvinen, “Introducing applied ludology: Hands-onmethods for game studies.” in DiGRA Conference. Cite-seer, 2007.
[56] D. Castro and C. Werner, “Use of games as a strategyfor teaching software reuse,” SBGAMES, 2020 (in Por-tuguese).
217
International Journal on Advances in Software, vol 13 no 3 & 4, year 2020, http://www.iariajournals.org/software/
2020, © Copyright by authors, Published under agreement with IARIA - www.iaria.org
Microservice-Enabled Simulation Platform for Industry-4.0 Dynamic Systems:
A Computational Fluid Dynamics Case Study for Underground Coalmine
Ventilation Networks
Alexey Cheptsov
High Performance Computing Center Stuttgart,
University of Stuttgart
Stuttgart, Germany
e-mail: [email protected]
Oleg Beljaev
Donetsk National Technical University,
Computer Science Department
Pokrowsk, Ukraine
e-mail: [email protected]
Abstract—Industry 4.0 is a state-of-the-art methodology of
complex industrial systems development, which aims to
improve the industrial processes by applying the digitalization
and computer processing to the technology-level of production
objects. The ability to process streaming data from numerous
digital sensors, as enabled by Industry 4.0, endorses a potential
for creation of many innovative applications. One of the major
classes of industrial applications that are enabled by Industry
4.0 is the simulation – the technology that is frequently used for
the “offline” optimization of technological processes. In the
context of Industry 4.0, the simulation will be benefitting from
the “online” integration with the digitalized industrial
infrastructure, e.g., for the realization of real-time support
scenarios. However, the existing simulation approaches and
tools are not able to support highly dynamic, hierarchically
organized industrial systems due to a monolithic design of
those tools, motivated by the other essential requirements, such
as efficiency, user- and developer-friendliness, etc. This article
proposes an approach that is based on microservices – the
functionally-decoupled, interconnected composition blocks of a
hierarchically organized, modular simulation application, that
implements a specific part of the simulation logic for the
targeted physical phenomena. The use of the microservice-
based approach is demonstrated on the implementation of a
simulation framework for underground coalmine ventilation
networks – complex technological objects that impose
challenging tasks, such as conduction of Computational Fluid
Dynamics studies.
Keywords-microservices; dynamic systems; real-time
simulation; computational fluid dynamics; cyber-physical
automation; ventilation network.
I. INTRODUCTION
Modelling and Simulation are essential technologies for design and support of complex industrial and technological objects, which can be methodologically considered as Dynamic Systems (DS). DS form a special class of simulation applications that are based on the (mathematical) models that are built according to the functional and structural decomposition approaches. The essence of those approaches lies in the application of a numerical decomposition method (e.g., domain decomposition, functional decomposition, structural decomposition, etc.) in order to i) break a complex system down into the elementary
sub-systems (sub-models), which can be represented by means of the standard mathematical techniques (e.g., systems of ordinary and/or differential equations), as well as ii) define a methodology to combine those sub-models to solve the original big problem.
A typical DS example is a Ventilation Network (VN) of an underground coalmine, as discussed in our earlier publication [1] and also taken as the basis case study in this article (see a further description in Section II). VNs are challenging objects in terms of design, operational support, and control – they expose several safety-critical tasks, which cannot be solved in the practice without an extensive support, provided by the simulation tools. One of such tasks is the analysis of the aerodynamics, i.e., of the distribution of the air and gases in underground mining areas – the major factor of the coalmine production safety. The classic simulation approach for such tasks is served by the Computational Fluid Dynamics (CFD) technique – a numerical computation method based on complex models.
The quality of the CFD models prediction (the model data accuracy) can be considerably improved by incorporation of the data that are measured at the object (i.e., the physical measurements data) into the simulation – the strategy that is often referred as a part of the “cyber-physical system” or “internet-of-things” concept (see a survey of Bordel Sanchez and Alcarria [2]). Nowadays, these concepts are considered as essentials of the Industry 4.0 methodology, aiming to maximize the digitalization and automation of industrial systems (see overview of Wollschlaeger et al. [3]). For this purpose, the modern industrial technological objects are being increasingly equipped with “smart sensors” – light-weight measurement devices with rich communication interfaces (like Ethernet) that allow retrieval of physical data, e.g., in form of the real-time data streams. The new-generation smart sensors are characterized by a wide portability and low power consumption and hence can be installed in a very broad spectrum of industrial technological objects, also including the production areas of coalmines and their VNs. The data that are obtained from the sensors can be used not only to “calibrate” the simulation experiments results, but also to support the models in the situations when they cannot be reliably applied to some specific parts of the modelled

218
International Journal on Advances in Software, vol 13 no 3 & 4, year 2020, http://www.iariajournals.org/software/
2020, © Copyright by authors, Published under agreement with IARIA - www.iaria.org
physical problem or phenomena, e.g., those that include unpredictable processes, such as the gas emission from dynamic sources of VNs, such as the goaf – a cavity in the production areas of the underground coalmining works. In particular, the published work of Stewart et al. [4] has shown that the value of VN models can be considerably increased for the use in real, productional cases by incorporating the sensors data. However, integration of sensor data into the general-purpose simulation packages is not easy, in particular, due to the monolithic design of the former.
This paper evaluates the major problems with which the simulation experts might face during the development of sensor-aware simulation application scenarios by using wide-spread programming models and tools. As an efficient and, at the same time, developer-friendly alternative to the traditional approaches, a decentralized, microservice-oriented simulation framework MS-Sim is proposed and described.
The remainder of the paper is organized as follows: Section II gives an overview of VNs and modelling techniques for their analysis. Section III introduces and discusses the methodology of a real-time simulation of VNs. Section IV is dedicated to the microservice architecture for development of simulation applications. Section V presents the evaluation use cases and discusses the validation and benchmarking results. Section VI concludes the paper and discusses the main outcomes.
II. OVERVIEW OF VENTILATION NETWORKS AS OBJECTS
OF MODELLING AND SIMULATION
Despite of the revolutionary development in the domain of renewable and regenerative energy technologies, as presented in the last decade, (black) coal remains one of the most important sources of energy for industrial and urban objects world-wide, along with the gas, oil and other fossil fuels. The total discovered reserves of 1 Tera-ton along with the actual annual production of 5,5 Giga-ton (according to the International Energy Program [5]) makes the coal to one of the most essential energy sources of the world’s industry, especially in the regions of East Europe, Asia, and Australia. At the same time, the coal industry is one of the most unsafe industrial sectors in terms of the work safety – the specific of the underground production (carried out at the depths of up to many kilometers under the surface), such as a limited ability of the natural air circulation through the underground mining fields or a frequent location of dynamic sources of hazardous gases, cause in the practice a considerable percentage of victims among the work labour due to technological accidents, such as the explosions of methane and oxygen mixtures.
Ventilation is the most important technology that is used for the safety ensuring in underground production areas of coalmines – it aims to provide mining fields with the fresh air conducted from the surface (in the amount that is necessary for carrying out the mining processes by the underground workers), as well as to drain the hazardous gases (mainly, CH4 – methane) that are emitted during the mining and coal transporting from the underground
production areas. The real VNs have to cover a widely distributed network of diverse interconnected underground airways (see Fig. 1) that span over many mining sections (e.g., longwalls) with diverse elements with the total length of up to many thousands of kilometers, as shown in Fig. 2. The ventilation is enforced by the ventilation fans (along with smaller local booster fans), mounted on the surface, that ensure an uninterrupted air circulation through all the elements of the VN sections: main gates (leading the fresh air from the surface), faces (areas of coalmining), tail gates (offtakes of air-gas mixtures), etc.
Figure 1. General structure of mine ventilation section.
The engineering analysis of the VN ventilation aims to solve a multi-level (including the airway, section, or network levels) regulation problem in order to determine operation modes of the major and booster fans (i.e., the depression values), values of the local regulators (e.g., the positions of sluice valves), etc., in order to saturate every VN airway with the airflow-rates required for the safe coalmining production. In practice, this is frequently performed with the help of static models, having the following general form:
2RQP
where P – the air-pressure across the airway, Q – the air-flow rate, R – the air-flow resistance.
The air-flow model in the general form (1), applied to each and every VN element, results in the equation system that allows calculation of static ventilation properties for the whole VN. However, dealing with more complex tasks like the ventilation on demand (ensuring optimal energy consumption in constantly changing VN configurations due to gradual progress of the coalmining process), or solving any task that requires analysis of the gas emission from the coal-bed implies the analysis of dynamic behavior and makes the static model (1) inapplicable. Instead, the dynamic models are required at this place.

219
International Journal on Advances in Software, vol 13 no 3 & 4, year 2020, http://www.iariajournals.org/software/
2020, © Copyright by authors, Published under agreement with IARIA - www.iaria.org
The latter analysis task – gas-dynamics – is of a special importance for the coalmine safety, as most of the emergency situations in the coalmining industry happen due to combustion of the gases preserved in the coal veins [6]. Once past the face, the intake air that travels up the main gate and leaves the section through the tail gate is no longer fresh, but contaminated by mine gases, such as methane. Methane may be emitted from diverse dynamic sources in the section. The major source is, however, the goaf – a cavity between the main and the tail gates, which preserves the sealed methane that is carried out by the air-flows bleeding through it (parallel to the face, as depicted in Fig. 3). The concentration of the methane in the mixture with oxygen carried away by the main gate’s bleeding flows through the goaf may relatively quickly reach the upper limit (of approx. 5%), which can cause spontaneous combustions of gases and coal in the goaf. Therefore, the gas-dynamics models are of a special importance for the coalmine safety, for the reason that they allow a prediction of potentially unsafe situations.
The gas-dynamics analysis relies on the models that consider dynamic aspects of the unsteady, multiphase (air- and gas-) flows, which are a way more complex than the static model (1). The general approach to the analysis of the dynamic problems involving fluids is the use of Navier-
Stokes (NS) equations for a compressible flow (e.g., see a detailed explanation in Chorin [7]), covering different aspects of the fluids’ macroscopic properties, such as the free-streaming and interaction with complex-geometry surfaces. Since the NS equations are non-linear and have no analytical solution, numerical techniques have to be applied. The common practical way used in the numerical CFD simulation is to apply an approximation and decomposition in order to simplify the original mathematical model whilst keeping the most essential fluid properties (e.g., flow rates, viscosity, pressures, etc.) sufficiently represented. A widely used VN aerodynamic model is a 1-D NS-approximation proposed by Svjatnjy [8], in the form of the equation system (2), consisting of a transport (impulse) and a continuity equation.
qF
ρa
ξ
Q
F
ρa
t
P
(t)QrrQt
Q
F
ρ
ξ
F
ρ
ξ
P
22
22
2
2
where t – the time, ξ – the spatial coordinate, and other values – diverse aerodynamic properties and coefficients.
12
117
3
4
5
8
7
6
17
10
18
15
33
32
29
28
14
13
12
25
24
30
34
16
19
2120
11
26
27
31
23 36
22 35
51
50
48
38
3756
57
47
53
49
55
54
60
59
42
43
0
58
46
3945
40
41
0
44
0
103
82
68
83101
12 13
11
1516
20
17
18 23
21
113
2422
104
75
85
84
25
86
105
76
106
107
108
30
52
26
69
28
70
35
29
66
67
46
81
116
100
63
99
64
45
6544
43
4281 95
93
94 92
115
114
97
96
60 59
9 10
1
23
5
4
6
7
36
37
38
3998
72
51
53
5250
54
41
47
40
79
49
56
55
57
8
7778
61
71
89 109
111
90
80
11091
112
88
102
73
31
32
33
34
48
74
14
0
19
27
58
62
9
Figure 2. Illustration of real-complexity ventilation network with 117 branches and 61 connection nodes – coalmine South-Donbass-3, located in Ukraine. The coloring of airways is used here just for better readibility purpose.

220
International Journal on Advances in Software, vol 13 no 3 & 4, year 2020, http://www.iariajournals.org/software/
2020, © Copyright by authors, Published under agreement with IARIA - www.iaria.org
The NS-based equations can also describe the state and transport properties of gas fluids. One of the “classic” models that describe a methane emission from the goaf‘s filtration space was proposed by Feldmann [9]:
V
GGdVt
Cm 0
where G – the gas-mass flow that is carried out by filtration air-flow from the goaf, G0 – the gas-mass flow in the filtration volume of the goaf, C – the gas concentration in the filtration flow through the goaf, m – the coefficient of the goaf porosity, as well as other aerodynamic properties.
Figure 3. Methane emission schema in a U-type (longwall) section
ventilation: a) main gate, b) tail gate, c) goaf.
The Feldmann’s model (3) of the methane emission from the goaf can be approximated (in order to simplify the further numerical solution) by a 1-D representation, e.g., in the following form, as elaborated by Svjatnjy [8]:
dt
dqQ
q
mVQQ
dt
dQ
q
mVmmm
m
20
where Qm – the methane-flow rate and q – the air-flow rate in the filtration space of the goaf.
The methane transportation by the flow in the section’s tail gate, surrounded by the goaf, as well as in the further VN airways along the air-flow contour direction can be described, for example, by the following model built according to the Stewart’s discrete cells approach [4]:
N
j
j
mt
i
mt QQ1
where i
mtQ – the rate of the methane-flow that is transported
by the i-discretization element of the airway, N – the number of discretization elements that act as sources of the methane transported with the incoming air-flow.
The overall dynamic model of the complete VN can be built up from the models of each of its elements, i.e.:
airways with only air-flow (e.g., the main gates leading fresh air to the section), such as represented by model (2),
airways that contain active methane sources (e.g., the goaf), such as represented by models (2) and (4),
airways that are transporting both air- and methane-flows from the adjoining airways (e.g., the tail gates carrying out the used air and methane from the section), such as represented by model (2) and (5),
as well as by the connective equations that describe the boundary conditions between the elements, as defined at the phase of discretization. Discretization can be performed by means of several methods, such as the Finite Differences (FDM), Finite Volume (FVM), Discontinuous Galerkin (DM), etc., see more details at [10]. Fig. 4 shows an example of a 1-D FDM discretization for a simple mining section containing a main gate (air-flow QMG), a face (air-flow QF), a goaf (air-flow QG and emitted gas-flow QmG), and a tail gate (air-flow QTG and gas-flow QmtTG) – see more details on FDM discretization for NS-based equations at [11].
Figure 4. 1-D discretization schema of a mining section with a main gate
(MG), face (F), goaf (G), and tail gate (TG).
The resulting 1-D model of a coalmining section can thus be shaped into the following form:
)(
,
,
)(
)(
)(
)(
)(
12
)1(..2
1
21
2
0
221
221
221
221
jj
i
i
jTGTGjNj
GmTGjj
Gjiij
Gj
Gj
GjGj
Gj
Gj
TGjTGj
iijTGj
GjGjiijGj
FjFj
iijFj
MGjMGj
iijMGj
S
pa
t
P
QmtQmt
QmQmt
rQPPS
QmQ
mV
QmQmdt
dQm
Q
mV
QrrQPPS
t
Q
QrrQPPS
t
Q
QrrQPPS
t
Q
QrrQPPS
t
Q

221
International Journal on Advances in Software, vol 13 no 3 & 4, year 2020, http://www.iariajournals.org/software/
2020, © Copyright by authors, Published under agreement with IARIA - www.iaria.org
where Δψ – the length of a spatial discretization element along the air-flow contour direction.
Application of a numerical solution method (such as Euler, Runge-Kutta, etc. – see more at Feldmann’s survey [12]) leads to a resolution of the equation, in its general form (6), with the aim to obtain the evolution of the dynamic processes in time. Fig. 5 shows an example of the aerodynamics processes development by applying different control actions in a test section, controlled by a ventilation fan and a local regulator, installed in the tail gate.
(a)
(b)
Figure 5. Example of aerodynamics analysis by means of models: (a) air-
flow in langwall, (b) methane-flow in mining section’s goaf.
III. STATE OF THE ART IN SIMULATION TECHNOLOGIES
FOR VENTILATION NETWORKS ANALYSIS
Implementation of the VN aerodynamics equations, such as needed for the ventilation control, happening on the basis of equations in the general form (6), can be performed in several ways. The simplest, in terms of developments efforts, is the usage of a wide-spread simulation package, such as ANSYS-CFX or OpenFOAM. Those packages provide a rich library of diverse solvers that can be applied on the target model equations. The other alternatives include:
development of the own simulation platform (including discretization approaches, numerical solvers, visualization software, etc.) with more problem-specific customization options, however,
requiring much more development and support actions, and
use of the mixed (heterogeneous) environments with the customization of some specific functions of the standard simulation package.
However, regardless of the chosen implementation strategy and technology, the simulation applications have to deal with one critical problem – the model data actuality. Since the VNs are highly dynamic objects, meaning their parameters are continuously changing, at the latest after every production cycle (e.g., after an extension of the section, redirection of the air-flow contour), it is important to keep the models being constantly updated, in order to ensure that they can still be applicable on the production processes in their actual state and deliver trustful results.
In the reality, it has always been very difficult, if not even impossible, to refresh the data frequently. The so-called “ventilation surveys” – physical measurements of the aerodynamics parameter in the VN – could only be conducted for every 2 to 4 weeks, for the reasons of technological complexity. However, the parameter values between the last and the new measurements might change considerably, most notably – for the gas-dynamics. Therefore, the dynamic models have not found a “critical mass” application in the coal industry up to nowadays.
However, the things have been changing in the last years rapidly – the modern coalmines rely extensively on the Cyber-Physical Automation (CPA), which offers, among other advantages, an advanced data acquisition and monitoring technology, supported by the Industrial Ethernet technologies like PROFINET, Modbus, etc., see some examples by Lee at [13] or Kay at [14]. One of the CPA systems that has successfully been taken in production is UTAS, widely utilized at the East-European coalmining industry space, for details look at Ignatovych [15]. The sensor network of UTAS provides both air- and methane-flow detectors, see in Fig. 6.
(a)
(b)
Figure 6. Example of UTAS smart sensors: (a) Methane detector
TX3263D, (b) Air-flow rate measurement station TX1322D.

222
International Journal on Advances in Software, vol 13 no 3 & 4, year 2020, http://www.iariajournals.org/software/
2020, © Copyright by authors, Published under agreement with IARIA - www.iaria.org
The key advantage of the CPA organization for the implementation of ventilation control is an immediate (i.e., in the real-time) availability of sensors data, which might be used for the fine-grain control of technological processes. Moreover, many CPA systems serves at the same time as a decentralized computation platform for “in situ” sensor data processing, i.e., when the sensor data are processed locally on the available digital resources – the so-called “sensor processors”. The interconnection of all sensor processors allows the realization of global control operations, i.e., for the whole VN. On the other hand, the distributed, heterogeneous CPA infrastructure, which is preferable to be used for conduction of CFD simulation studies straightforwardly in the industrial environment, poses a major problem for the development of the simulation software, which cannot rely on the general-purpose development environments of the simulation software, such as the above mentioned ANSYS-CFX or OpenFOAM, designed for densely-organized, massively-parallel infrastructures – the High Performance Computers (HPC) or Cloud. Even for the custom simulation frameworks that partially rely on standard packages, there are still numerous adaptations and optimizations necessary, which are very difficult to implement, e.g., as the interaction between the sensor and modelling parts of the simulation workflow.
Development of the simulation software “from scratch” would allow to overcome the general compatibility problems of the standard simulation packages. However, it is a complex and non-trivial process. Moreover, the following CPA-specific infrastructure factors have to be considered:
Heterogeneity of the CPA distributed infrastructure – many sensor devices are provided on the basis of a host system, whose architecture might differ from the typical HPC, Cluster, or Cloud environment but still requires a seamless integration within the distributed application workflows. However, the standard parallelization approaches require a uniform infrastructure with the compute nodes of the same hardware architecture and performance class.
Limited flexibility of the mainstream parallelization approaches to support distributed application scenarios – many parallel applications rely on the Single Instruction Multiple Data (SIMD) technique, which mainly targets densely built compute systems like HPC. However, the applications that are running on the truly distributed infrastructures (HPC + Cloud + remote embedded systems) have to be developed according to the MIMD approach, in order to allow different functionalities to be executed on different types of systems.
Composition complexity of the CFD models –models are often organized according to the applied mathematical decomposition technique to the initial physical problem, which have to consider different hierarchical levels with complex informational and control dependencies between the composition blocks of the models (see Fig. 7). The hierarchical physical connections between the objects have to be reflected in their models, accordingly.
Figure 7. Hierarchical structure of composition blocks of ventilation
network CFD models.
The simulation software needs to be developed in a modular way, where the modules would correspond to a part of the modelled physical system (according to the applied decomposition strategy), with the possibility of reuse of the topologically-assembled modules to implement the functionality of the higher-level models, i.e., in a bottom-up development approach. Therefore, novel development approaches are required for the implementation of the portable, horizontally and vertically scalable, as well as energy-efficient simulation software.
IV. MICROSERVICE ARCHITECTURE FOR DEVELOPMENT
OF SIMULATION APPLICATIONS
In the last decade, Service-Oriented Architectures (SOA) have been successfully established in software development area as a more efficient (in terms of the required development efforts but also in terms of performance) alternative to the monolithic software design. The key concepts of SOA, such as the component-based application design, remote access of components via standardized communication protocols, etc., make the service-oriented development concept attractive for use in the simulation applications as well. However, due to the required peak performance on the highly optimized infrastructures, such as HPC, which could not be guaranteed by the standard SOA technologies, like the web services, the SOA concept has not found a wide application in the simulation applications domain. However, with i) the proliferation of the less strict, in terms of performance requirements, Cloud technology into the simulation domain, ii) appearance of heterogeneous Cloud-HPC testbeds, as well as iii) optimization of the SOA communication technology stack, the interest of the community in using the SOA technology started to grow again. With respect to the requirements discussed in previous Section III, it is proposed

223
International Journal on Advances in Software, vol 13 no 3 & 4, year 2020, http://www.iariajournals.org/software/
2020, © Copyright by authors, Published under agreement with IARIA - www.iaria.org
to use a Microservice (MS) architectures for the realization of the VN simulation framework (see Fig. 8).
Figure 8. Composition of services for realisation of simulation
application.
In this approach, a simulation application is arranged as a collection of independent, isolated, portable software modules (i.e., services), each of those implementing a composition block of the complex system, composed according to the functional, spatial, or any other decomposition. Each MS follows in its implementation a locality principle, i.e., bearing the responsibility for the assigned part of the complex system. In order to reflect the physical or informational connections of the real object, MS can be interconnected by means of a common data and/or control flow, which can be implemented with the help of a light-weight communication library, such as the technology-agnostic HTTP.
In order to evaluate the usability of the MS concept to carry out the VN simulation studies, as previously described in Section II, a reference framework MS-Sim was developed, available at the open-source platform Github [16]. The MS-Sim key concepts that are relevant to the simulation applications developments are as follows:
Microservice model – specifies the development scenario for independent MS. The collection of different MS can be combined in a “market place” – library of domain-related services, which can be integrated into a common (simulation) application.
Application model – defines the implementation strategy for MS-based (simulation) applications.
Communication model – provides a realization of data exchange (e.g., control and data flow) between the loosely-coupled over the distributed infrastructure resources MS, as well as data storage.
Hierarchy model – defines the implementation of hierarchically-dependent MS at the different granularity levels.
The MS-Sim microservice model provides a specification for every individual MS-module. According to it, MS are asynchronous and independent software processes, which are identified by a unique Identifikator. The MS can be data-synchronized with the other services by means of ports – special buffers in which the service can put the data that need to be communicated to the other services, or also obtain the incoming data (see Fig. 9). MS-Sim provides API to read/write data from/to buffers as well as to flush (by the sender) and synchronize (by the receiver) the buffer content.
Figure 9. High-level microservice archtiecture.
At the time of service development, the connections between the MS, i.e., sources and destinations of data exchanged by means of ports, as well as the size of the ports’ buffer, are irrelevant and can be established in the phase of creating a microservice application, i.e., by the MS-Sim application model. The application model specifies all the MS that are included into the application as well as connections between their corresponding ports, see Fig. 10. The MS are normally implemented in accordance to a pro-active logic, i.e., they are steered by a dedicated “master” service by means of a command flow – messages coded corresponding to a user-defined protocol, acknowledged across all MS, see example in Fig. 11. The application model distinguishes 2 categories of ports: normal buffers and proxies. The latter are used for internal communication with the dependent MS (e.g., between the master and the workers) and are not visible to the other application components interfacing this MS.
Figure 10. High-level microservice archtiecture.

224
International Journal on Advances in Software, vol 13 no 3 & 4, year 2020, http://www.iariajournals.org/software/
2020, © Copyright by authors, Published under agreement with IARIA - www.iaria.org
Figure 11. Implementation of command flow by worker microservices.
The typical application workflow contains instructions to initiate some important for the simulation logic operations, such as the initialization of model’s parameters (e.g., by the value obtained from the sensor), initiation of the simulation, control of the simulation experiment convergence, output of results, etc.
The data exchange between the master and the workers (e.g., for the propagation of the command flow or gathering results), as well as among the workers at the time of performing the simulation (e.g., for the implementation of the boundary conditions exchange), happens asynchronously and supported at the runtime of the (simulation) application execution by the MS-Sim communication model. In the communication model, the connection pairs (i.e., communication links) between the sender and the recipient MS are specified, as shown in Fig. 12. The information about the amount (number of entities) of data transmitted between the sender’s and the recipient’s ports may be added to the communication link as well (or assumed as a single data value, otherwise). At the physical network level, the data transport is performed by a special communication library, supplied to the microservice execution framework.
Figure 12. Realization of indirect communication between microservices.
The major dilemma, which nearly all microservice applications are facing during their design, is the definition of the granularity level of the initial problem that shall be implemented as a microservice. For example, in our case of the CFD applications, the lowest granularity level is served by a discretization element, and the highest – by a VN, see Fig. 7 above. In general, the lower is the chosen granularity level of the individual MS, the more customization options can be applied to the design of the MS-based application. However, the disadvantages of the very low chosen granularity level are getting very clear when the number of microservices in the MS-application is getting fairly big and the application has to spent most of the time in struggling with the management and coordination issues arising across the huge amount of very small MS. The “golden middle” strategy, which is used by some MS-based applications, is, however, not always applicable. On the contrary to the existing approaches, the MS-Sim design allows the developer (in our case – the simulation expert) to incorporate MS of different levels granularity in a single application, depending on the imposed customization and usability requirements. This hierarchical view is becoming possible to achieve by using the MS-Sim hierarchy model – a special methodology for creation of compound, hierarchically structured services. The MS-Sim hierarchical service concept allows not only to use the microservices of the different granularity in a common application, but also to create and reuse new, higher-level services on the base of the already existing ones. The developer will obtain the possibility to reuse services of any granularity level from a common “service market place”. Fig. 13 shows an example of a microservice-based implementation of the U-formed coalmining section (depicted in Fig. 3) that combines the services of: i) discrete units (q, p) and ii) airways (Q, P) granularity level.
A prototype implementing the basic functionality of the MS-Sim framework was implemented with OpenMPI (see Gabriel et al. [17]) – an implementation of the Message-Passing Interface (MPI) standard, serving in our implementation as both a run-time environment and a communication library. OpenMPI is currently one of the most widely used solutions for designing parallel applications, mainly for HPC and cluster infrastructures. However, it is also useful for the implementation of MS-based applications: Same as the typical MPI applications, the SOA-based applications consist of a large number of components (microservices, in our terminology, or ranks, in the MPI terminology), which are running on distributed resource in isolated environments (as a software process). The components (regardless of whether they are microservices or MPI ranks) need to occasionally communicate between a couple of those (sender and receiver) or involving a group of components (i.e., collectively). In MS-Sim, every microservice is wrapped into an MPI process and is identified, in addition to its own Identifikator, by an MPI rank. The communication library (see Fig. 12) substitutes the data transfer calls with a corresponding MPI library calls, such as asynchronous point-to-point or collective communication.

225
International Journal on Advances in Software, vol 13 no 3 & 4, year 2020, http://www.iariajournals.org/software/
2020, © Copyright by authors, Published under agreement with IARIA - www.iaria.org
Figure 13. Implementation of ventilation section model with microservices
of different granularity levels.
V. VALIDATION AND BENCHMARKING RESULTS
The ventilation section model, depicted in Fig. 12, which includes the models of the air-flow through the main gate and face, air leakage into the filtration cavity of the goaf and methane emission, as well as transport of the air-methane mix through the tail gate was evaluated for a serious of typical changes that might be applied to the operational mode of the VN regulation elements – the main ventilation fan and local regulator (a sluice valve installed in the tail gate). The discretization of the physical domain was performed with the help of method of lines (NMOL), as served by the equation (6), with the approximation element length of Δψ=50m. The numerical solution (time discretization) was performed with Runge-Kutta (RK4) method with the time stamp of 0.1 s. The service-based application workflow was steered by a dedicated supervising service – a manager, which performs the following functions:
Initialization of microservices with the parameters that correspond to their respective physical object.
Initiation of iterative numerical solution process.
Control of the solution readiness by means of polling the status of every individual “worker service”.
Instruct the services to store results in a local storage (the local disk).
Goal of the evaluation was: i) to validate the functionality of the models as compared with the real measurements from the test objects and ii) to benchmark the performance of simulation services in order to evaluate the applicability for real-time and HPC/Cloud usage scenarios.
The functional validation was performed on the basis of a test object (a section of the coalmine South-Donbass-3) for three subsequent regulation scenarios (A, B, C):
substantial increasing of the ventilation fan pressure H from the value 0 to the full capacity 160,69 N/m2 (scenario A),
decreasing of the air throughput by means of raising the regulation element’s value r from 0 to 25 Ns2/m8 (scenario B), and
returning of the regulator in the initial position (scenario C).
The values of the airflows that resulted from simulation (see Table 1) were validate across the practical measurements data that were obtained by Svjatnyj [8]. The validation has not found any deviations between the modelling experiments and real measurements.
The non-functional performance benchmarking was performed for two following scenarios:
Performance on a range of non-parallel systems: an embedded device (a low-power ARM-based embedded system Odroid-XU4 [18]), a generic desktop PC (Intel Core i5 CPU), and a server system equipped with a high-performance Intel Haswell CPU. The evaluated figure of merit was the ability to meet real-time requirements, i.e., Tsim < Tphys, where Tsim – the simulation time (duration of simulation experiment execution), Tphys – duration of dynamic process in real-time of the physical process. Only main gate model was used in this benchmark.
Performance on a parallel (HPC/Cloud) infrastructure. The evaluated figure of merit was the parallel efficiency, measured as TSim/(NCores*TNcores=1), where NCores – the number of parallel processing units (e.g., CPU cores), TNcores=1 – the simulation time on a single processing unit. The evaluated system was served by a cluster with Intel Haswell CPU and Infiniband interconnect.
The performance results on non-parallel systems are shown in Fig. 14. In order to test the scalability on different hardware architectures, the evaluation was repeated for a doubled set of microservices (also involving more communication between them), which was achieved through refining the discretization mesh from Δψ=50m. (corresponds to 8 microservices representing the modelled main gate) to Δψ=25m. (i.e.,16 microservices, accordingly).
Benchmarking for the test case have revealed, that all systems were able to satisfy the real-time requirements (by the measured physical duration of the dynamic process of approximately 3 hours). As expected, the worst scalability results (decrease of performance by increased simulation’s computation load) were shown by the low-performance embedded system, however, without any implication on the usability in real-time scenarios.

226
International Journal on Advances in Software, vol 13 no 3 & 4, year 2020, http://www.iariajournals.org/software/
2020, © Copyright by authors, Published under agreement with IARIA - www.iaria.org
TABLE I. VALIDATION RESULTS FOR TEST OBJECT
Parameter Experiment (A) Experiment (B) Experiment (C)
Start Finish Start Finish Start Finish
Regulation Actions
Local regulator resistance
r´ [Ns2/m8] 0 0 0 25 25 5
Ventilator depression ΔP [N/m2]
0 160.69 160.69 160.69 160.69 160.69
Measurement Values
Airflow Q [m3/s]
- Main Gate 0 7.2 7.2 2.38 2.38 4.45
- Face 0 5.6 5.6 1.86 1.86 3.45
- Goaf 0 1.6 1.6 0.52 0.52 1.00
- Tail Gate 0 7.2 7.2 2.38 2.38 4.45
Simulation Results Values
Airflow Q [m3/s]
- Main Gate 0 7.199 7.199 2.39 2.39 4.45
- Face 0 5.599 5.599 1.86 1.86 3.46
- Goaf 0 1.599 1.599 0.53 0.53 0.99
- Tail Gate 0 7.199 7.199 2.39 2.39 4.45
The important outcome of the nonfunctional properties evaluation is the fact that despite of being extremely compute time consuming and communication intensive, the CFD models of ventilation networks can be executed even on relatively small and with weak performance low-power systems, which are interconnected by means of commodity networks, such as Ethernet. Of course, imposing the necessary level of approximation (as in our case that deals with 1D-models) is the major prerequisite for the ability of such small systems to carry out the simulation successfully; however, the precision of the obtained simulation results allows the simulations to be used for the real cases in production without any considerable restrictions.
Figure 14. Performance results on diverse hardware architetures.
As for a highly optimized parallel high-performance system, the scalability of the applications is one of the major criteria for the usability of parallel applications. This characteristic was tested on a parallel cluster with Infiniband interconnect and Intel Xeon processors. The parallel efficiency that was obtained on the cluster is shown in Fig. 15. The implemented benchmark shows very positive results (efficiency over 100%) for up to 72 cores. Afterwards, the efficiency starts lowering, due to undersubscription of the CPU cores, as the number of microservices remains unchanged. Overall, according to the evaluation results, the pilot implementation of the MS-Sim platform, supported by OpenMPI, was able to achieve good performance and can be applied in both real-time and HPC simulation cases.
Figure 15. Parallel efficiency on cluster.

227
International Journal on Advances in Software, vol 13 no 3 & 4, year 2020, http://www.iariajournals.org/software/
2020, © Copyright by authors, Published under agreement with IARIA - www.iaria.org
VI. CONCLUSION
The simulation technology is facing the challenges of application for new real-time scenarios that require a high flexibility of modelling tools in terms of the broader usage of the available infrastructure (data acquisition, storage, and processing devices). The rapid development of sensor networks has made possible a number of new innovative scenarios, for which the monolithic design of the existing simulation tools and workflow solutions on their top might be of a big obstacle. Service-oriented platforms offer a promising vision of the future development of simulation tools by offering benefits of on-demand distribution and parallelization, which might be well supported the underlying management platforms. Microservices are the technology that can if not fully replace the workflow-based scenarios but have the potential to support and bring them to the principally new level of usability. The effort that was done on implementation of the ventilation scenario has revealed a high potential of microservices architectures in geoscience and other domains of science and technology.
The dynamic approach, in which the services act as independent interactive components that are continuously running on the dedicated hardware and can be steered by a remote controller according to the specific application logic is particularly interesting for real-time control scenarios. In such scenarios, the services can incorporate the sensor data, make prediction for the future situation development, and instruct the control system about the probability of any potential risks appearance. On the other hand, the models can be optimized by adapting their parameters to best fit the actual mode of the controlled complex dynamic system.
The further research related to the application of the microservice simulation concept to the ventilation networks (and other dynamic systems with topological structure) will concentrate on the following activities:
elaboration of functional composition strategies to development of complex, assembled service for hierarchically-organized systems,
evaluation of the energy consumption of microservices on the embedded systems and elaboration of strategies to its minimization,
extension of the communication library to support other commodity data transfer libraries, such as any REST-based communication frameworks, such as RabbitMQ, etc.,
development of interfaces to communicate with the industrial sensors (field bus),
simplification of API towards automation of complex microservices creation,
modularization of the numerical solvers’ library, in order to allow a seamless selection of the required numerical method to be applied on the models.
The other important direction of work will be the adoption of the microservice programming concept and the implemented MS-Sim framework by the further application scenarios in the HPC community. The advantages that are offered by the SOA style of programming MIMD parallel applications offers advantages for many other application
domains in the engineering and other scientific computing fields. The developed microservice-based programming technology is expected to be useful for the design of environmental control systems, biomedicine applications, traffic prediction and control systems, as well as many others.
ACKNOWLEDGMENT
The work presented in this paper has become possible thanks to the support of the EU project ChEESE, which has received funding from the European Union’s Horizon 2020 research and innovation program under the grant agreement Nº 823844.
REFERENCES
[1] A. Cheptsov and O. Beljaev, “A Microservices Approach for Parallel Applications Design: A Case Study for CFD Simulation in Geoscience Domain”, In proc. GEOProcessing 2020: The Twelfth International Conference on Advanced Geographic Information Systems, Applications, and Services, pp. 25-30, 2020.
[2] B. Bordel Sánchez, R. Alcarria, and T. Robles, “Cyber-physical systems: Extending pervasive sensing from control theory to the Internet of Things”, Pervasive and Mobile Computing, 2017.
[3] M. Wollschlaeger, T. Sauter, and J. Jasperneite, “The future of industrial communication: Automation networks in the era of the Internet of Things and Industry 4.0”, IEEE Industrial Electronics Magazine, vol. 11, no. 1, pp. 17-27, 2017.
[4] C. Stewart, S. Aminossadati, and M. Kizil, “Use of live sensor data in transient simulations of mine ventilation models”, Mining Report 153 (4/2017), pp. 356-363, 2017.
[5] Internationales Energy Programm (IEA), “World Energy Balances 2019”, [Online]. Available from: https://www.iea.org/statistics/coal/. Last access on 5.12.2020.
[6] Wikipedia. Statistics of major catastrophes in coal mines, [Online]. Available from: https://de.wikipedia.org/wiki/ Liste_von_Ungl%C3%BCcken_im_Bergbau/ 2020.03.24. Last access on 5.12.2020.
[7] A. Chorin and J.-E. Marsden, “A Mathematical Introduction to Fluid Mechanics”, Springer Verlag, 2000.
[8] V. Svjatnyj, “Simulation of aerodynamic processes and development of control system for underground mine ventilation”, PhD thesis 1985, (in Russian).
[9] L. Feldmann, “Dynamics analysis and automated control systems synthesis for coalmine ventilation”, PhD thesis, 1974, (in Russian).
[10] H.J. Bungartz, S. Zimmer, M. Buchhoz, and D. Pflüger, “Model creation and simulation. A practise-oriented guide”, Springer Verlag, 2013, (in German).
[11] R. Rannacher, “Finite element methods for Navier-Stokes equation”, Lecture notes on theoretical and numerical fluid mechanics in Vancouver, 2019.
[12] L. Feldmann, V. Svyatnyy, M. Resch, and M. Zeitz, “Research domain: Parallel simulation technology”, In proc. ASIM: The 3. International Conference on Simulation and Computer Graphic, pp. 139-168, 2009.
[13] E. Lee, “The past, present and future of cyber-physical systems: A focus on models”, Sensors 15(3), pp. 4837-4869, 2015.
[14] J. A. Kay, R. Entzminger, and D. Mazur, "Industrial Ethernet - overview and best practices", Conference Record of 2014 Annual Pulp and Paper Industry Technical Conference, Atlanta, GA, pp. 18-27, 2014.

228
International Journal on Advances in Software, vol 13 no 3 & 4, year 2020, http://www.iariajournals.org/software/
2020, © Copyright by authors, Published under agreement with IARIA - www.iaria.org
[15] N. Ignatovych, “Perspectives of implementation of automated contol system UTAS in coal-mines”, Problems of work safety in Ukraine, 17(2009), pp. 3-16, 2009, (in Ukrainian).
[16] MS-Sim reference framework implementationat Github, [Online]. Available from: https://github.com/alexey-cheptsov/MS-Sim. Last access on 5.12.2020.
[17] E. Gabriel et al., “Open MPI: Goals, concept, and design of a next generation MPI implementation”, In proc. 11th European PVM/MPI Users' Group Meeting, pp. 97-104, 2004.
[18] Pollin, Odroid-XE4 short specification, [Online]. Available from: https://www.pollin.de/p/odroid-xu4-einplatinen-computer-samsung-exynos-5422-2-gb-2x-usb-3-0-810409. Last access on 5.12.2020.

229
International Journal on Advances in Software, vol 13 no 3 & 4, year 2020, http://www.iariajournals.org/software/
2020, © Copyright by authors, Published under agreement with IARIA - www.iaria.org
On Classifying Urban Issues from TV News UsingNatural Language Processing and Geoprocessing
Rich Elton Carvalho RamalhoInformation Systems Laboratory
Federal University of Campina GrandeCampina Grande - PB, [email protected]
Anderson Almeida FirminoInformation Systems Laboratory
Federal University of Campina GrandeCampina Grande - PB, Brazil
Claudio de Souza BaptistaInformation Systems Laboratory
Federal University of Campina GrandeCampina Grande - PB, Brazil
Ana Gabrielle Ramos FalcaoInformation Systems Laboratory
Federal University of Campina GrandeCampina Grande - PB, Brazil
Maxwell Guimaraes de OliveiraInformation Systems Laboratory
Federal University of Campina GrandeCampina Grande - PB, Brazil
Fabio Gomes de AndradeFederal Institute of Paraıba
Cajazeiras - PB, [email protected]
Abstract—Citizens as sensors enable society to discuss urbanissues. Although some geosocial networks have been developedin recent years to enable citizens to report many types of urbanproblems, the engagement of the users of these networks usuallydecreases in time. Hence, many relevant issues are not postedreducing the effectiveness of these networks. Aiming to overcomethis limitation, this article proposes an approach in which urbanissues are automatically detected from a television news program.The proposed solution uses geoparsing and Natural LanguageProcessing techniques to geocode and classify the identified com-plaints. The results are published in the Crowd4City geosocialnetwork that deals specifically with urban issues. Finally, ourmethod was evaluated using data from a real news TV programin Brazil. Our results indicated 59.8% of success in extractingtext and location from the video news.
Index Terms—Geosocial network; NLP; Urban Issues; Crowd-sourcing.
I. INTRODUCTION
The high concentration of population in urban areas hasimposed on local authorities several challenges to addressissues concerning mobility, security, infrastructure, education,health, etc. These are what we call urban issues. One importantchallenge for these authorities consists of identifying theproblems that have been faced by citizens.
Aiming to solve this limitation, in the context of SmartCities, some authors have developed geosocial networks thatdeal specifically with urban issues. These networks enablethe use of context-aware services to locate users and theircomplaints.
In a previous work [1] we provided a discussion towardsthe proposal for an approach for automated detection of urbanissues from TV news programs. In this work, we improveour previous proposal defining domain ontology named UIDO(Urban Issues Domain Ontology), which aims to model thesemantics of urban issues. We also extend the case study with
The authors would like to thank the Brazilian Research Council - CNPqfor funding this research.
a performance analysis in order to compare our classifier withXGBoost and Bi-LSTM classifiers. Finally, this work alsoprovides a state-of-the-art comprehensive review in the field.
In the context of Smart Cities, geosocial networks en-able the use of context-aware services to locate users andtheir complaints about urban issues. Several tools, such asCrowd4City [2], Wegov [3], and FixMyStreet [4] provideurban complaint environments. However, people’s motivationto use such geosocial networks decreases throughout time.Hence, to ensure a high engagement of society, differentapproaches to gathering information are required.
Several local TV stations in Brazil portray urban issuesaddressed by the community. An example is the ’Calendar’report in a daily open TV channel news program in the Stateof Paraıba, Brazil. That news broadcast exhibits several urbanissues from the main cities of that particular state. Then, wedecided to use the information presented in this broadcast toautomatically input new urban issues into geosocial networks,improving citizenship and increasing awareness. To accom-plish this task, we initially convert the audio descriptions inthe news channel into text. After that, we use geoparsingtools from Geographic Information Systems (GIS) and NaturalLanguage Processing (NLP) techniques to extract the correctlocation of the respective urban issues.
In this article, we propose a framework to extract audio filesfrom TV news, convert them into text documents, then extractlocation using a gazetteer and urban issues from text usingNLP techniques in order to feed the Crowd4City geosocialnetwork. It is important to mention that the news is up-to-date and extracted from a real context. Our main contributionconsists in the integration of GIS and NLP.
The remainder of this article is structured as follows. SectionII discusses related work. Section III presents an overview ofthe Crowd4City geosocial network. Section IV focuses on ourproposed method for extracting and structuring urban issuesreported in TV news. Section V presents a case study and

230
International Journal on Advances in Software, vol 13 no 3 & 4, year 2020, http://www.iariajournals.org/software/
2020, © Copyright by authors, Published under agreement with IARIA - www.iaria.org
discusses the results. Finally, Section VI concludes the paperand points out further research to be undertaken.
II. RELATED WORK
NLP techniques have been broadly used in several appli-cation domains including machine translation, speech recog-nition, chatbots/question answering, text summarization, textclassification, text generation, sentiment analysis, recommen-dation systems and information retrieval. Britz et al. [5] discussmachine translation using a seq2seq model. Reddy et al. [6]present a question answering approach. Schwenk et al. [7]focus on text classification. Radford et al. [8] propose alanguage model using unsupervised learners. NLP is difficultto accomplish since text differs from language to language.
Upon developing our proposed approach, we first performedan extensive study on the already existing models withinscenarios similar to ours. Given that our method is basedon NLP and geoparsing, we discovered some useful corpora.Oliveira et al. [9], for instance, contributed to the creationof a gold-standard english corpus of urban issues identifiedfrom geo-located tweets. Such information can be very usefulfor improving geoparsers and for developing classifiers forthe detection of urban issues. Focusing on our TV newsdomain, Camelin et al. [10] composed a corpus of differentTV Broadcast News from French channels and online pressarticles. These articles were manually annotated in order toobtain topic segmentation and linking annotations betweentopic segments and press articles. The FrNewsLink is freelyavailable online. Although both corpora are based on differentlanguages than the one used in our study, they proved to beuseful in such domains.
Aiming at obtaining information from the TV news videos,Kannao and Guha [11] focused their study on extracting textfrom the overlay banner presented in broadcasts. Such textusually contains brief descriptions of news events. They per-formed experiments using Tesseract Optical Character Recog-nition (OCR) for overlay text recognition trained using Webnews articles. The authors validated their approach usingdata from there Indian English television shows and obtainedsignificant results. However, their domain is limited. In a morerecent study [12], the authors proposed a system architecturethat enables the semantic segmentation of TV news broadcastvideos. In this architecture, the collected videos were seg-mented into shots from which advertisements were detectedand removed. Then, the remaining non-commercial contentwas classified as news bulletins, debates, or interviews. Finally,contents categorized as news bulletins were processed aimingat obtaining news stories. To validate the proposed architecturethey used videos from three Indian English news channels.Nonethetess, they do not address urban issues.
Chifu and Fournier [13] developed the SegChainW2Vframework. In their work, video segmentation was accom-plished from lexical chains obtained by transforming theresults of video transcriptions into vectors. Then, they usedcosine-based similarity measures to detect topic variationsalong with a video and applied the word2vec word embeddings
model for computing similarities between the videos. Theyused data from a French TV news broadcast and an EnglishMOOC video, and the preliminary results showed the viabilityof the proposed solution. Nevertheless, unlike the solutiondescribed in this article, this work did not deal with urbancomplaints.
Iwata et al. [14] enabled users to retrieve news videos fromkeywords. In their solution, the author used OCR for extractingcaptions from video images in Arabic. Then, they applied oftext processing techniques to perform character recognitionand automatic language translation. Their approach aimedat evaluating the use of frame images extracted from theAlJazeera broadcasting programs. Despite the relevance of thiswork, it does not evaluate the semantics of the videos.
Similarly, Pala et al. [15] developed a system for the tran-scription, keyword spotting and alerting, archival and retrievalfor broadcasted Telugu TV news. Their main goal was to aidviewers in easily detecting where and when topics of theirinterest were being presented on TV news in real-time andthey were also hoping to assist anyone (including editorialteams at TV studios) in discovering videos of TV news reportsabout specific topics, defined by the user with keywords. Theirsystem was the first that enabled the simultaneous executionof the broadcasted audio (speech), video and transcriptionof the audio in real-time with the Indian Language, withkeyword spotting and user alerts. Although it can detect topicsof interest based on keyword, the system cannot identify thetheme to extract the theme or domain being discussed in thevideo.
Bansal and Chakraborty [16] proposed an approach forcontent-based video retrieval by combining several state-of-the-art learning and video/sentence representation techniquesgiven a natural language query. They aimed at overcomingthe robustness and efficiency problems found in the existingsolutions using deep-learning based approaches, combiningmultiple learning models. Their results showed that their solu-tion was able to capture the videos’ and sentences’ semanticswhen compared to other existing approaches. However theauthors lack retrieving any geographic information.
Dong et al. [17] focused on developing a method forsubject words extraction of urban complaint data posted onthe Internet. Their approach consisted in the segmentation ofthe complaint information, extraction and filtering of candidatesubject words, and was validated using 8289 complaints postedon a Beijing website. The proposed method showed thatbetter results can be obtained than the Term Frequency–InverseDocument Frequency (TF-IDF) and TextRank methods in thecontext of written informal content made by Internet users.Nonetheless, such an approach would need to be validated inother scenarios.
Mocanu et al. [18] proposed a method for news extractionby using temporal segmentation of the multimedia informa-tion, allowing it to be indexed and thus be more easily foundthe users interested in specific topics. Their approach wasbased on anchorperson identification, where the TV newsprogram presenter was featured on the video. They performed

231
International Journal on Advances in Software, vol 13 no 3 & 4, year 2020, http://www.iariajournals.org/software/
2020, © Copyright by authors, Published under agreement with IARIA - www.iaria.org
some tests with a limited database of French TV programs.Nevertheless, the topic detection method implemented in thiswork is not very robust, since it is based only on the videosubtitles.
Zlitni et al. [19] addressed the problem of automatic topicsegmentation in order to analyze the structure and automati-cally index digital TV streams using operational and contex-tual characteristics of TV channel production rules as priorknowledge. They used a two-level segmentation approach,where initially the program was identified in a TV streamand then the segmentation was accomplished, thus dividing thenews programs into different topics. They obtained reasonableresults in their experiments, but their approach is completelydependent on the production rules of TV channels. Alsoaiming at achieving news story segmentation, Liu and Wang[20] focused their efforts on using a convolutional neuralnetwork in order to partition the programs into semanticallymeaningful parts. They based their input on the closed captioncontent of the news and trained and tested their model usingthe TDT2 dataset, from Topic Detection and Tracking (TDT).Although they obtained significant results, their approach islimited to the linguistic information extracted from the closedcaption and thus it is not applicable to programs without suchresource.
Even though several studies could be found, none of themcomprises the same aspects and goals we aim at achieving withour study, which is to perform NLP and GIS extraction andstructuring of stories depicted in TV news reports, focusingespecially on urban complaints.
III. ONTOLOGIES VERSUS TOPIC MODELING FOR URBANISSUES AUTOMATED EXTRACTION
The classical definition of ontology is provided by Gruber[21]: “An ontology is a formal explicit specification of a sharedconceptualization”. In other words, ontologies provide a sharedvocabulary that can be used to model a domain. Such a sharedvocabulary can be represented by objects and/or concepts thatmay contain properties and relationships [22].
In computer science, ontologies have been used since thelast decades for accomplishing several tasks such as im-proving communication between agents (human or software);enabling computational inference; and reusing data models orknowledge schemas [23]. In this context, ontologies can beclassified according to the language expressivity and scope.Language expressivity focuses on knowledge representation.Such a classification includes information ontologies, linguis-tic ontologies, software ontologies and formal ontologies. Onthe other hand, the scope addresses the level of specificityof the knowledge represented by the ontology and includesdomain ontologies and general ontologies.
Concerning language expressivity, information ontologiesare a clarified organization of ideas useful solely by humans.Linguistic ontologies can be dictionaries, folksonomies [24],lexical databases, etc. One known information ontology exam-ple is the Resource Description Framework (RDF). Softwareontologies focus on data storage and data manipulation for data
consistency in software development activities. The UnifiedModeling Language (UML) is one example of a softwareontology. Formal ontologies require some clear semanticsand involve formal logic and formal semantics, with strictrules about how to define concepts and relationships. TheWeb Ontology Language (OWL) a widely used language thatenables people to build formal ontologies. Finally, concerningthe scope of this article, domain ontologies stand out. Differentfrom general ontologies, domain ontologies focus on specificdomains, such as urban issues, with specific viewpoints andcharacteristics, to better represent the domain semantics.
A way of extracting valuable information from texts is usingOntology-based Information Extraction (IE), as performed byYang et al. [25]. Ontology-based IE processes unstructuredor semi-structured natural language text through a mechanismguided by ontologies to extract certain types of information[26]. Two main categories split ontology-based IE: document-driven and ontology-driven. Document-driven [27] is knownas semantic annotation, where the discovered knowledge isstructured in domain ontologies, while ontology-driven [28]extracts information from unstructured documents based on adomain ontology constructed under the help of domain expertsor even by combining domain ontologies with core referenceontologies and folksonomies.
While domain ontologies represent structured and special-ized semantic knowledge, topic modeling is the discovery ofhidden semantic structures in a text [29]. In this context, unsu-pervised topic modeling is an unsupervised machine learningtask that can scan a set of documents to detect word andphrase patterns a set of documents, detecting word and phrasepatterns within them, being suitable for dealing with a large-scale dataset [30]. Topic modeling also has the capability ofautomatically clustering word groups and similar expressionsthat best characterize a set of documents. Thus, topic modelingcan be seen as a baseline to build domain ontologies in orderto enable performing ontology-based IE in specific domainssuch as urban issues.
In the context of the urban issues domain, this article appliestopic modeling combined with location extraction in order toidentify not solely the main keywords for this domain, but alsothe hidden semantics of urban issues. Such hidden semanticsmay include the way of people complain about urban issuessuch as potholes, broken lights, litter and others. This is akey step towards building a domain ontology in the urbanissues domain that can be applied to perform ontology-basedIE in unstructured texts from social media. Moreover, oncea domain ontology in urban issues is built, it can be usefulto many other tasks. One of the main advantages in usingontologies is the interoperability by humans and the abilityto perform inferences, which makes the domain modelingeasier and readable by machines. In order to illustrate howontologies can be used to model semantically urban issues, inthe following we present a domain ontology for urban issues.

232
International Journal on Advances in Software, vol 13 no 3 & 4, year 2020, http://www.iariajournals.org/software/
2020, © Copyright by authors, Published under agreement with IARIA - www.iaria.org
Fig. 1. Main concepts and relationships from the UIDO ontology
A. The UIDO ontology
We designed the UIDO - Urban Issues Domain Ontology forsemantic modeling of urban issues [9], [31]. The design phasefor the UIDO ontology started by analyzing the CContology[32], a domain ontology developed to support online customercomplaint management. Such ontology contains seven mainclasses: Complaint Problems, Complaint Resolutions, Com-plaint, Complainant, Complaint-Recipient, Address, and Con-tract. From these, only four classes would be relevant to cre-ate the UIDO ontology: Complaint, Complainant, ComplaintProblems and Address. However, these four concepts couldnot be directly reused because they focus on specific customercomplaints that are quite different from the complaints in theurban issues domain. Therefore, only the CContology designideas were used for defining the concepts and relationships forthe UIDO ontology.
The UIDO ontology was developed using the Web OntologyLanguage (OWL) [33] using the Protege 5.0 system. The coreof the UIDO ontology is the classes UrbanIssueReport. thisclass has two main goals: to act as a top concept during thereasoning process on discovering urban issues from a text; andto be a metamodel for the Linked Data entities from the socialmedia messages related to urban issues. Figure 1 shows themain concepts and relationships of the UIDO ontology. Theseconcepts and relationships make the basic skeleton, but thereare others in the sublevels of the hierarchy.
The classes UrbanIssueType and UrbanLocationLevel(shown in Figure 1) are explained in more detail because theyare the most important concepts beyond the core. The coreclass UrbanIssueReport represents the reports regarding urbanissues. The “user” attribute is encapsulated into the Sourceclass as well as the “description” attribute. The UrbanIssueclass groups urban issue reports of the same type, locationand time by the hasUrbanIssueReport relationship.
The UrbanIssueType class models the classification of is-sues related to the urban environment. There are initially
Fig. 2. The urban issue type hierarchy
five subclasses for urban issue types: education, security,infrastructure, health and transportation. Figure 2 shows theUrbanIssueType hierarchy. The six issue types learned fromthe FixMyStreet corpora fits in the infrastructure concept.Thus, they are included as Infrastructure subclasses. Othercorpora and specialist knowledge would be necessary in orderto expand the ontology within other classes and subclasses thatmay be further included.
Figure 3 shows an example of two instances (“brokenbollard” and “pavement damage”) from the classes UrbanIs-sueTerm and UrbanIssueStem in a relationship with the issuetype “Road or Path Defects” from the UrbanIssueType class.
The UrbanLocationLevel class models the level of detail forgeographical locations. Figure 4 shows the urban location levelhierarchy. Such levels are used in constraints for urban issueslocations according to the urban issue term. These constraintsare modeled through the relationship occursIn. For example,a detected urban issue report about a pothole is relevant if itoccurred at street or POI (Point of Interest) levels. However, athigher levels such as city or county, such a report tends to beirrelevant due to the geographic vagueness. There are initiallythree subclasses: Street/Road, District and POI. Nevertheless,other levels may be further included according to new studies.The semantics of such instances are explained in details in thefollowing section.
The UrbanLocation class models the geographical informa-tion of urban issue reports. Such class reuses concepts from theLinkedGeoData ontology (LGDO) [34]. The LGDO ontologywas chosen for the spatial locations related to urban issues forthe following reasons: 1) It is derived from concepts definedby the OpenStreetMap [35]; 2) OpenStreetMap is currently ahuge up-to-date and open spatial database that contains spatialfeatures, mostly inside urban areas, such as street networks,which are commonly found in urban issue reports; 3) Apreliminary work (presented in the following section) thatfocused on the geographical facet of urban issues enables tostore spatial features from OpenStreetMap and provides the

233
International Journal on Advances in Software, vol 13 no 3 & 4, year 2020, http://www.iariajournals.org/software/
2020, © Copyright by authors, Published under agreement with IARIA - www.iaria.org
Fig. 3. An example of urban issue stems and terms related to an urban issuetype
Fig. 4. The urban location level hierarchy
location levels for the UIDO ontology.The Time class models the temporal information of an
urban issue. The temporal information can be assigned to thetime which the social media message was posted or it canbe extracted from the social media message using temporalparsers. Such class reuses concepts from the OWL-Timeontology [36]. The OWL-Time ontology models temporalconcepts describing the temporal properties of resources in theworld or described in Web pages such as urban issues reportedin social media. Thus, the class Time in the UIDO ontologyis equivalent to the TemporalEntity in the OWL-Time.
Finally, the classes UrbanIssueTerm and UrbanIssueStemmodel the key terms learned during the knowledge acquisitionstage. These concepts are in charge of connecting the topconcepts modeled with the terms learned from the analyzedcorpus. A set of relevant stems are instances of the urbanissue stem concept instead of words (elements from Wui) asa stem is the root of a word and thus it better represents agroup of words with similar semantics. The combined stemsproduce a set of relevant terms Tui through the relationshipformedByUrbanIssueStem. These terms are instances of theurban issue term concept. Then, subsets of these relevantterms compose the vocabulary of urban issue types throughthe relationship hasUrbanIssueTerm. Both term and stems canbe synonyms for each other. For those cases, the relationshipisSynonym applies.
Fig. 5. Crowd4City’s main user interface.
IV. THE CROWD4CITY GEOSOCIAL NETWORK
The Crowd4City system is a geosocial network aiming atproviding e-participation to citizens, which enables them totake part more actively in their city’s management, acting assensors. The Crowd4City users can share and comment onmany kinds of geolocated urban issues including traffic jam,criminality, potholes, broken pole lights and so on. Citizen’scomplaints about urban issues are shared publicly in theCrowd4City aiming to draw the attention of the authorities andthe society as a whole. Hence, Crowd4City enables humansas sensors in a smart city environment. Figure 5 depictsthe Crowd4City interface in which users can see the spatialdistribution and pattern of different topics related to urbanissues.
Regarding Crowd4City’s use (Figure 5), the citizens cancreate complaint posts using their personal information or evenanonymously, and they can input their dissatisfactions makinguse of the geographical tools. They can mark a single pointon the map where the problem took place (for instance, if theuser is reporting a pothole on a street); they can draw lines,perhaps to show routes where there are lighting issues; or theycan even draw polygons on the map, thus being able to reportregions that can be considered insecure.
Crowd4City presents some predefined categories for theproblems reported including: Education, Sanitation, Trans-portation, Work Under Construction, Security and Others(Noise Pollution, Rubbish, Lighting, Potholes, etc.). However,if the user wishes to report something else, there is a categorynamed “Other”, which can be used for such uncategorizedcomplaints.
Crowd4City’s posts consist mainly of a location (geographicinformation), a title, a brief description and optionally multi-media attachments if the user has pictures or videos of theproblem being reported. Additionally, the system provides asection for the other users’s feedback with like/dislike buttonsand a comment section, as seen in Figure 6.
Crowd4City enables operations such as pan and zoom.Also, the system provides several filters so that the users may

234
International Journal on Advances in Software, vol 13 no 3 & 4, year 2020, http://www.iariajournals.org/software/
2020, © Copyright by authors, Published under agreement with IARIA - www.iaria.org
perform more specialized searches for their information ofinterest. There are the basic filters, where the posts may berefined by the selected categories or creation dates; and theadvanced filters, which may consider the complaints’ contentsand their geographic information. With the advanced filters,the users may perform searches using the buffer and containsoperations, select some Points Of Interest (POI) categories(such as schools, hospitals, squares, airports and so on) andcombine all the available filters.
A serious problem when dealing with information submitteddirectly from the internet users is the reliability of suchdata. Malicious users and spammers may use this tool topost irrelevant, erroneous or misleading information or evenharmful URLs that can affect the users’ devices. In orderto bypass this problem, we elaborated a reputation model tobe implemented in the Crowd4City geosocial network thatevaluates every information submitted to the system and allowsthe users to better understand if what they are reading could betrustworthy or not. That way, we aim to provide a spam-freeenvironment for Crowd4City, minimizing misinformation.
Our reputation model evaluates every action the users make,such as post creation and comments. That way, we assigna score to each user, which represents how trustworthy theyare. When analyzing the content submitted in a new post orcomment, the reputation model first checks if there are anyof the flagged expressions (commonly used words associatedwith spam or malicious content, such as ”make money” or”lose weight”, which were not expected to be used in thecontext of this geosocial network). According to the numberof flagged expressions used, a spam score is attributed to itand that will have on user’s reputation.
The second step adopted was the prohibition of uploadingpossibly harmful files, such as executables (.exe files). How-ever, this is just a precautionary step and does not affect thereputation, since the file to be submitted could be.
We added in Crowd4City the possibility for the users toevaluate every post with ”I agree” or ”I disagree”. With
Fig. 6. A rubbish complaint.
the information retrieved from such feedback, we wish todetermine if the content evaluated could be inappropriate, falseor incorrect. Posts with a higher rate of ”I agree” feedback canindicate true and impartial content. The result of the feedbackin a post created by the user affecteds his reputation score.However, the reputation of the user who sends a feedback isalso taken into account, since a malicious user may try to ruinother users’ reputation.
A more direct way for the users to express their discon-tentment with users they see that are not using Crowd4Cityproperly is to report them as spammers on their profile pages.
Finally, one last feature is considered, which is the userparticipation in the system. Users that participate more activelycreating post, commenting and evaluating other posts are morelikely to have the system’s best interests in mind, wishing forCrowd4City to achieve its full potential and be filled withtruthful information that could be used to improve the city’sconditions and its population’s quality of life.
This way, users’ reputation score is calculated considering:the reputation score associated with their posts and comments;the number of times they have been flagged as spammers; andhow active they are. To each of these points, an expirationdate is associated, in case of users change their behavior overtime (once malicious users may change their mind and startusing the geosocial network correctly).
As a result, this reputation score is shown graphically onthe user’s profile page with a red stamp (for users with lowreputation scores), a white stamp (for neutral users), a bronzestamp, a silver stamp or a gold stamp (the last three for userswith a good reputation, according to how good their scoresare).
V. AUTOMATED METHOD FOR EXTRACTING ANDSTRUCTURING URBAN ISSUES REPORTED IN TV NEWS
The main problem addressed in this research deals withobtaining urban issues complaints from TV news, georef-erencing them and automatically classifying them into oneof the defined categories. The categories include sanitation,transportation, work under construction, among others. Theurban issues context considered in this work is based on acorpus built in a previous work [9].
Our methodology comprises the following steps, accordingto Figure 7. First, we implemented a Web scraping methodto extract the audio from video news. Second, we convert theaudio into text using a speech recognition tool. Third, we usea gazetteer to perform geoparsing on the mentioned addressesand locations obtained from the Named Entity Recognition(NER) process, without preprocessing. Then, we implementeda preprocessing step comprising word capitalization, stop-words removal and lemmatization. Fourth, we use NER toobtain the named entities from the text. Then, we performtopic modeling to obtain the class of urban issues related tothe text. Finally, the urban issues put into the Crowd4Citygeosocial network. We detail each step of our methodologynext.

235
International Journal on Advances in Software, vol 13 no 3 & 4, year 2020, http://www.iariajournals.org/software/
2020, © Copyright by authors, Published under agreement with IARIA - www.iaria.org
A. Web scraping - Video 2 Txt
Initially, we developed a Web scraping tool for obtaining thevideos from a TV news website. The data comes from a Brazil-ian TV broadcast website in Portuguese. We used the Seleniumlibrary [37] and YouTubeDL [38] to download the audio filesfrom the video URLs that were stored in a JavaScript ObjectNotation (JSON) file. Then, we used the SpeechRecognitionlibrary [39] with the Google Speech Recognition API toconvert audio into text. In order to decode the speech intotext, groups of vectors are matched to one or more phonemes,which is a fundamental unit of speech. The SpeechRecognitionlibrary relies on modern speech recognition systems basedon neural networks and Voice Activity Detectors (VADs). Inaddition, Google Speech Recognition API is free and supportsBrazilian Portuguese language with good results.
B. Preprocessing
In the preprocessing step, we converted the text into lowercase, removed stopwords and performed lemmatization. Weused the Spacy library [40] to perform entity recognitionof locations. The Natural Language Toolkit (NLTK) Pythonlibrary [41] was also used for the lemmatization process.
The strategy defined for the preprocessing was to extractwords that are entities from locations using the Spacy NER,for which the library performs very well when aided by theSpeechRecognition tool. Spacy also offers support for thePortuguese language, which avoids the translation of all textsinto English, as it may reduce performance.
Spacy recognizes the location entities of the text and theirtitle, so we combine all the location entities found to thensearch for those addresses and choose the one with the highestreliability.
We also have guaranteed anonymization by removing thenames of people that took part in the audio extracted fromvideo URLs. Hence, privacy was preserved, although it isimportant to note that all the videos processed in this workare publicly accessible from the sources.
Fig. 7. Our proposed methodology.
C. Geoparsing
We used the Geocoder library [42], which offers an APIthat enables the use of geocoding services such as Google,ArcGIS, and Bing. The chosen API service was ArcGIS,which provides simple and efficient tools for vector operations,geocoding, map creation and so on. Brazil is ranked level1 in the library, which means that an address lookup willusually result in accurate matches to the “PointAddress” and“StreetAddress” levels, which fulfills our requirements. Afterhaving the entities properly combined, we iterate through thisstructure by checking which one is the most accurate address(among the ones resulted by the Geocoder using ArcGIS). Theaccuracy is increased by filtering the addresses found, so theuser may perform filtering by state, city or even geographiccoordinate.
We used the Open Street Map (OSM) to obtain spatial datafrom some cities of the State of Paraiba in Brazil, and agazetteer to improve the geoparsing accuracy. The gazetteercontains streets, neighborhoods, roads, schools, hospitals, su-permarkets, pharmacies, etc. Notice that we do not deal withplace name pronunciation, as the audio files do, because thenames of the places were converted into text. We performed acleaning of this data to keep only the information of interest tous: name, type and coordinates. Such cleaned data was storedin a PostgreSQL/PostGIS database system. Figure 8 presentsthe geoparsing step.
D. Topic Modelling
Concerning the topic modeling, we used Gensim [43],an open-source library for unsupervised topic modeling andNLP, which provides statistical machine learning tools. Weused LDA from Gensim (LDAMulticore and LDAModel) toimplement topic modeling, which considers each documentas a collection of topics, and each topic as a collection ofkeywords.
In order to implement a topic classifier in Gensim, weneeded to follow a few steps: creating both a word dictionaryand a corpus (bag of words), then providing the desirednumber of topics and some algorithm tuning parameters. Theword dictionary chooses an identifier for each words containedin documents. The corpus (bag of words) was a dictionarycontaining a set of the word identifiers and the number ofoccurrences of each word along the document. TF-IDF wasalso used, transforming the corpus co-occurrence matrix intoa local TF-IDF co-occurrence matrix.
Concerning topic modeling, we removed all the words thatwere location entities, as they were not useful for the classclassification process, aiming at increasing the accuracy of themodel. Thus, our classifier focused on words of a given class,without worrying about locations.
To find out the best number of topics, some tests wereperformed and then we identified the best model comparing theevaluated models using the measure coherence score, whichevaluates the quality of the obtained topics. After these tests,we concluded that the best number of data topics would befour, as shown in Figure 9.

236
International Journal on Advances in Software, vol 13 no 3 & 4, year 2020, http://www.iariajournals.org/software/
2020, © Copyright by authors, Published under agreement with IARIA - www.iaria.org
Fig. 8. The geoparsing process.
With four topics, the algorithm achieve a coherence scoreof 0.527613, the best result in the used dataset. Anotherimprovement was the generation of the 15 most in the topicsgenerated by the algorithm. After that, we manually selectedthe words that should not be considered and we added themto the list of stop words. Then, we repeated the process untilthe 10 words in each topic were strongly related to the topic.
In topic modeling, we can analyze which topics representall documents and also the keywords of each topic. Figure 10shows the thirty most frequent words in the first topic andalso presents the words of the first topic sorted according totheir relevance. The most important words were water, sewage,pavement, and home, thus indicating that the topic addressessanitation problems.
VI. A CASE STUDY IN CAMPINA GRANDENEIGHBOURHOOD
Usually, urban issues raises the attention of the local press,in order to establish a connection between population and citycouncils. In Campina Grande, a 400,000 inhabitants Braziliancity, citizens report their complaints to local TVs throughmessaging service platforms.
Thus, this research aims to fill the gaps mentioned above,helping to share complaints and providing a centralized means
Fig. 9. Coherence score per number of topics.
with this information, it makes it easier for both the inhabitantsto make complaints and for the local authorities to solve thereported problems.
A. Setup
In this research, we collected 1,007 videos of the news story“My Neighborhood on TV”, covering the years 2016 to 2019,with an average duration of five minutes per video. We tookall videos from the Paraiba TV news program website [44].
From all the videos obtained, in 602 of them (59.8 %) itwas possible to obtain the text and the locations. Unfortunately,
Fig. 10. Most frequent words in the first topic.

237
International Journal on Advances in Software, vol 13 no 3 & 4, year 2020, http://www.iariajournals.org/software/
2020, © Copyright by authors, Published under agreement with IARIA - www.iaria.org
TABLE INUMBER OF TEXTS PER TOPIC
Class Number of instancesStreets 308Other (construction works) 236Other (sanitation) 108Education 91Garbage 79Other (traffic) 64Complaints 26Health 24Security 17Other (water shortage) 17Public transportation 14Forestation 5Other 1
some videos did not specify the location. At the same time,some videos did not specify the urban issue, as the word“obra”, which means “something not concluded that is beingbuilt or repaired” in Portuguese, is applied as a problemgeneralization.
We extracted the problem classes reported in the videos,enabling various applications to use them in an attempt toimprove city management. Municipality authorities may benotified to provide solutions for urban issues.
When analyzing the data, we could see that there was aclear imbalance. Table I shows the arrangement of classes andthe respective number of elements in each one.
As we can see in Table I, the majoritarian class had 308elements, while there were many classes with less than 50elements. However, as pointed by Branco et al. [45], whenusing unbalanced datasets, problems such as the use of biasedassessment metrics to enrich the performance of the modelsin less frequent cases will occur. Also, it is necessary to forcemachine learning algorithms to focus on these less frequentcases.
Therefore, we carry out tests with all classes and decidedto with performing use only the four classes with over 90elements: Education, Other (sanitation), Other (constructionworks), and Streets.
B. Results
We performed several tests in the Gensim library, usingdifferent pre-processing functions and tests different valuesfor their parameters. We set the number of steps equals to10 because we saw that with this number we obtained betterresults without losing performance (see Figure 11). When wetried to use values below or above 10, the accuracy decreased.
We used Coherence Score to test the topics, which measuresthe relative distance between the words within a topic. Thenumber of parameters used was 4, with a score of 0.52. Sucha score is acceptable in this preliminary study due to ourdataset. A problem using geoparsing is entity recognition.This is because the tools used for NLP cannot recognize
entities that are misspelled (for example, if someone wrotethe Campina Grande entity lowercase). However, this problemwas mitigated with the use of the TrueCase library [46], whichcorrected the capitalization of words, so that the geoparsingcould recognize the entities, obtaining good accuracy. It isimportant to notice that NLP is by definition not capable ofgetting the real meaning of any term or context, as text issomething by nature completely different than language. Inorder to deal with context, we needed to combine NLP withother resources such as Part-Of-Speech tagging and supervisedmachine learning algorithms for instance.
The TrueCase library supports the English language only.As our data was in Portuguese, we needed to use a library totranslate the words from Portuguese to English - GoogleTrans[47] - use the TrueCase and then do the reverse process, re-sulting the words in Portuguese with the correct capitalization.
As an additional process to improve the performance ofgeoparsing, we used a gazetteer, to improve in the geolocationprocess for texts of the city of Campina Grande - which is theobject of this research.
Regarding topic classification, we analyzed the F-Score: 1)With all 13 classes and 993 complaints, and 2) Removing theclasses with less than 90 instances, with 743 complaints re-maining. In both cases, we carried out the same pre-processing(stemming, TF-IDF, etc.). Besides, we used two classificationalgorithms and compared their results. The classification algo-rithms used in this study were XGBoost [48] and a Bi-LSTMneural network (Bidirectional LSTM). [49].
Using XGBoost with all classes we obtained an a F-Scoreof 68.55%. After removing classes with few instances, weimproved the results and obtained an F-Score of 83.34%. InFigure 12, we can see the F-Score with full data and only withthe major classes. On the other hand, using the Bi-LSTM withall classes, we obtained an F-Score of 32%. With the removalof minority classes, the F-Score increased to 75%, as we cansee in Figure 13.
Fig. 11. Comparative chart for influence of the steps value in the coherencescore.

238
International Journal on Advances in Software, vol 13 no 3 & 4, year 2020, http://www.iariajournals.org/software/
2020, © Copyright by authors, Published under agreement with IARIA - www.iaria.org
Fig. 12. Comparison between the results with full data and with four classesusing XGBoost.
Fig. 13. Comparison between the results with full data and with four classesusing Bi-LSTM.
VII. CONCLUSION
Citizens as sensors enable the engagement of societythrough technology to complain about urban issues. Smartcities demand tools for such engagement promoting e-citizenship and e-participation. Nonetheless, although someof such tools have already been proposed, it turns out thatpeople engagement decreases in time. Hence, the gathering ofurban issues from any media is very important to keep peopleengaged. As such, this article proposes an approach to gatherurban issues data from a TV news program using geoparsingand NLP techniques to locate and classify the urban issues inorder to input it in the Crowd4City geosocial network.
The results showed that our approach is feasible and thatwe manage to classify urban issues into four topics: mobility,sanitation, buildings and others. As future work, we plan toperform an in-depth performance analysis of geoparsing, aswell as topic modeling, by manually identifying the topicsof the videos as ground truth and comparing them with thetopic modeling results. Another plan consists of performing
a comparative study between topic modeling and supervisedmachine learning.
REFERENCES
[1] R. Rich Elton, F. Anderson, B. Claudio, F. Ana Gabrielle, O. Maxwell,and A. Fabio, “Using Natural Language Processing for ExtractingGeoSpatial Urban Issues Complaints from TV News.” Valencia, Spain:IARIA, Mar. 2020, pp. 55–60.
[2] A. G. R. Falcao et al., “Towards a reputation model applied to geosocialnetworks: a case study on crowd4city,” in Proceedings of the 33rdAnnual ACM Symposium on Applied Computing, SAC, Pau, France,2018, pp. 1756–1763.
[3] T. Wandhofer, C. van Eeckhaute, S. Taylor, and M. Fernandez, “We-Gov analysis tools to connect policy makers with citizens online,” inProceedings of the tGovernment Workshop, 2012, pp. 1–7.
[4] N. Walravens, “Validating a Business Model Framework for SmartCity Services: The Case of FixMyStreet,” in Proceedings of the 27thInternational Conference on Advanced Information Networking andApplications Workshops, 2013, pp. 1355–1360.
[5] D. Britz, A. Goldie, M.-T. Luong, and Q. V. Le, “Massive explorationof neural machine translation architectures,” ArXiv, vol. abs/1703.03906,2017.
[6] S. Reddy, D. Chen, and C. D. Manning, “Coqa: A conversationalquestion answering challenge,” vol. Transactions of the Associationfor Computational Linguistics, Volume 7, March 2019, pp. 249–266. [Online]. Available: https://www.aclweb.org/anthology/Q19-1016[accessed: 2020-03-02]
[7] H. Schwenk, L. Barrault, A. Conneau, and Y. LeCun, “Verydeep convolutional networks for text classification.” in EACL (1),M. Lapata, P. Blunsom, and A. Koller, Eds. Association forComputational Linguistics, 2017, pp. 1107–1116. [Online]. Available:https://www.aclweb.org/anthology/E17-1104/ [accessed: 2020-03-02]
[8] A. Radford et al., “Language models areunsupervised multitask learners,” 2018. [Online]. Available:https://d4mucfpksywv.cloudfront.net/better-language-models/language-models.pdf [accessed: 2020-03-02]
[9] M. G. de Oliveira, C. de Souza Baptista, C. E. C. Campelo, andM. Bertolotto, “A Gold-standard Social Media Corpus for Urban Issues,”in Proceedings of the Symposium on Applied Computing (SAC), ser. SAC’17. New York, NY, USA: ACM, 2017, pp. 1011–1016.
[10] N. Camelin et al., “FrNewsLink : a corpus linking TVBroadcast News Segments and Press Articles,” in Proceedingsof the Eleventh International Conference on Language Resourcesand Evaluation (LREC 2018). Miyazaki, Japan: EuropeanLanguage Resources Association (ELRA), 2018. [Online]. Available:https://www.aclweb.org/anthology/L18-1329 [accessed: 2020-03-02]
[11] R. Kannao and P. Guha, “Overlay Text Extraction From TV NewsBroadcast,” CoRR, vol. abs/1604.00470, 2016. [Online]. Available:http://arxiv.org/abs/1604.00470 [accessed: 2020-03-02]
[12] R. Kannao and P. Guha, “A system for semantic segmentation of tv newsbroadcast videos,” Multimedia Tools and Applications, vol. 79, no. 9, pp.6191–6225, 2020.
[13] A.-G. Chifu and S. Fournier, “Segchain: Towards a generic automaticvideo segmentation framework, based on lexical chains of audio tran-scriptions,” in Proceedings of the 6th international conference on webintelligence, mining and semantics, 2016, pp. 1–8.
[14] S. Iwata, W. Ohyama, T. Wakabayashi, and F. Kimura, “Recognitionand connection of moving captions in arabic tv news,” in 2017 1stInternational Workshop on Arabic Script Analysis and Recognition(ASAR). IEEE, 2017, pp. 163–167.
[15] M. Pala, L. Parayitam, and V. Appala, “Real-time transcription, key-word spotting, archival and retrieval for telugu TV news using ASR,”International Journal of Speech Technology, vol. 22, no. 2, pp. 433–439,2019.
[16] R. Bansal and S. Chakraborty, “Visual Content Based Video Retrievalon Natural Language Queries,” in Proceedings of the 34th ACM/SIGAPPSymposium on Applied Computing, ser. SAC ’19. New York, NY, USA:ACM, 2019, pp. 212–219.
[17] Z. Dong and X. Lv, “Subject extraction method of urban complaintdata,” in Proceedings of the IEEE International Conference on BigKnowledge (ICBK), 2017, pp. 179–182.

239
International Journal on Advances in Software, vol 13 no 3 & 4, year 2020, http://www.iariajournals.org/software/
2020, © Copyright by authors, Published under agreement with IARIA - www.iaria.org
[18] B. Mocanu, R. Tapu, and T. Zaharia, “Automatic extraction of story unitsfrom TV news,” in Proceedings of the IEEE International Conferenceon Consumer Electronics (ICCE), Jan. 2017, pp. 414–415.
[19] T. Zlitni, B. Bouaziz, and W. Mahdi, “Automatic topics segmentationfor TV news video using prior knowledge,” Multimedia Tools andApplications, vol. 75, no. 10, pp. 5645–5672, 2016.
[20] Z. Liu and Y. Wang, “TV News Story Segmentation Using Deep NeuralNetwork,” in Proceedings of the IEEE International Conference onMultimedia Expo Workshops (ICMEW), 2018, pp. 1–4.
[21] T. R. Gruber et al., “A translation approach to portable ontologyspecifications,” Knowledge acquisition, vol. 5, no. 2, pp. 199–221, 1993.
[22] M. Gruninger, “Ontology: applications and design,” Commun. ACM,vol. 45, no. 2, 2002.
[23] C. Roussey, F. Pinet, M. A. Kang, and O. Corcho, “An introduction toontologies and ontology engineering,” in Ontologies in Urban develop-ment projects. Springer, 2011, pp. 9–38.
[24] I. Peters, Folksonomies. Indexing and retrieval in Web 2.0. Walter deGruyter, 2009.
[25] X. Yang, R. Gao, Z. Han, and X. Sui, “Ontology-based hazard informa-tion extraction from chinese food complaint documents,” in InternationalConference in Swarm Intelligence. Springer, 2012, pp. 155–163.
[26] D. C. Wimalasuriya and D. Dou, “Ontology-based information extrac-tion: An introduction and a survey of current approaches,” 2010.
[27] O. Corcho, “Ontology based document annotation: trends and openresearch problems,” International Journal of Metadata, Semantics andOntologies, vol. 1, no. 1, pp. 47–57, 2006.
[28] D. W. Embley, D. M. Campbell, R. D. Smith, and S. W. Liddle,“Ontology-based extraction and structuring of information from data-rich unstructured documents,” in Proceedings of the seventh interna-tional conference on Information and knowledge management, 1998,pp. 52–59.
[29] D. M. Blei, “Introduction to probabilistic topic models,” Communica-tions of the ACM, vol. 55, no. 4, pp. 77–84, 2011.
[30] A. Lesnikowski, E. Belfer, E. Rodman, J. Smith, R. Biesbroek, J. D.Wilkerson, J. D. Ford, and L. Berrang-Ford, “Frontiers in data ana-lytics for adaptation research: Topic modeling,” Wiley InterdisciplinaryReviews: Climate Change, vol. 10, no. 3, p. e576, 2019.
[31] M. G. d. Oliveira, “Ontology-driven urban issues identification fromsocial media.” Ph.D. dissertation, Federal University of Campina Grande(UFCG), 2016.
[32] M. Jarrar, “Towards effectiveness and transparency in e-business trans-actions: an ontology for customer complaint management,” in SemanticWeb for Business: Cases and Applications. IGI Global, 2009, pp. 127–149.
[33] D. L. McGuinness, F. Van Harmelen et al., “Owl web ontology languageoverview,” W3C recommendation, vol. 10, no. 10, p. 2004, 2004.
[34] C. Stadler, J. Lehmann, K. Hoffner, and S. Auer, “Linkedgeodata: Acore for a web of spatial open data,” Semantic Web, vol. 3, no. 4, pp.333–354, 2012.
[35] M. Haklay and P. Weber, “Openstreetmap: User-generated street maps,”IEEE Pervasive Computing, vol. 7, no. 4, pp. 12–18, 2008.
[36] S. Cox, C. Little, J. Hobbs, and F. Pan, “Time ontology in owl,” W3Crecommendation, vol. 19, 2017.
[37] Selenium, “Selenium Library.” [Online]. Available:https://www.selenium.dev/ [accessed: 2020-03-02]
[38] R. Gonzalez et al., “YouTubeDL.” [Online]. Available:https://github.com/ytdl-org/youtube-dl [accessed: 2020-03-02]
[39] A. Zhang, “Selenium.” [Online]. Available:https://github.com/Uberi/speechrecognition [accessed: 2020-03-02]
[40] Explosion AI, “Spacy.” [Online]. Available: https://spacy.io/ [accessed:2020-03-02]
[41] NLTK Project, “The Natural Language Toolkit.” [Online]. Available:https://radimrehurek.com/gensim/ [accessed: 2020-03-02]
[42] D. Carriere et al., “Geocoder.” [Online]. Available:https://geocoder.readthedocs.io/ [accessed: 2020-03-02]
[43] R. Rehurek and P. Sojka, “Software Framework forTopic Modelling with Large Corpora.” [Online]. Available:https://radimrehurek.com/gensim/ [accessed: 2020-03-02]
[44] G1 Paraiba, “JPB1 TV News program official website.” [Online].Available: http://g1.globo.com/pb/paraiba/jpb-1edicao/videos/ [accessed:2020-03-02]
[45] P. Branco, L. Torgo, and R. P. Ribeiro, “A survey of predictive modelingon imbalanced domains,” ACM Comput. Surv., vol. 49, no. 2, pp. 31:1–31:50, 2016.
[46] D. Fury, “TrueCase.” [Online]. Available:https://github.com/daltonfury42/truecase [accessed: 2020-03-02]
[47] S. Han, “Googletrans.” [Online]. Available: https://github.com/ssut/py-googletrans [accessed: 2020-03-02]
[48] T. Chen and C. Guestrin, “Xgboost: A scalable tree boosting system,”in Proceedings of the 22nd ACM SIGKDD International Conferenceon Knowledge Discovery and Data Mining, San Francisco, CA, USA,August 13-17, 2016, 2016, pp. 785–794.
[49] A. Graves and J. Schmidhuber, “Framewise phoneme classificationwith bidirectional lstm and other neural network architectures,” NeuralNetworks, vol. 18, no. 5, pp. 602 – 610, 2005, iJCNN 2005.

240
International Journal on Advances in Software, vol 13 no 3 & 4, year 2020, http://www.iariajournals.org/software/
2020, © Copyright by authors, Published under agreement with IARIA - www.iaria.org
Context and Georeferencing of Archaeological, Prehistorical, and GeoscientificObject Entities, Resulting from Integration of Knowledge Resources’ Development
and Universal Conceptual Knowledge Pattern Matching
Claus-Peter RuckemannWestfalische Wilhelms-Universitat Munster (WWU), Germany;
Unabhangiges Deutsches Institut fur Multi-disziplinare Forschung (DIMF), Germany;Leibniz Universitat Hannover, GermanyEmail: [email protected]
Abstract—This paper presents the long-term research resultson context creation and georeferencing, deploying advancedknowledge based mining, enabled by conceptual knowledgeframeworks. The goal of this fundamental research is tosystematically develop advanced information science tools andknowledge-based methods, gaining new insights for complexarchaeological, prehistorical, and geoscientific contexts. The vastresources and data collections are otherwise not practicallyavailable to archaeologists and geoscientists. The paper presentsthe methodological base of an innovative algorithm frameworkof conceptual knowledge pattern matching, allowing theconsideration of complementary and descriptive knowledgeof meaning and intrinsic object properties. The research isillustrated by practical implementations of knowledge patternmatching, including processing and developing multi-disciplinaryand multi-lingual knowledge object entities and resources. Thisspecialised research concentrates on geoscientific context andgeoreferencing. The demonstration of a previously unpublishedpractical information science case study from classicalarchaeology, prehistory, and geosciences shows automatedknowledge context creation and georeferencing.
Keywords–Knowledge Context Creation; Georeferencing;Archaeology and Geosciences; Superordinate Knowledge;Conceptual Knowledge Pattern Matching Methodology.
I. INTRODUCTION
Advanced creation of context and georeferencing frommulti-disciplinary archaeological, prehistorical, and geoscien-tific object entities is a most challenging task. So far, there isno consistent, practical concept available relieving the funda-mental deficits of respective resources, especially motivatingnew fundamental ways of concepts’ integration.
This extended research is based on the creation of advancedknowledge resources and implementation of the ConceptualKnowledge Pattern Matching (CKPM), which was presentedat the GEOProcessing 2020 conference in Valencia, Spain [1].
This paper presents developments, which are complemen-tary to conceptual knowledge deployed in knowledge resourcesand processing method used so far. The new developmentsclosely integrate with features enabled by knowledge-centricdevelopment of resources and objects. The presented casesfocus on basic phonetic associations and topographic andcartographic context creation and visualisation, starting withadvanced knowledge mining.
Knowledge Mining is supported by a number of commonmethods and algorithms, e.g., string pattern matching algo-rithms, associative, comparative, and phonetic algorithms. Allthese achievements deal with distinct extrinsic properties ofrespective entities in very limited ways.
The motivation for creating the CKPM was the lack ofsuitable facilities for an advanced matching of ‘meaning’ whenimplementing mining solutions in context of complex multi-disciplinary and multi-lingual Knowledge Resources. Espe-cially, conceptual knowledge can relate to any of factual, con-ceptual, and procedural knowledge. To a comparable extent,metacognitive knowledge can also relate to any of factual,conceptual, and procedural knowledge but the formalisationof conceptual knowledge is different in a way that universalimplementations can be deployed in flexible and still consistentways. A practical approach for knowledge pattern matching isthe fundament for this research. Its methodological fundamentsand the practical integration with the development of univer-sal knowledge resources will be presented in the followingsections, targetting on the practical creation of object entities’context and georeferencing.
The rest of this paper is organised as follows. Section IIprovides the background of knowledge complements and for-malisation of meaning. Section III introduces the previouswork and components. Sections IV presents methodology,method, and implementation. Sections V, VI, and VII presentthe implementation, matching process, and resulting tables.Section VIII provides an implementation of module integrationfor the result of context creation and georeferencing. Sec-tions IX and X discuss the main achievements and summariseconclusions and future work.
II. FROM MEANING AND STRUCTURES TO KNOWLEDGECOMPLEMENTS
Knowledge, meaning, and patterns form relations, whichmay require some introduction.
The concept of meaning differs from the concept of signifi-cation. Semantic and syntactic structures do not suffice to de-termine the discursive meaning of an expression [2]. Discoursemeans a way of speaking. On the one hand, grammaticallycorrect phrases may lack discursive meaning. On the otherhand, grammatically incorrect sentences may be discursivelymeaningful.
Such formalised approaches require a solid understandingof interpretation [3] and application of methods. Fundamen-tal approaches, especially, the semiotic triangle of symbol,thought/Reference, and referent [4] are fundamental for un-derstanding principles.
Knowledge and meaning are closely tied with intrinsic andextrinsic properties. Therefore, understanding of intrinsic andextrinsic properties of entities is significant for any context.

241
International Journal on Advances in Software, vol 13 no 3 & 4, year 2020, http://www.iariajournals.org/software/
2020, © Copyright by authors, Published under agreement with IARIA - www.iaria.org
This is nevertheless true for any case of natural language, esp.considering langage, langue, and parole [5].
Creating practical approaches requires algorithms. An algo-rithm is a process or set of rules to be followed in problem-solving operations. In general, algorithms cannot, by theirfundamental nature, handle intrinsic and extrinsic propertiesto the same quality and extent. For example, an intrinsicproperty of a word object is the meaning in mind, the ‘lemma’.An extrinsic property of a word object can be a writtenword. Extrinsic properties do not reflect meaning and insightas their representations do not generally allow reasonableresults. Best practice provides us with solid, complementaryknowledge concepts and methodologies allowing to createadvanced methods.
Data do not have or carry meaning. Therefore, understandingmeaning is of major significance in information science whendealing with improving formalisation processes and creating‘logos based’ analogies along with cognitive processes. Com-monly, cognition (cognitio, from Latin cognoscere, “get toknow”) is the mental action or process of acquiring knowledgeand understanding through thought, experience, and the senses(Source: Oxford dictionary). Analogy (from Greek analogia,αναλoγια, “proportion”) is a cognitive process of transferringinformation or ‘meaning’ from a particular subject, the ana-logue or source, to another, the target.
Nevertheless, aspects of meaning can be described usingknowledge complements, e.g., considering factual, conceptual,procedural, and metacognitive knowledge [6]. Especially, con-ceptual knowledge can relate to any of factual, conceptual, andprocedural knowledge. To a comparable extent, metacognitiveknowledge can relate to any of factual, conceptual, and proce-dural knowledge. A practical approach for knowledge patternmatching will be presented in the following sections.
III. PREVIOUS WORK, COMPONENTS, AND RESOURCES
The fundaments of terminology and understanding knowl-edge are layed out by Aristotle being an essential part of‘Ethics’ [7]. Information sciences can very much benefit fromAristotle’s fundaments and a knowledge-centric approach [6]but for building holistic and sustainable solutions, supportinga modern definition of knowledge [8], they need to go beyondthe available technology-based approaches and hypothesis [9]as analysed in Platon’s Phaidon.
Making a distinction and creating interfaces between meth-ods and the implementation applications, the results of thisresearch are illustrated here along with the practical exampleof the Knowledge Mapping methodology [10] enabling thecreation of new object and entity context environments, e.g.,implementing methods for knowledge mining context.
The means to achieve such recommendations even forcomplex scenarios is to use the principles of SuperordinateKnowledge, integrating arbitrary knowledge. The core assem-bly elements of Superordinate Knowledge [11] are:
• Methodology.• Implementation.• Realisation.
Separation and integration of assemblies have proven beneficialfor building solutions with different disciplines and differentlevels of expertise. Comprehensive focussed subsets of con-ceptual knowledge can also provide excellent modular andstandardised complements for information systems component
implementations, e.g., for environmental information manage-ment and computation [12].
For the implementation of case studies, the modules are builtby support of a number of major components and resources,which can be used for a wide range of applications, e.g.,creation of resources and extraction of entities. The UniversalDecimal Classification (UDC) [13] is the world’s foremostdocument indexing language in the form of a multi-lingualclassification scheme covering all fields of knowledge andconstitutes a sophisticated indexing and retrieval tool. TheUDC is designed for subject description and indexing ofcontent of information resources irrespective of the carrier,form, format, and language. UDC is an analytico-synthetic andfacetted classification. It uses a knowledge presentation basedon disciplines, with synthetic features. UDC schedules areorganised as a coherent system of knowledge with associativerelationships and references between concepts and relatedfields. The UDC allows an efficient and effective processing ofknowledge data and provides facilities to obtain a universal andsystematical view on classified objects. UDC-based referencesin this publication are taken from the multi-lingual UDCsummary [13] released by the UDC Consortium [14] undera Creative Commons license [15]. Facets can be createdwith any auxiliary tables, e.g., auxiliaries of place and space,time, language, and form as well as general characteristics,e.g., properties, materials, relations, processes, and operations,persons and personal characteristics. Module examples areemploying Perl Compatible Regular Expressions (PCRE) [16]syntax for specifying common string patterns and Perl [17] forcomponent wrapping purposes with this information sciencecase study in archaeology, prehistory, and geosciences.
In addition, context data, visualisation modules, and pho-netic modules were developed and integrated for benefit ofthis research. The used components will be referred to in therespective following sections.
IV. METHODOLOGY AND IMPLEMENTATION
The implementation strictly follows the fundamentalmethodological algorithm base.
A. Methodological algorithm baseThe Conceptual Knowledge Pattern Matching (CKPM)
methodology targets providing and accessing knowledge objectpatterns. This methodological algorithm framework is basedon the Superordinate Knowledge Methodology, which allowssystematical use and thorough processing by the steps:
1) Selecting knowledge objects.2) Accessing knowledge object patterns.3) Thorough processing of object entities and references.4) Object entity analysis, knowledge complements’ based.5) Result formation.
The respective accessing includes the organisation and struc-tures used with the objects and entities. Object patterns need tobe accessible to an extent and quality, which allows a sufficientprocessing for the respective scenario. The requirements forspecific scenarios will therefore be individual. The processingincludes making use of the characteristics and features of therespective implementations of the knowledge based frame-works providing a conceptual base for a certain method. Theconceptual knowledge complements referred from knowledge

242
International Journal on Advances in Software, vol 13 no 3 & 4, year 2020, http://www.iariajournals.org/software/
2020, © Copyright by authors, Published under agreement with IARIA - www.iaria.org
objects can have their origins from manual as well as fromautomated processes. For the implementation and realisation,the framework providing the base conceptual knowledge ref-erence patterns is the UDC. The results in this publication usethe UDC Summary Linked Data (Main Tables, [18]). Creatingfacets and patterns can also make use of the common auxiliarysigns being part of the UDC framework [19]. The followingadvanced employment of conceptual knowledge (UDC) is farbeyond common application of universal classification.
B. Implemented methodAn implementation of a CKPM based method requires
accessible objects and a suitable conceptual framework basefor processing and automation. The methodic implementationillustrated here enables to employ an UDC framework appro-priate for systematical use, implemented by the steps:
1) Knowledge Resources’ objects.2) Accessing formalised conceptual knowledge object pat-
tern description based on UDC, e.g., including geosci-entific context and georeferencing.
3) Processing procedure via pipelines, employing UDCknowledge and forks.
4) Entity analysis, based on UDC framework references.5) Result formation on base of Knowledge Resources’
objects, retaining conceptual knowledge.In this case, meaning is described by conceptual patterns,which can be searched and analysed. Processing algorithmscan follow the given organisation, e.g., the decimal organisa-tion of the UDC, following available forks as will be illustratedfor the matching process in the following sections. Processingand analysis includes primary, decimal conceptual knowledgeand associated multi-dimensional knowledge in context ofthe object entities. The method allows advanced data-centriccomputing procedures. In practice, the facility for consistentlydescribing knowledge is a valuable quality, esp., conceptualknowledge, e.g., using the UDC and its editions.
C. Implemented conceptual knowledge framework and targetTargeting practical use for advanced geoscientific informa-
tion and expert systems, conceptual geoscientific and geo-graphic mapping and referencing are required. Geographicconceptual knowledge pattern entities are created based onUDC code references [20] of geography, biography, history.Table I shows an implementation excerpt.
TABLE I. CONCEPTUAL KNOWLEDGE PATTERN MATCHING: IMPL. UDCREFERENCES OF GEOGRAPHY, BIOGRAPHY, HISTORY (EXCERPT).
Code / Sign Ref. Verbal Description (EN)
UDC:902 ArchaeologyUDC:903 Prehistory. Prehistoric remains, artefacts, antiquitiesUDC:904 Cultural remains of historical timesUDC:908 Area studies. Study of a localityUDC:91 Geography. Exploration of the Earth and of individual
countries. Travel. Regional geographyUDC:912 Nonliterary, nontextual representations of a regionUDC:92 Biographical studies. Genealogy. Heraldry. FlagsUDC:93/94 HistoryUDC:94 General history
A geoscientific / archaeology example from the case studiesand implementations for geoscientific information systems
and application components is used for illustration in thenext sections. The example will show a tiny subset of thecomprehensive, universal conceptual knowledge used.
The above conceptual knowledge contains all the referencesfor geographic context, which includes the conceptual knowl-edge regarding geographic data, e.g., geoinformation and geo-descriptive knowledge. The relevant conceptual knowledge re-quired for geoscientific context is provided by references fromnatural sciences’ context. Any of the conceptual knowledgecan be used in any stage of a CKPM process, e.g., in start,intermediate, and target specifications.
Natural sciences related conceptual knowledge pattern enti-ties are created based on UDC code references [21] of mathe-matics and natural sciences. An excerpt of the implementationis shown in Table II.
TABLE II. CONCEPTUAL KNOWLEDGE PATTERN MATCHING: IMPL. UDCREFERENCES OF MATHEMATICS AND NATURAL SCIENCES (EXCERPT).
Code / Sign Ref. Verbal Description (EN)
UDC:51 MathematicsUDC:52 Astronomy. Astrophysics. Space research. GeodesyUDC:53 PhysicsUDC:54 Chemistry. Crystallography. MineralogyUDC:55 Earth Sciences. Geological sciencesUDC:550.3 GeophysicsUDC:551 General geology. Meteorology. Climatology.
Historical geology. Stratigraphy. PalaeogeographyUDC:551.21 Vulcanicity. Vulcanism. Volcanoes. Eruptive phenomena.
EruptionsUDC:551.7 Historical geology. Stratigraphy. PalaeogeographyUDC:551.8 PalaeogeographyUDC:551.24 GeotectonicsUDC:56 PalaeontologyUDC:57 Biological sciences in generalUDC:58 BotanyUDC:59 Zoology
Time related conceptual knowledge pattern entities arecreated based on UDC code references [22], especially theauxiliaries of time). Table III shows an implementation excerpt.
TABLE III. CONCEPTUAL KNOWLEDGE PATTERN MATCHING:IMPLEMENTED UDC REFERENCES, AUXILIARIES OF TIME (EXCERPT).
Code / Sign Ref. Verbal Description (EN)
UDC:“0” First millennium CEUDC:“1” Second millennium CEUDC:“2” Third millennium CEUDC:“3/7” Time divisions other than dates in Christian (Gregorian)
reckoningUDC:“3” Conventional time divisions and subdivisions:
numbered, named, etc.UDC:“4” Duration. Time-span. Period. Term. Ages and age-groupsUDC:“5” Periodicity. Frequency. Recurrence at specified intervals.UDC:“6” Geological, archaeological and cultural time divisionsUDC:“61/62” Geological time divisionUDC:“63” Archaeological, prehistoric, protohistoric periods and agesUDC:“7” Phenomena in time. Phenomenology of time
Spatial conceptual knowledge pattern entities are createdbased on UDC code references [23], especially the auxiliariesof spatial features and place (UDC (1/9)), (Table IV).

243
International Journal on Advances in Software, vol 13 no 3 & 4, year 2020, http://www.iariajournals.org/software/
2020, © Copyright by authors, Published under agreement with IARIA - www.iaria.org
TABLE IV. CONCEPTUAL KNOWLEDGE PATTERN MATCHING: IMPL. UDCREFERENCES, AUXILIARIES OF SPATIAL FEATURES AND PLACE (EXCERPT).
Code / Sign Ref. Verbal Description (EN)
UDC:(1) Place and space in general. Localization. OrientationUDC:(2) Physiographic designationUDC:(3) Places of the ancient and mediaeval worldUDC:(31) Ancient China and JapanUDC:(32) Ancient EgyptUDC:(33) Ancient Roman Province of Judaea. The Holy Land.
Region of the IsraelitesUDC:(34) Ancient IndiaUDC:(35) Medo-PersiaUDC:(36) Regions of the so-called barbariansUDC:(37) Italia. Ancient Rome and ItalyUDC:(38) Ancient GreeceUDC:(399) Other regions. Ancient geographical divisions other than
those of classical antiquityUDC:(4) EuropeUDC:(5) AsiaUDC:(6) AfricaUDC:(7) North and Central AmericaUDC:(8) South AmericaUDC:(9) States and regions of the South Pacific and Australia.
Arctic. Antarctic
Knowledge Resources’ objects carry respective conceptualUDC facets and references, including georeferences.
V. BASIC PRINCIPLE PROCESSING IMPLEMENTATION
Regarding an implementation (‘lxgrep’), a basic routinepreparing object entity input into a common structure isillustrated in Figure 1.
1 if (/ˆ(\S)(.*)/./ˆ /||/ˆ$/||/ˆ *$/) {2 s/ˆ(\S.*)\n/\@ENTRY\@$1@@/;3 s/ˆ(.*)\n/\1@@/;4 s/\@ENTRY\@/\n/;5 open(TMPFILE,">>$tempfile"); print TMPFILE "$_"; close(
TMPFILE);6 }
Figure 1. Basic routine preparing input entries (excerpt).
An associated elementary system call implementing a basicregular search is shown in Figure 2.
1 system("egrep -h $temppat $ARGV[0].tmp > $ARGV[0].grep.tmp");
2 system("mv $ARGV[0].grep.tmp $ARGV[0].tmp");
Figure 2. Elementary system call for a basic regular search (excerpt).
An element for a simple system sort based function usedwith the above search is shown in Figure 3.
1 print "\tsorting entries...\n";2 system("sort -f -k 1,14 <$tempfile>$tempfile.out");3 unlink $tempfile;
Figure 3. Element of simple system call sort function (excerpt).
A simple backformatting routine is given in Figure 4.
1 print "\tbackformatting entries...\n";2 system("perl -e ’while (<>){s/@@/\n/g;chop;print $_}’ <
$ARGV[0].tmp>$ARGV[0].sort");3 unlink "$ARGV[0].tmp";
Figure 4. Simple backformatting routine (excerpt).
For further structural, technical details, and pipelining pleasesee the references for the case studies given in the text.
VI. NEW MATCHING PROCESS AND PROCESSING
The new framework of the matching process and processingincludes following the conceptual knowledge forks. Here,the primary, decimal reference forks of the UDC are usedfor implementation, which provide the red line forks withinuniversal knowledge. Matching is beyond non-conceptualknowledge, e.g., natural language processing and string patternmatching. Especially, country and border concepts cannotbe used for specification, e.g., ancient and modern borderlines fail to be useful. The process enables places in ancientGreece and Rome, from archaeological and prehistoric timesassociated with places in the ancient and modern world tobe described, e.g., references of the type UDC:..."63"(37)and UDC:..."63"(38). Trigger question can be ‘Canarchaeological artefacts’ objects of a certain context beassociated with earth science objects?’. A symbolic writingspecifying a conceptual expression is shown in Figure 5.
1 STRT:[UDC:.*?90]2 CTXT:[[UDC:.*?\(.*?38.*?\)]|[UDC:.*?\"6.*?\"]].*[[UDC
:.*?\"6.*?\"]|[UDC:.*?\(.*?38.*?\)]]3 SRCH:[[UDC:.*?55]|[UDC:.*?912]]
Figure 5. Example for symbolic writing of pattern expression (excerpt).
A systematic concept of conceptual knowledgeimplementation allows advanced features, e.g., patternrange variations, pattern permutations. A basic serial pipelineimplementation example test for knowledge objects in<input> is shown in Figure 6.
1 cat <input> | lxgrep "’%%IML:.*?UDC:.*?\(38.*?\)’" |lxgrep "’%%IML:.*?UDC:.*?\"6.*?\"’" <outputctxt>
2 cat <outputctxt> | lxgrep "’%%IML:.*?UDC:.*?90’"3 cat <outputctxt> | lxgrep "’%%IML:.*?UDC:.*?55’" | lxgrep
"’%%IML:.*?UDC:.*?912’" | lxgrep LATLON:
Figure 6. Example for serial pipeline implementation (excerpt).
The pipeline includes objects containing and referring tolatitude / longitude objects. The trackable spatial/place relatedfork process within the conceptual pattern entity group isillustrated in Figure 7.
UDC:(1/9)
UDC:(9)
UDC:(8)
UDC:(7)
UDC:(6)
UDC:(5)
UDC:(4)
UDC:(3)
UDC:(39)
UDC:(38). . .. . .. . .UDC:(37)
. . .
UDC:(31)UDC:(2)
UDC:(1)Conceptualpattern
entity group
Common
auxiliaries
of place
Figure 7. Matching process: Primary, decimal (UDC) conceptual knowledgeforks, auxiliaries of spatial features and place (excerpt).
The processing successfully follows the “Ancient Greece”fork. Figure 8 illustrates the fork process within the conceptual

244
International Journal on Advances in Software, vol 13 no 3 & 4, year 2020, http://www.iariajournals.org/software/
2020, © Copyright by authors, Published under agreement with IARIA - www.iaria.org
pattern entity group for the related conceptual knowledgeregarding time.
UDC:"0/7"
UDC:"7"
UDC:"6"
. . .
UDC:"63". . .. . .. . .UDC:"61/62"
. . .UDC:"5"
UDC:"4"
UDC:"3"
UDC:"2"
UDC:"1"
UDC:"0"Conceptualpattern
entity group
Common
auxiliaries
of time
Figure 8. Matching process: Primary, decimal (UDC) conceptual knowledgeforks, auxiliaries of time (excerpt).
The processing successfully follows the “geographical/his-torical” and “natural sciences” fork. The main tables of theconceptual knowledge are managed in the same way withinthe respective conceptual pattern entity groups (Figure 9).
UDC:0/9
UDC:9
UDC:94
UDC:93
UDC:92
UDC:91. . .. . .. . .UDC:90
UDC:8
UDC:7
UDC:6
UDC:5
UDC:59
UDC:58
. . .
UDC:55. . .. . .. . .. . .
UDC:50
UDC:4
UDC:3
UDC:2
UDC:1
UDC:0Conceptualpattern
entity group
Main
tables
Figure 9. Matching process: Primary, decimal (UDC) conceptual knowledgeforks, main tables, including earth sciences and geography (excerpt).
The processing successfully follows the “Earth sciences”and “Geography” forks. These procedures referencing to aformalised [24], practical framework of conceptual knowledgeembrace all the relevant universal knowledge, e.g., includingnatural sciences and geosciences, archaeology, philosophy, andhistory. The results of removing in the domain of knowledgeand removing in the domain of mathematics are not the same.In principle, abstraction means removing [25]. In the mathe-matical domain, removing is mostly formalised by subtraction[26].
In general, any universal conceptual knowledge frameworkcan be used, which enables a systematical processing and
which is universal and consistent. Nevertheless, UDC hasproven to be by far the most universal, practical, and efficientchoice for multi-disciplinary and multi-lingual context. There-fore, UDC references are used for this publication, illustration,and the practical implementations for this research.
Demonstrated meaning patterns can be used plain, e.g.,on conceptual fundament, or integrating references betweenobjects containing non-conceptual knowledge, too. The de-velopment target will certainly depend on intended case sce-narios and capacities of resources’ and module developers.This research can only demonstrate some principle, majorfeatures of UDC in context of an implementation done forthe given practical scenario. However, it is always possible toparametrise conceptual knowledge depth and width of matchesfor any case due to the structure of the UDC implementation.
VII. RESULTING MATCH TABLES
Following the above archaeology-geosciences case ofmatching process and processing, the resulting match tablescontain the references to conceptional and associated multi-dimensional knowledge in context of the object entities. Theresulting start match table of object entities (Table V) containsentities and references on details of mythological and archae-ological context.
TABLE V. RESULTING CONCEPTUAL KNOWLEDGE PATTERN MATCHINGINTERMEDIATE START (‘UDC:90’) MATCH TABLE (EXCERPT).
Object Entity Reference Data (excerpt)
Poseidon DESC MYTH SYN LOC UDC . . . CITE:[27], [28], [29], [30]Polybotes /-is DESC MYTH SYN LOC UDC . . . CITE:[27], [29]Polyvotes /-is DESC MYTH SYN LOC UDC . . . CITE:[27], [29] (transcr.)
These entities contain descriptions, including transcriptions,transliterations, translations, mythology references, synonyms,location references, UDC references, and citation sources.The citations refer to respective associations of the figuredprogramme with Poseidon and the giant Polybotes / Polybotis /Polyvotes / Polyvotis and further references to the detailsof mythological context of realia objects, respectively toParthenon metopes (Acropolis, Athens).
The result match table of object entities (Table VI) containsentities and references on details of natural sciences contextand georeferences.
TABLE VI. RESULTING CONCEPTUAL KNOWLEDGE PATTERN MATCHINGINTERMEDIATE RESULT (‘UDC:55’) MATCH TABLE (EXCERPT).
Object Entity Reference Data (excerpt)
Kos DESC VOLC VNUM GRC LATLON UDC . . .Methana DESC VOLC VNUM GRC LATLON UDC . . .Milos DESC VOLC VNUM GRC LATLON UDC . . .Nisyros DESC VOLC VNUM GRC LATLON UDC . . .Santorini DESC VOLC VNUM GRC LATLON UDC . . .Yali DESC VOLC VNUM GRC LATLON UDC . . .
The entities in the respective match tables containdescriptions, volcanological references, volcano numbers,country references, latitude and longitude location references,UDC references, and further references. A resulting object isshown in Figure 10. Its respective media object entities referto archaeology associated with Poseidon and Polyvotis.

245
International Journal on Advances in Software, vol 13 no 3 & 4, year 2020, http://www.iariajournals.org/software/
2020, © Copyright by authors, Published under agreement with IARIA - www.iaria.org
1 Nisyros [Volcanology, Geology, Archaeology]:2 Volcano, Type: Strato volcano, Island,3 Country: Greece, Subregion Name: Dodecanese Islands,4 Status: Historical, Summit Elevation: 698\UD{m}. ...5 Craters: ..., VNUM: 0102-05=, ...6 %%IML: UDC:[911.2+55],[930.85],[902]"63"(4+38+23+24)=147 %%IML: UDC:[912] ...8 %%IML: media:...{UDC:[911.2+55],"63"(4+38+23)}...jpg9 Stefanos Crater, Nisyros, Greece.
10 LATLON: 36.578345,27.168069611 %%IML: GoogleMapsLocation: https://www.google.com/...@36
.578345,27.1680696,337m/...12 Little Polyvotis Crater, Nisyros, Greece.13 LATLON: 36.5834105,27.1660736 ...
Figure 10. Result object entity from Knowledge Resources: Nisyros object,Greece, containing media object entities and georeferences (excerpt).
As requested, the object contains / refers to latitude /longitude and conceptual knowledge, together with factualknowledge and media references.
Figure 11 shows media object entities based on the concep-tual knowledge pattern matching process, an object entity atprocess start (Figure 11(a)), from archaeological artefacts, anda resulting reference object (Figure 11(b)), from natural ob-jects. The media object entities and their context represent theresult of the requested knowledge pattern matching, includingrespective georeferencing properties.
VIII. INTEGRATION MODULES FOR RESULT CONTEXTCREATION AND GEOREFERENCING
Commonly, it is a challenging question how the integrationof multi-disciplinary knowledge object instances and contextcan be achieved for further deployment.
A. Phonetic modules and values
The deployed implementation modules support a ‘silken’selection [31], phonetic modules, which can be specified andclosely integrated with conceptual context.
The knowledge resources can be used by any algorithmsuitable for a defined workflow. One of the available mod-ule implementing a silken selection based on the Soundexprinciple is the knowledge_sndx_standard application. Thehistorical Soundex [32] is a phonetic algorithm for indexingnames by sound. The goal with this algorithm is to encode ho-mophones so that they can be represented by the same resultingcode in order to match persons’ name despite differences inwriting and spelling [33]. The basic algorithm mainly encodesconsonants. Vowels are not encoded unless being a first letter.The U.S. Government is using a modified modern rule set [34]for purposes in census and archives. The original intention wasto catch the English pronunciation, anyhow there are manydifferent implementations in use today.
The selection module, modelled after the standard Perl im-plementation [35], for computing LX Soundex codes [36], canbe adapted for different procedural context and programmingconcepts [37], [38]. The various workflows can define andintegrate their own Soundex codes for different purposes andtopics.
A large number of different modules and algorithms weredeveloped for this research, even including various phoneticalgorithms for respective content and context. Listing 11shows a fully functional excerpt Perl source code module(knowledge_sndx_grlat) modelled after the standard Perlimplementation and developed for the respective Greek andLatin context.
1 #!/usr/bin/perl2 #3 # knowledge_sndx_grlat -- (c) LX Project -- CPR
1992, 2012, 20194 #5
6 $string=$ARGV[0];7 $sndx_nocode = undef;8
9 sub knowledge_sndx_grlat10 {11 local (@s, $f, $fc, $_) = @_;12 push @s, ’’ unless @s;13
14 foreach (@s)15 {16 $_ = uc $_;17 tr/A-Z//cd;18
19 if ($_ eq ’’)20 {21 $_ = $sndx_nocode;22 }23 else24 {25 ($f) = /ˆ(.)/;26 tr/-AEHIOUWYBFPVCGJKQSXZDTLMNR
/000000000111122022222334556/;27 ($fc) = /ˆ(.)/;28 s/ˆ$fc+//;29 tr///cs;30 tr/0//d;31 $_ = $f . $f . $_ . ’000’;32 s/ˆ(.{5}).*/$1/;33 $_=˜s/BB/BV/;34 $_=˜s/VV/BV/;35 }36 }37
38 wantarray ? @s : shift @s;39 }40
41 $code = knowledge_sndx_grlat $string;42 print ("SNDX-grlat:$code:$string\n");43
44 ##EOF:
Figure 11. LX Soundex SNDX-grlat module Perl source code (excerpt),considering language dependent homophonic partial word transcriptions.
Table VII shows the result of the selection module forrespective transcriptions in this information science case study.
TABLE VII. PHONETIC SOUNDEX SNDX-GRLAT CODES FOR TRANSCRIPTSOF POLYBOTES AND HOMOPHONIC PARTIAL WORDS (EXCERPT).
Object Entity Soundex Code (excerpt)
Polybotes SNDX-grlat:PP413:PolybotesPolybotis SNDX-grlat:PP413:PolybotisPolyvotes SNDX-grlat:PP413:PolyvotesPolyvotis SNDX-grlat:PP413:Polyvotis-botes SNDX-grlat:BV320:-botes-botis SNDX-grlat:BV320:-botis-votes SNDX-grlat:BV320:-votes-votis SNDX-grlat:BV320:-votis
The special phonetic code algorithm can consider possibletranscriptions in respective languages for code results, whichreflect a well comparable phonetic situation even for differenttranscriptions of the same entities.

246
International Journal on Advances in Software, vol 13 no 3 & 4, year 2020, http://www.iariajournals.org/software/
2020, © Copyright by authors, Published under agreement with IARIA - www.iaria.org
(a) Metope, New Acropolis Museum, Athens, (CPR, DIMF, 2019). (b) Volcano crater, island of Nisyros, Dodecanese Islands, Greece, (CPR, DIMF, 2019).
Figure 11. Result based on the conceptual knowledge pattern matching process, via intermediate match table (Table VI): (a) an artefact, metope (EAST VI),Parthenon, (Archaeology Digital Object Archive, 2019), and a resulting georeferenced object, (b) a natural object (Geosciences Digital Object Archive, 2019).
B. Knowledge reference tree: Phonetic and conceptualAssociated relations of object entities may span more than a
distinctive conceptual knowledge reference group. Table VIIIshows an excerpt of object entities and associated sources andreference data. The excerpt reflect presented the informationscience case study. Reference data excerpts list UDC codereferences and Soundex code references (SNDX-standard) forthe named object entities.
Colour codes of the generated knowledge context reflect theresults of the knowledge pattern matching, especially the resultgroup (yellow) and result group contexts (green/blue).
TABLE VIII. KNOWLEDGE REFERENCE TABLE: UDC CODE REFERENCESAND PHONETIC (SOUNDEX, SNDX-GRLAT) ASSOCIATION (EXCERPT).
Object Entity and Sources KR Reference Data (excerpts)UDC Code Soundex Code
Parthenon, Acropolis, Athens O UDC:902/904... SNDX:PP635Polybotes , [27], [29] (transcr.) O UDC:902/904... SNDX:PP413
SNDX:BV320Poseidon, [27], [28], [29], [30] O UDC:902/904... SNDX:PP235
. . .
Kos (Volcano) C UDC:550.3... SNDX:KK200Methana (Volcano) C UDC:550.3... SNDX:MM350Milos (Volcano) C UDC:550.3... SNDX:MM420Nisyros (Volcano) CO UDC:550.3... SNDX:NN262
Polyvotis (Volc. Crater) CO UDC:550.3... SNDX:PP413SNDX:BV320
Stefanos (Volc. Crater) CO UDC:550.3... SNDX:SS315Santorini (Volcano) C UDC:550.3... SNDX:SS536Yali (Volcano) C UDC:550.3... SNDX:YY400. . .
Knowledge Resources (KR) can contain objects and entitiesof different organisation and structure, especially, collection(O) object entities and container (C) object entities. Referencedata, especially UDC codes and phonetic Soundex codes,can be deployed for complex scenarios, which benefit from
advanced referenced besides knowledge content and contextof object entities and referenced sources.
There are two categories of object entities regarding a geo-referencing context: Object entities, which cannot be logicallyattributed with a georeferencing and those, which have prop-erties allowing georeferencing attributation. The first category(upper group) in this case is represented by a UDC:902/904context group, whereas the second category (lower group) isrepresented by a UDC:550.3 context group.
The groups are linked by conceptual knowledge as someentities refer to both special collections and containers (CO).An additional, significant reference link between the groupcalculates from the phonetic SNDX:PP413/SNDX:BV320 ref-erences.
C. Reference to automated context and georeferencing
Those associated object entities of different groups (Ta-ble VIII), which carry conceptual references and georefer-encing can be selected by available properties and criteria,especially conceptual knowledge and phonetic means.
Table IX shows an excerpted result of the phonetic/con-ceptual knowledge reference tree process, the automaticallyassociated georeferenced object entities.
TABLE IX. RESULT OF THE PHONETIC/CONCEPTUAL KNOWLEDGEREFERENCE TREE: GEOREFERENCED OBJECT ENTITIES (EXCERPT).
Object Entity Reference Data (excerpt)LATLON
Kos (Volcano) 36.829 27.257Methana (Volcano) 37.615 23.336Milos (Volcano) 36.699 24.439Nisyros (Volcano) 36.580 27.180Parthenon, Acropolis, Athens 37.972 23.727Polyvotis (Volc. Crater) 36.583 27.177Santorini (Volcano) 36.404 25.396Stefanos (Volc. Crater) 36.578 27.168Yali (Volcano) 36.630 27.100

247
International Journal on Advances in Software, vol 13 no 3 & 4, year 2020, http://www.iariajournals.org/software/
2020, © Copyright by authors, Published under agreement with IARIA - www.iaria.org
Figure 12. Automatically generated knowledge context (red bullet markers) of the conceptual knowledge pattern matching result group (yellow labels) and resultgroup contexts (green/blue labels) in their topographic context, created based on georeferenced knowledge resources object entities and conceptual knowledge.
Consecutive context can be created by automatically gen-erated mapping and visualisation modules, e.g., employingGMT routines, based on these results. Result context of theUDC:902/904 context group are UDC:550.3 context groupobject entities, which secondary context (Figure 12) is repre-sented by respective geological and plate tectonics knowledgefor the georeferenced area (Aegean Sea region). The newgenerated context integrates the various contexts and objectentity representations in a multi-dimensional result. For thesecases the module option is Mercator projection in order toprovide a common base for comparisons of proper attributesand required flexibility.
Appropriate data was required for the topographic datarelated criteria. In the past, the georeferenced objects havebeen used with various data, e.g., with the Global LandOne-kilometer Base Elevation Project (GLOBE) [39] and the2-minute gridded global relief data (ETOPO2v2) [40].
For the required resolution of the results presented here,the knowledge resources had to be integrated with databased on the gridded ETOPO1 1 arc-minute global reliefmodel data [41]. For special purposes data can be composedfrom various sources, e.g., adding Shuttle Radar TopographyMission (SRTM) data [42] from the Consultative Group onInternational Agricultural Research (CGIAR) [43].
The horizontal datum of ETOPO1 is World Geodetic Systemgeographic, which was established in 1984 (WGS84) and later
revised. The WGS84 specifications and references are providedby the National Geospatial-Intelligence Agency (NGA) [44]and as EPSG:4326 from the European Petroleum SurveyGroup Geodesy (EPSG) [45]. The vertical datum of ETOPO1is “sea level”. The source elevation data were not converted bythe authors of ETOPO1 to a common vertical datum becauseof the large cell size of 1 arc-minute.
The Generic Mapping Tools (GMT) [46] suite applicationcomponents are used for handling the spatial data, applyingthe related criteria, and for the visualisation.
IX. DISCUSSION
The implemented method and the integration modules forresult context creation and georeferencing has been a viable,efficient, and flexible solution in many case scenarios. Imple-mentations are far not trivial but any discipline being able toask questions as demonstrated should also be able to deploythe methodology and presented components for creating solidfundaments and practical solutions for challenging, complexscenarios, e.g., classification and dating of objects [47], geo-scientific prospection, surveying [48], and knowledge [49],chorological and chronological context [50], can contribute tothe fundaments of archeological and prehistorical cognition[51] and insight [52] regarding realia and abstract objects,knowledge, and contexts. The presented knowledge-basedmethod and conceptual knowledge framework allow to address

248
International Journal on Advances in Software, vol 13 no 3 & 4, year 2020, http://www.iariajournals.org/software/
2020, © Copyright by authors, Published under agreement with IARIA - www.iaria.org
context very flexibly, e.g., in order to enable the metacognitivedocumentation of metacognitive and procedural knowledge ofGeoscientific Information Systems or Geographic InformationSystem analysis [53], filtering contextualised artistic represen-tations [54] and managing object collections [55]. Knowledge-based approaches can also be beneficial without advancedknowledge resources, e.g., in cases of realia collections, infor-mation management and service oriented institutions and re-search data collection, e.g., The Digital Archaeological Record[56] of Digital Antiquity [57].
For example, in focus cases of archaeology, prehistory, andhistory context and georeferencing can further be supportedby facet creation into more dimensions and also allows theapplication of a consistent conceptual base for descriptionand fuzziness, beyond common auxiliaries and georeferencing.Spatial references beyond common auxiliaries of place [23](Table IV), especially ‘Places of the ancient and mediaevalworld’ (UDC:(3)) and ‘Countries and places of the modernworld’ (UDC:(4/9)) can be created from the following tablesof UDC code references.
Tables X and XI provide example excerpts of relevant mainconceptual knowledge and details of UDC references used forconceptual mapping. For conceptual knowledge of place andspatial context the implementations requires to provide refer-ences to classification codes. The UDC provides referencesbased on the common auxiliaries of place of the UDC [23]as excerpted here for facets of place and space, physiographicdesignation, and places from ancient to modern world.
TABLE X. CONCEPTUAL MAPPING REFERENCES WITH UDC CODES OFSPATIAL FEATURES / PLACE: AUXILIARIES OF PLACE (EXCERPT).
UDC Code Description
UDC:(1/9) Common auxiliaries of place.UDC:(1) Place and space in general. Localization. OrientationUDC:(100) Universal as to place. International. All countries in generalUDC:(1-0/-9) Special auxiliary subdivision for boundaries and
spatial forms of various kindsUDC:(1-0) ZonesUDC:(1-1) Orientation. Points of the compass. Relative positionUDC:(1-2) Lowest administrative units. LocalitiesUDC:(1-5) Dependent or semi-dependent territoriesUDC:(1-6) States or groupings of states from various points of viewUDC:(1-7) Places and areas according to privacy, publicness and
other special featuresUDC:(1-8) Location. Source. Transit. DestinationUDC:(1-9) Regionalization according to specialized points of view
TABLE XI. CONCEPTUAL MAPPING REFERENCES WITH UDC CODES OFSPATIAL FEATURES / PLACE: PHYSIOGRAPHIC DESIGNATION (EXCERPT).
UDC Code Description
UDC:(2) Physiographic designationUDC:(20) EcosphereUDC:(21) Surface of the Earth in general.
Land areas in particular.Natural zones and regions
UDC:(23) Above sea level. Surface relief. Above groundgenerally. Mountains
UDC:(24) Below sea level. Underground. SubterraneanUDC:(25) Natural flat ground (at, above or below sea level). The
ground in its natural condition, cultivated or inhabitedUDC:(26) Oceans, seas and interconnectionsUDC:(28) Inland watersUDC:(29) The world according to physiographic featuresUDC:(3/9) Individual places of the ancient and modern world
The references, e.g., classification, facets, concordances, andtextual description, are usable in all the procedures and stepsand allow to consider and implement arbitrary flexibility offuzziness. Entry points to relevant and associated knowledgemay be in any disciplinary context due to the consistentframework of the UDC and the multi-disciplinary and multi-lingual Knowledge Resources.
In our practical research projects and implementations,deploying a modular integration of consequent knowledgeresources’ components and their development with means ofconceptual knowledge pattern matching has proven to enablevaluable solutions for challenging and complex cases of inmany disciplines.
X. CONCLUSION
This research achieved to implement the goal of integratingknowledge resources’ development and universal conceptualknowledge pattern matching for practical context creation andgeoreferencing of archaeological, prehistorical, and geoscien-tific object entities. Respective module implementations, com-ponents developments, and results of automatically generatedand consistent knowledge context and georeferencing wereshown.
The information science integration case study demonstratedthe practical components and their coherence for creatingcontext and generating context results, e.g., visualisation, car-tographic and topographic context including advanced solu-tions of object entity selection for georeferencing. It must beemphasised that this research targets an information sciencecase study for multi-disciplinary resources and context, andcannot be limited to plain principles of case studies of technicalor engineering aspects.
The implementations successfully employ the method ofknowledge pattern matching based on the CKPM methodology.Further, the knowledge based mining implementation success-fully employs the UDC references in order to provide therequired conceptual framework. The UDC references provedto provide an excellent core component, for universal, multi-disciplinary, and multi-lingual knowledge.
In this new context, UDC showed to have a perfect organ-isational structure of conceptual knowledge for practical, sys-tematical use as well as for an efficient and flexible processingsupport, following respective knowledge forks for referenceswhile creating and keeping developing resources and concep-tional knowledge consistent supported by its editions.
The rewarding benefits of the methodology allow disci-plines, e.g., archaeologists, to work with complex and multi-disciplinary and multi-lingual knowledge references in a con-sistent way, which can by far no longer be dealt with man-ually or even with anachronistic practices. The knowledge-based methodology enables addressing arbitrary knowledgeand facets and to create new and individual methods for dealingwith complements, based on common knowledge resources.
The general framework includes targetting previouslyunidentified references to knowledge resulting from the refer-enced complements. The methodology provides a wide rangeof facilities for individual methods to deal with applicationscenarios, multi-dimensional object references, fuzziness andarbitrary fine granularity of knowledge and references and evenreferences from external notations.

249
International Journal on Advances in Software, vol 13 no 3 & 4, year 2020, http://www.iariajournals.org/software/
2020, © Copyright by authors, Published under agreement with IARIA - www.iaria.org
However, each of the deployed implementation components,e.g., classification, phonetic algorithms, and topographic con-text data, and GMT mapping, may require intensive study andeven years of experience. The integration may even requireadditional levels of understanding and experience. Therefore,to significant extent, the will and seriousness to invest inand work with information science methods is an unavoidableprecondition for any discipline to create successful solutionsfor millions of references and objects based on the presentedmethods.
In daily practice, the integration based on the new methodprovides excellent and sustainable conceptual documentationand enables to create associations and links between knowl-edge object entities, which cannot result with comparableconsistency otherwise. Further, configuring knowledge rangescan be achieved in many ways, e.g., by limiting resources, con-figuring the pattern depths and widths, ranking and selection.
Future research on theory and practice will continue devel-oping practical conceptual knowledge frameworks, especiallyfor prehistory and archaeology and natural sciences context,suitable knowledge resources, knowledge patterns, and furthermeans of integration modules and components.
ACKNOWLEDGEMENTS
We are grateful to the “Knowledge in Motion” (KiM)long-term project, Unabhangiges Deutsches Institut fur Multi-disziplinare Forschung (DIMF), for partially funding this re-search, implementation, case studies, and publication undergrants D2018F6P04938 and D2018F3P04932 and to its seniorscientific members and members of the permanent commissionof the science council, especially to Dr. Friedrich Hulsmann,Gottfried Wilhelm Leibniz Bibliothek (GWLB) Hannover,to Dipl.-Biol. Birgit Gersbeck-Schierholz, Leibniz UniversitatHannover, to Dipl.-Ing. Martin Hofmeister, Hannover, andto Olaf Lau, Hannover, Germany, for fruitful discussion,inspiration, practical multi-disciplinary case studies, and theanalysis of advanced concepts. We are grateful to Dipl.-Ing.Hans-Gunther Muller, HPE, Germany, for his excellent contri-butions and assistance providing practical private cloud andstorage solutions. We are grateful to the members of theEastern Mediterranean research and studies campaign 2018–2020, DIMF, and all national and international partners inthe Geo Exploration and Information cooperations for theirconstructive and trans-disciplinary support. We are gratefulto The International ARS Science and History Network andThe Science and High Performance Supercomputing Centre(SHPSC) for long-term support. / DIMF-PIID-DF98 007.
REFERENCES
[1] C.-P. Ruckemann, “From Knowledge and Meaning Towards Knowl-edge Pattern Matching: Processing and Developing Knowledge ObjectsTargeting Geoscientific Context and Georeferencing,” in Proceedingsof The Twelfth International Conference on Advanced Geographic In-formation Systems, Applications, and Services (GEOProcessing 2020),November 21 – 25, 2020 - Valencia, Spain. XPS Press, Wilmington,Delaware, USA, 2020, pages 36–41, ISSN: 2308-393X, ISBN-13:978-1-61208-762-7, URL: http://www.thinkmind.org/index.php?view=article&articleid=geoprocessing 2020 3 10 30035 [accessed: 2020-08-09].
[2] M. Foucault, The Archaeology of Knowledge. Routledge Classics,2002, ISBN: 978-0-415-28752-4, Translated by A. M. Sheridan Smith.
[3] Aristotle, On Interpretation, 2008, Peri Hermeneias, Organon, (Written350 B.C.E.), Translated by E. M. Edghill Provided by The Internet Clas-sics Archive, URL: http://classics.mit.edu/Aristotle/interpretation.html[accessed: 2020-07-12].
[4] C. K. Ogden and I. A. Richards, The Meaning of Meaning: A Studyof the Influence of Language upon Thought and of the Science ofSymbolism, 1923.
[5] F. de Saussure, Cours de linguistique generale, 1916, (title in English:Course in General Linguistics), Charles Bally and Albert Sechehaye(eds.).
[6] L. W. Anderson and D. R. Krathwohl, Eds., A Taxonomy for Learning,Teaching, and Assessing: A Revision of Bloom’s Taxonomy of Educa-tional Objectives. Allyn & Bacon, Boston, MA (Pearson EducationGroup), USA, 2001, ISBN: 978-0801319037.
[7] Aristotle, The Ethics of Aristotle, 2005, Project Gutenberg, eBook,EBook-No.: 8438, Rel. Date: Jul., 2005, Digit. Vers. of the Orig. Publ.,Produced by Ted Garvin, David Widger, and the DP Team, Edition 10,URL: http://www.gutenberg.org/ebooks/8438 [accessed: 2020-01-12].
[8] C.-P. Ruckemann, F. Hulsmann, B. Gersbeck-Schierholz, P. Skurowski,and M. Staniszewski, Knowledge and Computing. Post-Summit Re-sults, Delegates’ Summit: Best Practice and Definitions of Knowledgeand Computing, Sept. 23, 2015, The Fifth Symp. on Adv. Comp. andInf. in Natural and Applied Sciences (SACINAS), The 13th Int. Conf.of Num. Analysis and Appl. Math. (ICNAAM), Sept. 23–29, 2015,Rhodes, Greece, 2015, DOI: 10.15488/3409.
[9] Plato, Phaedo, 2008, (Written 360 B.C.E.), Translated by BenjaminJowett, Provided by The Internet Classics Archive, URL: http://classics.mit.edu/Plato/phaedo.html [accessed: 2020-01-12].
[10] C.-P. Ruckemann, “Methodology of Knowledge Mapping for ArbitraryObjects and Entities: Knowledge Mining and Spatial Representations– Objects in Multi-dimensional Context,” in Proceedings of TheTenth International Conference on Advanced Geographic InformationSystems, Applications, and Services (GEOProcessing 2018), March25–29, 2018, Rome, Italy. XPS Press, Wilmington, Delaware,USA, 2018, pp. 40–45, ISSN: 2308-393X, ISBN: 978-1-61208-617-0, URL: http://www.thinkmind.org/index.php?view=article&articleid=geoprocessing 2018 3 20 30078 [accessed: 2020-01-12].
[11] C.-P. Ruckemann, “Superordinate Knowledge Based Comprehen-sive Subset of Conceptual Knowledge for Practical Mathematical-Computational Scenarios,” in The Ninth Symposium on AdvancedComputation and Information in Natural and Applied Sciences (SACI-NAS), Proceedings of The 17th International Conference of NumericalAnalysis and Applied Mathematics (ICNAAM), September 23–28,2019, Rhodes, Greece, Proceedings of the American Institute of Physics(AIP), AIP Conference Proceedings. AIP Press, Melville, New York,USA, 2020, ISSN: 0094-243X, (to appear).
[12] C.-P. Ruckemann, Sustainable Knowledge and Resources Managementfor Environmental Information and Computation. Business ExpertPress, Manhattan, New York, USA, Mar. 2018, Ch. 3, pp. 45–88, in:Huong Ha (ed.), Climate Change Management: Special Topics in theContext of Asia, ISBN: 978-1-94784-327-1, in: Robert Sroufe (ed.),Business Expert Press Environmental and Social Sustainability forBusiness Advantage Collection, ISSN: 2327-333X (collection, print).
[13] “Multilingual Universal Decimal Classification Summary,” 2012, UDCConsortium, 2012, Web resource, v. 1.1. The Hague: UDC Consortium(UDCC Publication No. 088), URL: http://www.udcc.org/udcsummary/php/index.php [accessed: 2020-01-12].
[14] “Universal Decimal Classification Consortium (UDCC),” 2020, URL:http://www.udcc.org [accessed: 2020-07-05].
[15] “Creative Commons Attribution Share Alike 3.0 license,” 2012, URL:http://creativecommons.org/licenses/by-sa/3.0/ [accessed: 2020-01-12],(first release 2009, subsequent update 2012).
[16] “Perl Compatible Regular Expressions (PCRE),” 2020, URL: https://www.pcre.org/ [accessed: 2020-08-09].
[17] “The Perl Programming Language,” 2020, URL: https://www.perl.org/[accessed: 2020-08-09].
[18] “UDC Summary Linked Data, Main Tables,” 2018, URL: https://udcdata.info/078887 [accessed: 2020-01-12].
[19] “UDC, Common Auxiliary Signs,” 2019, URL: https://udcdata.info/078885 [accessed: 2020-01-12].

250
International Journal on Advances in Software, vol 13 no 3 & 4, year 2020, http://www.iariajournals.org/software/
2020, © Copyright by authors, Published under agreement with IARIA - www.iaria.org
[20] “UDC 9: Geography. Biography. History,” 2019, URL: http://udcdata.info/068076 [accessed: 2020-01-12].
[21] “UDC 5: Mathematics. Natural sciences,” 2019, URL: http://udcdata.info/025403 [accessed: 2020-01-12].
[22] “UDC “. . .”: Common auxiliaries of time,” 2019, URL: http://udcdata.info/011472 [accessed: 2020-01-12].
[23] “UDC (1/9): Common auxiliaries of place,” 2019, URL: http://udcdata.info/001951 [accessed: 2020-01-12].
[24] C.-P. Ruckemann, R. Pavani, B. Gersbeck-Schierholz, A. Tsitsipas,L. Schubert, F. Hulsmann, O. Lau, and M. Hofmeister, Best Practiceand Definitions of Formalisation and Formalism. Post-Summit Results,Delegates’ Summit: The Ninth Symposium on Advanced Computationand Information in Natural and Applied Sciences (SACINAS), The17th International Conference of Numerical Analysis and AppliedMathematics (ICNAAM), September 23–28, 2019, Rhodes, Greece,2019, DOI: 10.15488/5241.
[25] A. Back, Aristotle’s Theory of Abstraction. Springer: Cham, Heidel-berg, New York, Dordrecht, London, 2014, ISBN: 978-3-319-04758-4,ISSN: 1879-8578, The New Synthese Historical Library, (Book Series),Texts and Studies in the History of Philosophy, Volume 73.
[26] L. Ucnık, I. Chvatık, and A. Williams, The Phenomenological Critiqueof Mathematisation and the Question of Responsibility: Formalisationand the Life-World. Springer, 2015, ISBN: 978-3-319-09827-2,(Collection), Contributions to Phenomenology, Volume 76.
[27] W. H. S. Jones, Pausanias Description of Greece. London: WilliamHeinemann, New York: G. P. Putnam’s Sons, MCMXVIII, 1918, vol. Iand II.
[28] A. Michaelis, Der Parthenon. Leipzig, Druck und Verlag von Breitkopfund Hartel, 1871, (title in English: The Parthenon).
[29] M. A. Tiverios, “Observations on the East Metopes of the Parthenon,”American Journal of Archaeology, vol. 86, no. 2, 1982, pp. 227–229.
[30] K. A. Schwab, Celebrations of Victory: The Metopes of the Parthenon.Cambridge, Cambridge University Press, 2005, pp. 159–198, in: JeniferNeils (ed.), The Parthenon: From Antiquity to the Present.
[31] C.-P. Ruckemann, “Archaeological and Geoscientific Objects usedwith Integrated Systems and Scientific Supercomputing Resources,”International Journal on Advances in Systems and Measurements,vol. 6, no. 1&2, 2013, pp. 200–213, ISSN: 1942-261x, URL: http://www.thinkmind.org/download.php?articleid=sysmea v6 n12 2013 15[accessed: 2020-08-09].
[32] R. C. Russel and M. K. Odell, “U.S. patent 1261167,” 1918, (Soundexalgorithm), patent issued 1918-04-02.
[33] D. E. Knuth, The Art of Computer Programming: Sorting and Search-ing. Addison-Wesley, 1973, vol. 3, ISBN: 978-0-201-03803-3, OCLC:39472999.
[34] National Archives and Records Administration, “The Soundex IndexingSystem,” 2007, 2007-05-30, URL: http://www.archives.gov/research/census/soundex.html [accessed: 2013-05-26].
[35] M. Stok, “Perl, Soundex.pm, Soundex Perl Port,” 1994, (code afterDonald E. Knuth).
[36] “LX SNDX, a Soundex Module Concept for Knowledge Resources,”LX-Project Consortium Technical Report, 2013, URL: http://www.user.uni-hannover.de/cpr/x/rprojs/en/#LX [accessed: 2020-07-12].
[37] E. Rempel, “tcllib, soundex.tcl, Soundex Tcl Port,” 1998, (code afterDonald E. Knuth).
[38] A. Kupries, “tcllib, soundex.tcl, Soundex Tcl Port Documentation,”2003, (code after Donald E. Knuth).
[39] “Global Land One-kilometer Base Elevation Project (GLOBE),” Na-tional Geophysical Data Center (NGDC), National Centers for En-vironmental Information (NCEI), National Oceanic and AtmosphericAdministration (NOAA), NOAA Satellite and Information Service(NESDIS), U.S. Department of Commerce (DOC), URL: http://www.ngdc.noaa.gov/mgg/topo/globe.html [accessed: 2020-07-12].
[40] “2-Minute Gridded Global Relief Data (ETOPO2v2),” 2006, June,2006, World Data Service for Geophysics, Boulder, USA, NationalGeophysical Data Center, National Centers for Environmental In-formation (NCEI), National Oceanic and Atmospheric Administra-tion (NOAA), URL: http://www.ngdc.noaa.gov/mgg/fliers/06mgg01.html [accessed: 2020-07-12].
[41] C. Amante and B. W. Eakins, “ETOPO1 1 Arc-Minute Global ReliefModel: Procedures, Data Sources and Analysis,” 2009, NOAA Tech-nical Memorandum NESDIS NGDC-24. National Geophysical DataCenter, NOAA. DOI: 10.7289/V5C8276M.
[42] “CGIAR Consortium for Spatial Information (CGIAR-CSI),” 2020,URL: http://www.cgiar-csi.org [accessed: 2020-07-12].
[43] “Consultative Group on International Agricultural Research (CGIAR),”2020, URL: http://www.cgiar.org [accessed: 2020-07-12].
[44] “World Geodetic System (WGS),” 2012, National Geospatial-Intelligence Agency (NGA), URL: http://earth-info.nga.mil/GandG/wgs84/index.html [accessed: 2020-07-12].
[45] “Spatial reference for EPSG:4326,” European Petroleum Survey GroupGeodesy (EPSG), URL: https://epsg.io/4326 [accessed: 2020-07-12].
[46] “GMT - Generic Mapping Tools,” 2020, URL: http://gmt.soest.hawaii.edu/ [accessed: 2020-07-12].
[47] R. Gleser, “Beitrag zur Klassifikation und Datierung der palmet-tenformigen Gurtelschließen der spaten Latenezeit,” ArchaeologicalCorrespondence (in German: Archaologisches Korrespondenzblatt), Bd.34, vol. 34, 2004, pp. 229–242, (title in English: Contribution forClassification and Dating of Palmette-shaped Belt Buckles in the LateLatene).
[48] R. Gleser, O. Al-Saadi, V. Schmidt, and T. Fritsch, “GeophysicalProspection and Archaeological Excavation at a Celtic Burial Site nearNonnweiler, Saarland,” 2015, Poster presentation in the session ‘Archeo-geophysics’ (in German: ‘Archaogeophysik’) (AR) at the 75th annualmeeting of the German Geophysical Society (in German: Jahrestagungder Deutschen Geophysikalischen Gesellschaft) (DGG) in Hannover,2015.
[49] R. Gleser, “Ein Technologiesprung - Fruhes Metall. Wissen, Funktionund Symbol,” in: T. Otten, J. Kunow, M. M. Rind, and M. Trier(Eds.), Revolution jungSteinzeit. Katalog zur Archaologischen Lan-desausstellung Nordrhein-Westfalen. Schriften zur Bodendenkmalpflegein Nordrhein-Westfalen, Bd. 11,1 (Darmstadt 2015), vol. 11,1, 2015,pp. 251–259, (title in English: A Technological Leap – Early Metal.Knowledge, Function, and Symbol).
[50] R. Gleser, “Neue Uberlegungen zur Chronologie der postbandkeramis-chen Kulturphanomene in Mitteleuropa,” in: Centenary of JaroslavPalliardi’s Neolithic and Aeneolithic Relative Chronology, InternationalConference Moravske Budejovice 2014, 2016, pp. 107–116, MoravskeBudejovice 2016, (title in English: New Considerations on the Chronol-ogy of Post Band Ceramics Cultural Phenomena in Central Europe).
[51] R. Gleser, Zu den erkenntnistheoretischen Grundlagen der Prahis-torischen Archaologie. Leiden, 2020, 2020, (title in English: Onthe Epistemological Fundaments of Prehistorical Archaeology), in: M.Renger, S.-M. Rothermund, S. Schreiber, and A. Veling (Eds.), Theorie,Archaologie, Reflexion. Kontroversen und Ansatze im deutschsprachi-gen Diskurs, (in print).
[52] R. Gleser, Rekonstruktion der Vergangenheit: Zur methodischen Eige-nart prahistorischen Erkennens. Paderborn, 2018, pp. 199–237, (titlein English: Reconstruction of the Past: On the Methodical Peculiarityof Prehistorical Cognition), in: A.-S. Naujoks, J. Stelling, and O. R.Scholz (eds.), Von der Quelle zur Theorie. Vom Verhaltnis zwischen Ob-jektivitat und Subjektivitat in den historischen Wissenschaften, ISBN:978-3-95743-136-3.
[53] R. Filloramo, V. Becker, and A. Curci, “Apulian prehistoric communityconnections: Preliminary results of GIS analysis and field activity,”Journal of Archaeological Science: Reports, vol. 32, 2020, pp. 1–11,102380, URL: https://doi.org/10.1016/j.jasrep.2020.102380 [accessed:2020-11-08].
[54] V. Becker, Gemeinsamkeiten und Unterschiede bildlicher Darstel-lungen zwischen Jungpalaolithikum und Neolithikum. Munster,2018, 2018, pp. 3–13, (title in English: Commonalities and Dif-ferences of Figurative Depictions Among Late Palaeolithic andNeolithic), in: T. Schreiber (Ed.), Zugange zur Kontextualisierungbildlicher Darstellungen in den Altertumswissenschaften. Workshopdes Netzwerks Archaologie Diagonal. 28.–29. Juni 2013 an derWWU Munster, URL: https://repositorium.uni-muenster.de/transfer/miami/2cbdabb9-e908-4b8f-9f4f-1745ea06e8cd [accessed: 2020-11-08].
[55] V. Becker, “Keramik der Lausitzer Kultur aus der Lehrsammlung derAbteilung fur Ur- und Fruhgeschichtliche Archaologie der Universitat

251
International Journal on Advances in Software, vol 13 no 3 & 4, year 2020, http://www.iariajournals.org/software/
2020, © Copyright by authors, Published under agreement with IARIA - www.iaria.org
Munster,” 2012, (title in English: Ceramics of the Lausitz Culture fromthe Collection of the Division of Prehistoric Archaeology, Universityof Munster), URL: https://www.uni-muenster.de/imperia/md/content/geschichte/ufg/pdf/lausitzer kultur.pdf [accessed: 2020-11-08].
[56] “The Digital Archaeological Record (tDAR),” 2020, URL: http://www.tdar.org [accessed: 2020-08-05].
[57] “Center for Digital Antiquity,” 2020, Arizona State Univ., URL: http://www.digitalantiquity.org/ [accessed: 2020-08-05].

252
International Journal on Advances in Software, vol 13 no 3 & 4, year 2020, http://www.iariajournals.org/software/
2020, © Copyright by authors, Published under agreement with IARIA - www.iaria.org
Managing Patient Records in Complex Systems in Time of Epidemics The Predominence of Human Aspects for Quality of Processes
Eloria Vigouroux-Zugasti, Christian Bourret Laboratory of DICEN IDF
University of East-Paris Marne-la-Vallée Val d’Europe / Serris, France
Email: [email protected], [email protected]
Sylvie Parrini-Alemanno CNAM
Paris, France Email: [email protected]
Abstract — With the recent promulgation of the General Data Protection Regulations, data management is becoming a crucial strategic issue in organizations. The quality of data dissemination is of utmost importance in the healthcare environment. Indeed, medical confidentiality is closely linked to the dissemination of personal information inherent in the patient's record. Yet, how can a complex system, composed of multiple multidisciplinary actors (medical, paramedical, administrative, etc.), deal with the potential disclosure of personal data? What steps can be taken to manage this risk? With the current health crisis of the COVID-19, those questions become essential. Medical confidentiality and crisis management has to deal with massive ethical issues related to the use of personal data. The interoperability of professionals and the quality of care are more crucial than ever, considering the need to limit the spread of the virus. To answer these questions, a case study was conducted in the Multidisciplinary Care House of Mimizan (France, Landes, New Aquitaine Region). The goal was to investigate the importance of human and data management for traceability of care and for crisis management. This medical organization is composed of medical and paramedical professionals, but also a relatively large administrative team for such an institution. The results highlight that this organization manages to set up, at the initiative of the professionals, both flexible and structured processes, allowing optimal follow-up of patients, while guaranteeing respect for their personal information.
Keywords — Health; Data; Patient Records; Quality; Crisis; Human Relationship; COVID-19; Territory; Organization.
I. INTRODUCTION The management of personal data, with the recent
promulgation of the General Data Protection Regulations (GDPR - May 2018), becomes a crucial and strategic issue for organizations. In the healthcare sector, respect for medical confidentiality is closely linked to the dissemination of patients' personal records. Data has to be managed with great care in order to limit the risk of unfortunate disclosure or data loss. Data management in health organizations depends on both technical and human factors, which are closely related to each other. Technical aspects (storage, access, sorting, etc.) would only be efficient if they are linked to a human data management policy (uses guidelines, access ethics, conditions of diffusion inside and outside the organization, etc.).
However, the current French healthcare organization tends to evolve to a collaborative working method, as some researchers have been able to show in their studies [1]. For the past ten years, French health authorities have been witnessing the emergence of some new organizations of health professionals and the exponential growth of groups of (para)medical professionals, attesting the growing complexity of health organizations [2]. This is particularly the case for Multidisciplinary/Multiprofessional Health Houses (MCHs), with 910 establishments active in France in March 2017, compared to only 240 in 2013 [3]. These establishments are complex because of the number of interacting actors they involve. They also tend to rely on the notion of sharing and circulating data, especially health information about patients. In doing so, they tend to improve patients’ health care and health monitoring.
The current health context tends to intensify the difficulties in the management of health in France - and a priori in the whole world also. This is why reflections and practices related to the management of personal records, especially from a human point of view, must be intensified. Indeed, health professionals are under intense pressure. Lack of trust in the organization, organizational misfunction, team tensions, exhaustion, stress and fear of being contaminated represent high risk factors that could lead to (un)voluntary misuse of personal records. For health organizations, it is critical to find solutions to preserve their quality. It is also critical to remain scrupulous with the protection of data crisis in order to guarantee the quality of care, while protecting patients' records and especially those who are contaminated.
How could both technical and human processes guarantee medical confidentiality and manage the inherent risks linked to data disclosure, while ensuring the interoperability of professionals and the quality of care, in time of crisis? It seems that the challenge is mainly about the ability of the French health system to increase its level of performance [4]. The challenge also rests on the ability of collaborative organizations to hold their staff together, despite the pressure they have to work with.
To answer this question, a first case study was conducted in the Multidisciplinary Care House of Mimizan (MCHM). To do so, an exploratory qualitative approach was conducted via focus groups with the whole team of the institution and

253
International Journal on Advances in Software, vol 13 no 3 & 4, year 2020, http://www.iariajournals.org/software/
2020, © Copyright by authors, Published under agreement with IARIA - www.iaria.org
via an interview with its two managers. The goal is to establish an inventory of practices, particularly in terms of data quality management in complex health institutions. The analytical approach presented here is based on the structural level of MCH actions, in which resources (human and material) are mobilized to ensure a good coordination for patients’ care and confidential data policy [5]. MCHs are a recent and emergent phenomenon, with heterogeneous ways of working. The goal of this article is to explore one of the biggest and formalized MCH, from an exploratory point of view, in order to understand its organization and its capacity to be considered as a model for other MCH. A second phase of the survey was conducted following the same methodology, when the French government declared the state of emergency to protect the population from the COVID-19 epidemic, on March 12, 2020. The goal is to compare the ordinary processes to the crisis ones and to deepen the human aspects of data management.
Section II is dedicated to the overall contextualization of the study. Section III presents the institution selected for the study, the MCHM to show how it is representative of the new healthcare institutions needed in fragile territory. In Section IV, the article analyzes the quality processes inherent in the management of this institution’s data. The Section V presents the specifications of the MCHM. Section VI provides details on the general lack of use of the national digital health record. Sections VII to IX are dedicated to the second phase of the survey, related to the adaptation of the MCHM to the COVID-19 health crisis. Section VII concerns the hypertelic aspects [6] of organizational processes in the field of public health – that is, organizational processes hyper-adaptive to their context but wich may become impossible to adapt if the context changes. In Section VIII, the evolution of organizational management is developed. Section IX presents the model of collaboration and interdisciplinary cooperation as a necessary step to succeed in time of crisis. We bring a conclusion of our analysis in Section X.
II. STUDY BACKGROUND In this section, the study background is explained. The
specific context of the current French public healthcare context and policy are also detailed for a better understanding of the study.
A. Challenging health context In 2014, the population density of Landes department
fluctuated between 2 and 45 inhabitants/km², with an aging index among the highest in the region [7]. In 2015, 31.5% of Landes’ population was over 60 years of age, a great increase compared to 2011 [8]. According to the Regional Health Authority – RHA (in French, Agence Régionale de Santé), in 2016, the rural population represented more than 50% of the whole Landes population. In addition, this region also has a medical demography and a density of specialists lower than regional and national averages, as well as a small number of healthcare establishments. It also has few alternatives to the nursing homes for old people [7]. Therefore, old people’s loss of autonomy is more difficult to manage. According to RHA, 1/3 of liberal general
practitioners were over 60 years old in 2017 [9]. This is a very problematic issue: combined with the difficulties of attractiveness of the territory, it becomes more and more difficult to maintain the number of practitioners in this area. The RHA demographic patterns of Landes health care show a highly unfavorable public health context:
• White areas (towns located more than fifty kilometers away from a hospital emergency department), combined with an insufficient number of expert services (radiology, rheumatology, gynecology, allergology, pneumology, dermatology, etc.)
• Medical desertification: unattractive territory for young (para)medical professionals (region’s remoteness from large cities, low internet coverage, few cultural offers, etc.). Doctors are struggling to find successors, despite administrative provisions and facilitations offered by health authorities.
• Fragile areas: unequal distribution of health professionals in areas with an imbalance between the number of potential patients and the number of doctors, as well as areas where the advanced age of patients (or the doctor) would require urgent decisions.
Facing these difficulties, some political representatives try to shed some light on the issue of medical deserts: in October 2018, the mayor of a small town called Ychoux proposed to prohibit, by municipal decree, his fellow citizens from falling ill, due to the lack of medical care in its surroundings. The study was conducted in this area for its relevance concerning the challenges France will have to face in the coming years. The main problem in France is getting young medical staff to settle in countryside areas, where living standards are less attractive than urban contexts.
B. Management of de-materialized health data in a complex system Personal records, such as medical data, defined by the
French Data Protection Act, called Loi informatique et liberté, (cf. paragraph 2, article 2 of the Act) as an information relating to a person who is physically identified or who can be identified, directly or indirectly, by reference to an identification number or to one or more elements specific to him/her [10]. In addition, this data must be processed in order to make sense. This process is defined by the same law (cf. paragraph 3, article 2 of the Act) as a transaction or set of transactions, whatever the process used [10]: collection, recording, organization, storage, modification, consultation, communication by transmission, etc. Data are also part of an exchange, characterized by the provision to several professionals, such as health staff, who are entitled to know everything about these data. Their goals are to insure the coordination and continuity of patients’ medical care [11].
However, the exploitation of personal records remains a sensitive subject. It directly affects the privacy of each individual [12], especially when it comes to medical data. In complex systems, such as MCH, there are several issues related to the management and to the protection of health

254
International Journal on Advances in Software, vol 13 no 3 & 4, year 2020, http://www.iariajournals.org/software/
2020, © Copyright by authors, Published under agreement with IARIA - www.iaria.org
data. From an organizational point of view, it is essential to set up procedures to secure access to data. Those procedures tend to limit the structural disorders that can affect the confidential standards of data, by establishing, for example, quality indicators. Measurement and management tools in health establishments are essential [4]. In addition, complex systems have a large number of stakeholders, but they do not have the same level of data access authorization. It increases the risks of fraudulent or accidental access to information.
With the multiplication of MCHs, the French health sector must now face a multitude of risks related to data, which require close scrutiny of each elementary activity [2]. These establishments are the result of a clustering of health professionals who, until now, had been working alone. However, using common resources and administrative staff lead professionals to rethink their working methods, while insisting on control and rigour. The various stakeholders in the project have to develop fundamental procedures for collaborative work. This aims at reducing and optimizing work processes [2], while considering the topics of control and quality as the heart of these processes. Professionals, in this new context, must demonstrate that their services are delivered in a secure environment. This environment helps controlling the risks and meet the expectations/requirements of patients [4].
C. Multidisciplinary health centre: although need for a restructured health policy – from a political point of view MCHs are a model that catalyzes needs, from health
professional, public decision makers and patient care points of view [5]. The creation of this type of institution represents the convergence of three complementary processes, identified by Autès and Dufay [13]:
• Movement initiated by healthcare professionals to gather their activities within MCHs and health centers.
• Reflection of local officials, concerned by the management of health in their districts, involved in logics of prevention, of permanence of care, of first aid and the continuum between outpatient services and hospitals. They also care about offering external and specialized consultations to the people living in areas where there is a shortage of health practitioners;
• Necessary reorganization of the supply of care due, first, to the constraints of modern medicine and pathologies and, second, to the effects induced by the anticipated decline in medical demography.
From a territorial point of view, the MCHM aims at meeting the four standards of public health action: 1) maintaining a local offer, 2) guaranteeing equal access to health for all, 3) ensuring continuity of care between the primary care offer and graduated hospital care 4) and, finally, strengthening health prevention policies. For local officials, the issue is to strengthen weakened health districts and care offer [13], by proposing long-term ways-out to solve the current problems. In addition, since MCHs are subjected to accreditation rules, by responding to quality
indicators established by public health authorities [13], they contribute to an increased performance of districts’ medical management.
III. METHODOLOGICAL APPROACH In this section, the sampling and methodological
procedures are presented.
A. Why Study the MCHM? By definition, MCHs depend on specific contexts. It is
important to identify the territory’s needs, to take into account the needs of its population and its state of supply. MCHM is considered as representative of this movement of territorial restructuring in the field of healthcare both in its conditions of implementation and in its daily functioning, structured around the interrelationships between territorial stakeholders [5]. Indeed, despite its recent implementation, it manages to meet the whole public health objectives, both mandatory and optional, imposed by the “RHA Inter-professional Agreement” contract, particularly in terms of shared information systems, which are at the heart of the challenges related to data quality. The dynamic of the creation of the MCHM was, in the first place, launched by healthcare practitioners themselves, in reaction to the progressive desertification of their territory and the challenges it involves [13]. The project of creating the MCHM began in 2004. The district’s doctors wanted to cluster their activities in a single establishment, to pool their administrative tasks and to offer a better access to care for their patients. This approach is in line with the observations of some researchers, who state that medical desertification in rural areas has been the main motivation for the mobilization of health professionals [13]. One of the main problems lays in Landes’ unattractiveness for doctors. The mere proximity of the beach and the “sweetness of life” are not enough to attract young professionals willing to settle down. It is necessary to provide health professionals with some attractive and secure professional conditions of practice.
However, the notion of attractiveness of the project is very important here [5]. Offering a young professional an isolated practice in a small town does not have the same appeal as a long-term position in a MCH, in which he or she could be supervised, advised and supported by administrative services, surrounded by colleagues and supported by financial and material resources. Collegiality and plurality of perspectives make the medical practice both more reassuring and richer [13], especially at the beginning of a career. This is the appeal proposed, in general, by MCHs and, in particular, by the case studied in this article, which is one of the biggest and dynamic MCHs in France. Its professionals have been recently asked to present their institution in the next National French Congress of MCH. This type of organizational dynamism is a movement widely desired and claimed by the younger generations of medical and paramedical professionals [14].
Moreover, Landes is the largest region of France, with a mainly rural territory and offers most of the current and forthcoming public health services presented in the contextualization part of this article. Having such an

255
International Journal on Advances in Software, vol 13 no 3 & 4, year 2020, http://www.iariajournals.org/software/
2020, © Copyright by authors, Published under agreement with IARIA - www.iaria.org
innovative MCH in this kind of area is an example of how to deal with public health issues in other regions in France, especially concerning the rural ones.
B. Methodological Approach and Sampling The survey was conducted from the 8th of December
2018 to the 10th of March 2019. This period provides two main contexts: seasonal epidemics (the flue in January and spring allergies in March) and quiet period in December and February. It seemed relevant to investigate the MCHM in both these contexts in order to deepen all the aspects of its organizational data management. At the beginning of the survey, the goal was to identify the organizational model and rules implemented by the MCHM’s team, specially concerning working processes and data management. To do so, a qualitative approach has been chosen This method has been selected for its ability to investigate the practices and interpret the results. It considers that the “confrontation with the corpus is a necessary condition for the perception of social practices” [14]. The goal was also to confront the different points of view concerning the organizational processes. The potential divergences and discordances regarding the positions can be highlighted. Does a secretary think the same thing of the establishment than a doctor or paramedical worker? Concerning data privacy management, the heads of the MCHM in charge have been interviewed. They had to explain their choices in terms of data management policy, of coordination put in place and of emergency plans in case of unfortunate disclosure.
Regarding the questions, all the members of the MHCM staff we asked about two common topics. The first was about the daily-work and its organization, both concerning the inner-group and the relationships with the other members of the MCHM (for example: secretary-secretary, secretary-medical, etc.). The goal was to highlight relational and organizational dysfunctions. Secondly, all the staff members were asked about their own professional uses of patients’ health records, in terms of access of use and of transmission. The purpose was to identify good and problematic uses.
The second questions asked for some more specific topics. The goal was to have a better understanding of each specific staff members (medical doctor, paramedical, administrative, etc.), to point out the benefits and the limits of their new work, management and organizational processes since they entered the MCHM. Four focus groups took place in December 2018 and February 2019, with the four specific staff members. Then, interviews were conducted in January 2018 and March 2019, with the head of the administrative staff and the heads of the MCHM. They all were realized in the MCHM, in the meeting room. The goal was to make the people feel comfortable and to prevent conversations from being heard by the patients or the other staffs’ members. This approach seemed relevant, as it helped people to speak freely.
A second phase of the survey was conducted during the COVID-19 crisis, from the 12th of March 2020 to the 11th of May 2020, in the same organization. This period corresponds to the riskiest period of the pandemic, from a public health point of view, when France reached its highest rates of virus spread. It also corresponds to the most difficult time for
public health organizations, which have had to adapt urgently their processes to face this situation they never knew before. For the sake of homogeneity, it was decided to use the criteria and distribution initially used for the first phase of the survey in order to compare the results. It was also decided to conduct the interviews by teleconference. The goal was to limit the risk of exposure to the virus and to make the survey as smooth as possible for the MCHM staff.
C. Health Records Management in the MCHM
TABLE I. DISTRIBUTION OF THE INTERVIEWED SAMPLE
Criteria Distribution Number %
Gender Male 14 51.9
Female 13 48.1
Age
25-35 6 22.2
35-45 7 25.9
45-55 8 29.7
55-65 6 22.2
Professional activity
Medical doctors 11 40.7
Paramedical staff 8 29.7
Administrative staff 5 18.5
Executive of administrative staff 1 3.7
Executive of the MCHM
(also doctors) 2 7.4
As Table I shows, the MCHM brings together three main
crews: doctors (8 + 2 regular substitutes + 1 trainee), paramedics (3 nurses and their collaborators, 2 physiotherapists, 2 podiatrists, 1 psycho-motor therapists, 1 dietician) and administrative staff (5 secretaries, only working for doctors, managed by an executive). Including trainee doctors and nursing staff, the sample is composed of thirty individuals involved in the daily operations of the MCHM. They are all subjected to the institution's collective agreement, in which respect for medical confidentiality is clearly enshrined. Data is managed and stored on a specific medical database software, Weda [15], which is also used by the surrounding external collaborators (pharmacies, specialists, hospitals, etc.). The choice to use the same software aims at facilitating the medical and administrative aspects concerning the caring continuum. Each member of the MCHM has secure access provided by the software. These codes are not stored on the institution's digital devices in order to limit the risk in case of theft or hacking.
However, not all MCHM members have the same level of access to patients’ records. Doctors, as well as their secretaries, have full access to all the information concerning: files, auxiliary session schedules, secure messaging, etc. This is justified by the need for doctor/doctor

256
International Journal on Advances in Software, vol 13 no 3 & 4, year 2020, http://www.iariajournals.org/software/
2020, © Copyright by authors, Published under agreement with IARIA - www.iaria.org
and doctor/secretary interoperability, for the smooth functioning of the MCHM and good patient care. At the request of a patient or a staff member, restrictions may be applied to limit secretaries' or doctors' access to some records. All patients were asked about this sharing consent.
Then come the paramedics, with a diffusion specific to each specialty. Their access is conditioned by the needs of their activity. A physiotherapist, for example, will have access to the patient's x-rays and related prescriptions; a nurse will have access to history, specialist contacts, blood test results or vaccines, depending on needs. These professionals do not have access to the content of visits, letters, prescriptions, unless some specific case discussed with the doctor. The accreditation of external professionals is aligned with the system applied within the institution, according to the needs of the patient, the activity or the specialty. Collaborative patient follow-up is governed by Multi-Professional Consultation Meetings (MPCMs), planned or impromptu, attended by all the professionals involved in the presented case. Each meeting is documented, stored via Weda and only accessible to the concerned professionals. Doctors and secretaries meet weekly to monitor performance and improve organizational quality processes. The doctors interviewed also associate these meetings with team management (trust, accountability, etc.), to ensure cohesion among all workers and to involve them in the administration of the MCHM.
This institution is a motivated and voluntary grouping of health professionals, in a singular and innovative organizational form. As a result, this configuration will have to be closely observed in the years to come in order to evaluate its lean management in data management and its mode of transactional relations, perceived as co-constructive interactions.
IV. ANALYSIS OF DATA MANAGEMENT PROCESSES This section is dedicated to the analysis of MCHM data
management concerning patients’ records. Thanks to the study, the main protagonists of this type of management tasks have been identified, such as the governance of the establishment, from a managerial point of view.
A. Data Ethics and Dissemination Quality An organization can be defined as a set of recurring
transactional programs that constitute transactional flows. They are driven by a set of conventions and rules in a given context [16]. For its proper functioning, given the complexity of its transactions, it is essential to give access to the right information, at the right people, at the right time, to make a selective transmission of users, in order to fight against misinformation, over-abundance and deviant uses [12]. The principle of data management is based on the ability of actors to select information and analyze it, in such a way that it is only disseminated to its legitimate recipients. The interest of this approach is twofold. On the one hand, it allows a smooth organization of sharing actions, making the institutional processes efficient. On the other hand, it makes it possible to limit the risks linked to the poor dissemination of data, thus guaranteeing respect for confidential medical records.
The ethical processing of information seems to be the starting point of the MCHM's data management strategy. Béranger defines it as a mechanism for the interpretation of data, by a person or an organization, that will lead to give a specific meaning to data [12]. By giving attention to information, by analyzing it, the heads of MCHM tend to give meaning and value to data, as well as to determine the logistics of action to be applied: censorship, global dissemination, limited dissemination, etc. In the medical sector, it is fundamental to establish a reflection on personal health data through an ethical prism “in order to [remove] doubt and control uncertainties” [12] and to manage the risks inherent in the nature of patients’ records. It leads to speak of the non-maleficence nature of the MCHM's information strategy: access to data is examined according to the profile and nature of the user [12]. Data sharing is conditioned by the profile of the information receiver, ranging from full sharing to very limited access, depending on activity and needs. This improves the security, confidentiality and protection of such data [12], as well as the performance of the information management system. By analyzing the data, determining the conditions for sharing and clearly identifying the receivers, the quality of access to patients' personal records is guaranteed.
B. Informational Lean Management: no Unnecessary Information The data processing method leads us to analyze the
notion of lean in quality management. Lean School is defined as “the search for process optimization by chasing down everything that is inappropriate or superfluous” guaranteeing “performance by eliminating waste” [2]. This method is usually applied to inventory management (0 stock), document management (0 paper), or logistics (0 unnecessary transport, 0 waiting, etc.). This can be relied to information management, in order to analyze the transaction rationalization activities [17].
Indeed, the info-ethical treatment as previously mentioned tends towards a very low entropy, i.e., a degree of almost nil disorder [12]. A system in which information is transmitted without analysis increases the level of confusion, as well as the slowness of decision-making and the risks of accidental dissemination of personal records. On the contrary, in a complex system such as the MCHM, the implementation of a hierarchy in information management (doctors analyze and choose the criteria before disseminating information) makes the actions of all team members easier and more fluid, by sending them only the data that will be useful to them in the exercise of their activity. This is a kind of lean management, applied to information management. This data dissemination method tends towards the goal of “0 useless information", in order to guarantee both respect for medical confidentiality (0 information poorly disseminated), the quality of patient care (0 information missing) and the fluidity of actions (0 dysfunction linked to poor information dissemination). This information management method seems to be perfectly adapted to the performance requirements of MCHM's missions, while benefiting the daily tasks (administrative and patient care).

257
International Journal on Advances in Software, vol 13 no 3 & 4, year 2020, http://www.iariajournals.org/software/
2020, © Copyright by authors, Published under agreement with IARIA - www.iaria.org
V. ORGANIZATIONAL PROCESSES: GUARANTEEING THE QUALITY OF DATA MANAGEMENT
In this section, the organizational processes observed during the survey will be discussed, which refers to data and patients’ records management.
A. The Human Relations Theory as a Leading Light In the MCHM, the mobilization of the whole staff tends
to improve the processes’ efficiency [2]. The MCHM’s management method is based on the involvement of all teams in improving the life of the institution: meetings, taking into account opinions, professional development, empowerment, etc. This method seems to be similar to the collaborative processes set up within the MCHM, although the institution does not claim any particular managerial method: unexpected discussions, weekly team meetings, festive group cohesion events, etc. This team management aims at analyzing defects and dysfunctions, and then seeking solutions [2]. This tends to improve the overall functioning of the establishment, where, according to Zacklad, all persons involved in the transaction are in the position of (co-)director, (co-)beneficiary, (co-)recipient (principal) and (co-)recipient [16]. Emphasis is placed on freedom of speech, professional responsibilities, skills of each individual and, above all, the necessary trust between employees, which is considered essential by all MCHM staff.
As Doucet points out, it is essential for the direction of quality action to be collegial. This makes it possible [in particular] to respect responsibilities and involve departments: medical consultation, scheduling, data management, human resources, etc. [2]. As a large number of individuals have access to the institution's health data, the use of this collaborative and collegial approach is essential to the MCHM. The increase in performance can only be achieved through the collaboration with the departments involved in this approach. By soliciting and valuing all staff members, the MCHM ensures fine relationship management, but also encourages professionalism and accountability of each individual. They also do so by regularly reminding them of the need for secrecy and rigor (formally and informally), especially concerning the performance of their daily tasks relating to patient health records. Transactional relationships lead to overcome formal/informal oppositions by insisting on their complementarity [5].
B. Leadership: Team, Quality and Performance Management This managerial approach is in line with the objective of
promoting confidentiality and trust with producers and suppliers of information, thus contributing to the control of risks and deviations of data [12]. However, for MCHM staff management to be effective, it must also deal with some leadership issues. Leadership and management of the institution must be provided by a person of influence who, thanks to his or her managerial skills is able to guarantee, effective cooperation and coordination, based on mutual trust [5]. The notions of cooperation and trust seem to be interdependent key resources for the management of complex systems. Cooperation relies on a clear commitment
of each member of the group and is strengthened by trust and by the working contract [17]. In a complex system, each member of the team contributes to the success of the institution goals, so it is important for all team members to be aware of the values their work involves, such as secrecy, efficiency, empathy, etc. [18] It is up to the leader to make the team understand these fundamental values defended by the institution, from which ethics rules of behavior flow. To do so, in the MCHM, many meetings are held, with the whole staff or with some subgroups (doctors-doctors, doctors-secretaries, etc.). Managing does not mean dominating. It is rather knowing how to talk to teams and how to get them to work towards a common goal [19]. Even if some members sometimes complain about the high number of meetings, they seem essential for the good management of the institution. Those meetings allow the team to have some feedback on the work and outline all technical or relational issues. It helps the manager to resolve the disagreements before they worsen and help the team to work with fluency [19].
The operational management of the MCHM is based on the involvement of the two doctors, whom will here be called P. and T. Their influence is based on their legitimacy within the team, gained through their seniority, their involvement in the project and their ability to organize the run of the institution. The team trusts in them. Trust is built over time and in the relationships. It is a capital that the two doctors accumulated through years [18]. They are well known by all the team members, sometimes for more than twenty years. They are also known for their emotional competencies [19], that combines feeling with objective cooperation skills. The long-term trust of the team gives P. et T. the ability to engage and influence each member of the group, which helps the team to solve complex issues [20] and aim for an outstanding performance of their work. P. and T. are complementary, both in terms of relational aspects and in the conduct of data establishment and management. However, for a good cohabitation, the roles must be clear and non-antagonistic [2]. The risk associated is the disappearance of authority representatives. The smooth running of the institution is based on the clear identification of authority figures, to which the staff can refer. The figure of authority also allows to the control of practices, beyond the “self-control” by the operator himself, in which skills and responsibilities are assumed by himself/herself [2], but not objectified by an external point of view. Each member is a part of the system and they have to work toward the same goal for the institution to reach its goals and insure the quality of care [19].
However, this verification dimension, in order to ensure the quality of the tasks performed, is quite crucial when it comes to such sensitive data as those referred to in this article: respect for medical confidentiality, quality of transmission of information, management of the risks of records leakage, etc. Taking leadership within the MCHM then seems to represent an additional element in the performance of strategies to protect patient medical records. The leaders act here as an element of internal data protection control, which compliance must be assessed and objectified

258
International Journal on Advances in Software, vol 13 no 3 & 4, year 2020, http://www.iariajournals.org/software/
2020, © Copyright by authors, Published under agreement with IARIA - www.iaria.org
externally by a notational Data Protection Officer [2]. This perspective can also be considered by taking as a model the Zacklad cooperative transaction logic reading grid, framework for analyzing action and practice at the meso level [16].
VI. GENERAL LACK OF USE OF THE NATIONAL DIGITAL HEALTH RECORD
The MCHM tends to present organizational processes in accordance with public health requirements, while following effective procedures for the management of patients' personal records. It should, however, be noted that the national digital Electronic Health Record (in French, Dossier Medical Partagé - DMP) is not integrated into any of the care management approaches within this institution. The study case tends to reveal an attitude of rejection of this instrument by MCHM staff members. They themselves state that this folder “is not designed for medical practice”, although they admit the promising nature of such a tool.
“In case of emergency, the DMP becomes counterproductive. Of course, all the information about the patient is included, but it is not sorted or classified. It is up to us to find the right information and, in emergency situations, we have something more important to do than sorting information” says E., one of the MCHM doctors. They also confess that they are disturbed by the additional and time-consuming actions required to update the patients' DMP, since this platform does not provide any automatic downloading add-ons for the software they use. It seems that the DMP system is in contradiction with the practices of MCHM professionals, with regard to their quality management processes. This notion is closely linked to the need for procedural rationality of the care action, namely an “orientation of the activity”. In this orientation, the action is justified by taking into account the way in which the tools contribute to performance. It is partly defined by the quality of the realization process [17]. Doctors highlight a logic “inherent in our relationship with objects and our environment, which we judge according to their adaptation to our expectations and needs” [2]. Applying this to Doucet reasoning, it would seem that doctors judge the use of the DMP in terms of its field operability and its ability to meet the needs imposed by their profession.
However, according to their statements, data’s quality processing on the DMP is incompatible with their needs. Charlotte Maday, in her article [17], uses the image of deep-sea fishing: throwing a net on the ocean floor, collecting information indiscriminately and presenting it to users. This image seems to be applicable to doctors' feeling towards the DMP. By presenting the “raw” data, the system is not in line with their requirements for efficient data management. It does not fit their ethical approaches or the “informational lean”, the main data management strategies used within the MCHM. More broadly, DMP raises the need for co-production concerning innovation and the necessary collaboration between producers and users to guarantee the quality of a product or a service. Bringing together the documents and data, for process governance, requires mastering the notion of a system but, above all, acting in a
spirit of active collaboration [17]. The main issues related to the DMP concern its digital features, ethical uses of data and the ability of professionals from various trades to collaborate on the same project. It represents a question to investigate, specially concerning the conception and the interoperability of various medical software. The goal is to ensure the performance of software and improve the quality of care.
VII. MANAGING TEAMS AND DATA SECURITY IN TIMES OF CRISIS: AN HYPERTELIC CONTEXT
The MCHM was severely damaged by the COVID-19 crisis, placing its processes in a position that could be described as “hypertelic”. This concept, developed by Simondon, originally applied to technical objects, particularly industrial objects [6]. It develops the idea that a tool specifically developed for a technology or for a specific context becomes obsolete and inadequate if the technology or context evolves. The hyper-specialization of tools or, in other words, a marked hyper-adaptation between a context and an object, can therefore lead to the "de-adaptation" if the environment evolves.
In the pre-COVID-19 context, the public health situation was relatively stable, which served as benchmarks for the development of the organizational processes of the MCHM: identification of very specific problems, seasonal epidemics management, stabilized external collaborations, rigor in data processing (technical and human), etc. The pandemic shattered these established paradigms as quickly as it did drastically. It put the institution's organizational processes to the test, particularly with regard to the protection of patients and data. There was an increasing risk of stress-induced errors, unintentional disclosure or a danger of a breakdown in organizational trust, which is a fundamental pillar of the organization of the MCHM. The pandemic highlighted the need for the institution to adapt to changes in its usual health context. It also highlighted its difficulty to do so. This difficult context contributed to the loss of adequacy of the organizational and operational processes of the MCHM. It led the organization to readapt itself profoundly and urgently, in less than a week. The crisis led to the emergence of what could be described as an organizational hypertelia, a “mismatch” of organizational processes with the context in which they are inserted.
This context was completed by the lack of reference points that could help cope this unprecedented situation. The goal for the MCHM was twofold. The first was to maintain the level of quality of care and the second was to protect the identity of infected patients. In a climate of anxiety and marked suspicion, it was important for the organization to guarantee the safety of its patients and its staff. Tracking infected patients without disclosing confidential information does not only required organizational adjustments but also a significant amount of data management work. The bulk of the work was not so much based on the technical aspects of data storage as on the human and operational aspects. Human and operational issues were identified by the doctors as the two main objects mobilized to deal with the crisis.

259
International Journal on Advances in Software, vol 13 no 3 & 4, year 2020, http://www.iariajournals.org/software/
2020, © Copyright by authors, Published under agreement with IARIA - www.iaria.org
VIII. COVID-19: THE NECESSARY EVOLUTION OF ORGANIZATIONAL MANAGEMENT
Within the MCHM, the crisis situation would have led to a certain degree of organizational fragmentation, resulting in a lack of team cohesion, a loss of coherence in decision-making, and difficulties in establishing an action plan or prioritizing. There was also a high risk of a loss of organizational confidence and a backlash that could have put the organization in a position of failure. It seemed relevant, in this context, to appeal to the four organizational issues in times of crisis, defined by Le Cardinal [18]: risk, uncertainty, complexity and sense of values. The risks, especially before the peak of the epidemic, were multiple, whether individual, organizational or health-related. This leads to the notion of uncertainty. During the survey, MCHM practitioners said that none of them, including the most experienced, had ever, in their professional or personal life, faced such an emergency situation: “No matter how much I think about it, I can't find anything comparable to what is happening to us now. How should we deal with a pandemic whose magnitude and consequences stay unclear?”. The situation was particularly complex for the organization, as it required a hasty and profound redesign of its operations, while at the same time ensuring data and patient protection. From an operational point of view, while the substance of the work remained the same, the health necessity induced a change of working habits to which the staff had to adapt quickly. From a procedural point of view, the disinfection measures proved difficult to reconcile with the necessary pace of consultations. From a relational point of view, the staff had to manage a multitude of strong emotions to ensure the smooth running of the MCHM, which could have had quite detrimental effects on the cohesion of the group and the quality of service. Cohesion is an indispensable element for the solidity and the security of an organization. This brings us to the last point made by Le Cardinal, namely the sense of values [18]. While the first three points have sometimes been thorny or grueling for the MCHM staff, this notion of value has proven to be rich and redeeming, helping to strengthen the staff's confidence in the organization.
A. Trust as an organizational key resource One of the main challenges was to protect confidential
data from accidental or deliberate misuses (e.g., find out who is infected to protect oneself and one’s families). The team needed to emphasize strong group cohesion and deep trust to limit the perverse effects of fear and uncertainty. Many authors recognize the fundamental nature of trust in the consolidation of professional cooperation relationships [18] 22] [23]. They also insist on the importance of trust for good health of the organization. This notion is all the more important in times of crisis or in risky situations. It contributes to the fluidity of actions, exchanges and collaboration, by minimizing the costs induced by action control procedures [24]. Indeed, within organizations that doubt their own competences, control activities reduce the quality of procedures and decision-making. They also
increase process times, not to mention the consequences in relational and psychosocial terms. Trust is all the more important as it plays a central role in times of crisis and in risk exposure, as it partly conditions their management [25] and their consequences.
One of the pillars of the successful crisis management was the revaluation of the values defended by the MCHM: dedication, protocol rigor and competence. The young doctors took over the reorganization and the whole COVID-19 medical consultations. This esprit de corps strongly contributed to the reinforcement of positive values within the team (solidarity, team spirit, devotion, commitment, etc.). Moreover, the young doctors not only established the new care protocol, but also expose themselves to the virus, by taking in charge the COVID-19 consultations. In doing so, they diminished the exposure of at-risk doctors to the COVID-19 (age, comorbidity factors, etc.). They took some risk to protect their colleagues. Within the new protocol, the main space of the MCHM was isolated from the space dedicated to COVID-19. The doctor’s goal was not only to limit staff exposure to the virus, but also to maintain patient anonymity. The aim was to protect the personal records of potential infected patients and to subtly inform the rest of the staff of the limits not to be crossed.
The dedication of doctors to the organization of care and the protection of staff and patients was a decisive factor. It has a strong impact on the consolidation of trust during the riskiest moments of the crisis, according to the survey results. A hundred percent of the respondents agree that this was the event that marked them the most, that gave them enough confidence to stay united and that gave them a frame to follow for the rest of the crisis. This feeling has to do with the relationship between individual focus and collective focus, between profit and risk. By taking the risk of exposing themselves to protect their colleagues, the young doctors valued the notion of dedication and the confidence they had in their team's ability to deal with the crisis. Moreover, their attitude towards the protection of their infected patients' data was a reminder of the ethical conduct they expected from all the staff.
B. Emotional intelligence: a pillar of crisis management The doctors expressed an esprit de corps, a withdrawal
from individual benefit for the benefit of the collective, of the whole organization. This strong decision helped to strengthen the commitment to the collective and clearly defined their role within the organization [2]. At this worrying and uncertain moment of the crisis, their involvement represented an organizational anchor point, a reference point for all staff, enabling them to become aware of the values at work in their work [19; 20]. From a meso point of view, this leads to a pronounced form of professional and emotional commitment of all staff. The doctors' action was both a translation and a reminder: it reflected the ethical conduct expected during the crisis, while reminding staff that they could trust the rigor of the organization. This attitude echoes to a communication studies approach, which considers emotions as a social performity [26]. According to this approach, emotions and

260
International Journal on Advances in Software, vol 13 no 3 & 4, year 2020, http://www.iariajournals.org/software/
2020, © Copyright by authors, Published under agreement with IARIA - www.iaria.org
affectivity are not considered as individual construction, but as a product of social interactions, forget by the socio-cultural culture of the organization [26]. As the organization benefited from a long-term and strong affective and emotional bonding, it seemed evident to capitalize on it to manage the first days of the crisis.
The stakes of this event were both rational and emotional. As Goleman reminds us, "emotional intelligence is based on self-control, ardor, perseverance and the ability to incite oneself to action" [19] [20]. It is based on fundamental ethical attitudes. The rational mind, of which we are most aware, is balanced and reflective, while the emotional mind is impulsive, powerful and sometimes illogical. The attitude of doctors has appealed to this dimension of the mind, acting against the deleterious effects of agitation, persuading - not convincing - the rest of the team to act to achieve a common goal. They acted on feelings rather than on reasoning, on the capacity for commitment and influence.
Rational and emotional intelligence are inseparable from each other for the well-being of organizations. Alvarez, in 2001, highlighted the constant need to combine the rules and procedures of formal systems with the emotional dimensions of the team. These are plural and circular relationships [27]. Within the MCHM, every action taken, every protocol established acts on the psychosocial determinants of the team. The use of masks and gloves, but above all of hats and gowns, which were not mandatory, had the effect of reflecting the organization's desire to protect its employees. The same is true of the protocols for receiving COVID-19 patients, as well as the systematic disinfection processes, which were intended to enhance staff protection. By acting on the operational and procedural level, the MCHM was also able to act on the affective dimensions of its team and enhance its interest in them.
The collective action can be related to the ability of the organization to be resilient, e.g., to “absorb, respond to and also benefit from events that occur as a result of changes in the environment” [28]. The hypertelic context can lead the organization to a definitive failure. It was all the more crucial to reduce its effects during the crisis as such a failure could endanger the whole territorial healthcare network and the population. Resilience rests on a system of shared values and an ability to use owned resources in a creative and innovative way [29]. The MCHM was able to draw on its strengths, particularly its human and procedural strengths, and on its value system to stem the adverse effects of the crisis. As the organization could not benefit from any additional technical and human support, it intelligently reviewed its entire procedures, in order to make the best use of the resources at its disposal and to adapt as best as possible to the management of the crisis.
C. The essential circularity between technical and human aspects An organization is not only based on these non-human
and technical aspects, but on an alliance of these dispositions with the social and human space of which it is composed. Yet one of the staff members showed a contagious anxiety, despite this collective effort to face the
situation calmly. It resulted in growing restlessness, errors in the management of patient data, difficulty communicating with others, and proven inefficiency in performing their tasks. Thus, both procedurally and humanly, the employee undermined the organizational stability and security of the MCHM. This was all the more worrisome since the psychosocial stability of the MCHM remained precarious, suspended from daily government announcements on the evolution of the epidemic. The decompensation of the employee risked causing internal dysfunction, the repercussions of which could be disastrous externally. Indeed, each individual is part of the system and each exerts an influence on all the others [19] [20]. The decision to allow this employee to work from home allowed the preservation of other staff members and the quality of service to patients. This example clearly shows that a system or network does not have an immutable durability, but on the contrary must be vigilant to each of its components to ensure their cohesion.
Everything is thus equally important in the organization: organizational factors (procedural capacity), cognitive factors (interpretation by individuals), discursive factors (information exchanges), as well as non-human entities. This whole constitutes the organizational collective, the network. The stability of the network depends on the solidity of the components and their ability to anticipate and cope with future events. It is this anticipation of events that has been the lifeblood of the MCHM. By isolating the disruptive actor before it impacted the rest of the organizational components, they made it possible to safeguard the stability of the network and data security, while offering a benevolent and adapted solution. It is difficult for an organization to find a constant balance, especially when it comes to human components in a crisis situation. The strength and quality of a network is based on its ability to adapt to its social context (Callon, Latour, Akrich, etc.). The social dimension is understood as an effect caused by interactions between very different actors, who are continuously succeeding each other and who participate in the evolution and modification of the network. Within the MCHM, there were successive, progressive and necessary adaptations of the organizational processes, which reinforced its capacity for collective action and fought against its hypertelic dimension.
IX. ORGANIZATIONAL HEALTHCARE NETWORK: A MODEL OF COLLABORATION AND INTERDISCIPLINARY COOPERATION
The organizational "readjustment" solution chosen by the MCHM was interdisciplinary cooperation. The beginning of the pandemic was, according to the doctors interviewed, the most complex moment in their crisis management. Starting from scratch is one thing, making this new beginning efficient is another. According to Pesqueux, complexity, uncertainty of outcome and the dangers involved call for cooperation [24]. As soon as the state of emergency was made official, the objective was to collectively find the most satisfactory solution to ensure continuity of care, while avoiding antagonisms, paradoxes and contradictions. This explains the rejection of the action

261
International Journal on Advances in Software, vol 13 no 3 & 4, year 2020, http://www.iariajournals.org/software/
2020, © Copyright by authors, Published under agreement with IARIA - www.iaria.org
plan proposed by the leaders and the health framework. This, according to one of the young doctors, "was, in itself, not a bad idea. The substance seemed good to me, but there were too many contradictory elements in the procedures. There were also a lot of redundant steps, which wasted unnecessary time and were not relevant to the management of COVID-19 patients. We absolutely had to involve the surrounding health care system. Not only to refine our strategy, but also to ensure consistency. This excerpt illustrates a crucial point in crisis management. In a situation like this, it's not so much a matter of having experts on specific topics. Rather, it is a matter of consolidating a network of actors capable of collaborating and producing collective responses to problematic situations, while remaining united and solid to ensure an efficient and constructive organization [24].
In general, the organizational healthcare network constitutes a tool for improving professional practices and, more broadly, it contributes to maintaining or even improving the level of quality of service provided [10]. The network must act on three levels of collaboration, all of which are essential [5]: the operational (or clinical) level - where the acts of care are carried out -, the structural level - which mobilizes human and material resources to ensure continuous and comprehensive care - and the institutional level - representing the decision-makers and financers of the health system.
With regard to the operational level, the MCHM relied on the interdisciplinary nature of the organizational health network, in particular the hospital institutions. The latter benefit from numerous plans and protocols specific to crisis management, which propose efficient and specific organizational processes to respond to the multiplicity of types of crisis. Thanks to the solidity of their professional network, MCHM doctors were able to quickly obtain the information needed to structure their care protocol. The latter represents a procedural hybridization. On the one hand, it is based on the principle of sectorization in the hospital environment, which was gradually implemented in all institutions. However, since hospitals were better adapted to procedures for isolating contagious patients, the MCHM team had to adapt the procedure to its own structural constraints. This required a collaborative reflection in order to find a solution that would be comfortable for patients, while limiting the risk of exposure for professionals.
The operational cooperation of the MCHM local health network also developed a structural cooperation. As hospitals feared to be overwhelmed by the number of patients, MCHM doctors volunteered to replace hospital doctors during their days off to maintain the quality of care of the surrounding hospitals. Their objective was to maintain the quality of patient care, so that it would be comprehensive and continuous [30]. There seems to be, within this organizational health network, a certain conception of solidarity, which associates cooperation to the realization of a common work [24]. This case is in line with the organizational model known as "collaboration - cooperation" and corresponds to a plural level of relationship, which enriches and fleshes out the
interdisciplinary relationships between institutions. This organizational principle tends to reject practices of non-cooperation and domination and instead aims to promote relational exchanges. This inter-organizational alliance was, it seems, a determining factor within the Landes health territory.
X. CONCLUSION During the first phase of the survey, the sharing
procedures introduced at the MCHM raised questions about risk assessment. In this institution, different informational and managerial strategies were put in place to secure the exchange of personal records. However, during the first investigation, it seemed that the process of quality of care evaluation and “information crisis” management protocols (accidental or fraudulent disclosure, for example) were relatively minor. Before the COVID-19 crisis, the institution did not seem to have been confronted with any type of major crisis. Its youth and its efficient management could explain this situation. Emergency protocols to resolve this type of situation were non-existent in the MCHM. It is problematical, as this implementation is one the most important principles of evaluating the quality of care in France, since the publication of the law of 31 July 1991 [13].
It, therefore, seemed essential to study in great depth the involvement of the MCHM during the crisis and the change it had to conduct to brave it. The COVID-19 had been the real first challenge that could have put the MCHM in danger or even in total failure, especially concerning personal records management. During first month of the pandemic, the MCHM invested in a global reflexive stance to modernize its processes [30]. It questions its own modes of management to adapt to the crisis and so its capacity of resilience, as an ability of the organization to act in adequation to the reality, without taking any unthinking risk [29]. In the field of health, apparently minor errors or failures can have vital consequences [1] or endanger a health care institution and its staff. The management of the quality approach of such an institution cannot be done without a risk management component, nor a more global and formalized evaluation aspect. The measurement principles are inseparable from the principle of quality management [10]. It was necessary for the MCHM to proceed to this modernization and to develop its quality management procedures.
The second part of the survey highlighted the importance of organizational trust and the mobilization of emotional intelligence. Quality and data management rely to some rational perspectives. However, the others aspects of the institution depend on human and emotional aspects, even considering data management. The price for the lack of emotional intelligence or trust could end up compromising the existence of the organization [19] and its efficiency during the crisis. Before the COVID-19 pandemic, problems were resolved with discretion and fluency, with clear and identified leaders. The case of the MCHM presents a very interesting duality. Indeed, despite the profound redesign of these organizational processes, its founding values

262
International Journal on Advances in Software, vol 13 no 3 & 4, year 2020, http://www.iariajournals.org/software/
2020, © Copyright by authors, Published under agreement with IARIA - www.iaria.org
(commitment, solidarity and trust) had been critical for its success [19] and had insured the stability and the fluency of the MCHM team. The survey could thus conclude to the predominance of trust and emotional intelligence over processes and management of technical devices. It also highlighted the necessity for healthcare institutions to be resilient and to develop a continuous adaption to its environment, to avoid hypertelia, and to learn from its crisis experiences to improve its processes [31].
It would be interesting to investigate, on a larger scale, other MCHs, in order to compare the results of this study with other territorial and technical contexts. Health care institutions were severely tested by the epidemic of the COVID-19 and some of them did not experience the success of the MCHM. Conducting a large-scale survey would test the hypothesis of the preponderance of emotional intelligence in crisis management. It could also help identify the key resources on which organizations should rely during crisis contexts. In a longer-term perspective, the results of such a study could formulating crisis management approaches dedicated to emerging and collaborative health organizations. The objective is also to consider the development of a single working model for all MCHs, specially concerning data privacy management. As each MCH has its own specifications (socioeconomical context, number of the staff members, equipment, competences, etc.) would it be possible and relevant to propose a single crisis management model and resilience capacity to all of them [32]?
REFERENCES
[1] E. Vigouroux-Zugasti, C. Bourret and S. Parrini-Alemanno, “From Theory to Reality – Health Data Management in a Complex System”, eTELEMED 2020, The Twenlfth International Conference on eHealth, Telemedecine, and Social Medicine, DigitalWorld 2020 Congress, November 21, 2020 to November 25, 2020. [Online]: https://www.thinkmind.org/index.php?view=instance&instance=eTELEMED+2020 [Accessed: 10-November-2020].
[2] C. Doucet, Quality, University Press of France (Presses Universitaires de France), 2013.
[3] The French Senate. Access to care: health innovation promoted in French territories, 2017. [Online]: http://www.senat.fr/rap/r16-686/r16-68613.htm [Accessed: 16-January-2020].
[4] C. Vilcot and H. Leclet, “Quality indicators in health: Certification and evaluation of professional practices”, Second release, French Association of normalization, 2006.
[5] A. Bartoli and J. Sebai, “Multidisciplinary Care Houses facing territorial coordination”, Gestion 2000, no. 6, pp. 17-37, 2015.
[6] New Aquitaine Regional Health Authority, Population and its characteristics in New Aquitaine, 2018. [Online]: http://www.nouvelleaquitaine.ars.sante.fr/la-population-et-ses-caracteristiques-en-nouvelle-aquitaine [Retrieved: January, 2020].
[7] INSEE, Complete File – Landes (40), 2010. [Online]: https://www.insee.fr/fr/statistiques/2011101?geo=DEP-40#chiffre-cle-1 [Accessed: 23-October-2019].
[8] New Aquitaine Regional Health Authority, Key Metrics, 2017. [Online]:
https://www.calameo.com/read/003713143e21e889f9535?page=3 [Accessed: 23-October-2019].
[9] French Data Protection Act. Loi informatique et liberté, Law no. 78-17 of January the 6th 1978 (Last modification: July 27th 2019). [Online]: https://www.cnil.fr/fr/la-loi-informatique-et-libertes#article2 [Accessed: 23-October-2019].
[10] L. Miguel-Chamion, “Protection of shared health data”, International Journal of Bioethics, vol. 25, no. 3, pp. 63-80, 2014.
[11] J. Béranger, “Data ethical value of health big data”, Les Carnets du numérique, vol. 12, no. 1, pp. 109-32, 2016.
[12] C. Vilcot and H. Leclet, “Quality indicators in health: Certification and evaluation of professional practices”, Second release, French Association of normalization, 2006.
[13] L. Monnoyer-Smith, “For a complex epistemology of information and communication sciences”, presented at the 16th SFSIC Congress, Paris. 2008 [Online]: https://www.sfsic.org/congres_2008/spip.php?article78, [Accessed: 23-October-2019].
[14] M. Zacklad, “Management as a scoping activity in a context of cooperative transactions”, Activité, vol. 10, no. 1, pp. 192-200, 2013.
[15] D. Maurel, “Sens-making: A model for the construction of reality and the apprehension of information by individuals and groups”. Communication Studies, vol. 35, no. 2, pp. 31-46, 2010.
[16] G. Le Cardinal, “Federating and stimulating energies, building trust to face crisis situations”, Inflexions, vol. 2, no. 3, pp. 153-168, 2006.
[17] G. Le Cardinal, “Trust as a fundamental element of society”, Revue Projet, vol. 2, no. 293, pp. 65-71, 2006.
[18] D. Goleman, Emotional intelligence, Bantam Books, 1996 [19] D. Goleman, Working with emotional intelligence,
Bloomsbury Publishing PLC, 1999. [20] C. Mayday, “Quality of data and Open data”, I2D
Information, données documents, vol. 53, no. 4, pp. 58-58, 2016.
[21] Software Weda. [On line]: https://www.weda.fr [Accessed: 26-March-2020].
[22] D. Maurel and A. Chebbi, “The perception of informational trust. Impacts on informational behaviours and documentary practices in an organizational context”, Communication and Organization, vol. 42, pp. 73-90, 2012.
[23] G. Simondon, On the Mode of Existence of Technical Objects, (ed. Aubier, 1958) University of Minnesota Press, 2017.
[24] P. Peretti-Watel, Risk society, La Decouverte, 2010. [25] F. Alavrez, The role of trust in the exchange of information:
Study of control relationships in the hospital environment. Human Sciences and Society, Parix IX Dauphine University, 2001. [On line]: https://hal.archives-ouvertes.fr/tel-02545337/document [Accessed: 26-July-2020].
[26] C. Lengnick-Hall and T. Beck, “Adaptive fit versus robust transformation: how organizations respond to environmental change”, Journal of Management, vol. 31, no. 5, pp. 738-757, 2005.
[27] A. Giddens, The Consequences of Modernity, Standford University Press, 1990.
[28] L. Begin and D. Chabaud, “Organizational resilience: the case of a family business”, RFSIC, no. 200, pp. 127-142, 2010.
[29] L.D. Coutu, “How resilience works”, Harvard Business Review, vol. 80, no. 5, pp. 46-55, 2002.
[30] A. Dumas and F. Martin-Juchat, “A communicational approach to emotions in organizations: questions and

263
International Journal on Advances in Software, vol 13 no 3 & 4, year 2020, http://www.iariajournals.org/software/
2020, © Copyright by authors, Published under agreement with IARIA - www.iaria.org
methodological implications”, RFSIC, no. 9, 2016. [On line]: http://journals.openedition.org/rfsic/2103 [Accessed: 26-July-2020].
[31] M.K. Christianson, Farkas M.T., K.M. Sutcliffe, K.E. Weick, “Learning through rare events: significant interruptions at the Baltimore & Ohio Railroad Museum”, Organization Science, vol. 20, no. 5, pp. 846-860, 2009.
[32] J. Bauweraerts and O. Colot, “Organizational resilience in family business: myth or reality?”, Recherches en Sciences de Gestion, vol. 2, no. 101, pp. 197-215, 2014.

264
International Journal on Advances in Software, vol 13 no 3 & 4, year 2020, http://www.iariajournals.org/software/
2020, © Copyright by authors, Published under agreement with IARIA - www.iaria.org
Principles and Applications of a Multiresolution Geodata Cube
Lassi Lehto, Jaakko Kähkönen and Juha Oksanen Geoinformatics and Cartography
Finnish Geospatial Research Institute (FGI) National Land Survey of Finland
Masala, Finland email: [email protected], [email protected], [email protected]
Abstract—The Data Cube concept provides a useful metaphor for management of raster geodata resources in the cloud. An initiative, called GeoCubes Finland, has been launched with the aim to facilitate access to geospatial raster data for academic research. The work is carried out in the context of a major research infrastructure development program in Finland. In the ingestion process, data sets are pre-processed into a harmonized, multiresolution cloud-based repository and brought into a common georeferencing frame, resolution levels, encoding format and tiling scheme. A custom Application Programming Interface (API) has been developed for flexible query, download and analysis of the repository’s content layers. Cloud-optimized access to pre-stored resolution levels supports efficient interactive visual exploration of analysis results computed on-the-fly. The presented application examples of the GeoCubes repository include field inspection, route finding and wind exposure analysis.
Keywords-raster data; multi-resolution; harmonisation; cloud service; visualization.
I. INTRODUCTION Use of raster-formatted data sets in geospatial analysis is
increasing rapidly. At the same time geographic data are being introduced into disciplines outside the traditional domain of geoinformatics, like climate change, intelligent transport, health care and immigration studies. Geospatial data sets are also growing rapidly in number and volume. In particular, the volume of raster data sets is becoming difficult to manage. The resolution of image sensors has steadily improved and new imaging technologies have been taken into use. In addition, integrating geospatial raster data sets for analysis has become a tedious task, as the data sets typically differ in critical parameters like origin, resolution, coordinate reference system, encoding, format, etc. It is important to develop mechanisms that facilitate access to relevant data resources.
The data cube concept has emerged as a solution for organizing a repository of harmonized geospatial raster datasets [1] [2], [3]. In computer technology, a data cube is a multi-dimensional array of values [4]. Those values represent certain facts that can be organized along various aspects. For instance, results of a vote can be considered along political party, voting districts, age or gender of candidates, year of election, etc. These aspects correspond to the axes of the multi-dimensional array and the values live in cells inside this array.
In the geospatial domain, the data cube approach was first used in the Earth Observation (EO) community for organizing vast amounts of satellite images [5]. In this application area time is a very important dimension, as satellite imagery are typically available in extensive time series. The four most typical data cube dimensions in an EO application thus are the two geospatial coordinate axes, time and the imagery type.
In the case of a geospatial data cube, the predominant axes naturally are latitude, longitude and the possible height. A voxel-based approach for organizing truly 3D geodata is also possible [6]. The cell value represents the fact about the physical environment that the data set happens to describe. Thus, content theme can be seen as a predominant axis of a geospatial data cube. The most important benefit of organizing data sets as a data cube repository is immediate availability of the contents for integrated analysis. The approach thus aims at fulfilling the goals of the concept Analysis Ready Data (ARD) [7].
The most important positive aspects that a multidimensional data cube approach provides for geospatial application can be listed as
• A data cube forms an integrated data repository, where harmonized content layers are ready for use without troublesome data preparation steps.
• Ingested datasets are aligned on pixel level and thus can be readily integrated for visualization and analysis.
• A data cube can be accessed along any of its dimensions, allowing for new kinds of knowledge retrieval and spatial analysis processes.
• A joint data cube repository enables data providers to deliver content through a new, easy-to-use channel, thus expanding their user base.
• The simplicity of raster data processing can be more effectively and widely exploited.
• By organizing a data cube as a cloud-based service with Web-friendly APIs, the potential use scenarios can be further widened.
The importance of the data cube concept for geospatial
application domain is also demonstrated by the fact that the Open Geospatial Consortium has initiated standardization work on the subject [8]. Another significant development is the Open Data Cube (ODC) initiative. ODC is an open source software library for organizing vast amounts of satellite imagery according to principles of data cube [9]. The software

265
International Journal on Advances in Software, vol 13 no 3 & 4, year 2020, http://www.iariajournals.org/software/
2020, © Copyright by authors, Published under agreement with IARIA - www.iaria.org
includes components for cataloguing and indexing EO resources and for ingesting those resources into a harmonized and optimized storage format for easy data retrieval. Furthermore, the ODC library provides tools for accessing and downloading content and for performing analysis operations on it. The ODC community has also developed tools for visual exploration and statistical analysis of the data cube contents. Concrete national and regional data cube implementations based on ODC include the Australian data cube called Digital Earth Australia [10], the Swiss Data Cube [11], Columbian Cube, Vietnam Open Data Cube, and the Africa Regional Data Cube covering Kenya, Senegal, Sierra Leone, Ghana and Tanzania [12].
ODC can also be applied to data resources other than EO data. The examples mentioned in the ODC documentation include gridded data sets like elevation models, geophysical grids and other interpolated surfaces. However, most of the activities around geospatial data cubes focus on satellite image processing, in general, and on their time series applications, in particular [5].
An initiative has been launched in Finland to build a multi-resolution, cloud service-based geodata cube, called GeoCubes Finland, containing some of the most important national geodatasets [13]. The contents of the GeoCubes include data layers like Digital Elevation Model (DEM), administrative areas, land use, surface deposits and various attributes of the national forest inventory. The content layers are provided by the governmental agencies that collect and continuously maintain them. GeoCubes Finland thus differs from other geodata-related data cube implementations by not focusing on satellite imagery, but rather on other traditional geodata sets. The GeoCubes development is being carried out in the context of a large research infrastructure development program in Finland, called Open Geospatial Information Infrastructure for Research (oGIIR) [14]. Datasets to the GeoCubes are being provided by the National Land Survey of Finland (NLS), the Finnish Environment Institute (SYKE), the Geological Survey of Finland (GTK), and the National Resources Institute Finland (LUKE).
In Section II, the basic principles of the GeoCubes Finland are presented. Section III details the technical implementation of the GeoCubes data repository. Data ingestion process is described in Section IV. Section V discusses the custom content access API of the GeoCubes Finland data repository in more detail. Section VI presents the two GeoCubes Finland client platforms developed. In Sections VII and VIII, some visualization related considerations and example applications are discussed. Section IX concludes the paper.
II. GEOCUBES FINLAND
A. General A feature that makes GeoCubes Finland different from
other geospatial data cube implementations is its multi-resolution nature. A set of fixed resolution levels (1, 2, 5, 10, 20, 50, 100, 200, 500 and 1000 m) have been selected to store the contained data sets. The resolutions are selected to facilitate processing of analysis operations, typically run on round resolution values, and to enable easy integration with
statistical and other auxiliary data sets. Opposite to resolution levels typical for web mapping schemas, such as the powers of two in Google Maps, in GeoCubes Finland the resolution levels are selected to serve the user in analysis tasks. The available set of resolution levels depend on the original accuracy of the source data set. Thus, the finest resolution of most of the GeoCubes Finland’s content layers is 10 m. Only some national data sets can be reasonably be represented in 1 m resolution. These include the most accurate digital elevation model and the administrative division data sets.
Resolution levels could possibly be seen as one dimension of a multi-dimensional geodata cube, but each resolution level has an individual range for the cube’s coordinate-related axes. Therefore, the resolution levels of the cube must in fact be seen as a set of separate cube instances. Hence, the plural form of the cube’s name: GeoCubes Finland.
In addition to industry-standard access interface to coverage data, the Web Coverage Service (WCS) [15], the GeoCubes contents can be accessed via direct file URLs and through the custom-built GeoCubes API.
B. Contents
The contents of GeoCubes Finland include a representative selection of spatial data sets maintained by governmental research organisations in Finland (like SYKE, LUKE and GTK). As reference data, some general-purpose data sets provided by the NLS are also included. Data sets are organised as individual layers of information with common representational properties for easy integration and analysis.
Examples of data sets stored in GeoCubes in the first phase include high-resolution elevation models (from the NLS), land-use layers (from the SYKE), superficial deposits layers (from the GTK) and national forest inventory layers (from the LUKE). The latest additions to the GeoCubes Finland data layers are slope and aspect of the terrain, computed from the 2 m resolution DEM, sea regions and the cropland field parcels layer.
C. Metadata
Metadata concerning the data sets stored in GeoCubes Finland are provided as a centralised resource. Because of the nature of the data sets, special attention is put on providing descriptive information about the classifications applied in raster layers. This information is predominantly made available as internal metadata fields of the raster data file. The access API developed to the GeoCubes supports metadata queries, too. As GeoCubes provides multi-resolution data storage, the applied nomenclature in some cases form hierarchical classification structures.
D. Data Encoding
The encoding of GeoCubes Finland cell values depends on the nature of the data set being represented. Both classified data sets (like land use or superficial deposits maps) and data sets with continuous value ranges (like Digital Elevation Models (DEMs) or orthophotos) are included. No-data areas are represented as zero-valued cells in classified data sets and by a separate mask channel in data sets with continuous value ranges.

266
International Journal on Advances in Software, vol 13 no 3 & 4, year 2020, http://www.iariajournals.org/software/
2020, © Copyright by authors, Published under agreement with IARIA - www.iaria.org
E. Grid The standardised grid applied in GeoCubes is based on the
Finnish national Coordinate Reference System (CRS) ETRS-TM35FIN (EPSG code 3067). This projected CRS is compatible with the pan-European ETRS89 system. ETRS-TM35FIN covers the whole country in one projection zone and has the false easting value of 500 000 m on its central meridian at 27°E longitude. The origin of the GeoCubes Finland’s grid (top-left corner) is located at the coordinate point (0, 7800000). The easting value of the origin is selected to avoid negative coordinates. The northing coordinate value is selected as a round 100 km value, allowing for good coverage of the country.
III. TECHNICAL IMPLEMENTATION OF THE REPOSITORY GeoCubes Finland’s data storage is implemented as a set
of Cloud Optimized GeoTIFF (COG) files [16], [17]. These files are stored on a cloud service platform, organized in directories by data provider, data set and the edition of data set. The area of the country is divided into tessellation of sixty 100 km * 100 km sized blocks, each maintained as a separate GeoTIFF file to ease processing tasks. The tessellation also facilitates parallelization of various processing steps and works as a rudimentary spatial index. All the files can always be accessed in a straightforward manner via http (HyperText Transfer Protocol) by their URLs (Uniform Resource Locator). The block tessellation is shown in Figure 1.
Figure 1. The sixty GeoCubes Finland blocks covering the country and coordinates of their upper-left corner in the national ETRS-TM35FIN
coordinate reference system. A GeoTIFF file arranged according to COG specification
contains overviews and has its raster content organized as
tiles. The overviews are ordered in sections from the coarsest to the most detailed, followed by the full resolution raster. The metadata describing the offset of each section must be at the beginning of the file. With this file structure, a calling COG-aware client can make use of the http ‘GET Range’ query, which enables an indicated subsection of a file to be requested. By first requesting the metadata portion, the client can then select an appropriate range of bytes to only download the needed geospatial area of an appropriate resolution, i.e. overview level. This mechanism significantly improves the efficiency of raster data retrieval for cloud-service based applications. In the rudimentary tests carried out on the GeoCubes Finland COG files, it has been noticed that speed improvements of up to 80 % can be achieved with Cloud Optimized files when compared to traditional GeoTIFF files.
The multiple resolutions are implemented in two ways, both as internal GeoTIFF overview layers and as individual external resolution specific GeoTIFF files. Internal overviews facilitate easy content delivery, as all resolutions are contained inside as single file. Separate resolution specific GeoTIFF files in turn enable better control of resolutions for computations run in external applications. The overview functionality, like most other computing tasks in GeoCubes Finland, is implemented using Geospatial Data Abstraction Library (GDAL) [18]. Python-based processing tasks are performed making use of the Rasterio library [19].
To collect the individual files as a complete view covering the whole country, the so-called Virtual Format mechanism (VRT) of GDAL is used [20]. In this approach, an XML-formatted text file is used to refer to the set of image files that constitute the integrated view. As such, a single VRT file can for instance refer to all external GeoTIFF overview files on certain resolution level, thus facilitating analysis and visualization of larger areas. In the same way, a VRT file can refer to various resolution-specific files in a certain tessellation block, providing a light-weight representation of the multi-resolution data set of that block. VRT files can be easily transported across network connections. Because the file references are stored as absolute addresses, the VRT file can be opened in a third-party application. This approach limits downloading of raster content to the spatial area and to the resolution level the user actually needs.
IV. DATA INGESTION PROCESSING In the data ingestion process the data sets being imported
to GeoCubes Finland repository are transformed to the common form. Vector data sets are first rasterized. In the rasterization process the value of attribute selected for GeoCubes is stored to the cells. The spatial resolution applied in the rasterization is selected from the list of GeoCubes resolutions, based on the accuracy of the data set in question. All of the data sets currently available in the GeoCubes repository have base resolution of either 1 m or 10 m. In the rasterization process the resulting raster data is stored as GeoTIFF files in the block structure of GeoCubes. If vector data is available in several scales, the smaller scale versions are rasterized and used as the source for overview layers on appropriate resolutions.

267
International Journal on Advances in Software, vol 13 no 3 & 4, year 2020, http://www.iariajournals.org/software/
2020, © Copyright by authors, Published under agreement with IARIA - www.iaria.org
If the source data set is available as raster data, the data set is processed to resample the cells to the GeoCubes grid and produce the block-wise GeoTIFF files. In some cases, the classification schemes or data collection resolutions have changed along time between data set editions. This kind of discrepancies must be corrected in the data ingestion process to produce a harmonized collection of repository layers.
The next step in the data ingestion process is to produce the coarser resolution representations as GeoTIFF overview layers. The generalization procedure available in the GDAL’s ‘BuildOverviews’ function is used in the processing of coarser resolutions. An appropriate resampling method is selected, depending on the nature of the source data set. In the process both the resolution levels are produced both as internal GeoTIFF overview layers and as independent single-resolution GeoTIFF files. The multiresolution files are then transformed into the COG form. For categorical data sets the metadata, color table and category information are written to the GeoTIFF files.
In case of categorized data sets, generalization is a delicate process, in which the distribution of categories should be maintained as accurately as possible. If the source data set provides a hierarchical classification scheme, more general classes are used on the coarser resolution levels. In some cases, the generalization procedure has been carried out by the data provider using custom data-specific methods and the resulting multiresolution GeoTIFF files are then used as the input for the GeoCubes data ingestion process.
Next the VRT files are processed. The multiresolution versions of the block-wise GeoTIFF files are combined together in a VRT file. The single resolution files on all available resolution levels are processed in the same way. In addition, for each block a set of VRT files is created, so that for each available resolution level a VRT file is available containing this base resolution and all the coarser resolutions. This arrangement facilitates dynamic provision of multiresolution representations of the content in various base resolutions. Finally, these block-wise VRT files are combined together as VRT files covering the whole country.
Data ingestion procedure is automated by Python script-based processing. GDAL’s Python API is used extensively [21]. The main spatial functions like vector data access, rasterization, raster data generalization, georeferencing and GeoTIFF manipulation are based on the use of GDAL Python API. All the processing of raster data arrays is done using Python’s NumPy library [22]. The fully automated ingestion process facilitates processing of new data set editions as they become available.
V. CONTENT ACCESS API An API has been developed for exploring, downloading
and analyzing the GeoCubes Finland contents [23]. The API is designed according to the principles of RESTful Web API [24], in which the request is defined by the path components of the query URL. The API provides requests for querying the basic metadata of the repository, querying cell values on a given location, downloading content by bounding box, polygon or administrative unit and analyzing the content in terms of cell value distribution, change detection, etc. The
analysis operations are run on the server platform, without downloading any content to the client side.
In all content queries, the query can be run on a desired resolution level and year. The multi-resolution structure of the GeoCubes repository gives to the user a flexible choice on speed vs. accuracy of the operation. For instance, an analysis procedure under development can be first tested on a coarse resolution level, and the real, time-consuming run on the finest resolution be carried out only when seemed appropriate. In case of analysis based on visual exploration, the resolution level, on which the analysis is run, can always be matched with the zoom level of the visualization. This way the analysis can be run in roughly constant time and the interactivity level of the application can be kept stable.
The general scheme of the access API can be described as follows:
what to do / on which resolution level / with which content layer / where / when / how
As an example, the query for the cell value on a given location becomes as:
legend/500/mvmi-paatyyppi/340500,6695000/2009
where mvmi-paatyyppi (in Finnish) is one of the themes (forest inventory data) of GeoGubes.
Another query would request download of a content layer inside the given list of municipalities (‘kuntajako’ in Finnish), from the given resolution level and year:
clip/100/corine/kuntajako:734,761,834,433,224,444,927/2000
The resulting data set, requested using the GeoCubes Web
client, is shown in Figure 2.
Figure 2. A CORINE data set downloaded via GeoCubes API using
administrative units’ boundaries as selection area.

268
International Journal on Advances in Software, vol 13 no 3 & 4, year 2020, http://www.iariajournals.org/software/
2020, © Copyright by authors, Published under agreement with IARIA - www.iaria.org
Downloading of a DEM from two blocks in VRT format with multiresolution content would go as:
clip/20/km10/blocks:300000,6900000, 300000,6800000/2018/vrt:mr
Download of a terrain slope layer, computed from the 2 m
resolution DEM, in horizontal resolution of 1 m, from inside a user-defined polygon would be initiated like this:
clip/1/km2slope/polygon:358978,6668706,358918,6668645,358923,6668597,358980,6668549,359093,6668579,359096,6668668,359017,6668719,358978,6668706/2019
An example of an analysis would be change detection
between CORINE versions 2000 and 2012 in land use type fields (‘pellot’ in Finnish) inside the given bounding box:
analyse:changedetect/10/corine:Pellot /bbox:225700,6660000,494300,6740000/2000,2012
The result of the above analysis is an image depicting the
changes in red (removals) and green (additions). Another analysis would determine the distribution of cell
values inside the two indicated counties (‘maakuntajako’ in Finnish): analyse:distribution/500/mvmi-maaluokka/maakuntajako:04,06/2015
The result is a list of existing cell values together with their
frequencies. The analysis results visualized in the GeoCubes Web client using the D3.js library [25] is shown in Figure 3.
Figure 3. GeoCubes analysis results indicate distribution of data values inside the selected area (shown as a bar chart in the left bottom corner).
As an auxiliary data source for analysis purposes, the
Finnish administrative areas in four different levels are also available in vector form in the GeoCubes repository.
The GeoCubes API has been implemented as a Web service using Django Web framework [26], together with Python-based service side scripts making an extensive use of the Python API of GDAL. In addition to the custom API, the most relevant service interfaces standardized by the Open Geospatial Consortium are also supported. The main components of the GeoCubes Finland platform are shown in Figure 4.
Figure 4. The main system components of the GeoCubes Finland platform.
VI. CLIENT PLATFORMS Two main software projects have been accomplished to
develop client platforms for supporting the GeoCubes data usage. An Open Layers -based web client has been developed to demonstrate the data contents and access API of the GeoCubes repository. The application provides fast and easy visualization of the GeoCubes content layers, together with interactive querying of the layer cell values. The data retrieval options include download by bounding box, user-defined polygon, administrative area and GeoCubes tessellation block. The user interface of the web client is depicted in Figure 3.
A client application capable of accessing GeoCubes API has also been developed as a QGIS plugin [27]. The plugin provides an exploration tool for interactive visualization and querying of the GeoCubes data layers. Data download can be requested using a bounding box, polygon or administrative unit-based selection. The resolution level can be selected explicitly. The downloaded data set can be directly inserted as a new layer into the current QGIS project, or it can be stored to the local disc for later use. An example of the user interface of the plugin is presented in Figure 5.

269
International Journal on Advances in Software, vol 13 no 3 & 4, year 2020, http://www.iariajournals.org/software/
2020, © Copyright by authors, Published under agreement with IARIA - www.iaria.org
Figure 5. The user interface of the QGIS GeoCubes Finland plugin.
VII. VISUALIZATION CONSIDERATIONS For basic visualization of the content layers, a Web Map
Tile Service (WMTS) is available on the GeoCubes platform. The service makes use of a Web Map Service (WMS) that uses a VRT file combining the original GeoTIFF files as its source. This arrangement enables both ad hoc visualizations through WMS and cache-based static image delivery via WMTS. In the case of the WMTS service, the pre-rendered tiles are available on the fixed resolution levels of the GeoCubes. For best visual presentation, the client should apply scale levels that correspond to those resolutions. The WMS implementation of GeoCubes platform is based on MapServer and the WMTS service on MapProxy.
Visualization of administrative areas poses a specific challenge. Because areas are represented as raster data to facilitate analysis with other content layers, boundary lines cannot be used to separate an area from the neighboring areas. The only way to reliably display the administrative division of the country in a legible manner is to ensure that neighboring areas are always presented with clearly distinguishable colors. The Finnish lowest level administrative division has more than 300 municipalities. Thus, to achieve an appropriate data set with cell values corresponding to the real municipality codes, a raster with 16-bit cell values was created. However, for Web browser-based visualization, a 256-colour PNG
image is required. A custom software module was developed that creates random color components for a 256-colour RGB color table and applies the colors to municipalities so that the three-color components of a municipality always differ more than 30 units from all of the neighboring areas’ color components. The result is a bright and colorful municipality map, in which all areas can be reliably distinguished (Figure 6).
Figure 6. A municipality map with well distinguishable colors.
Another example of enhanced visualization tested in GeoCubes Finland is the locally stretched DEM visualization. The terrain of the country is mostly flat, higher elevations existing only in the northern Lapland. A consistent, stable country-wide DEM visualization thus depicts flat areas with very limited color scale, making it impossible to recognize subtle height differences. A dynamic visualization module was developed for GeoCubes that stretches every individual view requested by the client to full color scale. As the GeoCubes data repository has multiple resolution levels, the visualization processing can be performed efficiently in constant time, independently of the presentation scale of the client. The two images in Figure 7 depict the difference between fixed and dynamic DEM visualization on a particularly flat area in the Finnish Ostrobothnia.
Figure 7. A static DEM visualization compared with a dynamic, locally stretched graphic scale.
A 3D example of visualization of GeoCubes’ contents is
depicted in Figure 8. Here, DEM data is extracted from the GeoCubes data repository around possible crater locations, where a meteorite impact is deemed to be behind the peculiar rounded land form. The multiresolution contents of the GeoCubes repository supports effective 3D visualization of crater areas of various sizes.

270
International Journal on Advances in Software, vol 13 no 3 & 4, year 2020, http://www.iariajournals.org/software/
2020, © Copyright by authors, Published under agreement with IARIA - www.iaria.org
Figure 8. Possible meteorite impact craters visualized, based on GeoCubes DEM. Big scale differences in visualizations are supported by GeoCubes’
multiresolution contents.
VIII. APPLICATION EXAMPLES The analysis processes can be effectively run on different
resolution levels and their results are readily available for visual exploration over the whole range of scales supported by the geodatacube's resolutions. The GeoCubes API has been designed to support access, querying and analysis of the geodatacube's contents on the resolution level appropriate for the actual use situation.
A. Field Inspection As an example of using GeoCubes API, a field inspection
of repository cell values has been tested. In this approach, the inspector moves around on the terrain and constantly receives values of the GeoCubes layer of interest into his cell phone. This way, the inspector can compare the environment around him with the stored category values, for instance, he can determine the correctness of forest type information – and do that on all available resolution levels of the repository.
In the developed pilot implementation, the position of the inspector is recorded with an application called Owntracks. The location is reported back to a server (Eclipse Mosquitto) [28] implementing the ISO-standardized Message Queuing Telemetry Transport (MQTT) -protocol. The user is presented with a map-based application (Leaflet with Realtime extension). When the map application gets notice from the MQTT server that the user has moved to a new location, it then send a request to the ‘legend’ operation of the GeoCubes API together with the location information. As a result, it will get cell values from the requested layer on all available resolution levels and can compare them with the reality around him. The pilot’s architecture is presented in Figure 9.
Figure 9. A field inspector accessing GeoCubes cell values using Mosquitto
server.
B. Route Finding In another analysis example, the GeoCubes DEM layer is
used for route finding for a forest vehicle that has certain limits for movement in steep slopes. DEM data for study area was acquired by accessing the GeoCubes API’s ‘clip’ operation from within the QGIS application [29]. Then, analysis functions available in QGIS were used to compute slope values for the area and these were used as the cost surface for route finding. Areas too steep for the vehicle were excluded from the computation. The case study demonstrates the use of the GeoCubes’ content for analysis using tools outside the GeoCubes platform. The same analysis could also be run in different resolution levels, depending on the needs of the application. The resulting route alternatives are depicted in Figure 10 using QGIS plugin [30] for three.js, a JavaScript library for 3D visualization [31].
Figure 10. Route finding in QGIS with DEM from GeoCubes using slope as cost surface. White areas denote terrain that has been classified to be too
steep and is excluded. The red and yellow lines denote found alternative routes.
C. Wind Exposure Analysis Another GeoCubes data application example involves
creating a forecast map of perceived temperature, based on location-dependent exposure to wind. The result is a “winter map” with a background layer, adapted to reflect the snowy conditions of the Nordic winter landscape, together with an overlay indicating the direction of wind and the level of wind chill-affected perceived temperature. The approach makes use of the GeoCubes-provided cloud-optimized multiresolution DEM data, combined with the weather forecast information accessed online from the Finnish Meteorological Institute (FMI).
The service is implemented as a PHP: Hypertext Preprocessor script making an extensive use of GDAL’s command line interface. At the core of the service is the GDAL command ‘gdal_translate’, which accesses the online VRT files of the GeoCubes repository by direct URL reference. The VRT file provides a convenient single point access to all sixty multiresolution GOC files that cover the whole country. Using the ‘projwin’ and ‘outsize’ parameters of the ‘gdal_translate’ command, one can specify from which area the data is to be retrieved and what is the desired size of

271
International Journal on Advances in Software, vol 13 no 3 & 4, year 2020, http://www.iariajournals.org/software/
2020, © Copyright by authors, Published under agreement with IARIA - www.iaria.org
the resulting image. These parameters together determine the resolution level that is accessed in the GeoCubes multiresolution data storage. This arrangement facilitates an easy and efficient presentation of the analysis results in various scales, depending on the zooming levels selected in the user interface.
Once the request for a “winter map” comes to the service, the PHP script will access the FMI’s weather forecast service through a Web Feature Service (WFS) interface, and then parses the required wind direction information from the response. Consequently, the script will request the needed DEM data from the GeoCubes service. The DEM is processed to produce the slope and aspect layers, needed for computing the perceived temperature. After the computation, the resulting wind chill-affected perceived temperature map is rendered. The orthophoto layer is requested from GeoCubes and dynamically tuned to reflect the snowy winter conditions by applying appropriate image filtering tools. Finally, these two map layers are combined and the resulting “winter map” is returned to the client application. An exemplary map, depicting the area of the Levi ski resort in the Northern Finland and visualized for 3D viewing in a three.js-based web client, is shown in Figure 11.
IX. CONCLUSIONS One of the major obstacles for wider use of geospatial
raster data sets in different research and analysis scenarios is the work required for pre-processing the available data sets. This often involves coordinate reference system transformations, resampling procedures, coding system translations, integration of map sheet-based data files, etc. To facilitate the introduction of geospatial data sets into research processes in a multidisciplinary setting, a harmonized, easy-to-access data storage would be really beneficial. In the GeoCubes Finland initiative, this kind of approach has been taken.
A representative set of geospatial data sets with national coverage has been ingested into the cloud service-based data repository. The pre-processing phase involves operations like rasterizing vector-formatted source data sets, resampling of source data into the set of standardized GeoCubes resolution levels, harmonization of value coding systems between different data set editions, encoding of the resulting raster content into the common cloud-optimized image format and storing it to the cloud repository, both as binary images files and as textual VRT representations.
By storing the raster data sets in multiple resolution levels, the GeoCubes repository can support certain use cases very efficiently. These include interactive visual exploration of on-the-fly analysis results and testing of an analysis procedure on coarse resolution levels before launching an accurate analysis on detailed levels. The result layer of an analysis can be configured as a new GeoCubes content layer and thus be run dynamically by the calling visualization client. The analysis procedure will always select the resolution level closest to the visual scale, thus enabling nearly constant processing times to be maintained.
Further work on the GeoCubes Finland platform will focus on adding new layers to the repository’s data collection, developing modular analysis functions for server-side processing, and enhancing the GeoCubes client applications. More user testing will be carried out to gather feedback and guidance for further development of the platform.
ACKNOWLEDGMENT We made use of computing resources provided by the
Open Geospatial Information Infrastructure for Research (oGIIR, urn:nbn:fi:research-infras-2016072513) funded by the Academy of Finland and CSC – The IT Center for Science Ltd.
REFERENCES [1] L. Lehto, J. Kähkönen, J. Oksanen, and T. Sarjakoski,
“Harmonized Multiresolution Geodata Cube for Efficient Raster Data Analysis and Visualization,” in GEOProcessing 2020: The Twelfth International Conference on Advanced Geographic Information Systems, Applications, and Services, Valencia, Spain, Nov 21-25, 2020, pp. 36–41, Accessed: Dec. 7, 2020. [Online]. Available: https://www.thinkmind.org/index.php?view=article&articleid=geoprocessing_2020_1_60_30055.
[2] P. Baumann, “The Datacube Manifesto,” 2017, Accessed
Dec. 7, 2020 [Online]. Available: https://external.opengeospatial.org/twiki_public/pub/CoveragesDWG/Datacubes/The-Datacube-Manifesto.pdf.
[3] L. Lehto, J. Kähkönen, J. Oksanen, and T. Sarjakoski,
“GeoCubes Finland - A Unified Approach for Managing Multi-resolution Raster Geodata in a National Geospatial Research Infrastructure,” in GEOProcessing 2018: The Tenth International Conference on Advanced Geographic Information Systems, Applications, and Services, Mar. 2018, pp. 18–22, Accessed: Dec. 7, 2020. [Online]. Available: http://www.thinkmind.org/index.php?view=article&articleid=geoprocessing_2018_2_10_30069.
[4] Wikipedia, “Data cube,” 2020. Accessed Dec. 7, 2020.
[Online]. Available: https://en.wikipedia.org/wiki/Data_cube
[5] A. Lewis et al., “Rapid, high-resolution detection of environmental change over continental scales from satellite data – the Earth Observation Data Cube,” International Journal of Digital Earth, vol. 9, no. 1, pp. 106–111, Jan. 2016, doi: 10.1080/17538947.2015.1111952.
[6] U. Pyysalo and T. Sarjakoski, “Voxel Approach to Landscape Modelling,” in The International Archives of the Photogrammetry and Remote Sensing, 2008, pp. 563–568, Accessed: Dec. 7, 2020. [Online]. Available: https://www.semanticscholar.org/paper/Voxel-Approach-to-Landscape-Modelling-Pyysalo/a2074c8487c028670348c6efa051d6590a41e6c8.
[7] G. Giuliani et al., “Building an Earth Observations Data Cube: lessons learned from the Swiss Data Cube (SDC) on generating Analysis Ready Data (ARD),” Big Earth Data, vol. 1, no. 1–2, pp. 100–117, Dec. 2017, doi: 10.1080/20964471.2017.1398903.
[8] P. Baumann, D. Misev, P. Hogan, R. Brackin, K. Thayer, and E. Hirschorn, “Datacube Domain Working Group Carter,” 2017. Accessed Dec. 7, 2020. [Online]. Available:

272
International Journal on Advances in Software, vol 13 no 3 & 4, year 2020, http://www.iariajournals.org/software/
2020, © Copyright by authors, Published under agreement with IARIA - www.iaria.org
https://external.opengeospatial.org/twiki_public/pub/CoveragesDWG/Datacubes/17-071_Datacube-DWG_Charter.pdf
[9] ODC, “Open Data Cube,” 2020. Accessed Dec. 7, 2020. [Online]. Available: https://www.opendatacube.org/
[10] A. Lewis et al., “The Australian Geoscience Data Cube — Foundations and lessons learned,” Remote Sensing of Environment, vol. 202, pp. 276–292, Dec. 2017, doi: 10.1016/j.rse.2017.03.015.
[11] SDC, “Swiss Data Cube (SDC) – EO for monitoring the environment of Switzerland in space and time,” 2020. Accessed Dec. 7, 2020. [Online]. Available: https://www.swissdatacube.org/
[12] Global Partnership for Sustainable Development Data, “Africa Regional Data Cube,” 2020. Accessed Dec. 7, 2020. [Online]. Available: http://www.data4sdgs.org/index.php/initiatives/africa-regional-data-cube
[13] L. Lehto, J. Kähkönen, J. Oksanen, and T. Sarjakoski, “Supporting wide user-base in raster analysis - GeoCubes Finland,” in International Archives of the Photogrammetry, Remote Sensing and Spatial Information Sciences - ISPRS Archives, 2018, vol. 42, no. 4, pp. 397–402, doi: 10.5194/isprs-archives-XLII-4-329-2018.
[14] OGIIR, “Open Geospatial Information Infrastructure for Research,” 2020. Accessed Dec. 7, 2020. [Online]. Available: http://www.geoportti.fi/about/
[15] OGC, “Web Coverage Service,” 2020. Accessed Dec. 7, 2020. [Online]. Available: https://www.ogc.org/standards/wcs
[16] OSGeo, “GeoTIFF,” 2019. Accessed Dec. 7, 2020. [Online]. Available: https://trac.osgeo.org/geotiff/
[17] COG, “Cloud Optimized GeoTIFF,” 2020. Accessed Dec. 7, 2020. [Online]. Available: https://www.cogeo.org/
[18] GDAL, “Geospatial Data Abstraction Library,” 2020. Accessed Dec. 7, 2020. [Online]. Available: https://gdal.org/
[19] MapBox, “Rasterio: access to geospatial raster data — rasterio documentation,” 2020. Accessed Dec. 7, 2020. [Online]. Available: https://rasterio.readthedocs.io/en/latest/
[20] GDAL, “VRT – GDAL Virtual Format,” 2020. Accessed Dec. 7, 2020. [Online]. Available: https://gdal.org/drivers/raster/vrt.html
[21] GDAL, “GDAL Python API,” 2020. Accessed Dec. 7, 2020. [Online]. Available: https://gdal.org/python/
[22] NumPy, “NumPy - The fundamental package for scientific computing with Python,” 2020. Accessed Dec. 7, 2020. [Online]. Available: https://numpy.org/
[23] L. Lehto, J. Kähkönen, J. Oksanen, and T. Sarjakoski, “Flexible Access to a Harmonised Multi-resolution Raster Geodata Storage in the Cloud,” in GEOProcessing 2019: The Eleventh International Conference on Advanced Geographic Information Systems, Applications, and Services, Feb. 2019, pp. 26–28, Accessed: Dec. 7, 2020. [Online]. Available: http://www.thinkmind.org/index.php?view=article&articleid=geoprocessing_2019_2_20_30054.
[24] M. Rouse, “What is a RESTful API (REST API) and How Does it Work?,” 2020. Accessed Dec. 7, 2020. [Online]. Available: https://searchapparchitecture.techtarget.com/definition/RESTful-API
[25] M. Bostock, “D3.js - Data-Driven Documents,” 2020. Accessed Dec. 7, 2020. [Online]. Available: https://d3js.org/
[26] Django Software Foundation, “The Web framework for perfectionists with deadlines | Django,” 2020. Accessed Dec 7, 2020. [Online]. Available: https://www.djangoproject.com/
[27] QGIS, “QGIS Plugins,” 2020. Accessed Dec. 7, 2020. [Online]. Available: https://plugins.qgis.org/
[28] R. Light, “Mosquitto: server and client implementation of the MQTT protocol,” Journal of Open Source Software, vol. 2, no. 13, p. 265, 2017, doi: 10.21105/joss.00265.
[29] QGIS, “QGIS - A Free and Open Source Geographic Information System,” 2020. Accessed Dec. 7, 2020. [Online]. Available: https://qgis.org/en/site/
[30] QGIS, “Qgis2threejs Plugin Document — Qgis2threejs Plugin 2.4 documentation,” 2020. Accessed Dec. 7, 2020. [Online]. Available: https://qgis2threejs.readthedocs.io/en/docs/index.html
[31] threejs, “three.js – JavaScript 3D library,” 2020. Accessed Dec. 7, 2020. [Online]. Available: https://threejs.org/

273
International Journal on Advances in Software, vol 13 no 3 & 4, year 2020, http://www.iariajournals.org/software/
2020, © Copyright by authors, Published under agreement with IARIA - www.iaria.org
Figure 11. A perceived temperature “winter map” presented for 3D viewing in a three.js-based web client. The areas with red stripes are on the shelter side of the hill, whereas the areas with blue stripes represent chilly slopes, exposed to wind. The orientation of the stripes indicates the direction of the wind and their
density the level of the shelter/exposure effect.

274
International Journal on Advances in Software, vol 13 no 3 & 4, year 2020, http://www.iariajournals.org/software/
2020, © Copyright by authors, Published under agreement with IARIA - www.iaria.org
Facial Mimicry Analysis Based on 3D Morphable Face Models
Oky Dicky Ardiansyah Prima, Yuta Ono, Hisayoshi Ito
Grad. School of Soft. and Inf. Sci., Iwate Pref. Univ.Takizawa, Japan
email: {prima, hito}@iwate-pu.ac.jp, [email protected]
Takahiro TomizawaHitachi Ind. & Ctrl. Solutions
Yokohama, Japanemail: Takahiro.tomizawa.ax
@hitachi.com
Takashi ImabuchiOffice of Regional Collaboration,
Iwate Pref. Univ.Takizawa, Japan
email: [email protected]
Abstract—Facial mimicry is an important non-verbal communication that can promote favorable social behavior and positive relationships. As recent computer vision technologies have reached the level of human perception for processing facial information, the study of automated analysis of facial mimicry has attracted the attention of the Human Computer Interaction (HCI) society. In this study, we propose a system to evaluate the similarity of facial images based on the shape of the face derived from 3-Dimensional (3D) face data. Two different 3D face data were used in this study: a 3D Digital Character (3DDC) and the Surrey 3D Morphable Face Model (3DMFM). Our approach consists of the following steps: (1) landmark extraction from the facial image; (2) 3D shape fitting; (3) similarity analysis for the face point cloud. Our results show that the similarity between faces can be assessed by analyzing the non-rigid portions of the faces. The proposed system can be extended as a facial mimicry training tool to improve social communication.
Keywords-mimicry; expression training; emotion; image processing.
I. INTRODUCTION
People often consciously or unconsciously mimic the facial expressions of their conversation partners. This type of non-verbal communication is important in providing additional information beyond verbal communication. This study extends our previous research on a facial mimicry training based on 3-Dimensional (3D) morphable face models [1]. Non-verbal communication refers to communication methods without using languages, such as gestures, facial expressions, tone of voice, eye contact, and posture. Unconscious mimicry increases affiliation, which helps to foster relationships with others [2].
Facial expressions involve signals of a larger communicative process, conveying the focus of attention, intention, motivation, and emotion. For instance, a smile with the corners of the mouth turned up to expose the front teeth may express joy. A frown, typically with the corners of the mouth turned down, forms an expression of disapproval.Some researchers believe that emotions are a universal construct. However, differences in culture can lead to differences in the absolute level of intensity of emotions [3].
The FACS (Facial Action Coding System), which is a set of facial muscle movements corresponding to displayed emotions, is a traditional measure for analyzing facial expressions [3]. The movements of individual facial muscles
are encoded by FACS from slightly different instantaneous changes in facial appearance. Each action unit (AU) is described in the FACS manual.
Manual coding of video recordings of participants according to the units of action described by FACS takes a significant amount of time and effort. Automatic analysis of facial expressions has received a great attention from the computer vision community. Bartlett et al. (1999) made an early attempt to automate facial expressions using FACS by applying computer image analysis to classify the basic elements that comprise complex facial movements [4]. Using template matching to detect facial features, such as lips, eyes, brows and cheeks, Tian et al. (2000) developed an Automatic Face Analysis (AFA) system [5], which recognizes changes in facial expression into AUs.
Recent computer vision technology has made it possible to perform conventional face recognition processes such as face detection, face matching, facial feature extraction, and facial expression classification in real time. Baltrušaitis et al. (2018) developed an open source facial behavior toolkit, OpenFace 2.0. This toolkit uses a linear kernel support vector machine to detect facial expressions by detecting the unit of motion (AU) of the face [6]. iMotions [7] is a commercial tool for automatic analysis of facial expressions. The tool allows the user to select the FACET [8] or AFFDEX [9]algorithm for facial expression recognition.
In contrast to the growing interest in the application of automated facial expression analysis, there have been surprisingly few attempts to measure the similarity of facial expressions. In our previous work, we used a deformable 3DDigital Character (3DDC) to find the most similar shape to a given facial image [1]. The similarity of the faces was measured by calculating the relationship between the 3D point clouds obtained from each face.
In this study, we extend our previous work to evaluate the similarity of facial images based on the shape of the face derived from two different face data: a 3DDC [10] and the Surrey 3D Morphable Face Model (3DMFM) [11]. We fit these models to the corresponding facial images and derive the facial features that are important for similarity analysis.
The rest of this paper is organized as follows. Section II discusses known approaches to facial expression imitation. Section III introduces our proposed facial mimicry analysis system. Section IV shows our experiment results. Finally, Section V gives a short conclusion and highlights the most important outcomes of this paper.

275
International Journal on Advances in Software, vol 13 no 3 & 4, year 2020, http://www.iariajournals.org/software/
2020, © Copyright by authors, Published under agreement with IARIA - www.iaria.org
II. RELATED WORK
Measuring the degree of similarity between facial images is an important task in the field of face recognition. Many studies have used dimensional reduction techniques between feature representations to infer similarity. These studies include Eigenfaces [12] and Fisherfaces [13], which have been used in traditional face recognition.
An attempt to construct a facial similarity map was made by Holub et al. (2007). This map was calculated based on Triplets [14]. The resulting map demonstrated that the resulting map can effectively create a metric space that preserves notions of facial similarity.
The drawback of existing automatic facial expression recognition methods is that most of them focus on AU detection. Sadovnik et al. (2018) suggested that face recognition and face similarity are correlated, but the two are inherently different [15]. Since similarity in facial images can be recognized even when they are not the same person, there is a need to build a new dataset corresponding to the similarity of facial expressions. Vemulapalli and Agarwala (2019) built a large faces-in-the-wild dataset that labels facial expressions based on human visual preferences [16] and visualized the similarity of faces using t-SNE [17].
As described above, many studies have analyzed face similarity using 2-Dimensional (2D) facial images. However,
Figure 2. Generation of 3D face data for this study. Figure 3. The experiment setup in this study.
FacialImage
LandmarkExtraction
Shape-to-landmark Fitting (3DDC)
Shape-to-landmark Fitting (3DMFM)
3D Face3D Face
50cmDisplay
Expression Intensity0.25 0.5 0.75 1.0
Joy
Surprise
Figure 1. Some facial expressions generated using 3DDC.

276
International Journal on Advances in Software, vol 13 no 3 & 4, year 2020, http://www.iariajournals.org/software/
2020, © Copyright by authors, Published under agreement with IARIA - www.iaria.org
only few studies have used 3D facial images. Moorthy et al. (2010) extracted Gabor features from automatically detected fiducial points of texture images from the 3D face and demonstrate that these features correlate well with human judgements of similarity [18].
After Blanz and Vetter (1999) introduced a 3DMFM as a general face representation and a principled approach to image analysis [19], 3DMFM have incorporated into many solutions for facial analysis. 3DMFM generates a 3D face data from a given facial image and modifying the shape and texture in a natural way using its Principal Component Analysis (PCA) model of face shape and color information.
Huber et al (2016) have made a publicly available 3DMFM, accompanied by their open-source software framework [11].
Another technique to generate an associate 3D face datafrom a given facial image is the deformation transfer. It is a well-recognized technique in computer graphics that creates expressive and plausible animations. Sumner and Popović (2004) proposed deformation transfer for triangle meshes, where the cloning process does not require the source and the target model to share several vertices or triangles [10]. Prima et al. (2020) demonstrated deformations of faces based on their expressions [1] as an initial attempt to measure similarity of pairs of 3D faces (Figure 1).
FacialActions
Target FacesMimicry
Subject I Subject II Subject III Subject IV
A
B
C
D
2
E
F
Figure 4. The target face and facial mimicry performed by each subject.

277
International Journal on Advances in Software, vol 13 no 3 & 4, year 2020, http://www.iariajournals.org/software/
2020, © Copyright by authors, Published under agreement with IARIA - www.iaria.org
To fit a 3D face data into a facial image, some points of the model need to be associated to the corresponding 2D landmark points in the facial image. Extracting landmark points from facial images can be done using automated facial landmarks tools, such as Dlib library [20]. Those 2D landmark points are mapped into the 3D face data using a shape-to-landmarks fitting method [21].
III. FACIAL MIMICRY ANALYSIS
Our attempt to analyze the facial mimicry of a pair of facial images takes three steps. The first step is to generate 3D face data from the facial images. The resulting 3D face data is then registered in a common 3D coordinate space. The
second step is to sampling point clouds from the 3D face data.In the last step, we verify the similarity of the faces by analyzing the point clouds that correspond to each face. Each of these steps is described below.1) STEP 1: Generation of 3D Face Data
Here, 3DDC and 3DMFM were generated from the input face images, respectively. Figure 2 shows the flow for generating the 3D face data in this study. At first, 68 facial landmark points were extracted from the face image using the Dlib library. The 3D face data was then fitted to these landmark points to generate 3D face data that represents the original face image. For the 3DDC, the shape-to-landmark
Figure 5. Differences in distance between the point clouds of 3DDC for the target face and the mimetic face of subject I.
A B C D E F
A
B
C
D
E
F
Subject
Targ
etlow high

278
International Journal on Advances in Software, vol 13 no 3 & 4, year 2020, http://www.iariajournals.org/software/
2020, © Copyright by authors, Published under agreement with IARIA - www.iaria.org
calculation was performed by solving the Perspective-n-Point (PnP) problem and deformation transfer [10]. The resulting rotation vector from the PnP were applied to the 3DDC so that the 3DDC was oriented the same as the input facial image. For the 3DMFM, pose estimation and shape fitting was performed using a lightweight 3DMFM fitting library, “eos” [22]. The generated 3D face data is saved in OBJ file format.2) STEP 2: Point Cloud Extraction
We extracted point clouds from the resulting 3D face data obtained from the previous step. Open3D [23], an open-source library for analyzing 3D data, was used for this
purpose. Sampling was done uniformly from the 3D surface based on the triangle area. Here, due to the different scales of 3DDC and 3DMFM, the sampling interval was adjusted to have the same number of sampling data from both face data.3) STEP 3: Similarity Analysis
In order to analyze the similarity between facial images, the distance of each point on the original face was calculated to determine the distance to the target face. The internal functions of Open3D were used to calculate the distance.Here, the shorter the distance, the more similar the faces are.
Figure 6. Differences in distance between the point clouds of 3DMFM for the target face and the mimetic face of subject I.
A B C D E F
A
B
C
D
E
F
Subject
Targ
et
low high

279
International Journal on Advances in Software, vol 13 no 3 & 4, year 2020, http://www.iariajournals.org/software/
2020, © Copyright by authors, Published under agreement with IARIA - www.iaria.org
Considering that the non-rigid motion of the face is dominant when mimicking the opponent's face, we cropped the mouth and analyzed the correlation between the point clouds of this area.
IV. RESULT
Four male subjects (mean age 20.6 years) were recruited for the experiments. All subjects agreed to participate and signed the consent forms, to allow their data to be used in publications of this study. The room was set up with a table and stool for the subjects. On the table was a laptop computer that was used to display the target face to be mimicked by the subject. The monitor resolution was set at 1,440 × 900 and the refresh rate was 60 Hz. The subject was seated at approximately 50 cm from the laptop. Figure 3shows the experimental setup in this study.
Subjects completed one practice block followed by six experimental blocks. For every block, a target face to mimic was displayed on the laptop. Subjects were asked to press the space button on the keyboard when they best imitate the target's face image. By pressing this button, the computer's built-in camera will take a picture of the subject's face.Finally, subjects were debriefed by the experimenter about the purpose of the study. Figure 4 shows the target face and facial mimicry performed by each subject. Subjects areimitating not only the facial expression of the target, but also the head posture of the target face.1) Differences in distance between the 3D face data
3DDC and 3DMFM were used to generate 3D face data for target and mimetic faces. The difference in distance between the point clouds of 3D face data for the target face and the mimetic face of each subject was calculated. In order
to be able to compare the two data correctly, we performed frontalization to each 3D face data in advance.
Figures 5 and 6 show the calculation results for 3DDC and 3DMFM of subject I, respectively. The colors indicate the degree of difference between the target face and the imitated face. Ideally, there will be the least difference between the two 3D face data in the right downward diagonal direction. In Figure 5, no facial actions yield the most similar (least different) results in that direction.However, in Figure 6, facial action: D, E, and F (dotted rectangles) were found to be the most similar between pairs, indicating subject I properly mimic the given three target faces.
In the case of the 3DDC face data, there are large differences in non-rigid areas such as the forehead, cheeks, eyebrows, and mouth. Similar results were seen in the 3DMFM face data, but the color distribution appeared to be less. Interestingly, there were significant differences at around the area of the nose, which is the rigid area. To figure out what caused these differences, we observed the 3D face data generated from the same person but in different headposes.
Figure 7 shows the 3D face data generated from the two target faces: B and E. As described in the previous section, we applied the initial 3DMFM to these faces using the shape-to-landmark method. However, after the 3D face data was frontalized, the difference in the shape of the nose are observable even in the same person's face. This suggests that the resulting frontalized face data contain some degree of distortion. Therefore, 3DMFM may not be supposed to generate 3D facial data with extreme head postures. This drawback also applies to 3DDC.
Figure 7. Distortions around the nose after the face frontalization.(from left: 3DMFM aligned to the target face, face cropping, face frontalization (isomap), and distortion at the nose)
Facial actions: E
Facial actions: B

280
International Journal on Advances in Software, vol 13 no 3 & 4, year 2020, http://www.iariajournals.org/software/
2020, © Copyright by authors, Published under agreement with IARIA - www.iaria.org
Figure 8 shows the difference in distance between the 3DDC of the subject faces and the 3DDC of the mimetic faces of all subjects. Similarly, Figure 9 shows the difference in distance between the 3DMFM of the subject faces and the 3DMFM of the mimetic faces of all subjects. Values were standardized to enable comparison among different data sources: 3DDC and 3DMFM. These values were colored in three levels to make them visually distinguishable. The values surrounded by dotted rectangles indicate the smallest difference between the presented face image and the imitated face image. To summarize, the 3DMFM sees that subjects I and III imitated the target faces of C, D and E, whereas, subject II imitated the target faces of B, C and E.Unfortunately, we were not able to see the suitability of facial mimicry in 3DDC just by calculating the difference in distance of the 3D face data. Overall, these results indicated that measuring the similarity between two 3D face data based solely on the differences between them is not sufficient.2) Correlation Analysis between the 3D face data
For a more detailed analysis, we analyzed the similarity between two 3D facial data for point clouds in and around the mouth. Here, since the 3DDC is a complete head model,
a 3D bounding box was needed to crop the mouth region. Open3D was used to perform this task.
Table I shows the correlations between the target face and the mimetic face in the mouth region of 3DDC for all subjects, whereas Table II shows the correlations in the mouth region of 3DMFM. In the 3DDC, the correlation was highest when the subject's facial expression was the same as that of the presenting face (values surrounded by a square on the diagonal). However, it might be difficult to assess facial mimicry solely based on this value because of the overall high values of the correlation coefficients in all data, as shown in Table I. On the other hand, the values of correlation coefficients obtained from the 3DMFM varied, but the correlation coefficients were found to be high when the target face's facial action were consistent with those of the subject. This finding indicates that 3DMFM is more suitable than 3DDC for evaluating facial mimicry.3) Perceptual Judgment
In order validate the resulted facial mimicry performed by each subject, a 5-point Likert scale was used to gauge similarity. A value of 1 indicated that the two faces were completely dissimilar, while a value of 5 indicated that the two faces being compared were identical. Ten independent
Figure 8. Differences in distance among 3DDC of the target faces and the mimetic faces of all subjects.
A 1.54 1.82 0.31 0.24 0.84 0.93 A 0.63 0.82 2.66 2.31 0.99 0.31
B 0.96 2.92 0.59 0.48 1.37 1.72 B 1.29 1.73 2.01 1.48 0.76 0.62
C 1.11 2.10 0.97 0.35 0.64 1.32 C 1.04 1.05 1.99 1.98 0.50 0.98
D 1.79 1.49 0.75 0.41 0.01 0.52 D 0.35 0.29 2.89 2.66 1.20 0.76
E 1.53 1.84 0.59 0.33 0.53 0.87 E 0.49 0.70 2.56 2.31 0.95 0.56
F 0.46 5.23 2.60 2.45 3.40 3.75 F 3.41 3.98 1.02 0.06 1.59 2.63
A B C D E F A B C D E F
A 0.25 0.73 1.60 0.30 0.20 1.14 A 2.67 0.68 1.03 1.35 0.57 1.37
B 0.00 1.65 2.49 0.58 0.60 0.71 B 1.85 1.52 0.48 0.96 0.80 0.96
C 0.21 0.96 1.67 0.98 0.53 0.49 C 2.25 1.16 1.31 0.43 0.44 0.44
D 0.41 0.46 0.96 0.75 0.18 1.07 D 3.09 0.53 1.47 1.10 0.33 1.11
E 0.11 0.69 1.46 0.57 0.06 0.95 E 2.71 0.79 1.14 1.06 0.39 1.07
F 1.97 3.88 4.65 2.63 2.76 1.31 F 0.15 3.50 1.52 1.46 2.68 1.47
A B C D E F A B C D E F
Targ
et
Targ
et
Subject I Subject II
Targ
et
Targ
et
Subject III Subject IV

281
International Journal on Advances in Software, vol 13 no 3 & 4, year 2020, http://www.iariajournals.org/software/
2020, © Copyright by authors, Published under agreement with IARIA - www.iaria.org
raters were asked to rate the similarity between their faces and the presented faces shown in Figure 4. The raters were instructed to focus on the three areas of the eyebrows, eye shape, and mouth, which varied greatly.
To evaluate whether there was a difference in the meanscore on the perceived similarity of pairs of faces, we conducted a one-way ANOVA. The means and standard deviations are shown in Table III. These results showed that there was a significant effect of the type of the facial action on the perceptual judgment level for the six conditions [F(5, 234) = 2.25, p < 0.01]. The target face and the face imitated by the subject were perceived to be similar, except for the facial action C.
V. CONCLUDING REMARKS
In this study, we extended our previous work to assess the similarity of pairs of 3D face data by using differences in the distance and correlation of point clouds in the 3D face data. The face data use in our study was generated using deformable 3-Dimensional Digital Character (3DDC) and the Surrey 3-Dimensional Morphable Face Model (3DMFM). We utilized the deformation transfer technique to clone the subject’s facial movements into the 3DDC when mimicking a given facial image. The 3DMFM allows for a closer
correspondence between the points, rather than only a set of facial feature points as in 3DDC.
To analyze the similarity of pairs of 3D face data, all 3D face data generated in this study were frontalized. We believed that comparison of faces can be made more effective by using a face-frontal view. However, while analyzing the experimental data, we noticed that some facial parts were distorted by this process. Therefore, we suggest that we need to be aware of this distortion when generating 3D facial data with extreme head posture.
Our experimental results show that measuring similarity using only the differences between point clouds of 3D face data is not sufficient. However, for the non-rigid part of the face, the similarity between the two 3D facial data can be measured by performing correlation analysis.
The proposed system can be extended as a face imitation training tool to improve social communication. Using this tool, users can practice imitating faces from photographs by referring to the differences in the reconstructed 3D facial data.
ACKNOWLEDGMENT
This work was supported by the grant of the Iwate Prefectural University's strategic project. We also thank the
Figure 9. Differences in distance among 3DMFM of the target faces and the mimetic faces of all subjects.
A 0.31 0.35 1.38 2.08 0.49 4.55 A 1.02 0.62 2.40 1.64 0.67 3.19
B 0.16 0.37 1.22 1.75 0.66 3.92 B 0.77 0.42 1.99 1.32 0.96 2.72
C 1.69 2.23 1.05 1.44 2.71 1.55 C 1.00 1.33 0.39 0.40 3.10 0.28
D 2.32 2.78 1.52 0.81 3.20 3.37 D 1.70 1.95 2.11 1.47 3.59 2.19
E 1.21 0.66 2.67 3.23 0.51 5.03 E 1.80 1.39 3.12 2.76 0.00 4.02
F 2.06 2.63 1.29 1.56 2.99 1.65 F 1.41 1.75 0.81 0.67 3.36 0.39
A B C D E F A B C D E F
A 1.07 0.19 2.10 1.63 0.89 2.37 A 1.41 0.59 0.93 0.99 0.89 1.97
B 0.78 0.31 1.67 1.34 1.23 1.94 B 1.14 0.74 0.87 0.76 0.91 1.63
C 0.77 2.22 0.33 1.52 3.42 0.71 C 1.24 2.53 2.12 1.11 2.00 1.08
D 1.68 2.65 2.01 1.25 3.78 2.26 D 2.17 2.88 2.52 1.78 2.39 2.21
E 2.18 0.80 2.87 2.60 0.18 3.07 E 2.13 0.76 1.36 1.97 1.41 2.74
F 1.09 2.56 0.71 1.67 3.68 1.13 F 1.58 2.91 2.35 1.42 2.26 1.49
A B C D E F A B C D E F
Targ
et
Subject I
Targ
et
Subject II
Subject III Subject IV
Targ
etTa
rget

282
International Journal on Advances in Software, vol 13 no 3 & 4, year 2020, http://www.iariajournals.org/software/
2020, © Copyright by authors, Published under agreement with IARIA - www.iaria.org
editor and three anonymous reviewers for their constructive comments, which helped us to improve the manuscript.
REFERENCES
[1] O. D. A. Prima, H. Ito, T. Tomizawa, and T. Imabuchi, “Facial Mimicry Training Based on 3D Morphable Face Models,” The Thirteenth International Conference on Advances in Computer-Human Interactions, ACHI 2020, pp. 57-60, 2020.
[2] J. L. Lakin, V. E. Jefferis, C. M. Cheng, and T. L. Chartrand,“The Chameleon Effect as Social Glue: Evidence fot the Evolutionary Significance of Nonconscious Mimicry,”Journal of Nonverbal Behavior, 27(3), pp. 145–162, 2003.
[3] P. Ekman et al., “Universals and Cultural Differences in the Judgments of Facial Expressions of Emotion,” Journal of Personality and Social Psychology, 53(4), pp. 712-717, 1987.
[4] M. S. Bartlett, J. C. Hager, P. Ekman, and T. J. Sejnowski, “Measuring Facial Expressions by Computer Image Analysis,” Psychophysiology, Cambridge University Press, 36(2), pp.253–263, 1999.
[5] Y. L. Tian, T. Kanade, and J. F. Cohn, “Recognizing Lower Face Action Units for Facial Expression Analysis.” Proceedings - 4th IEEE International Conference on
Automatic Face and Gesture Recognition, FG 2000, 23(2), pp.484–490, 2000.
[6] T. Baltrusaitis, A. Zadeh, Y. C. Lim, and L-P. Morency, “OpenFace 2.0: Facial Behavior Analysis Toolkit,” IEEE International Conference on Automatic Face and Gesture Recognition, 2018.
[7] iMotions, https://imotions.com/ [retrieved: August 31, 2020][8] G. Littlewort et al., "The computer expression recognition
toolbox (CERT)," Face and Gesture 2011, Santa Barbara, CA, 2011, pp. 298-305, doi: 10.1109/FG.2011.5771414.
[9] D. McDuff et al., “AFFDEX SDK: A Cross-Platform Real-Time Multi-Face Expression Recognition Toolkit,”
TABLE I. CORRELATIONS BETWEEN THE TARGET FACE AND THE MIMETIC FACE IN THE MOUTH REGION OF 3DDC.
TABLE II. CORRELATIONS BETWEEN THE TARGET FACE AND THE MIMETIC FACE IN THE MOUTH REGION OF 3DMFM.
A B C D E F A B C D E FA 0.99 0.91 0.88 0.9 0.87 0.92 A 0.99 0.67 0.71 0.68 0.6 0.66B 0.91 0.99 0.89 0.92 0.89 0.93 B 0.67 0.99 0.68 0.76 0.74 0.59C 0.89 0.91 0.99 0.93 0.92 0.93 C 0.74 0.66 0.99 0.69 0.6 0.77D 0.91 0.93 0.93 0.99 0.92 0.93 D 0.68 0.73 0.71 0.99 0.69 0.62E 0.87 0.9 0.92 0.93 0.99 0.92 E 0.61 0.76 0.61 0.73 0.99 0.44F 0.89 0.93 0.91 0.91 0.9 0.99 F 0.76 0.68 0.79 0.68 0.56 0.97
A B C D E F A B C D E FA 0.99 0.91 0.88 0.89 0.85 0.91 A 0.99 0.68 0.73 0.69 0.64 0.72B 0.91 0.99 0.89 0.91 0.87 0.93 B 0.67 0.99 0.70 0.77 0.76 0.66C 0.89 0.91 0.98 0.92 0.91 0.93 C 0.75 0.68 0.99 0.69 0.64 0.78D 0.91 0.92 0.93 0.99 0.91 0.92 D 0.68 0.74 0.73 0.99 0.72 0.68E 0.87 0.9 0.93 0.93 0.99 0.91 E 0.60 0.75 0.65 0.75 0.99 0.53F 0.89 0.93 0.91 0.9 0.88 0.99 F 0.77 0.70 0.78 0.68 0.6 0.99
A B C D E F A B C D E FA 0.99 0.92 0.89 0.91 0.87 0.91 A 0.98 0.69 0.71 0.7 0.65 0.64B 0.91 0.99 0.90 0.92 0.89 0.93 B 0.66 0.99 0.68 0.74 0.77 0.56C 0.90 0.91 0.99 0.93 0.92 0.93 C 0.75 0.68 0.99 0.73 0.64 0.75D 0.92 0.93 0.93 0.99 0.92 0.92 D 0.68 0.74 0.71 0.99 0.72 0.6E 0.88 0.9 0.93 0.93 0.99 0.91 E 0.58 0.75 0.62 0.70 0.99 0.41F 0.9 0.93 0.92 0.91 0.9 0.99 F 0.77 0.71 0.78 0.72 0.6 0.96
A B C D E F A B C D E FA 0.99 0.91 0.9 0.9 0.85 0.91 A 0.93 0.72 0.73 0.72 0.67 0.72B 0.91 0.99 0.90 0.91 0.88 0.93 B 0.61 0.98 0.69 0.76 0.76 0.66C 0.89 0.90 0.99 0.93 0.91 0.93 C 0.76 0.73 0.99 0.75 0.72 0.79D 0.91 0.92 0.94 0.99 0.91 0.92 D 0.64 0.75 0.72 0.99 0.74 0.68E 0.87 0.90 0.93 0.93 0.99 0.91 E 0.51 0.72 0.63 0.72 0.94 0.53F 0.89 0.92 0.92 0.90 0.89 0.99 F 0.79 0.76 0.79 0.74 0.67 0.99
Subject III
Targ
et
Subject IV
Targ
et
Subject I
Targ
et
Subject II
Targ
et
Subject I
Subject II
Subject III
Subject IV
Targ
etTa
rget
Targ
etTa
rget
TABLE III. THE MEANS AND STANDARD DEVIATIONS OF THE PERCEPTUAL JUDGEMENT.
FACIAL ACTION
A B C D E F
MEAN(STDEV)
2.9(1.16)
3.3(1.10)
2.2(1.19)
4.2(0.94)
4.0(0.88)
3.8(1.07)

283
International Journal on Advances in Software, vol 13 no 3 & 4, year 2020, http://www.iariajournals.org/software/
2020, © Copyright by authors, Published under agreement with IARIA - www.iaria.org
Conference on Human Factors in Computing Systems, pp. 3723–3726, 2016. https://doi.org/10.1145/2851581.2890247
[10] R. W. Sumner and J. Popović, “Deformation Transfer for Triangle Meshes,” ACM Transactions on Graphics, 23(3), pp. 399-405, 2004.
[11] P. Huber et al., “A Multiresolution 3D Morphable Face Model and Fitting Framework,” 11th International Joint Conference on Computer Vision, Imaging and Computer Graphics Theory and Applications, pp. 79–86, 2016.
[12] M. A. Turk and A. P. Pentland. Face Recognition Using Eigenfaces. In Computer Vision and Pattern Recognition, 1991. Proceedings CVPR’91., IEEE Computer Society Conference on, pp. 586–591. IEEE, 1991.
[13] P. N. Belhumeur, J. P. Hespanha, and D. J. Kriegman, “Eigen faces vs. Fisherfaces: Recognition using class specific linear projection,” IEEE Transactions on pattern analysis and ma-chine intelligence, 19(7), pp. 711–720, 1997.
[14] A. Holub, Y. Liu, and P. Perona, “On Constructing Facial Similarity Maps,” IEEE Computer Society Conference on Computer Vision and Pattern Recognition, pp. 17–22, 2007.
[15] A. Sadovnik, W. Gharbi, T. Vu, and A. Gallagher, “Finding Your Lookalike: Measuring face similarity rather than face identity,” IEEE Computer Society Conference on Computer Vision and Pattern Recognition Workshops, pp. 2235–2353, 2018.
[16] R. Vemulapalli and A. Agarwala, “A Compact Embedding for Facial Expression Similarity,” Proceedings of the IEEE
Computer Society Conference on Computer Vision and Pattern Recognition, pp. 5683–5692, 2019.
[17] V. D. M. Laurens and G. Hinton, “Visualizing Data Using t-SNE” Journal of Machine Learning Research, 9, pp. 2579–2605, 2008.
[18] A. K. Moorthy, A. Mittal, S. Jahanbin, K. Grauman and A. C. Bovik, “3D Facial Similarity: Automatic Assessment Versus Perceptual Judgments,” 2010 Fourth IEEE International Conference on Biometrics: Theory, Applications and Systems (BTAS), Washington, DC, pp. 1-7, 2010.
[19] V. Blanz and T. Vetter, “A Morphable Model for the Synthesis of 3D Faces,” In ACM Transactions on Graphics (Proceedings of SIGGRAPH), pp. 187–194, 1999.
[20] V. Kazemi and J. Sullivan, “One Millisecond Face Alignment with an Ensemble of Regression Trees,” Proceedings of the IEEE Conference on Computer Vision and Pattern Recognition, pp. 1867–1874, 2014.
[21] O. Aldrian and W. A. P. Smith, “Inverse Rendering of Faces with a 3D Morphable Model,” IEEE Transactions on Pattern Analysis and Machine Intelligence, 35(5), pp. 1080–1093, 2013.
[22] eos: A Lightweight Header-Only 3D Morphable Face Model fitting library in modern C++11/14.https://github.com/patrikhuber/eos[retrieved: August 31, 2020]
[23] Open3D, http://www.open3d.org/ [retrieved: August 31, 2020]

284
International Journal on Advances in Software, vol 13 no 3 & 4, year 2020, http://www.iariajournals.org/software/
2020, © Copyright by authors, Published under agreement with IARIA - www.iaria.org
A Pointing Device for 3D Interactive Spherical Displays
Oky Dicky Ardiansyah Prima, Katsuyoshi Hotta, Rintaro Takahashi, Hisayoshi Ito Graduate School of Software and Information Science, Iwate Prefectural University
152-52 Sugo Takizawa, Japan email: [email protected] { g236q004, g231r019 }@s.iwate-pu.ac.jp, [email protected]
Abstract—Three-Dimensional (3D) displays have been developed to allow users to view 3D objects from any angle. There are several input interfaces for interacting with this display, such as joysticks and gesture interfaces. However, in order to properly interact with the 3D objects in the display, the input interface needs to obtain its own 3D location from the 3D tracking device. In this study, we propose a low-cost pointing device for a 3D interactive display using an infrared camera and a smartphone instead of a 3D tracking device. The camera is set up at the bottom of the display to detect the contact point between the pointing device and the display surface. The pointing device gets its 3D orientation from the smartphone's built-in Inertial Measurement Unit (IMU). The proposed pointing device enables the user to see the auxiliary line from the device tip from different angles. We demonstrated some 3D pointing applications, such as selecting objects inside the display to show the usability of the proposed pointing device.
Keywords-VR; 3D stylus; spherical display; virtual reality; perception.
I. INTRODUCTION
The increasing use of Three-Dimensional (3D) contents in the media and entertainment industry is providing a catalyst for the development of devices to effectively represent and interact with this content. This study extends our previous research on a 3D pointing device [1]. Over the past decade, this new development has boosted and refreshed interest in Virtual Reality (VR). VR devices such as the Oculus Rift and HTC Vive [2], which are capable of full-body tracking, provide users with a natural interaction with 3D contents in a virtual space.
Apart from VR devices, the development on 3D displays has taken a big step forward with the introduction of light field displays. These displays are generally intended to create motion parallax and stereoscopic disparity, allowing the observer to perceive the scene in 3D without the need to wear obtrusive glasses [3]. Looking Glass [4] is a currently available holographic display system that generates 45 distinct views of a 3D scene using the light field technique. In the future, rapid advances in electronics, optics and photonics are bringing more true 3D display technologies to the market [5].
Another attempt to achieve true 3D representation is the use of non-planar displays instead of flat displays. 3D Spherical Display (3DSD) has an advantage on representing 3D objects to be seen from any angle. SnowGlobe [6] and Spheree [7] were developed as perspective-corrected 3DSDs based on a non-planar Two- to Three-Dimensional (2D-to-
3D) mapping technique. SnowGlobe uses a single projector and a hemispherical mirror to reflect the image onto the display surface. In contrast, Spheree uses multiple calibrated projectors to project the image directly onto the display surface. Both displays use a 3D tracking device to track the location of the user's head relative to the display, providing a motion-parallax-corrected perspective of the objects on the display. CoGlobe [8][9][10], an upgrade of the Spheree, supports two users to view 3D contents from each own viewpoint using modified active shutter glasses. 3DSDs may have overcome the limited situation awareness of headset VR.
3DSDs can be equipped with a touch interface by optically tracking the user’s rear illuminated fingers that appear as blob images when touching the display surface [11]. Each center of the blob has a 3D coordinate (x, y, z) originating from the center of the 3DSD. CoGlobe demonstrated several 3D games using 3D pointing devices such as pointing devices and rackets. The OptiTrack system [12] tracked the 3D location and orientation (x, y, z, pitch, yaw, roll) of multiple passive reflective markers attached to those devices. Hereinafter, the information about the 3D location and orientation is simply referred to as Six-Degree of Freedom (6DoF). This system also uniquely identified and labeled each group of markers attached to each device.
Attaching multiple reflective markers to a pointing device can degrade its functionality. In addition, in order to estimate the 6DoF, those markers needed to be connected to each other like branches, which increased the shape of the pointing device and made it difficult to use. Instead of reflective markers, Augmented Reality (AR) markers can be used to estimate the 6DoF of a pointing device, such as the DodecaPen [13]. However, due to the shape of the 3DSD, the pointing device is often hidden from the camera used to track the AR markers, making it impossible to estimate the 6DoF.
In this study, we propose a pointing device suitable for a spherical display by using a touch interface to acquire the 3D location and an Inertial Measurement Unit (IMU) to acquire the orientation. The orientation data is calibrated using the Motion Platform and the corrected data is sent to the computer controlling the 3DSD and combined with the 3D location obtained from the touch interface.
The rest of this paper is organized as follows. In section II, we describe the 3DSD hardware and software developed for this study. Section III introduces our approach to implement the pointing device. Section IV describes our experiment results. Section V discusses about the further enhancements to the proposed pointing device. Finally, Section VI presents our conclusions and future works.

285
International Journal on Advances in Software, vol 13 no 3 & 4, year 2020, http://www.iariajournals.org/software/
2020, © Copyright by authors, Published under agreement with IARIA - www.iaria.org
II. THE 3D SPHERICAL DISPLAY FOR THIS STUDY A 3DSD was created for this study using a single projector.
Figure 1(a) shows the hardware design of the 3DSD. We used a spherical acrylic lighting case (acrylic globe) as the display material. The interior of the display was painted with rear-projection acrylic paint, so that images projected from inside are visible from the outside of the display. A 3D projector with 4K resolution to was used to generate a high-resolution image onto the display. A fisheye lens was installed between the projector and the acrylic globe to spread the image from the projector to the entire surface of the interior of the spherical acrylic. In order to make the display touchable, we placed a wide-lens infrared camera at the bottom. Since the axes of the camera and of the fisheye lens are different, we aligned these
axes using an affine transformation. For the infrared illumination, we installed a high-power infrared LED at the opposite side of the camera. Figure 1(b) shows the globe on our 3DSD.
To make it easier for users to visualize 3D objects, we have created a software program based on the Unity 3D Platform that allows any 3D application running on the platform to be displayed on the 3DSD. Figure 2 shows how two users view a 3D scene from different perspectives. As shown in the figure, the software program generated images for each viewpoint and projected those images onto the surface of the 3DSD. The two images appear to be superimposed, but each image is displayed at a different timing. Therefore, if the user uses shutter glasses, the images at each timing can be viewed separately. Currently, the HTC
(a) The hardware design of our 3DSD (b) The globe
Figure 1. Our 3D spherical display (a) and the globe (b) projected onto the display.
Projector
Acrylic globe
Fish lens
Illumination
Figure 2. Our 3DSD software program based on the Unity 3D platform.
User #1
User #2
User #1
User #2

286
International Journal on Advances in Software, vol 13 no 3 & 4, year 2020, http://www.iariajournals.org/software/
2020, © Copyright by authors, Published under agreement with IARIA - www.iaria.org
Vive Tracker [14] needs to be attached to the user's head to determine the user's perspective. In the future, we plan to simplify the tracking system by replacing it with a 3D face tracking based on a vision camera.
III. OUR PROPOSED POINTING DEVICE
Figure 3 shows a scene in which the proposed pointing device is used on a 3DSD. The camera for the 3DSD touch interface captures any blob images on the 3DSD surface. The proposed pointing device does not use a 3D tracking device such as motion capture, but acquires the location based on the blob image detected by the infrared camera and the orientation
based on the IMU. The details of the calculation to determine the location and orientation of the pointing device are as follows.
A. Detecting the location of the tip of the pointing device When the tip of the pointing device touches the surface of
the 3DSD, the blob image corresponding to the touched area is extracted to localize the tip's location. This process involves binarizing the blob image to form a contour at the boundary and fitting an ellipse to the contour. OpenCV (opencv.org), an open-source computer vision software library, is used for this calculation. Here, the coordinate of the tip of the pointing device is calculated as the center coordinate of the ellipse.
We perform the following coordinate transformations to convert the coordinates of the tip of the pointing device mentioned above into the 3DSD's 3D coordinate system. At first, since the image in the 3DSD is projected according to Lambert Azimuthal Equal-Area Projection, the coordinates of the tip of the pointing device are converted to this projection. Next, these coordinates are re-projected into the Universal Transverse Mercator (UTM) coordinate system and mapped onto spheroid, which represents the 3D coordinate system of the 3DSD. Figure 4 shows a series of the above transformations. The world map was used as the background image projected onto the 3DSD to make a better understanding of these transformations.
In our system, the blob image is extracted for everything that touches the surface of the 3DSD, but currently, we do not distinguish between the user's fingertip or the pointing device. Therefore, when using the prototype of this pointing device, the 3DSD should not be touched except by this device.
B. Getting the rotation of the pointing device In this study, we prototyped the pointing device using a
mobile device, the iPhone 7. As shown in Figure 5, we set up a pointing stick on the top of the iPhone 7 and attached a rubber to the tip to touch the 3DSD. The pointing device gets
Figure 3. The mechanism of the proposed pointing device.
Infrared camera
Orientation
Location
Infrared LED
Pointingdirection
Projector with a fisheye lens
Blob images
IMU
Figure 4. 3D coordinates of the tip of the pointing device.
Lambert Azimuthal Equal-Area UTM coordinate system
Speroid3DSD’s 3D coordinate system
(x, y, z)Tip’s location
r

287
International Journal on Advances in Software, vol 13 no 3 & 4, year 2020, http://www.iariajournals.org/software/
2020, © Copyright by authors, Published under agreement with IARIA - www.iaria.org
its own orientation (pitch, yaw, roll) from the iPhone 7's built-in IMU. This information is transmitted to the 3DSD via Bluetooth of the iPhone 7. In this way, this integration of location and orientation information allows the pointing device to have 6DoF information. Using this information, the 3DSD software system will be able to calculate the posture of the pointing device and project an auxiliary line from its tip according to the user's perspective. Here, the length of the auxiliary line can be adjusted with the audio buttons on the iPhone 7 or the Graphical User Interface (GUI) on its screen.
The iPhone 7's built-in IMU includes a compass and a gyroscope sensor. However, to make the pointing device works properly, these sensor values must be calibrated in advance. In this study, we constructed a simplified Stewart Platform (Motion Platform) to calibrate the rotation information obtained from the IMU of the iPhone 7. Although this simplified platform has only three actuators instead of the six used in the original form, it is enough as a validation device for this study.
Figure 6 shows the calibration of the iPhone 7 on the Motion Platform. The calibration analyzes the difference between the rotation angle from the IMU and the rotation angle of the Platform. For calibration, the Motion platform was used to perform 27 arbitrary motions only on pitch and roll angles. The reason for not changing direction to the yaw angle is to measure the stability of the IMU when measuring the yaw angle. Since the changes in the yaw angle are the result of the changes in pitch and roll, there will be less changes in the yaw angle. Figure 7 shows orientation angles derived from the IMU after being calibrated using the Motion Platform. Figure 8 shows the relationship between the rotation angle of the Motion Platform and the rotation angles of the iPhone 7. Despite the variability of the pitch and roll angles of about ±10 degrees, the variability of the yaw angle is limited
Figure 5. The proposed pointing device for the 3DSD. Figure 6. The Motion Platform built for this study.
+
ー
+ー
Changing the length of the auxiliary line (volume buttons)
Changing the length of the auxiliary line (GUI slider)
The tip of the pointing device Pitch
Roll
Yaw
iPhone 7
Figure 7. Values of orientation angles derived from the IMU
after being calibrated using the Motion Platform.
Motion Platform
10.07.5
5.02.5
0.0-2.5
-5.0-7.5
-10.0
10.07.5
5.02.5
0.0-2.5
-5.0-7.5
-10.0
10.07.5
5.0
2.50.0
-2.5-5.0-7.5
-10.01 5 10 15 20 25
Deg
ree
Deg
ree
Deg
ree
Pitch
Roll
Yaw
DataiPhone 7

288
International Journal on Advances in Software, vol 13 no 3 & 4, year 2020, http://www.iariajournals.org/software/
2020, © Copyright by authors, Published under agreement with IARIA - www.iaria.org
to about ±2 degrees. There was a high correlation between the pitch angles, 𝑟(25) = .99 , 𝑝 < .001 , with a 𝑅! = .979 . Similarly, there was also a high correlation between the roll angles, 𝑟(25) = .99 , 𝑝 < .001 , with a 𝑅! = .998 , and between the yaw angles,𝑟(25) = .78, 𝑝 < .001, with a 𝑅! =.602. These results indicate that the IMU built into the iPhone 7 is accurate enough to perform interactions that require absolute orientation.
Figure 9 shows the proposed pointing device that works with the 3DSD. The HTC Vive Tracker was attached to the camera to capture this image from the correct perspective. To give users a strong impression of motion parallax, we attached a wallpaper pattern on the back of the virtual fish-tank. From the camera's perspective, the auxiliary line of the pointing device extends in the correct direction according to the orientation of the device. The volume button or slider as
shown in Figure 5 allows the user to adjust the length of this line.
IV. EXPERIMENTAL RESULTS
We evaluated the proposed pointing device in terms of accuracy, pointing stability, and user experience. A 51 cm diameter 3DSD was used in the experiment. The display, pointing device and user perspective coordinate systems were calibrated using the HTC Vive tracker. The 3DSD runs on a desktop computer with a 3.6 GHz CPU, 32 GB of RAM and a GTX980Ti graphics card.
A. Pointing Accuracy In the 3DSD, the accuracy of the pointing device is
required for operations such as selecting a 3D object. In the case of the 3DSD with a diameter of 51 cm, one degree of
Figure 9. Our working pointing device.
Figure 8. The relationships between orientation angles of the Motion Platform and the iPhone 7.
R² = 0.9787
-10
-8
-6
-4
-2
0
2
4
6
8
10
-10 -8 -6 -4 -2 0 2 4 6 8 10
iPho
ne 7
(Deg
ree)
Motion Platform (Degree)
Pitch
R² = 0.9975
-10
-8
-6
-4
-2
0
2
4
6
8
10
-10 -8 -6 -4 -2 0 2 4 6 8 10
iPho
ne 7
(Deg
ree)
Motion Platform (Degree)
Roll
R² = 0.6019
-10
-8
-6
-4
-2
0
2
4
6
8
10
-10 -8 -6 -4 -2 0 2 4 6 8 10
iPho
ne 7
(Deg
ree)
Motion Platform (Degree)
Yaw
R 2 = 0.979 R 2 = 0.998 R 2 = 0.602

289
International Journal on Advances in Software, vol 13 no 3 & 4, year 2020, http://www.iariajournals.org/software/
2020, © Copyright by authors, Published under agreement with IARIA - www.iaria.org
pointing error corresponds to a deviation of about 1 cm at the center of the 3DSD. In order to evaluate the accuracy of pointing, 12 arbitrary locations on the 3DSD surface were selected, and the pointing device was set from these locations towards the center of the display. At each point, vectors representing the pointing direction were recorded for two seconds, and the difference with the vector connecting the pointing point and the center of the 3DSD, hereafter referred
to as the ground truth vector, was analyzed. Each measurement was sampled at 60 Hz, resulting in 120 vectors.
Figure 10 shows the 12 locations used for the evaluation and vectors of the pointing device pointing to the center of the display from those locations (blue lines). The red lines show the ground truth vectors. A small discrepancy can be observed between the red and blue lines. Here, we took the inner product of both vectors and quantified the difference in angles. Figure 11 shows the distribution of the angle differences at
Figure 10. The resulting vectors (blue) from the pointing device tip and their
corresponding ground truth (red).
Figure 12. Schematic diagram of the pointing experiment in yaw
angle direction.
x [m]
z [m]
y [m]
#1
#12
#11
#10
#9
#8
#7
#6
#5
#4
#3
#2
Pointing device
Fixed point
Figure 11. The distribution of the angle differences at each of the 12
locations.
Figure 13. Intersection points of the vectors from the pointing
device tip and the display surface.
Diff
eren
ce in
ang
le (d
egre
e)
Locationx [m]
z [m]
y [m]

290
International Journal on Advances in Software, vol 13 no 3 & 4, year 2020, http://www.iariajournals.org/software/
2020, © Copyright by authors, Published under agreement with IARIA - www.iaria.org
each of the 12 locations. The circle inside the interquartile range represents the mean value of the data. The median values and interquartile ranges varied by locations. However, the median and mean values in total measured 1.08 and 1.05 degrees, respectively. These values correspond to about 1 cm at the center of the 3DSD. The range of quartiles is at most 1 degree or less, except at the sixth location. At the sixth location, pointing diagonally upward might be the cause of the increase in the differences. In practical use, most users are not aware of any differences within this range. The one-way Analysis of Variance (ANOVA) shows that there is a significant effect of the location on the pointing accuracy [F(11, 1392) = 2.26, p < .01].
B. Pointing Stability In the previous calibration using the Motion Platform, the
correlation between the IMU’s yaw angle and the measured yaw angle was the lowest compared to the pitch and roll angles. In order to investigate how this result affects the stability of the pointing operation, we performed an experiment of pointing solely in the yaw direction.
Figure 12 shows a schematic diagram of the experiment. The pointing device is placed on a board placed on the side of the 3DSD to allow pointing only in the yaw angle direction. Here, the pointing device was rotated ±135 degrees with respect to the center of the 3DSD and the vectors representing the pointing direction were recorded. In total, 1,147 vectors were collected during the operation.
In order to verify the pointing stability, we calculated the intersection points (x, y, z) of these vectors with the 3DSD and fitted a plane 𝑓(𝑥, 𝑦) = 𝑧 = 𝑎𝑥 + 𝑏𝑦 + 𝑐 to these points using the least squares method. The maximum absolute value of the residual was measured 0.20 cm. This small error means that the pointing vector changes smoothly in the yaw direction and the proposed pointing device is sufficiently stable. Figure 13 shows the distribution of the intersection points on the 3DSD.
C. Object Selection We conducted an experiment to select objects in 3DSD
using the proposed pointing device. For the experiment, we constructed a virtual fish-tank in 3DSD and placed four fishes at a distance from each other. We measured the time required to select every fish.
Nine students of the Faculty of Software and Information Science of Iwate Prefectural University participated in the experiment. Each subject randomly selected each fish using the proposed pointing device. However, in order to avoid gaps in results due to differences in pointing distance between
TABLE I. TIME BEING TAKEN BY THE SUBJECT TO POINT EACH FISH.
Subject ID
Fish A B C D
1 8.4 3.4 5.5 4.9 2 7.5 2.6 3.6 3.3 3 4.3 2.5 5.1 4.6 4 3.5 10.6 4.4 4.8 5 8.4 4.3 5.3 4.9 6 5.9 4.6 4.4 5.2 7 7.8 3.5 4.1 3.8 8 6.9 3.2 2.9 3.8 9 10.6 3.7 3.7 4.8
Mean 7.03 4.26 4.34 4.45 StDev. 2.204 2.458 0.844 0.663
(seconds)
Figure 14. The virtual fish-tank for the experiment.
A
C
B
D
Touch location

291
International Journal on Advances in Software, vol 13 no 3 & 4, year 2020, http://www.iariajournals.org/software/
2020, © Copyright by authors, Published under agreement with IARIA - www.iaria.org
subjects, we had all subjects start pointing at the same point. When the selection was successful, the color of the fish changed automatically and the time since the start of pointing was recorded. The experiment ended when all four fishes have been pointed out successfully.
Figure 14 shows the virtual fish-tank for the experiment. The “touch location” is a location to start to point to a fish, regardless of the location of the fish. The four fishes (A, B, C,
D) are 34.9 cm, 22.6 cm, 23.7 cm, and 21.8 cm away from this point, respectively.
Table I shows the time being taken by each subject to select each fish. While the average time required to select fish in B, C, and D takes about 4 seconds, most subjects spent the most time to successfully select the fish A. We considered that it is a reasonable result since the fish A is the farthest away from the touch location. When selecting an object that is far away, a small amount of slippage in the pointing angle can
(a) Volumetric data
(b) Motion capture data
(c) Virtual fish-tank
(d) 3D digital globe
Figure 15. Various 3D contents that can be displayed onto the 3DSD.

292
International Journal on Advances in Software, vol 13 no 3 & 4, year 2020, http://www.iariajournals.org/software/
2020, © Copyright by authors, Published under agreement with IARIA - www.iaria.org
reduce the pointing accuracy to the object. The one-way Analysis of Variance (ANOVA) shows that there is a significant effect between the pointing locations on the time taken by subjects to successfully point to a fish [F(3, 32) = 4.46, p < .01].
V. DISCUSSION Various spherical displays have been proposed in the past
decade. The main purpose of developing these displays was to allow users to view content from various angles. To our knowledge, Sphere [15] is the first 2D spherical display that introduced multi-touch interactions, such as dragging, scaling, flicking, and rotating. This multi-touch function provides the same level of interaction as that of an ordinary planar display. However, as the use of 3D content increases, the direction of development of spherical displays has changed from 2D to 3D. Currently, there are some companies producing spherical displays, such as Global Imagination [16], PufferSphere [17], and ArcScience [18].
In 2011, SnowGlobe [6] was demonstrated to be the first 3DSD with a fish-tank VR. It has the same multi-touch functionality as the Sphere, allowing for interaction with 3D objects. However, interaction with 3D objects is likely to take advantage of the depth information, which requires a complex system to realize. Spheree [7] demonstrated 3D gestures using an optical motion capture device. Currently, CoGlobe [8] might be the most advanced 3DSD that allows two users to interact with the display at the same time. However, as long as the 3D interactions rely on expensive motion capture devices, the 3DSD may not become widely available. A 3D pen stylus that does not require a motion capture device such as the TouchTM Haptic Device [19] may be used to perform 3D interaction with the display within a certain range. However, its arm limits the work area.
This study extends the touch interface to enable 3D interactions without the use of a motion capture device. For this purpose, we have built a new 3DSD that has the same functionality as CoGlobe. Our proposed pointing device combines the 3D position on the display surface detected by the touch interface with the orientation measured by the IMU to obtain the 6DoF. Due to the high precision of recent IMUs, such as the one built into the iPhone 7, we believe that it is reasonable to obtain the orientation information of the pointing device from the IMU. Our calibration results using the Motion Platform indicate that the IMU built into the iPhone 7 is accurate enough to perform interactions that require absolute orientation.
The 3DSD has the potential to represent a variety of 3D contents, such as volumetric data [20], motion capture data, virtual fish-tank, and 3D digital globe, as shown in Figure 15. Since the proposed pointing device uses a mobile device, its functionality can be further enhanced by software application programs on the device. For example, after selecting a 3D object, gestures such as rotating and scaling can be performed on the mobile device screen to manipulate the 3D object. The capability to control the length of the auxiliary line from the tip of the pointing device may allow the user to sculpt or slice the 3D objects. Moreover, by using the haptic sensor inside
the mobile device, the user can receive a haptic feedback when touching a 3D object.
VI. CONCLUSION In this study, we have proposed a new pointing device that
can be used to interact with a 3D spherical display without using a motion capture device. Our proposed device is characterized by the two different sources to calculate its 6DoF. They are a touch interface to acquire the location of the device tip and an IMU to measure the orientation of the device. We built a Motion Platform with three actuators to calibrate the IMU. Our experiments have confirmed the pointing accuracy and stability for the device.
The proposed pen has not yet been studied in detail in terms of resolution and sensitivity, but we will further experiment to clarify it in the future. We will also extend the functionality of the proposed pointing device as an interface in virtual surgical training based on a spherical display.
ACKNOWLEDGEMENT This work was supported by JSPS KAKENHI Grant
Numbers 20K12123. We also thank to the Iwate Prefectural University of Japan, for funding this project. We also thank the editor and three anonymous reviewers for their constructive comments, which helped us to improve the manuscript.
REFERENCES [1] R. Takahashi, K. Hotta, O. D. A. Prima, and H. Ito, “A
Perspective-Corrected Stylus Pen for 3D Interaction,” The Thirteenth International Conference on Advances in Computer-Human Interactions (ACHI 2020), pp. 11-14, 2020.
[2] A. Borrego, J. Latorre, M. Alcañiz, and R. Llorens, “Comparison of Oculus Rift and HTC Vive: Feasibility for Virtual Reality-Based Exploration, Navigation, Exergaming, and Rehabilitation,” Games for Health Journal, 7(3), pp. 151-156, 2018.
[3] B. Masia, G. Wetzstein, P. Didyk, and D. Gutierrez, “A survey on computational displays: Pushing the Boundaries of Optics, Computation, and Perception,” Computers and Graphics (Pergamon), 37(8), pp. 1012-1038, 2013.
[4] Looking Glass, https://lookingglassfactory.com. [retrieved: September, 2020]
[5] J. Geng, “Three-Dimensional Display Technologies,” Advances in Optics and Photonics, 5(4), pp. 456–535, 2013.
[6] J. Bolton, K. Kim, and R. Vertegaal, “SnowGlobe: A Spherical Fish-Tank VR Display,” In Conference on Human Factors in Computing Systems - Proceedings, pp. 1159-1164, 2011.
[7] F. Ferreira et al., “Spheree: A 3D Perspective-Corrected Interactive Spherical Scalable Display,” ACM SIGGRAPH 2014 Emerging Technologies, pp. 1, 2014. https://doi.org/10.1145/2614217.2630585
[8] Q. Zhou et al., “CoGlobe - A Co-located Multi-Person FTVR Experience,” ACM SIGGRAPH 2018 Emerging Technologies. https://doi.org/10.1145/3214907.3214914.
[9] G. Hagemann, Q. Zhou, I. Stavness., O. D. A. Prima, and S. Fels, “Here’s looking at you: A Spherical FTVR Display for Realistic Eye-Contact,” ISS 2018 - Proceedings of the 2018

293
International Journal on Advances in Software, vol 13 no 3 & 4, year 2020, http://www.iariajournals.org/software/
2020, © Copyright by authors, Published under agreement with IARIA - www.iaria.org
ACM International Conference on Interactive Surfaces and Spaces, pp. 357–362, 2018.
[10] D. Fafard et al., “FTVR in VR: Evaluating 3D performance with a simulated volumetric fish-tank virtual reality display,” Conference on Human Factors in Computing Systems, pp. 1-12, 2019.
[11] T. Crespel, P. Reuter, and X. Granier, “A Low-Cost Multitouch Spherical Display: Hardware and Software Design,” Display Week 2017, May 2017, Los Angeles, California, United States. pp. 619- 622, 10.1002/sdtp.11716 . hal-01455523.
[12] OptiTrack, https://optitrack.com. [retrieved: September, 2020] [13] P. C. Wu et al., ”DodecaPen: Accurate 6DoF Tracking of a
Passive Stylus,” UIST 2017 - Proceedings of the 30th Annual ACM Symposium on User Interface Software and Technology, pp. 365–374, 2017.
[14] Vive Tracker, https://www.vive.com/eu/vive-tracker/ [retrieved: September, 2020]
[15] H. Benko, A. D. Wilson, and R. Balakrishnan, “Sphere: Multi-Touch Interactions on a Spherical Display,” UIST 2008 -
Proceedings of the 21st Annual ACM Symposium on User Interface Software and Technology, pp. 77-86, 2008.
[16] S. W. Utt, P. C. Rubesin, and M. A. Foody, “Display System Having a Three-Dimensional Convex Display Surface,” US Patent 7,352,340. 2005.
[17] Pufferfish Ltd. http://pufferfishdisplays.co.uk/, 2002. [retrieved: September, 2020]
[18] L. Thomas, F. Christopher, and L. Jonathan, “A Self-Contained Spherical Display System,” In ACM Siggraph 2003 Emerging Technologies.
[19] T h e T o u c h T M H a p t i c D e v i c e , 3 D S y s t e m s , https://www.3dsystems.com/haptics-devices/touch. [retrieved: September, 2020]
[20] T. Grossman, D. Wigdor, and R. Balakrishnan, “Multi-Finger Interaction with 3D Volumetric Displays,” In UIST ’04: Proceedings of the 17th annual ACM symposium on User interface software and technology, pp. 61-70, 2004.