Surface properties of electrochemically oxidized carbon fibers
11
PERGAMON Carbon 37 (1999) 1797–1807 Surface properties of electrochemically oxidized carbon fibers a, a b b b b * C.U. Pittman Jr. ,W. Jiang , Z.R. Yue , S. Gardner , L. Wang , H. Toghiani , c C.A. Leon y Leon a Department of Chemistry, Mississippi State University, Mississippi State, MS 39762, USA b Department of Chemical Engineering, Mississippi State University, Mississippi State, MS 39762, USA c Quantachrome Corp., Boynton, FL 33426, USA Received 7 October 1998; accepted 5 February 1999 Abstract High-strength PAN-based carbon fibers were continuously electrochemically oxidized by applying current through the fibers which served as an anode in 1% wt. KNO solutions. NaOH titration showed that the quantity of acidic surface 3 21 functions increased with the extent of electrochemical oxidation up to oxidation levels of 6360 C g . Fibers with over 1.1 21 mmol g of total acidic functional groups per gram were achieved by electrochemical oxidation. The lower limit values of the surface area, based on a model in which every carbon of a lateral plane surface is oxidized to a titratable acidic function, were in fair agreement with the specific surface area measurements from DR / CO adsorption at 273 K. BET / N 2 2 measurements of the surface area vs. extent of oxidation were very low, did not increase substantially on increased oxidation and failed to match the surface areas calculated from NaOH uptake values or measured by DR / CO . Aqueous NaOH is able 2 to access a far larger area than ‘dry surface’ nitrogen gas adsorption at 77 K. This confirms that a complex micropore structure has formed below the outer fiber surface upon electrooxidation. The pore distribution is mostly comprised of ultramicropores which require higher temperature thermal activation for gaseous molecules like N or CO to penetrate. 2 2 Capillary forces augmented by ionization of acidic sites and exothermic solvation assist NaOH–H O transport into pores 2 where acidic functions on the pore surfaces can be neutralized. Some swelling of the porous surface region, when submerged in aqueous base, leads to greater internal surface–NaOH contact. The depth of this layer is deeper than that detected by XPS. Electrochemical oxidation of the carbon fiber with 1% wt. KNO solution penetrates deep inside the carbon fibers with 3 1 1 increasing current flow. Ag , methylene blue (MB ) and I were adsorbed on the oxidized fibers. The extent of adsorption 2 1 1 increased with the extent of electrochemical oxidation. The adsorption capacity of Ag was much higher than that of MB 1 or I . The quantity of Ag adsorption from aqueous solution by the oxidized fibers depends strongly on pH and maximizes 2 at pH510.5, suggesting solvation–ionization can effectively aid transport into the micropores. X-ray diffraction patterns 1 0 confirmed that some adsorbed Ag was reduced to Ag . The amount of NH (and/or NH –H O), CH CH OH, C H CH , 3 3 2 3 2 6 5 3 CCl adsorbed onto fibers under these adsorbates’ vapor pressure at 258C, respectively, depended on adsorbate polarity. The 4 stronger the polarity of the adsorbate, the more was adsorbed. 1999 Elsevier Science Ltd. All rights reserved. Keywords: A. Carbon fibers; B. Electrochemical treatment; C. Adsorption; D. Functional groups; Surface properties 1. Introduction interfacial shear strength [1,3–9]. Carbon fiber, when used without any surface treatment, produces composites with Carbon fibers possess excellent mechanical properties low interlaminar shear strengths (ILSS) [10]. This is partly for composite reinforcement [1,2]. But the efficient transla- due to weak adhesive bonding between the fiber and the tion of these outstanding mechanical properties into usable matrix. Adhesion between the fiber and the binder phase composite structures depends, in part, on the fiber–matrix depends considerably on the functional groups present on the carbon fiber surface, the surface density, surface morphology and roughness [1,11,12]. This has resulted in *Corresponding author. Tel.: 11-601-325-7616; fax: 11-601- the development of many surface treatments [13–43] that 325-7611. E-mail address: [email protected] (C.U. Pittman Jr.) improve the fiber–matrix adhesion. 0008-6223 / 99 / $ – see front matter 1999 Elsevier Science Ltd. All rights reserved. PII: S0008-6223(99)00048-2
-
Upload
independent -
Category
Documents
-
view
4 -
download
0
Transcript of Surface properties of electrochemically oxidized carbon fibers
PERGAMON Carbon 37 (1999) 1797–1807
Surface properties of electrochemically oxidized carbon fibersa , a b b b b*C.U. Pittman Jr. , W. Jiang , Z.R. Yue , S. Gardner , L. Wang , H. Toghiani ,
cC.A. Leon y LeonaDepartment of Chemistry, Mississippi State University, Mississippi State, MS 39762, USA
bDepartment of Chemical Engineering, Mississippi State University, Mississippi State, MS 39762, USAcQuantachrome Corp., Boynton, FL 33426, USA
Received 7 October 1998; accepted 5 February 1999
Abstract
High-strength PAN-based carbon fibers were continuously electrochemically oxidized by applying current through thefibers which served as an anode in 1% wt. KNO solutions. NaOH titration showed that the quantity of acidic surface3
21functions increased with the extent of electrochemical oxidation up to oxidation levels of 6360 C g . Fibers with over 1.121mmol g of total acidic functional groups per gram were achieved by electrochemical oxidation. The lower limit values of
the surface area, based on a model in which every carbon of a lateral plane surface is oxidized to a titratable acidic function,were in fair agreement with the specific surface area measurements from DR/CO adsorption at 273 K. BET/N2 2
measurements of the surface area vs. extent of oxidation were very low, did not increase substantially on increased oxidationand failed to match the surface areas calculated from NaOH uptake values or measured by DR/CO . Aqueous NaOH is able2
to access a far larger area than ‘dry surface’ nitrogen gas adsorption at 77 K. This confirms that a complex microporestructure has formed below the outer fiber surface upon electrooxidation. The pore distribution is mostly comprised ofultramicropores which require higher temperature thermal activation for gaseous molecules like N or CO to penetrate.2 2
Capillary forces augmented by ionization of acidic sites and exothermic solvation assist NaOH–H O transport into pores2
where acidic functions on the pore surfaces can be neutralized. Some swelling of the porous surface region, when submergedin aqueous base, leads to greater internal surface–NaOH contact. The depth of this layer is deeper than that detected by XPS.Electrochemical oxidation of the carbon fiber with 1% wt. KNO solution penetrates deep inside the carbon fibers with3
1 1increasing current flow. Ag , methylene blue (MB ) and I were adsorbed on the oxidized fibers. The extent of adsorption21 1increased with the extent of electrochemical oxidation. The adsorption capacity of Ag was much higher than that of MB
1or I . The quantity of Ag adsorption from aqueous solution by the oxidized fibers depends strongly on pH and maximizes2
at pH510.5, suggesting solvation–ionization can effectively aid transport into the micropores. X-ray diffraction patterns1 0confirmed that some adsorbed Ag was reduced to Ag . The amount of NH (and/or NH –H O), CH CH OH, C H CH ,3 3 2 3 2 6 5 3
CCl adsorbed onto fibers under these adsorbates’ vapor pressure at 258C, respectively, depended on adsorbate polarity. The4
stronger the polarity of the adsorbate, the more was adsorbed. 1999 Elsevier Science Ltd. All rights reserved.
Keywords: A. Carbon fibers; B. Electrochemical treatment; C. Adsorption; D. Functional groups; Surface properties
1. Introduction interfacial shear strength [1,3–9]. Carbon fiber, when usedwithout any surface treatment, produces composites with
Carbon fibers possess excellent mechanical properties low interlaminar shear strengths (ILSS) [10]. This is partlyfor composite reinforcement [1,2]. But the efficient transla- due to weak adhesive bonding between the fiber and thetion of these outstanding mechanical properties into usable matrix. Adhesion between the fiber and the binder phasecomposite structures depends, in part, on the fiber–matrix depends considerably on the functional groups present on
the carbon fiber surface, the surface density, surfacemorphology and roughness [1,11,12]. This has resulted in*Corresponding author. Tel.: 11-601-325-7616; fax: 11-601-the development of many surface treatments [13–43] that325-7611.
E-mail address: [email protected] (C.U. Pittman Jr.) improve the fiber–matrix adhesion.
0008-6223/99/$ – see front matter 1999 Elsevier Science Ltd. All rights reserved.PI I : S0008-6223( 99 )00048-2
1798 C.U. Pittman et al. / Carbon 37 (1999) 1797 –1807
Electrochemical oxidation of carbon fibers is effective in 2.2. Electrochemical oxidationimproving the shear properties of carbon fiber–resincomposites [21,44] and is preferred because it allows Continuous electrochemical treatments were carried outcontinuous processing of the carbon fibers [1,15,23,24,44]. in a U-tube apparatus. Aqueous, 1% wt. KNO was used3
We initially undertook electrochemical oxidation to create as the electrolyte. Carbon fibers were continuously passedfiber surfaces that could be further derivatized by poly- through the electrolyte and served as the anode. A 254-cm-functional amines or polymers in order to improve adhe- long stainless-steel bar running through the U-tube wassion. However, it recently became apparent that extensive used as the cathode. The schematic diagram of thiselectrochemical oxidations produced an interesting porous apparatus, as well as the treatment details have alreadycarbon fiber with adsorbent capabilities [23]. been described [23].
Detailed characterization of oxidized carbon fiber sur-faces is essential to understand what modifications occur 2.3. Specific surface areaduring treatment. A detailed understanding of the amountand types of surface functions created, the surface area, the Specific surface areas were calculated from the BETpore structure and distribution as well as morphology is equation for N adsorption at 77 K (Quantasorb dynamic2
needed. These factors also influence the ability of treated flow analyzer, Quantachrome). Surface areas were alsocarbon fibers to adsorb gaseous and liquid species. Carbon calculated from the DR equation for CO adsorption at 2732
fibers, activated by steam oxidation, are known to be good K (Autosorb vacuum volumetric analyzer, Quantachrome).adsorbing materials [1]. Continuous fibers with high Density Functional Theory (DFT) was also applied. Fur-surface areas might be of use as adsorbents where continu- ther experimental details are available elsewhere [23].ous fiber material properties are also needed.
We have previously investigated the surface area and 2.4. Adsorption in aqueous solutionspore size distribution of electrochemically oxidized carbonfibers [23]. A large fraction of the pores generated were NaOH uptake and capacity to adsorb silver ion, methyl-too small to allow adequate characterization by standard ene blue and iodine were determined by the change innitrogen adsorption at low temperature (77 K, BET/N ). solution concentration of the adsorbate from before to after2
However, such small pores (ultramicropores) can be effec- adsorption by the fibers. A 24 h standard adsorption timetively probed by CO adsorption at 273 K and this data period was selected.2
can be effectively analyzed using the Dubinin-Radus-hkevich method (DR/CO ) [45] employing Density Func- 2.4.1. NaOH uptake2
tional Theory (DFT) [46]. Carbon fiber surface areas, NaOH solutions (1–2 mM) were prepared with boiledderived by applying the DR method to CO adsorption distilled water so as to remove dissolved carbon dioxide.2
2 21data, increased almost linearly from ca. 1 to 132 m g as Approximately 1 g of carbon fiber was immersed in 25–50the extent of electrochemical oxidation increased from 0 to ml of NaOH solution in a plastic vial for 4 h. The changes
2110 600 C g [23]. in NaOH concentration were measured with a pH meterIn the present investigation, PAN-based carbon fibers (Ion Analyzer 250, Corning).
21were electrochemically oxidized from 0 to 6300 C g .1The amount and nature of the surface functions were 2.4.2. Ag adsorption
characterized by NaOH uptake, adsorption of NH (aque- Carbon fiber (|0.04 g) was immersed in 100 ml of31ous), ethanol, toluene, carbon tetrachloride, Ag (aqueous), AgNO solution (|5 mM) and shaken at 258C for 24 h in3
1methylene blue (aqueous), iodine (aqueous), X-ray photo- the dark. The Ag adsorption vs. initial pH experimentselectron spectroscopy [50] and X-ray diffraction. employed carbon fiber (|0.650 g) in 150 ml of aqueous
AgNO (9.32 mM). The pH value of the initial AgNO3 31solution was adjusted with NH aq. or HNO . The change3 3
1in concentration of Ag after adsorption was determined2. Experimental by KSCN titrations employing Fe(NH )(SO ) as an4 4 2
indicator [47]. Before titration, the pH of all of the2.1. Materials adsorbates were adjusted to pH52|4.
Type II, PAN-based carbon fibers (Thornel 1-300), 2.4.3. Methylene blue adsorptionmanufactured by Amoco Performance Products were used NaOH (1 ml of 1.0 M aqueous solution) was added into
1in this study. This high-strength carbon fiber has 3000 1 l of pre-made aqueous methylene blue (MB ) (2021 26filaments per tow. All other chemicals were purchased in mg l , 53.5310 M) to deprotonate both carboxyl and
analytical grade purity from Aldrich Chemical Co. and phenolic hydroxyl surface groups on the fibers. The fiber1used as received. specimen (0.1 g) was immersed in 50–300 ml of MB
C.U. Pittman et al. / Carbon 37 (1999) 1797 –1807 1799
solution for 16 h. The solution volume used depended onthe quantity of surface acidic functions present as de-termined previously by base uptake. The adsorption of the
1MB solution was measured spectrophotometrically(Spectronic 21 D, Milton Roy Co.) at 620 nm. Distilledwater was used as a blank. The quantity of adsorption wascalculated from the change in dye concentration before andafter adsorption.
2.4.4. I adsorption2
An I –KI aqueous solution with an I concentration of2 2
0.05 M was used. Fiber samples (|0.1 g) were immersedin 25 ml of the solution and the mixture was shaken at258C for 24 h in the dark. The amount of I adsorbed was2
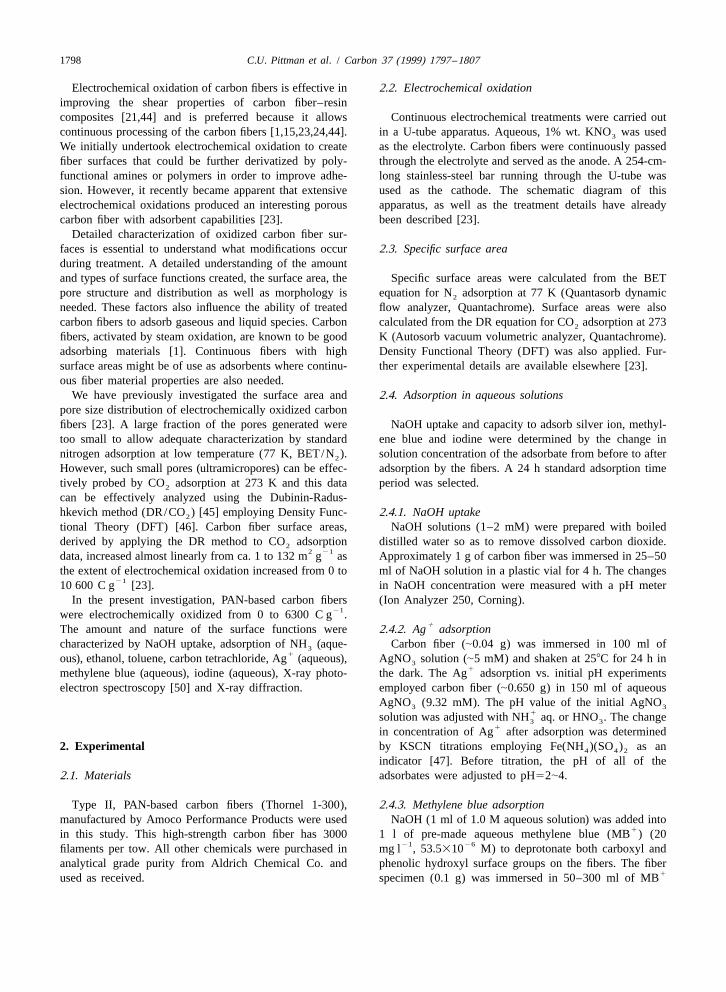
obtained by Na S O titration with a starch indicator [48]. Fig. 1. NaOH uptake by electrochemically oxidized carbon fiber2 2 3
prepared continuously at different applied currents.
2.5. Adsorption from the vapor phase
Adsorption of ammonia (and/or NH aq.), ethanol, powdered, and the diffraction lines were measured with3
toluene and carbon tetrachloride was carried out for 24 h CuKa radiation (l50.15405 nm).1
under the vapor pressure of each at constant temperature(258C). The amount adsorbed was calculated from themeasured weight gain of the samples. Ammonia adsorption 3. Results and discussionwas conducted from the vapor phase generated over a 28%wt. NH aqueous solution (vapor pressure equals 447 3.1. NaOH uptake3
mm Hg) where the [NH ]–[H O] ratio in the vapor was3 2
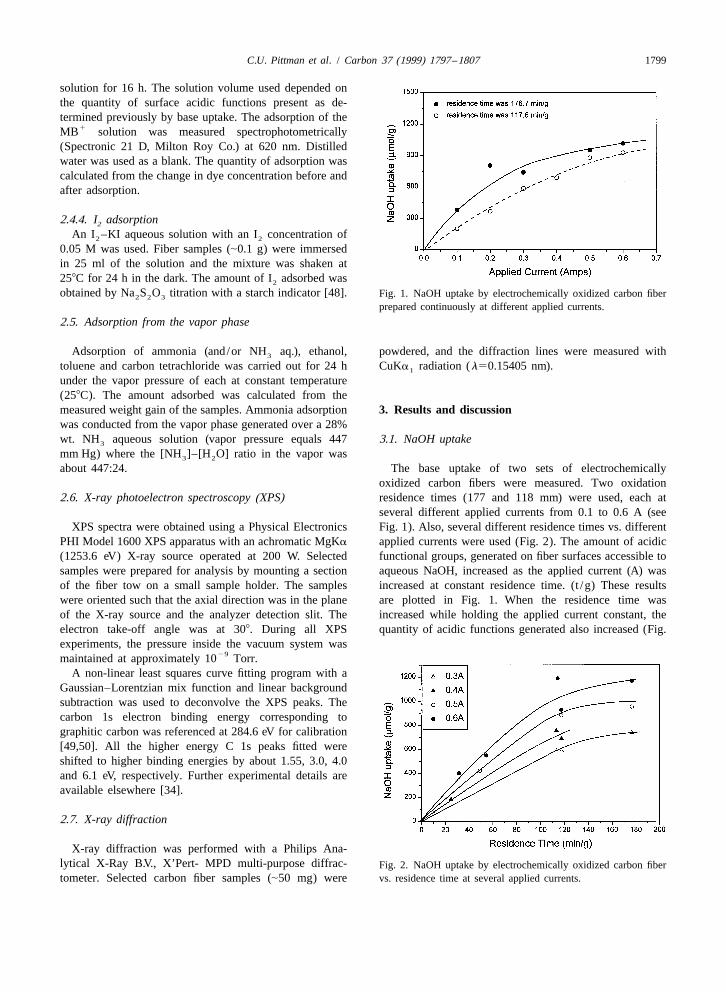
about 447:24. The base uptake of two sets of electrochemicallyoxidized carbon fibers were measured. Two oxidation
2.6. X-ray photoelectron spectroscopy (XPS) residence times (177 and 118 mm) were used, each atseveral different applied currents from 0.1 to 0.6 A (see
XPS spectra were obtained using a Physical Electronics Fig. 1). Also, several different residence times vs. differentPHI Model 1600 XPS apparatus with an achromatic MgKa applied currents were used (Fig. 2). The amount of acidic(1253.6 eV) X-ray source operated at 200 W. Selected functional groups, generated on fiber surfaces accessible tosamples were prepared for analysis by mounting a section aqueous NaOH, increased as the applied current (A) wasof the fiber tow on a small sample holder. The samples increased at constant residence time. (t /g) These resultswere oriented such that the axial direction was in the plane are plotted in Fig. 1. When the residence time wasof the X-ray source and the analyzer detection slit. The increased while holding the applied current constant, theelectron take-off angle was at 308. During all XPS quantity of acidic functions generated also increased (Fig.experiments, the pressure inside the vacuum system was
29maintained at approximately 10 Torr.A non-linear least squares curve fitting program with a
Gaussian–Lorentzian mix function and linear backgroundsubtraction was used to deconvolve the XPS peaks. Thecarbon 1s electron binding energy corresponding tographitic carbon was referenced at 284.6 eV for calibration[49,50]. All the higher energy C 1s peaks fitted wereshifted to higher binding energies by about 1.55, 3.0, 4.0and 6.1 eV, respectively. Further experimental details areavailable elsewhere [34].
2.7. X-ray diffraction
X-ray diffraction was performed with a Philips Ana-lytical X-Ray B.V., X’Pert- MPD multi-purpose diffrac- Fig. 2. NaOH uptake by electrochemically oxidized carbon fibertometer. Selected carbon fiber samples (|50 mg) were vs. residence time at several applied currents.

1800 C.U. Pittman et al. / Carbon 37 (1999) 1797 –1807
21achieved up to 2475 mmol g of acidic functions (10 60021C g of oxidation) [55].
21Since over 1 mmol g of total acidic functional groupsper gram of carbon fiber was achieved by electrochemical
21oxidations of over 6000 C g , a larger surface area musthave been produced. This quantity of functional groups ismuch higher than that generated by other wet chemicaltreatments [36,37,43,51–55]. For example, only 61.5
21 21meq g and 16 meq g of acidic functions were achievedby oxidation in refluxing 79% HNO for 60 min and in an3
oxygen plasma at 50 W for 4 min, respectively. Thesehighly electrochemically oxidized carbon fibers appear tobe interesting as possible new adsorbent materials.
Fig. 3. NaOH uptake onto electrochemically oxidized carbon 3.2. Surface area calculation based on NaOH uptakefibers vs. the extent of oxidation.
2). The extent of electrochemical oxidation was defined as Assuming that a single layer of acidic functions isthe product of the current and residence time per gram of neutralized on the fiber surfaces which aqueous NaOH is
21fibers (C g ). In Fig. 3 the NaOH uptake vs. the extent of able to reach, a minimum value of the fiber surface areaoxidation is plotted for twenty experiments where the can be calculated based on the edge geometry of a lateral
21 2extent of oxidation was increased to 6360 C g . The plane and the projected area covered by a COO (oracidic functional groups increased in direct proportion to COOH) function. Fig. 4 shows two models of the graphite
21the extent of oxidation up to about 3000 C g . Thereafter, lateral planes on a carbon fiber. These lateral planes (edgesthe slope of the curve decreased but acidic groups con- of graphite sheets) are readily oxidized compared to basaltinued to be formed as the extent of oxidation went up. At planes. Thus, oxygenated functions will form most readily
21 21a 6360 C g level of oxidation about 1000 mmol g of at a lateral plane. Walker’s method of obtaining the areaacidic functions were formed and in other studies we have per surface carbon atom can be used [56]. In the limiting
Fig. 4. Model for the density of acidic surface functional groups.
C.U. Pittman et al. / Carbon 37 (1999) 1797 –1807 1801
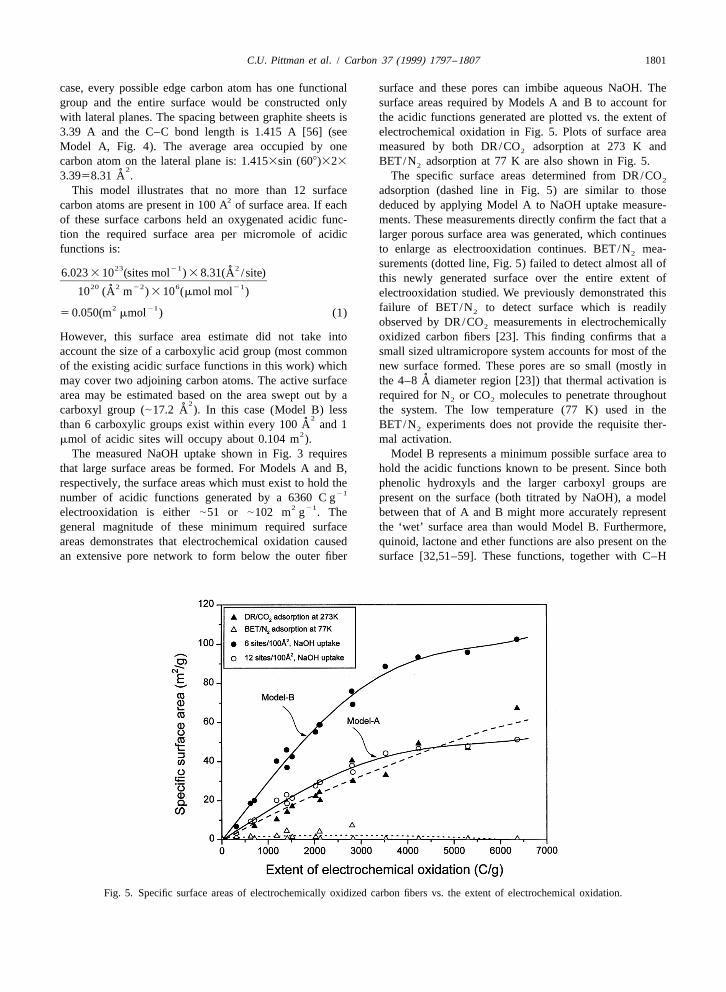
case, every possible edge carbon atom has one functional surface and these pores can imbibe aqueous NaOH. Thegroup and the entire surface would be constructed only surface areas required by Models A and B to account forwith lateral planes. The spacing between graphite sheets is the acidic functions generated are plotted vs. the extent of3.39 A and the C–C bond length is 1.415 A [56] (see electrochemical oxidation in Fig. 5. Plots of surface areaModel A, Fig. 4). The average area occupied by one measured by both DR/CO adsorption at 273 K and2
carbon atom on the lateral plane is: 1.4153sin (608)323 BET/N adsorption at 77 K are also shown in Fig. 5.22˚3.3958.31 A . The specific surface areas determined from DR/CO2
This model illustrates that no more than 12 surface adsorption (dashed line in Fig. 5) are similar to those2carbon atoms are present in 100 A of surface area. If each deduced by applying Model A to NaOH uptake measure-
of these surface carbons held an oxygenated acidic func- ments. These measurements directly confirm the fact that ation the required surface area per micromole of acidic larger porous surface area was generated, which continuesfunctions is: to enlarge as electrooxidation continues. BET/N mea-2
surements (dotted line, Fig. 5) failed to detect almost all of23 21 2˚6.023 3 10 (sites mol ) 3 8.31(A /site) this newly generated surface over the entire extent of]]]]]]]]]]]20 2 22 6 21˚10 (A m ) 3 10 (mmol mol ) electrooxidation studied. We previously demonstrated this
2 21 failure of BET/N to detect surface which is readily25 0.050(m mmol ) (1)observed by DR/CO measurements in electrochemically2
However, this surface area estimate did not take into oxidized carbon fibers [23]. This finding confirms that aaccount the size of a carboxylic acid group (most common small sized ultramicropore system accounts for most of theof the existing acidic surface functions in this work) which new surface formed. These pores are so small (mostly in
˚may cover two adjoining carbon atoms. The active surface the 4–8 A diameter region [23]) that thermal activation isarea may be estimated based on the area swept out by a required for N or CO molecules to penetrate throughout2 2
2˚carboxyl group (|17.2 A ). In this case (Model B) less the system. The low temperature (77 K) used in the2˚than 6 carboxylic groups exist within every 100 A and 1 BET/N experiments does not provide the requisite ther-2
2mmol of acidic sites will occupy about 0.104 m ). mal activation.
The measured NaOH uptake shown in Fig. 3 requires Model B represents a minimum possible surface area tothat large surface areas be formed. For Models A and B, hold the acidic functions known to be present. Since bothrespectively, the surface areas which must exist to hold the phenolic hydroxyls and the larger carboxyl groups are
21number of acidic functions generated by a 6360 C g present on the surface (both titrated by NaOH), a model2 21electrooxidation is either |51 or |102 m g . The between that of A and B might more accurately represent
general magnitude of these minimum required surface the ‘wet’ surface area than would Model B. Furthermore,areas demonstrates that electrochemical oxidation caused quinoid, lactone and ether functions are also present on thean extensive pore network to form below the outer fiber surface [32,51–59]. These functions, together with C–H
Fig. 5. Specific surface areas of electrochemically oxidized carbon fibers vs. the extent of electrochemical oxidation.
1802 C.U. Pittman et al. / Carbon 37 (1999) 1797 –1807
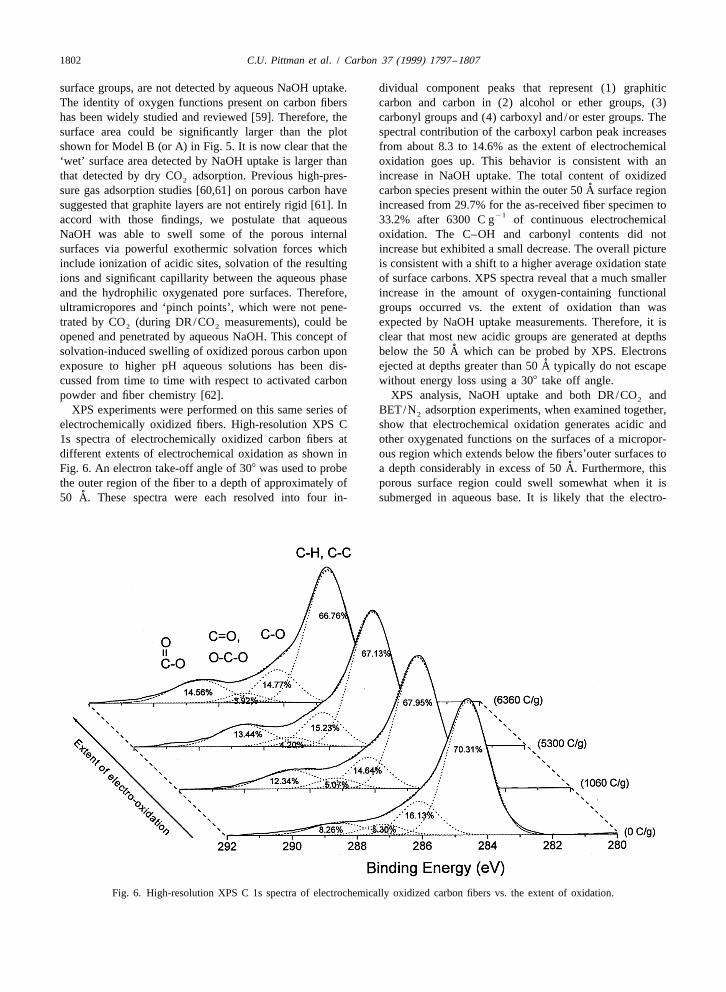
surface groups, are not detected by aqueous NaOH uptake. dividual component peaks that represent (1) graphiticThe identity of oxygen functions present on carbon fibers carbon and carbon in (2) alcohol or ether groups, (3)has been widely studied and reviewed [59]. Therefore, the carbonyl groups and (4) carboxyl and/or ester groups. Thesurface area could be significantly larger than the plot spectral contribution of the carboxyl carbon peak increasesshown for Model B (or A) in Fig. 5. It is now clear that the from about 8.3 to 14.6% as the extent of electrochemical‘wet’ surface area detected by NaOH uptake is larger than oxidation goes up. This behavior is consistent with anthat detected by dry CO adsorption. Previous high-pres- increase in NaOH uptake. The total content of oxidized2
˚sure gas adsorption studies [60,61] on porous carbon have carbon species present within the outer 50 A surface regionsuggested that graphite layers are not entirely rigid [61]. In increased from 29.7% for the as-received fiber specimen to
21accord with those findings, we postulate that aqueous 33.2% after 6300 C g of continuous electrochemicalNaOH was able to swell some of the porous internal oxidation. The C–OH and carbonyl contents did notsurfaces via powerful exothermic solvation forces which increase but exhibited a small decrease. The overall pictureinclude ionization of acidic sites, solvation of the resulting is consistent with a shift to a higher average oxidation stateions and significant capillarity between the aqueous phase of surface carbons. XPS spectra reveal that a much smallerand the hydrophilic oxygenated pore surfaces. Therefore, increase in the amount of oxygen-containing functionalultramicropores and ‘pinch points’, which were not pene- groups occurred vs. the extent of oxidation than wastrated by CO (during DR/CO measurements), could be expected by NaOH uptake measurements. Therefore, it is2 2
opened and penetrated by aqueous NaOH. This concept of clear that most new acidic groups are generated at depths˚solvation-induced swelling of oxidized porous carbon upon below the 50 A which can be probed by XPS. Electrons
˚exposure to higher pH aqueous solutions has been dis- ejected at depths greater than 50 A typically do not escapecussed from time to time with respect to activated carbon without energy loss using a 308 take off angle.powder and fiber chemistry [62]. XPS analysis, NaOH uptake and both DR/CO and2
XPS experiments were performed on this same series of BET/N adsorption experiments, when examined together,2
electrochemically oxidized fibers. High-resolution XPS C show that electrochemical oxidation generates acidic and1s spectra of electrochemically oxidized carbon fibers at other oxygenated functions on the surfaces of a micropor-different extents of electrochemical oxidation as shown in ous region which extends below the fibers’outer surfaces to
˚Fig. 6. An electron take-off angle of 308 was used to probe a depth considerably in excess of 50 A. Furthermore, thisthe outer region of the fiber to a depth of approximately of porous surface region could swell somewhat when it is
˚50 A. These spectra were each resolved into four in- submerged in aqueous base. It is likely that the electro-
Fig. 6. High-resolution XPS C 1s spectra of electrochemically oxidized carbon fibers vs. the extent of oxidation.
C.U. Pittman et al. / Carbon 37 (1999) 1797 –1807 1803
chemical oxidations conducted in this work penetrateincreasingly deeper inside the carbon fibers as the extent ofoxidation goes up.
3.3. Adsorption in aqueous solutions
1The amount of Ag adsorption by fibers which had been21electrochemically oxidized to 5300 C g was plotted vs.
the pH value of the AgNO aqueous solution in which the3
fibers were immersed (see Fig. 7). The pH value of theinitial AgNO solution (9.32 mM) was 5.36. Its pH was3
adjusted up or down with NH OH or HNO , respectively.4 31Ag adsorption sharply increased as the pH of the initial
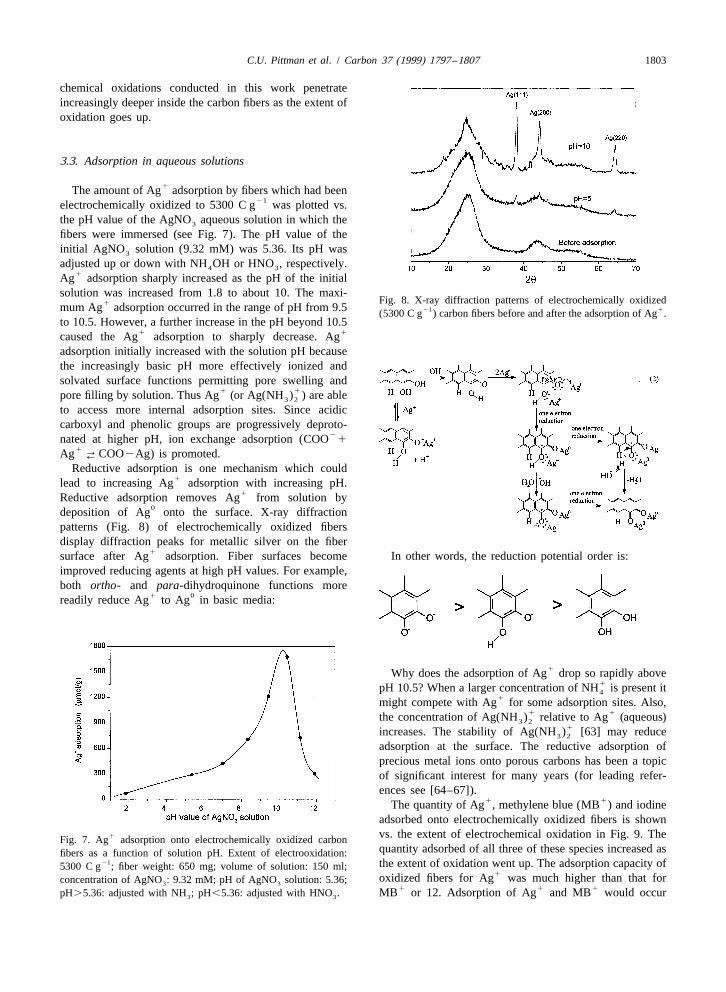
solution was increased from 1.8 to about 10. The maxi-Fig. 8. X-ray diffraction patterns of electrochemically oxidized1mum Ag adsorption occurred in the range of pH from 9.5 21 1(5300 C g ) carbon fibers before and after the adsorption of Ag .
to 10.5. However, a further increase in the pH beyond 10.51 1caused the Ag adsorption to sharply decrease. Ag
adsorption initially increased with the solution pH becausethe increasingly basic pH more effectively ionized andsolvated surface functions permitting pore swelling and
1 1pore filling by solution. Thus Ag (or Ag(NH ) ) are able3 2
to access more internal adsorption sites. Since acidiccarboxyl and phenolic groups are progressively deproto-
2nated at higher pH, ion exchange adsorption (COO 11 →Ag COO2Ag) is promoted.←
Reductive adsorption is one mechanism which could1lead to increasing Ag adsorption with increasing pH.
1Reductive adsorption removes Ag from solution by0deposition of Ag onto the surface. X-ray diffraction
patterns (Fig. 8) of electrochemically oxidized fibersdisplay diffraction peaks for metallic silver on the fiber
1surface after Ag adsorption. Fiber surfaces become In other words, the reduction potential order is:improved reducing agents at high pH values. For example,both ortho- and para-dihydroquinone functions more
1 0readily reduce Ag to Ag in basic media:
1Why does the adsorption of Ag drop so rapidly above1pH 10.5? When a larger concentration of NH is present it4
1might compete with Ag for some adsorption sites. Also,1 1the concentration of Ag(NH ) relative to Ag (aqueous)3 2
1increases. The stability of Ag(NH ) [63] may reduce3 2
adsorption at the surface. The reductive adsorption ofprecious metal ions onto porous carbons has been a topicof significant interest for many years (for leading refer-ences see [64–67]).
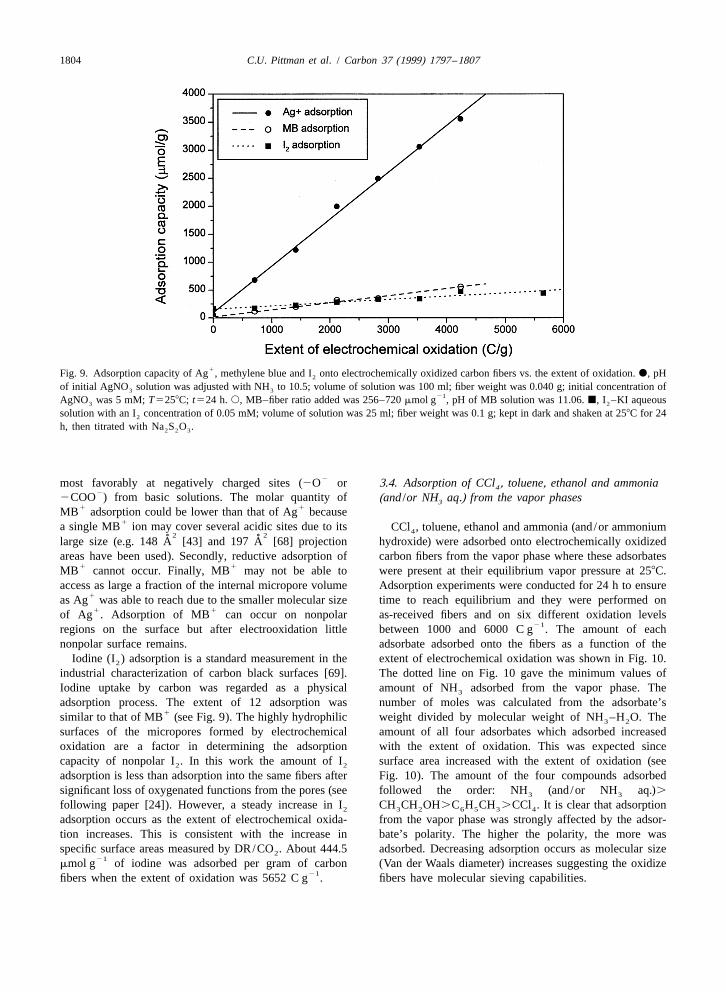
1 1The quantity of Ag , methylene blue (MB ) and iodineadsorbed onto electrochemically oxidized fibers is shown
1 vs. the extent of electrochemical oxidation in Fig. 9. TheFig. 7. Ag adsorption onto electrochemically oxidized carbonquantity adsorbed of all three of these species increased asfibers as a function of solution pH. Extent of electrooxidation:
21 the extent of oxidation went up. The adsorption capacity of5300 C g ; fiber weight: 650 mg; volume of solution: 150 ml;1oxidized fibers for Ag was much higher than that forconcentration of AgNO : 9.32 mM; pH of AgNO solution: 5.36;3 3
1 1 1pH.5.36: adjusted with NH ; pH,5.36: adjusted with HNO . MB or 12. Adsorption of Ag and MB would occur3 3
1804 C.U. Pittman et al. / Carbon 37 (1999) 1797 –1807
1Fig. 9. Adsorption capacity of Ag , methylene blue and I onto electrochemically oxidized carbon fibers vs. the extent of oxidation. d, pH2
of initial AgNO solution was adjusted with NH to 10.5; volume of solution was 100 ml; fiber weight was 0.040 g; initial concentration of3 321AgNO was 5 mM; T5258C; t524 h. s, MB–fiber ratio added was 256–720 mmol g , pH of MB solution was 11.06. j, I –KI aqueous3 2
solution with an I concentration of 0.05 mM; volume of solution was 25 ml; fiber weight was 0.1 g; kept in dark and shaken at 258C for 242
h, then titrated with Na S O .2 2 3
2most favorably at negatively charged sites (2O or 3.4. Adsorption of CCl , toluene, ethanol and ammonia42
2COO ) from basic solutions. The molar quantity of (and /or NH aq.) from the vapor phases31 1MB adsorption could be lower than that of Ag because
1a single MB ion may cover several acidic sites due to its CCl , toluene, ethanol and ammonia (and/or ammonium42 2˚ ˚large size (e.g. 148 A [43] and 197 A [68] projection hydroxide) were adsorbed onto electrochemically oxidized
areas have been used). Secondly, reductive adsorption of carbon fibers from the vapor phase where these adsorbates1 1MB cannot occur. Finally, MB may not be able to were present at their equilibrium vapor pressure at 258C.
access as large a fraction of the internal micropore volume Adsorption experiments were conducted for 24 h to ensure1as Ag was able to reach due to the smaller molecular size time to reach equilibrium and they were performed on
1 1of Ag . Adsorption of MB can occur on nonpolar as-received fibers and on six different oxidation levels21regions on the surface but after electrooxidation little between 1000 and 6000 C g . The amount of each
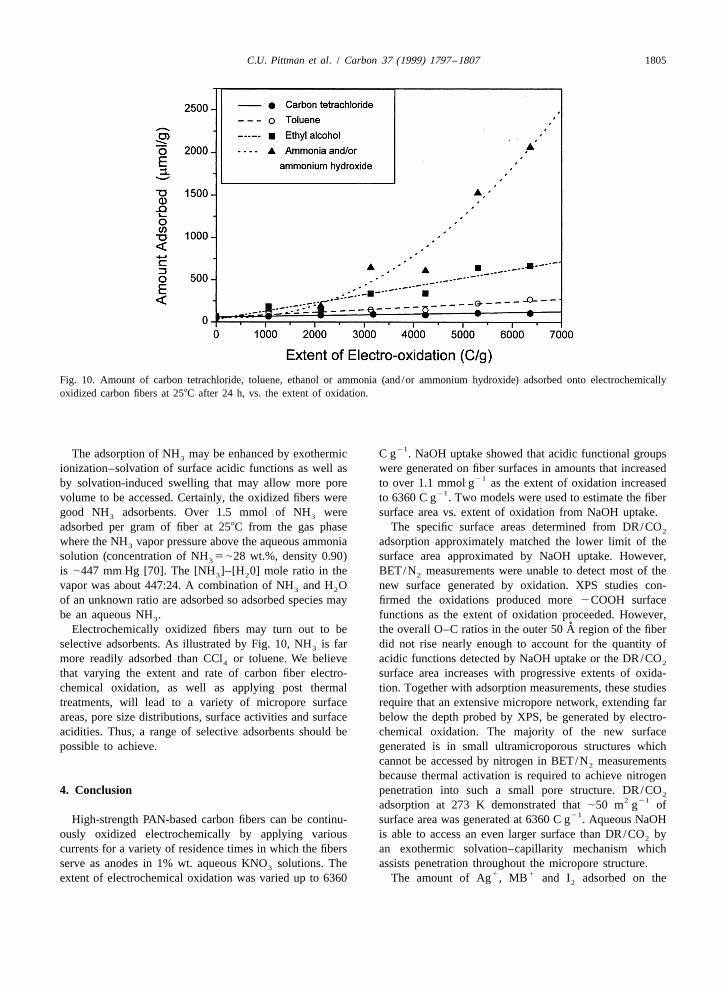
nonpolar surface remains. adsorbate adsorbed onto the fibers as a function of theIodine (I ) adsorption is a standard measurement in the extent of electrochemical oxidation was shown in Fig. 10.2
industrial characterization of carbon black surfaces [69]. The dotted line on Fig. 10 gave the minimum values ofIodine uptake by carbon was regarded as a physical amount of NH adsorbed from the vapor phase. The3
adsorption process. The extent of 12 adsorption was number of moles was calculated from the adsorbate’s1similar to that of MB (see Fig. 9). The highly hydrophilic weight divided by molecular weight of NH –H O. The3 2
surfaces of the micropores formed by electrochemical amount of all four adsorbates which adsorbed increasedoxidation are a factor in determining the adsorption with the extent of oxidation. This was expected sincecapacity of nonpolar I . In this work the amount of I surface area increased with the extent of oxidation (see2 2
adsorption is less than adsorption into the same fibers after Fig. 10). The amount of the four compounds adsorbedsignificant loss of oxygenated functions from the pores (see followed the order: NH (and/or NH aq.).3 3
following paper [24]). However, a steady increase in I CH CH OH.C H CH .CCl . It is clear that adsorption2 3 2 6 5 3 4
adsorption occurs as the extent of electrochemical oxida- from the vapor phase was strongly affected by the adsor-tion increases. This is consistent with the increase in bate’s polarity. The higher the polarity, the more wasspecific surface areas measured by DR/CO . About 444.5 adsorbed. Decreasing adsorption occurs as molecular size2
21mmol g of iodine was adsorbed per gram of carbon (Van der Waals diameter) increases suggesting the oxidize
21fibers when the extent of oxidation was 5652 C g . fibers have molecular sieving capabilities.
C.U. Pittman et al. / Carbon 37 (1999) 1797 –1807 1805
Fig. 10. Amount of carbon tetrachloride, toluene, ethanol or ammonia (and/or ammonium hydroxide) adsorbed onto electrochemicallyoxidized carbon fibers at 258C after 24 h, vs. the extent of oxidation.
21The adsorption of NH may be enhanced by exothermic C g . NaOH uptake showed that acidic functional groups3
ionization–solvation of surface acidic functions as well as were generated on fiber surfaces in amounts that increased21by solvation-induced swelling that may allow more pore to over 1.1 mmol g as the extent of oxidation increased
21volume to be accessed. Certainly, the oxidized fibers were to 6360 C g . Two models were used to estimate the fibergood NH adsorbents. Over 1.5 mmol of NH were surface area vs. extent of oxidation from NaOH uptake.3 3
adsorbed per gram of fiber at 258C from the gas phase The specific surface areas determined from DR/CO2
where the NH vapor pressure above the aqueous ammonia adsorption approximately matched the lower limit of the3
solution (concentration of NH 5|28 wt.%, density 0.90) surface area approximated by NaOH uptake. However,3
is |447 mm Hg [70]. The [NH ]–[H 0] mole ratio in the BET/N measurements were unable to detect most of the3 2 2
vapor was about 447:24. A combination of NH and H O new surface generated by oxidation. XPS studies con-3 2
of an unknown ratio are adsorbed so adsorbed species may firmed the oxidations produced more 2COOH surfacebe an aqueous NH . functions as the extent of oxidation proceeded. However,3
˚Electrochemically oxidized fibers may turn out to be the overall O–C ratios in the outer 50 A region of the fiberselective adsorbents. As illustrated by Fig. 10, NH is far did not rise nearly enough to account for the quantity of3
more readily adsorbed than CCl or toluene. We believe acidic functions detected by NaOH uptake or the DR/CO4 2
that varying the extent and rate of carbon fiber electro- surface area increases with progressive extents of oxida-chemical oxidation, as well as applying post thermal tion. Together with adsorption measurements, these studiestreatments, will lead to a variety of micropore surface require that an extensive micropore network, extending farareas, pore size distributions, surface activities and surface below the depth probed by XPS, be generated by electro-acidities. Thus, a range of selective adsorbents should be chemical oxidation. The majority of the new surfacepossible to achieve. generated is in small ultramicroporous structures which
cannot be accessed by nitrogen in BET/N measurements2
because thermal activation is required to achieve nitrogen4. Conclusion penetration into such a small pore structure. DR/CO2
2 21adsorption at 273 K demonstrated that |50 m g of21High-strength PAN-based carbon fibers can be continu- surface area was generated at 6360 C g . Aqueous NaOH
ously oxidized electrochemically by applying various is able to access an even larger surface than DR/CO by2
currents for a variety of residence times in which the fibers an exothermic solvation–capillarity mechanism whichserve as anodes in 1% wt. aqueous KNO solutions. The assists penetration throughout the micropore structure.3
1 1extent of electrochemical oxidation was varied up to 6360 The amount of Ag , MB and I adsorbed on the2
1806 C.U. Pittman et al. / Carbon 37 (1999) 1797 –1807
[14] Da Y, Wang D, Sun M, Chen C, Yue J. Compos Sci Technoloxidized fibers increased as the extent of oxidation went1 1987;30:119.up. The adsorption capacity of Ag onto the fibers is much
1 1 [15] Harvey J, Kozlowski C, Sherwood PMA. J Mater Scihigher than that of MB or I . Ag adsorption strongly21987;22:1585.depended on solution pH further suggesting aqueous base
[16] Jones C. Surf Interface Anal 1993;20:357.can access a larger internal microporous surface via a[17] Nakao F, Takenaka Y, Asai H. Composites 1992;23:365.
solvation–pore penetration–swelling mechanism at a pH of[18] Baillie CA, Bader MG. J Mater Sci 1994;29:3822.
10–10.5. X-ray diffraction patterns proved that a portion of [19] Wang T, Sherwood PMA. Chem Mater 1994;6:788.1 0the Ag adsorbed was reduced to Ag . Extensive ad- [20] DeVilbiss TA, Wightman JP. In: Ishida H, Koenig JL,sorption of NH –H O from the vapor phase by electro-3 2 editors, Composite interfaces, New York: Elsevier, 1993, pp.chemically oxidized fibers occurred. The more polar the 307–16.adsorbate, the more was adsorbed from the vapor phase at [21] King TR, Adams DF, Buttry DA. In: Composites Science
and Technology, 1992, p. 351.258C (e.g. an adsorption order of NH (and/or NH aq.).3 3
[22] Barbier B, Pinson J, Desarmot G, Sanchez M. J ElectrochemCH CH OH.C H CH .CCl was found). This suggests3 2 6 5 3 4Soc 1990;137:1757.that properly prepared electrochemically oxidized carbon
[23] Pittman Jr. CU, Jiang W, Yue ZR, Leon y Leon CA. Carbonfibers might be excellent selective adsorbents.1999;37:85–96.
[24] Yue ZR, Jiang W, Wang L, Gardner SD, Pittman Jr CU,1999;37:1785–1796.
Acknowledgements [25] Alexander MR, Jones FR. Carbon 1996;34:1093.[26] Weitzsacker CL, Sherwood PMA. Surface and Interface
This research was supported in part by the National Analysis 1995;23:551.Science Foundation through Grant Nos. OSR-9452857 and [27] Fitzer E, Popovska N, Rensch HP. J Adhesion 1991;36:139.EPS-9452857. Support from the State of Mississippi and [28] Yosomiya R, Fujisawa T, Morimoto K. Polym Bull
1984;12:523.Mississippi State University is also gratefully acknowl-[29] Brewis DM, Comyn J, Fowler JR, Briggs D, Gibson VA.edged. C.U. Pittman Jr., and S.D.Gardner wish to acknowl-
Fiber Sci Technol 1979;12:41.edge the National Science Foundation (Grant[30] Rand B, Robinson R. Carbon 1979;15:257.No.CTS9212295), Mississippi State University and the[31] Belfiore LA, Shah RJ, Cheng C. Polym ComposDepartment of Chemical Engineering for funding to pur-
1989;10:122.chase the XPS/ISS instrumentation.
[32] Gardner SD, Singamsetty CSK, Booth GL, He G, Pittman Jr.CU. Carbon 1995;33:587.
[33] Wu Z, Pittman Jr. CU, Gardner SD. Carbon 1995;33:597.References [34] Gardner SD, Singamsetty CSK, Wu Z, Pittman Jr. CU.
Surface and Interface Analysis 1996;24:311.[35] Perakslis ED, Gardner SD, Pittman Jr. CU. J Adhes Sci[1] Donnet JB, Bansal RC. In: Carbon fibers, 2nd ed., New
Technol 1997;11:531.York: Marcel Dekker, 1990.[36] Pittman Jr. CU, He GR, Wu B, Gardner SD. Carbon[2] Murdie N. In: Marsh H, Heintz EA, Rodriguez-Reinoso F,
1997;35:317.editors, Introduction to carbon technologies, Spain: Universi-[37] Pittman Jr. CU, Wu Z, Jiang W, He GR, Wu B, Li W, Gardnerty of Alicante Press, 1997, p. 597.
SD. Carbon 1997;35:929.[3] Fitzer E, Weiss R. In: Processing and use of carbon fiberreinforced plastics, VDI Verlag, 1981, p. 45. [38] Allred RE, Schimpf WC. J Adhes Sci Technol 1994;8:383.
[4] Ishida H, editor, Interfaces in polymer, ceramic and metal [39] Donnet JB, Brendle M, Dhami TL, Bahl OP. Carbonmatrix composites, New York: Elsevier, 1988. 1987;24:757.
[5] Fitzer E, Weiss R. Carbon 1987;25:455. [40] Loh IH, Cohen RE, Baddour RF. J Mater Sci 1987;22:2937.[6] Lehman S, Robinson R, Tse MK. In: Proc 31st Intl SAMPE [41] Jones C, Sammann E. Carbon 1990;28:509.
Symp, Anaheim, CA, 1986, pp. 291–2. [42] Dagli G, Sung NH. Polym Compos 1989;10:109.[7] Plueddemann EP. Interfaces in polymer matrix composites, [43] Pittman Jr. CU, Jiang W, He GR, Gardner SD. Carbon
New York: Academic Press, 1974. 1998;36:25.[8] Hughes JDH. Composite Sci Technol 1991;41:13. [44] King TR, Adams DE, Buttry DA. Composites 1991;22:380.[9] Yosomiya R, Morimoto K, Nakajima A, Ikada Y, Suzuki T. [45] Lowell S, Shields JE. In: Powder Surface Area and Porosity,
Adhesion and binding in composites, New York: Marcel 3rd ed., New York: Chapman & Hall, 1991, p. 119.Dekker, 1990. [46] Ravikovitch PI, Gusev V Yu, Leon y Leon CA, Neimark AV.
[10] Tomonoh S, Sawanobori T. Composite Interfaces In: Extended abstracts, 23rd Biennial conf on Carbon, State1993;1:113. College, PA, 1997;1:136.
[11] Fitzer E, Geigl KH, Huttner W, Weiss R. Carbon [47] Hillebrand WF, Lundell GEF, Bright HA, Hoffman JI. In:1980;18:389. Applied Inorganic Analysis, 2nd ed., New York: John Wiley,
[12] Drzal LT, Rich MJ, Lloyd PFJ. Adhesion 1982;16:1. 1953, p. 207.[13] Ehrburger P, Herque JJ, Donnet JB. Petroleum derived [48] Fritz JS, Schenk Jr. GH. In: Quantitative analytical chemis-
carbons. American chemical society symposium series try, Boston, MA: Allyn & Bacon, 1966, p. 216.1975;21:324. [49] Xie Y, Sherwood PMA. Chem Mater 1990;2:293.

C.U. Pittman et al. / Carbon 37 (1999) 1797 –1807 1807
[50] Moulder JF, Stickle WF, Sobol PE, Bomben KD. In: [62] Mattson JS, Nark HB. Activated Carbon, New York: MarcelChastain J, editor, Handbook of X-ray photoelectron spec- Dekker, 1971.troscopy, Eden Prairie, MN: Perkin-Elmer, 1992, p. 253. [63] Brilar JC, Emeleus HJ, Nyholm SR, Trotman-Dickenson AF.
[51] Horie K, Murai H, Mita I. Fiber Sci Tech 1976;9:253. Comprehensive inorganic chemistry, Vol. 3, Pergamon Press[52] Weinberg NL, Reddy TB. J Appl Electrochem 1973;3:73. Ltd, 1973.[53] Rivin D. Rubber Chem Tech 1963;36:729. [64] Pun BR, Singh S, Mahajan OP. Indian J Chem 1965;3(2):54.[54] Polovina L, Babic B, Kaluderovic B, Dekanski A. Carbon [65] Ehrburger P, Dentzer J, Lahage J. Carbon 1987;25:129.
1997;35:1047. [66] Suh DJ, Park T-J, Ihm S-K. Ind Eng Chem Res[55] Jiang W. Ph.D. Thesis, Mississippi State University, 1998. 1992;31:1849.[56] Hoffman WP, Vastola FJ, Walker PL. Carbon 1984;22:585. [67] Fu R, Zeng H, Lu Y. Carbon 1994;32:593.[57] Gardner SD, He G, Pittman Jr. CU. Carbon 1996;34:1221. [68] Graham D. J Phys Chem 1955;50:896.[58] Waseem SF, Gardner SD, He G, Pittman Jr. CU. J Mater Sci [69] Meguro T, Torikai N, Watanabe N, Tomizuka I. Carbon
1998;33:3151. 1985;23:137.[59] Donnet JB, Bansal RD. In: Carbon Fibers, 2nd ed., New [70] Brilar JC, Emeleus HJ, Nyholin SR, Trotman-Dickenson AF,
York: Marcel Dekker, 1990, pp. 205–65. editors, Comprehensive inorganic chemistry, Vol. 2, Per-[60] Gregg SJ, Sing KSW. In: Adsorption, surface area and gamon Press Ltd, 1973, p. 225.
porosity, London: Academic Press, 1982, p. 132.[61] Koresh JE, Kim TH, Walker DRB, Koros WJJ. Chem Soci
Faraday Transactions, 1 1989;85:4311.