Non-polar interactions between cholesterol and phospholipids: a molecular dynamics simulation study
Upload
khangminh22Category
view
0download
0
RESEARCH ARTICLE
Membrane-Derived Phospholipids ControlSynaptic Neurotransmission and PlasticityVictoria García-Morales1, Fernando Montero1, David González-Forero1,Guillermo Rodríguez-Bey1, Laura Gómez-Pérez1, María Jesús Medialdea-Wandossell1,2,Germán Domínguez-Vías1, José Manuel García-Verdugo3, Bernardo Moreno-López1*
1 Grupo de Neurodegeneración y Neuroreparación (GRUNEDERE), Área de Fisiología, Facultad de Me-dicina, Universidad de Cádiz, Cádiz, Spain, 2 Salus Infirmorum, Universidad de Cádiz, Cádiz, Spain,3 Centro de Investigación Príncipe Felipe, CIBERNED, Universidad de Valencia, Valencia, Spain
AbstractSynaptic communication is a dynamic process that is key to the regulation of neuronal excit-
ability and information processing in the brain. To date, however, the molecular signals con-
trolling synaptic dynamics have been poorly understood. Membrane-derived bioactive
phospholipids are potential candidates to control short-term tuning of synaptic signaling, a
plastic event essential for information processing at both the cellular and neuronal network
levels in the brain. Here, we showed that phospholipids affect excitatory and inhibitory neu-
rotransmission by different degrees, loci, and mechanisms of action. Signaling triggered
by lysophosphatidic acid (LPA) evoked rapid and reversible depression of excitatory and
inhibitory postsynaptic currents. At excitatory synapses, LPA-induced depression de-
pended on LPA1/Gαi/o-protein/phospholipase C/myosin light chain kinase cascade at the
presynaptic site. LPA increased myosin light chain phosphorylation, which is known to trig-
ger actomyosin contraction, and reduced the number of synaptic vesicles docked to active
zones in excitatory boutons. At inhibitory synapses, postsynaptic LPA signaling led to de-
phosphorylation, and internalization of the GABAAγ2 subunit through the LPA1/Gα12/13-pro-
tein/RhoA/Rho kinase/calcineurin pathway. However, LPA-induced depression of
GABAergic transmission was correlated with an endocytosis-independent reduction of
GABAA receptors, possibly by GABAAγ2 dephosphorylation and subsequent increased lat-
eral diffusion. Furthermore, endogenous LPA signaling, mainly via LPA1, mediated activity-
dependent inhibitory depression in a model of experimental synaptic plasticity. Finally, LPA
signaling, most likely restraining the excitatory drive incoming to motoneurons, regulated
performance of motor output commands, a basic brain processing task. We propose that
lysophospholipids serve as potential local messengers that tune synaptic strength to prece-
dent activity of the neuron.
PLOS Biology | DOI:10.1371/journal.pbio.1002153 May 21, 2015 1 / 30
OPEN ACCESS
Citation: García-Morales V, Montero F, González-Forero D, Rodríguez-Bey G, Gómez-Pérez L,Medialdea-Wandossell MJ, et al. (2015) Membrane-Derived Phospholipids Control SynapticNeurotransmission and Plasticity. PLoS Biol 13(5):e1002153. doi:10.1371/journal.pbio.1002153
Academic Editor: Alberto Bacci, ICM—Institut duCerveau et de la Moelle épinière Hôpital Pitié-Salpêtrière 47, bd de l'Hôpital, FRANCE
Received: September 16, 2014
Accepted: April 15, 2015
Published: May 21, 2015
Copyright: © 2015 García-Morales et al. This is anopen access article distributed under the terms of theCreative Commons Attribution License, which permitsunrestricted use, distribution, and reproduction in anymedium, provided the original author and source arecredited.
Data Availability Statement: All relevant data arewithin the paper and its Supporting Information files.
Funding: This work was supported by grants fromSpain’s Ministerio de Economía y Competitividad(SAF2011-23633) and the Junta de Andalucía’sConsejería de Innovación, Ciencia y Empresa(PAI2011-CTS-7281) to BML. The funders had norole in study design, data collection and analysis,decision to publish, or preparation of the manuscript.

Author Summary
Neuronal networks are modules of synaptic connectivity that underlie all brain functions,from simple reflexes to complex cognitive processes. Synaptic plasticity allows these net-works to adapt to changing external and internal environments. Membrane-derived bioac-tive phospholipids are potential candidates to control short-term synaptic plasticity. Wedemonstrate that lysophosphatidic acid (LPA), an important intermediary in lipid metab-olism, depresses the main excitatory and inhibitory synaptic systems by different mecha-nisms. LPA depresses inhibitory synaptic transmission by reducing the number ofpostsynaptic receptors at inhibitory synapses; whereas it depresses excitatory synaptictransmission by decreasing the size of the ready-to-use synaptic vesicle pool at excitatoryterminals. Finally, we demonstrate that LPA signaling contributes to the performance ofmotor output commands in adult animals. Our data documents that synaptic strength andneuronal activity are modulated by products of membrane phospholipid metabolism,which suggests that bioactive phospholipids are candidates in coupling brain function tothe metabolic status of the organism.
IntroductionActivity-dependent plasticity of neuronal networks refers to the adaptive changes in their prop-erties in response to external and internal stimuli. In a prominent form of central nervous sys-tem (CNS) plasticity, synaptic strength results in an increase (potentiation) or decrease(depression) of transmission efficacy, depending on the neuron’s precedent activity (activity-dependent synaptic plasticity). Short-lived processes that modify synaptic strength occur inpractically all types of synapses [1], and short-term synaptic plasticity is essential in regulatingneuronal excitability and is central to information processing at both cellular and neuronal net-work levels [2]. Homeostatic adjustment of synaptic weights counteracts neuronal rate distur-bances that affect self-tuning neuronal activity within a dynamic range via Ca2+-dependentsensors [3]. The number of receptors in the surface membrane and at synaptic sites, and thesize of the readily releasable pool (RRP) of synaptic vesicles (SVs), are important determinantsof synaptic strength, short-term plasticity, and intersynaptic crosstalk [4–8]. Unmasking thefeedback mechanisms that are believed to sense neuron activity and adjust synaptic strength(i.e., activity-dependent, coupled messenger synthesis and/or release) would help to explainhow circuits adapt during synaptic homeostasis, experience-dependent plasticity, and/or syn-aptic dysfunctions that underlie cognitive decline in many neurological diseases.
The ligand-gated ionotropic channels—A-type GABAA receptors (GABAARs) and AMPA-type glutamate receptors (AMPARs)—mediate fast synaptic transmission at the vast majorityof inhibitory and excitatory synapses, respectively, in the mammalian brain [4,5,9]. Cell surfacestability of receptors is further regulated by post-translational phosphorylation, palmitoylation,and/or ubiquitination. In particular, AMPAR and GABAAR phosphorylation modulates the re-ceptor’s biophysical properties and membrane trafficking. Hence, the coordinated activity ofkinases and phosphatases plays a pivotal role in controlling synaptic strength and neuronal ex-citability. Key residues within the intracellular domains of diverse AMPAR and GABAAR sub-units are targeted by a number of kinases, including protein kinases A and C, calcium/calmodulin-dependent kinase II, and tyrosine kinases of the Src family. Generally, phosphory-lation stabilizes the receptor on the surface and, conversely, dephosphorylation appears to beimportant for receptor endocytosis [4,9].
LPA Controls Synaptic Strength and Plasticity
PLOS Biology | DOI:10.1371/journal.pbio.1002153 May 21, 2015 2 / 30
Competing Interests: The authors have declaredthat no competing interests exist.
Abbreviations: aCSF, artificial cerebrospinal fluid;AMPAR, AMPA-type glutamate receptor; a.z.,active zone; bPTX, b oligomer of PTX; CaN,calcineurin; Cap, calcineurin auto-inhibitory peptide;CNS, central nervous system; cRNA, control non-interfering siRNA; ePSC, evokedpostsynaptic current; eEPSC, evoked excitatorypostsynaptic current; eIPSC, evoked inhibitorypostsynaptic current; GABAAR, A-typeGABA receptor; HMN, hypoglossal motoneuron; HN,hypoglossal nucleus; ir, immunoreactive; LPA,lysophosphatidic acid; LPAR, LPA receptor; MAPK,mitogen-activated protein kinase; mIPSC, miniaturequantal inhibitory postsynaptic current; MLC, myosinlight chain; MLCK, myosin light chain kinase;NMDAR, N-methyl-D-aspartate receptor; PBS,phosphate-buffered saline; PKC, protein kinase C;PLC, phospholipase C; PPR, paired-pulse ratio; PTX,pertussis toxin; ROCK, Rho kinase; RRP, readilyreleasable pool; siRNA, small interfering RNA; SMN,spinal cord motoneuron; STD, short-term depression;SV, synaptic vesicle; TTX, tetrodotoxin; VGAT,vesicular GABA transporter; VGLUT2, vesicularglutamate transporter 2; VLRF, ventrolateralreticular formation.

Lysophosphatidic acid (LPA) is a strong candidate to function as a local messenger that rap-idly affects synaptic strength. A membrane-derived bioactive phospholipid that affects all bio-logical systems, LPA is an important intermediary in lipid metabolism and has a vital role in denovo biosynthesis of membrane phospholipids [10]. The nervous system is markedly modulat-ed by LPA signaling. LPA, autotaxin (the main LPA-synthesizing enzyme), and many subtypesof LPA-specific G-protein-coupled receptors (LPA1–6) are enriched in the brain [10–12].Downstream signaling cascades mediating LPA signaling include mitogen-activated protein ki-nase (MAPK) activation, adenylyl cyclase inhibition or activation, phospholipase C (PLC) acti-vation/Ca2+ mobilization and/or protein kinase C (PKC) activation, arachidonic acid release,Akt/PKB activation, and the activation of small GTPase RhoA and subsequent Rho kinase(ROCK) stimulation [10]. Many subtypes of LPA receptors (LPARs) are expressed in the brain;in particular, LPA1 is highly expressed and is the most prevalent receptor subtype in both theembryonic and adult brains [13–15]. Accordingly, LPA targets all CNS cell types to modulatedevelopmental processes including neurogenesis, migration, differentiation, and morphologi-cal and functional changes [10]. However, little is known about how LPA signaling influencesneuron physiology and neuronal connectivity or integrates incoming synaptic drive. Presynap-tic LPA2 at glutamatergic synapses mediates neuronal network hyperexcitability in an epilepticmouse model [16]. In addition, LPA1-deficient mice manifest alterations in managing diverseneurotransmitters [17–20]. Endogenous ROCK activity, an intracellular partner in LPA signal-ing, is necessary to maintain afferent AMPAergic and GABAAergic synaptic strength in moto-neurons [8]. As a conventional link in synaptic plasticity, activity-dependent LPA productionoccurs downstream of noxious activation of glutamate receptors in models of neuropathic pain[21]. However, whether LPA signaling is actually able to modulate synaptic strength and medi-ate activity-dependent synaptic plasticity remains unresolved.
The aim of this study was to investigate whether LPA regulates synaptic strength and plas-ticity of motoneuron excitatory and inhibitory synapses. Here, we show that LPA—mainly viaLPA1—induced rapid and reversible depression in synaptic strength (short-term depression[STD]), and operated as an autocrine messenger mediating activity-dependent STD at inhibi-tory synapses. At glutamatergic synapses, presynaptic LPA signaling reduced the size of theRRP of SVs. At GABAergic synapses, postsynaptic LPA action mediated dephosphorylationand endocytosis-dependent internalization of the GABAAγ2 subunit. Strikingly, LPA signalingregulated the performance of motor output commands in vivo. Therefore, LPA seems to haveimportant implications for synaptic plasticity, pathology, and information processing in thebrain.
ResultsThe hypoglossal motor system was used as an experimental model to test the hypothesis thatLPA regulates synaptic function. Hypoglossal motoneurons (HMNs) are arranged in the hypo-glossal nucleus (HN) at the dorsal medulla, being easily accessible for functional studies in ani-mal models. In vitro, AMPAR- and GABAAR-mediated neurotransmission incoming toHMNs can be feasibly isolated and are well characterized [8]. From an experimental point ofview, a considerable advantage of this system is that the inspiratory-related afferent activity inHMNs, almost exclusively mediated by AMPAergic signaling, persists even in the in vivo de-cerebrated preparation [22,23]. Interestingly, HMNs underpin essential motor commands fornormal suckling behavior in the neonate, a vital activity altered in LPA1-deficient mice [24]. Inaddition, lpa1–6 mRNAs are expressed by HMNs in the adult mouse (Allen Mouse Brain Atlas,http://mouse.brain-map.org/; [25]). Altogether, previous findings point to this motor system as
LPA Controls Synaptic Strength and Plasticity
PLOS Biology | DOI:10.1371/journal.pbio.1002153 May 21, 2015 3 / 30

a suitable model to investigate the role of LPA in the control of excitatory and inhibitory synap-tic neurotransmission at the CNS.
Anatomical Support for a Role of Lysophospholipids at Excitatory andInhibitory SynapsesTo explore a possible role of LPA in shaping the normal motor output of the HN, it was neces-sary to determine the predominant isotype of its main target receptors expressed in this motornucleus. Assessment of the expression levels of mRNAs for LPA1–6 receptors in microdissectedHN from neonatal (P7) rats revealed that lpa1 mRNA was 1.5 to 12.5 times more abundantthan lpa2–6 transcripts (Fig 1A). Subsequently, confocal analysis of double immunolabeled HNfrom P7 pups showed LPA1-immunoreactive (ir) puncta, patches, and fiber-like structures
Fig 1. Expression pattern of LPA1 in the HN supports a role for lysophospholipids in the control ofsynaptic neurotransmission. (A) Expression levels of mRNA for indicated LPARs obtained by qRT-PCR ofmicrodissected HNs from neonatal rats (P7) relative to the housekeeping GAPDH. Values were normalizedtaking mean value for lpa1 as 1. *p < 0.05, one-way ANOVA on Ranks relative to lpa2–6. Plot data can befound in S1 Data. (B–K) Multiple immunolabeling confocal images of the HN from P7 rats showing a closerelationship between LPA1-ir patches and structures expressing the nonphosphorylated form ofneurofilament H (SMI32), a motoneuron marker (B–F), VGLUT2- (G, H, open arrows), and/or VGAT-ir (I-K)inputs. The 18.8 ± 2.1% (n = 35 HMNs) of VGLUT2-ir and 11.9 ± 1.6% (n = 51 HMNs) of VGAT-ir inputsapposed to HMN somata colocalized with LPA1-ir patches. Note that in 3-D reconstructions (E, F, and Hb),LPA1 staining colocalizes and borders SMI32-ir somata and dendrites (E, F, arrows). The yz- and xz-planesalso confirm colocalization of LPA1-ir with excitatory (Ha, open arrows) and inhibitory (K) inputs. Finally,VGLUT2- (Hb) and VGAT-ir (I) inputs appeared apposed on LPA1-containing SMI32-ir dendrites. The xz- andyz-planes are located as indicated by the white dashed lines. Scale bars: B, 50 μm; G, 25 μm; C, D, and J,10 μm; E and I, 5 μm; and F, H, and K, 2 μm.
doi:10.1371/journal.pbio.1002153.g001
LPA Controls Synaptic Strength and Plasticity
PLOS Biology | DOI:10.1371/journal.pbio.1002153 May 21, 2015 4 / 30

colocalizing with SMI32-positive HMN perikarya and dendrite-like structures (Fig 1B–1D).Three-dimensional reconstructions agreed with a cytoplasmic and membrane localization ofLPA1 in perikarya and main dendritic branches of HMNs (Fig 1E and 1F). Triple immunofluo-rescence for LPA1, SMI32, and the vesicular glutamate (VGLUT2) or GABA (VGAT) trans-porters as synaptic markers confirmed that LPA1-ir puncta were colocalizing with excitatory(VGLUT2-ir) or inhibitory (VGAT-ir) presynaptic structures (Fig 1G, 1H, 1J, and 1K). Bothexcitatory and inhibitory inputs were also found apposed to SMI32-ir neuropil or somata coex-pressing LPA1 (Fig 1H and 1I). Although LPA1 expression in other neural cell types is not ex-cluded, this expression pattern supports pre and/or postsynaptic roles of LPA1 at the mainexcitatory and inhibitory inputs on HMNs, suggesting a potential contribution of LPA to mo-toneuron physiology.
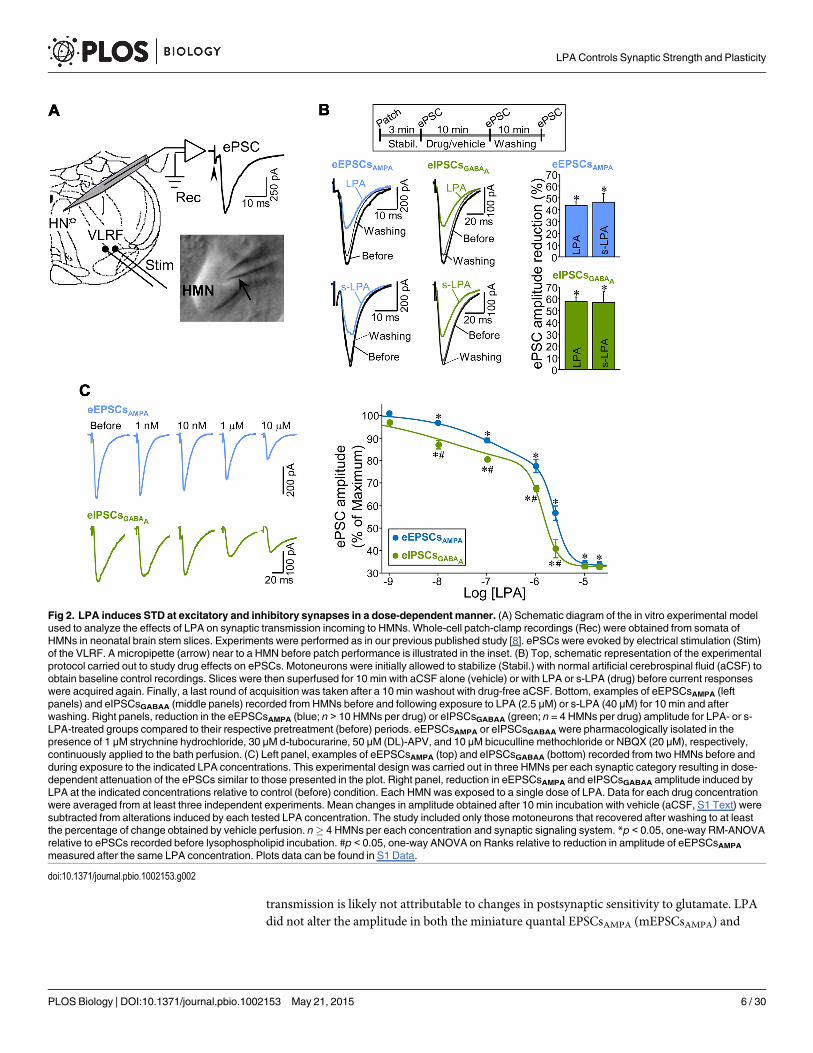
LPA Induces STD of Excitatory and Inhibitory Inputs in a Dose-Dependent MannerNext, we investigated the functional effects of LPA on glutamatergic and GABAergic synapticcurrents by whole-cell patch-clamp recordings of HMNs (slices from P6–P9 rats). Electricalstimulation of the ventrolateral reticular formation (VLRF) evoked postsynaptic currents(ePSCs) in HMNs (Fig 2A). The AMPAR- or GABAAR-mediated components of ePSCs (excit-atory [eEPSCsAMPA] or inhibitory postsynaptic currents [eIPSCsGABAA], respectively) were iso-lated and recorded as described in S1 Text.
The two major species of LPA (approximately 70%) found in the brain [26], monounsatu-rated (18:1, or LPA) and saturated (18:0, or s-LPA), were used in this study. While LPA acti-vates LPA1–3, s-LPA has high affinity for LPA1/2, but is a comparatively poor agonist againstLPA3 [27]. Unless stated otherwise, LPA was used at a similar concentration (2.5 μM) to thatfound in serum (1–5 μM) [28]. In general, unsaturated LPAs are more potent than s-LPA in ac-tivating LPARs and inducing biological activities [29]. Accordingly, a higher concentration wasused for s-LPA (40 μM) than for LPA (2.5 μM) to achieve a similar effect on neurotransmis-sion. Both phospholipids, added for 10 min to the bath solution, strongly attenuated the ampli-tude of eEPSCsAMPA and eIPSCsGABAA (Fig 2B). The effects were reversed after 10 min ofwashing. Thus, LPA modulated rapidly and reversibly the strength of AMPAR- and GABAAR-mediated synaptic transmission in motoneurons.
The tested dose (2.5 μM) of LPA had a proportionately higher effect on inhibitory than onexcitatory inputs (Fig 2B and 2C). Further, differential sensitivity to LPA was studied by apply-ing various concentrations, ranging from 1 nM to 20 μM. After subtracting vehicle-inducedchanges (S1 Text), an effect on both currents was detectable at concentrations as low as 10 nMand increased with LPA concentration to a similar maximum reduction in both currents (ap-proximately 70%) at 10–20 μM (Fig 2C). Dose-response relationships were well fitted(p< 0.001; r2 > 0.99) by biphasic (two slopes) five-parameter logistic equations, suggestingthat LPA affects synaptic neurotransmission by multiple mechanisms. It remains to be deter-mined whether this is the consequence of the recruitment of diverse isoreceptors and/or down-stream signaling pathways. In any case, from the nanomolar to first-order micromolar range,LPA diminished inhibitory inputs (IC50 = 1.0 ± 0.17 μM) in greater proportions (p< 0.001,Kolmogorov-Smirnov test) than excitatory ones (IC50 = 1.8 ± 0.08 μM), but at higher concen-trations, LPA affected both synaptic systems similarly (Fig 2C).
LPA Operates Presynaptically at Excitatory InputsAs in our previously published study [8], a combined electrophysiological analysis was per-formed to identify the LPA synaptic site of action. LPA signaling on AMPAR-mediated
LPA Controls Synaptic Strength and Plasticity
PLOS Biology | DOI:10.1371/journal.pbio.1002153 May 21, 2015 5 / 30
transmission is likely not attributable to changes in postsynaptic sensitivity to glutamate. LPAdid not alter the amplitude in both the miniature quantal EPSCsAMPA (mEPSCsAMPA) and
Fig 2. LPA induces STD at excitatory and inhibitory synapses in a dose-dependent manner. (A) Schematic diagram of the in vitro experimental modelused to analyze the effects of LPA on synaptic transmission incoming to HMNs. Whole-cell patch-clamp recordings (Rec) were obtained from somata ofHMNs in neonatal brain stem slices. Experiments were performed as in our previous published study [8]. ePSCs were evoked by electrical stimulation (Stim)of the VLRF. A micropipette (arrow) near to a HMN before patch performance is illustrated in the inset. (B) Top, schematic representation of the experimentalprotocol carried out to study drug effects on ePSCs. Motoneurons were initially allowed to stabilize (Stabil.) with normal artificial cerebrospinal fluid (aCSF) toobtain baseline control recordings. Slices were then superfused for 10 min with aCSF alone (vehicle) or with LPA or s-LPA (drug) before current responseswere acquired again. Finally, a last round of acquisition was taken after a 10 min washout with drug-free aCSF. Bottom, examples of eEPSCsAMPA (leftpanels) and eIPSCsGABAA (middle panels) recorded from HMNs before and following exposure to LPA (2.5 μM) or s-LPA (40 μM) for 10 min and afterwashing. Right panels, reduction in the eEPSCsAMPA (blue; n > 10 HMNs per drug) or eIPSCsGABAA (green; n = 4 HMNs per drug) amplitude for LPA- or s-LPA-treated groups compared to their respective pretreatment (before) periods. eEPSCsAMPA or eIPSCsGABAA were pharmacologically isolated in thepresence of 1 μM strychnine hydrochloride, 30 μM d-tubocurarine, 50 μM (DL)-APV, and 10 μM bicuculline methochloride or NBQX (20 μM), respectively,continuously applied to the bath perfusion. (C) Left panel, examples of eEPSCsAMPA (top) and eIPSCsGABAA (bottom) recorded from two HMNs before andduring exposure to the indicated LPA concentrations. This experimental design was carried out in three HMNs per each synaptic category resulting in dose-dependent attenuation of the ePSCs similar to those presented in the plot. Right panel, reduction in eEPSCsAMPA and eIPSCsGABAA amplitude induced byLPA at the indicated concentrations relative to control (before) condition. Each HMNwas exposed to a single dose of LPA. Data for each drug concentrationwere averaged from at least three independent experiments. Mean changes in amplitude obtained after 10 min incubation with vehicle (aCSF, S1 Text) weresubtracted from alterations induced by each tested LPA concentration. The study included only those motoneurons that recovered after washing to at leastthe percentage of change obtained by vehicle perfusion. n� 4 HMNs per each concentration and synaptic signaling system. *p < 0.05, one-way RM-ANOVArelative to ePSCs recorded before lysophospholipid incubation. #p < 0.05, one-way ANOVA on Ranks relative to reduction in amplitude of eEPSCsAMPA
measured after the same LPA concentration. Plots data can be found in S1 Data.
doi:10.1371/journal.pbio.1002153.g002
LPA Controls Synaptic Strength and Plasticity
PLOS Biology | DOI:10.1371/journal.pbio.1002153 May 21, 2015 6 / 30
postsynaptic currents evoked by exogenous glutamate pulses (S1 Text; S1 Fig). For that reason,we sought evidence for a presynaptic mechanism by recording spontaneous AMPAergic synap-tic currents under facilitated spontaneous glutamate release (sEPSCsAMPA). In this condition,synaptic activity was a mixture of action potential-dependent and -independent events. AfterLPA treatment, the sEPSCsAMPA amplitude, but not frequency (10.8 ± 1.0 Hz, p = 0.761), re-versibly decreased to a value similar to that recorded for mEPSCsAMPA in control condition(before: 36.0 ± 3.8 pA; LPA: 24.0 ± 2.0 pA; Fig 3A–3C). This agrees with a LPA-induced full in-hibition of action potential-dependent events.
In addition, we evaluated eEPSCsAMPA facilitation using paired-pulse and repetitive afferentstimulation protocols as in our previously published study [8]. Under repetitive stimulation, achange in the amount of facilitation is considered to be attributable to a presynaptic change inthe release probability of neurotransmitter quanta [1]. In the control condition, paired-pulsestimulation displayed a strong facilitation of eEPSCsAMPA over the entire range of interstimu-lus intervals tested, but this was more pronounced at shorter interstimulus intervals (Fig 3D;S2 Fig). Facilitated PPR (paired-pulse ratio) showed a marked and reversible increase at 25 msand 50 ms intervals after application of either s- or LPA (abbreviated as s-/LPA; Fig 3D; S2Fig). On average, LPA and s-LPA increased the magnitude of PPR by 12.8% and 29.3% at 25ms, respectively. The finding that LPA also reversibly potentiated the facilitation index ofeEPSCsAMPA under repeated VLRF stimulation provided additional evidence in support ofthese outcomes (S1 Text; S3 Fig).
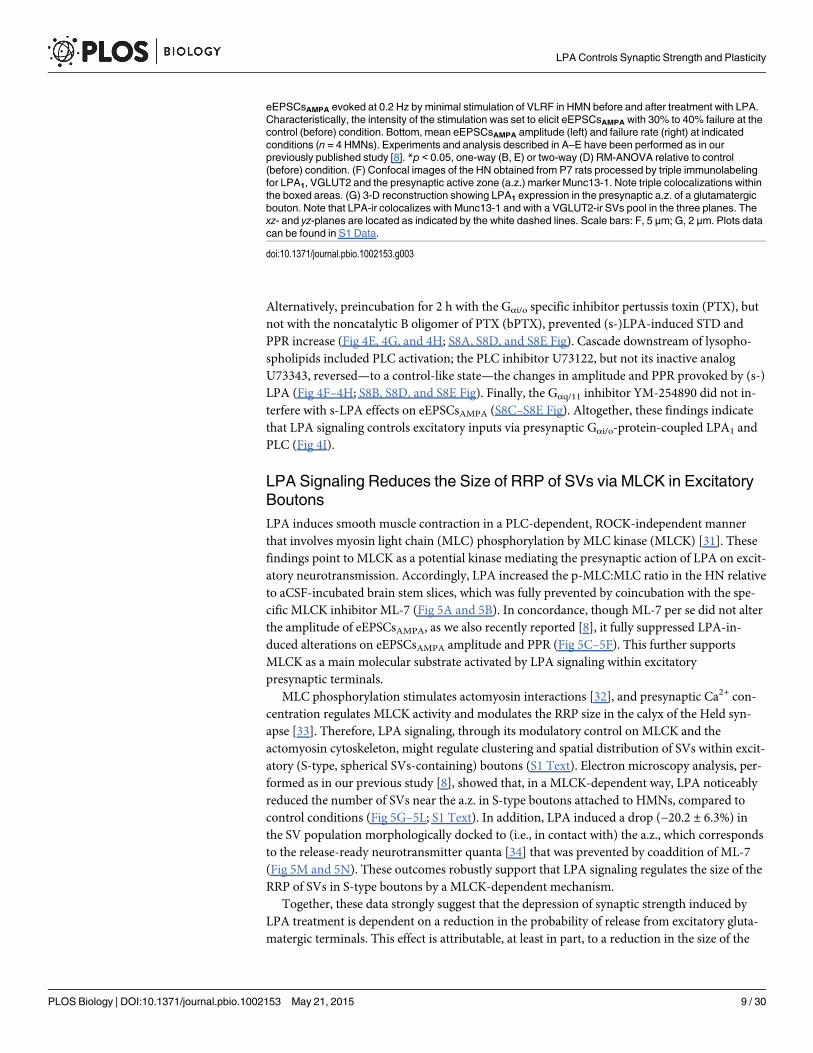
At this point in our study, the attenuation of eEPSCsAMPA induced by LPA was related to areduction in the glutamate release probability, which is believed to be determined by thenumber of fusion-competent SVs or the size of the RRP of SVs [6,7]. This idea was furtherstrengthened by a subsequent analysis of eEPSCsAMPA amplitude using the minimal stimulationparadigm, designed to stimulate only one fiber and a single or small number of release sites. Asin our previous study [8], the intensity of the stimulation was set to elicit eEPSCsAMPA with 30%to 40% failure (Fig 3E). In this context, LPA treatment evoked a significant reduction of themean amplitude of eEPSCsAMPA elicited by minimal stimulation and an enhancement of theeEPSCsAMPA failure rate (Fig 3E; S4 Fig). The presynaptic action of LPA on glutamatergic inputsis further supported because LPA1-ir puncta colocalize with Munc13-1, a presynaptic activezone (a.z.) marker [30], in VGLUT2-containing boutons (Fig 3F and 3G). The LPA1 associationwith a region of the presynaptic membrane compromised in the fusion of SVs supports thatLPA signaling has a direct relationship with the machinery involved in the regulation of neuro-transmitter release.
LPAModulates Excitatory Inputs via LPA1/Gα i/o-PLCThe qRT-PCR and immunohistochemical studies, together with additional pharmacologicaltests (S1 Text: S5 Fig; S6 Fig), robustly point to LPA1 as a pivotal LPAR affecting glutamatergicsynapses. In this context, injection of a small interfering RNA (siRNA) against lpa1 (siRNAlpa1;2 μg/2 μl) into the fourth ventricle efficiently reduced LPA1 expression in the brain stem (Fig4A; S1 Text; S7 Fig). siRNAlpa1 robustly diminished, but did not fully avoid, (s-)LPA-inducedalterations on eEPSCsAMPA amplitude and PPR relative to the administration of control nonin-terfering siRNA (cRNA; 2 μg/2 μl) or vehicle (RNase-free phosphate buffered saline; 2 μl) (Fig4A–4D). Whether the remaining response of eEPSCsAMPA to (s-)LPA could be due to residualLPA1 expression or to recruitment of compensatory mechanisms—e.g., via up-regulated LPA3
in response to LPA1 knockdown—remains to be elucidated.LPA1 couples with and activates three G proteins: Gα12/13, Gαi/o, and Gαq/11 [10]. Previous
findings [8] and pharmacological data (S1 Text) did not support Gα12/13 involvement.
LPA Controls Synaptic Strength and Plasticity
PLOS Biology | DOI:10.1371/journal.pbio.1002153 May 21, 2015 7 / 30
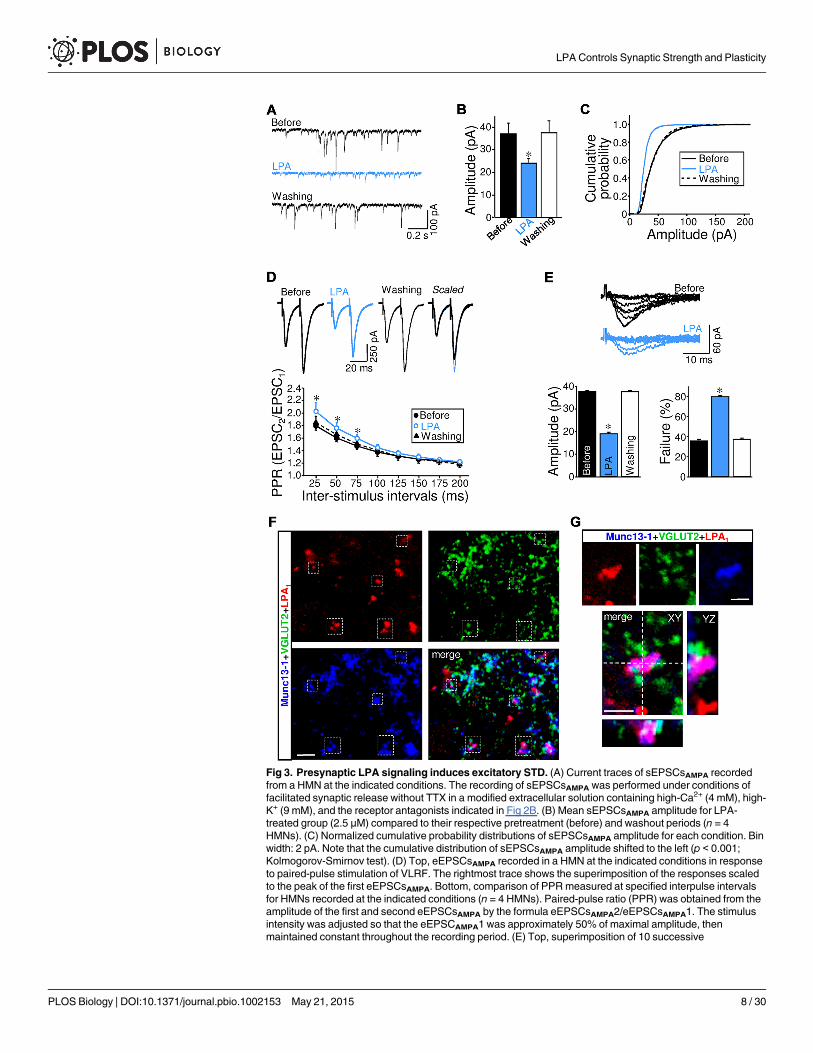
Fig 3. Presynaptic LPA signaling induces excitatory STD. (A) Current traces of sEPSCsAMPA recordedfrom a HMN at the indicated conditions. The recording of sEPSCsAMPA was performed under conditions offacilitated synaptic release without TTX in a modified extracellular solution containing high-Ca2+ (4 mM), high-K+ (9 mM), and the receptor antagonists indicated in Fig 2B. (B) Mean sEPSCsAMPA amplitude for LPA-treated group (2.5 μM) compared to their respective pretreatment (before) and washout periods (n = 4HMNs). (C) Normalized cumulative probability distributions of sEPSCsAMPA amplitude for each condition. Binwidth: 2 pA. Note that the cumulative distribution of sEPSCsAMPA amplitude shifted to the left (p < 0.001;Kolmogorov-Smirnov test). (D) Top, eEPSCsAMPA recorded in a HMN at the indicated conditions in responseto paired-pulse stimulation of VLRF. The rightmost trace shows the superimposition of the responses scaledto the peak of the first eEPSCsAMPA. Bottom, comparison of PPRmeasured at specified interpulse intervalsfor HMNs recorded at the indicated conditions (n = 4 HMNs). Paired-pulse ratio (PPR) was obtained from theamplitude of the first and second eEPSCsAMPA by the formula eEPSCsAMPA2/eEPSCsAMPA1. The stimulusintensity was adjusted so that the eEPSCAMPA1 was approximately 50% of maximal amplitude, thenmaintained constant throughout the recording period. (E) Top, superimposition of 10 successive
LPA Controls Synaptic Strength and Plasticity
PLOS Biology | DOI:10.1371/journal.pbio.1002153 May 21, 2015 8 / 30
Alternatively, preincubation for 2 h with the Gαi/o specific inhibitor pertussis toxin (PTX), butnot with the noncatalytic B oligomer of PTX (bPTX), prevented (s-)LPA-induced STD andPPR increase (Fig 4E, 4G, and 4H; S8A, S8D, and S8E Fig). Cascade downstream of lysopho-spholipids included PLC activation; the PLC inhibitor U73122, but not its inactive analogU73343, reversed—to a control-like state—the changes in amplitude and PPR provoked by (s-)LPA (Fig 4F–4H; S8B, S8D, and S8E Fig). Finally, the Gαq/11 inhibitor YM-254890 did not in-terfere with s-LPA effects on eEPSCsAMPA (S8C–S8E Fig). Altogether, these findings indicatethat LPA signaling controls excitatory inputs via presynaptic Gαi/o-protein-coupled LPA1 andPLC (Fig 4I).
LPA Signaling Reduces the Size of RRP of SVs via MLCK in ExcitatoryBoutonsLPA induces smooth muscle contraction in a PLC-dependent, ROCK-independent mannerthat involves myosin light chain (MLC) phosphorylation by MLC kinase (MLCK) [31]. Thesefindings point to MLCK as a potential kinase mediating the presynaptic action of LPA on excit-atory neurotransmission. Accordingly, LPA increased the p-MLC:MLC ratio in the HN relativeto aCSF-incubated brain stem slices, which was fully prevented by coincubation with the spe-cific MLCK inhibitor ML-7 (Fig 5A and 5B). In concordance, though ML-7 per se did not alterthe amplitude of eEPSCsAMPA, as we also recently reported [8], it fully suppressed LPA-in-duced alterations on eEPSCsAMPA amplitude and PPR (Fig 5C–5F). This further supportsMLCK as a main molecular substrate activated by LPA signaling within excitatorypresynaptic terminals.
MLC phosphorylation stimulates actomyosin interactions [32], and presynaptic Ca2+ con-centration regulates MLCK activity and modulates the RRP size in the calyx of the Held syn-apse [33]. Therefore, LPA signaling, through its modulatory control on MLCK and theactomyosin cytoskeleton, might regulate clustering and spatial distribution of SVs within excit-atory (S-type, spherical SVs-containing) boutons (S1 Text). Electron microscopy analysis, per-formed as in our previous study [8], showed that, in a MLCK-dependent way, LPA noticeablyreduced the number of SVs near the a.z. in S-type boutons attached to HMNs, compared tocontrol conditions (Fig 5G–5L; S1 Text). In addition, LPA induced a drop (−20.2 ± 6.3%) inthe SV population morphologically docked to (i.e., in contact with) the a.z., which correspondsto the release-ready neurotransmitter quanta [34] that was prevented by coaddition of ML-7(Fig 5M and 5N). These outcomes robustly support that LPA signaling regulates the size of theRRP of SVs in S-type boutons by a MLCK-dependent mechanism.
Together, these data strongly suggest that the depression of synaptic strength induced byLPA treatment is dependent on a reduction in the probability of release from excitatory gluta-matergic terminals. This effect is attributable, at least in part, to a reduction in the size of the
eEPSCsAMPA evoked at 0.2 Hz by minimal stimulation of VLRF in HMN before and after treatment with LPA.Characteristically, the intensity of the stimulation was set to elicit eEPSCsAMPA with 30% to 40% failure at thecontrol (before) condition. Bottom, mean eEPSCsAMPA amplitude (left) and failure rate (right) at indicatedconditions (n = 4 HMNs). Experiments and analysis described in A–E have been performed as in ourpreviously published study [8]. *p < 0.05, one-way (B, E) or two-way (D) RM-ANOVA relative to control(before) condition. (F) Confocal images of the HN obtained from P7 rats processed by triple immunolabelingfor LPA1, VGLUT2 and the presynaptic active zone (a.z.) marker Munc13-1. Note triple colocalizations withinthe boxed areas. (G) 3-D reconstruction showing LPA1 expression in the presynaptic a.z. of a glutamatergicbouton. Note that LPA-ir colocalizes with Munc13-1 and with a VGLUT2-ir SVs pool in the three planes. Thexz- and yz-planes are located as indicated by the white dashed lines. Scale bars: F, 5 μm; G, 2 μm. Plots datacan be found in S1 Data.
doi:10.1371/journal.pbio.1002153.g003
LPA Controls Synaptic Strength and Plasticity
PLOS Biology | DOI:10.1371/journal.pbio.1002153 May 21, 2015 9 / 30

Fig 4. LPAmodulates AMPAR-mediated neurotransmission via LPA1/Gαi/o-PLC. (A) Schematic diagram of microinjections performed in the fourthventricle of neonatal rats at P4. A solution (2 μl) containing the vehicle (RNase-free phosphate-buffered saline [PBS]), control noninterfering RNA (cRNA,2 μg) or a small interfering RNA directed against lpa1 (siRNAlpa1, 2 μg) was administered by means of a Hamilton syringe. (B) Representative eEPSCsAMPA
recorded in HMNs obtained from animals receiving the specified treatments recorded at the indicated conditions. (C, D) Mean eEPSCsAMPA amplitudereduction (C, in percent) and PPR ratio increase (D, in percent) in response to addition to the bath of LPA (2.5 μM) or s-LPA (40 μM) measured at 25 msinterpulse intervals for HMNs recorded under the indicated treatments (control, LPA: n = 13 HMNs, s-LPA: n = 6 HMNs; vehicle, LPA: n = 6 HMNs, s-LPA:n = 4 HMNs; cRNA, LPA: n = 6 HMNs, s-LPA: n = 4 HMNs; siRNA, LPA: n = 9 HMNs, s-LPA: n = 5 HMNs). *p < 0.05, one-way ANOVA relative to control,vehicle and cRNA conditions. (E) Effect of LPA on eEPSCsAMPA from two HMNs in response to paired-pulse stimulation under the presence of the Gαi/o
inhibitor pertussis toxin (PTX) (100 ng/ml; left) or the noncatalytic B oligomer of PTX (bPTX) (100 ng/ml; right). Slices were preincubated for 2 h with PTX orbPTX before recordings began and were maintained throughout the experimental procedure. (F) Representative eEPSCsAMPA from 4 HMNs in response topaired-pulse stimulation of VLRF showing the effects of the PLC inhibitor U73122 (1 μM) or its inactive analog U73343 (5 μM) per se (top) or coadded afterprevious incubation for 10 min with LPA (bottom). (G, H) Mean eEPSCsAMPA amplitude and PPR ratio (25 ms interpulse intervals) under the indicatedtreatments (PTX and bPTX, n = 6 HMNs; U73122, n = 5 HMNs; LPA+U73122, n = 5 HMNs; U73343, n = 4 HMNs; LPA+U73343, n = 5 HMNs). *p < 0.05,one-way RM-ANOVA relative to control (before) condition. (I) Diagram of the proposed pathway mediating LPA-induced STD at AMPAergic signaling,indicating drug targets. Plots data can be found in S1 Data.
doi:10.1371/journal.pbio.1002153.g004
LPA Controls Synaptic Strength and Plasticity
PLOS Biology | DOI:10.1371/journal.pbio.1002153 May 21, 2015 10 / 30

Fig 5. LPA rearranges SVs at excitatory boutons in a MLCK-dependent manner. (A) Western blot of phosphorylated and total MLC protein levels(denoted as pMLC and MLC, respectively) in the HN of neonatal brain stem slices incubated for 10 min in aCSF alone (control) or supplemented with eitherLPA (2.5 μM), vehicle (0.2% DMSO), LPA + vehicle, or LPA + ML-7 (10 μM). α-tubulin (α-tub) expression was the internal loading reference. (B) Histogramshowing the average ratio of pMLC to total MLC densitometric intensity for the control and treated slices. Ratio values were normalized relative to the controlgroup. Columns represent the average of at least three independent experiments. *p < 0.05, one-way ANOVA on Ranks relative to control condition. (C)eEPSCsAMPA recorded from two HMNs in normal aCSF and after 10 min bath perfusion with the indicated combination of drugs. (D) Average eEPSCAMPA
amplitude for the ML-7 (n = 5 HMNs) and LPA+ML-7 (n = 7 HMNs) treated groups of HMNs compared with their respective pretreatment controls (before). (E)eEPSCsAMPA evoked in HMNs by paired-pulse stimulation of VLRF before and following treatment with LPA and finally after coaddition of ML-7. (F) Changesin PPR of eEPSCsAMPA measured in HMNs exposed sequentially to LPA and LPA+ML-7. *p < 0.05, one-way RM-ANOVA relative to the control condition inD and F. (G, H) Electron micrographs of two S-type boutons (containing spherical vesicles) with asymmetric synaptic contacts on the somatic membrane of aHMN depicting details of the procedure used to examine topographically the numerical changes in SVs. The number of SVs was counted in three zones,each 0.1 μmwide, parallel to the membrane of the synaptic cleft and at successively greater distances from the a.z. (G). The first region (red dashed line)encloses an area directly adjacent to the a.z. membrane. The intermediate region (orange dashed line) was located in the interval from 0.1 μm to 0.2 μm
LPA Controls Synaptic Strength and Plasticity
PLOS Biology | DOI:10.1371/journal.pbio.1002153 May 21, 2015 11 / 30

RRP of SVs. Our results reaffirm that LPA signaling modulates excitatory synaptic transmis-sion through mechanisms modulating the presynaptic component of the synapse.
LPA-Induced Inhibitory STD Comprises Postsynaptic LPA1-RhoA/ROCK-CaN Signaling and GABAAγ2 DephosphorylationNext, we explored whether LPA modulates GABAergic and glutamatergic synapses by similarmechanisms of action. Amplitude, but not frequency, of miniature quantal IPSCsGABAA(mIPSCsGABAA) recorded in HMNs was reduced by LPA, in agreement with a postsynaptic siteof action (Fig 6A; S9 Fig). The molecular cascade downstream of LPA is also distinct, sinceLPA-induced alterations on mIPSCsGABAA were reversed by the ROCK inhibitor H1152 (Fig6A; S9 Fig). H1152 also returned (s-)LPA-induced changes in eIPSCGABAA amplitude to a con-trol-like state (S10A and S10B Fig). In support of a non-presynaptic action of s-LPA oneIPSCsGABAA, the mean PPR remained similar to the control condition in the presence of s-LPA or s-LPA plus H1152 (S10C and S10D Fig). Colocalization in HMNs of LPA1-ir with thepostsynaptic marker gephyrin, a clustering protein for GABAARs [35], strengthened the evi-dence of a postsynaptic site of action for LPA (Fig 6B).
Postsynaptic action and the molecular signaling underlying LPA-induced modulation ofGABAAergic system were assessed in primary cultures of spinal motoneurons (SMNs) (S1Text; S11 Fig). The mean amplitude of inward GABAAR-mediated current evoked byexogenous GABA pulses (−4.13 ± 0.98 nA; n = 8 SMNs) was robustly reduced by s-LPA(−62.5 ± 10.1%, p< 0.001, one-way ANOVA for repeated measures (RM-ANOVA)), in aROCK-dependent way (s-LPA+H1152: −3.23 ± 0.49 nA, p = 0.345) (Fig 6C). In addition, weobserved that s-LPA activated the small GTP-binding protein RhoA, the major ROCK activa-tor, in SMNs. This was evidenced by an s-LPA-induced increase (+78.3 ± 25.7%; p< 0.05, one-way ANOVA on Ranks) in the membrane (M):cytosolic (C) ratio of RhoA expression relativeto the control condition (Fig 6D). Supplementary data support LPA signaling as the activatorfor the RhoA/ROCK pathway in motoneurons (S1 Text; S12 Fig). Furthermore, pretreatmentwith siRNAlpa1 prevented the effects of (s-)LPA on GABAAR-mediated currents compared tocRNA-treated SMNs, providing conclusive evidence of postsynaptic LPA1 involvement (Fig 6Eand 6F; S1 Text; S13 Fig).
Phosphorylation of serine 327 on the GABAAγ2 subunit (pGABAAγ2) regulates GABAARclustering and synaptic strength at inhibitory synapses [36,37]. Therefore, we investigatedwhether LPA1-ROCK signaling regulates phosphorylation of GABAAγ2. Contrary to expecta-tions of a direct interaction between ROCK and GABAAγ2, s-LPA induced a robust reduction(−83.3 ± 5.2%) of the pGABAAγ2:GABAAγ2 ratio in SMNs that was prevented by coaddition ofH1152 (+1.6 ± 6.0%) (Fig 6G). This was also observed in the HN (S1 Text; S14 Fig). Strikingly,direct binding of the phosphatase calcineurin (CaN) to GABAAγ2 subunits dephosphorylatesSer327 [37,38], which leads to a reduction in inhibitory postsynaptic current amplitude [37].
away from the a.z. Finally, the more distant region (white dashed line) occupied an area corresponding to the distance interval from 0.2 μm to 0.3 μm. Thetotal number of SVs contained in each bouton section was also quantified (H). (I–K) Electron micrographs of S-type boutons in contact with the somaticmembrane of HMNs from neonatal rats following incubation (10 min) of brain stem slices in aCSF alone (control) or supplemented with LPA or LPA+ML-7 atconcentrations indicated in A. The boxed region (red dashed line) encloses the area directly adjacent to the a.z. membrane. (L) Quantitative changes in thenumber of SVs (expressed as percentage change from control) are shown in each spatial compartment. Histogram bins indicate distances from the a.z. asindicated in the legend. Increment in the number of the total pool of SVs per bouton section is also illustrated (yellow bars). (M) High-magnification electronmicroscopy images showing in detail the SVs (membranes in contact with the presynaptic density) docked to the a.z. (arrowheads). Scale bars: G–K,200 nm; M, 100 nm. (N) Histogram showing the linear density of docked SVs per μm of a.z. under the indicated conditions. Control, n = 133 boutons/a.z.;vehicle, n = 54/104 boutons/a.z.; LPA, n = 102 boutons/a.z.; LPA plus ML-7, n = 102 boutons/a.z. *p < 0.05, one-way ANOVA relative to the controlcondition. Experiments and analysis were performed as in our previous published study [8]. Plots data can be found in S1 Data.
doi:10.1371/journal.pbio.1002153.g005
LPA Controls Synaptic Strength and Plasticity
PLOS Biology | DOI:10.1371/journal.pbio.1002153 May 21, 2015 12 / 30

Fig 6. LPA induces GABAAergic STD and GABAAγ2 dephosphorylation via postsynaptic LPA1-RhoA/ROCK-CaN signaling. (A) Spontaneouslyoccurring mIPSCsGABAA recorded from a representative HMN before and after perfusion with the indicated combination of drugs. Bottom, meanmIPSCsGABAA amplitude (left) and frequency (right) at indicated conditions (n = 5 HMNs). mIPSCsGABAA were pharmacologically isolated in the presence of1 μM tetrodotoxin (TTX), 1 μM strychnine hydrochloride, 30 μM d-tubocurarine, 50 μM (DL)-APV, and NBQX (20 μM) continuously applied to the bathperfusion. *p < 0.05, one-way RM-ANOVA relative to the control (before) condition. (B) Multiple immunolabeling confocal images of the HN from P7 ratsshowing colocalization between LPA1-ir and gephyrin-ir (top). 3-D reconstruction (bottom) showing that LPA1-ir colocalizes with gephyrin in a SMI32-ir HMN.n, HMN nucleus. The xz- and yz-planes are located as indicated by the white dashed lines. Scale bars: 5 μm. (C) Whole-cell GABAAergic currents evoked by100 ms pressure pulses of GABA (applied at saturating concentration; 1 mM) in two spinal motoneurons (SMNs) under indicated treatments. Recordingswere performed in the presence of TTX in nominally Ca2+-free solution. (D) Western blots of total (T), cytosolic (C), and membrane-associated (M) RhoA inSMNs in untreated and s-LPA incubated (for 10 min) cultures. (E) Whole-cell GABAAergic currents evoked by pulses of GABA in SMNs preincubated withcRNA (top) or siRNAlpa1 (bottom) before and after superfusion with the indicated drugs. (F) Summary data showing the changes in GABAAergic currentsmeasured in SMNs exposed at different treatments (n� 5 SMNs per group). #, *p < 0.05, one-way ANOVA or RM-ANOVA, respectively, relative to s-LPA orLPA treatments of cRNA preincubated SMNs. (G) Western blot (top) and averaged ratio (bottom) of phosphorylated and total GABAAγ2 subunit protein levels(denoted as pGABAAγ2 and GABAAγ2, respectively) in SMNs incubated (10 min) with aCSF alone (control) or supplemented with indicated drugs. β-actinwas an internal loading reference. (H) Same as in C under indicated treatments. SMNs were preincubated for 30 min with the calcineurin (CaN) autoinhibitorypeptide (Cap; 50 μM). (I) Changes of CaN activity in lysates from cultured SMNs untreated (control) or treated for 10 min with the indicated drugs. *p < 0.05,one-way ANOVA on Ranks relative to control condition. Plots data can be found in S1 Data.
doi:10.1371/journal.pbio.1002153.g006
LPA Controls Synaptic Strength and Plasticity
PLOS Biology | DOI:10.1371/journal.pbio.1002153 May 21, 2015 13 / 30
Therefore, recruitment of CaN (also named Ca2+/calmodulin-dependent phosphatase 2B), wasproposed as a potential link between LPA1-ROCK signaling and GABAAγ2 dephosphorylation.
Preincubation of SMNs with CaN autoinhibitory peptide (Cap; 50 μM) also prevented(+4.8 ± 16.5%) s-LPA from inducing a reduction in pGABAAγ2:GABAAγ2 ratio (Fig 6G).Expression of GABAAγ2 remained unchanged regardless of treatment (Fig 6G). s-LPA alsohad no effect on the GABA-evoked currents in SMNs pretreated with Cap for 30 min (Cap:2.2 ± 0.3 nA; Cap+s-LPA: 2.1 ± 0.3 nA; n = 5 SMNs) (Fig 6H). s-LPA-induced alterations inmIPSCsGABAA and eIPSCsGABAA in HMNs were also CaN-dependent (S1 Text; S15 Fig). Addi-tionally, CaN activity strongly increased in SMNs after incubation with s-LPA, but not withs-LPA plus H1152 or H1152 alone (Fig 6I). Altogether, these data show that (s-)LPA, specifi-cally acting through postsynaptic LPA1-RhoA/ROCK-CaN signaling pathway, regulateGABAAR-mediated neurotransmission, by a mechanism involving dephosphorylation ofGABAAγ2 subunit at Ser
327.
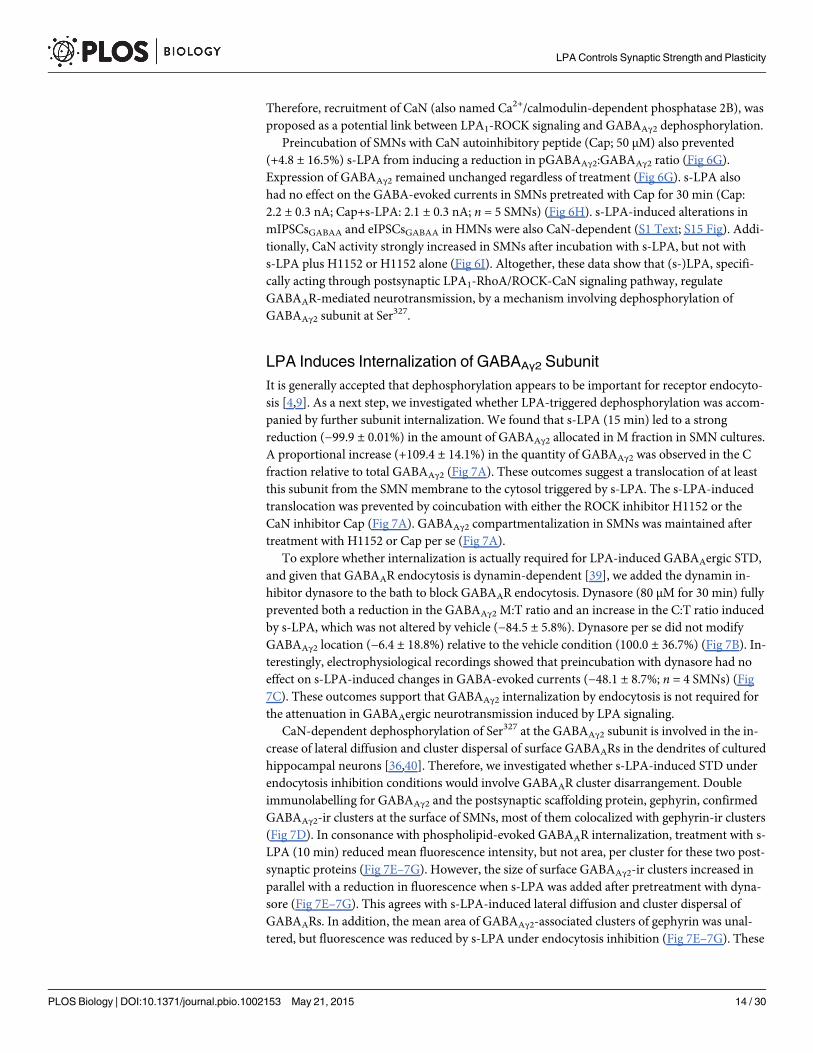
LPA Induces Internalization of GABAAγ2 SubunitIt is generally accepted that dephosphorylation appears to be important for receptor endocyto-sis [4,9]. As a next step, we investigated whether LPA-triggered dephosphorylation was accom-panied by further subunit internalization. We found that s-LPA (15 min) led to a strongreduction (−99.9 ± 0.01%) in the amount of GABAAγ2 allocated in M fraction in SMN cultures.A proportional increase (+109.4 ± 14.1%) in the quantity of GABAAγ2 was observed in the Cfraction relative to total GABAAγ2 (Fig 7A). These outcomes suggest a translocation of at leastthis subunit from the SMNmembrane to the cytosol triggered by s-LPA. The s-LPA-inducedtranslocation was prevented by coincubation with either the ROCK inhibitor H1152 or theCaN inhibitor Cap (Fig 7A). GABAAγ2 compartmentalization in SMNs was maintained aftertreatment with H1152 or Cap per se (Fig 7A).
To explore whether internalization is actually required for LPA-induced GABAAergic STD,and given that GABAAR endocytosis is dynamin-dependent [39], we added the dynamin in-hibitor dynasore to the bath to block GABAAR endocytosis. Dynasore (80 μM for 30 min) fullyprevented both a reduction in the GABAAγ2 M:T ratio and an increase in the C:T ratio inducedby s-LPA, which was not altered by vehicle (−84.5 ± 5.8%). Dynasore per se did not modifyGABAAγ2 location (−6.4 ± 18.8%) relative to the vehicle condition (100.0 ± 36.7%) (Fig 7B). In-terestingly, electrophysiological recordings showed that preincubation with dynasore had noeffect on s-LPA-induced changes in GABA-evoked currents (−48.1 ± 8.7%; n = 4 SMNs) (Fig7C). These outcomes support that GABAAγ2 internalization by endocytosis is not required forthe attenuation in GABAAergic neurotransmission induced by LPA signaling.
CaN-dependent dephosphorylation of Ser327 at the GABAAγ2 subunit is involved in the in-crease of lateral diffusion and cluster dispersal of surface GABAARs in the dendrites of culturedhippocampal neurons [36,40]. Therefore, we investigated whether s-LPA-induced STD underendocytosis inhibition conditions would involve GABAAR cluster disarrangement. Doubleimmunolabelling for GABAAγ2 and the postsynaptic scaffolding protein, gephyrin, confirmedGABAAγ2-ir clusters at the surface of SMNs, most of them colocalized with gephyrin-ir clusters(Fig 7D). In consonance with phospholipid-evoked GABAAR internalization, treatment with s-LPA (10 min) reduced mean fluorescence intensity, but not area, per cluster for these two post-synaptic proteins (Fig 7E–7G). However, the size of surface GABAAγ2-ir clusters increased inparallel with a reduction in fluorescence when s-LPA was added after pretreatment with dyna-sore (Fig 7E–7G). This agrees with s-LPA-induced lateral diffusion and cluster dispersal ofGABAARs. In addition, the mean area of GABAAγ2-associated clusters of gephyrin was unal-tered, but fluorescence was reduced by s-LPA under endocytosis inhibition (Fig 7E–7G). These
LPA Controls Synaptic Strength and Plasticity
PLOS Biology | DOI:10.1371/journal.pbio.1002153 May 21, 2015 14 / 30

Fig 7. LPA induces dephosphorylation and internalization of the GABAAγ2 subunit in a ROCK/CaN-dependent manner. (A, B) Western blot (top) and averaged ratio (bottom) of total (T), cytosolic (C), andmembrane-associated (M) GABAAγ2 in cultured SMNs incubated (10 min) with aCSF alone (control) orsupplemented with indicated drugs (A). Dynasore (80 μM) or vehicle (0.2% DMSO) were added to theincubation solution 30 min before subsequent s-LPA coaddition for 10 min (B). β-actin was an internal loadingreference for T and C fractions and an indicator for fractionation purity. The average densitometric signals forthe GABAAγ2 C and M samples were expressed as a fraction of T GABAAγ2 of the same samples andnormalized to the corresponding ratio determined for samples representing control conditions. *p < 0.05,one-way ANOVA on Ranks relative to control or vehicle condition. (C) Same as in Fig 6C under indicatedtreatments. Treatment with dynasore began at least 30 min before patch performance and was present allalong the recording protocol. (D) Left, low-magnification photomicrographs showing a group of SMNs at 6days in vitro treated for 40 min with aCSF alone and stained for GABAAγ2. Right, detail of a SMN exemplifyingclose association between GABAAγ2- and gephyrin-ir clusters. (E, F) Examples of GABAAγ2- and gephyrin-irclusters in the surface of neurites obtained from SMNs treated for 40 min with dynasore (E) or 30 min withdynasore plus 10 min with s-LPA+dynasore (F). Scale bars: D, 50 μm; E, F, 5 μm. (G) Normalized meancluster area (left) and fluorescence intensity (right) of GABAAγ2- and gephyrin-ir clusters analyzed under the
LPA Controls Synaptic Strength and Plasticity
PLOS Biology | DOI:10.1371/journal.pbio.1002153 May 21, 2015 15 / 30
results are compatible with s-LPA-induced disorganization of GABAAR clusters that concludesin receptor internalization. Effects under the presence of dynasore support that this GABAARdisarrangement might involve previous lateral diffusion and cluster dispersal of surfaceGABAARs like that reported previously for cultured hippocampal neurons [36,40].
In summary, our data highlight a pathway by which, via recruitment of RhoA/ROCK signal-ing, postsynaptic LPA1 evokes CaN-dependent dephosphorylation at Ser327 of the GABAAγ2
subunit, which is followed by GABAAR cluster dispersion and its concomitant translocationfrom the plasma membrane to the cytosol (Fig 7H). The latter does not seem to be required forthe reduction in GABAAergic synaptic strength triggered by LPA. Phospholipid-induced syn-aptic strength depression seems to be mainly supported by GABAAγ2 dephosphorylation andsubsequent GABAAR cluster dispersal.
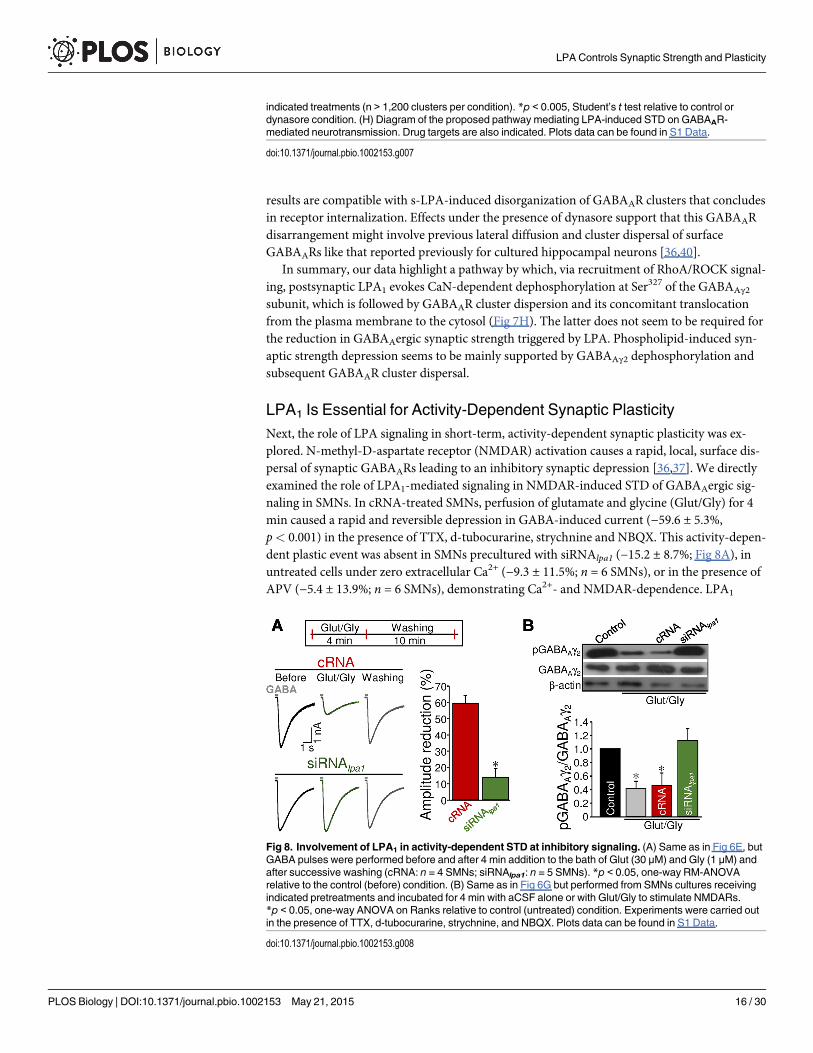
LPA1 Is Essential for Activity-Dependent Synaptic PlasticityNext, the role of LPA signaling in short-term, activity-dependent synaptic plasticity was ex-plored. N-methyl-D-aspartate receptor (NMDAR) activation causes a rapid, local, surface dis-persal of synaptic GABAARs leading to an inhibitory synaptic depression [36,37]. We directlyexamined the role of LPA1-mediated signaling in NMDAR-induced STD of GABAAergic sig-naling in SMNs. In cRNA-treated SMNs, perfusion of glutamate and glycine (Glut/Gly) for 4min caused a rapid and reversible depression in GABA-induced current (−59.6 ± 5.3%,p< 0.001) in the presence of TTX, d-tubocurarine, strychnine and NBQX. This activity-depen-dent plastic event was absent in SMNs precultured with siRNAlpa1 (−15.2 ± 8.7%; Fig 8A), inuntreated cells under zero extracellular Ca2+ (−9.3 ± 11.5%; n = 6 SMNs), or in the presence ofAPV (−5.4 ± 13.9%; n = 6 SMNs), demonstrating Ca2+- and NMDAR-dependence. LPA1
indicated treatments (n > 1,200 clusters per condition). *p < 0.005, Student’s t test relative to control ordynasore condition. (H) Diagram of the proposed pathway mediating LPA-induced STD on GABAAR-mediated neurotransmission. Drug targets are also indicated. Plots data can be found in S1 Data.
doi:10.1371/journal.pbio.1002153.g007
Fig 8. Involvement of LPA1 in activity-dependent STD at inhibitory signaling. (A) Same as in Fig 6E, butGABA pulses were performed before and after 4 min addition to the bath of Glut (30 μM) and Gly (1 μM) andafter successive washing (cRNA: n = 4 SMNs; siRNAlpa1: n = 5 SMNs). *p < 0.05, one-way RM-ANOVArelative to the control (before) condition. (B) Same as in Fig 6G but performed from SMNs cultures receivingindicated pretreatments and incubated for 4 min with aCSF alone or with Glut/Gly to stimulate NMDARs.*p < 0.05, one-way ANOVA on Ranks relative to control (untreated) condition. Experiments were carried outin the presence of TTX, d-tubocurarine, strychnine, and NBQX. Plots data can be found in S1 Data.
doi:10.1371/journal.pbio.1002153.g008
LPA Controls Synaptic Strength and Plasticity
PLOS Biology | DOI:10.1371/journal.pbio.1002153 May 21, 2015 16 / 30

knockdown reduced by approximately 40% the magnitude of activity-dependent STD at inhib-itory synapses. From an extrapolation of these values to the dose-response curve in Fig 2C, itcould be indirectly estimated that local concentrations of phospholipids achieved in responseto those levels of motoneuron activity were first order micromolar, assuming all synthesizedand released phospholipids were the monounsaturated form of LPA (18:1).
Glut/Gly also caused a drastic decrease in the pGABAAγ2:GABAAγ2 ratio in untreated orcRNA-incubated SMNs, which was prevented by siRNAlpa1 (Fig 8B). Altogether, these data in-dicate that NMDAR-driven GABA-current depression was spike-independent and essential toextracellular Ca2+ entry via NMDARs and LPA1 activation, which downstream inducesSer327GABAAγ2 dephosphorylation.
Findings from activity-dependent synaptic plasticity experiments agree with the notion thatmotoneurons are potential sources for Ca2+-dependent, spike-independent synthesis and re-lease of lysophospholipids, which in turn might stimulate autocrine signaling pathways (tomodulate inhibitory synapses), at least by way of the LPA1 receptor. These outcomes alsostrongly point to lysophospholipids as paracrine retrograde messengers that act on presynapticLPA1 to regulate excitatory synapses; however, further research is needed to confirm thispossibility.
Endogenous LPA Signaling Restrains Baseline Activity of Motoneuronsin AdulthoodFinally, physiological involvement of LPA signaling in performance of motor output com-mands was investigated. In vivo, most HMNs exhibit rhythmic inspiratory-related burstingdischarges driven by glutamatergic brain stem afferents, mainly acting on AMPARs, with littleor no contribution of inhibitory inputs [22,23].
We began by analyzing the level and pattern of expression of the LPA1 receptor within theHN of the adult rat. qRT-PCR analysis showed that disparity between lpa1 and lpa2–6 tran-scripts in the HN was even more accentuated in adults than at the neonatal stage (Fig 9A). In-terestingly, mRNA and protein levels for LPA1 at adulthood were approximately 150% and140%, respectively, higher than in neonatal animals (Fig 9A and 9B). These results suggest again in relevance of LPA1-mediated signaling in the HN during postnatal development, sup-porting previous observations in the murine brain [41]. Immunohistochemistry revealedLPA1-ir puncta-like structures all along the HN (Fig 9C) and colocalization between VGLUT2-and LPA1-ir puncta (Fig 9D, 9E, and 9H). A high proportion of VGLUT2-ir inputs(47.9 ± 3.4%; n = 55 HMNs) apposed to the perikarya of SMI32-identified HMNs were coloca-lizing with LPA1-ir puncta (Fig 9E and 9F). This also supposed an increase of approximately150% during postnatal maturation. LPA1-ir appeared to border and colocalize with SMI32-irstructures (Fig 9G), supporting cytoplasmic and membrane location of LPA1 in adult HMNs.Therefore, the molecular machinery to support a role of LPA1 in modulating excitatory neuro-transmission is also present in adults.
Additionally, in vivo decerebrated rats maintain respiratory activity [22,23]. To look for arole of LPA signaling in processing motoneuron inspiratory activity, LPA1/3 inhibitors VPC32179 (0.5 mM), VPC 32183 (1 mM), and Ki16425 (2 mM) or its vehicle (10% DMSO) weremicroiontophoretically applied to antidromically-identified HMNs subjected to unitary extra-cellular recordings (Fig 9I). The effect of these drugs on the unitary basal firing inspiratory-re-lated activity of HMNs in basal conditions (end-tidal CO2 = 4.8%–5.2%) was evaluated. Thetime course of the mean firing rate averaged over the duration of the inspiratory burst (mFR/burst) was measured by applying increasing currents (−20 to −140 nA, 30 s duration) throughthe drug barrels (Fig 9J–9L). A current-dependent increase in the mFR/burst of HMNs was
LPA Controls Synaptic Strength and Plasticity
PLOS Biology | DOI:10.1371/journal.pbio.1002153 May 21, 2015 17 / 30

Fig 9. Endogenous LPA signaling restrains inspiratory-related baseline activity of HMNs in the adultrat. (A) Like Fig 1A, but tissue was extracted from adult rats. Inset, comparative expression levels of lpa1mRNA in HNs from neonatal (P7) and adult rats. *p < 0.05, one-way ANOVA on Ranks relative to lpa2–6 orthe adult condition in the inset. (B) Western blot for LPA1 in the HN at P7 and at the adult age. β-actin was aninternal loading reference. (C) Low-magnification confocal image taken from a selected region of the HN in anadult rat showing triple immunolabeling for SMI32, VGLUT2, and LPA1. (D) Double immunolabeling noticedLPA1 colocalizing with excitatory terminals (yellow) in the HN. (E, F) Confocal xy-planes showing immuneLPA1 staining colocalizing with excitatory terminals (yellow, arrowheads) and SMI32-ir structures (purple).Note in E a VGLUT2-immunopositive input colocalizing with LPA1 that is apposed to the soma of a LPA1-expressing HMN (n, HMN nucleus). (G, H) Images of LPA1 and SMI32 (G) or VGLUT2 (H) are shown in thexy-, xz-, and yz-planes illustrating 3-D reconstructions. The white and yellow crosshairs display locations ofxz- and yz-planes. Note that LPA1-ir colocalizes and borders SMI32-ir structures (E–G), supporting cytosolicand membrane localization of the LPAR in HMNs. It also colocalizes with VGLUT2 (E, F, and H), indicating itsexpression in excitatory terminals. Scale bars: C, 50 μm; D, 20 μm; E–H, 2 μm. (I) Schematic diagram of thein vivo experimental preparation. Unitary discharge activity (Rec) of HMNs was obtained in decerebrated,vagotomized, and artificially ventilated adult rats, which had been injected with a neuromuscular blockingagent. A three-barreled pipette with a barrel for electrophysiological recordings and another formicroiontophoretic administration of a drug are illustrated. HMNs were identified by their antidromic activationfrom the electrode (St.) implanted in the XIIth nerve and by the collision test (top traces) betweenspontaneous orthodromic (dot) and antidromic (asterisk) evoked action potentials. When the stimulus wastriggered by a spontaneous spike at a short latency, the antidromic action potential was occluded(arrowhead). Middle and bottom traces represent the extracellularly recorded spike discharge for aninspiratory HMN and the histogram of the instantaneous firing rate (FR, in spikes (sp)/s), respectively. Mean
LPA Controls Synaptic Strength and Plasticity
PLOS Biology | DOI:10.1371/journal.pbio.1002153 May 21, 2015 18 / 30

observed for all drugs but not when current was applied to the vehicle solution (Fig 9J–9L). Insummary, these data point to a physiological role for LPA signaling in motor output perfor-mance by restraining the inspiratory-related activity driven by glutamatergic inputs to HMNs.
DiscussionThe present study showed that bioactive membrane-derived phospholipids evoke rapid and re-versible synaptic depression and mediate activity-dependent synaptic plasticity, mainly viaLPA1. Phospholipids likely operate as local messengers in activity-dependent GABAergic STDin a Ca2+-dependent, spike-independent manner. Strikingly, at physiological concentrations ofnanomolar to first order micromolar, LPA has a greater effect on inhibitory than excitatory in-puts. Finally, LPA signaling regulates brain-elemental processing tasks such as performance ofmotor output commands. These data open a new scenario in which the membrane-phospho-lipid metabolism actively participates in controlling synaptic strength, and then affects neuro-nal excitability in physiological and pathological states.
Important determinants of synaptic strength, short-term plasticity and intersynaptic cross-talk mainly involve fine-tuning of the number of neurotransmitter receptors and the RRP sizeof SVs [4,8]. LPA depresses the main excitatory and inhibitory synaptic systems, affecting bothby different degrees, loci, and mechanisms of action. At glutamatergic synapses, and by way ofpresynaptic Gαi/o-protein-coupled LPA1 and PLC-MLCK activation, LPA results in MLC phos-phorylation, which might stimulate the actomyosin contractile apparatus [32] to reduce thebulk of the RRP of SVs (Fig 10). Depletion of some RRP of SVs usually underlies short-termforms of synaptic depression [1,2]. Ultrastructural correlates for LPA-induced STD furthersupported that functional synaptic changes are partly explained by a reduction in the size ofthe RRP of SVs. Changes in the actin cytoskeleton are a prerequisite for exocytosis, enablingdocking and fusion of SVs with the plasmalemma [32]. As in our results, LPA-dependentcontraction of smooth muscle cells involves activation of PLC and MLCK, followed by MLCphosphorylation [31] that promotes actomyosin interactions [32]. In this context, a physicalrelationship between p-MLC and glutamatergic synapses on adult and neonatal motoneuronshas been recently reported [42]. At the calyx of Held synapse, MLCK controls the size of thefast-releasing pool of SVs [43]. In addition, ROCK regulates p-MLC levels via MLCK inhibitionto maintain basal RRP ordering of SVs at excitatory inputs [8,42]. Therefore, presynaptic LPA-dependent and ROCK signaling seem to converge onto a common molecular mechanism,namely MLC phosphorylation and size of the RRP at excitatory synapses. It is interesting, then,that the ROCK inhibitor did not actually enhance LPA-induced depression of AMPAR cur-rents. These outcomes suggest that the antagonistic functional actions of ROCK and LPA1-sig-naling, converging on MLCK, results in a push–pull mechanism that regulates the size of theRRP of SVs at excitatory synapses.
At GABAergic synapses, LPA dephosphorylates Ser327 of GABAAγ2 subunits and favorsGABAAγ2 internalization via postsynaptic Gα12/13-coupled LPA1/RhoA/ROCK signaling and
firing rate (mFR, red dotted line) in each burst was measured and subsequently plotted along time. (J)Instantaneous firing rates (sp/s) of two HMNs in response to microiontophoretic administration of VPC 32183or vehicle (10%DMSO in PBS, pH 8.0) at the indicated current. During the before condition, a retentioncurrent of +5 nA is continuously applied. Note the lack of effect of vehicle and the stimulating effect exerted bythe application of the LPA1/3 inhibitor. (K) Time course of the mean FR (mFR, sp/s) per burst in response tomicroiontophoretic administration (30 s on, 60 s off) of VPC 32183 or vehicle at the indicated applied currents.(L) Mean current-response curves illustrating the effects of microiontophoretically-administered LPA1/3
antagonists VPC 32179 (0.5 mM; n = 7 HMNs), VPC 32183 (1 mM; n = 5 HMNs), Ki16425 (2 mM; n = 8HMNs) or vehicle (n = 4 HMNs) on motoneuron activity characterized by the change in the mFR per burst.Plots data can be found in S1 Data.
doi:10.1371/journal.pbio.1002153.g009
LPA Controls Synaptic Strength and Plasticity
PLOS Biology | DOI:10.1371/journal.pbio.1002153 May 21, 2015 19 / 30

subsequent CaN activation (Fig 10). The cell surface stability of GABAARs is regulated by post-translational modifications such as phosphorylation. GABAAR phosphorylation is involved inthe modulation of receptor biophysical properties and membrane trafficking [44]. Phosphory-lation stabilizes the GABAAR on the surface and, conversely, dephosphorylation is importantfor receptor endocytosis [4]. NMDAR activation causes GABAAR cluster dispersal and lateraldiffusion by CaN activation and dephosphorylation of Ser327GABAAγ2 [36,40], leading tolong-term depression at CA1 inhibitory synapses [37]. Dispersal could involve receptor cluster-ing at clathrin-coated sites at the plasmalemma, which invaginate and pinch off to form cla-thrin-coated vesicles. Internalized receptors are then either subject to rapid recycling or aretargeted for lysosomal degradation [4].
Our results indicated that the LPA1-RhoA/ROCK-CaN pathway dephosphorylates theGABAAγ2 subunit, which undergoes lateral diffusion, dispersal of clusters, and subsequent en-docytosis (Fig 10). However, endocytosis does not seem to be crucial for LPA-induced func-tional depression at GABAAergic neurotransmission, which seemed to be mainly supported byGABAAγ2 dephosphorylation and subsequent clusters dispersal of surface GABAARs. The ki-netic recovery suggests rapid replenishment of the synaptic GABAAR content, given that re-es-tablishment of inhibitory synaptic strength occurred with 7 to 10 min washing after LPA-induced depression. The coordinated action of kinases and phosphatases, downstream ofLPA1-triggered signaling, then plays a pivotal role in controlling neuronal excitability by mod-ulation of GABAAγ2 phosphorylation and receptor recycling.
The present results seem controversial in relation to our previous findings demonstrating apresynaptic role for endogenous baseline ROCK activity in the regulation of AMPAergic and
Fig 10. Proposedmechanism by which a membrane-derived bioactive phospholipid such as LPA regulates synaptic strength. LPA affects mainexcitatory and inhibitory synapses by different degrees, loci, and mechanisms of action. At glutamatergic synapses (left diagram), binding of phospholipids topresynaptic Gαi/o-protein-coupled LPA1 indirectly activates MLCK via PLC, promoting MLC phosphorylation and subsequent actomyosin cytoskeletoncontraction. This would alter the spatial distribution of SVs within the presynaptic terminal and the RRP size of SVs, which results in rapid and reversibleexcitatory STD. At the GABAergic synapse (right diagram), LPA—synthesized and/or released in response to Ca2+ entry through NMDAR—interacts withpostsynaptic Gα12/13-coupled LPA1, then activates RhoA/ROCK. Subsequently, phosphatase calcineurin acts to dephosphorylate Ser327 of the GABAAγ2
subunit, which in turn undergoes lateral diffusion and internalization by endocytosis. Dephosphorylation of the GABAAγ2 component of GABAARs results inrapid and reversible inhibitory STD.
doi:10.1371/journal.pbio.1002153.g010
LPA Controls Synaptic Strength and Plasticity
PLOS Biology | DOI:10.1371/journal.pbio.1002153 May 21, 2015 20 / 30

GABAAergic neurotransmission [8]; here, we describe that ROCK also acts postsynaptically tomediate LPA-induced depression of the GABAAergic transmission. Whether presynaptic base-line ROCK activity in inhibitory inputs depends on membrane-derived bioactive lipid media-tors, such as LPA and/or sphingosine 1-phosphate, remains to be elucidated. Nevertheless, atglutamatergic synapses, ROCK activity is likely independent of LPA1/3 signaling, because in-hibitors of these receptors did not mimic AMPAergic STD induced by ROCK inhibition. How-ever, we cannot discard the involvement of another LPAR in maintaining baseline ROCKactivity in the synaptic terminals. Interestingly, although presynaptic ROCK is active in our ex-perimental conditions [8], postsynaptic endogenous activity of ROCK, if any, is even below thelevel required to reveal its impact on synaptic strength and membrane properties [8] of moto-neurons. This could be explained by the differential expression of ROCK isoforms at the twocompartments, ROCKα in the postsynaptic site and ROCKβ in the presynaptic one, and/or thelower concentration of ROCKα in motoneurons relative to synaptic structures [8]. Anyway,data suggest that when motoneuron activity is low, presynaptic ROCK activity maintains in-hibitory synaptic strength by stabilizing the size of the RRP of SVs. However, after exogenousaddition of LPA or when motoneuron activity rises, and subsequent coupled LPA synthesisand/or release occurs, postsynaptic LPA1 stimulates ROCK. This leads to deinhibition byGABAAγ2 dephosphorylation and receptor endocytosis.
In the rat, the highest LPA concentration in tissue is found in the brain [12]. Cultured corti-cal neurons produce LPA at nanomolar concentrations [45], but LPA levels increase up to10 μM after injury, trauma, or hemorrhage involving blood–brain barrier damage [46]. Here,physiological concentrations (nanomolar to first order micromolar) of LPA affected GABAer-gic to a greater degree than glutamatergic inputs, achieving maximal and similar affectation at10 μM. Thus, it is possible that LPA signaling maintains neuronal excitability around a dynam-ic range, promoting deinhibition at low levels of neuronal activity and depressing excitatory in-puts when activity increases, perhaps as part of a homeostatic mechanism that preventsexcitotoxicity. Any candidate for coupling synaptic strength to neuronal activity must be regu-lated by activity at the postsynaptic site. Interestingly, noxious stimulation of primary afferentneurons induces LPA production in the dorsal horn in a glutamate-dependent manner [21].Here, LPA signaling, mainly via LPA1, was essential in STD of inhibitory inputs triggered byprecedent activity of the neuron. Autocrine LPA signaling was essential for NMDAR-drivenGABA-current depression, which depends on extracellular Ca2+ entry passing throughNMDARs. Activity-dependent synaptic plasticity occurred independently of the generation ofaction potentials at the postsynaptic neuron. Postsynaptic [Ca2+] increase and LPA signalingdependence for activity-dependent STD in cultured motoneurons strongly support that thiscell type is a potential source for activity-dependent LPA synthesis and/or release.
Despite the apparent lack of endogenous LPA signaling affecting synaptic strength in our invitro model, local iontophoretic application of three LPA1/3 inhibitors increased, in a dose-de-pendent manner, the baseline inspiratory-related activity of HMNs in the adult rat. This rhyth-mic inspiratory-related bursting discharge of HMNs is driven mainly by glutamatergic brainstem afferences, with little or no contribution of inhibitory inputs [22,47]. There is an apparentgain in relevance of LPA1-mediated signaling in the HN during postnatal development, to thedetriment of LPA2–6-triggered pathways, as well as excitatory inputs apposed to adult HMNsexpress LPA1. Taken together, these findings support that phospholipids, most likely activatingLPA1 at glutamatergic synapses, controlled physiological inspiratory-related activity of HMNs,presumably by restraining their AMPAergic input drive [22]. Thus, endogenous LPA signalingphysiologically contributes in the performance of normal patterns of motor output commandsin adult animals.
LPA Controls Synaptic Strength and Plasticity
PLOS Biology | DOI:10.1371/journal.pbio.1002153 May 21, 2015 21 / 30

Alterations in phospholipid homeostasis affect various pathological conditions, thus attract-ing increased diagnostic and pharmacological interest [48]. The exquisite balance between ex-citatory and inhibitory inputs is critical for the proper functioning of the brain, and itsimbalance leads to the cognitive impairment associated with neurodegenerative diseases andmetabolic syndromes related to obesity, dyslipidemia, lipodystrophy, insulin resistance, and al-coholism [49–51]. In particular, LPA production and/or autotaxin are increased in obesity-as-sociated metabolic diseases [52], induced hypercholesterolemia [53], congenital lipodystrophy[54], as well as in ethanol-fed mice [55] and in patients with Alzheimer disease [56] or multiplesclerosis [57]. In addition, phospholipids uptake in mammalian cells depends on their activa-tion status, a critical support for cellular incorporation of nutrition-derived fatty acids. Im-ported phospholipids are utilized for production of bioactive lipids, such as LPA [58], andthereby modify synaptic transmission. Therefore, we can point to LPA as a promising candi-date in coupling brain function, by modulating synaptic strength and plasticity, to the metabol-ic condition of the organism across physiological and pathological states.
Materials and MethodsWistar rats of either sex and CD1 pregnant mice were obtained from an authorized supplier (An-imal Supply Services, University of Cádiz, Spain), and were cared for and handled in accordancewith the guidelines of the European Union Council (86/609/UE) and Spanish regulations (BOE67/8509-12; BOE 1201/2005) on the use of laboratory animals. Animals were individuallyhoused—except neonatal animals, which were housed with their mother—in cages with waterand food pellets available ad libitum, under temperature-controlled conditions at 21 ± 1°C, witha 12 h light and dark cycle. Efforts were made to minimize the number of animals used and theirsuffering. All surgical procedures were carried out under aseptic conditions. Experimental proce-dures were approved by the local Animal Care and Ethics Committee.
Electrophysiological RecordingsIn vitro whole-cell patch-clamp recordings of motoneurons. Whole-cell patch-clamp
experiments were performed on cultured SMNs or on HMNs from transverse brain stem slices(300–400 μm thick) of P6–P9 rats as previously described [8,42,59]. Whole-cell AMPAergic re-sponses were recorded at a holding potential of −65 mV with the KGluconate-based intracellu-lar solution. GABAA postsynaptic currents were recorded in cells voltage-clamped at −75 mVusing the CsCl-based electrode solution. The AMPAergic or GABAAergic component of theevoked currents was pharmacologically isolated as indicated in the legend of Fig 2B.
Unitary extracellular recordings of HMNs in the adult rat. Adult animals (250–300 gr)were prepared for extracellular recordings as reported previously [60,61]. Tracheotomized,vagotomized, and decerebrated animals were paralyzed and mechanically ventilated. End-tidalCO2 was kept at 4.8%–5.2% along the recording session. Three-barreled, microfilament-filledglass pipettes were used for single-unit recording and microiontophoretic drug administration.
ImmunohistochemistryBrain stem coronal sections (30 μm thick) and SMNs were processed by immunohistochemis-try against vesicular glutamate (VGLUT2), GABA (VGAT) transporters, GABAAγ2 subunit,gephyrin and/or Munc13-1 as synapse-related markers, LPA1, and/or the nonphosphorylatedform of neurofilament H (SMI32) as a motoneuron marker, following standard protocols.
LPA Controls Synaptic Strength and Plasticity
PLOS Biology | DOI:10.1371/journal.pbio.1002153 May 21, 2015 22 / 30

Electron MicroscopyBrain stem slices (300 μm thick) incubated for 10 min (approximately 22°C), with aCSF alone,0.2% DMSO (vehicle) or with various drug treatments were immediately fixed and processedfor electron microscopy analysis. Ultrathin sections (70–80 nm thick) were analyzed at highmagnification (43,000x). Only boutons, contacting with motoneurons at the level of the nucle-olus, evidencing at least an a.z. were included in this study [8].
siRNA-Mediated Silencing of lpa1Neonatal rats (P4) received an acute injection of siRNAlpa1, or nontargeting siRNA (cRNA),(2 μg/rat) in 2 μl of RNase-free PBS into the fourth ventricle. The target sequence for the siR-NAlpa1 was UCAUUGUGCUUGGUGCCUU. A group of animals was infused with 2 μl ofRNase-free PBS (vehicle) as an additional control. Primary cultures of SMNs were incubatedwith 2.5 μl of either cRNA or siRNAlpa1 (each 100 μM) for 72 h at 37°C. Cells were then collect-ed for qRT-PCR analyses or used for electrophysiological studies.
Quantitative Real-Time Reverse Transcriptase PCR (qRT-PCR)Total RNA was extracted from the HN or cultured SMNs using TRIzol, and 0.5 μg of RNA wasused for cDNA synthesis with iScript cDNA synthesis. The PCR primers were as indicated inS2 Table.
Western BlottingTotal protein was extracted from microdissected HNs, NSC34 cells, and membrane and cytosolfractions of NSC34 cells and SMNs. Membranes were blotted with specific antibodies againstGABAAγ2, p
Ser327GABAAγ2, LPA1, p-MLC, MLC, or RhoA. Membranes were also probed withanti-α1-tubulin or anti-β-actin antibodies as control for the total amount of protein containedin each well.
Statistics and Data AnalysisData are expressed as the mean ± standard error of the mean (SEM). The number of analyzedspecimens per experimental condition is indicated in figure legends or in the result section.Data were obtained from at least three animals per experimental condition. In ROCK activity,western blotting and qRT-PCR experiments, each individual assay was performed by using tis-sue samples collected from at least six animals per experimental condition. Quantitative datafrom ROCK and CaN activity assays, western blot, and qRT-PCR represent the average of, atleast, three independent experiments. Applied statistical tests per experimental condition areindicated in figure legends or in results. Post hoc Holm Sidak or Dunn tests were applied forANOVA for repeated measures or on Ranks, respectively. In all cases, the minimum signifi-cance level was set at p< 0.05.
Supporting InformationS1 Data. A dataset file with original data for all figures.(XLSX)
S1 Fig. LPA does not act postsynaptically on AMPAergic signaling. (A) Traces of spontane-ously occurring mEPSCsAMPA recorded from a representative HMN before and after 10 minbath perfusion with LPA (2.5 μM). mEPSCsAMPA were pharmacologically isolated in the pres-ence of 1 μM tetrodotoxin (TTX), 1 μM strychnine hydrochloride, 30 μM d-tubocurarine,
LPA Controls Synaptic Strength and Plasticity
PLOS Biology | DOI:10.1371/journal.pbio.1002153 May 21, 2015 23 / 30

50 μM (DL)-APV, and 10 μM bicuculline methochloride applied to the bath perfusion. (B) Cu-mulative probability functions of mEPSCAMPA amplitudes pooled from 4 HMNs recordedunder indicated conditions. Bin width: 2 pA. Plot data can be found in S1 Data. (C) Whole-cellAMPAergic currents evoked by 100 ms pressure pulses of glutamate (applied at saturating con-centrations; 1 mM) in a HMN before and after superfusion with LPA. Recordings were per-formed in the presence of TTX in nominally Ca2+-free solution. Experiments and analysis wereperformed as in our previously published study [8].(TIF)
S2 Fig. s-LPA operates presynaptically at AMPAergic synaptic signaling. Top, examples ofeEPSCsAMPA recorded in a HMN in response to paired-pulse stimulation of VLRF axons at theindicated conditions. Stimulus interval was 25 ms. The rightmost trace shows the superimposi-tion of the responses scaled to the peak of the first eEPSCsAMPA. Bottom, PPR was obtainedfrom the amplitude of the first and second eEPSCsAMPA by the formula eEPSCsAMPA2/eEPSC-sAMPA1. Comparison of PPRmeasured at interpulse intervals ranging from 25 to 200 ms forHMNs recorded before, during, and after washout of the s-LPA (40 μM; n = 6 HMNs).�p< 0.05, two-way RM-ANOVA relative to control (before) condition. Experiments and analy-sis were performed as in our previously published study [8]. Plots data can be found in S1 Data.(TIF)
S3 Fig. LPA potentiates the facilitation index of eEPSCsAMPA under repeated VLRF stimu-lation. Top, recorded succession of eEPSCsAMPA in a HMN evoked by a train of 20 stimuli at40 Hz applied to the VLRF before and after adding LPA. Traces are scaled, with first eEPSC-sAMPA of train being equal at both conditions. Bottom, mean eEPSCsAMPA amplitude, normal-ized to the first eEPSCsAMPA (eEPSCsAMPAn/eEPSCsAMPA1) plotted against the positionnumber of eEPSCsAMPAn within the train (1–20) at the indicated conditions (n = 5 HMNs).The symbol code is as in S2 Fig. The stimulus intensity was adjusted so that the eEPSCAMPA1was approximately 50% of the maximal amplitude and then was maintained constant through-out the recording period. �p< 0.05, two-way RM-ANOVA relative to control (before) condi-tion. Plot data can be found in S1 Data.(TIF)
S4 Fig. LPA alters distribution of eEPSCsAMPA amplitude evoked by minimal stimulation.(A) Amplitude distribution histograms of eEPSCsAMPA before and after treatment with LPA.Amplitude of eEPSCsAMPA was distributed over a range from zero to around 115 pA at the be-fore condition; however, LPA narrowed the amplitude distribution toward lower amplitudes(upper limit of approximately 35 pA). Each histogram is made of 800 responses (5 pA bin size)pooled from 4 HMNs. (B) Normalized cumulative probability distributions of eEPSCsAMPA
amplitude. Note that LPA displaced to the left the cumulative distribution of eEPSCsAMPA am-plitude (p< 0.05; Kolmogorov-Smirnov test). Bin width: 2 pA. Failures were excluded. Plotsdata can be found in S1 Data.(TIF)
S5 Fig. Pharmacological insights for LPA1 as a key receptor mediating LPA-inducedAMPAergic STD. (A) eEPSCsAMPA from HMNs recorded before and after exposure to OMPT(1 μM) or VPC 32183 (1 μM) alone (top panels) and LPA (2.5 μM) or s-LPA (40 μM) followedby coaddition of VPC 32183 (bottom panels). (B) Mean eEPSCsAMPA amplitude reduction (inpercent) at the indicated treatments (n� 5 HMNs per condition). �p< 0.05, one-wayANOVA relative to control condition. Plots data can be found in S1 Data.(TIF)
LPA Controls Synaptic Strength and Plasticity
PLOS Biology | DOI:10.1371/journal.pbio.1002153 May 21, 2015 24 / 30
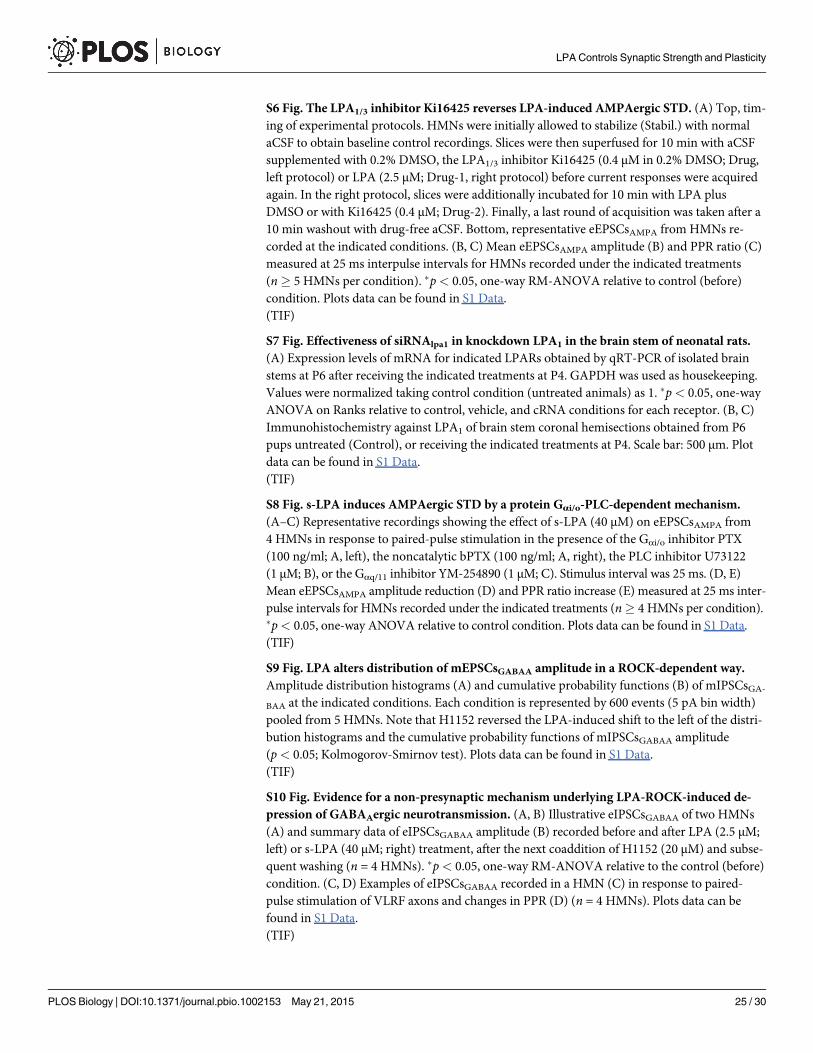
S6 Fig. The LPA1/3 inhibitor Ki16425 reverses LPA-induced AMPAergic STD. (A) Top, tim-ing of experimental protocols. HMNs were initially allowed to stabilize (Stabil.) with normalaCSF to obtain baseline control recordings. Slices were then superfused for 10 min with aCSFsupplemented with 0.2% DMSO, the LPA1/3 inhibitor Ki16425 (0.4 μM in 0.2% DMSO; Drug,left protocol) or LPA (2.5 μM; Drug-1, right protocol) before current responses were acquiredagain. In the right protocol, slices were additionally incubated for 10 min with LPA plusDMSO or with Ki16425 (0.4 μM; Drug-2). Finally, a last round of acquisition was taken after a10 min washout with drug-free aCSF. Bottom, representative eEPSCsAMPA from HMNs re-corded at the indicated conditions. (B, C) Mean eEPSCsAMPA amplitude (B) and PPR ratio (C)measured at 25 ms interpulse intervals for HMNs recorded under the indicated treatments(n� 5 HMNs per condition). �p< 0.05, one-way RM-ANOVA relative to control (before)condition. Plots data can be found in S1 Data.(TIF)
S7 Fig. Effectiveness of siRNAlpa1 in knockdown LPA1 in the brain stem of neonatal rats.(A) Expression levels of mRNA for indicated LPARs obtained by qRT-PCR of isolated brainstems at P6 after receiving the indicated treatments at P4. GAPDH was used as housekeeping.Values were normalized taking control condition (untreated animals) as 1. �p< 0.05, one-wayANOVA on Ranks relative to control, vehicle, and cRNA conditions for each receptor. (B, C)Immunohistochemistry against LPA1 of brain stem coronal hemisections obtained from P6pups untreated (Control), or receiving the indicated treatments at P4. Scale bar: 500 μm. Plotdata can be found in S1 Data.(TIF)
S8 Fig. s-LPA induces AMPAergic STD by a protein Gαi/o-PLC-dependent mechanism.(A–C) Representative recordings showing the effect of s-LPA (40 μM) on eEPSCsAMPA from4 HMNs in response to paired-pulse stimulation in the presence of the Gαi/o inhibitor PTX(100 ng/ml; A, left), the noncatalytic bPTX (100 ng/ml; A, right), the PLC inhibitor U73122(1 μM; B), or the Gαq/11 inhibitor YM-254890 (1 μM; C). Stimulus interval was 25 ms. (D, E)Mean eEPSCsAMPA amplitude reduction (D) and PPR ratio increase (E) measured at 25 ms inter-pulse intervals for HMNs recorded under the indicated treatments (n� 4 HMNs per condition).�p< 0.05, one-way ANOVA relative to control condition. Plots data can be found in S1 Data.(TIF)
S9 Fig. LPA alters distribution of mEPSCsGABAA amplitude in a ROCK-dependent way.Amplitude distribution histograms (A) and cumulative probability functions (B) of mIPSCsGA-BAA at the indicated conditions. Each condition is represented by 600 events (5 pA bin width)pooled from 5 HMNs. Note that H1152 reversed the LPA-induced shift to the left of the distri-bution histograms and the cumulative probability functions of mIPSCsGABAA amplitude(p< 0.05; Kolmogorov-Smirnov test). Plots data can be found in S1 Data.(TIF)
S10 Fig. Evidence for a non-presynaptic mechanism underlying LPA-ROCK-induced de-pression of GABAAergic neurotransmission. (A, B) Illustrative eIPSCsGABAA of two HMNs(A) and summary data of eIPSCsGABAA amplitude (B) recorded before and after LPA (2.5 μM;left) or s-LPA (40 μM; right) treatment, after the next coaddition of H1152 (20 μM) and subse-quent washing (n = 4 HMNs). �p< 0.05, one-way RM-ANOVA relative to the control (before)condition. (C, D) Examples of eIPSCsGABAA recorded in a HMN (C) in response to paired-pulse stimulation of VLRF axons and changes in PPR (D) (n = 4 HMNs). Plots data can befound in S1 Data.(TIF)
LPA Controls Synaptic Strength and Plasticity
PLOS Biology | DOI:10.1371/journal.pbio.1002153 May 21, 2015 25 / 30

S11 Fig. SMNs express LPA1. (A) Epifluorescence images of cultured SMNs processed byimmunohistochemistry for the motoneuron marker SMI32 (left) and counterstained with thenuclear marker DAPI (right). Note that all cells in the field are SMI32-ir. (B) Expression levelsof mRNA for the indicated LPARs obtained by qRT-PCR of cultured SMNs relative to thehousekeeping GAPDH. �p< 0.05, one-way ANOVA on Ranks relative to lpa2–6. (C) Epifluor-escence images of cultured SMNs processed by immunohistochemistry for SMI32 (top) andLPA1 (bottom). Scale bars: A, 25 μm; C, 100 μm. Plot data can be found in S1 Data.(TIF)
S12 Fig. (s-)LPA stimulates RhoA/ROCK signaling in motoneurons. (A) Left, western blotsof LPA1 and total (T), cytosolic (C), and membrane-associated (M) RhoA in the motoneuron-like cell line NSC34 after indicated treatments. For LPA1, the cell line HEK293 was taken as anegative control and β-actin expression was used as an internal loading reference. Right, histo-gram showing the average ratio of densitometric intensity in M or C fractions relative to totalRhoA at the indicated conditions. Ratio values were normalized relative to the control group.(B, C) Summary histogram of changes in ROCK activity in homogenates from HN (B) and cul-tured NSC34 (C) untreated (control) or treated with either s-LPA (40 μM), H1152 (100 μM),or s-LPA plus H1152. �, # p< 0.05, one-way ANOVA on Ranks relative to the control andboth control and s-LPA-treated groups, respectively. Plots data can be found in S1 Data.(TIF)
S13 Fig. Effectiveness of siRNAlpa1 in knockdown LPA1 in SMNs. (A) Expression levels ofLPAR mRNAs in SMNs after incubation with the small interfering RNA against lpa1 (siR-NAlpa1) relative to cultures treated with a nontargeting siRNA (cRNA). �p< 0.05, one-wayANOVA on Ranks relative to lpa2–6. (B, C) Epifluorescence images of cultured SMNs receivingthe indicated treatments processed by immunohistochemistry for SMI32 and LPA1. Immuno-histochemical processing was performed in parallel. Scale bars: 25 μm. Plot data can be foundin S1 Data.(TIF)
S14 Fig. s-LPA induces GABAAγ2 dephosphorylation in the HN by a ROCK-dependentmechanism.Western blot (top) and averaged ratio (bottom) of phosphorylated and totalGABAAγ2 subunit protein levels (denoted as pGABAAγ2 and GABAAγ2, respectively) in theHN of neonatal brain stem slices incubated (10 min) with aCSF alone (control) or supple-mented with indicated drugs. β-actin was an internal loading reference. �p< 0.05, one-wayANOVA on Ranks relative to control condition. Plot data can be found in S1 Data.(TIF)
S15 Fig. s-LPA-induced alterations in mIPSCsGABAA and eIPSCsGABAA in HMNs wereCaN-dependent. (A–C) Traces of spontaneously occurring mIPSCsGABAA (A), amplitude dis-tribution histograms (B, 5 pA bin size), and cumulative probability functions (C, 5 pA bin size)pooled from 8 HMNs before and after exposure to s-LPA (40 μM). (D) Examples of recordedeIPSCsGABAA in a HMN in response to paired-pulse stimulation of VLRF under the specifiedtreatments. All HMNs were recorded in the presence of CaN autoinhibitory peptide (Cap;12.5 μM) added to the recording pipette solution. Plots data can be found in S1 Data.(TIF)
S1 Table. Ultrastructural characterization of S-type boutons attached to HMNs. The dataused to generate the table can be found in S1 Data.(DOC)
LPA Controls Synaptic Strength and Plasticity
PLOS Biology | DOI:10.1371/journal.pbio.1002153 May 21, 2015 26 / 30

S2 Table. Sequence of primers used for qRT-PCR.(DOC)
S1 Text. Supporting results and a more detailed description of materials and methods.(DOC)
AcknowledgmentsWe thank Dr. Federico Portillo for his skillful help with in vivo administration of siRNA. Wealso thank Elaine Lilly, PhD (Writer’s First Aid), for English language revision ofthis manuscript.
Author ContributionsConceived and designed the experiments: BML. Performed the experiments: VGM FMDGFGRB GDV LGPMJMW. Analyzed the data: VGM FMDGF GRB GDV LGPMJMW BML.Contributed reagents/materials/analysis tools: JMGV. Wrote the paper: BML.
References1. Zucker RS, Regehr WG (2002) Short-term synaptic plasticity. Annu Rev Physiol 64: 355–405. PMID:
11826273
2. Schneggenburger R, Sakaba T, Neher E (2002) Vesicle pools and short-term synaptic depression: les-sons from a large synapse. Trends Neurosci 25: 206–212. PMID: 11998689
3. Turrigiano GG (2008) The self-tuning neuron: synaptic scaling of excitatory synapses. Cell 135: 422–435. doi: 10.1016/j.cell.2008.10.008 PMID: 18984155
4. Vithlani M, TerunumaM, Moss SJ (2011) The dynamic modulation of GABA(A) receptor trafficking andits role in regulating the plasticity of inhibitory synapses. Physiol Rev 91: 1009–1022. doi: 10.1152/physrev.00015.2010 PMID: 21742794
5. Arancibia-Carcamo IL, Kittler JT (2009) Regulation of GABA(A) receptor membrane trafficking and syn-aptic localization. Pharmacol Ther 123: 17–31. doi: 10.1016/j.pharmthera.2009.03.012 PMID:19374920
6. Dobrunz LE (2002) Release probability is regulated by the size of the readily releasable vesicle pool atexcitatory synapses in hippocampus. Int J Dev Neurosci 20: 225–236. PMID: 12175858
7. Millar AG, Bradacs H, Charlton MP, Atwood HL (2002) Inverse relationship between release probabilityand readily releasable vesicles in depressing and facilitating synapses. J Neurosci 22: 9661–9667.PMID: 12427821
8. Gonzalez-Forero D, Montero F, Garcia-Morales V, Dominguez G, Gomez-Perez L, et al. (2012) Endog-enous Rho-kinase signaling maintains synaptic strength by stabilizing the size of the readily releasablepool of synaptic vesicles. J Neurosci 32: 68–84. doi: 10.1523/JNEUROSCI.3215-11.2012 PMID:22219271
9. LuW, Roche KW (2012) Posttranslational regulation of AMPA receptor trafficking and function. CurrOpin Neurobiol 22: 470–479. doi: 10.1016/j.conb.2011.09.008 PMID: 22000952
10. Choi JW, Chun J (2013) Lysophospholipids and their receptors in the central nervous system. BiochimBiophys Acta 1831: 20–32. doi: 10.1016/j.bbalip.2012.07.015 PMID: 22884303
11. Lee HY, Murata J, Clair T, Polymeropoulos MH, Torres R, et al. (1996) Cloning, chromosomal localiza-tion, and tissue expression of autotaxin from human teratocarcinoma cells. Biochem Biophys Res Com-mun 218: 714–719. PMID: 8579579
12. Das AK, Hajra AK (1989) Quantification, characterization and fatty acid composition of lysophosphati-dic acid in different rat tissues. Lipids 24: 329–333. PMID: 2755310
13. Hecht JH, Weiner JA, Post SR, Chun J (1996) Ventricular zone gene-1 (vzg-1) encodes a lysophospha-tidic acid receptor expressed in neurogenic regions of the developing cerebral cortex. J Cell Biol 135:1071–1083. PMID: 8922387
14. An S, Bleu T, Hallmark OG, Goetzl EJ (1998) Characterization of a novel subtype of human G protein-coupled receptor for lysophosphatidic acid. J Biol Chem 273: 7906–7910. PMID: 9525886
LPA Controls Synaptic Strength and Plasticity
PLOS Biology | DOI:10.1371/journal.pbio.1002153 May 21, 2015 27 / 30
15. Choi JW, Herr DR, Noguchi K, Yung YC, Lee CW, et al. (2010) LPA receptors: subtypes and biologicalactions. Annu Rev Pharmacol Toxicol 50: 157–186. doi: 10.1146/annurev.pharmtox.010909.105753PMID: 20055701
16. Trimbuch T, Beed P, Vogt J, Schuchmann S, Maier N, et al. (2009) Synaptic PRG-1 modulates excit-atory transmission via lipid phosphate-mediated signaling. Cell 138: 1222–1235. doi: 10.1016/j.cell.2009.06.050 PMID: 19766573
17. Harrison SM, Reavill C, Brown G, Brown JT, Cluderay JE, et al. (2003) LPA1 receptor-deficient micehave phenotypic changes observed in psychiatric disease. Mol Cell Neurosci 24: 1170–1179. PMID:14697676
18. Roberts C, Winter P, Shilliam CS, Hughes ZA, Langmead C, et al. (2005) Neurochemical changes inLPA1 receptor deficient mice—a putative model of schizophrenia. Neurochem Res 30: 371–377.PMID: 16018581
19. Blanco E, Bilbao A, Luque-Rojas MJ, Palomino A, Bermudez-Silva FJ, et al. (2012) Attenuation of co-caine-induced conditioned locomotion is associated with altered expression of hippocampal glutamatereceptors in mice lacking LPA1 receptors. Psychopharmacology (Berl) 220: 27–42. doi: 10.1007/s00213-011-2446-6 PMID: 21887497
20. Musazzi L, Di Daniel E, Maycox P, Racagni G, Popoli M (2011) Abnormalities in alpha/beta-CaMKIIand related mechanisms suggest synaptic dysfunction in hippocampus of LPA1 receptor knockoutmice. Int J Neuropsychopharmacol 14: 941–953. doi: 10.1017/S1461145710001240 PMID: 20942999
21. Ueda H, Matsunaga H, Olaposi OI, Nagai J (2013) Lysophosphatidic acid: Chemical signature of neuro-pathic pain. Biochim Biophys Acta 1831: 61–73. doi: 10.1016/j.bbalip.2012.08.014 PMID: 22960381
22. Rekling JC, Feldman JL (1998) PreBotzinger complex and pacemaker neurons: hypothesized site andkernel for respiratory rhythm generation. Annu Rev Physiol 60: 385–405. PMID: 9558470
23. Gonzalez-Forero D, Portillo F, Sunico CR, Moreno-Lopez B (2004) Nerve injury reduces responses ofhypoglossal motoneurones to baseline and chemoreceptor-modulated inspiratory drive in the adult rat.J Physiol 557: 991–1011. PMID: 15090609
24. Contos JJ, Fukushima N, Weiner JA, Kaushal D, Chun J (2000) Requirement for the lpA1 lysophospha-tidic acid receptor gene in normal suckling behavior. Proc Natl Acad Sci U S A 97: 13384–13389.PMID: 11087877
25. Lein ES, Hawrylycz MJ, Ao N, Ayres M, Bensinger A, et al. (2007) Genome-wide atlas of gene expres-sion in the adult mouse brain. Nature 445: 168–176. PMID: 17151600
26. Sugiura T, Nakane S, Kishimoto S, Waku K, Yoshioka Y, et al. (1999) Occurrence of lysophosphatidicacid and its alkyl ether-linked analog in rat brain and comparison of their biological activities toward cul-tured neural cells. Biochim Biophys Acta 1440: 194–204. PMID: 10521703
27. Bandoh K, Aoki J, Taira A, Tsujimoto M, Arai H, et al. (2000) Lysophosphatidic acid (LPA) receptors ofthe EDG family are differentially activated by LPA species. Structure-activity relationship of cloned LPAreceptors. FEBS Lett 478: 159–165. PMID: 10922489
28. Eichholtz T, Jalink K, Fahrenfort I, Moolenaar WH (1993) The bioactive phospholipid lysophosphatidicacid is released from activated platelets. Biochem J 291 (Pt 3): 677–680. PMID: 8489494
29. Tigyi G (2010) Aiming drug discovery at lysophosphatidic acid targets. Br J Pharmacol 161: 241–270.doi: 10.1111/j.1476-5381.2010.00815.x PMID: 20735414
30. Varoqueaux F, Sigler A, Rhee JS, Brose N, Enk C, et al. (2002) Total arrest of spontaneous and evokedsynaptic transmission but normal synaptogenesis in the absence of Munc13-mediated vesicle priming.Proc Natl Acad Sci U S A 99: 9037–9042. PMID: 12070347
31. Sriwai W, Zhou H, Murthy KS (2008) G(q)-dependent signalling by the lysophosphatidic acid receptorLPA(3) in gastric smooth muscle: reciprocal regulation of MYPT1 phosphorylation by Rho kinase andcAMP-independent PKA. Biochem J 411: 543–551. doi: 10.1042/bj20071299 PMID: 18237278
32. Moreno-Lopez B, Sunico CR, Gonzalez-Forero D (2011) NO orchestrates the loss of synaptic boutonsfrom adult "sick" motoneurons: modeling a molecular mechanism. Mol Neurobiol 43: 41–66. doi: 10.1007/s12035-010-8159-8 PMID: 21190141
33. Lee JS, Kim MH, HoWK, Lee SH (2008) Presynaptic release probability and readily releasable poolsize are regulated by two independent mechanisms during posttetanic potentiation at the calyx of Heldsynapse. J Neurosci 28: 7945–7953. doi: 10.1523/JNEUROSCI.2165-08.2008 PMID: 18685020
34. Schikorski T, Stevens CF (2001) Morphological correlates of functionally defined synaptic vesicle popu-lations. Nat Neurosci 4: 391–395. PMID: 11276229
35. Tyagarajan SK, Fritschy JM (2014) Gephyrin: a master regulator of neuronal function? Nat Rev Neu-rosci 15: 141–156. doi: 10.1038/nrn3670 PMID: 24552784
36. Muir J, Arancibia-Carcamo IL, MacAskill AF, Smith KR, Griffin LD, et al. (2010) NMDA receptors regu-late GABAA receptor lateral mobility and clustering at inhibitory synapses through serine 327 on the
LPA Controls Synaptic Strength and Plasticity
PLOS Biology | DOI:10.1371/journal.pbio.1002153 May 21, 2015 28 / 30

gamma2 subunit. Proc Natl Acad Sci U S A 107: 16679–16684. doi: 10.1073/pnas.1000589107 PMID:20823221
37. Wang J, Liu S, Haditsch U, TuW, Cochrane K, et al. (2003) Interaction of calcineurin and type-A GABAreceptor gamma 2 subunits produces long-term depression at CA1 inhibitory synapses. J Neurosci 23:826–836. PMID: 12574411
38. Muir J, Arancibia-Carcamo IL, MacAskill AF, Smith KR, Griffin LD, et al. (2010) NMDA receptors regu-late GABAA receptor lateral mobility and clustering at. Proc Natl Acad Sci U S A 107: 16679–16684.doi: 10.1073/pnas.1000589107 PMID: 20823221
39. Kittler JT, Chen G, Honing S, Bogdanov Y, McAinsh K, et al. (2005) Phospho-dependent binding of theclathrin AP2 adaptor complex to GABAA receptors regulates the efficacy of inhibitory synaptic trans-mission. Proc Natl Acad Sci U S A 102: 14871–14876. PMID: 16192353
40. Bannai H, Levi S, Schweizer C, Inoue T, Launey T, et al. (2009) Activity-dependent tuning of inhibitoryneurotransmission based on GABAAR diffusion dynamics. Neuron 62: 670–682. doi: 10.1016/j.neuron.2009.04.023 PMID: 19524526
41. Weiner JA, Hecht JH, Chun J (1998) Lysophosphatidic acid receptor gene vzg-1/lpA1/edg-2 is express-ed by mature oligodendrocytes during myelination in the postnatal murine brain. J Comp Neurol 398:587–598. PMID: 9717712
42. Sunico CR, Gonzalez-Forero D, Dominguez G, Garcia-Verdugo JM, Moreno-Lopez B (2010) Nitricoxide induces pathological synapse loss by a protein kinase G-, Rho kinase-dependent mechanismpreceded by myosin light chain phosphorylation. J Neurosci 30: 973–984. doi: 10.1523/JNEUROSCI.3911-09.2010 PMID: 20089906
43. Srinivasan G, Kim JH, von Gersdorff H (2008) The pool of fast releasing vesicles is augmented by myo-sin light chain kinase inhibition at the calyx of Held synapse. J Neurophysiol 99: 1810–1824. doi: 10.1152/jn.00949.2007 PMID: 18256166
44. Vithlani M, Moss SJ (2009) The role of GABAAR phosphorylation in the construction of inhibitory synap-ses and the efficacy of neuronal inhibition. Biochem Soc Trans 37: 1355–1358. doi: 10.1042/BST0371355 PMID: 19909275
45. Fukushima N, Weiner JA, Chun J (2000) Lysophosphatidic acid (LPA) is a novel extracellular regulatorof cortical neuroblast morphology. Dev Biol 228: 6–18. PMID: 11087622
46. Tigyi G, Hong L, YakubuM, Parfenova H, Shibata M, et al. (1995) Lysophosphatidic acid alters cerebro-vascular reactivity in piglets. Am J Physiol 268: H2048–2055. PMID: 7771554
47. Peever JH, Shen L, Duffin J (2002) Respiratory pre-motor control of hypoglossal motoneurons in therat. Neuroscience 110: 711–722. PMID: 11934478
48. Fuchs B, Schiller J (2009) Lysophospholipids: their generation, physiological role and detection. Arethey important disease markers? Mini Rev Med Chem 9: 368–378. PMID: 19275729
49. Middleton L, Yaffe K (2009) Promising strategies for the prevention of dementia. Arch Neurol 66:1210–1215. doi: 10.1001/archneurol.2009.201 PMID: 19822776
50. Farr SA, Yamada KA, Butterfield DA, Abdul HM, Xu L, et al. (2008) Obesity and hypertriglyceridemiaproduce cognitive impairment. Endocrinology 149: 2628–2636. doi: 10.1210/en.2007-1722 PMID:18276751
51. Gupta S, Knight AG, Losso BY, Ingram DK, Keller JN, et al. (2012) Brain injury caused by HIV proteaseinhibitors: role of lipodystrophy and insulin resistance. Antiviral Res 95: 19–29. doi: 10.1016/j.antiviral.2012.04.010 PMID: 22580130
52. Rancoule C, Dusaulcy R, Treguer K, Gres S, Attane C, et al. (2014) Involvement of autotaxin/lysopho-sphatidic acid signaling in obesity and impaired glucose homeostasis. Biochimie 96: 140–143. doi: 10.1016/j.biochi.2013.04.010 PMID: 23639740
53. Tokumura A, Kanaya Y, Kitahara M, Miyake M, Yoshioka Y, et al. (2002) Increased formation of lyso-phosphatidic acids by lysophospholipase D in serum of hypercholesterolemic rabbits. J Lipid Res 43:307–315. PMID: 11861673
54. Subauste AR, Das AK, Li X, Elliott BG, Evans C, et al. (2012) Alterations in lipid signaling underlie lipo-dystrophy secondary to AGPAT2mutations. Diabetes 61: 2922–2931. doi: 10.2337/db12-0004 PMID:22872237
55. Zhao Z, Yu M, Crabb D, Xu Y, Liangpunsakul S (2011) Ethanol-induced alterations in fatty acid-relatedlipids in serum and tissues in mice. Alcohol Clin Exp Res 35: 229–234. doi: 10.1111/j.1530-0277.2010.01338.x PMID: 21058963
56. Umemura K, Yamashita N, Yu X, Arima K, Asada T, et al. (2006) Autotaxin expression is enhanced infrontal cortex of Alzheimer-type dementia patients. Neurosci Lett 400: 97–100. PMID: 16529861
57. Hammack BN, Fung KY, Hunsucker SW, Duncan MW, Burgoon MP, et al. (2004) Proteomic analysis ofmultiple sclerosis cerebrospinal fluid. Mult Scler 10: 245–260. PMID: 15222687
LPA Controls Synaptic Strength and Plasticity
PLOS Biology | DOI:10.1371/journal.pbio.1002153 May 21, 2015 29 / 30

58. Engelmann B, WiedmannMK (2010) Cellular phospholipid uptake: flexible paths to coregulate the func-tions of intracellular lipids. Biochim Biophys Acta 1801: 609–616. doi: 10.1016/j.bbalip.2010.02.013PMID: 20226876
59. Gonzalez-Forero D, Portillo F, Gomez L, Montero F, Kasparov S, et al. (2007) Inhibition of resting po-tassium conductances by long-term activation of the NO/cGMP/protein kinase G pathway: A newmechanism regulating neuronal excitability. J Neurosci 27: 6302–6312. PMID: 17554004
60. Montero F, Portillo F, Gonzalez-Forero D, Moreno-Lopez B (2008) The nitric oxide/cyclic guanosinemonophosphate pathway modulates the inspiratory-related activity of hypoglossal motoneurons in theadult rat. Eur J Neurosci 28: 107–116. doi: 10.1111/j.1460-9568.2008.06312.x PMID: 18616563
61. Sunico CR, Portillo F, Gonzalez-Forero D, Moreno-Lopez B (2005) Nitric oxide-directed synaptic re-modeling in the adult mammal CNS. J Neurosci 25: 1448–1458. PMID: 15703399
LPA Controls Synaptic Strength and Plasticity
PLOS Biology | DOI:10.1371/journal.pbio.1002153 May 21, 2015 30 / 30
Copyright © 2022 FDOKUMEN