Synaptic and sub-synaptic localization of amyloid-β protein precursor in the rat hippocampus
Upload
khangminh22Category
view
3download
0
HAL Id: tel-03369169https://tel.archives-ouvertes.fr/tel-03369169
Submitted on 7 Oct 2021
HAL is a multi-disciplinary open accessarchive for the deposit and dissemination of sci-entific research documents, whether they are pub-lished or not. The documents may come fromteaching and research institutions in France orabroad, or from public or private research centers.
L’archive ouverte pluridisciplinaire HAL, estdestinée au dépôt et à la diffusion de documentsscientifiques de niveau recherche, publiés ou non,émanant des établissements d’enseignement et derecherche français ou étrangers, des laboratoirespublics ou privés.
Unifying experimental heterogeneity in a geometricalsynaptic plasticity model
Yuri Elias Rodrigues
To cite this version:Yuri Elias Rodrigues. Unifying experimental heterogeneity in a geometrical synaptic plasticity model.Molecular biology. Université Côte d’Azur, 2021. English. NNT : 2021COAZ6013. tel-03369169

THÈSE DE DOCTORAT
Unifying experimental heterogeneity in a geometrical
synaptic plasticity model
Unification de l’hétérogénéité expérimentale par unmodèle géométrique de la plasticité synaptique
Yuri ELIAS RODRIGUES
Inria Sophia Antipolis-Méditerranée
Institut de Pharmacologie Moléculaire et Cellulaire (IPMC)
Présentée en vue de l’obtentiondu grade de docteur enInteractions moléculaires et cellulaires
d’Université Côte d’Azur
Dirigée par: Hélène MARIE
Co-dirigée par: Romain VELTZ
Soutenue le: 30 Juin 2021
Devant le jury, composé de:
Devant le jury, composé de:Dr. Olivier FAUGERAS,
Directeur de Recherche, InriaDr. Suhita NADKARNI,
Maîtres de Conférence/Doyenne Associé, IISERDr. Nicolas BRUNEL,
Professeur, Duke University
Dr. Cian O’DONNELL,
Maîtres de Conférence, University of BristolDr. Hélène MARIE,
Directeur de Recherche, CNRS/IPMC/UCADr. Romain VELTZ
Chercheur, Inria


Unification de I’hétérogénéité expérimentale par unmodèle géomé-
trique de la plasticité synaptique
Jury :
Président
Dr. Olivier FAUGERAS, Directeur de Recherche, Inria
Rapporteurs
Dr. Suhita NADKARNI, Maîtres de Conférence/Doyenne Associé, IISER
Dr. Nicolas BRUNEL, Professeur, Duke University
Examinateur
Dr. Cian O’DONNEL, Maîtres de Conférence, University of Bristol
Directeurs de thèse
Dr. Hélène MARIE, Directeur de Recherche, CNRS/IPMC/UCA
Dr. Romain VELTZ, Chercheur, Inria
ii

Abstract
How learning occurs has been a long-standing question in neuroscience. Since
the first demonstration that the strength wiring up neurons can be persistent, the
study of neuronal connections, the synapses, became a path to understanding
memory formation. In the 70s, the first electrophysiology methods to modify the
synaptic strength were discovered, leading to the evidence of how synapses sub-
jected to stimulation are plastic. Such a form of synaptic plasticity was predicted
two decades before by a theoretical synaptic rule coined by the neuropsychologist
Donald Hebb. The possibility that a devised rule could explain memory motivated
the birth of theories providing new questions and mechanistic representations of
the brain’s functioning.
The diversification of techniques allowed researchers to investigate in depth
the nature of synaptic rules. However, the heterogeneity of experimental condi-
tions adopted by different laboratories implicated that the same stimulation pat-
tern could produce different synaptic modifications. The observed heterogeneity
in the methods and outcomes have hindered the formalization of a coherent view
on how synaptic plasticity works. To fill this gap, this thesis developed a stochas-
tic computational model of the rat CA3-CA1 glutamatergic synapse to explain and
gain insights into how experimental conditions affect plasticity outcomes. I un-
covered a new plasticity rule that accounts for methodological differences such
as developmental aspects, extracellular medium and temperature influences on
synaptic plasticity outcome. The model relies on an expanded version of the
previous methods to predict synaptic plasticity, modified to handle combined dy-
namics. That is achieved by introducing a geometrical readout to interpret the
dynamics of two calcium-binding enzymes controlling plasticity induction. In this
way, the model covers classical and recent stimulation paradigms (e.g. STDP,
FDP) using a single rule parameter set. Finally, the model’s robustness is tested
for in vivo-like spike time irregularity showing how different protocols converge
iii

to the same outcome when regularity is altered. This model allows one to obtain
testable predictions since it links the simulated variables to the specificity needed
to describe a plasticity protocol. Although the model is specific to a single CA3-
CA1 synapse, the study’s insights may be generalized to other types, enabling a
deeper understanding of the rules of synaptic plasticity and learning.
Keywords: computational neuroscience, synaptic plasticity, learning rules, mem-
ory, hippocampus, enzymes modelling, experimental conditions
iv

Résumé
La façon dont l’apprentissage se produit est une question de longue date à la-
quelle la recherche en neuroscience tente de répondre. Depuis la première dé-
monstration que la force de câblage des neurones peut être persistante, l’étude
des connexions neuronales, les synapses, est devenue une voie de compréhen-
sion pour la formation de la mémoire. Dans les années 70, les premières mé-
thodes d’électrophysiologie pour modifier la force synaptique a été découverte,
menant à la preuve que les synapses stimulées ont des propriétés plastiques. Une
telle forme de plasticité synaptique avait été prédite deux décennies auparavant
par une règle synaptique théorique inventée par le neuropsychologue Donald
Hebb. La possibilité qu’une règle élaborée puisse expliquer la mémoire a motivé
la naissance de théories apportant de nouvelles questions et des représentations
mécanistiques du fonctionnement du cerveau.
La diversification des techniques expérimentales a permis aux chercheurs d’en-
quêter en profondeur sur la nature des règles synaptiques. Cependant, l’hétéro-
généité des conditions expérimentales adoptées par différents laboratoires impli-
quait que le même schéma de stimulation pourrait produire différentes modifica-
tions synaptiques. L’hétérogénéité observée dans les méthodes et les résultats
ont entravé la formalisation d’une vision cohérente du fonctionnement de la plas-
ticité synaptique. Pour combler cette lacune, pendant cette thèse, j’ai développé
un modèle stochastique neurocomputationel de la synapse CA3-CA1 glutamater-
gique de rat pour expliquer et obtenir des informations sur la manière dont les
conditions expérimentales affectent les résultats de cette plasticité. J’ai découvert
une nouvelle règle de plasticité qui tient compte des différencesméthodologiques
telles que les aspects développementaux, l’influence du milieu extracellulaire et
de la température sur l’issue de la plasticité synaptique. Lemodèle repose sur une
version étendue des méthodes précédentes pour prédire la plasticité synaptique,
modifiée pour gérer la dynamique combinée. Cela est possible en introduisant
v

une lecture géométrique afin d’interpréter la dynamique de deux enzymes de
liaison au calcium contrôlant l’induction de la plasticité. De cette façon, le mo-
dèle couvre les paradigmes de stimulation classiques et récents (par exemple
STDP, FDP, BTSP) en utilisant un seul jeu de paramètres. Enfin, la robustesse
du modèle est testée dans un contexte mimant l’irrégularité des décharges de
potentiels d’actions in vivo montrant comment différents protocoles convergent
vers la même issue de plasticité synaptique lorsque la régularité est altérée. Ce
modèle permet d’obtenir des prédictions testables de façon expérimentale car il
relie les variables simulées à la spécificité requise pour décrire un protocole de
plasticité. Bien que le modèle soit spécifique à la synapse CA3-CA1, les résultats
de cette étude peuvent être généralisés à d’autres types de synapses, permet-
tant une meilleure compréhension des règles de la plasticité synaptique et de
l’apprentissage.
Mots clés : neurosciences computationnelles, plasticité synaptique, règles d’ap-
prentissage, mémoire, hippocampe, modélisation des enzymes, conditions expé-
rimentales
vi

vii

I dedicate this thesis to my family, partners, friends and teachers with a special
mention to the person that taught me about love and perseverance, Serenita
(aka Nena).
viii

Acknowledgments
This thesis would not have been possible without the guidance of my supervi-
sors Hélène Marie and Romain Veltz, who, together with our collaborator, Cian
O’Donnell, were always available. Romain, during my PhD, always had his doors
opened for discussions, pushed me to do sports, and was an enthusiastic mentor.
Hélène was regularly making sure that I had the goals on sight. Cian shared his
philosophy of science and showed me new possibilities.
I would like to share my appreciation for being part of the MathNeuro team at
Inria Sophia Antipolis, where the most elaborated goûters were led by Mathieu
Desroches, who continuously cared for the PhD students’ well-being. I also would
like to thank Halgurd Taher and Louisiane Lemaire. Besides being my running
buddies, they helpedme develop ideas on calcium dynamics and the hypothetical
size of lakes in South America.
I would like to thank Eduardo R. Zimmer and Evandro Manica, who were my
mentors in Brazil. To my dear friend, Oussama Sabri, who I met by chance in
LASCONVII and later joined the same project in the Université Côte d’Azur. Cyrille
Mascart and his family for sharing Christmas celebrations. My colleagues at CAMP
summer school, who made me a surprise birthday cake, shared a tight routine of
learning synaptic plasticity and eating spiced food. For my lovely girlfriend Winky
Chow, who my mind and heart fly to at every moment I let my thoughts wander.
For my sister Ylana E. Rodrigues who is the keeper of my memories. My Mom,
Stepfather and Brother, understood my absence and always cheered for me. To
my uncle and aunt who let me dream of being a scientist since I was a kid. To my
dad, who taught me how to play chess. To all my family and friends.
ix

Table of Contents
1 Introduction 11.1 From Cajal to Lisman . . . . . . . . . . . . . . . . . . . . . . . . . . . . . . 2
1.2 Reductionist representations of synaptic mechanisms . . . . . . . . . . 4
1.3 Unified theories of plasticity . . . . . . . . . . . . . . . . . . . . . . . . . 4
1.4 Research problem . . . . . . . . . . . . . . . . . . . . . . . . . . . . . . . . 5
2 Synaptic plasticity and its mechanisms 82.1 The timescales of plasticity . . . . . . . . . . . . . . . . . . . . . . . . . . 8
2.1.1Short-term plasticity . . . . . . . . . . . . . . . . . . . . . . . . . . . 9
2.1.2Long-term plasticity . . . . . . . . . . . . . . . . . . . . . . . . . . . 10
2.2 Receptors and ion-channels . . . . . . . . . . . . . . . . . . . . . . . . . . 11
2.2.1NMDA receptor . . . . . . . . . . . . . . . . . . . . . . . . . . . . . . 11
2.2.2AMPA receptor . . . . . . . . . . . . . . . . . . . . . . . . . . . . . . 11
2.2.3Voltage gated Ca2+ channels . . . . . . . . . . . . . . . . . . . . . . 12
2.2.4GABA receptors . . . . . . . . . . . . . . . . . . . . . . . . . . . . . . 12
2.2.5Small Potassium ion channel . . . . . . . . . . . . . . . . . . . . . . 13
2.3 The Ca2+ dynamics . . . . . . . . . . . . . . . . . . . . . . . . . . . . . . . 13
2.3.1The Ca2+ hypothesis for plasticity . . . . . . . . . . . . . . . . . . . 13
2.3.2Calmodulin . . . . . . . . . . . . . . . . . . . . . . . . . . . . . . . . 15
2.3.3CaMKII . . . . . . . . . . . . . . . . . . . . . . . . . . . . . . . . . . . 16
2.3.4Calcineurin . . . . . . . . . . . . . . . . . . . . . . . . . . . . . . . . 17
2.3.5CaN and CaMKII joint activity . . . . . . . . . . . . . . . . . . . . . . 17
2.4 Stimulation protocols . . . . . . . . . . . . . . . . . . . . . . . . . . . . . . 18
2.4.1FDP and STDP . . . . . . . . . . . . . . . . . . . . . . . . . . . . . . . 19
2.5 Sensitivity to experimental conditions . . . . . . . . . . . . . . . . . . . 20
2.5.1Preparation of the neural tissue . . . . . . . . . . . . . . . . . . . . 20
2.5.2Temperature . . . . . . . . . . . . . . . . . . . . . . . . . . . . . . . . 21
2.5.3Extracellular Ca2+ and Mg2+ . . . . . . . . . . . . . . . . . . . . . . 22
2.5.4Development . . . . . . . . . . . . . . . . . . . . . . . . . . . . . . . 23
3 Computational models of synaptic plasticity 32
x

3.1 Unified theories for synaptic - modeling approaches . . . . . . . . . . . 32
3.2 Complexity of mechanisms on plasticity models . . . . . . . . . . . . . 33
3.2.1Experimental conditions . . . . . . . . . . . . . . . . . . . . . . . . . 34
3.2.2Firing patterns . . . . . . . . . . . . . . . . . . . . . . . . . . . . . . . 38
3.2.3Brain regions and structures (localization) . . . . . . . . . . . . . . 40
3.2.4Fast/slow variables . . . . . . . . . . . . . . . . . . . . . . . . . . . . 42
3.3 Determinism, stochasticity and averages . . . . . . . . . . . . . . . . . . 48
3.4 Thresholds strategies . . . . . . . . . . . . . . . . . . . . . . . . . . . . . 48
4 The gap in the computational models of plasticity 574.1 Limits of unidimensional thresholds . . . . . . . . . . . . . . . . . . . . . 58
5 A stochastic model of hippocampal synaptic plasticity with geo-metrical readout of enzymes - Article 615.1 Research context . . . . . . . . . . . . . . . . . . . . . . . . . . . . . . . . 61
5.2 Article preamble . . . . . . . . . . . . . . . . . . . . . . . . . . . . . . . . . 64
5.3 Article . . . . . . . . . . . . . . . . . . . . . . . . . . . . . . . . . . . . . . . 64
5.4 Article methods . . . . . . . . . . . . . . . . . . . . . . . . . . . . . . . . . 81
5.5 Article supplementary results . . . . . . . . . . . . . . . . . . . . . . . . . 106
6 Additional results and discussion 1126.1 CaN and CaMKII related experiments . . . . . . . . . . . . . . . . . . . . 112
6.1.1A synaptic version of the CaN and CaMKII nonlinear filter . . . . . 113
6.1.2The effects of the temperature range in the FDP . . . . . . . . . . 113
6.2 The limits of non-dynamical measures to predict plasticity (failed at-
tempt) . . . . . . . . . . . . . . . . . . . . . . . . . . . . . . . . . . . . . . 115
6.3 How stochasticity affects the model . . . . . . . . . . . . . . . . . . . . . 116
6.3.1Averaged and discrete vesicle release . . . . . . . . . . . . . . . . 116
6.3.2Comparison with a deterministic version of the model . . . . . . . 116
6.4 Possible interactions between laser-tissue warming and Ca2+ dye . . . 117
6.5 In vivo-like modelling . . . . . . . . . . . . . . . . . . . . . . . . . . . . . . 118
6.5.1Sleep stimulation patterns . . . . . . . . . . . . . . . . . . . . . . . 119
6.5.2Behavioral time scale synaptic plasticity (BTSP) . . . . . . . . . . 121
7 Discussion and conclusion 1267.1 Geometrical readout . . . . . . . . . . . . . . . . . . . . . . . . . . . . . . 127
7.2 The role of stochasticity, is it a bug or a feature? . . . . . . . . . . . . . 127
7.3 Limitations . . . . . . . . . . . . . . . . . . . . . . . . . . . . . . . . . . . . 128
7.4 Future directions . . . . . . . . . . . . . . . . . . . . . . . . . . . . . . . . 129
1 Annexe: Simulation of jump processes 133xi

List of abbreviations
STDP spike time-dependent plasticity
BCM Bienenstock-Cooper-Munro
GFP green fluorescent protein
LTP long-term plasticity
LTD long-term depression
LFP local field potential
EPSP excitatory postsynaptic potential
STP short-term plasticity
STD short-term depression
HFS high-frequency stimulation
LFS low-frequency stimulation
AMPAr α-amino-3-hydroxy-5-methyl-4-isoxazolepropionic receptor
GluA1-A4 AMPAr subunits
NMDAr N-methyl-D-aspartate receptor
GluN2A-2C NMDAr subunits
VGCC voltage-gated calcium channel
L, N, P/Q, R and T VGGCs subtypes
GABAr gamma-aminobutyric acid receptor
SK small potassium
BaP backpropagating action potential
CA1 Cornu Ammonis 1 (hippocampus region)
CA3 Cornu Ammonis 3 (hippocampus region)
Ca2+ calcium divalent cation
Mg2+ magnesium divalent cation
[Ca2+]o extracellular calcium concentration
[Ca2+]i intracellular calcium concentration
[Mg2+]o extracellular magnesium concentration
[Mg2+]i intracellular magnesium concentration
K+ potassium cation
Na+ sodium cation
Cl- chlorine anion
PSD postsynaptic density
ATP adenosine triphosphate
ER endoplasmic reticulum
xii

SERCA sarcoendoplasmic reticulum (SR) calcium transport ATPase
CaM calmodulin
CaMKII Ca2+/Calmodulin-dependent kinase II
CaN or PP2 calcineurin
MAP2 microtubule-associated protein 2
FRET Förster resonance energy transfer
aCSF artificial cerebrospinal fluid
GHK Goldman-Hodgkin-Katz
FDP frequency-dependent plasticity
EEG electroencephalogram
GLT-1 glutamate transporter 1
eCBS endocannabinoids
NO nitric oxide
glu glutamate
hipp hippocampus
mGluR1 metabotropic glutamate receptor subtype 1
REM rapid eyes movement
NREM non-rapid eyes movement
BTSP behavioral time scale plasticity
PDMP piecewise deterministic Markov process
ODE ordinary differential equation
LSODA Livermore solver for ordinary differential equations
xiii

Chapter 1
Introduction
We live in a world of constant change, in which the environment forces organisms
to adapt. Such adaptability is achieved through learning and memory, which are
properties beyond simply sensing the environment. Learning is rooted to experi-
ence and can modify how information is processed, and therefore, how thoughts,
actions and behaviours occur. The learning property is so fundamental that it
is even observed in brainless fungi (Nakagaki et al. 2000), gifted to machines
(Friedman et al. 2001) and imprinted in materials (Tian et al. 2017). For brained
animals, neurons can learn through a process called plasticity, which is currently
understood as the induction of persistent changes in the neuronal function, con-
stitution, and interactions with other neurons. Such long-lasting changes (Abra-
ham 2003) are triggered by the activity of brain cells that can connect in various
ways. A perspective on this diversity is represented by the number of possible
connections among the neurons of a worm (c. elegans) which can host a large
number of configurations stemming from only 9 of its 302 neurons dedicated to
movement (Rakowski and Karbowski 2017). Furthermore, each neuron connec-
tion has a different strength which can change under sufficient stimulation. The
hotspot of these changes is called the synapse, the locus where neurons "touch"
each others (συναψιζ, syn συν, ensemble and haptein αψιζ, touching - Sherrington
1910). Owning to understand learning, neuroscientists have investigated the con-
ditions ruling synaptic efficacy. However, experiments have shown that the same
activity patterns do not always produce the same plasticity outcome. This thesis
presents a new plasticity rule to account for the critical conditions controlling how
neurons wire up together. The synaptic rule proposed in this thesis considers bio-
physical conditions to explain the diversity of plasticity outcomes. Also, it builds
over the original ideas of John Lisman and other names of neuroscience which
the historical contributions to plasticity are drafted next.
1

2 CHAPTER 1. INTRODUCTION
1.1 From Cajal to Lisman
Historically, theoretical and experimental works have alternated for the primacy
of the progress of synaptic plasticity understanding as shown in Figure 1.1. A
mini-historical review can start by referring to Ramón y Cajal 1894 and his de-
scription of neuronal structures using the Golgi staining process. This unveiled
the tiny neuronal structures called dendritic spikes (espinas) sprouting from den-
drites with unprecedented details. At the beginning of the twentieth century, the
mathematical formalization of neuronal theories was in its infancy. For instance,
the McCulloch–Pitts model (McCulloch and Pitts 1943) laid the concepts still in
use in artificial neuronal networks nowadays. Soon after, the first plasticity rule
describing how a source neuron takes part in changing the excitability of its down-
stream neurons was stated in Hebb 1949. Hebb’s rule precedes the first electro-
physiology methods to induce plasticity in the hippocampus developed in the
70s (Bliss and Lømo 1973; Lynch et al. 1977). Simultaneously to the experimen-
tal confirmation of plasticity induction in 1966-77, Sejnowski 1977 anticipated
the "bidirectional learning rules" based on the precise spiking times of connected
neurons, currently known as spike time-dependent plasticity (STDP). Experimen-
tal evidence for this rule would be found years after by Markram and Sakmann
1995, and later by Bi and Poo 1998. The stages of the STDP rule understanding
can be seen from different levels of description and usage, 1) an abstract imple-
mentation level brought by Sejnowski 1977, without mechanistic understanding
2) an experimental confirmation by Markram and Sakmann 1995 and a more pop-
ular definition given by Bi and Poo 1998, and 3) a current widespread use of STDP
in neuromorphic computers and bio-inspired materials (Prezioso et al. 2018).
The different levels of implementation of the BCM (Bienenstock, Cooper, and
Munro) rule (Bienenstock et al. 1982) shared a similar path to the STDP rule. The
BCM rule is based on the spike frequency (instead of spike times) and applied
to visual cortex data (Wiesel and Hubel 1963), and such frequency-dependent
rule was initially uncovered by Dunwiddie and Lynch 1978. Nowadays, the BCM
and STDP rules are taken as canonical in bio-inspired applications without proper
consideration of their physiological relevance (Tigaret et al. 2016). The Bienen-
stock et al. 1982 rule uses a threshold to separate opposite types of plasticity.
The idea of threshold in biology can be traced back to the first neuronal model
McCulloch-Pitts model. This thesis will expand the threshold concept to predict
plasticity.
With the possibility of visualizing the calcium dynamics inside the neurons
thanks to the green fluorescent protein (GFP) discovery, more specifically cal-

1.1. FROM CAJAL TO LISMAN 3
Ramon y Cajalcharacterized the brain structures,including dendritic spines(thorns, espinas) stating itsimportance for learning.
1906
Charles Scott Sherringtondescribed the synapse in muscular junctions as the functional gap between neurons.
1913 1949
Donald O. Hebbstated the first synaptic rule hypothesizing on a [...]"growth process or metabolic change" taking part in modifying the synaptic efficacy.
1973
Timothy Bliss and Terje Lømo, developedfirst electrophysiology method to induce Hebb-like potentiation in the hippocampus.
1977
Garry Lynch and Thomas Duwiddie showedhow long-term potentiation and depressioncan be induced in a frequency-dependentway.
1982
Elie L. Bienenstock, Leon N Cooper andPaul W. Munro, devised a learning rule based on previous plasticity experiments to explain the development of orientationselectivity in the visual cortex. Anticipating the sliding thresholddemonstrated in different brain regions.
1977
Terrence Sejnowski developed the first spike time-dependent bidirectional model for thecerebellum, antecipating the experimental evidence for the same phenomenon in other brain regions.
Pioneers ofbrain structureand functionIvan PavlovLorente de NóWarren McCullochBrenda Milner(still working)
The expansion of ephys. repertoireBernard KatzMartin ChalfieErwin NeherBert SakmannAlan HodgkinAndrew Huxley
Caricatureneuron modelsMcCulloch-Pitts model
Dawn of thecomputational eraHogdin-Huxley modelRosenblatt's PerceptronHopfield network
Visualizing theneuronal chaosMartin ChalfieRafael YusteHenry MarkranZhuo-Hua Pan (潘卓华)
1989 1998
John E. Lisman proposes a model to illustratehis calcium amplitude hypothesis, in which the plasticity bidirectionality is controlled by two-thresholds over either high or moderate calcium levels. His original work also suggests an enzymatic maintenance role for the kinaseand phosphatase interactions.
Bi Guo-Qiang (毕国强) and Mu-ming Poo (蒲慕明)using cultured hippocampal neurons helped topopularize the spike time-dependent plasticitywhich currently is largely applied in bioinspiredapplications.
Figure 1.1: A short roadmap of plasticity experiment and theory hallmarks. A short roadmap of plasticity experiment and the-
ory hallmarks through the 20th century. Note that the only woman cited was Brenda Milner, who has continuously contributed to the
understanding of memory (even now at 102 years old). Women’s contributions to neuroscience are not widely available or mentioned;
fortunately, a project to highlight these has been pushed forward in a timely and needed rescue of the scientific heritage.
cium indicators with a GFP domain, plasticity rules branched and diversified. For
instance, parallel to the synaptic rules based on neurons spiking times, Lisman
1989 proposed a newmodel hypothesizing how calcium-bindingmolecules induce
and maintain plasticity at the molecular level motivated by precursor studies on
protein phosphorylation pathways from Nestler and Greengard 1983. This thesis
will also expand such original idea.
Despite the advances brought by the plasticity models, the growing number
of plasticity experiments has caused few theories to expire since they were not
sufficiently general or had central assumptions proved false. As a benefit, these
improved the synergy between theory and experimental investigation, motivat-
ing new questions on how plasticity occurs. However, mostly overlooking experi-
mental heterogeneity. The problem addressed in this thesis is how to incorporate

4 CHAPTER 1. INTRODUCTION
the experimental diversity in a unified theory capable of providing testable pre-
dictions.
1.2 Reductionist representations of synaptic mechanisms
Synaptic models aiming to elucidate plasticity induction have been built on sim-
plified representations of the biological entities and interactions in different gran-
ularities (Brette 2016; Marr 1982). Similarly, non-mechanistic approaches (e.g.
deep learning) can make accurate predictions. However, they do not attend a bi-
ological description level (e.g. components of the synaptic nano/microdomains,
calcium sources) to explain the plasticity mechanisms (Kievit et al. 2011). In this
thesis, representations of synaptic mechanisms, or reduction of real biological
entities Kievit et al. 2011), will be used to gain insights on the process of plas-
ticity induction. Unavoidably, the simulations of mechanisms activating neurons
are described only partially by models. For example, the equations describing
ion channels kinetics and their collective behaviour simplify the different states,
localizations and compositions of these units. An intermediate approach is to
model individual ion channel contributions to the neuron electrophysiology of us-
ing a stochastic approach. Here, synaptic mechanisms are implemented using a
partially deterministic Markov process (see Annexe 1). The postsynaptic mech-
anisms are modelled with more biophysical detail, including different stochastic
sources (Ribrault et al. 2011), and signals originated in the soma are modelled
phenomenologically.
1.3 Unified theories of plasticity
The growing experimental evidence solidified that precise temporal spike pat-
terns alone are insufficient to explain plasticity. The characterization of mecha-
nisms propelled the emergence of unified theories for synaptic plasticity. These
theories expanded the mechanistic understanding of synaptic plasticity, gaining
further insight into the induction process by encompassing multiple plasticity-
relatedmodifiers: spikes, calcium, neuronmorphology, calcium-bindingmolecules,
temperature, extracellular and extracellular ion concentration, astrocytes, etc.
Such a growing number of interactions poses an analysis challenge since the in-
terpretation of multiple dynamics did not advance simultaneously with the higher
number of mechanisms included. This thesis will address such methodological

1.4. RESEARCH PROBLEM 5
shortcomings by proposing a novel prediction strategy more suitable to multidi-
mensional simulations.
1.4 Research problem
It is hard tomimic nature. Laboratories tend to use their recipe variations (Tebaykin
et al. 2018) without justifications. For instance, several ex vivo studies in which
the brain slices are extracted and prepared for electrophysiology do not recreate
the neurons’ conditions. For example, non-physiological temperatures are used
since the first description of LTP induction (Bliss and Lømo 1973). The mentioned
problem is not only restricted to ex vivo experimentation. In vivo recordings are
also affected by the sampling process. Electrodes or optogenetic probes inserted
in living brains can cause inflammation or heat damage during stimulating (Misra
et al. 2013). These mixed experimental approaches can cause a reproducibility
problem, and as mentioned by Wittenberg et al. 2006, laboratory differences can
be a source of divergent plasticity outcomes even using a similar stimulation.
This thesis intends to provide a mechanistic explanation of how plas-ticity outcomes, sometimes qualitatively conflicting and sampled fromdifferent experimental conditions, are part of the same phenomenon.
The thesis is structured as follows: chapter 2 introduces plasticity-related terms;
chapter 3 discusses unified theories, their strategies and mechanisms; chapter 4
formalizes the gap in these unified theories and presents the conceptual approach
developed in the results; chapter 5 states the context in which this research was
done and how it led to the article containing the main results, methods and sup-
plemental results; chapter 6, adds additional results; and, chapter 7 discusses
the results and comments on future perspectives.
References
Abraham, Wickliffe C (2003). “How long will long-term potentiation last?” In: Philosophical Trans-actions of the Royal Society of London. Series B: Biological Sciences 358.1432, pp. 735–744.
Bi, Guo-qiang and Mu-ming Poo (1998). “Synaptic modifications in cultured hippocampal neu-
rons: dependence on spike timing, synaptic strength, and postsynaptic cell type”. In: Journalof neuroscience 18.24, pp. 10464–10472.
Bienenstock, Elie L, Leon N Cooper, and Paul W Munro (1982). “Theory for the development of
neuron selectivity: orientation specificity and binocular interaction in visual cortex”. In: Journalof Neuroscience 2.1, pp. 32–48.

6 CHAPTER 1. INTRODUCTION
Bliss, Tim VP and Terje Lømo (1973). “Long-lasting potentiation of synaptic transmission in the
dentate area of the anaesthetized rabbit following stimulation of the perforant path”. In: TheJournal of physiology 232.2, pp. 331–356.
Brette, Romain (2016). Frankenstein models and the double-edged sword of modelling tools.http://romainbrette.fr/frankenstein-models-and-the-double-edged-sword-of-
modelling-tools/. Accessed: 2021-04-15.
Dunwiddie, Thomas and Gary Lynch (1978). “Long-term potentiation and depression of synaptic
responses in the rat hippocampus: localization and frequency dependency.” In: The Journal ofphysiology 276.1, pp. 353–367.
Friedman, Jerome, Trevor Hastie, Robert Tibshirani, et al. (2001). The elements of statistical learn-ing. Vol. 1. 10. Springer series in statistics New York.
Hebb, Donald Olding (1949). “The organization of behavior: a neuropsychological theory”. In.
Kievit, Rogier A, Jan-Willem Romeijn, Lourens J Waldorp, Jelte M Wicherts, H Steven Scholte, and
Denny Borsboom (2011). “Modeling mind and matter: reductionism and psychological mea-
surement in cognitive neuroscience”. In: Psychological Inquiry 22.2, pp. 139–157.
Lisman, John (1989). “A mechanism for the Hebb and the anti-Hebb processes underlying learning
and memory”. In: Proceedings of the National Academy of Sciences 86.23, pp. 9574–9578.Lynch, Gary, Thomas Dunwiddie, and Valentin Gribkoff (1977). “Heterosynaptic depression: a post-
synaptic correlate of long-term potentiation”. In: Nature 266.5604, pp. 737–739.
Markram, H and B Sakmann (1995). “Action potentials propagating back into dendrites trigger
changes in efficacy of single-axon synapses between layer V pyramidal neurons”. In: Soc. Neu-rosci. Abstr. Vol. 21. 3, p. 2007.
Marr, David (1982). “Vision: A computational investigation into the human representation and
processing of visual information”. In.
McCulloch, Warren S and Walter Pitts (1943). “A logical calculus of the ideas immanent in nervous
activity”. In: The bulletin of mathematical biophysics 5.4, pp. 115–133.Misra, Amrit, Pradeep Kondaveeti, Jonathan Nissanov, Kenneth Barbee, Patricia Shewokis, Lise
Rioux, and Karen A Moxon (2013). “Preventing neuronal damage and inflammation in vivo
during cortical microelectrode implantation through the use of Poloxamer P-188”. In: Journalof neural engineering 10.1, p. 016011.
Nakagaki, Toshiyuki, Hiroyasu Yamada, and Ágota Tóth (2000). “Maze-solving by an amoeboid
organism”. In: Nature 407.6803, pp. 470–470.
Nestler, Eric J and Paul Greengard (1983). “Protein phosphorylation in the brain”. In: Nature305.5935, pp. 583–588.
Prezioso, M, MR Mahmoodi, F Merrikh Bayat, H Nili, H Kim, A Vincent, and DB Strukov (2018).
“Spike-timing-dependent plasticity learning of coincidence detection with passively integrated
memristive circuits”. In: Nature communications 9.1, pp. 1–8.Rakowski, Franciszek and Jan Karbowski (2017). “Optimal synaptic signaling connectome for lo-
comotory behavior in Caenorhabditis elegans: Design minimizing energy cost”. In: PLoS com-putational biology 13.11, e1005834.
Ramón y Cajal, Santiago (1894). “The Croonian lecture.—La fine structure des centres nerveux”.
In: Proceedings of the Royal Society of London 55.331-335, pp. 444–468.

REFERENCES 7
Ribrault, Claire, Ken Sekimoto, and Antoine Triller (2011). “From the stochasticity of molecular
processes to the variability of synaptic transmission”. In: Nature Reviews Neuroscience 12.7,
pp. 375–387.
Sejnowski, Terrence J (1977). “Storing covariance with nonlinearly interacting neurons”. In: Journalof mathematical biology 4.4, pp. 303–321.
Sherrington, Charles Scott (1910). “Flexion-reflex of the limb, crossed extension-reflex, and reflex
stepping and standing”. In: The Journal of physiology 40.1-2, pp. 28–121.
Tebaykin, Dmitry, Shreejoy J Tripathy, Nathalie Binnion, Brenna Li, Richard C Gerkin, and Paul
Pavlidis (2018). “Modeling sources of interlaboratory variability in electrophysiological proper-
ties of mammalian neurons”. In: Journal of neurophysiology 119.4, pp. 1329–1339.
Tian, He et al. (2017). “Emulating bilingual synaptic response using a junction-based artificial
synaptic device”. In: ACS nano 11.7, pp. 7156–7163.
Tigaret, Cezar M, Valeria Olivo, Josef HLP Sadowski, Michael C Ashby, and Jack R Mellor (2016).
“Coordinated activation of distinct Ca 2+ sources and metabotropic glutamate receptors en-
codes Hebbian synaptic plasticity”. In: Nature communications 7, p. 10289.Wiesel, Torsten N and David H Hubel (1963). “Single-cell responses in striate cortex of kittens
deprived of vision in one eye”. In: Journal of neurophysiology 26.6, pp. 1003–1017.

Chapter 2
Synaptic plasticity and itsmechanisms
Synaptic plasticity regulates the transmission efficacy between pre and postsy-
naptic neurons. This process starts with a Ca2+ influx across the neuronal mem-
brane following the activation of postsynaptic contents such as receptors, ion
channels, enzymes, and vesicle-filled neurotransmitters. The activation of synap-
tic contents triggers structural changes, provoking the addition, removal or re-
modelling of structural proteins. Also, the synaptic content undergoes functional
changes, causing mechanisms to alter their biophysical properties, such as their
conductance (charge movement), permeability (ion flux) or molecular conforma-
tion. The combination of functional and structural changes may lead to a poten-
tiated or depressed synaptic efficacy. However, despite the accumulated knowl-
edge about synaptic plasticity, the phenomenon is not fully understood due to
the heterogeneity of electrophysiological approaches (Tebaykin et al. 2018) and
the lack of biophysical characterization of synaptic contents (Heil et al. 2018).
This chapter sums up plasticity forms, synaptic components, mechanisms, the
synaptic sensibility to extracellular ion concentrations and my main hypothesis
concerning plasticity induction.
2.1 The timescales of plasticity
Pre and postsynaptic mechanisms such as ion channels, receptors, enzymes are
regularly activated, adapt at different timescales according to their kinetics and
available resources. Thanks to the interaction of these mechanisms, neurons can
communicate and induce plasticity. Figure 2.1 exemplifies the short- and long-
term timescales of different plasticity forms discussed next.
8

2.1. THE TIMESCALES OF PLASTICITY 9
Figure 2.1: Short- and long-term plasticity timescales. A) AMPAr desensitization occurs when glutamate binds to the AMPAr, and the
pore does not open—depending on how deep is the desensitization, the full recovery of AMPA current can take from 100 to 300 ms given
the AMPAr subunits composition (Robert and Howe 2003). B) Short-term facilitation is thought to be caused by Ca2+
influx through VGCCs
which accumulates in the presynaptic terminal, enhancing the probability of vesicle release (The Residual Ca2+
Hypothesis) (Debanne et al.
1996). However, other mechanisms can cause facilitation, such as buffers saturation and spike broadening (Jackman and Regehr 2017). C)
Under constant firing the vesicle pools become empty causing short-term depression (Fernández-Alfonso and Ryan 2004; Rizzoli and Betz
2005). D) Long-term plasticity phases showing structural changes occurring in dendritic spines (Bosch et al. 2014).
2.1.1 Short-term plasticity
Short-term plasticity (STP) consists of adaptations at fast timescales producing
immediate changes in the excitability or resources availability (Deperrois and
Graupner 2020; Tsodyks and Markram 1997). In the literature (Zucker and Regehr
2002; Rizzoli and Betz 2005), STP refers to a phenomena, such as receptor de-
sensitization (∼1 to 25 ms) and ion-channels inactivation, facilitation of vesicle
release (∼50 to 200 ms), or depletion of neurotransmitter filled vesicles in the
presynaptic terminals (∼50 to 2000 ms). The listed STP examples adapt in mil-
liseconds to seconds, and their effect exceeds such range (Deperrois and Graup-
ner 2020). Also, STP can be characterized as an all-or-none process, such as the
vesicle release and its consequent short-term depression or facilitation evaluated
in multiple trials. Although short-term plasticity refers to millisecond range adap-
tations, faster processes (fraction of milliseconds) are also prone to adaptations
(Ribrault et al. 2011; Dobrunz et al. 1997).

10 CHAPTER 2. SYNAPTIC PLASTICITY AND ITS MECHANISMS
Figure 2.2: Long term plasticity. A) High Ca2+
entry caused by high-frequency stimulation. B) Induction of LTP using 50 Hz (adapted from
(Dudek and Bear 1992)) showing the change in the excitatory postsynaptic potential (EPSP) slope (Byrne 2017). C) Receptor exocytosis
and synaptic button enlargement. D) Low Ca2+
entry caused by low-frequency stimulation. E) Induction of LTD using 3 Hz (adapted from
(Dudek and Bear 1992)), same plasticity measure as in B. F) Receptor endocytosis and synaptic button shrinkage.
2.1.2 Long-term plasticity
Two forms of long-term plasticity, long-term potentiation (LTP) and long-term de-
pression (LTD), reflects the long-lasting effects on synaptic efficacy. LTP was first
characterized by Bliss and Lømo 1973 with local field potential in the CA3-CA1
pathway using a high-frequency stimulation (HFS). Years after, Lynch et al. 1977
would demonstrate LTD in the same pathway using a slow-frequency stimulation
(LFS). Both forms of plasticity and their importance for understanding memory
were debated in the context of hippocampal lesion studies (Douglas 1967). Fig-
ure 2.2 depicts Dudek and Bear 1992’s experiments inducing LTP and LTD, high-
lighting receptor endocytosis and exocytosis as the outcome for HFS and LFS
stimulations, respectively. Dudek and Bear 1992 also blocked NMDA receptor to
show how the long-term plasticity depends on it.
LTP or LTD have protein reorganization phases. In these phases, the dendritic
spines malleable body are reshaped minutes after or during the induction proto-
col (Bosch et al. 2014). Initially, LTP and LTD undergo structural reorganization
and stabilization (early long-term plasticity), consolidation, and later new protein
synthesis (late long-term plasticity), see Figure 2.1D. Fluorescence markers on

2.2. RECEPTORS AND ION-CHANNELS 11
multiple structural proteins identified the rhythms of LTP induction from the early
phase, occurring until ∼1 hour after the stimulation, to late potentiation phase,
occurring after ∼ 1 hour (Bosch et al. 2014). Usually, structural protein studies
investigate the different plasticity phases with a time resolution of minutes or
dozens of seconds to follow long term changes (Bosch et al. 2014; Thomazeau
et al. 2020). Few other studies have measured long-term plasticity phases at
shorter time scales (Frost et al. 2010). Also, Bosch et al. 2014 characterization of
early and late-LTP was performed at room temperature, in which enzyme activity
is expected to react (under equivalent stimulation protocol) slower than physio-
logical temperatures, potentially modifying the timescales of structural changes
(Thomazeau et al. 2020). Next, receptors and ion channels, the primary Ca2+
sources provoking structural and functional changes, will be discussed.
2.2 Receptors and ion-channels
2.2.1 NMDA receptor
N-methyl-D-aspartate receptors (NMDAr) are the primary source of synaptically
induced Ca2+ influx in dendritic spines (Yuste et al. 1999); they have a tetramer ar-
rangement composed of subunits GluN1, GluN2 (A-D) and GluN3 (Salussolia et al.
2011). The NMDAr’s subtype expression is age-dependent, producing receptors
with different kinetics and functions within the brain. Both glutamate and glycine
activate NMDArs leading to ionotropic (K+, Na+ and Ca2+), and metabotropic ac-
tivity depending on NMDAr composition. A concept to understand the role of
NMDAr is the coincidence detection in which the NMDAr-Mg2+ unblocking occurs
when dendritic spines are sufficiently depolarized (Collingridge et al. 1983). That
enhances NMDAr conductance since the NMDAr blocking is alleviated by the BaP
current reaching dendritic spines. Another form of NMDAr conductance modula-
tion occurs by changing extracellular Ca2+ as shown in Maki and Popescu 2014.
2.2.2 AMPA receptor
α-amino-3-hydroxy-5-methyl-4-isoxazolepropionic receptor (AMPAr) are tetrame-
ters composed of GluA1-A4 subunits. These glutamatergic receptors are majorly
expressed in the dendritic spines, and their central role is to relay excitatory neu-
ronal impulses (Lu et al. 2009). It is of particular interest for plasticity since the
inclusion and removal of AMPArs from the postsynaptic density (PSD) reflects the
plasticity outcomes illustrated in Figure 2.2. Due to this, AMPArs density in den-

12 CHAPTER 2. SYNAPTIC PLASTICITY AND ITS MECHANISMS
dritic spines correlates with PSD size. Unlike NMDAr, given the synapse type,
AMPArs have a specific distance-dependent expression to compensate EPSP at-
tenuation towards the soma (Nicholson et al. 2006). Note also that AMPAr current
can have its magnitude changed even without the inclusion of new units due to
the phosphorylation of its subunits (Incontro et al. 2018).
2.2.3 Voltage gated Ca2+ channels
An important Ca2+ source in plasticity induction is the voltage-gated Ca2+ chan-
nels (VGCCs) which are a class of ion channels permeable to Ca2+ ions, activated
by changes in the membrane potential. VGCCs (L, N, P/Q, R and T) have specific
distribution and variations within the brain and non-neuronal cells (Magee and
Johnston 1995). A classification for the VGCCs subtypes attributes their activation
to a particular membrane depolarization level. For instance, low-, intermediary-
and high-voltage activated channels, such as T-type VGCCs, activated at resting
membrane conditions and L-type VGCCs activated at high voltage (Magee and
Johnston 1995). Although VGCCs provides less Ca2+ (synaptic induced Yuste et al.
1999) compared to NMDAr in dendritic spines there are VGCC-dependent forms
plasticity (Adermark and Lovinger 2007). However, the VGCCs major contribu-
tion is the presynaptic vesicle release triggered by responding to a Ca2+ influx
caused by presynaptic action potentials (He et al. 2018). This effect is the ma-
jor stochastic component in the signal transduction since its ineffective opening
causes vesicle release failures (Yuste et al. 1999).
2.2.4 GABA receptors
So far, we have reviewed only excitatory mechanisms (VGCC, AMPAr and NM-
DAr). However, plasticity requires also the participation of inhibitory mecha-
nisms (Meredith et al. 2003). For instance, the gamma-aminobutyric acid receptor
(GABAr) (Rowlett et al. 2005) is activated by the presence of GABA neurotrans-
mitters which opens for the passage for Cl- and K+, leading to inhibitory currents
to cause cell polarization (Pelkey et al. 2017). GABAr controls neuronal excitabil-
ity and the EPSPs integration since inhibitory currents act in different parts of the
neuron, such as soma, dendrites and spines (Somogyi and Klausberger 2005). By
interacting with Ca2+ sources, GABAr can modify plasticity induction outcomes as
shown by blocking studies (Meredith et al. 2003; Buchanan and Mellor 2007).

2.3. THE CA2+ DYNAMICS 13
2.2.5 Small Potassium ion channel
A class of potassium channel is activated in a [Ca2+]i-dependent manner, hyper-
polarizing the membrane potential and reducing the NMDAr and VGCCs enhance-
ment caused bymembrane depolarization. For instance, the small potassium (SK)
channel which interacts with Ca2+ sources (Griffith et al. 2016) to reduce Ca2+ in-
flux, therefore affecting plasticity outcomes (Tigaret et al. 2016). This class of
channels limits the Ca2+ influx and the Ca2+-induced excitotoxicity (Trombetta-
Lima et al. 2020).
2.3 The Ca2+ dynamics
Plasticity of dendritic spines depends on intracellular Ca2+ elevations and it is
mainly controlled by Ca2+ sources such as (Yuste 2010): NMDAr, Ca2+ permeable
AMPAr, VGCCs, Kainate receptors, Ca2+ storages from endoplasmatic reticulum
(ER). However, Ca2+ dynamics impact other neuronal functions such as neuronal
transmission, plasticity, neurite growth, apoptosis, ATP production, protein ex-
pression, to cite a few (Knot et al. 2005). Due to the multiple functions of Ca2+,
its influx and extrusion are tightly controlled in dendritic spines. Therefore, den-
dritic spines actively compartmentalise Ca2+ with its high extrusion efficiency
(outside the cell), which is supposed to exceed Ca2+ diffusion through the spine
neck (Sabatini and Svoboda 2000). Such efficiency at extruding Ca2+ from the
tiny dendritic spine’s cytoplasm is granted by Ca2+ pumps (e.g. PMCA), mobile
buffers (e.g. Calmodulin) or also Ca2+ ER storages (e.g. SERCA pumps) which
can prevent depotentiation (Perez-Alvarez et al. 2020). Despite this tight con-
trol, internal Ca2+ fluctuates due to tonic T-type VGCCs flickering, keeping a basal
Ca2+ concentration of around 50 nM (Maravall et al. 2000). The main method to
indirectly probe the Ca2+ dynamics is through fluorescent Ca2+-binding proteins.
However, this form of indirect visualization has some drawbacks such as laser-
induced phototoxicity. The laser exciting the fluorescent proteins in the synaptic
domains can modify the receptors and ion channels’ kinetic parameters since
the temperature increases and it can cause photodamage (Podgorski and Ran-
ganathan 2016; Schmidt and Oheim 2018) given the laser parameters.
2.3.1 The Ca2+ hypothesis for plasticity
Ca2+ is the primary signalling ion in the brain (Knot et al. 2005) and since the
discovery that intracellular levels of Ca2+ are fundamental to induce both LTP and

14 CHAPTER 2. SYNAPTIC PLASTICITY AND ITS MECHANISMS
Figure 2.3: Variations of the Ca2+ hypothesis for plasticity. Left: Ca2+ amplitude hypothesis. Middle: Ca2+
duration hypothesis. Right:
Ca2+
location hypothesis.
LTD (Lynch et al. 1983; Mulkey and Malenka 1992) neuroscientists have searched
for a relationship between plasticity outcomes and Ca2+. Lisman 1989 coined a
hypothesis linking the Ca2+ amplitude to plasticity directionality at the same the-
oretical work that proposes a molecular mechanism for memory storage based on
enzyme activity. Lisman statement can be rewritten in the following way: high lev-
els of Ca2+ influx lead to potentiation, while moderate levels lead to depression.
Such a hypothesis, illustrated in Figure 2.3 (Left), finds support in a frequency-
dependent plasticity experiment done by Hansel et al. 1996 using Ca2+ fluores-
cence imaging. Despite that, direct observation of Ca2+ without fluorescent dye
prevents a proper evaluation of the amplitude hypothesis. Moreover, evidence
against the Ca2+ amplitude hypothesis is given by Tigaret et al. 2016, which shows
a high Ca2+ amplitude (measured with Ca2+ dye) induced not LTP, while a mod-
erate level induced LTP does. Also by Nevian and Sakmann 2006 that shows the
same Ca2+ amplitude can induce both LTP and LTD. The two last examples make
such a claim without measuring the whole Ca2+ plasticity protocols due to pho-
totoxicity issues. Another variation of it the Ca2+ hypothesis, the Ca2+ duration
hypothesis suggests the duration of Ca2+ intracellular elevations dictates plastic-
ity directionality (Mizuno et al. 2001). That can be stated as brief and high Ca2+
levels induce LTP, while sustained and moderate Ca2+ levels induce LTD, as de-
picted in Figure 2.3 (Middle). Despite such hypothesis has received favourable
support by Yang et al. 1999; Mizuno et al. 2001, precise control of Ca2+ is hard to
be achieved using only spikes (Yang et al. 1999). Therefore, part of the support
of the duration hypothesis comes from computational studies (Gamble and Koch
1987). Other ideas are proposed, such as the Ca2+ location hypothesis (Figure
2.3, Right) that states depending on the source of Ca2+ (e.g. NMDAr or VGCCs),
a different directionality would be selected. However, it falls in similar technical

2.3. THE CA2+ DYNAMICS 15
Figure 2.4: Ca2+-binding enzymes. The figure represents the CaMKII interaction with CaM, CaMKII phosphorylation of glutamatergic
receptors and its role inducing AMPAr insertion (O’Connor et al. 2005). Also, it shows CaN interaction with CaM, CaN dephosphorylation of
glutamatergic receptors and its role removing AMPAr (O’Connor et al. 2005).
limitations from the previous hypothesis when controlling Ca2+ entry (Evans and
Blackwell 2015). Given the shortcomings, it is interesting to point out a simple
enquiring by Malenka 1993, [...] It is well established that a rise in postsynaptic
Ca2+ is necessary for LTP induction. How can a rise in postsynaptic Ca2+ also be
responsible for LTD? [...]. Ca2+ is extruded very fast from the spines. Therefore it
has a relatively fast decay time (50 - 500 ms) when compared to enzymes. This
thesis will try to interpret the dynamics of "what comes after Ca2+" since new
measurements are available for the immediate Ca2+-cascade, and this can lead
to a new interpretation of Malenka’s observation and hopefully make it more clear
how different plasticity experiments, with different experimental conditions, are
part of the same phenomenon.
2.3.2 Calmodulin
Calmodulin (CaM) is a calcium-binding enzyme highly expressed in dendritic spines
interacting with LTP and LTD pathways (see Figure 2.4), and other calcium-related
regulatory mechanisms (e.g. pain Hasan et al. 2017, vesicle release Pang et al.
2010). It is a mobile buffer that efficiently detects the Ca2+ influx due to its high
affinity and fast binding (Faas et al. 2011). CaM dependent enzymes, such as
CaMKII and CaN, which inhibition and blocking can disrupt plasticity induction
(O’Connor et al. 2005) are discussed next.

16 CHAPTER 2. SYNAPTIC PLASTICITY AND ITS MECHANISMS
2.3.3 CaMKII
The Ca2+/Calmodulin-dependent kinase II, or CaMKII, has four isoforms (α, β, γ,
and δ, Gaertner et al. 2004) associated with the induction of long term plastic-
ity (LTP and LTD) (Coultrap and Bayer 2012). This enzyme is composed of 12
subunits, forming a holoenzyme that can phosphorylate (activate by adding a
phosphate group) its neighbouring units allowing the enzyme to be activated
longer in the absence of Ca2+. Such autophosphorylation property was hypoth-
esized to have a maintenance role in dendritic spines (Lisman 1989). When
CaMKII is activated, it would reach a stable state due to its autophosphorylation,
which would surpass protein turnover by having new included CaMKII becom-
ing self-phosphorylated at Ca2+ basal levels and saturation of dephosphorylation
pathways (Lisman 1985; Miller et al. 2005). Despite that, a maintenance role
through autophosphorylation was not confirmed in brain slices by Förster reso-
nance energy transfer (FRET)-sensor experiments recording CaMKII activity (Lee
et al. 2009). Instead, experiments have shown that CaMKII activity returns to
basal levels instead of staying in an activated (self-sustained) state (Chang et
al. 2017; Chang et al. 2019). Other evidence for the lack of maintenance role
was obtained by applying CaMKII inhibitors after an LTP protocol, producing no
changes in the LTP expression (Chen et al. 2001). Despite that, CaMKII was found
to modify the NMDAr function by biding on its GluN2B subunit and forming an
NMDAr-CaMKII complex necessary for LTP induction and possibly maintenance
(Incontro et al. 2018). The maintenance role of NMDAr-CaMKII was suggested by
test-tube essays (Urakubo et al. 2014). To date, a self-sustained CaMKII activ-
ity to justify a maintenance role has not been confirmed for LTP (Michalski 2014;
Coultrap and Bayer 2012). More studies are necessary to evaluate the NMDAr-
CaMKII complexmaintenance role in more physiological conditions (Urakubo et al.
2014). Rather than LTPmaintenance, the CaMKII induction role was demonstrated
by knocking-out CaMKIIα, the most abundant isoform in excitatory synapses to-
gether with CaMKIIβ, causing impairment of learning and memory capabilities
(Silva et al. 1992; Incontro et al. 2018). Still, CaMKII may have a maintenance
role for LTD (Coultrap and Bayer 2012). Another aspect of Lisman’s hypothesis
is that the phosphatase activity causes CaMKII to dephosphorylate. However, by
blocking a series of synaptic phosphatases, Otmakhov et al. 2015 found CaMKII
dephosphorylation unaltered.
CaMKII has structural and functional roles. The formation of the NMDAr-CaMKII
complex increases the Ca2+ influx and CaMKII phosphorylated AMPAr has increased
conductance. Because CaMKII can increase Ca2+ influx, CaMKII excitability path-

2.3. THE CA2+ DYNAMICS 17
ways have been highlighted as a drug target to prevent excitotoxicity (Coultrap
et al. 2011). Structurally, CaMKII isoforms differentially interact with dendritic
spines structural proteins (Okamoto et al. 2009), for instance, by bundling to-
gether with F-actin filaments that compose dendritic spine body and stimulating
neurite growth (Okamoto et al. 2009). The roles associated with this enzyme
have been the focus of theoretical studies owning to predict plasticity and better
understand memory. However, the complete CaMKII enzyme is a modelling chal-
lenge due to the staggering number of state combinations its 12 subunits can
form (Pharris et al. 2019).
2.3.4 Calcineurin
PP2, or Calcineurin (CaN) and its isoforms (α, β, γ), are a Calmodulin activated
phosphatases mainly associated with LTD (Creamer 2020; O’Connor et al. 2005).
It stands in Lisman’s hypothesis as a mediator of LTD and reversal pathway of LTP.
Indeed, CaN is relevant to LTD since inhibiting the phosphatase leads to lower
LTD amplitude. As CaMKIIβ, CaN has structural and functional plasticity roles
such as the dephosphorylation of AMPAr leading to LTD (Woolfrey and Dell’Acqua
2015) and NMDAr desensitization by interacting with the GluN2A subunit (Rycroft
and Gibb 2004). Structural plasticity effects include regulation microtubules-
stabilizing proteins such as tau (axons) and MAP2 (dendrites) (Hoffman et al.
2017). CaN-tau regulation is a relevant path to study tauopathies and other neu-
rodegenerative diseases such as Alzheimer’s. Excessive tau phosphorylationmay
lead to protein bundle accumulation with a cascade of deleterious effects from
slower synaptic transmission (L. Zhou et al. 2017) to neuronal death (Fath et al.
2002). Still, CaN apoptotic pathways can be triggered by excessive Ca2+ influx (F.
Shibasaki and McKeon 1995) and be explored in neuroprotective strategies (Erin
et al. 2003).
2.3.5 CaN and CaMKII joint activity
Fujii et al. 2013 suggested that CaN and CaMKII enzymatic activity could represent
a pulse number and frequency decoder in neuron somata. However, in dendritic
spines, CaMKII measurements (Chang et al. 2017) showed a faster saturation
profile given frequency (from 0.49 to 7.8 Hz) and pulse number (more than eight
pulses to saturation in room temperature). Given these contradictory evidences,
CaN-CaMKII as an enzymatic decoder needs to be investigated in dendritic spines
where these enzymes are primarily expressed instead of neuron somata. Another

18 CHAPTER 2. SYNAPTIC PLASTICITY AND ITS MECHANISMS
experiment on CaN-CaMKII dynamics reinforces that CaN and CaMKII respectively
induces LTD and LTP in a frequency-dependent manner (O’Connor et al. 2005).
In O’Connor et al. 2005 experiment, by inhibiting CaMKII, LTP is abolished, and
the same is valid for CaN and LTD. Despite this association, CaMKII and CaN are
not exclusively related to potentiation or depression (Woolfrey and Dell’Acqua
2015). Interestingly, one of the first transgenic animal models was a CaMKIIα
knockout designed to study the learning and memory dependence of this enzyme
(Silva et al. 1992). Note that both enzymes are related to plasticity and apoptotic
pathways, disrupted CaMKII-NMDA complex induced excitotoxicity (Coultrap and
Bayer 2012) and CaN-induced apoptosis (F. Shibasaki and McKeon 1995). Despite
that, the thresholds separating the healthy and pathological functions of these
enzymes are unknown.
2.4 Stimulation protocols
Experimentalists can artificially manipulate Ca2+ influx through dendritic spines
using spiking times (or the firing patterns) to investigate how neuronal activity in-
duces plasticity. The stimulation protocol may be induced by external electrodes
in brain slices exposing (or not) neuronal circuitry (Bliss and Lømo 1973); opto-
genetics which requires the expression of light-sensitive ion channels (e.g. chan-
nelrhodopsins) (Anisimova et al. 2019); glutamate uncaging (Ellis-Davies 2019)
which releases caged glutamate from a light-sensitive molecular matrix, allowing
the precise stimulation of individual spines; or also, delivering electrical current
using a patch through (or at) the neuronal membrane surface (Neher et al. 1978),
with various clamping variations such as current, voltage and dynamical (Berecki
et al. 2014). Also, plasticity can be induced chemically, without manipulating neu-
ronal spiking activity (Santschi et al. 1999). A general description of plasticity pro-
tocols highlights pre-and postsynaptic spiking times or their rate, duration, brain
region, aCSF temperature, preparation steps of the neural tissue, developmental
age, etc. Usually, stimulation protocols are heterogeneous like the electrophysi-
ology methods shown in Tebaykin et al. 2018. However, most plasticity protocols
use firing structures with highly correlated regular spikes (not observed in vivomeasurements (Cui et al. 2018)) and non-physiological experimental conditions
(Inglebert et al. 2020; Bi and Poo 1998).
The first electrophysiology measurements of LTP were recorded and induced
through local field potentials (LFP) (Bliss and Lømo 1973). It consists of estimat-
ing the slope of the electromagnetic field decay produced by themovement of the
charges in response to a neural pathway stimulation. This measure is preferred

2.4. STIMULATION PROTOCOLS 19
when recording in the extracellular medium since the signal amplitude depends
on the source distance from the electrode (e.g. metal or micropipette) (Buzsáki
et al. 2012). Other techniques such as patch-clamp variations and intracellular
recordings are invasive but allow one to measure the neuron’s current and volt-
age, with a precise estimation of the EPSP amplitude change (Covey and Carter
2015). Electrophysiological techniques have several intricacies. For instance, in
in vivo recording, the correct electrode placement has to be verified by surgery.
It is not unusual to have experiments discarded due to technical issues and arte-
facts (Ahnaou et al. 2020). Automatized electrophysiology is still not widely avail-
able and still limited to few types of experiments (Annecchino and Schultz 2018).
Other forms of measure of the plasticity outcomes are by imaging, targeting spe-
cific proteins linked to the plasticity expression (Bosch et al. 2014), or imaging
genetically encoded indicators (e.g. voltage and calcium) to evaluate the EPSP
or its effects before being filtered by the spine neck (Jackman and Regehr 2017;
Kwon et al. 2017).
2.4.1 FDP and STDP
The first stimulation protocol descends from the Bliss and Lomo (Bliss and Lømo
1973) which proposes a method to induce LTP using an external stimulation in a
rabbit CA3-CA1 pathway (Nicoll 2017). Their technique continued to be used due
to its practicality (Dudek and Bear 1992; Dudek and Bear 1993) even after new
methods allowing control over pre and postsynaptic spiking times (Neher et al.
1978) have been described. An example is the frequency-dependent stimulation
(FDP) paradigm presented by Dunwiddie and Lynch 1978 that uses regular spikes.
However, note that later experiments have used jittered spikes, such as the rate-
dependent in- duction of plasticity by Sjöström et al. 2001. In the 70s, when
LTP and LTD were experimentally confirmed in the hippocampus, simultaneously
the Bienstook Cooper Monro (BCM) theory formalized the experiments of visual
cortex directional selectivity using a nonlinear function of synaptic efficacy and
frequency (Lynch et al. 1977). The BCM popularized the idea that a threshold
marks a transition between LTD and LTP over the frequency. For instance, the
BCM-like rule found in the hippocampus (Wang and Wagner 1999; Holland and
Wagner 1998).
The experiment that established a canonical bidirectional plasticity rule was
popularized by Bi and Poo 1998 and made possible due to the patch-clamp tech-
niques (Markram et al. 2011). Bi and Poo 1998 discovered that precise timing
of pre and postsynaptic spikes and its causality can describe plasticity outcomes

20 CHAPTER 2. SYNAPTIC PLASTICITY AND ITS MECHANISMS
observed in cultured neurons, with the causal pairing inducing LTP, and the anti-
causal one inducing LTD. The bidirectionality of STDP, experimentally demon-
strated by Bi and Poo 1998, was a theoretical construct previously used by Se-
jnowski 1977. Currently, experiments have demonstrated that the synaptic rules
STDP havemultiple shapes influenced by: age (Meredith et al. 2003), temperature
Krelstein et al. 1990, frequency (Sjöström et al. 2001), distance from the soma
(Letzkus et al. 2006), aCSF composition (Inglebert et al. 2020), duration (Mizuno
et al. 2001). To date, there is no mechanistic justification for how the experimen-
tal conditions affect the STDP outcomes. For instance, as Wittenberg and Wang
2006 interestingly points out, a similar STDP causal stimulation protocol can in-
duce LTP (Nishiyama et al. 2000), LTD (Christie et al. 1996; Wittenberg and Wang
2006) and no change (Pike et al. 1999), without telling why such differences arise.
2.5 Sensitivity to experimental conditions
Synapses are sensitive, and experimental choices affect plasticity, as will be ex-
emplified further. Despite that, plasticity experiments have a wide range of non-
physiological settings selected due to technical limitations in mimicking the neu-
ron environment. Figure 2.5 shows histograms of the experimental parameters
used in hallmark plasticity experimental publications described in Table 3.3 and
3.1.
Figure 2.5: Histograms of experimental conditions in plasticity experiments using brain slices in the hippocampus and cortex.The data was extracted from hallmark plasticity studies reproduced by theoretical models (Graupner and Brunel 2012, Ebner et al. 2019,
Jedrzejewska-Szmek et al. 2017, Inglebert et al. 2020). For articles which uses a interval, such as P14-21, the whole interval was counted.
This histogram is based on the ones described in Tebaykin et al. 2018.
2.5.1 Preparation of the neural tissue
Electrophysiological recordings are usually done in brain slices and cultured neu-
rons. Brain slicing preparations have variations, and the effects of these are not
completely understood. A basic protocol to brain slicing goes as follows (Papouin
and Haydon 2018): anaesthetized animals are sacrificed for brain extraction and

2.5. SENSITIVITY TO EXPERIMENTAL CONDITIONS 21
further isolation of the region of interest while submerged in aCSF; the region of
interest is isolated under a specific aCSF slicing solution designed to cause min-
imal damage to neurons while having their connections severed, then slices are
left to recover under a specific aCSF solution until further use in a recording cham-
ber with recirculated aCSF (designed for recording). Each step of this process has
several variables that can modify the plasticity outcomes. However, the effects of
preparation methods are not widely discussed in the papers using them (Papouin
and Haydon 2018). For instance, high Mg2+ during slicing prevents epileptiform
activity in slices, and it is a stabilizing factor for further recording. However, a
variation of 0.3 mM in Mg2+ concentration can change whether or not LTP is in-
duced (Capron et al. 2006). Moreover, given the slicing temperature, dendrite
spines can significantly shrink when slicing is done in ice-cold temperatures (Q.
Zhou et al. 2004). An alternative to slices is cultured neurons in which the brain
is extracted during embryonic development and processed to differentiate and
form connections in vitro (Gordon et al. 2013).
Given the diversity of electrophysiology recording done in non-physiological
conditions, slicing preparation and the associated recipes usually do not recreate
the ideal neuronal environment. Tebaykin et al. 2018 highlighted that electro-
physiological choices between laboratories are variable, and aCSF recipes are
passed from supervisor to student in a conservative way. Given that synapses
are very sensitive to their environment, the lack of uniformity on how close the
experiments are to reproduce the extracellular environment does little to produce
replicate and comparable data. Despite the lack of uniformity in data, the cost
to re-investigate the hallmarks of plasticity neuroscience under uniform experi-
mental conditions is not negligible, and new hypothesis from theoretical plasticity
models may justify such effort.
2.5.2 Temperature
Previously, it was mentioned that synapses are sensitive to experimental con-
ditions. An important factor affecting biochemical reactions is the temperature
since it defines the average kinetic energy of molecules and ions, therefore recep-
tor activation and plasticity timescales (Roelandse and Matus 2004). Krelstein et
al. 1990 showed that changing temperature 3-5C can induce qualitative changes
in the plasticity induced in hibernator hamsters. Also, Wittenberg and Wang 2006
compare different temperature effects on STDP protocols for hippocampal slices
in rats without conclusive evidence. In terms of temperature- induced changes,
ionic channels such as VGCC can have a kinetic constant 50x different when the

22 CHAPTER 2. SYNAPTIC PLASTICITY AND ITS MECHANISMS
temperature passes from physiological to non-physiological range (Shibasaki et
al. 2007). Enzymes critical to plasticity induction also have their kinetics modi-
fied. For instance, the CaMKII saturation point decreases for higher temperatures
under the same stimuli (Chang et al. 2017). Therefore, it is unsafe to presume
that an accurate understanding of how plasticity works can be achieved using
non-physiological electrophysiology. Still, room temperature recordings are still
used since physiological temperatures may reduce neural tissue viability (Buskila
et al. 2014).
2.5.3 Extracellular Ca2+ and Mg2+
Ca2+, as previously mentioned, dictates the plasticity outcomes. Extracellular
Ca2+ affects Ca2+ dynamics and the Ca2+- influx through the modification of Ca2+-
reversal potential according to the diffusion laws formalized by the GHK (Goldman-
Hodgkin-Katz) equation. Receptors also are susceptible to such variations; for in-
stance, NMDAr conductance reduces in response to high extracellular Ca2+ (Maki
and Popescu 2014). Despite Ca2+ importance, plasticity studies use a variety of
Ca2+ concentrations in their recipes, which are often non-physiological (Inglebert
et al. 2020). Different concentrations can modify the release probability of presy-
naptic vesicles containing neurotransmitters which is sufficiently heterogeneous
even under controlled conditions, within the same brain region (King et al. 2001;
Dobrunz et al. 1997). Note that during a plasticity experiment, aCSF is recircu-
lated with a fixed concentration. However, in an intracellular environment, the
external Ca2+ is dynamically subjected to Ca2+ fluctuations caused by astrocytes,
which regulate various extracellular concentrations (Bazargani and Attwell 2016)
and it is modulated by the astrocyte network (Wang et al. 2012).
Mg2+ is also a largely available divalent ion (4th major ion in the brain Romani
2011) which interacts with Ca2+ sources controlling plasticity. It affects NMDAr
conductance (Jahr and Stevens 1990) and has its internal concentration tightly
regulated (Romani 2011). During brain slice preparations, Mg2+ is added to con-
trol spontaneous and epileptiform activity. Despite its importance, plasticity pro-
tocols have variable choices of Mg2+ concentrations (see Figure 2.5). Its effects
can cause experiments in free-Mg2+ to induce plasticity with only a single pulse
(Mizuno et al. 2001). Tebaykin et al. 2018 have mapped various ions from elec-
trophysiology experiments (not directly to plasticity) and noted that Mg2+ has the
greatest variability (1, 1.3 and 2 mM) among ions used in the aCSF recipes, mean-
while Ca2+ is well centered around 2 mM despite physiological external Ca2+ in
rats is usually inferior to 1.8 mM (Inglebert et al. 2020). The model developed in

REFERENCES 23
this thesis predicts the effects of Mg2+ variations for different plasticity protocols.
2.5.4 Development
The plasticity induction requirements are not constant during development since
structural and biochemical alterations occur within brain cells. For instance, dur-
ing puberty, there is a high density of dendritic spines and an up-regulated prun-
ing which decreases towards adulthood (Boivin et al. 2018). Such shift process
depends on inhibitory GABAr (>P9-21 in rats Rivera et al. 1999; Afroz et al. 2016)
tonic current, which the deletion of which can cause cognitive impairment. GABAr
also has its own shift passing from excitatory to inhibitory (Rinetti-Vargas et al.
2017) and can affect STDP induction (Meredith et al. 2003). Other synaptic re-
ceptors and ion channels are also subjected to composition modifications and
expression shifts. During development, the NMDAr exchange the preferential ex-
pression of GluN2B subunits to the GluN2A, producing NMDAr with a smaller coin-
cidence detection window (Iacobucci and Popescu 2018; Iacobucci and Popescu
2017). Furthermore, the second component of the coincidence detection, the
BaP, also has a dynamical shift caused by maturation and expression of ion chan-
nels (Buchanan and Mellor 2007). Plasticity components in the developmental
and adult brain are not the same, and in correlation, the plasticity induction can
differ in an age-dependent way (Dudek and Bear 1993; Cao and Harris 2012;
Meredith et al. 2003). Despite the various changes that occur in the animal mod-
els’ first days of life, it is usual to observe studies using a rat cohort with a wide
age gap (see Table 3.3 and 3.1). The model presented in this thesis analyses the
effect of age in different plasticity protocols.
Next, amini-reviewwill discuss how different plasticitymodels have contributed
to propose testable predictions.
References
Adermark, Louise and David M Lovinger (2007). “Combined activation of L-type Ca2+ channels
and synaptic transmission is sufficient to induce striatal long-term depression”. In: Journal ofNeuroscience 27.25, pp. 6781–6787.
Afroz, Sonia, Julie Parato, Hui Shen, and Sheryl Sue Smith (2016). “Synaptic pruning in the female
hippocampus is triggered at puberty by extrasynaptic GABAA receptors on dendritic spines”.
In: Elife 5, e15106.
Ahnaou, A, E White, R Biermans, NV Manyakov, and WHIM Drinkenburg (2020). “In Vivo Plastic-
ity at Hippocampal Schaffer Collateral-CA1 Synapses: Replicability of the LTP Response and
Pharmacology in the Long-Evans Rat”. In: Neural Plasticity 2020.

24 CHAPTER 2. SYNAPTIC PLASTICITY AND ITS MECHANISMS
Anisimova, Margarita, Bas van Bommel, J Simon Wiegert, Marina Mikhaylova, Thomas Glenn Oert-
ner, and Christine E Gee (2019). “Long vs short-term synaptic learning rules after optogenetic
spike-timing-dependent plasticity”. In: bioRxiv, p. 863365.Annecchino, Luca A and Simon R Schultz (2018). “Progress in automating patch clamp cellular
physiology”. In: Brain and neuroscience advances 2, p. 2398212818776561.Bazargani, Narges and David Attwell (2016). “Astrocyte calcium signaling: the third wave”. In:
Nature neuroscience 19.2, pp. 182–189.
Berecki, Géza, Arie O Verkerk, Antoni CG van Ginneken, and Ronald Wilders (2014). “Dynamic
clamp as a tool to study the functional effects of individual membrane currents”. In: Patch-Clamp Methods and Protocols. Springer, pp. 309–326.
Bi, Guo-qiang and Mu-ming Poo (1998). “Synaptic modifications in cultured hippocampal neu-
rons: dependence on spike timing, synaptic strength, and postsynaptic cell type”. In: Journalof neuroscience 18.24, pp. 10464–10472.
Bliss, Tim VP and Terje Lømo (1973). “Long-lasting potentiation of synaptic transmission in the
dentate area of the anaesthetized rabbit following stimulation of the perforant path”. In: TheJournal of physiology 232.2, pp. 331–356.
Boivin, Josiah R, David J Piekarski, A Wren Thomas, and Linda Wilbrecht (2018). “Adolescent prun-
ing and stabilization of dendritic spines on cortical layer 5 pyramidal neurons do not depend
on gonadal hormones”. In: Developmental cognitive neuroscience 30, pp. 100–107.
Bosch, Miquel, Jorge Castro, Takeo Saneyoshi, Hitomi Matsuno, Mriganka Sur, and Yasunori Hayashi
(2014). “Structural andmolecular remodeling of dendritic spine substructures during long-term
potentiation”. In: Neuron 82.2, pp. 444–459.
Buchanan, Katherine A and Jack R Mellor (2007). “The development of synaptic plasticity induction
rules and the requirement for postsynaptic spikes in rat hippocampal CA1 pyramidal neurones”.
In: The Journal of Physiology 585.2, pp. 429–445.
Buskila, Yossi, Paul P Breen, Jonathan Tapson, André Van Schaik, Matthew Barton, and John W
Morley (2014). “Extending the viability of acute brain slices”. In: Scientific reports 4.1, pp. 1–7.Buzsáki, György, Costas A Anastassiou, and Christof Koch (2012). “The origin of extracellular fields
and currents—EEG, ECoG, LFP and spikes”. In: Nature reviews neuroscience 13.6, pp. 407–420.Byrne, John H (2017). Learning and memory: a comprehensive reference. Academic Press.
Cao, Guan and Kristen M Harris (2012). “Developmental regulation of the late phase of long-
term potentiation (L-LTP) and metaplasticity in hippocampal area CA1 of the rat”. In: Journal ofneurophysiology 107.3, pp. 902–912.
Capron, Brigitte, Christian Sindic, Emile Godaux, and Laurence Ris (2006). “The characteristics of
LTP induced in hippocampal slices are dependent on slice-recovery conditions”. In: Learning &Memory 13.3, pp. 271–277.
Chang, Jui-Yun, Y. Nakahata, Y. Hayano, and R. Yasuda (2019). “Mechanisms of Ca 2+/calmodulin-
dependent kinase II activation in single dendritic spines”. In: Nature Communications 10.1,
p. 2784.
Chang, Jui-Yun, Paula Parra-Bueno, Tal Laviv, Erzsebet M Szatmari, Seok-Jin R Lee, and Ryohei Ya-
suda (2017). “CaMKII autophosphorylation is necessary for optimal integration of Ca2+ signals
during LTP induction, but not maintenance”. In: Neuron 94.4, pp. 800–808.

REFERENCES 25
Chen, Huan-Xin, Nikolai Otmakhov, Stefan Strack, Roger J Colbran, and John Lisman (2001). “Is
persistent activity of calcium/calmodulin-dependent kinase required for the maintenance of
LTP?” In: Journal of neurophysiology 85.4, pp. 1368–1376.
Christie, Brian R, Jeffrey C Magee, and Daniel Johnston (1996). “The role of dendritic action poten-
tials and Ca2+ influx in the induction of homosynaptic long-term depression in hippocampal
CA1 pyramidal neurons.” In: Learning & memory 3.2-3, pp. 160–169.
Collingridge, Graham L, SJ Kehl, and H t McLennan (1983). “Excitatory amino acids in synaptic
transmission in the Schaffer collateral-commissural pathway of the rat hippocampus.” In: TheJournal of physiology 334.1, pp. 33–46.
Coultrap, Steven J and K Ulrich Bayer (2012). “CaMKII regulation in information processing and
storage”. In: Trends in neurosciences 35.10, pp. 607–618.Coultrap, Steven J, Rebekah S Vest, Nicole M Ashpole, Andy Hudmon, and K Ulrich Bayer (2011).
“CaMKII in cerebral ischemia”. In: Acta pharmacologica Sinica 32.7, pp. 861–872.
Covey, E. and M. Carter (2015). Basic Electrophysiological Methods. Oxford University Press. isbn:
9780199939800. url: https://books.google.fr/books?id=-udcBgAAQBAJ.
Creamer, Trevor P (2020). “Calcineurin”. In: Cell Communication and Signaling 18.1, pp. 1–12.
Cui, Yihui, Ilya Prokin, Alexandre Mendes, Hugues Berry, and Laurent Venance (2018). “Robustness
of STDP to spike timing jitter”. In: Scientific reports 8.1, pp. 1–15.Debanne, Dominique, Nathalie C Guerineau, BH Gähwiler, and Scott M Thompson (1996). “Paired-
pulse facilitation and depression at unitary synapses in rat hippocampus: quantal fluctuation
affects subsequent release.” In: The Journal of physiology 491.1, pp. 163–176.
Deperrois, Nicolas and Michael Graupner (2020). “Short-term depression and long-term plastic-
ity together tune sensitive range of synaptic plasticity”. In: PLoS computational biology 16.9,
e1008265.
Dobrunz, Lynn E, Emily P Huang, and Charles F Stevens (1997). “Very short-term plasticity in hip-
pocampal synapses”. In: Proceedings of the National Academy of Sciences 94.26, pp. 14843–14847.
Douglas, Robert (1967). “The hippocampus and behavior.” In: Psychological bulletin 67.6, p. 416.
Dudek and Bear (1993). “Bidirectional long-term modification of synaptic effectiveness in the
adult and immature hippocampus”. In: Journal of Neuroscience 13.7, pp. 2910–2918.
— (1992). “Homosynaptic long-term depression in area CA1 of hippocampus and effects of N-
methyl-D-aspartate receptor blockade.” In: Proceedings of the National Academy of Sciencesof the United States of America 89.10, p. 4363.
Dunwiddie, Thomas and Gary Lynch (1978). “Long-term potentiation and depression of synaptic
responses in the rat hippocampus: localization and frequency dependency.” In: The Journal ofphysiology 276.1, pp. 353–367.
Ebner, Christian, Claudia Clopath, Peter Jedlicka, and Hermann Cuntz (2019). “Unifying Long-Term
Plasticity Rules for Excitatory Synapses by Modeling Dendrites of Cortical Pyramidal Neurons”.
In: Cell Reports 29.13, pp. 4295–4307.Ellis-Davies, Graham CR (2019). “Two-photon uncaging of glutamate”. In: Frontiers in synaptic
neuroscience 10, p. 48.
Erin, N, RAW Lehman, PJ Boyer, and ML Billingsley (2003). “In vitro hypoxia and excitotoxicity in
human brain induce calcineurin–Bcl-2 interactions”. In: Neuroscience 117.3, pp. 557–565.

26 CHAPTER 2. SYNAPTIC PLASTICITY AND ITS MECHANISMS
Evans, RC and KT Blackwell (2015). “Calcium: amplitude, duration, or location?” In: The BiologicalBulletin 228.1, pp. 75–83.
Faas, Guido C, Sridhar Raghavachari, John Lisman, and Istvan Mody (2011). “Calmodulin as a
direct detector of Ca 2+ signals”. In: Nature neuroscience 14.3, p. 301.
Fath, Thomas, Jochen Eidenmüller, and Roland Brandt (2002). “Tau-mediated cytotoxicity in a
pseudohyperphosphorylationmodel of Alzheimer’s disease”. In: Journal of Neuroscience 22.22,pp. 9733–9741.
Fernández-Alfonso, Tomás and Timothy A Ryan (2004). “The kinetics of synaptic vesicle pool de-
pletion at CNS synaptic terminals”. In: Neuron 41.6, pp. 943–953.
Frost, Nicholas A, Hari Shroff, Huihui Kong, Eric Betzig, and Thomas A Blanpied (2010). “Single-
molecule discrimination of discrete perisynaptic and distributed sites of actin filament assem-
bly within dendritic spines”. In: Neuron 67.1, pp. 86–99.
Fujii, Hajime, Masatoshi Inoue, Hiroyuki Okuno, Yoshikazu Sano, Sayaka Takemoto-Kimura, Kazuo
Kitamura, Masanobu Kano, and Haruhiko Bito (2013). “Nonlinear decoding and asymmetric
representation of neuronal input information by CaMKIIα and calcineurin”. In: Cell reports 3.4,pp. 978–987.
Gaertner, Tara R, Steven J Kolodziej, Dan Wang, Ryuji Kobayashi, John M Koomen, James K Stoops,
and M Neal Waxham (2004). “Comparative analyses of the three-dimensional structures and
enzymatic properties of α, β, γ, and δ isoforms of Ca2+-calmodulin-dependent protein kinase
II”. In: Journal of Biological Chemistry 279.13, pp. 12484–12494.
Gamble, Edward and Christof Koch (1987). “The dynamics of free calcium in dendritic spines in
response to repetitive synaptic input”. In: Science 236.4806, pp. 1311–1315.
Gordon, Jennifer, Shohreh Amini, and Martyn K White (2013). “General overview of neuronal cell
culture”. In: Neuronal Cell Culture, pp. 1–8.Graupner, Michael and Nicolas Brunel (2012). “Calcium-based plasticity model explains sensitiv-
ity of synaptic changes to spike pattern, rate, and dendritic location”. In: Proceedings of theNational Academy of Sciences 109.10, pp. 3991–3996.
Griffith, Thom, Krasimira Tsaneva-Atanasova, and Jack R Mellor (2016). “Control of Ca2+ influx
and calmodulin activation by SK-channels in dendritic spines”. In: PLoS computational biology12.5.
Hansel, C, A Artola, and W Singer (1996). “Different threshold levels of postsynaptic [Ca2+] i have
to be reached to induce LTP and LTD in neocortical pyramidal cells”. In: Journal of Physiology-Paris 90.5-6, pp. 317–319.
Hasan, Raquibul, Alasdair TS Leeson-Payne, Jonathan H Jaggar, and Xuming Zhang (2017). “Calmod-
ulin is responsible for Ca 2+-dependent regulation of TRPA1 Channels”. In: Scientific reports7.1, pp. 1–13.
He, Rongfang, Juan Zhang, Yiyan Yu, Laluo Jizi, Weizhong Wang, and Miaoling Li (2018). “New
insights into interactions of presynaptic Calcium Channel subtypes and SNARE proteins in neu-
rotransmitter release”. In: Frontiers in molecular neuroscience 11, p. 213.
Heil, Katharina F, Emilia Wysocka, Oksana Sorokina, Jeanette Hellgren Kotaleski, T Ian Simpson, J
Douglas Armstrong, and David C Sterratt (2018). “Analysis of proteins in computational models
of synaptic plasticity”. In: BioRxiv, p. 254094.

REFERENCES 27
Hoffman, Alexander, Goce Taleski, and Estelle Sontag (2017). “The protein serine/threonine phos-
phatases PP2A, PP1 and calcineurin: A triple threat in the regulation of the neuronal cytoskele-
ton”. In: Molecular and Cellular Neuroscience 84, pp. 119–131.
Holland and Wagner (1998). “Primed facilitation of homosynaptic long-term depression and de-
potentiation in rat hippocampus”. In: Journal of Neuroscience 18.3, pp. 887–894.
Iacobucci, Gary J and Gabriela K Popescu (2018). “Kinetic Models for Activation and Modulation of
NMDA Receptor Subtypes”. In: Current Opinion in Physiology.— (2017). “NMDA receptors: linking physiological output to biophysical operation”. In: Nature
reviews Neuroscience 18.4, p. 236.
Incontro, Salvatore, Javier Dıéaz-Alonso, Jillian Iafrati, Marta Vieira, Cedric S Asensio, Vikaas S So-
hal, Katherine W Roche, Kevin J Bender, and Roger A Nicoll (2018). “The CaMKII/NMDA receptor
complex controls hippocampal synaptic transmission by kinase-dependent and independent
mechanisms”. In: Nature communications 9.1, pp. 1–21.Inglebert, Yanis, Johnatan Aljadeff, Nicolas Brunel, and Dominique Debanne (2020). “Synaptic
plasticity rules with physiological calcium levels”. In: Proceedings of the National Academy ofSciences. issn: 0027-8424. doi: 10.1073/pnas.2013663117.
Jackman, Skyler L and Wade G Regehr (2017). “The mechanisms and functions of synaptic facili-
tation”. In: Neuron 94.3, pp. 447–464.
Jahr, Craig E and Charles F Stevens (1990). “A quantitative description of NMDA receptor-channel
kinetic behavior”. In: Journal of Neuroscience 10.6, pp. 1830–1837.
Jedrzejewska-Szmek, Joanna, Sriraman Damodaran, Daniel B Dorman, and Kim T Blackwell (2017).
“Calcium dynamics predict direction of synaptic plasticity in striatal spiny projection neurons”.
In: European Journal of Neuroscience 45.8, pp. 1044–1056.
King, Richard D, Michael C Wiest, and P Read Montague (2001). “Extracellular calcium deple-
tion as a mechanism of short-term synaptic depression”. In: Journal of Neurophysiology 85.5,
pp. 1952–1959.
Knot, Harm J et al. (2005). “Twenty years of calcium imaging: cell physiology to dye for”. In:
Molecular interventions 5.2, p. 112.Krelstein, Michael S, MP Thomas, and JM Horowitz (1990). “Thermal effects on long-term potenti-
ation in the hamster hippocampus”. In: Brain research 520.1-2, pp. 115–122.
Kwon, Taekyung, Masayuki Sakamoto, Darcy S Peterka, and Rafael Yuste (2017). “Attenuation of
synaptic potentials in dendritic spines”. In: Cell reports 20.5, pp. 1100–1110.Lee, Seok-Jin R, Yasmin Escobedo-Lozoya, Erzsebet M Szatmari, and Ryohei Yasuda (2009). “Acti-
vation of CaMKII in single dendritic spines during long-term potentiation”. In: Nature 458.7236,pp. 299–304.
Letzkus, Johannes J, Björn M Kampa, and Greg J Stuart (2006). “Learning rules for spike timing-
dependent plasticity depend on dendritic synapse location”. In: Journal of Neuroscience 26.41,pp. 10420–10429.
Lisman, John (1985). “A mechanism for memory storage insensitive to molecular turnover: a
bistable autophosphorylating kinase”. In: Proceedings of the National Academy of Sciences82.9, pp. 3055–3057.
— (1989). “Amechanism for the Hebb and the anti-Hebb processes underlying learning andmem-
ory”. In: Proceedings of the National Academy of Sciences 86.23, pp. 9574–9578.

28 CHAPTER 2. SYNAPTIC PLASTICITY AND ITS MECHANISMS
Lu, Wei, Yun Shi, Alexander C Jackson, Kirsten Bjorgan, Matthew J During, Rolf Sprengel, Peter H
Seeburg, and Roger A Nicoll (2009). “Subunit composition of synaptic AMPA receptors revealed
by a single-cell genetic approach”. In: Neuron 62.2, pp. 254–268.
Lynch, Gary, Thomas Dunwiddie, and Valentin Gribkoff (1977). “Heterosynaptic depression: a post-
synaptic correlate of long-term potentiation”. In: Nature 266.5604, pp. 737–739.
Lynch, Gary, John Larson, Stephen Kelso, German Barrionuevo, and Frank Schottler (1983). “Intra-
cellular injections of EGTA block induction of hippocampal long-term potentiation”. In: Nature305.5936, p. 719.
Magee, Jeffrey C and Daniel Johnston (1995). “Characterization of single voltage-gated Na+ and
Ca2+ channels in apical dendrites of rat CA1 pyramidal neurons.” In: The Journal of physiology487.1, pp. 67–90.
Maki, Bruce A and Gabriela K Popescu (2014). “Extracellular Ca2+ ions reduce NMDA receptor
conductance and gating”. In: Journal of General Physiology 144.5, pp. 379–392.
Malenka, Robert C (1993). “Long-term depression: not so depressing after all.” In: Proceedings ofthe National Academy of Sciences of the United States of America 90.8, p. 3121.
Maravall, áM, ZFMainen, BL Sabatini, and K Svoboda (2000). “Estimating intracellular calcium con-
centrations and buffering without wavelength ratioing”. In: Biophysical journal 78.5, pp. 2655–2667.
Markram, Henry,WulframGerstner, and Jesper Sjostrom (2011). “A history of spike-timing-dependent
plasticity”. In: Frontiers in synaptic neuroscience 3, p. 4.
Meredith, Rhiannon M, Anna M Floyer-Lea, and Ole Paulsen (2003). “Maturation of long-term po-
tentiation induction rules in rodent hippocampus: role of GABAergic inhibition”. In: Journal ofNeuroscience 23.35, pp. 11142–11146.
Michalski, Paul J (2014). “First demonstration of bistability in CaMKII, a memory-related kinase”.
In: Biophysical journal 106.6, pp. 1233–1235.Miller, Paul, Anatol M Zhabotinsky, John Lisman, and Xiao-Jing Wang (2005). “The stability of
a stochastic CaMKII switch: dependence on the number of enzyme molecules and protein
turnover”. In: PLoS biology 3.4, e107.
Mizuno, Tomoyuki, Ichiro Kanazawa, and Masaki Sakurai (2001). “Differential induction of LTP and
LTD is not determined solely by instantaneous calcium concentration: an essential involvement
of a temporal factor”. In: European Journal of Neuroscience 14.4, pp. 701–708.
Mulkey, Rosel M and Robert C Malenka (1992). “Mechanisms underlying induction of homosynaptic
long-term depression in area CA1 of the hippocampus”. In: Neuron 9.5, pp. 967–975.
Neher, Erwin, Bert Sakmann, and Joe Henry Steinbach (1978). “The extracellular patch clamp: a
method for resolving currents through individual open channels in biological membranes”. In:
Pflügers Archiv 375.2, pp. 219–228.
Nevian, Thomas and Bert Sakmann (2006). “Spine Ca2+ signaling in spike-timing-dependent plas-
ticity”. In: Journal of Neuroscience 26.43, pp. 11001–11013.
Nicholson, Daniel A, Rachel Trana, Yael Katz, William L Kath, Nelson Spruston, and Yuri Geinisman
(2006). “Distance-dependent differences in synapse number and AMPA receptor expression in
hippocampal CA1 pyramidal neurons”. In: Neuron 50.3, pp. 431–442.
Nicoll, Roger A (2017). “A brief history of long-term potentiation”. In: Neuron 93.2, pp. 281–290.

REFERENCES 29
Nishiyama, Makoto, Kyonsoo Hong, Katsuhiko Mikoshiba, Mu-Ming Poo, and Kunio Kato (2000).
“Calcium stores regulate the polarity and input specificity of synaptic modification”. In: Nature408.6812, p. 584.
O’Connor, Daniel H, Gayle MWittenberg, and Samuel S-HWang (2005). “Dissection of bidirectional
synaptic plasticity into saturable unidirectional processes”. In: Journal of neurophysiology 94.2,pp. 1565–1573.
Okamoto, Kenichi, Miquel Bosch, and Yasunori Hayashi (2009). “The roles of CaMKII and F-actin in
the structural plasticity of dendritic spines: a potential molecular identity of a synaptic tag?”
In: Physiology 24.6, pp. 357–366.
Otmakhov, Nikolai, Shaurav Regmi, and John Lisman (2015). “Fast decay of CaMKII FRET sensor
signal in spines after LTP induction is not due to its dephosphorylation”. In: PLoS One 10.6,
e0130457.
Pang, Zhiping P, Peng Cao, Wei Xu, and Thomas C Südhof (2010). “Calmodulin controls synaptic
strength via presynaptic activation of calmodulin kinase II”. In: Journal of Neuroscience 30.11,
pp. 4132–4142.
Papouin, Thomas and Philip G Haydon (2018). “Obtaining acute brain slices”. In: Bio-protocol 8.2.Pelkey, Kenneth A, Ramesh Chittajallu, Michael T Craig, Ludovic Tricoire, Jason C Wester, and Chris
J McBain (2017). “Hippocampal GABAergic inhibitory interneurons”. In: Physiological reviews97.4, pp. 1619–1747.
Perez-Alvarez, Alberto, Shuting Yin, Christian Schulze, John A Hammer, Wolfgang Wagner, and
Thomas G Oertner (2020). “Endoplasmic reticulum visits highly active spines and prevents
runaway potentiation of synapses”. In: Nature communications 11.1, pp. 1–10.Pharris, Matthew C, Thomas M Bartol, Terrence J Sejnowski, Mary B Kennedy, Melanie I Stefan, and
Tamara L Kinzer-Ursem (2019). “A multi-state model of the CaMKII dodecamer suggests a role
for calmodulin in maintenance of autophosphorylation”. In.
Pike, Fenella G, Rhiannon M Meredith, Andrew WA Olding, and Ole Paulsen (1999). “Postsynaptic
bursting is essential for ‘Hebbian’induction of associative long-term potentiation at excitatory
synapses in rat hippocampus”. In: The Journal of physiology 518.2, pp. 571–576.
Podgorski, Kaspar and Gayathri Ranganathan (2016). “Brain heating induced by near-infrared
lasers during multiphoton microscopy”. In: Journal of neurophysiology 116.3, pp. 1012–1023.
Ribrault, Claire, Ken Sekimoto, and Antoine Triller (2011). “From the stochasticity of molecular
processes to the variability of synaptic transmission”. In: Nature Reviews Neuroscience 12.7,
pp. 375–387.
Rinetti-Vargas, Gina, Khanhky Phamluong, Dorit Ron, and Kevin J Bender (2017). “Periadolescent
maturation of GABAergic hyperpolarization at the axon initial segment”. In: Cell reports 20.1,pp. 21–29.
Rivera, Claudio, Juha Voipio, John A Payne, Eva Ruusuvuori, Hannele Lahtinen, Karri Lamsa, Ulla
Pirvola, Mart Saarma, and Kai Kaila (1999). “The K+/Cl- co-transporter KCC2 renders GABA
hyperpolarizing during neuronal maturation”. In: Nature 397.6716, pp. 251–255.
Rizzoli, Silvio O and William J Betz (2005). “Synaptic vesicle pools”. In: Nature Reviews Neuro-science 6.1, pp. 57–69.
Robert, Antoine and James R Howe (2003). “How AMPA receptor desensitization depends on re-
ceptor occupancy”. In: Journal of Neuroscience 23.3, pp. 847–858.

30 CHAPTER 2. SYNAPTIC PLASTICITY AND ITS MECHANISMS
Roelandse, Martijn and Andrew Matus (2004). “Hypothermia-associated loss of dendritic spines”.
In: Journal of Neuroscience 24.36, pp. 7843–7847.
Romani, Andrea MP (2011). “Cellular magnesium homeostasis”. In: Archives of biochemistry andbiophysics 512.1, pp. 1–23.
Rowlett, James K, Donna M Platt, Snjezana Lelas, John R Atack, and Gerard R Dawson (2005).
“Different GABAA receptor subtypes mediate the anxiolytic, abuse-related, and motor effects
of benzodiazepine-like drugs in primates”. In: Proceedings of the National Academy of Sciences102.3, pp. 915–920.
Rycroft, Beth K and Alasdair J Gibb (2004). “Inhibitory interactions of calcineurin (phosphatase 2B)
and calmodulin on rat hippocampal NMDA receptors”. In: Neuropharmacology 47.4, pp. 505–
514.
Sabatini, Bernardo L and Karel Svoboda (2000). “Analysis of calcium channels in single spines
using optical fluctuation analysis”. In: Nature 408.6812, pp. 589–593.
Salussolia, Catherine L, Michael L Prodromou, Priya Borker, and Lonnie P Wollmuth (2011). “Ar-
rangement of subunits in functional NMDA receptors”. In: Journal of Neuroscience 31.31, pp. 11295–11304.
Santschi, Linda, Magali Reyes-Harde, and Patric K Stanton (1999). “Chemically induced, activity-
independent LTD elicited by simultaneous activation of PKG and inhibition of PKA”. In: Journalof neurophysiology 82.3, pp. 1577–1589.
Schmidt, Elke and Martin Oheim (2018). “Two-photon imaging induces brain heating and calcium
microdomain hyperactivity in cortical astrocytes”. In: bioRxiv, p. 321091.Sejnowski, Terrence J (1977). “Storing covariance with nonlinearly interacting neurons”. In: Journal
of mathematical biology 4.4, pp. 303–321.
Shibasaki, Futoshi and Frank McKeon (1995). “Calcineurin functions in Ca (2+)-activated cell death
in mammalian cells.” In: The Journal of cell biology 131.3, pp. 735–743.
Shibasaki, Makoto Suzuki, Atsuko Mizuno, and Makoto Tominaga (2007). “Effects of body tem-
perature on neural activity in the hippocampus: regulation of resting membrane potentials by
transient receptor potential vanilloid 4”. In: Journal of Neuroscience 27.7, pp. 1566–1575.
Silva, Alcino J, Richard Paylor, Jeanne M Wehner, and Susumu Tonegawa (1992). “Impaired spatial
learning in alpha-calcium-calmodulin kinase II mutant mice”. In: Science 257.5067, pp. 206–
211.
Sjöström, Per Jesper, Gina G Turrigiano, and Sacha B Nelson (2001). “Rate, timing, and coopera-
tivity jointly determine cortical synaptic plasticity”. In: Neuron 32.6, pp. 1149–1164.
Somogyi, Peter and Thomas Klausberger (2005). “Defined types of cortical interneurone structure
space and spike timing in the hippocampus”. In: The Journal of physiology 562.1, pp. 9–26.
Tebaykin, Dmitry, Shreejoy J Tripathy, Nathalie Binnion, Brenna Li, Richard C Gerkin, and Paul
Pavlidis (2018). “Modeling sources of interlaboratory variability in electrophysiological proper-
ties of mammalian neurons”. In: Journal of neurophysiology 119.4, pp. 1329–1339.
Thomazeau, Aurore, Miquel Bosch, Sofia Essayan-Perez, Stephanie A Barnes, Hector De Jesus-
Cortes, and Mark F Bear (2020). “Dissociation of functional and structural plasticity of dendritic
spines during NMDAR and mGluR-dependent long-term synaptic depression in wild-type and
fragile X model mice”. In: Molecular psychiatry, pp. 1–18.

REFERENCES 31
Tigaret, Cezar M, Valeria Olivo, Josef HLP Sadowski, Michael C Ashby, and Jack R Mellor (2016).
“Coordinated activation of distinct Ca 2+ sources and metabotropic glutamate receptors en-
codes Hebbian synaptic plasticity”. In: Nature communications 7, p. 10289.Trombetta-Lima, Marina, Inge E Krabbendam, and Amalia M Dolga (2020). “Calcium-activated
potassium channels: Implications for aging and age-related neurodegeneration”. In: The inter-national journal of biochemistry & cell biology 123, p. 105748.
Tsodyks, Misha V and Henry Markram (1997). “The neural code between neocortical pyrami-
dal neurons depends on neurotransmitter release probability”. In: Proceedings of the nationalacademy of sciences 94.2, pp. 719–723.
Urakubo, Hidetoshi, Miharu Sato, Shin Ishii, and Shinya Kuroda (2014). “In vitro reconstitution of
a CaMKII memory switch by an NMDA receptor-derived peptide”. In: Biophysical journal 106.6,pp. 1414–1420.
Wang, Nathan A Smith, Qiwu Xu, Takumi Fujita, Akemichi Baba, Toshio Matsuda, Takahiro Takano,
Lane Bekar, and Maiken Nedergaard (2012). “Astrocytes modulate neural network activity by
Ca2+-dependent uptake of extracellular K+”. In: Science signaling 5.218, ra26–ra26.
Wang and Wagner (1999). “Priming-induced shift in synaptic plasticity in the rat hippocampus”.
In: Journal of neurophysiology 82.4, pp. 2024–2028.
Wittenberg and Wang (2006). “Malleability of spike-timing-dependent plasticity at the CA3–CA1
synapse”. In: Journal of Neuroscience 26.24, pp. 6610–6617.
Woolfrey, Kevin M and Mark L Dell’Acqua (2015). “Coordination of protein phosphorylation and
dephosphorylation in synaptic plasticity”. In: Journal of Biological Chemistry 290.48, pp. 28604–28612.
Yang, Shao-Nian, Yun-Gui Tang, and Robert S Zucker (1999). “Selective induction of LTP and LTD
by postsynaptic [Ca2+] i elevation”. In: Journal of neurophysiology 81.2, pp. 781–787.
Yuste, Rafael (2010). Dendritic spines. MIT press.
Yuste, Rafael, Ania Majewska, Sydney S Cash, and Winfried Denk (1999). “Mechanisms of calcium
influx into hippocampal spines: heterogeneity among spines, coincidence detection by NMDA
receptors, and optical quantal analysis”. In: Journal of Neuroscience 19.6, pp. 1976–1987.
Zhou, Lujia et al. (2017). “Tau association with synaptic vesicles causes presynaptic dysfunction”.
In: Nature communications 8.1, pp. 1–13.Zhou, Qiang, Koichi J Homma, and Mu-ming Poo (2004). “Shrinkage of dendritic spines associated
with long-term depression of hippocampal synapses”. In: Neuron 44.5, pp. 749–757.
Zucker, Robert S and Wade G Regehr (2002). “Short-term synaptic plasticity”. In: Annual reviewof physiology 64.1, pp. 355–405.

Chapter 3
Computational models of synapticplasticity
Computational science fields such as AI or computer vision generally have bench-
mark datasets to rank models’ performance. The same practice is uncommon in
computational neuroscience (Jolivet et al. 2008) since the specificity of experi-
ments imposes a less flexible approach when the mechanistic understanding is
the goal. The plasticity experimentation hallmarks such as STDP from Bi and Poo
1998 or the BCM-rule from Kirkwood et al. 1996 cover only a fraction of the stag-
gering heterogeneity seen in the plasticity experimentation literature. Therefore,
they cannot be used as the sole quantitative or qualitative ground truth to judge
if a plasticity model performs well. Since the plasticity phenomenon is still being
explored, an ideal model can support this exploration by reproducing a compre-
hensive set of experiments to provide testable predictions and sharper questions
(Karlin and Matessi 1983).
3.1 Unified theories for synaptic - modeling approaches
Due to the diversity of plasticity experiments, conceptual advances are neces-
sary to address a large body of experiments. Unified theories (Kievit et al. 2011)
have thus been proposed to tackle this issue. These unified theories, exemplified
by models, combine different concepts to describe a larger domain of evidence
related to synaptic plasticity. In this way, they open new questions. Although
the theory status could sound premature compared to long-standing theories in
physics (e.g. as stated in Rohrlich 1989 pg. 27), the term is justified by how
a model achieves a broader understanding by combining previously established
principles, concepts or evidence. For instance, in Costa et al. 2015 the descrip-
32

3.2. COMPLEXITY OF MECHANISMS ON PLASTICITY MODELS 33
tion of both pre-and postsynaptic long-term plasticity are unified to give a new
vision on how long-term plasticity is induced. Another example, Ebner et al. 2019
models the evidence that plasticity is deferentially induced given the neuron’s
morphologic characteristics together with the concept of the enzymatic control
of pre-and postsynaptic plasticity. Other examples of unified models approaches
are given by Mäki-Marttunen et al. 2020, Shouval et al. 2002, De Pittà and Brunel
2016 and Singh et al. 2021. Integrating mechanisms into a single model can
increase its complexity due to the resulting number of interactions but allows
one to incorporate the diverse mechanistic contributions to synaptic plasticity.
However, a unified theory is not necessarily built over complexity or the detailed
description of all known interactions. More abstract models (Graupner and Brunel
2012; Clopath and Gerstner 2010) can also unify different concepts. Note that a
complex model does not imply its quality when reproducing a phenomenon, as
shown by Brette 2015, neither, reproducing experiments should be the single
goal of modelling. Thus, we will identify how models unifying different concepts
contribute to pose testable hypotheses.
3.2 Complexity of mechanisms on plasticity models
To understand how mechanistic models differ and propose testable predictions,
we need to know how models are assembled and what are their limits. Testable
predictions can be quoted as what an experimentalist needs in order to test the
model predictions. For instance, an electrophysiology experiment has many de-
tails and steps, with few exceptions, overlooked by current models. However,
they can affect learning rules as shown in Figure 3.1. Therefore, it is important
to define the scope in which the hypothesis drawn from the model are testable.
Table 3.4 categorizes the level mechanistic details to specify model capabilities
as shown in Table 3.5. Such categorization is done not to undermine other models
efforts but to identify the gap in which different model could contribute. To this,
four attributes were considered: experimental conditions (temperature, devel-
opment, aCSF), firing structures (FDP, STDP, irregular firing), localization (presy-
naptic, morphology, glia, sampling methods), and fast/slow variables (membrane
potential, neurotransmitters, Ca2+ sources, molecular dynamics). With these four
attributes, five models are compared as shown in Table 3.5. Next, the four at-
tributes and their relevance for testable predictions are discussed.

34 CHAPTER 3. COMPUTATIONAL MODELS OF SYNAPTIC PLASTICITY
3.2.1 Experimental conditions
Modelling plasticity requires qualitative or quantitative data and the data type
(e.g. neuroimage, EEG, electrophysiology). Because sampling methods normally
vary between labs (Tebaykin et al. 2018) and methodological differences can
modify the experimental outcomes (as in Figure 3.1), knowing how the data used
in amodel is sampled can help to determine themodel’s scope. Electrophysiology
measurements are the most common type of data used in plasticity modelling.
Despite that, experimental conditions can vary as shown in the Tables 3.3, 3.1
and 3.2 which summarize ex vivo experiments which are reproduced by the five
models in the Table 3.5 (except Tigaret et al. 2016; Mizuno et al. 2001; Dudek
and Bear 1993). Sampling aspects known to affect plasticity outcomes are: sex
(Dachtler and Fox 2017), age (Dudek and Bear 1993; Kirkwood et al. 1995), tem-
perature (Alonso and Marder 2020; Krelstein et al. 1990), aCSF recipe (Inglebert
et al. 2020), slicing procedures and brain regions. However, this list of plastic-
ity modifiers is overlooked by most models which are unlikely to propose clear
instructions linking experimental conditions and their simulated variables. This
limitation of current models will be discussed in more detail later when we de-
scribe how models implement experimental conditions. Figure 3.2 depicts an ex-
ample of implementation of experimental conditions that is classified as complex
in Table 3.4.
Figure 3.1: Examples of plasticity rules modulated by experimental conditions. On the Left, plasticity outcomes from LFS and TBS
affected by age (see Dudek and Bear 1993). In the Middle, plasticity outcomes from STDP being affected by [Ca2+]o and [Mg
2+]o (see
Inglebert et al. 2020). On the Right, plasticity outcomes from TBS affected by temperature (see Krelstein et al. 1990).
Temperature
Most temperatures used in plasticity experiments do not closely follow physiolog-
ical conditions due to neural tissue viability (Buskila et al. 2020) and other exper-

3.2. COMPLEXITY OF MECHANISMS ON PLASTICITY MODELS 35
imental constraints. Temperature fluctuations can occur during experimentation,
induced by the environment, or sampling techniques such as laser or electrode-
induced heating, both poorly controlled. By observing the categorized plasticity
models in Table 3.5, most of them overlook the temperature differences in the ex-
periments they reproduce (Tables 3.3 and 3.1). For instance, the three STDP ex-
periments reproduced by Jedrzejewska-Szmek et al. 2017’s model were recorded
at different temperatures. However, the implemented NDMAr and AMPAr are not
adapted to the temperature differences, although they are known to be affected
by it (Korinek et al. 2010; Postlethwaite et al. 2007). By stating which temperature
the model is designed for can help to define its validity. That could improve the
bottleneck on the data availability since synaptic or neuronal mechanisms are not
experimentally characterized in a sufficiently broad range to support modelling.
Unlike plasticity models, few other computational neurosciencemodels have tem-
perature adaptations, even when using heterogeneous data sources (Bartol et al.
2015; Alonso and Marder 2020). For instance, Bartol et al. 2015 reconstitutes
Ca2+ dynamics in physiological temperatures, adjusting their model to 34C with
the reference parameters for the model sampled at different temperatures. Also,
Alonso and Marder 2020 characterizes network dynamics using data from crabs
(Cancer Borealis) in different temperatures. They show that temperature can
modulate network rhythms (Tang et al. 2012), this modulation is expected to be
acute in hot-blooded animals, for which temperature range is narrow. Tempera-
ture oscillations occur during circadian cycles or pathological circumstances (e.g.
fever, hyper/hypothermia). Thus, the implementation of temperature is a relevant
factor impacting how we can model memory, learning and normal functioning of
the brain.
Developmental age of specimens
Animals undergo constant change during their lifetimes. The genetic variability
analysis of the developing synaptosome (Cizeron et al. 2020) pointed out that
the synaptic genetic diversity reaches its peak during adulthood, whereas old
and young individuals have it less differentiated. An example of developmental
impacts over plasticity is shown by Dudek and Bear 1993. They use local field
stimulation on the CA3-CA1 pathway to induce LTD at different developmental
ages, showing that LTD is more robust for younger than adult rats. Despite the
LTP and LTD requirements being not the same during development (Pinar et al.
2017; Dudek and Bear 1993), most models for plasticity overlook age despite rec-
ognizing its relevance Graupner and Brunel 2012. Usually, computational mod-

36 CHAPTER 3. COMPUTATIONAL MODELS OF SYNAPTIC PLASTICITY
els depict age as a class rather than a continuum. For instance, in McKiernan
and Marrone 2017 review, age is represented as age classes with different firing
properties. The range of animal ages used in plasticity experiments is also vari-
able, usually within few days of difference Nevian and Sakmann 2006 (13-15) or
a month as in Weber et al. 2016. Despite Ca2+ sources undergo fast expression
changes during development, such as the NMDAr developmental shift (Sinclair et
al. 2016), these aspects are not explicitly described in plasticity model (Shouval et
al. 2002; Philpot et al. 2001). Therefore, it is relevant for models to capture these
differences since they induce qualitative alteration in electrophysiology and Ca2+
dynamics within few days (Meredith et al. 2003; Dudek and Bear 1993; Buchanan
and Mellor 2007; Kirkwood et al. 1995). Table 3.5 shows that developmental as-
pects are the most overlooked among the compared models for plasticity.
Figure 3.2: Idealized experimental conditions implementation. On the Left, all implemented mechanisms have temperature con-
trol. In the Middle, All implemented ions have their reversal potential considering internal and external concentrations. On the Right, all
implemented mechanisms are effects by age.
aCSF composition
In ex vivo experiments, an artificial cerebrospinal fluid (aCSF) is used to support
the neural tissue viability. The aCSF composition influences neuronal electro-
physiology (Tebaykin et al. 2018) by changing the spontaneous neuronal activity
(Barreto and Cressman 2011; Barreto and Cressman 2011) or modifying receptor
kinetics (Maki and Popescu 2014). An experimental-theoretical work (Inglebert
et al. 2020) showed how the external Ca2+ concentration, [Ca2+]o, causes qual-
itative changes on the STDP curves obtained from hippocampal rat slices. They
modelled the collected data using a nonlinear version of Graupner and Brunel
2012 Ca2+-based rule since the linear version was not sufficient (see Table 3.5).
They managed to reproduce STDP with different delays, frequencies, and burst
modes. However, despite it is well known that extracellular ion concentrations
(e.g. [Ca2+]o, [Mg2+]o) modulates various molecular mechanisms implicated in
synaptic plasticity, such as NMDAr conductance (Maki and Popescu 2014) and
VGCCs. Despite that the implementation of a biophysically detailed external ion

3.2. COMPLEXITY OF MECHANISMS ON PLASTICITY MODELS 37
influence has not been done for plasticity models (Higgins et al. 2014; Inglebert et
al. 2020). Note that some biophysical models in computational neuroscience use
GHK formalism to cover the diversity of extracellular ionic concentrations (Huang
et al. 2015) such as the astrocyte ion buffering properties (Serrano-Gotarredona
et al. 2013).
L5 or L2/3 cortex - brain slices
EXPERIMENT PAPER REP. FREQ (Hz) AGE (DAYS) TEMP. (C) Ca (mM) Mg (mM)
STDP + freq Sjöström et al. 2001 1 min 0.1 – 50 12 – 21 32 – 34 2.5 1
STDP + freq
sub. t. depolarizationSjöström et al. 2001 1 min 0.1 – 50 12 – 21 32 – 34 2.5 1
1Pre1Post10 - 15x
L5-L5, L2/3-L5
soma distances
Sjöström and Häusser 2006* – 50 14 – 21 32 – 35 2 1
1Pre1Post10
L5-L5, L2/3-L5
soma distances
sub. t depolarization
Sjöström and Häusser 2006* – 50 14 – 21 32 – 35 2 1
STDP Froemke et al. 2006 60 – 100 0.2 10 – 35 room 2.5 1.5
STDP
bicuculine meth.Froemke et al. 2006 60 – 100 0.2 10 – 35 room 4 4
5x 1Pre1Post10
(STDP, at a given freq.
repeated 30-40 at 0.2 Hz)
Froemke et al. 2006 30 – 40 0.2 10 – 35 room 4 4
nx 1Pre1Post10
(STDP, at a given freq.
repeated 30-40 at 0.2 Hz)
Froemke et al. 2006 30 – 40 0.2 10 – 35 room 4 4
xPre+yPost
(STDP, at a given freq.
repeated 30-40 at 0.2 Hz)
Froemke et al. 2006 30 – 40 0.2 10 – 35 room 4 4
STDP (burst)
(1Pre3Post ∆ t)
Post at 50 Hz
Nevian and Sakmann 2006 60 0.1 13 – 15 32 – 35 2 1
STDP (burst frequency)
(1Pre3Post10 and 1Pre3Post-10)
Post at X Hz
Nevian and Sakmann 2006 60 0.1 13 – 15 32 – 35 2 1
STDP (burst frequency)
(1PreXPost10 and 1PreXPost-10)
Post at 50 Hz
Nevian and Sakmann 2006 60 0.1 13 – 15 32 – 35 2 1
STDP (1Pre1Post)
L2/3-L5
soma distances
Letzkus et al. 2006 100 – 200 1 21 – 42 34 – 35 2 1
STDP (1Pre3Post)
L2/3-L5
soma distances
Letzkus et al. 2006 100 – 200 1 21 – 42 34 – 35 2 1
STDP
corticostriatalShen et al. 2008* 10–15 (x5) 0.1 19 – 26 room 2 1
STDP
corticostriatalPawlak and Kerr 2008 60 0.1 19 – 22 31 – 33 2.5 2.0
STDP
corticostriatalFino et al. 2010 100 1 15 – 21 34 2 1
Table 3.1: Plasticity experiments in the cortex (slices) reproduced by the models in Table 3.5.

38 CHAPTER 3. COMPUTATIONAL MODELS OF SYNAPTIC PLASTICITY
Hippocampus - cultured neurons
EXPERIMENT PAPER REP. FREQ (Hz) AGE (DAYS) TEMP. (C) Ca (mM) Mg (mM)
STDP, single, triplets
quadruplets (pre or post)Wang et al. 2005 60 1
17 – 18 (E)
8 – 15 (IV)room 3 2
STDP Bi and Poo 1998 60 118 – 20 (E)
8 – 15 (IV)room 3 2
Table 3.2: Plasticity experiments in cultured hippocampal neurons reproduced by the models in Table 3.5.
Hippocampus - brain slices
EXPERIMENT PAPER REP. FREQ (Hz) AGE (DAYS) TEMP. (C) Ca (mM) Mg (mM)
STDP (warm)
1Pre1Post ∆ tWittenberg and Wang 2006 70 – 100 5 14 – 21 30 – 34 2 1
STDP (cold)
1Pre1Post ∆ tWittenberg and Wang 2006 70 – 100 5 14 – 21 24 – 30 2 1
STDP (cold)
1Pre2Post ∆ tWittenberg and Wang 2006 70 – 100 5 14 – 21 24 – 30 2 1
STDP (cold)
1Pre2Post ∆ tWittenberg and Wang 2006 20 – 30 5 14 – 21 24 – 30 2 1
STDP (burst)
1Pre1Post ∆ t
picrotoxin
Tigaret et al. 2016 300 5 50 –55 35 2.5 1.3
STDP (single)
1Pre2Post ∆ t
picrotoxin
Tigaret et al. 2016 300 5 50 –55 35 2.5 1.3
Doublets (duration)
2Pre50, 2Pre10
picrotoxin
Tigaret et al. 2016 300 and 900 5 and 3 50–55 35 2.5 1.3
STDP (single, Ca)
1Pre1Post ∆ tInglebert et al. 2020
100, > delays
150, < delays0.3 14 – 20 30 1.3 – 3 Ca/1.5
STDP (single)+freq+Ca2+
1Pre1Post10, X HzInglebert et al. 2020
100, > delays
150, < delays0.3 – 10 14 – 20 30 1.3, 1.8 Ca/1.5
STDP (burst)
1PreXPost10, X=2..4Inglebert et al. 2020 100 0.3 14 – 20 30 1.3, 1.8 Ca/1.5
STDP (single+age)
1Pre1Post ∆ tMeredith et al. 2003 20 0.2 9 – 45 24 – 28 2 2
STDP (burst+age)
1Pre2Post ∆ tMeredith et al. 2003 20 0.2 9 – 45 24 – 28 2 2
FDP Dudek and Bear 1992 900 1 – 50 ∼35 35 2.5 1.5
FDP+age Dudek and Bear 1993 900 1 7 – 35 35 2.5 1.5
TBS+age Dudek and Bear 1993 3 – 4 ( 5) epochs4Pre at 100 Hz
(10x at 5Hz)6, 14 and 17 35 2.5 1.5
LFS (duration) Mizuno et al. 2001 1 – 600 1 12 – 28 30 2.4 0
LFS (duration)
NMDA blockerMizuno et al. 2001 1 – 600 1 12 – 28 30 2.4 0
dendritic cooperativity
4 spinesWeber et al. 2016 50 3 49 – 77 32 – 35 1.25 1.3
dendritic cooperativity
4 spines
low-Mg
Weber et al. 2016 50 3 49 – 77 32 – 35 1.25 0.1
STDP
astrocyte activity
+picrotoxin
Bonansco et al. 2011 60 1 25 – 35 20 – 22 2.5 2
Table 3.3: Plasticity experiments in the hippocampus (slices) reproduced by the models in Table 3.5.
3.2.2 Firing patterns
Firing patterns are the plasticity experimentation aspect that received the most
attention from modellers despite not being the only cause for plasticity induction.

3.2. COMPLEXITY OF MECHANISMS ON PLASTICITY MODELS 39
Next, let’s describe which protocols are mostly targeted by plasticity models. Fig-
ure 3.3 show different experimental paradigms classified in Table 3.4.
Figure 3.3: Idealized experimental firing patterns which could be covered by a single model. On the left, illustrations depict
BCM related goals, data-driven comparisons, BCM-like modifications (sliding threshold and amplification), and BaP induced by EPSP. In the
middle, data-driven comparison and different STDP curves (as in Wittenberg and Wang 2006). On the right, it illustrates a replay experiment
in which spikes are recorded in CA3-CA1 in vivo and the firing patterns used as input in ex vivo.
Spike-timing-dependent plasticty
STDP protocols control the Ca2+ influx in dendritic spines through pre and postsy-
naptic stimulation. In the literature, STDP firing pattern variations include bursts,
various frequencies and pulse numbers, inducing different plasticity outcomes
shown by Wittenberg and Wang 2006; Tigaret et al. 2016. These variations are
also affected by experimental conditions (Inglebert et al. 2020), and by dendritic
location as implemented by Ebner et al. 2019. Despite neurocomputational stud-
ies have given hold important the canonical STDP curve estimated by Bi and Poo
1998, it was not found to be reproducible in low Ca2+ settings (Froemke and Dan
2002; Inglebert et al. 2020). Yet, it became a benchmark for some models (De
Pittà and Brunel 2016) and neuro-inspired technologies (Zhuravleva et al. 1997).
Table 3.5 shows how different plasticity models cover a wide range of STDP exper-
iments, while other models focus on the canonical STDP with little physiological
relevance.
Frequency dependent platicity (FDP)
Bliss and Lømo 1973 were the first to formalize a method to induce LTP. Further,
Lynch et al. 1977 did the same with LTD, leading to the experimental discovery
of the frequency-dependent plasticity. The BCM-like and the STDP curves are
milestones for plasticity models (Graupner and Brunel 2012; Izhikevich and De-
sai 2003). Despite the various FDP experiments, spiking times of EPSP-induced
APs are not recorded (Mayr and Partzsch 2010). For instance, in Dudek and
Bear 1992 that only mentions the presynaptic frequency and does not record

40 CHAPTER 3. COMPUTATIONAL MODELS OF SYNAPTIC PLASTICITY
postsynaptic spikes. Therefore, depending on the experimental conditions, su-
perthreshold summated EPSPs can produce AP, affecting the Ca2+ influx. From
the modelling perspective, one should be aware that an FDP experiments can
have EPSP-induced-AP, thus it is important to have a mechanism to generate
APs. Excluding EPSP-induced-AP can hinder the participation of NMDAr coinci-
dence detection (Jahr and Stevens 1990). The models in Table 3.5 do not include
short term depression, which is known to limit the high-frequency stimulation
due to the fast depletion of neurotransmitter resources (Fernández-Alfonso and
Ryan 2004). Other plasticity models (Deperrois and Graupner 2020; Costa et al.
2015) implement these presynaptic adaptations, which are relevant to grasp the
unreliable nature of neuronal transmission.
Another experimental example is the sliding threshold (Kirkwood et al. 1996)
implemented by Shouval et al. 2002 through the NMDAr decay times, however,
without explicitly modelling what grants the NMDAr slower or faster kinetics such
as the NMDAr shift (Philpot et al. 2001). Also, other models have suggested the
hyperpolarizing-activated currents as the factors controlling the sliding threshold
(Narayanan and Johnston 2010), however, without a direct data comparison.
Irregular Firing
The most used experimental data in plasticity models are the regular firing struc-
tures with correlated spiking times. However, neurons in vivo are subjected to
background noise and irregular spiking times incompatible with the usual experi-
mental approach. As previously noted, in vivo plasticity cannot be explained only
by delay times as in STDP (Froemke and Dan 2002), thus suggesting rules that
use a single frequency or a single delay time characterize plasticity is of limited
interest. Unified theories can be applied to natural firing patterns as shown in
previous plasticity models (Graupner et al. 2016; Cui et al. 2018; Bittner et al.
2017). Table 3.4 collects studies of irregular firing in plasticity protocols which
are found in various degrees in the models listed in Table 3.5.
3.2.3 Brain regions and structures (localization)
Synaptic plasticity induction can be different between brain region since neu-
rons exhibit various morphologies (e.g. Purkinje and CA1 pyramidal cell), input
patterns dependent on the incoming neurocircuitry, genetic expression profiles
(Cizeron et al. 2020) and are supported for different densities of non-neuronal
cells (e.g. non-uniform distribution astrocytes, Keller et al. 2018). A formulation
of the non-neurocentric plasticity has been approached by unified theories which

3.2. COMPLEXITY OF MECHANISMS ON PLASTICITY MODELS 41
aim to generalize concepts (De Pittà and Brunel 2016). Depending on which sam-
pling method is used, plasticity outcomes from ex vivo and in vivo can differ due
to the background activity and others aspects (Ahnaou et al. 2020). Table 3.4 de-
scribes key aspects regulating plasticity in different localization contexts which
are used to classify models in Table 3.5.
Presynaptic plasticity pathways
The presynaptic release is pointed out as the largest source of variability in the
postsynaptic calcium influx due to its all-or-none behaviour (Yuste et al. 1999).
Unified theories have included presynaptic plasticity pathways such as the en-
docannabinoid system Heifets and Castillo 2009 to predict pre and postsynaptic
plastic changes (Costa et al. 2015; Ebner et al. 2019; Deperrois and Graupner
2020; Costa et al. 2017; Cui et al. 2018). Also, different forms of vesicle release
are implemented by the models as shown in Table 3.5, most usually, a discrete re-
lease with or without short-term plasticity (STP) is used, or an averaged STP form
in which the effects are illustrated in Figure 6.4A. However, vesicle pool dynamics
are generally ignored by models (Jedrzejewska-Szmek et al. 2017). Instead, mod-
els (De Pittà and Brunel 2016; Ebner et al. 2019) have used an averaged-form
of vesicle release or no adaptation, i.e. does not mimic the depletion of vesicles
during sustained inputs. An example of discrete and averaged vesicle release
forms is given in this thesis’s additional results in Figure 6.4.
Morphology
Different implementations of spine (Bartol et al. 2015) and neuron morphologies
(Herz et al. 2006) are found in models to represent time and position of vari-
ables relevant to plasticity (Chindemi et al. 2020; Ebner et al. 2019; Jedrzejewska-
Szmek et al. 2017). The relevance of spatial characterization intersects with elec-
trophysiology and diffusion properties of enzymes (Yasuda 2017) which has been
approached by more detailed models (Blackwell et al. 2019). Furthermore, den-
dritic spikes contribution to plasticity prediction has been implemented by Ebner
et al. 2019. Another example, Chindemi et al. 2020 includes multiple simplified
Ca2+-dependent rules based on Graupner and Brunel 2012 to estimate plasticity
in cortical neurons for various synapses. Table 3.4 shows different levels of neu-
ron morphology implementations and how plasticity models adopt them (Table
3.5).

42 CHAPTER 3. COMPUTATIONAL MODELS OF SYNAPTIC PLASTICITY
Non-neuronal cells contribution
The tripartite synapse (pre, post and astrocyte, Tewari and Majumdar 2012; Nad-
karni and Jung 2007) or quadripartite (including microglia Schafer et al. 2013)
are non-neurocentric frameworks to understand plasticity through the synaptic
micro and macrodomains. These non-neuron cells regulate the extracellular en-
vironment, excitability, neuronal death and development (Singer et al. 2018). For
instance, astrocytes prevent glutamate spillover to nearby spines through gluta-
mate transporters (GLT-1) which recently has been receiving attention in models
González et al. 2020. Despite De Pittà and Berry 2019 initiatives to model the
participation glia cells on plasticity there is still a gap to be filled as suggested by
Table 3.5.
Sampling methods
The rules to induce plasticity differ between brain regions due to their specializa-
tion, specific morphology, expression, and connectivity rules. Therefore, models
need to be adaptable to capture aspect in different regions, such as done by
Graupner and Brunel 2012. Theoretically, a model can evaluate if the experi-
ment done for one region is valid for another one as shown by Ebner et al. 2019
which made a cortex model and applied it to reproduce cortical and hippocampal
data. The benefit of having a less abstract parameter space is that a model can
be repurposed using available biophysical measures rather than decode how a
given abstraction maps an experiment specificity. The meaning of abstraction
here is how a model represents physical units and biological entities. Table 3.5
shows how generic plasticity models are when including different brain regions
and sampling methods.
3.2.4 Fast/slow variables
Within the dendritic spines, ion channels can open and close in milliseconds, and
enzymes can stay activated for minutes. Such duality can bridge short and long
time scales Antunes et al. 2016a. For instance, the hippocampus’s sliding thresh-
old phenomena was observed using first a slow priming stimulation with a rest
period followed by the frequency-dependent protocol (Wang and Wagner 1999).
Another experiment requiring slow variables is the Bittner et al. 2017 behavioural
spiking time plasticity. They replayed a burst-like-STDP recorded in vivo with long
delay times (seconds), finding a bell shape curve that requires a slow variable
to bridge long timescales. To include these, models have used slow variables

3.2. COMPLEXITY OF MECHANISMS ON PLASTICITY MODELS 43
(e.g. based on enzymes) to integrate fast timescales, such as done by Graup-
ner and Brunel 2007 inspired by their CaMKII-CaN model (Graupner and Brunel
2007). A similar strategy is done by Clopath and Gerstner 2010, which integrates
fast membrane potential timescales using a low pass filter. Table 3.5 shows how
models integrate these different aspects.
Membrane potential
Membrane potential is usually a fast variable that is more accessible to measure
than Ca2+. Although some models have not included electrophysiological aspects
directly (Graupner and Brunel 2012; Inglebert et al. 2020), its characterization
was shown to be relevant to understand how NMDAr coincidence contributes to
plasticity. BaPs, which are the postsynaptic responses dendritic spines interact
with, attenuates under constant use, and it is subjected to the differential expres-
sion of ion channels (Ebner et al. 2019). The BaP attenuation controls the Ca2+
entry in neurons through NMDAr coincidence. The membrane potential is closely
related to neuron morphology since it defines the location of excitatory, inhibitory
and modulatory inputs (Gerstner et al. 2018), and the dendritic tree integration
properties.
Neurotransmitters & receptors
The plasticity phenomena have necessary conditions other than entry of Ca2+ in-
flux, for instance mGluR1 (Tigaret et al. 2016) and CaMKII activation (Chang et
al. 2017). Beyond the classically implemented receptor and ion channels, neu-
romodulators modify excitability and requirements to plasticity induction (He et
al. 2015). Models have included neuromodulators contribution (Blackwell et al.
2019). Alternatively, they have modelled regions that are markedly related to
neuromodulation, such as dopaminergic synapses in the striatum (Jedrzejewska-
Szmek et al. 2017). Also, this has been done in a more phenomenological fashion
Gerstner et al. 2018. As suggested by Magee and Grienberger 2020, neuromod-
ulators participate in vivo plasticity (Isaac et al. 2009; Bittner et al. 2017). There-fore it would be valuable if they were more represented in models.

44 CHAPTER 3. COMPUTATIONAL MODELS OF SYNAPTIC PLASTICITY
COMPLEX
INTERMEDIATE
SIMPLIFIED
ABSENT
EXPE
RIM
ENTA
LCO
NDITIO
NS
temperature
allmechanismshave
somemechanismshave
onemechanism
have
nocontrol
development
allmechanismshave
somemechanismshave
onemechanism
have
nocontrol
aCSF
external/internalconcentrationforallions
external/internalconcentrationforoneions
arbitraryconcentrationunit
nocontrol
FIRIN
GST
RUCT
URES
FDP
reproducesfrequency-dependentdata
slidingthreshold
(ifshownforthebrain
region)
ratestim
ulation(e.g.Poisson)
otherdirectstim
ulationexperim
ent
reproducesfrequency-dependentdata
reproducesfrequency-dependent(quali)
noFDP
STDP
burstSTDPxPre(x1)-yPost(y1)-delay,
single
pairedSTDP
STDPvariations(e.g.ext.Ca2+,distance)
STDPjittered
single
pairedSTDP
(multiple
delaytim
es)
single
delaySTDP
noSTDP
irregularfiringstructures
Poissonfiring,non-Poissonfiring
replaydata,in-vivolike
(e.g.sleepwaveripples)
regularwithbackgroundnoise
withdata
Poissonfiring,replaydata
predictionwithoutdata
Poissonfiring
predictionwithoutdata
absent
LOCA
LIZA
TION
presynaptic
presynapticsignaling(e.g.endocanabinoid,arc)
preVGCCs,preNMDA,preBuffers
presynapticLTD/LTP
vesiclespooldynamics
STP(e.g.augmentation,facilitation)
discreterelease
STP,presynapticvoltageorCa2+
discreterelease
averagedreleaseprobability
nopresynapticcontrol
morphology
3Dreconstructions
spines,dendrites,soma,axon
1Dcompartments
ball-and-stick
pointneuron
anymorphologicalaspect
nomorphology
glia
ion-buffering,aCSFfiltrate,gliotransmission
recyclingneurotransmission
Ca2+waves
phen.gliacontroloveraCSF
gliotr.
phen.excitabilitycontrolbyglia
Noglia
samplingmethods
slices,cultured,In-vivo
morethanonebrain
region
single
region
morethanonemethod
asingle
brain
region
onemethod(e.g.CA1accuteslices)
Notspecified
FAST
ANDSL
OW
VAR.
membranepotential
activedendrite
differentialchannelsexpression
inhibitory/excitatoryinputintegration
gapjunctions,attenuationofvoltage
passivedendrite(ifpresent)
atleastK+andNa+channels
integrate-and-firetype
novoltage
neurotransmitters&receptors
ionotropic
metabotropic
dose-dependence
neuromodulators
ionotropic
dose-dependentcontrol
ionotropicreceptors/ionchannelsonly
notspecified
Ca2+sources
extracelullarCa2+,Pumps,dyeinclusion
buffering
permeable
AMPA
permeable
Na+,NMDAsubtypes,VGCCsubtypes
ER
genericNMDA
genericVGCC
single
Ca2+source
(withoutspecifiedsource)
noCa2+
moleculardynamics
diffusion
interactionswithreceptors,ionchannels
transporters(e.g.GLT-1)
turnover
messengers(e.g.g-protein)
buffering
data-drivenandphenomenological
implementationofmolecules
phenomenological
implementationofmolecules
(e.g.unknownmolecules)
absent
Table 3.4: Table classifying different attributes of plasticity models.

3.2. COMPLEXITY OF MECHANISMS ON PLASTICITY MODELS 45
GraupnerandBrunel2012
Ebneretal.2019
DePittàandBrunel2016
Jedrzejewska-Szmeketal.2017
Inglebertetal.2020
EXPE
RIM
ENTA
LCONDITIONS
Temperature
absent
absent
absent
temperaturecorrected
ionchannels
absent
Development
absent
absent
absent
absent
absent
aCSF
absent
absent
absent
absent
Ca2+andMg2+modelled
byphen.non-linearity
FIRIN
GST
RUCT
URES
FDP
STDP+FDP
(Sjöström
etal.2001)
Poisson(prediction)
slidingthreshold
(prediction)
STDP+FDP+proxim
al
(Sjöström
etal.2001)
STDP+FDP+basal
(Sjöström
andHäusser2006)
STDP+FDP+delays+distance
(prediction)
glia.frequencyresponse
Poissonfiring
absent
STDP+FDPfordifferentCa2+
from
(Inglebertetal.2020)
STDP
STDP+FDP
(Sjöström
etal.2001)
single
andburstSTDP
(WittenbergandWang2006)
STDP+jitter(prediction)
burstSTDP
(NevianandSakmann2006)
STDP+distance
(Letzkusetal.2006)
(Weberetal.2016)
STDPmodulationby
gliotransmitterregulation
STDP+frequency
delayin
gli.transtoSTDP
(BiandPoo1998)
STDP+dopamine
(Finoetal.2010)
(PawlakandKerr2008)
(Shenetal.2008)
[Ca]o+STDP
STDP+burst
STDP+FDP
(Inglebertetal.2020)
irregularfiring
in-vivolikefiring
Poissonrate(prediction)
STDP+jitter(prediction)
stochasticbackgroundactivity
atsynapseclusters
(prediction)
Poissonfiring
STDPjitterongliotransmission
absent
absent
LOCA
LIZA
TION
presynaptic
nopreadaptation
discrete
(externalnoiseoncalcium)
preLTP/LTD
eCBandNOsignaling
averagedvesicle
release
averagedvesicle
release
byresource-usefunction
(TsodyksandMarkram
1997)
pre.gliomodulation
preCa
STP
(byAMPAdesensitization)
nofailures
inheritedfrom
(Evansetal.2013)
discrete
nopreadaptation
discrete
(externalnoiseoncalcium)
morphology
absent
soma+dendrites+axon
inherited(Hayetal.2011)
pointneuron
soma+dendrite+spines
inherited(Evansetal.2013)
absent
glia
absent
absent
gliotr.modulationbyfreq.
gliotransmission
effectonpreNMDA
STDPmodulatedbyglia
gliaslow-inwardcurrent
absent
absent
samplingmethods
culturedneurons
brain
slices
rathipp.andcortex
(withadaptations)
rathipp.andcortex
(noadaptationsforchange)
culturedneurons,hippocampus
(BiandPoo1998)
corticostriatalprojections
differentslicingplanes
(Finoetal.2010)(horizontal)
(PawlakandKerr2008)(sagital0)
(noadaptationsforchange)
brain
slices
rathipp.
FAST
ANDSL
OW
VAR.
membranepotential
nomembranepotential
uniform
distributionof
ionchannels
(Na,K,SK,VGCCs)
inherited(Hayetal.2011)
BaPattenuation
(Hayetal.2011)
leakyintegrate-and-fireneuron
withphen.AMPAandext.input
glia.trans.byslowinwardcurrents
Differentialchannelsexpression
inhibitory/excitatoryintegration
5VGCCs,5K,1Na
nomembranepotential
neurotransmitters
receptors
absent
AMPA
NMDA
phen.eCB,NO,glu
deterministicneurotransmitter
glu
(mixingvolumeratio,
clearanceandrecyclingtim
e)
GABA(A),AMPA,NMDA
absent
Ca2+sources
phen.NMDAnonlinearity
VGCCandNMDA
phen.NMDAandVGCC,preCa
VGCCsandNMDA,dyeandbuffers
phen.NMDA
nonlinearity
Moleculardynamics
absent
(basedon
GraupnerandBrunel2007)
phen.presynapticLTPandLTD,
postsynapticLTPandLTD
phen.transporter
forglu
clearence
glu
diffusion
Calbidin,diffusion
absent
Table 3.5: Table classifying different attributes of plasticity models using the guide in the Table 3.5.

46 CHAPTER 3. COMPUTATIONAL MODELS OF SYNAPTIC PLASTICITY
Ca2+ sources
Models have introduced both detailed (Bartol et al. 2015; Blackwell et al. 2019)
and simplified (Shouval et al. 2002; Graupner and Brunel 2012) Ca2+ dynamics.
Usually these simulations where validated with dye fluorescence data which re-
flects the buffered Ca2+. There is a diversity of plasticity models focusing on the
Ca2+ sources, such as endoplasmatic reticulum (Singh et al. 2021), Ca2+ diffusion
(Jedrzejewska-Szmek et al. 2017), and NMDAr decay time (Shouval et al. 2002).
Due to the diversity of mechanisms, a Ca2+ linear model was shown to be in-
sufficient to reproduce STDP rules sampled at different [Ca2+]o (Inglebert et al.
2020).
Molecular dynamics
Molecular interactions are linked to different forms of plasticity. For instance,
Lisman 1989’s model provided testable predictions for two problems simultane-
ously, memory storage and plasticity induction. His hypothesis that CaMKII would
control memory maintenance was based on the dynamics of CaN and CaMKII. The
former surpassing protein turnover through its self-sustained activity (illustrated
by models Miller et al. 2005; Graupner and Brunel 2007) and could be reversed by
CaN. Instead of the maintenance role, Chang et al. 2017; Chang et al. 2019 sug-
gests CaMKII takes part only in the induction of plasticity. Later, Otmakhov with
Lisman and others showed experimental evidence suggesting that any known
phosphatase does not dephosphorylate CaMKII (Otmakhov et al. 2015). This em-
pirical evidence was previously predicted by Michalski 2013’s model. Regardless
of physiological relevance, the concepts developed still influence models seek-
ing different pathways to illustrate the memory storage hypothesis (Urakubo et
al. 2014). Several models explored the combined role of CaMKII and CaN (or
phosphatases and kinases) and their role in plasticity. For instance, Antunes et
al. 2016b models AMPAr exocytosis and endocytosis triggered the enzymatic dy-
namics of CaN and CaMKII. CaMKII implementations are seen with different levels
of detail, such as Pharris et al. 2019 which tries to model the combinatorial explo-
sion of CaMKII states recently unachievable. Also, Ebner et al. 2019 implements
a phenomenological version of the enzyme dynamics for pre and postsynaptic
long-term plasticity using Clopath and Gerstner 2010 low-pass strategy to pre-
dict plasticity.
The data output from molecular simulations tend to be larger than those fo-
cusing on only voltage or calcium, and it has complicated interpretation due to
the possible unknown interactions which could escape analysis. An example of

3.2. COMPLEXITY OF MECHANISMS ON PLASTICITY MODELS 47
multiple threshold systems is given by Ebner et al. 2019. Alternatively, as in
Blackwell et al. 2019, an average over key molecules during a fixed interval was
used to predict how alcohol disturbs plasticity. Simulation with various molecules
(Kotaleski and Blackwell 2010; Bhalla 2017), with redundant pathways, could indi-
cate the molecular compensations in the disruption pathways implicated in plas-
ticity (Mizusaki and O’Donnell 2021). Therefore, methodological advances are
necessary to analyse these systems.

48 CHAPTER 3. COMPUTATIONAL MODELS OF SYNAPTIC PLASTICITY
3.3 Determinism, stochasticity and averages
A competition in which neuron model had to reproduce the voltage traces as a re-
sult of a current injection raised questions on which kind of modelling (biophysical
or abstract) could better predict the spiking events of cortical neurons (Jolivet et
al. 2008). The collective behaviour of hundreds of stochastic ion channels shaping
a neuron’s membrane potential has been estimated by deterministic modelling
when parameters are optimized to this. However, when scaling down towards
smaller compartments, such as dendritic spines, an averaged approach does not
represent the dynamics of a few stochastic units (Ribrault et al. 2011). The num-
ber of receptors and ion channels falls sharply in dendritic spines (Nimchinsky
et al. 2004), such as ∼3 VGCCs to ∼15 NMDAr (Ribrault et al. 2011) demand-
ing a stochastic modelling approach to encompass the inherent stochasticity of
such small compartments (Blackwell et al. 2019). An alternative is to include an
external global noise, however without a defined source (Graupner and Brunel
2012). Another stochastic event relevant to understand plasticity is the all-or-
none release of neurotransmitter vesicles. Despite these events being discrete
and depending on the availability of vesicles, plasticity models usually character-
ize vesicle release using averages or unitary input without short-term plasticity.
That is, when using an averaged input a vesicle release failure may never oc-
cur, it is plausible that strategies without short-term plasticity introduce more
glutamate than expected (see Figure 6.4A). Stochastic contributions of individual
receptors and ion-channels are essential to characterize the highly miniaturized
dendritic spines due to its small number of components. Furthermore, action po-
tential backpropagation experienced by dendritic spines also can be stochastic,
with random invasion of distant dendrites (Short et al. 2017). The richness of
stochastic process in the neurons and how they contribute to learning still need
to be understood better since multiple descriptions of the stochastic phenomena
does not attribute a function to what is measured (Ribrault et al. 2011; Rusakov
et al. 2020).
3.4 Thresholds strategies
Mechanisms with short and long timescales affect how plasticity is expressed.
Thus implementing all known players (Meunier et al. 2017) would be out of reach
for a human to do without mistakes. Instead of having a cascade of events link-
ing stimulation to the inclusion of AMPAr in the PSD, one could map a variable
into the desired outcome without necessarily simulating the intermediary inter-

3.4. THRESHOLDS STRATEGIES 49
actions, also known as the phenomenological model of cascade induction. For
instance, Graupner and Brunel 2012 thresholds Ca2+, showing that it is possi-
ble to generate various learning rules seen in the literature; to this, they use
a Heaviside function detecting when Ca2+ is over the LTD and/or LTP threshold.
When Ca2+ crosses the threshold, it modifies the synaptic efficacy with a given
LTD and LTP associated rate. Furthermore, Graupner and Brunel 2012 model was
modified to unify other plasticity mechanisms (Inglebert et al. 2020; Graupner
et al. 2016; De Pittà and Brunel 2016; Chindemi et al. 2020). However, since
Graupner and Brunel 2012 model extension is also abstract, they could not be
merged in a modular way and are restricted by the specificity of the experiment
they reproduce. Thresholds are usually applied to fast time scales (e.g. Ca2+ in
Graupner and Brunel 2012 and voltage in Clopath and Gerstner 2010), translated
to integrators, filters or indicator functions. A general limitation of the threshold
approach is the definition of an upper limit, meaning that a variable contributes
to induce plasticity regardless of how high it is above the threshold, disregarding
abnormally influxes. This lack of upper limit for excessively high Ca2+ influx ig-
nores that apoptotic pathways can be triggered for example. Another thresholds
issue is that variables contribute to plasticity from the first spike in a spike train,
which does not assume the possibility that some spikes are used to communicate
only instead of inducing plasticity. For instance, the dendritic spine structure is
unchanged for a single EPSP however, after eight EPSPs spine structure reorga-
nization occurs (Chang et al. 2017).
A threshold strategy following original Lisman 1989’s Ca2+ amplitude hypoth-
esis, also discussed in Shouval et al. 2002, uses two thresholds over Ca2+ to
describe synaptic weight change, using the expression below from Graupner and
Brunel 2012:
τ ρ = −ρ(1− ρ)(ρ⋆ − ρ) + γp(1− ρ)Θ(c(t)− θp)− γdρΘ[c(t)− θd] +Noise(t).
Here, c(t) is the Ca2+ concentration, ρ is the synaptic weight, γp and γd are
respectively the rate of change for LTP and LTD. This expression represents plas-
ticity induction with a Heaviside function Θ using a LTP and LTD threshold over
calcium, respectively, θp and θd. Note that the noise is added externally, repre-
senting a global measure of noise, such strategy is refined by De Pittà and Brunel
2016 which specifies more precisely the noise sources before adding it externally.
Other strategies, instead, apply a similar two-threshold system in more than one
variable using a low-pass filter as in Ebner et al. 2019. In this thesis, a new
threshold system will proposed that instead of being applied individually to each

50 CHAPTER 3. COMPUTATIONAL MODELS OF SYNAPTIC PLASTICITY
variable as in previous works, is applied to combined dynamics of variables.
References
Ahnaou, A, E White, R Biermans, NV Manyakov, and WHIM Drinkenburg (2020). “In Vivo Plastic-
ity at Hippocampal Schaffer Collateral-CA1 Synapses: Replicability of the LTP Response and
Pharmacology in the Long-Evans Rat”. In: Neural Plasticity 2020.
Alonso, Leandro M and Eve Marder (2020). “Temperature compensation in a small rhythmic cir-
cuit”. In: Elife 9, e55470.
Antunes, Gabriela, Antonio Carlos Roque, and Fabio M Simoes De Souza (2016a). “Modelling in-
tracellular competition for calcium: kinetic and thermodynamic control of different molecular
modes of signal decoding”. In: Scientific Reports 6.1, pp. 1–12.Antunes, Gabriela, CA Roque, and FM Simoes-de-Souza (2016b). “Stochastic induction of long-
term potentiation and long-term depression”. In: Scientific reports 6, p. 30899.Barreto, Ernest and John R Cressman (2011). “Ion concentration dynamics as a mechanism for
neuronal bursting”. In: Journal of biological physics 37.3, pp. 361–373.Bartol, Thomas M, Daniel X Keller, Justin P Kinney, Chandrajit L Bajaj, Kristen M Harris, Terrence J
Sejnowski, and Mary B Kennedy (2015). “Computational reconstitution of spine calcium tran-
sients from individual proteins”. In: Frontiers in synaptic neuroscience 7, p. 17.
Bhalla, Upinder Singh (2017). “Synaptic input sequence discrimination on behavioral timescales
mediated by reaction-diffusion chemistry in dendrites”. In: Elife 6, e25827.
Bi, Guo-qiang and Mu-ming Poo (1998). “Synaptic modifications in cultured hippocampal neu-
rons: dependence on spike timing, synaptic strength, and postsynaptic cell type”. In: Journalof neuroscience 18.24, pp. 10464–10472.
Bittner, Katie C, Aaron D Milstein, Christine Grienberger, Sandro Romani, and Jeffrey C Magee
(2017). “Behavioral time scale synaptic plasticity underlies CA1 place fields”. In: Science 357.6355,pp. 1033–1036.
Blackwell, Kim T, Armando G Salinas, Parul Tewatia, Brad English, Jeanette Hellgren Kotaleski,
and David M Lovinger (2019). “Molecular mechanisms underlying striatal synaptic plasticity:
relevance to chronic alcohol consumption and seeking”. In: European Journal of Neuroscience49.6, pp. 768–783.
Bliss, Tim VP and Terje Lømo (1973). “Long-lasting potentiation of synaptic transmission in the
dentate area of the anaesthetized rabbit following stimulation of the perforant path”. In: TheJournal of physiology 232.2, pp. 331–356.
Bonansco, Christian, Alejandro Couve, Gertrudis Perea, Carla Á Ferradas, Manuel Roncagliolo, and
Marco Fuenzalida (2011). “Glutamate released spontaneously from astrocytes sets the thresh-
old for synaptic plasticity”. In: European Journal of Neuroscience 33.8, pp. 1483–1492.
Brette, Romain (2015). “What is the most realistic single-compartment model of spike initiation?”
In: PLoS Comput Biol 11.4, e1004114.Buchanan, Katherine A and Jack R Mellor (2007). “The development of synaptic plasticity induction
rules and the requirement for postsynaptic spikes in rat hippocampal CA1 pyramidal neurones”.
In: The Journal of Physiology 585.2, pp. 429–445.

REFERENCES 51
Buskila, Yossi, Alba Bellot-Saez, Orsolya Kékesi, Morven Cameron, and John Morley (2020). “Ex-
tending the life span of acute neuronal tissue for imaging and electrophysiological studies”.
In: Basic Neurobiology Techniques. Springer, pp. 235–259.Chang, Jui-Yun, Y. Nakahata, Y. Hayano, and R. Yasuda (2019). “Mechanisms of Ca 2+/calmodulin-
dependent kinase II activation in single dendritic spines”. In: Nature Communications 10.1,
p. 2784.
Chang, Jui-Yun, Paula Parra-Bueno, Tal Laviv, Erzsebet M Szatmari, Seok-Jin R Lee, and Ryohei Ya-
suda (2017). “CaMKII autophosphorylation is necessary for optimal integration of Ca2+ signals
during LTP induction, but not maintenance”. In: Neuron 94.4, pp. 800–808.
Chindemi, Giuseppe et al. (2020). “A calcium-based plasticity model predicts long-term potentia-
tion and depression in the neocortex”. In: bioRxiv.Cizeron, Mélissa, Zhen Qiu, Babis Koniaris, Ragini Gokhale, Noboru H Komiyama, Erik Fransén, and
Seth GN Grant (2020). “A brain-wide atlas of synapses across the mouse lifespan”. In: Science.Clopath, Claudia and Wulfram Gerstner (2010). “Voltage and spike timing interact in STDP–a uni-
fied model”. In: Frontiers in synaptic neuroscience 2, p. 25.
Costa, Froemke, Sjöström, and Van Rossum (2015). “Unified pre-and postsynaptic long-term plas-
ticity enables reliable and flexible learning”. In: Elife 4, e09457.
Costa, Zahid Padamsey, James A D’Amour, Nigel J Emptage, Robert C Froemke, and Tim P Vogels
(2017). “Synaptic transmission optimization predicts expression loci of long-term plasticity”.
In: Neuron 96.1, pp. 177–189.
Cui, Yihui, Ilya Prokin, Alexandre Mendes, Hugues Berry, and Laurent Venance (2018). “Robustness
of STDP to spike timing jitter”. In: Scientific reports 8.1, pp. 1–15.Dachtler, James and Kevin Fox (2017). “Do cortical plasticity mechanisms differ between males
and females?” In: Journal of Neuroscience Research 95.1-2, pp. 518–526.
De Pittà, Maurizio and Hugues Berry (2019). Computational Glioscience. Springer.De Pittà, Maurizio and Nicolas Brunel (2016). “Modulation of synaptic plasticity by glutamatergic
gliotransmission: A modeling study.” In: Neural plasticity.Deperrois, Nicolas and Michael Graupner (2020). “Short-term depression and long-term plastic-
ity together tune sensitive range of synaptic plasticity”. In: PLoS computational biology 16.9,
e1008265.
Dudek and Bear (1993). “Bidirectional long-term modification of synaptic effectiveness in the
adult and immature hippocampus”. In: Journal of Neuroscience 13.7, pp. 2910–2918.
— (1992). “Homosynaptic long-term depression in area CA1 of hippocampus and effects of N-
methyl-D-aspartate receptor blockade.” In: Proceedings of the National Academy of Sciencesof the United States of America 89.10, p. 4363.
Ebner, Christian, Claudia Clopath, Peter Jedlicka, and Hermann Cuntz (2019). “Unifying Long-Term
Plasticity Rules for Excitatory Synapses by Modeling Dendrites of Cortical Pyramidal Neurons”.
In: Cell Reports 29.13, pp. 4295–4307.Evans, Rebekah C, Yash M Maniar, and Kim T Blackwell (2013). “Dynamic modulation of spike
timing-dependent calcium influx during corticostriatal upstates”. In: Journal of neurophysiology110.7, pp. 1631–1645.
Fernández-Alfonso, Tomás and Timothy A Ryan (2004). “The kinetics of synaptic vesicle pool de-
pletion at CNS synaptic terminals”. In: Neuron 41.6, pp. 943–953.

52 CHAPTER 3. COMPUTATIONAL MODELS OF SYNAPTIC PLASTICITY
Fino, Elodie, Vincent Paille, Yihui Cui, Teresa Morera-Herreras, Jean-Michel Deniau, and Laurent Ve-
nance (2010). “Distinct coincidence detectors govern the corticostriatal spike timing-dependent
plasticity”. In: The Journal of physiology 588.16, pp. 3045–3062.
Froemke, Robert C and Yang Dan (2002). “Spike-timing-dependent synaptic modification induced
by natural spike trains”. In: Nature 416.6879, pp. 433–438.
Froemke, Robert C, Ishan A Tsay, Mohamad Raad, John D Long, and Yang Dan (2006). “Contri-
bution of individual spikes in burst-induced long-term synaptic modification”. In: Journal ofneurophysiology.
Gerstner, Wulfram, Marco Lehmann, Vasiliki Liakoni, Dane Corneil, and Johanni Brea (2018). “El-
igibility traces and plasticity on behavioral time scales: experimental support of neohebbian
three-factor learning rules”. In: Frontiers in neural circuits 12, p. 53.González, Janneth, Andrés Pinzón, Andrea Angarita-Rodrıéguez, Andrés Felipe Aristizabal, George
E Barreto, and Cynthia Martıén-Jiménez (2020). “Advances in Astrocyte Computational Models:
From Metabolic Reconstructions to Multi-omic Approaches”. In: Frontiers in neuroinformatics14, p. 35.
Graupner, Michael and Nicolas Brunel (2012). “Calcium-based plasticity model explains sensitiv-
ity of synaptic changes to spike pattern, rate, and dendritic location”. In: Proceedings of theNational Academy of Sciences 109.10, pp. 3991–3996.
— (2007). “STDP in a bistable synapse model based on CaMKII and associated signaling path-
ways”. In: PLoS computational biology 3.11, e221.
Graupner, Michael, Pascal Wallisch, and Srdjan Ostojic (2016). “Natural firing patterns imply low
sensitivity of synaptic plasticity to spike timing compared with firing rate”. In: Journal of Neu-roscience 36.44, pp. 11238–11258.
Hay, Etay, Sean Hill, Felix Schürmann, Henry Markram, and Idan Segev (2011). “Models of neo-
cortical layer 5b pyramidal cells capturing a wide range of dendritic and perisomatic active
properties”. In: PLoS Comput Biol 7.7, e1002107.He, Kaiwen, Marco Huertas, Su Z Hong, XiaoXiu Tie, Johannes W Hell, Harel Shouval, and Alfredo
Kirkwood (2015). “Distinct eligibility traces for LTP and LTD in cortical synapses”. In: Neuron88.3, pp. 528–538.
Heifets, Boris D and Pablo E Castillo (2009). “Endocannabinoid signaling and long-term synaptic
plasticity”. In: Annual review of physiology 71, pp. 283–306.
Herz, Andreas VM, Tim Gollisch, Christian K Machens, and Dieter Jaeger (2006). “Modeling single-
neuron dynamics and computations: a balance of detail and abstraction”. In: science 314.5796,pp. 80–85.
Higgins, David, Michael Graupner, and Nicolas Brunel (2014). “Memory maintenance in synapses
with calcium-based plasticity in the presence of background activity”. In: PLoS Comput Biol10.10, e1003834.
Huang, Shiwei, Sungho Hong, and Erik De Schutter (2015). “Non-linear leak currents affect mam-
malian neuron physiology”. In: Frontiers in cellular neuroscience 9, p. 432.
Inglebert, Yanis, Johnatan Aljadeff, Nicolas Brunel, and Dominique Debanne (2020). “Synaptic
plasticity rules with physiological calcium levels”. In: Proceedings of the National Academy ofSciences. issn: 0027-8424. doi: 10.1073/pnas.2013663117.

REFERENCES 53
Isaac, John TR, Katherine A Buchanan, Robert U Muller, and Jack R Mellor (2009). “Hippocam-
pal place cell firing patterns can induce long-term synaptic plasticity in vitro”. In: Journal ofNeuroscience 29.21, pp. 6840–6850.
Izhikevich, Eugene M and Niraj S Desai (2003). “Relating stdp to bcm”. In: Neural computation15.7, pp. 1511–1523.
Jahr, Craig E and Charles F Stevens (1990). “A quantitative description of NMDA receptor-channel
kinetic behavior”. In: Journal of Neuroscience 10.6, pp. 1830–1837.
Jedrzejewska-Szmek, Joanna, Sriraman Damodaran, Daniel B Dorman, and Kim T Blackwell (2017).
“Calcium dynamics predict direction of synaptic plasticity in striatal spiny projection neurons”.
In: European Journal of Neuroscience 45.8, pp. 1044–1056.
Jolivet, Renaud, Felix Schürmann, Thomas K Berger, Richard Naud, Wulfram Gerstner, and Arnd
Roth (2008). “The quantitative single-neuron modeling competition”. In: Biological cybernetics99.4, pp. 417–426.
Karlin, Samuel and CMatessi (1983). “The eleventh ra fisher memorial lecture-kin selection and al-
truism”. In: Proceedings of the Royal society of London. Series B. Biological sciences 219.1216,pp. 327–353.
Keller, Daniel, Csaba Erö, and Henry Markram (2018). “Cell densities in the mouse brain: a sys-
tematic review”. In: Frontiers in neuroanatomy 12, p. 83.
Kievit, Rogier A, Jan-Willem Romeijn, Lourens J Waldorp, Jelte M Wicherts, H Steven Scholte, and
Denny Borsboom (2011). “Modeling mind and matter: reductionism and psychological mea-
surement in cognitive neuroscience”. In: Psychological Inquiry 22.2, pp. 139–157.
Kirkwood, Hey-Kyoung Lee, and Mark F Bear (1995). “Co-regulation of long-term potentiation and
experience-dependent synaptic plasticity in visual cortex by age and experience”. In: Nature375.6529, pp. 328–331.
Kirkwood, Rioult, and Bear (1996). “Experience-dependent modification of synaptic plasticity in
visual cortex”. In: Nature 381.6582, pp. 526–528.
Korinek, M, M Sedlacek, O Cais, I Dittert, and L Vyklicky Jr (2010). “Temperature dependence of
N-methyl-D-aspartate receptor channels and N-methyl-D-aspartate receptor excitatory post-
synaptic currents”. In: Neuroscience 165.3, pp. 736–748.
Kotaleski, Jeanette Hellgren and Kim T Blackwell (2010). “Modelling the molecular mechanisms of
synaptic plasticity using systems biology approaches”. In: Nature Reviews Neuroscience 11.4,
pp. 239–251.
Krelstein, Michael S, MP Thomas, and JM Horowitz (1990). “Thermal effects on long-term potenti-
ation in the hamster hippocampus”. In: Brain research 520.1-2, pp. 115–122.
Letzkus, Johannes J, Björn M Kampa, and Greg J Stuart (2006). “Learning rules for spike timing-
dependent plasticity depend on dendritic synapse location”. In: Journal of Neuroscience 26.41,pp. 10420–10429.
Lisman, John (1989). “A mechanism for the Hebb and the anti-Hebb processes underlying learning
and memory”. In: Proceedings of the National Academy of Sciences 86.23, pp. 9574–9578.Lynch, Gary, Thomas Dunwiddie, and Valentin Gribkoff (1977). “Heterosynaptic depression: a post-
synaptic correlate of long-term potentiation”. In: Nature 266.5604, pp. 737–739.
Magee, Jeffrey C and Christine Grienberger (2020). “Synaptic plasticity forms and functions”. In:
Annual review of neuroscience 43, pp. 95–117.

54 CHAPTER 3. COMPUTATIONAL MODELS OF SYNAPTIC PLASTICITY
Maki, Bruce A and Gabriela K Popescu (2014). “Extracellular Ca2+ ions reduce NMDA receptor
conductance and gating”. In: Journal of General Physiology 144.5, pp. 379–392.
Mäki-Marttunen, Tuomo, Nicolangelo Iannella, Andrew G Edwards, Gaute Einevoll, and Kim T Black-
well (2020). “A unified computational model for cortical post-synaptic plasticity”. In: eLife.Mayr, Christian G and Johannes Partzsch (2010). “Rate and pulse based plasticity governed by
local synaptic state variables”. In: Frontiers in Synaptic Neuroscience 2, p. 33.
McKiernan, Erin C and Diano F Marrone (2017). “CA1 pyramidal cells have diverse biophysical
properties, affected by development, experience, and aging”. In: PeerJ 5, e3836.Meredith, Rhiannon M, Anna M Floyer-Lea, and Ole Paulsen (2003). “Maturation of long-term po-
tentiation induction rules in rodent hippocampus: role of GABAergic inhibition”. In: Journal ofNeuroscience 23.35, pp. 11142–11146.
Meunier, Claire NJ, Pascal Chameau, and Philippe M Fossier (2017). “Modulation of synaptic plas-
ticity in the cortex needs to understand all the players”. In: Frontiers in synaptic neuroscience9, p. 2.
Michalski, PJ (2013). “The delicate bistability of CaMKII”. In: Biophysical journal 105.3, pp. 794–806.
Miller, Paul, Anatol M Zhabotinsky, John Lisman, and Xiao-Jing Wang (2005). “The stability of
a stochastic CaMKII switch: dependence on the number of enzyme molecules and protein
turnover”. In: PLoS biology 3.4, e107.
Mizuno, Tomoyuki, Ichiro Kanazawa, and Masaki Sakurai (2001). “Differential induction of LTP and
LTD is not determined solely by instantaneous calcium concentration: an essential involvement
of a temporal factor”. In: European Journal of Neuroscience 14.4, pp. 701–708.
Mizusaki, Beatriz EP and Cian O’Donnell (2021). “Neural circuit function redundancy in brain dis-
orders”. In: arXiv preprint arXiv:2102.03039.Nadkarni, Suhita and Peter Jung (2007). “Modeling synaptic transmission of the tripartite synapse”.
In: Physical biology 4.1, p. 1.
Narayanan, Rishikesh and Daniel Johnston (2010). “The h current is a candidate mechanism for
regulating the sliding modification threshold in a BCM-like synaptic learning rule”. In: Journalof neurophysiology 104.2, pp. 1020–1033.
Nevian, Thomas and Bert Sakmann (2006). “Spine Ca2+ signaling in spike-timing-dependent plas-
ticity”. In: Journal of Neuroscience 26.43, pp. 11001–11013.
Nimchinsky, Esther A, Ryohei Yasuda, Thomas G Oertner, and Karel Svoboda (2004). “The num-
ber of glutamate receptors opened by synaptic stimulation in single hippocampal spines”. In:
Journal of Neuroscience 24.8, pp. 2054–2064.
Otmakhov, Nikolai, Shaurav Regmi, and John Lisman (2015). “Fast decay of CaMKII FRET sensor
signal in spines after LTP induction is not due to its dephosphorylation”. In: PLoS One 10.6,
e0130457.
Pawlak, Verena and Jason ND Kerr (2008). “Dopamine receptor activation is required for corticos-
triatal spike-timing-dependent plasticity”. In: Journal of Neuroscience 28.10, pp. 2435–2446.
Pharris, Matthew C, Thomas M Bartol, Terrence J Sejnowski, Mary B Kennedy, Melanie I Stefan, and
Tamara L Kinzer-Ursem (2019). “A multi-state model of the CaMKII dodecamer suggests a role
for calmodulin in maintenance of autophosphorylation”. In.

REFERENCES 55
Philpot, Benjamin D, Aarti K Sekhar, Harel Z Shouval, and Mark F Bear (2001). “Visual experience
and deprivation bidirectionallymodify the composition and function of NMDA receptors in visual
cortex”. In: Neuron 29.1, pp. 157–169.
Pinar, Cristina, Christine J Fontaine, Juan Triviño-Paredes, Carina P Lottenberg, Joana Gil-Mohapel,
and Brian R Christie (2017). “Revisiting the flip side: long-term depression of synaptic efficacy
in the hippocampus”. In: Neuroscience & Biobehavioral Reviews 80, pp. 394–413.Postlethwaite, Michael, Matthias H Hennig, Joern R Steinert, Bruce P Graham, and Ian D Forsythe
(2007). “Acceleration of AMPA receptor kinetics underlies temperature-dependent changes in
synaptic strength at the rat calyx of Held”. In: The Journal of physiology 579.1, pp. 69–84.
Ribrault, Claire, Ken Sekimoto, and Antoine Triller (2011). “From the stochasticity of molecular
processes to the variability of synaptic transmission”. In: Nature Reviews Neuroscience 12.7,
pp. 375–387.
Rohrlich, Fritz (1989). From paradox to reality: Our basic concepts of the physical world. Cam-
bridge University Press.
Rusakov, Dmitri A, Leonid P Savtchenko, and Peter E Latham (2020). “Noisy synaptic conductance:
bug or a feature?” In: Trends in Neurosciences.Schafer, Dorothy P, Emily K Lehrman, and Beth Stevens (2013). “The “quad-partite” synapse:
Microglia-synapse interactions in the developing and mature CNS”. In: Glia 61.1, pp. 24–36.
Serrano-Gotarredona, Teresa, Timothée Masquelier, Themistoklis Prodromakis, Giacomo Indiveri,
and Bernabe Linares-Barranco (2013). “STDP and STDP variations with memristors for spiking
neuromorphic learning systems”. In: Frontiers in neuroscience 7, p. 2.
Shen,Weixing, Marc Flajolet, Paul Greengard, and D James Surmeier (2008). “Dichotomous dopamin-
ergic control of striatal synaptic plasticity”. In: Science 321.5890, pp. 848–851.
Short, Shaina M, Katerina D Oikonomou, Wen-Liang Zhou, Corey D Acker, Marko A Popovic, Dejan
Zecevic, and Srdjan D Antic (2017). “The stochastic nature of action potential backpropagation
in apical tuft dendrites”. In: Journal of neurophysiology 118.2, pp. 1394–1414.
Shouval, Harel Z, Mark F Bear, and Leon N Cooper (2002). “A unified model of NMDA receptor-
dependent bidirectional synaptic plasticity”. In: Proceedings of the National Academy of Sci-ences 99.16, pp. 10831–10836.
Sinclair, Duncan, Joseph Cesare, Mary McMullen, Greg C Carlson, Chang-Gyu Hahn, and Karin E
Borgmann-Winter (2016). “Effects of sex and DTNBP1 (dysbindin) null gene mutation on the
developmental GluN2B-GluN2A switch in the mouse cortex and hippocampus”. In: Journal ofneurodevelopmental disorders 8.1, p. 14.
Singer, Annabelle C, Anthony J Martorell, J Miller Douglas, Fatema Abdurrob, Matthew K Attokaren,
John Tipton, Hansruedi Mathys, Chinnakkaruppan Adaikkan, and Li-Huei Tsai (2018). “Noninva-
sive 40-Hz light flicker to recruit microglia and reduce amyloid beta load”. In: Nature protocols13.8, pp. 1850–1868.
Singh, Nishant, Thomas Bartol, Herbert Levine, Terrence Sejnowski, and Suhita Nadkarni (2021).
“Presynaptic endoplasmic reticulum regulates short-term plasticity in hippocampal synapses”.
In: Communications biology 4.1, pp. 1–13.
Sjöström, Per Jesper and Michael Häusser (2006). “A cooperative switch determines the sign
of synaptic plasticity in distal dendrites of neocortical pyramidal neurons”. In: Neuron 51.2,
pp. 227–238.

56 CHAPTER 3. COMPUTATIONAL MODELS OF SYNAPTIC PLASTICITY
Sjöström, Per Jesper, Gina G Turrigiano, and Sacha B Nelson (2001). “Rate, timing, and coopera-
tivity jointly determine cortical synaptic plasticity”. In: Neuron 32.6, pp. 1149–1164.
Tang, Lamont S, Adam L Taylor, Anatoly Rinberg, and Eve Marder (2012). “Robustness of a rhyth-
mic circuit to short-and long-term temperature changes”. In: Journal of Neuroscience 32.29,
pp. 10075–10085.
Tebaykin, Dmitry, Shreejoy J Tripathy, Nathalie Binnion, Brenna Li, Richard C Gerkin, and Paul
Pavlidis (2018). “Modeling sources of interlaboratory variability in electrophysiological proper-
ties of mammalian neurons”. In: Journal of neurophysiology 119.4, pp. 1329–1339.
Tewari, Shivendra G and Kaushik Kumar Majumdar (2012). “A mathematical model of the tripartite
synapse: astrocyte-induced synaptic plasticity”. In: Journal of biological physics 38.3, pp. 465–496.
Tigaret, Cezar M, Valeria Olivo, Josef HLP Sadowski, Michael C Ashby, and Jack R Mellor (2016).
“Coordinated activation of distinct Ca 2+ sources and metabotropic glutamate receptors en-
codes Hebbian synaptic plasticity”. In: Nature communications 7, p. 10289.Tsodyks, Misha V and Henry Markram (1997). “The neural code between neocortical pyrami-
dal neurons depends on neurotransmitter release probability”. In: Proceedings of the nationalacademy of sciences 94.2, pp. 719–723.
Urakubo, Hidetoshi, Miharu Sato, Shin Ishii, and Shinya Kuroda (2014). “In vitro reconstitution of
a CaMKII memory switch by an NMDA receptor-derived peptide”. In: Biophysical journal 106.6,pp. 1414–1420.
Wang, Richard C Gerkin, David W Nauen, and Guo-Qiang Bi (2005). “Coactivation and timing-
dependent integration of synaptic potentiation and depression”. In: Nature neuroscience 8.2,
pp. 187–193.
Wang and Wagner (1999). “Priming-induced shift in synaptic plasticity in the rat hippocampus”.
In: Journal of neurophysiology 82.4, pp. 2024–2028.
Weber, Jens P, Bertalan K Andrásfalvy, Marina Polito, Ádám Magó, Balázs B Ujfalussy, and Judit K
Makara (2016). “Location-dependent synaptic plasticity rules by dendritic spine cooperativity”.
In: Nature communications 7, p. 11380.Wittenberg and Wang (2006). “Malleability of spike-timing-dependent plasticity at the CA3–CA1
synapse”. In: Journal of Neuroscience 26.24, pp. 6610–6617.
Yasuda, Ryohei (2017). “Biophysics of biochemical signaling in dendritic spines: implications in
synaptic plasticity”. In: Biophysical journal 113.10, pp. 2152–2159.Yuste, Rafael, Ania Majewska, Sydney S Cash, and Winfried Denk (1999). “Mechanisms of calcium
influx into hippocampal spines: heterogeneity among spines, coincidence detection by NMDA
receptors, and optical quantal analysis”. In: Journal of Neuroscience 19.6, pp. 1976–1987.
Zhuravleva, ZN, VN Saifullina, and CI Zenchenko (1997). “Morphometric analysis of hippocampal
pyramidal neurons in situ and in grafts developing in the anterior eye chambers of young and
aged Wistar rats”. In: Journal of Neural Transplantation and Plasticity 6.

Chapter 4
The gap in the computationalmodels of plasticity
Computational models of plasticity have the potential to provide testable hypoth-
esis to understand learning and memory better. As in the previous chapter, uni-
fying concepts enlarge the domain of questions one can ask. If an ideal model
can provide sharper questions, a complex model would grant broader coverage.
However, drawbacks from overlaying complexity may not ensure a precise repre-
sentation of the real phenomenon (Brette 2015). For instance, models using data
from heterogeneous conditions (Bartol et al. 2015) can fall on the Frankenstein
effect discussed by Brette 2016. That is, there is a risk of false modularity when
assembling mechanisms obtained from different sources such as repositories of
neuronal mechanisms. Also, there is an analytical challenge when simulating
many variables (Ebner et al. 2019; Blackwell et al. 2019). Therefore, a balanced
modelling approach encompassed with data validation is a more suitable goal.
As previously discussed in chapter three, most models overlook experimentalconditions of their datasets, limiting how one can compare experiment and sim-
ulation. More contributions are also required for in vivo-like firing, non-neural cellsplasticity modulation, how calcium sources and molecular dynamics are mod-
elled. One can attribute such arrested development to a data shortage. However,
similarly to the precursor plasticity models, they could predict experimental out-
comes for years to come, even with scarce evidence. Therefore, in this thesis,
with the available data, a biophysical model was developed to cover experimen-
tal conditions and how they interact with the key calcium sources and the im-
mediate calcium-binding enzymes. The model phenomenologically includes con-
tributions from the more established advances of synaptic plasticity (FDP, STDP,
membrane potential, morphology, vesicle release) to balance complexity. As pre-
viously discussed, there is an analytical bottleneck when interpreting molecular
57

58 CHAPTER 4. THE GAP IN THE COMPUTATIONAL MODELS OF PLASTICITY
simulations; next, a new plasticity prediction strategy is defined that expands the
interpretability of established unidimensional thresholds and averages.
4.1 Limits of unidimensional thresholds
A challenge in modelling is to decide whether adding a mechanism is relevant
for a given task and how abstract or complex it should be. Owning to represent
synaptic mechanisms, models can assume that relevant factors are hidden (not
explicitly described), allowing them to predict plasticity without necessarily simu-
lating all cascade of events linked to plasticity outcomes. In the literature, strate-
gies to bridge cascade of events without describing intermediary steps are done
by thresholds (Graupner and Brunel 2012; Shouval et al. 2002), filters (Clopath
and Gerstner 2010; Gerstner et al. 2018) or averages over the simulated vari-
ables (Blackwell and Jedrzejewska-Szmek 2013). Variable-thresholding in neuron
models date back to McCulloch and Pitts 1943. Experimentally, W. Singer in 1977
(as refereed by Bear et al. 1987) suggests the existence of a thresholdmechanism
over calcium and voltage interactions to induce plasticity modifications. Although
it is long known that the interaction over two or more variables should be taken
into account in a combined way, current models still use unidimensional thresh-
olds, asmentioned in chapter 3. Therefore, new techniques to deal with combined
activity are required. In this thesis, we developed a polygonal threshold, named
here geometrical readout, which can be used to capture the dynamical patterns of
two or more variables simultaneously (Figure 4.2C), instead of individually (Figure
4.2A-B). Instead of relying on a unidimensional threshold (Graupner and Brunel
2012; Clopath and Gerstner 2010), one could define a geometrical shape or vol-
ume to readout dynamical pattern inducing plasticity. Combining variables into
orbits can potentially improve the separability of plasticity protocol since when
the number of dimensions increases, the distance between points also does for
a suitable metric (Friedman et al. 2001 pages 22-23). Conversely, this is an is-
sue for methods for data classification (Friedman et al. 2001) since more data is
required to fill up the sparsity associated with the increase of dimensions, also
known as the "curse of dimensionality". The advantage of using it in the dynam-
ical systems is that such extra space gained with more dimensions can separate
better plasticity protocols which can be too similar in lower dimensions. This is
illustrated by Guyon and Elisseeff 2003 which shows that even adding a second
dimension with noise can increase separability in scatter plots. We depict this
increase of separability with a toy model example in Figure 4.1.
Limits are important for biological systems. As mentioned in chapter 2, exces-

4.1. LIMITS OF UNIDIMENSIONAL THRESHOLDS 59
Figure 4.1: Increase of orbit separability with different dimensionalities. A) 20 pulses of two variables with different rise and decay
constant representing different plasticity protocols. B) The same variables in panel B added combined with two other variables with different
decay and rise times. C) Same as A and B combined to other two variables. D) Distance between curves a and b in panel A. E) Distance
between curves a and b in panel B. F) Distance between curves a and b in panel C.
sive calcium activation triggers apoptotic pathways rather than plasticity (Zhivo-
tovsky and Orrenius 2011; Orrenius et al. 2003). Unidimensional thresholds usu-
ally do not consider upper limits, Figure 4.2D–I shows how the geometrical and
unidimensional thresholds are saturated by two slow variables with increasingly
higher increment size (var1 and var2). Using these two aspects, orbits and a
geometrical readout, we developed a model which can predict a wide range of
plasticity experiments. The following section proposes a model to cover the ex-
posed gaps. The main question it tries to answer is twofold, how a geometrical
threshold can decode the enzymatic activity to predict plasticity and how it can
be used to understand the heterogeneity of plasticity outcomes.

60 CHAPTER 4. THE GAP IN THE COMPUTATIONAL MODELS OF PLASTICITY
Figure 4.2: Unidimensional and geometrical threshold. A) Variable with a slow decay (τ = 1.5s) integrating 30 pulses at 10 Hz with
threshold at 2 a.u.. The color gradient (white to green) depicts the increment size in variable at each pulse B) Variable with a faster decay
time (τ = 0.2s) integrating 30 pulses at 10 Hz with threshold at 2 a.u. . The color gradient (white to blue) depicts the increment size.
C) Combined dynamics of variables in panels A and B showing a geometrical threshold (defined by the points [7.5,1.],[7.5,2.],[2.,2.] and
[2.,1.]). D) Time above the threshold (t.a.t) for different increment sizes (white to green) for the variable in the panel A. E) Time above the
threshold (t.a.t) for different increment sizes (white to blue) for the variable in the panel B. F) Time inside the polygon (t.i.p) for different
increment sizes (white to red) for the variable in the panel B. G) Total time over the threshold for the variable in panel A changing the
increment size. H) Same as G for panel B. G) Total time inside the polygon for orbits in the panel C.
Chapter 5
A stochastic model ofhippocampal synaptic plasticitywith geometrical readout ofenzymes - Article
5.1 Research context
The overall goal of the trans-disciplinary collaboration between my thesis super-
visors Romain Veltz (INRIA) and Hélène Marie (IPMC) was to model a healthy CA3-
CA1 synapse to test later Alzheimer’s disease-related disruptions in the Ca2+ dy-
namics induced by the intracellular peptide residue from APP (Amyloid precursor
protein) cleavage, called AICD (APP intracellular domain, Pousinha et al. 2017;
Pousinha et al. 2019). This peptide up-regulates NMDAr-dependent postsynap-
tic Ca2+ contribution by regulating GluN2B subunit in excitatory synapses (Inno-
cent et al. 2012) and increases Ca2+-dependent hyperpolarisation (Pousinha et
al. 2019), decreasing cell excitability and neuron integration properties which are
believed to influence cognitive decay during the early stage of Alzheimer’s dis-
ease. The research goal related to the pathology modelling could not start as a
satisfactory synapse model was not readily available to cover the heterogeneity
of experimental conditions. The thesis project, therefore, focused on creating an
excitatory synapse model. In parallel, Romain Veltz and Cian O’Donnell (Univer-
sity of Bristol) had initiated a collaboration to build this type of model in healthy
conditions providing the backbone on which the thesis project started.
The project was funded through the ComputaBrain project granted by Univer-
sité Côte d’Azur, which intends to model and unify different brain scales to under-
61

62CHAPTER 5. A STOCHASTICMODELOF HIPPOCAMPAL SYNAPTIC PLASTICITYWITHGEOMETRICAL READOUTOF ENZYMES - ARTICLE
stand healthy and pathological aspects of memory processing. This PhD thesis
was funded to cover the synaptic scale of this project. The first challenge was
to explain the Tigaret et al. 2016’s STDP experiments claiming that the canon-
ical STDP rules were not reproducible in brain slices. Tigaret et al. 2016 also
used a broad range of stimulation patterns, including burst-STDP, different delays,
presynaptic stimulation with burst and frequencies. This article had an apparent
paradox caused by the Ca2+ dye, with similar fluorescence curves for plasticity
protocols yielding different outcomes (discussed in Figure 6.5).
Initially, we used Fujii et al. 2013’s discovery attributing to CaMKII and CaN
somatic amplitude and integral a filter property the ability to decode the firing
patterns (number of pulses and frequency). Our first readout predicted plasticity
using the simulated enzymatic integral and amplitude (Fujii et al. 2013). Later,
fast CaMKII measurements in dendritic spines done by Chang et al. 2017 were
considered, marking a change of research direction since this new data described
temperature effects on CaMKII (see article methods). Also, Chang et al. 2019 used
their faster sensor in dendritic spines that differed from Fujii et al. 2013 in terms
of CaMKII saturation. That raised the doubt whether the nonlinear filter found by
Fujii et al. 2013 is valid for dendritic spines. The comparison of our model based
on Chang et al. 2019 using Fujii et al. 2013 readout strategy is shown in Figure
6.1. The closest similarity between these papers was that dendritemeasurements
had a slower CaMKII saturation (Chang et al. 2017), which could explain Fujii et al.
2013 discrepancy.
Chang et al. 2017 (supp. files) measurements displayed a slow decay in Ca2+
fluorescence. This characteristic slow adaptation also affected CaMKII activation
during glutamate uncaging (see article methods Figure M11). It was important to
understand how the adaptation of CaMKII occur in Chang et al. 2017 since Tigaret
et al. 2016 (supp. files) also had a strong adaptation of Ca2+-sources (visualized
through Ca2+ dye) which caused the fluorescence to vanish in 20 s after the stim-
ulation (no Ca2+ influx). Due to this, the hypothesis lead to the investigation and
inclusion of sources of adaptation in the model, such as BaP attenuation (Gold-
ing et al. 2001), AMPA desensitisation (Robert and Howe 2003), the SK channels
(Griffith et al. 2016) and short-term depression and facilitation. From all possibili-
ties, the one which best matches Chang et al. 2017 attenuation was the transient
spine volume which slightly decreased Ca2+ concentration (Holst et al. 2021) and
CaMKII activation. However, no data was available to model the transient vol-
ume since structural proteins dynamics are usually imaged in a time resolution
of minutes or hours (Bosch et al. 2014).
After reproducing Tigaret et al. 2016, the challenge was to increase the range

5.1. RESEARCH CONTEXT 63
of experiments the model can cover. However, data with similar experimental
conditions were scarce. Given that the temperature could change CaMKII activa-
tion as shown in Chang et al. 2017, the focus was to find themost similar plasticity
experiments done at 35C. Dudek and Bear 1992 was the best candidate since it
had a BCM-like curve and increased the number of LTD experiments to validate
the model. After reproducing Dudek and Bear 1992’s data, the initial strategy of
averages and integrals was discarded since a long plasticity protocol (e.g. LTD)
would scaled up the integral value due to noise. That was the motivation to find
a readout in which the time would be relevant only when the enzymes reached a
specific activation level, like a Goldilocks zone for plasticity.
Parallel to adopting another prediction strategy, another experiment fromDudek
and Bear 1993 had the same temperature and aCSF, but for different ages, show-
ing that LTD and LTP had different requirements throughout developmental ages.
Initially, Dudek and Bear 1993 motivated the inclusion of age control in the model
by diversifying the NMDAr subtypes. To this, NMDAr shift was modelled using Sin-
clair et al. 2016’s NMDAr subtypes expression profiles. In this way, we innovate
on how to model age in plasticity models by adding a parameter controlling an
age continuum, different from other computational neuroscience models (based
on electrophysiology), which treated age as a class (e.g. young vs adult). Age-
related NMDAr changes were essential to calibrate the model since Tigaret et al.
2016 used older rats than Dudek and Bear 1992; Dudek and Bear 1993. Later,
the model included age-related BaP and GABA changes since, as mentioned by
Buchanan and Mellor 2007 and Meredith et al. 2003, these are relevant to un-
derstand age-related changes in STDP with BaP being more efficient for an adult
than younger rats, with implications for the NMDAr coincidence detection.
The aCSF conditions were slightly different between Dudek and Bear 1992 and
Tigaret et al. 2016. However, these differences were even greater considering
Meredith et al. 2003 and Wittenberg and Wang 2006, done at room temperature
(see Table 3.3). Wittenberg and Wang 2006 and Krelstein et al. 1990 suggested
how plasticity rules can be affected by temperature. Due to this, it was decided
to extend the temperature control initially over NMDAr using Korinek et al. 2010’s
NMDAr-dependent EPSP measurements. However, the temperature adjustments
from other receptors and ion channels were done later. During NeuroFrance 2019
conference, we discovered through Yanis Inglebert’s poster how external Ca2+
and Mg2+ modulated STDP. That was important to understand since experiments
used to validate the model had different aCSF recipes. After the inclusion of a
better Ca2+ control through GHK formalism, we found that Ca2+ also affected the
vesicle release probability (Hardingham et al. 2006; King et al. 2001) and the

64CHAPTER 5. A STOCHASTICMODELOF HIPPOCAMPAL SYNAPTIC PLASTICITYWITHGEOMETRICAL READOUTOF ENZYMES - ARTICLE
NMDAr conductance (Maki and Popescu 2014) which were phenomenologically
implemented.
5.2 Article preamble
Plasticity experiments are heterogeneous in their methods, and conditions are
thought to represent physiological learning and memory. Therefore, it is vital to
understand how plasticity is induced in such extreme cases (non-physiological
conditions) since they can also induce long-lasting changes in synaptic efficiency.
The article presented next describes a data-driven model to gain insight into the
relationship between plasticity outcomes in heterogeneous experimental condi-
tions. It shows a new synaptic rule which reproduces several plasticity exper-
iments using the concepts of geometrical readout and orbits mentioned previ-
ously. Also, it offers a hypothesis on how irregular firing from in vivo plasticity
occurs and new strategies to induce LTP and LTP based on plasticity protocols.
The model also formalises strategies to induce LTP or LTD when less favourable
experimental conditions are not met (e.g. LTD and adult rats). For instance, the
model predicts that presynaptic burst can rescue LTD induced by LFS in adult
rats to levels similar to rat pups using Dudek and Bear 1992; Dudek and Bear
1993’s experimental conditions. It also predicts several plasticity maps indexed
by the experimental conditions or firing structure variations (in vivo-like and reg-
ular spikes, single interspike stimulation interval). This theoretical result extends
the reproducibility factor of hallmarks experiments. And, it provides testable pre-
dictions using parameter modifications such as temperature, developmental age,
aCSF (Mg and Ca), and distance from the soma.
The synapse model which will presented next is formulated as a Piecewise de-
terministic Markov process, see Annexe 1 for details.

A stochastic model of hippocampal synaptic plasticitywith geometrical readout of enzyme dynamicsYuri E. Rodrigues1,2,3,*, Cezar M. Tigaret4, Helene Marie1,3,6, Cian O’Donnell5,6, and Romain Veltz2,6,*
Discovering the rules of synaptic plasticity is an important step for understanding brain learning. Existing plasticity modelsare either 1) top-down and interpretable, but not flexible enough to account for experimental data, or 2) bottom-up andbiologically realistic, but too intricate to interpret and hard to fit to data. We fill the gap between these approaches byuncovering a new plasticity rule based on a geometrical readout mechanism that flexibly maps synaptic enzyme dynamicsto plasticity outcomes. We apply this readout to a multi-timescale model of hippocampal synaptic plasticity induction thatincludes electrical dynamics, calcium, CaMKII and calcineurin, and accurate representation of intrinsic noise sources. Usinga single set of model parameters, we demonstrate the robustness of this plasticity rule by reproducing nine published exvivo experiments covering various spike-timing and frequency-dependent plasticity induction protocols, animal ages, andexperimental conditions. The model also predicts that in vivo-like spike timing irregularity strongly shapes plasticity outcome.This geometrical readout modelling approach can be readily applied to other excitatory or inhibitory synapses to discovertheir synaptic plasticity rules.
To understand how brains learn, we need to identify the rulesgoverning how synapses change their strength in neural circuits.What determines whether each synapse strengthens, weakens,or stays the same? The dominant principle at the basis of cur-rent models of synaptic plasticity is the Hebb postulate1 whichstates that neurons with correlated electrical activity strengthentheir synaptic connections, while neurons active at differenttimes weaken their connections. In particular, spike-timing-dependent plasticity (STDP) models2–4 were formulated basedon experimental observations that precise timing of pre- and post-synaptic spiking determines whether synapses are strengthened orweakened5–8. However, experiments also found that plasticity in-duction depends on the rate and number of stimuli presented to thesynapse9,10, and the level of dendritic spine depolarisation11–15.The lack of satisfactory plasticity models based solely on neuralspiking prompted researchers to consider more elaborate modelsbased on synapse biochemistry16. Following a proposed role forpostsynaptic calcium (Ca2+) signalling in synaptic plasticity17,previous models assumed that the amplitude of postsynaptic cal-cium controls long-term alterations in synaptic strength, withmoderate levels of calcium causing long-term depression (LTD)and high calcium causing long-term potentiation (LTP)18,19. Re-cent experimental data suggests that calcium dynamics is alsoimportant20–24 . As a result, subsequent phenomenological mod-els of plasticity incorporated slow variables that integrate thefast synaptic input signals, loosely modelling calcium and itsdownstream effectors25–32.
However, even these models do not account for data showingthat plasticity is highly sensitive to physiological conditions suchas the developmental age of the animal33–36, extracellular calcium
and magnesium concentrations37,38 and tissue temperature39–41.The fundamental issue is that the components of these phe-nomenological models do not directly map to biological compo-nents of synapses, so they cannot automatically model alterationsdue to physiological and experimental conditions. This absencelimits the predictive power of existing plasticity models.
To tackle this problem, we devised a new plasticity rule basedon a bottom-up, data-driven approach by building a biologically-grounded model of plasticity induction at a single rat hippocam-pal CA3–CA1 synapse. We focus on this synapse type becauseof the abundant published experimental data that can be usedto quantitatively constrain the model parameters. Compared toprevious models in the literature, we aimed for an intermedi-ate level of detail: enough biophysical components to capturethe key dynamical processes underlying plasticity induction, butnot the full molecular cascade underlying plasticity expression;much of which is poorly quantified42. Our model centred ondendritic spine electrical dynamics, calcium signalling and imme-diate downstream molecules, which we then mapped to synapticstrength change via an conceptually new dynamical, geometricreadout mechanism. Crucially, the model also captures intrinsicnoise based on the stochastic switching of synaptic receptors andion channels43,44. We found that the model can account for pub-lished data from spike-timing and frequency-dependent plasticityexperiments, and variations in physiological parameters influenc-ing plasticity outcomes. We also tested how the model respondedto in vivo-like spike timing jitter and spike failures, and foundthat the plasticity rules were highly sensitive to these subtle inputalterations.
1 Université Côte d’Azur, Nice, Alpes-Maritimes, France. 2 Institut national de recherche en informatique et en automatique (INRIA), Sophia Antipolis, France. 3
Institut de Pharmacologie Moléculaire et Cellulaire (IPMC), Valbonne, France. 4 Neuroscience and Mental Health Research Institute, Division of PsychologicalMedicine and Clinical Neurosciences, School of Medicine, Cardiff University, Cardiff, UK. 5 Computational Neuroscience Unit, School of Computer Science, Electricaland Electronic Engineering, and Engineering Mathematics, University of Bristol, Bristol, UK. 6 Co-last authors. * Corresponding authors: [email protected],[email protected]
1
5.3. ARTICLE 65

Fig. 1. | The synapse model, its timescales and mechanisms. a, Model diagram with the synaptic components, the pre and postsynaptic com-partments. Inhibitory receptor bottom left. b, Stochastic dynamics of the different receptors and channels. Plots show the total number of openchannels/receptors as a function of time. AMPArs and NMDArs are activated by glutamate, VGCC are activated by membrane potential, and GABArsare activated by GABA. The timescale of variable response increases from top to bottom panels. c, Dendritic spine membrane potential (left) andcalcium concentration (right) as function of time for a single causal (1Pre1Post10) stimulus. d, Left: depletion of vesicle pools (reserve and docked)induced by 30 pairing repetitions delivered at 5 Hz45 (Methods). The same vesicle depletion rule is applied to both glutamate and GABA. Right: BaPefficiency as function of time. BaP efficiency controls the axial resistance between soma and dendrite in order to phenomenologically capture thedistance-dependent BaP attenuation46,47 (Methods). e, Activated enzyme concentration for CaM, CaN and CaMKII, as function of time for thestimulus 1Pre1Post10, 30 pairing repetitions delivered at 5 Hz. Note that the vertical grey bar is the duration of the stimuli, 6 s.
Results
A multi-timescale model of synaptic plasticity induction. Webuilt a computational model of plasticity induction at a singleCA3-CA1 rat glutamatergic synapse (Fig. 1). Our goal wasto reproduce results on synaptic plasticity that explored the ef-fects of several experimental parameters: fine timing differencesbetween pre and postsynaptic spiking (Fig. 2-3); stimulationfrequency (Fig. 4); animal age (Fig. 5); external calcium andmagnesium (Fig. 6); stochasticity in the firing structure (Fig. 7),temperature and experimental conditions variations (Supplemen-tal Information). Where possible, we set parameters to valuespreviously estimated from experiments, and tuned the remainderwithin physiologically plausible ranges to reproduce our targetplasticity experiments (Methods).
The model components are schematized in Fig. 1a (fulldetails in Methods). For glutamate release, we used a two-pool vesicle depletion and recycling system, which accountsfor short-term presynaptic depression and facilitation. Whenglutamate is released from vesicles, it can bind to the postsynap-tic α-amino-3-hydroxy-5-methyl-4-isoxazolepropionic acid andN-methyl-D-aspartate receptors (AMPArs and NMDArs, respec-tively). When dendritic spine voltage depolarises, it activatesvoltage-gated calcium channels (VGCCs) and removes magne-
sium (Mg2+) block from NMDArs. Backpropagating actionpotentials (BaP) can also cause spine depolarisation. As an in-hibitory component, we modelled a gamma-aminobutyric acidreceptor (GABAr) synapse on the dendrite shaft48. Calcium ionsinfluxing through VGCCs and NMDArs can activate hyperpo-larising SK potassium channels49,50, bind to calmodulin (CaM)or to a generic calcium buffer. Calcium-bound calmodulin acti-vates two major signalling molecules immediately downstream ofCa/CaM enzymes51: Ca2+/calmodulin-dependent protein kinaseII (CaMKII) or calcineurin (CaN) phosphatase, also known asPP2B52. We included these two proteins because CaMKII acti-vation is necessary for Schaffer-collateral LTP53,54, while CaNactivation is necessary for LTD55,56. Later, we show how we mapthe joint activity of CaMKII and CaN to LTP and LTD.
Synaptic receptors and ion channels have an inherent ran-dom behavior, stochastically switching between open and closedstates44. If the number of receptors or channels is large, thenthe variability of the total population activity becomes negligiblerelative to the mean57. However individual hippocampal synapsescontain only small numbers of receptors and ion channels, forexample ∼10 NMDA receptors and <15 VGCCs58–60, makingtheir total activation highly stochastic. Therefore, we modelledAMPAr, NMDAr, VGCCs and GABAr as stochastic processes.Presynaptic vesicle release events were also stochastic: glutamate
2/46
66CHAPTER 5. A STOCHASTICMODELOF HIPPOCAMPAL SYNAPTIC PLASTICITYWITHGEOMETRICAL READOUTOF ENZYMES - ARTICLE

Fig. 2. | The duration and amplitude of the joint CaN-CaMKII activity differentiates plasticity protocols. a, Activity of CaMKII (solid line)and CaN (dashed line) (µM) for two protocols. Experimentally the 1Pre2Post10 produces LTP, and 1Pre1Post10 produces no change (NC). Bothare composed of 300 pairing repetitions delivered at 5 Hz. b, Joint enzymatic activity (CaN-CaMKII) for the protocols in panel a. The black dotindicates the initial resting activity and the arrows the trajectory direction as function of time. The grey points mark the time position (x-axis inpanel a) for both protocols at 2, 10 and 60 s (when the stimulation stops). The black square is the zoomed region in panel c. c, The mean timespent (colorbar) for each protocol in panel b (100 samples for each protocol for panelsc, f and i). d, Same as in panel a, but for the LTP protocol,1Pre2Post50 and, the NC protocol, 2Post1Pre50. Both are composed of 300 pairing repetitions at 5 Hz. e, Same as in panel b for protocols in panel d.f, The mean time spent (colorbar) for each protocol in panel e. g, Same as in panel a and d, but for two protocols with different frequencies and pulserepetitions. The LTD protocol, 2Pre50 900 at 3 Hz and, the NC protocol 2Pre10 300 at 5 Hz. h, Same as in panel b and e for protocols in panel g. i,The mean time spent (colorbar) for each protocol in panel h.
release was an all-or-nothing event, and the amplitude of eachglutamate pulse was drawn randomly, modelling heterogeneity invesicle size61. The inclusion of stochastic processes to accountfor an intrinsic noise in synaptic activation62 contrasts with mostprevious models in the literature, which either represent all vari-ables as continuous and deterministic or add an external genericnoise source63–65.
The synapse model showed nonlinear dynamics across multi-ple timescales. For illustration, we stimulated the synapse withsingle simultaneous glutamate and GABA vesicle releases (Fig.1b). AMPArs and VGCCs open rapidly but close again withina few milliseconds. The dendritic GABAr closes more slowly,on a timescale of ∼10 ms. NMDArs, the major calcium source,closes on timescales of ∼50 ms and ∼250 ms for the GluN2Aand GluN2B subtypes, respectively.
To show the typical responses of the spine head voltage andCa2+, we stimulated the synapse with a single presynaptic pulse(EPSP) paired 10 ms later with a single BaP (1Pre1Post10) (Fig.1c, left). For this pairing, when BaP is triggered immediately
after an EPSP, it leads to a large Ca2+ transient aligned with theBaP due to the NMDArs first being bound by glutamate thenunblocked by the BaP depolarisation (Fig. 1c, right).
Single pre or postsynaptic stimulation pulses did not cause de-pletion of vesicle reserves or substantial activation of the enzymes.To illustrate these slower-timescale processes, we stimulated thesynapse with a prolonged protocol: one presynaptic pulse fol-lowed by one postsynaptic pulse 10 ms later, repeated 30 times at5 Hz (Fig. 1d-e). The number of vesicles in both the docked andreserve pools decreased substantially over the course of the stim-ulation train (Fig. 1d left), which in turn causes decreased vesiclerelease probability. Similarly, by the 30th pulse, the dendritic BaPamplitude had attenuated to ∼85% (∼70% BaP efficiency; Fig.1d right) of its initial amplitude, modelling the effects of slow den-dritic sodium channel inactivation47,66. CaM concentration roserapidly in response to calcium transients but also decayed backto baseline on a timescale of ∼500 ms (Fig. 1e top). In contrast,the concentration of active CaMKII and CaN accumulated over atimescale of seconds, reaching a sustained peak during the stimu-
3/46
5.3. ARTICLE 67

lation train, then decayed back to baseline on a timescale of ∼10and ∼120 s respectively, in line with experimental data51,54,67
(Fig. 1e).The effects of the stochastic variables can be seen in Fig.
1b–d. The synaptic receptors and ion channels open and closerandomly (Fig. 1b). Even though spine voltage, calcium, anddownstream molecules were modelled as continuous and deter-ministic, they inherited some randomness from the upstreamstochastic variables. As a result, there was substantial trial-to-trial variability in the voltage and calcium responses to identicalpre and postsynaptic spike trains (grey traces in Fig. 1d). Thisvariability was also passed on to the downstream enzymes CaM,CaMKII and CaN, but was filtered and therefore attenuated bythe slow dynamics of CaMKII and CaN. In summary, the modelcontained stochastic nonlinear variables acting over five differentorders of magnitude of timescale, from∼1 ms to∼1 min, makingit sensitive to both fast and slow components of input signals.
Distinguishing between stimulation protocols using theCaMKII and CaN joint response. It has proven difficult forsimple models of synaptic plasticity to capture the underlyingrules and explain why some stimulation protocols induce plas-ticity while others do not. We tested the model’s sensitivity bysimulating its response to a set of protocols used by24 in a recentex vivo experimental study on adult (P50-55) rat hippocampuswith blocked GABAr. We focused on three pairs of protocols(three rows in Fig. 2). In each case in24’s experiments, one of thepair induced LTP or LTD, while the other subtly different proto-col caused no change (NC) in synaptic strength. We asked if themodel’s joint CaMKII-CaN activity could distinguish betweeneach pair of protocols.
The first pair of protocols differed in intensity. A protocolwhich caused no plasticity consisted of 1 presynaptic spike fol-lowed 10 ms later by one postsynaptic spike repeated at 5 Hzfor one minute (1Pre1Post10, 300 at 5Hz). The other protocolinduced LTP, but differed only in that it included a postsynapticdoublet instead of a single spike (1Pre2Post10, 300 at 5Hz), im-plying a slightly stronger BaP amplitude initially. For the plots inFig. 2a, it was not possible to set a single concentration thresholdon either CaMKII or CaN that would discriminate between theprotocols.
To achieve better separability, we combined the activity ofthe two enzymes, plotting the joint CaMKII and CaN responsesagainst each other on a 2D plane (Fig. 2b). In this geometricplot, the two protocol’s trajectories can be seen to overlap for theinitial part of the transient, but then diverge. To quantify trialto trial variability, we also calculated contour maps showing themean fraction of time the trajectories spent in each part of theplane during the stimulation (Fig. 2c). Importantly, both thetrajectories and contour maps were substantially non-overlappingbetween the two protocols, implying that they can be separatedbased on the joint CaN-CaMKII activity. We found that the1Pre2Post10 protocol leads to a weaker response in both CaMKIIand CaN, corresponding to the lower blue traces Fig. 2b. Thedecreased response to the doublet protocol was due to the en-hanced attenuation of dendritic BaP amplitude over the course ofthe simulation47, leading to less calcium influx through NMDArsand VGCCs (data not shown).
The second pair of protocols we explored differed in sequenc-
ing. We stimulated the synapse model with one causal (EPSP-BaP) protocol involving a single presynaptic spike followed 50ms later by a doublet of postsynaptic spikes (1Pre2Post50, 300 at5Hz), repeated at 5 Hz for one minute, which24 found caused LTP.The other anticausal protocol involved the same total numberof pre and postsynaptic spikes, but with the pre-post order re-versed (2Post1Pre50, 300 at 5Hz). Experimentally this anticausal(BaP-EPSP) protocol did not induce plasticity. Notably, the onlydifference was the sequencing of whether the pre or postsynapticneuron fired first, over a short time gap of 50 ms. Despite theactivations being apparently difficult to distinguish (Fig. 2d), wefound that the LTP-inducing protocol caused greater CaN activa-tion than the protocol that did not trigger plasticity. Indeed, thistranslated to a horizontal offset in both the trajectory and contourmap (Fig. 2e–f), demonstrating that another pair of protocols canbe separated in the joint CaN-CaMKII plane.
The third pair of protocols differed in both duration and in-tensity. In line with previous studies,24 found that a train ofdoublets of presynaptic spikes separated by 50 ms repeated ata low frequency of 3 Hz for 5 minutes (2Pre50, 900 at 3Hz)induced LTD, while a slightly more intense but shorter durationprotocol of presynaptic spike doublets separated by 10 ms re-peated at 5 Hz for one minute (2Pre10, 300 at 5Hz) did not causeplasticity. When we simulated both protocols in the model (Fig.2g–i), both caused similar initial responses in CaMKII and CaN.In the shorter protocol, this activation decayed to baseline within100 s of the end of the stimulation. However the slower andlonger-duration 2Pre50 3Hz 900p protocol caused an additionalsustained, stochastically fluctuating, plateau of activation of bothenzymes (Fig. 2g). This resulted in the LTD-inducing protocolhaving a downward and leftward-shifted CaN-CaMKII trajectoryand contour plot, relative to the other protocol (Fig. 2h-i). Theseresults again showed that the joint CaN-CaMKII activity may beuseful to predict plasticity changes.
A geometrical readout mapping joint enzymatic activity toplasticity outcomes. We found that the simulated CaN-CaMKIItrajectories from the two LTP-inducing protocols (1Pre2Post10and 1Pre2Post50, at Fig. 2a and D respectively) spent a largefraction of time near ∼ 20 µM CaMKII and 7–10 µM CaN. Incontrast, protocols that failed to trigger LTP had either lower(2Post1Pre50 and 2Pre10, Fig. 2d and 2g respectively), or higherCaMKII and CaN activation (1Pre1Post10, Fig. 2a). The LTD-inducing protocol, by comparison, spent a longer period in aregion of sustained but lower∼ 12µM CaMKII and∼ 2µM CaNand activation. The plots in Fig. 2c,f and g, show contour mapsof histograms of the joint CaMKII-CaN activity, indicating wherein the plane the trajectories spent most time. Fig. c and f indicatethis measure can be used to predict plasticity, because the NC andLTP protocol histograms are largely non-overlapping. In Fig. 2c,the NC protocol response ‘overshoots’ the LTP protocol response,whereas in Fig. 2f the NC protocol response ‘undershoots’ theLTP protocol response. In contrast, when we compared the re-sponse histograms for LTD and NC protocols, we found a greateroverlap (Fig. 2i). This suggested that in this case the histogramalone was not sufficient to separate the protocols, and that proto-col duration is also important. LTD induction (2Pre50) requireda more prolonged activation than NC (2Pre10).
To design a geometrical readout mechanism to map the
4/46
68CHAPTER 5. A STOCHASTICMODELOF HIPPOCAMPAL SYNAPTIC PLASTICITYWITHGEOMETRICAL READOUTOF ENZYMES - ARTICLE

Fig. 3. | Read-out strategy an Tigaret et al. 201624 experiment. a, Illustration of the joint CaMKII and CaN activities crossing the plasticityregions. Arrows indicate the flow of time, starting at the black dot. Note that here time is hidden and one can only see the changes in enzymeconcentrations. b, Region indicator showing when CaN and CaMKII crosses the LTD or LTP regions in panel a. Leaving the region activates aleaking mechanism that keeps track of the accumulated time inside the region. Such leaking mechanism drives the transition rates used to predictplasticity (Methods). c, Plasticity Markov chain with three states: LTD, LTP and NC. There are only two transition rates which are functions of theplasticity region indicator (Methods). The LTP transition is fast whereas the transition LTD is slow, meaning that LTD change requires longer timeinside the LTD region (panel a). The NC state starts with 100 processes. d, Joint CaMKII and CaN activity for all Tigaret protocols (labelled in F).The stimulus ends when the trajectory becomes smooth. Corresponds to Fig. 2b,e and h, at 60 s. e, Region indicator for the protocols labelled in F.The upper square bumps are caused by the protocol crossing the LTP region, the lower square bumps when the protocol crosses the LTD region (as inpanel d). f, Synaptic weight (%) as function of time for each protocol. The weight change is defined as the number (out of 100) of states in the LTPstate minus the number of states in the LTD state (panel c). The trajectories correspond to the median of the simulations in panel g. g, Synapticweight change (%) predicted by the model compared to data (EPSC amplitudes) from24 (100 samples for each protocol, also for panel h and i). Thedata (grey dots) was provided by24 (note an 230% outlier as the red asterisk), red bands indicate data means. h, Predicted mean synaptic weightchange (%) as function of delay (ms) and number of pairing repetitions (pulses) for the protocol 1Pre2Post(delay), for delay between -100 and 100.LTD is induced by 2Post1Pre50 after at least 500 pulses. The mean weight change along each dashed line is reported in the STDP curves in panel i. i,Synaptic weight change (%) as function of pre-post delay. Each plot corresponds to a different pairing repetition number (legend). The solid lineshows the mean, and the ribbons are the 2nd and 4th quantiles. The red dots are the data means estimated in24, also shown in panel g.
enzyme activity to plasticity outcomes, we first drew non-overlapping boxes of LTP and LTD “plasticity regions” in theCaN-CaMKII plane (Fig. 3a). We positioned these regions overthe parts of the phase space where the enzyme activities corre-sponding to the LTP- and LTD-inducing protocols were mostdifferent, as shown by trajectories in Fig. 2. We then fixed theseregions for all subsequent parts of this study. When a trajectoryenters in one of these plasticity regions, it activates LTD or LTPindicator variables (Methods) which encode the joint enzymeactivities (trajectories in the phase plots) transitions across theLTP and LTD regions over time (Fig. 3b). These indicator vari-able drove transition rates in a plasticity Markov chain used topredict LTP or LTD (Fig. 3c), see Methods. The LTD transitionrates were slower than the LTP transition rates, to reflect studiesshowing that LTD requires sustained synaptic stimulation20–22.The parameters for this plasticity Markov chain (Methods) were
fit to the plasticity induction outcomes from different protocols(Table M1). In the beginning of the simulation, the plasticityMarkov chain starts with 100 processes48 in the state NC, witheach variable representing 1% weight change, an abstract mea-sure of synaptic strength that can be either EPSP, EPSC, or fieldEPSP slope depending on the experiment. Each process can tran-sit stochastically between NC, LTP and LTD states. At the endof the protocol, the plasticity outcome is given by the differencebetween the number of processes in the LTP and the LTD states(Methods).
This readout mechanism acts as a parsimonious model of thecomplex signalling cascade linking CaMKII and CaN activationto expression of synaptic plasticity68. It can be considered asa two-dimensional extension of previous computational studiesthat applied analogous 1D threshold functions to dendritic spinecalcium concentration18,19,30,31. Our model is scalable, as it gives
5/46
5.3. ARTICLE 69

Fig. 4. | Frequency dependent plasticity, Dudek and Bear 19929 dataset. a, Example traces of joint CaMKII-CaN activity for each of9’s protocols.b, Region indicator showing when the joint CaMKII-CaN activity crosses the LTD or LTP regions for each protocol in panel a. c, Synaptic weightchange (%) as function of time for each protocol, analogous to Fig. 3c. Trace colours correspond to panel a. The trajectories displayed were chosen tomatch the medians in panel e. d, Mean (100 samples) time spent (s) for protocols 1Pre for 900 pairing repetitions at 3, 10 and 50 Hz. e, Comparisonbetween data from9 and our model (1Pre 900p, 300 samples per frequency, Table M1). Data are represented as normal distributions with the meanand variance extracted from9. Note that data from Dudek and Bear are given in field EPSP slope change. f, Prediction for the mean weight change(%) varying the stimulation frequency and pulse number (24x38x100 data points, respectively pulse x frequency x samples). The red dots show the9
protocol parameters, the corresponding results are shown in panel e.
the possibility for the readout to be extended to dynamics of ndifferent molecules, using n-dimensional closed regions.
In Fig. 3d, we plot the model’s responses to seven differentplasticity protocols used by24 by overlaying example CaMKII-CaN trajectories for each protocol with the LTP and LTD regions.The corresponding region occupancies are plotted as function oftime in E, and long-term alterations in the synaptic strength areplotted as function of time in F. The three protocols that inducedLTP in the24 experiments spent substantial time in the LTP re-gion, and so triggered potentiation. In contrast, the 1Pre1Post10(yellow trace) overshoots both regions, crossing them only brieflyon its return to baseline, and so resulted in little weight change.The protocol that induced LTD (2Pre50, purple trace) is fivetimes longer than other protocols, spending sufficient time in-side the LTD region (Fig. 3f). In contrast, two other protocolsthat spent time in the same LTD region of the CaN-CaMKIIplane (2Post1Pre50 and 2Pre10) were too brief to induce LTD.These protocols were also not strong enough to reach the LTPregion, so resulted in no net plasticity, again consistent with24’sexperiments.
We observed run-to-run variability in the amplitude of thepredicted plasticity, due to the inherent stochasticity in the model.In Fig. 3g, we plot the distribution of the predicted plasticity fromeach protocol (colours) alongside the data from24’s study, findinga good correspondence.
Experimentally, LTP can be induced by few pulses while LTDusually requires longer-duration stimulation20–22. We incorpo-rated this effect into the readout model by letting LTP have fastertransition rates than LTD (Fig. 3c).24 found that 300 repetitions ofanticausal post-before-pre pairings did not cause LTD, in contrastto the canonical spike-timing-dependent plasticity curve7. We
hypothesized that LTD might indeed appear with the anticausal24
protocol (Table M1) if stimulation duration was increased. Toexplore this possibility in the model, we systematically varied thenumber of paired repetitions from 100 to 1200, and also co-variedthe pre-post delay from -100 to 100 ms. Fig. 3h shows a contourplot of the predicted mean synaptic strength change across for the1Pre2Post(delay) stimulation protocol for different numbers ofpairing repetitions. A LTD window appears after ∼500 pairingrepetitions for some anticausal pairings, in line with our hypothe-sis. The magnitude of LTP also increases with pulse number, forcausal positive pairings. For either 100 or 300 pairing repetitions,only LTP or NC is induced (Fig. 3i). The model also made otherplasticity predictions by varying24’s experimental conditions (Fig.S1). In summary, our model readout reveals that the direction andmagnitude of the change in synaptic strength can be predictedfrom the joint CaMKII-CaN activity in the LTP and LTD regions.
Frequency-dependent plasticity. The stimulation protocolsused by24 explored how subtle variations in pre and postsy-naptic spike timing influenced the direction and magnitude ofplasticity (see Table M1 for experimental differences). In con-trast, traditional synaptic plasticity protocols exploring the roleof presynaptic stimulation frequency did not measure the tim-ing of co-occurring postsynaptic spikes9,69,70. These studiesfound that long-duration low-frequency stimulation induces LTD,whereas short-duration high-frequency stimulation induces LTP,with a cross-over point of zero change at intermediate stimulationfrequencies. In addition to allowing us to explore frequency-dependent plasticity (FDP), this stimulation paradigm also givesus further constraints for LTD in the model since in24, only oneLTD case was available. For FDP, we focused on modelling the
6/46
70CHAPTER 5. A STOCHASTICMODELOF HIPPOCAMPAL SYNAPTIC PLASTICITYWITHGEOMETRICAL READOUTOF ENZYMES - ARTICLE

experiments from9, who stimulated Schaffer collateral projectionsto pyramidal CA1 neurons with 900 pulses in frequencies rang-ing from 1 Hz to 50 Hz. In addition to presynaptic stimulationpatterns, the experimental conditions differed from24 in two otheraspects: animal age and control of postsynaptic spiking activity(see Table M1 legend). We incorporated both age-dependenceand EPSP-evoked-BaPs (Methods). Importantly, the read-outmechanism mapping joint CaMKII-CaN activity to plasticity isthe same for all experiments in this work.
Fig. 4a shows the joint CaMKII-CaN activity when we stim-ulated the model with 900 presynaptic spikes at 1, 3, 5, 10 and50 Hz9. Higher stimulation frequencies drove stronger responsesin both CaN and CaMKII activities (Fig. 4a). Fig. 4b,c show thecorresponding plasticity region indicator for the LTP/LTD regionthreshold crossings and the synaptic strength change. From thisset of five protocols, only the 50 Hz stimulation drove a responsestrong enough to reach the LTP region of the plane (Fig. 4a a,d).Although the remaining four protocols drove responses primarilyin the LTD region, only the 3 and 5 Hz stimulations resulted insubstantial LTD. The 1 Hz and 10 Hz stimulations resulted innegligible LTD, but for two distinct reasons. Although the 10 Hzprotocol’s joint CaMKII-CaN activity passed through the LTDregion of the plane (Fig. 4a,d), it was too brief to activate theslow LTD mechanism built into the readout (Methods). The 1 Hzstimulation, on the other hand, was prolonged, but its responsewas mostly too weak to reach the LTD region, crossing the thresh-old only intermittently (Fig. 4b, bottom trace). Overall the modelmatched well the mean plasticity response found by Dudek andBear (Fig. 4e), following a classic BCM-like curve as function ofstimulation frequency71,72.
We then used the model to explore the stimulation space inmore detail by varying the stimulation frequency from 0.5 Hz to50 Hz, and varying the number of presynaptic pulses from 50 to1200. Fig. 4f shows a contour map of the mean synaptic strengthchange (%) in this 2D frequency–pulse number space. Under9’sexperimental conditions, we found that LTD induction requiredat least ∼300 pulses, at frequencies between 1Hz and 3Hz. Incontrast, LTP could be induced using ∼50 pulses at ∼20Hz orgreater. The contour map also showed that increasing the numberof pulses (vertical axis in Fig. 4e) increases the magnitude ofboth LTP and LTD. This was paralleled by a widening of the LTDfrequency range, whereas the LTP frequency threshold remainedaround ∼20Hz, independent of pulse number. The pulse depen-dence amplitude increase predicted in Fig. 4 is also valid for24
experiment shown in Fig. S1f.Ex vivo experiments in9 were done at 35°C. However, lower
temperatures are more widely used ex vivo because they extendbrain slice viability. We performed further simulations testingtemperature modifications for9’s experiment, finding that it had astrong effect on plasticity outcomes (Fig. S2d–f).
Variations in plasticity induction with developmental age.The rules for induction of LTP and LTD change duringdevelopment33,35, so a given plasticity protocol can produce dif-ferent outcomes when delivered to synapses from young animalsversus mature animals. For example, when33 tested the effects oflow-frequency stimulation (1 Hz) on CA3-CA1 synapses fromrats of different ages, they found that the magnitude of LTDdecreases steeply with age from P7 until becoming minimal in
mature animals >P35 (Fig. 5a, circles). Across the same agerange, they found that a theta-burst stimulation protocol inducedprogressively greater LTP magnitude with developmental age(Fig. 5b, circles). Paralleling this, multiple properties of neuronschange during development: the NMDAr switches its dominantsubunit expression from GluN2B to GluN2A73–75, the reversalpotential of the receptor (GABAr) switches from depolarisingto hyperpolarizing34,76,77, and the action potential backpropa-gates more efficiently with age46. These mechanisms have beenproposed to underlie the developmental changes in synaptic plas-ticity rules because they are key regulators of synaptic calciumsignalling34,46. However, their sufficiency and individual con-tributions to the age-related plasticity changes are unclear. Weincorporated these mechanisms in the model (Methods) by param-eterizing each of the three components to vary with the animal’spostnatal age, to test if they could account for the age-dependentplasticity data.
We found that elaborating the model with age-dependentchanges in NMDAr composition, GABAr reversal potential, andBaP efficiency, while keeping the same plasticity readout param-eters, was sufficient to account for the developmental changes inLTD and LTP observed by33 (Fig. 5a,b). We then explored themodel’s response to protocols of various stimulation frequencies,from 0.5 to 50 Hz, across ages from P5 to P80 (Fig. 5c,e). Fig. 5cshows the synaptic strength change as function of stimulation fre-quency for ages P15, P25, P35 and P45. The magnitude of LTDdecreases with age, while the magnitude of LTP increases withage. Fig. 5e shows a contour plot of the same result, covering theage-frequency space.
The 1Hz presynaptic stimulation protocol in33 did not induceLTD in adult animals9. We found that the joint CaN-CaMKIIactivity trajectories for this stimulation protocol underwent anage-dependent leftward shift beyond the LTD region (Fig. 5f).This implies that LTD is not induced in mature animals by thisconventional LFS protocol due to insufficient activation of en-zymes. In contrast,24 and78 were able to induce LTD in adultrat tissue by combining LFS with presynaptic spike pairs re-peated 900 times at 3 Hz. Given these empirical findings andour modelling results, we hypothesized that LTD induction inadult animals requires that the stimulation protocol: 1) causesCaMKII and CaN activity to stay more in the LTD region thanthe LTP region, and 2) is sufficiently long to activate the LTDreadout mechanism. With experimental parameters used by33,this may be as short as 300 pulses when multi-spike presynapticprotocols are used since the joint CaMKII-CaN activity can reachthe LTD region more quickly than for single spike protocols. Wesimulated two such potential protocols as predictions: doubletand quadruplet spike groups delivered 300 times at 1 Hz, with 50ms between each pair of spikes in the group (Fig. 5d). The modelpredicted that both these protocols induce LTD in adults (greenand blue curves), whereas as shown above, the single pulse pro-tocol did not cause LTD (yellow curve). These findings suggestthat the temporal requirements for inducing LTD may not be asprolonged as previously assumed, since they can be reduced byvarying stimulation intensity. See Fig. S3 for frequency versusage maps for presynaptic bursts.
33 also performed theta-burst stimulation (TBS, Table M1) atdifferent developmental ages, and found that LTP is not easily in-duced in young rats (Fig. 5b), see also35. The model qualitatively
7/46
5.3. ARTICLE 71

matches this trend, and also predicts that TBS induces maximalLTP around P21, before declining further during development(Fig. 5b, green curve). Similarly, we found that high-frequencystimulation induces LTP only for ages >P15, peaks at P35, thengradually declines at older ages (Fig. 5e). Note that in Fig. 5b,we used 6 epochs instead of 4 used by33 to increase LTP outcomewhich is known to washout after one hour for young rats35.
Fig. 5. | Age-dependent plasticity, Dudek and Bear 199333 dataseta, Synaptic weight change for 1Pre, 900 at 1 Hz as in33. The solid lineis the mean and the ribbons are the 2nd and 4th quantiles predicted byour model (same for panel b, c and f). b, Synaptic weight change forTheta Burst Stimulation (TBS - 4Pre at 100 Hz repeated 10 times at5Hz given in 6 epochs at 0.1Hz (Table M1) and33. c, Synaptic weightchange as function of frequency for different ages. BCM-like curvesshowing that, during adulthood, the same LTD protocol becomes lessefficient. It also shows that high-frequencies are inefficient at inducingLTP before P15. d, Synaptic weight change as function of age. Proposedprotocol using presynaptic bursts to recover LTD at ≥ P35 with lesspulses, 300 instead of the original 900 from33. This effect is more pro-nounced for young rats. Fig. S3 shows a 900 pulses comparison. e, Meansynaptic strength change (%) as function of frequency and age for 1Pre900 pulses (32x38x100, respectively, for frequency, age and samples).The protocols in33 (panel a) are marked with the yellow vertical line.The horizontal lines represent the experimental conditions of panel c.Note the P35 was used for9 experiment in Fig. 4f. f, Mean time spentfor the 1Pre 1Hz 900 pulses protocol showing how the trajectories areleft-shifted as rat age increases.
In contrast to33’s findings, other studies have found that
LTP can be induced in hippocampus in young animals (<P15)with STDP. For example,34 found that at room temperature,1Pre1Post10 induces LTP in young rats, whereas 1Pre2Post10induces NC. This relationship was inverted for adults, with1Pre1Post inducing no plasticity and 1Pre2Post10 inducing LTP(Fig. S5).
Together, these results suggest that not only do the require-ments for LTP/LTD change with age, but also that these age-dependencies are different for different stimulation patterns. Fi-nally, we explore which mechanisms are responsible for plasticityinduction changes across development in the FDP protocol (Fig.S3) by fixing each parameter to young or adult values for theFDP paradigm. Our model analysis suggests that the NMDArswitchiacobucci2017 is a dominant factor affecting LTD induction,but the maturation of BaP46 is the dominant factor affecting LTPinduction, with GABAr shift having only a weak influence onLTD induction for33’s FDP.
Plasticity requirements during development do not necessar-ily follow the profile in33 as shown by34’s STDP experiment. Ourmodel shows that multiple developmental profiles are possiblewhen experimental conditions vary within the same stimulationparadigm. This is illustrated in Fig. S5a–c by varying the age ofSTDP experiments done in different conditions.
Effects of extracellular calcium and magnesium concentra-tion on plasticity. The canonical STDP rule7 measured in cul-tured neurons, high [Ca2+]o, and at room temperature, was re-cently found not to be reproducible at physiological [Ca2+]o inCA1 brain slices38. Instead, by varying the [Ca2+]o and [Mg2+]othey found a spectrum of STDP rules with either no plasticityor full-LTD for physiological [Ca2+]o conditions ([Ca2+]o < 1.8mM) and a bidirectional rule for high [Ca2+]o ([Ca2+]o > 2.5mM), shown in Fig. 6a–c (data).
We attempted to reproduce38’s findings by varying [Ca2+]oand [Mg2+]o with the following consequences for the modelmechanisms (Methods). On the presynaptic side, [Ca2+]o modu-lates vesicle release probability. On the postsynaptic side, high[Ca2+]o reduces NMDAr conductance79, whereas [Mg2+]o affectsthe NMDAr Mg2+ block80. Furthermore, spine [Ca2+]o influxactivates SK channels, which hyperpolarize the membrane andindirectly modulate NMDAr activity50,81.
Fig. 6a–c compares our model to38’s STDP data at different[Ca2+]o and [Mg2+]o. Note that38 used 150 (100) pairing repe-titions for the anti-causal (causal) both delivered at 0.3 Hz. At[Ca2+]o=1.3 mM, Fig. 6a shows the STDP rule induced weakLTD for brief causal delays. At [Ca2+]o= 1.8 mM, in Fig. 6b, themodel predicted a full-LTD window. At [Ca2+]o= 3 mM, in Fig.6c, it predicted a bidirectional rule with a second LTD windowfor long pre-before-post pairings, previously theorized by26.
Fig. 6d illustrates the time spent by the joint CaN-CaMKIIactivity for 1Pre1Post10 using38’s experimental conditions. Eachdensity plot corresponds to a different panel in Fig. 6 with the re-spective Ca/Mg. The response under low [Ca2+]o spent most timeinside the LTD region, but high [Ca2+]o shifts the trajectory tothe LTP region. Fig. S4a presents density plots for the anticausalpost-before-pre protocols.
38 fixed the Ca/Mg ratio at 1.5, although aCSF formulationsin the literature differ (see Table M1). Fig. S4d shows that vary-ing Ca/Mg ratio and [Ca2+]o for38’s experiments restrict LTP to
8/46
72CHAPTER 5. A STOCHASTICMODELOF HIPPOCAMPAL SYNAPTIC PLASTICITYWITHGEOMETRICAL READOUTOF ENZYMES - ARTICLE

Fig. 6. Effects of extracellular calcium and magnesium concentrations on plasticity a, Synaptic weight (%) for a STDP rule with[Ca2+]o = 1.3 mM (fixed ratio, Ca/Mg=1.5). According to the data extracted from38, the number of pairing repetitions for positive (nega-tive) delays is 100 (150), both delivered at 0.3 Hz38. The solid line is the mean, and the ribbons are the 2nd and 4th quantiles predicted by our model(all panels use 100 samples). b, Same as A, but for [Ca2+]o= 1.8 mM (Ca/Mg ratio = 1.5). c, Same as A, but for [Ca2+]o= 3 mM (Ca/Mg ratio = 1.5).d, Mean time spent for causal pairing, 1Pre1Post10, at different Ca/Mg concentrations. The contour plots are associated with the panels a, b and c. e,STDP and extracellular Ca/Mg. Synaptic weight change (%) for causal (1Pre1Post10, 100 at 0.3 Hz) and anticausal (1Post1Pre10, 150 at 0.3 Hz)pairings varying extracellular Ca from 1.0 to 3 mM (Ca/Mg ratio = 1.5). The dashed lines represent the experiments in the panel a, b and c. We used21x22x100 data points, respectively calcium x delay x samples. f, Varying frequency and extracellular Ca/Mg for the causal pairing 1Pre1Post10,100 at 0.3 Hz. Contour plot showing the mean synaptic weight (%) for a single causal pairing protocol (1Pre1Post10, 100 samples) varying frequencyfrom 0.1 to 10 Hz and [Ca2+]o from 1.0 to 3 mM (Ca/Mg ratio = 1.5). We used 21x18x100 data points, respectively calcium x frequency x samples.
Ca/Mg>1.5 and [Ca2+]o>1.8 mM.Our model can also identify the transitions between LTD and
LTP depending on Ca/Mg. Fig. 6e shows a map of plasticityas function of pre-post delay and Ca/Mg concentrations and theparameters where LTP is induced for the 1Pre1Post10 protocol.Since plasticity rises steeply at around [Ca2+]o= 2.2 mM, smallfluctuations in [Ca2+]o near this boundary could cause qualita-tive transitions in plasticity outcomes. For anticausal pairings,increasing [Ca2+]o increases the magnitude of LTD (Fig. S4billustrates this with38’s data).
38 also found that increasing the pairing frequency to 5 or 10Hz results in a transition from LTD to LTP for 1Pre1Post10 at[Ca2+]o= 1.8 mM (Fig. S4c), similar frequency-STDP behaviourhas been reported in cortex10. In Fig. 6f, we varied both thepairing frequencies and [Ca2+]o and we observe similar transi-tions to38. However, the model’s transition for [Ca2+]o= 1.8 mMwas centred around 0.5 Hz, which was untested by38. The modelpredicted no plasticity at higher frequencies, unlike the data, thatshows scattered LTP and LTD (see Fig. S4c). Fig. S1d andS4e shows that24’s burst-STDP and38’s STDP share a similartransition structure, but not9’s FDP.
In contrast to38’s results, we found that setting low [Ca2+]ofor24’s burst-STDP abolishes LTP, and does not induce strongLTD (Fig. S1d). For9’s experiment, Fig. S2a [Mg2+]o con-trols a sliding threshold between LTD and LTP but not [Ca2+]o(Fig. S2b). For another direct stimulation experiment, Fig. S4cshows that in an Mg-free medium, LTP expression requires fewer
pulses21.Despite exploring physiological [Ca2+]o and [Mg2+]o
38 usea non-physiological temperature (30°C) which extends T-typeVGCC closing times and modifies the CaN-CaMKII baseline (Fig.S5i). Fig. S5g,h shows comparable simulations for physiologicaltemperatures. Overall our model predicts that temperature canchange STDP rules in a similar fashion to [Ca2+]o (Fig. S4a,b).In summary, plasticity is highly sensitive to variations in extra-cellular calcium, magnesium, and temperature (Fig. S1a, Fig.S5d-f;40).
In vivo-like spike variability affects plasticity. In the abovesections, we used highly regular and stereotypical stimulationprotocols to replicate typical ex vivo plasticity experiments. Incontrast, neural spiking in hippocampus in vivo is irregular andvariable78,82. It is unclear how natural firing variability affectsthe rules of plasticity induction27,83–85. We explored this questionusing model simulations by adding three distinct types of variabil-ity: 1) spike time jitter, 2) failures induced by dropping spikes, 3)independent pre and postsynaptic Poisson spike trains83.
We introduced spike timing jitter by adding zero-mean Gaus-sian noise (s.d. σ ) to pre and postsynaptic spikes, changing spikepairs inter-stimulus interval (ISI). In Fig. 7a, we plot the LTPmagnitude as function of jitter magnitude (controlled by σ ) forprotocols taken from24. With no jitter, σ = 0, these protocolshave different LTP magnitudes (corresponding to Fig. 3) andbecome similar once σ increases. The three protocols with apostsynaptic spike doublet gave identical plasticity for σ = 50
9/46
5.3. ARTICLE 73

ms.To understand the effects of jittering, we plotted the trajec-
tories of CaN-CaMKII activity (Fig. 7c). 2Post1Pre50 which"undershoots" the LTP region shifted into the LTP region for jitterσ = 50 ms. In contrast, 1Pre1Post10 which "overshoots" the LTPregion shifted to the opposite direction towards the LTP region.
Why does jitter cause different spike timing protocols to yieldsimilar plasticity magnitudes? Increasing jitter causes a fractionof pairings to invert causality. Therefore, the jittered protocolsbecame a mixture of causal and anticausal pairings (Fig. 7c).This situation occurs for all paired protocols. So any protocolwith the same number spikes will become mixed if the jitter islarge enough. Note that despite noise the mean frequency wasconserved at 5 ± 13.5 Hz (see Fig. 7e).
Next, we studied the effect of spike removal. In the previoussections, synaptic release probability was ∼60% (for [Ca2+]o=2.5 mM) or lower, depending on the availability of docked vesi-cles (Methods). However, baseline presynaptic vesicle releaseprobability is heterogeneous across CA3-CA1 synapses, rangingfrom ∼ 10− 90%86,87 and likely lower on average in vivo88,89.BaPs are also heterogeneous with random attenuation profiles47
and spike failures90. To test the effects of pre and postsynapticfailures on plasticity induction, we performed simulations wherewe randomly removed spikes, altering the previously regularattenuation in24’s protocols.
In Fig. 7b we plot the plasticity magnitude as function of spar-sity (percentage of removed spikes). The sparsity had differentspecific effects for each protocol. 1Pre2Post10 and 1Pre2Post50which originally produced substantial LTP were robust to spikeremoval until ∼60% sparsity. In contrast, the plasticity mag-nitude from both 1Pre1Post10 and 2Post1Pre50 showed a non-monotonic dependence on sparsity, first increasing then decreas-ing, with maximal LTP at ∼40% sparsity.
To understand how sparsity causes this non-monotonic effecton plasticity magnitude, we plotted the histograms of time spentin the CaN-CaMKII plane for 2Post1Pre50 for three levels of spar-sity: 0%, 30% and 80% (Fig. 7d). For 0% sparsity, the activationspent most time at the border between the LTP and LTD regions,resulting in no plasticity. Increasing sparsity to 30% caused theactivation to shift rightward into the LTP region because therewas less attenuation of pre and postsynaptic resources. In con-trast, at 80% sparsity, the activation moved into the LTD regionbecause there were not enough events to substantially activateCaMKII and CaN. Since LTD is a slow process and the protocolduration is short (60s), there was no net plasticity. Thereforefor this protocol, high and low sparsity caused no plasticity fordistinct reasons, whereas intermediate sparsity enabled LTP bybalancing resource depletion with enzyme activation.
Next we tested the interaction of jitter and spike removal. Fig.7f shows a contour map of weight change as function of jitter andsparsity for the 2Post1Pre50 protocol, which originally inducedno plasticity (Fig. 2). Increasing spike jitter enlarged the range ofsparsity inducing LTP. In summary, these simulations (Fig. 7a,b,fand h) show that different STDP protocols have different degreesof sensitivity to noise in the firing structure, suggesting that sim-ple plasticity rules derived from regular ex vivo experiments maynot predict plasticity in vivo.
How does random spike timing affect rate-dependent plastic-ity? We stimulated the model with pre and postsynaptic Poisson
Fig. 7. | Jitter and spike dropping effects on STDP; and Poissonspike trains. a, Mean weight (%) for the jittered STDP protocols. Thesolid line is the mean, and the ribbons are the 2nd and 4th quantiles pre-dicted by our model estimated using 100 samples (same for all panels).b, Mean weight (%) for the same24 protocols used at panel a subjectedto random spike removal (sparsity %). c, Mean time spent (s) varyingjittering. Contour plot shows 2Post1Pre50 and 1Pre1Post10 (300 at 5Hz) with (grey contour plot) and with jittering (coloured contour plot).The circles and squares correspond to the marks in panel a. d, Meantime spent (s) varying sparsity. Contour plot in grey showing 0% sparsityfor 2Post1Pre50 300 at 5Hz (see Fig. 2f). The contour plots show theprotocol with spike removal sparsities at 0% (NC) 30% (LTP), and 80%(NC). The triangles correspond to the same marks in panel a. e, Distri-bution of the 50 ms jittering applied to the causal protocol 1Pre1Post10,300 at 5 Hz in which nearly half of the pairs turned into anticausal.The mean frequency is 5 ± 13.5 Hz. The protocol 2Post1Pre50 willhave nearly half of the pairings turning into causal, making them havea similar firing structure and position inside the LTP region. f, Meanweight change (%) combining both sparsity (panel b) and jittering (panela) for 2Post1Pre50, 300 at 5 Hz. g, Mean weight change (%) of pre andpostsynaptic Poisson spike train delivered simultaneously for 10 s. Theplot shows the plasticity outcome for different presynaptic firing rate(1000/frequency) for a fixed postsynaptic baseline at 10Hz. The upperraster plot depicts the released vesicles at 40 Hz and the postsynapticbaseline at 10Hz (including the AP evoked by EPSP). h), Mean weightchange (%) varying the rate of pre and postsynaptic Poisson spike traindelivered simultaneously for 10 s. The dashed line depicts panel g.
10/46
74CHAPTER 5. A STOCHASTICMODELOF HIPPOCAMPAL SYNAPTIC PLASTICITYWITHGEOMETRICAL READOUTOF ENZYMES - ARTICLE

spike trains for 10s, under9’s experimental conditions. We sys-tematically varied both the pre and postsynaptic rates (Fig. 7h).The 10s stimulation protocols induced only LTP, since LTD re-quires a prolonged stimulation21. LTP magnitude monotonicallyincreased with the presynaptic rate (Fig. 7g,h). In contrast, LTPmagnitude varied non-monotonically as function of postsynapticrate, initially increasing until a peak at 10 Hz, then decreasingwith higher stimulation frequencies. This non-monotonic depen-dence on post-synaptic rate is inconsistent with classic rate-basedmodels of Hebbian plasticity. We also investigated how this plas-ticity dependence on pre- and post-synaptic Poisson firing ratesvaries with developmental age (Fig. S2g–i). We found that at P5no plasticity is induced, at P15 a LTP region appears at around 1Hz postsynaptic rate, and at P20 plasticity becomes similar to themature age, with a peak in LTP magnitude at 10 Hz postsynapticrate.
DiscussionWe built a model of a rat CA3-CA1 hippocampal synapse, in-cluding key electrical and biochemical components underlyingsynaptic plasticity induction (Fig. 1). We used a novel geometricreadout of CaN-CaMKII dynamics (Fig. 2-4) to predict the out-comes from a range plasticity experiments with heterogeneousconditions: animal developmental age (Fig. 5), aCSF composi-tion (Fig. 6), temperature (Supplemental files), and in vivo-likefiring variability (Fig. 7).
Our model included critical components for plasticity in-duction at CA3-CA1 synapses: those affecting dendritic spinevoltage, calcium signalling, and enzymatic activation. We wereable to use model to make quantitative predictions, because itsvariables and parameters corresponded to biological components.This property allowed us to incorporate the model components’dependence on developmental age, external Ca/Mg levels, andtemperature to replicate datasets across a range of experimentalconditions. The model is relatively fast to simulate, taking ∼1minute of CPU time to run 1 minute of biological time. Thesepractical benefits should enable future studies to make experi-mental predictions on dendritic integration of multiple synapticinputs42,91,92 and on the effects of synaptic molecular alterationsin pathological conditions. In contrast, abstract models basedon spike timing28,93,94 or simplified calcium dynamics18,30 mustrely on ad hoc adjustment of parameters with less biologicalinterpretability.
The model was built based the new concept that the full tem-poral activity of CaN-CaMKII over the stimulus duration51, andnot their instantaneous activity levels18,19, is responsible for plas-ticity changes. We instantiated this concept by analyzing the jointCaN-CaMKII activity in the two-dimensional plane and design-ing polygonal plasticity readout regions (Fig. 3a). In doing so,we generalised previous work with plasticity induction based onsingle threshold and a slow variable26,28,30,95. Here, we used atwo-dimensional readout, but anticipate a straightforward gener-alisation to higher-dimensions for different cellular processes inneuroscience but also in systems biology more broadly. The cen-tral discovery is that these trajectories, despite being stochastic,can be separated in the plane as function of the stimulus (Fig. 3).This is the basis of our new synaptic plasticity rule.
Let us describe the intuition behind our model more concisely.
First, we abstracted away the sophisticated cascade of plasticityexpression. Second, the plasticity regions, crossed by the tra-jectories, are described with a minimal set of parameters, theirtuning is quite straightforward and done once and for all, evenwhen the joint activity is stochastic. The tuning of the model ispossible thanks to the decoupling of the plasticity process fromthe spine biophysics which acts as a feedforward input to theplasticity Markov chain and from the distributions of the differenttrajectories, which are well separated. It is expected that one canfind other model versions (parameters or conceptual) instantiatingour concept that also match the data well.
In our model, some CaMKII-CaN trajectories overshot theplasticity regions (e.g. Fig. 3d). Although abnormally high andprolonged calcium influx to cells can trigger cell death96, the ef-fects of high calcium concentrations at single synapses are poorlyunderstood. Notably, a few studies have reported evidence con-sistent with an overshoot, where strong synaptic calcium influxdoes not induce LTP20,24,97.
Intrinsic noise is an essential component of the model. Howcan the synapse reliably express plasticity but be noisy at thesame time43,44? Noise can be reduced either by redundancy or byaveraging across time, also called ergodicity98. However redun-dancy requires manufacturing and maintaining more components,and therefore costs energy. We propose that, instead, plasticityinduction is robust due to temporal averaging by slow-timescalesignalling and adaptation processes. These slow variables reducenoise by averaging the faster timescale stochastic variables. Thismay be a reason why CaMKII uses auto-phosphorylation to sus-tain its activity and slow its decay time54,99. In summary, thissuggests that the temporal averaging by slow variables, combinedwith the separability afforded by the multidimensional readout, al-lows synapses to tolerate noise while remaining energy-efficient.
We identified some limitations of the model. First, wemodelled only a single postsynaptic spine attached to two-compartment neuron for soma and dendrite. Second, the modelabstracted the complicated process of synaptic plasticity expres-sion, and even if this replicated the “early” phase of LTP/LTDexpression in the first 30–60 minutes after induction, slowerprotein-synthesis-dependent processes, maintenance processes,and synaptic pruning proceed at later timescales100. Third, likemost biophysical models, ours contained many parameters (Meth-ods). Although we set these to physiologically plausible valuesand then tuned to match the plasticity data, other combinationsof parameters may fit the data equally well101,102 due to the ubiq-uitous phenomenon of redundancy in biochemical and neuralsystems103,104. Indeed synapses are quite heterogeneous in re-ceptor and ion channel counts58–60,105, protein abundances106,107,and spine morphologies65,108, even within the subpopulation ofCA1 pyramidal neuron synapses that we modelled here. It re-mains to be discovered how neurons tune their synaptic propertiesin this vast parameter space to achieve functional plasticity rules,or implement meta-plasticity109–111.
Several predictions follow from our results. Since themodel respected the stochasticity of vesicle release112,113,NMDAr60,74,75,114, and VGCC opening59,115,116, the magnitudeof plasticity varied from simulation trial to trial (Methods,Fig. 3g,4e). This suggests that the rules of plasticity are in-herently stochastic63,117 and that the variability observed inexperiments9,21,24,33,34,38,40 is not just due to heterogeneity in
11/46
5.3. ARTICLE 75

synapse properties. By running extensive simulations over thespace of protocols beyond those tested experimentally (Fig. 3h,i;4f; 5c,e and f; 6e,f), we made testable predictions for plasticityoutcomes. For example,24 did not find LTD when using classicpost-before-pre stimulation protocols, but the model predictedthat LTD could be induced if the number of pairing repetitionswas extended (Fig. h,i). The model also predicts that the lack ofLTD induced by FDP in adults can be recovered using doubletsor quadruplet spike protocols (Fig. 5d). We tested the model’ssensitivity to spike time jitter and spike failure in the stimulationprotocols (Fig. 7). Our simulations predicted that this firingvariability can alter the rules of plasticity, in the sense that itis possible to add noise to cause LTP for protocols that did nototherwise induce plasticity.
What do these results imply about the rules of plasticityin vivo? First, we noticed that successful LTP or LTD induc-tion required a balance between two types of slow variables:those that attenuate, such as presynaptic vesicle pools and den-dritic BaP, versus those that accumulate, such as slow enzymaticintegration62,118,119. This balance is reflected in the inverted-Ushaped magnitude of LTP seen as a function of post-synapticfiring rate (Fig. 7h). Second, although spike timing on millisec-ond timescales can in certain circumstances affect the directionand magnitude of plasticity (Fig. 3), in order to drive sufficientactivity of synaptic enzymes, these patterns would need to berepeated for several seconds. However, if these repetitions aresubject to jitter or failures, as observed in hippocampal spiketrains in vivo82,120, then the millisecond-timescale informationwill be destroyed as it gets averaged out across repetitions by theslow integration processes of CaMKII and CaN (Fig. 7a–d). Thenet implication is that millisecond-timescale structure of individ-ual spike pairs is unlikely to play an important role in determininghippocampal synaptic plasticity in vivo83,88,121.
In summary, we presented a new type of biophysical model forplasticity induction at the rat CA3-CA1 glutamatergic synapse.Although the model itself is specific to this synapse type, thestudy’s insights may generalise to other synapse types, enabling adeeper understanding of the rules of synaptic plasticity and brainlearning.
Data and Software AvailabilityThe code will be available on Github after peer-review process.
AcknowledgmentsThis work has been partially supported by the French govern-ment, through the UCAJEDI Investments in the Future projectmanaged by the National Research Agency (ANR-15-IDEX-01),see ComputaBrain project. Funding was also provided by theUK Medical Research Council (MR/S026630/1) and from theEuropean Union’s Horizon 2020 Framework Programme for Re-search and Innovation under the Specific Grant Agreement No.945539 (Human Brain Project SGA3). We thank Kim A. Black-well, Serena M. Dudek, Matthew G. Gold, Jack R. Mellor, L.Mironov, Matthew C. Pharris, Gabriela K. Popescu and Gayle M.Wittenberg for advice and discussions.
Author ContributionsConceptualization Y.E.R., C.O. and R.V ; Performed simulationsY,E.R; Designed the figures Y.E.R.; Original draft Y.E.R. andC.O.; Mathematical formalization Y.E.R. and R.V.; Writing, Re-view Editing Y.R., C.O., R.V. and H.M. ; Coding Y.E.R., C.O.and R.V.; Software R.V. ; Supervision R.V., C.O. and H.M. ;Funding H.M., C.O. ; Biological consulting C.O. and H.M. In-vestigation Y.E.R. and C.O. ; Project Management R.V. and H.M..
Competing interestsThe authors declare no competing interests.
Additional InformationSupplementary information is available for this paper at httpCorrespondence and requests should be addressed to R.M. andY.E.R.
References1. Hebb, D. O. The organization of behavior: a neuropsycho-
logical theory (1949).
2. Blum, K. I. & Abbott, L. F. A model of spatial map forma-tion in the hippocampus of the rat. Neural computation 8,85–93 (1996).
3. Gerstner, W., Kempter, R., Van Hemmen, J. L. & Wagner,H. A neuronal learning rule for sub-millisecond temporalcoding. Nature 383, 76–78 (1996).
4. Eurich, C. W., Pawelzik, K., Ernst, U., Cowan, J. D. &Milton, J. G. Dynamics of self-organized delay adaptation.Physical Review Letters 82, 1594 (1999).
5. Debanne, D., Guerineau, N. C., Gähwiler, B. & Thompson,S. M. Paired-pulse facilitation and depression at unitarysynapses in rat hippocampus: quantal fluctuation affectssubsequent release. The Journal of physiology 491, 163–176 (1996).
6. Tsodyks, M. V. & Markram, H. The neuralcode between neocortical pyramidal neurons de-pends on neurotransmitter release probability.Proceedings of the national academy of sciences 94, 719–723 (1997).
7. Bi, G.-q. & Poo, M.-m. Synaptic modifications incultured hippocampal neurons: dependence on spiketiming, synaptic strength, and postsynaptic cell type.Journal of neuroscience 18, 10464–10472 (1998).
8. Markram, H., Gerstner, W. & Sjöström, P. J.A history of spike-timing-dependent plasticity.Frontiers in synaptic neuroscience 3, 4 (2011).
9. Dudek, S. & Bear, M. Homosynaptic long-termdepression in area CA1 of hippocampus and ef-fects of N-methyl-D-aspartate receptor blockade.Proceedings of the National Academy of Sciences 89,4363 (1992).
10. Sjöström, P. J., Turrigiano, G. G. & Nelson, S. B. Rate, tim-ing, and cooperativity jointly determine cortical synapticplasticity. Neuron 32, 1149–1164 (2001).
12/46
76CHAPTER 5. A STOCHASTICMODELOF HIPPOCAMPAL SYNAPTIC PLASTICITYWITHGEOMETRICAL READOUTOF ENZYMES - ARTICLE

11. Artola, A., Bröcher, S & Singer, W. Different voltage-dependent thresholds for inducing long-term depressionand long-term potentiation in slices of rat visual cortex.Nature 347, 69–72 (1990).
12. Magee, J. C. & Johnston, D. A synaptically controlled,associative signal for Hebbian plasticity in hippocampalneurons. Science 275, 209–213 (1997).
13. Sjöström, P. J. & Häusser, M. A cooperative switch de-termines the sign of synaptic plasticity in distal dendritesof neocortical pyramidal neurons. Neuron 51, 227–238(2006).
14. Golding, N. L., Staff, N. P. & Spruston, N. Dendritic spikesas a mechanism for cooperative long-term potentiation.Nature 418, 326–331 (2002).
15. Hardie, J. & Spruston, N. Synaptic depolarization is moreeffective than back-propagating action potentials during in-duction of associative long-term potentiation in hippocam-pal pyramidal neurons. Journal of Neuroscience 29, 3233–3241 (2009).
16. Shouval, H. Z., Wang, S. S.-H. & Wittenberg,G. M. Spike timing dependent plasticity: a con-sequence of more fundamental learning rules.Frontiers in computational neuroscience 4, 19 (2010).
17. Lisman, J. A mechanism for the Hebb and the anti-Hebb processes underlying learning and memory.Proceedings of the National Academy of Sciences 86,9574–9578 (1989).
18. Shouval, H. Z., Bear, M. F. & Cooper, L. N. A unifiedmodel of NMDA receptor-dependent bidirectional synap-tic plasticity. PNAS 99, 10831–10836 (2002).
19. Karmarkar, U. R. & Buonomano, D. V. A model of spike-timing dependent plasticity: one or two coincidence detec-tors? Journal of neurophysiology 88, 507–513 (2002).
20. Yang, S.-N., Tang, Y.-G. & Zucker, R. S. Selective induc-tion of LTP and LTD by postsynaptic [Ca2+] i elevation.Journal of neurophysiology 81, 781–787 (1999).
21. Mizuno, T., Kanazawa, I. & Sakurai, M. Differential induc-tion of LTP and LTD is not determined solely by instanta-neous calcium concentration: an essential involvement ofa temporal factor. European Journal of Neuroscience 14,701–708 (2001).
22. Wang, H.-X., Gerkin, R. C., Nauen, D. W. & Bi, G.-Q.Coactivation and timing-dependent integration of synapticpotentiation and depression. Nature neuroscience 8, 187–193 (2005).
23. Nevian, T. & Sakmann, B. Spine Ca2+ signaling in spike-timing-dependent plasticity. Journal of Neuroscience 26,11001–11013 (2006).
24. Tigaret, C. M., Olivo, V., Sadowski, J. H., Ashby, M. C.& Mellor, J. R. Coordinated activation of distinct Ca 2+sources and metabotropic glutamate receptors encodesHebbian synaptic plasticity. Nature communications 7,10289 (2016).
25. Abarbanel, H. D., Gibb, L., Huerta, R. & Rabinovich,M. I. Biophysical model of synaptic plasticity dynamics.Biological cybernetics 89, 214–226 (2003).
26. Rubin, J. E., Gerkin, R. C., Bi, G.-Q. & Chow, C. C. Cal-cium time course as a signal for spike-timing dependentplasticity. Journal of neurophysiology (2005).
27. Rackham, O., Tsaneva-Atanasova, K., Ganesh, A. &Mellor, J. A Ca2+-based computational model forNMDA receptor-dependent synaptic plasticity at in-dividual post-synaptic spines in the hippocampus.Frontiers in synaptic neuroscience 2, 31 (2010).
28. Clopath, C. & Gerstner, W. Voltage andspike timing interact in STDP–a unified model.Frontiers in synaptic neuroscience 2, 25 (2010).
29. Kumar, A. & Mehta, M. R. Frequency-dependentchanges in NMDAR-dependent synaptic plasticity.Frontiers in computational neuroscience 5, 38 (2011).
30. Graupner, M. & Brunel, N. Calcium-based plastic-ity model explains sensitivity of synaptic changesto spike pattern, rate, and dendritic location.Proceedings of the National Academy of Sciences 109,3991–3996 (2012).
31. Standage, D., Trappenberg, T. & Blohm, G. Calcium-dependent calcium decay explains STDP in a dynamicmodel of hippocampal synapses. PloS one 9, e86248(2014).
32. De Pittà, M. & Brunel, N. Modulation of synaptic plastic-ity by glutamatergic gliotransmission: A modeling study.Neural plasticity (2016).
33. Dudek, S. M. & Bear, M. F. Bidirectional long-term mod-ification of synaptic effectiveness in the adult and im-mature hippocampus. Journal of Neuroscience 13, 2910–2918 (1993).
34. Meredith, R. M., Floyer-Lea, A. M. & Paulsen, O.Maturation of long-term potentiation induction rulesin rodent hippocampus: role of GABAergic inhibition.Journal of Neuroscience 23, 11142–11146 (2003).
35. Cao, G. & Harris, K. M. Developmental regulationof the late phase of long-term potentiation (L-LTP)and metaplasticity in hippocampal area CA1 of the rat.Journal of neurophysiology 107, 902–912 (2012).
36. Cizeron, M. et al. A brain-wide atlas of synapses acrossthe mouse lifespan. Science (2020).
37. Mulkey, R. M. & Malenka, R. C. Mechanisms underlyinginduction of homosynaptic long-term depression in areaCA1 of the hippocampus. Neuron 9, 967–975 (1992).
38. Inglebert, Y., Aljadeff, J., Brunel, N. & Debanne, D.Synaptic plasticity rules with physiological calcium levels.Proceedings of the National Academy of Sciences. ISSN:0027-8424 (2020).
39. Volgushev, M. et al. Probability of transmitter re-lease at neocortical synapses at different temperatures.Journal of neurophysiology 92, 212–220 (2004).
13/46
5.3. ARTICLE 77

40. Wittenberg, G. M. & Wang, S. S.-H. Malleability of spike-timing-dependent plasticity at the CA3–CA1 synapse.Journal of Neuroscience 26, 6610–6617 (2006).
41. Klyachko, V. A. & Stevens, C. F. Temperature-dependentshift of balance among the components of short-term plas-ticity in hippocampal synapses. Journal of Neuroscience26, 6945–6957 (2006).
42. Blackwell, K. T. et al. Molecular mechanismsunderlying striatal synaptic plasticity: relevanceto chronic alcohol consumption and seeking.European Journal of Neuroscience 49, 768–783 (2019).
43. Yuste, R., Majewska, A., Cash, S. S. & Denk,W. Mechanisms of calcium influx into hippocampalspines: heterogeneity among spines, coincidence detec-tion by NMDA receptors, and optical quantal analysis.Journal of Neuroscience 19, 1976–1987 (1999).
44. Ribrault, C., Sekimoto, K. & Triller, A. From the stochas-ticity of molecular processes to the variability of synap-tic transmission. Nature Reviews Neuroscience 12, 375(2011).
45. Sterratt, D., Graham, B., Gillies, A. & Willshaw, D.Principles of computational modelling in neuroscience(Cambridge University Press, 2011).
46. Buchanan, K. A. & Mellor, J. R. The development ofsynaptic plasticity induction rules and the requirementfor postsynaptic spikes in rat hippocampal CA1 pyra-midal neurones. The Journal of Physiology 585, 429–445(2007).
47. Golding, N. L., Kath, W. L. & Spruston, N. Dichotomy ofaction-potential backpropagation in CA1 pyramidal neu-ron dendrites. Journal of neurophysiology 86, 2998–3010(2001).
48. Destexhe, A., Mainen, Z. F. & Sejnowski,T. J. Kinetic models of synaptic transmission.Methods in neuronal modeling 2, 1–25 (1998).
49. Adelman, J. P., Maylie, J. & Sah, P. Small-conductanceCa2+-activated K+ channels: form and function.Annual review of physiology 74, 245–269 (2012).
50. Griffith, T., Tsaneva-Atanasova, K. & Mellor, J. R. Con-trol of Ca2+ influx and calmodulin activation by SK-channels in dendritic spines. PLoS computational biology12 (2016).
51. Fujii, H. et al. Nonlinear decoding and asymmetric repre-sentation of neuronal input information by CaMKIIα andcalcineurin. Cell reports 3, 978–987 (2013).
52. Saraf, J. et al. A friend or foe: calcineurin across the gamutof neurological disorders. ACS central science 4, 805–819(2018).
53. Giese, K. P., Fedorov, N. B., Filipkowski, R. K. & Silva,A. J. Autophosphorylation at Thr286 of the α calcium-calmodulin kinase II in LTP and learning. Science 279,870–873 (1998).
54. Chang, J.-Y. et al. CaMKII autophosphorylation is neces-sary for optimal integration of Ca2+ signals during LTP in-duction, but not maintenance. Neuron 94, 800–808 (2017).
55. O’Connor, D. H., Wittenberg, G. M. & Wang, S. S.-H. Dis-section of bidirectional synaptic plasticity into saturableunidirectional processes. Journal of neurophysiology 94,1565–1573 (2005).
56. Otmakhov, N., Regmi, S. & Lisman, J. E. Fast decay ofCaMKII FRET sensor signal in spines after LTP induc-tion is not due to its dephosphorylation. PLoS One 10,e0130457 (2015).
57. O’Donnell, C. & van Rossum, M. C. Systematic analysisof the contributions of stochastic voltage gated channels toneuronal noise. Frontiers in computational neuroscience8, 105 (2014).
58. Takumi, Y., Ramírez-León, V., Laake, P., Rinvik, E.& Ottersen, O. P. Different modes of expression ofAMPA and NMDA receptors in hippocampal synapses.Nature neuroscience 2, 618–624 (1999).
59. Sabatini, B. L. & Svoboda, K. Analysis of calcium chan-nels in single spines using optical fluctuation analysis.Nature 408, 589–593 (2000).
60. Nimchinsky, E. A., Yasuda, R., Oertner, T. G. & Svo-boda, K. The number of glutamate receptors openedby synaptic stimulation in single hippocampal spines.Journal of Neuroscience 24, 2054–2064 (2004).
61. Liu, G., Choi, S. & Tsien, R. W. Variability of neurotrans-mitter concentration and nonsaturation of postsynapticAMPA receptors at synapses in hippocampal cultures andslices. Neuron 22, 395–409 (1999).
62. Deperrois, N. & Graupner, M. Short-term depression andlong-term plasticity together tune sensitive range of synap-tic plasticity. PLoS computational biology 16, e1008265(2020).
63. Bhalla, U. S. Signaling in small subcellular volumes. II.Stochastic and diffusion effects on synaptic network prop-erties. Biophysical Journal 87, 745–753 (2004).
64. Antunes, G. & De Schutter, E. A stochastic signaling net-work mediates the probabilistic induction of cerebellarlong-term depression. Journal of Neuroscience 32, 9288–9300 (2012).
65. Bartol, T. M. et al. Computational reconstitution ofspine calcium transients from individual proteins.Frontiers in synaptic neuroscience 7, 17 (2015).
66. Colbert, C. M., Magee, J. C., Hoffman, D. A. & John-ston, D. Slow recovery from inactivation of Na+ channelsunderlies the activity-dependent attenuation of dendriticaction potentials in hippocampal CA1 pyramidal neurons.Journal of Neuroscience 17, 6512–6521 (1997).
67. Quintana, A. R., Wang, D., Forbes, J. E. & Waxham,M. N. Kinetics of calmodulin binding to calcineurin.Biochemical and biophysical research communications334, 674–680 (2005).
68. He, Y, Kulasiri, D & Samarasinghe, S. Modelling the dy-namics of CaMKII–NMDAR complex related to memoryformation in synapses: The possible roles of threonine 286autophosphorylation of CaMKII in long term potentiation.Journal of theoretical biology 365, 403–419 (2015).
14/46
78CHAPTER 5. A STOCHASTICMODELOF HIPPOCAMPAL SYNAPTIC PLASTICITYWITHGEOMETRICAL READOUTOF ENZYMES - ARTICLE

69. Wang, H. & Wagner, J. J. Priming-induced shiftin synaptic plasticity in the rat hippocampus.Journal of neurophysiology 82, 2024–2028 (1999).
70. Kealy, J. & Commins, S. Frequency-dependent changesin synaptic plasticity and brain-derived neurotrophic fac-tor (BDNF) expression in the CA1 to perirhinal cortexprojection. Brain research 1326, 51–61 (2010).
71. Abraham, W. C., Mason-Parker, S. E., Bear, M. F., Webb,S. & Tate, W. P. Heterosynaptic metaplasticity in the hip-pocampus in vivo: a BCM-like modifiable threshold forLTP. Proceedings of the National Academy of Sciences98, 10924–10929 (2001).
72. Bienenstock, E. L., Cooper, L. N. & Munro, P. W. The-ory for the development of neuron selectivity: orienta-tion specificity and binocular interaction in visual cortex.Journal of Neuroscience 2, 32–48 (1982).
73. Sheng, M., Cummings, J., Roldan, L. A., Jan, Y. N. &Jan, L. Y. Changing subunit composition of heteromericNMDA receptors during development of rat cortex. Nature368, 144–147 (1994).
74. Popescu, G., Robert, A., Howe, J. R. & Auerbach, A. Re-action mechanism determines NMDA receptor responseto repetitive stimulation. Nature 430, 790 (2004).
75. Iacobucci, G. J. & Popescu, G. K. NMDA receptors:linking physiological output to biophysical operation.Nature reviews Neuroscience 18, 236 (2017).
76. Rivera, C. et al. The K+/Cl- co-transporter KCC2 ren-ders GABA hyperpolarizing during neuronal maturation.Nature 397, 251–255 (1999).
77. Rinetti-Vargas, G., Phamluong, K., Ron, D. & Bender,K. J. Periadolescent maturation of GABAergic hyperpolar-ization at the axon initial segment. Cell reports 20, 21–29(2017).
78. Isaac, J. T., Buchanan, K. A., Muller, R. U. & Mellor, J. R.Hippocampal place cell firing patterns can induce long-term synaptic plasticity in vitro. Journal of Neuroscience29, 6840–6850 (2009).
79. Maki, B. A. & Popescu, G. K. Extracellular Ca2+ions reduce NMDA receptor conductance and gating.Journal of General Physiology 144, 379–392 (2014).
80. Jahr, C. E. & Stevens, C. F. A quantitative de-scription of NMDA receptor-channel kinetic behavior.Journal of Neuroscience 10, 1830–1837 (1990).
81. Ngo-Anh, T. J. et al. SK channels and NMDA receptorsform a Ca 2+-mediated feedback loop in dendritic spines.Nature neuroscience 8, 642–649 (2005).
82. Fenton, A. A. & Muller, R. U. Place celldischarge is extremely variable during individ-ual passes of the rat through the firing field.Proceedings of the National Academy of Sciences 95,3182–3187 (1998).
83. Graupner, M., Wallisch, P. & Ostojic, S. Natural firing pat-terns imply low sensitivity of synaptic plasticity to spiketiming compared with firing rate. Journal of Neuroscience36, 11238–11258 (2016).
84. Bittner, K. C., Milstein, A. D., Grienberger, C., Romani,S. & Magee, J. C. Behavioral time scale synaptic plastic-ity underlies CA1 place fields. Science 357, 1033–1036(2017).
85. Cui, Y., Prokin, I., Mendes, A., Berry, H. & Ve-nance, L. Robustness of STDP to spike timing jitter.Scientific reports 8, 1–15 (2018).
86. Dobrunz, L. E., Huang, E. P. & Stevens, C. F.Very short-term plasticity in hippocampal synapses.Proceedings of the National Academy of Sciences 94,14843–14847 (1997).
87. Enoki, R., Hu, Y.-l., Hamilton, D. & Fine, A. Expression oflong-term plasticity at individual synapses in hippocampusis graded, bidirectional, and mainly presynaptic: opticalquantal analysis. Neuron 62, 242–253 (2009).
88. Froemke, R. C. & Dan, Y. Spike-timing-dependent synap-tic modification induced by natural spike trains. Nature416, 433 (2002).
89. Borst, J. G. G. The low synaptic release probability in vivo.Trends in neurosciences 33, 259–266 (2010).
90. Short, S. M. et al. The stochastic nature of ac-tion potential backpropagation in apical tuft dendrites.Journal of neurophysiology 118, 1394–1414 (2017).
91. Oliveira, R. F., Kim, M. & Blackwell, K. T. Subcellular lo-cation of PKA controls striatal plasticity: stochastic simu-lations in spiny dendrites. PLoS Comput Biol 8, e1002383(2012).
92. Ebner, C., Clopath, C., Jedlicka, P. & Cuntz, H. Unify-ing Long-Term Plasticity Rules for Excitatory Synapsesby Modeling Dendrites of Cortical Pyramidal Neurons.Cell Reports 29, 4295–4307 (2019).
93. Song, S., Miller, K. D. & Abbott, L. F. Competitive Heb-bian learning through spike-timing-dependent synapticplasticity. Nature neuroscience 3, 919–926 (2000).
94. Pfister, J.-P. & Gerstner, W. Triplets of spikesin a model of spike timing-dependent plasticity.Journal of Neuroscience 26, 9673–9682 (2006).
95. Badoual, M. et al. Biophysical and phenomenologicalmodels of multiple spike interactions in spike-timing de-pendent plasticity. International journal of neural systems16, 79–97 (2006).
96. Zhivotovsky, B. & Orrenius, S. Calcium and cell deathmechanisms: a perspective from the cell death community.Cell calcium 50, 211–221 (2011).
97. Pousinha, P. A. et al. Physiological and pathophysiologi-cal control of synaptic GluN2B-NMDA receptors by theC-terminal domain of amyloid precursor protein. Elife 6,e25659 (2017).
98. Sterling, P. & Laughlin, S. Principles of neural design(MIT Press, 2015).
99. Chang, J.-Y., Nakahata, Y., Hayano, Y. & Yasuda, R. Mech-anisms of Ca 2+/calmodulin-dependent kinase II activa-tion in single dendritic spines. Nature Communications10, 2784 (2019).
15/46
5.3. ARTICLE 79

100. Bailey, C. H., Kandel, E. R. & Harris, K. M. Struc-tural components of synaptic plasticity and memory con-solidation. Cold Spring Harbor perspectives in biology 7,a021758 (2015).
101. Marder, E. & Taylor, A. L. Multiple models to cap-ture the variability in biological neurons and networks.Nature neuroscience 14, 133–138 (2011).
102. Mäki-Marttunen, T., Iannella, N., Edwards, A. G.,Einevoll, G. & Blackwell, K. T. A unified computationalmodel for cortical post-synaptic plasticity. eLife (2020).
103. Gutenkunst, R. N. et al. Universally sloppy parameter sen-sitivities in systems biology models. PLoS Comput Biol3, e189 (2007).
104. Marder, E. Variability, compensation, and modulation inneurons and circuits. PNAS 108, 15542–15548 (2011).
105. Racca, C., Stephenson, F. A., Streit, P., Roberts, J. D. B.& Somogyi, P. NMDA receptor content of synapsesin stratum radiatum of the hippocampal CA1 area.Journal of Neuroscience 20, 2512–2522 (2000).
106. Shepherd, G. M. & Harris, K. M. Three-dimensional struc-ture and composition of CA3→ CA1 axons in rat hip-pocampal slices: implications for presynaptic connectiv-ity and compartmentalization. Journal of Neuroscience 18,8300–8310 (1998).
107. Sugiyama, Y., Kawabata, I., Sobue, K. & Okabe, S. Deter-mination of absolute protein numbers in single synapsesby a GFP-based calibration technique. Nature methods 2,677–684 (2005).
108. Harris, K. M. & Stevens, J. K. Dendritic spines of CA 1pyramidal cells in the rat hippocampus: serial electron mi-croscopy with reference to their biophysical characteristics.Journal of Neuroscience 9, 2982–2997 (1989).
109. Huang, Y.-Y., Colino, A., Selig, D. K. & Malenka, R. C.The influence of prior synaptic activity on the induction oflong-term potentiation. Science 255, 730–733 (1992).
110. Deisseroth, K, Bito, H, Schulman, H & Tsien, R. Synap-tic plasticity: a molecular mechanism for metaplasticity.Current Biology 5, 1334–1338 (1995).
111. Abraham, W. C. Metaplasticity: tuning synapses and net-works for plasticity. Nature Reviews Neuroscience 9, 387–387 (2008).
112. Rizzoli, S. O. & Betz, W. J. Synaptic vesicle pools.Nature Reviews Neuroscience 6, 57–69 (2005).
113. Alabi, A. A. & Tsien, R. W. Synaptic vesicle pools anddynamics. Cold Spring Harbor perspectives in biology 4,a013680 (2012).
114. Sinclair, D. et al. Effects of sex and DTNBP1 (dys-bindin) null gene mutation on the developmental GluN2B-GluN2A switch in the mouse cortex and hippocampus.Journal of neurodevelopmental disorders 8, 14 (2016).
115. Magee, J. C. & Johnston, D. Characterization of singlevoltage-gated Na+ and Ca2+ channels in apical dendritesof rat CA1 pyramidal neurons. The Journal of physiology487, 67–90 (1995).
116. Iftinca, M et al. Temperature dependence of T-typecalcium channel gating. Neuroscience 142, 1031–1042(2006).
117. Antunes, G, Roque, A. & Simoes-de Souza, F. Stochasticinduction of long-term potentiation and long-term depres-sion. Scientific reports 6, 30899 (2016).
118. Cai, Y., Gavornik, J. P., Cooper, L. N., Yeung, L. C. &Shouval, H. Z. Effect of stochastic synaptic and den-dritic dynamics on synaptic plasticity in visual cortexand hippocampus. Journal of neurophysiology 97, 375–386 (2007).
119. Mizusaki, B. E., Li, S. S., Costa, R. P. & Sjöström, P. J. Pre-and postsynaptically expressed spiking-timing-dependentplasticity contribute differentially to neuronal learning.BioRxiv, 450825 (2018).
120. Wierzynski, C. M., Lubenov, E. V., Gu, M. & Siapas, A. G.State-dependent spike-timing relationships between hip-pocampal and prefrontal circuits during sleep. Neuron 61,587–596 (2009).
121. Sadowski, J. H., Jones, M. W. & Mellor, J. R. Sharp-waveripples orchestrate the induction of synaptic plasticity dur-ing reactivation of place cell firing patterns in the hip-pocampus. Cell reports 14, 1916–1929 (2016).
16/46
80CHAPTER 5. A STOCHASTICMODELOF HIPPOCAMPAL SYNAPTIC PLASTICITYWITHGEOMETRICAL READOUTOF ENZYMES - ARTICLE

Online MethodsData and code availabilityAll simulations were performed in the Julia programming language (version 1.4.2). Simulating the synapse model is equivalent tosampling a piecewise deterministic Markov process, and this relies on the Julia package PiecewiseDeterministicMarkovProcesses.jl.These simulations are event-based, and no approximation is made beyond the ones required to integrate the ordinary differentialequations by the method LSODA (Livermore Solver for Ordinary Differential Equations). We run the parallel simulations in the Nefcluster operated by Inria.
EXPERIMENT PAPER REPETITIONS FREQ (Hz) AGE (DAYS) TEMP. (°C) Ca (mM) Mg (mM)STDP 1 300 5 56 35 2.5 1.3
STDP 2 100, positive delays150, negative delays 0.3
14—20(21 for LTP)
30(30.45 for LTP) 1.3—3 Ca/1.5
STDP 3 20 0.2 9—45 24—28 2 2
STDP 4 70—100 5 14—2124—30(22.5-23) 2 1
pre-burst 1 300 and 900 3 and 5 56 35 2.5 1.3FDP 5 900 1—50 35 35 2.5 1.5FDP 6 900 1 7—35 35 2.5 1.5
TBS 6 3—4 (5) epochs4Pre at 100 Hz(10x at 5Hz) 6, 14 and 17 35 2.5 1.5
LFS 7 1—600 1 12—2830(26.5-31) 2.4 0
Table M1. Table with the parameters extracted from the respective publications. To fit the data associated to publications displaying a parameterinterval (e.g. 70 or 100) we used a value within the provided limits. Otherwise, we depict in red the value used to fit to the data. For completedata structure on these publications and the ones used for method validation see github code. We allowed the AP to be evoked by EPSPs for theseprotocols:5–7. Note that1 used GABA(A)r blocker modelled by turning GABAr conductance to zero. Also,7 LTD protocol used partial NMDAblocker modelled by reducing NMDA conductance by 97 %.
Modelling proceduresNotationsWe write 1A the indicator of a set A meaning that 1A(x) = 1 if x belongs to A and zero otherwise.
Vesicle release and recyclingVesicle-filled neurotransmitters from the presynaptic terminals stimulate the postsynaptic side when successfully released. We deriveda vesicle release Markov chain model based on a deterministic approach described in8 on page 183. We denote by (t1, · · · , tn) the timearrivals of the presynaptic spikes.
Vesicles can be in two states, either belonging to the docked pool (with cardinal D) with fast emptying, or to the reserve pool(with cardinal R) which replenishes D9. The docked pool loses one vesicle each time a release10 occurs with transition D−→ D−1(Fig. M1C). The reserve pool replenishes the docked one with transition (R,D)→ (R− 1,D+ 1). Finally, the reserve pool isreplenished with rate (R0−R)/τre f
D with the transition (R,D)−→ (R+1,D).
TRANSITION RATE INITIAL CONDITION(R,D)→ (R−1,D+1) (D0−D) ·R/τD D(0) = D0(R,D)→ (R+1,D−1) (R0−R) ·D/τR R(0) = R0
(R,D)−→ (R+1,D) (R0−R)/τre fR
Table M2. Stochastic transitions used in the pool dynamics. Note that the rates depend on the pool’s cardinal11.
In addition to the stochastic dynamics in Table M2, each spike ti triggers a vesicle release D−→ D−1 with probability prel :
prel(Capre, [Ca2+]o,D) =(Capre)
s
(Capre)s +h([Ca2+]o)
s 1D>0, h([Ca2+]o) = 0.654+1.349
1+ e4·([Ca2+]o−1.708 mM)
which is a function of presynaptic calcium Capre and extracellular calcium concentration [Ca2+]o through the threshold h([Ca2+]o).To decide whether a vesicle is released for a presynaptic spike ti, we use a phenomenological model of Capre (see Fig. M1A) based on
17/46
5.4. ARTICLE METHODS 81

a resource-use function12:
Capre =−Capreτpre
Capre(0) = 0
Ca jump =1−Ca jump
τrec−δdecay ·Ca jump ·Capre Ca jump(0) = 1.
(1)
Upon arrival of the presynaptic spikes, t ∈ (t1, · · · , tn), we update Capre according to the deterministic jump:
Capre −→Capre +Ca jump.
Finally, after Capre has been updated, a vesicle is released with probability prel (Fig. M1B).Parameters for the vesicle release model is given in Table M3. The experimental constraints to devise a release probability model
are given by13 and1. Because [Ca2+]o modifies the release probability dynamics14, we fixed an initial release probability of 68 %for [Ca2+]o = 2.5 mM as reported by1 (initial value in Fig. M1B and D). Additionally,13 report a 38% reduction in the initial releaseprobability when changing [Ca2+]o from 2.5 mM to 1 mM. Taking these into account, the decreasing sigmoid function in the Fig. M1Edepicts our [Ca2+]o-dependent release probability model (prel).
Fig. M1E shows that our prel function is in good agreement with a previous analytical model14 suggesting that prel([Ca2+]o) ∝([Ca2+]o)
2 mM−2. Our model also qualitatively reproduces the vanishing of calcium dye fluorescence levels after 20 s of theta trainsfrom1 (in their Supplementary Materials). We interpret their fluorescence measurements as an effect of short-term depression (seeFig. M1B).
Despite our model agreeing with previous works, it is a simplified presynaptic model that does not encompass the vesicle release’shighly heterogeneous nature. Vesicle release dynamics are known to be sensitivity to various experimental conditions such astemperature15, the age for some brain regions10 or magnesium concentration13. Furthermore, since our model of vesicle dynamics issimple, τrec in Equation (1) has two roles: to delay the prel recovery caused by Capre inactivation (enforced by δCa in Equation (1))and to prevent vesicle release after HFS induced depression9,14. Later, we incorporate a higher number of experimental parameters(age, temperature, [Ca2+]o, [Mg2+]o) with our NMDAr model, the main postsynaptic calcium source.
NAME VALUE REFERENCEVesicle release model (stochastic part)initial number of vesicles at D D0 = 25 5 to 209,16
initial number of vesicles at R R0 = 30 17 to 20 vesicles16
time constant R→ D(D recycling) τD = 5 s 1 s9
time constant D→ R(R mixing) τR = 45 s
20 s (when depleted) to 5 min (hypertonic shock)9,11
time constant 1→ R(R recycling) τre f
R = 40 s 20 to 30 s9
release probability half-activation curve h adjusted to different [Ca2+]orelease probability sigmoid slope s = 2 adjusted to different [Ca2+]o
Vesicle release model (deterministic part)
Capre attenuation recovery τpre = 20 ms 50 - 500 ms for with dye17
therefore < 50 to 500 ms undyed (unbufered)deterministic jump attenuation recovery τrec = 20 s ∼ 20 s9
deterministic jump attenuation fraction δca = .0004 inactivation of pre calcium18
Table M3. | Parameter values used in the presynaptic model. Our model does not implement a larger pool called "resting pool" containing∼ 180 vesicles (CA3-CA1 hippocampus)16. Terminology note: In other works, the larger pool with ∼180 vesicles can be found with differentnomenclatures such as "reserve pool"19 or "resting pool"16. Furthemore, the nomenclature used in our model for the reserve pool, can also be foundas "recycling pool" in9,16.
18/46
82CHAPTER 5. A STOCHASTICMODELOF HIPPOCAMPAL SYNAPTIC PLASTICITYWITHGEOMETRICAL READOUTOF ENZYMES - ARTICLE

Fig. M1. | Presynaptic release. a, Presynaptic calcium in response to the protocol 1Pre, 300 at 5 Hz displaying adaptation. b, Release probability forthe same protocol as panel A but subjected to the docked vesicles availability. c, Number of vesicles in the docked and reserve pools under depletioncaused by the stimulation from panel A. d, Plot of the mean (300 samples) release probability (%) for different frequencies for the protocol 1Pre300 pulses at [Ca2+]o = 2.5 mM. Note that most of the frequencies are dominated by short-term depression, and the model also displays short-termfacilitation (black curve, at 50 Hz). e, Release probability (%) for a single presynaptic spike given the [Ca2+]o. Note that14 model was multiplied bythe experimentally measured release probability at [Ca2+]o = 2 mM since their model has this calcium concentration as the baseline. Our model alsodoes not cover the abolishing of release probability at [Ca2+]o = 0.5 mM which can also be difficult to experimentally measure given the rarity ofevents13.
19/46
5.4. ARTICLE METHODS 83

NAME VALUE REFERENCEPassive cableleak reversal potential Eleak =−70 mV 69mV from20
membrane leak conductance(for spine and passive dendrite) gleak = 4 ·10−6 nS/µm2 * see table legend21
membrane leak conductance(only soma) gsoma = 5.31 ·10−3 nS/µm2 3 ·10−4 to 1.3 ·10−3nS/µm222
47 to 2.1 ·103nS (NeuroElectro:CA1)
membrane capacitance Cm = 6 ·10−3 pF/µm2 1 ·10−2 pF/µm223
17 to 177 pF (NeuroElectro:CA1)axial resistivity of cytoplasm Ra = 1 ·10−2 GΩµm 2 ·10−3 GΩµm24
Dendritedendrite diameter Ddend = 2 µm same as25
dendrite length Ldend = 1400 µm apical dendrites, 1200 to 1600 µm26
dendrite surface area Adend = 8.79 ·103 µm2 π ·Ddend ·Ldenddendrite volume Voldend = 4.4 ·103µm3 π · (Ddend/2)2 ·Ldenddendritic membrane capacitance Cdend = 52.77 pF Cm ·Adenddendrite leak reversal potential gleakdend = 3.51 ·10−2 nS gleak ·Adenddendrite axial conductance gdi f f = 50 nS Ra ·Adend
Somasoma diameter Dsoma = 30 µm 21 µm27 page 3soma area (sphere) Asoma = 2.82 ·103 µm2 (4π/3) · (Dsoma/2)3 ; 2.12 ·103 µm228
soma membrane capacitance Csoma = 16.96 pF Cm ·Asoma
soma leaking conductance gleaksoma = 15 nS gsoma ·Asoma22
Dendritic spinespine head volume Volsp = 0.03 µm3 same as29
spine head surface Asp = 4.66 ·10−1 µm2 4π · (3Volsp/4π)2/3
spine membrane capacitance Csp = 2.8 ·10−3 pF Cm ·Asp
spine head leak conductance gleaksp = 1.86 ·10−6 nS gleak ·Asp
Dendritic spine neckspine neck diameter Dneck = 0.1 µm 0.05 to 0.6 µm30
neck length Lneck = 0.2 µm 0.7±0.6 µm31
neck cross sectional area CSneck = 7.85 ·10−3 µm2 π · (Dneck/2)2
neck resistance gneck = 3.92 nS≈ 255.1 MΩ CSneck/(Lneck ·Ra)50 to 550 MΩ (275±27 MΩ)32
Table M4. Parameters for the neuron electrical properties. * The membrane leak conductance in the spine is small since the spine resistance is sohigh that is considered infinite (> 106MΩ)21, therefore the current mostly leaks through the neck. Additionally, the dendrite leak conductance isequally small in order to control the distance-dependent attenuation by the axial resistance term gadapt
BaP in Equations 3 and 4.
20/46
84CHAPTER 5. A STOCHASTICMODELOF HIPPOCAMPAL SYNAPTIC PLASTICITYWITHGEOMETRICAL READOUTOF ENZYMES - ARTICLE

Membrane potential and currentsOur model is built over three compartments, a spherical dendritic spine linked by the neck to a cylindrical dendrite connected to aspherical soma. The membrane potential of these compartments satisfy the equations below (parameters in Table M4). The differentcurrents are described in the following sections.
Csp ·Vsp = gneck · (Vdend−Vsp)+gspL · (Erev−Vsp)+ IT + IL + IR + INMDA + IAMPA + ISK (2)
Cdend ·Vdend = gadaptBaP · (Vsoma−Vdend)+gneck · (Vsp−Vdend)+gdend
L · (Erev−Vdend)+ IGABA (3)
Csoma ·Vsoma = gadaptBaP · (Vdend−Vsoma)+gsoma
L · (Erev−Vsoma)+βage · (IBaP + INa)+ IK (4)
Action-potential backpropagation (BaP)Postsynaptic currentsThe postsynaptic currents are generated in the soma, backpropagated to the dendritic spine and filtered by a passive dendrite. Thesoma generates BaPs using a version of the Na+ and K+ channel models developed by33. The related parameters are described inTable M5 (the voltage unit is mV).
Sodium channel Potassium channel
αm(Vsoma) = 0.4 · Vsoma +30
1− e−Vsoma+30
7.2αn(Vsoma) = e−0.11·(Vsoma−13)
βm(Vsoma) = 0.124 · Vsoma +30
eVsoma+30
7.2 −1βn(Vsoma) = e−0.08·(Vsoma−13)
minf(Vsoma) =αm(Vsoma)
αm(Vsoma)+βm(Vsoma)ninf(Vsoma) =
11+αn(Vsoma)
mτ(Vsoma) =1
αm(Vsoma)+βm(Vsoma)nτ(Vsoma) = max
(50 · βn(Vsoma)
1+αn(Vsoma);2)
αh(Vsoma) = 0.01 · Vsoma +45
eVsoma+45
1.5 −1n(Vsoma) =
ninf−nnτ
βh(Vsoma) = 0.03 · Vsoma +45
1− e−Vsoma+45
1.5IK = γK ·n · (ErevK−Vsoma)
h(Vsoma) = αh(Vsoma) · (1−h)−βh(Vsoma) ·h
m(Vsoma) =minf−m
mτ
INa = γNa ·m3 ·h · (ErevNa−Vsoma).
To trigger a BaP, an external current IBaP is injected in the soma at times t ∈ t1, ..., tn (postsynaptic input times) for a chosenduration δin j with amplitude Iamp (nA):
IBaP =n
∑i=1
H(ti) · (1−H(ti +δin j)) · Iamp.
The current injected in the soma is filtered in a distance-dependent manner by the dendrite before it reaches the dendritic spine. Thedistant-dependent BaP amplitude attenuation changes the axial resistance gadapt
BaP (see equations 3 and 4) between the dendrite and thesoma as follows (Fig. M2C top):
gadaptBaP = β ·gdi f f ·βsoma, βsoma(dsoma) = 0.1+
1.41+ e0.02·(dsoma−230.3µm)
(5)
where dsoma is the distance of the spine to the soma and where the factor β is dynamically regulated based on a resource-use equation12
with a dampening factor βaux changing the size of the attenuation step δdecay:
β =1−βτrec
−δdecay ·β−1aux ·β · IBaP(t)
βaux =1−βaux
τauxrec
−δaux ·βaux · IBaP(t).
21/46
5.4. ARTICLE METHODS 85

Fig. M2. | AP Evoked by EPSP. a, Model and data comparison for the distance-dependent BaP amplitude attenuation measured in the dendriteand varying the distance from the soma. The stimulation in panel A is set to reproduce the same stimulation as24. Golding measurements haveneurons that are strongly attenuated and weakly attenuated (dichotomy mark represented by the dashed line). However, in this work, we consideronly strongly attenuated neurons. b, Attenuation of somatic action potential from37 and model in response to five postsynaptic spikes delivered at100 Hz. The value showed for the model is the spine voltage with distance from the soma set to zero (scale 25 ms, 20 mV).c, Top panel shows theβsoma used in Equation (5) to modify the axial conductance between the soma and dendrite. Bottom panel shows the age-dependent changes in thestep of the resource-use equation, in Equation (6) that accelerates the BaP attenuation and decreases the sodium currents in the Equation (4). d,Probability of evoking an AP multiplied by the successfully evoked AP (pAP(Vevoked) ·1(evoked) for the protocol 1Pre, 300 at 5 Hz (2.5 mM Ca). d,Two-pool dynamics with the stimulation than panel D showing the vesicle release, the reserve and docked pools, and the evoked AP. e, Probability ofevoking an AP for the protocol 1Pre 300 pulses at different frequencies (3 and 5 Hz have the same probability).
The BaP attenuation model is based on24 data for strongly attenuating neurons. Therefore, the second type of attenuation (weaklyattenuating) in neurons is not considered (dichotomy in Fig. M2A). Fig. M2A compares Golding data to our model and illustrates theeffect of BaP attenuation in the upper panels of Fig. M2A and B.
Table M5 shows the BaP attenuation parameters. The plasticity outcomes as function of the dendritic spine distance from the somaare shown in Fig. S2C and Fig. S1E.
Age-dependent BaP adaptationAge-dependent BaP attenuation modifies the neuronal bursting properties through the maturation and expression of potassium andsodium channels34, therefore changing the interaction of polarizing and depolarizing currents (see Fig. M2B)35,36. We reproduce37
somatic attenuation profiles (Fig. M2B) with our model by including an age-dependent BaP amplitude attenuation factor. We definethe attenuation factor βage (Fig. M2C bottom), as follows.
βage =1− Iage
τagerec
−δage ·βage · IBaP(t), δ agerec =
1.391 ·10−4
1+ e0.135(age−16.482 days). (6)
In Equation (4), the age effects are introduced by multiplying the attenuation factor βage by the sodium INa and the external IBaPcurrents.
AP evoked by EPSPA presynaptic stimulation triggers a BaP if sufficient depolarization is caused by the EPSPs reaching the soma27 chapter 13. Weincluded an option to choose whether an EPSP can evoke an AP using an event generator resembling the previous release probabilitymodel (prel). Like the prel , the BaPs evoked by EPSPs are estimated before the postsynaptic simulation. To this, we use a variableVevoke which is incremented by 1 at each presynaptic time t ∈ (t1, ..., tn) and has exponential decay:
Vevoke =−Vevoke
τvVevoke(0) = 0
Vevoke −→Vevoke +1.(7)
22/46
86CHAPTER 5. A STOCHASTICMODELOF HIPPOCAMPAL SYNAPTIC PLASTICITYWITHGEOMETRICAL READOUTOF ENZYMES - ARTICLE

NAME VALUE REFERENCESoma parameters for Na+ and K+ channel
sodium conductance γNa = 8 ·102 nS0.32 nS/µm233
see legend commentary
potassium conductance γK = 40 nS0.48 nS/µm233
see legend commentaryreversal potential sodium ErevNa = 50 mV 33
reversal potential potassium ErevK =−90 mV 33
BaP attenuation parameters
attenuation step factor (age) δagesee Equation (6) and Fig. M2B and C bottom
24,37
attenuation step factor δdecay = 1.727 ·10−5 adjusted to fit24,37
auxiliary attenuation step factor δaux = 2.304 ·10−5 adjusted to fit24,37
recovery time for the attenuation factor τrec = 2 sadjusted to fit
24,37
recovery time for the auxiliary attenuation factor τauxrec = 2 s
adjusted to fit24,37
recovery time for the age attenuation factor τagerec = 0.5 s
adjusted to fit24,37
AP evoked by EPSPdecay time for Vevoke τV = 40 ms 23
delay AP evoked by EPSP δdelay−AP = 15 ms 41
Table M5. The Na+ and K+ conductances intentionally do not match the reference because models with passive dendrite need higher current input toinitiate action potentials42. Therefore we set it to achieve the desired amplitude on the dendrite and the dendritic spine according to the predictionsof24 and43.
Since the BaPs evoked by EPSP are triggered by the afferent synapses and are limited by their respective docked pools (D), we usethe previous prel to define the probability of an AP to occur. We test the ratio of successful releases from 25 synapses to decide if aBaP is evoked by an EPSP, setting a test threshold of 80%. Therefore, we express the probability of evoking an AP, pAP(Vevoke), withthe following test:
∑25 1(rand < prel(Vevoked , [Ca2+]o,D))
25> 80 %.
The EPSP summation dynamics on the soma and dendrites depend on the complex neuron morphology38,39 which was notimplemented by our model. Therefore, our "AP evoked by EPSP test" intends to give a simplified way to produce BaPs similar to anintegrate-and-fire model8.
Previous work suggests that BaPs can be evoked with a ∼5 % probability for low-frequencies40 in the Dudek and Bear 1992experiment ([Ca2+]o = 2.5 mM). Our model covers this estimation, but the chance to elicit an AP increases with the frequency38. Thisis captured by the Vevoke (in a integrate-and-fire fashion27) as shown in Fig. M2F. The Fig.s M2D and E show how a 5 Hz stimulationevokes APs. The delay between the EPSP and the evoked AP is set to δdelay−AP = 15ms, similar to the EPSP-spike latency reportedfor CA1 neurons41.
AMPArMarkov chainThe AMPAr is modeled with the Markov chain (Fig. M3) described by44,45 and adapted to temperature changes according to46. Here,we introduce the additional parameters ρAMPA
f ,ρAMPAb to cover AMPAr temperature-sensitive kinetics46. The corresponding parameters
are given in Table M6.
23/46
5.4. ARTICLE METHODS 87

C0 C1 C2 C3 C4
D0 D1 D2 D3 D4
O2 O3 O4
D22 D23 D24
4k1 · [Glu] ·ρAMPAf
k−1 ·ρAMPAb
3k1 · [Glu] ·ρAMPAf
2k−1 ·ρAMPAb
2k1 · [Glu] ·ρAMPAf
3k−1 ·ρAMPAb
k1 · [Glu] ·ρAMPAf
4k−1 ·ρAMPAb
3k1 · [Glu] ·ρAMPAf
k−2 ·ρAMPAb
3k1 · [Glu] ·ρAMPAf
k−1 ·ρAMPAb
2k1 · [Glu] ·ρAMPAf
2 · k−1 ·ρAMPAb
k1 · [Glu] ·ρAMPAf
3k−1 ·ρAMPAb
2k1 · [Glu] ·ρAMPAf
k−1 ·ρAMPAb
k1 · [Glu] ·ρAMPAf
2k−1 ·ρAMPAb
4δ0γ0 δ1γ1 2δ1γ1 3δ1γ1 4δ1γ1
δ2γ2 2δ2γ2 3δ2γ2
α2β α3β α4β
Fig. M3. AMPAr Markov chain with three sub-conductance states and two desensitisation levels. It includes parameters ρAMPAf , ρAMPA
b (binding andunbinding of glutamate) which depend on temperature. Open states are O2, O3 and O4; closed states are C0, C1, C2, C3 and C4; desensitisationstates are D0, D1, D2, D3 and D4; deep desensitisation states are D22, D23 and D24.
The AMPAr current is the sum of the subcurrents associated to the occupancy of the three subconductance states O2, O3 and O4of the Markov chain in the Fig. M3 and described as follows:
IAMPA = (ErevAMPA−Vsp) · (γA2 ·O2+ γA3 ·O3+ γA4 ·O4).
The adaptation of the Markov chain from44 is made by changing the forward ρAMPAf and backward ρAMPA
b rates in a temperature-dependent manner matching the decay time reported by46:
ρAMPAf =
10.2731+ e−0.473·(T−31.724°C)
, ρAMPAb =
5.1341+ e−0.367·(T−28.976°C)
.
The effects of temperature change on AMPAr dynamics are presented in Fig. M4, which also shows that the desensitisation isunaltered between temperature changes (Fig. M4B and C). The recovery time from desensitisation is the same as at room temperature44.Desensitisation measurements are required to account for a temperature-dependent change in the rates of the "vertical" transitions inFig. M3, see46. This can be relevant for presynaptic bursts.
Fig. M4. | Effect of temperature in the AMPAr. a, Probability of AMPAr opening ( O2+O3+O4NAMPA
) and the decay time at different temperatures inresponse to 1 mM glutamate during 1 ms (standard pulse).46 data (our model) suggests that AMPAr decay time at 35°C is ∼ 0.5 ms (∼ 0.6 ms) and at25°C is ∼ 0.65 ms (∼ 0.95 ms), this shows a closer match towards more physiological temperatures. b, Desensitisation profile of AMPAr at 35°Cshowing how many AMPAr are open in response to a glutamate saturating pulse (5 mM Glu during 20 ms) separated by an interval (x-axis). c, Sameas in panel B but for 25°C.
24/46
88CHAPTER 5. A STOCHASTICMODELOF HIPPOCAMPAL SYNAPTIC PLASTICITYWITHGEOMETRICAL READOUTOF ENZYMES - ARTICLE

NAME VALUE REFERENCEGlutamate parametersduration of glutamate in the cleft gluwidth = 1 ms 47
concentration of glutamate in the cleft gluamp = 1 mM 47
glutamate variability(gamma distribution Γ) glucv = Γ(1/0.52,0.52) 48
glutamate signal Gluglucv ·gluamp
for AMPAr, NMDAr and copied to GABA neurotransmitterAMPAr parametersnumber of AMPArs NAMPA = 120 29
reversal potential ErevAMPA = 0 mV 29
subconductance O2 γA2 = 15.5 pS 16.3 pS45
subconductance O3 γA3 = 26 pS 28.7 pS45
subconductance O4 γA4 = 36.5 pS 37.8 pS45
glu binding k1 = 1.6 ·107M−1s−1 44
glu unbinding 1 k−1 = 7400 s−1 44
glu unbinding 2 k−2 = 0.41 s−1 44
closing α = 2600 s−1 44
opening β = 9600 s−1 44
desensitisation 1 δ1 = 1500 s−1 44
desensitisation 2 δ2 = 170 s−1 44
desensitisation 3 δ0 = 0.003 s−1 44
re-desensitisation 1 γ1 = 9.1 s−1 44
re-desensitisation 2 γ2 = 42 s−1 44
re-desensitisation 3 γ0 = 0.83 s−1 44
Table M6. Parameter values for the AMPAr Markov chain and glutamate release affecting NMDAr, AMPAr. Properties of GABA release are thesame as those for glutamate.
Postsynaptic Ca2+ influxThe effects of experimental conditions in the calcium dynamics are due to receptors, ion channels and enzymes. A leaky term modelsthe calcium resting concentration in the Equation (8). The calcium fluxes from NMDAr and VGCCs (T, R, L types) are given inEquation (9). The diffusion term through the spine neck is expressed in Equation (10). Finally, the buffer, the optional dye and theenzymatic reactions are given in Equation (11) (parameter values given at the Table M7):
Ca =Ca∞−Ca
τCa+ (8)
CaNMDA + IT + IR + IL
2 ·F ·Asp+ (9)
max(Ca∞,Ca/3)−CaτCaDi f f
− (10)
˙Bu f fCa− ˙Dye+ enzymes. (11)
Despite the driving force to the resting concentration, Ca∞ = 50 nM, the tonic opening of T-type channels causes calcium tofluctuate making its mean value dependent on temperature, extracellular calcium and voltage. The effects of this tonic opening invarious experimental conditions are shown in Fig. S4C. To avoid modelling dendritic calcium sources, we use a dampening termas one-third of the calcium level since calcium imaging comparing dendrite and spine fluorescence have shown this trend49. TheEquation (10) implements the diffusion of calcium from the spine to the dendrite through the neck. The time constant for the diffusioncoefficient τCaDi f f , is estimated as described in50. The calcium buffer and the optional dye are described as a two states reactionsystem51:
˙Bu f fCa = kBu f fon · (Bu f fcon−Bu f fCa) ·Ca− kBu f f
o f f ·Bu f fCa
˙Dye = kFluo5on · (Fluo5 fcon−Dye) ·Ca− kFluo5
o f f ·Dye.
We estimated the calcium reversal potential for the calcium fluxes using the Goldman–Hodgkin–Katz (GHK) flux equationdescribed in52. The calcium ion permeability, PCa, was used as a free parameter adjusting a single EPSP to produce a calcium
25/46
5.4. ARTICLE METHODS 89

amplitude of ∼ 3 µM as reported in53.
φ = zCa ·Vsp ·F/R · (T +273.15K)
ΦCa =−PCa · zCa ·F ·φ ·[Ca]i− [Ca]o · e−φ
1− e−φ (12)
ΦCa is used to determine the calcium influx through NMDAr and VGCC in the Equations 13, 14, 15 and 16.
NAME VALUE REFERENCEBuffer and dye
association buffer constant kBu f fon = 0.247 µM−1ms−1 29
dissociation buffer constant kBu f fo f f = 0.524 ms−1 29
buffer concentration Bu f fcon = 62 µM 76.7 µM29
Calcium dynamicsCalcium baseline concentration Ca∞ = 50 nM 37±5 to 54±5 nM17
Calcium decay time τCa = 10 ms50 to 500 ms for with dye17
therefore < 50 to 500 ms undyed (unbufered)Calcium diffusion DCa = 0.3338 µm2ms−1 0.22 to 0.4 µm2ms−129,50
Calcium diffusion time constant τCaDi f f =Volsp
2DCa·Dneck+ Lneck
2DCa= 0.5 ms 8 ms for a Vsp = 0.7 µm350
GHKtemperature T = 35°C converted to Kelvin in the Equation (12) given the protocolfaraday constant F = 96.485 C mol−1 52
gas constant R = 8.314 J K−1 mol−1 52
Calcium permeability PCa = 0.045 µm ms−1 adjusted to produce 3 µM Calcium in response to a Glu releasesupplementary files from53
Calcium ion valence zCa = 2 52
Table M7. Postsynaptic calcium dynamics parameters.
NMDAr - GluN2A and GluN2BMarkov chainIn the hippocampus, the NMDAr are principally heteromers composed of the obligatory subunit GluN1 and either the GluN2A orGluN2B subunits. These N2 subunits guide the activation kinetics of these receptors with the GluN1/GLUN2B heteromers displayingslow kinetics (∼ 250ms) and the GluN1/GluN2A heteromers displaying faster kinetics (∼ 50ms). We modeled both NMDA subtypes.The NMDAr containing GluN2A is modeled with the following Markov chain54 where we introduce the additional parametersρNMDA
f ,ρNMDAb :
A0 A1 A2 A3 A4 AO1 AO2
ka · [Glu] ·ρNMDAf
k−a ·ρNMDAb
kb · [Glu] ·ρNMDAf
k−b ·ρNMDAb
kc ·ρNMDAf
k−c ·ρNMDAb
kd ·ρNMDAf
k−d ·ρNMDAb
ke ·ρNMDAf
k−e ·ρNMDAb
k f ·ρNMDAf
k− f ·ρNMDAb
The NMDAr containing GluN2B is modeled with a Markov chain based on the above GluN2A scheme. We decreased the rates by∼75% in order to match the GluN2B decay at 25°C as published in55.
B0 B1 B2 B3 B4 BO1 BO2
sa · [Glu] ·ρNMDAf
s−a ·ρNMDAb
sb · [Glu] ·ρNMDAf
s−b ·ρNMDAb
sc ·ρNMDAf
s−c ·ρNMDAb
sd ·ρNMDAf
s−d ·ρNMDAb
se ·ρNMDAf
s−e ·ρNMDAb
s f ·ρNMDAf
s− f ·ρNMDAb
The different rates are given in Table M8.
NMDAr and age switchThe age-dependent expression ratio of the subtypes GluN2A and GluN2B (rage) was obtained from hippocampal mice data56. Weadded noise to this ratio causing ∼1 NMDAr subunit to flip towards GluN2A or GluN2B (see Fig. M5E). The population of 15NMDAr is divided in the two subtypes according to the ratio plotted in Fig. M5B as function of age. The ratio to define the number
26/46
90CHAPTER 5. A STOCHASTICMODELOF HIPPOCAMPAL SYNAPTIC PLASTICITYWITHGEOMETRICAL READOUTOF ENZYMES - ARTICLE

Fig. M5. | NMDAr changes caused by age, temperature and extracellular and magnesium concentrations in the aCSF.A Decay time ofthe NMDAr-mediated EPSP recorded from neocortical layer II/III pyramidal neurons (grey)57 compared to the decay time from the GluN2Bchannel estimated by our model (yellow) and data from Iacobussi’s single receptor recording (purple)55. b, Comparison of our implementation ofGluN2B:GluN2A ratio and the GluN2B:GluN2A ratio from the mice’s CA1. c, Comparison of our implementation of NMDAr conductance changein response to the extracellular against data58. d, Forward and backwards temperature factors implemented to approximate NMDAr subtypes decaytimes at room temperature55 and temperature changes observed in57. e, NMDAr subtypes number on our model given age. We add noise to havea smoother transition between different ages. f, Calcium concentration changes for causal and anticausal protocols in response to different aCSFcalcium and magnesium compositions with fixed Ca/Mg ratio (1.5). Scale 50 ms and 5 µM.
NMDAr subtypes as function of age reads:
rage = 0.507+0.964
1+ e0.099·(age−25.102 days)+N (0,0.05)
NGluN2B = round(
NNMDA · rage
rage +1
)
NGluN2A = round(
NNMDA
rage +1
).
The round term in the two previous equations ensures that we have an integer value for the NMDAr subtypes, making the stairshaped curve seen in Fig. M5E.
NMDAr and temperatureWe adjusted the GluN2A and GluN2B forward and backward rates to follow the temperature effects on NMDAr-mediated EPSP57
(see Fig. M5A and D). Because GluN2B dominates the NMDAr-mediated EPSP, we fit its decay time on the NMDAr-mediated EPSPas function of temperature as reported by57 using a logistic functions ρNMDA
f and ρNMDAb . The decay time comparison is shown in
Fig. M5A. Then, we applied the same temperature factor ρNMDAf and ρNMDA
b for GluN2A. The decay times of GluN2A and GluN2Bare similar to the ones reported by Iacobucci55. The forward and backward factors are described as follows:
ρNMDAf =−1230.680+
1239.0671+ e−0.099·(T+37.631°C)
, ρNMDAb = 3.036+
1621.6161+ e−0.106·(T−98.999°C)
.
27/46
5.4. ARTICLE METHODS 91

NMDAr current and Ca2+-dependent conductanceNMDAr conductance is modulated by external calcium and is modelled according to the next equations using NMDAr subconductancesAO1 and AO2 (GluN2A), and BO1 and BO2 (GluN2B).
γNMDA = 33.949+58.388
1+ e4·([Ca2+]o−2.701 mM)pS
B(Vsp, [Mg]o) =1
1+ [Mg]o3.57 · e−0.062·Vsp
NMDA = (BO1 +BO2 +AO1 +AO2) ·B(Vsp, [Mg]o) · γNMDA
INMDA = (ErevNMDA−Vsp) ·NMDA
We now modify the conductance function γNMDA reported by58. The reported NMDAr conductance at [Ca2+]o = 1.8 mM is53±5pS. Here, we used the higher conductance 91.3 pS for NMDAr (for both subtypes) at [Ca2+]o = 1.8 mM to compensate for thesmall number of NMDArs reported by59. Hence, we cover58 data differently to account for this constraint: this caused a right-shift inthe NMDA-conductance curve (Fig. M5C). The calcium influx CaNMDA is modulated by the GHK factor, Equation (12), as function ofthe internal and external calcium concentrations and the spine voltage:
CaNMDA = fCa ·ΦCa ·NMDA. (13)
The combined effect of Magnesium60 and extracellular Calcium concentration are displayed in Fig. M5F.
GABA(A) receptorMarkov chainWe used the GABA(A) receptor Markov chain (Fig. M6) presented in Bush and Sakmann 199063,64 and we estimated temperatureadaptations using Otis and Mody 199265 measurements.
C0 C1 C2
O1 O2
rb1 · [Gaba]
ru1
rb2 · [Gaba]
ru2
ro1rc1 ·ρGABAb
ro1rc2 ·ρGABAb
Fig. M6. | GABAr Markov chain model. Closed states (C0, C1 and C2) open in response to GABAr and can go either close again or open (O1 andO2)
GABA(A)r and temperatureBecause the amplitude of GABA(A) current is altered by the GABAr shift66 during development, we applied temperature changes onlyto the closing rates using a logistic the function ρGABA
b estimated by fitting65 measurements (data comparison in the Fig. M7B and E).
ρGABAb = 1.470− −1.279
1+ e0.191·(T−32.167) .
GABA(A)r current and age switchThe GABA(A)r-driven current changes during development3 passing from depolarizing (excitatory) to hyperpolarizing (inhibitory)67.That is, the reversal potential of chloride ions permeating GABA(A)r shifts from above the membrane resting potential (inward drivingforce - excitatory) to below the membrane resting potential (outward driving force - inhibitory)66. Such effect mediated by chlorideions is associated with the KCC2 pump (K Cl co-transporter) which becomes efficient in extruding chloride ions during maturation66.To cover the GABA(A)r shift, we fit the chloride reversal potential (ECl
rev) using the data published by66 (Fig. M7C):
EClrev =−92.649+
243.5151+ e0.091·(age−0.691 days)
IGABA = (O1 +O2) · (EClrev−Vdend) · γGABA.
Table M9 presents the parameters to model the GABAr.
28/46
92CHAPTER 5. A STOCHASTICMODELOF HIPPOCAMPAL SYNAPTIC PLASTICITYWITHGEOMETRICAL READOUTOF ENZYMES - ARTICLE

NAME VALUE ENCENMDAr (GluN2A)glutamate binding ka = 34 µM−1s−1 54
glutamate binding kb = 17 µM−1s−1 54
forward rate kc = 127 s−1 54
forward rate kd = 580 s−1 54
opening rate ke = 2508 s−1 54
opening rate k f = 3449 s−1 54
closing rate k− f = 662 s−1 54
closing rate k−e = 2167 s−1 54
backward rate k−d = 2610 s−1 54
backward rate k−c = 161 s−1 54
glutamate unbinding k−b = 120 s−1 54
glutamate unbinding k−a = 60 s−1 54
NMDAr (GluN2B)glutamate binding sb = 0.25kb adapted from GluN2A54,55
glutamate binding sc = 0.25kc adapted from GluN2A54,55
forward rate sc = 0.25kc adapted from GluN2A54,55
forward rate sd = 0.25kd adapted from GluN2A54,55
opening rate se = 0.25ke adapted from GluN2A54,55
opening rate s f = 0.25k f adapted from GluN2A54,55
closing rate s− f = 0.23k− f adapted from GluN2A54,55
closing rate s−e = 0.23k−e adapted from GluN2A54,55
backward rate s−d = 0.23k−d adapted from GluN2A54,55
backward rate s−c = 0.23k−c adapted from GluN2A54,55
glutamate unbinding s−b = 0.23k−b adapted from GluN2A54,55
glutamate unbinding s−a = 0.23k−a adapted from GluN2A54,55
other parameterstotal number of NMDAr NNMDA = 15 5-3029,47,59
distribution of GluN2A and GluN2B defined by rage56
NMDAr conductance depending on calcium γNMDA58
NMDAr reversal potential ErevNMDA = 0 mV 61
fraction of calcium carried by NMDAr fCa = 0.1 62
Table M8. NMDAr parameters.
NAME VALUE ENCEGABA(A) receptornumber of GABA NGABA = 34 3068
chloride reversal potential see age-dependent equation 66
GABAr conductance γGABA = 36 pS 27 pS69
binding rb1 = 20 ·106M−1 s−1 same as63
unbinding ru1 = 4.6 ·103 s−1 same as63
binding rb2 = 10 ·106 M−1s−1 same as63
unbinding ru2 = 9.2 ·103 s−1 same as63
opening pore rro1 = 3.3 ·103 s−1 same as63
opening pore rro2 = 10.6 ·103 s−1 same as63
closing pore rc2 = 400 s−1 based on63,65
closing pore rc2 = 9.8 ·103 s−1 based on63,65
Table M9. GABAr parameters.
29/46
5.4. ARTICLE METHODS 93

Fig. M7. | GABA(A)r current, kinetics and chloride reversal potential. a, States of GABA(A)r Markov chain at 25°C in response to a presynapticstimulation. Opened = O1 +O2, closed = C0 +C1 +C2. b, Model and data comparison65 for GABA(A)r current at 25°C. Even though data wererecorded from P70 at 25°C and P15 at 35°C, we normalize the amplitude to invert the polarity and compare the decay time. This is done since thenoise around P15 can either make GABAr excitatory or inhibitory as shown by Ecl data in panel C. c, Chloride reversal potential (ECl
rev) fitted to66
data. Note we used both profiles from axon and dendrite age-depended EClrev changes since exclusive dendrite data is scarce. d, States of simulated
from GABA(A)r Markov chain at 35°C in response to a presynaptic stimulation. e, Model and data comparison65 for GABA(A)r current at 25°C(same normalization as in panel B). f, Change in the polarization of GABA(A)r currents given the age driven by the ECl
rev.
VGCC - T, R and L typeMarkov chainA stochastic VGCC model was devised using the channel gating measurements from CA1 rat’s (2-8 weeks) pyramidal neurons byMagee and Johnston 1995 at room temperature70. Our model has three different VGCC subtypes described by the Markov chains inFig. M8: the T-type (low-voltage), the R-type (medium-to-high-voltage) and the L-type (high-voltage).
C0 C1
C2 OR
αRm(Vsp) ·ρV GCC
f
β Rm(Vsp) ·ρV GCC
b
αRm(Vsp) ·ρV GCC
f
β Rm(Vsp) ·ρV GCC
b
αRh (Vsp) ·ρV GCC
fβ Rh (Vsp) ·ρV GCC
b αRh (Vsp) ·ρV GCC
fβ Rh (Vsp) ·ρV GCC
b
OL1 C0 OL2
β L1 (Vsp) ·ρV GCC
b
αL(Vsp) ·ρV GCCf
αL(Vsp) ·ρV GCCf
β L2 (Vsp) ·ρV GCC
b
C0 C1
C2 OT
αTm (Vsp) ·ρV GCC
f
β Tm (Vsp) ·ρV GCC
b
αTm (Vsp) ·ρV GCC
f
β Tm (Vsp) ·ρV GCC
b
αTh (Vsp) ·ρV GCC
fβ Th (Vsp) ·ρV GCC
b αTh (Vsp) ·ρV GCC
fβ Th (Vsp) ·ρV GCC
b
Fig. M8. From left to right, R-, L-, and T-type VGCCs Markov chain adapted from Magee and Johnston 199570. The R- (left scheme) and T- type(right scheme) have a single open state (red colour), respectively, Or and OT . The L-type VGCC (middle) has two open states, OL1 and OL2.
The VGCC Markov chain derived from Magee and Johnston 199570 are composed of two gates (h,m) for T- (Fig. M9A and D)and R-types (Fig. M9B and E) and a single gate for L-type (Fig. M9C), as described in the equations below.
30/46
94CHAPTER 5. A STOCHASTICMODELOF HIPPOCAMPAL SYNAPTIC PLASTICITYWITHGEOMETRICAL READOUTOF ENZYMES - ARTICLE

R-type h-gate rates
τR?h = 100
hR?in f (Vsp) =
1
1+ eVsp+39
9.2
αRh (Vsp) =
hRin f
τRh
β Rh (Vsp) =
1−hRin f
τRh
R-type m-gate rates
β R?m = 40
mR?in f =
1
1+ e3−10
8
αR?m r = β R?
m ·mR?
in f
1−mR?in f
τRm =
1αR?
m +β R?m
mRin f =
1
1+ e3−Vsp
8
αRm(Vsp) =
mRin f
τRm
β Rm(Vsp) =
1−mRin f
τRm
T-type h-gate rates
τT?h = 50
hT?in f (Vsp) =
1
1+ eVsp+70
6.5
αTh (Vsp) =
hTin f
τTh
β Th (Vsp) =
1−hTin f
τTh
T-type m-gate rates
β T?m = 1
mT?in f =
1
1+ e−32+20
7
αT?m r = β T?
m ·mT∗
in f
1−mT?in f
τTm =
1αT?
m +β T?m
mTin f =
1
1+ e−32−Vsp
7
αTm(Vsp) =
mTin f
τTm
β Tm (Vsp) =
1−mTin f
τTm
L-type rates
αL(Vsp) =0.83
1+ e13.7−Vsp
6.1
β L1 (Vsp) =
0.53
1+ eVsp−11.5
6.4
β L2 (Vsp) =
1.86
1+ eVsp−18.8
6.17
VGCC and temperatureWe used the same temperature factor for every VGCC subtype, respectively ρV GCC
f and ρV GCCb (see Fig. M9F), as follows:
ρV GCCf = 2.503− 0.304
1+ e1.048·(T−30.668)
ρV GCCb = 0.729+
3.2251+ e−0.330·(T−36.279) .
The VGCC subtypes are differently sensitive to temperature, with temperature factors for decay times ranging from 271 to 50-fold72.It further complicates if T-type isoforms are considered. Indeed, they can have temperature factors that accelerate or slow down thekinetics. For instance, when passing from room to physiological temperatures, the isoform Cav3.3 has a closing time ∼50 % faster71
and the isoform Cav3.1 becomes ∼15 % slower. To simplify, the same temperature factor is adopted to all VGCC subtypes.
VGCC currentsThe VGCC currents are integrated to the dendritic spine and estimated using the GHK Equation (12), as follows:
IT = γT ·ΦCa ·OT (14)IR = γR ·ΦCa ·OR (15)IL = γL ·ΦCa · (OL1 +OL2) (16)
31/46
5.4. ARTICLE METHODS 95

Table M10 presents the parameters to model the VGCC channels.
NAME VALUE ENCEVGCCVGCC T-type conductance γCaT = 12 pS same as70
VGCC R-type conductance γCaR = 17 pS same as70
VGCC L-type conductance γCaL = 27 pS same as70
number of VGCCs 3 for each subtype 1 to 2073
Table M10. VGCC parameters
Fig. M9. | VGCC rates and temperature factors. a, Activation (αm(Vsp)) and deactivation rates (βm(Vsp)) for the T-type m-gate. b, Activation(αm(Vsp)) and deactivation rates (βm) for the R-type m-gate. c, Activation (αm(Vsp)) and both deactivation rates (β L
2 (Vsp) and β 12 (Vsp)) for the L-type
VGCC. d, Activation (αh(Vsp)) and deactivation rates (βh(Vsp)) for the T-type h-gate. e, Activation (αh(Vsp)) and deactivation rates (βh(Vsp)) for theR-type h-gate. f, Temperature factor applied to all the rates, forward change (ρV GCC
f ) for the α rates and backward change (ρV GCCb ) for the β rates.
SK channelThe small potassium (SK) channel produces hyperpolarizing currents which are enhanced in the presence of intracellular calciumelevations. The SK channel current was based on the description of62 as follows:
r(Ca) =Caσ
Caσ +hσSK
msk =r(Ca) ·ρSK
f −ms
τSK ·ρSKb
ISK = γSK · (ESKrev −Vsp) ·msk ·NSK .
We chose a temperature factor to decrease the decay time of hyperpolarizing currents by a factor of two when passing fromphysiological to room temperature. Despite that the ences for temperature effects on the SK channel are few, a report74 suggests aleft-ward shift in the SK half-activation when changing from 37°C (hSK = 0.38±0.02 µM) to 25°C (hSK = 0.23±0.01 µM) ; that isa 65% decrease.
ρSKb = 149.37− 147.61
1+ e0.093·(T−98.85C), ρSK
f = 0.005+2.205
1+ e−0.334·(T+25.59C)
Table M11 presents the parameters to model the SK channel.
32/46
96CHAPTER 5. A STOCHASTICMODELOF HIPPOCAMPAL SYNAPTIC PLASTICITYWITHGEOMETRICAL READOUTOF ENZYMES - ARTICLE

NAME VALUE ENCESK channelnumber of SK channels NSK = 15 10–20075
SK conductance γSK = 10 pS 76
SK reversal potential ESKrev =−90 mV 62
SK half-activation hSK = 0.333 µM 62
SK half-activation slope σ = 6 4 in62
SK time constant τSK = 6.3 ms 62
Table M11. SK channel parameters.
Enzymes - CaM, CaN and CaMKIIMarkov chainTo model the enzymes dynamics, we adapted a monomeric CaM-CaMKII Markov chain from77 which builds over78. Our adaptationincorporates a simplified CaN reaction which only binds to fully saturated CaM. That is, CaM bound to four calcium ions on Nand C terminals (see Markov chain in the Fig. M10). A consequence of the Pepke coarse-grained model is that calcium binds andunbinds simultaneously from the CaM terminals (N,C). We assumed no dephosphorylation reaction between CaMKII and CaN since79
experimentally suggested that no known phosphatase affects CaMKII decay time which is probably caused only by CaM untrapping79.This was previously theorized by80’s model, and it is reflected in Chang data53,77. The structure of the corresponding Markov chain isshown in Fig. M10.
Chang’s data77 provides a high-temporal resolution fluorescence measurements for CaMKII in the spines of rat’s CA1 pyramidalneurons and advances the description of CaMKII self-phosphorylation (at room temperature). We modified Chang’s model of CaMKIIunbinding rates k2,k3,k4,k5 to fit CaMKII dynamics at room/physiological temperature as shown by53 supplemental files. Previousmodelling of CaMKII77,78 used a stereotyped waveform with no adaptation to model calcium. Our contribution to CaMKII modellingwas to use calcium dynamics sensitive to the experimental conditions to reproduce CaMKII data, therefore, allowing us to capturephysiological temperature measurements from53. Note that CaMKII dynamics has two time scales and we only capture the fastest one(after stimulation ceases, 60 s) and the relative amplitude of CaMKII between the different temperatures. The slowest one occursat the end of the stimulus, close to the maximum (Fig. M11A); this can be caused by the transient volume increase in the spine asmeasured by53.
Table M12 shows the concentration of the enzymes and Table M13 shows the parameters to model enzymes reactions in the Fig.M10.
NAME VALUE REFERENCEEnzyme concentrationsfree CaM concentration CaMcon = 30 µM 81
free KCaM concentration mKCaMcon = 70 µM 82,83
free CaN concentration mCaNcon = 20 µM 5–20 µM84
Table M12. Concentration of each enzyme.
Temperature effects on enzymatic-activityWe then included temperature factors in the coarse-grained model using Chang data77, as shown in Fig. M11. For CaMKII, we fittedthe modified dissociation rates of the phosphorylation states k2, k3 and k5 to match the data on relative amplitude and decay time usingthe following logistic function:
ρCaMKIIb = 162.171− 161.426
1+ e0.511(T−45.475°C).
For CaN, we fit the85’ data at 25°C as seen in Fig. M12A. However, since CaN-CaM dissociation rates at physiological temperatureswere not found, we set the temperature factor to CaN that fits the outcomes of the protocols we proposed to reproduce. A referencevalue from the CaN-AKAP79 complex86 showed a Q10 = 4.46 = (2.19 s−1/9.78 s−1) which is nearly the temperature factor used inour model for CaM. Therefore, both the association and dissociation rates are modified using the following logistic functions:
ρCaNf = 2.503− 0.304
1+ e1.048(T−30.668°C)
ρCaNb = 0.729+
3.2251+ e−0.330(T−36.279°C)
.
33/46
5.4. ARTICLE METHODS 97

CaM0 CaM2N
CaM2C CaM4
KCaM0 KCaM2N
KCaM2C KCaM4
PCaM0 PCaM2N
PCaM2C PCaM4
P mKCaM
P2
CaNCaM4
CaM-Ca and CaM-CaN reactions
KCaM-Ca reactions
KCaM phosphorylation
autonomous activity
k2Nf
k2Nb
k2Nf
k2Nb
k2Cf
k2Cb
k2Cf
k2Cb
kK2Nf
kK2Nb
kK2Nf
kK2Nb
kK2Cf
kK2Cb
kK2Cf
kK2Cb
kCaM0bkCaM0
f kCaM2NbkCaM2N
f
kCaM2CbkCaM2C
f kCaM4bkCaM4
f
F · k1 F · k1
F · k1 F · k1
ρCaMKIIb · k5k4
ρCaMKIIb · k2 ρCaMKII
b · k2
ρCaMKIIb · k2ρCaMKII
b · k2
ρCaNf · kCaN
f
ρCaNb · kCaN
b
ρCaMKIIb · k3
Fig. M10. | Coarse-grained model of CaM, CaMKII and CaN adapted from77 and78 The reaction description matches with the color: Releases2Ca, consumes 2Ca, consumes mKCaM, releases mKCaM, releases CaM2C, CaM2N, CaM0, CaM2N, releases mCaN, consumes mCaN, phoshorylateK units to P units, phosphorylated states and dephosphorylation.
34/46
98CHAPTER 5. A STOCHASTICMODELOF HIPPOCAMPAL SYNAPTIC PLASTICITYWITHGEOMETRICAL READOUTOF ENZYMES - ARTICLE

Fig. M11. | CaMKII temperature changes in our model caused by 1Pre, 30 at 0.49 Hz with Glutamate uncaging (no failures allowed), 1MmCa, 2mM Mg, P4-7 organotypic slices from mice hippocampus. a, CaMKII fluorescent probe lifetime change measured by53 for 25°(blue) and35°C (red)53. The decay time (τ) was estimated by fitting the decay after the stimulation (30 pulses at 0.49Hz) using a single exponential decay,y = a ·e−t·b ; τ = 1\b. b, Simulation of the CaMKII concentration change (with respect to the baseline) at 25°in response to same protocol applied inthe panel A. The simulations on the panels B, C, E and F show the mean of 20 samples. c, Same as in panel B but for 35°C. d, Estimated temperaturechange factor for the dissociation rates k2, k3 and k5 in the Markov chain at the Fig. M10. e, Change in the concentration of the CaMKII states(25°C) which are summed to compose CaMKII change in the panel B. f, Same as in panel E for 35°C with reference to the panel C.
Fig. M12. | CaN temperature changes in our model caused by 1Pre, 100 at 20 Hz with Glutamate uncaging (no failures allowed), 2Mm Ca,Free Mg, 11-13 days in vitro. a, Simulated caN change (blue solid line) in response to the same stimuli of the CaN measurement from85 RY-CaNfluorescent probe (green solid line). The decay time (τ) estimated from data (y = a · e−t·b) is 94.83 s (dashed purple line) and for our model (solidpurple line) is 82.66 s. b, Simulated CaN change for physiological temperature with decay time 54.44 s. Due to the lack of data, CaN kinetic changewas set to fit plasticity on the protocols use in this work. c, Temperature change, ρCaN
f and ρCaNb , aplied to CaN association and dissociation rates.
Our dissociation rate becomes 0.006 s−1 for 22°C (same temperature as in87), 0.0012 s−1), at the same temperature the association rate becomes9.45 ·106M−1s−1 (46 ·106M−1s−1 in87).
35/46
5.4. ARTICLE METHODS 99

REACTIONS VALUE REFERENCECoarse-grained model, CaM-Ca reactionsCaM0 + 2Ca⇒ CaM2CCaM2N + 2Ca⇒ CaM4 k2C
f = adapt(k1Con ,k
2Con ,k
1Co f f ,k
2Con ,Ca) 78
CaM0 + 2Ca⇒ CaM2NCaM2C + 2Ca⇒ CaM4 k2N
f = adapt(k1Non ,k
2Non ,k
1No f f ,k
2Non ,Ca) 78
CaM2C⇒ CaM0 + 2CaCaM4⇒ CaM2N + 2Ca k2C
b = adapt(k1Co f f ,k
2Co f f ,k
1Co f f ,k
2Con ,Ca) 78
CaM2N⇒ CaM0 + 2CaCaM4⇒ CaM2C + 2Ca k2N
b = adapt(k1No f f ,k
2No f f ,k
1No f f ,k
2Non ,Ca) 78
k1Con = 5 ·106M−1s−1 1.2 to 9.6 ·106M−1s−178
k2Con = 10 ·106M−1s−1 5 to 35 ·106M−1s−178
k1Non = 100 ·106M−1s−1 25 to 260 ·106M−1s−178
k2Non = 200 ·106M−1s−1 50 to 300 ·106M−1s−178
k1Co f f = 50 s−1 10 to 70 s−178
k2Co f f = 10 s−1 8.5 to 10 s−178
k1No f f = 2000 s−1 1 ·103 to 4 ·103 s−178
k2No f f = 500 s−1 0.5 ·103 to > 1 ·103 s−178
Coarse-grained model, KCaM-Ca reactionsKCaM0 + 2Ca⇒ KCaM2CKCaM2N + 2Ca⇒ KCaM4 kK2C
f = adapt(kK1Con ,kK2C
on ,kK1Co f f ,k
K2Con ,Ca) 78
KCaM0 + 2Ca⇒ KCaM2NKCaM2C + 2Ca⇒ KCaM4 kK2N
f = adapt(kK1Non ,kK2N
on ,kK1No f f ,k
K2Non ,Ca) 78
KCaM2C⇒ KCaM0 + 2CaKCaM4⇒ KCaM2N + 2Ca kK2C
b = adapt(kK1Co f f ,k
K2Co f f ,k
K1Co f f ,k
K2Con ,Ca) 78
KCaM2N⇒ KCaM0 + 2CaKCaM4⇒ KCaM2C + 2Ca kK2N
b = adapt(kK1No f f ,k
K2No f f ,k
K1No f f ,k
K2Non ,Ca) 78
kK1Con = 44 ·106M−1s−1 78
kK2Con = 44 ·106M−1s−1 78
kK1Non = 76 ·106M−1s−1 78
kK2Non = 76 ·106M−1s−1 78
kK1Co f f = 33 s−1 78
kK2Co f f = 0.8 s−1 0.49 to 4.9 s−178
kK1No f f = 300 s−1 78
kK2No f f = 20 s−1 6 to 60 s−178
Coarse-grained model, CaM-mKCaM reactionsCaM0 + mKCaM⇒ mKCaM0 kCaM0
f = 3.8 ·103M−1s−1 78
CaM2C + mKCaM⇒ mKCaM2C kCaM2Cf = 0.92 ·106M−1s−1 78
CaM2N + mKCaM⇒ mKCaM2N kCaM2Nf = 0.12 ·106M−1s−1 78
CaM4 + mKCaM⇒ mKCaM4 kCaM4f = 30 ·106M−1s−1 14 to 60 ·106M−1s−178
mKCaM0⇒ CaM0 + mKCaM kCaM0b = 5.5 s−1 78
mKCaM2C⇒ CaM2C + mKCaM kCaM2Cb = 6.8 s−1 78
mKCaM2N⇒ CaM2N + mKCaM kCaM2Nb = 1.7 s−1 78
mKCaM4⇒ CaM0 + mKCaM kCaM4b = 1.5 s−1 1.1 to 2.3 s−178
Coarse-grained model, self-phosphorylation reactionsKCaM0⇒ PCaM0KCaM2N⇒ PCaM2NKCaM2C⇒ PCaM2CKCaM4⇒ PCaM4
k1 = 12.6 s−1 77
Fraction of activated CaMKII F =CaMKII/mKCaMcon see Equation (17)77
PCaM0⇒ P+CaM0PCaM2N⇒ P+CaM2NPCaM2C⇒ P+CaM2CPCaM4⇒ P+CaM4
k2 = 0.33−1 0.33 s−1 ; adapted from77
P⇒mKCaM k3 = 4 ·0.17s−1 0.17s−1 adapted from77
P⇒P2 k4 = 4 ·0.041s−1 0.041s−1 adapted from77
P2⇒P k5 = 8 ·0.017s−1 0.017s−1adapted from77
Calcineurin model, CaM-CaM4 reactionsCaM4+mCaN⇒mCaNCaM4 kCaN
f = 10.75 ·106M−1s−1 46 ·106M−1s−187
mCaNCaM4⇒CaM4+mCaN kCaNb = 0.02 s−1 0.0012 s−187
see temperature factor
Table M13. Parameters for the coarse-grained model published in78 and adapted by77 and this work.78 rate adaptation for the coarse-grained modeladapt(a,b,c,d,Ca) = a·b
c+d·Ca .
36/46
100CHAPTER 5. A STOCHASTICMODELOF HIPPOCAMPAL SYNAPTIC PLASTICITYWITHGEOMETRICAL READOUTOF ENZYMES - ARTICLE

ReadoutWe describe the readout mechanism which provides the plasticity event which takes place in the synapse. First, we define the followingvariables which are representative of "active CaMKII" and "active CaN":
Active CaNCaN =CaN4
Active CaMKIIKCaM = KCaM0+KCaM2C+KCaM2N +KCaM4PCaM = PCaM0+PCaM2C+PCaM2N +PCaM4
CaMKII = KCaM+PCaM+P+P2. (17)
It is known that the calcium entry initiates a cascade of events that ultimately leads to short and long term plasticity changes. Specificconcentrations of CaMKII and CaN trigger activation functions actD and actP when they belong to one of the two polygonal regions(P and D), termed plasticity regions:
˙actD = aD ·1D−bD · (1−1D) ·actD˙actP = aP ·1P−bP · (1−1P) ·actP.
To Specify the LTP/LTD rates, termed Drate and Prate, we use the activation functions, actD and actP, as follows:
Prate(actP) = t−1P
acthPP
acthPP +KhP
P
Drate(actD) = t−1D
acthDD
acthDD +KhD
D
.
The Markov plasticity chain (see Fig. M13) starts with initial conditions NC=100, LTD=0 and LTP=0. Fig. M14 shows how thereadout works to predict plasticity for a single orbit. Table M14 shows the parameters to define the polygons of the plasticity regions(see Fig. M14)B.
LTD NC LTPPrate(actP)
Drate(actD)
Prate(actP)
Drate(actD)
Fig. M13. | Plasticity Markov Chain.
37/46
5.4. ARTICLE METHODS 101

Fig. M14. | Plasticity readout for the protocol 1Pre2Post10, 300 at 5Hz, from1. a, CaMKII and CaN activity in response to protocol 1Pre2Post10.b, Enzymatic joint activity in the 2D plane showing LTP and LTD’s plasticity regions. The black point marks the beginning of the stimulation, andthe white point shows the end of the stimulation after 60 s. c, Region indicator illustrating how the joint activity crosses the LTP and the LTD regions.d, The leaky activation functions are used respectively as input to the LTP and LTD rates. The activation function has a constant rise when thejoint-activity is inside the region, and exponential decay when it is out. e, The LTD rate in response to the leaky activation function, actD, in panel D.Note that this rate profile occurs after the stimulation is finished (60 s). The joint-activity is returning to the resting concentration in panel A. f, TheLTP rate in response to the leaky activation function, actP, in panel D. g, Outcome of the plasticity Markov chain in response to the LTD and LTPrates. The EPSP change (%) is estimated by the difference between the number of processes in the states LTP and LTD, LT P−LT D. h, NormalizedLTP and LTD rates (multiplied to their respective time constant, tD, tP) sigmoids. The dashed line represents the half-activation curve for the LTP andLTD rates. Note in panel D that the leaky activation function reaches the half-activation Kp = 1.3e4.
NAME VALUE REFERENCELeaking variable (a.u.)rise constant inside the LTD region aD = 0.1 a.u. ·ms−1 fitted to cover all protocols in Table M1rise constant inside the LTP region aP = 0.2 a.u. ·ms−1 fitted to cover all protocols in Table M1decay constant outside the LTD region bD = 2 ·10−5 a.u. ·ms−1 fitted to cover all protocols in Table M1decay constant outside the LTP region bP = 1 ·10−4 a.u. ·ms−1 fitted to cover all protocols in Table M1Plasticity Markov chainLTD rate time constant tD = 1.8 ·104 ms fitted to cover all protocols in Table M1LTP rate time constant tP = 1.3 ·104 ms fitted to cover all protocols in Table M1hill coefficient LTP hP = 2 fitted to cover all protocols in Table M1hill coefficient LTD hD = 2 fitted to cover all protocols in Table M1half occupation LTP KP = 1.3 ·104 a.u. fitted to cover all protocols in Table M1half occupation LTD KD = 8 ·104 a.u. fitted to cover all protocols in Table M1Plasticity region (edges of the polygons)LTP region (CaMKII) - top border 29.5 fitted to cover all protocols in Table M1LTP region (CaMKII) - bottom border 1.4 fitted to cover all protocols in Table M1LTP region (CaN) - right border 10. fitted to cover all protocols in Table M1LTP region (CaN) - left border 6.35 fitted to cover all protocols in Table M1LTD region (CaMKII) - top border 29.5 fitted to cover all protocols in Table M1LTD region (CaMKII) - bottom border 1.4 fitted to cover all protocols in Table M1LTD region (CaN) - right border 1.85 fitted to cover all protocols in Table M1LTD region (CaN) - left border 6.35 fitted to cover all protocols in Table M1LTD region - upper diagonal (line equation in the 2D map) CaMKII =+1.64 ·CaN +20.20 fitted to cover all protocols in Table M1LTD region - lower diagonal (line equation in the 2D map) CaMKII =−5.18 ·CaN +20.91 fitted to cover all protocols in Table M1
Table M14. Parameters to define the plasticity readout.
38/46
102CHAPTER 5. A STOCHASTICMODELOF HIPPOCAMPAL SYNAPTIC PLASTICITYWITHGEOMETRICAL READOUTOF ENZYMES - ARTICLE

References1. Tigaret, C. M., Olivo, V., Sadowski, J. H., Ashby, M. C.
& Mellor, J. R. Coordinated activation of distinct Ca 2+sources and metabotropic glutamate receptors encodesHebbian synaptic plasticity. Nature communications 7,10289 (2016).
2. Inglebert, Y., Aljadeff, J., Brunel, N. & Debanne, D.Synaptic plasticity rules with physiological calcium levels.Proceedings of the National Academy of Sciences. ISSN:0027-8424 (2020).
3. Meredith, R. M., Floyer-Lea, A. M. & Paulsen, O.Maturation of long-term potentiation induction rulesin rodent hippocampus: role of GABAergic inhibition.Journal of Neuroscience 23, 11142–11146 (2003).
4. Wittenberg, G. M. & Wang, S. S.-H. Malleability of spike-timing-dependent plasticity at the CA3–CA1 synapse.Journal of Neuroscience 26, 6610–6617 (2006).
5. Dudek, S. & Bear, M. Homosynaptic long-termdepression in area CA1 of hippocampus and ef-fects of N-methyl-D-aspartate receptor blockade.Proceedings of the National Academy of Sciences 89,4363 (1992).
6. Dudek, S. M. & Bear, M. F. Bidirectional long-term mod-ification of synaptic effectiveness in the adult and im-mature hippocampus. Journal of Neuroscience 13, 2910–2918 (1993).
7. Mizuno, T., Kanazawa, I. & Sakurai, M. Differential induc-tion of LTP and LTD is not determined solely by instanta-neous calcium concentration: an essential involvement ofa temporal factor. European Journal of Neuroscience 14,701–708 (2001).
8. Sterratt, D., Graham, B., Gillies, A. & Willshaw, D.Principles of computational modelling in neuroscience(Cambridge University Press, 2011).
9. Rizzoli, S. O. & Betz, W. J. Synaptic vesicle pools.Nature Reviews Neuroscience 6, 57–69 (2005).
10. Rudolph, S., Tsai, M.-C., Von Gersdorff, H. & Wadiche,J. I. The ubiquitous nature of multivesicular release.Trends in neurosciences 38, 428–438 (2015).
11. Pyle, J. L., Kavalali, E. T., Piedras-Rentería, E. S. & Tsien,R. W. Rapid reuse of readily releasable pool vesicles athippocampal synapses. Neuron 28, 221–231 (2000).
12. Tsodyks, M. V. & Markram, H. The neuralcode between neocortical pyramidal neurons de-pends on neurotransmitter release probability.Proceedings of the national academy of sciences 94, 719–723 (1997).
13. Hardingham, N. R. et al. Extracellular calcium regulatespostsynaptic efficacy through group 1 metabotropic glu-tamate receptors. Journal of Neuroscience 26, 6337–6345(2006).
14. King, R. D., Wiest, M. C. & Montague, P. R. Extracellularcalcium depletion as a mechanism of short-term synapticdepression. Journal of Neurophysiology 85, 1952–1959(2001).
15. Fernández-Alfonso, T. & Ryan, T. A. The kinetics ofsynaptic vesicle pool depletion at CNS synaptic terminals.Neuron 41, 943–953 (2004).
16. Alabi, A. A. & Tsien, R. W. Synaptic vesicle pools anddynamics. Cold Spring Harbor perspectives in biology 4,a013680 (2012).
17. Maravall, á., Mainen, Z., Sabatini, B. & Svoboda, K. Es-timating intracellular calcium concentrations and buffer-ing without wavelength ratioing. Biophysical journal 78,2655–2667 (2000).
18. Forsythe, I. D., Tsujimoto, T., Barnes-Davies, M., Cuttle,M. F. & Takahashi, T. Inactivation of presynaptic calciumcurrent contributes to synaptic depression at a fast centralsynapse. Neuron 20, 797–807 (1998).
19. Südhof, T. C. The synaptic vesiclecycle revisited. Neuron28, 317–320 (2000).
20. Spigelman, I, Tymianski, M, Wallace, C., Carlen, P. & Ve-lumian, A. Modulation of hippocampal synaptic transmis-sion by low concentrations of cell-permeant Ca2+ chela-tors: effects of Ca2+ affinity, chelator structure and bindingkinetics. Neuroscience 75, 559–572 (1996).
21. Koch, C. & Zador, A. The function of dendritic spines:devices subserving biochemical rather than electrical com-partmentalization. Journal of Neuroscience 13, 413–422(1993).
22. Fernandez, F. R. & White, J. A. Gain control in CA1pyramidal cells using changes in somatic conductance.Journal of Neuroscience 30, 230–241 (2010).
23. Hines, M. L. & Carnevale, N. T. The NEURON simulationenvironment. Neural computation 9, 1179–1209 (1997).
24. Golding, N. L., Kath, W. L. & Spruston, N. Dichotomy ofaction-potential backpropagation in CA1 pyramidal neu-ron dendrites. Journal of neurophysiology 86, 2998–3010(2001).
25. Yi, G.-S., Wang, J., Deng, B. & Wei, X.-L. Morphol-ogy controls how hippocampal CA1 pyramidal neuronresponds to uniform electric fields: a biophysical model-ing study. Scientific Reports 7, 1–13 (2017).
26. Mendoza, A. L., Durán, D. A. B. & Gómez, A. B. S.Increased dendritic length in CA1 and CA3 hippocam-pal neurons during the metestrus phase in Wistar rats.Brain research 1682, 78–83 (2018).
27. Stuart, G., Spruston, N. & Häusser, M. Dendrites (OxfordUniversity Press, 2016).
28. Zhuravleva, Z., Saifullina, V. & Zenchenko, C. Mor-phometric analysis of hippocampal pyramidal neu-rons in situ and in grafts developing in the an-terior eye chambers of young and aged Wistarrats. Journal of Neural Transplantation and Plasticity 6(1997).
29. Bartol, T. M. et al. Computational reconstitution ofspine calcium transients from individual proteins.Frontiers in synaptic neuroscience 7, 17 (2015).
39/46
5.4. ARTICLE METHODS 103

30. Harris, K. M., Jensen, F. E. & Tsao, B. Three-dimensionalstructure of dendritic spines and synapses in rat hippocam-pus (CA1) at postnatal day 15 and adult ages: impli-cations for the maturation of synaptic physiology andlong-term potentiation [published erratum appears in JNeurosci 1992 Aug; 12 (8): following table of contents].Journal of Neuroscience 12, 2685–2705 (1992).
31. Adrian, M., Kusters, R., Storm, C., Hoogenraad, C. C.& Kapitein, L. C. Probing the interplay between den-dritic spine morphology and membrane-bound diffusion.Biophysical journal 113, 2261–2270 (2017).
32. Popovic, M. A., Carnevale, N., Rozsa, B. & Zecevic, D.Electrical behaviour of dendritic spines as revealed byvoltage imaging. Nature communications 6, 1–12 (2015).
33. Migliore, M., Hoffman, D. A., Magee, J. C. & Johnston, D.Role of an A-type K+ conductance in the back-propagationof action potentials in the dendrites of hippocampal pyra-midal neurons. Journal of computational neuroscience 7,5–15 (1999).
34. Gymnopoulos, M., Cingolani, L. A., Pedarzani, P. &Stocker, M. Developmental mapping of small-conductancecalcium-activated potassium channel expression in the ratnervous system. Journal of Comparative Neurology 522,1072–1101 (2014).
35. Grewe, B. F., Bonnan, A. & Frick, A. Back-propagation of physiological action potential outputin dendrites of slender-tufted L5A pyramidal neurons.Frontiers in cellular neuroscience 4, 13 (2010).
36. Jung, H.-Y., Mickus, T. & Spruston, N. Prolonged sodiumchannel inactivation contributes to dendritic action po-tential attenuation in hippocampal pyramidal neurons.Journal of Neuroscience 17, 6639–6646 (1997).
37. Buchanan, K. A. & Mellor, J. R. The development ofsynaptic plasticity induction rules and the requirementfor postsynaptic spikes in rat hippocampal CA1 pyra-midal neurones. The Journal of Physiology 585, 429–445(2007).
38. Etherington, S. J., Atkinson, S. E., Stuart, G. J. & Williams,S. R. Synaptic integration. eLS (2010).
39. Ebner, C., Clopath, C., Jedlicka, P. & Cuntz, H. Unify-ing Long-Term Plasticity Rules for Excitatory Synapsesby Modeling Dendrites of Cortical Pyramidal Neurons.Cell Reports 29, 4295–4307 (2019).
40. Mayr, C. G. & Partzsch, J. Rate and pulse basedplasticity governed by local synaptic state variables.Frontiers in Synaptic Neuroscience 2, 33 (2010).
41. Fricker, D. & Miles, R. EPSP amplification and the preci-sion of spike timing in hippocampal neurons. Neuron 28,559–569 (2000).
42. Levine, D. & Woody, C. Effects of active versus passivedendritic membranes on the transfer properties of a simu-lated neuron. Biological cybernetics 31, 63–70 (1978).
43. Kwon, T., Sakamoto, M., Peterka, D. S. & Yuste, R.Attenuation of synaptic potentials in dendritic spines.Cell reports 20, 1100–1110 (2017).
44. Robert, A. & Howe, J. R. How AMPA recep-tor desensitization depends on receptor occupancy.Journal of Neuroscience 23, 847–858 (2003).
45. Coombs, I. D., MacLean, D. M., Jayaraman, V., Farrant,M. & Cull-Candy, S. G. Dual Effects of TARP γ-2 onGlutamate Efficacy Can Account for AMPA Receptor Au-toinactivation. Cell reports 20, 1123–1135 (2017).
46. Postlethwaite, M., Hennig, M. H., Steinert, J. R.,Graham, B. P. & Forsythe, I. D. Acceleration ofAMPA receptor kinetics underlies temperature-dependentchanges in synaptic strength at the rat calyx of Held.The Journal of physiology 579, 69–84 (2007).
47. Spruston, N., Jonas, P. & Sakmann, B. Dendritic glutamatereceptor channels in rat hippocampal CA3 and CA1 pyra-midal neurons. The Journal of physiology 482, 325–352(1995).
48. Liu, G., Choi, S. & Tsien, R. W. Variability of neurotrans-mitter concentration and nonsaturation of postsynapticAMPA receptors at synapses in hippocampal cultures andslices. Neuron 22, 395–409 (1999).
49. Segal, M. & Korkotian, E. Endoplasmic reticulum calciumstores in dendritic spines. Frontiers in neuroanatomy 8, 64(2014).
50. Holcman, D, Korkotian, E & Segal, M. Calcium dy-namics in dendritic spines, modeling and experiments.Cell calcium 37, 467–475 (2005).
51. Sabatini, B. L., Oertner, T. G. & Svoboda, K. The life cy-cle of Ca2+ ions in dendritic spines. Neuron 33, 439–452(2002).
52. Hille, B. Ionic channels in excitable membranes.Current problems and biophysical approaches.Biophysical Journal 22, 283–294 (1978).
53. Chang, J.-Y. et al. CaMKII autophosphorylation is neces-sary for optimal integration of Ca2+ signals during LTP in-duction, but not maintenance. Neuron 94, 800–808 (2017).
54. Popescu, G., Robert, A., Howe, J. R. & Auerbach, A. Re-action mechanism determines NMDA receptor responseto repetitive stimulation. Nature 430, 790 (2004).
55. Iacobucci, G. J. & Popescu, G. K. Kinetic Models forActivation and Modulation of NMDA Receptor Subtypes.Current Opinion in Physiology (2018).
56. Sinclair, D. et al. Effects of sex and DTNBP1 (dys-bindin) null gene mutation on the developmental GluN2B-GluN2A switch in the mouse cortex and hippocampus.Journal of neurodevelopmental disorders 8, 14 (2016).
57. Korinek, M, Sedlacek, M, Cais, O, Dittert, I & VyklickyJr, L. Temperature dependence of N-methyl-D-aspartatereceptor channels and N-methyl-D-aspartate receptor exci-tatory postsynaptic currents. Neuroscience 165, 736–748(2010).
58. Maki, B. A. & Popescu, G. K. Extracellular Ca2+ions reduce NMDA receptor conductance and gating.Journal of General Physiology 144, 379–392 (2014).
40/46
104CHAPTER 5. A STOCHASTICMODELOF HIPPOCAMPAL SYNAPTIC PLASTICITYWITHGEOMETRICAL READOUTOF ENZYMES - ARTICLE

59. Nimchinsky, E. A., Yasuda, R., Oertner, T. G. & Svo-boda, K. The number of glutamate receptors openedby synaptic stimulation in single hippocampal spines.Journal of Neuroscience 24, 2054–2064 (2004).
60. Jahr, C. E. & Stevens, C. F. A quantitative de-scription of NMDA receptor-channel kinetic behavior.Journal of Neuroscience 10, 1830–1837 (1990).
61. Destexhe, A., Mainen, Z. F. & Sejnowski, T. J. Synthesisof models for excitable membranes, synaptic transmis-sion and neuromodulation using a common kinetic formal-ism. Journal of computational neuroscience 1, 195–230(1994).
62. Griffith, T., Tsaneva-Atanasova, K. & Mellor, J. R. Con-trol of Ca2+ influx and calmodulin activation by SK-channels in dendritic spines. PLoS computational biology12 (2016).
63. Busch, C. & Sakmann, B. Synaptic transmission in hip-pocampal neurons: numerical reconstruction of quantalIPSCs. 55, 69–80 (1990).
64. Destexhe, A., Mainen, Z. F. & Sejnowski,T. J. Kinetic models of synaptic transmission.Methods in neuronal modeling 2, 1–25 (1998).
65. Otis, T. & Mody, I. Modulation of decay kinetics andfrequency of GABAA receptor-mediated spontaneous in-hibitory postsynaptic currents in hippocampal neurons.Neuroscience 49, 13–32 (1992).
66. Rinetti-Vargas, G., Phamluong, K., Ron, D. & Bender,K. J. Periadolescent maturation of GABAergic hyperpolar-ization at the axon initial segment. Cell reports 20, 21–29(2017).
67. Chamma, I., Chevy, Q., Poncer, J. C. & Lévi, S.Role of the neuronal K-Cl co-transporter KCC2in inhibitory and excitatory neurotransmission.Frontiers in cellular neuroscience 6, 5 (2012).
68. Edwards, F. A., Konnerth, A. & Sakmann, B. Quantalanalysis of inhibitory synaptic transmission in the den-tate gyrus of rat hippocampal slices: a patch-clamp study.The Journal of Physiology 430, 213–249 (1990).
69. Macdonald, R. L., Rogers, C. J. & Twyman, R. Ki-netic properties of the GABAA receptor main conduc-tance state of mouse spinal cord neurones in culture.The Journal of Physiology 410, 479–499 (1989).
70. Magee, J. C. & Johnston, D. Characterization of singlevoltage-gated Na+ and Ca2+ channels in apical dendritesof rat CA1 pyramidal neurons. The Journal of physiology487, 67–90 (1995).
71. Iftinca, M et al. Temperature dependence of T-typecalcium channel gating. Neuroscience 142, 1031–1042(2006).
72. Peloquin, J., Doering, C., Rehak, R & McRory, J. Tem-perature dependence of Cav1. 4 calcium channel gating.Neuroscience 151, 1066–1083 (2008).
73. Higley, M. J. & Sabatini, B. L. Calcium signaling in den-dritic spines. Cold Spring Harbor perspectives in biology4, a005686 (2012).
74. Van Herck, I. et al. Model Development of SK ChannelGating Incorporating Calcium Sensitivity and Drug Inter-action. Biophysical Journal 114, 306a (2018).
75. Bock, T., Honnuraiah, S. & Stuart, G. J. Paradoxical ex-citatory impact of SK channels on dendritic excitability.Journal of Neuroscience 39, 7826–7839 (2019).
76. Maylie, J., Bond, C. T., Herson, P. S., Lee, W.-S. & Adel-man, J. P. Small conductance Ca2+-activated K+ channelsand calmodulin. The Journal of physiology 554, 255–261(2004).
77. Chang, J.-Y., Nakahata, Y., Hayano, Y. & Yasuda, R. Mech-anisms of Ca 2+/calmodulin-dependent kinase II activa-tion in single dendritic spines. Nature Communications10, 2784 (2019).
78. Pepke, S., Kinzer-Ursem, T., Mihalas, S. & Kennedy, M. B.A dynamic model of interactions of Ca2+, calmodulin,and catalytic subunits of Ca2+/calmodulin-dependent pro-tein kinase II. PLoS computational biology 6, e1000675(2010).
79. Otmakhov, N., Regmi, S. & Lisman, J. E. Fast decay ofCaMKII FRET sensor signal in spines after LTP induc-tion is not due to its dephosphorylation. PLoS One 10,e0130457 (2015).
80. Michalski, P. The delicate bistability of CaMKII.Biophysical journal 105, 794–806 (2013).
81. Kakiuchi, S. et al. Quantitative determinations of calmod-ulin in the supernatant and particulate fractions of mam-malian tissues. The Journal of Biochemistry 92, 1041–1048 (1982).
82. Feng, B., Raghavachari, S. & Lisman, J. Quantitative esti-mates of the cytoplasmic, PSD, and NMDAR-bound poolsof CaMKII in dendritic spines. Brain research 1419, 46–52 (2011).
83. Lee, S.-J. R., Escobedo-Lozoya, Y., Szatmari, E. M. &Yasuda, R. Activation of CaMKII in single dendriticspines during long-term potentiation. Nature 458, 299–304 (2009).
84. Roehrl, M. H. et al. Selective inhibition ofcalcineurin-NFAT signaling by blocking protein–protein interaction with small organic molecules.Proceedings of the National Academy of Sciences 101,7554–7559 (2004).
85. Fujii, H. et al. Nonlinear decoding and asymmetric repre-sentation of neuronal input information by CaMKIIα andcalcineurin. Cell reports 3, 978–987 (2013).
86. Li, H. et al. Balanced interactions of calcineurin withAKAP79 regulate Ca 2+–calcineurin–NFAT signaling.Nature structural & molecular biology 19, 337 (2012).
87. Quintana, A. R., Wang, D., Forbes, J. E. & Waxham,M. N. Kinetics of calmodulin binding to calcineurin.Biochemical and biophysical research communications334, 674–680 (2005).
41/46
5.4. ARTICLE METHODS 105

Supplementary filesSupplemental files present some experiments and predictions extending the notion of parameter sensitivity. Also, they show the effectof modifications in the experimental parameters in Table M1. For instance, Fig. S1 show variations on1’s experiment.
Fig. S1. | Varying1 experimental parameters. Related to Fig. . a, Mean synaptic weight change for 1Pre2Post(delay) varying the temperature,original temperature is 35°C (dashed grey line). b, Mean synaptic weight change for 1Pre2Post(delay) varying the age, original age is P50-55 (dashedgrey line). c, Mean synaptic weight change for 1Pre2Post(delay) varying the frequency, original frequency is 5 Hz (dashed grey line). d, Meansynaptic weight change for 1Pre2Post(delay) varying the [Ca2+]o, original [Ca2+]o= 2.5 mM (dashed grey line). e, Mean synaptic weight change for1Pre2Post(delay) varying the distance from the soma, original distance is 200 µm (dashed grey line). A similar trend in distal spines was previouslyfound in2. f, Mean synaptic weight change of 1Pre2Post50 and 2Post1Pre50 when number of pulses increases or deacreses. Note the similarity with3
in Fig. S4C.
42/47
106CHAPTER 5. A STOCHASTICMODELOF HIPPOCAMPAL SYNAPTIC PLASTICITYWITHGEOMETRICAL READOUTOF ENZYMES - ARTICLE

Fig. S2 shows variations of4 parameters for [Ca2+]o, [Mg2+]o, temperature and dendritic spine distance from the soma. Also, itshows the Poisson spike train protocol (as in Fig. G and H) for temperature and age parameters obtained from an estimation of thebody temperature regulation during development (or thermoregulation maturation, also called maturation of temperature homeostasis,estimated in Fig. S5G).
Fig. S2. | Varying experimental parameters in4 and Poisson spike train during development. Related to Fig. and . a, Mean synaptic weightchange for the FDP experiment varying the [Mg2+]o, original [Mg2+]o= 1.5 mM (dashed grey line). b, Mean synaptic weight change for the FDPexperiment varying the [Ca2+]o, original [Ca2+]o= 2.5 mM (dashed grey line). c, Mean synaptic weight change for the FDP experiment varyingthe distant from the soma, original 200 µm (dashed grey line). Changing the distance from the soma modifies how fast BaPs evoked by EPSP willattenuate. Note that LTD is prevalent for a spine situated far from the soma. This could justify why spines distant from the soma are smaller in sizesince distance correlates with synaptic weight. d, Mean synaptic weight change for the FDP experiment varying the temperature, original temperature35°C (dashed grey line). e, Mean synaptic weight change for the FDP experiment varying the pairing repetitions at 33°C showing how LTD isenhanced. f, Mean synaptic weight change for the FDP experiment varying the pairing repetitions at 37°C showing how LTD is abolished. g, Meansynaptic weight change for pre and postsynaptic Poisson spike train during 30 s for P5 and 34°C. The panel shows that there is weak and diffusedLTP. h, Mean synaptic weight change for pre and postsynaptic Poisson spike train during 30 s for P15 and 35°C. The panel shows that there is a startof LTP window forming for slow postsynaptic rates (<1 Hz). i, Mean synaptic weight change for pre and postsynaptic Poisson spike train during 30 sfor P20 and 35°C. The panel shows that a window forms around 10 Hz postsynaptic rate similar to what is shown by5 and in Fig. H.
Fig. S3 expands the presynaptic burst strategy hypothesized to recover the LTD in adult slices (Fig. C) for 900 pairing repetitions.Also, Fig. S3 tries to isolate the contribution of each age-dependent mechanism (NMDAr, GABAr, BaP efficiency switches) for 3 and5 Hz predictions in6 experiment. To this we fixed each of the three mechanisms coding for age in our model at P5 and P50, to observehow they shape the plasticity. Note the experiment in Fig. S4D-I is only to theoretically show how each age mechanism contributes toplasticity in Fig. . Also we compare predictions of between different STDP experiments across age.
43/47
5.5. ARTICLE SUPPLEMENTARY RESULTS 107

Fig. S3. | Duplets, triplets and quadruplets for FDP, perturbing developmental-mechanisms for LFS and HFS in6, and age-related changesin STDP experiments1,7,8. Related to Fig. and . a, Mean synaptic weight change (%) for the duplet-FDP (2Pre50) experiment varying age. Thepanel shows showing that not only LTD is enhanced but also LTP. b, Mean synaptic weight change (%) for the triplet-FDP (3Pre50) experimentvarying age. The panel shows that LTD magnitude further enhanced for adult rats and that a leftward shift of the LTD-LTP transition. c, Meansynaptic weight change (%) for the quadruplet-FDP (4Pre50) experiment varying age. The panel shows a further leftward shift on the LTD-LTPtransition (compared to 3Pre50). d, Mean synaptic weight change (%) for the 1 Pre 900 at 30 and 3 Hz with6. The panel shows the fixed NMDAr atP5 (more GluN2B) causing an increase of LTD magnitude and a slight increase of LTP magnitude for adult rats compared to baseline (grey solidline). e, Same experiment as panel D but fixing BaP maturation at P5 (higher BaP attenuation). LTP is abolished, but LTD is not affected. Thisis because AP induced by EPSP attenuate too fast for 30 Hz not able to produce enough depolarization to activate NMDAr Mg-unblock. f, Sameexperiment as panel D but fixing GABAr maturation at P5 (excitatory GABAr) what causes only slightly enhances LTD (3 Hz) for adult rats. g, Sameexperiment as panel D but fixing NMDAr at P50 (more GluN2A). LTD appears with decreased magnitude for young rats compared to baseline (greysolid line). h, Same experiment as panel D but fixing BaP maturation at P50 (less BaP attenuation). LTP is enhanced for young rats because the BaPpairing with the slow closing GluN2B produces more calcium influx. i, Same experiment as panel D but fixing GABAr maturation at P50 (inhibitoryGABAr) which does not affect the FDP experiment. j, Mean synaptic weight change (%) for8’s single versus burst-STDP experiment for differentages. The data from Meredith (boxplots) were pooled by the age as shown in the x-axis. The solid line represents the mean, and the shaded ribbonthe 2nd and 4th quantiles simulated by the model (same for panels A-F). k, Mean synaptic weight change (%) for7’s STDP experiment in which thenumber of postsynaptic spikes increases. The x-axis marker from 14-21 indicates that only this interval was published without further specification.We use our model to estimate age related changes to7 protocols. Note that the model does not cover the 1Pre2Post10 properly (model predicts onlyoutcomes near the first data quantile). Notice that single and burst STDP leads to LTD, meanwhile8’s to LTP or NC. l, Mean synaptic weight change(%) for1’s STDP experiment which compares single versus burst STDP. The x-axis marker from 50-55 indicates that only a interval was publishedwithout further specification. We use our model to estimate age related changes to1 protocols. It is noticeable that each STDP experiment has adifferent development.
44/47
108CHAPTER 5. A STOCHASTICMODELOF HIPPOCAMPAL SYNAPTIC PLASTICITYWITHGEOMETRICAL READOUTOF ENZYMES - ARTICLE

Fig. S4 presents modifications of7’s STDP experiment and the reproduction of3 data.
Fig. S4. | [Ca2+]o and [Mg2+]o related modifications for7’s experiment. Related to Fig. . a, Mean time spent for anticausal pairing, 1Post1Pre10,at different Ca/Mg concentrations. The contour plots are associated with the Fig. A, B and C. b, STDP and extracellular Ca/Mg. Synaptic weightchange (%) for causal (1Pre1Post10, 100 at 0.3 Hz) and anticausal (1Post1Pre10, 150 at 0.3 Hz) pairings varying [Ca2+]o from 1.0 to 3 mM (Ca/Mgratio = 1.5). c, Varying frequency and extracellular Ca/Mg for the causal pairing 1Pre1Post10, 100 at 0.3 Hz. Synaptic weight change (%) for a singlecausal pairing protocol varying frequency from 0.1 to 10 Hz. [Ca2+]o was fixed at 1.8 mM (Ca/Mg ratio = 1.5). d, Mean synaptic weight change (%)for7’s STDP experiment showing how temperature qualitatively modifies plasticity. The dashed lines are ploted in panel B. e, Mean synaptic weightchange (%) showing effects 0.5°C from panel A. Black and grey solid lines represent the same color dashed lines in panel A (30 and 30.5°C). Thebidirectional curves, black and grey lines in panel A (dashed) and panel B (solid), becoming full-LTD when temperature increases to 34.5 and 35°C,respectively yellow and purple lines in panel A (dashed) and panel B (solid). Further increase abolishes plasticity. f, Mean synaptic weight change(%) for3’s experiment in Free-Mg ([Mg2+]o= 10−3mM for best fit) showing the different time requirements to induce LTP and LTD. For LTD, tosimulate the NMDAr antagonist D-AP5 which causes a NMDAr partial blocking we reduced the NMDAr conductance by 97%. Note the similaritywith Fig. S1F. g, Mean synaptic weight change (%) of7’s STDP experiment changing [Ca2+]o and Ca/Mg ratio. h, Mean synaptic weight change (%)of7’s STDP experiment changing pre-post delay time and frequency. Note the similarity with Fig. S1C. i, Mean synaptic weight change (%) of7’sSTDP experiment changing pre-post delay time and age. Age has a weak effect on this experiment done at [Ca2+]o= 2.5 mM.
45/47
5.5. ARTICLE SUPPLEMENTARY RESULTS 109
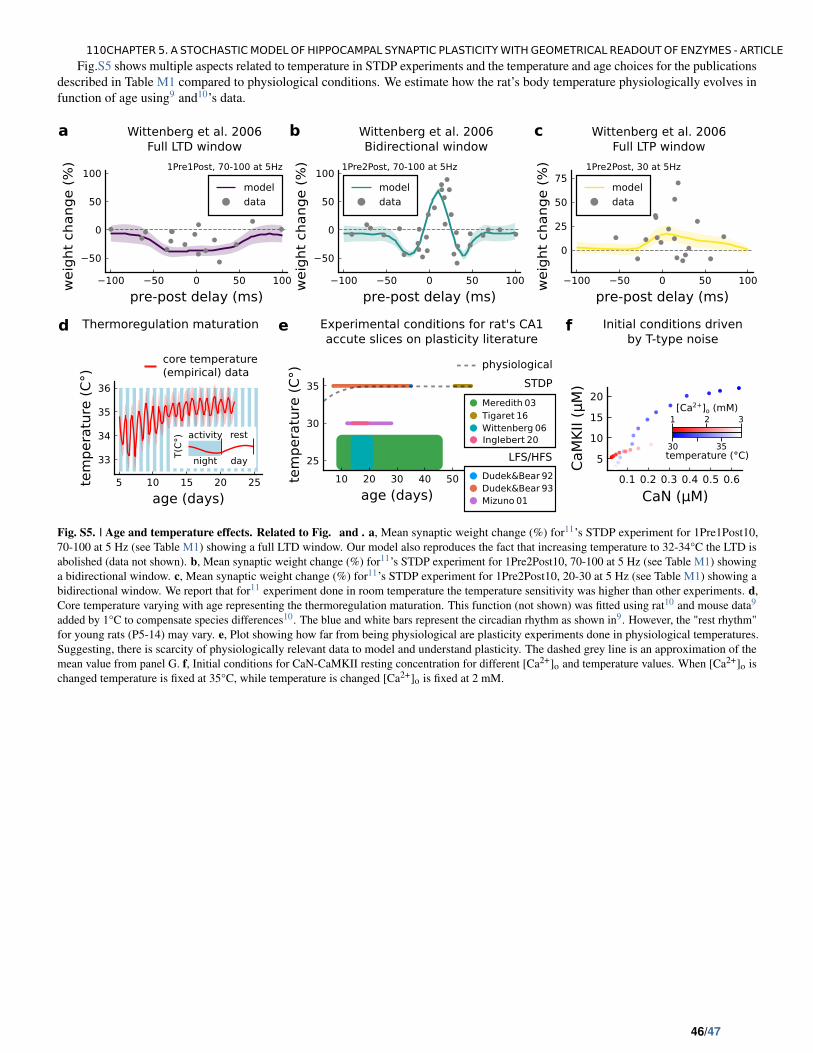
Fig.S5 shows multiple aspects related to temperature in STDP experiments and the temperature and age choices for the publicationsdescribed in Table M1 compared to physiological conditions. We estimate how the rat’s body temperature physiologically evolves infunction of age using9 and10’s data.
Fig. S5. | Age and temperature effects. Related to Fig. and . a, Mean synaptic weight change (%) for11’s STDP experiment for 1Pre1Post10,70-100 at 5 Hz (see Table M1) showing a full LTD window. Our model also reproduces the fact that increasing temperature to 32-34°C the LTD isabolished (data not shown). b, Mean synaptic weight change (%) for11’s STDP experiment for 1Pre2Post10, 70-100 at 5 Hz (see Table M1) showinga bidirectional window. c, Mean synaptic weight change (%) for11’s STDP experiment for 1Pre2Post10, 20-30 at 5 Hz (see Table M1) showing abidirectional window. We report that for11 experiment done in room temperature the temperature sensitivity was higher than other experiments. d,Core temperature varying with age representing the thermoregulation maturation. This function (not shown) was fitted using rat10 and mouse data9
added by 1°C to compensate species differences10. The blue and white bars represent the circadian rhythm as shown in9. However, the "rest rhythm"for young rats (P5-14) may vary. e, Plot showing how far from being physiological are plasticity experiments done in physiological temperatures.Suggesting, there is scarcity of physiologically relevant data to model and understand plasticity. The dashed grey line is an approximation of themean value from panel G. f, Initial conditions for CaN-CaMKII resting concentration for different [Ca2+]o and temperature values. When [Ca2+]o ischanged temperature is fixed at 35°C, while temperature is changed [Ca2+]o is fixed at 2 mM.
46/47
110CHAPTER 5. A STOCHASTICMODELOF HIPPOCAMPAL SYNAPTIC PLASTICITYWITHGEOMETRICAL READOUTOF ENZYMES - ARTICLE

References1. Tigaret, C. M., Olivo, V., Sadowski, J. H., Ashby, M. C.
& Mellor, J. R. Coordinated activation of distinct Ca 2+sources and metabotropic glutamate receptors encodesHebbian synaptic plasticity. Nature communications 7,10289 (2016).
2. Ebner, C., Clopath, C., Jedlicka, P. & Cuntz, H. Unify-ing Long-Term Plasticity Rules for Excitatory Synapsesby Modeling Dendrites of Cortical Pyramidal Neurons.Cell Reports 29, 4295–4307 (2019).
3. Mizuno, T., Kanazawa, I. & Sakurai, M. Differential induc-tion of LTP and LTD is not determined solely by instanta-neous calcium concentration: an essential involvement ofa temporal factor. European Journal of Neuroscience 14,701–708 (2001).
4. Dudek, S. & Bear, M. Homosynaptic long-termdepression in area CA1 of hippocampus and ef-fects of N-methyl-D-aspartate receptor blockade.Proceedings of the National Academy of Sciences 89,4363 (1992).
5. Graupner, M., Wallisch, P. & Ostojic, S. Natural firing pat-terns imply low sensitivity of synaptic plasticity to spike
timing compared with firing rate. Journal of Neuroscience36, 11238–11258 (2016).
6. Dudek, S. M. & Bear, M. F. Bidirectional long-term mod-ification of synaptic effectiveness in the adult and im-mature hippocampus. Journal of Neuroscience 13, 2910–2918 (1993).
7. Inglebert, Y., Aljadeff, J., Brunel, N. & Debanne, D.Synaptic plasticity rules with physiological calcium levels.Proceedings of the National Academy of Sciences. ISSN:0027-8424 (2020).
8. Meredith, R. M., Floyer-Lea, A. M. & Paulsen, O.Maturation of long-term potentiation induction rulesin rodent hippocampus: role of GABAergic inhibition.Journal of Neuroscience 23, 11142–11146 (2003).
9. McCauley, J. P. et al. Circadian modulation of neurons andastrocytes controls synaptic plasticity in hippocampal areaCA1. Cell reports 33, 108255 (2020).
10. Wood, T. et al. Treatment temperature and insult severityinfluence the neuroprotective effects of therapeutic hy-pothermia. Scientific reports 6, 1–12 (2016).
11. Wittenberg, G. M. & Wang, S. S.-H. Malleability of spike-timing-dependent plasticity at the CA3–CA1 synapse.Journal of Neuroscience 26, 6610–6617 (2006).
47/47
5.5. ARTICLE SUPPLEMENTARY RESULTS 111

Chapter 6
Additional results and discussion
As shown in the article, the model can reproduce and predicts plasticity outcomes
for experiments in different experimental conditions. Here, I will summarize other
experiments that were not inserted in the main text thereby expanding the article
scope and providing other preliminary results, such as: a synaptic version of CaN-
CaMKII nonlinear filter by Fujii et al. 2013, the role of the temperature range in
the frequency-dependent plasticity by O’Connor et al. 2005, the limits of non-
dynamical measures to predict plasticity as in Blackwell et al. 2019, a comparison
between different types of presynaptic release and a deterministic version of the
model, the possible interactions between laser-tissue warming and Ca2+ dye, and
two examples of in vivo-like plasticity.
6.1 CaN and CaMKII related experiments
Our model was based on the combined CaN and CaMKII activity in which the
memory role was hypothesized and modelled by Lisman 1985; Lisman 1989. Lis-
man’s core idea was that CaMKII would stay permanently activated through its
self-phosphorylated activity and deactivated by CaN in a switch-like fashion. Also,
the CaMKII activated states would surpass protein turnover by phosphorylating
other CaMKII. Despite the innovation of such ideas (Bear et al. 2018), the memory
maintenance role through self-phosphorylation (Chang et al. 2017; P. Michalski
2013) and phosphatase influence over CaMKII dephosphorylation (Otmakhov et
al. 2015; Fujii et al. 2013) were not confirmed in ex vivo/in vivo experiments. How-
ever, a possible role of CaMKII in sustaining a transient "molecular memory" can
be achieved by the CaMKII-GluN2B complex, which still needs to be investigated
in vivo/ex vivo (Urakubo et al. 2014; Paul J Michalski 2014). Furthermore, fluo-
rescence experiments by Fujii et al. 2013; Chang et al. 2017; Chang et al. 2019
112

6.1. CAN AND CAMKII RELATED EXPERIMENTS 113
show that CaMKII self-phosphorylation does not make it permanently activated
as hypothesized by P. Michalski 2013 model.
6.1.1 A synaptic version of the CaN and CaMKII nonlinear filter
Fujii et al. 2013 claims that these enzymes behave as a nonlinear decoder of
frequency and pulse number (Figure 6.1D–F). They show that somatic CaMKII is
sensitive to frequency, pulse number, and CaN only to the pulse by measuring
enzymatic integral and amplitude. Using the model, we can test if such nonlinear
filter observed in the soma of cultured neurons by Fujii et al. 2013 could be found
in dendritic spines. For this, the same experimental conditions and stimulation
protocol mentioned in the paper were used: glutamate uncaging (no failures),
25C, 2mM [Ca2+]o free-Mg2+, P13 chosen arbitrarily since Fujii et al. 2013 uses
cultured neurons, 200 µm from the soma, allowing BaP elicited by EPSPs. Fig-
ure 6.1A–C shows that the dendritic spine version of the nonlinear filter does not
follow Fujii et al. 2013 findings. That is possibly due to the difference in the satu-
ration profile of these enzymes in dendritic spines (model) and the soma (exper-
iment). For instance, in Figure 6.1D, somatic CaMKII can accumulate activation
for high frequency and pulses; in contrast, Figure 6.1A, the model shows that
activity was slightly higher around 1 Hz, with a 20% difference between other fre-
quencies. Such lack of frequency-dependence was noticed in Chang et al. 2017
CaMKII measurements. Thus, the synaptic version of the nonlinear in Figure 6.1C
filter had an inverted outcome to what was measured by Fujii et al. 2013 in Figure
6.1F, with CaMKII less active for high frequency and pulse number than CaN for
the synaptic version. The model suggests that the amplitude is a poor predictor
for enzymatic activity since it can vary depending on where it is measured; CaN
and CaMKII are more expressed in dendritic spines than the soma. Note that the
model cannot evaluate the enzymatic dynamics in the soma measured by Fujii
et al. 2013 since it is built just for dendritic spines.
6.1.2 The effects of the temperature range in the FDP
Focusing on CaN and CaMKII contributions to plasticity, O’Connor et al. 2005 drug-
inhibited CaMKII and CaN. They show that inhibiting CaMKII abolishes LTP, and
inhibiting CaN abolishes LTD (Figure 6.2C). However, these molecules are not ex-
clusively controlling LTP and LTD as mentioned by Coultrap and Bayer 2012; Kipa-
nyula et al. 2016. Here, we would like to test how the wide temperature range
affects qualitative changes in O’Connor et al. 2005 FDP ex vivo experiment. Since

114 CHAPTER 6. ADDITIONAL RESULTS AND DISCUSSION
Figure 6.1: Synaptic version CaMKII and CaN nonlinear filter using the same experimental conditions estimated by the model (panels A–C)
and Fujii et al. 2013 measurements (panels D–F). A) CaMKII maximal amplitude (normalized concentration) using different frequencies and
pulse numbers. Low frequencies had maximal activation when compared to the data measures in the soma (panel D). B) CaN maximal
amplitude (normalized values) using different frequencies and pulse numbers. The CaN profile was similar to what was measured in the
soma (panel E). C) Difference between normalized CaN and CaMKII showing an inverted dominance to what was observed in the soma
(panel F). D) Fujii et al. 2013 CaMKII amplitude measurement using the fluorescence change obtained in a FRET probe (also D–E). E) Fujii
et al. 2013 CaN amplitude measurement using a fluorescent probe. F) Nonlinear filter found by Fujii et al. 2013 in the soma in which CaMKII
is more active for high frequencies and pulses, and CaN for low frequencies.
O’Connor et al. 2005 uses the range 27.5-32 C (Figure 6.2A red lines), we eval-
uate how the model reproduces this data by fixing the same experimental condi-
tions: 100 pulses at different frequencies in 3 epochs separated by 5 minutes, 2.0
mM [Ca2+]o (used 2.2 mM for the model 1), 1mM [Mg2+]o, P14-21 (used for P21
the model), BaP induced by EPSPs allowed. The temperature was set to exceed
2 C under and above the described temperature thus falling the range 27.5-32
C. The model simulated different frequencies and temperatures to explore the
qualitative changes as shown in Figure 6.2A. By finding the best match from the
mean weight change in Figure 6.2A (green dots) and O’Connor et al. 2005’s data
in Figure 6.2B (pink dots), the model suggests that fixing a single temperature
would not produce the curve observed. That is, for warmer temperatures, LTD
was prevalent (Figure 6.2A over the top red line), and for colder temperatures,
1The 0.2 mM difference makes the plasticity outcomes at high frequency closer to the data. The model has a strong
attenuation to high frequencies due to fast vesicle depletion. The 0.2 mM difference increases Ca2+ influx and release
probability slightly. Other aspects in the age range were not investigated and could account for high frequency outcomes.
Another possibility is that the high frequency outcomes LTP are washed out after fewminutes given the in a age-dependent
manner shown in Cao and Harris 2012.

6.2. THE LIMITS OF NON-DYNAMICAL MEASURES TO PREDICT PLASTICITY (FAILED ATTEMPT) 115
Figure 6.2: O’Connor et al. 2005 experiment dissecting the CaMKII and CaN roles. A) Mean plasticity weight induced by 3x100
presynaptic pulses separated by 5 minutes using O’Connor et al. 2005’s experimental conditions with age fixed at P21. B) Best fit from
model to data. C) O’Connor et al. 2005 data showing the effect of inhibiting CaN or CaMKII.
LTP was prevalent (Figure 6.2A under the red bottom line). Given the possible
qualitative changes in the temperature range, precise temperature control would
be more useful to identify frequency-dependent changes.
O’Connor et al. 2005 argument was that CaMKII controls LTP and CaN LTD. In
Figure 6.2C, their data on inhibiting these enzymes showed how the FDP would
be modified. However, given the qualitative temperature changes range that the
model has identified, such experiments need to be better constrained. Our model
does not reproduce data in Figure 6.2C since the CaMKII, or CaN inhibition effects
could not be determined.
6.2 The limits of non-dynamical measures to predict plas-ticity (failed attempt)
Before developing the geometrical readout in the main publication, a strategy
similar to the one in Blackwell et al. 2019 to predict plasticity was attempted. The
simulated dynamics are collapsed into a single value (e.g. mean or median), and
the prediction part would be based on the separability between outcome classes
(LTP, LTD and no change) as shown in Figure 6.3. We tested the separability of
different measures such as integral, max value, mean, median using Tigaret et al.
2016 protocols. We noticed that certain protocols were too overlapped (gray re-
gion) to be suitable for multiclass classifiers. In Blackwell et al. 2019 the plasticity
prediction between pathological and healthy were done by averaging a protein in
a given time interval, the shortcomings of this approach could be addressed by
our geometrical threshold which also can be used to detect dynamical differences
in protein dynamics without having the information collapsed in a single value.

116 CHAPTER 6. ADDITIONAL RESULTS AND DISCUSSION
Figure 6.3: Comparison between measures derived from the simulated dynamics for the Tigaret et al. 2016 data. The grey
region indicates an overlap in between different classes of plasticity outcomes (LTP, LTD and NC). A) Scatter plot between CaN and CaMKII
integral. The axis was divided by 1e6 only to see axis ticks better (also in panel C). B) Scatter plot between CaMKII and CaN amplitude. C)
Scatter plot between CaM amplitude and Ca integral.
6.3 How stochasticity affects the model
6.3.1 Averaged and discrete vesicle release
Part of the computational neuroscience models uses averages as input (Tsodyks
et al. 1998). However, the vesicle release in nature has an all-or-none behaviour
(or discrete multivesicular release). Here we will test the differences between a
discrete presynaptic release used in the article and an averaged presynaptic re-
lease. The left panel in Figure 6.4A shows the glutamate concentration between
the discrete release that mimics a single vesicle and the average input estimated
from our presynaptic model. Figure 6.4A illustrates the difference of the activa-
tion on these two approaches in the model, only changing the presynaptic input.
Note in Figure 6.4A (Left) that since glutamate concentration is never zero for
the averaged release, the enzymes elicited with the 1Pre1Post10 protocol from
Tigaret et al. 2016 will be more activated as shown in Figure 6.4B (Right). Using
an averaged stimulation as input may cause overstimulation since failures never
occur. Also, the zero glutamate concentration is not reached, as shown in Figure
6.4A (Left). Thus, this experiment suggests that averaged inputs used in neuron
networks may be outside the glutamate concentration a synapse usually experi-
ences. The assumption that the neuron experiences an averaged concentration
of glutamate may not be equivalent to stimulating a synapse with an averaged
input.
6.3.2 Comparison with a deterministic version of the model
To show the relevance of stochasticity and to evaluate if it is possible to have a
faster simulation, a deterministic version of the model was made and tested using

6.4. POSSIBLE INTERACTIONS BETWEEN LASER-TISSUE WARMING AND CA2+ DYE 117
Figure 6.4: Comparison of stochastic and deterministic versions of the model. And a comparison between discrete andaveraged release.. A) Left, discrete release (green) and averaged release. Right, enzymes activation using the different approaches. B)
Comparison between a fully stochastic model (with discrete release), a deterministic version (with discrete release), and a deterministic
version (with averaged release). C) Enzymatic baseline differences between stochastic and deterministic model versions given the external
Ca2+.
the 1Pre1Post10 protocol from Tigaret et al. 2016. All Markov chains described
in the methods 5.4 were implemented as a first-order chemical reaction. Figure
6.4B shows a comparison between the deterministic (purple lines) and stochastic
version (yellow lines) using both discrete release and also a deterministic version
using averaged release (green). Note that the deterministic and stochastic simu-
lations using discrete release are slightly similar. It was identified that the source
of this difference comes from the T-type flickering, which is continuously acti-
vated due to its low-voltage threshold (Magee and Johnston 1995). Meanwhile,
other VGCCs, NMDAr and AMPAr, had little impact since their contribution are
only at discrete times (pre and post spikes). Since we identified the T-type chan-
nel as the most relevant stochasticity source, we tested how the experimental
conditions affect the versions of the model. Figure 6.4C shows how the CaN and
CaMKII average baseline activity diverge for the model versions. When [Ca2+]o
increases, it amplifies the T-type long-term fluctuations on Ca2+ and affects the
Ca2+-binding enzymes resting concentrations.
6.4 Possible interactions between laser-tissuewarming andCa2+ dye
Fluorescent dyes revolutionized how we study neuronal functions (Knot et al.
2005); it allowed one to visualize Ca2+ and proteins by exciting these dyes, for
instance, with a laser. However, as with any other method that perturbs what is
being observed, this method comes with drawbacks. Since the fluorescent dye
binds to Ca2+, it modifies its diffusion properties (Maravall et al. 2000) and interac-
tions with Ca2+-dependent pathways (Zhang et al. 2018). For instance, as noted
by Zhang et al. 2018 Ca2+ dye disrupts interaction with the SK channel, which has

118 CHAPTER 6. ADDITIONAL RESULTS AND DISCUSSION
Figure 6.5: Dye implementation comparison. A) Tigaret Ca2+ measurements of according to the protocols on top th row. B) Ca2+
with
dye, temperature increased and SK conductance set to zero. C) Ca2+
without the dye.
a Ca2+ and voltage-dependent activation. Also, plasticity protocols with and with-
out the dye can display qualitative differences as shown by Mulkey and Malenka
1992. This experiment suggests that calcium dynamics observed with dye should
carefully be considered (Maravall et al. 2000). For instance, in the Figure 6.5A-B,
the protocols 1Pre2Post50 and 2Post1Pre50 from Tigaret et al. 2016 have similar
Ca2+ dye curves and produce different plasticity outcomes (without the dye). Our
model better reproduces the dye curves when the temperature is increased and
the SK channel contribution is set to zero (Zhang et al. 2018). Also, in Figure 6.5C,
the simulations predict that Tigaret et al. 2016 protocols have different shapes
without the dye.
Furthermore, a concerning aspect of fluorescent dyes is the photobleaching
or ablation caused by laser stimulation. Given the frequency, laser wavelength
and duration, one can rapidly increase the temperature in neural tissue (Picot
et al. 2018) and modify the kinetics and Ca2+ source dynamics being observed
(Podgorski and Ranganathan 2016; Ebbesen and Bruus 2012; Oliver et al. 2000).
Strategies to measure Ca2+ fluorescence with high temporal resolution and man-
age heat transfer effects still need to be developed (Schmidt and Oheim 2018).
6.5 In vivo-like modelling
Since the experimental discovery of STDP (Markram et al. 2011) it has been hy-
pothesized whether it is a relevant framework to understand in vivo spiking pat-

6.5. IN VIVO-LIKE MODELLING 119
terns. For instance, Froemke and Dan 2002 suggested that in vivo plasticity can-
not be explained by only the delay time between pre and postsynaptic spikes
since it disregards the history of previous spikes. Despite the possible lack of
relevance for physiological learning, the STDP framework is widely used in neuro-
morphic computing sided by BCM. Graupner et al. 2016, using an irregular STDP
with Poisson spikes simulated an in vivo-like firing, concluded that the plasticity-
dependence over the delay time is reduced. Another study using in vivo-likefiring perturbed the delay time of the spike pairs (Cui et al. 2018). They show
that perturbing the delay times reduces the LTP magnitude. Our model observed
that depending on which perturbation is applied to the STDP firing structure, LTP
could be either enhanced or abolished (see article Figure 7). Therefore, observing
plasticity through one variable, such as the delay time, could be insufficient to
explain in vivo firing. Also, the perturbing regular firing patterns to approximate
in vivo-like firing is a limited approach enforced by data scarcity. However, new
in vivo plasticity datasets (Ahnaou et al. 2020) offer a singular opportunity to
test the robustness of current models for plasticity. For instance, "replay exper-
iments" (Isaac et al. 2009; Bittner et al. 2017) or those only recorded with local
field potential (Ahnaou et al. 2020). New sampling methods such as optogenet-
ics STDP would allow the expansion of in vivo plasticity experiments (Anisimova
et al. 2019).
6.5.1 Sleep stimulation patterns
Sleep is required for memory consolidation (Whalley 2019) and the induction
of long-term plasticity forms. However, the participation of characteristic neu-
ronal oscillations is not fully understood. During sleep, the neural environment
changes, as the Ca2+ sources and its modulators (McCauley et al. 2020; Gordon
2004). For instance, the astrocytes retract from the tripartite synapse modifying
how glutamate is recycled during the sleep (Haydon 2017). Also, brain tempera-
ture oscillates, causing kinetic changes in the Ca2+ sources (Sela et al. 2021). A
characteristic sleep oscillation, for instance, the non-rapid eyes movement phase
(non-REM), displays activity spindles (or sharp-wave ripples, Sadowski et al. 2016)
which induces LTP, as demonstrated by replay experiments in slices and in vivo(Rosanova and Ulrich 2005). It is hypothesised that sleep’s primary function is
to renormalise strengthened synapses by weakening (LTD) synaptic efficiencies
that were strengthened during wakefulness (Marcos Gabriel Frank 2012; Vivo et
al. 2019). Conversely, sleep deprivation shows reduced neuronal excitability, op-
posite to the strengthening hypothesis (Borbély et al. 2018). Our model could

120 CHAPTER 6. ADDITIONAL RESULTS AND DISCUSSION
potentially be used to study replayed firing patterns related to sleep, possibly by
including neuromodulators related to sleep. It can also be expanded by adding
diffusion of enzymes, which could contribute to understand the interplay between
neighbouring spines and investigate homeostatic plasticity (Seibt and Marcos G
Frank 2019). Since sleep has a homeostatic role, the activation of a dendritic
spine cluster during sleep can cause enzymes to diffuse out from the spine neck.
For instance, Calcineurin can reach the dendritic shaft, but CaMKII has a shorter
diffusion range, limiting the interaction with neighbouring spines (Fujii et al. 2013;
Yasuda 2017). Yet, since sleep is differently important during development (Vivo
et al. 2019), coding for age should be a desirable model property when investi-
gating plasticity related to sleep.
Figure 6.6: Model hypothesis for sleep under different age and temperature conditions. A) Stimulation pattern representing delta
waves during sleep. B) Approximation of temperature oscillation during development based on Wood et al. 2016; McCauley et al. 2020. C)
Mean weight change using the pattern in panel for different ages and temperatures.
An ideal way to study sleep patterns using the model would be with CA3-CA1
spikes recorded during behaviour, such as the data collected by Sadowski et
al. 2016. Here, an empirical sleep-wave pattern was build based on the low-
frequency delta (1-4 Hz) (Siapas and Wilson 1998). Basically, a 100 pulses burst
at 20 Hz presynaptic bursts separated by 1 Hz in 12 epochs as in Figure 6.6A. The
experimental conditions used were physiologically plausible with 1.5 mM [Ca2+]o
and 1.2 mM [Mg2+]o (Inglebert et al. 2020). To evaluate how physiological con-
ditions constrain plasticity, age-dependent temperature regulation (Wood et al.
2016) was empirically estimated (Figure 6.6B). Figure 6.6C shows that a sleep-
wave pattern induces LTD during the first weeks of life, and later the same slow-
wave pattern induces less LTD (Figure 6.6C). The experiment in Figure 6.6C may
reflect the synaptic pruning phase (Semple et al. 2013) in the rat development in
which the synaptogenesis is up-regulated, and it is counterbalanced by synaptic
elimination completed after P21-28 in rats (Semple et al. 2013). Note that further
investigation, diversifying the firing patterns is necessary to tackle the develop-
ment of sleep in rats since the oscillations (e.g. NREM, REM) are not the same

REFERENCES 121
Figure 6.7: Behavioral time scale synaptic plasticity (BTSP). Plasticity states was changed set to 300. Bittner’s parameters used to
tune the model were 35C, 2 mM [Ca
2+]o, 1 mM [Mg
2+]o (0.7 mM gave better fit), P50, 200 µm from the soma. A) The geometrical threshold
using the protocol from Bittner et al. 2017. B) A comparison between the model and data from the BTSP curve discovered by Bittner et al.
2017.
through the first weeks of life (Marcos G Frank et al. 2017).
6.5.2 Behavioral time scale synaptic plasticity (BTSP)
During behaviour, the hippocampus continuously maps the space. However, the
plasticity rules forming spatial representation are not fully understood. An answer
was proposed by Bittner et al. 2017. They discovered a synaptic rule for place field
(Hartley et al. 2000) formation, which does not require immediate coincidence
between pre and post-firing patterns, exceeding the canonical STDP delay time
(Bi and Poo 1998) (see Figure 6.7). Since our model has integrative properties
granted by slow decaying enzymes, we would like to test if it can reproduce the
Bittner et al. 2017 replay experiment. Although our model has not been designed
for mice experiments, it can still reproduce Bittner et al. 2017 BTSP curve. This
preliminary result suggests that the same phenomenon may occur in rats. This
result can motivate other behavioural time scale rules to be discovered. Bittner
et al. 2017 mentions the possible signalling pathways evolved, and our model
offers a dynamical explanation using CaN and CaMKII combined activity as shown
in Figure 6.7A.
References
Ahnaou, A, E White, R Biermans, NV Manyakov, and WHIM Drinkenburg (2020). “In Vivo Plastic-
ity at Hippocampal Schaffer Collateral-CA1 Synapses: Replicability of the LTP Response and
Pharmacology in the Long-Evans Rat”. In: Neural Plasticity 2020.
Anisimova, Margarita, Bas van Bommel, J Simon Wiegert, Marina Mikhaylova, Thomas Glenn Oert-
ner, and Christine E Gee (2019). “Long vs short-term synaptic learning rules after optogenetic
spike-timing-dependent plasticity”. In: bioRxiv, p. 863365.

122 CHAPTER 6. ADDITIONAL RESULTS AND DISCUSSION
Bear, Mark F, Sam F Cooke, Karl Peter Giese, Bong-Kiun Kaang, Mary B Kennedy, Ji-il Kim, Richard
GM Morris, and Pojeong Park (2018). “In memoriam: John Lisman–commentaries on CaMKII as
a memory molecule”. In: Molecular brain 11.1, pp. 1–12.
Bi, Guo-qiang and Mu-ming Poo (1998). “Synaptic modifications in cultured hippocampal neu-
rons: dependence on spike timing, synaptic strength, and postsynaptic cell type”. In: Journalof neuroscience 18.24, pp. 10464–10472.
Bittner, Katie C, Aaron D Milstein, Christine Grienberger, Sandro Romani, and Jeffrey C Magee
(2017). “Behavioral time scale synaptic plasticity underlies CA1 place fields”. In: Science 357.6355,pp. 1033–1036.
Blackwell, Kim T, Armando G Salinas, Parul Tewatia, Brad English, Jeanette Hellgren Kotaleski,
and David M Lovinger (2019). “Molecular mechanisms underlying striatal synaptic plasticity:
relevance to chronic alcohol consumption and seeking”. In: European Journal of Neuroscience49.6, pp. 768–783.
Borbély, Sándor, Ildikó Világi, Zsófia Haraszti, Örs Szalontai, Tünde Hajnik, Attila Tóth, and László
Détári (2018). “Sleep deprivation decreases neuronal excitability and responsiveness in rats
both in vivo and ex vivo”. In: Brain research bulletin 137, pp. 166–177.
Cao, Guan and Kristen M Harris (2012). “Developmental regulation of the late phase of long-
term potentiation (L-LTP) and metaplasticity in hippocampal area CA1 of the rat”. In: Journal ofneurophysiology 107.3, pp. 902–912.
Chang, Jui-Yun, Y. Nakahata, Y. Hayano, and R. Yasuda (2019). “Mechanisms of Ca 2+/calmodulin-
dependent kinase II activation in single dendritic spines”. In: Nature Communications 10.1,
p. 2784.
Chang, Jui-Yun, Paula Parra-Bueno, Tal Laviv, Erzsebet M Szatmari, Seok-Jin R Lee, and Ryohei Ya-
suda (2017). “CaMKII autophosphorylation is necessary for optimal integration of Ca2+ signals
during LTP induction, but not maintenance”. In: Neuron 94.4, pp. 800–808.
Coultrap, Steven J and K Ulrich Bayer (2012). “CaMKII regulation in information processing and
storage”. In: Trends in neurosciences 35.10, pp. 607–618.Cui, Yihui, Ilya Prokin, Alexandre Mendes, Hugues Berry, and Laurent Venance (2018). “Robustness
of STDP to spike timing jitter”. In: Scientific reports 8.1, pp. 1–15.Ebbesen, Christian L and Henrik Bruus (2012). “Analysis of laser-induced heating in optical neu-
ronal guidance”. In: Journal of neuroscience methods 209.1, pp. 168–177.Frank, Marcos G, Norman F Ruby, Horace Craig Heller, and Paul Franken (2017). “Development of
circadian sleep regulation in the rat: a longitudinal study under constant conditions”. In: Sleep40.3.
Frank, Marcos Gabriel (2012). “Erasing synapses in sleep: is it time to be SHY?” In: Neural plasticity2012.
Froemke, Robert C and Yang Dan (2002). “Spike-timing-dependent synaptic modification induced
by natural spike trains”. In: Nature 416.6879, pp. 433–438.
Fujii, Hajime, Masatoshi Inoue, Hiroyuki Okuno, Yoshikazu Sano, Sayaka Takemoto-Kimura, Kazuo
Kitamura, Masanobu Kano, and Haruhiko Bito (2013). “Nonlinear decoding and asymmetric
representation of neuronal input information by CaMKIIα and calcineurin”. In: Cell reports 3.4,pp. 978–987.
Gordon, Christopher J (2004). “Effect of cage bedding on temperature regulation and metabolism
of group-housed female mice”. In: Comparative medicine 54.1, pp. 63–68.

REFERENCES 123
Graupner, Michael, Pascal Wallisch, and Srdjan Ostojic (2016). “Natural firing patterns imply low
sensitivity of synaptic plasticity to spike timing compared with firing rate”. In: Journal of Neu-roscience 36.44, pp. 11238–11258.
Hartley, Tom, Neil Burgess, C Lever, F Cacucci, and J O’keefe (2000). “Modeling place fields in
terms of the cortical inputs to the hippocampus”. In: Hippocampus 10.4, pp. 369–379.Haydon, Philip G (2017). “Astrocytes and the modulation of sleep”. In: Current opinion in neuro-
biology 44, pp. 28–33.
Inglebert, Yanis, Johnatan Aljadeff, Nicolas Brunel, and Dominique Debanne (2020). “Synaptic
plasticity rules with physiological calcium levels”. In: Proceedings of the National Academy ofSciences. issn: 0027-8424. doi: 10.1073/pnas.2013663117.
Isaac, John TR, Katherine A Buchanan, Robert U Muller, and Jack R Mellor (2009). “Hippocam-
pal place cell firing patterns can induce long-term synaptic plasticity in vitro”. In: Journal ofNeuroscience 29.21, pp. 6840–6850.
Kipanyula, Maulilio John, Wahabu Hamisi Kimaro, and Paul F Etet (2016). “The emerging roles of
the calcineurin-nuclear factor of activated T-lymphocytes pathway in nervous system functions
and diseases”. In: Journal of aging research 2016.
Knot, Harm J et al. (2005). “Twenty years of calcium imaging: cell physiology to dye for”. In:
Molecular interventions 5.2, p. 112.Lisman, John (1985). “A mechanism for memory storage insensitive to molecular turnover: a
bistable autophosphorylating kinase”. In: Proceedings of the National Academy of Sciences82.9, pp. 3055–3057.
— (1989). “Amechanism for the Hebb and the anti-Hebb processes underlying learning andmem-
ory”. In: Proceedings of the National Academy of Sciences 86.23, pp. 9574–9578.Magee, Jeffrey C and Daniel Johnston (1995). “Characterization of single voltage-gated Na+ and
Ca2+ channels in apical dendrites of rat CA1 pyramidal neurons.” In: The Journal of physiology487.1, pp. 67–90.
Maravall, áM, ZFMainen, BL Sabatini, and K Svoboda (2000). “Estimating intracellular calcium con-
centrations and buffering without wavelength ratioing”. In: Biophysical journal 78.5, pp. 2655–2667.
Markram, Henry,WulframGerstner, and Jesper Sjostrom (2011). “A history of spike-timing-dependent
plasticity”. In: Frontiers in synaptic neuroscience 3, p. 4.
McCauley, John P et al. (2020). “Circadian modulation of neurons and astrocytes controls synaptic
plasticity in hippocampal area CA1”. In: Cell reports 33.2, p. 108255.Michalski, Paul J (2014). “First demonstration of bistability in CaMKII, a memory-related kinase”.
In: Biophysical journal 106.6, pp. 1233–1235.Michalski, PJ (2013). “The delicate bistability of CaMKII”. In: Biophysical journal 105.3, pp. 794–
806.
Mulkey, Rosel M and Robert C Malenka (1992). “Mechanisms underlying induction of homosynaptic
long-term depression in area CA1 of the hippocampus”. In: Neuron 9.5, pp. 967–975.
O’Connor, Daniel H, Gayle MWittenberg, and Samuel S-HWang (2005). “Dissection of bidirectional
synaptic plasticity into saturable unidirectional processes”. In: Journal of neurophysiology 94.2,pp. 1565–1573.

124 CHAPTER 6. ADDITIONAL RESULTS AND DISCUSSION
Oliver, Ann E, Gary A Baker, Robert D Fugate, Fern Tablin, and John H Crowe (2000). “Effects of
temperature on calcium-sensitive fluorescent probes”. In: Biophysical journal 78.4, pp. 2116–2126.
Otmakhov, Nikolai, Shaurav Regmi, and John Lisman (2015). “Fast decay of CaMKII FRET sensor
signal in spines after LTP induction is not due to its dephosphorylation”. In: PLoS One 10.6,
e0130457.
Picot, Alexis et al. (2018). “Temperature rise under two-photon optogenetic brain stimulation”. In:
Cell reports 24.5, pp. 1243–1253.Podgorski, Kaspar and Gayathri Ranganathan (2016). “Brain heating induced by near-infrared
lasers during multiphoton microscopy”. In: Journal of neurophysiology 116.3, pp. 1012–1023.
Rosanova, Mario and Daniel Ulrich (2005). “Pattern-specific associative long-term potentiation
induced by a sleep spindle-related spike train”. In: Journal of Neuroscience 25.41, pp. 9398–
9405.
Sadowski, Josef HLP, Matthew W Jones, and Jack R Mellor (2016). “Sharp-wave ripples orches-
trate the induction of synaptic plasticity during reactivation of place cell firing patterns in the
hippocampus”. In: Cell reports 14.8, pp. 1916–1929.Schmidt, Elke and Martin Oheim (2018). “Two-photon imaging induces brain heating and calcium
microdomain hyperactivity in cortical astrocytes”. In: bioRxiv, p. 321091.Seibt, Julie and Marcos G Frank (2019). “Primed to sleep: the dynamics of synaptic plasticity across
brain states”. In: Frontiers in systems neuroscience 13, p. 2.
Sela, Yaniv, Marieke MB Hoekstra, and Paul Franken (2021). “Sub-minute prediction of brain tem-
perature based on sleep–wake state in the mouse”. In: Elife 10, e62073.
Semple, Bridgette D, Klas Blomgren, Kayleen Gimlin, DonnaM Ferriero, and Linda J Noble-Haeusslein
(2013). “Brain development in rodents and humans: Identifying benchmarks of maturation and
vulnerability to injury across species”. In: Progress in neurobiology 106, pp. 1–16.
Siapas, Athanassios G and Matthew A Wilson (1998). “Coordinated interactions between hip-
pocampal ripples and cortical spindles during slow-wave sleep”. In: Neuron 21.5, pp. 1123–
1128.
Tigaret, Cezar M, Valeria Olivo, Josef HLP Sadowski, Michael C Ashby, and Jack R Mellor (2016).
“Coordinated activation of distinct Ca 2+ sources and metabotropic glutamate receptors en-
codes Hebbian synaptic plasticity”. In: Nature communications 7, p. 10289.Tsodyks, Misha, Klaus Pawelzik, and HenryMarkram (1998). “Neural networks with dynamic synapses”.
In: Neural computation 10.4, pp. 821–835.
Urakubo, Hidetoshi, Miharu Sato, Shin Ishii, and Shinya Kuroda (2014). “In vitro reconstitution of
a CaMKII memory switch by an NMDA receptor-derived peptide”. In: Biophysical journal 106.6,pp. 1414–1420.
Vivo, Luisa de et al. (2019). “Evidence for sleep-dependent synaptic renormalization in mouse
pups”. In: Sleep 42.11, zsz184.
Whalley, Katherine (2019). “Sleep to forget”. In: Nature Reviews Neuroscience 20.12, pp. 716–
717.
Wood, Thomas, Damjan Osredkar, Maja Puchades, Elke Maes, Mari Falck, Torun Flatebø, Lars Wal-
løe, Hemmen Sabir, and Marianne Thoresen (2016). “Treatment temperature and insult sever-
ity influence the neuroprotective effects of therapeutic hypothermia”. In: Scientific reports 6.1,pp. 1–12.

REFERENCES 125
Yasuda, Ryohei (2017). “Biophysics of biochemical signaling in dendritic spines: implications in
synaptic plasticity”. In: Biophysical journal 113.10, pp. 2152–2159.Zhang, Xiao-Dong et al. (2018). “Coupling of SK channels, L-type Ca 2+ channels, and ryanodine
receptors in cardiomyocytes”. In: Scientific reports 8.1, p. 4670.

Chapter 7
Discussion and conclusion
The following discussion extends the one in the article and presents other argu-
ments, limitations and questions the model could address.
Synaptic models can propose new questions and testable predictions, and in
some cases, anticipate experimental advances on how learning and memory oc-
cur (Sejnowski 1999). Given the model scope, it is possible to accommodate the
diversity of plasticity experimental outcomes or hypothesize over synaptic mech-
anisms interaction. In this thesis, a new model of synapse was proposed to unify
usually neglected aspects affecting plasticity outcomes (as reviewed in chapter
3). Thus, a new synaptic rule is provided to link simulation and experiments using
the combined activity of CaN and CaMKII interpreted with a geometrical readout.
It is not feasible for a model to include all differences between plasticity experi-
ments since electrophysiology methods are highly heterogeneous (Tebaykin et al.
2018). However, an effort is necessary to model the differences which can con-
tribute to understanding plasticity. For instance Letzkus et al. 2006 and Sjöström
et al. 2001 differ by 0.5 mM [Ca2+]o and are reproduced in Ebner et al. 2019’s
cortical model without any model adjustment for that. [Ca2+]o is critical since it
modifies the release probability and Ca2+ influx, and a 0.5 mM [Ca2+]o difference
can cause qualitative changes in the hippocampus (Inglebert et al. 2020). With a
model dedicated to identifying key experimental conditions, one can avoid pos-
sible contradictions and extend the number of covered experiments by the same
model. The model in this thesis predicts that some stimulation protocols have
sharper transitions (see plasticity maps in the article) depending on the experi-
mental conditions (e.g. [Ca2+]o inferior to 0.5 mM), thus, pointing out which pa-
rameters are more sensitive for ex vivo experiments and potentially improving
the experimental design.
ex vivo experiments can be considered as extreme cases since the brain ex-
tracellular environment needs to be recreated. Usually, the firing patterns are
126

7.1. GEOMETRICAL READOUT 127
different from in vivo and are highly correlated (i.e. regular). The model devel-
oped here can predict in vivo-like learning (e.g. Bittner et al. 2017) since it can bedirectly adjusted to follow physiological conditions. For instance, using Poisson
spikes, i.e. simplified representation of in vivo firing ignoring bursts, the model
found that an LTP window is maximal when the postsynaptic neuron fires at 10Hz
for any presynaptic frequency (between θ and α rhythms) (Graupner et al. 2016).
Since the model codes for development aspects, it is possible to predict that such
LTP window around the alpha-theta band emerges between the second and third
week of life. This coincides with the beginning of rats’ exploratory behaviour in
which theta oscillations on EEG (4-10 Hz) are observed (Vanderwolf 1969; Thiels
et al. 1990). The model also predicts that two STDP protocols with firing patterns
producing too weak or strong enzyme activation to generate LTP (Tigaret et al.
2016) can converge to the LTP region once they are jittered, suggesting that un-
der irregular firing (with similar frequency), the specificity of spiking times or the
delay are less relevant for in vivo-like plasticity.
7.1 Geometrical readout
The new synaptic rule presented in this thesis borrows the concept of orbits from
dynamical systems to demonstrate the possibility of differentiating plasticity pro-
tocols using a stochastic model of postsynaptic Ca2+-cascade. Such synaptic in-
duction rule states that the plasticity outcomes depends on the time spent by the
joint CaMKII and CaN activity inside the plasticity regions and activate the LTP or
LTD rates. This can be interpreted as an enzymatic version of the Ca2+ duration
hypothesis (Evans and Blackwell 2015) which claims that high and brief Ca2+ tran-
sients induce plasticity. Meanwhile, long and moderate levels induce depression.
A Goldilocks hypothesis for plasticity (analogy with the Goldilocks principle) can
be formulated from the geometrical threshold and can be tested through FRET
probes: the enzymatic activity should not be excessively high or too low to in-duce plasticity, instead, it should reach and spend the right time inside the LTDor LTP plasticity region.
7.2 The role of stochasticity, is it a bug or a feature?
Neurons produce spikes that are not transmitted, resulting in synaptic failures
(Rusakov et al. 2020). Hypothesis on the role of these failures are many: the failed
spikes activate post to pre signalling, e.g. nitric oxide or retrograde endocannabi-

128 CHAPTER 7. DISCUSSION AND CONCLUSION
noid pathways (Castillo et al. 2012); failed spikes form a self-communication
within neuron’s distant structures (dendrites, axon) (Short et al. 2017); that the
absence of spikes is also part of the information between neurons. Examples of
how failures are relevant or not is dubious, for instance, the hydra vulgaris thrivewith low synaptic failure rates (Dupre and Yuste 2017). Meanwhile, studies in rats
suggest that spikes are the exception (Borst 2010) due to high synaptic failure
rate in vivo. However, brain regions have different synaptic failure rate given
their function (Joris and Trussell 2018), and present redundancy with multivesic-
ular release (Molnar et al. 2016; Rudolph et al. 2015). Also, various behaviours
are altered when failures increase (Prosser and Nelson 1981). The open question
on why neurons produce spikes that will not result in a vesicle release requires
more investigation. The model present here can capture the specificity of ex-
perimental conditions and firing adaptations (e.g. STD) in a stochastic manner
and may be useful in raising new questions on the role of stochasticity. For in-
stance, a hypothesis raised by the model, not discussed in the paper, is whether
CaMKII autophosphorylation acts as a spike history reservoir against transmis-
sion failures. Once the failures start to be prevalent, the self-sustained activity
prevents a total forgetting of the previously integrated spikes by the enzyme ac-
tivation, allowing better integration of sparse spikes. A contrast with the mutant
CaMKII without the autophosphorylation domain shows a CaMKII which decays
faster and impairs learning. This hypothetical feature would allow that stimuli to
be integrated even after the short-term depression predominate (more failures).
Also, it could be useful during bursts in which vesicles needs time to be refiled
every high-frequency event-cycle, for instance, as in the behavioural time scale
plasticity or sleep-wave patterns (Bittner et al. 2017) shown in Figure 6.7.
7.3 Limitations
Considering the models in the mini-review of chapter 3, the model developed
covers firing patterns structures, with extensive validation, and innovates in the
experimental conditions. However, it falls short in the localization aspects, mainly
for morphology, non-neuronal cells (e.g. microglia and astrocytes), presynaptic
long-term plasticity and neuromodulators. The model is limited to only CA3-CA1
synapses from ex vivo studies. Meanwhile, abstract models, less constrained by
data, can be more easily adapted to other brain regions.
The model uses a single set of parameters to predict plasticity. However, this
may not be a valid assumption since plasticity dependent pathways are likely to
be affected by experimental conditions. That was done for the sake of simplicity

7.4. FUTURE DIRECTIONS 129
and readability. A contrasting example is shown by Chindemi et al. 2020 which
attributes to each synapse in a cortical neuron its own threshold system. Using
our framework, one could investigate,using glutamate uncaging and CaN-CaMKII
FRET probes, if the same synaptic rule is different or different synapses.
Another assumption is that enzymatic concentration is the same throughout
the lifespan. However, it is suggested that for pup rats, the CaMKII concentra-
tion is reduced. An unchanging concentration is assumed in our model due to
the lack of precise measurements. Also, despite the model robustness to experi-
mental heterogeneities, a sensitivity analysis was not carried out to observe how
robust the model is for parameter perturbations, such as variations in the num-
bers of receptors and ion channel (Marder and Taylor 2011). This is an important
aspect to consider since stochastic effects on plasticity outcomes can have mul-
tiple sources: from the inherent flickering of receptors, vesicle release failures,
different neurons, oscillations in the recording temperature.
Similarly to the fact that different parameters could equally fit neural data
(Marder and Taylor 2011), another modelling approach suggests that the num-
ber of different subtypes of ion channels allows a richer repertoire of neuron
dynamics (Schneider et al. 2021). The variability of ion channels in the model
developed is reduced with phenomenological modelling of BaP generation, and
only three types VGCCs subtypes (see Jedrzejewska-Szmek et al. 2017). Also,
such variability of expression is not fixed during the lifetime, Cizeron et al. 2020
and it was evaluated to be little differentiated during the infant and elder rats
and more diversified during adulthood. Also, the model lacks validation material
for older adult rats, which present different plasticity patterns from adults (Pinar
et al. 2017).
7.4 Future directions
The model developed in this thesis can unfold different projects. However, a
challenge of complex models is that they are difficult to replicate and scale-up.
A deterministic version of the model was in order to gain performance and to
evaluate the necessity of stochasticity, which showed to be most relevant for
the presynaptic release and the resting concentrations of enzymes (see Figure
6.3). It is important to reduce the model complexity, without losing its capabili-
ties, to make it more accessible. Another ongoing strategy is to make the model
available online by a web tool in which experimentalist could use it to plan their
experiments.
Another possibility is the application of the model to neuropathologies through

130 CHAPTER 7. DISCUSSION AND CONCLUSION
Ca2+ sources abnormalities. For instance, tau protein binds to the neurotrans-
mitter vesicles and decrease release probability at high frequencies (Zhou et al.
2017). Also, the model can study APP intracellular interactions to evaluate the
plasticity effects with an upregulated Ca2+ influx. The study of disruption of a
healthy synapse would make more sense if done with associated behaviours or
in vivo-like firing patterns, such as those related to sleep, exploration and other
behaviours. Also, a future direction for the model could be to include patholo-
gies by having the contribution of different neuromodulators (e.g. acetylcholine
Isaac et al. 2009) and glia cells (Nadkarni and Jung 2007). Also, having astrocyte
contribution would be useful to understand how Ca2+-based communication in
astrocytes modulates synaptic rules in neurons (Verveyko et al. 2021). The limits
between a pathological and healthy Ca2+ influx should more precisely defined.
Finally, a future direction is to formalize an algorithm to detect dynamical pat-
terns. This could be relevant to explore multiple dynamical biophysical interac-
tions automatically. This could be achieved by using the concept of time spent
in a region (or volume) to understand how orbits produce different outcomes in
a similar way to the supervised learning algorithms (Friedman et al. 2001). Also,
an unsupervised learning algorithm could be potentially implemented using a ge-
ometrical threshold by attributing a criterion for class formation given the orbits
distance or how they share the same space.
References
Bittner, Katie C, Aaron D Milstein, Christine Grienberger, Sandro Romani, and Jeffrey C Magee
(2017). “Behavioral time scale synaptic plasticity underlies CA1 place fields”. In: Science 357.6355,pp. 1033–1036.
Borst, J Gerard G (2010). “The low synaptic release probability in vivo”. In: Trends in neurosciences33.6, pp. 259–266.
Castillo, Pablo E, Thomas J Younts, Andrés E Chávez, and Yuki Hashimotodani (2012). “Endo-
cannabinoid signaling and synaptic function”. In: Neuron 76.1, pp. 70–81.
Chindemi, Giuseppe et al. (2020). “A calcium-based plasticity model predicts long-term potentia-
tion and depression in the neocortex”. In: bioRxiv.Cizeron, Mélissa, Zhen Qiu, Babis Koniaris, Ragini Gokhale, Noboru H Komiyama, Erik Fransén, and
Seth GN Grant (2020). “A brain-wide atlas of synapses across the mouse lifespan”. In: Science.Dupre, Christophe and Rafael Yuste (2017). “Non-overlapping neural networks in Hydra vulgaris”.
In: Current Biology 27.8, pp. 1085–1097.
Ebner, Christian, Claudia Clopath, Peter Jedlicka, and Hermann Cuntz (2019). “Unifying Long-Term
Plasticity Rules for Excitatory Synapses by Modeling Dendrites of Cortical Pyramidal Neurons”.
In: Cell Reports 29.13, pp. 4295–4307.

REFERENCES 131
Evans, RC and KT Blackwell (2015). “Calcium: amplitude, duration, or location?” In: The BiologicalBulletin 228.1, pp. 75–83.
Friedman, Jerome, Trevor Hastie, Robert Tibshirani, et al. (2001). The elements of statistical learn-ing. Vol. 1. 10. Springer series in statistics New York.
Graupner, Michael, Pascal Wallisch, and Srdjan Ostojic (2016). “Natural firing patterns imply low
sensitivity of synaptic plasticity to spike timing compared with firing rate”. In: Journal of Neu-roscience 36.44, pp. 11238–11258.
Inglebert, Yanis, Johnatan Aljadeff, Nicolas Brunel, and Dominique Debanne (2020). “Synaptic
plasticity rules with physiological calcium levels”. In: Proceedings of the National Academy ofSciences. issn: 0027-8424. doi: 10.1073/pnas.2013663117.
Isaac, John TR, Katherine A Buchanan, Robert U Muller, and Jack R Mellor (2009). “Hippocam-
pal place cell firing patterns can induce long-term synaptic plasticity in vitro”. In: Journal ofNeuroscience 29.21, pp. 6840–6850.
Jedrzejewska-Szmek, Joanna, Sriraman Damodaran, Daniel B Dorman, and Kim T Blackwell (2017).
“Calcium dynamics predict direction of synaptic plasticity in striatal spiny projection neurons”.
In: European Journal of Neuroscience 45.8, pp. 1044–1056.
Joris, Philip X and Laurence O Trussell (2018). “The calyx of Held: a hypothesis on the need for
reliable timing in an intensity-difference encoder”. In: Neuron 100.3, pp. 534–549.
Letzkus, Johannes J, Björn M Kampa, and Greg J Stuart (2006). “Learning rules for spike timing-
dependent plasticity depend on dendritic synapse location”. In: Journal of Neuroscience 26.41,pp. 10420–10429.
Marder, Eve and Adam L Taylor (2011). “Multiple models to capture the variability in biological
neurons and networks”. In: Nature neuroscience 14.2, pp. 133–138.
Molnar, Gabor, Márton Rózsa, Judith Baka, Noemi Holderith, Pal Barzo, Zoltan Nusser, and Gábor
Tamás (2016). “Human pyramidal to interneuron synapses are mediated by multi-vesicular
release and multiple docked vesicles”. In: Elife 5, e18167.
Nadkarni, Suhita and Peter Jung (2007). “Modeling synaptic transmission of the tripartite synapse”.
In: Physical biology 4.1, p. 1.
Pinar, Cristina, Christine J Fontaine, Juan Triviño-Paredes, Carina P Lottenberg, Joana Gil-Mohapel,
and Brian R Christie (2017). “Revisiting the flip side: long-term depression of synaptic efficacy
in the hippocampus”. In: Neuroscience & Biobehavioral Reviews 80, pp. 394–413.Prosser, C Ladd and DO Nelson (1981). “The role of nervous systems in temperature adaptation
of poikilotherms”. In: Annual Review of Physiology 43.1, pp. 281–300.
Rudolph, Stephanie, Ming-Chi Tsai, Henrique Von Gersdorff, and Jacques I Wadiche (2015). “The
ubiquitous nature of multivesicular release”. In: Trends in neurosciences 38.7, pp. 428–438.Rusakov, Dmitri A, Leonid P Savtchenko, and Peter E Latham (2020). “Noisy synaptic conductance:
bug or a feature?” In: Trends in Neurosciences.Schneider, Marius, Albert Gidon, Jochen Triesch, Peter Jedlicka, and Hermann Cuntz (2021). “Bi-
ological complexity facilitates tuning of the neuronal parameter space”. In: bioRxiv. doi: 10.1101/2021.05.04.442120.
Sejnowski, Terrence J (1999). “The book of Hebb”. In: Neuron 24.4, pp. 773–776.
Short, Shaina M, Katerina D Oikonomou, Wen-Liang Zhou, Corey D Acker, Marko A Popovic, Dejan
Zecevic, and Srdjan D Antic (2017). “The stochastic nature of action potential backpropagation
in apical tuft dendrites”. In: Journal of neurophysiology 118.2, pp. 1394–1414.

132 CHAPTER 7. DISCUSSION AND CONCLUSION
Sjöström, Per Jesper, Gina G Turrigiano, and Sacha B Nelson (2001). “Rate, timing, and coopera-
tivity jointly determine cortical synaptic plasticity”. In: Neuron 32.6, pp. 1149–1164.
Tebaykin, Dmitry, Shreejoy J Tripathy, Nathalie Binnion, Brenna Li, Richard C Gerkin, and Paul
Pavlidis (2018). “Modeling sources of interlaboratory variability in electrophysiological proper-
ties of mammalian neurons”. In: Journal of neurophysiology 119.4, pp. 1329–1339.
Thiels, Edda, Jeffrey R Alberts, and Catherine P Cramer (1990). “Weaning in rats: II. Pup behav-
ior patterns”. In: Developmental Psychobiology: The Journal of the International Society forDevelopmental Psychobiology 23.6, pp. 495–510.
Tigaret, Cezar M, Valeria Olivo, Josef HLP Sadowski, Michael C Ashby, and Jack R Mellor (2016).
“Coordinated activation of distinct Ca 2+ sources and metabotropic glutamate receptors en-
codes Hebbian synaptic plasticity”. In: Nature communications 7, p. 10289.Vanderwolf, Case H (1969). “Hippocampal electrical activity and voluntary movement in the rat”.
In: Electroencephalography and clinical neurophysiology 26.4, pp. 407–418.
Verveyko, Darya V, Andrey Yu Verisokin, Dmitry E Postnov, and Alexey R Brazhe (2021). “Model-
ing of astrocyte networks: towards realistic topology and dynamics”. In: Frontiers in cellularneuroscience 15, p. 50.
Zhou, Lujia et al. (2017). “Tau association with synaptic vesicles causes presynaptic dysfunction”.
In: Nature communications 8.1, pp. 1–13.

Annexe 1
Simulation of jump processes
This annexe provides information on the stochastic processes used in this thesis.
The model has both stochastic and deterministic parts. That is, the model is
deterministic in between stochastic transitions (e.g. opening of AMPAr) satisfying
the following flow:
dxcdt
= F (xc, xd, µ), (1.1)
in which xc are the continuous variables evolving deterministically in between
discrete events and µ is a set of parameters. For example, continuous variables
are xc = (Vsp, Vdend, Vsoma, Ca, · · · ) ∈ Rc. At discrete times, transitions occurs with to-
tal rate Rtot(xc, xd, µ) between states of the Markov chains described in the article
methods 5.4. All the state variables are collected in xd, termed the discrete vari-
ables. For example, the states associated to the receptors and plasticity Markov
chain xd = (AMPA,NMDA, V GCC,LTP, LTD · · · ) ∈ Rd. This type of Markov process
belongs to the class of Piecewise deterministic Markov processes (PDMP) and are
extensively described in Davis 2018.
To simulate the synapse model as a stochastic process X, it is relevant to de-
scribe when the next jump will occur. The simulation of such process seems tricky
at first due to the interdependence between the variables, that is, the xd affects
the deterministic part, F (xc, xd, µ), and xc affects the total rate Rtot(xc, xd, µ). For
one to know when the process X jumps, the flow 1 must be determined. How-
ever, to know the flow 1, it is necessary to know when the process jumps, which
is equivalent to determine the length of the continuous domain. Fortunately, the
simulations of PDMP is well-reviewed, for example, in Graham and Talay 2013.
There are two classes of simulation methods. The first one is the most precise
and is called the rejection method. However, to work well, one needs to have
133

134 ANNEXE 1. ANNEXE: SIMULATION OF JUMP PROCESSES
a tight bound λ on the total rate: ∀xd, xc, Rtot(xc, xd, µ) ≤ λ. Given the intricacies
of your model, we have not been able to find a good bound λ, meaning that we
would have to reject a lot of "simulations", which increases the simulation time.
The other alternative for simulation is the true jump method which takes an inte-
gral equation to find the jump time.
Hence, for the simulation of our model, we appeal to the tricky twist Veltz 2015
to the "true jump method", which circumvents the need to solve the integral
equation by solving an ODE related to the flow 1 but of dimension c+1. Using this
new formulation to find the true jump opens the possibility to test different ODE
solvers from package DiffferentialEquations.jl to chose the best one, which was
in our case LSODA, that can handle both stiff and non-stiff equations (Hindmarsh
and Petzold 2005).
The simulation method is thus the following. Given a jump time Tn−1, solve the
following ODE,
y(s) =F (y(s),xd(T
+n−1),µ)
Rtot (y(s))
τ(s) = 1Rtot(y(s))
y(0) = xc(T+n−1
), τ(0) = Tn−1
on the time interval (0, Sn)where Sn ∼ E(1). Then the next jump time is Tn = τ(Sn)
and xc(T−n ) = y(Sn). Now, knowing the jump time Tn, one can make the jump on xd
and iterate.
References
Davis, Mark HA (2018). Markov models & optimization. Routledge.Graham, Carl and Denis Talay (2013). Stochastic simulation and Monte Carlo methods: mathe-
matical foundations of stochastic simulation. Vol. 68. Springer Science & Business Media.
Hindmarsh, AC and LR Petzold (2005). “LSODA, ordinary differential equation solver for stiff or
non-stiff system”. In.
Veltz, Romain (2015). “A new twist for the simulation of hybrid systems using the true jump
method”. In: arXiv preprint arXiv:1504.06873.
Copyright © 2022 FDOKUMEN