Qualitative analysis of phospholipids and their oxidised ...
34
Full Terms & Conditions of access and use can be found at https://www.tandfonline.com/action/journalInformation?journalCode=ifra20 Free Radical Research ISSN: 1071-5762 (Print) 1029-2470 (Online) Journal homepage: https://www.tandfonline.com/loi/ifra20 Qualitative analysis of phospholipids and their oxidised derivatives – used techniques and examples of their applications related to lipidomic research and food analysis Karol Parchem, Shlomo Sasson, Carla Ferreri & Agnieszka Bartoszek To cite this article: Karol Parchem, Shlomo Sasson, Carla Ferreri & Agnieszka Bartoszek (2019): Qualitative analysis of phospholipids and their oxidised derivatives – used techniques and examples of their applications related to lipidomic research and food analysis, Free Radical Research, DOI: 10.1080/10715762.2019.1657573 To link to this article: https://doi.org/10.1080/10715762.2019.1657573 © 2019 The Author(s). published by Informa UK Limited, trading as Taylor & Francis Group Accepted author version posted online: 16 Aug 2019. Published online: 05 Sep 2019. Submit your article to this journal Article views: 179 View related articles View Crossmark data
-
Upload
khangminh22 -
Category
Documents
-
view
0 -
download
0
Transcript of Qualitative analysis of phospholipids and their oxidised ...

Full Terms & Conditions of access and use can be found athttps://www.tandfonline.com/action/journalInformation?journalCode=ifra20
Free Radical Research
ISSN: 1071-5762 (Print) 1029-2470 (Online) Journal homepage: https://www.tandfonline.com/loi/ifra20
Qualitative analysis of phospholipids and theiroxidised derivatives – used techniques andexamples of their applications related to lipidomicresearch and food analysis
Karol Parchem, Shlomo Sasson, Carla Ferreri & Agnieszka Bartoszek
To cite this article: Karol Parchem, Shlomo Sasson, Carla Ferreri & Agnieszka Bartoszek(2019): Qualitative analysis of phospholipids and their oxidised derivatives – used techniquesand examples of their applications related to lipidomic research and food analysis, Free RadicalResearch, DOI: 10.1080/10715762.2019.1657573
To link to this article: https://doi.org/10.1080/10715762.2019.1657573
© 2019 The Author(s). published by InformaUK Limited, trading as Taylor & FrancisGroup
Accepted author version posted online: 16Aug 2019.Published online: 05 Sep 2019.
Submit your article to this journal
Article views: 179
View related articles
View Crossmark data

REVIEW ARTICLE
Qualitative analysis of phospholipids and their oxidised derivatives – usedtechniques and examples of their applications related to lipidomic researchand food analysis
Karol Parchema, Shlomo Sassonb, Carla Ferreric and Agnieszka Bartoszeka
aDepartment of Food Chemistry, Technology and Biotechnology, Faculty of Chemistry, Gdansk University of Technology, Gda�nsk,Poland; bInstitute for Drug Research, Faculty of Medicine, The Hebrew University of Jerusalem, Jerusalem, Israel; cIstituto per la SintesiOrganica e la Fotoreattivit�a, Consiglio Nazionale delle Ricerche, Bologna, Italy
ABSTRACTPhospholipids (PLs) are important biomolecules that not only constitute structural buildingblocks and scaffolds of cell and organelle membranes but also play a vital role in cell biochemis-try and physiology. Moreover, dietary exogenous PLs are characterised by high nutritional valueand other beneficial health effects, which are confirmed by numerous epidemiological studies.For this reason, PLs are of high interest in lipidomics that targets both the analysis of membranelipid distribution as well as correlates composition of lipids with their effects on functioning ofcells, tissues and organs. Lipidomic assessments follow-up the changes occurring in living organ-isms, such as free radical attack and oxidative modifications of the polyunsaturated fatty acids(PUFAs) build in PL structures. Oxidised PLs (oxPLs) can be generated exogenously and suppliedto organisms with processed food or formed endogenously as a result of oxidative stress.Cellular and tissue oxPLs can be a biomarker predictive of the development of numerous dis-eases such as atherosclerosis or neuroinflammation. Therefore, suitable high-throughput analyt-ical techniques, which enable comprehensive analysis of PL molecules in terms of the structureof hydrophilic group, fatty acid (FA) composition and oxidative modifications of FAs, have beencurrently developed. This review addresses all aspects of PL analysis, including lipid isolation,chromatographic separation of PL classes and species, as well as their detection. The bioinfor-matic tools that enable handling of a large amount of data generated during lipidomic analysisare also discussed. In addition, imaging techniques such as confocal microscopy and mass spec-trometry imaging for analysis of cellular lipid maps, including membrane PLs, are presented.
ARTICLE HISTORYReceived 27 February 2019Revised 22 July 2019Accepted 9 August 2019
KEYWORDSBioinformatics; imagingtechniques; LC-MS;lipidomics; oxidisedphospholipids;phospholipids
Biological role of cellular, tissue andexogenous PLs and products of their oxidation
Phospholipids (PLs) are amphiphilic molecules com-posed of lipophilic moiety and a phosphorylated hydro-philic group. They constitute structural building blocksof biological membranes in plant and animal cells andsubcellular organelles. PLs also determine biophysicalproperties of membrane bilayers such as fluidity andpermeability as well as the organisation and regulationof the activity of embedded proteins [1]. In addition,membrane PL-derived polyunsaturated fatty acids(PUFAs) are precursors of numerous signalling mole-cules such as eicosanoids, leukotrienes, prostaglandinsand thromboxanes that are important modulators ofboth inflammation and anti-inflammatory signals [2].
Dietary PLs are known for their high nutritional valueand beneficial health effects. Numerous epidemiologicalstudies indicate that foodborne PLs may prevent ormodulate the progression of chronic diseases. DietaryPLs and products of their enzymatic metabolism mayaffect pathways related to inflammation and regulatelipid metabolism [3]. PLs also normalise blood lipid pro-files by reducing the absorption of cholesterol, triacylgly-cerols (TAGs) and fatty acids (FAs) in the intestine.Therefore, dietary PLs, especially PUFA containing, arethought to reduce the risk of cardiovascular diseases [3].Consequently, some sources, such as krill oil, are consid-ered nutritionally beneficial due to the high abundanceof n-3 PUFAs (i.e. eicosapentaenoic acid (EPA) and doco-sahexaenoic acid (DHA)) in the PL structure [4–6].
CONTACT Karol Parchem [email protected] Department of Food Chemistry, Technology and Biotechnology, Faculty of Chemistry, GdanskUniversity of Technology, Gda�nsk, PolandThis article has been republished with minor changes. These changes do not impact the academic content of the article.� 2019 The Author(s). published by Informa UK Limited, trading as Taylor & Francis GroupThis is an Open Access article distributed under the terms of the Creative Commons Attribution-NonCommercial-NoDerivatives License (http://creativecommons.org/licenses/by-nc-nd/4.0/),which permits non-commercial re-use, distribution, and reproduction in any medium, provided the original work is properly cited, and is not altered, transformed, or built upon inany way.
FREE RADICAL RESEARCHhttps://doi.org/10.1080/10715762.2019.1657573
Po
bra
no z
mo
stw
ied
zy.p
l

Moreover, previous studies demonstrated that PUFAsdelivered in PL structure are more efficiently incorpo-rated into cell membranes than these present in TAGs[7]. This is probably because PUFAs build in TAG struc-ture are preferentially used as the energy source for skel-etal muscles and heart cells or are directed to adipocytes[8]. For instance, it was found that dietary PLs areneeded for the regeneration of damaged hepatocytesand proper function of the nervous system [1].
Yet, PUFAs within PLs are particularly susceptible tooxidation during manufacturing, storage and final prep-aration of foods (e.g. frying, baking or grilling) [9].Previous studies indicated that dietary oxidised PLs(oxPLs) can be toxic to epithelial cells of the digestivetract, which are directly exposed them. The accumula-tion of dietary oxPLs by the digestive tract cells mayalso induce oxidative stress that can cause cell mem-brane oxidation and DNA or protein damage leading tosome gastrointestinal pathologies [10]. In addition, diet-ary oxidised FAs build in PL and TAG structure, afterintestinal digestion and absorption by enterocytes, canbe released into the portal vein and circulatory system.These oxidised lipids may contribute to the etiology ofperipheral diseases, such as atherosclerosis [11,12].
On the other hand, PUFAs within cellular PLs are sus-ceptible to endogenous oxidation upon cellular oxida-tive stress. Such endogenous oxPLs can be involved intwo interrelated processes: first, cell and tissue damageand, second, activation of signalling pathways thatmediate inflammatory response and apoptosis [13].There is an ample evidence that both ingested andendogenously formed oxPLs are also integrated intooxidised low-density lipoproteins (LDL), which furthercontribute to the development of cardiovascular dis-eases including atherosclerosis, thrombosis and coron-ary artery disease [14,15]. Although oxPLs have beenimplicated in the development of numerous disorders,they occur not only in pathological states but alsounder healthy conditions. The difference betweenpathological and physiological conditions seems to bequantitative, the elevated levels of oxPLs species wereidentified in various tissues or blood. Therefore, oxPLshave been proposed as potential biomarkers in breastcancer [16], hyperlipidaemia [17] neuroinflammation[18], lung injury [19] or alcoholic patients [20], thoughnone of the oxPLs have yet been validated.
The development of lipidomics andrelated sciences
Recent advances in research on function of lipids incells, tissues, organs and whole organism under both
physiological and pathological states contributed to thedevelopment of lipidomics – an interdisciplinary sub-field of metabolomics that focuses on the global studyof the lipidome, which is defined as the collection oflipid compounds within a given biological system [21].Lipidomic studies embrace the identification of individ-ual lipid species, subcellular localisation and tissue dis-tribution as well as changes in their abundance andconcentration. Such knowledge is necessary to enablethe discovery of molecular mechanisms of lipid actionunder physiological conditions as well as during thedevelopment of disorders. One of the branches of lipi-domics is membrane lipidomics which nowadays hasbeen attracting growing interest because the mem-brane compartment is a highly organised system andthe choice of PLs reflects biophysical rules as well asbiochemical and physiological outcomes of the wholecell [22,23]. In parallel, the oxidative reactivity of thePLs can affect membrane organisation, thus, cellularand homeostasis, including the natural process of mem-brane PL replacement [24]. Therefore, efforts have beenundertaken to clarify the interplay between PL organ-isation and reactivity to contribute to the full compre-hension of the cell management. Nevertheless, it canbe stated that oxidative lipidomics does not develop asfast as lipidomics. The nonincreasing annual number ofpublications with keywords “oxidised lipids” and“oxidised phospholipids” can confirm this observation(Figure 1) [25]. On the other hand, since the 1990s ofthe last century, a growing number of publicationsunder “lipid oxidation” keyword have been observed(Figure 1). The explanation of this phenomenon may bethe fact that “lipid oxidation” per se is a very generalterm that has been used in various areas of research todetermine the impact of free radicals on lipids presentin clinical samples such as fluids and tissues (redox biol-ogy) or foodstuffs (food quality). The lipid oxidation
Figure 1. Number of publications on lipid-related topics from1950 to 2015. Reprinted with permission from [25].
2 K. PARCHEM ET AL.
Po
bra
no z
mo
stw
ied
zy.p
l
reaction in these studies is often monitored by simpleand unspecific spectrophotometric methods, such asTBARS assay. Whereas screening, identification andcharacterisation of oxidised lipids and PLs during oxida-tive lipidomic studies requires the use of advanced andnot so affordable methods.
The results of epidemiological studies indicate thatthe type, quality and intake of dietary lipids may con-tribute to the prevention or promotion of diet relatedmetabolic diseases including obesity, type 2 diabetes,atherosclerosis or hypertension. Therefore, lipidomicsand membrane lipidomics are considered powerfultools to investigate the interactions between diet,nutrients, genes and human metabolism, both inphysiological and pathological conditions [21]. Thisapproach contributed to the introduction of foodomics– a discipline that investigates the food and nutritiondomains through the application of advanced omicstechnologies to improve wellbeing, human health andconsumer knowledge [26,27]. The foodomic studiesinvolve not only metabolomics, including lipidomics,but also genomics, epigenomics, transcriptomics andproteomics for compound profiling/authenticity and/orbiomarkers analysis related to food quality orsafety [27,28].
In general, two analytical strategies can be distin-guished in the lipidomic studies. Targeted analysesfocus on the determination of a set of known lipid spe-cies. However, it should be noted that modern method-ologies enable large-scale lipid profiling, embracinghundreds of compounds [29]. The second strategy is,thus, the untargeted analyses that allow a more com-prehensive evaluation of lipidomic profile. In thisapproach, the entire data sets comprising thousands ofmetabolite signals are processed, which enables detec-tion and identification of unknown lipids as well. Someof them can be identified as potential discriminators ofdifferent physiological or pathological states. However,it should be noted that the targeted analyses providemore sensitive and accurate detection of lipids, which isthe consequence of monitoring of predetermined com-pounds for which the analytical methodology wasdeveloped [29].
The development of lipidomics has been advancedin the last decades for the availability of analytical tech-niques and proper instruments that enable qualitativeand quantitative analysis of lipid compounds in com-plex matrices, such as biological and food specimens.The application of mass spectrometry (MS) with softionisation techniques was the key step towards theadvent of lipidomics. The first report on the applicationof electrospray ionisation (ESI) [30] and matrix-assisted
laser desorption/ionisation (MALDI) [31] for the analysisof complex PL mixtures was published in 1994 and1995, respectively. Since then, applications of shotgun(direct injection) MS and liquid chromatographycoupled with MS (LC-MS) have become dominant tech-niques in lipid analysis, including PLs. Additionally,other techniques such as gas chromatography (GC),thin layer chromatography (TLC) and nuclear magneticresonance (NMR), especially 31P NMR in the analysis ofPLs [32], are widely applied in the lipidomic analysis[33]. It must be immediately clarified that so far PLscontaining geometrical and positional isomers cannotbe satisfactorily analysed to distinguish molecules withthe same mass due to the complex mixtures of lipidspresent especially in biological samples. GC and furtherfatty acid derivatisation procedures using dimethyldisulphide or other reagents are necessary to explorethe complex isomerism of fatty acid structures [34].
To summarise the current state of knowledge con-cerning the comprehensive analysis of PL species andtheir oxidised derivatives, we reviewed the analyticaltechniques used in lipidomics and related sciences. Thisreview covers all qualitative aspects of PL analysis, fromthe lipid isolation through the chromatographic separ-ation of PL classes and species to their detection. Wediscussed standard techniques used for PL analysis,which can be successfully applied in most laboratoriesas well as advanced approaches such as two-dimen-sional chromatography coupled with MS or ion mobilityspectrometry (IMS) that enable more detailed character-isation of complex lipid samples. We presented alsobioinformatic tools applied for handling a large amountof data generated during MS-based analysis. Moreover,confocal microscopy for imaging of cellular lipids, usingvarious fluorescence probes as well as mass imagingtechniques are presented and discussed in this review.
Occurrence and structural diversity of PL andgeneration of their oxidative derivatives
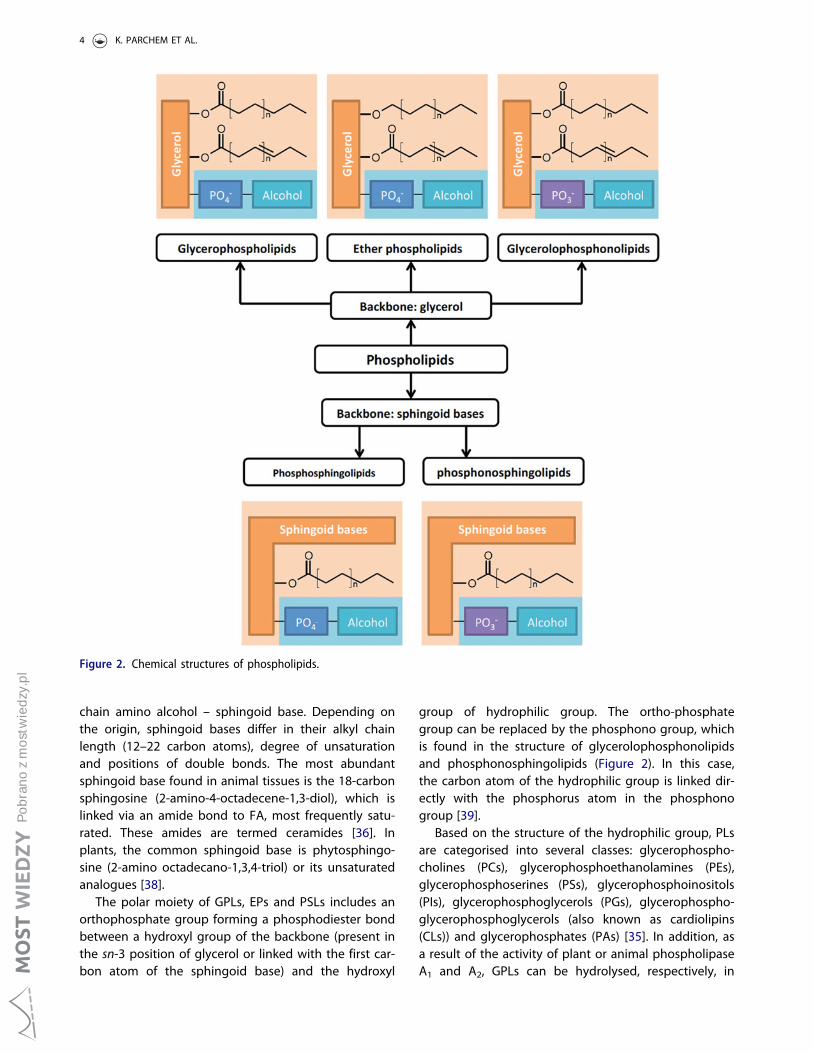
According to the backbone structure, PLs are classifiedinto two major groups: glycerophospholipids (GPLs)and phosphosphingolipids (PSLs) (Figure 2) [35].Lipophilic fragment of GPLs consists of two FAs linkedto L-glycerol by ester bonds in the sn-1 and sn-2 posi-tions forming diacyl moieties [36]. Naturally occurringplant and animal GPLs typically contain a saturated FAin the sn-1 position and an unsaturated FA in the sn-2position [1]. In the case of ether phospholipids (EPs)(present in animal and microbial organisms), FA in thesn-1 position is replaced by long-chain O-alkyl or O-alkenyl groups [37]. The core structure in PSLs is a long-
FREE RADICAL RESEARCH 3
Po
bra
no z
mo
stw
ied
zy.p
l
chain amino alcohol – sphingoid base. Depending onthe origin, sphingoid bases differ in their alkyl chainlength (12–22 carbon atoms), degree of unsaturationand positions of double bonds. The most abundantsphingoid base found in animal tissues is the 18-carbonsphingosine (2-amino-4-octadecene-1,3-diol), which islinked via an amide bond to FA, most frequently satu-rated. These amides are termed ceramides [36]. Inplants, the common sphingoid base is phytosphingo-sine (2-amino octadecano-1,3,4-triol) or its unsaturatedanalogues [38].
The polar moiety of GPLs, EPs and PSLs includes anorthophosphate group forming a phosphodiester bondbetween a hydroxyl group of the backbone (present inthe sn-3 position of glycerol or linked with the first car-bon atom of the sphingoid base) and the hydroxyl
group of hydrophilic group. The ortho-phosphategroup can be replaced by the phosphono group, whichis found in the structure of glycerolophosphonolipidsand phosphonosphingolipids (Figure 2). In this case,the carbon atom of the hydrophilic group is linked dir-ectly with the phosphorus atom in the phosphonogroup [39].
Based on the structure of the hydrophilic group, PLsare categorised into several classes: glycerophospho-cholines (PCs), glycerophosphoethanolamines (PEs),glycerophosphoserines (PSs), glycerophosphoinositols(PIs), glycerophosphoglycerols (PGs), glycerophospho-glycerophosphoglycerols (also known as cardiolipins(CLs)) and glycerophosphates (PAs) [35]. In addition, asa result of the activity of plant or animal phospholipaseA1 and A2, GPLs can be hydrolysed, respectively, in
Figure 2. Chemical structures of phospholipids.
4 K. PARCHEM ET AL.
Po
bra
no z
mo
stw
ied
zy.p
l

position sn-1 or sn-2 of glycerol to form lysophospholi-pids (LPLs) such as lysophosphatidylcholines (LPCs) andlysophosphatidylethanolamines (LPEs) [36]. The mostabundant class of PSLs are sphingomyelins (SMs), inwhich choline is the hydrophilic group [36]. In nature,ceramide derivatives of ethanolamine and inositol arealso found [38].
The PL fraction is often called lecithin, but this termdoes not define a chemical structure. This term is usedto describe PLs of the plant (e.g. rapeseed or soybeanlecithin) or animal (e.g. egg yolk lecithin) origin [40].Moreover, in lipid technology, this name is often usedfor PL fraction dissolved in ethanol, whose main com-ponent is the PC fraction. The fraction insoluble in etha-nol is named cephalins, and mainly contains thePE fraction.
PUFAs, such as linolenic acid, arachidonic acid, EPAand DHA, in PLs can undergo oxidation. Oxidised PLs(oxPLs) are generated in biological systems as a resultof enzymatic oxidation and/or random free radical-mediated nonenzymatic peroxidation [41,42]. CellularPLs can be modified directly by specific enzymes suchas lipoxygenases, cyclooxygenases or cytochrome c[43]. The peroxidation of PLs is also induced by directinteractions with reactive oxygen species (ROS) andreactive nitrogen species (RNS), which either penetratecells or are generated endogenously by cellular proc-esses (e.g. mitochondrial origin or NADPH oxidase) [19].In turn, dietary oxPLs are formed during food produc-tion as a result of nonenzymatic autooxidation andphotooxidation or enzymatic oxidation catalysed by lip-oxygenases [9].
The structure of the final oxidation products gener-ated via radical-based peroxidation depends on sev-eral factors including the nature of oxidant species,the unsaturation degree of FA linked to the glycerolbackbone and the positions of double bonds [44]. Theabstraction of hydrogen atoms located on methylenegroups of unsaturated FA, and subsequent reactionwith oxygen, leads to the formation of peroxy radical.In the next step, this radical can initiate a next peroxi-dation reaction with another unsaturated FA andfinally is stabilised by PL hydroperoxide formation.These primary oxidation products (PL hydroperoxides)are characterised by low stability and can decomposevia monomolecular or bimolecular reactions [9] tolong-chain oxPLs containing hydroxy, polyhydroxy,epoxy or keto groups [45]. The long-chain oxidationproducts further undergo oxidative changes that leadto the formation of short-chain oxPLs containing satu-rated and unsaturated aldehydes, hydroxy-aldehydes,carboxylic acids and hydroxy carboxylic acids as well
as furan derivatives [44]. In addition, volatile lowmolecular weight compounds such as pentanal orhexanal are formed as a result of C–C bond cleav-age [45].
Sample preparation
The first stage of lipidomic studies requires the isolationof lipid fractions from matrices in which these mole-cules are usually strongly embedded. This process aimsalso at the separation of nonlipid substances such asproteins, sugars, and low molecular weight compoundsthat could interfere with further steps of the analysis[46]. We believe that the standardisation of the meth-ods for lipid isolation is still an unaddressed problem,which influences the use of the data for meta-analysis.Lipidomic applications require a high yield of analyteisolation, reproducibility, but also short preparationtime. In addition, the final extracts should be providedin a form suitable to the instrumental techniques usedin the subsequent steps of analysis [33]. For example,shotgun lipidomics, where lipid species are analysed byMS and/or tandem MS after direct injection, is highlydependent on the extract quality, since any nonlipidsubstances and water contamination could led to sig-nificant ion suppression and/or high chemical noise.Consequently, this can result in reduced sensitivity andinaccurate or irreproducible MS measurements [47]. Thetechniques of initial sample preparation for PL analysisinclude liquid–liquid extraction (LLE), protein precipita-tion (PPT) and, more recent, solvent saving directimmersion solid phase microextraction (DI-SPME),which has attracted considerable attention [33,48,49].Some enrichment of lipid fraction in PLs is possiblewith the aid of solid phase extraction (SPE) procedures.Sample preparation techniques used in the PL analysis,examples of their application and information on therequired sample volumes, isolation time, cost, recov-eries, lipid coverage, repeatability/reproducibility andpotential for their automation are presented in Table 1.
Sample collection and storage
PLs and especially their oxidised derivatives are veryunstable compounds; therefore sampling and storageconditions are key factors affecting sample quality.Since lipid degradation, for example resulting fromuncontrolled oxidation or hydrolysis, can occur within afew seconds, the material should be protected asquickly as possible. The preparation of analysed mater-ial depends mainly on the origin and form of the sam-ple. The isolation of lipid fractions from plant, animal
FREE RADICAL RESEARCH 5
Po
bra
no z
mo
stw
ied
zy.p
l

Table1.
Comparison
ofsamplepreparationtechniqu
esforlipid
analysiswith
particular
referenceto
phosph
olipidsandtheiroxidised
derivatives.
Techniqu
eParameter
Chloroform
-based
liquid–
liquid
extractio
n(Folch’s
metho
dandBligh
andDyermetho
d)
Chloroform
-freeliquid–
liquidextractio
n
Ultrasou
nd-assisted
extractio
n(UAE
)
Microwave-
assisted
extractio
n(M
AE)
Precipitatio
nmetho
ds(PPT)
Combinatio
nof
LLE/PPTwith
solid
phase
extractio
n(SPE)
Direct
immersion
solid
phase
microextractio
n(DI-SPM
E)MTBEmetho
dBU
MEmetho
d
Application
exam
ple
Hum
anblood
plasma
Hum
anblood
plasma
Hum
anblood
plasma
Hum
anbloodplasma
Freeze-dried
yeastcells
Hum
anblood
plasma
Hum
anblood
plasma
Hum
anbreast
milk
Cell
homog
enate
Samplevolume/
mass
50mL
20–50mL
�75mL
30mL
10mg
200mL
20–50mL
used
toLLEor
PPT
(500
mLof
lipid
extract)
1mL
Solventsystem
used
Chloroform
;methano
l;0.9%
w/v
aqueou
sNaClsolution
(orwater)
MTBE;methano
l;water
Butano
l;methano
l;heptane;ethyl
acetate1%
v/v
aqueou
saceticacid
e.g.
MTBE;methano
l;water
e.g.
chloroform
;methano
l2-prop
anol
Methano
l;0.2%
form
icacid;
2-prop
anol
2-prop
anol;
methano
l(for
lipid
desorptio
n)
Sampleam
ount
toextractant
volumeratio
1:20
v/va
1:100v/va
1:12
v/va
1:5to
1:25
v/v(based
onMTBEvolume)
7mLof
the
solventmixture
per10
mgof
thesample
1:3to
1:5v/v
2.5mLof
solvents
persample
used
durin
gSPE
Thevolumeof
solventrequired
forthelipid
desorptionis
100mL
�1mL
Isolationtim
eExtractio
ntim
e:fortyminutes
bExtractio
ntim
e:70
minb
(Simultaneou
sextractio
nof
96samples
ispo
ssible
atthis
timeusing96-
wellrob
ots)
Extractio
ntim
e:35
minb
(Simultaneou
sextractio
nof
96samples
ispo
ssible
atthis
timeusing96-
wellrob
ots)
Extractio
ntim
e:30
minb
Extractio
ntim
e:16
minb
Extractio
ntim
e:overnigh
tExtractio
ntim
edepend
edon
metho
dused
Solid
phase
extractio
n:e.g.
10samples
in 30min
using
spin
columns
Solvent
evaporation
Precon
ditio
nof
afib
re:
20–30min
Lipid
absorptio
non
fibre:
5–90
min
Lipid
desorptio
n:5to
60minutes
(Simultaneou
slipid
isolation
from
96samples
ispo
ssible
atthis
timeusing96-
wellrob
ots)
Cost
Inexpensive
apparatus
Inexpensive
solventused
Long
working
time
Inexpensive
solventused
(Highercost
topu
rchase
the
automatic
robo
ts)
Inexpensive
solventused
(Highercost
topu
rchase
the
automatic
robo
ts)
Inexpensivesolventused
Highercost
topu
rchase
thesystem
Inexpensive
solventused
Highercost
topu
rchase
thesystem
Inexpensive
solventused
(five
times
cheaper
than
LLE)
Inexpensive
solventused
Expensive
cartrid
ges
Inexpensive
solventused
Expensive
SPMEfib
res
Lipidanalysis
techniqu
eused
LC-M
SLC-M
S/MS
LC-M
SLC-M
S/MS
LC-ELSD
LC-M
SLC-M
SLC-CAD
LC-M
SLC-M
S/MS
MALDI-M
S/MS
LC-M
S/MS
Recovery
Recovery
values
ofPC
forFolch,
acidified
Bligh
andDyerand
BlighandDyer
metho
dsis
Similarrecovery
values
forPC
andhigh
erfor
PIcomparedto
Folch’smetho
d
Similarrecovery
values
forPC
,PE,P
A,LPCand
SMandhigh
erforPA
,PG,P
S,PG
andLPA
Higherrecovery
values
for
SMclassescomparedto
BlighandDyermetho
dandforPE
andSM
comparedto
previous
repo
rted
MTBEmetho
d
Therecoveries
wereestim
ated
forcholesterol
(92%
),TA
G(95%
)and
FFA(92%
)
Therecovery
values
forPC
,PE,P
G,P
S,LPC
andSM
werein
therang
eof
60–90%
Therecovery
value
foroxPC
is67.5%
Therecoveries
valueforPG
,PE,P
C,LPCand
SMin
the
rang
eof
55–70%
(continued)
6 K. PARCHEM ET AL.
Po
bra
no z
mo
stw
ied
zy.p
l

Table1.
Continued.
Techniqu
eParameter
Chloroform
-based
liquid–
liquid
extractio
n(Folch’s
metho
dandBligh
andDyermetho
d)
Chloroform
-freeliquid–
liquidextractio
n
Ultrasou
nd-assisted
extractio
n(UAE
)
Microwave-
assisted
extractio
n(M
AE)
Precipitatio
nmetho
ds(PPT)
Combinatio
nof
LLE/PPTwith
solid
phase
extractio
n(SPE)
Direct
immersion
solid
phase
microextractio
n(DI-SPM
E)MTBEmetho
dBU
MEmetho
d
arou
nd100,
90and75%,
respectively.
comparedto
Folch’smetho
dLower
recovery
valuefor
PCcomparedto
Blighand
Dyermetho
dandprevious
repo
rted
MTBEmetho
dLipido
mecoverage
Highlipid
coverage
for
Folch’smetho
dandacidified
BlighandDyer
Lipidcoverage
comparableto
chloroform
-basedLLE
Lipidcoverage
comparableto
Folch’smetho
d
Higheroveralln
umberof
lipidsidentifiedcompared
toBlighandDyermetho
dandprevious
repo
rted
MTBEmetho
d
Lipidcoverage
comparableto
chloroform
basedLLE
Broadlipid
coverage
(LPC
,LPE,PC
,PG,
PS,SM)
Thistechniqu
eis
aimed
atisolationof
specificlipid
species
e.g.
oxPC
s
SPMEenablesthe
isolationof
broaderrang
eof
lipid
catego
ries/
classes
comparedto
Folch’smetho
d,ho
wever,the
latter
allows
better
coverage
ofhigh
-abun
dant
mem
branePL
(PCs
andPEs)
Repeatability/
reprod
ucibility
Standard
deviations
below
5%for
Folch’sand
Blighand
Dyermetho
ds
Standard
deviations
ofthemean
values
below
6%
Standard
deviation
values
below
8%
Highrepeatability
compared
toBlighandDyermetho
dandprevious
repo
rted
MTBE(Relativestandard
deviations
below
5.55%)
Higher
repeatability
comparedto
chloroform
-basedLLE
(Intraday
and
interday
relative
standard
deviations
intherang
eof
0.63–6%
and
4–12%,
respectively
Coefficient
ofvariatio
nbelow
20%
Coefficient
ofvariatio
nis9.6%
Relativestandard
deviations
below
14%
for
tested
PLclasses
Potential
forautomation
Low
High
High
Low
Low
High
High
High
Remarks
Fire,h
ealth
and
environm
ental
hazards
Lipid-containing
organicph
ase
form
sthe
bottom
layer
durin
gph
ase
separatio
n
Lipid-containing
organicph
ase
form
sthe
upperlayer
durin
gph
ase
separatio
n
Lipid-containing
organicph
ase
form
sthe
upperlayer
durin
gph
ase
separatio
n
Frequenciesfrom
20kH
zto
severalG
Hzareused
Duringthe
extractio
ntemperature
increases,
which
canlead
tothe
breakdow
nof
thermolabile
analytes
Theprotein
removal
efficiencyis
99%
Techniqu
erequ
ireslittle
labo
urinpu
t
Priorsample
preparation
usingLLEor
PPTisrequ
ired
Thecolumns
canbe
reused,
which
sign
ificantly
redu
cescosts.
DI-SPM
Eisan
equilibriu
mtechniqu
e
Reference
[50–52]
[50,51,53–55]
[56–58]
[59,60]
[61]
[62]
[63,64]
[48,49]
a Based
ontotale
xtractantvolumeinclud
ingre-extraction
bThetim
eof
centrifug
ation,
lipid-con
tainingph
asetransfer,(po
tentialre-extractio
n)andsolventevaporationshou
ldbe
added.
FREE RADICAL RESEARCH 7
Po
bra
no z
mo
stw
ied
zy.p
l
and human tissues as well as solid food samplesrequires usually quick freezing in liquid nitrogen andgrinding before the addition of organic solvents [65,66].Samples derived from cell cultures must be first thor-oughly washed from serum-borne lipids. Depending onthe further procedure used, the cells can be homoge-nised [48] or more commonly the lipids are extractedfrom the cell pellet directly by the addition of cold sol-vents [65,67]. In turn, liquid samples, such as serum orplasma as well as foodstuffs, e.g. milk, can be extracteddirectly using cold solvents or following freezing andstorage [66,68]. The nonenzymatic lipid peroxidationmay occur even at �20 �C. Therefore, if immediateextraction is not possible such samples should bestored at �80 �C for a few months. Moreover, to avoidoxidative modifications of lipids, the extraction solventsystems are commonly enriched with antioxidants,among which butylated hydroxytoluene (BHT) is mostfrequently added [66]. However, it should be noted thatantioxidants may reduce oxidised lipid species, andtherefore they should not be added to samples inwhich oxPLs are to be analysed [69]. Instead, other pro-tectors, such as metal chelators (e.g. EDTA, EGTA orDPTA) are used along with low temperature, nitrogenatmosphere and protection from light [46,66].
Sometimes, there is a necessity to thaw the samplesseveral times to perform analysis of various parameters.Hammad et al. determined the effect of freeze andthaw cycles on the stability of SM(C16:0) in humanblood serum and plasma samples. The results showedthat the first and second freeze and thaw cycle do notaffect the level of this SM specie, while a statisticallysignificant change was observed after the third cycle[70]. Therefore, a better solution may be to divide sam-ples before freezing into smaller single-use portions toavoid multiple freeze and thaw cycles, which will ensurehigh sample quality for all planned analyses. Someauthors have also determined the effect of the anti-coagulant type used for the preparation of plasma sam-ples on PL concentration. The results obtained byGonz�alez-Covarrubias et al. indicated that among 80endogenous lipids, the content of 71 species signifi-cantly depended on two or all tested anticoagulants(sodium citrate, potassium EDTA and lithium heparin)[71]. Statistically significant differences between twotypes of anticoagulants on PL recovery were observedfor the majority of PLs including LPC, LPE, PC, PE andSM species, while variations among all three tested anti-coagulants were found for LPC(16:0), PC(40:4), PE(36:3),SM(d18:1/16:0) and plasmalogen form pPE (38:5), pPE(36:5). Most importantly, for all PL species (only except
PC(40:2)), the extraction efficiency was the highest inthe case of potassium EDTA [71].
During sampling of human or animal biologicalmaterial such as blood, special should be also paid tothe effect of a circadian cycle on the variability in thecomposition of individual lipid species, including PLs.The human studies involving 20 healthy males identi-fied in some of them, the circadian-regulated PC spe-cies in the plasma [72]. For example, the peakconcentration levels in the evening were observed forPC(32:2) and plasmalogen forms such as pPC(34:0),pPC(34:1), pPC(34:2) and pPC(36:2). In addition, circa-dian variation in LPC(16:0) and SM(d18:1/18:1) levelswere found. The studies carried out by Kasukawa et al.also showed diurnal oscillations in LPC(16:0) as well asPG(18:1/0:0) levels [73]. In turn, Aviram et al. indicatedchanges in nuclear and mitochondrial lipidome inmouse liver throughout the day and upon differentfeeding regimens [74]. In the mentioned cell organelles,222 lipid species belonging to different PL classes suchas CLs, lysocardiolipins (LCLs), LPEs, LPEs, PAs, PCs, PEs,PGs, PIs, PSs and SMs were identified and quantified.Among 152 lipids found in the nucleus and 217 lipidsin mitochondria, 34 and 31% of lipids, respectively,showed diurnal oscillations. In both organelles, predom-inant oscillating lipids were PC and PE species. In add-ition, the results indicated that these oscillations in thenucleus and mitochondria are antiphasic. Analysis ofthe peak accumulation time for the various oscillatingPLs showed that the vast majority of nuclear lipidspeaked early in the light phase at zeitgeber time. Incontrast, most diurnal-regulated mitochondrial PLsreached their maximum levels at the transition fromthe light to the dark phase [74].
Another important factor that can affect the lipidprofile is food intake. As already mentioned, Aviramet al. determined various feeding regimens and showedthat there is a significant difference between mice fedad libitum (described above) and exclusively during thenight. In the case of nucleus lipidome, the night-restricted feeding led to an increase in the fraction ofoscillating PLs, whereas in mitochondria, its moderatedecrease was observed. Moreover, under night-restricted feeding, the vast majority of oscillating PLsaccumulated in the nucleus at the beginning of darkphase, whereas in mitochondria PLs peaked at thebeginning of light phase [74]. This contrasted with thePL fluctuation observed for ad libitum fed mice, thus,showed a significant effect of feeding regimens on lipi-dome of individual cell organelles.
In sample preparation, an interesting observationcan be made in the case of the red blood cell (RBC)
8 K. PARCHEM ET AL.
Po
bra
no z
mo
stw
ied
zy.p
l

membrane lipidomic analysis, since it is well knownthat the lifetime of these cells is around 4 months.During this period, the RBCs come into contact with allthe body tissues. Consequently, their membrane PLscan carry an important information related to nutri-tional habits and metabolism. The isolation of matureRBCs, whose characteristics (such as density gradientand cell diameter) is well known, can be nowadays car-ried out by robotics, thus avoiding tedious and impre-cise manipulations [75]. Generally speaking, technicaland methodological aspects, especially in the case ofthe preparation of biological samples such as RBCs,should be thoroughly discussed among the scientificcommunity, working toward unification and standard-isation of the procedures. This would be very importantfor improving the analytical efficiency and establishingcalibrated parameters for metabolic evaluation.
Isolation of PL fractions
LLE is the most commonly applied extraction proced-ure, appropriate for a wide range of apolar and polarlipid compounds, including PLs. Best known is theFolch’s method that was introduced in 1957. In thisprotocol, chloroform/methanol (2:1 v/v) extraction mix-ture is employed followed by washing the extract withsaline solution (0.9% NaCl or KCl) [76]. The main draw-back of Folch’s method is the substantial consumptionof organic solvents, as it requires a 20-fold excess ofchloroform/methanol mixture over the sample volume.Therefore, several alternative approaches were devel-oped, among which the most commonly used is theBligh and Dyer method [77]. The extraction yield ofthese two methods is similar for samples containingless than 2% w/w lipid fraction. However, for samplesricher in lipid content, the recovery of total lipid frac-tion by the Bligh and Dyer method can be even 50%lower than in the Folch’s procedure [78]. The disadvan-tage of both methods is the use of a toxic solvent –chloroform. Therefore, in some studies, the less toxicreplacement – dichloromethane, which provides similarextraction efficiency as the Folch’s method, is used [79].Nevertheless, to avoid toxic solvents, other extractionmethods have gained popularity in lipidomic studies inrecent years. An example of such approach is themethod introduced in 2008, which employs the mixtureof methyl tert-butyl ether (MTBE) and methanol (1.5:1 v/v) followed by washing the extract with water added ata 5:1 v/v ratio [53]. In contrast to chloroform anddichloromethane, MTBE organic phase is lighter thanwater and constitutes the upper layer in this two-phasesystem. However, the MTBE extract contains quite a
large amount of water, which requires a longer time toevaporate the solvent under a stream of nitrogen andresults in more sodium adducts in comparison withextraction using chloroform along with possible ionsuppression and/or high chemical noise (especially inthe case of shotgun MS) [47]. Another chloroform-freeprotocol for the lipidomic approach is the butanol–me-thanol (BUME) method. This protocol includes an initialextraction of lipids using butanol/methanol mixture (3:1v/v) followed by extraction using heptane/ethyl acetate(3:1 v/v). Then, the phase separation is induced by add-ition of 1% aqueous acetic acid [56]. Initially, the BUMEmethod was used to isolate lipids from plasma samples,but then it was developed to extend the possibilities ofits use in a variety of biological samples such as tissuesand cultured cells [47]. Both mentioned chloroform-freemethods are characterised by comparable lipid extrac-tion efficiency, while the organic phase of the BUMEmethod contains less water than the organic phase inthe case of the MTBE method [56]. In addition, it shouldbe noted that both these methods (MTBE and BUME)were developed to their suitability for automation of PLand other lipid analysis. Another extraction solvent sys-tem proposed to isolate lipids from biological fluidsand tissues is hexane/2-propanol mixture (3:2 v/v).Plasma can serve as an example of the application ofthis method. In this case, the solvent mixture is addedto the sample in a ratio of 8:1, followed by vigorousmixing and transfer to an ultrasound bath for 5min.Then, an aqueous solution of Na2SO4 is added, theupper hexane phase is transferred to a new tube andthe bottom phase is re-extracted with a new portion ofhexane/2-propanol mixture (3:2 v/v). After pooling bothextract portions, the solvent is evaporated [80].
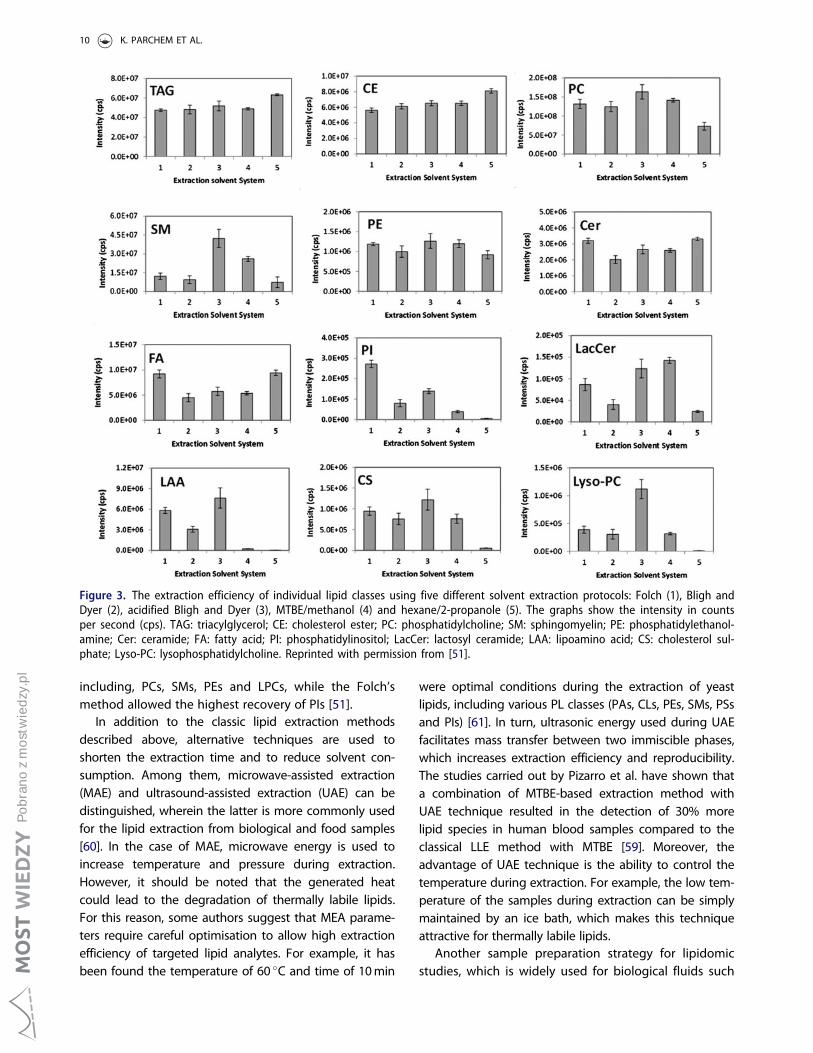
The extraction efficiency of individual lipid classes,including PLs and LPLs, using most of the above-described methods has been tested on the example ofhuman LDL (Figure 3) [51]. The LC-MS/MS techniquewas employed for qualitative and quantitative analysisof isolated lipids using five different solvent extractionprotocols: Folch, Bligh and Dyer, acidified Bligh andDyer, MTBE/methanol and hexane/2-propanol. Thequalitative analysis enabled to identify more than 350different lipid species belonging to 19 subclasses. It wasfound that the solvent composition had a small effecton the extraction of major lipid classes, such as TAGsand cholesterol esters, while the extraction of lessabundant lipids was strongly dependent on the solventsystem used (Figure 3). Based on these results, it can bestated that the acidified Bligh and Dyer protocol wasthe most efficient method for extraction of PLs
FREE RADICAL RESEARCH 9
Po
bra
no z
mo
stw
ied
zy.p
l
including, PCs, SMs, PEs and LPCs, while the Folch’smethod allowed the highest recovery of PIs [51].
In addition to the classic lipid extraction methodsdescribed above, alternative techniques are used toshorten the extraction time and to reduce solvent con-sumption. Among them, microwave-assisted extraction(MAE) and ultrasound-assisted extraction (UAE) can bedistinguished, wherein the latter is more commonly usedfor the lipid extraction from biological and food samples[60]. In the case of MAE, microwave energy is used toincrease temperature and pressure during extraction.However, it should be noted that the generated heatcould lead to the degradation of thermally labile lipids.For this reason, some authors suggest that MEA parame-ters require careful optimisation to allow high extractionefficiency of targeted lipid analytes. For example, it hasbeen found the temperature of 60 �C and time of 10min
were optimal conditions during the extraction of yeastlipids, including various PL classes (PAs, CLs, PEs, SMs, PSsand PIs) [61]. In turn, ultrasonic energy used during UAEfacilitates mass transfer between two immiscible phases,which increases extraction efficiency and reproducibility.The studies carried out by Pizarro et al. have shown thata combination of MTBE-based extraction method withUAE technique resulted in the detection of 30% morelipid species in human blood samples compared to theclassical LLE method with MTBE [59]. Moreover, theadvantage of UAE technique is the ability to control thetemperature during extraction. For example, the low tem-perature of the samples during extraction can be simplymaintained by an ice bath, which makes this techniqueattractive for thermally labile lipids.
Another sample preparation strategy for lipidomicstudies, which is widely used for biological fluids such
Figure 3. The extraction efficiency of individual lipid classes using five different solvent extraction protocols: Folch (1), Bligh andDyer (2), acidified Bligh and Dyer (3), MTBE/methanol (4) and hexane/2-propanole (5). The graphs show the intensity in countsper second (cps). TAG: triacylglycerol; CE: cholesterol ester; PC: phosphatidylcholine; SM: sphingomyelin; PE: phosphatidylethanol-amine; Cer: ceramide; FA: fatty acid; PI: phosphatidylinositol; LacCer: lactosyl ceramide; LAA: lipoamino acid; CS: cholesterol sul-phate; Lyso-PC: lysophosphatidylcholine. Reprinted with permission from [51].
10 K. PARCHEM ET AL.
Po
bra
no z
mo
stw
ied
zy.p
l

as blood plasma [62,81] involves protein removal byprecipitation. This technique is also useful in the ana-lysis of metabolites occurring in food samples, such ascow and goat milk [82]. This approach involves proteinremoving from the samples by the addition of a water-miscible solvent such as acetonitrile, methanol, ethanolor 2-propanol, which in contrast to LLE technique leadsto the formation of a monophasic system. If the con-centration of analytes in the sample is high enough forthe detection method used, the sample can be directlyinjected after protein precipitation (PPT) [65]. Sarafiaet al. compared 4-PPT methods using different water-miscible solvents (methanol, acetonitrile, 2-propanoland mixture of 2-propanol/acetonitrile (1:2 v/v)) withLLE methods employing four different solvent systems(methanol combined with chloroform, dichloromethaneor MTBE as well as isopropanol with hexane). Theresults indicated that protein removal was more effi-cient using PPT technique than LLE. Especially, 2-pro-panol appeared to be the most suitable solvent forhuman blood plasma enabling a broad coverage andrecovery of lipids, including PC, PE, PS, PG, LPC and SMclasses [62]. Another report showed that recovery val-ues for PC, PE and PI species were almost equivalent formethanol, ethanol and 2-propanol. Slightly higherrecoveries of some LPC species were observed formethanol, which also proved to be the best for alltested LPI species [83].
Apolar lipids such as TAGs, cholesterol and its esters,which are present in fractions obtained following totallipid extraction or protein precipitation, can interferewith further steps of PLs analysis. Therefore, apolar lip-ids can be selectively removed using SPE technique, inwhich columns containing silica gel as the stationaryphase are commonly used. Initially, apolar lipids areeluted with hexane and diethyl ether, while PLs thatremain bound to stationary phase are subsequentlyeluted with methanol followed by the mixture ofchloroform, methanol and water. This approach allowsalmost a complete recovery of the PLs [68,84].
To best of our knowledge, there are no specific meth-ods or protocols for selective isolation of oxPLs from bio-logical and food samples. Currently, the samplepreparation prior to the analysis of PLs modified by oxi-dation includes conventional techniques such as LLE[66,85,86] and PPT [63]. Commonly, chloroform-basedmethods are still preferred in the case of oxPLs extrac-tion, most likely due to the effective isolation of a widerange of lipids, including oxidised derivatives [25]. Theinfluence of additional factors such as ultrasound ormicrowave treatment on the extraction efficiency of oxi-dised lipids has not yet been determined. Therefore, due
to the low concentration level of oxPLs in total lipidextract obtained by means of LEE or PPT techniques, thepreconcentration of samples may be required.Alternatively, the separation of the oxidised species fromunoxidised and neutral lipids present in the sample canbe achieved already at the sample preparation stage.Both of these challenges can be overcome using the SPEtechnique. For example, this technique was used to tar-geted analysis and quantification of plasma oxPL speciesrecognised as molecules with potential diagnostic valuein acute inflammation, cardiovascular disease and ath-erosclerosis [63]. For this purpose, the micro-SPE (lSPE)method employing C18-modified silica gel spin-columnswas tested. After loading the lipid extract, the columnswere washed with methanol/0.2% formic acid (70/30 v/v) to remove salts and the majority of hydrophilic speciessuch as LPCs. Then, oxPCs were mainly eluted withmethanol/0.2% formic acid (82:18 v/v), while nonoxidisedPLs were subsequently eluted with methanol/0.2% for-mic acid (98:2 v/v). Finally, 2-propanol washout removedresidual lipids such as TAGs, after the reconstituted col-umns were ready again for further use. The recovery ofoxPC species in the fraction enriched with oxidised deriv-atives was around 70–75% [63,64]. Another tested strat-egy of oxPL enrichment consisted in the application ofsurface functionalised nanoparticles [87]. This methodinvolves a derivatisation with a bifunctional reagent con-taining both a hydrazide group for hydrazone formationwith aldehyde-containing oxPLs and a thiol moiety ena-bling subsequent trapping with nanoparticles. After thewashing step, the trapped analytes are quantitativelyreleased from the nanoparticle surface as a result oftransamination with hydroxylamine. Then the releasedoxime-derivatives of the carbonyl-containing oxPLs areanalysed. So far, this approach was applied to preparean enriched extract of oxPCs from samples such ashuman plasma with recoveries up to 90% [87].
The conventional sample preparation methods, LLEand combined liquid–liquid extraction and solid phaseextraction (LLE-SPE) are based on manual lipid isolation.These methods are overly time consuming to beemployed for routine analyses of many samples, whichis commonly required in lipidomic studies [48].Therefore, there has been recently a growing interest indirect immersion solid phase microextraction (DI-SPME)for the study of lipid compounds, including PLs. DI-SPME technique is based on adsorption of analytes onthe surface of thin glass or quartz fibre coated with aspecific sorbent. Silica-based sorbents modified withC18 groups are often used for lipidomic applications[48,49,88]. When the analyte concentrations reach dis-tribution equilibrium between the fibres surface and
FREE RADICAL RESEARCH 11
Po
bra
no z
mo
stw
ied
zy.p
l

the sample matrix, the coated fibres are immersed inpurified water to remove sample residues. Then, lipidcompounds are desorbed by immersion of the fibres inthe organic or aqueous organic solvent [48,49]. The pre-pared extract can be then analysed using LC-MS or shot-gun MS. Current DI-SPME devices are available with afully automated 96-well plate systems that allow simul-taneous extractions of many samples at the same time[48]. Among the advantages of the DI-SPME techniqueare the shorter sample preparation time, lower use oforganic solvents (especially toxic chloroform) and smallersample volume, which is particularly important for scarcematerial such as clinical samples [49].
To summarise this chapter, special attention shouldbe paid to the fact that sample preparation is on theone hand very important to generate high quality lipi-domic data sets. On the contrary, it should be notedthat there is no universal method for isolation of PLsand their oxidised derivatives from different sources.The Folch’s, Bligh-Dyer and Matyash extraction meth-ods were originally developed to the specific matrices,such as brain tissue, fish muscle, Escherichia coli, andtheir direct application to other types of samples maynot provide satisfactory extraction efficiency and lipidcoverage. For this reason, it seems necessary to opti-mise the isolation condition, such as a solvent system,the ratio of the sample amount to the solvent volumeor the effect of additional factors such as ultrasounds.Particular care must be taken during optimising the iso-lation of oxPLs that are characterised by relatively highpolarity and may be lost upon standard proceduresdedicated to lipid isolation.
Separation of PL
Thin layer chromatography
Thin layer chromatography (TLC) is a relatively simpleand inexpensive technique [89] for quick separation ofdifferent PL classes. This technique can provide prelim-inary information about PL composition and the pres-ence of oxidised species (e.g. PL hydroperoxides),thereby helping to properly choose more advancedanalytical approaches. The silica gel coated high per-formance TLC (HPTLC) plates are most commonlyemployed in PL analysis, which allows not only separ-ation of individual PL classes, such as PAs, PCs, PEs andPIs, but also products of their hydrolysis, includingLPAs, LPCs, LPEs and LPIs [90].
In contrast to analytical HPTLC, preparative TLC ischaracterised by high capacity and allows separation oflarger amounts of analytes (10–1000mg) [91]. Therefore,the latter technique can be applied to the isolation of
individual PL classes for further analysis, e.g. using GC.After chromatographic separation, the compounds ofinterest can be extracted from the respective areas ofthe preparative plate with the aid of organic solvents,e.g. chloroform/methanol mixture (1:2 v/v) [92].
The main components of the mobile phase used inone-dimensional TLC (1D TLC) separation of PL classesare chloroform, methanol and water. The mobile phasecomposition can be adjusted depending on the varietyof PL classes present in the samples by adding organicsolvents (e.g. acetone, methyl acetate, 2-propanol, trie-thylamine, ethanol) and modifiers (e.g. acetic acid,
Figure 4. 1D HPTLC chromatogram of soy lecithin (left) andHT-29 cell (right) phospholipids separated on silica gel plateusing a mobile phase composed of chloroform/methanol/acetic acid/acetone/water (35:25:4:14:2 v/v/v/v/v) and visual-ized with molybdenum reagent. The soy lecithin was dissolvedin chloroform at a concentration of 5mg/mL. The lipid fractionextracted from HT-29 cells using Bligh and Dyer method was dis-solved in chloroform/methanol mixture (2:1 v/v) at a concentrationof 20mg/mL. The samples were applied onto TLC plate in a vol-ume of 40lL as 8-mm bands. LPCs: lysophosphatidylcholines;SMs: sphingomyelins; PCs: phosphatidylcholines; LPEs: lysophos-phatidylethanolamines; PSs: phosphatidylserines; PIs: phosphatidyli-nositols; PEs: phosphatidylethanolamines; PAs: glycerophosphates;PGs: phosphatidylglycerols; un: unknown.
12 K. PARCHEM ET AL.
Po
bra
no z
mo
stw
ied
zy.p
l

ammonia) [90]. An example of commonly used 1D TLCsystem that allows the analysis of samples with a diver-sified composition of PL classes is a mixture of chloro-form, methanol, acetic acid, acetone and water(35:25:4:14:2 v/v/v/v/v). This solvent system enables sep-aration of LPCs, SMs, PCs, LPIs, LPEs, PSs, PIs, PEs, PAs,PGs and CLs [92,93]. In our research, we employed thischromatographic system to determine the compositionof PL classes in both biological samples (lipid fractionisolated from HT-29 cells) and food product (soy leci-thin) (Figure 4). However, it should be indicated thatnative and oxidised species belonging to the same PLclass tend to coelute during 1D TLC separation usingsilica gel coated plates. Nevertheless, the detection ofoxPLs among their native counterparts is possible bymeans of specific derivatising reagents, as described atthe end of the section.
For very complex PL composition, it is recommendedto use two-dimensional TLC (2D TLC) with higher reso-lution capability. In the first dimension, PL classes areseparated using a solvent mixture with higher elutionstrength. A typical mobile phase used at this stage con-sists of chloroform, methanol and 28% ammonia solu-tion (60:35:8 v/v/v). After chromatogram developmentand drying of the plate, PL classes are further separatedin the second dimension at a 90� angle from the firstrun. In this case, the mobile phase with lower elutionstrength (e.g. chloroform, acetone, methanol, acetic acidand water (50:20:10:10:5 v/v/v/v)) is employed [94,95].Despite the significant improvement in chromatographicresolution, a major disadvantage of 2D TLC is the limit ofone sample analysis per plate, whereas nearly two dozenof samples can be applied in a single 1D TLC run [89].
The key factor to achieve high resolution and repro-ducibility are the experimental conditions in the
developing chamber. Therefore, it is recommended thatthe chamber should be homogenously saturated forgiven durations (at least 20min). Similarly, humiditymust be controlled to maintain adequate stationaryphase activity, which plays an important role in the sep-aration of PL classes on the silica plate [90]. These com-binations can be fulfilled with the use of automaticdeveloping chambers e.g. delivered by CAMAG,Switzerland.
Once PL separation by means of TLC technique, thenext step is their detection with nonspecific or specificderivatising agents. Among the latter, PL-specificreagents [96] or reagents interact with individualhydrophilic groups of PLs [92], such as choline, etha-nolamine or serine, can be distinguished (Table 2). TLCtechnique may also be useful for the detection andidentification of oxPLs such as hydroperoxide deriva-tives. The presence of PL hydroperoxides, e.g. in heat-treated food samples or oxidatively challenged cul-tured cells, can be detected following spraying theplate with a solution of dimethyl-p-phenylenediamine(DMP) or tetramethyl-p-phenylenediamine, whichresults in purple staining of oxidised moieties [69,102].For example, in our research, we applied the HPTLCtechnique with DMP-visualisation to monitor the kinet-ics of lipoxygenase-catalysed peroxidation of egg yolkphospholipid fraction (Figure 5) [104]. The HPTLC pro-files revealed the differences in the rate of PL hydro-peroxides formation and degradation between PC andPE classes caused by the varied composition of FAs intheir structures.
It is important to limit the sample exposure toatmospheric oxygen throughout the oxPLs analysis toavoid uncontrolled oxidation [69]. Our experience indi-cates that the most sensitive step in which uncontrolled
Table 2. Derivatisation reagents used to visualise PL following TLC separation.Derivatisation reagent Specificity Analyte appearance Reference
Acetic aqueous solution of copper(II) sulphate
Organic compounds Black spots/bands [97]
Primulin solution Lipid compounds Fluorescent spots/bands(kex/em¼ 312/605 nm
[94]
Dittmer-Lester reagent (with furthermodifications)
PLs Blue spots/bands on awhite background
[96,98]
Malachite green reagent PLs Bright green spots/bands on anorange background
[99]
2,4-dinitrophenylhydrazine Plasmalogens Yellow-orange spots/bands on awhite background
[100,101]
Dragendorff reagent Choline-containing PLs (LPCs,PCs, SMs)
Orange-red spots/bands [92]
Ninhydrin Free amino group-containing PLs(LPEs, LPSs, PEs,PSs)
Red–violet spots/bands [92]
N,N-Dimethyl-p-phenylenediaminedihydrochloride
PL hydroperoxides Purple spots/bands [69]
N,N,N0,N0-Tetramethyl-p-phenylenediamine
PL hydroperoxides Purple spots/bands [102]
Schiff’s reagent PLs with aldehyde moiety Red–violet spots/bands [103]
FREE RADICAL RESEARCH 13
Po
bra
no z
mo
stw
ied
zy.p
l

PL oxidation can occur is the application of samplesonto TLC plates. Therefore, it is recommended to applythe samples using manual or automatic TLC applicatorfitted with a nitrogen cover shield [69,102].
Liquid chromatography
The most widely analytical tool used for the identifica-tion and quantitative analysis of PLs present in bio-logical, pharmaceutical or food samples is liquidchromatography (LC). The employment of normalphase LC (NPLC) and hydrophilic interaction liquid chro-matography (HILIC) enables the separation of individualPL classes according to their hydrophilic group struc-ture [41,46,68,105]. In turn, reverse phase LC (RPLC)ensures the separation of PL species belonging to thesame class but differ in their FA composition. IndividualPL classes can be separated in terms of the length andunsaturation degree of FAs, and also by the type anddegree of oxidative modification of FAs present withinthe PL structure [41,46,105–107].
Separation of PLs into classes
The structure and chemical properties of PLs enabletheir separation into individual classes by means ofNPLC. For this purpose, columns with a length of100–250mm packed with unmodified silica gel [41,92]or modified silica gel with diol groups [108,109] with a
grain diameter of 3–5 mm are commonly used. At thebeginning of the gradient elution, a mobile phase witha low eluting strength, usually composed of a mixtureof chloroform and methanol [41,110] or hexane and 2-propanol [93,108] is employed. The proportion of thecomponent with stronger eluting strength (methanol or2-propanol depending on the solvent system used) isthen increased throughout the elution. Typical mobilephase additives used are ammonium formate, ammo-nium acetate, acetic acid, triethylamine or ammonia[33,41,92,108–110]. The volume of water in the mobilephase is usually between 0.5 and 3% v/v [33]. To beprecise, such a chromatographic system is termedaqueous NPLC (ANPLC). For example, the ANPLC systemwas used to the characterise rat brain PLs using a silicagel column and a mobile phase composed of chloro-form, methanol, acetic acid, triethylamine and water ingradient elution that allowed for the separation of 8-PLclasses including: PGs, CLs, PIs, PEs, PCs, PAs and SMs,as well as PSs, the class characteristic for brain tis-sues [41].
In recent years, HILIC has become an increasinglypopular technique for the analysis of PL composition.The most commonly used columns are 100–150mmlong with a diameter of 2–4.6mm, packed with eitherunmodified silica gel [104,105] or modified with diol[111] or amine groups [110]. The mobile phase is usu-ally a mixture of acetonitrile and water [68,105,111].During the analysis, the water content increases usuallyup to 40% v/v ensuring a stronger elution strength inthe HILIC system [112,113]. The appropriate pH of themobile phase is obtained by adding 0.1–0.2% v/v for-mic acid, 5–10-mM ammonium acetate or 20-mMammonium formate [33].
In the case of HILIC, the typical analysis time rangesfrom 15min for isocratic analyses [114] up to 60min ingradient elution, where even the separation of positionalisomers of individual PL classes, such as LPEs or LPCs, canbe observed (Figure 6) [115,116]. Unfortunately, thisapproach is sometimes insufficient for lipidomic studies.Therefore, there is a constant search for faster lipid separ-ation methods that can be successfully coupled with MS.Modern LC-MS methods are based on the use of shortercolumns (e.g. 50mm) with small particle size (subtwo mmparticles) at ultrahigh-pressures (up to 1300 bars), whichleads to fast analysis and obtaining narrow chromato-graphic peaks (even less than a few seconds) [117]. Theapplication of the fast LC-MS method in the lipidomestudy of Eimeria falciformis sporozoites and Toxoplasmagondii tachyzoites allowed for the separation of PGs, PIs,PEs, inositol phosphorylceramides, ethanolamine phos-phorylceramides, PSs, phosphatidylthreonines, PCs and
Figure 5. 1D HPTLC chromatograms of hen egg yolk PL frac-tion extracted with methanol: (a and b) profiles of native PLclasses visualised with acidic copper sulphate solution andmolybdenum reagent, respectively; (c) DMP-visualised profilesof native (0min) and enzymatically oxidised PL classes after 10,20, 30, 60, 90, and 120min of the soybean LOX 1-catalyzedreaction. LPCs: lysophosphatidylcholines; SMs: sphingomyelins;PCs: phosphatidylcholines; LPEs: lysophosphatidylethanolamines;PIs: phosphatidylinositols; PEs: phosphatidylethanolamines; PGs:phosphatidylglycerols; TAG: triacylglycerols. Reprinted with per-mission from [104].
14 K. PARCHEM ET AL.
Po
bra
no z
mo
stw
ied
zy.p
l

SMs in a run time of 3.5min [118]. Another technique ena-bles comprehensive lipidomic analysis within a very shorttime is ultrahigh-performance supercritical fluid chroma-tography (UHPSFC). This technique coupled with MS hasbeen successfully applied in the study of total lipid extractof the porcine brain and allows detection of close to 30nonpolar and polar lipid classes, including PLs in a runtime of 6min [119].
However, attention should be paid to the fact that dur-ing the one-dimensional separation of PL classes, nativeand oxidised species belonging to the same class tend tocoelute [41]. Therefore, it seems necessary to reseparatethe fractions of individual PL classes by means of anotherchromatographic system, as shown in the next sections.
Separation of individual PL species
As mentioned above, RPLC supports the separation ofindividual PL class species according to the length andunsaturation degree of FA chains present in the PLstructure as well as in the terms of the type and degree
of their oxidative modification [46,105,106]. For thispurpose, standard chromatographic columns with alength of 150–250mm packed with silica gel modifiedwith C18 groups, less frequently C8 and C30, are used.The mobile phase is composed of solvents such asacetonitrile, isopropanol, tetrahydrofuran, methanol orwater, while the modifiers include ammonium acetateor choline chloride [105,120]. The analysis time in theRPLC technique ranges from 15min [106] up to 80minfor untargeted analysis for comprehensive characterisa-tion of lipids present in the samples [105]. In the caseof PL species analysis by means of LC-MS, the fast sep-aration method employing short columns with thelength of 50mm with small particle size (e.g. 1.7 mm) isbecoming more and more popular. For example, theapplication of the fast LC-MS/MS method enables acomprehensive untargeted lipidomic analysis of oxi-dised PL species in human embryonic kidney cell lineHEK293 as well as primary mouse peritoneal macro-phages [85]. This example shows that despite the useof tandem MS, prior separation of lipids is highly rec-ommended for quantitative analysis of oxPLs, which iscaused by their large diversity and generally low abun-dance in biological and food samples [43]. Additionally,this approach allows the identification of oxidised spe-cies based on two independent parameters: the m/zvalues and differences in the retention time [25].
The oxidation of unsaturated FAs present in thestructures of PLs decreases their hydrophobicity com-pared to the native counterparts. Consequently, in theRP mode, the retention time of PL molecules dependson the degree of FA oxidation. A higher oxidationdegree shortens the elution time of the modified com-pounds [66,86,107,121]. Separation of oxPLs from theirnative counterparts can also be achieved by means ofHILIC [122]. Among the advantage of such approach,the authors mention better chromatographic separationcompared to the RP method developed by them andless ionisation suppression effects [122].
Two-dimensional liquid chromatography
As mentioned above, PLs consist a large number ofindividual compounds that differ in both the structureof the hydrophilic group and the FA composition inthe lipophilic fragment. Therefore, their completeseparation by means of one-dimensional LC (1D-LC) ispractically unachievable. The development of chroma-tographic techniques over the past decade contributedto an increase of interest in the analysis of PL fractionby two-dimensional LC (2D-LC).
To fully understand the application of 2D LC in acomprehensive analysis of PLs, its various types have
Figure 6. HILIC-MS chromatogram of lipid classes represented bystandards containing oleic acid on a Spherisorb Si column(250� 4.6mm, 5 mm) with a gradient elution using a mobile phasecomposed of acetonitrile and 5-mM aqueous ammonium acetateand ESI-MS detection in positive (A) and negative (B) ion mode. TG:triacylglycerol; Chol: cholesterol; CE: cholesteryl ester; FA: fatty acid;PG: phosphatidylglycerol; 2-LPG: 2-lysophosphatidylglycerol; 1-LPG:1-lysophosphatidylglycerol; PI: phosphatidylinositol; CA: cardiolipins;LPI: lysophosphatidylinositol; pPE: phosphatidylethanolamine plas-malogen; PE: phosphatidylethanolamine; 2-LPE: 2-lysophosphatidy-lethanolamine; 1-LPE: 1-lysophosphatidylethanolamine; pPC:phosphatidylcholine plasmalogen; PC: phosphatidylcholine; SM:sphingomyelin; 2-LPC: 2-lysophosphatidylcholine; 1-LPC: 1-lysophos-phatidylcholine. Reprinted with permission from [105].
FREE RADICAL RESEARCH 15
Po
bra
no z
mo
stw
ied
zy.p
l

been briefly characterised. Based on the number ofpeaks analysed, two different strategies to implement2D-LC technique are available. In the case of compre-hensive 2D-LC (LC� LC), all analytes that are elutedfrom the first dimension (1D) column are injected ontothe second dimension (2D) column. Thus, all peakseluted from the 1D column are fully sampled. In thecase of heart-cutting 2D-LC (LC-LC), analytes eluted asone or few peaks are selected and a fraction of a givenpeak or peaks is collected and then injected onto the2D column [123]. In addition, based on temporal imple-mentation, three types of 2D-LC are available: online,offline or stop-and-go, also known as stop-flow [124].During online analysis, the eluate from the 1D column iscollected in the loop and after filling it, the fraction isimmediately injected onto the 2D column. In this case,the 2D analysis time is limited to the collection time ofthe fractions from the 1D column. Therefore, thisapproach is confined to very short chromatographiccolumns (e.g. 10mm) during the 2D separation [125]. Inthe offline approach of 2D-LC technique, 1D column elu-ates are collected manually or with fraction collectorsand the fractions are stored. When needed, the mobilephase from the 1D fractions can be evaporated, and theanalytes can be redissolved in the solvent compatiblewith the 2D system [105,116]. Additionally, thisapproach allows to concentrate samples. Comparingboth schemes, the online approach is clearly faster andcan be fully automated, while the offline system enablesa higher resolving power as a result of using longer col-umns during 2D separation [124]. In the case of thestop-flow mode, the 1D and 2D analysis are carried outrotationally. During 1D separation, the eluate is col-lected in the loop [106]. After loop filling, the 1D pumpis interrupted, while the eluate collected in the loop isreinjected onto 2D column. Once 2D separation is com-pleted, the 1D pump is restarted and the 1D separationis continued until the loop is filled again. The cycles arerepeated as often times as required [106,124].
Due to the high resolving power of 2D-LC, it is suc-cessfully used in the field of lipid science. For instance,the application of online comprehensive normal pha-se� reverse phase 2D LC (NP� RP 2D-LC) methodenabled the identification of 721 lipid compounds in asample isolated from rat peritoneal surface layer,among which numerous PLs differing in the structureof hydrophilic group as well as FA composition weredistinguished [125]. The offline approach of 2D-LC tech-nique is also commonly used in the analysis of lipids,especially PLs. The advantage is that longer chromato-graphic columns used during 2D ensure higher reso-lution of, assuming the use of the same particle size of
stationary phase and eluent flow rate. Therefore, theoffline system can be successfully employed duringuntargeted analyses for comprehensive characterisationof lipid fractions in food and biological samples. Theapplication of offline HILIC-RP 2D-LC system in the ana-lysis of hen egg yolk, soybeans or porcine brain tissueallowed for the identification of over 150 different lipidcompounds. Among them, numerous PLs have beendetected, including various PL classes (PGs, PIs, CLs, PEs,PCs and SMs), their lyso forms (LPGs, LPIs, LPEs andLPCs) as well as PE and PC plasmalogen forms possess-ing vinyl ether fatty alcohols at the sn-1 position of theglycerol backbone [105].
An important advantage of the LC� LC techniques isthe separation of native PLs from their oxidised deriva-tives within individual PL classes [41]. This goal wasaccomplished by means of 1D separation of PLs usingNP mode and collection of fractions corresponding toindividual PL classes. Then, the mobile phase wasevaporated under a stream of nitrogen, the analyteswere dissolved in the appropriate solvent and individ-ual PL classes were subsequently analysed in thesecond dimension using the RP mode [41].
The third mentioned 2D-LC approach that can beimplemented for the PL analysis is the stop-flow system.An example of the application of the stop-flow compre-hensive 2D-LC method is the analysis of PLs present incow’s milk and plasma samples. For this purpose, a loopholding a volume of 100 mL, which provided 1-min collec-tion of eluate from the 1D HILIC column was employed.After filling the loop, the collected fraction was injecteddirectly onto the RP column. The 2D analysis ensured theseparation of molecular species differing in the lengthand degree of unsaturation of FAs present in diacyl moi-eties. The application of the stop-and-go HILIC� RP 2D-LC method enabled separation of 6-PL classes (PIs, PEs,PSs, PCs, SMs and LPCs) in the first dimension and deter-mination of up to 16 individual species differing in FAcomposition (Figure 7) [106]. Nevertheless, one of the dis-advantages of stop-and-go implementation is theextended time of the analysis, which can last up to 6h[126]. In addition, the analytes that are present for such along time in the 1D column may diffuse even though themobile phase flow is stopped. Consequently, this leads toweakening of the 1D resolving power [124].
Detection of PL
Basic detectors coupled with LC used inPL analysis
In the case of native PL analysis, spectrophotometricdetectors are practically unusable due to the lack of
16 K. PARCHEM ET AL.
Po
bra
no z
mo
stw
ied
zy.p
l

groups in their structures with characteristic wave-length absorption. Therefore, absorption in the190–210 nm range results from the presence of doublebonds as well as some functional groups, such as carb-oxyl, phosphate and amine [127] is occasionally used[97]. However, the extinction coefficient is stronglydependent on the unsaturation degree of FAs within PLstructure, which makes the quantitative analysis practic-ally impossible [128].
In contrast to native molecules, the spectrophotomet-ric detectors can be successfully applied for the analysisof oxPLs. The homolytic hydrogen atom abstraction fromthe methylene group of PUFAs that occurs during oxida-tion as a result of electron rearrangement leads to theformation of conjugated dienes [9]. This structure exhib-its the characteristic absorption at the wavelengtharound 230nm. Therefore, LC coupled with spectro-photometric detector set at 232–234nm is used for thedetection of numerous primary (hydroperoxides) and
secondary (epoxides, alcohols and ketones) products ofPL oxidation [121,129,130]. We applied this approachduring RP analysis of PE and PC fractions obtained byHILIC fractionation of enzymatically oxidised PLs isolatedfrom hen egg yolk, as shown in Figure 8(d,e) [104].However, it should be noted that the application of LC-UV-MS approach, where low sample concentrations areexposed to high UV doses in a detector cell may haveserved impact on the structure of analytes [131]. Suchalterations can be particularly probable in the case ofanalysis of unstable lipid oxidation products such asoxPLs and consequently lead to the generation of arte-fact signals in the MS spectrum.
Fluorescence detectors are another type of detectorssometimes coupled with LC during PL analysis. In thiscase, a precolumn or postcolumn derivatisation of analy-tes is necessary. A number of nonspecific and specificderivatising reagents can be employed. For example, 1-dimethylaminonaphthalene-5-sulfonyl chloride or
Figure 7. Enlargement of the HILIC� RPLC-MS contour plot of the glycerophosphatidylcholine molecular species of plasma (left),along with the corresponding 2D raw data (right). The 1D separation was carried out on an Ascentis Express HILIC column(150� 2.1mm, 2.7 mm) with a gradient elution using mobile phase composed of acetonitrile/10-mM aqueous ammonium formate(90/10) and acetonitrile/methanol/10-mM aqueous ammonium formate (55:35:10). The 2D separation was carried out on anAscentis Express C18 column (150� 4.6mm, 2.7 mm) with a gradient elution using mobile phase composed of isopropanol/10-mM ammonium formate/tetrahydrofuran (55:30:15) and acetonitrile. Reprinted with permission from [106].
FREE RADICAL RESEARCH 17
Po
bra
no z
mo
stw
ied
zy.p
l

succinimidyl 2-naphthoxyacetate is used for precolumnderivatisation of PL molecules with the primary aminogroup, such as PEs and PSs. In the case of PAs, anexample of a precolumn derivatising reagent is 3-(9-anthroyl) diazo-2-propene [132]. For postcolumn derivati-sation, the most common are nonspecific probes thatform noncovalent complexes with the hydrophobic frag-ment of PL molecules, but also with other lipid com-pounds such as TAGs. The formation of the complex leadsto a rapid increase of probe fluorescence, upon thechange of the environment from hydrophilic to hydro-phobic. An example of such nonspecific postcolumnprobes are 1,6-diphenyl-1,3,5-hexatriene (DPH) or 2,5-
bis(5-tert-butyl-benzoxazol-2-yl)thiophene(BBOT) [120,133].
The type of detectors widely used for the qualitativeand quantitative analysis of lipids, including PLs, is aero-sol detectors such as evaporative light scatteringdetector (ELSD) and charged aerosol detector (CAD). Inthis type of detectors, the eluate is nebulised in an inertgas stream resulting in the formation of a primary aero-sol, which then flows into the drying tube, where themobile phase is evaporated off [134]. In the case ofELSD, the resulting secondary aerosol is transferred intothe detection chamber, where the beam of light crossesthe cloud of analyte and the scattering of light is
Figure 8. HPLC-CAD chromatogram of the hen egg yolk PLs obtained during the separation in the HILIC mode (A). CAD-HPLCchromatograms obtained during separation in the RP mode for oxidised and nonoxidised PE (B) and PC (C) species formed after60min of soybean LOX-1 catalysed reaction. HPLC-DAD chromatograms obtained during separation in the RP mode for oxidizedPE (D) PC (E) species formed after 60min of soybean LOX-1 catalysed reaction. TAGs: triacylglycerols; FAs: fatty acids; PGs: phos-phatidylglycerols; PIs: phosphatidylinositols; PEs: phosphatidylethanolamines; LPEs: lysophosphatidylethanolamines; PCs: phospha-tidylcholines; SMs: sphingomyelins; LPCs: lysophosphatidylcholines. Reprinted with permission from [104].
18 K. PARCHEM ET AL.
Po
bra
no z
mo
stw
ied
zy.p
l

measured by a photomultiplier. During analysis usingCAD, the dried particles collide with a stream of posi-tively charged gas (e.g. nitrogen), which forces thetransfer of the charge onto the analyte molecules.Finally, the particles are transported via ion trap to thecollector, where their charge is measured by an elec-trometer. The most known disadvantage of ELSD is thenarrow range of analyte concentration for which thelinear response of the detector is achieved. A similardisadvantage is observed also for CAD, yet the linearresponse range is still approximately 10 times broader[134]. Additionally, ELSD response is also depended onionic strength and thus its application may cause somedifficulties during gradient elution program.
Despite these facts, aerosol detectors are widelyused, especially in the field of food science and foodindustry, where in-depth PL analysis using advancedtechnologies is not always necessary. Both ELSD andCAD have been successfully applied in the analysis offood samples such as milk [68,84] or egg yolk (Figure8(a)) [104,135]. In our experiments, we applied CAD toprofiling of oxPE and oxPC species formed during lipox-idase-catalysed peroxidation of egg yolk PL fraction(Figure 8(b,c)) [104]. During the separation of the frac-tions of individual PL classes in RP mode, CAD enabledmonitoring of both oxidised and nonoxidised PLs,which is not possible using DAD (Figure 8(d,e)).
Mass spectrometry
In recent years, shotgun MS, TLC-MS and LC-MS havebecome the key analytical techniques used in the fieldof lipid science. The application of low-energy ionisa-tion techniques, such as ESI and MALDI, has revolution-ised the use of MS in the analysis of labile biomoleculesincluding PLs and especially product of their oxidation[43]. Consequently, these techniques paved the way tothe development of modern lipidomics and oxidativelipidomics [46]. However, the analysis of oxPLs is still abig challenge and so far there is a lack of universalmethods to analyse them in a wide range of molecularmasses and different concentration levels [25].
The shotgun MS, in which ESI is generally employed[136], is mainly used in targeted analysis aimed atdetecting a set of selected compounds. However, directinjection of a complex mixture of compounds mayreduce the ionization efficiency, especially those thatare present in a low concentration such as oxPLs [137].Therefore, as mentioned earlier, this approach is notrecommended in the analysis of PL oxidation products[43] or at least the use of high-resolution MS (thedetails of the technique are given in this section) is
indicated [25]. Direct injection of the complex sampleinto low-resolution instruments can limit the isolationof low-abundant ions (e.g. oxPLs ions), which are neces-sary for tandem mass spectrometry experiments [25].
There are also some limitation in the application ofMALDI technique in the analysis of PLs and particularlyoxPLs in complex samples, which is due to the fact thatthis technique is not compatible with online separationtechniques needed to minimalise analyte suppressioneffects and to increase the dynamic range of detection[43,64]. Although some reports indicate the applicationof this technique in native and oxidised PL studies, butthese reports often concern model substances ratherthan complex samples. For example, the MALDI-TOF MSmethod was used to determine the effect of model PLoxidation on the kinetics of digestion catalysed byphospholipase A2 [138]. A helpful solution in the casecomplex samples can be the separation of lipids ofinterest (e.g. oxidised species) already at the samplepreparation stage followed by their analysis usingMALDI. An example of such a sample preparation tech-nique is lSPE, as described earlier [64].
Another approach in the MS analysis of PLs involvestheir initial separation by means of HPTLC techniquefollowed by direct PLs extraction from appropriatechromatogram zones of the plates and their injectioninto a mass spectrometer. This can be achieved by theapplication of TLC-MS Interface, e.g. delivered byCAMAG, Switzerland, as shown in the study of hypo-chlorous acid-induced oxidation products of PC(C16:0/C18:1) [139]. Alternatively, PLs separated by HPTLCtechnique can be directly loaded from the plate intothe mass spectrometer using ionisation techniquessuch as MALDI or desorption electrospray ionisation(DESI). For example, the application of TLC coupledwith MALDI-TOF MS device enabled the comprehensivecharacterisation of PLs isolated from hen egg yolk [140]and porcine brain [141]. The detection of individual PLclasses was possible even for analytes occurring at lev-els less than 1% of the total PL fraction (e.g. PIs in henegg yolk), which corresponded to the detection limit ofabout 400 pmol [140]. Moreover, previous studiesemploying normal phase TLC technique coupled withMALDI-TOF MS revealed that FA composition withinindividual PL classes affected their position within theband corresponding to a respective class. The PE andPC species containing shorter and more unsaturatedacyl residues were characterised by lower retention fac-tor (Rf) values [142]. In turn, LC coupled with MS detec-tion is usually associated with the employment of ESI;less common is atmospheric pressure chemical ionisa-tion (APCI).
FREE RADICAL RESEARCH 19
Po
bra
no z
mo
stw
ied
zy.p
l

In the analysis of native and oxidised PLs, low-energyionisation techniques such as MALDI or ESI are com-monly used. These techniques do not allow impartingenough quantities of energy onto the subject moleculeto induce fragmentation in the ion source in oppositionto hard ionisation techniques, where in-source ion frag-mentation takes place introducing complexity to theMS spectrum and difficulty to molecule identification.Considering the above, acute identification of PL spe-cies, which despite the different FA composition andvarious oxidative modifications have exactly the samemolecular mass, is difficult to achieve even using high-resolution MS. For example, the structural isomers ofPC(C16:0/20:4) with one hydroperoxide group or twohydroxy groups are characterised by the same molecu-lar mass (m/z 814.6, [MþH]þ). For this reason, tandemmass spectrometry (MS/MS), where controlled ion frag-mentation is achieved e.g. by collision-induced dissoci-ation (CID), is a powerful tool in the analysis of nativeand oxidised PLs in complex samples. The MS/MS tech-nique ensures the fragmentation of ions selected in thefirst mass analyser as a result of a collision with an inertgas in the collision cell. In the next step, fragmentedions are analysed in the second mass analyser [143]. Onthe one hand, interpretation of MS/MS spectra is a bigchallenge, but, on the other hand, this approach pro-vides unique information on the structure of moleculesparticularly useful in the identification of structural andpositional isomers. In the case of oxidised species, thecorrect interpretation of MS/MS spectrum can contrib-ute to the in-depth structural characterisation includingthe position of oxidised acyl chain in glycerol moiety,the side of modification along the unsaturated acylchain as well as the nature of oxidation group(s)[144,145]. Moreover, some authors proposed theapplication of ozone-induced dissociation coupled withMS/MS to examine the double-bound localisation inpositional isomers. For example, Deeley et al. usedthis technique to distinguish PL plasmalogens,which allowed to find the following 1-O-alkyl PE and PSspecies in human lens: pPE(16:0/9Z-18:1), pPE(11Z-18:1/9Z-18:1), pPE(18:0/9Z-18:1), pPS(16:0/9Z-18:1), pPE(11Z-18:1/9Z-18:1), and pPE(18:0/9Z-18:1) [146].
As a result of parent ions fragmentation and analysisof generated fragment ions, it is possible to identify FAsin the sn-1 and sn-2 positions of individual PL species[42,147]. For example, shotgun MS/MS method wasemployed to identify the long-chain oxidation productsof PCs that differed in length and unsaturation degree ofFA present in the sn-2 position of glycerol [148]. In thecase of complex biological samples, high-resolution MS/MS analysis of PLs and especially oxidise species is
preceded by separation by means of fast LC. Forexample, application of LC-MS/MS method enabled bothqualitative and quantitative analysis of oxidised speciesof individual PL classes in mouse primary macrophages.The total amounts of oxPCs, oxPEs and oxPIs per onemillion cells were 1180.3, 936.5 and 80.7 fmol, respect-ively [85]. The MS/MS technique has also been used inthe analysis of short-chain oxPLs formed as a result ofcleavage of the unsaturated FA including carbonyl prod-ucts, such as saturated and unsaturated aldehydes,hydroxy-aldehydes, carboxylic acids, and hydroxy car-boxylic acids esterified to glycerol back-bone [144,145,148].
In the field of lipid science, various types of mass analy-sers can be employed. Generally, the mass analysers canbe divided into low-resolution quadrupole (Q), linear iontrap (IT) and high-resolution instruments embracing time-of-flight (TOF), quadrupole time-of-flight (Q-TOF) or triplequadrupole (QqQ). The latter are characterised by massresolving power (determined at full width half-heightmaximum) higher than 10,000 [149] and are definitelymore popular in lipidomic studies [33]. However, each ofthem has some advantages and drawbacks concerningthe qualitative and quantitative analysis of lipids. Forexample, QqQ are commonly used for quantification ofnative and oxidise PLs. In turn, for the structural character-isation of unknown lipids, high-resolution MS such as TOFbased mass analysers or Fourier transform ion cyclotronresonance (FTICR) are widely employed [43]. Moreover,modern high-resolution instruments equipped with fastscan speeds and polarity switching, like some Orbitrapinstruments, are highly recommended for detecting oflow-abundant oxidised PL species in both positive andnegatively ion mode with high throughput [25]. However,high-resolution MS/MS instruments, which do not allowsimultaneous scanning in positive and negative ion modeduring the analysis, are also successfully used in the ana-lysis of oxPL. For example application of linear ion trap(LTQ) – Orbitrap mass spectrometer equipped with anelectrospray ion source enabled the identification of 46oxidised PC species in oxidised LDL [122].
In addition to untargeted analysis of native andoxidised PLs, targeted strategies are commonly usedin lipidomic studies. In the case targeted analysis ofcholine-containing PL classes, such as PCs and SMs, themost popular approach is precursor ion scanning (PIS)for m/z 184 in the positive ion mode [25,150]. Thisapproach takes advantage of the high intensityobserved for product ion (fragment) at m/z 184 corre-sponding to protonated ion ([MH]þ) of the polar head,in this case, choline. For other PL classes, PIS or neutralloss scanning (NLS) acquisition modes can be
20 K. PARCHEM ET AL.
Po
bra
no z
mo
stw
ied
zy.p
l

conducted [151]. Exemplary parameters applied duringexploratory analysis of PLs present in human serum forindividual classes are as follows: PE, NLS 141Da (posi-tive ion mode); PS, NLS 185Da (positive ion mode); PA,NLS 98Da (positive ion mode); PG, NLS 172Da (positiveion mode); and PI, PIS m/z 241Da (negative ion mode)(Figure 9) [150]. In turn, multireaction monitoring(MRM) experiments are commonly used e.g. for screen-ing known oxPLs [152]. The advantage of a targetedapproach is higher resolution and better sensitivity[150]; however, a limited range of native and oxidisedPL species screened in each acquisition cycle is themain drawback. Therefore, during multiple PL classes’analysis, several injections can be necessary, which inconsequence can require a larger sample volume [25].
Ion mobility spectrometry
The differentiation of PL isomers is often difficult evenusing ESI-MS/MS technique. For this reason, anothertechnique – ion mobility spectrometry (IMS) – is moreuseful in some applications. So far, this technique hasbeen successfully used in the analysis of PL species ofindividual classes differ in the structures of acyl chains,but it has been not applied to the study of oxidativemodifications along the unsaturated FA chain [153]. Ingeneral, similar to mass spectrometry, the first stageinvolves ionisation of the analytes. Then, the generatedions are introduced into the analyser, where they aredifferentiated based on the mobility within a pressur-ised chamber under the influence of an electric field.
Figure 9. Separation of PL classes by HILIC-UPLC. Multiplex analysis of mixture of PL class standards (A) and human serum (B)using PIS and NLS in positive and negative ion mode. Top panel shows HILIC chromatographic separation and mass spectrometricdetection of PL classes by either precursor m/z 184, 241, and 264 or neutral loss m/z 141, 172, 185, and 98. Middle panel showsNLS m/z 141 in positive ion mode specific for PE and LPE. Bottom panel shows summed mass spectral (MS) data from NLS m/z141 in positive ion mode shown indicated in grey above. Inset: magnification from m/z 762 to m/z 774. PG: phosphatidylglycerol;PI: phosphatidylinositol; PE: phosphatidylethanolamine; LPE: 1-lysophosphatidylethanolamine; PC: phosphatidylcholine; PA: phos-phatidic acid; SM: sphingomyelin; LPC: lysophosphatidylcholine. Reprinted with permission from [150].
FREE RADICAL RESEARCH 21
Po
bra
no z
mo
stw
ied
zy.p
l

The main difference between IMS and MS is the factthat the measurement of the ion drift time occurswithin a pressurised chamber, while the measurementof m/z ratio takes place in the absence of gas. Themobility of ion through the chamber depends mainlyon the frequency of the collision between ion and neu-tral gas. Therefore, the ion mobility of a compoundunder ideal experimental conditions depends on its sizeand shape [154]. In addition, the IMS is usually coupledwith mass spectrometry (IMS-MS) and enables full dif-ferentiation of ions tacking into account size, shape,mass and charge [33]. Identification of individual com-pounds is carried out based on m/z ratio and drift time(usually expressed in milliseconds) [155]. The applica-tion of ESI-IMS-MS technique in phospholipidomicresearch enables the differentiation of PL species ofindividual class that differ in the position of the acylchain present in the structure (regioisomers). Therefore,this approach eliminates the need to use regiospecificenzymes such as phospholipase A1 and A2 to determinethe position of the FAs in PL structure. Furthermore, theESI-IMS-MS technique makes it possible to separate PLclass species that differ in localisation of the doublebound in the structure of acyl chain as well as the con-formation of double bound (cis-trans isomers).
Another technique used in the analysis of PLs isMALDI-IMS-MS, which enables a fast (hundreds ofmicroseconds) analysis of complex mixtures of PLs. Thechanges in drift times of PLs result from differences inacyl chain length and degree of unsaturation and thenature of the hydrophilic group [156]. In addition, previ-ous studies indicate that formation of alkali PL adducts,formed upon the addition of LiCl, NaCl, KCl or CsCl tothe matrix, leads to a significant shift towards lower col-lision cross sections in comparison with protonated PLspecies with a similar m/z. Consequently, the shift inthe mobility of ions produced by alkali cationisation isobserved, which is particularly evident in the case ofcaesium ion. Therefore, the addition of caesium salt tothe matrix allows the identification of PL species, whichotherwise would not be observed [156]. Exemplaryoverlay of two-dimensional MALD-IM-MS plots obtainedfor rat brain PLs with and without caesium ion is shownin Figure 10.
Data analysis by means of bioinformatic tools
One of the main challenges for lipidomics and foodo-mics, in particular for MS-based approaches, is compu-tational and bioinformatic requirements for handling alarge amount of data generated during analysis. A typ-ical workflow in lipidomics begins with sample
preparation followed by data acquisition, processing ofraw lipid data set and lipid identification using data-bases such as LIPID MAPS (http://www.lipidmaps.org)[157]. Another important step in lipidomic data analysisis the application of appropriate chemometric methods,which allow for the selection of key molecules (discrimi-nators) that characterise a specific phenotype. For thispurpose, classical statistical tests such as ANOVA meth-ods, principal component analysis (PCA) and partialleast squares discriminant analysis (PLS-DA) are com-monly used [158]. Moreover, for complex lipid datasets, generated e.g. during untargeted lipidomics ana-lysis using two-dimensional chromatography coupledwith MS, a combination of multiway methods, such asmultivariate curve resolution (MCR) can be applied[158]. Recently, the regions of interest multivariatecurve resolution (ROIMCR) procedure, which enablescompressing and processing LC-MS data, was employedin lipid standards analysis, including PLs. This approachconsists of a preliminary selection of the regions ofinterest of the LC-MS data followed by their throughoutchemometric analysis [159]. The bioinformatic analysisincludes also the interpretation of observed lipidchanges in the biochemical context, which is known asa pathway analysis. An example of a database providinglipid metabolic pathway information is KyotoEncyclopaedia of Genes and Genomes (KEGG) (https://www.genome.jp/kegg).
The experimental strategy used to acquire MS dataaffects data processing and information interpretations.Therefore, different bioinformatic lipid tools can beemployed for the analysis of shotgun and LC-MS data
Figure 10. Overlay of two 2D MALDI-IMS-MS plots of ratbrain phospholipids. The analysis was carried out directly fromthe brain tissue, on which matrix solution (2,5-dihydroxyben-zoic acid) without and caesium was deposited. Reprinted withpermission from [156].
22 K. PARCHEM ET AL.
Po
bra
no z
mo
stw
ied
zy.p
l

[160,161]. Among bioinformatic tools, approaches usingreference libraries followed by spectrum similaritysearches can be distinguished. Examples of such toolsare MassBank (https://massbank.eu/MassBank/), HumanMetabolome Database (http://www.hmdb.ca/), whichcontain both MS and MS/MS spectra of various metabo-lites, including PLs. In addition, MassBank enables incorp-oration of self-created reference spectra [160].Nevertheless, the lipid identification rate using thesedatabases is usually low, due to the limited amount ofempirically generated MS/MS spectra [162]. Therefore,bioinformatic tools based on in silico generated tandemMS spectra, such as LipidBlast (http://fiehnlab.ucdavis.edu/projects/LipidBlast) [162], are employed in lipidomicstudies. In this approach, the identification of lipids isobtained by fitting experimental fragment m/z valueswith simulated library m/z values using in silico fragmen-tation libraries. Another open sources software with insilico generated libraries is LipidMatch (http://secim.ufl.edu/secim-tools/lipidmatch/) [163], which was intro-duced in 2017 and includes over 500,000 lipid species,across over 60 lipid categories, including PLs.Furthermore, LipidMatch includes a list of potentialoxidised FAs (both long- and short-chain) that can beincorporated in the structure of lipids. In turn, the open-source software tool entirely dedicated to the predictionand identification of oxPLs is LPPtiger (https://home.uni-leipzig.de/fedorova/software/lpptiger/) [164], which wasproposed in 2017. The LPPtiger workflow uses threeunique algorithms: in silico oxidation, theoretical CIDfragmentation and multiscore-based identification. Inthis way, the software can predict oxidised lipids in agiven lipidome and identify corresponding predictedstructures. A powerful bioinformatic tool is alsoLipidSearch (Thermo Fisher Scientific, Waltham, MA),which can be used for the analysis of a large amount ofMS data obtained for both shotgun and LC-MSapproaches. This software enables automatic identifica-tion and relative quantification of cellular lipids [161]. Inaddition, a number of other bioinformatic tools such asGreazy [165], LipidView (formerly LipidProfiler) [166] orLipidXplorer [167] are used for MS data processing dur-ing PL analysis.
Although the use of the bioinformatics tools men-tioned above seems to be an invaluable step duringlipid analysis, the databases may still be incompleteregarding the tandem MS spectra of oxPLs, which canlimit their identification. In addition, it should also benoted that oxPLs are usually less abundant and conse-quently may generate MS/MS spectra with a lower sig-nal to noise ratio. Therefore, the analytical approachesdeveloped should include specific selection criteria, e.g.
isotopic envelope, for more efficient identification ofoxPLs even in samples with a low ratio of oxidised tonative PLs [25].
Imaging techniques
Mass spectrometry imaging
From the biological point of view, apart from the con-tent of individual lipid species, their distribution in agiven biological system may be even more important.Therefore, there is a growing interest in imaging techni-ques such as mass spectrometry imaging (MSI). Thislabel-free technique enables for studying in situ localisa-tion, structure characterisation and relative quantifica-tion of multiple lipids in biological samples. The spatialmapping of the distribution of cellular or tissue lipids isachieved as a result of MS data acquisition from thedefined pixels of the sample followed by processing oflipid MS data set [168]. The analysis efficiency dependson several parameters such as the MS instrument con-figuration, number of shots fired per pixel, the distancebetween pixels or the data acquisition rate [169]. Oneof the most commonly used ionisation techniquescoupled with MSI are MALDI and DESI, which enabledirect lipid analysis on the sample surface withouttime-consuming and laborious extraction steps requiresfor ESI [153].
The MALDI-MSI technique has proved to be a power-ful tool in PL analysis of animal and human tissues suchas brain, colon, heart or liver [168] as well as culturedcells [170]. Moreover, tracking changes in the cellularand tissue distribution of PLs enabled selection ofmolecular features most indicative of a given diseasestate, and, consequently, can provide insight into dis-ease prediction and monitoring of its progression. Anexample of this approach was the monitoring of PLchanges in the brain of a mouse model of Alzheimer’sdisease associated with the development of this dis-order. As a result of disease progression, changes in thedistribution of various lipid species including PCs, SMs,PIs and LPCs were observed. The lipid remodellingincluded several regions of the mouse brain such asfrontal cortex, hippocampus and subiculum [171].Another application of MSI technique in lipidomics is tostudy changes in the PL distribution between normaland cancerous tissues, which may be useful in clinicalpractice to identify tumour margins after surgical resec-tion. This approach was tested on an example of gastriccancer operations in direct comparison with marginassessment by frozen-section histopathology [172]. Thestatistical analysis indicated that distribution disorder ofCL(10-[18:2/18:2],30[18:2/18:2]), PE(36:1) and PS(36:1) is a
FREE RADICAL RESEARCH 23
Po
bra
no z
mo
stw
ied
zy.p
l

diagnostic feature for distinguishing normal gastric tis-sue from benign and malignant tumour tissues [172].Differences in the PL distribution were also observedbetween normal liver tissue and colon cancer livermetastasis, where mainly the increase of SM(16:0) in thecase of cancerous tissue was observed [173]. The PLimaging technique also enables discrimination oftumour subtypes and grades. For example, the DESI-MStechnique was used for rapid classification of humanbrain tumours, where differences in PS and PI specieswere mainly observed [174]. In turn, air flow-assistedionisation (AFAI) MSI technique allowed for moleculardistinguishing of breast invasive ductal carcinoma andbreast ductal carcinoma in situ. Changes in the abun-dance of four ions corresponding to PL species (m/z706.5, PC(30:0); m/z 718.6, PC(32:0) or PE(35:0); m/z724.5, PE(34:1); and m/z 730.5, PC(32:2)) were observedbetween tumour subtypes as well as depending ongrade of breast cancer (Figure 11) [175].
Additional exciting application of MSI technique isspatial imaging of oxPLs in tissues, which can contrib-ute to advanced understanding of pathogenesis andprogression of numerous diseases. In order to investi-gate the distribution of oxPLs in the spinal cord tissuefrom the lumbar region of adult rats, the high-selectiveMALDI MSn imaging technique has been used. Theapplication of the mentioned technique allowed foridentification and localisation of short-chain products ofPL oxidation such as PC(18:0/9:0 COOH) and PC(16:0/11:0 COOH) [176]. The MS-based imaging was also usedto identify and determine the distribution of oxPL inmouse organs such as brain, kidney and liver [177].Moreover, the effect of different sample storage condi-tions on the formation of oxPLs was determined. Theimagining experiments indicated that global formationof oxidised species, such as PC(16:0/9:0 COOH), PC(16:0/11:0 CHO) and PC(16:0/11:0 COOH), across the tissuewas observed within 24 h under ambient conditions. Itwas also shown that PL oxidation is inhibited if thesamples are stored at �80 �C under nitrogen atmos-phere [177].
Confocal imaging technique
The analytical techniques described above can becoupled to the investigation of the lipid maps in cells.In many cases, changes in the composition of PLs incells due to nutritional overload or oxidative stresstranslate into biophysical changes in cellular mem-branes. Recently, it was shown that the fluorescentprobe laurdan can be used in confocal imaging to fol-low alterations in the fluidity of the plasma membrane
and insulin granule membranes in insulin secretingbeta cells exposed to high glucose and/or high palmiticacid concentrations (Figure 12) [178]. Laurdan, whichincorporates into the lipid phase in membranes,changes emission intensity in a way correlating withthe biophysical state of its environment. Its excited-state relaxation is independent of the head-group typein PLs, but is sensitive to the degree of saturation of FAmoieties present in PLs and freedom of mobility ofwater molecules in the membrane bilayer. It was shownbefore that high glucose and/or high palmitic acid incu-bations activate phospholipase A2 and induced PLsremodelling in beta cells by exchanging polyunsatur-ated FA and introducing saturated FA and monounsatu-rated FA [179,180], which led to significant changes,predominantly in the fluidity of the membrane of insu-lin granules.
Also, the real-time quantitative analysis of cellularlipid maps by confocal spectral imaging of intracellularmicropolarity was performed [181]. For this purpose,the solvatochromic and lipophilic probe Nile red, whichshifts its emission spectrum from yellow to red whenthe degree of polarity of the lipid environmentincreases, was used. The adapted spectral phaser ana-lysis helped to determine pixel-by-pixel the degree oflipid polarity, and to mapp insulin secreting beta cellsto provide accurate representations of the proportionof nonpolar, polar and highly polar lipids in the cellsand created a topographical image of the cellular distri-bution of the various classes of lipids in the plasmamembrane, insulin granules and lipid droplets inthe cells.
Fluorescence probes have also been used in thestudy of membrane lipid oxidation using fluorescenceand confocal microscopy. An example of such probe isC11-BODIPY581/591, which is an FA analogue with emis-sion maximum in the red range of the visible spectrum.The previous research using living rat-1fibroblastsshowed that the fluorescent probe is distributed het-erogeneously throughout cellular membranes, with pre-dominant localisation in the perinuclear region of thecell. The probe was not specific for any particularorganelle, such as mitochondria, peroxisomes, lyso-somes and Golgi apparatus, while lower probe incorp-oration was observed for rat-1fibroblast plasmamembrane [182]. As a result of free radical-induced oxi-dation of butadienyl moiety of the probe, the fluores-cence emission maximum shifts from 595 nm (redfluorescence) to 520 nm (green fluorescence) [182].Therefore, the C11-BODIPY581/591 is widely used in thestudy of lipid oxidation of model membrane systems aswell as cellular membrane lipid damage, e.g. caused by
24 K. PARCHEM ET AL.
Po
bra
no z
mo
stw
ied
zy.p
l

Figure 11. AFAI-MSI of samples of low-grade breast ductal carcinoma in situ (A and C) and high-grade breast invasive ductal car-cinoma (B and D). Positive ion mode AFAI-MSI ion images of two samples showing the distribution of m/z 706.5 correspondingto PC(30:0) (A1, B1), m/z 718.6 corresponding to PC(32:0) or PE(35:0) (A2, B2), m/z 724.5 corresponding to PE(34:1) (A3, B3) andm/z 730.5 corresponding to PC(32:2) (A4, B4). Negative ion mode AFAI-MSI ion images of sample two samples showing the distri-bution of m/z 295.2, corresponding to FA(18:2) (C1, D1), m/z 311.2 corresponding to octadecanoids (C2, D2), m/z 327.2 corre-sponding to FA(22:6) (C3, D3) and m/z 329.2 corresponding to FA(22:5) (C4, D4). Lower magnification images with expandedviews of an adjacent haematoxylin and eosin (H&E) stained section are shown in (E). Reprinted with permission from [175].
FREE RADICAL RESEARCH 25
Po
bra
no z
mo
stw
ied
zy.p
l
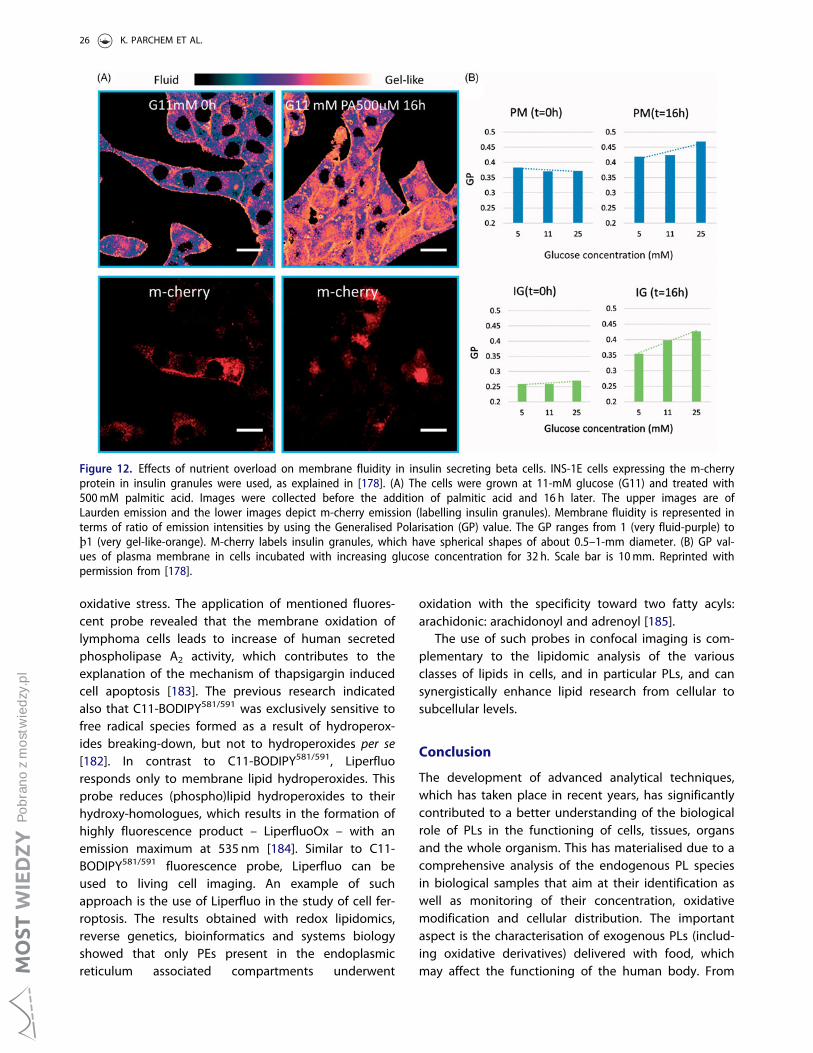
oxidative stress. The application of mentioned fluores-cent probe revealed that the membrane oxidation oflymphoma cells leads to increase of human secretedphospholipase A2 activity, which contributes to theexplanation of the mechanism of thapsigargin inducedcell apoptosis [183]. The previous research indicatedalso that C11-BODIPY581/591 was exclusively sensitive tofree radical species formed as a result of hydroperox-ides breaking-down, but not to hydroperoxides per se[182]. In contrast to C11-BODIPY581/591, Liperfluoresponds only to membrane lipid hydroperoxides. Thisprobe reduces (phospho)lipid hydroperoxides to theirhydroxy-homologues, which results in the formation ofhighly fluorescence product – LiperfluoOx – with anemission maximum at 535 nm [184]. Similar to C11-BODIPY581/591 fluorescence probe, Liperfluo can beused to living cell imaging. An example of suchapproach is the use of Liperfluo in the study of cell fer-roptosis. The results obtained with redox lipidomics,reverse genetics, bioinformatics and systems biologyshowed that only PEs present in the endoplasmicreticulum associated compartments underwent
oxidation with the specificity toward two fatty acyls:arachidonic: arachidonoyl and adrenoyl [185].
The use of such probes in confocal imaging is com-plementary to the lipidomic analysis of the variousclasses of lipids in cells, and in particular PLs, and cansynergistically enhance lipid research from cellular tosubcellular levels.
Conclusion
The development of advanced analytical techniques,which has taken place in recent years, has significantlycontributed to a better understanding of the biologicalrole of PLs in the functioning of cells, tissues, organsand the whole organism. This has materialised due to acomprehensive analysis of the endogenous PL speciesin biological samples that aim at their identification aswell as monitoring of their concentration, oxidativemodification and cellular distribution. The importantaspect is the characterisation of exogenous PLs (includ-ing oxidative derivatives) delivered with food, whichmay affect the functioning of the human body. From
Figure 12. Effects of nutrient overload on membrane fluidity in insulin secreting beta cells. INS-1E cells expressing the m-cherryprotein in insulin granules were used, as explained in [178]. (A) The cells were grown at 11-mM glucose (G11) and treated with500mM palmitic acid. Images were collected before the addition of palmitic acid and 16 h later. The upper images are ofLaurden emission and the lower images depict m-cherry emission (labelling insulin granules). Membrane fluidity is represented interms of ratio of emission intensities by using the Generalised Polarisation (GP) value. The GP ranges from 1 (very fluid-purple) top1 (very gel-like-orange). M-cherry labels insulin granules, which have spherical shapes of about 0.5–1-mm diameter. (B) GP val-ues of plasma membrane in cells incubated with increasing glucose concentration for 32 h. Scale bar is 10mm. Reprinted withpermission from [178].
26 K. PARCHEM ET AL.
Po
bra
no z
mo
stw
ied
zy.p
l

the biological point of view, the composition of PLclasses, the abundance and position of FAs present inPL molecules, the position and conformation of unsat-urated carbon atoms within them as well as oxidativemodifications may alter cell functions due to structuraland modified signalling pathways. Fortunately, the con-stantly developing analytical techniques enable theidentification and quantitation of numerous PL mole-cules differing in the structure in ever-shorter time.Nevertheless, it should be noted that the advancedapproaches are often preceded by the application ofstandard techniques for initial characterisation of lipidfraction in tested samples, especially in the case of thefood industry, where the access to advanced equip-ment is not always warranted.
Disclosure statement
The authors declare that they have no conflict of interest.
Funding
This work was supported by the National Science Center(Poland) under Grant 2016/23/N/NZ9/02224 and EuropeanCooperation for Science and Technology under Grant CA16112.
References
[1] K€ullenberg de Gaudry D, Taylor La, Schneider M,et al. Health effects of dietary phospholipids. LipidsHealth Dis. 2012;11:1–16.
[2] Molendi-Coste O, Legry V, Leclercq IA. Why and howmeet n-3 PUFA dietary recommendations?Gastroenterol Res Pract. 2011;2011:364040.
[3] Blesso CN. Egg phospholipids and cardiovascularhealth. Nutrients. 2015;7(4):2731–2747.
[4] Ahn SH, Lim SJ, Ryu YM, et al. Absorption rate of krilloil and fish oil in blood and brain of rats. LipidsHealth Dis. 2018;17(1):162.
[5] Choi JY, Jang JS, Son DJ, et al. Antarctic krill oil dietprotects against lipopolysaccharide-induced oxidativestress, neuroinflammation and cognitive impairment.Int J Mol Sci. 2017;18(12):1–15.
[6] Ursoniu S, Sahebkar A, Serban MC, et al. Lipid-modi-fying effects of krill oil in humans: systematic reviewand meta-analysis of randomized controlled trials.Nutr Rev. 2017;75(5):361–373.
[7] Burri L, Hoem N, Banni S, et al. Marine Omega-3phospholipids: metabolism and biological activities.Int J Mol Sci. 2012;13(11):15401–15419.
[8] Taylor LA, Pletschen L, Arends J, et al. Marine phos-pholipids – a promising new dietary approach totumor-associated weight loss. Support Care Cancer.2010;18(2):159–170.
[9] Wasowicz E, Gramza A, HeR�s M, et al. Oxidation of lip-ids in foods. Pol J Food Nutr Sci. 2004;13:87–100.
[10] Miyamoto S, Dupas C, Murota K, et al. Phospholipidhydroperoxides are detoxified by phospholipase A2and GSH peroxidase in rat gastric mucosa. Lipids.2003;38(6):641–649.
[11] Ursini F, Zamburlini A, Cazzolato G, et al.Postprandial plasma lipid hydroperoxides: a possiblelink between diet and atherosclerosis. Free Radic BiolMed. 1998;25(2):250–252.
[12] Cohn JS, Kamili A, Wat E, et al. Dietary phospholipidsand intestinal cholesterol absorption. Nutrients. 2010;2(2):116–127.
[13] Fruhwirth GO, Loidl A, Hermetter A. Oxidized phos-pholipids: from molecular properties to disease.Biochim Biophys Acta. 2007;1772(7):718–736.
[14] Ashraf MZ, Kar NS, Podrez EA. Oxidized phospholi-pids: biomarker for cardiovascular diseases. Int JBiochem Cell Biol. 2009;41(6):1241–1244.
[15] Ravandi A, Babaei S, Leung R, et al. Phospholipidsand oxophospholipids in atherosclerotic plaques atdifferent stages of plaque development. Lipids. 2004;39(2):97–109.
[16] Hammad LA, Wu G, Saleh MM, et al. Elevated levelsof hydroxylated phosphocholine lipids in the bloodserum of breast cancer patients. Rapid CommunMass Spectrom. 2009;23(6):863–876.
[17] Kinoshita M, Oikawa S, Hayasaka K, et al. Age-relatedincreases in plasma phosphatidylcholine hydroperox-ide concentrations in control subjects and patientswith hyperlipidemia. Clin Chem. 2000;46(6 Pt 1):822–828.
[18] Gwak YS, Kang J, Leem JW, et al. Oxidized phosphat-idylcholine is a marker for neuroinflammation in mul-tiple sclerosis brain. J Neurosci Res. 2007;85(11):2352–2359.
[19] Bochkov VN, Oskolkova OV, Birukov KG, et al.Generation and biological activities of oxidized phos-pholipids. Antioxid Redox Signal. 2010;12(8):1009–1059.
[20] Adachi J, Matsushita S, Yoshioka N, et al. Plasmaphosphatidylcholine hydroperoxide as a new markerof oxidative stress in alcoholic patients. J Lipid Res.2004;45(5):967–971.
[21] Hy€otyl€ainen T, Bondia-Pons I, Ore�si�c M. Lipidomics innutrition and food research. Mol Nutr Food Res.2013;57(8):1306–1318.
[22] Ferreri C, Chatgilialoglu C. Membrane lipidomics forpersonalized health. Chichester: John Wiley & Sons;2015.
[23] Ferreri C, Chatgilialoglu C. Role of fatty acid-basedfunctional lipidomics in the development of molecu-lar diagnostic tools. Expert Rev Mol Diagn. 2012;12(7):767–780.
[24] Nicolson GL, Ash ME. Lipid replacement therapy: anatural medicine approach to replacing damaged lip-ids in cellular membranes and organelles and restor-ing function. Biochim Biophys Acta. 2014;1838(6):1657–1679.
[25] Reis A. Oxidative phospholipidomics in health anddisease: achievements, challenges and hopes. FreeRadic Biol Med. 2017;111:25–37.
[26] Cifuentes A. Food analysis and foodomics. JChromatogr A. 2009;1216(43):7109.
FREE RADICAL RESEARCH 27
Po
bra
no z
mo
stw
ied
zy.p
l

[27] Cifuentes A. Food analysis: present, future, and foo-domics. ISRN Anal Chem. 2012;2012:1–16.
[28] Herrero M, Sim�o C, Garc�ıa-Ca~nas V, et al. Foodomics:MS-based strategies in modern food science andnutrition. Mass Spectrom Rev. 2012;31(1):49–69.
[29] Gorrochategui E, Jaumot J, Lacorte S, et al. Data ana-lysis strategies for targeted and untargeted LC-MSmetabolomic studies: overview and workflow. TrACTrends Anal Chem. 2016;82:425–442.
[30] Han X, Gross RW. Electrospray ionization mass spec-troscopic analysis of human erythrocyte plasmamembrane phospholipids. Proc Natl Acad Sci U S A.1994;91(22):10635–10639.
[31] Marto JA, White FM, Seldomridge S, et al. Structuralcharacterization of phospholipids by matrix-assistedlaser desorption/ionization Fourier transform ioncyclotron resonance mass spectrometry. Anal Chem.1995;67(21):3979–3984.
[32] Schiller J, Arnold K. Application of high resolution31P NMR spectroscopy to the characterization of thephospholipid composition of tissues and body fluids– a methodological review. Med Sci Monit. 2002;8(11):MT205–MT222.
[33] Cajka T, Fiehn O. Comprehensive analysis of lipids inbiological systems by liquid chromatography – massspectrometry. Trends Anal Chem. 2014;61:192–206.
[34] Ferreri C, Masi A, Sansone A, et al. Fatty acids inmembranes as homeostatic, metabolic and nutri-tional biomarkers: recent advancements in analyticsand diagnostics. Diagnostics. 2016;7(1):1–14.
[35] Fahy E, Subramaniam S, Brown HA, et al. A compre-hensive classification system for lipids. J Lipid Res.2005;46(5):839–861.
[36] Guo Z, Vikbjerg AF, Xu X. Enzymatic modification ofphospholipids for functional applications and humannutrition. Biotechnol Adv. 2005;23(3):203–259.
[37] Christie W. Ether lipids. AOCS Lipid Libr. 2016;49:vii-151.
[38] Christie W. Long-chain or sphingoid bases. AOCSLipid Libr. 2016;1–9;141.
[39] Mukhamedova KS, Glushenkova AI. Natural phospho-nolipids. Chem Nat Compd. 2000;36(4):329–341.
[40] Van Nieuwenhuyzen W, Tom�as MC. Update on vege-table lecithin and phospholipid technologies. Eur JLipid Sci Technol. 2008;110(5):472–486.
[41] Samhan-Arias AK, Ji J, Demidova OM, et al. Oxidizedphospholipids as biomarkers of tissue and cell dam-age with a focus on cardiolipin. Biochim BiophysActa. 2012;1818(10):2413–2423.
[42] O’Donnell VB. Mass spectrometry analysis of oxidizedphosphatidylcholine and phosphatidylethanolamine.Biochim Biophys Acta. 2011;1811(11):818–826.
[43] Bochkov V, Gesslbauer B, Mauerhofer C, et al.Pleiotropic effects of oxidized phospholipids. FreeRadic Biol Med. 2017;111:6–24.
[44] Reis A, Spickett CM. Chemistry of phospholipid oxida-tion. Biochim Biophys Acta. 2012;1818(10):2374–2387.
[45] Zhou L, Zhao M, Bindler F, et al. Identification of oxi-dation compounds of 1-stearoyl-2-linoleoyl- sn -glyc-ero-3-phosphoethanolamine during thermal oxidation.J Agric Food Chem. 2015;63(43):9615–9620.
[46] Peterson BL, Cummings BS. A review of chromato-graphic methods for the assessment of phospholi-pids in biological samples. Biomed Chromatogr.2006;20(3):227–243.
[47] Cruz M, Wang M, Frisch-Daiello J, et al. Improvedbutanol-methanol (BUME) method by replacingacetic acid for lipid extraction of biological samples.Lipids. 2016;51(7):887–896.
[48] Birjandi AP, Bojko B, Ning Z, et al. High throughputsolid phase microextraction: a new alternative foranalysis of cellular lipidome? J Chromatogr B AnalytTechnol Biomed Life Sci. 2017;1043:12–19.
[49] Garwoli�nska D, Hewelt-Belka W, Namie�snik J, et al.Rapid characterization of the human breast milk lipi-dome using a solid-phase microextraction and liquidchromatography-mass spectrometry-based approach.J Proteome Res. 2017;16(9):3200–3208.
[50] Ulmer CZ, Jones CM, Yost RA, et al. Optimization ofFolch, Bligh-Dyer, and Matyash sample-to-extractionsolvent ratios for human plasma-based lipidomicsstudies. Anal Chim Acta. 2018;1037:351–357.
[51] Reis A, Rudnitskaya A, Blackburn GJ, et al. A compari-son of five lipid extraction solvent systems for lipido-mic studies of human LDL. J Lipid Res. 2013;54(7):1812–1824.
[52] Pellegrino RM, Di Veroli A, Valeri A, et al. LC/MS lipidprofiling from human serum: a new method for glo-bal lipid extraction. Anal Bioanal Chem. 2014;406(30):7937–7948.
[53] Matyash V, Liebisch G, Kurzchalia TV, et al. Lipidextraction by methyl-tert-butyl ether for high-throughput lipidomics. J Lipid Res. 2008;49(5):1137–1146.
[54] Patterson RE, Ducrocq AJ, McDougall DJ, et al.Comparison of blood plasma sample preparationmethods for combined LC-MS lipidomics and metab-olomics. J Chromatogr B Analyt Technol Biomed LifeSci. 2015;1002:260–266.
[55] Gil A, Zhang W, Wolters JC, et al. One- vs two-phaseextraction: re-evaluation of sample preparation pro-cedures for untargeted lipidomics in plasma samples.Anal Bioanal Chem. 2018;410(23):5859–5870.
[56] L€ofgren L, Ståhlman M, Forsberg GB, et al. The BUMEmethod: a novel automated chloroform-free 96-welltotal lipid extraction method for blood plasma. JLipid Res. 2012;53(8):1690–1700.
[57] L€ofgren L, Forsberg GB, Ståhlman M. The BUMEmethod: a new rapid and simple chloroform-freemethod for total lipid extraction of animal tissue. SciRep. 2016;6:27688.
[58] Barrilero R, Gil M, Amig�o N, et al. LipSpin: a new bio-informatics tool for quantitative 1H NMR lipid profil-ing. Anal Chem. 2018;90(3):2031–2040.
[59] Pizarro C, Arenzana-R�amila I, P�erez-del-Notario N,et al. Plasma lipidomic profiling method based onultrasound extraction and liquid chromatographymass spectrometry. Anal Chem. 2013;85(24):12085–12092.
[60] Teo CC, Chong WPK, Tan E, et al. Advances in sam-ple preparation and analytical techniques for lipido-mics study of clinical samples. TrAC Trends AnalChem. 2015;66:1–18.
28 K. PARCHEM ET AL.
Po
bra
no z
mo
stw
ied
zy.p
l

[61] Khoomrung S, Chumnanpuen P, Jansa-Ard S,et al. Rapid quantification of yeast lipid using micro-wave-assisted total lipid extraction and HPLC-CAD.Anal Chem. 2013;85(10):4912–4919.
[62] Sarafian MH, Gaudin M, Lewis MR, et al. Objectiveset of criteria for optimization of sample preparationprocedures for ultra-high throughput untargetedblood plasma lipid profiling by ultra performanceliquid chromatography�mass spectrometry. AnalChem. 2014;86(12):5766–5774.
[63] St€ubiger G, Aldover-Macasaet E, Bicker W, et al.Targeted profiling of atherogenic phospholipids inhuman plasma and lipoproteins of hyperlipidemicpatients using MALDI-QIT-TOF-MS/MS. Atherosclerosis.2012;224(1):177–186.
[64] St€ubiger G, Belgacem O, Rehulka P, et al. Analysis ofoxidized phospholipids by MALDI mass spectrometryusing 6-Aza-2-thiothymine together with matrix addi-tives and disposable target surfaces. Anal Chem.2010;82(13):5502–5510.
[65] Liakh I, Pakiet A, Sledzinski T, et al. Modern methodsof sample preparation for the analysis of oxylipins inbiological samples. Molecules. 2019;24(8):1639.
[66] Spickett CM, Reis A, Pitt AR. Identification of oxidizedphospholipids by electrospray ionization mass spec-trometry and LC-MS using a QQLIT instrument. FreeRadic Biol Med. 2011;51(12):2133–2149.
[67] Ulmer CZ, Patterson RE, Koelmel JP, et al. A robustlipidomics workflow for mammalian cells, plasma,and tissue using liquid-chromatography high- reso-lution tandem mass spectrometry. Methods Mol Biol.2017;1609:91–106.
[68] Donato P, Cacciola F, Cichello F, et al. Determinationof phospholipids in milk samples by means of hydro-philic interaction liquid chromatography coupled toevaporative light scattering and mass spectrometrydetection. J Chromatogr A. 2011;1218(37):6476–6482.
[69] Bruun-Jensen L, Colarow L, Skibsted LH. Detectionand quantification of phospholipid hydroperoxides inturkey meat extracts by planar chromatography. JPlanar Chromatogr. 1995;8:475–479.
[70] Hammad SM, Pierce JS, Soodavar F, et al. Bloodsphingolipidomics in healthy humans: impact ofsample collection methodology. J Lipid Res. 2010;51(10):3074–3087.
[71] Gonzalez-Covarrubias V, Dane A, Hankemeier T, et al.The influence of citrate, EDTA, and heparin anticoa-gulants to human plasma LC–MS lipidomic profiling.Metabolomics. 2013;9(2):337–348.
[72] Chua EC, Shui G, Lee IT, et al. Extensive diversity incircadian regulation of plasma lipids and evidencefor different circadian metabolic phenotypes inhumans. Proc Natl Acad Sci U S A. 2013;110(35):14468–14473.
[73] Kasukawa T, Sugimoto M, Hida A, et al. Humanblood metabolite timetable indicates internal bodytime. Proc Natl Acad Sci U S A. 2012;109(37):15036–15041.
[74] Aviram R, Manella G, Kopelman N, et al. Lipidomicsanalyses reveal temporal and spatial lipid organiza-tion and uncover daily oscillations in intracellularorganelles. Mol Cell. 2016;62(4):636–648.
[75] Am�ezaga J, Arranz S, Urruticoechea A, et al. Alteredred blood cell membrane fatty acid profile in cancerpatients. Nutrients. 2018;10(12):1–13.
[76] Folch J, Lees M, Sloane Stanley GH. A simple methodfor the isolation and purification of total lipides fromanimal tissues. J Biol Chem. 1957;226(1):497–509.
[77] Bligh EG, Dyer WJ. A rapid method of total lipidextraction and purification. Can J Biochem Physiol.1959;37(8):911–917.
[78] Iverson SJ, Lang SL, Cooper MH. Comparison of theBligh and Dyer and Folch methods for total lipiddetermination in a broad range of marine tissue.Lipids. 2001;36(11):1283–1287.
[79] Cequier-S�anchez E, Rodr�ıguez C, Ravelo AG, et al.Dichloromethane as a solvent for lipid extraction andassessment of lipid classes and fatty acids from sam-ples of different natures. J Agric Food Chem. 2008;56(12):4297–4303.
[80] Mawatari S, Hazeyama S, Morisaki T, et al. Enzymaticmeasurement of ether phospholipids in humanplasma after hydrolysis of plasma with phospholip-ase A1. Pract Lab Med. 2018;10:44–51.
[81] Lee DY, Kind T, Yoon YR, et al. Comparative evalu-ation of extraction methods for simultaneous mass-spectrometric analysis of complex lipids and primarymetabolites from human blood plasma. Anal BioanalChem. 2014;406(28):7275–7286.
[82] Mung D, Li L. Development of chemical isotopelabeling LC-MS for milk metabolomics: comprehen-sive and quantitative profiling of the amine/phenolsubmetabolome. Anal Chem. 2017;89(8):4435–4443.
[83] Satomi Y, Hirayama M, Kobayashi H. One-step lipidextraction for plasma lipidomics analysis by liquidchromatography mass spectrometry. J Chromatogr B.2017;1063:93–100.
[84] Kiełbowicz G, Micek P, Wawrze�nczyk C. A new liquidchromatography method with charge aerosoldetector (CAD) for the determination of phospholipidclasses. Application to milk phospholipids. Talanta.2013;105:28–33.
[85] Aoyagi R, Ikeda K, Isobe Y, et al. Comprehensiveanalyses of oxidized phospholipids using a measuredMS/MS spectra library. J Lipid Res. 2017;58(11):2229–2237.
[86] Spickett CM, Rennie N, Winter H, et al. Detection ofphospholipid oxidation in oxidatively stressed cellsby reversed-phase HPLC coupled with positive-ion-ization electrospray [correction of electroscopy] MS.Biochem J. 2001;355(2):449–457.
[87] Haller E, St€ubiger G, Lafitte D, et al. Chemical recog-nition of oxidation-specific epitopes in low-densitylipoproteins by a nanoparticle based concept fortrapping, enrichment, and liquid chromatography-tandem mass spectrometry analysis of oxidativestress biomarkers. Anal Chem. 2014;86(19):9954–9961.
[88] Birjandi AP, Mirnaghi FS, Bojko B, et al. Applicationof solid phase microextraction for quantitation ofpolyunsaturated fatty acids in biological fluids. AnalChem. 2014;86(24):12022–12029.
[89] Milojkovi�c-Opsenica D, Andri F. High performancethin-layer chromatography. In: Green
FREE RADICAL RESEARCH 29
Po
bra
no z
mo
stw
ied
zy.p
l

chromatographic techniques: separation and purifica-tion of organic and inorganic analytes. Dordrecht:Springer Science & Business Media; 2013.
[90] Handloser D, Widmer V, Reich E. Separation of phos-pholipids by HPTLC – an investigation of importantparameters. J Liq Chromatogr Relat Technol. 2008;31(13):1857–1870.
[91] Rabel F, Sherma J. Review of the state of the art ofpreparative thin-layer chromatography. J LiqChromatogr Relat Technol. 2017;40(4):165–176.
[92] Palusinska-Szysz M, Kania M, Turska-Szewczuk A,et al. Identification of unusual phospholipid fattyacyl compositions of Acanthamoeba castellanii. PlosOne. 2014;9(7):e101243.
[93] Xu G, Waki H, Kon K, et al. Thin-layer chromatog-raphy of phospholipids and their lyso forms: applica-tion to determination of extracts from rathippocampal CA1 region. Microchem J. 1996;53(1):29–33.
[94] Tanaka T, Kassai A, Ohmoto M, et al. Quantificationof phosphatidic acid in foodstuffs using a thin-layer-chromatography-imaging technique. J Agric FoodChem. 2012;60(16):4156–4161.
[95] Fuchs B, S€uss R, Teuber K, et al. Lipid analysis bythin-layer chromatography – a review of the currentstate. J Chromatogr A. 2011;1218(19):2754–2774.
[96] Dy�nska-Kukulska K, Ciesielski W, Zakrzewski R. Theuse of a new, modified Dittmer-Lester spray reagentfor phospholipid determination by the TLC imageanalysis technique. Biomed Chromatogr. 2013;27(4):458–465.
[97] Helmerich G, Koehler P. Comparison of methods forthe quantitative determination of phospholipids inlecithins and flour improvers. J Agric Food Chem.2003;51(23):6645–6651.
[98] Dittmer JC, Lester RL. A simple, specific spray for thedetection of phospholipids on thin-layer chromato-grams. J Lipid Res. 1964;5:126–127.
[99] Stillwell W. Membrane reconstitution. In: An intro-duction to biological membranes. 2nd ed. New York:Elsevier; 2016. p. 273–312.
[100] Rhee KS, Del Rosario RR, Dugan LR. Determination ofplasmalogens after treating with a 2,4-dinitrophenyl-hydrazine-phosphoric acid reagent. Lipids. 1967;2(4):334–338.
[101] Fuchs B. Analytical methods for (oxidized) plasmalo-gens: methodological aspects and applications. FreeRadic Res. 2015;49(5):599–617.
[102] Kriska T, Girotti AW. Separation and quantitation ofperoxidized phospholipids using high-performancethin-layer chromatography with tetramethyl-p-phenylenediamine detection. Anal Biochem. 2004;327(1):97–106.
[103] Friedman P, Horkko S, Steinberg D, et al. Correlationof antiphospholipid antibody recognition with thestructure of synthetic oxidized phospholipids.Importance of Schiff base formation and aldol con-densation. J Biol Chem. 2002;277(9):7010–7020.
[104] Parchem K, Kusznierewicz B, Chmiel T, et al. Profilingand qualitative assessment of enzymatically andthermally oxidized egg yolk phospholipids using a
two-step high-performance liquid chromatographyprotocol. J Am Oil Chem Soc. 2019;96(6):693–706.
[105] L�ısa M, C�ıfkov�a E, Hol�capek M. Lipidomic profiling ofbiological tissues using off-line two-dimensionalhigh-performance liquid chromatography-mass spec-trometry. J Chromatogr A. 2011;1218(31):5146–5156.
[106] Dugo P, Fawzy N, Cichello F, et al. Stop-flow compre-hensive two-dimensional liquid chromatographycombined with mass spectrometric detection forphospholipid analysis. J Chromatogr A. 2013;1278:46–53.
[107] Kim J, Minkler PE, Salomon RG, et al. Cardiolipin:characterization of distinct oxidized molecular spe-cies. J Lipid Res. 2011;52(1):125–135.
[108] Jia L, Wang C, Kong H, et al. Plasma phospholipidmetabolic profiling and biomarkers of mouse IgAnephropathy. Metabolomics. 2006;2(2):95–104.
[109] Kim J, Hoppel CL. Comprehensive approach to thequantitative analysis of mitochondrial phospholipidsby HPLC-MS. J Chromatogr B Analyt Technol BiomedLife Sci. 2013;912:105–114.
[110] Bur�e C, Ayciriex S, Testet E, et al. A single run LC-MS/MS method for phospholipidomics. Anal BioanalChem. 2013;405(1):203–213.
[111] Anesi A, Guella G. A fast liquid chromatography-mass spectrometry methodology for membrane lipidprofiling through hydrophilic interaction liquid chro-matography. J Chromatogr A. 2015;1384:44–52.
[112] Buszewski B, Noga S. Hydrophilic interaction liquidchromatography (HILIC)–a powerful separation tech-nique. Anal Bioanal Chem. 2012;402(1):231–247.
[113] Gama MR, da Costa Silva RG, Collins CH, et al.Hydrophilic interaction chromatography. TrAC TrendsAnal Chem. 2012;37:48–60.
[114] Schwalbe-Herrmann M, Willmann J, Leibfritz D.Separation of phospholipid classes by hydrophilicinteraction chromatography detected by electrosprayionization mass spectrometry. J Chromatogr A. 2010;1217(32):5179–5183.
[115] C�ıfkov�a E, Hol�capek M, L�ısa M, et al. Nontargetedquantitation of lipid classes using hydrophilic inter-action liquid chromatography-electrospray ionizationmass spectrometry with single internal standard andresponse factor approach. Anal Chem. 2012;84(22):10064–10070.
[116] C�ıfkov�a E, Hol�capek M, L�ısa M. Nontargeted lipidomiccharacterization of porcine organs using hydrophilicinteraction liquid chromatography and off-line two-dimensional liquid chromatography-electrospray ion-ization mass spectrometry. Lipids. 2013;48(9):915–928.
[117] Hol�capek M, Jir�asko R, L�ısa M. Recent developmentsin liquid chromatography-mass spectrometry andrelated techniques. J Chromatogr A. 2012;1259:3–15.
[118] Kong P, Lehmann MJ, Helms JB, et al. Lipid analysisof Eimeria sporozoites reveals exclusive phospholi-pids, a phylogenetic mosaic of endogenous synthe-sis, and a host-independent lifestyle. Cell Discov.2018;4:24.
[119] L�ısa M, Hol�capek M. High-throughput and compre-hensive lipidomic analysis using ultrahigh-
30 K. PARCHEM ET AL.
Po
bra
no z
mo
stw
ied
zy.p
l

performance supercritical fluid chromatography –mass spectrometry. Anal Chem. 2015;87(14):7187–7195.
[120] Caudron E, Zhou JY, Chaminade P, et al.Fluorescence probe assisted post-column detectionfor lipid analysis in microbore-LC. J Chromatogr A.2005;1072(2):149–157.
[121] Milne GL, Porter NA. Separation and identification ofphospholipid peroxidation products. Lipids. 2001;36(11):1265–1275.
[122] Sala P, P€otz S, Brunner M, et al. Determination of oxi-dized phosphatidylcholines by hydrophilic inter-action liquid chromatography coupled to Fouriertransform mass spectrometry. Int J Mol Sci. 2015;16(4):8351–8363.
[123] Stoll DR, Carr PW. Two-dimensional liquid chroma-tography: a state of the art tutorial. Anal Chem.2017;89(1):519–531.
[124] Carr PW, Stoll DR Two-dimensional liquid chromatog-raphy: principles, practical implementation and appli-cations Agilent Technical Note. Germany: AgilentTechnologies, Inc.; 2015.
[125] Nie H, Liu R, Yang Y, et al. Lipid profiling of rat peri-toneal surface layers by online normal- and reversed-phase 2D LC QToF-MS. J Lipid Res. 2010;51(9):2833–2844.
[126] Tranchida PQ, Donato P, Cacciola F, et al. Potentialof comprehensive chromatography in food analysis.TrAC Trends Anal Chem. 2013;52:186–205.
[127] Ostrowska J, Skrzydlewska E, Figaszewski ZA.Isolation and analysis of phospholipids. Chem Anal.2000;45:613–629.
[128] Restuccia D, Spizzirri UG, Puoci F, et al.Determination of phospholipids in food samples.Food Rev Int. 2012;28(1):1–46.
[129] Ibusuki D, Nakagawa K, Asai A, et al. Preparation ofpure lipid hydroperoxides. J Lipid Res. 2008;49(12):2668–2677.
[130] Butler O’Connor ES, Mazerik JN, Cruff JP, et al.Lipoxygenase-catalyzed phospholipid peroxidation:preparation, purification, and characterization ofphosphatidylinositol peroxides. In: Uppu RM, MurthySN, Pryor WA, et al., ed. Free radicals and antioxidantprotocols. Methods in molecular biology (methodsand protocols). 2nd ed. New York: Humana Press;2010. p. 387–401.
[131] Schweikart F, Hulthe G. HPLC–UV–MS analysis: asource for severe oxidation artifacts. Anal Chem.2019;91(3):1748–1751.
[132] Ibrahim H, Caudron E, Kasselouri A, et al. Interest offluorescence derivatization and fluorescence probeassisted post-column detection of phospholipids: ashort review. Molecules. 2010;15(1):352–373.
[133] Ouhazza M, Sioufii AM. Liquid chromatography ana-lysis of some phospholipids with fluorescence detec-tion. Analusis. 1992;20:185–188.
[134] Ramos RG, Libong D, Rakotomanga M, et al.Comparison between charged aerosol detection andlight scattering detection for the analysis ofLeishmania membrane phospholipids. J ChromatogrA. 2008;1209(1–2):88–94.
[135] Kiełbowicz G, Trziszka T, Wawrze�nczyk C. Separationand quantification of phospholipid and neutral lipidclasses by HPLC–CAD: application to egg yolk lipids.J Liq Chromatogr Relat Technol. 2015;38(8):898–903.
[136] Han X, Gross RW. Global analyses of cellular lipi-domes directly from crude extracts of biological sam-ples by ESI mass spectrometry: a bridge tolipidomics. J Lipid Res. 2003;44(6):1071–1079.
[137] Hou W, Zhou H, Elisma F, et al. Technological devel-opments in lipidomics. Brief Funct GenomicsProteomics. 2008;7(5):395–409.
[138] Schr€oter J, S€uß R, Schiller J. MALDI-TOF MS to moni-tor the kinetics of phospholipase A2-digestion of oxi-dized phospholipids. Methods. 2016;104:41–47.
[139] Schr€oter J, Griesinger H, Reu€y E, et al. Unexpectedproducts of the hypochlorous acid-induced oxidationof oleic acid: a study using high performance thin-layer chromatography-electrospray ionization massspectrometry. J Chromatogr A. 2016;1439:89–96.
[140] Fuchs B, Schiller J, S€uss R, et al. A direct and simplemethod of coupling matrix-assisted laser desorptionand ionization time-of-flight mass spectrometry(MALDI-TOF MS) to thin-layer chromatography (TLC)for the analysis of phospholipids from egg yolk. AnalBioanal Chem. 2007;389(3):827–834.
[141] Schiller J, S€uß R, Fuchs B, et al. Combined applicationof TLC and matrix-assisted laser desorption and ionisa-tion time-of-flight mass spectrometry (MALDI-TOF MS)to phospholipid analysis of brain. Chromatographia.2003;57(S1):S297–S302.
[142] Fuchs B, Schiller J, S€uß R, et al. Capabilities and dis-advantages of combined matrix-assisted laser-desorption/ionization time-of-flight mass spectrom-etry (MALDI-TOF MS) and high-performance thin-layer chromatography (HPTLC): analysis of egg yolklipids. JPC J Planar Chromatogr Mod TLC. 2009;22(1):35–42.
[143] Domingues MRM, Reis A, Domingues P. Mass spec-trometry analysis of oxidized phospholipids. ChemPhys Lipids. 2008;156(1–2):1–12.
[144] Reis A, Domingues P, Domingues MRM. Structuralmotifs in primary oxidation products of palmitoyl-arachidonoyl-phosphatidylcholines by LC-MS/MS. JMass Spectrom. 2013;48(11):1207–1216.
[145] Reis A, Domingues MRM, Amado FML, et al. Radicalperoxidation of palmitoyl-lineloyl-glycerophospho-choline liposomes: identification of long-chain oxi-dised products by liquid chromatography-tandemmass spectrometry. J Chromatogr B Analyt TechnolBiomed Life Sci. 2007;855(2):186–199.
[146] Deeley JM, Thomas MC, Truscott RJW, et al.Identification of abundant alkyl ether glycerophospho-lipids in the human lens by tandem mass spectrom-etry techniques. Anal Chem. 2009;81(5):1920–1930.
[147] Ali AH, Zou X, Lu J, et al. Identification of phospholi-pids classes and molecular species in different typesof egg yolk by using UPLC-Q-TOF-MS. Food Chem.2017;221:58–66.
[148] Reis A, Domingues P, Ferrer-Correia AJV, et al.Tandem mass spectrometry of intact oxidation prod-ucts of diacylphosphatidylcholines: evidence for theoccurrence of the oxidation of the phosphocholine
FREE RADICAL RESEARCH 31
Po
bra
no z
mo
stw
ied
zy.p
l

head and differentiation of isomers. J Mass Spectrom.2004;39(12):1513–1522.
[149] Rathahao-Paris E, Alves S, Junot C, et al. High reso-lution mass spectrometry for structural identificationof metabolites in metabolomics. Metabolomics. 2016;12(1):10
[150] Baker PRS, Armando AM, Campbell JL, et al. Three-dimensional enhanced lipidomics analysis combiningUPLC, differential ion mobility spectrometry, andmass spectrometric separation strategies. J Lipid Res.2014;55(11):2432–2442.
[151] Ni Z, Milic I, Fedorova M. Identification of carbony-lated lipids from different phospholipid classes byshotgun and LC-MS lipidomics. Anal Bioanal Chem.2015;407(17):5161–5173.
[152] Nakanishi H, Iida Y, Shimizu T, et al. Analysis of oxi-dized phosphatidylcholines as markers for oxidativestress, using multiple reaction monitoring with theor-etically expanded data sets with reversed-phaseliquid chromatography/tandem mass spectrometry. JChromatogr B Analyt Technol Biomed Life Sci. 2009;877(13):1366–1374.
[153] Spickett CM, Pitt AR. Oxidative lipidomics coming ofage: advances in analysis of oxidized phospholipidsin physiology and pathology. Antioxid Redox Signal.2015;22(18):1646–1666.
[154] Kliman M, May JC, Mclean JA. Lipid analysis and lipi-domics by structurally selective ion mobility-massspectrometry. Biochim Biophys Acta. 2011;1811(11):935–945.
[155] Groessl M, Graf S, Taylor A, et al. Separation of iso-meric lipids by ion mobility-time of flight mass spec-trometry. Thun: Tofwerk AG; 2015. p. 1–4.
[156] Jackson SN, Ugarov M, Post JD, et al. A Study ofphospholipids by Ion Mobility TOFMS. J Am SocMass Spectrom. 2008;19(11):1655–1662.
[157] Ore�si�c M. Bioinformatics and computationalapproaches applicable to lipidomics. Eur J Lipid SciTechnol. 2009;111(1):99–106.
[158] Checa A, Bedia C, Jaumot J. Lipidomic data analysis:tutorial, practical guidelines and applications. AnalChim Acta. 2015;885:1–16.
[159] Dalmau N, Bedia C, Tauler R. Validation of theRegions of Interest Multivariate Curve Resolution(ROIMCR) procedure for untargeted LC-MS lipidomicanalysis. Anal Chim Acta. 2018;1025:80–91.
[160] Hartler J, Tharakan R, K€ofeler HC, et al. Bioinformaticstools and challenges in structural analysis of lipido-mics MS/MS data. Brief Bioinform. 2013;14(3):375–390.
[161] Wang M, Wang C, Han RH, et al. Novel advances inshotgun lipidomics for biology and medicine. ProgLipid Res. 2016;61:83–108.
[162] Kind T, Liu KH, Lee DY, et al. LipidBlast in silico tan-dem mass spectrometry database for lipid identifica-tion. Nat Methods. 2013;10(8):755–758.
[163] Koelmel JP, Kroeger NM, Ulmer CZ, et al. LipidMatch:an automated workflow for rule-based lipid identifi-cation using untargeted high-resolution tandemmass spectrometry data. BMC Bioinformatics. 2017;18(1):331.
[164] Ni Z, Angelidou G, Hoffmann R, et al. LPPtiger soft-ware for lipidome-specific prediction and identifica-tion of oxidized phospholipids from LC-MS datasets.Sci Rep. 2017;7(1):15138.
[165] Kochen MA, Chambers MC, Holman JD, et al. Greazy:open-source software for automated phospholipidtandem mass spectrometry identification. AnalChem. 2016;88(11):5733–5741.
[166] Ejsing CS, Duchoslav E, Sampaio J, et al. Automatedidentification and quantification of glycerophospholi-pid molecular species by multiple precursor ion scan-ning. Anal Chem. 2006;78(17):6202–6214.
[167] Herzog R, Schuhmann K, Schwudke D, et al.LipidXplorer: a software for consensual cross-plat-form lipidomics. PLOS One. 2012;7(1):e29851.
[168] Gode D, Volmer DA. Lipid imaging by mass spec-trometry – a review. Analyst. 2013;138(5):1289–1315.
[169] Bedna�r�ık A, Mach�alkov�a M, Moskovets E, et al. MALDIMS imaging at acquisition rates exceeding 100 pixelsper second. J Am Soc Mass Spectrom. 2019;30(2):289–298.
[170] Shimizu Y, Satou M, Hayashi K, et al. Matrix-assistedlaser desorption/ionization imaging mass spectrom-etry reveals changes of phospholipid distribution ininduced pluripotent stem cell colony differentiation.Anal Bioanal Chem. 2017;409(4):1007–1016.
[171] Hong JH, Kang JW, Kim DK, et al. Global changes ofphospholipids identified by MALDI imaging massspectrometry in a mouse model of Alzheimer’s dis-ease. J Lipid Res. 2016;57(1):36–45.
[172] Eberlin LS, Tibshirani RJ, Zhang J, et al. Molecularassessment of surgical-resection margins of gastriccancer by mass-spectrometric imaging. Proc NatlAcad Sci U S A. 2014;111(7):2436–2441.
[173] Shimma S, Sugiura Y, Hayasaka T, et al. MALDI-basedimaging mass spectrometry revealed abnormal distri-bution of phospholipids in colon cancer liver metas-tasis. J Chromatogr B Analyt Technol Biomed Life Sci.2007;855(1):98–103.
[174] Eberlin LS, Norton I, Dill AL, et al. Classifying humanbrain tumors by lipid imaging with mass spectrom-etry. Cancer Res. 2012;72(3):645–654.
[175] Mao X, He J, Li T, et al. Application of imaging massspectrometry for the molecular diagnosis of humanbreast tumors. Sci Rep. 2016;6:21043.
[176] Stutts WL, Menger RF, Kiss A, et al. Characterizationof phosphatidylcholine oxidation products by MALDIMS(n). Anal Chem. 2013;85(23):11410–11419.
[177] Patterson NH, Thomas A, Chaurand P. Monitoringtime-dependent degradation of phospholipids in sec-tioned tissues by MALDI imaging mass spectrometry.J Mass Spectrom. 2014;49(7):622–627.
[178] Maulucci G, Cohen O, Daniel B, et al. Fatty acid-related modulations of membrane fluidity in cells:detection and implications. Free Radic Res. 2016;50(sup1):S40–S50.
[179] Cohen G, Riahi Y, Shamni O, et al. Role of lipid per-oxidation and PPAR-d in amplifying glucose-stimu-lated insulin secretion. Diabetes. 2011;60(11):2830–2842.
[180] Cohen G, Shamni O, Avrahami Y, et al. Beta cellresponse to nutrient overload involves phospholipid
32 K. PARCHEM ET AL.
Po
bra
no z
mo
stw
ied
zy.p
l

remodelling and lipid peroxidation. Diabetologia.2015;58(6):1333–1343.
[181] Maulucci G, Di Giacinto F, De Angelis C, et al. Realtime quantitative analysis of lipid storage and lipoly-sis pathways by confocal spectral imaging of intra-cellular micropolarity. BBA Mol Cell Biol Lipids. 2018;1863(7):783–793.
[182] Drummen GPC, van Liebergen LCM, Op den KampJAF, et al. C11-BODIPY(581/591), an oxidation-sensitivefluorescent lipid peroxidation probe: (micro)spectro-scopic characterization and validation of method-ology. Free Radic Biol Med. 2002;33(4):473–490.
[183] Gibbons E, Nelson J, Anderson L, et al. Role of mem-brane oxidation in controlling the activity of humangroup IIa secretory phospholipase A(2) toward apop-totic lymphoma cells. Biochim Biophys Acta. 2013;1828(2):670–676.
[184] Yamanaka K, Saito Y, Sakiyama J, et al. A novel fluor-escent probe with high sensitivity and selectivedetection of lipid hydroperoxides in cells. RSC Adv.2012;2(20):7894–7900.
[185] Kagan VE, Mao G, Qu F, et al. Oxidized arachidonicand adrenic PEs navigate cells to ferroptosis. NatChem Biol. 2017;13(1):81–90.
FREE RADICAL RESEARCH 33
Po
bra
no z
mo
stw
ied
zy.p
l