Comparison of SDS- and methanol-assisted protein solubilization and digestion methods forEscherichia...
10
RESEARCH ARTICLE Comparison of SDS- and methanol-assisted protein solubilization and digestion methods for Escherichia coli membrane proteome analysis by 2-D LC-MS/MS Nan Zhang 1 , Rui Chen 1 , Nelson Young 2 , David Wishart 2 , Philip Winter 3 , Joel H. Weiner 3, 4 and Liang Li 1 1 Department of Chemistry, University of Alberta, Edmonton, Alberta, Canada 2 Department of Biological Sciences and Computing Science, University of Alberta, Edmonton, Alberta, Canada 3 Institute for Biomolecular Design, University of Alberta, Edmonton, Alberta, Canada 4 Department of Biochemistry, University of Alberta, Edmonton, Alberta, Canada Both organic solvent and surfactant have been used for dissolving membrane proteins for shot- gun proteomics. In this work, two methods of protein solubilization, namely using 60% metha- nol or 1% SDS, to dissolve and analyze the inner membrane fraction of an Escherichia coli K12 cell lysate were compared. A total of 358 proteins (1417 unique peptides) from the methanol- solubilized protein mixture and 299 proteins (892 peptides) from the SDS-solubilized sample- were identified by using trypsin digestion and 2-D LC-ESI MS/MS. It was found that the meth- anol method detected more hydrophobic peptides, resulting in a greater number of proteins identified, than the SDS method. We found that 159 out of 358 proteins (44%) and 120 out of 299 proteins (40%) detected from the methanol- and SDS-solubilized samples, respectively, are inte- gral membrane proteins. Among the 190 integral membrane proteins 70 were identified exclu- sively in the methanol-solubilized sample, 89 were identified by both methods, and only 31 pro- teins were exclusively identified by the SDS method. It is shown that the integral membrane proteins reflected the theoretical proteome for number of transmembrane helices, length, func- tional class, and topology, indicating there was no bias in the proteins identified. Received: July 16, 2006 Revised: September 14, 2006 Accepted: November 11, 2006 Keywords: In-solution digestion / LC-MS/MS / Membrane proteins / Methanol / SDS 484 Proteomics 2007, 7, 484–493 1 Introduction Analysis of membrane proteins presents a special challenge because they are not readily soluble in pure aqueous buffers and often undergo aggregation [1–3]. Despite several techni- cal shortcomings, gel-based protein separation in combina- tion with MS for protein identification is still a widely used technique for analyzing membrane proteomes [4–8]. Recently, the shotgun proteomics approach has emerged as a powerful technique for membrane proteome identification and quantitation [9–14]. Shotgun proteomics requires the generation of peptides from proteins via a protein degrada- tion technique, such as enzyme or chemical digestion. For analyzing a membrane proteome, dissolving the hydro- phobic proteins in a suitable solvent system compatible with enzyme digestion can be a challenge. In the past few years, several research groups have reported technical advances to enable membrane protein analysis using the shotgun prote- omics approach, in which proteins are dissolved in a surfac- tant medium or in an organic solvent, followed by protein digestion and LC-MS/MS analysis of the peptides [1, 11–27]. Specific protein digestion (e.g. trypsin) [10, 11, 13, 14, 17, 18, Correspondence: Professor Liang Li, Department of Chemistry, University of Alberta, Edmonton, Alberta, Canada E-mail: [email protected] Fax: 11-780-492-8231 Abbreviations: GRAVY, grand average of hydropathicity; SCX, strong cation-exchange; TM, transmembrane DOI 10.1002/pmic.200600518 © 2007 WILEY-VCH Verlag GmbH & Co. KGaA, Weinheim www.proteomics-journal.com
-
Upload
independent -
Category
Documents
-
view
0 -
download
0
Transcript of Comparison of SDS- and methanol-assisted protein solubilization and digestion methods forEscherichia...

RESEARCH ARTICLE
Comparison of SDS- and methanol-assisted protein
solubilization and digestion methods for Escherichia coli
membrane proteome analysis by 2-D LC-MS/MS
Nan Zhang1, Rui Chen1, Nelson Young2, David Wishart2, Philip Winter3,Joel H. Weiner3, 4 and Liang Li1
1 Department of Chemistry, University of Alberta, Edmonton, Alberta, Canada2 Department of Biological Sciences and Computing Science, University of Alberta, Edmonton, Alberta, Canada3 Institute for Biomolecular Design, University of Alberta, Edmonton, Alberta, Canada4 Department of Biochemistry, University of Alberta, Edmonton, Alberta, Canada
Both organic solvent and surfactant have been used for dissolving membrane proteins for shot-gun proteomics. In this work, two methods of protein solubilization, namely using 60% metha-nol or 1% SDS, to dissolve and analyze the inner membrane fraction of an Escherichia coli K12cell lysate were compared. A total of 358 proteins (1417 unique peptides) from the methanol-solubilized protein mixture and 299 proteins (892 peptides) from the SDS-solubilized sample-were identified by using trypsin digestion and 2-D LC-ESI MS/MS. It was found that the meth-anol method detected more hydrophobic peptides, resulting in a greater number of proteinsidentified, than the SDS method. We found that 159 out of 358 proteins (44%) and 120 out of 299proteins (40%) detected from the methanol- and SDS-solubilized samples, respectively, are inte-gral membrane proteins. Among the 190 integral membrane proteins 70 were identified exclu-sively in the methanol-solubilized sample, 89 were identified by both methods, and only 31 pro-teins were exclusively identified by the SDS method. It is shown that the integral membraneproteins reflected the theoretical proteome for number of transmembrane helices, length, func-tional class, and topology, indicating there was no bias in the proteins identified.
Received: July 16, 2006Revised: September 14, 2006
Accepted: November 11, 2006
Keywords:
In-solution digestion / LC-MS/MS / Membrane proteins / Methanol / SDS
484 Proteomics 2007, 7, 484–493
1 Introduction
Analysis of membrane proteins presents a special challengebecause they are not readily soluble in pure aqueous buffersand often undergo aggregation [1–3]. Despite several techni-cal shortcomings, gel-based protein separation in combina-tion with MS for protein identification is still a widely used
technique for analyzing membrane proteomes [4–8].Recently, the shotgun proteomics approach has emerged as apowerful technique for membrane proteome identificationand quantitation [9–14]. Shotgun proteomics requires thegeneration of peptides from proteins via a protein degrada-tion technique, such as enzyme or chemical digestion. Foranalyzing a membrane proteome, dissolving the hydro-phobic proteins in a suitable solvent system compatible withenzyme digestion can be a challenge. In the past few years,several research groups have reported technical advances toenable membrane protein analysis using the shotgun prote-omics approach, in which proteins are dissolved in a surfac-tant medium or in an organic solvent, followed by proteindigestion and LC-MS/MS analysis of the peptides [1, 11–27].Specific protein digestion (e.g. trypsin) [10, 11, 13, 14, 17, 18,
Correspondence: Professor Liang Li, Department of Chemistry,University of Alberta, Edmonton, Alberta, CanadaE-mail: [email protected]: 11-780-492-8231
Abbreviations: GRAVY, grand average of hydropathicity; SCX,
strong cation-exchange; TM, transmembrane
DOI 10.1002/pmic.200600518
© 2007 WILEY-VCH Verlag GmbH & Co. KGaA, Weinheim www.proteomics-journal.com

Proteomics 2007, 7, 484–493 Technology 485
22–24], nonspecific digestion (e.g. proteinase K) [12], chemi-cal digestion (e.g. cyanogen bromide) [8], and microwave-assisted acid hydrolysis [27] have all been used.
Recent studies have suggested that a commonly usedenzyme, trypsin, can still be functional in a digestion solu-tion with a methanol concentration of up to about 65% [28–30]. Thus, a high concentration of methanol can be used tosolubilize membrane proteins, followed by trypsin digestion.This methanol-assisted protein solubilization and proteolysistechnique has been reported to be useful for membraneproteome analysis [10, 30]. The use of an organic solvent,such as 60% methanol, to solubilize membrane proteins hasone major advantage compared to the use of a solvent systemcontaining a strong surfactant, such as SDS. The organicsolvent can be readily removed after protein digestion, whilea strong surfactant, such as SDS, is difficult to remove. As ananionic detergent, SDS firmly binds to cationic protein/pep-tide side chains causing effective denaturation but renderproteins/peptides encased in an SDS shell. Therefore, even ifvirtually all the excess SDS is removed from a peptide/pro-tein solution by dialysis or ion exchange, there is still a cer-tain amount of SDS present in the sample and firmly boundto a peptide/protein surface.
Compared to the use of an organic solvent, the advantageof SDS is that it can dissolve a wider range of proteins,including misfolded and precipitated proteins. However,SDS can potentially affect the enzyme digestion process bydenaturing the enzyme and reducing its catalytic activity.The process of dissolving a membrane fraction requires highconcentrations of surfactants to be effective. However, assoon as the proteins are dissolved, the solubilized proteinscan remain in the solution in more diluted surfactant solu-tions. Thus, a common practice in analyzing membranefractions is to use a high concentration of surfactant solutionto dissolve the proteins, and then dilute the solution by asmuch as 20-fold [11, 14], and subject the diluted solution toprotein digestion using an enzyme, such as trypsin. A lowconcentration of SDS (e.g. 0.1%) does not significantly affectthe enzyme digestion.
It is well known that SDS can degrade the performanceof RP separations as well as MS analyses of peptides. If SDSis used to solubilize the proteins, the remaining SDS in thedigested peptide sample is commonly removed by using anion-exchange column. In shotgun proteomics, where 2-Dpeptide separation is used, the first dimension of separationis generally based on ion-exchange chromatography. Thus,SDS removal from the digested peptide sample is integratedinto the first-dimensional peptide separation.
Since an SDS solution generally provides better solubili-zation of a membrane fraction than an organic solvent, suchas 60% methanol, it would be expected that a shotgunapproach involving the use of SDS for dissolving proteins(i.e. the SDS method) should encompass the proteome cov-erage generated by a shotgun approach using methanol fordissolving proteins (i.e. the methanol method). If this hy-pothesis holds, only the SDS method would be needed to
analyze membrane fractions of the cell lysate. In this work,this hypothesis is examined by applying both methods toanalyze the same Escherichia coli K12 membrane fraction andcomparing the results generated. For each method, the pep-tide digests were analyzed by LC-ESI MS/MS three times toaccount for variability of protein identification results withinthe method.
2 Materials and methods
2.1 Cells and membrane fraction preparation
The E. coli K12 MG1655 strain was used as a model system inthis study. Cells were cultured aerobically in Neidhardt’sglucose defined medium [31] and the inner membrane frac-tion was prepared according to the Yamato procedure [32]. Inbrief, cells were harvested, washed once with 50 mM Tris-HCl, pH 8.0, resuspended in Tris-HCl containing 20%sucrose and incubated with lysozyme (70 mg/mL) – EDTA(10 mM) and broken by French press lysis at 400 psi. Thedebris was removed by centrifugation at 10 0006g and thecell envelope was harvested by centrifugation at 100 0006g.The crude membranes were collected and resuspended in30 mM Tris-HCl, 10% sucrose and 3 mM EDTA at pH 7.2and layered to 10–44% sucrose step gradient for an overnightcentrifugation at 30 0006g at 47C. The inner membraneswere collected from the sucrose band, washed with 3 mMEDTA, pH 7.2, and centrifuged for 2 h at 30 0006g at 47C.The pellet was collected and washed with 50 mM MOPS atpH 8.0 to remove adhering proteins. The washed pellet wasstored in 50 mM MOPS, pH 8.0.
A 1-mg sample was taken and placed in a new micro-centrifuge tube. After centrifugation at 47C for 10 min, thesupernatant was removed and the pellet was washed with50 mL H2O twice to get rid of the original suspension solvent.The pellet was equally divided and placed in two new tubesfor subsequent methanol-assisted and SDS-assisted solubili-zation, respectively. About 0.5 mg of the protein pellet wasused for each method to ensure a sufficient amount of pep-tides was generated for replicate experiments, as detailedbelow. In our experience, depending on the applications, theamount of protein samples used for both SDS and methanoldigestion can be scaled down by at least ten-fold (i.e. with astarting material of less than 50 mg).
2.2 Protein solubilization and digestion
Organic solvent-assisted solubilization and proteolysis wereperformed according to the published protocol [10]. About0.5 mg of the membrane protein pellet was resuspended in125 mM NH4HCO3 at pH 8 via vortexing. The suspensionwas heated to 907C and kept at this temperature for 20 minfor thermal denaturing of proteins. The sample was thencooled on ice, and diluted, with occasional vortexing, by ad-ding methanol to produce a sample solution containing 60%
© 2007 WILEY-VCH Verlag GmbH & Co. KGaA, Weinheim www.proteomics-journal.com

486 N. Zhang et al. Proteomics 2007, 7, 484–493
methanol and a protein concentration of 0.5 mg/mL. Thesample was not fully dissolved even after adding the organicsolvent. Tryptic digestion was then performed at a trypsin/protein ratio of 1:30 at 377C for 5 h. After digestion, the so-lution was centrifuged and the supernatant was saved. Thepellet, after being resuspended in 200 mL 60% methanol andthe addition of 5 mg trypsin, was digested for another 5 h.The supernatant from this second digestion was pooled withthat from the first digestion. The digested sample was loadedonto a strong cation-exchange (SCX) column for the first--dimension separation (see below). Each individual ion-exchange fraction was subjected to ZipTip cleanup before RPLC-ESI MS/MS analysis.
SDS-assisted solubilization and proteolysis were per-formed as previously described [11, 14]. In brief, the mem-brane protein pellet (0.5 mg) was fully dissolved by adding50 mL of 1% SDS to the sample. Standard protein reductionand alkylation procedures were performed [33]. Before per-forming tryptic digestion, the sample was diluted ten times,resulting in an SDS concentration of 0.1% with a total vol-ume of 500 mL. Then 16 mL of 1 mg/mL trypsin was added in50 mM NH4HCO3 buffer at a trypsin/protein ratio of 1:30.Tryptic digestion was performed at 377C overnight. As in themethanol method, an SCX separation was first carried outand each individual ion-exchange fraction was then sub-jected to ZipTip cleanup before LC-ESI MS/MS.
2.3 LC separation of peptides
2-D LC separation was applied to the digested samples. Thefirst dimension, SCX separation was performed on a VydacVHP400 series 2.16150 mm SCX column at a flow rate of150 mL/min using an Agilent HPLC 1100 system. Solvent Awas 0.1% TFA in 15% ACN, and solvent B was the same asA, but with 0.5 M NaCl. The gradient was as follows: 100% Awas kept for 8 min and the eluate was discarded; the con-centration of solvent B was increased to 60% in 14 min, andin the next two minutes, solvent B was changed to 100% andthen back to 0% in one minute. Before sample injection, thepH of the digested sample was adjusted to 2 by adding 0.1%TFA. From 10 to 30 min, 1-min fractions were collected.Only the fractions showing UV absorption (i.e. from 17 to26 min), were analyzed further. The first two and the lastthree of these fractions were pooled into two fractions, asthey had low UV absorption signals. Thus, the first-dimen-sion separation resulted in a total of six fractions. Each frac-tion was reduced to about 50 mL by vacuum centrifugation toremove ACN. The peptide fraction was desalted by applyingC18-ZipTip (Millipore, Ontario, Canada), three timessequentially, with the use of 50 and 80% ACN/H2O in 0.1%TFA. The eluates were combined and subjected to vacuumcentrifugation to near dryness (1 mL). To avoid columnsaturation, the cleaned sample was diluted to 15 mL in 0.1%TFA and 2 mL of the diluted sample was injected into a150 mm6100 mm C18 column for RP LC-ESI MS/MS with aflow rate of 1.0–1.2 mL/min.
2.4 MS and data processing
LC-ESI MS/MS experiments were carried out on a SurveyorLCQ Deca IT mass spectrometer (ThermoFinnigan, SanJose, CA) with a repeat duration of 0.5 min, repeat count of 1,and a 3 min exclusion duration window. Three replicate LC-ESI MS/MS experiments were done on each ion-exchangefraction using the same conditions.
Peak lists from LC-ESI MS/MS experiments were gener-ated by the LCQ software Bioworks Browser via Turbo-Sequest. MASCOT search engine (http://www.matrixscience.com) was used for protein database search using theSwiss-Prot database. The taxonomy was set to E. coli. (5914sequences). Oxidation (M) and Pyro_glu (N-term E, Q) wereset as variable modifications. Carbamidomethyl (C) was setas a modification for the SDS sample, because the methanolmethod did not use reduction/alkylation prior to proteindigestion. The precision tolerance for LCQ MS/MS data was1.4 Da for peptide masses and 0.8 Da for fragment ion mas-ses. The peptide hits were considered as positive identifica-tions if the MASCOT search scores were higher than theMASCOT identity scores on a 95% confidence level. After theproteins identified from six individual SCX fractions werepooled to generate a list of total proteins found in each run,the single peptide hits with a matching score of 30–45 weremanually analyzed. The peptide hit was considered a positiveidentification if the fragment ions contained more than fiveconsecutive y- or b-ions and all fragment ion peaks with highintensity (i.e. peak intensity of .30% in a normalized spec-trum). In this way, about 50% of the peptides initially identi-fied with scores ranging from 30 to 45 were deleted. Theoutput of the MASCOT search results was extracted to anExcel file by a program developed in-house to provide a list ofproteins identified by the peptides that pass the definedthreshold. In this approach the redundant peptides for dif-ferent protein identities were automatically discarded.Finally, the protein list was manually examined, and for theproteins identified under the same gene name, only the pro-teins with accession numbers from E. coli K12 were kept.
3 Results and discussion
For the SDS or methanol method, a total of six fractions fromthe ion-exchange column separation of the digest were col-lected. Each fraction was run in three replicates by RP LC-ESI MS/MS. MASCOT search data from these analyses weretabulated according to protein name, accession number,unique peptide sequences used for protein identification,protein molecular weight, MASCOT search score for an in-dividual peptide, peptide mass, mass error, peptide grandaverage of hydropathicity (GRAVY) index, and MASCOTthreshold index for positive identification of the given pep-tide. Supplementary Tables 1–3 list the MASCOT searchresults in three replicate runs from the sample preparedusing the SDS method, respectively. The MASCOT search
© 2007 WILEY-VCH Verlag GmbH & Co. KGaA, Weinheim www.proteomics-journal.com
Proteomics 2007, 7, 484–493 Technology 487
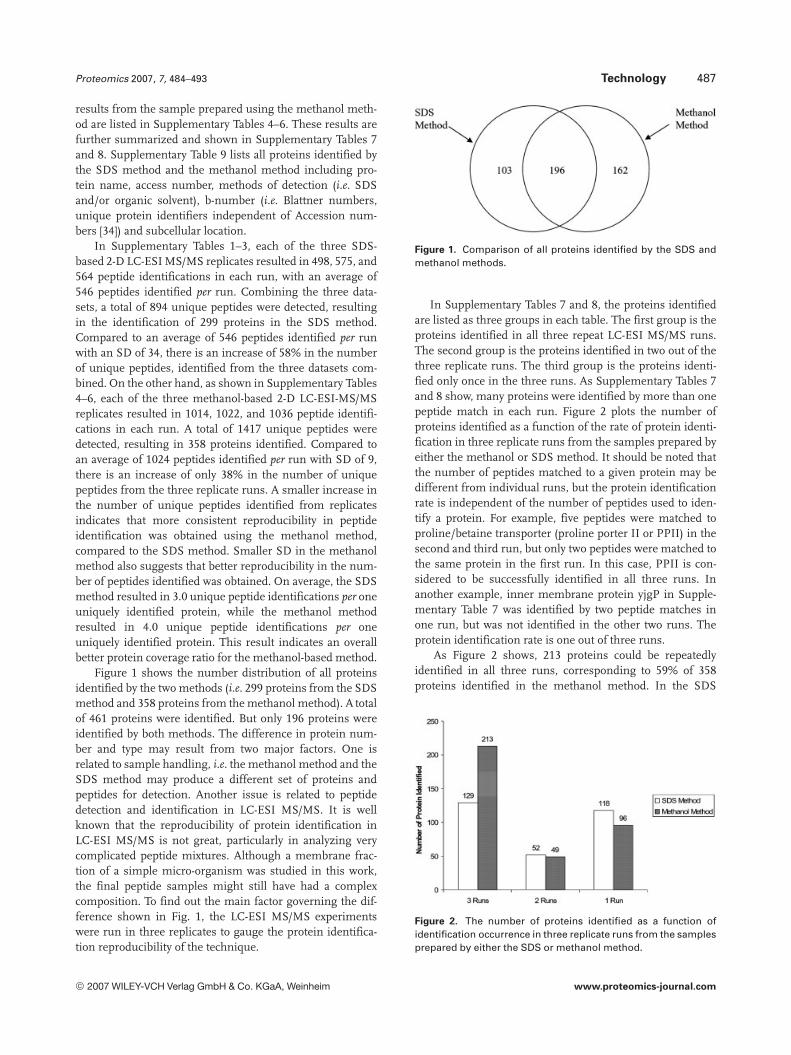
results from the sample prepared using the methanol meth-od are listed in Supplementary Tables 4–6. These results arefurther summarized and shown in Supplementary Tables 7and 8. Supplementary Table 9 lists all proteins identified bythe SDS method and the methanol method including pro-tein name, access number, methods of detection (i.e. SDSand/or organic solvent), b-number (i.e. Blattner numbers,unique protein identifiers independent of Accession num-bers [34]) and subcellular location.
In Supplementary Tables 1–3, each of the three SDS-based 2-D LC-ESI MS/MS replicates resulted in 498, 575, and564 peptide identifications in each run, with an average of546 peptides identified per run. Combining the three data-sets, a total of 894 unique peptides were detected, resultingin the identification of 299 proteins in the SDS method.Compared to an average of 546 peptides identified per runwith an SD of 34, there is an increase of 58% in the numberof unique peptides, identified from the three datasets com-bined. On the other hand, as shown in Supplementary Tables4–6, each of the three methanol-based 2-D LC-ESI-MS/MSreplicates resulted in 1014, 1022, and 1036 peptide identifi-cations in each run. A total of 1417 unique peptides weredetected, resulting in 358 proteins identified. Compared toan average of 1024 peptides identified per run with SD of 9,there is an increase of only 38% in the number of uniquepeptides from the three replicate runs. A smaller increase inthe number of unique peptides identified from replicatesindicates that more consistent reproducibility in peptideidentification was obtained using the methanol method,compared to the SDS method. Smaller SD in the methanolmethod also suggests that better reproducibility in the num-ber of peptides identified was obtained. On average, the SDSmethod resulted in 3.0 unique peptide identifications per oneuniquely identified protein, while the methanol methodresulted in 4.0 unique peptide identifications per oneuniquely identified protein. This result indicates an overallbetter protein coverage ratio for the methanol-based method.
Figure 1 shows the number distribution of all proteinsidentified by the two methods (i.e. 299 proteins from the SDSmethod and 358 proteins from the methanol method). A totalof 461 proteins were identified. But only 196 proteins wereidentified by both methods. The difference in protein num-ber and type may result from two major factors. One isrelated to sample handling, i.e. the methanol method and theSDS method may produce a different set of proteins andpeptides for detection. Another issue is related to peptidedetection and identification in LC-ESI MS/MS. It is wellknown that the reproducibility of protein identification inLC-ESI MS/MS is not great, particularly in analyzing verycomplicated peptide mixtures. Although a membrane frac-tion of a simple micro-organism was studied in this work,the final peptide samples might still have had a complexcomposition. To find out the main factor governing the dif-ference shown in Fig. 1, the LC-ESI MS/MS experimentswere run in three replicates to gauge the protein identifica-tion reproducibility of the technique.
Figure 1. Comparison of all proteins identified by the SDS andmethanol methods.
In Supplementary Tables 7 and 8, the proteins identifiedare listed as three groups in each table. The first group is theproteins identified in all three repeat LC-ESI MS/MS runs.The second group is the proteins identified in two out of thethree replicate runs. The third group is the proteins identi-fied only once in the three runs. As Supplementary Tables 7and 8 show, many proteins were identified by more than onepeptide match in each run. Figure 2 plots the number ofproteins identified as a function of the rate of protein identi-fication in three replicate runs from the samples prepared byeither the methanol or SDS method. It should be noted thatthe number of peptides matched to a given protein may bedifferent from individual runs, but the protein identificationrate is independent of the number of peptides used to iden-tify a protein. For example, five peptides were matched toproline/betaine transporter (proline porter II or PPII) in thesecond and third run, but only two peptides were matched tothe same protein in the first run. In this case, PPII is con-sidered to be successfully identified in all three runs. Inanother example, inner membrane protein yjgP in Supple-mentary Table 7 was identified by two peptide matches inone run, but was not identified in the other two runs. Theprotein identification rate is one out of three runs.
As Figure 2 shows, 213 proteins could be repeatedlyidentified in all three runs, corresponding to 59% of 358proteins identified in the methanol method. In the SDS
Figure 2. The number of proteins identified as a function ofidentification occurrence in three replicate runs from the samplesprepared by either the SDS or methanol method.
© 2007 WILEY-VCH Verlag GmbH & Co. KGaA, Weinheim www.proteomics-journal.com

488 N. Zhang et al. Proteomics 2007, 7, 484–493
method, 129 proteins or 43% of 299 proteins were identifiedin three runs. These data indicate that the methanol methoddemonstrated an overall increase of 28% in the ability torepeatedly identify proteins from the same complex mem-brane protein mixture. This increase is in agreement withthe SD of nine, calculated for the methanol-based methodand 38 for the SDS method in relation to the total number ofidentified peptides during each 2-D LC-MS/MS experiment.The repeatedly identified proteins, most likely, are the onesthat produced peptides with high probability of detection byLC-ESI MS/MS. Factors affecting peptide detectabilityinclude protein abundance, protein digestion efficiency,peptide separation, and peptide ionization efficiency.Figures 3A–C show the number distribution of the proteinsidentified in three, two, and one run, respectively. Not sur-prisingly, many proteins in common were identified, asshown in Fig. 3A. As the identification rate decreased, veryfew proteins in common were identified, as seen in Figs. 3Band C.
Some of the proteins identified in all three runs of onemethod may be identified once or twice by the other method,if not in all three runs. Figure 4 shows the distribution of theproteins in common, identified by the SDS and methanolmethods. As Fig. 4A shows, in the SDS method, only ten outof a total of 129 proteins (8%) detectable in all three runswere not detected in the methanol method. However, 56 outof a total of 213 proteins (26%) detectable in all three runs ofthe methanol method were not seen in the SDS method.Many of these proteins were identified by two or more pep-
Figure 3. Distribution of the proteins repeatedly identified in in-dividual methods. Proteins were identified in (A) three runs, (B)two runs, and (C) one run only.
Figure 4. Distribution of the proteins in common (in three runs)identified by the (A) SDS and (B) methanol methods.
tides with an average of 2.7 peptides per protein. Thus, asubstantial number of proteins were identified in the meth-anol method only. This cannot be due to the variation asso-ciated with LC-ESI MS/MS. The failure to identify this manyproteins in the SDS method is mainly due to the absence oftheir corresponding peptides in sufficient quantities fordetection by LC-ESI MS/MS.
From the above discussion, it can be concluded that thecompositions of the peptide mixtures produced by the SDSmethod and the methanol method were quite different andLC-ESI MS/MS analysis of these mixtures led to the identi-fication of significantly different sets of proteins. In partic-ular, the methanol method apparently detected more pro-teins than the SDS method. At the first glance, these resultswere somewhat surprising, because one would expect thatthe SDS method capable of solubilizing all proteins in themembrane fraction of the E. coli cell lysate should detectmore proteins and provide better proteome coverage thanthe methanol method. However, solubilization is not theonly factor governing the outcome of protein identification.Other factors, including protein digestion (e.g. trypsin activ-ities in the digestion solution), peptide separation, andpeptide ionization, have significant impact on the outcomeof the MS-based proteomic analysis. To understand theseresults better, any possible correlation between protein orpeptide property and detectability by either method wasexamined.
© 2007 WILEY-VCH Verlag GmbH & Co. KGaA, Weinheim www.proteomics-journal.com

Proteomics 2007, 7, 484–493 Technology 489
Figure 5A shows the number of proteins identified by thetwo methods as a function of the molecular masses groupedinto several bins. When the difference in the number ofproteins identified by the two methods (i.e. 358 versus 299) isaccounted for, the two distributions shown in Fig. 5A appearto be quite similar, except that significantly more proteins inthe mass range from 10 to 30 kDa were detected in themethanol method. Figure 5B shows the protein distributionas a function of protein hydrophobicity, gauged by theGRAVY indexes, grouped into several bins. The distributionis biased to the positive GRAVY indexes, which is not sur-prising considering that the hydrophobic membrane pro-teins were enriched in the analyzed samples. For the com-parison of the two methods, Fig. 5B shows that betweenhydrophilic proteins (e.g. exhibiting negative GRAVY index)
there were no apparent difference in regard to the totalnumber of identified proteins. However, for hydrophobicproteins (e.g. exhibiting positive GRAVY index), a greaternumber of proteins were detected in the methanol method,which is consistent with the detection of a higher number ofintegral membrane proteins by this method (see below).
Figure 5C shows the protein distribution as a function ofthe hydrophobicity of peptides detected in LC-ESI MS/MS.Interestingly, these two methods give different distributions.For both methods, the overall distribution of identified pep-tides (Fig. 5C) demonstrates bias towards preferential iden-tification of hydrophobic peptides, exhibiting the patternsimilar to the one shown for protein GRAVY distribution(Fig. 5B). A closer inspection of the diagram in Fig. 5C showsinsignificant differences in the region of hydrophilic peptide
Figure 5. Distribution of proteins identi-fied by the two methods as a function of(A) molecular masses; (B) proteinhydrophobicity gauged by the GRAVYindexes; and (C) the hydrophobicity ofpeptides detected in LC-ESI MS/MS.
© 2007 WILEY-VCH Verlag GmbH & Co. KGaA, Weinheim www.proteomics-journal.com

490 N. Zhang et al. Proteomics 2007, 7, 484–493
identifications (e.g. peptides exhibiting negative GRAVYindex). In contrast to this observation, the inspection of thehydrophobic region (e.g. peptides exhibiting positive GRAVYindex) of the same diagram reveals significantly highernumber of peptides identified by the methanol method. Thisdifference may be related to the efficiencies of the digestionprocesses. In the SDS method, the protein concentration inthe digestion solution was 0.5 mg in 500 mL of 0.1% SDSsolution. In the methanol method, the protein concentrationwas 0.5 mg in 1000 mL of 60% methanol. For the digestion,the protein to trypsin ratio was 1:30 for both methanol andSDS methods and the protein concentration was higher inthe SDS method which should result in more completedigestion in the SDS method from the enzyme kinetics pointof view. However, there are at least two other factors that mayinterfere with the digestion process. One is related to thepartial denaturing of the proteins due to the dilution of theoriginal SDS solution used to solubilize the protein sample(i.e. ten-fold dilution from 1 to 0.1% SDS). Reduction in SDSconcentration may result in the refolding of some of theproteins into partially denatured forms, preventing trypsinfrom accessing some cleavage sites during the proteindigestion process. Another factor is related to steric hin-drance caused by the presence of SDS molecules bound to aprotein. With the presence of SDS in the digestion solution,the hydrophobic domains of a protein may interact with theSDS molecules, which can interfere with trypsin digestion bypreventing the enzyme from accessing these sites for cleav-age. In the methanol method, the methanol molecules candenature the protein by unfolding it, which makes the en-zyme more accessible to the hydrophobic domains [35, 36]. Itshould be noted that some reagents such as DMF have beenreported to enhance the proteolysis of proteins, solubilizedin SDS solution [37]. Whether the addition of this reagent orothers can improve the SDS method for membrane pro-teome analysis will be investigated in the future.
The data shown in Fig. 5 and Supplementary Table 9indicate that the major difference between the methanolmethod and the SDS method is that more hydrophobic pep-tides and hydrophobic membrane proteins are detectedusing the methanol method, resulting in an increase inoverall number of identified proteins and in particular thehydrophobic integral membrane proteins. Figure 6 showsthe distribution of integral membrane proteins identified bythe two methods. A total of 190 integral membrane proteinswere identified. Of these, 70 were identified exclusively in themethanol-solubilized sample, 89 were identified by bothmethods, and only 31 proteins were exclusively identified bythe SDS method. It is evident that 84% (159) of all assignedintegral membrane proteins would be identified if methanol-based solubilization was exclusively used, while only 63%(120) of all mapped integral membrane proteins would beidentified if the SDS method was exclusively used. Theseresults unambiguously show significantly higher bias of themethanol-based method towards hydrophobic integralmembrane proteins, indicating that the methanol method is
Figure 6. Comparison of integral membrane proteins identifiedby the SDS and methanol methods.
more efficient in identifying integral membrane proteins.The bias of the methanol method for identification of hydro-phobic peptide and integral membrane proteins is also inagreement with the results obtained from 2-D LC-MS/MSinvestigations of membrane proteins, isolated from pro-karyotes and eukaryotes with organic solvent-assisted samplepreparations [38, 39].
Finally, we have compared the experimental proteomedata obtained in this work to the theoretical membrane pro-teome of E. coli (see Supplementary Table 10). Unfortunatelythe theoretical membrane proteome is still poorly defined.Von Heijne [40] has created a database of 737 integral mem-brane proteins that traverse the membrane at least twice.Hunt [41] attempted to define a database of known and pre-dicted membrane proteins by combining data from theE. coli entry point (http://coli.berkeley.edu/cgi-bin/ecoli/coli_entry.pl) (156 proteins), proteins listed as membraneproteins in the GenProt database (http://genprotec.mbl.edu)(634 proteins), or proteins that contained at least two trans-membrane (TM) helices by the PHD algorithm [42] (821proteins). This created a database of 1017 proteins thatappeared on at least one database. The GenProt databaseincludes integral membrane proteins as well as some extrin-sic proteins that are part of multisubunit complexes, but it isnot comprehensive. For example, DmsA and DmsB, extrin-sic subunits of the DMSO reductase complex [43] areincluded in GenProt, but FrdA and FrdB, similar extrinsicsubunits of the fumarate reductase complex [44] are notincluded. Extrinsic components of ATP Binding Cassette(ABC) transporter class are generally not included. Further-more, some proteins, known to be membrane associatedthrough hydrophobic interactions such as Dld, D-lactatedehydrogenase [45] or GlpD, glycerol-3-phosphate dehy-drogenase [46] do not appear in any of the databases. Inaddition, a number of outer membrane proteins are includedin this database.
Out of the 461 proteins identified by the SDS and meth-anol 2-D LC-ESI MS/MS, 431 proteins have clearly assign-able b-number [34] and the remaining ones could not beassociated with a known b-number. These 431 proteins wereanalyzed in detail. To analyze these proteins, we used acomposite of the von Heijne, GenProt CyberCell MembraneProtein Database (http://www.projectcybercell.ca) and PHDdatabases for a total of 1089 entries in our theoretical mem-
© 2007 WILEY-VCH Verlag GmbH & Co. KGaA, Weinheim www.proteomics-journal.com

Proteomics 2007, 7, 484–493 Technology 491
brane proteome (Supplementary Table 10) with the caveatsnoted above in terms of inclusiveness. This resulted in iden-tifying 246 proteins as “membrane proteins” including atleast 29 proteins that were localized to the outer membrane(see Supplementary Table 9). The remaining 185 proteinswere examined individually. At least 55 additional proteinscould be assigned as “extrinsic” membrane proteins byknown association with integral subunits (e.g. the Nuo sub-units of NADH dehydrogenase), as known lipoproteins [47],as known or putative components of ABC transporters [48]and as proteins involved with flagella, peptidoglycan, andlipopolysaccharide biosynthesis, giving a total of at least 301of the 431 proteins identified as being membrane proteins(see Supplementary Table 9).
A total of 168 proteins identified herein were found in thevon Heijne database. We analyzed these proteins withrespect to a number of parameters. With respect to thenumber of TM helices, we found a higher percentage ofproteins with two TM helices compared to the theoreticalproteome and less with 10 or 12 TM helices (Fig. 7). Wecompared the experimental proteome with respect to proteinlength and found a slight bias towards identification oflonger proteins but overall there is a good correlation withthe theoretical proteome (Fig. 8).
Von Heijne and coworkers [40] have divided the theoret-ical membrane proteome into nine functional classes. Anal-ysis of our data indicates that all classes were identified in theexperimental proteome, with slightly more proteins involvedin biosynthesis and metabolism and less transport andunknown proteins than in the theoretical proteome (Fig. 9).Von Heijne and coworkers [40] have determined the TMorientation of the majority of the 737 proteins with two ormore TM helices. They found that the carboxyl terminalfaces “in” for 65% of the proteins and “out” for 18%. Theremainder could not be determined. Using their analysis, wefound an almost identical distribution for the experimentalproteome of 64% “inward” facing proteins and 20% “out-
Figure 7. Comparison of TM helix distribution for the theoreticalversus experimental proteome. Black bars refer to the theoreticalproteome and are taken from [40]. Gray bars are the experimentaldata.
Figure 8. Comparison of integral membrane protein size dis-tribution for the theoretical versus experimental proteome. Blackbars refer to the theoretical proteome and are taken from [40].Gray bars are the experimental data.
Figure 9. Comparison of integral membrane protein functionaldistribution for the theoretical versus experimental proteome.Black bars refer to the theoretical proteome and are taken from[40]. Gray bars are the experimental data. B, biosynthesis; C,channel; E, efflux transport; F, flagella; L, lipid synthesis; M, me-tabolism; S, signaling; T, transport uptake; U, unknown.
ward” facing. Overall, these data indicate that there was nobias in the experimental proteome compared to the theoreti-cal membrane proteome.
We compared the proteins identified in our experimentalproteome with the Affymetrix microarray transcriptome sig-nal intensity for cells grown under similar aerobic condi-tions. The Affymetrix data were taken from experimentsdescribed in [47]. Of the 4256 ORFs tested in the microarrayexperiment, 2990 transcripts were defined as “present” withgreater than 95% probability. Of the 431 proteins identifiedherein, 374 had transcript levels defined as present and 269
© 2007 WILEY-VCH Verlag GmbH & Co. KGaA, Weinheim www.proteomics-journal.com
492 N. Zhang et al. Proteomics 2007, 7, 484–493
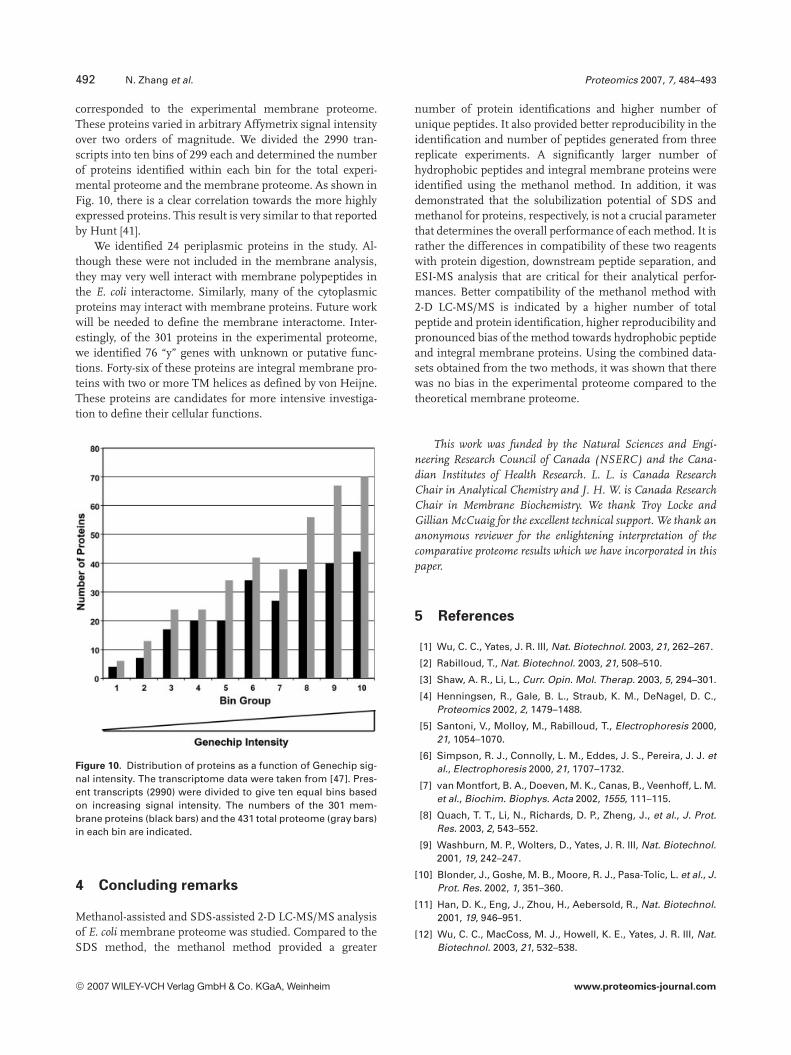
corresponded to the experimental membrane proteome.These proteins varied in arbitrary Affymetrix signal intensityover two orders of magnitude. We divided the 2990 tran-scripts into ten bins of 299 each and determined the numberof proteins identified within each bin for the total experi-mental proteome and the membrane proteome. As shown inFig. 10, there is a clear correlation towards the more highlyexpressed proteins. This result is very similar to that reportedby Hunt [41].
We identified 24 periplasmic proteins in the study. Al-though these were not included in the membrane analysis,they may very well interact with membrane polypeptides inthe E. coli interactome. Similarly, many of the cytoplasmicproteins may interact with membrane proteins. Future workwill be needed to define the membrane interactome. Inter-estingly, of the 301 proteins in the experimental proteome,we identified 76 “y” genes with unknown or putative func-tions. Forty-six of these proteins are integral membrane pro-teins with two or more TM helices as defined by von Heijne.These proteins are candidates for more intensive investiga-tion to define their cellular functions.
Figure 10. Distribution of proteins as a function of Genechip sig-nal intensity. The transcriptome data were taken from [47]. Pres-ent transcripts (2990) were divided to give ten equal bins basedon increasing signal intensity. The numbers of the 301 mem-brane proteins (black bars) and the 431 total proteome (gray bars)in each bin are indicated.
4 Concluding remarks
Methanol-assisted and SDS-assisted 2-D LC-MS/MS analysisof E. coli membrane proteome was studied. Compared to theSDS method, the methanol method provided a greater
number of protein identifications and higher number ofunique peptides. It also provided better reproducibility in theidentification and number of peptides generated from threereplicate experiments. A significantly larger number ofhydrophobic peptides and integral membrane proteins wereidentified using the methanol method. In addition, it wasdemonstrated that the solubilization potential of SDS andmethanol for proteins, respectively, is not a crucial parameterthat determines the overall performance of each method. It israther the differences in compatibility of these two reagentswith protein digestion, downstream peptide separation, andESI-MS analysis that are critical for their analytical perfor-mances. Better compatibility of the methanol method with2-D LC-MS/MS is indicated by a higher number of totalpeptide and protein identification, higher reproducibility andpronounced bias of the method towards hydrophobic peptideand integral membrane proteins. Using the combined data-sets obtained from the two methods, it was shown that therewas no bias in the experimental proteome compared to thetheoretical membrane proteome.
This work was funded by the Natural Sciences and Engi-neering Research Council of Canada (NSERC) and the Cana-dian Institutes of Health Research. L. L. is Canada ResearchChair in Analytical Chemistry and J. H. W. is Canada ResearchChair in Membrane Biochemistry. We thank Troy Locke andGillian McCuaig for the excellent technical support. We thank ananonymous reviewer for the enlightening interpretation of thecomparative proteome results which we have incorporated in thispaper.
5 References
[1] Wu, C. C., Yates, J. R. III, Nat. Biotechnol. 2003, 21, 262–267.
[2] Rabilloud, T., Nat. Biotechnol. 2003, 21, 508–510.
[3] Shaw, A. R., Li, L., Curr. Opin. Mol. Therap. 2003, 5, 294–301.
[4] Henningsen, R., Gale, B. L., Straub, K. M., DeNagel, D. C.,Proteomics 2002, 2, 1479–1488.
[5] Santoni, V., Molloy, M., Rabilloud, T., Electrophoresis 2000,21, 1054–1070.
[6] Simpson, R. J., Connolly, L. M., Eddes, J. S., Pereira, J. J. etal., Electrophoresis 2000, 21, 1707–1732.
[7] van Montfort, B. A., Doeven, M. K., Canas, B., Veenhoff, L. M.et al., Biochim. Biophys. Acta 2002, 1555, 111–115.
[8] Quach, T. T., Li, N., Richards, D. P., Zheng, J., et al., J. Prot.Res. 2003, 2, 543–552.
[9] Washburn, M. P., Wolters, D., Yates, J. R. III, Nat. Biotechnol.2001, 19, 242–247.
[10] Blonder, J., Goshe, M. B., Moore, R. J., Pasa-Tolic, L. et al., J.Prot. Res. 2002, 1, 351–360.
[11] Han, D. K., Eng, J., Zhou, H., Aebersold, R., Nat. Biotechnol.2001, 19, 946–951.
[12] Wu, C. C., MacCoss, M. J., Howell, K. E., Yates, J. R. III, Nat.Biotechnol. 2003, 21, 532–538.
© 2007 WILEY-VCH Verlag GmbH & Co. KGaA, Weinheim www.proteomics-journal.com

Proteomics 2007, 7, 484–493 Technology 493
[13] Li, N., Shaw, A. R. E., Zhang, N., Mak, A., Li, L., Proteomics,2004, 4, 3156–3266.
[14] Zhang, N., Li, N., Li, L., J. Proteome Res. 2004, 3, 719–727.
[15] Ji, C., Lo, A., Marcus, S., Li, L., J. Proteome Res. 2006, 5,256722576.
[16] Simpson, R. J., Connolly, L. M., Eddes, J. S., Pereira, J. J. etal., Electrophoresis 2000, 21, 1707–1732.
[17] Schirmer, E. C., Florens, L., Guan, T., Yates, J. R. III, Gerace,L., Science 2003, 301, 1380–1382.
[18] Schafer, H., Nau, K., Sickmann, A., Erdmann, R., Meyer, H. E.,Electrophoresis 2001, 22, 2955–2968.
[19] Maire, M. L., Champeil, P., Moller, J. V., Biochim. Biophys.Acta 2000, 1508, 86–111.
[20] Krungkrai, J., Kanchanarithisak, R., Krungkrai, S. R., Rocha-nakij, S., Exp. Parasit. 2002, 100, 54–61.
[21] Hufnagel, P., Schweiger, U., Eckerskorn, C., Oesterhelt, D.,Anal. Biochem. 1996, 243, 46–54.
[22] Ferro, M., Seigeurin-Berny, D., Rolland, N., Chapel, A. et al.,Electrophoresis 2000, 21, 3517–3526.
[23] Corbin, R. W., Paliy, O., Yang, F., Shabanowitz, J. et al., Proc.Natl. Acad. Sci. USA 2003, 100, 9232–9237.
[24] Blonder, J., Goshe, M. B., Xiao, W., Camp, D. G. et al., J.Proteome Res. 2004, 3, 434–444.
[25] Barnidge, D. R., Dratz, E. A., Sunner, J., Jesaitis, A. J., ProteinSci. 1997, 6, 816–824.
[26] Ball, L. E., Oatis, J. E., Jr., Dharmasiri, K., Busman, M. et al.,Protein Sci. 1998, 7, 758–764.
[27] Zhong, H., Marcus, S., Li, L., J. Am. Soc. Mass Spectrom.2005, 16, 471–481.
[28] Simon, L. M., Kotorman, M., Garab, G., Laczko, I., Biochem.Biophys. Res. Commun. 2001, 280, 1367–1371.
[29] Russell, W. K., Park, Z.-Y., Russell, D. H., Anal. Chem. 2001,73, 2682–2685.
[30] Blonder, J., Conrads, T. P., Yu, L. R., Terunuma, A. et al., Pro-teomics 2004, 4, 31–45.
[31] Neidhardt, F. C., Bloch, P. L., Smith, D. F., J. Bacteriol. 1974,119, 736–747.
[32] Yamato, I., Anraku, Y., Hirosawa, K., J. Bioichem. 1975, 77,705–718.
[33] Shevchenko, A., Wilm, M., Vorm, O., Mann, M., Anal. Chem.1996, 68, 850–858.
[34] Blattner, F. R., Plunkett, G. III, Bloch, C. A., Perna, N. T. et al,Science 1997, 277, 1432–1434.
[35] Welinder, K. G., Anal. Biochem. 1988, 174, 54–64.
[36] Fink, A. L., Painter, B., Biochemistry 1987, 26, 1665–1671.
[37] Houen, G., Sando, T., Anal. Biochem. 1991, 193, 186–190.
[38] Fischer, F., Wolters, D., Rögner, M., Poetsch, A., Mol. CellProteom. 2006, 5, 444–453.
[39] Blonder, J., Terunuma, A., Conrads, T. P., Chan, K. C. et al., J.Invest. Dermatol. 2004, 123, 691–699.
[40] Daley, D. O., Rapp, M., Granseth, E., Melen, K. et al., Science2005, 308, 1321–1323.
[41] Corbin, R. W., Paliy, O., Yang, F., Shabanowitz, J. et al., Proc.Natl Acad. Sci. USA 2003, 100, 9232–9237.
[42] Futcher, B., Latter, G. I., Monardo, P., McLaughlin, C. S., Gar-rels, J. I., Mol. Cell Biol. 1999, 19, 7357–7368.
[43] Bilous, P. T., Weiner, J. H., J. Bacteriol. 1988, 170, 1511–1518.
[44] Lemire, B. D., Robinson, J. J., Bradley, R. D., Scraba, D. G.,Weiner, J. H., J. Bacteriol. 1983, 155, 391–397.
[45] Pratt, E. A., Jones, J. A., Cottam, P. F., Dowd, S. R., Ho, C.,Biochim. Biophys. Acta. 1983, 729, 167–175.
[46] Schryvers, A., Lohmeier, E., Weiner, J. H., J. Biol Chem.1978, 253, 783–788.
[47] Brokx, S. J., Ellison, M., Locke, T., Bottorff, D. et al., J. Bac-teriol. 2004, 186, 3254–3258.
[48] Paulsen, I. T., Sliwinski, M. K., Saier, M. H., Jr., J. Mol. Biol.1998, 277, 573–592.
© 2007 WILEY-VCH Verlag GmbH & Co. KGaA, Weinheim www.proteomics-journal.com