Mixture of Volumetric Primitives for Efficient Neural Rendering
Upload
independentCategory
view
2download
0
Mt
SD
a
ARRAA
KAMSSV
1
msiictuowtptmsl
oftac(
0h
Fluid Phase Equilibria 354 (2013) 236–244
Contents lists available at SciVerse ScienceDirect
Fluid Phase Equilibria
journa l h om epage: www.elsev ier .com/ locate / f lu id
altodextrin–SDS interactions: Volumetric, viscometric and surfaceension study
. Chauhan ∗, Vivek Sharma, Kundan Sharmaepartment of Chemistry, Himachal Pradesh University, Shimla-5, India
r t i c l e i n f o
rticle history:eceived 19 March 2013eceived in revised form 20 June 2013ccepted 22 June 2013vailable online 29 June 2013
a b s t r a c t
Carbohydrate–surfactant interactions and micellization behavior of anionic surfactant (sodium dodecylsulfate, SDS) in aqueous solution of (0, 0.5, 1.0 and 1.5% w/v) maltodextrin have been studied using density,sound velocity, viscosity and surface tension in the temperature range of 20–40 ◦C at an interval of 5 ◦C.Density and speed of sound data have been used to derive parameters like isentropic compressibility (�s),apparent molar volume (˚v) and apparent molar isentropic compression (˚k). Surface tension has been
eywords:pparent molar volumealtodextrin
DSurface tension
used to calculate surface excess concentration (�max), minimum area occupied by the surfactant (Amin)and surface film pressure (�cmc) whereas relaxation time (�) is calculated using viscosity data. Volumetricmeasurements indicate that ˚v values are positive and generally increase with rise in temperature aswell as with increase in percentage of maltodextrin (0.5–1.5%). Viscous relaxation time (�) and surfacetension (�) have been found to decrease with rise in temperature.
iscosity
. Introduction
There are different attempts and techniques that have beenade to understand the interactions between carbohydrate and
urfactant system which has a great significance in pharmaceutical,ndustrial and biological systems [1,2]. Some of the relevant studiesn this respect have been cited in literature also [3–5]. The physico-hemical properties of surfactants vary markedly above and belowhe critical micelle concentration (CMC) [6]. Below the CMC val-es, these properties (e.g. conductivity, electromotive force, etc.)f ionic surfactants like sodium dodecyl sulphate (SDS) resembleith those of a strong electrolyte but above the CMC, these proper-
ies change dramatically indicating a highly cooperative associationrocess which is going to take place. This behavior is explained inerms of formation of organized aggregates of large numbers of
olecules called micelles [7] in which the hydrophobic parts ofurfactants associate with each other in interior of the aggregate,eaving the hydrophilic parts to face aqueous medium.
Surfactants are added to a liquid in order to increase its wettingr spreading properties because of their ability to lower the sur-ace tension of a liquid as well as the interfacial tension betweenwo liquids or between a liquid and a solid [8,9]. The surface active
mphiphilic anions are absorbed on water surface where theyreate a characteristic monolayer. The hydrophobic alkyl chainsdodecyl) –CH3 (CH2)11 are oriented outside from the water surface,∗ Corresponding author. Tel.: +91 177 2830803; fax: +91 177 2830775.E-mail address: [email protected] (S. Chauhan).
378-3812/$ – see front matter © 2013 Elsevier B.V. All rights reserved.ttp://dx.doi.org/10.1016/j.fluid.2013.06.051
© 2013 Elsevier B.V. All rights reserved.
while the hydrophilic OSO3− head group is directed into the aque-
ous environment. The overall process has the tendency to bring thehydrocarbon molecules together, which is known as the hydropho-bic interactions. The critical micelle concentration (CMC) of SDS inpure water at 25 ◦C is 0.0082 mol dm−3 [10] and the aggregationnumber at CMC is usually considered to be about 62 [11].
Maltodextrin is a water-soluble oligosaccharide containinghundreds of sugar molecules and has a variety of applications viz.used as food additives, in pharmaceutical, industrial and in biolog-ical systems [3]. In aqueous solution, it is responsible for differentkinds of interactions occurring among its components [12]. Thestructure of maltodextrin has been shown in Fig. 1.
In view of these facts, in the present work, different parameterslike apparent molar volume (˚v), apparent molar isentropic com-pression (˚k), surface excess concentration (�max), minimum areaoccupied by the surfactant (Amin), surface film pressure (�cmc) andviscous relaxation time (�) in SDS–maltodextrin system has beenstudied by using different techniques for the characterization ofmicellar solution in order to improve the current understanding ofinteractions between carbohydrates and surfactants.
2. Experimental
2.1. Materials
Sodium dodecyl sulphate having purity > 99.5% obtained fromHiMedia Pvt. Ltd. However, a pure sample of SDS was obtained bygiving the following treatment. About 50 g of SDS was dissolved in500 ml of 95% ethanol. Suspension in the solution was removed by

S. Chauhan et al. / Fluid Phase Equilibria 354 (2013) 236–244 237
Ft
fibv2fwas2u
2
AarpdehfljDvT±
SwtMsTo
3
3
ts(Tpu
�
woh
sou
nd
velo
city
, (v)
and
isen
trop
ic
com
pre
ssib
ilit
y,
(�s)
of
aqu
eou
s
SDS
at
dif
fere
nt
tem
per
atu
res
(◦ C).
mol
dm
−3[0
%]
Mal
tod
extr
in
d
(kg
mol
−3)
v
(m
s−1)
�s
(TPa
−1)
20
25
30
35
40
20
25
30
35
40
20
25
30
35
40
998.
321
997.
152
995.
747
994.
124
992.
299
1482
.99
1497
.13
1509
.37
1520
.08
1529
.15
455.
4633
447.
4243
440.
8182
435.
3380
430.
9802
998.
375
997.
207
995.
800
994.
176
992.
350
1483
.37
1497
.42
1509
.44
1520
.29
1529
.37
455.
2053
447.
2264
440.
7539
435.
1950
430.
8340
998.
419
997.
249
995.
840
994.
212
992.
386
1483
.52
1497
.59
1509
.68
1520
.45
1529
.49
455.
0932
447.
1060
440.
5961
435.
0876
430.
7508
998.
467
997.
297
995.
887
994.
257
992.
430
1483
.80
1497
.81
1509
.85
1520
.63
1529
.65
454.
8996
446.
9532
440.
4761
434.
9649
430.
6416
998.
520
997.
350
995.
935
994.
306
992.
475
1484
.10
1498
.05
1510
.05
1520
.82
1529
.82
454.
6916
446.
7862
440.
3382
434.
8348
430.
5264
998.
582
997.
406
995.
990
994.
359
992.
529
1484
.21
1498
.17
1510
.25
1521
.01
1529
.99
454.
5959
446.
6896
440.
1973
434.
7030
430.
4073
998.
622
997.
456
996.
038
994.
406
992.
574
1484
.39
1498
.42
1510
.46
1521
.12
1530
.09
454.
4675
446.
5182
440.
0537
434.
6196
430.
3315
998.
678
997.
499
996.
082
994.
448
992.
614
1484
.64
1498
.55
1510
.59
1521
.33
1530
.28
454.
2890
446.
4215
439.
9585
434.
4813
430.
2073
998.
725
997.
548
996.
128
994.
493
992.
658
1484
.94
1498
.87
1510
.99
1521
.48
1530
.44
454.
0841
446.
2089
439.
7053
434.
3760
430.
0983
998.
771
997.
592
996.
170
994.
534
992.
699
1484
.87
1498
.78
1510
.90
1521
.38
1530
.32
454.
1060
446.
2428
439.
7391
434.
4151
430.
1480
998.
807
997.
625
996.
204
994.
567
992.
731
1484
.85
1498
.76
1510
.89
1521
.36
1530
.30
454.
1018
446.
2400
439.
7299
434.
4122
430.
1454
998.
856
997.
673
996.
252
994.
615
992.
778
1484
.87
1498
.74
1510
.85
1521
.34
1530
.28
454.
0673
446.
2304
439.
7320
434.
4026
430.
1363
998.
899
997.
712
996.
291
994.
653
992.
814
1484
.87
1498
.72
1510
.82
1521
.31
1530
.23
454.
0478
446.
2249
439.
7323
434.
4031
430.
1488
998.
926
997.
752
996.
326
994.
685
992.
847
1484
.86
1498
.71
1510
.81
1521
.23
1530
.22
454.
0416
446.
2130
439.
7226
434.
4349
430.
1401
nti
es
in
den
sity
mea
sure
men
ts
wer
e
±4
×
10−3
kg
m−3
.
ig. 1. Structure of maltodextrin in which repeating glucose molecules connectedogether by �-(1,4) glycosidic linkage.
ltration and remaining solution was gently warmed on a waterath. As the volume of solution reduced to one fourth of its originalolume, the solution was left to cool at room temperature for about–3 h. The final product was ground gently and dried under vacuumor about two days before use. Maltodextrin having purity > 99%as obtained from Loba Chemie Pvt. Ltd. and used as such without
ny further purification. Water is the main solvent in the presenttudy. Doubly distilled water having conductivity (�) in the range
× 10−6–3 × 10⁻⁶ S−1 cm−1 and pH ∼7.0 at 25 ◦C was collected forse.
.2. Equipment and experimental procedure
Density and sound velocity measurement were carried out usingnton Paar 5000 (DSA-5000). The reproducibility of speed of soundnd density data was well within ±0.2 m s−1 and ±2 × 10⁻⁶ g cm−3
espectively. The precision in temperature was ±0.001 ◦C. A highrecision water bath fitted with a digital temperature controlledevice used for viscosity measurement supplied by Narang Sci-ntific Works (NSW) Pvt. Ltd. New Delhi. Viscosity measurementsave been carried out by using jacketed Ostwald viscometer havingow time 348 s for distilled water at 25 ◦C. The viscometer was sub-
ected to calibration before use at 25 ◦C using water (� = 0.891 cP),ioxane (� = 1.19 cP) and DMSO (� = 2.01 cP) as solvents. Thesealues agreed reasonably well with the literature values [13,14].he reproducibility of the measurements of viscosity was within0.02 cP.
Surface tension measurements were carried out by using Maningh Survismeter supplied by Spectro Lab Equipments Pvt. Ltd.ith number of drops of water equal to 146 at 25 ◦C. The survisme-
er was subjected to calibration before use at 25 ◦C by DMSO andeOH having � values 43.33 and 22.41 m Nm−1 which were rea-
onably in good agreement with those reported in literature [15].he reproducibility for the surface tension measurements comesut to be in the range ±0.10 m Nm−1.
. Results and discussion
.1. Volumetric and acoustic studies
Density (d) and sound velocity (v) of SDS in the concentra-ion range (1–14 mmol dm−3) have been measured in aqueousolution of maltodextrin (0.5–1.5%, w/v) at different temperatures20–40 ◦C) at an interval of 5 ◦C. The data have been summarized inables 1–4 and have been used to calculate the following derivedarameters. The isentropic compressibility (�s) has been calculatedsing the relation [16],
s = 12
(1)
v dhere d (kg m−3) is the density of solution and v (m s−1) is the speedf sound for the solution. The compressibility of micellar solutionsas been proposed to depend mainly on two major contributions Ta
ble
1D
ensi
ty, (
d)
103, [
SDS]
1 2 3 4 5 6 7 8 9 10
11
12
13
14
The
un
cert
ai

238
S. Chauhan
et al.
/ Fluid
Phase Equilibria
354 (2013)
236–244
Table 2Density, (d) sound velocity, (v) and isentropic compressibility, (�s) of SDS in 0.5% (w/v) of aqueous solution of maltodextrin at different temperatures (◦C).
103, [SDS] mol dm−3 [0.5%] Maltodextrin
d (kg mol−3) v (m s−1) �s (TPa−1)
20 25 30 35 40 20 25 30 35 40 20 25 30 35 40
1 1000.182 999.008 997.595 995.963 994.134 1484.24 1498.25 1510.50 1521.14 1530.22 453.8504 445.9257 439.3436 433.9287 429.58322 1000.241 999.067 997.649 996.017 994.187 1484.50 1498.48 1510.69 1521.29 1530.37 453.6647 445.7625 439.2093 433.8197 429.47613 1000.324 999.145 997.727 996.093 994.261 1484.81 1498.75 1510.95 1521.51 1530.51 453.4376 445.5671 439.0238 433.6611 429.36564 1000.344 999.165 997.746 996.112 994.277 1485.02 1498.95 1511.13 1521.68 1530.66 453.3003 445.4393 438.9109 433.556 429.27455 1000.383 999.200 997.780 996.144 994.307 1485.15 1499.10 1511.21 1521.78 1530.72 453.2033 445.3345 438.8495 433.4851 429.22796 1000.441 999.258 997.833 996.194 994.356 1485.47 1499.37 1511.52 1522.03 1530.98 452.9818 445.1483 438.6462 433.3209 429.0617 1000.500 999.314 997.889 996.251 994.411 1485.65 1499.55 1511.69 1522.19 1531.13 452.8453 445.0165 438.5229 433.205 428.95328 1000.551 999.361 997.935 996.293 994.446 1485.87 1499.73 1511.85 1522.33 1531.25 452.6882 444.8888 438.4099 433.1071 428.87099 1000.581 999.392 997.963 996.320 994.481 1485.94 1499.79 1511.87 1522.34 1531.26 452.6319 444.8394 438.386 433.0897 428.8502
10 1000.623 999.423 998.005 996.363 994.521 1486.00 1499.82 1511.90 1522.37 1531.28 452.5764 444.8078 438.3501 433.0539 428.821811 1000.656 999.465 998.033 996.390 994.548 1486.03 1499.75 1511.89 1522.35 1531.26 452.5432 444.8306 438.3436 433.0536 428.821312 1000.707 999.517 998.083 996.438 994.595 1486.03 1499.73 1511.86 1522.32 1531.23 452.5201 444.8193 438.3391 433.0498 428.817913 1000.746 999.551 998.118 996.470 994.626 1486.02 1499.72 1511.85 1522.30 1531.18 452.5086 444.8101 438.3295 433.0472 428.832514 1000.800 999.602 998.180 996.540 994.690 1486.01 1499.71 1511.83 1522.29 1531.17 452.4903 444.7934 438.3139 433.0225 428.8105
The uncertainties in sound velocity measurements were ±0.5 m s−1.
Table 3Density, (d) sound velocity, (v) and isentropic compressibility, (�s) of SDS in 1% w/v aqueous solution of maltodextrin at different temperatures (◦C).
103, [SDS] mol dm−3 [1.0%] Maltodextrin
d (kg mol−3) v (m s−1) �s (TPa−1)
20 25 30 35 40 20 25 30 35 40 20 25 30 35 40
1 1002.001 1000.837 999.412 997.773 995.937 1485.20 1499.16 1511.45 1522.02 1531.02 452.4410 444.5705 437.9937 432.6409 428.35752 1002.055 1000.877 999.454 997.813 995.976 1485.29 1499.33 1511.53 1522.09 1531.13 452.3618 444.4520 437.9289 432.5837 428.27923 1002.102 1000.915 999.488 997.848 996.011 1485.56 1499.50 1511.78 1522.26 1531.23 452.1762 444.3343 437.7692 432.4719 428.20824 1002.153 1000.964 999.537 997.895 996.055 1485.86 1499.78 1511.94 1522.46 1531.42 451.9706 444.1467 437.6551 432.338 428.08315 1002.204 1001.013 999.585 997.942 996.102 1486.12 1500.01 1512.14 1522.64 1531.58 451.7895 443.9888 437.5183 432.2154 427.97346 1002.262 1001.070 999.640 997.995 996.153 1486.39 1500.25 1512.37 1522.85 1531.77 451.5992 443.8214 437.3612 432.0732 427.84547 1002.349 1001.156 999.723 998.077 996.231 1486.65 1500.40 1512.56 1523.03 1531.94 451.4021 443.6946 437.2150 431.9356 427.71698 1002.399 1001.203 999.770 998.122 996.277 1486.84 1500.57 1512.71 1523.16 1532.06 451.2642 443.5732 437.1078 431.8424 427.63029 1002.406 1001.208 999.774 998.125 996.280 1486.92 1500.71 1512.79 1523.23 1532.12 451.2125 443.4883 437.0598 431.8015 427.5954
10 1002.483 1001.284 999.849 998.198 996.351 1487.03 1500.82 1512.86 1523.31 1532.17 451.1111 443.3896 436.9866 431.7245 427.537111 1002.503 1001.301 999.866 998.214 996.369 1487.08 1500.86 1512.89 1523.32 1532.20 451.0718 443.3584 436.9618 431.7119 427.512612 1002.542 1001.342 999.903 998.252 996.404 1487.12 1500.88 1512.92 1523.34 1532.21 451.0300 443.3285 436.9283 431.6842 427.492113 1002.581 1001.386 999.948 998.297 996.448 1486.87 1500.75 1512.79 1523.21 1532.08 451.1641 443.3858 436.9838 431.7384 427.545614 1002.616 1001.411 999.972 998.319 996.470 1487.17 1500.96 1512.98 1523.40 1532.26 450.9663 443.2507 436.8635 431.6212 427.4358

S. Chauhan
et al.
/ Fluid
Phase Equilibria
354 (2013)
236–244
239
Table 4Density, (d) sound velocity, (v) and isentropic compressibility, (�s) of SDS in 1.5% (w/v) aqueous solution of maltodextrin at different temperatures (◦C).
103, [SDS] mol dm−3 [1.5%] Maltodextrin
d (kg mol−3) v (m s−1) �s (TPa−1)
20 25 30 35 40 20 25 30 35 40 20 25 30 35 40
1 1003.857 1002.660 1001.227 999.580 997.738 1486.36 1500.28 1512.54 1522.99 1531.93 450.8999 442.9818 436.5698 431.3088 427.07652 1003.901 1002.705 1001.273 999.626 997.781 1486.56 1500.46 1512.61 1523.13 1532.08 450.7588 442.9737 436.4516 431.2097 426.97443 1003.940 1002.746 1001.312 999.667 997.821 1486.83 1500.61 1512.80 1523.29 1532.21 450.5776 442.8671 436.3827 431.1014 426.88494 1003.989 1002.792 1001.356 999.706 997.860 1486.99 1500.78 1512.96 1523.43 1532.38 450.4587 442.7464 436.2713 431.0054 426.77355 1004.068 1002.868 1001.431 999.775 997.932 1487.34 1501.01 1513.26 1523.72 1532.61 450.2113 442.5772 436.0656 430.8116 426.61466 1004.138 1002.936 1001.497 999.846 997.997 1487.46 1501.20 1513.35 1523.79 1532.67 450.1072 442.4352 435.9850 430.7414 426.55347 1004.202 1002.996 1001.557 999.903 998.053 1487.58 1501.45 1513.50 1523.93 1532.80 450.0060 442.2614 435.8725 430.6377 426.45728 1004.226 1003.023 1001.580 999.925 998.073 1487.87 1501.57 1513.68 1524.09 1532.94 449.8198 442.1788 435.7588 430.5379 426.37079 1004.259 1003.053 1001.609 999.954 998.103 1488.00 1501.69 1513.77 1524.18 1533.02 449.7264 442.0949 435.6944 430.4745 426.3134
10 1004.295 1003.087 1001.644 999.987 998.134 1488.08 1501.85 1513.85 1524.24 1533.07 449.6620 441.9858 435.6331 430.4264 426.272411 1004.335 1003.130 1001.680 1000.031 998.179 1487.15 1501.89 1513.86 1524.28 1533.07 449.6078 441.9433 435.6002 430.3962 426.258712 1004.380 1003.167 1001.720 1000.061 998.204 1488.28 1501.93 1513.90 1524.28 1533.08 449.5151 441.9034 435.5713 430.3720 426.236913 1004.416 1003.204 1001.758 1000.097 998.241 1488.12 1501.86 1513.85 1524.21 1533.03 449.5232 441.9283 435.5836 430.3960 426.248914 1004.449 1003.234 1001.787 1000.126 998.269 1488.18 1501.89 1513.85 1524.20 1533.01 449.5326 441.8975 435.5710 430.3892 426.2481
0 2
4 6
2.0
5
2.1
0
2.1
5
2.2
0
2.2
5
2.3
0
2.3
5
2.4
0
2.4
5
2.5
0
104,
v(m
3mol
-1)
20
OC
25
OC
30
OC
35
OC
40
OC
10
3, [SD
S] (
(a)
0 2
4 6
-0.1
8
-0.1
6
- 0.1
4
-0.1
2
-0.1
0
- 0.0
8
- 0.0
6
-0.0
4
-0.0
2
0.0
0
0.0
2
0.0
4
10
3, [SD
S]
(m
k(m
3·mol
-1·TPa
-1)
(b)
Fig. 2.
(a) A
pp
arent
molar
volum
e, ˚
v(m
3m
olcom
pression
, ˚
k(m
3m
ol −1
TPa −1)
of aqu
eous
[17]: (i)
the
comp
ressibility of
the
hyd
rocarbon core
and
(ii) th
ein
teractions
between
the
head
group
s. H
owever,
isentrop
ic com
-p
ressibility is
likely to
be d
epen
den
t on
the
variation of
the
coun
terion
bind
ing
and
the
hyd
roph
ilicity of
the
head
group
[18].Th
e com
pressibility
data
for p
ure
SDS
and
for d
ifferent
percen
t-ages
of m
altodextrin
has
been su
mm
arized in
Tables 1–4
and
show
that
the
comp
ressibility d
ecreases w
ith in
crease in
temp
erature
asw
ell as
with
concen
tration of
SDS
[19], w
hich
makes
the
solution
rather
incom
pressible.
The
value
of �
salso
decreased
with
increase
in th
e p
ercentage
of m
altodextrin
. Th
e low
ering
in com
pressibility
imp
lies th
at th
ere is
enh
ancin
g m
olecular
association in
this
sys-tem
on in
crease in
solute
conten
t, as
the
new
entities
(formed
du
eto
molecu
lar association
) becom
e com
pact
and
less com
pressible.
So th
ere is
increasin
g solu
te–solvent
interaction
s w
ith in
crease in
temp
erature
and
with
concen
tration [17].
The
app
arent
molar
volum
e (˚
v ) h
as been
calculated
usin
g th
erelation
[19],
˚v =
do −
d
md
do
+Md
(2)
wh
ere m
(mol
kg −1)
is th
e m
olality of
the
solution
, M
(kg m
ol −1)
is th
e m
olecular
weigh
t of
surfactan
t, d
(kg m
−3)
is th
e d
ensity
ofth
e solu
tion,
and
do
(kg m
−3)
is th
e d
ensity
of solven
t i.e.
aqueou
ssolu
tion of
maltod
extrin.
8 10
12
14
16
mo
l.dm
-3)
8 1
0 1
2 14
16
ol·d
m-3)
20
OC
25
OC
30
OC
35
OC
40
OC
−1)
and
(b) ap
paren
t m
olar ad
iabaticSD
S at
differen
t tem
peratu
res.

240 S. Chauhan et al. / Fluid Phase Equilibria 354 (2013) 236–244
0 2 4 6 8 10 12 14 16
1.4
1.6
1.8
2.0
2.2
2.4
10
4,
v(m
3m
ol-1
)
103, [SDS] (mol.dm
-3)
20OC
25OC
30OC
35OC
40OC
(a)
0 2 4 6 8 10 12 14 16
-0.1 2
-0.1 0
-0.0 8
-0.0 6
-0.0 4
-0.0 2
0.0 0
0.0 2
0.0 4
k(m
3·m
ol-1
·TP
a-1)
103, [SDS] (mol ·dm
-3)
20OC
25OC
30OC
35OC
40OC
(b)
Fig. 3. (a) Apparent molar volume, ˚v (m3 mol−1) and (b) apparent molar adia-bs
t(b
(
(
dppcsa
(b)
(a)
ΦΦ
atic compression, ˚k (m3 mol−1 TPa−1) as a function of [SDS] in 0.5% (w/v) aqueousolution of maltodextrin at different temperatures.
In the presently studied maltodextrin–surfactant systems, theypes of interactions which are possible among maltodextrinoligosaccharide) and sodium dodecyl sulphate (SDS) solute wille:
(i) Ionic–hydrophilic interactions between the ion (SO2−4 ) of
solute and hydrophilic sites ( OH, C O and O ) of the mal-todextrin.
(ii) Hydrophobic–hydrophilic interactions between hydrophobicpart of SDS and hydrophilic part of maltodextrin.
iii) Hydrophobic–hydrophobic interactions between the alkylchain of the saccharide molecules and hydrophobic part of thesolute (SDS) and
iv) Hydrogen-bonding between maltodextrin and water(H2O).
Apparent molar values, ˚v for SDS in aqueous maltodextrin atifferent temperatures have been reported in Tables S1–S4 (sup-
lementary data). Figs. 2(a)–5(a) show that the values of ˚v areositive, increases with rise in temperature as well as with per-entage of maltodextrin. A similar conclusion is drawn in case ofurfactant system as reported in the literature [18,20]. The value ofpparent molar adiabatic compression, ˚v has been calculated byFig. 4. (a) Apparent molar volume, ˚v (m3 mol−1) and (b) apparent molar adia-batic compression, ˚k (m3 mol−1 TPa−1) as a function of [SDS] in 1% (w/v) aqueoussolution of maltodextrin at different temperatures.
using the relation [19],
˚k = �s − �o
mdo+ ˚v�s (3)
where �o is the isentropic compressibility for the solvent, �s is theisentropic compressibility for the solution, ˚v is the apparent molarvolume and do is the density of solvent respectively.
The ˚k values, thus obtained have been reported in Tables S1–S4(supplementary data). A perusal of data along with Figs. 2(b)–5(b)depicts the behavior of ˚k at different concentrations of maltodex-trin as well as at different temperatures. At lower concentrationof maltodextrin, (i.e. at 0.5%, w/v) ˚k are initially negative whichgradually increase with rise in [SDS] at all temperatures. The non-linear behavior in ˚k values becomes more prominent at highermaltodextrin concentration.
Both ˚v and ˚k values show strong temperature dependenceas well. It is apparent from these graphs that added sugar seems tointeract with charged head groups of surfactant electro-statically[18].

S. Chauhan et al. / Fluid Phase Equilibria 354 (2013) 236–244 241
Table 5Viscosity, (�) of SDS in 0% and 0.5% (w/v) aqueous solution of maltodextrin at different temperatures (◦C).
103, [SDS] mol dm−3 � (cp)
0% 0.5%
20 25 30 35 40 20 25 30 35 40
1 1.0023 0.8889 0.8026 0.7202 0.6528 1.0050 0.8990 0.8005 0.7112 0.65512 1.0043 0.8904 0.8038 0.7216 0.6536 1.0052 0.8996 0.8013 0.7118 0.65573 1.0052 0.8918 0.8058 0.7223 0.6543 1.0057 0.9000 0.8018 0.7123 0.65634 1.0076 0.8925 0.8064 0.7226 0.6549 1.0062 0.9003 0.8026 0.7127 0.65665 1.0100 0.8931 0.8073 0.7231 0.6553 1.0065 0.9007 0.80320 0.7130 0.65696 1.0115 0.8966 0.8106 0.7266 0.6569 1.0070 0.9013 0.8035 0.7134 0.65747 1.0151 0.8983 0.8119 0.7284 0.6596 1.0080 0.9020 0.8043 0.7142 0.65858 1.0154 0.8988 0.8124 0.7286 0.6601 1.0088 0.9034 0.8047 0.7149 0.65899 1.0156 0.8990 0.8134 0.7290 0.6609 1.0111 0.9050 0.8074 0.7171 0.6601
10 1.0161 0.8992 0.8153 0.7297 0.6612 1.0114 0.9055 0.8078 0.7173 0.660411 1.0164 0.8993 0.8155 0.7306 0.6639 1.0118 0.9059 0.8082 0.7174 0.6606
000
3
t
Fco
12 1.0166 0.8994 0.8157 0.7312
13 1.0169 0.8998 0.8158 0.7318
14 1.0170 0.9000 0.8163 0.7325
.2. Viscometric studies
Viscosity of SDS in water and in different percentage of mal-odextrin (w/v) has also been carried out by using Ostwald
0 2 4 6 8 10 12 14 16
2.30
2.32
2.34
2.36
2.38
2.40
2.42
2.44
2.46
2.48
10
4,
v(m
3m
ol-1
)
103, [SDS] (mol.d m
-3)
20OC
25OC
30OC
35OC
40OC
(a)
0 2 4 6 8 10 12 14 16
-0.08
-0.07
-0.06
-0.05
-0.04
-0.03
-0.02
-0.01
0.00
0.01
0.02
0.03
0.04
k(m
3·m
ol-1
·TP
a-1)
103, [SDS] (m ol·dm
-3)
20OC
25OC
30OC
35OC
40OC
(b)
ig. 5. (a) Apparent molar volume, ˚v (m3 mol−1) and (b) apparent molar adiabaticompression, ˚k (m3 mol−1 TPa−1) as a function of [SDS] in 1.5% aqueous solutionf maltodextrin at different temperatures.
.6630 1.0122 0.9066 0.8090 0.7179 0.6607
.6638 1.0128 0.9069 0.8092 0.7181 0.6618
.6640 1.0136 0.9078 0.8094 0.7185 0.6613
viscometer at different temperatures. Viscosity of solution is cal-culated by using the relation [19],
�s = �otsds
twdw(4)
where �o is the viscosity of solvent, tw the time of flow of solvent,ts the time of flow of solution, dw the density of solvent, and ds thedensity of solution. The viscosity data for aqueous SDS and for dif-ferent concentration of maltodextrin (0.5, 1, 1.5%, w/v) at differenttemperatures have been reported in Tables 5 and 6. The viscosityvalues have been further used to calculate viscous relaxation time(�) which is calculated by using the relation [20]
� = 4�s
3v2d(5)
The dependence of � on SDS concentration in aqueous solutionof maltodextrin has been reported in Tables S5–S6 (supplementarydata). Viscous relaxation time increases gradually with increase inconcentration of surfactant, SDS and same decrease with rise intemperature. This is mainly due to the structural relaxation pro-cesses occurring due to the re-arrangement of the molecules [21].These observations, therefore lead to conclusion that there existssignificant amount of interactions between SDS and maltodextrin.
3.3. Surface tension studies
Surface tension of SDS in water and in different percentage ofmaltodextrin (w/v) at 25 and 35 ◦C has been carried out by usingMan Singh Survismeter. The surface tension (�s) is calculated byusing the relation [19],
�s = �0nwds
nsdw(6)
where �s is the surface tension of the solution, �o the surfacetension of the solvent, nw the number of drops of solvent, ns thenumber of drops of solution, dw the density of solvent, and ds
the density of solution. Surface tension measurements used toprovide information about the binding of SDS to maltodextrin. If themaltodextrin–SDS complex is surface active, then it would reducethe surface tension of solvent molecule [3].
The surface tension data have been presented at different per-centages of maltodextrin in Fig. 6(a)–(d) which shows a decreasesin the surface tension with rise in temperature [22] as well as
with percentage of maltodextrin. Below cmc, (i.e. 0.0082 mol dm−3)surface tension of SDS in maltodextrin decreases sharply tominimum, which is indicating the adsorption of SDS to theair–water interface. Initially, at lower surfactant concentration,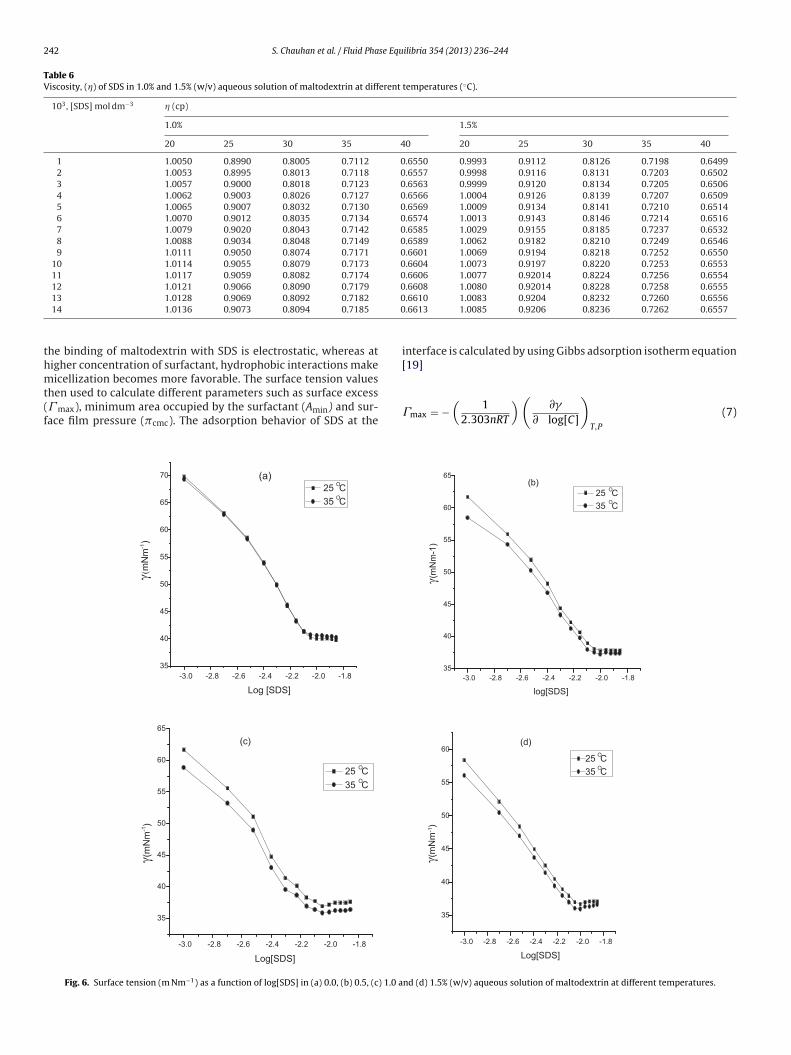
242 S. Chauhan et al. / Fluid Phase Equilibria 354 (2013) 236–244
Table 6Viscosity, (�) of SDS in 1.0% and 1.5% (w/v) aqueous solution of maltodextrin at different temperatures (◦C).
103, [SDS] mol dm−3 � (cp)
1.0% 1.5%
20 25 30 35 40 20 25 30 35 40
1 1.0050 0.8990 0.8005 0.7112 0.6550 0.9993 0.9112 0.8126 0.7198 0.64992 1.0053 0.8995 0.8013 0.7118 0.6557 0.9998 0.9116 0.8131 0.7203 0.65023 1.0057 0.9000 0.8018 0.7123 0.6563 0.9999 0.9120 0.8134 0.7205 0.65064 1.0062 0.9003 0.8026 0.7127 0.6566 1.0004 0.9126 0.8139 0.7207 0.65095 1.0065 0.9007 0.8032 0.7130 0.6569 1.0009 0.9134 0.8141 0.7210 0.65146 1.0070 0.9012 0.8035 0.7134 0.6574 1.0013 0.9143 0.8146 0.7214 0.65167 1.0079 0.9020 0.8043 0.7142 0.6585 1.0029 0.9155 0.8185 0.7237 0.65328 1.0088 0.9034 0.8048 0.7149 0.6589 1.0062 0.9182 0.8210 0.7249 0.65469 1.0111 0.9050 0.8074 0.7171 0.6601 1.0069 0.9194 0.8218 0.7252 0.6550
10 1.0114 0.9055 0.8079 0.7173 0.6604 1.0073 0.9197 0.8220 0.7253 0.655311 1.0117 0.9059 0.8082 0.7174 0.6606 1.0077 0.92014 0.8224 0.7256 0.655412 1.0121 0.9066 0.8090 0.7179 0.6608 1.0080 0.92014 0.8228 0.7258 0.6555
00
thmt(f
13 1.0128 0.9069 0.8092 0.7182
14 1.0136 0.9073 0.8094 0.7185
he binding of maltodextrin with SDS is electrostatic, whereas atigher concentration of surfactant, hydrophobic interactions make
icellization becomes more favorable. The surface tension valueshen used to calculate different parameters such as surface excess� max), minimum area occupied by the surfactant (Amin) and sur-ace film pressure (�cmc). The adsorption behavior of SDS at the
-3.0 -2.8 -2.6 -2.4 -2.2 -2.0 -1.8
35
40
45
50
55
60
65
(mN
m-1)
Log[SDS]
25OC
35OC
(c)
-3.0 -2.8 -2.6 -2.4 -2.2 -2.0 -1.8
35
40
45
50
55
60
65
70
mN
m-1)
Log [SDS]
25OC
35OC
(a)
Fig. 6. Surface tension (m Nm−1) as a function of log[SDS] in (a) 0.0, (b) 0.5, (c) 1.0 a
.6610 1.0083 0.9204 0.8232 0.7260 0.6556
.6613 1.0085 0.9206 0.8236 0.7262 0.6557
interface is calculated by using Gibbs adsorption isotherm equation[19]
�max = −(
12.303nRT
)(∂�
∂ log[C]
)T,P
(7)
-3.0 -2.8 -2.6 -2.4 -2.2 -2.0 -1.8
35
40
45
50
55
60
65
(mN
m-1
)
log[SDS]
25OC
35OC
(b)
-3.0 -2.8 -2.6 -2.4 -2.2 -2.0 -1.8
35
40
45
50
55
60
(mN
m-1)
Log[SDS]
25OC
35OC
(d)
nd (d) 1.5% (w/v) aqueous solution of maltodextrin at different temperatures.

S. Chauhan et al. / Fluid Phase Equilibria 354 (2013) 236–244 243
-0.20.0 0.2 0.4 0.6 0.8 1.0 1.2 1.4 1.6
90
92
94
96
98
100
102
104
106
108
110
112
114
Am
in (
nm
2)
% w/v
25OC
OC 35
(b)
-0.2 0.0 0.2 0.4 0.6 0.8 1.0 1.2 1.4 1.6
30.0
30.5
31.0
31.5
32.0
32.5
33.0
33.5
34.0
34.5
cm
c
% w/v
25OC
35OC
(c)
-0.20.0 0.2 0.4 0.6 0.8 1.0 1.2 1.4 1.6
1.45
1.50
1.55
1.60
1.65
1.70
1.75
1.80
1.85
ma
x (
mo
l cm
-2)
10
10
% w/v
25OC
35OC(a)
F tion ot
wbcoi
A
wcwi
TA
ig. 7. (a) The variation of � max (mol cm−2), (b) variation of Amin (nm2) and (c) variaemperatures.
here (∂�/∂ log[C]), the slope calculated from the graph plotetween � vs log[C], n = 2 in all the cases, R is the universal gasonstant and T is the absolute temperature. The minimum areaccupied by the surfactant molecule at the saturated air/solutionnterface (Amin) calculated from the equation [23]
min = 1018
�maxNo(8)
here No is Avogadro’s number and the factor 1018 arises as aonversion factor of area from m2 to nm2. Amin at cmc increasesith increase in percentage of maltodextrin and also increases with
ncrease in temperature. The lowering of the surface tension of a
able 7 study of interfacial parameters (� max), Amin and ˘cmc (m Nm−1) of SDS in different perc
% age of maltodextrin (w/v) 1010, � max (mol cm−2)
298.15 308.15
0.0 1.83 1.74
0.5 1.80 1.67
1.0 1.74 1.64
1.5 1.62 1.46
f �cmc (m Nm−1) of SDS at CMC in different percentages of maltodextrin at different
solvent by the surface film at cmc can be expressed in terms of thesurface film pressure [23]∏
cmc= �o − �cmc (9)
where �o is the surface tension of solvent and �cmc the surfacetension at cmc. These parameters are reported in Table 7. � max
is a useful measure of the amount of surfactant adsorbed at air-water interface and decrease in � max of SDS in the presence ofmaltodextrin as compare to water however, indicates increasedhydrophilic character of the SDS–maltodextrin complex, also there-
fore a decrease in � max value of SDS is observed with the increasein temperature in aqueous solution of maltodextrin as shown inFig. 7(a). Accordingly, Amin increases with rise in temperature whichis also in agreement with literature [24]. Such binding thus explainsentages of maltodextrin (0.0–1.5%) at different temperatures (◦C).
102, Amin (nm2) ˘cmc(m Nm−1)
298.15 308.15 298.15 308.15
90.64 95.61 32.14 30.0692.13 99.20 33.26 31.7295.25 101.20 34.33 32.38
102.41 113.41 33.04 31.31

2 se Equ
tTtaF
4
ptItcrssS
A
mmrt
A
t
[
[[
[
[[[[
[
[
[
[
44 S. Chauhan et al. / Fluid Pha
he stability of SDS–maltodextrin complex at air–water interface.he surface pressure, ˘cmc however, decreases with increase inemperature and is found to be consistent with the effect outlinedbove. The schematic plots for Amin and ˘cmc have been shown inig. 6(b)–(c) respectively.
. Conclusion
In summary, we have concluded that the volumetric studiesoint the delayed micellization for SDS in presence of maltodex-rin which is further supported well by the surface tension studies.n case of maltodextrin with SDS, at lower surfactant concentra-ion, there are appreciable electrostatic interactions but at higheroncentration of surfactant, hydrophobic interactions play majorole. Surface excess (� max) and minimum area occupied by theurfactant (Amin) complimenting each other, thus, reveals the con-iderable amount of an association or interactions taking place inDS–maltodextrin system.
cknowledgments
S. Chauhan and Kundan Sharma thank University Grant Com-ission, New Delhi for their financial assistance under theajor research project (F. No. 32-237/2006(SR)) and awarding
esearch fellowship (No. F.4-1/2006 (BSR)/7-75/2007(BSR)) respec-ively.
ppendix A. Supplementary data
Supplementary data associated with this article can be found, inhe online version, at http://dx.doi.org/10.1016/j.fluid.2013.06.051.
[[
[
ilibria 354 (2013) 236–244
References
[1] A. Wangsakan, P. Chinachoti, D.J. McClements, J. Agric. Food Chem. 49 (2001)5039–5045.
[2] G. Wang, G. Olofsson, J. Phys. Chem. 99 (1995) 5588–5596.[3] S. Chauhan, M.S. Chauhan, D. Kaushal, V.K. Syal, J. Jyoti, J. Solution Chem. 39
(2010) 622–638.[4] D. Ramyadevi, A. Subathira, S. Saravanan, Res. J. Chem. Sci. 2 (7) (2012)
47–52.[5] A. Wangsakan, P. Chinachoti, D.J. McClements, J. Agric. Food Chem. 51 (2003)
7810–7814.[6] A. Ali, N.H. Ansari, J. Surfact. Deterg. 13 (2010) 441–449.[7] E. Kudryashov, T. Kapustina, S. Morrissey, V. Buckin, K. Dawson, J. Colloid Inter-
face Sci. 203 (1998) 59–68.[8] D.W. Fuerstenau, J. Colloid Interface Sci. 256 (2002) 79–90.[9] W. Wang, J.C.T. Kwak, Colloids Surf. A 156 (1999) 95–110.10] E.J. Beck, J.F. Caplan, E.K. Comeau, C.V. Howley, D.G. Marangoni, Can. J. Chem.
73 (1995) 1741–1745.11] M.N. Jones, Chem. Soc. Rev. 21 (1992) 127–136.12] D.J. McClements, K. Demetriades, Crit. Rev. Food Sci. Nutr. 38 (1998)
511–536.13] S. Chauhan, K. Sharma, D.S. Rana, G. Kumar, A. Umar, J. Mol. Liq. 175 (2012)
103–110.14] S. Chauhan, J. Jyoti, G. Kumar, J. Mol. Liq. 159 (2011) 196–200.15] R.A. Stairs, W.T. Rispin, R.C. Makhija, Can. J. Chem. 48 (1970) 2755.16] S. Chauhan, M.S. Chauhan, J. Jyoti, Rajni, J. Mol. Liq. 148 (2009) 24–28.17] D.M. Bloor, J. Gormally, E. Wyn-Jones, J. Chem. Soc., Faraday Trans. 1 80 (1984)
1915–1923.18] S. Chauhan, M.S. Chauhan, G.S. Chauhan, Sonika, J. Jyoti, Int. J. Thermophys. 33
(2012) 279–288.19] S. Chauhan, K. Sharma, D.S. Rana, G. Kumar, A. Umar, J. Solution Chem. 42 (2013)
634–656.20] D.S. Gill, J. Singh, P. Singh, S.K. Rehani, R. Khajura, Indian J. Chem. A 37 (1999)
45.21] S.S. Aswale, S.R. Aswale, R.S. Hajare, J. Chem. Pharm. Res. 4 (5) (2012)
2671–2677.22] I.M. Umlong, K. Ismail, Colloids Surf. A 299 (2007) 8–14.23] C.C. Ruiz, J.M. Hierrezuelo, J.A. Molina-Boliva, Colloid. Polym. Sci. 286 (2008)
1281–1289.24] S.K. Paliwal, V.K. Talhane, J. Pure Appl. Ultrason. 26 (2004) 105–109.
Copyright © 2022 FDOKUMEN