Morphology-Based Automatic Seizure Detector for Intracerebral EEG Recordings
Upload
independentCategory
view
6download
0
ORIGINAL RESEARCH
A Twin Study of Intracerebral Volumetric Relationships
J. Eric Schmitt • Gregory L. Wallace • Rhoshel K. Lenroot •
Sarah E. Ordaz • Dede Greenstein • Liv Clasen •
Kenneth S. Kendler • Michael C. Neale • Jay N. Giedd
Received: 14 April 2009 / Accepted: 8 January 2010 / Published online: 30 January 2010
� US Government 2010
Abstract Using high resolution magnetic resonance
imaging data, we examined the interrelationships between
eight cerebral lobar volumetric measures via both explor-
atory and confirmatory factor analyses in a large sample
(N = 484) of pediatric twins and singletons. These analy-
ses suggest the presence of strong genetic correlations
between cerebral structures, particularly between regions
of like tissue type or in spatial proximity. Structural
modeling estimated that most of the variance in all struc-
tures is associated with highly correlated lobar latent fac-
tors, with differences in genetic covariance and heritability
driven by a common genetic factor that influenced gray and
white matter differently. Reanalysis including total brain
volume as a covariate dramatically reduced the total
residual variance and disproportionately influenced the
additive genetic variance in all regions of interest.
Keywords Twin � Cerebrum � MRI � Genetics �Pediatrics
Introduction
The human telencephalon, or cerebrum, is approximately
950 grams at adulthood and represents over 80% of total
brain weight (Jenkins and Truex 1963). As a region of
dramatic evolutionary expansion in humans, the cerebrum
is of particular interest in attempts to understand the biol-
ogy underlying complex psychological and psychiatric
phenomena (Carroll 2003; Hill and Walsh 2005). The
human cerebrum is both the defining neuroanatomic
structure of our species as well as one of the most impor-
tant determinants of our identity as individuals. Yet despite
the importance of the cerebrum to behavior genetics,
neurogenetics, and evolutionary genetics, our understand-
ing of both the etiology of individual differences in cere-
bral patterning and the genetics underlying human brain
evolution remain quite limited (Rakic 2009).
By isolating genetically mediated variance in brain
structures, twin and family studies using magnetic reso-
nance imaging (MRI) provide valuable information on the
relative importance of genetics on brain anatomy. Prior
twin studies have consistently shown that population var-
iability in total brain volumes is almost entirely due to
genetic variation (Panizzon et al. 2009; Schmitt et al.
2007b). For example, Baare et al. estimated very high
heritabilities for total brain volume (0.90), total gray matter
(0.82) and total white matter (0.88) using high resolution
MRI scans from 54 monozygotic (MZ) twin pairs, 58
dizygotic (DZ) twin pairs, and 34 siblings (Baare et al.
2001). In a pediatric sample of 34 MZ and 32 DZ twin
pairs with reading disability, Pennington et al. estimated
total cerebral volume heritability at 97% (Pennington et al.
2000). More recently, Peper et al. reported a total brain
volume heritability estimate of 0.94 in a sample of 45 MZ
and 62 DZ nine year old twin pairs (Peper et al. 2009).
Edited by Kristen Jacobson.
J. E. Schmitt (&) � K. S. Kendler � M. C. Neale
Virginia Institute for Psychiatric and Behavioral Genetics,
Virginia Commonwealth University, 800 East Leigh Street,
suite 100, PO Box 980003, Richmond, VA 23298-0003, USA
e-mail: [email protected]; [email protected]
G. L. Wallace � R. K. Lenroot � D. Greenstein �L. Clasen � J. N. Giedd
Pediatric Imaging Unit, Child Psychiatry Branch,
National Institute of Mental Health, Bethesda, MD, USA
S. E. Ordaz
Department of Psychology, University of Pittsburgh,
Pittsburgh, PA, USA
123
Behav Genet (2010) 40:114–124
DOI 10.1007/s10519-010-9332-6

Despite the well-established importance of genetic fac-
tors on global brain volumes, the role of genetics on
cerebral substructures is far less well-understood. To date,
there have been only three twin studies that have examined
the genetic contributions to individual cerebral lobar vol-
umes (Carmelli et al. 2002; Geschwind et al. 2002; Wallace
et al. 2006). In an older adult sample from the National
Heart, Lung, and Blood Institute (NHLBI), Geschwind
et al. examined lobar brain volumes in 72 MZ and 67 DZ
twins and found that the frontal and temporal lobe volumes
had relatively high heritability (0.69–0.77), parietal lobe
moderate heritability (0.54–0.57), and occipital lobe the
lowest heritability (0.37–0.38) of the cerebral lobes
(Geschwind et al. 2002). Carmeli et al. reported similar
heritability estimates, also based on data from the NHLBI
sample (Carmelli et al. 2002). Using the NIH pediatric twin
sample, Wallace et al. estimated that the heritability of the
frontal, temporal, and parietal lobes ranged from 0.88 to
0.92 in 90 MZ twin pairs, 38 DZ pairs, and 158 singletons
(Wallace et al. 2006).
To date, only a handful of studies have attempted to
examine the genetic relationships between brain volumes
in a multivariate framework (Baare et al. 2001; Posthuma
et al. 2000; Schmitt et al. 2007a; Wright et al. 2002), and
none has focused on cerebral volumes in a typical sample.
In other words, despite the evidence that most large brain
volumes are highly heritable, there is very little evidence
about whether genetic effects within the cerebrum are the
consequence of independent genetic factors or caused by
shared genetic effects influencing the cerebrum in its
entirety. In this article, we attempt to address the question
of whether genetically mediated individual differences in
cerebral lobar volumes exhibit regional specificity within
the cerebrum, or rather are dominated by global or tissue-
specific effects.
Methods
These analyses utilize neuroimaging data from the Pedi-
atric Twin Study at the Child Psychiatry Branch of the
National Institute of Mental Health (NIMH). The subjects
in this study were recruited by means of local and national
advertisements for participation in an ongoing longitudinal
pediatric imaging study. Advertisements specified that the
MRI study sought twins between the ages of 5 and 18, with
no learning disabilities, neurological problems or behav-
ioral disorders. The screening process involved phone
interviews, behavioral questionnaires mailed to parents and
teachers, an in-person clinical interview, family history
assessment, as well as a physical and neurological exam.
Exclusion criteria included having a lifetime history
of physical, neurological, or psychiatric abnormalities,
learning disabilities, or psychiatric illness oneself, or in
either one-first-degree relative or more than 20% of sec-
ond-degree relatives. Approximately one in four families
responding to the advertisements met inclusion criteria.
Twins were included in the analysis only if quantifiable
MRI scans free from motion or other artifact were obtained
on both twins at the same age. Written assent from the
child and written consent from a parent were obtained for
each participant. The study protocol was approved by the
institutional review board of the National Institute of
Mental Health.
Zygosity was determined by DNA analysis of buccal
cheek swabs using 9–21 unlinked short tandem repeat loci
for a minimum certainty of 99%, by BRT Laboratories,
Inc. (Baltimore, MD). The resultant sample consisted of
127 same-sex MZ twin pairs (mean age = 11.6, SD = 3.3;
age range = 5.6–18.7; 74 [58%] male, 53 female), 36
same-sex DZ twin pairs (mean age = 11.0, SD = 3.7; age
range = 5.5–18.2; 18 [60%] male, 12 female), and 158
singletons (mean age = 11.3, SD = 3.5; age range =
5.2–18.7; 94 [59%] male, 64 female).
Image acquisition
All subjects were scanned on the same GE 1.5 Tesla Signa
MRI scanner. A three-dimensional spoiled gradient recal-
led echo in the steady state (3D SPGR) imaging protocol
was used for all subjects (axial slice thickness = 1.5 mm,
time to echo = 5 ms, repetition time = 24 ms, flip
angle = 45 degrees, acquisition matrix = 192 9 256,
number of excitations = 1, and field of view = 24 cm).
Image processing
The native MRI scans were first registered into standard-
ized stereotaxic space using a linear transformation
(Collins et al. 1994) and corrected for non-uniformity
artifacts (Sled et al. 1998). The registered and corrected
volumes were segmented into gray matter, white matter,
cerebro-spinal fluid, and background using a neural net
classifier (Zijdenbos et al. 2002). The tissue classification
information was combined with a probabilistic atlas to
provide region of interest measures (Collins et al. 1994).
The output measures of this process have shown high
agreement with conventional hand tracing measures. The
measures used in the present study were cerebral lobar
volumes (frontal, parietal, temporal, and occipital lobes),
for gray and white tissue compartments separately.
Statistical analyses
Preliminary inspection of normal quantile plots of the
observed variables indicated that they met the normality
Behav Genet (2010) 40:114–124 115
123

assumptions of structural equation modeling with likeli-
hood based optimization. Using R (Ihaka and Gentleman
1996; R Development Core Team 2005) we calculated
correlations between all volumes for MZ and DZ groups
separately.
Multivariate analyses were performed in Mx (Neale
et al. 2002). We started by constructing a preliminary
8-variable triple Cholesky decomposition, the multivariate
analog of the classical ACE model, in order to calculate
relatively unbiased genetic and environmental correlations
between the observed variables as well as heritability
estimates (Neale and Cardon 1992). We also calculated
eigenvalues on the decomposed covariance matrices to
obtain an approximate number of factors required to
explain most of the observed variance. We then performed
an exploratory factor analysis (EFA) using independent
pathway models (Kendler et al. 1987; Mcardle and Gold-
smith 1990). Scree plots of eigenvalues from the Cholesky
decomposition suggested that three common factors, at
most, would be required to explain most of the covariance
for each variance component. Thus, our full model inclu-
ded three factors for each of three variance components
(additive genetic, shared environmental, and unique envi-
ronmental variance), as well as structure-specific factors
for each variance component. This model is subsequently
referred to as the 333-ACE IPM, indicating 3 additive
genetic (A), 3 shared environmental (C), and 3 unique
environmental (E) common factors, respectively.
As a complementary approach to IFA, we also per-
formed a confirmatory analysis (CFA) as the nature of the
cerebral measures implied a straightforward factor struc-
ture. Each of the eight variables measured was hypothe-
sized to be influenced by factors related to tissue type (e.g.
gray versus white matter) or spatial location (e.g. lobe).
These relationships are visualized in Fig. 1a, in which
each observed variable is influenced by two latent factors
based on its unique combination of region and tissue.
Coincidentally, the factor structure of this model is iden-
tical to the multitrait-multimethod model (MTMM) origi-
nally proposed by Campbell and Fiske for the assessment of
construct validity (Campbell and Fiske 1959). In MTMMs,
the variance in each observed measure is assumed to be a
combination of latent contributions from one of two or
more trait-specific factors (e.g. anxiety, depression) and one
of two or more method-specific factors (e.g. test battery).
Our parameterization was similar to the correlated traits,
correlated methods version of MTMM devised by Joreskog
for CFA using structural equation modeling (Joreskog
1971) and is virtually identical in specification to prior
models used in the behavioral sciences (Coromina and
Coenders 2006). Given our twin sample, the MTMM model
was expanded in order to decompose observed intercerebral
covariances into genetic and nongenetic sources (Fig. 1b).
Thus, intercerebral relationships due to genetic (A), shared
environmental (C), and unique environmental (E) influ-
ences could be estimated separately.
The MTMM has been extensively used in the social
sciences, though the principles of the model can be easily
generalized (Bechger and Maris 2004). The widespread use
of MTMM over several decades has revealed many
unfortunate limitations of the approach, such as identifi-
cation problems for small numbers of factors, easy mis-
specification, unidentified submodels due to inadequate
local information, and errors in estimation. Some of the
problems are specific to the use of ordinal data, however
(Tomas et al. 2000). Additive MTMM models, for exam-
ple, have been shown to fit well for continuous, normally
distributed variables even if the fit is poor for ordinal data
(Corten et al. 2002). Nevertheless, because of the inherent
problems associated with the MTMM factor structure, we
elected to pursue a cautious approach in our own data.
Since prior research has demonstrated at most a trivial role
of the shared environment on absolute cerebral volumes
(Wallace et al. 2006), we attempted to remove all factors
Fig. 1 Confirmatory factor models. Panel A is a sample path diagram
of the MTMM model factor pattern. Two classes of latent variables
are defined, those pertaining to tissue or spatial location. Though not
shown, each path corresponds to a unique, freely estimated parameter.
The first letter of the observed variable name corresponds to spatial
location (F, frontal; P, parietal; O, occipital; T temporal) and the
second to tissue (G, gray; W, white). Given data from twins and
family members, the variance can be decomposed into genetic and
nongenetic sources (Panel B). For simplicity, the model from only
one twin is shown
116 Behav Genet (2010) 40:114–124
123

related to the shared environment. But because of the risk
of over-fitting, we did not attempt more subtle simplifica-
tions of the model (e.g. removing tissue-specific factors).
We employed maximum likelihood for numeric opti-
mization (Edwards 1972). In these analyses, best-fit models
were chosen using AIC (Akaike 1987), though we also
performed likelihood ratio chi-squared tests to compare
model fits without rewarding parsimony. Since preliminary
simple linear regressions demonstrated a significant effect
of age, race, and sex, we used residuals from multiple
regressions including age sex and race as explanatory
variables for all models.
Covarying for global effects
Univariate ACE modeling was used to decompose the
phenotypic variance of total brain volume (TBV). We then
repeated our statistical analyses, but included TBV as a
regressor on mean ROI volumes.
Results
Within individuals, correlations between cerebral struc-
tures were high (Table 1). The highest correlations,
approximately 0.80–0.95, were between frontal gray matter
and both temporal and parietal gray, as well as between
frontal white and parietal and temporal white matter. The
lowest correlations, approximately 0.30–0.60, were
between occipital structures and structures of different
tissue type in different lobes. In general, variables that
differed only by one qualitative trait were more correlated
than if they differed by both tissue type and spatial loca-
tion. For example, frontal gray matter was highly corre-
lated with frontal white, as well as to temporal and parietal
gray, but to a lesser extent to parietal and temporal white.
The most prominent exception to this observation was a
high correlation between temporal gray and parietal white
matter.
Similar to our prior univariate studies on a slightly
smaller sample, the within-region, cross twin correlations
were substantially higher in MZ twins relative to DZ twins
for cerebral volumes. The differences between groups were
strongest for white matter structures, though these
descriptive statistics suggest that both gray and white
matter are highly heritable. Heritability estimates from the
Cholesky decomposition (Table 2) also suggested gener-
ally high heritability values for cerebral ROIs. Variance
attributable to the shared environment was small for all
cerebral regions, ranging from 0.02 to 0.24.
Table 1 Within and cross twin correlations between cerebral volumes for MZ (below diagonal) and DZ (above diagonal) groups
FG1 FW1 OG1 OW1 PG1 PW1 TG1 TW1 FG2 FW2 OG2 OW2 PG2 PW2 TG2 TW2
FG1 1.00 0.75 0.54 0.60 0.80 0.67 0.87 0.68 0.46 0.32 0.20 0.22 0.37 0.23 0.36 0.24
FW1 0.67 1.00 0.48 0.77 0.59 0.94 0.79 0.92 0.29 0.49 0.10 0.43 0.19 0.48 0.34 0.53
OG1 0.64 0.58 1.00 0.69 0.59 0.52 0.61 0.52 0.23 0.13 0.44 0.31 0.25 0.14 0.28 0.25
OW1 0.39 0.73 0.70 1.00 0.54 0.84 0.71 0.82 0.20 0.32 0.33 0.51 0.19 0.45 0.26 0.44
PG1 0.84 0.61 0.73 0.51 1.00 0.62 0.70 0.53 0.23 0.19 0.14 0.21 0.28 0.19 0.14 0.11
PW1 0.44 0.86 0.60 0.83 0.55 1.00 0.71 0.90 0.13 0.40 0.03 0.40 0.07 0.48 0.19 0.47
TG1 0.85 0.67 0.71 0.51 0.74 0.53 1.00 0.83 0.38 0.39 0.37 0.46 0.36 0.38 0.45 0.48
TW1 0.48 0.83 0.52 0.77 0.46 0.84 0.64 1.00 0.30 0.50 0.27 0.57 0.26 0.56 0.42 0.65
FG2 0.82 0.62 0.62 0.50 0.74 0.49 0.70 0.53 1.00 0.58 0.51 0.22 0.89 0.42 0.88 0.43
FW2 0.62 0.90 0.58 0.69 0.55 0.80 0.68 0.81 0.63 1.00 0.29 0.59 0.49 0.84 0.68 0.77
OG2 0.53 0.57 0.71 0.65 0.59 0.57 0.58 0.60 0.63 0.55 1.00 0.60 0.66 0.39 0.63 0.39
OW2 0.39 0.66 0.59 0.82 0.43 0.72 0.51 0.74 0.42 0.70 0.73 1.00 0.32 0.71 0.41 0.72
PG2 0.66 0.57 0.60 0.58 0.80 0.54 0.56 0.52 0.87 0.57 0.70 0.49 1.00 0.46 0.82 0.39
PW2 0.43 0.81 0.56 0.76 0.50 0.90 0.55 0.83 0.50 0.87 0.61 0.80 0.57 1.00 0.60 0.79
TG2 0.71 0.66 0.63 0.60 0.66 0.57 0.83 0.70 0.86 0.68 0.69 0.53 0.76 0.61 1.00 0.68
TW2 0.47 0.74 0.52 0.68 0.42 0.74 0.67 0.91 0.50 0.82 0.60 0.76 0.47 0.85 0.70 1.00
Cross twin correlations are shown in shaded boxes; cross-twin, within-trait correlations are in boldface
Behav Genet (2010) 40:114–124 117
123

Genetic and environmental correlations
Cross-twin, cross-structure correlations tended to be sub-
stantially higher in the MZ group, suggesting that most of
the covariance between variables is genetically mediated.
Genetic and unique environmental correlations generated
with Cholesky decomposition are given in Table 3; the
covariances attributable to the shared environment were
substantially smaller than the other two variance compo-
nents, and the corresponding correlation matrix therefore is
not shown. Maximum likelihood estimates for the genetic
correlations were quite high, ranging from 0.56 to 0.94. As
with the within-individual phenotypic correlations, struc-
tures of like tissue type or location tended to be slightly
more correlated via genetic factors than those without these
similarities. In contrast, unique environmental correlations
were, in general, lower and more variable, ranging from
-0.22 to 0.86. By far the strongest environmental corre-
lations were between gray matter structures ([0.80),
excepting the occipital lobe. Unique environmental corre-
lations between regions of unlike tissue composition ten-
ded to be small or even negative.
Table 2 Variance components estimates for eight cerebral lobar volumes
No global covariate TBV-adjusted
a2 c2 e2 a2 c2 e2
FG 0.55 (0.31–0.75) 0.21 (0.03–0.44) 0.23 (0.17–0.32) 0.17 (0.00–0.49) 0.45 (0.15–0.62) 0.38 (0.29–0.51)
FW 0.75 (0.51–0.89) 0.10 (0.00–0.35) 0.14 (0.10–0.19) 0.55 (0.24–0.74) 0.15 (0.00–0.44) 0.30 (0.22–0.42)
OG 0.47 (0.20–0.69) 0.22 (0.03–0.49) 0.30 (0.22–0.41) 0.27 (0.05–0.55) 0.29 (0.04–0.52) 0.44 (0.33–0.58)
OW 0.57 (0.19–0.79) 0.17 (0.00–0.53) 0.26 (0.19–0.35) 0.37 (0.02–0.60) 0.16 (0.00–0.50) 0.46 (0.35–0.61)
PG 0.76 (0.48–0.84) 0.02 (0.00–0.30) 0.21 (0.15–0.31) 0.72 (0.37–0.83) 0.05 (0.00–0.38) 0.23 (0.17–0.34)
PW 0.71 (0.47–0.88) 0.15 (0.00–0.34) 0.14 (0.10–0.19) 0.27 (0.06–0.60) 0.48 (0.16–0.69) 0.25 (0.18–0.34)
TG 0.65 (0.43–0.80) 0.13 (0.01–0.34) 0.21 (0.15–0.30) 0.43 (0.12–0.65) 0.22 (0.17–0.52) 0.35 (0.26–0.48)
TW 0.61 (0.31–0.88) 0.24 (0.00–0.54) 0.15 (0.11–0.20) 0.33 (0.01–0.71) 0.35 (0.00–0.67) 0.32 (0.23–0.45)
95% confidence intervals are given in parentheses. Values represent the proportional variance in brain volumes attributable to genetic (a2), shared
environmental (c2) and individual specific (e2) factors
Table 3 Genetic and unique environmental correlations between cerebral substructures, with 95% confidence intervals in parenthesis
FG FW OG OW PG PW TG TW
FG 1 .20
(0 .39)
.26
(.07 .43)
-.28
(-.44 -.09)
.82
(.74 .88)
.11
(-.09 .31
.86
(.80 .91)
-.08
(-.28 .12)
FW .75
(.57 .94)
1 -.05
(-.24 .16)
.32
(.14 .49)
.12
(-.09 .32)
.66
(.54 .76)
.04
(-.17 .24)
.52
(.36 .65)
OG .83
(.57 .98)
.69
(.43 .93)
1 .41
(.24 .56)
.47
(.30 .62)
.27
(.08 .47)
.39
(.21 .55)
.03
(-.17 .23)
OW .76
(.44 1)
.74
(.56 .96)
.86
(.63 .98)
1 -.11
(-.31 .09)
.54
(.38 .67)
-.22
(-.40 -.01)
.43
(.26 .58)
PG .91
(.79 .98)
.58
(.39 .79)
.86
(.68 .97)
.66
(.41 .95)
1 .29
(.08 .47)
.81
(.73 .88)
-.10
(-.30 .12)
PW .88
(.64 .99)
.91
(.84 .98)
.89
(.68 .99)
.83
(.69 .98)
.74
(.57 .93)
1 .11
(-.09 .32)
.63
(.48 .74)
TG .94
(.85 .99)
.75
(.57 .93)
.63
(.40 .85)
.64
(.40 .98)
.79
(.67 .89)
.79
(.60 .94)
1 -.13
(-.33 .08)
TW .82
(.49 1)
.92
(.80 1)
.61
(.25 .90)
.72
(.45 .97)
.56
(.29 .88)
.84
(.70 .96)
.81
(.55 1)
1
The diagonal divides genetic (below) from unique environmental (above) correlations. Cross-tissue, within-lobe correlations are in boldface
118 Behav Genet (2010) 40:114–124
123
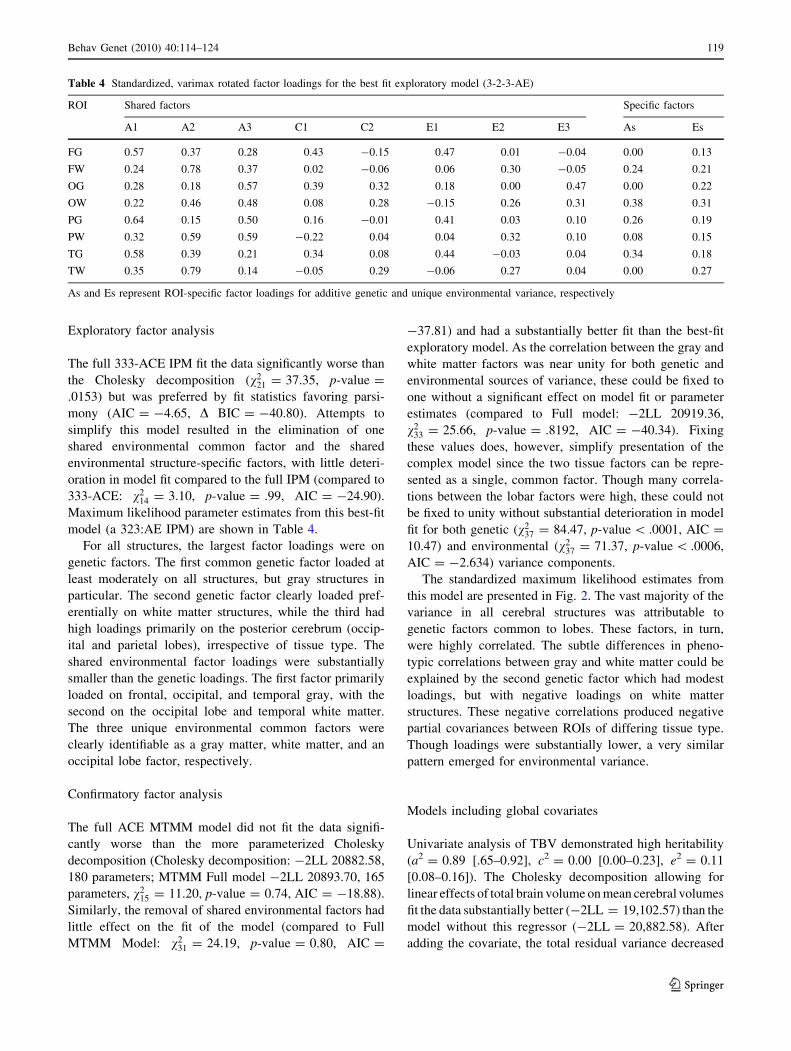
Exploratory factor analysis
The full 333-ACE IPM fit the data significantly worse than
the Cholesky decomposition (v221 = 37.35, p-value =
.0153) but was preferred by fit statistics favoring parsi-
mony (AIC = -4.65, D BIC = -40.80). Attempts to
simplify this model resulted in the elimination of one
shared environmental common factor and the shared
environmental structure-specific factors, with little deteri-
oration in model fit compared to the full IPM (compared to
333-ACE: v214 = 3.10, p-value = .99, AIC = -24.90).
Maximum likelihood parameter estimates from this best-fit
model (a 323:AE IPM) are shown in Table 4.
For all structures, the largest factor loadings were on
genetic factors. The first common genetic factor loaded at
least moderately on all structures, but gray structures in
particular. The second genetic factor clearly loaded pref-
erentially on white matter structures, while the third had
high loadings primarily on the posterior cerebrum (occip-
ital and parietal lobes), irrespective of tissue type. The
shared environmental factor loadings were substantially
smaller than the genetic loadings. The first factor primarily
loaded on frontal, occipital, and temporal gray, with the
second on the occipital lobe and temporal white matter.
The three unique environmental common factors were
clearly identifiable as a gray matter, white matter, and an
occipital lobe factor, respectively.
Confirmatory factor analysis
The full ACE MTMM model did not fit the data signifi-
cantly worse than the more parameterized Cholesky
decomposition (Cholesky decomposition: -2LL 20882.58,
180 parameters; MTMM Full model -2LL 20893.70, 165
parameters, v215 = 11.20, p-value = 0.74, AIC = -18.88).
Similarly, the removal of shared environmental factors had
little effect on the fit of the model (compared to Full
MTMM Model: v231 = 24.19, p-value = 0.80, AIC =
-37.81) and had a substantially better fit than the best-fit
exploratory model. As the correlation between the gray and
white matter factors was near unity for both genetic and
environmental sources of variance, these could be fixed to
one without a significant effect on model fit or parameter
estimates (compared to Full model: -2LL 20919.36,
v233 = 25.66, p-value = .8192, AIC = -40.34). Fixing
these values does, however, simplify presentation of the
complex model since the two tissue factors can be repre-
sented as a single, common factor. Though many correla-
tions between the lobar factors were high, these could not
be fixed to unity without substantial deterioration in model
fit for both genetic (v237 = 84.47, p-value \ .0001, AIC =
10.47) and environmental (v237 = 71.37, p-value \ .0006,
AIC = -2.634) variance components.
The standardized maximum likelihood estimates from
this model are presented in Fig. 2. The vast majority of the
variance in all cerebral structures was attributable to
genetic factors common to lobes. These factors, in turn,
were highly correlated. The subtle differences in pheno-
typic correlations between gray and white matter could be
explained by the second genetic factor which had modest
loadings, but with negative loadings on white matter
structures. These negative correlations produced negative
partial covariances between ROIs of differing tissue type.
Though loadings were substantially lower, a very similar
pattern emerged for environmental variance.
Models including global covariates
Univariate analysis of TBV demonstrated high heritability
(a2 = 0.89 [.65–0.92], c2 = 0.00 [0.00–0.23], e2 = 0.11
[0.08–0.16]). The Cholesky decomposition allowing for
linear effects of total brain volume on mean cerebral volumes
fit the data substantially better (-2LL = 19,102.57) than the
model without this regressor (-2LL = 20,882.58). After
adding the covariate, the total residual variance decreased
Table 4 Standardized, varimax rotated factor loadings for the best fit exploratory model (3-2-3-AE)
ROI Shared factors Specific factors
A1 A2 A3 C1 C2 E1 E2 E3 As Es
FG 0.57 0.37 0.28 0.43 -0.15 0.47 0.01 -0.04 0.00 0.13
FW 0.24 0.78 0.37 0.02 -0.06 0.06 0.30 -0.05 0.24 0.21
OG 0.28 0.18 0.57 0.39 0.32 0.18 0.00 0.47 0.00 0.22
OW 0.22 0.46 0.48 0.08 0.28 -0.15 0.26 0.31 0.38 0.31
PG 0.64 0.15 0.50 0.16 -0.01 0.41 0.03 0.10 0.26 0.19
PW 0.32 0.59 0.59 -0.22 0.04 0.04 0.32 0.10 0.08 0.15
TG 0.58 0.39 0.21 0.34 0.08 0.44 -0.03 0.04 0.34 0.18
TW 0.35 0.79 0.14 -0.05 0.29 -0.06 0.27 0.04 0.00 0.27
As and Es represent ROI-specific factor loadings for additive genetic and unique environmental variance, respectively
Behav Genet (2010) 40:114–124 119
123

precipitously for all regions (Fig. 3). Without a global
covariate, additive genetic was the largest variance compo-
nent for all ROIs; the use of a global covariate had a dis-
proportionately greater influence on the genetic variance
compared to the environmental variance components
(Table 2). Thus, after controlling for global effects, additive
genetic factors became relatively less important in explain-
ing the residual variance. This was expected because the
covariate itself was both strongly heritable and highly cor-
related with lobar volumes.
Table 5 provides correlations for individual variance
components from this model. Unlike the strong positive
genetic correlations observed for absolute volumes, genetic
correlations between TBV-covaried structures varied widely
and were often negative. For all variance components, neg-
ative correlations tended to be between gray and white matter
structures. In effect, controlling for TBV removed a sizable,
positive partial correlation between all structures.
Attempts to model the relationships between TBV-
covaried structures were only marginally successful. The
333-IPM fit worse than Cholesky decomposition based on
v2 but not by AIC (v221 = 41.53, p-value = .0048, AIC =
-0.47). As with the initial analyses on absolute volumes,
the 323-AE IPM was found to be the most parsimonious
model after a stepwise removal of latent factors (compared
to Cholesky: v235 = 44.45, p-value = 0.13, AIC = -25.55;
compared to 333-IPM: v214 = 2.91, p-value = 0.99, AIC =
-25.09).
Table 6 reports the parameter estimates from this model,
which were substantially more difficult to interpret than
those on absolute volumes. Genetic effects were no longer
predominant. Additionally, strong negative factor loadings
were a prominent feature of the TBV-covaried factor
models. The common factors still demonstrated evidence of
the gray/white dichotomy, but these effects were somewhat
obscured by loadings that did not fit the pattern. For
example, the most prominent loadings for the third genetic
factor were a positive loading on occipital gray matter, and a
negative loading on temporal gray; these structures were
uncorrelated via other common genetic factors.
Confirmatory analyses were somewhat more successful.
The Full MTMM did not fit significantly worse than
Cholesky decomposition (-2LL = 19,119.070, v216 =
16.50, p-value = .42, AIC = -16.50). Parameter esti-
mates from the best-fit MTMM submodel (-2LL
19149.989; relative to Cholesky v256 = 47.42, p-value =
.79, AIC = -64.581; relative to full MTMM v240 = 30.92,
p-value = .85, AIC = -49.01) are shown in Fig. 4. The
most striking differences compared to the MTMM without
a global covariate were (1) the substantial decrease in
variance explained by genetic lobar factors, (2) a reversal
in the correlations between these factors from strongly
positive to negative, and (3) a relative increase in the
importance of the path coefficients of the common genetic
factor with a similar pattern of positive and negative
values.
Discussion
A multivariate analysis of cerebral volumes suggests that
genetic factors play the dominant role in the generation of
interlobar covariance. These findings are similar to a prior
volumetric study on more ontogenetically diverse regions
of interest, which found a single genetic factor explaining
most of the observed covariance between cerebrum, cere-
bellum, caudate, and corpus callosum (Schmitt et al.
2007a). Because of the availability of segmentation data in
the cerebrum, however, in the analyses reported here we
were able to detect subtle differences in the relationships
between gray and white matter. Genetic correlation
matrices, EFA, and CFA all suggest that genetically med-
iated covariance is greater between brain regions of similar
Fig. 2 Maximum likelihood parameter estimates for the best-fit
MTMM model. For simplicity, genetic (panel A) and unique
environmental (panel B) factor loadings are shown separately
120 Behav Genet (2010) 40:114–124
123

tissue type. Since segmentation data from the rest of the
brain are not available, it is unclear whether these rela-
tionships are unique to the cerebrum, or rather are part of
more widespread genetically mediated tissue patterning.
Though a few studies also have reported cerebral lobar
heritability (Carmelli et al. 2002; Geschwind et al. 2002;
Wallace et al. 2006), the present analyses are unfortunately
the only extant information on intralobar volumetric rela-
tionships. However, the prior observation by Barre et al. of
a 0.68 genetic correlation between total brain gray and
white matter is, broadly speaking, consistent with the more
detailed analyses reported here (Baare et al. 2001).
Despite overwhelming evidence that brain volumes are
highly heritable, the specific genetic contributors to typical
human brain variation are unknown at present. However,
numerous genes have been linked to neurological diseases
with abnormalities in brain size and morphology, including
several forms of microcephaly and lissencephaly (Gaitanis
and Walsh 2004; Guerrini and Marini 2006). There is
increasing evidence that several of these genes experienced
rapid evolutionary change in humans relative to other pri-
mates (Preuss et al. 2004). Given their profound influence on
brain volumes, the genes implicated in microcephaly are of
particular relevance to the present study. Several genes that
cause microcephaly, including microcephalin (MCPH1),
ASPM, CENPJ, and NDE1 have well-documented roles in
cell division and cell growth (Chae and Walsh 2007). As
neocortical expansion throughout evolution has been
hypothesized to have occurred via increases in the number
of progenitor cell divisions (Rakic 1995), intra-species
variation in genes such as these may have driven the evo-
lution of the relatively large human brain.
Further, recent studies of evolutionarily novel poly-
morphisms have suggested that the human brain continues
to evolve. For example, a novel variant in MCPH1 that
appeared approximately 37,000 years ago has spread
throughout the human population at a rate that suggests it
was positively selected (Evans et al. 2005). Similar evi-
dence exists for a polymorphism of ASPM that originated
only 6,000 years ago (Mekel-Bobrov et al. 2005). Behav-
ioral genetic data supports the hypothesis that the human
brain is a work in progress, as the extraordinarily high
metabolic cost of brain tissue should place a selective
pressure towards smaller brains and ultimate fixation of
genetic polymorphisms affecting brain volumes. In con-
trast, imaging data has established that genetic variance not
only persists but by far the predominant determinant of
brain size. Although decades of neuropsychological
research has established that brain volumes are generally
poor predictors of cognitive abilities in human populations,
the persistence of genetic variation within the cortex sug-
gests that through much of human history cortical size
produced a selective advantage that was greater than its
metabolic cost.
Although of great interest to scientists and laypersons
alike, the genetics of brain evolution remains an enigmatic
Fig. 3 Residual variance for
variance components with and
without a global covariate,
organized by cerebral region of
interest. Variance components
(A, C, and E) are labeled and
shown as broken lines. Total
variance (V) is shown as a solidline
Behav Genet (2010) 40:114–124 121
123

field that intersects a diverse cadre of other scholarly fields
including anthropology, the neurosciences, molecular and
population genetics, philosophy, and medicine. A central
question in brain evolution is whether neuroanatomic
regions tend to evolve independently of one another based
on their behavioral specializations, or rather evolve toge-
ther as part of a more global evolutionary process. Finlay
and Darlington established that TBV is correlated [96%
with regional substructure volumes (with the exception of
the olfactory bulb) when they examined data from 131
Table 5 Genetic, shared environmental, and unique environmental
correlations after use of a global covariate on mean volumes for all
structures
FG FW OG OW PG PW TG TW
Genetic
FG 1.00
FW 20.94 1.00
OG 0.21 20.33 1.00
OW 20.36 0.22 0.34 1.00
PG 0.80 20.63 0.46 20.21 1.00
PW 20.67 0.63 0.26 0.34 20.22 1.00
TG 0.52 20.41 20.62 20.56 0.19 20.56 1.00
TW 20.66 0.67 20.56 0.26 20.65 0.21 20.25 1.00
Shared environmental
FG 1.00
FW 20.12 1.00
OG 20.15 20.96 1.00
OW 20.91 20.19 0.40 1.00
PG 20.32 0.11 20.07 0.41 1.00
PW 20.69 0.62 20.47 0.60 0.38 1.00
TG 0.34 20.89 0.81 20.12 20.53 20.76 1.00
TW 20.70 0.33 20.13 0.51 20.36 0.63 20.22 1.00
Unique environmental
FG 1.00
FW 20.45 1.00
OG 20.30 20.41 1.00
OW 20.76 0.30 0.37 1.00
PG 0.51 20.66 0.12 20.51 1.00
PW 20.72 0.54 20.02 0.56 20.43 1.00
TG 0.66 20.67 20.01 20.59 0.52 20.63 1.00
TW 20.58 0.49 20.13 0.44 20.64 0.62 20.58 1.00
Within-lobe correlations are shown in boldface
Table 6 Varimax-rotated, standardized maximum likelihood parameter estimates of best-fit exploratory model after covarying for total cerebral
volume. 1
ROI A1 A2 A3 C1 C2 E1 E2 E3 As Es
FG -0.28 0.27 -0.08 0.64 0.00 0.52 0.20 -0.18 0.19 0.24
FW 0.62 -0.37 0.01 -0.07 0.40 -0.31 0.28 0.26 0.00 0.26
OG 0.00 0.29 0.43 -0.09 -0.52 -0.04 -0.57 -0.06 0.00 0.34
OW 0.04 -0.09 0.35 -0.39 -0.05 -0.45 -0.29 0.26 0.47 0.38
PG -0.20 0.76 -0.04 -0.04 0.03 0.16 -0.04 -0.46 0.38 0.00
PW 0.34 -0.02 0.11 -0.53 0.38 -0.42 0.02 0.09 0.44 0.27
TG -0.27 0.01 -0.58 0.18 -0.46 0.44 -0.04 0.17 0.00 0.35
TW 0.09 -0.51 0.03 -0.40 0.16 -0.33 0.07 0.28 0.44 0.39
Fig. 4 Maximum likelihood parameter estimates for the best-fit
MTMM model after covarying for total brain volume. For clarity,
genetic (panel A) and unique environmental (panel B) factor loadings
are shown separately
122 Behav Genet (2010) 40:114–124
123
mammalian species (Darlington et al. 1999; Finlay and
Darlington 1995). Such strong correlations have been
hypothesized to reflect a generalized adaption to specific
selective pressures; although it is more energetically
expensive to expand the computational resources of the
entire brain when only specific functions are needed, the
molecular adjustments required are far fewer than those
required to completely repattern gross neural architecture.
The multivariate analyses reported here are generally
concordant with this hypothesis, as these data suggest that
most of the variance in lobar brain volumes is caused by
genetic factors that are shared between regions. This
finding is expected if a significant fraction of the genes that
cause inter-species variation in neuroanatomic volumes
also cause individual differences in human brain volumes.
Further molecular genetic studies are required, however, to
confirm this hypothesis.
As the cerebrum is the largest structure in the brain, it
was not surprising that its eight major subcomponents were
highly influenced by total brain volume. It is interesting,
however, that the use of the TBV disproportionately
decreased the additive genetic variance component with
respect to the environmental components, reducing the
heritability of all regions of interest substantially. This
effect suggests strong genetic correlations between TBV
and the cerebral ROIs in this study. In other words, a
strong—single genetic factor or several highly correlated
factors drives covariation between the observed variables.
When the effects of this factor are largely removed by
adding the TBV covariate, the positive partial correlations
it generates also disappear, producing more complex
interrelationships within the residual variance. The MTMM
factor structure still fit well after the covariate was added,
but the importance of the lobar factors relative to a
common ‘‘tissue’’ factor was reversed and the interlobar
correlations flipped to negative values. Thus, both the
exploratory and hypothesis-driven models suggest strong
global genetic effects mask more subtle and competing
genetic and nongenetic factors in the pediatric brain.
Limitations
Although provocative, the results of the present study must
be considered in the light of several limitations inherent in
the methods. First, our sample was limited to healthy chil-
dren and findings may be different in other populations. In
particular, our stringent selection criteria, which excluded
children with psychiatric or neurological risk factors, likely
eliminated a substantial fraction of the true population
variance in the measured endophenotypes. As no complete
population based pediatric twin imaging sample currently
exists, it is difficult to estimate the effect of these selection
factors. Secondly, the analyses reported here are complex,
involving sophisticated computational algorithms for the
generation of MRI images, segmentation and parcellation of
these images into brain volumes, and optimization of
behavioral genetic models. Although these techniques give
us the ability to ask more sophisticated questions about the
genetics of brain structure than many other methods, they
also rely on far more assumptions. Third, our study focused
on brain volumes alone. A recent study of Vietnam era twins
has suggested that the genetic factors exert their effects on
brain volumes through at least two largely independent
pathways, one that influences cortical thickness and one
surface area (Panizzon et al. 2009). From the present data, it
is unclear whether genetic factors influencing thickness,
surface area, or both, are responsible for the observed
genetic covariation between cerebral lobes. It is noteworthy
that our group has identified a large common genetic factor
influencing 54 gyral-level measures of cortical thickness
(Schmitt et al. 2008) previously, but it is likely that surface
area also is patterned at least in part via global genetic
factors. Fourth, although one of the largest imaging studies
currently available, our sample size is modest by the stan-
dards of population genetics.
Finally, although highly heritable, it is important to
remember that the role of environment can not be over-
stressed in the process of brain development. For example,
environmental factors have well-documented effects on
synaptogenesis and pruning, gray matter volumes, and
downstream cognitive measures such as memory and
intelligence. Our data suggests that environmental factors
play a relatively lesser role in the variance in volumes
within the population studied (American children), but it is
possible that samples with a broader range of environ-
mental exposures (international or older populations) may
exhibit a more pronounced effect of the environment on
neuroanatomic endophenotypes.
Acknowledgments This research was supported by the intramural
research program of the NIH as well as NIH grants MH-65322,
MH-20030, and DA-18673.
References
Akaike H (1987) Factor analysis and AIC. Psychometrika 52:317–332
Baare WF, Hulshoff Pol HE, Boomsma DI, Posthuma D, De Geus EJ,
Schnack HG, Van Haren NE, van Oel CJ, Kahn RS (2001)
Quantitative genetic modeling of variation in human brain
morphology. Cereb Cortex 11:816–824
Bechger TM, Maris G (2004) Structural equation modeling of
multiple facet data: extending models for multitrait-multimethod
data. Psicologica 25:253–274
Campbell DT, Fiske DW (1959) Convergent and discriminant
validation by the multitrait-multimethod matrix. Psychol Bull
56:81–105
Carmelli D, Swan GE, DeCarli C, Reed T (2002) Quantitative genetic
modeling of regional brain volumes and cognitive performance
in older male twins. Biol Psychol 61:139–155
Behav Genet (2010) 40:114–124 123
123

Carroll SB (2003) Genetics and the making of Homo sapiens. Nature
422:849–857
Chae TH, Walsh CA (2007) Genes that control the size of the cerebral
cortex. In: Bock G, Goode J (eds) Cortical development: genes
and genetic abnormalities. Wiley, Chichester, pp 79–90
Collins DL, Neelin P, Peters TM, Evans AC (1994) Automatic 3D
intersubject registration of MR volumetric data in Standardized
Talairach Space. J Comput Assist Tomogr 18:192–205
Coromina L, Coenders G (2006) Reliability and validity of egocen-
tered network data collected via web—a meta-analysis of
multilevel multitrait, multimethod studies. Soc Netw 28:209–231
Corten IW, Saris WE, Coenders G, van der Veld W, Aalberts CE,
Kornelis C (2002) Fit of different models for multitrait-
multimethod experiments. Struct Equ Model 9:213–232
Darlington RB, Dunlop SA, Finlay BL (1999) Neural development in
metatherian and eutherian mammals: variation and constraint. J
Comp Neurol 411:359–368
Edwards AWF (1972) Likelihood. Cambridge, London
Evans PD, Gilbert SL, Mekel-Bobrov N, Vallender EJ, Anderson JR,
Vaez-Azizi LM, Tishkoff SA, Hudson RR, Lahn BT (2005)
Microcephalin, a gene regulating brain size, continues to evolve
adaptively in humans. Science 309:1717–1720
Finlay BL, Darlington RB (1995) Linked regularities in the devel-
opment and evolution of mammalian brains. Science 268:1578–
1584
Gaitanis JN, Walsh CA (2004) Genetics of disorders of cortical
development. Neuroimaging Clin N Am 14:219–229
Geschwind DH, Miller BL, DeCarli C, Carmelli D (2002) Heritability
of lobar brain volumes in twins supports genetic models of
cerebral laterality and handedness. Proc Natl Acad Sci USA
99:3176–3181
Guerrini R, Marini C (2006) Genetic malformations of cortical
development. Exp Brain Res 173:322–333
Hill RS, Walsh CA (2005) Molecular insights into human brain
evolution. Nature 437:64–67
Ihaka R, Gentleman R (1996) R: a language for data analysis and
graphics. J Comput Graph Statist 299–314
Jenkins TW, Truex RC (1963) Dissection of the human brain as a
method for its fractionation by weight. Anat Rec 147:359–366
Joreskog KG (1971) Statistical analysis of sets of congeneric tests.
Psychometrika 52:101
Kendler KS, Heath AC, Martin NG, Eaves LJ (1987) Symptoms of
anxiety and symptoms of depression—same genes, different
environments. Arch Gen Psychiatry 44:451–457
Mcardle JJ, Goldsmith HH (1990) Alternative common factor models
for multivariate biometric analyses. Behav Genet 20:569–608
Mekel-Bobrov N, Gilbert SL, Evans PD, Vallender EJ, Anderson JR,
Hudson RR, Tishkoff SA, Lahn BT (2005) Ongoing adaptive
evolution of ASPM, a brain size determinant in Homo sapiens.
Science 309:1720–1722
Neale MC, Cardon LR (1992) Methodology for genetic studies of
twins and families. Kluwer, Dordrecht
Neale MC, Boker SM, Xie G, Maes HH (2002) Mx: statistical
modeling. Department of Psychiatry, Medical College of
Virginia, Virginia Commonwealth University, Richmond, VA
Panizzon M, Fennema-Notestine C, Eyler LT, Jernigan TL, Prom-
Wormley E, Neale M, Jacobson K, Lyons MJ, Grant MD, Franz
CE, Xian H, Tsuang M, Fischl B, Seidman LJ, Dale A, Kremen
WS (2009) Distinct genetic influences on cortical surface area
and cortical thickness. Cereb Cortex 19:2728–2735
Pennington BF, Filipek PA, Lefly D, Chhabildas N, Kennedy DN,
Simon JH, Filley CM, Galaburda A, DeFries JC (2000) A twin
MRI study of size variations in human brain. J Cogn Neurosci
12:223–232
Peper J, Schnack H, Brouwer R, van Baal C, van Leeuwen M, Collins
L, Evans A, Boomsma D, Kahn R, Poll HH (2009) Heritability
of brain structure at the onset of puberty: an MRI study in 9-year
old twin-pairs. Human Brain Map 30:2184–2196
Posthuma D, De Geus EJ, Neale MC, Hulshoff Pol HE, Baare WEC,
Kahn RS, Boomsma D (2000) Multivariate genetic analysis of
brain structure in an extended twin design. Behav Genet 30:311–
319
Preuss TM, Caceres M, Oldham MC, Geschwind DH (2004) Human
brain evolution: insights from microarrays. Nat Rev Genet 5:
850–860
R Development Core Team (2005) R: a language and environment for
statistical computing. Vienna, Austria
Rakic P (1995) A small step for the cell, a giant leap for mankind—a
hypothesis of neocortical expansion during evolution. Trends
Neurosci 18:383–388
Rakic P (2009) Evolution of the neocortex: a perspective from
developmental biology. Nat Rev Neurosci 10:724–735
Schmitt JE, Wallace GL, Rosenthal MA, Molloy EA, Ordaz S,
Lenroot R, Clasen LS, Blumenthal J, Kendler KS, Neale MC,
Giedd JN (2007a) A multivariate analysis of neuroanatomic
relationships in a genetically informative pediatric sample.
Neuroimage 35:70–82
Schmitt JE, Eyler LT, Giedd JN, Kremen WS, Kendler KS, Neale MC
(2007b) Review of twin and family studies on neuroanatomic
phenotypes and typical neurodevelopment. Twin Res Hum
Genet 10:683–694
Schmitt JE, Lenroot RK, Wallace GL, Ordaz S, Taylor KN, Kabani
N, Greenstein D, Lerch JP, Kendler KS, Neale MC, Giedd JN
(2008) Identification of genetically mediated cortical networks: a
multivariate study of pediatric twins and siblings. Cereb Cortex
18:1737–1747
Sled JG, Zijdenbos AP, Evans AC (1998) A nonparametric method
for automatic correction of intensity nonuniformity in MRI data.
IEEE Trans Med Imaging 17:87–97
Tomas JM, Hontangas PM, Oliver A (2000) Linear confirmatory
factor models to evaluate multitrait-multimethod matrices: the
effects of number of indicators and correlation among methods.
Multivar Behav Res 35:469–499
Wallace GL, Schmitt JE, Lenroot R, Viding E, Ordaz S, Rosenthal
MA, Molloy EA, Clasen LS, Kendler KS, Neale MC, Giedd JN
(2006) A pediatric twin study of brain morphometry. J Child
Psychol Psychiatry 47:987–993
Wright IC, Sham P, Murray RM, Weinberger DR, Bullmore ET
(2002) Genetic contributions to regional variability in human
brain structure: methods and preliminary results. Neuroimage
17:256–271
Zijdenbos AP, Forghani R, Evans AC (2002) Automatic ‘‘pipeline’’
analysis of 3-D MRI data for clinical trials: application to
multiple sclerosis. IEEE Trans Med Imaging 21:1280–1291
124 Behav Genet (2010) 40:114–124
123
Copyright © 2022 FDOKUMEN