Morphology-Based Automatic Seizure Detector for Intracerebral EEG Recordings
11
IEEE TRANSACTIONS ON BIOMEDICAL ENGINEERING, VOL. 59, NO. 7, JULY 2012 1871 Morphology-Based Automatic Seizure Detector for Intracerebral EEG Recordings R. Yadav, Student Member, IEEE, A. K. Shah, J. A. Loeb, M. N. S. Swamy, Fellow, IEEE, and R. Agarwal ∗ , Member, IEEE Abstract—In this paper, a new seizure detection system aimed at assisting in a rapid review of prolonged intracerebral EEG record- ings is described. It is based on quantifying the sharpness of the waveform, one of the most important electrographic EEG features utilized by experts for an accurate and reliable identification of a seizure. The waveform morphology is characterized by a measure of sharpness as defined by the slope of the half-waves. A train of abnormally sharp waves resulting from subsequent filtering are used to identify seizures. The method was optimized using 145 h of single-channel depth EEG from seven patients, and tested on another 158 h of single-channel depth EEG from another seven patients. Additionally, 725 h of depth EEG from 21 patients was utilized to assess the system performance in a multichannel con- figuration. Single-channel test data resulted in a sensitivity of 87% and a specificity of 71%. The multichannel test data reported a sensitivity of 81% and a specificity of 58.9%. The new system de- tected a wide range of seizure patterns that included rhythmic and nonrhythmic seizures of varying length, including those missed by the experts. We also compare the proposed system with a popular commercial system. Index Terms—Automatic seizure detection, EEG morphology, epilepsy. I. INTRODUCTION E PILEPSY is a common neurological disorder character- ized by unprovoked recurring epileptic seizures. Long- term video electroencephalogram (video EEG) is performed to monitor the occurrence of epileptic seizures [1]. The recordings are reviewed by electroencephalographers (EEGers) to iden- tify the occurrence of seizure events. Visual screening of the Manuscript received July 23, 2011; revised December 18, 2011; accepted February 17, 2012. Date of publication March 12, 2012; date of current version June 20, 2012. This work was supported in part by the Natural Sciences and Engineering Research Council (NSERC) of Canada under Grant A-7739, and in part by the National Institute of Health/National Institute of Neurological Dis- orders and Stoke (NIH/NINDS) under Grant R01NS058802. Asterisk indicates corresponding author. R. Yadav and M. N. S. Swamy are with the Center for Signal Pro- cessing and Communications, Department of Electrical and Computer En- gineering, Concordia University, Montreal, QC H3G 1M8, Canada (e-mail: [email protected]; [email protected]). A. K. Shah is with the Department of Neurology, Wayne State University School of Medicine, Detroit, MI 48201 USA (e-mail: [email protected]). J. A. Loeb is with the Department of Neurology and Center for Molecular Medicine and Genetics, Wayne State University School of Medicine, Detroit, MI 48201 USA (e-mail: [email protected]). ∗ R. Agarwal is with the Center for Signal Processing and Communications, Department of Electrical and Computer Engineering, Concordia University Montreal, QC H3G 1M8, Canada (e-mail: [email protected]). Color versions of one or more of the figures in this paper are available online at http://ieeexplore.ieee.org. Digital Object Identifier 10.1109/TBME.2012.2190601 voluminous EEG is labor intensive, tiresome, and expensive. Therefore, robust automatic seizure detection is needed. Challenges in the automatic seizure detection are due to wide variety of waveform morphologies, high interindividual vari- ability, and similarity of their morphology to normal EEG pat- terns [2]–[4]. Typically, an epileptic seizure presents electro- graphically by a sudden increase in the amplitude, rhythmicity, or frequency [5]. In the literature, most of the existing sys- tems for seizure detection are based on the idea of quantifying EEG into features related to amplitude, rhythmicity, and spectral properties of the EEG [2], [4], [6]–[12]. Features are extracted relative to the background EEG in majority of the systems, which helps in reducing false detections [2], [5], [13], [14]. A large number of seizures contain rhythmic discharges with increasing amplitude and a sustained dominant rhythm. Such epileptiform activities are easily detected by many seizure de- tection methods. However, these methods often fail to detect short-duration seizures or those with nonrhythmic mixed fre- quency characteristics [2], [4], [6], [13], [15], [16]. One common property of all epileptic seizures is the increase in the number of sharp-wave complexes (SWCs) as the seizure progresses. SWCs include sharp transients, sharp waves, and polymorphic epileptogenic waveforms that are distinct from the background EEG [6], [10], [12], [17]–[19]. Gotman [5] introduced an automatic seizure detection tech- nique that decomposes EEG into elementary half-waves (HWs) to extract parameters such as the average amplitude of the HWs (relative to a background), the average duration of the HWs, and coefficient of variation of the duration. An improvement in the detection specificity has been reported in a subsequent study [6] by including a larger temporal context. Several of the seizure de- tection schemes proposed by Gotman et al. [2], [20]–[22] aimed at enhancing the detection performance that included features derived from the HW decomposition. Several other methods that examine the waveform morphology or abnormally sharp activity to detect seizures have been proposed. Wilson et al. [23] pro- posed the Reveal algorithm based upon matching pursuit, small neural network rules and a new connected-object hierarchical clustering algorithm to detect seizures. Navakatikyan et al. [24] proposed a seizure detection algorithm for neonates by exam- ining the heightened regularity, wave intervals, amplitude, and shapes. Deburchgrave et al. [25] presented a seizure detection method for neonates mimicking a human observer. The method combines two algorithms to detect 1) spike-train-like seizures; and 2) oscillatory-type seizures. Similarly, Mitra et al. [3] also proposed a multistage seizure detection scheme for neonates that involved examining various morphological components. 0018-9294/$31.00 © 2012 IEEE
Transcript of Morphology-Based Automatic Seizure Detector for Intracerebral EEG Recordings

IEEE TRANSACTIONS ON BIOMEDICAL ENGINEERING, VOL. 59, NO. 7, JULY 2012 1871
Morphology-Based Automatic Seizure Detector forIntracerebral EEG Recordings
R. Yadav, Student Member, IEEE, A. K. Shah, J. A. Loeb, M. N. S. Swamy, Fellow, IEEE,and R. Agarwal∗, Member, IEEE
Abstract—In this paper, a new seizure detection system aimed atassisting in a rapid review of prolonged intracerebral EEG record-ings is described. It is based on quantifying the sharpness of thewaveform, one of the most important electrographic EEG featuresutilized by experts for an accurate and reliable identification of aseizure. The waveform morphology is characterized by a measureof sharpness as defined by the slope of the half-waves. A train ofabnormally sharp waves resulting from subsequent filtering areused to identify seizures. The method was optimized using 145 hof single-channel depth EEG from seven patients, and tested onanother 158 h of single-channel depth EEG from another sevenpatients. Additionally, 725 h of depth EEG from 21 patients wasutilized to assess the system performance in a multichannel con-figuration. Single-channel test data resulted in a sensitivity of 87%and a specificity of 71%. The multichannel test data reported asensitivity of 81% and a specificity of 58.9%. The new system de-tected a wide range of seizure patterns that included rhythmic andnonrhythmic seizures of varying length, including those missed bythe experts. We also compare the proposed system with a popularcommercial system.
Index Terms—Automatic seizure detection, EEG morphology,epilepsy.
I. INTRODUCTION
E PILEPSY is a common neurological disorder character-ized by unprovoked recurring epileptic seizures. Long-
term video electroencephalogram (video EEG) is performed tomonitor the occurrence of epileptic seizures [1]. The recordingsare reviewed by electroencephalographers (EEGers) to iden-tify the occurrence of seizure events. Visual screening of the
Manuscript received July 23, 2011; revised December 18, 2011; acceptedFebruary 17, 2012. Date of publication March 12, 2012; date of current versionJune 20, 2012. This work was supported in part by the Natural Sciences andEngineering Research Council (NSERC) of Canada under Grant A-7739, and inpart by the National Institute of Health/National Institute of Neurological Dis-orders and Stoke (NIH/NINDS) under Grant R01NS058802. Asterisk indicatescorresponding author.
R. Yadav and M. N. S. Swamy are with the Center for Signal Pro-cessing and Communications, Department of Electrical and Computer En-gineering, Concordia University, Montreal, QC H3G 1M8, Canada (e-mail:[email protected]; [email protected]).
A. K. Shah is with the Department of Neurology, Wayne State UniversitySchool of Medicine, Detroit, MI 48201 USA (e-mail: [email protected]).
J. A. Loeb is with the Department of Neurology and Center for MolecularMedicine and Genetics, Wayne State University School of Medicine, Detroit,MI 48201 USA (e-mail: [email protected]).
∗R. Agarwal is with the Center for Signal Processing and Communications,Department of Electrical and Computer Engineering, Concordia UniversityMontreal, QC H3G 1M8, Canada (e-mail: [email protected]).
Color versions of one or more of the figures in this paper are available onlineat http://ieeexplore.ieee.org.
Digital Object Identifier 10.1109/TBME.2012.2190601
voluminous EEG is labor intensive, tiresome, and expensive.Therefore, robust automatic seizure detection is needed.
Challenges in the automatic seizure detection are due to widevariety of waveform morphologies, high interindividual vari-ability, and similarity of their morphology to normal EEG pat-terns [2]–[4]. Typically, an epileptic seizure presents electro-graphically by a sudden increase in the amplitude, rhythmicity,or frequency [5]. In the literature, most of the existing sys-tems for seizure detection are based on the idea of quantifyingEEG into features related to amplitude, rhythmicity, and spectralproperties of the EEG [2], [4], [6]–[12]. Features are extractedrelative to the background EEG in majority of the systems,which helps in reducing false detections [2], [5], [13], [14].
A large number of seizures contain rhythmic discharges withincreasing amplitude and a sustained dominant rhythm. Suchepileptiform activities are easily detected by many seizure de-tection methods. However, these methods often fail to detectshort-duration seizures or those with nonrhythmic mixed fre-quency characteristics [2], [4], [6], [13], [15], [16]. One commonproperty of all epileptic seizures is the increase in the numberof sharp-wave complexes (SWCs) as the seizure progresses.SWCs include sharp transients, sharp waves, and polymorphicepileptogenic waveforms that are distinct from the backgroundEEG [6], [10], [12], [17]–[19].
Gotman [5] introduced an automatic seizure detection tech-nique that decomposes EEG into elementary half-waves (HWs)to extract parameters such as the average amplitude of the HWs(relative to a background), the average duration of the HWs, andcoefficient of variation of the duration. An improvement in thedetection specificity has been reported in a subsequent study [6]by including a larger temporal context. Several of the seizure de-tection schemes proposed by Gotman et al. [2], [20]–[22] aimedat enhancing the detection performance that included featuresderived from the HW decomposition. Several other methods thatexamine the waveform morphology or abnormally sharp activityto detect seizures have been proposed. Wilson et al. [23] pro-posed the Reveal algorithm based upon matching pursuit, smallneural network rules and a new connected-object hierarchicalclustering algorithm to detect seizures. Navakatikyan et al. [24]proposed a seizure detection algorithm for neonates by exam-ining the heightened regularity, wave intervals, amplitude, andshapes. Deburchgrave et al. [25] presented a seizure detectionmethod for neonates mimicking a human observer. The methodcombines two algorithms to detect 1) spike-train-like seizures;and 2) oscillatory-type seizures. Similarly, Mitra et al. [3] alsoproposed a multistage seizure detection scheme for neonatesthat involved examining various morphological components.
0018-9294/$31.00 © 2012 IEEE

1872 IEEE TRANSACTIONS ON BIOMEDICAL ENGINEERING, VOL. 59, NO. 7, JULY 2012
Aarabi et al. [13] presented a fuzzy rule-based seizure detectionsystem for intracranial EEG utilizing four features: average am-plitude, coefficient of variation of amplitude, entropy, and dom-inant frequency. Kelly et al. [26] proposed the IdentEventseizure detection method for scalp EEG employing three de-scriptors: pattern-match regularity statistic, local maximum fre-quency, and amplitude variation. More recently, Majumdar andVardhan [27] have introduced a differential windowed variance-based technique that examines abnormally sharp activity to de-tect seizures.
We present a novel approach to detect seizures by quanti-fying EEG waveform morphology by a single feature, i.e., thesharpness of the HWs. The EEGs (145 h) of seven patients wereused to optimize the proposed system in single-channel config-uration. Preliminary results on these training data are describedin [12], and yielded 100% sensitivity and a specificity of 91.2%.Seven new patient data (158.8 h) from the same database wereutilized to further test the system performance. The new systemis further validated in multichannel configuration using 725 h ofintracerebral EEG recordings (previously unseen by the method)from another database. A popular seizure detection method forintracerebral EEG recordings (Grewal–Gotman system [2]) wasused for comparison in the same test dataset.
This paper is outlined as follows. The proposed system isdescribed in Section II. Results obtained from the test data, andthe comparison to the Grewal–Gotman system [2] are providedin Section III and discussed in Section IV. Conclusions andfurther work are provided in Section V.
II. METHOD
A. Data Selection
In this study, two different sets of intracerebral EEG databasesare used. The first set is referred to as the MNI database, whereasthe second set as the FSP database.
The MNI database consists of intracerebral EEG data ac-quired with the Harmonie System (Stellate System, Inc., Mon-treal, Canada) from the Epilepsy Telemetry Unit at the MontrealNeurological Institute and Hospital (MNI/MNH). The databasecontains deidentified data from 15 patients that were initiallyused for another study [2]. One patient data were rejected be-cause it was not possible to define unambiguous onset and theend of seizure. Thus, data from 14 patients consisting of 304h of EEG constituted the MNI database. The data were filteredbetween 0.5 and 70 Hz prior to digitization at the sampling rateof 200 Hz. All patients had stainless steel nine contact depthEEG electrodes that were surgically placed inside the brain withcontacts located 5 mm apart. Some patients also had epiduralpeg electrodes that were typically labeled using the letter “E.”Depth electrodes were most commonly placed in the amygdala,hippocampus, frontal, or occipital lobes labeled as “AM,” “H,”“F,” and “O” with deepest contact labeled as 1. Normally, elec-trodes placed in the left and right hemispheres were labeled witheither “L” or “R”; for example, an electrode in the left amyg-dala was labeled LAM [28]. There was no prescreening of thepatients other than the requirement that they had at least threeelectrographic seizures during the monitoring sessions. For each
patient, five sections representing EEG activity in different brainstates, approximately 4–7 h each, were extracted in a way suchthat the three sections had at least one seizure each, one sectionduring wakefulness without seizures, and one section withoutseizures during sleep. We believe that these sections are suf-ficiently large to represent continuous EEG and, therefore, todevelop and test a new detection scheme. Prior to sectioning,a trained EEG specialist scored all data for seizures in bipolarmontage using their normal clinical judgement. A more detaileddescription of the MNI database can be found in [2].
The FSP database that is publicly available comes from theFreiburg seizure prediction database [29]. The database containsrecordings of 21 patients suffering from medically intractablefocal epilepsy, who underwent invasive presurgical epilepsymonitoring at the Epilepsy Center of the University Hospitalof Freiburg, Germany. The EEG data were acquired using theNeurofile NT digital video-EEG system with 128 channels, 256-Hz sampling rate, and a 16-bit analog-to-digital converter, fromdepth, grid, and strip electrodes surgically inserted inside thebrain or placed on the cortex of the patients. Six contacts fromeach recording were selected by visual inspection of the raw databy the EEGer. Three contacts were selected from the seizureonset zone, specifically from the areas involved in early ictalactivity. The remaining three electrode contacts were selectedas not involved or involved last in the seizure spread [29]. A de-tailed description of the FSP database can be found in [13], [27],and [29].
FSP data were filtered using a fifth-order digital Butterworthbandpass filter between 0.5 and 70 Hz with a notch filter at50 Hz to remove power line noise. Four bipolar channels wereconstructed by subtracting the signals of consecutive contacts,two for the epileptogenic zone and two for the associated remotelocations [13]. The four channel bipolar EEG data in the FSPdatabase were converted to European data format (EDF) usingfreely available BioSig toolbox [30]. Subsequently, the con-verted EDF files were imported into Harmonie 6.2e software(Stellate Systems Inc., Montreal, Canada).
The majority of seizure detection schemes in the literature aremultichannel detection techniques in which the core detectionstrategy is based on the single-channel detections that are subse-quently combined in some spatio-temporal context to make thefinal multichannel detection [2], [13]. These methods requirethe detections to occur in at least two or more channels to im-prove detection specificity. Clearly, this becomes problematicfor focal seizures, i.e., seizure activity occurring only in a singlechannel. In our initial assessment of the MNI database, we ob-served that some seizures are present only in a single channel.Therefore, we too considered our core detection strategy to bebased on a single channel. In practice, however, the detectionwould be done on all channels in the multichannel recording.The resulting detections on each of the channels within 30 s canbe grouped to make a final multichannel detection. The efficacyof the proposed method to detect seizures on single as well ason the multichannel configuration is illustrated by consideringsingle-channel analysis of the MNI database and multichannelanalysis of the FSP database. In multichannel settings, detec-tions made either on a single channel or on multiple channels

YADAV et al.: MORPHOLOGY-BASED AUTOMATIC SEIZURE DETECTOR FOR INTRACEREBRAL EEG RECORDINGS 1873
are grouped to make a final multichannel detection. We do notimpose the involvement of a minimum number of channels fora final detection. The advantage of this detection strategy is inits ability to detect focal, multifocal, and generalized seizures.Generally, this is how an EEGer would be scoring the data intheir routine EEG review.
We selected a single channel in which seizure is visuallyclearest or obvious in the first seizure section of each patientof the MNI database. The same channel is considered for theanalysis of rest of the data for each patient. The seven patientsin the training dataset (randomly selected) had 58 seizures inapproximately 145 h of single-channel EEG. The remainingseven patients (test data) of the MNI database had 42 seizures inapproximately 158 h of single-channel EEG. In contrast, com-plete FSP database in multichannel configuration is consideredas part of the test data. A certified EEGer at the Epilepsy Cen-ter of the University Hospital of Freiburg, Germany, scored theFSP database in accordance with the criteria used in their rou-tine clinical EEG review. The EEGer examined only the sectionscorresponding to the clinical seizure and scored electrographicchanges in the data. Subclinical seizures, if any, in the datawere, therefore, not marked. The database consists of 87 clin-ical seizures in 725 h of multichannel EEG. Using both theMNI and FSP databases, we also evaluated and compared theperformance of our system against that of the Grewal–Gotmansystem. None of the EEG recordings in the test dataset was usedin the algorithm development or the parameter training process.
B. Seizure Detection System
Our seizure detection system consists of three main steps: pre-processing, feature extraction, and classification. The first step(preprocessing) identifies and rejects the presence of artifact andnoise that may affect the detection specificity. The second step(feature extraction) computes a feature that quantifies the EEGwaveform sharpness in a 0.5-s nonoverlapping sliding window.The third step identifies the presence of seizure-like activitiesin individual channels. For the multichannel implementation,individual detections are combined to make a multichannel de-tection.
1) Preprocessing: The preprocessing block screens each0.5-s epoch for contamination by high-amplitude artifacts [2],[13]. It is one of the common types of artifacts that causes falsedetections, and often originates as an abrupt change in the EEGamplitude due to patient or electrode movement. Typically, in-tracerebral EEG is observed to be within ±2500 μV; therefore,an epoch contaminated by high-amplitude artifact can be easilyidentified [2], [13]. The epochs in which the EEG amplitudeexceeds ±2500 μV are excluded from the analysis. The prepro-cessed data are utilized to compute the EEG feature as describednext.
2) Feature Extraction: According to the widely accepteddefinition of epileptic seizure, during an epileptic seizure, anew type of EEG rhythm appears, hesitantly, and then more dis-tinctly, and soon it boldly dominates the EEG tracing. It tends tobecome slower with increasing amplitude and the more distinctspiky phases of the rhythmical waves appear [1]. A large pro-
Fig. 1. Illustration of gradually increasing number of sharp components in-cluding SWCs and spike-like activities as the seizure evolves. The number ofsharp components prior to seizure onset is nonexistent compared to postonset.
portion of electrographic ictal activity follows this definition.Existing systems for seizure detection aim to quantify this sud-den increase in the amplitude or rhythmicity via one or moremathematical descriptors to detect seizures.
It is well known that the morphology of the EEG patternassociated with seizure varies from patient-to-patient and withage [1]. In a recent study, based on the EEG morphology, seizurepatterns are broadly categorized as pseudosinusoidal dischargesand discharges with spike or sharp components [3], [18]. Epilep-tic seizure generally presents itself in the EEG with increasedsharp-wave-like activity as the seizure evolves [1], [12], [27].Fig. 1 illustrates the evolution of an epileptic seizure in thecontext of SWCs as the seizure progresses. Identification ofseizures may be possible by quantifying these SWCs, whichcan be characterized by sharp half-waves (SHWs). To do so, thepreprocessed EEG is decomposed into the HWs. Sharpness ofthe HWs is estimated by the slope of the best-fit straight line inthe least-squares sense [7]. The sharpness feature is extractedfor each HW and further processed in 0.5-s epochs.
a) HW decomposition: An HW is defined as the segmentof EEG located between two adjacent extrema (i.e., a minimumand a maximum). The extrema are detected as a change in thesign of the slope, which we measure as the difference betweentwo adjacent samples [5], [7]. To reduce the effect of smallfluctuations due to noise and artifacts, HWs less than 15 ms(three samples) in duration are ignored.
b) Sharpness of the HWs: Each HW is characterized byits sharpness feature, which is defined as the slope (m) of thebest-fit straight line of each HW. Since the slope is a function ofboth the amplitude and the duration (frequency) of the HW, thesharpness feature is highly sensitive to both of these properties.Some approaches in the literature have utilized the HW peak-to-peak amplitude and their duration as features for detection ofepileptiform EEG [5], [7]. In the same spirit, we incorporate anew approach to detect epileptic seizures using this sharpnessfeature [12].
3) Classification: The sharpness (m) of the HW character-izes the EEG waveform morphology in a coarse sense whichis utilized to characterize epileptic and normal EEG [1], [5],[7], [10], [12]. During an epileptic seizure, there is a persistentincrease in the number of SHWs. In contrast, in a nonseizureEEG, there are occasional sporadically occurring SHWs withno persistence. The latter can sometime lead to increased falsedetections. To minimize the false detections due to occasionalSHWs, we incorporate two filters: 1) an activation function and2) an order-statistics filter.

1874 IEEE TRANSACTIONS ON BIOMEDICAL ENGINEERING, VOL. 59, NO. 7, JULY 2012
An activation function (scaled heaviside step function [31])limits HWs to a minimum sharpness and is given by
g(n) ={
m for m ≥ mth
0 otherwise(1)
where mth is the threshold to identify candidate SHWs.Sharp transients in the EEG may satisfy conditions of the
activation function. To remove such events, we incorporate amedian filter as a second layer [15], [32], [33].
The median filter is defined as follows. To compute the outputof a median filter, an odd number of sample values are ranked(sorted numerically) and the middle value is used as the filteroutput. For a filter of window length (L = 2k + 1), the filteringprocedure for the input SHW sequences is given by
G(n) = med[g(n − k), . . . , g(n), . . . , g(n + k)] (2)
where g(n) and G(n) are the input values and the output of thewindow centered at the nth value, respectively, and “med” de-notes the median value. Equation (2) represents a nonrecursivemedian filter [34], [35]. Computational cost can be improvedby employing a recursive median filter that replaces the cen-ter point g(n) of the window by the median value of all thepoints inside it, and uses these values to calculate the median inthe subsequent window positions. The output of the recursivemedian filter [34] is given by
G(n) = med[G(n − k), . . . , G(n), g(n), . . . , g(n + k)] (3)
which replaces at every step, the leftmost k points in the movingwindow with the previous k output points [36], [37]. Recursivemedian filter is considered in this paper. The filter length L isempirically determined considering the low-frequency seizureactivity. We hypothesized that each 0.5-s epoch will have at leastone abnormally sharp activity, and therefore, a total of 12 in 6 s.We round this number to 15 for robustness due to potentialinfluence by noise.
An added advantage of this layer is that it preserves the contin-ual increase of the SHWs as the seizure evolves. Fig. 2 illustratesthe process of quantifying SWCs using HWs. In this example, a10-s section of epileptic seizure is shown in Fig. 2(a), and best-fitstraight lines for each HW are shown in Fig. 2(b). The sharp-ness measure (m) of the HWs that satisfies the requirement forSHWs is shown by the bar plot in Fig. 2(c). G(n) clearly revealsthe absence of SHWs prior to seizure onset, while during thepostonset there is a sudden increase in the number of SHWs [seeFig. 2(d)].
Receiver operator characteristic (ROC) curve is utilized todetermine the default value of mth (see Fig. 3) using the sevenpatient training data from the MNI database. Sensitivity andfalse detection rate (FDR) are computed for different values ofm to create the ROC curve. The value of m corresponding to theknee of the ROC curve is selected as the default threshold mthas shown in Fig. 3 (refer to [12] for more details). Subsequently,mth is employed to evaluate the performance in all the testdataset. Note that the default value of mth is not adjusted forany patient in the presented results using the test dataset.
In this study, we define a sustained discharge of SHWs (G(n)exceeding mth ) for at least 6 s as an electrographic seizure. The
Fig. 2. Epileptic seizure detected by the proposed method [12]. (a) 10 s of thedetected seizure event. (b) HWs modeled by the best-fit straight line. (c) Barplot of g(n), where g(n) is the output of the activation function that retainsSHWs. (D) Median filtered g(n). The parameter m represents the slope of thebest-fit line.
Fig. 3. ROC analysis. mth in the proposed system is varied from 5 to 50and detection threshold of the Grewal–Gotman system is varied from 1 to 10.Average sensitivity and FDR are computed on the seven patient training datasetto generate the ROC curve. The default thresholds to be used with testing dataare shown encircled.
number of SHWs in any epoch depends on the morphology andrhythm of the SWC. That is, an epoch may contain a single or aburst of SHWs. Therefore, in order to make a seizure detection,12 consecutive 0.5-s epochs must contain at least one SHW(HWs greater than mth in the time series G). Such a stringentdetection criterion may not be fulfilled in cases where thereare short pauses in the seizures. Therefore, instead of persistentdetection of the SHW in continuous 6 s blocks, the criterion isrelaxed to a minimum of 10 within 12 consecutive 0.5 s epochs(6 s). Final detection is made by counting epochs with SHWs.
C. Performance Evaluation
As described earlier, the performance of the proposed seizuredetection system is assessed using two databases. We usedsingle-channel EEG analysis for the MNI database and multi-channel analysis for the FSP database. Ambiguity in the manualmarking of a seizure onset and end is addressed by extendingthe onset and the end of seizures by 15 s [2], [13], [26]. Fur-thermore, prior to any performance evaluation, all automaticdetections that are within 30 s of one another are clusteredas a single-seizure event. An event detected by the proposedalgorithm is considered a good detection if there is an over-lap with a manually scored event; otherwise, it is considered afalse detection. The performance of the proposed system is also

YADAV et al.: MORPHOLOGY-BASED AUTOMATIC SEIZURE DETECTOR FOR INTRACEREBRAL EEG RECORDINGS 1875
compared to the Grewal–Gotman system in the same datasetwith the same rules. Note that the Grewal–Gotman system isspecifically designed for intracerebral EEG recordings and isavailable in commercial EEG systems. To the best of our bestknowledge, it is also a popular EEG review system in many clin-ical sites. Therefore, we considered it to be a suitable system forperformance comparison.
The Grewal–Gotman system requires a minimum of threechannels to make detections. Therefore, the channel of interestand two adjacent channels were considered in single-channel as-sessment of the MNI database. Events identified by the Grewal–Gotman system on any of these three selected channels are con-sidered a detection. Prior to performance evaluation, detectionswithin 30 s were also grouped as was done for the proposedsystem. The default threshold (= 3) for the system is obtainedfrom ROC analysis as was done for the proposed system (seeFig. 3).
The performance is assessed with the following two mea-sures, which are most commonly used in the seizure detectionliterature: sensitivity and specificity. Sensitivity is defined asthe percentage of true seizure events detected by the algorithm.Specificity is defined as the percentage of seizure events de-tected by the algorithm that are true positives [2], [38]. It isalso reported in terms of FDR, which is the number of false de-tections over time. In the seizure detection literature, FDR andspecificity are often used synonymously. Note that our definitionof the term “specificity” is also known as the positive predictivevalue or accuracy in diagnostic testing [6], [23], [38], [39]. Thedetection delay is not reported because of the unavailability ofexact seizure onset time, which is important for methods thatare employed as early seizure warning (alarming).
It is important to understand that in the original scoring of theelectrographic seizures in the FSP database, only the sectionscorresponding to clinical seizures were assessed. It is entirelypossible that there may be seizures present in parts of EEG with-out clinical component. These events would not be included inthe manual marking. A possible cause for an increase in theFDR could be due to the detection of these unmarked sub-clinical seizures, which warrants studying the characteristics offalse detections. To evaluate these false detections, two board-certified EEGers (authors AKS and JAL) reclassified these eventsinto three categories (Assessment I): seizure-like (SL) activity,interesting events (IE), and false detections (FDs). Seizure-likeactivity is defined as those FDs that a certified EEGer wouldconsider to be clearly seizures in his/her routine assessment.Similarly, false detections are those events that clearly are non-seizure. Interesting events are defined as those events that do notclearly belong to either of the two aforementioned categories.However, they may contain some seizure-like characteristic dis-charges of mixed frequency activity, sharp transients, spike,and wave paroxysms that the EEGer finds interesting. The twoEEGers used these general guidelines and assessed all the FDsinto one of the three categories according to their opinion asexperts. Using this Assessment I reclassification of the FDs, wereanalyze the overall performance.
It is well accepted that when a seizure is clear, the agreementbetween EEGers is quite high. Similarly, when it is clearly a non-
TABLE ISINGLE-CHANNEL EVALUATION OF THE MNI DATABASE: (a) TRAINING DATA
(b) TEST DATA
seizure, the agreement is again generally good. Events that fallinto the unclear category often cause the highest disagreement.We decided to further assess the performance (Assessment II)by combining the SL and IE categories into a single-group SL.We wanted to understand whether there was in fact a discor-dance on how the experts labeled seizure-like and interestingevents.
The subjective component involved in the manual analysis ofthe EEG often leads to disagreement between the EEG review-ers. Therefore, the interreviewer variability given by Cohen’sκ between the EEGers is computed to assess the agreementbetween the reviewers. We use κ statistics to determine the in-terobserver agreement (po ) for the proportion of random agree-ment (pe ): κ = (po − pe)/(1 − pe). If both the EEGers are incomplete agreement, then κ = 1. If there is no agreement otherthan what would be expected by chance, then κ ≤ 0 [26], [40].
III. RESULTS
The automatic detection results for our method and the com-parison Grewal–Gotman method in the MNI test database areshown in Table I, and for the FSP database in Table II. In the MNItraining dataset [see Table I (a)], the proposed system resultedin 100% sensitivity and a specificity of 91.2%, whereas theGrewal–Gotman system had an average sensitivity of 85.5% anda specificity of 51.5%. In the MNI test dataset [see Table I (b)],the proposed system resulted in an average sensitivity of 86.7%and a specificity of 71.3%, whereas the Grewal–Gotman sys-tem resulted in an average sensitivity of 90.2% and a specificityof 40.5%. The proposed system has an overall improvement of30.8% in the specificity against the Grewal–Gotman system inthe MNI test data.
In the multichannel FSP database, the proposed system re-sulted in an average sensitivity of 81% and a specificity of58.8%, whereas the Grewal–Gotman system reported an aver-age sensitivity of 65.6% and a specificity of 57.7%. For this
1876 IEEE TRANSACTIONS ON BIOMEDICAL ENGINEERING, VOL. 59, NO. 7, JULY 2012
TABLE IIMULTICHANNEL EVALUATION OF THE FSP DATABASE
TABLE IIIREASSESSMENT OF FALSE DETECTIONS IN THE FSP DATABASE
database, the performance shows an overall improvement in thesensitivity by 15.4% with similar specificity results over theGrewal–Gotman system.
The specificity after reclassification of the false detectionsby the two experienced board-certified EEGers is shown inTable III. Assessment I resulted in an overall specificity of 74.7%and 67.7% for the proposed system and 69% and 64.7% for theGrewal–Gotman system. An improvement in the specificity isobserved for both the methods. The proposed system improvedthe specificity by 15.8% and 8.8% according to the two EEGers.Similarly, the specificity improved in the Grewal–Gotman sys-tem by 11.3% and 7%. Both the methods reported additionalimprovement in the specificity based on Assessment II of thefalse detections as shown in Table III.
A moderate agreement between the two EEGers is achieved(κ = 0.43) on classifying the false detections into three cat-egories (SL, IE, and FD). However, the agreement is quitesubstantial (κ = 0.81) between the EEGers in Assessment IIcategorization.
The nonparametric Wilcoxon signed-rank test (95% con-fidence interval) was performed using the CoStat (ver 6.4,http://www.cohort.com) for statistical significance in terms ofthe sensitivity and specificity for the two methods. The Wilcoxonsigned-rank test indicates statistically significant sensitivity(with ap-value of 0.01) and specificity (Assessment I with a
p-value of 0.01) over the Grewal–Gotman system in the FSPdatabase, but not in the MNI database.
IV. DISCUSSIONS
The purpose of this study was to develop an automatic seizuredetection system for clinical use in the review of long-termintracerebral EEG recordings. The overall goal was to design asystem that detects a wide variety of seizure patterns with highsensitivity and high specificity (low FDR).
A. Sensitivity
The proposed system detected at least one seizure in all pa-tients, with an overall sensitivity of 86.7% for the MNI databaseand 81% for the FSP database using the default threshold (ob-tained using separate training dataset). The detected seizuresconsisted of a wide variety of patterns in the frequency rangeof 0.5–70 Hz that included focal seizures (seizure occurringonly in a single channel), rhythmic as well as seizures of mixedcharacteristics (nonrhythmic, discharge of spikes, and SWCs).The proposed system yielded similar sensitivity in single andmultichannel configurations [see Fig. 4(a)]. In the FSP database,our system yielded approximately a 15% improvement in thesensitivity over the Grewal–Gotman system, while in the MNItest data, both systems reported nearly the same sensitivity [seeFig. 4(a)].
The Grewal–Gotman system, however, had difficulties in de-tecting seizures that were present in a single channel, seizuresthat were of short duration, slow evolving, and nonrhythmicseizures (discharge of SWCs and spikes). Examples of focalseizures missed by the Grewal–Gotman system that were de-tected by our system in the MNI database are shown in Fig. 5.The missed event in Fig. 5(a) is a short (<15 s) seizure (chan-nel: LH1–LH3), while missed event in Fig. 5(b) contains a long(>30 s) seizure (channel: RH1–RH3).
An example of good detection is shown in Fig. 6 and anexample of seizure missed by both the systems in the FSPdatabase is shown in Fig. 7. The EEGer identified this electro-graphic seizure because of the associated clinical component.The missed seizure is about 27 s in duration with subtle changesin the EEG amplitude and ending with low-frequency complexes(<1 Hz). The seizure does not contain a sufficiently large num-ber of sharp complexes. It is most likely to be missed even byexperts in the absence of clinical component. Generally, boththe methods failed to detect such types of seizures. It is observedthat seizures without abnormally sharp activity are difficult todetect by the proposed system.
B. Specificity
In the MNI database, using the default detection threshold,our system had an average specificity of 91.2% in the trainingdata [12] and 71.3% in the test data. A specificity of 58.9%is obtained on the FSP database. The specificity in the FSPdatabase is poor compared to that in the MNI database, whichindicates a higher FDR. It is possible that some of these falsedetections may in fact be subclinical seizures that were not

YADAV et al.: MORPHOLOGY-BASED AUTOMATIC SEIZURE DETECTOR FOR INTRACEREBRAL EEG RECORDINGS 1877
Fig. 4. (a) Sensitivity and (b) specificity of the proposed and Grewal–Gotman system in the MNI and FSP databases. Error bars represent standard errors.Specificity results for the FSP database are after reclassification of false detections using Assessment I technique by the EEGers JAL and AKS, respectively.
Fig. 5. Missed events by the Grewal–Gotman system in (a) Patient 1 (channel:LH1–LH3) belonging to the MNI training dataset, and (b) Patient 2 (channel:RH1–RH3) belonging to the MNI test dataset. These events were detected bythe proposed system.
Fig. 6. Good detection in Patient 7 of the FSP database. EEG (30 s) containinga seizure that was detected by both systems. Vertical line represents the detectiontime.
identified by the EEGer in the original review of this data.Reevaluating these false detections provides more insight intothe detection performance.
In the MNI database, two patients (Patients 2 and 4) had asignificantly large number of false detections. In both cases, ma-jority of these false detections occurred in the seizure sections ofthe recordings (see the data description in Section II). The falsedetections included discharge of SWCs (∼ 5 s), low-amplitudefast activity, or were due to bursts of sharp transients in addi-tion to high-amplitude artifacts (see Fig. 8). A large proportion
Fig. 7. Missed event in Patient 5 of the FSP database. EEG (30 s) that wasmissed by both systems.
Fig. 8. False detections made by our system in the MNI test dataset. (a) Falsedetection in Patient 2 (channels: RH1–RH3), which represents low-amplitudefast activity. (b) False detection in Patient 4 (channel: RH1-RH3), which repre-sents burst of high-amplitude SWCs.
of false detections occurred several seconds to several minutesbefore the seizure onset. A recent study by Marsh et al. [41]demonstrated the role of interictal epileptic discharge (IEDs)for improved localization of seizure focus in children with in-tractable epilepsy. The authors report that electrodes with high-est frequency of IEDs over long periods of intracranial EEGcorrelate with the electrodes involved in the seizure onset inabout two-thirds of patients [41]. Furthermore, IEDs are usedclinically in a variety of ways to help identify the regions ofsurgical resection [42]. Several other studies, using long-termdepth EEG, report that in addition to resection of the seizure
1878 IEEE TRANSACTIONS ON BIOMEDICAL ENGINEERING, VOL. 59, NO. 7, JULY 2012
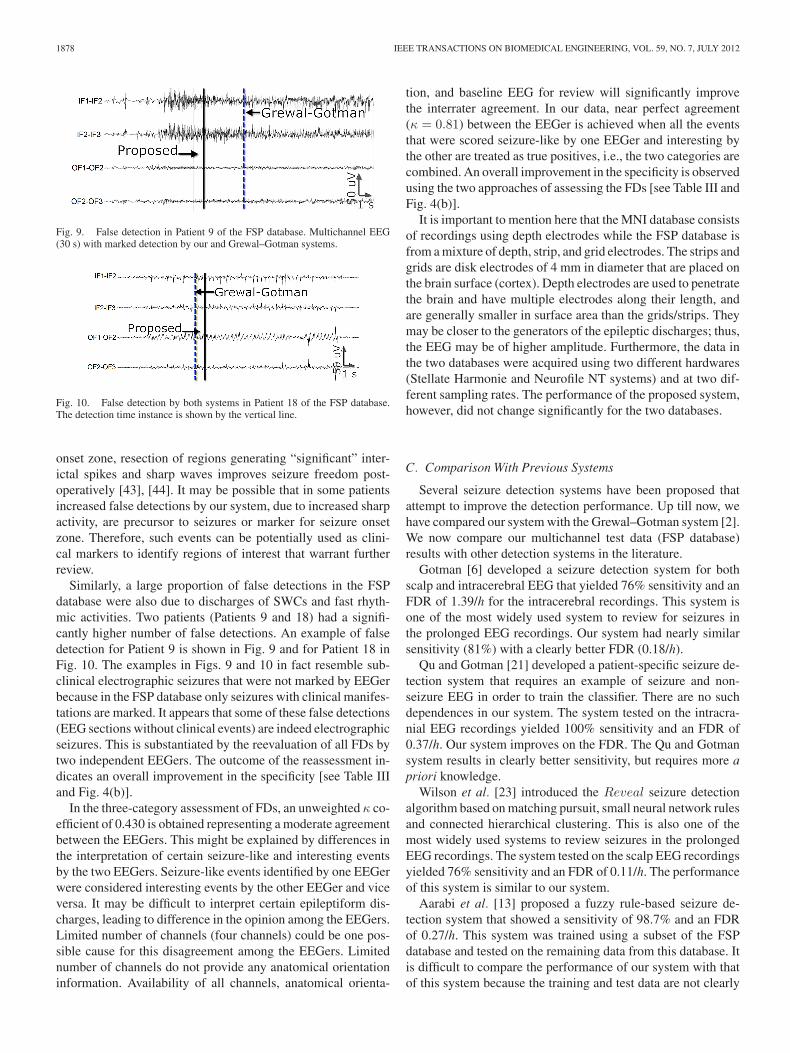
Fig. 9. False detection in Patient 9 of the FSP database. Multichannel EEG(30 s) with marked detection by our and Grewal–Gotman systems.
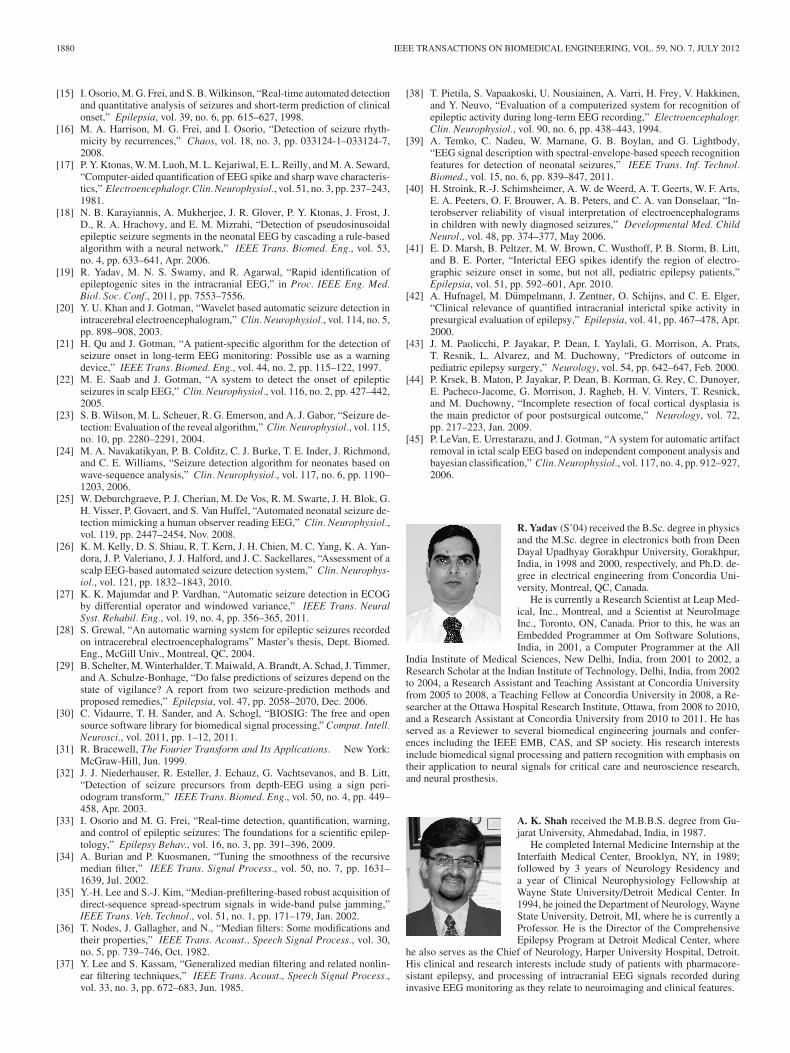
Fig. 10. False detection by both systems in Patient 18 of the FSP database.The detection time instance is shown by the vertical line.
onset zone, resection of regions generating “significant” inter-ictal spikes and sharp waves improves seizure freedom post-operatively [43], [44]. It may be possible that in some patientsincreased false detections by our system, due to increased sharpactivity, are precursor to seizures or marker for seizure onsetzone. Therefore, such events can be potentially used as clini-cal markers to identify regions of interest that warrant furtherreview.
Similarly, a large proportion of false detections in the FSPdatabase were also due to discharges of SWCs and fast rhyth-mic activities. Two patients (Patients 9 and 18) had a signifi-cantly higher number of false detections. An example of falsedetection for Patient 9 is shown in Fig. 9 and for Patient 18 inFig. 10. The examples in Figs. 9 and 10 in fact resemble sub-clinical electrographic seizures that were not marked by EEGerbecause in the FSP database only seizures with clinical manifes-tations are marked. It appears that some of these false detections(EEG sections without clinical events) are indeed electrographicseizures. This is substantiated by the reevaluation of all FDs bytwo independent EEGers. The outcome of the reassessment in-dicates an overall improvement in the specificity [see Table IIIand Fig. 4(b)].
In the three-category assessment of FDs, an unweighted κ co-efficient of 0.430 is obtained representing a moderate agreementbetween the EEGers. This might be explained by differences inthe interpretation of certain seizure-like and interesting eventsby the two EEGers. Seizure-like events identified by one EEGerwere considered interesting events by the other EEGer and viceversa. It may be difficult to interpret certain epileptiform dis-charges, leading to difference in the opinion among the EEGers.Limited number of channels (four channels) could be one pos-sible cause for this disagreement among the EEGers. Limitednumber of channels do not provide any anatomical orientationinformation. Availability of all channels, anatomical orienta-
tion, and baseline EEG for review will significantly improvethe interrater agreement. In our data, near perfect agreement(κ = 0.81) between the EEGer is achieved when all the eventsthat were scored seizure-like by one EEGer and interesting bythe other are treated as true positives, i.e., the two categories arecombined. An overall improvement in the specificity is observedusing the two approaches of assessing the FDs [see Table III andFig. 4(b)].
It is important to mention here that the MNI database consistsof recordings using depth electrodes while the FSP database isfrom a mixture of depth, strip, and grid electrodes. The strips andgrids are disk electrodes of 4 mm in diameter that are placed onthe brain surface (cortex). Depth electrodes are used to penetratethe brain and have multiple electrodes along their length, andare generally smaller in surface area than the grids/strips. Theymay be closer to the generators of the epileptic discharges; thus,the EEG may be of higher amplitude. Furthermore, the data inthe two databases were acquired using two different hardwares(Stellate Harmonie and Neurofile NT systems) and at two dif-ferent sampling rates. The performance of the proposed system,however, did not change significantly for the two databases.
C. Comparison With Previous Systems
Several seizure detection systems have been proposed thatattempt to improve the detection performance. Up till now, wehave compared our system with the Grewal–Gotman system [2].We now compare our multichannel test data (FSP database)results with other detection systems in the literature.
Gotman [6] developed a seizure detection system for bothscalp and intracerebral EEG that yielded 76% sensitivity and anFDR of 1.39/h for the intracerebral recordings. This system isone of the most widely used system to review for seizures inthe prolonged EEG recordings. Our system had nearly similarsensitivity (81%) with a clearly better FDR (0.18/h).
Qu and Gotman [21] developed a patient-specific seizure de-tection system that requires an example of seizure and non-seizure EEG in order to train the classifier. There are no suchdependences in our system. The system tested on the intracra-nial EEG recordings yielded 100% sensitivity and an FDR of0.37/h. Our system improves on the FDR. The Qu and Gotmansystem results in clearly better sensitivity, but requires more apriori knowledge.
Wilson et al. [23] introduced the Reveal seizure detectionalgorithm based on matching pursuit, small neural network rulesand connected hierarchical clustering. This is also one of themost widely used systems to review seizures in the prolongedEEG recordings. The system tested on the scalp EEG recordingsyielded 76% sensitivity and an FDR of 0.11/h. The performanceof this system is similar to our system.
Aarabi et al. [13] proposed a fuzzy rule-based seizure de-tection system that showed a sensitivity of 98.7% and an FDRof 0.27/h. This system was trained using a subset of the FSPdatabase and tested on the remaining data from this database. Itis difficult to compare the performance of our system with thatof this system because the training and test data are not clearly

YADAV et al.: MORPHOLOGY-BASED AUTOMATIC SEIZURE DETECTOR FOR INTRACEREBRAL EEG RECORDINGS 1879
defined. However, it must be noted that this system did not detectunmarked subclinical seizures that our system detected.
Kelly et al. [26] introduced the IdentEvent seizure detec-tion method for offline analysis of scalp EEG recording utilizingthree descriptors, pattern-match regularity statistic, local maxi-mum frequency, and amplitude variation. The method recorded79.5% sensitivity and an FDR of 0.08/h. Our system also re-ports a similar performance. However, it must be noted thatIdentEvent is designed for scalp EEG while our method is de-signed for intracranial recordings.
Majumdar and Vardhan [27] have recently proposed a seizuredetection system that is based on a differential operator andwindowed variance that yielded 91.5% sensitivity and an FDRof 0.12/h on 15 patients of the FSP database. It is interestingto note that the method quantifies abnormally sharp activitiesto make a seizure detection similar to that in our method, butusing different features. This method, however, processes thedata in a 15-s sliding window while we process the data in 0.5-sepoch. It is difficult to compare the performance of our systemwith that of this system, since the authors in [27] exclude sixpatients on which their method did not perform satisfactorily.This system also did not detect unmarked subclinical seizuresthat our system detected.
D. Computation Performance
Running our system on MATLAB 2008b (MathWorks Inc.)on a laptop with Intel dual core 1.8 GHz processor, 3 GB RAM,having the 32-bit Microsoft Windows 7 operating system, oursystem processed the 24-h four-channel EEG in approximately30 min. Computational performance of our system can be signif-icantly enhanced by developing a standalone version in C/C++.In addition, running on systems with faster processors with mul-tiple cores can further reduce the computation time. The per-formance and computational speed suggests that the proposedmethod can be clinically useful in the review of long-term EEGrecordings.
E. Limitations and Future Improvement
As with other systems, a large number of false events may bedetected by our system in the presence of discharges of SWCs,spikes, high-amplitude artifacts, and other physiological arti-facts such as electro-oculogram, electrocardiogram, and elec-tromyogram artifacts. The increased presence of sharp wavesand IED detections in some patients may allow the identifica-tion of seizure onset zone which warrants further investigation.We anticipate that by including additional artifact removal tech-niques for some of the aforementioned artifacts, the specificitywould be further improved, and this constitutes part of our fu-ture work. These artifacts are more prominent in the scalp EEGand extension of the proposed method for the scalp EEG wouldrequire inclusion of artifact management techniques to ensurethat components representing EEG activity are preserved [45].
V. CONCLUSION
We have presented a new seizure detection method for in-tracerebral EEGs and compared it against the Grewal–Gotmansystem. The method is based on quantifying the sharpness ofthe EEG waveform for accurate and reliable identification ofseizures. Compared to the Grewal–Gotman system, the pro-posed method has resulted in improved specificity in data fromtwo different institutions (MNI and FSP databases). It has re-sulted in nearly the same sensitivity for the MNI database andimproved sensitivity for the FSP database compared to that ofthe Grewal–Gotman system. The performance suggests that thenewly proposed seizure detection system can be clinically usefulin the review of long-term depth EEG recordings.
ACKNOWLEDGMENT
The authors would like to thank Stellate Systems, Montreal,Canada, for providing the MNI database, and the EpilepsyCenter of the University Hospital of Freiburg, Germany, forproviding the FSP database. They are grateful to Dr. A. Schulze-Bonhage and Dr. H. Feldwisch-Drentrup, both from the Univer-sity Hospital of Freiburg, Germany, for their help.
REFERENCES
[1] E. Niedermeyer and F. L. D. Silva, Electroencephalography: Basic Prin-ciples, Clinical Applications, and Related Fields. Baltimore, MD:Williams & Wilkins, 2004.
[2] S. Grewal and J. Gotman, “An automatic warning system for epilepticseizures recorded on intracerebral EEGs,” Clin. Neurophysiol., vol. 116,no. 10, pp. 2460–2472, 2005.
[3] J. Mitra, J. R. Glover, P. Y. Ktonas, A. Thitai Kumar, A. Mukherjee,N. B. Karayiannis, J. Frost, J. D., R. A. Hrachovy, and E. M. Mizrahi,“A multistage system for the automated detection of epileptic seizures inneonatal electroencephalography,” J. Clin. Neurophysiol., vol. 26, no. 4,pp. 218–26, 2009.
[4] R. Yadav, M. N. S. Swamy, and R. Agarwal, “Model-based seizure detec-tion for intracranial EEG recordings,” IEEE Trans. Biomed. Eng., vol. 59,pages 10, 2012 (in press).
[5] J. Gotman, “Automatic recognition of epileptic seizures in the EEG,”Electroencephalogr. Clin. Neurophysiol., vol. 54, no. 5, pp. 530–40, 1982.
[6] J. Gotman, “Automatic seizure detection: Improvements and evaluation,”Electroencephalogr. Clin. Neurophysiol., vol. 76, no. 4, pp. 317–324, 1990.
[7] B. L. Davey, W. R. Fright, G. J. Carroll, and R. D. Jones, “Expert systemapproach to detection of epileptiform activity in the EEG,” Med. Biol.Eng. Comput., vol. 27, pp. 365–370, Jul. 1989.
[8] A. A. Dingle, R. D. Jones, G. J. Carroll, and W. R. Fright, “A multistagesystem to detect epileptiform activity in the EEG,” IEEE Trans. Biomed.Eng., vol. 40, pp. 1260–1268, Dec. 1993.
[9] R. Yadav, R. Agarwal, and M. N. S. Swamy, “Detection of epilepticseizures in stereo-EEG using frequency-weighted energy,” in Proc. IEEEMidwest Symp. Circuits Syst., 2007, pp. 77–80.
[10] R. Yadav, R. Agarwal, and M. N. S. Swamy, “A novel dual-stage classifierfor automatic detection of epileptic seizures,” in Proc. IEEE Eng. Med.Biol. Soc. Conf., 2008, pp. 911–914.
[11] R. Yadav, R. Agarwal, and M. N. S. Swamy, “A new improved model-based seizure detection using statistically optimal null filter,” in Proc.IEEE Eng. Med. Biol. Soc. Conf., 2009, pp. 1318–1322.
[12] R. Yadav, R. Agarwal, and M. N. S. Swamy, “A novel morphology-basedclassifier for automatic detection of epileptic seizures,” in Proc. IEEEEng. Med. Biol. Soc. Conf., 2010, pp. 5545–5548.
[13] A. Aarabi, R. Fazel-Rezai, and Y. Aghakhani, “A fuzzy rule-based systemfor epileptic seizure detection in intracranial EEG,” Clin. Neurophysiol.,vol. 120, no. 9, pp. 1648–1657, 2009.
[14] S. M. Haas, M. G. Frei, and I. Osorio, “Strategies for adapting automatedseizure detection algorithms,” Med. Eng. Phys., vol. 29, no. 8, pp. 895–909, 2007.
1880 IEEE TRANSACTIONS ON BIOMEDICAL ENGINEERING, VOL. 59, NO. 7, JULY 2012
[15] I. Osorio, M. G. Frei, and S. B. Wilkinson, “Real-time automated detectionand quantitative analysis of seizures and short-term prediction of clinicalonset,” Epilepsia, vol. 39, no. 6, pp. 615–627, 1998.
[16] M. A. Harrison, M. G. Frei, and I. Osorio, “Detection of seizure rhyth-micity by recurrences,” Chaos, vol. 18, no. 3, pp. 033124-1–033124-7,2008.
[17] P. Y. Ktonas, W. M. Luoh, M. L. Kejariwal, E. L. Reilly, and M. A. Seward,“Computer-aided quantification of EEG spike and sharp wave characteris-tics,” Electroencephalogr. Clin. Neurophysiol., vol. 51, no. 3, pp. 237–243,1981.
[18] N. B. Karayiannis, A. Mukherjee, J. R. Glover, P. Y. Ktonas, J. Frost, J.D., R. A. Hrachovy, and E. M. Mizrahi, “Detection of pseudosinusoidalepileptic seizure segments in the neonatal EEG by cascading a rule-basedalgorithm with a neural network,” IEEE Trans. Biomed. Eng., vol. 53,no. 4, pp. 633–641, Apr. 2006.
[19] R. Yadav, M. N. S. Swamy, and R. Agarwal, “Rapid identification ofepileptogenic sites in the intracranial EEG,” in Proc. IEEE Eng. Med.Biol. Soc. Conf., 2011, pp. 7553–7556.
[20] Y. U. Khan and J. Gotman, “Wavelet based automatic seizure detection inintracerebral electroencephalogram,” Clin. Neurophysiol., vol. 114, no. 5,pp. 898–908, 2003.
[21] H. Qu and J. Gotman, “A patient-specific algorithm for the detection ofseizure onset in long-term EEG monitoring: Possible use as a warningdevice,” IEEE Trans. Biomed. Eng., vol. 44, no. 2, pp. 115–122, 1997.
[22] M. E. Saab and J. Gotman, “A system to detect the onset of epilepticseizures in scalp EEG,” Clin. Neurophysiol., vol. 116, no. 2, pp. 427–442,2005.
[23] S. B. Wilson, M. L. Scheuer, R. G. Emerson, and A. J. Gabor, “Seizure de-tection: Evaluation of the reveal algorithm,” Clin. Neurophysiol., vol. 115,no. 10, pp. 2280–2291, 2004.
[24] M. A. Navakatikyan, P. B. Colditz, C. J. Burke, T. E. Inder, J. Richmond,and C. E. Williams, “Seizure detection algorithm for neonates based onwave-sequence analysis,” Clin. Neurophysiol., vol. 117, no. 6, pp. 1190–1203, 2006.
[25] W. Deburchgraeve, P. J. Cherian, M. De Vos, R. M. Swarte, J. H. Blok, G.H. Visser, P. Govaert, and S. Van Huffel, “Automated neonatal seizure de-tection mimicking a human observer reading EEG,” Clin. Neurophysiol.,vol. 119, pp. 2447–2454, Nov. 2008.
[26] K. M. Kelly, D. S. Shiau, R. T. Kern, J. H. Chien, M. C. Yang, K. A. Yan-dora, J. P. Valeriano, J. J. Halford, and J. C. Sackellares, “Assessment of ascalp EEG-based automated seizure detection system,” Clin. Neurophys-iol., vol. 121, pp. 1832–1843, 2010.
[27] K. K. Majumdar and P. Vardhan, “Automatic seizure detection in ECOGby differential operator and windowed variance,” IEEE Trans. NeuralSyst. Rehabil. Eng., vol. 19, no. 4, pp. 356–365, 2011.
[28] S. Grewal, “An automatic warning system for epileptic seizures recordedon intracerebral electroencephalograms” Master’s thesis, Dept. Biomed.Eng., McGill Univ., Montreal, QC, 2004.
[29] B. Schelter, M. Winterhalder, T. Maiwald, A. Brandt, A. Schad, J. Timmer,and A. Schulze-Bonhage, “Do false predictions of seizures depend on thestate of vigilance? A report from two seizure-prediction methods andproposed remedies,” Epilepsia, vol. 47, pp. 2058–2070, Dec. 2006.
[30] C. Vidaurre, T. H. Sander, and A. Schogl, “BIOSIG: The free and opensource software library for biomedical signal processing,” Comput. Intell.Neurosci., vol. 2011, pp. 1–12, 2011.
[31] R. Bracewell, The Fourier Transform and Its Applications. New York:McGraw-Hill, Jun. 1999.
[32] J. J. Niederhauser, R. Esteller, J. Echauz, G. Vachtsevanos, and B. Litt,“Detection of seizure precursors from depth-EEG using a sign peri-odogram transform,” IEEE Trans. Biomed. Eng., vol. 50, no. 4, pp. 449–458, Apr. 2003.
[33] I. Osorio and M. G. Frei, “Real-time detection, quantification, warning,and control of epileptic seizures: The foundations for a scientific epilep-tology,” Epilepsy Behav., vol. 16, no. 3, pp. 391–396, 2009.
[34] A. Burian and P. Kuosmanen, “Tuning the smoothness of the recursivemedian filter,” IEEE Trans. Signal Process., vol. 50, no. 7, pp. 1631–1639, Jul. 2002.
[35] Y.-H. Lee and S.-J. Kim, “Median-prefiltering-based robust acquisition ofdirect-sequence spread-spectrum signals in wide-band pulse jamming,”IEEE Trans. Veh. Technol., vol. 51, no. 1, pp. 171–179, Jan. 2002.
[36] T. Nodes, J. Gallagher, and N., “Median filters: Some modifications andtheir properties,” IEEE Trans. Acoust., Speech Signal Process., vol. 30,no. 5, pp. 739–746, Oct. 1982.
[37] Y. Lee and S. Kassam, “Generalized median filtering and related nonlin-ear filtering techniques,” IEEE Trans. Acoust., Speech Signal Process.,vol. 33, no. 3, pp. 672–683, Jun. 1985.
[38] T. Pietila, S. Vapaakoski, U. Nousiainen, A. Varri, H. Frey, V. Hakkinen,and Y. Neuvo, “Evaluation of a computerized system for recognition ofepileptic activity during long-term EEG recording,” Electroencephalogr.Clin. Neurophysiol., vol. 90, no. 6, pp. 438–443, 1994.
[39] A. Temko, C. Nadeu, W. Marnane, G. B. Boylan, and G. Lightbody,“EEG signal description with spectral-envelope-based speech recognitionfeatures for detection of neonatal seizures,” IEEE Trans. Inf. Technol.Biomed., vol. 15, no. 6, pp. 839–847, 2011.
[40] H. Stroink, R.-J. Schimsheimer, A. W. de Weerd, A. T. Geerts, W. F. Arts,E. A. Peeters, O. F. Brouwer, A. B. Peters, and C. A. van Donselaar, “In-terobserver reliability of visual interpretation of electroencephalogramsin children with newly diagnosed seizures,” Developmental Med. ChildNeurol., vol. 48, pp. 374–377, May 2006.
[41] E. D. Marsh, B. Peltzer, M. W. Brown, C. Wusthoff, P. B. Storm, B. Litt,and B. E. Porter, “Interictal EEG spikes identify the region of electro-graphic seizure onset in some, but not all, pediatric epilepsy patients,”Epilepsia, vol. 51, pp. 592–601, Apr. 2010.
[42] A. Hufnagel, M. Dumpelmann, J. Zentner, O. Schijns, and C. E. Elger,“Clinical relevance of quantified intracranial interictal spike activity inpresurgical evaluation of epilepsy,” Epilepsia, vol. 41, pp. 467–478, Apr.2000.
[43] J. M. Paolicchi, P. Jayakar, P. Dean, I. Yaylali, G. Morrison, A. Prats,T. Resnik, L. Alvarez, and M. Duchowny, “Predictors of outcome inpediatric epilepsy surgery,” Neurology, vol. 54, pp. 642–647, Feb. 2000.
[44] P. Krsek, B. Maton, P. Jayakar, P. Dean, B. Korman, G. Rey, C. Dunoyer,E. Pacheco-Jacome, G. Morrison, J. Ragheb, H. V. Vinters, T. Resnick,and M. Duchowny, “Incomplete resection of focal cortical dysplasia isthe main predictor of poor postsurgical outcome,” Neurology, vol. 72,pp. 217–223, Jan. 2009.
[45] P. LeVan, E. Urrestarazu, and J. Gotman, “A system for automatic artifactremoval in ictal scalp EEG based on independent component analysis andbayesian classification,” Clin. Neurophysiol., vol. 117, no. 4, pp. 912–927,2006.
R. Yadav (S’04) received the B.Sc. degree in physicsand the M.Sc. degree in electronics both from DeenDayal Upadhyay Gorakhpur University, Gorakhpur,India, in 1998 and 2000, respectively, and Ph.D. de-gree in electrical engineering from Concordia Uni-versity, Montreal, QC, Canada.
He is currently a Research Scientist at Leap Med-ical, Inc., Montreal, and a Scientist at NeuroImageInc., Toronto, ON, Canada. Prior to this, he was anEmbedded Programmer at Om Software Solutions,India, in 2001, a Computer Programmer at the All
India Institute of Medical Sciences, New Delhi, India, from 2001 to 2002, aResearch Scholar at the Indian Institute of Technology, Delhi, India, from 2002to 2004, a Research Assistant and Teaching Assistant at Concordia Universityfrom 2005 to 2008, a Teaching Fellow at Concordia University in 2008, a Re-searcher at the Ottawa Hospital Research Institute, Ottawa, from 2008 to 2010,and a Research Assistant at Concordia University from 2010 to 2011. He hasserved as a Reviewer to several biomedical engineering journals and confer-ences including the IEEE EMB, CAS, and SP society. His research interestsinclude biomedical signal processing and pattern recognition with emphasis ontheir application to neural signals for critical care and neuroscience research,and neural prosthesis.
A. K. Shah received the M.B.B.S. degree from Gu-jarat University, Ahmedabad, India, in 1987.
He completed Internal Medicine Internship at theInterfaith Medical Center, Brooklyn, NY, in 1989;followed by 3 years of Neurology Residency anda year of Clinical Neurophysiology Fellowship atWayne State University/Detroit Medical Center. In1994, he joined the Department of Neurology, WayneState University, Detroit, MI, where he is currently aProfessor. He is the Director of the ComprehensiveEpilepsy Program at Detroit Medical Center, where
he also serves as the Chief of Neurology, Harper University Hospital, Detroit.His clinical and research interests include study of patients with pharmacore-sistant epilepsy, and processing of intracranial EEG signals recorded duringinvasive EEG monitoring as they relate to neuroimaging and clinical features.

YADAV et al.: MORPHOLOGY-BASED AUTOMATIC SEIZURE DETECTOR FOR INTRACEREBRAL EEG RECORDINGS 1881
J. A. Loeb received the M.D. and Ph.D. degrees fromthe University of Chicago, Chicago, IL.
He is currently a Professor in the Department ofNeurology and the Associate Director of The Centerfor Molecular Medicine and Genetics at Wayne StateUniversity, Detroit, MI. He subsequently completeda Residency in neurology at the Massachusetts Gen-eral Hospital, Boston, and a Fellowship Training inepilepsy at Harvard’s Beth Israel Hospital. He con-ducted postdoctoral research at the Department ofNeurobiology, Harvard Medical School, with Dr. G.
Fischbach where he became interested in how understanding brain developmentcan teach us what goes wrong in human disease and suggest new treatments.He developed a novel way to create biologically targeted protein therapeuticsthat formed the basis for a biopharmaceutical company he formed in MI calledGlyTag. He also directs a project to develop new treatments for human epilepsythrough the identification of the genes, molecular and cellular signals that under-lie the abnormal electrical activities that characterize this common neurologicaldisorder.
M. N. S. Swamy (S’59–M’62–SM’74–F’80) re-ceived the B.Sc. (Hons.) degree in mathematicsfrom Mysore University, Mysore, India, in 1954, theDiploma degree in electrical communication engi-neering from the Indian Institute of Science, Ban-galore, India, in 1957, and the M.Sc. and Ph.D. de-grees in electrical engineering from the University ofSaskatchewan, Saskatoon, SK, Canada, in 1960 and1963, respectively. In August 2001, he received theDoctor of Science (Honoris Causa) degree in engi-neering from Ansted University, Penang, Malaysia.
He is currently a Research Professor in the Department of Electrical andComputer Engineering, Concordia University, Montreal, QC, Canada, where hehas served as the Founding Chair of the Department of Electrical Engineeringfrom 1970 to 1977, and the Dean of Engineering and Computer Science from1977 to 1993. During that time, he developed the faculty into a research-orientedfaculty from what was primarily an undergraduate one. Since 2001, he has beenthe Concordia University Research Chair (Tier I) in Signal Processing. He haspublished extensively in the areas of number theory, circuits, systems, and sig-nal processing, holds five patents, and is a coauthor of six books. His researchinterests include audio, video, image, VLSI, and biomedical signal processing.
Dr. Swamy is a Fellow of a number of professional societies, including theInstitute of Electrical Engineers, U.K., the Engineering Institute of Canada, theInstitution of Engineers, India, and the Institution of Electronic and Telecommu-nication Engineers, India. In 2008, Concordia University instituted the M. N. S.Swamy Research Chair in Electrical Engineering as a recognition of his researchcontributions. He was inducted in 2009 to Provost’s Circle of Distinction forcareer achievements. He was conferred in 2009, the title of Honorary Professorat the National Chiao Tung University in Taiwan. He has served the IEEE atvarious positions such as the President-elect in 2003, the President in 2004, thePast-president in 2005, the Vice President (Publications) from 2001 to 2002,the Vice President in 1976, and the Editor-in-Chief of the IEEE TRANSACTIONS
ON CIRCUITS AND SYSTEMS—PART I from 1999 to 2001. He is the recipientof many IEEE-CAS Society Awards, including the Education Award in 2000,the Golden Jubilee Medal in 2000, and the 1986 Guillemin–Cauer Best PaperAward.
R. Agarwal (M’88) received the M.A.Sc. and Ph.D.degrees from Concordia University, Montreal, QC,Canada, in 1991 and 1995, respectively, both in elec-trical engineering.
He is currently the Vice President of Researchand Development and the Chief Technology Officerat Leap Medical, Inc., Montreal, and holds an Ad-junct Associate Professor at the Concordia Univer-sity. Prior to this, he was the Director of Research andDevelopment at Stellate Systems, a subsidiary of Na-tus Systems, U.S. He spent one year as a Postdoctoral
Fellow with the Montreal Neurological Institute, McGill University, Montreal,followed by a two-year NSERC-supported Industrial Research Fellowship atStellate Systems, Montreal. He has served as a Reviewer to several biomedicalengineering journals and conferences including the IEEE EMB, CAS, and SPsociety. His research interests include biomedical signal processing (particularlypattern detection in the EEG of epileptic patients, analysis of polysomnograms,ICU EEG monitoring, and evoked potentials), statistical signal processing, andsignal detection and estimation.