Development and validation of LC-MS/MS methods to ...
238
Development and validation of LC-MS/MS methods to determine PK/PD parameters of anti-infectives Dissertation zur Erlangung des naturwissenschaftlichen Doktorgrades der Julius-Maximilians-Universität Würzburg vorgelegt von Verena Jakob-Rodamer aus Scheinfeld Würzburg 2014
-
Upload
khangminh22 -
Category
Documents
-
view
1 -
download
0
Transcript of Development and validation of LC-MS/MS methods to ...

Development and validation of LC-MS/MS
methods to determine PK/PD parameters
of anti-infectives
Dissertation
zur Erlangung des naturwissenschaftlichen Doktorgrades
der Julius-Maximilians-Universität Würzburg
vorgelegt von
Verena Jakob-Rodamer
aus Scheinfeld
Würzburg 2014

Eingereicht bei der Fakultät für Chemie und Pharmazie am
Gutachter der schriftlichen Arbeit
1. Gutachter: Prof. Dr. Fritz Sörgel
2. Gutachter: Prof. Dr. Ulrike Holzgrabe
Prüfer des öffentlichen Promotionskolloquiums
1. Prüfer: Prof. Dr. Fritz Sörgel
2. Prüfer: Prof. Dr. Ulrike Holzgrabe
3. Prüfer: Prof. Dr. Petra Högger
Datum des öffentlichen Promotionskolloquiums
Doktorurkunde ausgehändigt am
Diese Arbeit wurde am Institut für Biomedizinische und Pharmazeutische Forschung
in Nürnberg-Heroldsberg angefertigt.
This thesis has been accomplished at the Institute for Biomedical and
Pharmaceutical Research in Nürnberg-Heroldsberg.

Acknowledgement
This thesis was accomplished under the supervision of Professor Dr Fritz Sörgel,
Director of the Institute for Biomedical and Pharmaceutical Research (IBMP) in
Nürnberg-Heroldsberg and Professor Dr Ulrike Holzgrabe, Chairman of
Pharmaceutical Chemistry at the University of Würzburg.
First and foremost, I greatly thank Professor Dr Fritz Sörgel for the assignment of this
scientific topic, the provision of the excellent technical equipment, his valuable
mentorship and promotion through all the years and during the work of this thesis.
Warmest thanks also go to Professor Dr Ulrike Holzgrabe for the time spent to
support this thesis in a very constructive way.
I am very thankful to Dr Martina Kinzig for the introduction and training in LC-MS/MS,
expert discussions in the laboratory and strong support during all lab procedures.
That included monitoring my work under the international guidelines of FDA and
CPMP (now called EMA guidelines) of that time.
Special thanks to the whole IBMP-Team for their outstanding team spirit and
collegiality and for their competent advice and practical help during the
pharmacokinetic projects. With so many plasma samples it would not have been
possible without them. This allowed me to provide in this thesis rich data on drugs in
humans helping to improve the quality of life.
The clinical part of this thesis was done by physicians in clinical research centres. I
received the plasma samples in the frozen state along with precise information on
dose, way of administration and accurate blood sampling. Sincere thanks to the
physicians and their medical staff. And not to forget all the healthy volunteers who
participated in those studies.
Thank you to my Gymnasium teacher Klaus-Jürgen Heß for his delighting chemistry
lessons and his support for the “Jugend forscht”-competition, where we were
awarded third in the national competition. That was the beginning of my bioanalytical
career. It is very sad to have to accept that he passed away so soon in December of
2012.
Thanks to the “Jugend forscht”-Organization and “Studienstiftung des deutschen
Volkes” for supporting me in the program of the promotion of young scientists.
Last, but not least I thank all my family for their stable backing and solid support.
I hope I can return this one time.

Meiner Familie


Table of contents
Table of contents....................................................................................................... V
List of figures............................................................................................................ IX
List of tables............................................................................................................ XII
List of schemes ......................................................................................................XVI
1 INTRODUCTION.....................................................................................1
1.1 Background on drug development..................... .................................... 1
1.2 Pharmacokinetics and Pharmacodynamics.............. ............................. 2
1.3 LC-MS/MS – techniques and progress with time....... ............................ 8 1.3.1 Ionisation Sources ..................................................................................... 9
1.3.2 Triple quadrupole technology................................................................... 11
1.3.3 Progress in the construction of mass spectrometers................................ 13
1.4 LC-MS/MS method development ........................ .................................. 14 1.4.1 MS/MS spectra and system optimization ................................................. 14
1.4.2 Liquid chromatography for combined use with mass spectrometry .......... 16
1.4.3 Sample preparation techniques ............................................................... 17
1.4.4 Selecting the Internal Standard................................................................ 19
1.4.5 Setting the calibration range .................................................................... 19
1.5 Why do we have to validate? ........................ ........................................ 20
1.6 Aims of this thesis................................ ................................................. 22
2 MATERIAL AND METHODS ...................................................................25
2.1 Instrumentation and software....................... ........................................ 25
2.2 Reference compounds, chemicals and biological speci mens ........... 27
2.3 Stock solutions .................................... .................................................. 28
2.4 Calibration standards and spiked quality control sa mples ................ 29
2.5 Validation experiments – procedure and acceptance c riteria ............ 31 2.5.1 Specificity ................................................................................................ 31
2.5.2 Selectivity ................................................................................................ 31
2.5.3 Linearity and sensitivity............................................................................ 31
2.5.4 Precision and accuracy............................................................................ 32
2.5.5 Stability experiments................................................................................ 32
2.5.6 Recovery ................................................................................................. 34
2.5.7 Matrix Effect............................................................................................. 34
2.5.8 Haemolysed plasma ................................................................................ 35
VI Table of contents
2.5.9 Hyperlipidaemic plasma........................................................................... 35
2.5.10 Anticoagulant........................................................................................... 36
2.5.11 Dilution integrity ....................................................................................... 36
2.5.12 Incurred sample re-analysis (ISR)............................................................ 36
2.6 Study sample collection and sample handling........ ............................ 37
2.7 Pharmacokinetic analysis ........................... .......................................... 37
3 MACROLIDES .....................................................................................38
3.1 Erythromycin Ethylsuccinate and Erythromycin A ..... ........................ 38 3.1.1 Chemical and pharmaceutical properties ................................................. 38
3.1.2 Current state of published analytical methods.......................................... 41
3.1.3 LC-MS/MS method .................................................................................. 42
3.1.4 Validation................................................................................................. 47
3.1.5 Method comparison on three different LC-MS/MS systems...................... 53
3.1.6 Comparison of the LC-MS/MS method with procedures reported in the literature............................................................................................. 56
3.1.7 Application to a pharmacokinetic study .................................................... 59
3.1.7.1 Study design and sample handling .......................................................... 59
3.1.7.2 Determination of plasma concentrations .................................................. 59
3.1.7.3 Pharmacokinetic results........................................................................... 62
3.1.8 Summary: Erythromycin ethylsuccinate ................................................... 65
3.2 Roxithromycin...................................... .................................................. 66 3.2.1 Chemical and pharmaceutical properties ................................................. 66
3.2.2 Published analytical methods................................................................... 68
3.2.3 LC-MS/MS method .................................................................................. 68
3.2.4 Validation................................................................................................. 73
3.2.5 Method comparison on three different LC-MS/MS systems...................... 76
3.2.6 Comparison of the LC-MS/MS method with procedures reported in the literature............................................................................................. 79
3.2.7 Application of the roxithromycin assay to a pharmacokinetic study .......... 81
3.2.7.1 Study design and sample handling .......................................................... 81
3.2.7.2 Determination plasma concentrations ...................................................... 81
3.2.7.3 Pharmacokinetic results........................................................................... 83
3.2.8 Summary: Roxithromycin......................................................................... 85
3.3 Clarithromycin ..................................... .................................................. 87 3.3.1 Chemical and pharmaceutical properties ................................................. 87
3.3.2 Already published analytical methods ...................................................... 89
3.3.3 LC-MS/MS method .................................................................................. 90

Table of contents VII
3.3.3.1 MS/MS spectra and tuning....................................................................... 90
3.3.3.2 Chromatography and sample preparation................................................ 92
3.3.4 Validation................................................................................................. 94
3.3.5 Method comparison on three different LC-MS/MS systems...................... 98
3.3.6 Comparison of the LC-MS/MS method with procedures reported in the literature........................................................................................... 102
3.3.7 Application to a pharmacokinetic study of oral clarithromycin................. 106
3.3.7.1 Study design and sample handling ........................................................ 106
3.3.7.2 Determination of plasma concentrations ................................................ 106
3.3.7.3 Pharmacokinetic results......................................................................... 108
3.3.8 Summary: clarithromycin ....................................................................... 111
3.4 Summary and conclusions: Macrolides................ ............................. 112 3.4.1 LC-MS/MS Assays................................................................................. 112
3.4.2 Pharmacokinetics and Pharmacodynamics............................................ 114
4 BETA-LACTAMS ...............................................................................118
4.1 Flucloxacillin..................................... ................................................... 118 4.1.1 Chemical and pharmaceutical properties ............................................... 118
4.1.2 Current state of published analytical methods for flucloxacillin............... 120
4.1.3 LC-MS/MS method development ........................................................... 121
4.1.4 Validation............................................................................................... 127
4.1.5 Comparison of the LC-MS/MS method with procedures reported in the literature........................................................................................... 130
4.1.6 Application to a pharmacokinetic study .................................................. 132
4.1.6.1 Study design and sample handling ........................................................ 132
4.1.6.2 Determination of flucloxacillin concentrations in human plasma............. 132
4.1.6.3 Pharmacokinetic results......................................................................... 133
4.1.7 Summary: flucloxacillin .......................................................................... 136
4.2 Piperacillin ....................................... .................................................... 136 4.2.1 Chemical and pharmaceutical properties ............................................... 136
4.2.2 Previously published analytical methods................................................ 139
4.2.3 LC-MS/MS method development ........................................................... 139
4.2.3.1 Mass spectra and tuning........................................................................ 139
4.2.3.2 Chromatography and sample preparation.............................................. 143
4.2.4 Validation in human plasma and urine ................................................... 145
4.2.5 Comparison of the LC-MS/MS method with procedures reported in the literature........................................................................................... 150
4.2.6 Application to a drug-drug interaction study of intravenous piperacillin/tazobactam with telavancin .................................................. 156

VIII Table of contents
4.2.6.1 Study design and sample handling ........................................................ 156
4.2.6.2 Chemical and pharmaceutical properties of telavancin .......................... 156
4.2.6.3 Determination of piperacillin concentrations in plasma and urine ........... 158
4.2.6.4 Pharmacokinetic results......................................................................... 160
4.2.7 Summary: Piperacillin ............................................................................ 162
4.3 Summary: β-Lactams ........................................... ............................... 164
5 FLUOROQUINOLONES .......................................................................166
5.1 Moxifloxacin....................................... .................................................. 166 5.1.1 Chemical and pharmaceutical properties ............................................... 166
5.1.2 Current state of published analytical methods........................................ 169
5.1.3 LC-MS/MS method development ........................................................... 169
5.1.3.1 MS/MS spectra and tuning..................................................................... 169
5.1.3.2 Chromatography .................................................................................... 172
5.1.4 Validation............................................................................................... 174
5.1.5 Comparison of the LC-MS/MS method with procedures reported in the literature........................................................................................... 176
5.1.6 Application to a pharmacokinetic study .................................................. 180
5.1.6.1 Study design and sample handling ........................................................ 180
5.1.6.2 Determination of moxifloxacin concentrations in human plasma ............ 180
5.1.6.3 Pharmacokinetic results......................................................................... 182
5.1.7 Summary: Moxifloxacin.......................................................................... 183
6 SUMMARY .......................................................................................185
7 ZUSAMMENFASSUNG ........................................................................188
List of abbreviations .............................................................................................. 191
References............................................................................................................ 196
Publications........................................................................................................... 220

List of figures IX
List of figures
Figure 1 The phases, time lines, and attrition that characterize the invention of new drugs, reprinted by permission from The McGraw-Hill Companies, Inc: Goodman & Gilman’s The Pharmacological Basis of Therapeutics by L. Brunton and B. Chabner [1] ........................................................................................... 1
Figure 2 Determining maximum concentration (Cmax), time to maximum concentration (tmax) and area under the curve (AUC) from the plasma concentration-time curve by the linear trapezoidal rule (data are presented later on page 109) .................................................3
Figure 3 Determining the elimination rate constant (kel) from the log-transformed plasma concentration-time curve (which will be presented later on page 161).................................................................5
Figure 4 Typical concentration versus pharmacodynamic effect curve ................7
Figure 5 PK/PD concept for antibiotics (shown on data, which will be presented later on page 109).................................................................8
Figure 6 Mechanism of electrospray ionisation (ESI), reprinted by permission from John Wiley and Sons: Mass spectrometry reviews [18] ...........................................................................................9
Figure 7 Mechanism of atmospheric pressure chemical ionisation (APCI), reprinted by permission from AB Sciex Pte. Ltd................................... 10
Figure 8 Schematic ion path of the triple quadrupole mass spectrometer API 5000™ LC-MS/MS system, adapted from AB Sciex Pte. Ltd. ....... 11
Figure 9 Schematic of a quadrupole mass filter, reprinted by permission from B.M. Tissue [24] .......................................................................... 12
Figure 10 Q1 mass spectrum of erythromycin ethylsuccinate (EES) ................... 43
Figure 11 Product ion spectrum and fragmentation scheme of EES.................... 43
Figure 12 Product ion spectrum and fragmentation scheme of erythromycin A .................................................................................... 44
Figure 13 Representative MRM-chromatograms for EES (top), ERY A (middle) and OLE (IS, bottom) in human plasma................................. 60
Figure 14 Plasma profiles (mean±SD) of EES and ERY A concentrations vs. time following an oral dose of EES suspension (eq. to 500 mg ERY base) to healthy volunteers (n=10) .............................................. 62
Figure 15 Positive precursor ion (Q1) spectrum of roxithromycin......................... 69
Figure 16 Product ion mass spectrum and fragmentation scheme of roxithromycin....................................................................................... 69
Figure 17 MRM-chromatograms of roxithromycin and the IS clarithromycin ........ 82
Figure 18 Mean plasma profile of roxithromycin concentration vs. time following a 300 mg oral dose of roxithromycin to 36 healthy volunteers............................................................................................ 83
Figure 19 Product ion scan of 14-hydroxy clarithromycin .................................... 91
Figure 20 Product ion mass spectrum and fragmentation scheme of clarithromycin ...................................................................................... 91

X List of figures
Figure 21 Matrix-effect assessment via post-column infusion of clarithromycin (top) and 14-hydroxy clarithromycin (bottom).............. 100
Figure 22 Chromatograms of CLA (top), CLA-MET (middle) and ROX (IS, bottom).............................................................................................. 107
Figure 23 Plasma profiles (mean±SD) of clarithromycin and 14-hydroxy clarithromycin concentrations versus time after administration of a 250-mg oral clarithromycin dose to 36 healthy volunteers ................. 109
Figure 24 Plasma concentration-time profile of a 250-mg oral dose of clarithromycin to healthy subjects in comparison to different MIC90 values................................................................................................ 117
Figure 25 Negative precursor ion (Q1) spectrum of flucloxacillin ....................... 121
Figure 26 Product ion mass spectrum and fragmentation scheme of flucloxacillin in the negative ion mode................................................ 122
Figure 27 Precursor ion scan of tolbutamide ..................................................... 124
Figure 28 Product ion scan of tolbutamide ........................................................ 124
Figure 29 Representative MRM-chromatograms for flucloxacillin (top) and tolbutamide (IS, bottom) in human plasma: (A) Blank plasma sample, (B) LLOQ (0.0100 µg/mL), (C) Subject sample (16 hours post-dose, 0.0129 µg/mL) and (D) Subject sample (0.75 hours post-dose, 24.37 µg/mL).................................................................... 133
Figure 30 Mean plasma concentration profile of flucloxacillin following a single oral 250-mg flucloxacillin capsule to 24 healthy volunteers. .... 134
Figure 31 Precursor ion (Q1) spectrum of piperacillin (negative-ion mode) ....... 140
Figure 32 Product ion spectrum and fragmentation scheme of piperacillin in the negative-ion mode....................................................................... 141
Figure 33 Product ion mass spectrum and fragmentation scheme of sulbactam.......................................................................................... 142
Figure 34 Representative MRM-chromatograms of piperacillin in human plasma .............................................................................................. 159
Figure 35 Representative MRM-chromatograms of piperacillin in human urine .................................................................................................. 160
Figure 36 Plasma profile (mean±SD) of piperacillin concentrations versus time following a 4 g intravenous dose of piperacillin to healthy volunteers (n = 12) ............................................................................ 161
Figure 37 Plasma concentration-time profile of a 30 min intravenous dose of 4 g piperacillin and 0.5 g tazobactam in relation to MIC90 data of aerobe, facultative anaerobe and anaerobe gram-negative (empty line) or gram-positive (dotted line) bacteria........................................ 164
Figure 38 Plasma concentration-time profile of a 250-g tablet of flucloxacillin in relation to the MIC90 value of S. aureus ......................................... 165
Figure 39 Moxifloxacin-topoisomerase IV cleavage complex, reprinted with permission from Macmillan Publishers Ltd: Nature structural & molecular biology [275], copyright 2009 ............................................ 166

List of figures XI
Figure 40 MRM-chromatograms of moxifloxacin in human plasma: (A) Blank plasma sample, (B) LLOQ (0.00514 µg/mL), (C) Subject plasma sample (t=0.67h, 4.31 µg/mL), (D) Subject plasma sample (t=48h, 0.204 µg/mL) ..................................................................................... 181
Figure 41 Plasma profile (mean±SD) of moxifloxacin concentrations versus time after administration of a 400-mg oral moxifloxacin dose to healthy volunteers (n=9).................................................................... 182

XII List of tables
List of tables
Table 1 Types of spectra with a triple-quadrupole mass spectrometer according to different application modes of the three quadrupoles ...... 13
Table 2 Stock solutions of analytes and internal standards (IS)........................ 29
Table 3 Calibration standards and SQC samples for validation ........................ 30
Table 4 Conditions of stability experiments ...................................................... 33
Table 5 Optimized MS/MS parameters for EES, ERY A and OLE.................... 45
Table 6 Summary of the assay for EES and ERY A in human plasma ............. 47
Table 7 Inter-day precision and accuracy of the calibration standards containing erythromycin ethylsuccinate or erythromycin A in human plasma..................................................................................... 48
Table 8 Intra- and inter-day precision and accuracy for the analysis of spiked quality control samples containing EES or ERY A in human plasma..................................................................................... 49
Table 9 Intra- and inter-day precision and accuracy for the analysis of spiked quality control samples containing EES and ERY A in human plasma..................................................................................... 49
Table 10 Accuracy and precision of EES and ERY A in haemolysed plasma..... 50
Table 11 Statistical evaluation of the stability experiments for EES.................... 51
Table 12 Statistical evaluation of the stability experiments for ERY A. ............... 52
Table 13 Validation data of EES on three different LC-MS/MS systems............. 53
Table 14 Validation data of ERY A on three different LC-MS/MS systems ......... 54
Table 15 Analytical methods for the determination of erythromycin ethylsuccinate and erythromycin A in human plasma; grouped by analytical technique and descending years of publication.................... 58
Table 16 Accuracy and precision of calibration standards and SQC samples during analysis of erythromycin ethylsuccinate and erythromycin A in study samples ......................................................... 61
Table 17 Pharmacokinetic parameters (mean±SD) of erythromycin ethylsuccinate (EES) and erythromycin base in healthy subjects after administration of a single oral dose of erythromycin ethylsuccinate ..................................................................................... 64
Table 18 Optimized MS/MS parameters for roxithromycin.................................. 71
Table 19 Summary of the LC-MS/MS method for roxithromycin in human plasma ................................................................................................ 73
Table 20 Intra- and inter-day precision and accuracy of roxithromycin in human plasma (four days, five replicates per day)............................... 74
Table 21 Stability data on roxithromycin at 940 ng/mL in human plasma ........... 75
Table 22 Validation data of roxithromycin from three LC-MS/MS systems ......... 78
Table 23 Comparison of current method with existent methods to quantify roxithromycin in human plasma, serum or blood; grouped by analytical technique and descending years of publication.................... 80

List of tables XIII
Table 24 Pharmacokinetic parameters (mean ± SD) of roxithromycin in healthy subjects after overnight fasting and administration of a single oral dose as a tablet .................................................................. 84
Table 25 Optimized MS/MS parameters for clarithromycin (CLA) and 14-hydroxy clarithromycin (CLA-MET) ...................................................... 92
Table 26 Summary of the clarithromycin and 14-hydroxy clarithromycin assay................................................................................................... 94
Table 27 Intra- and inter-day precision and accuracy of clarithromycin (CLA) in human plasma (four days, five replicates per day)................. 95
Table 28 Intra- and inter-day precision and accuracy of 14-hydroxy clarithromycin (CLA-MET) in human plasma (four days, five replicates per day)............................................................................... 96
Table 29 Stability data on clarithromycin (CLA, 998 ng/mL) in human plasma. ............................................................................................... 97
Table 30 Stability data on 14-hydroxy clarithromycin (CLA-MET, 999 ng/mL) in plasma................................................................................. 97
Table 31 Data of clarithromycin (CLA) from three LC-MS/MS systems ............ 101
Table 32 14-hydroxy clarithromycin (CLA-MET) data of three LC-MS/MS systems............................................................................................. 101
Table 33 Comparison of current method with other analytical methods for the determination of clarithromycin and 14-hydroxy clarithromycin in human plasma or serum; grouped by analytical technique and descending years of publication ........................................................ 104
Table 34 Accuracy and precision of calibration standards and spiked quality control samples during analysis of CLA and CLA-MET in study samples............................................................................................. 108
Table 35 Pharmacokinetic parameters (mean±SD) of clarithromycin in healthy subjects after overnight fasting and administration of a single oral dose as a tablet ................................................................ 110
Table 36 Pharmacokinetic parameters (mean ± SD) of 14-hydroxy clarithromycin in healthy subjects after overnight fasting and administration of a single oral tablet .................................................. 111
Table 37 Validated concentration ranges (ng/mL), range of linearity and sensitivity gain compared to prior API................................................ 113
Table 38 Summary of the macrolides’ chemical and pharmacokinetic properties .......................................................................................... 115
Table 39 Optimized MS/MS parameters for flucloxacillin.................................. 125
Table 40 Summary of the LC-MS/MS method for flucloxacillin in human plasma .............................................................................................. 127
Table 41 Intra- and inter-day precision and accuracy of the analysis of flucloxacillin in human plasma (five days, five replicates per day)...... 128
Table 42 Statistical evaluation of the stability experiments for flucloxacillin in human ammonium heparin plasma................................................ 129

XIV List of tables
Table 43 Comparison of developed method to existent methods to quantify flucloxacillin in human plasma or serum; grouped by analytical technique and descending years of publication ................................. 131
Table 44 Reported values for pharmacokinetic parameters (mean ± standard deviation) of flucloxacillin in healthy subjects after overnight fasting and administration of a single oral dose as capsule.............................................................................................. 135
Table 45 Optimized MS/MS parameters for piperacillin in the negative-ion mode ................................................................................................. 143
Table 46 Summary of the LC-MS/MS method for piperacillin in human plasma .............................................................................................. 145
Table 47 Intra- and inter-day precision and accuracy for the analysis of piperacillin in human plasma and urine (five days, five replicates per day)............................................................................................. 147
Table 48 Stability data of piperacillin in human ammonium heparin plasma ..... 148
Table 49 Stability data on piperacillin in human urine....................................... 149
Table 50 Comparison of bioanalytical methods for piperacillin in human plasma, serum and urine; grouped by analytical technique and descending years of publication ........................................................ 153
Table 51 Comparison of validation procedures for piperacillin in human plasma and urine............................................................................... 155
Table 52 Pharmacokinetic parameters (mean±SD or mean (CV)) for piperacillin of a single intravenous dose of 4 g piperacillin (PIP) and 0.5 g tazobactam (TAZ) to healthy volunteers or patients with normal renal function (upper part: 30-min infusion; lower part: bolus infusion) ................................................................................... 163
Table 53 Optimized MS/MS parameters for moxifloxacin ................................. 171
Table 54 Summary of the LC-MS/MS method for moxifloxacin in human plasma .............................................................................................. 173
Table 55 Intra- and inter-day precision and accuracy of moxifloxacin in human plasma (five days, five replicates per day .............................. 174
Table 56 Stability data on moxifloxacin in human plasma................................. 175
Table 57 Validated bioanalytical methods for the determination of moxifloxacin in human plasma or serum; grouped by analytical technique and descending years of publication ................................. 178
Table 58 Accuracy and precision of calibration standards and SQC samples during analysis of moxifloxacin in study samples................. 181
Table 59 Cmax/MIC for a 400-mg oral moxifloxacin dose and different micro-organisms.......................................................................................... 183
Table 60 Pharmacokinetic parameters (mean±SD) of moxifloxacin in healthy subjects after administration of a single oral dose ................. 184
Table 61 Summary of the properties of the drugs and the developed LC-MS/MS methods................................................................................ 185
Table 62 Summary of chemical and pharmacokinetic properties...................... 186
Table 63 Classes of antimicrobial agents related to PK/PD parameters........... 187

List of tables XV
Table 64 Übersicht über die Wirkstoffeigenschaften und die LC-MS/MS Methoden .......................................................................................... 188
Table 65 Übersicht der chemischen und pharmakokinetischen Eigenschaften ................................................................................... 189
Table 66 Einteilung von Antiinfektiva in PK/PD Parameter ............................... 190

XVI List of schemes
List of schemes
Scheme 1 Chemical structures of erythromycin A (ERY A), B and C.................... 38
Scheme 2 Chemical structure of erythromycin ethylsuccinate (EES).................... 39
Scheme 3 Acid-catalyzed intramolecular ketal formation of erythromycin............. 40
Scheme 4 Chemical structure of oleandomycin (OLE) ......................................... 45
Scheme 5 Chemical structure of roxithromycin (ROX).......................................... 67
Scheme 6 Fragmentation mechanism of the desosamine moiety of macrolides........................................................................................... 70
Scheme 7 Summary of the fragmentations for roxithromycin................................ 70
Scheme 8 Hydrolysis of the cladinose moiety of roxithromycin............................. 72
Scheme 9 Chemical structure of clarithromycin (CLA).......................................... 87
Scheme 10 Chemical structure of 14-hydroxy clarithromycin (CLA-MET)............... 88
Scheme 11 Acid-catalyzed degradation of clarithromycin....................................... 93
Scheme 12 Chemical structure of flucloxacillin (FLU)........................................... 118
Scheme 13 Beta-lactam structure compared to beta-lactam antibiotics................ 119
Scheme 14 Acid stability of flucloxacillin............................................................... 120
Scheme 15 Mechanism of flucloxacillin fragmentation in the negative-ion mode (adopted to the example of flucloxacillin from [199]) ................ 123
Scheme 16 Chemical structure of tolbutamide (TOL) ........................................... 125
Scheme 17 Chemical structure of piperacillin (PIP).............................................. 137
Scheme 18 Mechanism of beta-lactam degradation at basic pH .......................... 138
Scheme 19 Chemical structure of sulbactam (SUL, IS) ........................................ 141
Scheme 20 Chemical structure of telavancin........................................................ 157
Scheme 21 Chemical structures of the N-sulfate conjugate and the acyl-glucuronide metabolites of moxifloxacin ............................................ 167
Scheme 22 Chemical structure of moxifloxacin (MOX)......................................... 168
Scheme 23 Fragmentation scheme of moxifloxacin and gatifloxacin (IS) following collision induced dissociation in the positive ionisation mode ................................................................................................. 170
Scheme 24 Chemical structure of gatifloxacin (GAT) ........................................... 171

1 INTRODUCTION
1.1 Background on drug development
Drug development includes the long way from screening, synthesis and
characterization of thousands of chemical entities towards interaction with a given
drug target, pre-clinical tests in animals on efficacy, pharmacology and toxicity, until
a variety of clinical trials in human beings. See Figure 1.
Figure 1 The phases, time lines, and attrition that characterize the invention of
new drugs, reprinted by permission from The McGraw-Hill Companies, Inc:
Goodman & Gilman’s The Pharmacological Basis of Therapeutics by L. Brunton and
B. Chabner [1]
Typically, clinical trials are conducted in four phases: In Phase I (First in Human) the
potential new drug is given to a small number of healthy volunteers to assess
pharmacokinetics, safety and tolerability. Phase II includes clinical trials in subjects
and in a small number of patients to study efficacy and dosing, while during Phase III
(Multi-Site) studies hundreds of patients in a large number of clinical sites are
evaluated to confirm the efficacy in a large population. Before the first clinical trial
can start and before marketing the drug (when the Phase III trials are finished) an
application containing all important data of previous investigations must be filed to
the appropriate regulatory agency, e.g. Food and Drug Administration (FDA) in USA,
European Medicines Agency (EMA) or national institutions, e.g. Federal Institute for

2 INTRODUCTION
Drugs and Medical Devices (BfArM) in Germany. In the US these applications are
called IND (investigational new drug) application and NDA (new drug application).
After drug approval, Phase IV (Post-Marketing Surveillance) takes place to record
adverse events, compliance and drug-drug-interactions in thousands of patients [1].
A parallel application process has been established, not for studying new chemical
entities (NCE), but to compare generic or newly formulated drugs to already
marketed drugs. This is called ANDA (abbreviated new drug application) and in
general these require only bioequivalence (BE) and bioavailability (BA) trials, which
are regulated in detail by the FDA and EMA [2-3].
Recently, a new sort of clinical trials has been established: Phase 0 (Microdosing)
trials speed up the drug-development process by enabling decisions on which drug-
candidate may be the most promising for further development at an early stage of
drug development. Those exploratory IND studies explore pharmacokinetic data in
humans by giving a subtherapeutical dose to very few healthy subjects. These in
first-in-human studies do not answer safety or efficacy questions [4]. Among other
reasons this progress was possible due to especially sensitive and selective
bioanalytical methods being able to quantitate biofluid concentrations from a dose
that is only one percent of the calculated therapeutic dose.
1.2 Pharmacokinetics and Pharmacodynamics
Clinical trials are designed to investigate the pharmacokinetics (PK) and
pharmacodynamics (PD) of a potential new drug. While pharmacokinetics are
dealing with the absorption, distribution, metabolism and elimination (ADME) of
drugs, pharmacodynamics covers the drug’s pharmacological and toxic effects.
Pharmacokinetics describe the time course of the drug’s and its metabolite’s
concentration in body fluids and tissues by mathematical equations. As blood is
easily available and reflects in many cases the kinetic processes in the organism,
plasma or serum concentrations are used as measures of drug levels.
Absorption can be described by three PK parameters: Cmax, tmax and AUC. The
maximal plasma concentration (Cmax, unit e.g. in µg/mL) and the time (tmax, unit e.g.
in h) when this concentration is reached, can be taken directly from the plasma
concentration-time curve. While the amount of absorbed drug is measured by Cmax,
the time course of absorption is reflected by the part of the curve before Cmax.

Pharmacokinetics and Pharmacodynamics 3
Assuming the same dose, Cmax is high and tmax is short, when drug absorption is
quick. When Cmax is reached, the amount of drug entering the systemic circulation
equals the amount of drug being eliminated.
Figure 2 Determining maximum concentration (Cmax), time to maximum
concentration (tmax) and area under the curve (AUC) from the plasma concentration-
time curve by the linear trapezoidal rule (data are presented later on page 109)
0.00
0.10
0.20
0.30
0.40
0.50
0.60
0.70
0.80
0 3 6 9 12 15 18 21 24 27 30 33 36
Con
cent
ratio
n (µ
g/m
L)
Time (hours)
tmax
Cmax
AUCc1
t2
c2
t1
c1+c2
t2 - t1
Area calculated by Equation 1c1+c2
The area under the plasma concentration-time curve (AUC, e.g. in µg·h/mL) is a
measure for the amount of drug circulating in the organism. The AUC from measured
data points starting with the time of administration until the time of the last
quantifiable concentration can be easily calculated by the linear trapezoidal rule.
∑ ++→
+⋅−≈2
])t(C)t(C[)tt(AUC 1iii1i
t0 Equation 1
The residual area between the last quantifiable concentration (Cn) until infinity can be
extrapolated by assuming a mono-exponential decline of the concentration-time
curve. (Determination of kel is discussed later in this chapter.)
( ) ( )∑∫
−
=
++∞
∞→ ++⋅−≈⋅=1n
1i el
n1iii1i
0
0 kC
2CCtt
dt)t(CAUC Equation 2
Cmax and AUC0→t define the highest and total exposure of a drug in the body as well
as the concentration-time curve and therefore are crucial for the decision if two
medicinal products are bioequivalent . This is the case, if the 90%-confidence

4 INTRODUCTION
interval for the ratio of the test and reference product is within the acceptance
interval of 80-125% [3].
Friedrich Hartmut Dost published 1953 the first text book on pharmacokinetic
calculations [5], where he explained that the AUC of a drug, given intravenously (iv)
equals the AUC of a drug administered orally (po), if it is absorbed completely into
the body. On this basis absolute bioavailability is studied:
100DoseDose
AUC
AUC[%]F
po
iv
iv
po ⋅⋅= Equation 3
The drug’s Distribution in the body is expressed as volume of distribution (V, unit
e.g. in L), which is a fictive parameter, correlating the dose to the initial concentration
(C0, after bolus injection assuming an immediate distribution over the organism, one
compartment):
0CDose
V = (because mL.g.e,Volumemg.g.e,Amount
ionConcentrat = ) Equation 4
In general, a high volume of distribution indicates a wide distribution of the drug in
the body, i. e. organs, tissues, cells, etc. It is influenced by chemical characteristics,
and physicochemical properties of the drug. Among those are pKa, solubility,
membrane permeability, molecular weight.
The descending part of the plasma concentration-time curve is caused by drug
distribution from the blood circulation into body tissues and by drug elimination
processes. A sharply falling slope directly after Cmax indicates either fast distribution,
or an early and rapid elimination.
In most cases the drug distributes not immediately and uniformly in the body, but
distributes for example faster into heart, liver and lung than into muscle, skin or
bone. This is reflected in the log-transformed plasma concentration-time curve after
intravenous administration (Figure 3), which descends at first quickly and then
slowly. In order to describe such curves mathematically, two (or more) compartment
models have been developed, producing operational equations, which are improved
by physiologically-based pharmacokinetics (PBPK) [6-8].
A measure for the rate of distribution and elimination is the elimination rate constant
(k1 or kel, unit e.g. 1/h), which is obtained directly from the log-transformed
concentration-time by linear regression, see Figure 3:

Pharmacokinetics and Pharmacodynamics 5
Figure 3 Determining the elimination rate constant (kel) from the log-transformed
plasma concentration-time curve (which will be presented later on page 161)
0.10
1.00
10.00
100.00
1000.00
0 2 4 6 8 10 12 14
Time (h)
Con
cent
ratio
n (µ
g/m
L)
1.50
0.75
t1/2k1
kel
The rate of drug elimination can be described by the terminal elimination half-life
(t1/2, h). Assuming first-order kinetics, t1/2 is calculated by the following equation:
el2/1 k
2lnt = Equation 5
First-order kinetics can be assumed if absorption, distribution and elimination
processes are not saturable. However, many processes exist in an organism [9], that
can become saturated, of which the most common saturation is plasma protein
binding (PPB) or renal elimination (see below), which affect the linear PK to become
non-linear towards dose. PPB may be saturated, when the affinity of a drug to
human serum albumin or α1-glycoprotein and the drug concentration is high, e. g. 10-
100 µg/mL plasma [1]. Then, higher free drug concentrations cause V to increase
over-proportionally with increasing doses.
A measure for elimination is the clearance (CL, mL/min), which defines the volume
of blood that is cleared from the drug per unit of time. If elimination processes are not
saturated (first-order kinetics), a constant volume of blood is cleared by the organs,
and thus, the value of CL is constant over the clinical concentration range.
( )A
VAorgan C
CCQ
Cinationlimeofrate
CL−⋅
== Equation 6

6 INTRODUCTION
Thus, with known blood flow (Q), venous and arterial drug concentration (CV and CA),
the clearance of drug eliminating organs (mainly kidney and liver) can be determined
and added to yield the total clearance CLtot. As the arterial drug concentration and
additional elimination processes in saliva or sweat are difficult to obtain, further
equations for clearance have been developed.
Experimentally, CLtot can be determined after a single intravenous dose (complete
bioavailability) by the following equation:
AUCDose
CL tot = Equation 7
Accordingly, renal clearance (CLR) is the volume of blood, which is cleared by the
kidneys and can be experimentally determined by the amount of drug excreted in the
urine (Ae∞):
Dose
CLAe
AUC
AeCL tot
R⋅
== ∞∞ Equation 8
Pharmacodynamics is dealing with the effect of drugs on the organism, including
the target site, mode of action, resistance mechanisms, potency and efficacy. The
mode of action of anti-infectives is for example inhibition of cell wall synthesis (e. g.
β-lactams), inhibition of DNA-synthesis (e. g. quinolones), or inhibition of bacterial
protein synthesis (e. g. macrolides).
Typically, the effect of antibiotics is evaluated by susceptibility testing of bacterial
cultures, which are exposed to different concentrations of the drug. After 18-24 hours
of incubation, the minimum inhibitory concentration (MIC) can be assessed [1].
The PK/PD concept is originally based on an idea of Eagle et al. [10], who studied
in 1950 the effect of the dosing schedule on the efficacy of penicillin. Approximately
50 years later, when systematic studies on various antibiotics were performed,
PK/PD became a booming field of research [1, 11-15]. It correlates pharmacokinetics
studying concentration-time curves and pharmacodynamics evaluating effect-
concentration curves (Figure 4) to effect-concentration-relationships. This makes
sense, as the bacteria in a living organism are not subjected to the constant
concentration like in a test tube, but to the time course of the concentration curve
affecting the efficacy of the antibiotic.

Pharmacokinetics and Pharmacodynamics 7
Figure 4 Typical concentration versus pharmacodynamic effect curve
0
20
40
60
80
100
0 0.1 0.2 0.3 0.4 0.5
Effe
ct (
%)
Concentration (e.g. µg/mL)
Correlating the three main PK parameters to the MIC results in three PK/PD
parameters for efficacy:
MICT;MIC
AUC;
MIC
C 240max >−
They can be used for optimising dosing regimens for antibiotics. For example,
splitting the single dose every 24 hours into one third of the dose, given every
8 hours, would give the same overall AUC/MIC ratio, but a decreased Cmax/MIC and
in many cases an increased T>MIC.
The endeavour of PK/PD modelling is to find that parameter, which predicts efficacy
of a given antibiotic best, giving helpful hints for optimizing treatment and for
preventing antimicrobial resistance.
All those calculations and considerations are based on plasma concentration-time
curves from measured data points and measured MIC values. Therefore, it is crucial
that microbiological and bioanalytical methods, which are intended to generate the
data for PK/PD calculations, must fulfil particular requirements, including technical,
scientific and also regulatory aspects.

8 INTRODUCTION
Figure 5 PK/PD concept for antibiotics (shown on data, which will be presented
later on page 109)
0
0.1
0.2
0.3
0.4
0.5
0.6
0.7
0.8
0 4 8 12 16 20 24
Con
cent
ratio
n (µ
g/m
L)
Time (h)
MIC
Cmax
AUC0-24
T > MIC
1.3 LC-MS/MS – techniques and progress with time
Mass spectrometry (MS) was born in 1897, when Sir J. J. Thomson discovered the
electron, for what he was awarded the Nobel Prize in Physics in 1906. At the
beginning of the 20th century he constructed the first mass spectrometer, sorting ions
according to their trajectory in the electromagnetic field. Thomson’s scholar F. W.
Aston (1922 Nobel Prize in Chemistry) and A. J. Dempster improved resolution and
developed the first ionisation technique EI (electron ionisation). Chemists sought
high resolution mass analyzers, being able to detect elements and small molecules,
which led to the development of time-of-flight and quadrupole mass spectrometers.
Those could be coupled to gas chromatography (GC) and later in the 1950s to liquid
chromatography (LC) by W. Paul, who was awarded the Nobel Prize in Physics in
1989 for his evolutions in ion-trap MS.
Despite high improvements in resolution and quantitative analysis by coupling to
liquid chromatography were achieved, in the 1980s still no large molecules could be
analyzed as these were fragmented already during ionisation or evaporation. It was
only when J. B. Fenn applied the soft ionisation technique ESI (electrospray
ionisation) to peptides and F. Hillenkamp, M. Karas and K. Tanaka developed the
MALDI technique (matrix assisted laser desorption ionisation), biological
LC-MS/MS – techniques and progress with time 9
experiments with biological macromolecules became possible. J. B. Fenn and
K. Tanaka were awarded with part of the Nobel Prize in Chemistry in 2002 for this
work [16].
Here, triple-quadrupole mass spectrometers with soft ionisation techniques coupled
to liquid chromatography were applied to quantification of pharmaceutical molecules
in complex biological matrices.
1.3.1 Ionisation Sources
The ionisation source plays an important role for mass spectrometry as it is
responsible for generating detectable ions from the sample solution. A number of
ionisation sources for solid and liquid samples are available. The most common
techniques for transferring compounds from liquids into the gas phase are
electrospray ionisation (ESI) and atmospheric pressure chemical ionisation (APCI).
As they are soft ionisation techniques they are widely used for the analysis of
pharmaceuticals.
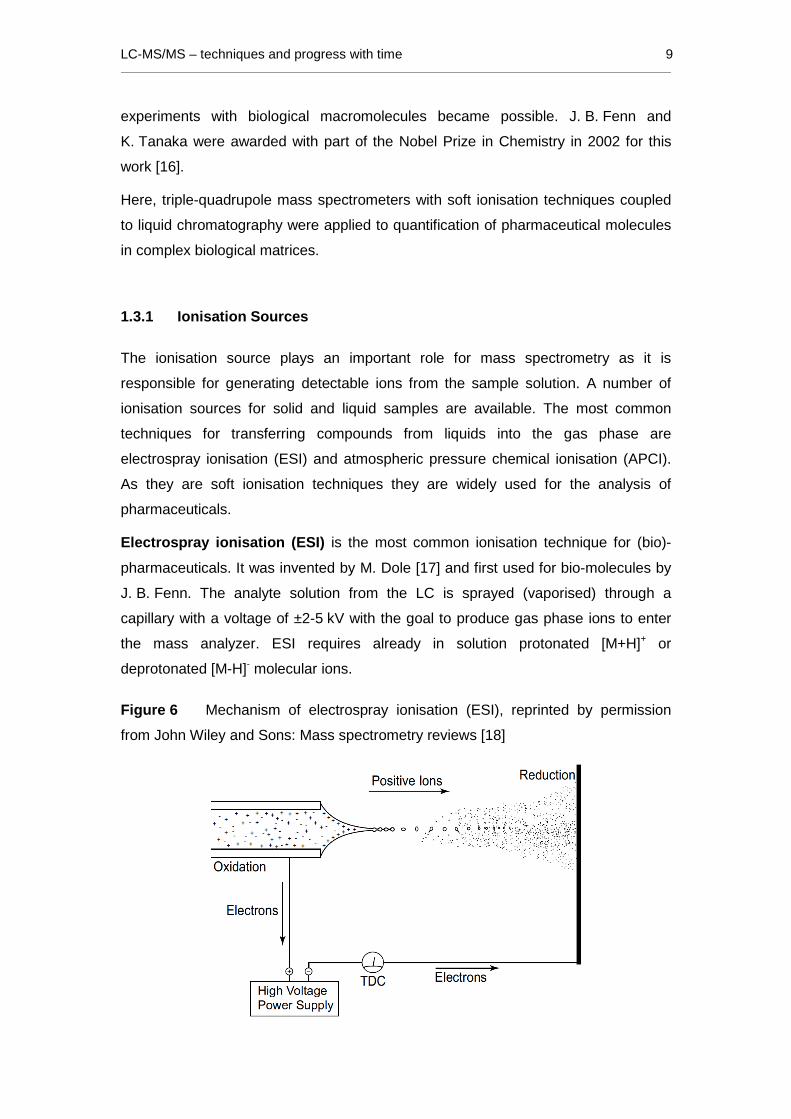
Electrospray ionisation (ESI) is the most common ionisation technique for (bio)-
pharmaceuticals. It was invented by M. Dole [17] and first used for bio-molecules by
J. B. Fenn. The analyte solution from the LC is sprayed (vaporised) through a
capillary with a voltage of ±2-5 kV with the goal to produce gas phase ions to enter
the mass analyzer. ESI requires already in solution protonated [M+H]+ or
deprotonated [M-H]- molecular ions.
Figure 6 Mechanism of electrospray ionisation (ESI), reprinted by permission
from John Wiley and Sons: Mass spectrometry reviews [18]

10 INTRODUCTION
By evaporation of solvent molecules, the droplets shrink until the charge repulsion is
high enough for Coulomb explosion. These smaller droplets run through the same
process until smallest charged droplets are formed. Still, research is ongoing how
the gaseous phase ions are formed from these last highly charged droplets. Two
different mechanisms have been postulated: the ion evaporation model (IEM) first
linked to the names of Iribarne and Thomson [19-21], and the charged residue model
(CRM) first postulated by Dole et al. [17, 22]. Kebarle et al. [18, 23] summarized the
mechanisms and concluded, that IEM is supposed for small ions, while the CRM is
more plausible for large macromolecules.
As the analytes need to be charged already in solution, this technique is suitable for
moderate polar to polar compounds. ESI is able to produce multiply charged ions,
useful for the analysis of peptides and proteins. Moreover, the technique allows the
use of very low flow rates, enabling the analysis of samples with less sample volume
(e. g. proteins). Here, a TurboIonSpray® interface was used, which facilitates
desolvation by a heated inert gas.
Non-polar compounds often show poor sensitivity after ESI and are much more
accessible using APCI.
Figure 7 Mechanism of atmospheric pressure chemical ionisation (APCI),
reprinted by permission from AB Sciex Pte. Ltd.
Atmospheric pressure chemical ionisation (APCI) is slightly different from ESI.
The compounds need not to be charged in solution, which is vaporized in a quartz
tube (temperatures between 300 and 500 °C), since they are ionized by primary ions
from solvent molecules or from air. Primary ions are generated on a corona
discharge needle with a current of ±3-5 µA and can be CH3OH2+, H3O
+, OH-, CH3O-,
CH3CNH+ from solvent molecules or e. g. O2+, O2
- from air. Ionisation of the analyte
takes place via charge transfer or proton transfer from the primary ion onto the

LC-MS/MS – techniques and progress with time 11
analyte. However, also adducts may be formed of the analyte with NH4+ or Na+ from
LC modifiers, which are often not reproducible enough for a sound quantification of
pharmaceuticals in plasma samples from a high number of individuals.
1.3.2 Triple quadrupole technology
Molecular ions, produced in the ion source at atmospheric pressure (760 torr,
1013 mbar), enter the first region of the mass spectrometer via a small orifice; here
through a so-called “curtain gas” (inert gas), which assists declustering from solvent
molecules. This part of the mass spectrometer is evacuated by a first turbo pump
and a backing pump to ensure a high vacuum and avoid collisions with other
molecules. In this region, the molecular beam is focused and led through a first
quadrupole, the Q0, see Figure 8. Focussing in this first region is achieved in
different ways in different mass spectrometers, see chapter 1.3.3. The actual mass
analysis takes place in the high vacuum region (10-5 torr), which is evacuated by a
second turbo pump and backing pump. Additional stabilizers and lenses are involved
to keep the ions on their path towards the detector, which is in this case a channel
electron multiplier. Two main principles accelerate the ions into and through the
mass spectrometer: the vacuum gradient and the DC voltage differential, see Figure
8.
Figure 8 Schematic ion path of the triple quadrupole mass spectrometer
API 5000™ LC-MS/MS system, adapted from AB Sciex Pte. Ltd.
Q1 q2 Q3
DetectorCollision CellIon Source Q0QJet™Ion Guide
Curtain Gas Interface
Stabilizer & Lenses
10-4 torr 10-5 torr1 torr760 torr
Ions are drawn through mass spectrometer by vacuum gradient and DC voltage differential
Quadrupole mass spectrometers are also called mass filters, as they have the ability
to selectively filter ions with a given mass-to-charge ratio (m/z) by a combination of
direct current (DC) and alternating current (AC), applied to each quadrupole. A single
quadrupole consists of four parallel metal rods (Figure 9), of which the two opposite
ones are equally charged. The potential of opposite rods is ±( U + Vcos(wt) ), where

12 INTRODUCTION
U is a DC voltage and Vcos(wt) is an AC voltage with V being the amplitude and w
the frequency.
Figure 9 Schematic of a quadrupole mass filter, reprinted by permission from
B.M. Tissue [24]
If only AC is applied to the rod pairs, all ions move on spiral-shaped flight paths
towards the detector. If additionally a certain DC is applied to the rods, all ions
(except the ones with the appropriate m/z) are dropped from their trajectory and
filtered by collision with the rods. By scanning a quadrupole, the DC/AC ratio is
elevated constantly to allow each m/z ratio to reach the detector for a certain time.
Dependent on which currents are applied to which quadrupoles, different scan
modes can be introduced:, see Table 1.
For known compounds, as is normally the case during bioanalytical measurements
of clinical trial samples, the Q1 spectrum is recorded for confirming and optimizing
the intensity of the drug’s molecular ion in the spectrum. The product ion spectrum is
recorded for selecting and optimizing a characteristic fragment ion of the drug. These
fragment ions are most often build within the Q2 by collision-activated dissociation
(CAD) with an inert gas (here: nitrogen), but may also be produced in the first region
of the mass analyzer by collision-induced dissociation (CID) with gas molecules from
the curtain gas or due to the lower vacuum.

LC-MS/MS – techniques and progress with time 13
Table 1 Types of spectra with a triple-quadrupole mass spectrometer according
to different application modes of the three quadrupoles
Type of spectrum Q1 Q2 / Collision gas Q3
Q1 spectrum Scanning AC only / no AC only
Q3 spectrum AC only AC only / a little Scanning
Product ion spectrum Filtering AC only / yes Scanning
Precurser ion spectrum Scanning AC only / yes Filtering
Multiple reaction monitoring Filtering AC only / yes Filtering
Neutral loss scan Scanning AC only / yes Scanning
(in sync with Q3) (in sync with Q1)
The exact masses of the precursor ion from the Q1 and normally one characteristic
fragment from the product ion spectrum are then used to set the triple quadrupole to
the MRM (multiple reaction monitoring) mode, which is used for quantitative analysis:
The first quadrupole (Q1) selects the precursor ion, which is then fragmented in the
second quadrupole (Q2). In the third quadrupole (Q3) a specific fragment, which is
characteristic for the pharmaceutical compound, is selected. For that reason the
triple quadrupole is highly selective as not only the molecular ion but also one (or
more) of its characteristic fragments is monitored. This plays an important role for
quantification of compounds in complex matrices, such as human plasma or urine.
The selectivity does not only affect the analyte of interest but also the background
ions. A decrease of background ions is observed which results in an overall increase
of the signal-to-noise ratio of the analyte, resulting in an extended sensitivity. These
two characteristics – sensitivity and selectivity – make the triple quadrupole mass
spectrometer superior to UV or fluorescence detection techniques and the ideal
instrument for bioanalytical measurements in samples from clinical trials.
1.3.3 Progress in the construction of mass spectrom eters
During the past decade a fast improvement of mass analyzers occurred, making it
possible to selectively quantify smaller and smaller amounts of analytes in complex
matrices, like human plasma. The most obvious alternation is the ionisation source:
Whereas the API III and API 3000™ were equipped with the horizontal spraying

14 INTRODUCTION
TurboIonSpray® (TISP) source, the API 5000™ is now equipped with the vertical
spraying TurboV™ (TVSP) source, allowing higher flow rates and thus better
separation of ions from non-charged particles.
But the major improvements are located within the ion path. The orifice diameter, for
example, grows from 0.1 mm [25] over 0.25 mm [26] to 0.62 mm [27] allowing a
larger number of molecular ions to enter the mass spectrometer, but making
improved declustering and ion focusing necessary. This can be achieved by a
skimmer, which is a funnel-shaped component directly behind the orifice, functioning
by gas dynamics. It was later replaced by a more complex component, the QJet™
ion guide, which uses a combination of gas dynamics and radio frequency fields [27].
All those technical alterations were done to improve system performance and
facilitate quantification methods. In order to keep those methods to the state of the
art, they have to be transferred regularly to the newer instruments.
1.4 LC-MS/MS method development
Bioanalytical LC-MS/MS method development comprises three main parts: At first,
MS/MS spectra are recorded and mass spectrometry settings are optimized, to find a
specific fragment ion and the most appropriate system parameters. Second, a fast
liquid chromatography method, suitable for MS/MS detection, is developed to
separate the analytes from matrix components. Third, a cost-effective and selective
sample preparation technique is selected and optimized, supporting the analysis by
LC-MS/MS. These steps are described in the following chapters and are
complemented by the selection of a suitable internal standard and setting the
calibration range.
1.4.1 MS/MS spectra and system optimization
To evaluate the most intensive signals, different ionisation sources and both, positive
and negative scan mode should be tested. The ionisation can be evaluated best by
infusing an analyte solution directly into the ion-source with the temperature set to
zero. In most cases, heating the nitrogen stream in the TISP or TVSP source step by
step to a maximum temperature of 350 °C (API 3000™) or 600 °C (API 5000™), is
useful to optimize desolvation of the analyte ions and to observe analyte instabilities
in the heat. Doing so, an appropriate equilibration time should be kept after each

LC-MS/MS method development 15
step. APCI cannot be used without heat as the complete solution needs to be
vaporised within the quartz tube. Therefore, optimizing the temperature should be
done in relation to the solvent flow.
With each ionisation source, a precursor ion spectrum (Q1) and a product ion
spectrum of the protonated or deprotonated molecular ion should be recorded in the
positive and in the negative scan mode. Using the most promising ionisation source
and polarity, the mass spectrometer settings have to be optimized for the precursor
ion. Analyzing pharmaceuticals with low molecular masses, in most cases the mass-
to-charge ratio (m/z) of the precursor ion is equal to the exact mass plus or minus
one (depending on the polarity of the scan mode). The aim is to intensify the m/z
signal of [M+H]+ or [M-H]- by scanning the Q1 (without collision gas) and
incrementing the gas settings and the electronic settings, i. e. the declustering
potential (DP) or the orifice voltage (OR).
Using the optimized settings for the precursor ion, the electronic settings for the
product ion is optimized. The most important parameters for fragmentation are
collision energy and collision gas density. In most cases, the most abundant product
ion can be used for the mass transition, but two more factors have to be considered
for selecting the fragment:
Analyzing small amounts of an analyte in complex matrices like plasma samples, not
only the intensity of a fragment signal is crucial, but also the specificity of its
underlying fragmentation reaction. Another molecule which has co-incidentally the
same molecular mass may also loose water or carbon dioxide, but will most likely not
loose the same mass if divided by an intra-molecular reaction into large fragments.
The second case considers analyzing a metabolite. One should be aware that a
second metabolite in the plasma sample may have the same molecular mass and
probably has some fragment ions in common. This can be the case if, for example, a
hydroxyl group is connected to another carbon atom. In such a case, not only the
selection of a useful fragment ion is essential, but also the sensible separation via
chromatography.
At last, a Q1 spectrum and a product ion spectrum of the analyte with all optimized
parameters are recorded to select the exact m/z values of the precursor ion and the
desired fragment ion for the mass transition in the MRM mode.

16 INTRODUCTION
1.4.2 Liquid chromatography for combined use with m ass spectrometry
In contrast to conventional HPLC (high performance liquid chromatography) and due
to the ionisation techniques for mass spectrometric detection, only volatile solvents
and buffers may be used for LC with MS or MS/MS detection. These are acetonitrile,
methanol, water, 2-propanol, acetic acid and formic acid (0.1-0.5 % v), ammonia,
ammonium acetate and ammonium formate (2-10 mM in positive ion mode, 2-50 mM
in negative ion mode). The use of TFA (trifluoroacetic acid) or TEA (triethylamine) as
ion-pairing reagents in the mobile phase to improve peak shape and resolution
should be carefully balanced against sensitivity issues as they may suppress the
signal intensity of the analyte by preventing efficient desolvation and ionisation in the
MS ion source.
In LC with MS/MS detection, the mobile phase composition is pre-determined by the
ionisation process to a certain extend. Though, depending on which ionisation
technique serves best for the analyte (e. g. polar compounds for ESI), the mobile
phase is pre-determined to a certain extend. This means that for ESI ionisation, the
compound should be already ionized within the mobile phase, which is achieved by
setting the pH at least two units above or below the compound’s pKa. In order to
avoid ion suppression at the same time, the mobile phase should have a rather small
ion strength, typically 2-10 mM. Additionally, for ESI acetonitrile should be preferred
versus methanol, as it assists desolvation in the gaseous phase slightly better.
However, if APCI showed better intensity during pre-tests, the mobile phase should
consist of the protic solvent methanol and slightly higher ion strength by ammonium
acetate or formate.
Consequently, column selection permits more degrees of freedom, as a variety of
reversed-phase columns had been developed in the past years. The most common
columns are based on silica modified by C18 or C8 chains, which are preferably
used for hydrophobic compounds. Starting with a certain water (or buffer) content in
the mobile phase an increase of the organic content will increase elution of the
analytes. Especially silica columns with steric large C18 chains, still contain not-
modified silanol groups. Depending on the concrete application, remaining silanol
groups can assist or trouble chromatography. Therefore, columns with TMS
(trimethylsilane) “endcapping” are a good alternative. The carbon content of C18 and
C8 columns gives a good information on how many (steric large) C18 or C8 chains
are present on a given column packing. For more polar or aromatic compounds,
phases modified with -NH2, -CN or -C6H5 are recommendable.

LC-MS/MS method development 17
As modified silica phases are not stable in basic conditions over pH 8 and only for
short time in acidic conditions below pH 2, column packings based on polymers have
been developed, which allow for instance retention of hydrophobic and basic
compounds under basic pH conditions.
Due to the MRM mode in MS/MS detection, peaks need not necessarily be
separated from each other; but from matrix components avoiding matrix effects
within the ionisation source. Nevertheless, as metabolites often differ only in the
position of a hydroxyl group, the m/z of the fragments may be equal and therefore
must be clearly separated in the LC. Caution has to be taken, if fragments with the
same m/z of pharmaceutical and metabolites had to be chosen for MRM transitions.
Therefore, in most cases, it is possible to use short columns with small inner
diameters to produce short run times by retaining the analytes for one or two minutes
on the at most specific column and in this way creating high-throughput methods.
1.4.3 Sample preparation techniques
Before samples can be analyzed with LC-MS/MS, matrix components need to be
removed to prevent columns from clogging and to ensure a low background during
the ionisation process. In general, there are three common sample preparation
procedures for LC-MS/MS: protein precipitation (PPT), liquid-liquid extraction (LLE)
and solid phase extraction (SPE).
PPT is the method of choice to achieve sample extracts from human plasma,
because ideally, only one or two pipetting steps are necessary per sample and only
small amounts or low-cost chemicals are needed. Typically, sample and precipitation
reagent (e. g. acetonitrile) are mixed at a ratio of 1:2 or 1:3 (v/v). Addition of acids
(formic acid, acetic acid, trifluoroacetic acid) to the precipitation reagent may result in
a more efficient precipitation process and needs to be investigated during method
development. After centrifugation, the supernatant can additionally be diluted with
buffer to reduce the organic content in the sample, which may result in sharper
chromatography. Instable drugs can be stabilised before precipitation by adding a
buffer with the corresponding pH-value or special stabilising agents. Polson et al.
[28] evaluate various protein precipitation methods and conclude that the overall ion
strength should be as low as possible for ESI ionisation, including the sample extract
as well as the mobile phase. However, matrix effects can be compensated by the
internal standard, which is tested during method development and validation.

18 INTRODUCTION
Low-dosed or rapid-metabolized drugs often require concentration of the sample,
which can be achieved by liquid-liquid extraction (LLE) or solid phase extraction
(SPE). According to Bonfiglio et al. [29], liquid-liquid extracts demonstrate the least
matrix effect in ESI ionisation. During LLE, an excess of organic solvent is added to
a certain amount of biological sample and shaken virtuously. Typically, the organic
layer is then evaporated to dryness and reconstituted in a water containing solvent.
According to the physical and chemical properties of the analyte, an appropriate
extraction solvent needs to be selected. Moreover, the extraction efficiency strongly
depends on the pH value, which needs to be investigated during method
development. The major drawback of this technique is lipids, which might be
extracted by certain organic solvents from the biological sample together with the
analyte and can disturb the chromatography. Additionally, a large amount of costly
organic solvents is needed and automation of LLE methods is rather not trivial.
The third common sample preparation technique is SPE, where a stationary phase is
used for sample purification and enrichment. Like HPLC columns, a variety of
stationary phases are available for analytes with different physical and chemical
properties. After column conditioning each sample is loaded on its own SPE column,
where the analyte molecules bind to the stationary phase. Then, matrix components
are removed from the sample by pre-defined washing steps. Finally, the purified
analyte is eluted with an appropriate solvent and evaporated to dryness. The re-
dissolved extract is then injected into the LC-MS/MS system. This technique evolves
most expenses for material and time, but is sometimes unavoidable when very small
amounts of analyte have to be detected with high precision. Then, analytes are
concentrated by using a relatively large plasma sample volume and re-dissolving the
dried analyte in a much smaller volume.
Optimising these techniques with regard to high-throughput has been an emerging
field in past years, which was reviewed previously [30-31]. The most important
innovation is the use of 96-well plates, available for all three sample preparation
techniques, where only the first step involves pipetting single samples, while all
further steps are carried out with 8-channel or 12-channel pipettes, or with robots,
which are able to transfer up to 96 samples at the same time, which is also used
here, see chapter 5.1.3.

LC-MS/MS method development 19
1.4.4 Selecting the Internal Standard
The internal standard (IS) plays an important role in bioanalytical methods for high
sample numbers from many different individuals. When the IS is added to each
sample as first step of sample preparation, the IS response in each sample can
correct for imprecision (variation) and inaccuracy (correctness) of the analyte
response deriving for example from sample handling during the work-up procedure
or from different endogenous plasma matrix components in calibration samples and
in unknown samples from clinical trials. The latter is known as matrix effect,
predominantly occurring in bioanalytical methods using LC-MS/MS.
Stable isotopically labelled compounds show virtually similar behaviour to the analyte
and are, therefore, preferred as internal standards. However, limited availability or
high costs for synthesis (especially when new chemical entities have been
developed for first pharmaceutical use in man) force the analyst to use structural
analogues for internal standardization of sample preparation and analysis.
For practical purposes, the IS response (i.e. peak area or peak height) should be
high enough to give stable signals and well integrable peaks, but it should not be too
high to avoid analyte signals in blank samples, e.g. caused by isotopic impurity of
stable isotopically labelled compounds.
1.4.5 Setting the calibration range
Ideally, for the determination of a complete pharmacokinetic profile, the lower limit of
quantification (LLOQ) needs to be zero, because at the end the drug should leave
the organism completely. However, the goal and the design of the clinical trial may
not foresee sampling until plasma concentrations are zero and in addition,
extraordinary sensitive assays often involve cost intensive equipment and time
consuming sample preparation techniques.
For bioequivalence studies minimal requirements for the LLOQ have been defined
by the EMA [3]: “The lower limit of quantification should be 1/20 of Cmax or lower, as
pre-dose concentrations should be detectable at 5 % of Cmax or lower.” The reason
behind is assuring an un-biased Cmax from study periods one and two, which must be
separated by a sufficient long wash-out period. This rule is also rational for other
than BE studies, but one should be aware of the fact that Cmax is not a fixed value,
but underlies a certain inter-subject variation. Therefore, for the estimation of the
expected Cmax it is crucial not only to consider drug, dose, formulation (e. g. extended

20 INTRODUCTION
release), study design (fed or fasted), but also the study population, i. e. healthy,
elderly, pediatric, renal or hepatic impaired patients. The last sampling time and half-
life of the drug also play an important role for estimating the concentration in the last
plasma sample. Often, also metabolites should be included in those pharmacokinetic
considerations.
If a bioanalytical assay is very sensitive per se, which means that the simplest and
cheapest techniques already allow a very sensitive method, then it is advisable to
validate the lowest possible LLOQ, even if higher concentrations are expected. The
reason is: Since drug development implies various clinical trials with different
dosages or formulations, the calibration range may have to be adjusted later on.
Then, it is much easier to add a partial validation to elevate the concentration range
than screwing more sensitivity out of a method without changing equipment (which
would require a complete new validation).
In some cases, the needed concentration range is wider than the linearity range of
the assay, in particular of the detector. Then, the calibration range is set to the
required LLOQ and the highest linearly detectable concentration is set as the ULOQ
(upper limit of quantification). Samples with concentrations exceeding the calibration
range can be diluted before analysis, which then has to be proven in an appropriate
validation experiment (see chapter 2.5.11 Dilution integrity). Nevertheless, it is not
advisable to pre-dilute a large number of the study samples.
1.5 Why do we have to validate?
The data obtained from measurement of samples from clinical trials is used for the
decision, if a new chemical entity can be applied to ill human beings. This decision is
basically an ethical question, which is therefore secured against errors and
manipulation.
In 1995 and 1996 the ICH (International Conference on Harmonization of Technical
Requirements for Registration of Pharmaceuticals for Human Use within the EU,
Japan and the USA) published the first, but rather general guidance for industry to
harmonize the procedure for validation of analytical procedures to ensure valid
interpretation of clinical trial data. The ICH guideline was renewed in 2005 [32] and is
still the basis for bioanalytical work.

Why do we have to validate? 21
However, in 2001 the first concrete guideline on BMV was implemented by the FDA
[33], addressing accuracy, precision and selectivity like ICH, and adding acceptance
criteria for analytical runs. In 2012, the first guideline on BMV by the EMA became
effective [34], including experiments that have been grated as additionally important
since 2001, like ISR (incurred sample re-analysis) [35-42], or should be determined
in a different way, like ME (Matrix Effect) [43-46].
These new concepts target basically the same idea: Calibration standards are
normally prepared in a pool of blank matrix (e. g. plasma or urine) of healthy donors,
while the samples with unknown concentrations come in an extreme case from
thousands of ill patients (i. e. in Phase IV studies) with highly varying composition of
plasma components. Analyzing part of those samples a second time as ISR gives a
good idea on assay reproducibility, accuracy and precision; in some cases even a
better idea than validation experiments with spiked blank matrix pools.
The second new concept is focused on the ME which is unwanted when co-eluting
matrix components from single unknown samples enhance or suppress the
ionisation of the analyte in the ion source of the MS, which causes an over- or under-
estimation of the signal compared to the calibration standards. In principle, some
sentences addressing this issue are already included in the FDA guideline on BMV
[33], but conduct and expressiveness of ME assessment differed a lot between
laboratories [45], which was 2012 brought to a consensus in the EMA guideline on
BMV [34].
For the sake of completeness: The third important new concept introduced and
referenced by the new EMA guideline is GCLP (Good Clinical and Laboratory
Practice), which is explained in a new EMA Reflection paper [47]. It emphasizes the
ethical responsibility also of bioanalyticists who should act with due diligence, for
example regarding written informed consent by the subjects having donated the
samples. This is regarded as a step towards applying the principles of GLP (Good
Laboratory Practice), which were originally intended for non-clinical studies, also to
clinical studies to support the international acceptance of laboratory data within the
OECD (Organisation for Economic Cooperation and Development).
Current developments include release of the Guideline on Bioanalytical Method
Validation in Pharmaceutical Development [48] by the Japanese Ministry of Health,
Labour and Welfare (MHLW) in September 2013, which is a well conceived
document concording with the main ideas of the EMA guideline. In the same month
the FDA published their second draft Guidance for Industry on Bioanalytical Method

22 INTRODUCTION
Validation, which is differing in several topics from previous guidelines by FDA and
EMA as was recently commented by different organisations like the American
Association of Pharmaceutical Scientists (AAPS), the European Bioanalysis Forum
(EBF), and the Global Bioanalysis Consortium (GBC). The release of the final
document is planned for March 2014.
These developments took place after the experimental part of this thesis was
completed.
1.6 Aims of this thesis
The aim was to develop and validate fast, highly sensitive, precise, and accurate
LC-MS/MS methods, complying with regulatory guidelines, for the analysis of human
plasma and urine from clinical trials and to use the concentration data for the
calculation of pharmacokinetic parameters in the context of pharmacokinetic-
pharmacodynamic principles.
Several therapeutically important drugs were investigated.
a) Erythromycin ethylsuccinate has been marketed for many years, yet it’s
pharmacokinetics were not well described since appropriate methods did not
become available. In particular, the extraction process was in many cases not
suitable to determine the prodrug erythromycin ethylsuccinate from the active base
erythromycin A. For the simultaneous quantification of erythromycin ethylsuccinate
and erythromycin A in human plasma only sparse data on analyte stability and
methods had been previously published, which used liquid-liquid extraction (not
under cooled conditions). These methods were not suitable for the application in
regulated high-throughput analysis of samples from a clinical trial.
b) Another macrolide widely used in Germany is roxithromycin. However, it has
never been approved for use in the United States. Since pharmacokinetic data on
roxithromycin are characterized by a high variability (different expression of CYP3A4
in liver and intestine and saturable protein binding at higher concentrations), a
pharmacokinetic study until 120 hours after administration was desirable, leading to
the need for an LC-MS/MS method, which is much more sensitive than previous
methods. Only three LC-MS/MS methods for the determination of roxithromycin
concentrations in human plasma were previously reported, which were characterized

Aims of this thesis 23
by too high LLOQs [49-50], too laborious sample preparation procedures [49], or too
long analysis times [49, 51].
c) Clarithromycin is also widely used and has worldwide importance. Clarithromycin
is metabolized to a hydroxylated metabolite, which exhibits at least one half of the
parent compound’s antimicrobial activity. Therefore, it is crucial to analyze both
compounds in samples from a clinical trial studying clarithromycin. Several LC-
MS/MS methods have been reported for the analysis of clarithromycin in human
plasma, but only four of them determined both, clarithromycin and 14-hydroxy
clarithromycin. Two of them estimated 14-hydroxy clarithromycin only semi-
quantitatively [52-53]. Since the reported LLOQs of the remaining two methods [54-
55] were too high for the quantification of all concentrations until 36 hours (including
inter-subject variability) after the administration of 250 mg clarithromycin, a new
method needed to be developed and validated.
The ruggedness of these macrolide methods should be tested by comparing the
selectivity, sensitivity, linearity range, matrix effects, accuracy and precision data in
validation experiments on three LC-MS/MS systems, differing from each other in the
way of construction of the ionisation source and the ion focussing region of the ion
path.
d) Many β-lactams have been introduced since the early days of penicillin G [56].
Flucloxacillin was considered an important step forward, however, its
pharmacokinetics are not fully understood. For the determination of flucloxacillin only
two LC-MS/MS methods had been previously published: One was designed to
analyze commercially available drug products [57] and the second one was
characterized by a too high LLOQ [58], since it was applied to a PK study of
intravenous flucloxacillin doses (1.5 to 5 g). Therefore, a highly sensitive method
should be developed and validated for the regulated quantification of plasma
concentrations from a 250 mg oral dose of flucloxacillin.
e) Piperacillin can be considered a real breakthrough into broad spectrum antibiotics
and will continue to be a substantial agent in antimicrobial therapy. Only four LC-
MS/MS methods for determining piperacillin in human plasma or serum have been
reported to day [59-62], but none of them was validated for analysis of urine
samples. These methods are characterised by relatively long analysis times per
sample (5.5 to 8.0 minutes), expensive and laborious sample preparation techniques
or reported issues with poor precision [59] since they were not designed specifically
for piperacillin, but for detecting a large number of β-lactams. The aim was to

24 INTRODUCTION
develop and validate a new LC-MS/MS method for the fast and cost-effective
determination of piperacillin concentrations in human plasma and urine from a
clinical trial studying a 4 g intravenous dose of piperacillin.
f) Moxifloxacin is the latest fluoroquinolone that was not only successfully introduced
into the market, but also received great acceptance by physicians. Yet, recently
adverse events [63-64] have been reported that make any further investigation into
moxifloxacin questionable. Only two LC-MS/MS methods for the analysis of
moxifloxacin in human plasma samples had been reported [65-66]. However, both
were not useful for the intended application since they were characterised by either a
very high sample volume of 1 mL plasma or by less sensitivity (0.050 µg/mL).
Therefore, the aim was to develop and validate an ultra-fast and highly precise
method using protein-precipitation for the determination of moxifloxacin in human
plasma samples from a clinical trial studying a 400 mg oral dose of moxifloxacin.
Summary of aims of this thesis
All methods were fully characterized by using parameters like accuracy, precision,
sensitivity, selectivity, run time, linearity, extraction recovery and matrix effects.
These parameters were discussed in detail and compared to methods from the
literature. Moreover, the method parameters of the macrolides were compared on
three different mass spectrometers and discussed with respect to technical
construction.
Acquired stability data of the examined anti-infectives and their metabolites were
explained by chemical reaction mechanisms and were set into the context of stability
data from the literature as well.
The purpose of the methods was to analyse samples from clinical trials, which in turn
are designed to obtain pharmacokinetic data on the investigated drugs. The gained
parameters like AUC, Cmax, tmax and t1/2 were compared to data from previously
reported comparable trials. The obtained plasma concentration-time curves were
correlated graphically with MIC values of popular microorganisms which might be a
starting point for further PK/PD investigations.

2 MATERIAL AND METHODS
2.1 Instrumentation and software
Mass spectrometers and software products
API III Plus RAD 1.6, MacQuan 1.5
API 3000™ SampleControl 1.4, LC2Tune 1.4, MacQuan 1.6
API 5000™ Analyst 1.4.2
all from AB SCIEX (Concorde, Ontario, Canada),
supplied by Applied Biosystems GmbH (Darmstadt, Germany)
Calculation Software
Microsoft Excel 2000 Microsoft Corporation, Redmond, WA, USA
WinNonlin™ Professional 2.0 Pharsight Corporation, Palo Alto, USA
HPLC pumps
L-6000 Lichrograph HPLC pump Merck KGaA, Darmstadt, Germany
L-6200A intelligent HPLC pump Merck KGaA, Darmstadt, Germany
HPLC pump 1200 Series Agilent Technologies, Waldbronn, Germany
Harvard apparatus syringe pump 11 Harvard Apparatus Inc., Massachusetts, USA
Autosamplers
L-7250 LaChrom autosampler Merck KGaA, Darmstadt, Germany
CTC CombiPal autosampler CTC Analytics, Zwingen, Switzerland
CTC HTS Pal autosampler CTC Analytics, Zwingen, Switzerland
Automated 96-Channel Pipettor
Multimek™ Beckmann Coulter GmbH, Krefeld, Germany

26 MATERIAL AND METHODS
Chromatography columns
Aqua C18, 5µm (50x4.6 mm) Phenomenex Ltd., Aschaffenburg, *
Betasil C18, 5µm (50x4.6 mm) Thermo Electron Corporation, Dreieich, *
Nucleosil 100 NH2, 5µm (40x4.6 mm) Alltech Grom GmbH, Rottenburg-Hailfingen, *
Spherisorb Phenyl, 5µm (60x4.6 mm) Alltech Grom GmbH, Rottenburg-Hailfingen, *
Symmetry C8, 5µm (50x4.6 mm) Waters GmbH, Eschborn, *
YMC ODS AM, 3µm (50x4.6 mm) YMC Europe GmbH, Dinslaken, *
YMC Pack CN, 3µm (50x4.0 mm) YMC Europe GmbH, Dinslaken, *
*Germany
Pipettes
Eppendorf Reference® 10-100µL Eppendorf, Hamburg, Germany
Eppendorf Reference® 100-1000µL Eppendorf, Hamburg, Germany
Eppendorf Reference® 500-2500µL Eppendorf, Hamburg, Germany
Eppendorf Reference Multipette® Eppendorf, Hamburg, Germany
Centrifuges
AllegraTM X-12R Centrifuge Beckmann Coulter GmbH, Krefeld, Germany
Biofuge primo R Heraeus Sepatech, Osterode, Germany
Laboratory mixer
Heidolph REAX 2000 Vortex Mixer Heidolph-Elektro GmbH, Kelheim, Germany
Multitube Vortex Mixer VWR Scientific, South Plainfield, NJ, USA
Analytical balance
Mettler AT261 Delta Range® FACT Mettler-Toledo GmbH, Gießen, Germany
pH-Meter
WTW pH 521 WTW GmbH, Weilheim, Germany

Reference compounds, chemicals and biological specimens 27
Ultrasonic bath
Sonorex Super RK 255 Bandelin electronic, Berlin, Germany
Consumables
Pipette tips for Eppendorf pipettes VWR International GmbH, Ismaning, Germany
Disposable nitril gloves, powder free VWR International GmbH, Ismaning, Germany
Microtubes, PP, 0.5 mL, snap-on lid VWR International GmbH, Ismaning, Germany
Microtubes, PP, 2 mL, screw cap VWR International GmbH, Ismaning, Germany
Microplates, 96 Deep-Well Porvair Sciences Ltd, Shepperton, UK
2.2 Reference compounds, chemicals and biological s pecimens
Reference compound
Clarithromycin (CLA) Hexal AG, Holzkirchen, *
14-Hydroxy clarithromycin (CLA-MET) Hexal AG, Holzkirchen, *
Erythromycin (ERY A) Sigma Aldrich Chemie GmbH, Schnelldorf,*
Erythromycin ethylsuccinate (EES) Sigma Aldrich Chemie GmbH, Schnelldorf,*
Flucloxacillin (FLU) GlaxoSmithKline, West Sussex, UK
Gatifloxacin (GAT) Grünenthal GmbH, Aachen, *
Moxifloxacin hydrochloride (MOX) Hexal AG, Holzkirchen, *
Oleandomycin (OLE) Sigma-Aldrich Chemie GmbH, Schnelldorf,*
Piperacillin (PIP) Wyeth Pharma GmbH, Münster, *
Roxithromycin (ROX) Hexal AG, Holzkirchen, *
Sulbactam sodium (SUL) Pfizer GmbH, Karlsruhe, *
Tolbutamide (TOL) Sigma-Aldrich Chemie GmbH, Schnelldorf,*
*Germany

28 MATERIAL AND METHODS
Chemicals and solvents
Acetic acid, 98% p. a. VWR International GmbH, Darmstadt, *
Acetonitrile, HPLC-grade Fisher Chemical, Fisher Scientific GmbH, *
Ammonia solution, 25% p. a. VWR International GmbH, Darmstadt, *
Ammonium acetate, p. a. VWR International GmbH, Darmstadt, *
Ammonium formate, p. a. VWR International GmbH, Darmstadt, *
Formic acid, 98% p. a. VWR International GmbH, Darmstadt, *
Methanol, HPLC-grade VWR International GmbH, Darmstadt, *
*Germany
Ultra pure water
Milli-Q purification system Millipore Corporation, Bedford, MA, USA
Drug-free biological matrix
Drug-free human EDTA plasma pooled plasma from healthy volunteers
Drug-free human heparinate plasma pooled plasma from healthy volunteers
Drug-free human urine pooled urine from healthy volunteers
Haemolysed plasma was prepared by adding 1 % of frozen and re-thawed drug-free
whole blood to drug-free human plasma containing ammonium heparinate or EDTA
as anticoagulant.
2.3 Stock solutions
Before weighing, reference compounds are allowed to equilibrate to room
temperature. The amount to be weighed is calculated with respect to purity, salt form
(conversion factor) and desired concentration, see Table 2. Then, the substance is
accurately weighed, dissolved in the appropriate solvent and diluted to the planned
volume. The stock solutions were aliquoted into polypropylene tubes and stored at
approximately -70 °C.

Calibration standards and spiked quality control samples 29
Table 2 Stock solutions of analytes and internal standards (IS)
Analyte Purity [%]
Content [%]
Solvent Concentration [mg/mL]
Clarithromycin (CLA) 98.1 98.1 Acetonitrile 0.40
14-Hydroxy Clarithromycin (CLA-MET) 100.0 100.0 Acetonitrile 0.40
Clarithromycin-d3 (IS) 98.0 98.0 Acetonitrile 0.40
Erythromycin A (ERY A) 94.0 88.2 Acetonitrile 0.20 and 0.16
Erythromycin Ethylsuccinate (EES) 97.4 97.4 Acetonitrile 0.50 and 0.40
Flucloxacillin (FLU) 91.6 91.6 Ultra-pure water 1.00
Gatifloxacin (GAT, IS) 92.5 92.5 Ultra-pure water 0.20
Moxifloxacin (MOX) 96.8 88.7 Ultra-pure water 0.50
Oleandomycin (OLE, IS) 100.0 100.0 Acetonitrile 0.10
Piperacillin (PIP) 96.0 96.0 Methanol 1.00 and 12.50
Roxithromycin (ROX) 97.6 97.6 Acetonitrile 0.40 and 1.00
Sulbactam (SUL, IS) 92.4 84.4 Ultra-pure water 0.10
Tolbutamide (TOL, IS) 100.0 100.0 Acetonitrile 2.00
Content: Percentage of analyte in the reference substance with respect to purity and salt form
2.4 Calibration standards and spiked quality contro l samples
On each validation day and before study sample analysis, two stock solutions (stock
solutions I and II) are precisely prepared and used for the preparation of the
calibration standards (stock solution I) and the spiked quality control (SQC) samples
(stock solution II), respectively.
Calibration standards as well as SQC samples in human plasma were prepared by
serial dilution, adding the appropriate amount of stock solution (I or II) or the higher
concentrated calibration standard or the higher concentrated SQC to drug-free
matrix (e. g. human plasma or urine), respectively.
For method validation and for calibration of pharmacokinetic measurements a
calibration curve (including two blank samples with and without IS, which were not
used for calculation of linear regression) was measured with each analytical run.
SQC samples were prepared for method validation and to control the precision and
accuracy of the assay during the measurement of study samples.

30 MATERIAL AND METHODS
Table 3 Calibration standards and SQC samples for validation
Analyte (Matrix)
Calibration standard concentrations [µg/mL]
SQC concentrations [µg/mL]
CLA (P)* 3.97, 2.98, 1.98, 0.982, 0.487, 0.193, 0.0962, 0.0480, 0.0191, 0.0144, 0.00958
2.96, 0.980, 0.0949, 0.0241
CLA (E)** 4.00, 3.00, 2.00, 0.500, 0.200, 0.100, 0.0500, 0.0200, 0.0150, 0.0100
4.00, 0.500, 0.0200, 0.0100
CLA (P)** 4.00, 3.00, 2.10, 0.400, 0.100, 0.0250, 0.0125, 0.00313, 0.00156, 0.000781
4.00, 1.60, 0.100, 0.00313, 0.00156
CLA (P)*** 4.00, 3.00, 2.10, 0.400, 0.100, 0.0250, 0.0125, 0.00313, 0.00156, 0.000781
4.00, 1.60, 0.100, 0.00313, 0.00156
CLA-MET (P)* 3.96, 2.97, 1.97, 0.980, 0.486, 0.193, 0.0959, 0.0479, 0.0191, 0.0143, 0.00955
2.97, 0.98, 0.0951, 0.0242
CLA-MET (E)** 4.00, 3.00, 2.00, 0.500, 0.200, 0.100, 0.0500, 0.0200, 0.0150, 0.0100
4.00, 0.500, 0.0200, 0.0100
CLA-MET (P)** 4.00, 3.00, 2.10, 0.400, 0.100, 0.0250, 0.0125, 0.00625, 0.00313, 0.00156
4.00, 1.60, 0.100, 0.00625, 0.00313
CLA-MET (P)*** 4.00, 3.00, 2.10, 0.0125, 0.00625, 0.00313, 0.00156, 0.000781, 0.000391
4.00, 0.100, 0.00625, 0.000781, 0.000391
EES (P)* 5.00, 4.00, 2.00, 1.00, 0.200, 0.100, 0.050, 0.020, 0.0150, 0.0100
4.00, 0.400, 0.100, 0.0200, 0.0100
EES (P)** 4.00, 3.00, 2.10, 0.420, 0.0700, 0.0125, 0.00250, 0.00125
4.00, 0.420, 0.0125, 0.00625, 0.00250
EES (P)*** 4.00, 3.00, 2.10, 0.0125, 0.00250, 0.00125, 0.000625, 0.000313, 0.000156
4.00, 0.420, 0.0125, 0.000313, 0.000156
ERY A (P)* 2.00, 1.60, 0.800, 0.400, 0.0800, 0.0400, 0.0200, 0.00800, 0.00600, 0.00400
1.60, 0.160, 0.0400, 0.00800, 0.00400
ERY A (P)** 2.10, 1.60, 0.400, 0.100, 0.0125, 0.00313, 0.00156, 0.000781
2.10, 0.400, 0.0125, 0.00156
ERY A (P)*** 2.10 1.60, 0.400, 0.0125, 0.00313, 0.000781, 0.000391, 0.0000977
2.10, 0.400, 0.0125, 0.000391, 0.000195
FLU (P)** 15.0, 7.50, 3.75, 1.88, 0.750, 0.375, 0.150, 0.0750, 0.0400, 0.0100
15.0, 7.50, 0.375, 0.0375, 0.0100
MOX (P)** 5.00, 3.75, 1.00, 0.250, 0.0500, 0.0250, 0.0100, 0.00800, 0.00500
5.00, 1.00, 0.125, 0.0125, 0.00500
PIP (P)** 125, 100, 12.5, 2.50, 1.25, 0.250, 0.125, 0.0500
125, 12.5, 1.25, 0.125, 0.0500
PIP (U)** 1250, 1000, 350, 35.0, 17.5, 3.50, 2.00, 1.25
1250, 350, 35.0, 3.50, 1.25
ROX (P)* 3.95, 2.97, 1.99, 0.984, 0.485, 0.189, 0.0938, 0.0466, 0.0182, 0.0137, 0.00921
2.79, 0.908, 0.0873, 0.0211
ROX (P)** 4.00, 3.00, 2.10, 1.60, 1.20, 0.404, 0.101, 0.0253, 0.0126, 0.00632, 0.00316
4.00, 0.101, 0.00632, 0.00316
ROX (P)*** 1.61, 1.21, 0.404, 0.101, 0.0253, 0.00632, 0.00158, 0.000790, 0.000395
1.61, 1.21, 0.101, 0.000790, 0.000395
(P): human ammonium heparin plasma, (E): human EDTA plasma, (U): human urine
*: API III Plus, **: API 3000™, ***: API 5000™

Validation experiments – procedure and acceptance criteria 31
2.5 Validation experiments – procedure and acceptan ce criteria
The realisation and acceptance criteria of the following validation experiments were
performed as recommended by the guidelines on bioanalytical method validation
introduced above (FDA, EMA [33, 67]).
2.5.1 Specificity
The specificity of an analytical method is the ability not to detect potential interfering
compounds from the biological matrix. The specificity is determined by analyzing
drug-free human plasma or urine from at least six different individuals (males and
females) with addition of IS and without IS.
The specificity experiment is successful, if no co-eluting peaks with areas of more
than 20 % of the analyte peak area at the lowest level of quantification (LLOQ)
occurred (FDA, EMA [33, 67]).
2.5.2 Selectivity
The selectivity of an analytical method is the capability to differentiate the analyte
from potential interfering compounds in the biological matrix. The influence of at least
six different batches of biological matrix on the determination of the analytes was
determined. Each batch of matrix was spiked with two different concentrations, which
were prepared thrice. For each concentration level, the mean value, standard
deviation and precision had to be within 15 %.
2.5.3 Linearity and sensitivity
For the determination of linearity and sensitivity, a calibration curve of at least eight
concentration levels was freshly prepared in biological matrix on each validation day
and analyzed in at least five validation runs (at least three runs are requested by
FDA and EMA) together with two blanks (with/without IS, not used for linear
regression).
Each calibration curve was evaluated by weighed linear regression and accepted, if
it contained maximal two outliers (back-calculated concentration outside 15 %-limit,

32 MATERIAL AND METHODS
or 20 %-limit at LLOQ) not being adjacent. The slopes, intercepts and the correlation
coefficients of the corresponding individual curves are calculated.
During study sample analysis the same specifications were applied, except for the
LLOQ, which had to be within 15 %.
The sensitivity of a method is defined by its LLOQ (lower limit of quantification),
which is the lowest concentration that can be measured with acceptable accuracy
and precision within 20 % and a signal-to-noise ratio greater or equal to 5. The
ULOQ (upper limit of quantification) is the calibration standard, but not necessarily
the highest quantifiable concentration (see pre-dilution of study samples in chapter
2.5.11 Dilution integrity).
The signal-to-noise ratio at the LLOQ is determined on API III Plus and API 3000™
by the peak signal divided by the upper noise level. The signal-to-noise on
API 5000™ is calculated with the AB SCIEX script using 3 STD of the noise.
2.5.4 Precision and accuracy
For the evaluation of the within-run and the between-run precision and accuracy of
the assay, five replicates of each SQC concentration level were prepared and
analyzed on each validation day. The concentrations were calculated by the
corresponding calibration curve. Mean, standard deviation (SD), accuracy and
precision are calculated for each concentration level:
Accuracy 100ionconcentratlTheoretica
ionconcentratMeasured(%) ⋅= Equation 9
Precision 100ionsconcentratmeasuredofMean
ionsconcentratmeasuredofSD(%) ⋅= Equation 10
2.5.5 Stability experiments
The stability experiments reflect the drug stability in the study samples during
collection, handling, preparation, measurement and storage. Therefore, the stability
of all analytes in the given matrix was evaluated by SQC samples with known
nominal concentrations at the ULOQ and near or at the LLOQ. Five replicates at
each concentration level were evaluated, although only three are requested in the
guidelines. The tested conditions are summarized in Table 4.

Validation experiments – procedure and acceptance criteria 33
Table 4 Conditions of stability experiments
Experiment Temperature Time Experiment reflects…
Short-term RT or 4 °C 2 and 4 hours sample handling and preparation
Long-term -20 °C and -70 °C days to months storage conditions
Freeze/Thaw -70 °C to RT FT 1: >24 hours, FT 2, 3: 12 hours
freezing and thawing of samples
Post-preparative (autosampler)
4 °C and -70 °C 24 up to 120 hours storage in the autosampler or freezer between sample preparation and measurement
Stock solution RT or 4 °C 6 hours stability of stock solutions
Light stability - reasonable time intervals
stability in daylight or artificial light
RT: room temperature, FT 1: freeze and thaw cycle 1
Directly after application of the storage conditions, the stored SQC samples and
freshly prepared calibration standards and SQC samples are prepared and analyzed
together in the same validation run.
While short-term, long-term and freeze/thaw conditions are subjected directly to the
SQC samples in matrix, the post-preparative stability starts after the sample work-up
procedure, when matrix components, including enzymes have been removed.
The stability of stock solutions is evaluated by preparing two stock solutions of the
same concentration and storing them for 6 hours at the intended temperature, which
depends on the expected analyte stability and the intended handling of the stock
solutions. After 6 hours two freshly prepared stock solutions and the stored ones are
diluted five times to a concentration within the calibration range and analyzed
alternately.
To determine the stability of an analyte towards light, human plasma and human
whole blood is spiked to a high concentration and aliquoted to 75 SQC samples,
each. 25 of those aliquots in each matrix, are stored in the dark, 25 in neon light and
25 in daylight (window sill). After 0, 1, 2, 4 and 6 hours, 5 aliquots each are
transferred into a freezer at -70 °C. At the end, all samples are thawn and analysed.
Statistical evaluation of the stability experiments is performed by calculating 95 %
confidence intervals for the ratios between the concentrations measured after
applying the respective test conditions and the corresponding control samples (to

34 MATERIAL AND METHODS
allow for any contribution of assay imprecision). Instability is concluded if both the
upper and lower limit of the confidence interval are greater than 10 %.
2.5.6 Recovery
For the determination of the absolute extraction recovery of analyte and IS, five
concentration levels in blank matrix, and the same concentration levels in processed
blank matrix were prepared by serial dilution. Five replicates of each concentration
level were analyzed. The recovery was evaluated by the equation:
Recovery 100matrixprocessedinareapeakmeannormalized
matrixinareapeakmeannormalized(%) ⋅= Equation 11
Normalization is performed by dividing the mean peak area (n=5) by the
corresponding theoretical concentration. The recovery may be below 100 %, but the
extent should be “consistent, precise and reproducible” (FDA [33]). Recovery is not
mentioned in the EMA guideline on BMV [34].
2.5.7 Matrix Effect
Matrix components may enhance or suppress the signal in LC-MS/MS assays (see
chapter 1.3.1 Ionisation Sources). There are two approaches how to determine the
matrix effect.
The Matrix Factor (MF) is determined by spiking the analyte and the IS into six
different lots of processed blank matrix (to exclude extraction recovery) and at the
same concentration into pure solution (e. g. mobile phase) and injecting three
replicates each directly into the system. The MF for each lot of matrix and each
analyte is then calculated by the following equation:
solutioninareapeakmatrixprocessedinareapeak
MF = Equation 12
A MF greater or smaller than 1 suggests ion enhancement or ion suppression due to
matrix components and should be correctable by the MF of the internal standard.
Therefore, the precision of the IS-normalized MF, calculated by dividing the analyte-
MF by the IS-MF, should not be greater than 15%.
Post-column infusion can be used to visualize the matrix effect by infusing a
solution with a low or medium analyte concentration via a T connector behind the

Validation experiments – procedure and acceptance criteria 35
analytical column by means of a syringe pump. The injection of different lots of
processed blank matrix samples onto the chromatographic system can increase or
decrease the signal, which reflects enhancement or suppression of the analyte’s
ionisation at the corresponding time point.
2.5.8 Haemolysed plasma
During venous blood collection into vacutainers or monovettes, the vacuum may
cause some blood cells to lyse and release haemoglobin, which is visible by the
orange to red colour of the plasma after centrifugation. Analytes may bind to such
plasma components, resulting in a different behaviour during extraction and analysis
than in non-haemolysed human plasma. As calibration standards and SQC samples
are prepared in a pool of normal human plasma, the measured concentration in
haemolysed plasma may be underestimated. Therefore, the influence of haemolysed
plasma has to be evaluated during method validation.
Haemolysed human plasma can be produced by freezing whole blood and re-
thawing it, which causes lysis of blood cells. The orange to red colour of haemolysed
clinical trial samples can be produced by spiking 1% of lysed blood into normal
human plasma.
The influence of haemolysed plasma on the determination of pharmaceuticals was
determined by spiking haemolysed human plasma at two concentration levels and
analyzing five replicates together with a calibration curve in normal human plasma.
No influence was concluded, if the accuracy and precision at each concentration
level did not exceed 15 %.
2.5.9 Hyperlipidaemic plasma
Especially in clinical trials evaluating a food-effect, very different plasma samples
regarding the content of lipids have to be analyzed in the same analytical run to
assure comparability of study periods. Therefore, hyperlipidaemic and non-
hyperlipidaemic samples have to be quantified using calibration standards in normal
human plasma. This kind of matrix difference may affect the resulting concentration
data at most, if the samples are prepared using a liquid-liquid extraction method,
where also lipids can be extracted from the plasma by the organic solvent.

36 MATERIAL AND METHODS
The influence of hyperlipidaemic plasma is evaluated similarly to the experiment for
haemolysed plasma. Five replicates per concentration level in hyperlipidaemic
plasma are prepared and analyzed together with calibration standards in normal
human plasma. No influence is concluded, if the accuracy and precision at each
concentration level does not exceed 15 %.
2.5.10 Anticoagulant
The influence of the anticoagulant on the assay is determined by preparing SQC
samples in plasma containing one anticoagulant (e. g. EDTA) and calibration
standards in plasma with another anticoagulant (e. g. ammonium heparin). If the
anticoagulant has no enhancing or suppressing effect on the sample analysis, the
measured concentrations are within the 15-% accuracy and precision of the nominal
SQC concentration.
2.5.11 Dilution integrity
Despite the proper planning of the calibration range based on literature data, the
concentrations of some study samples may exceed the validated calibration range.
In order to allow for a valid concentration value, those samples can be diluted with
drug-free human plasma (or urine) prior to the sample preparation procedure and the
re-analysis. This pre-defined dilution step must also be validated, whereby in most
cases, a dilution by factor 5 is sufficient.
The influence of sample dilution on the assay is determined by spiking the analyte
into the respective blank matrix at a concentration that exceeds the calibration range
to simulate a high study sample. This high SQC is first diluted by the intended factor
with drug-free matrix (at least five determinations per dilution factor) and then
processed and analyzed as all other samples. This experiment is also stipulated in
the bioanalytical method guidelines [33, 67] by the EMA and FDA, where accuracy
and precision should be within the set criteria, i.e. within ±15 %.
2.5.12 Incurred sample re-analysis (ISR)
To check the accuracy and precision not only in spiked matrix samples, but in real
clinical trial samples, a defined percentage of study samples is re-analyzed as

Pharmacokinetic analysis 37
incurred samples. For the best assessment, values around Cmax and during the
elimination phase are selected. Depending on the study sample number (below or
exceeding 1000), 10 % or 5 % should be re-analyzed as incurred samples, but less
than 20 samples for ISR is not recommended. For 67 % of the incurred samples, the
accuracy should be within 20 % of the mean of the original result and the ISR result.
The ISR concept developed through many publications, but the above procedure
and acceptance criteria is currently only included in the guidance by the EMA [34].
2.6 Study sample collection and sample handling
All study samples analyzed here, were from clinical trials with healthy volunteers,
who have signed informed consent forms in accordance with the “Declaration of
Helsinki” and its amendments. Shortly after collecting the human blood samples in
monovettes containing the respective anticoagulant, the samples are centrifuged for
10 minutes at approximately 1500 g in a cooled centrifuge (approx. 4 °C). Each
plasma sample is immediately transferred into at least two storage tubes (aliquots)
and frozen at the recommended temperature until analysis.
The shipment of human plasma samples from the study site to the bioanalytical
laboratory is done in dry-ice containing Styrofoam containers, attended with
temperature loggers to ensure analyte stability. Only after the first aliquot arrived in
good conditions at the bioanalytical laboratory, the second aliquot is shipped and
subsequently stored in another freezer.
On the day of analysis, the human plasma samples are thawed in a cold water bath
and mixed thoroughly. After centrifuging the tubes for 5 minutes at approximately
4 °C and 1500 g, an aliquot of the plasma sample is taken and prepared for analysis
according to the validated sample preparation procedure for the respective assay.
2.7 Pharmacokinetic analysis
All pharmacokinetic parameters were determined from actual sample collection times
and assayed plasma concentrations at these times. Concentration values below the
lower limit of quantification were set to zero. Pharmacokinetic parameters were
calculated by using the formulas described in chapter 1.2 Pharmacokinetics and
Pharmacodynamics.

3 MACROLIDES
3.1 Erythromycin Ethylsuccinate and Erythromycin A
3.1.1 Chemical and pharmaceutical properties
Being of bacterial origin erythromycin is a mixture of structurally very similar
components, chemically corresponding to a 14-membered lactone ring, which is
substituted by two sugar groups at C(4) and C(6), (for atom membering, see Scheme
1). The main component, erythromycin A, is composed of this 14-membered ring
containing ten chiral carbon atoms, two of them being attached to cladinose C(4) and
desosamine C(6). Erythromycin A, C37H67NO13 (exact mass 733.5 amu, mol. wt.
733.9 g/mol) is a water-insoluble weak base with a logP of 3.06 [68] and a pKa of 8.8
[69].
Scheme 1 Chemical structures of erythromycin A (ERY A), B and C
ERY R1 / R2 Formula Mol. weight Exact mass pK a logP
A -OH / -CH3 C37H67NO13 733.9 g/mol 733.5 amu 8.8 3.06
B -H / -CH3 C37H67NO12 717.9 g/mol 717.5 amu - -
C -OH / -H C36H65NO13 719.9 g/mol 719.5 amu - -
IUPAC Name of ERY A: (3R,4S,5S,6R,7R,9R,11R,12R,13S,14R)-6-(((2S,3R,4S,6R)-4-(dimethylamino)-3-hydroxy-6-methyltetrahydro-2H-pyran-2-yl)oxy)-14-ethyl-7,12,13-trihydroxy-4-(((2R,4R,5S,6S)-5-hydroxy-4-methoxy-4,6-dimethyltetrahydro-2H-pyran-2-yl)oxy)-3,5,7,9,11,13-hexamethyloxacyclotetradecane-2,10-dione

Chemical and pharmaceutical properties 39
Erythromycin is the first broad-spectrum macrolide antibiotic that has been used for
the treatment of infections of the respiratory tract and other infections. It serves as an
important alternative to penicillins.
The antibacterial activity of macrolides results from a blocking of bacterial protein
synthesis in the ribosomes, more precisely, by interacting with the 23S ribosomal
RNA (rRNA) of the 50S ribosomal subunit. This prevents the formation of new
ribosomes and subsequently the translation of messenger RNA in active ribosomes
[70]. This target site may be methylated by bacterial methyltransferase, the major
mechanism of macrolide resistance [71].
Scheme 2 Chemical structure of erythromycin ethylsuccinate (EES)
Formula Mol. weight Exact mass pKa logP
C43H75NO16 862.1 g/mol 861.5 amu 7.1 2.1
IUPAC Name: (2S,3R,4S,6R)-4-(dimethylamino)-2-(((3R,4S,5S,6R,7R,9R,11R,12R,13S,14R)-14-ethyl-7,12,13-trihydroxy-4-(((2R,4R,5S,6S)-5-hydroxy-4-methoxy-4,6-dimethyltetrahydro-2H-pyran-2-yl)oxy)-3,5,7,9,11,13-hexamethyl-2,10-dioxooxacyclotetradecan-6-yl)oxy)-6-methyltetrahydro-2H-pyran-3-yl ethyl succinate
Since erythromycin has been discovered, many structural modifications and
formulations have been developed to improve its bitter taste, its acid stability in the
gastric environment and, by implication, its bioavailability too. One of those
erythromycin derivatives is erythromycin ethylsuccinate (pKa 7.1 [72], logP 2.1 [73]),
see Scheme 2. It only differs from erythromycin A by esterification of the
desosamine-hydroxyl group. Erythromycin ethylsuccinate serves as prodrug for

40 Erythromycin Ethylsuccinate and Erythromycin A
erythromycin A as the desosamine-hydroxyl group is essential for its
pharmacological activity [74].
Erythromycin ethylsuccinate was developed as a paediatric suspension because of
its poor water-solubility (devoid of the bitter taste of erythromycin), but it is also
available as enteric-coated or film-coated tablet or suspension for adults.
Erythromycin base is incompletely but reasonably absorbed from the upper small
intestine, but inactivated by gastric acid (see Scheme 3), especially in combination
with food [1]. The absorption of erythromycin ethylsuccinate is rapid (half an hour
after drug administration [75]) and less altered in the presence of food [76].
Scheme 3 Acid-catalyzed intramolecular ketal formation of erythromycin
Data from studies using microbiological assays revealed peak concentrations of
erythromycin ethylsuccinate of 1.5 µg/mL (0.5 µg/mL of base), at 1 to 2 hours after
administration of a 500-mg dose, indicating that concentrations of the free base
comprise 20 to 35 % of the total concentration and that the concentration of the
microbiologically active erythromycin base in serum is similar for various
preparations [1]. For a more detailed view on the pharmacokinetics of the prodrug
erythromycin ethylsuccinate and its active metabolite erythromycin base in human

Current state of published analytical methods 41
plasma, more specific methods are needed that are able to distinguish between
erythromycin ethylsuccinate and erythromycin base.
Erythromycin distributes readily into body tissues and fluids, achieving antibacterial
concentrations, except for brain and CSF. The latter may derive from the rather large
molecular size of erythromycin, even since the molecule would be lipophilic enough
(logP 2.1) to enter the blood brain-barrier. The volume of distribution of erythromycin
base is 0.78±0.44 L/kg and it is bound to plasma proteins by 84±3 % [1].
Metabolism of erythromycin occurs by CYP3A4 in the liver, mainly producing the
N-demethylated analogue [69]. Erythromycin inhibits CYP3A4, not only affecting its
own metabolism, but also the efficacy and tolerability of many other drugs, including
terfenadine, felodipine, midazolam or carbamazepine. There is still uncertainty about
the mechanism of this non-competitive inhibition since it seems to be difficult to
distinguish between either a slowly reversible [77] or a mechanism-based irreversible
(MBI) [78] mechanism. Data from a recently published study support the mechanism-
based inactivation of CYP3A4 by macrolides. Studying the inhibition kinetics of
genetic CYP3A4 variants, the equations involving an enzyme-inhibitor intermediate
complex resulted in inhibition constants being quite likely attributable only by MBI
[79]. This interaction may cause beneficial (dose reduction of cyclosporines) or
mostly adverse drug response, like QT interval prolongation, hypotension, excessive
sedation or ataxia [77]. However, serious side effects have been observed rarely.
The most abundant side effects of erythromycin are dose-related and either
gastrointestinal, including nausea, vomiting, and diarrhoea, or hepatic .
3.1.2 Current state of published analytical methods
Several methods are published determining erythromycin or its derivatives in human
plasma [80-85]. However, only few methods can be found that quantify erythromycin
ethylsuccinate in matrices like pharmaceutical formulations [86-89], urine and milk
[90] and serum or plasma [91-95]. The methods for erythromycin ethylsuccinate in
human plasma or serum use liquid chromatography with electrochemical detection
(LC/ED) [94], or with derivatisation and spectrofluorometric detection (LC/FD) [95].
Others reported (FAB-MS) methods [92-93], one of them being coupled to an LC
system [92]. Previously reported LC/ED, LC/FD and FAB-MS methods present low
sensitivity, as well as expensive or time-consuming sample preparation procedures
using high sample volumes and long run times.

42 Erythromycin Ethylsuccinate and Erythromycin A
For a specific and fast determination, LC/MS and LC-MS/MS are especially useful. In
particular, MS/MS triple quadrupole mass spectrometry used in the multiple-reaction-
monitoring mode (MRM) provides surpassing speed, sensitivity and high selectivity
in quantitative analysis.
Several LC-MS/MS methods have been reported which determine erythromycin in a
series of matrices like fish [96-97], commercial preparations [98-100], aqueous
solution [101] and human plasma [102]. However, only one LC-MS/MS method has
been published for erythromycin ethylsuccinate in human plasma [91]. They used a
cost-ineffective and time-consuming extraction method combined with a comparably
long analysis run time. With regard to the high sample amount in large
pharmacokinetic studies, this is considered as inappropriate.
3.1.3 LC-MS/MS method
The original LC-MS/MS method was provided by Professor Dr Fritz Sörgel and is
discussed in detail in the following chapter. As EES and ERY A are non-polar
compounds, APCI is the most promising ionisation technique. It was used in the
positive ion mode, as both analytes are weak bases and can be easily protonated.
The positive ion Q1 spectra of EES and ERY A contained intensive peaks
correspondent to the protonated molecules [M+H]+ with m/z 862.7 (EES) and
m/z 734.6 (ERY A). No ERY A signals could be observed in the Q1 spectrum of
EES, indicating that no in-source fragmentation of the EES ester bond occurred, see
Figure 10.
The protonated molecules of EES (m/z 862.7) and ERY A (m/z 734.6) are
fragmented by collision-activated dissociation resulting in the MS/MS product ion
mass spectra depicted in Figure 11 and Figure 12. The system parameters are
optimized for the most intensive fragment signals, which are m/z 286.1 (EES) and
m/z 158.0 (ERY A), corresponding to the protonated (and esterified) desosamine.

LC-MS/MS method 43
Figure 10 Q1 mass spectrum of erythromycin ethylsuccinate (EES)
ERY A
862.7
Figure 11 Product ion spectrum and fragmentation scheme of EES
862.5
704.2
286.1
[M+H]+
-cladinose

44 Erythromycin Ethylsuccinate and Erythromycin A
Figure 12 Product ion spectrum and fragmentation scheme of erythromycin A
-cladinose
[M+H]+
158.0
734.5
576.1
-3 H2O522.7
Oleandomycin was used as internal standard, as it is chemically analogous to the
analytes (pKa 8.84, logP 1.69 [68]) and pharmaceutically not applied anymore,
displayed in Scheme 4.
The spectra of the internal standard oleandomycin (OLE) represented the protonated
molecule [M+H]+ with m/z 687.9 and the most abundant fragment ion with m/z 158.3.
Thus, the mass spectrometric experiments were performed using an APCI interface
operating in the positive ion mode by means of MRM of the following transitions:
m/z 863 → m/z 286 (EES), m/z 735 → m/z 158 (ERY A), and m/z 688 → m/z 158
(OLE).
System parameters were optimized for each system during spectra acquisition.
Settings summarized in Table 5 were chosen to obtain the highest analytical
sensitivity for EES and ERY A.

LC-MS/MS method 45
Scheme 4 Chemical structure of oleandomycin (OLE)
cladinose
O
O
H3C
H3C
O
CH3
CH3
O
H3C
H3C
OH
O
OOH
OCH3
H3C
10
4
14
12
O
desosamine
CH3
N
OHO
H3C
CH3
2
Formula Mol. weight Exact mass pK a logP
C35H61NO12 687.9 g/mol 687.4 amu 8.84 1.69
IUPAC Name: (3S,5R,6S,7R,8R,11R,12S,13R,14S,15S)-14-(((2S,3R,4S,6R)-4-(dimethylamino)-3-hydroxy-6-methyltetrahydro-2H-pyran-2-yl)oxy)-6-hydroxy-12-(((2R,4R,5S,6S)-5-hydroxy-4-methoxy-6-methyltetrahydro-2H-pyran-2-yl)oxy)-5,7,8,11,13,15-hexamethyl-1,9-dioxaspiro[2.13]hexadecane-4,10-dione
Table 5 Optimized MS/MS parameters for EES, ERY A and OLE
API III Plus API 3000™ API 5000™
Probe temperature 500 °C 500 °C 350 °C
Discharge needle current 3 µA 3 µA 5 µA
Orifice voltage / Declustering potential
40 V (OR) 46 V (OR) 50 V (DP)
Collision energy 40 eV 38 eV 40 eV
Nebulizer gas (APCI) 80 psi 80 psi 50 psi (GS1)
Auxiliary gas (APCI) 2 L/min 2 L/min 50 psi (GS2)
Nebulizer, auxiliary and curtain gas High purity nitrogen High purity nitrogen High purity nitrogen
Collision gas High purity argon High purity nitrogen High purity nitrogen
Collision gas thickness 240·1013 atoms/cm2 4 (2.4·10-5 torr) 5 (1.7·10-5 torr)
As the ethylsuccinate ester of erythromycin is unstable in methanol but stable in
acetonitrile [103], chromatographic separations were done without methanol in the

46 Erythromycin Ethylsuccinate and Erythromycin A
mobile phase. The ionisation processes in the APCI source can be supported by a
buffer with low ion-strength in the mobile phase, which was done with ammonium
acetate (5 mM). The stability of erythromycin in acidic solution has been evaluated
by Nakagawa et al. [104]. They found that erythromycin degraded more than 20 %
within one hour at pH 4, but was stable at pH 5. Cachet et al. [105] stated that
stability is critical during sample preparation and observed no degradation during
measurement, even with a mobile phase of pH 3. Therefore, the plasma samples
were buffered with ammonium acetate buffer (50 mM, pH 4.8) immediately before
precipitation. For the mobile phase, an ammonium acetate buffer (5 mM, pH 4.0)
was mixed with acetonitrile (55/45, v/v), which results in an experimental pH of the
mobile phase of approximately pH 5.
This mobile phase composition was delivered at a flow rate of 1.2 mL/min to a CN
reversed phase column, resulting in a baseline separation of EES and ERY A within
a run time of approximately 3.0 minutes (1.0 minute (ERY A, OLE) and 1.5 minutes
(EES)).
As previously discussed, EES reaches peak serum concentrations of 1.5 µg/mL
following administration of a 500-mg dose, whereby ERY A reaches peak serum
concentrations of 0.5 µg/mL [1]. In order to detect 5 % of Cmax, the LLOQs of EES
and ERY A should be lower than 75 ng/mL, and 25 ng/mL, respectively. In order to
be prepared for other dosing regimens, the following calibration ranges were defined:
10.0 to 5000 ng/mL for EES and 4.00 to 2000 ng/mL for ERY A.
The calibration standards and the SQC samples were prepared in drug-free human
plasma containing ammonium heparinate as anticoagulant because the study
samples were planned to be collected using the same anticoagulant. To control
probable conversion of EES to ERY A in human plasma, SQC samples containing
EES+ERY A and SQC samples containing either EES or ERY A were prepared.
To prevent erythromycin from intramolecular ketal formation (Scheme 3), all sample
handling as well as the sample preparation procedure was done in an ice-water bath.
After thawing the human plasma samples, calibration standards and SQC samples in
a cold water bath, the samples are mixed thoroughly and centrifuged for 5 minutes at
approximately 4 °C and 2380 g to separate eventually present solid components.
As the most cost-effective and fastest sample preparation technique, protein
precipitation is preferred: An aliquot of 100 µL of human plasma is stabilized by
addition of 50 µL of ammonium acetate buffer (50 mM, pH 4.8) and subsequently
deproteinised by adding 250 µL of acetonitrile containing the internal standard (IS)

Validation 47
oleandomycin, see Scheme 4. The IS working solution at a concentration of
500 ng/mL resulted in good peak area ratios (EES/IS and ERY A/IS) on API III Plus.
For the more sensitive systems API 3000™ and API 5000™, the IS working solution
was further diluted by factor ten.
The precipitated sample, containing the IS, is mixed thoroughly to facilitate
deproteinisation. The precipitate is separated by centrifugation for 5 minutes at 3600
rpm (2380 g) at approximately 4 °C. Lowering the ion strength and raising the water
content of the sample gives more constant and sharper peaks. Therefore, an aliquot
of 100 µL of the supernatant is diluted with 100 µL of ammonium acetate buffer
(5 mM, pH 4.8) and after mixing, 30 µL of each sample is injected onto the LC-
MS/MS system. In Table 6 the optimized sample preparation procedure and LC-
MS/MS conditions are summarized.
Table 6 Summary of the assay for EES and ERY A in human plasma
Characteristic Details
Sample preparation
100 µL plasma + 50 µL NH4CH3COO (50 mM, pH 4.8) + 250 µL CH3CN /IS
100 µL supernatant + 100 µL NH4CH3COO (5 mM, pH 4.8)
Internal standard Oleandomycin (OLE)
Column YMC-Pack Cyano, 3 µm (50 x 4.0 mm)
Mobile phase 45 % CH3CN
55 % NH4CH3COO (5 mM, pH 4.0)
Flow rate 1.2 mL/min
Run time 3.0 min
Ionisation APCI – atmospheric pressure chemical ionisation
Polarity Positive ion mode
Mass transitions
m/z 863 → m/z 286 (EES)
m/z 734 → m/z 158 (ERY A)
m/z 688 → m/z 158 (OLE)
CH3CN /IS: acetonitrile containing the internal standard oleandomycin (500 ng/mL)
3.1.4 Validation
This method was validated according to the FDA guideline on BMV [33], as it was
intended for measurement of concentration data for pharmacokinetic studies. The
data were obtained from a previous validation and the results are explained in this
chapter.

48 Erythromycin Ethylsuccinate and Erythromycin A
The specificity was determined in drug-free human plasma from six individuals. No
co-eluting peaks from matrix components interfered with the peaks of erythromycin
ethylsuccinate, erythromycin A and the IS.
For the determination of linearity and sensitivity (LLOQ) of the assay a calibration
curve for each analyte, including two blank samples which were not used for linear
regression, was prepared and analyzed on each of the five validation days. The
precision of the calibration standards is summarized in Table 7.
Table 7 Inter-day precision and accuracy of the calibration standards containing
erythromycin ethylsuccinate or erythromycin A in human plasma
EES ERY A
Precision (range) 1.4 to 12.3 % 1.2 to 9.2 %
Accuracy (range) -4.4 to 6.1 % -3.8 to 5.0 %
Precision (LLOQ) 12.3 % 9.2 %
Accuracy (LLOQ) 5.4 % 1.7 %
The calibration curves are linear over the whole concentration range, the correlation
coefficient of all curves being better than 0.999. The mean linear regression
equations of the calibration curves generated during the validation are:
EES: y = 0.0009 (±0.0005) + 0.0006 (±0.0000) x, r2 > 0.999
ERY A: y = 0.0008 (±0.0004) + 0.0008 (±0.0000) x, r2 > 0.999
y: ratio of analyte peak area and IS peak area, x: plasma concentration of analyte
Both, the slope and the intercept show very good consistency during all five days, as
does the precision and accuracy of the calibration standards, especially the lower
limit of quantification.
The intra-day and the inter-day precision and accuracy of the assay was evaluated
preparing three types of SQC samples. These types include SQCs in human plasma
containing EES or ERY A solely, or containing both, EES and ERY A together in one
sample. In this way, a probable conversion of EES to ERY A could be observed.
Each SQC type was prepared at four concentration levels and analyzed five times on
five consecutive validation days. The concentrations of the SQCs were calculated by
the corresponding calibration curve. Precision and accuracy data are summarized in
Table 8 and Table 9.

Validation 49
Table 8 Intra- and inter-day precision and accuracy for the analysis of spiked
quality control samples containing EES or ERY A in human plasma
Nominal Analyte Intra-day (N = 5) Inter-day (N = 25)
concentration [ng/mL]
precision
[[[[%]]]] accuracy
[[[[%]]]] precision
[[[[%]]]] accuracy
[[[[%]]]]
4000 EES 3.5 107.0 3.5 105.3
400.0 EES 5.3 100.2 4.6 103.8
100.0 EES 4.8 106.7 4.5 105.6
20.00 EES 6.6 102.9 6.4 99.0
10.00 EES 7.0 101.0 8.4 98.9
9 1600 ERY A 3.3 105.2 4.6 99.6
160.0 ERY A 3.9 102.4 3.9 100.4
40.00 ERY A 5.6 102.4 5.6 97.8
8.000 ERY A 7.2 105.0 7.4 100.8
4.000 ERY A 7.4 101.1 7.6 101.7
Table 9 Intra- and inter-day precision and accuracy for the analysis of spiked
quality control samples containing EES and ERY A in human plasma
Nominal Analyte Intra-day (N = 5) Inter-day (N = 25)
concentration [ng/mL]
precision
[[[[%]]]] accuracy
[[[[%]]]] precision
[[[[%]]]] accuracy
[[[[%]]]]
4000 EES 3.0 96.5 5.5 98.5
400.0 EES 1.7 95.7 6.1 97.7
100.0 EES 4.7 98.2 5.8 98.4
20.00 EES 8.0 97.8 7.1 97.5
10.00 EES 7.3 98.6 8.6 98.0
1600 ERY A 3.8 106.3 3.2 104.0
160.0 ERY A 1.3 103.6 3.8 101.8
40.00 ERY A 2.8 100.9 5.1 100.6
8.000 ERY A 6.6 102.2 8.9 100.9
4.000 ERY A 5.2 107.6 4.4 101.0
Erythromycin ethylsuccinate and erythromycin A can be measured with high
precision and accuracy in human plasma, when analyzed alone in each sample. As
the human plasma samples from the erythromycin ethylsuccinate study will contain
both analytes, it should be tested if both analytes can be determined reliably in a

50 Erythromycin Ethylsuccinate and Erythromycin A
simultaneous analysis. Table 9 summarizes the results of the validation samples
containing both analytes at the same time.
The small negative deviation from 100 % of EES accuracies combined with the small
positive deviation of ERY A accuracies in Table 9 may indicate a slight conversion
from EES to ERY A, but these values are statistically not significant. This is also
supported by the data in Table 8, confirming that simultaneous determination of EES
and ERY A is possible with very high accuracy and precision.
The mean (±SD) absolute extraction recovery of EES and ERY A was determined to
be 99.5 ± 5.0 % (EES) and 95.8 ± 1.6 % (ERY A) over the whole concentration
range. The mean absolute extraction recovery of the IS oleandomycin at the working
concentration is 91.3 ± 1.2 %. The simple protein precipitation introduced to extract
the analytes from plasma shows satisfactory recovery for both analytes. The
precision of all analytes was ≤5.1 %.
No influence of haemolysed plasma on the precision and accuracy of EES and
ERY A in five replicates at two concentration levels, each, was observed. The mean
concentration values of EES and ERY A in haemolysed human plasma were within
±7 % of the nominal concentrations. The precision was better than 4 %, see Table
10. Therefore, haemolysed human plasma samples can be analysed with the same
precision and accuracy as normal human plasma samples.
Table 10 Accuracy and precision of EES and ERY A in haemolysed plasma
Concentration
[ng/mL]
Analyte Accuracy
[%]
Precision
[%]
4000 EES 101.9 2.0
100.0 EES 102.9 3.9
1600 ERY A 93.3 1.5
40.00 ERY A 94.2 3.5
Stability data for EES and ERY A in human plasma are presented in Table 11 and
Table 12. The stability samples for EES and ERY A were prepared separately in
human plasma: five replicates of EES (4000 ng/mL and 100 ng/mL) and ERY A
(1600 ng/mL and 40 ng/mL), respectively.
The short-term stability data indicate that no ketal formation occurred in plasma
samples at 4 °C within 1.5 hours. Therefore, plasma samples containing EES and
ERY A can be prepared for analysis in an ice-water bath within 90 minutes, which is

Validation 51
enough time for precipitation of 100 samples during three freeze-thaw cycles. The
results of the stability experiments indicate that EES and ERY A are stable in human
plasma for at least 1.5 hours at 4 °C, and for at least 2 months at -20 °C and -70 °C.
Table 11 Statistical evaluation of the stability experiments for EES
Time Concentration Point estimator
Lower Limit
Upper Limit
Stability experiment
[ng/mL] [%] [%] [%]
30 min 4000 104.0 101.2 106.8
60 min 101.8 99.9 103.7
90 min 102.7 101.8 103.6
30 min 100.0 101.4 98.5 104.3
60 min 103.7 98.3 109.3
Short-term stability (approximately 4 °C)
90 min 101.6 96.7 106.9
24 hours 4000 101.6 97.8 105.6 Post-preparative stability (autosampler, approx. 4 °C) 24 hours 100.0 101.3 98.6 104.2
24 hours 4000 102.8 102.2 103.4 Post-preparative stability (approximately -70 °C) 24 hours 100.0 98.8 88.8 109.8
Once 4000 102.3 97.1 107.7
Twice 101.1 98.3 103.9
Thrice 102.3 99.8 104.8
Once 100.0 102.9 100.6 105.2
Twice 96.4 89.4 104.0
Freeze-thaw stability (approximately -70 °C)
Thrice 103.0 102.1 103.9
11 days 4000 98.6 96.2 101.0
2 months 98.2 93.7 102.9
11 days 100.0 98.9 93.3 104.7
Long-term stability (approximately -20 °C)
2 months 105.0 103.0 107.0
11 days 4000 101.6 97.6 105.8
2 months 101.8 97.4 106.4
11 days 100.0 97.8 94.0 101.8
Long-term stability (approximately -70 °C)
2 months 101.4 97.7 105.3
For the stability in prepared human plasma and during two freeze-thaw cycles, the
lower limits of the confidence intervals are 88.8 and 89.4 % respectively. This
indicates that the data in these two experiments was little less precise as the data of
the other experiments. This is not critical since the precision is generally rated
acceptable within 85-115%. In addition, the point estimators, reflecting the accuracy
of the stability data, are very close to 100% (98.8 and 96.4 %). Therefore, both

52 Erythromycin Ethylsuccinate and Erythromycin A
analytes are stable in prepared human plasma for at least 24 hours and during three
freeze-thaw cycles, each longer than 12 hours.
The hydrolysis of erythromycin ethylsuccinate in human plasma has also been
studied by Croteau et al. [94] who found half-lives of 1 hour at 37 °C and 4 hours at
4 °C, whereas Tsuji et al. [95] found approximately 10 % hydrolysis of EES during
13 days at -20 °C, but no further decrease after 36 days. Others reported a
combined experiment of 1 week at -20 °C followed by three freeze-thaw cycles to
37 °C, which affected the stability to a certain extent [91].
Table 12 Statistical evaluation of the stability experiments for ERY A.
Time Concentration Point estimator
Lower Limit
Upper Limit
Stability experiment
[ng/mL] [%] [%] [%]
30 min 1600 98.6 95.5 101.7
60 min 98.9 97.0 100.8
90 min 99.4 96.8 102.0
30 min 40.00 102.9 97.4 108.8
60 min 100.5 96.1 105.1
Short-term stability (approximately 4 °C)
90 min 96.7 92.5 101.1
24 hours 1600 95.6 95.1 96.1 Post-preparative stability (autosampler, approx. 4 °C)
24 hours 40.00 97.2 91.5 103.1
24 hours 1600 96.3 94.5 98.1 Post-preparative stability (approximately -70 °C)
24 hours 40.00 98.6 93.2 104.2
Once 1600 98.5 97.5 99.7
Twice 95.8 94.1 97.7
Thrice 102.0 100.1 103.9
Once 40.00 99.8 93.1 106.9
Twice 102.0 96.2 108.2
Freeze-thaw stability (approximately -70 °C)
Thrice 97.6 93.8 101.6
11 days 1600 103.9 101.6 106.2
2 months 100.1 97.7 102.5
11 days 40.00 98.9 97.2 100.6
Long-term stability (approximately -20 °C)
2 months 99.1 94.0 104.4
11 days 1600 100.5 98.1 102.9
2 months 98.3 96.2 100.4
11 days 40.00 100.9 97.4 104.6
Long-term stability (approximately -70 °C)
2 months 102.9 94.7 111.7

Method comparison on three different LC-MS/MS systems 53
3.1.5 Method comparison on three different LC-MS/MS systems
During method transfer all tuning parameters were optimized, assuring the real
optimum for the erythromycin method on all instruments and therefore producing
absolute comparability of the validation experiments. For method comparison
experiments were chosen that are influenced by either the ionisation process or the
alternated ion path on the quantification of EES and ERY A. These experiments
were performed by using the same analytical column, mobile phase and sample
preparation technique to assure absolute comparability on API 3000™ and
API 5000™. Details to the experiments in principle are detailed in chapter 2.5.
Data from system-dependent validation experiments are compared to previously
obtained data from API III Plus, see Table 13 and Table 14.
Table 13 Validation data of EES on three different LC-MS/MS systems
Experiment Unit API III Plus API 3000 ™ API 5000™
Selectivity in plasma [-] no interference in 6 individuals
no interference in 20 individuals
no interference in 20 individuals
Linearity range
Order of magnitude
[ng/mL] 10 to 5000
5.0·102
1.25 – 4002
3.2·103
0.156 – 4002
2.6·104
Correlation Coefficient
[-] >0.999 >0.997 >0.999
LLOQ Gain for newer API
[ng/mL] 10
-
1.25 8
0.156 8
Precision of LLOQ
Accuracy of LLOQ
[%]
[%]
12.3
105.4
2.7
101.3
4.1
101.7
Highest SQC
Lowest SQC [ng/mL]
[ng/mL]
4000
10
4002
2.50
4002
0.156
Precision of SQCs
Accuracy of SQCs
[%]
[%]
3.5 to 8.4
98.9 to 105.6
6.8 to 8.8
95.7 to 105.2
3.9 to 12.4
96.9 to 104.5
Matrix Effect
EES
EES/IS
MF, Prec [%]
MF, Prec [%]
-
-
0.84, 10.8 %
0.92, 1.7 %
0.84, 8.7 %
0.88, 1.8 %
SQC: spiked quality control, LLOQ: lower limit of quantification, EES: erythromycin ethylsuccinate, IS: internal standard, MF: matrix factor, Prec: precision in plasma from 6 individuals

54 Erythromycin Ethylsuccinate and Erythromycin A
Table 14 Validation data of ERY A on three different LC-MS/MS systems
Experiment Unit API III Plus API 3000 ™ API 5000™
Selectivity in plasma [-] no interference in 6 individuals
no interference in 20 individuals
no interference in 20 individuals
Linearity range
Order of magnitude
[ng/mL] 4.00 - 2000
5.0·102
0.781 – 2100
2.7·103
0.0977 – 2100
2.1·104
Correlation Coefficient [-] >0.999 >0.999 >0.998
LLOQ
Gain for newer API [ng/mL] 4.00
-
0.781
5 0.0977
8
Precision of LLOQ
Accuracy of LLOQ
[%]
[%]
9.2
101.7
1.2
96.4
6.9
106.5
Highest SQC
Lowest SQC [ng/mL]
[ng/mL]
1600
4
2100
1.56
2100
0.195
Precision of SQCs
Accuracy of SQCs
[%]
[%]
3.9 to 7.6
97.8 to 101.7
2.2 to 10.0
97.6 to 101.0
1.6 to 9.7
100.8 to 104.2
Matrix Effect
ERY A
ERY A/IS
MF, Prec [%]
MF, Prec [%]
-
-
1.05, 2.0 %
1.02, 1.9 %
0.98, 3.0 %
1.03, 1.0 %
SQC: spiked quality control, LLOQ: lower limit of quantification, ERY A: erythromycin A, IS: internal standard, MF: matrix factor, Prec: precision in plasma from 6 individuals
This high sensitivity on API 5000™ derives from the large orifice, which enables a
relatively high number of molecular ions to enter the mass spectrometer, whereas
the vertical spraying ion source enables a relatively high number of analyte ions
among relatively few interfering un-charged molecules to enter the mass
spectrometer.
The linear regression of the peak area ratios versus concentrations were fitted over
the mentioned concentration ranges. The mean linear regression equations of the
calibration curves were:
API III Plus, EES: y = 0.0009 (±0.0005) + 0.0006 (±0.0000) · x (r² ≥ 0.999)
API 3000™, EES: y = 0.0001 (± 0.0020) + 0.0068 (± 0.0016) · x (r² ≥ 0.997)
API 5000™, EES: y = 0.0000 (± 0.0001) + 0.0127 (± 0.0125) · x (r² ≥ 0.999)
API III Plus, ERY A: y = 0.0008 (±0.0004) + 0.0008 (±0.0000) · x (r² ≥ 0.999)
API 3000™, ERY A: y = -0.0001 (± 0.0006) + 0.0084 (± 0.0012) · x (r² ≥ 0.999)
API 5000™, ERY A: y = 0.0010 (± 0.0003) + 0.0130 (± 0.0003) · x (r² ≥ 0.998)
y: ratio of the EES or ERY A peak area to the IS peak area
x: plasma concentration of EES or ERY A

Method comparison on three different LC-MS/MS systems 55
Excellent linearity and correlation coefficients were obtained for all linearity ranges.
The overall precision and accuracy of the back-calculated calibration standards in
human plasma on API III Plus ranged from 1.2 to 12.3 % and from 95.6 to 106.1 %,
on API 3000™ it ranged from 0.3 to 8.2 %, and from 95.4 to 104.2 % for both
analytes. On API 5000™ the precision and accuracy of the calibration standards
ranged from 0.8 to 8.2 % and from 90.4 to 106.5 %, for both analytes. Therefore no
remarkable difference in precision or accuracy of the calibration standards was
observed on all three mass spectrometers.
Increasing sensitivity was achieved while transferring the method from one system to
the next. This can be seen by the LLOQ, which was improved two times by a factor
of 8 for EES and by the factors 5 and 8 for ERY A. The precision and accuracy
obtained at the LLOQs ranged from 1.2 to 12.3 % and from 96.4 to 106.5 %,
respectively, for both analytes on all three instruments, still showing a high precision
at the lowest limits of quantification. In addition, the signal-to-noise ratio was greater
than 5 for both analytes on all systems, except for EES at API 5000™ where it was
greater than 10.
Due to improved sensitivity of the newer mass analyzers, interferences in the
extended lower calibration range may occur. Therefore, the selectivity of the method
was tested by preparing drug-free human plasma from twenty (ten males and ten
females) individuals with and without IS. With none of the tested mass analyzers
interference between matrix components and EES or ERY A, or the IS
(oleandomycin) occurred in the observed concentration ranges. Even with the most
sensitive instrument, the API 5000™, samples were free from interferences down to
0.0488 ng/mL.
For the evaluation of the intra-day and inter-day precision and accuracy on the
API 3000™ and API 5000™, SQC samples containing EES or ERY A in human
plasma were analyzed on three validation days, respectively. Sample preparation
and calculations were performed as described above in the validation procedure.
The overall inter-day precision of the SQC samples containing EES or ERY A in
human plasma fulfilled the pre-defined acceptance criteria very well. All precision
data were below 15 % and accuracy was well within 85-115 % deviation from
nominal concentration.
As mass analyzers with quite different ionisation sources are compared, the test for
matrix effect is important. The matrix effect was investigated quantitatively as matrix

56 Erythromycin Ethylsuccinate and Erythromycin A
factor (MF) and qualitatively with post column infusion (for details on experimental
set-up see chapter 2.5.7).
All matrix factors (MF, mean ± SD) of ERY A were close to 1.0 on API 3000™ and
on API 5000™ indicating the absence of a matrix effect of ERY A in both analytical
systems. For EES, the MF calculated only by peak areas were slightly lower than the
MF corrected by the internal standard oleandomycin. This shows that slight ion
suppression of EES in both ionisation sources of API 3000™ and API 5000™
occurs. However, as the IS oleandomycin undergoes slight suppression to the same
extent, the overall matrix factor is compensated. The MF does not need to be 1.0
(see EMA [34]), but has to be constant for all analyzed matrices, assuring no
difference for calibration standards and different subjects’ samples. That is the case
in this experiment, proven by the small standard deviations.
Via post column infusion no increase or decrease of the signal was observed at and
near the retention times of EES, ERY A and OLE, respectively, and therefore, a
matrix effect was excluded for both instruments.
3.1.6 Comparison of the LC-MS/MS method with proced ures reported in the
literature
Table 15 shows LLOQ, run time, sample volume, sample preparation and quality
control data for several previously reported analytical methods determining
erythromycin ethylsuccinate in human plasma [91-95] in comparison to the present
LC-MS/MS method.
All previously reported methods are based on extraction procedures requiring high
sample volumes (up to 3.0 mL), expensive organic solvents and much time for
sample preparation procedures. Such high sample volumes should be avoided for
two reasons: First, blood volume taken from volunteers or patients should be kept
low for ethical reasons and 3 mL of plasma would require approximately 6 mL of
blood for one single aliquot and one single timepoint. Second, re-analysis of samples
due to analytical or pharmacokinetic reasons is hardly possible when sample volume
is enough for only one analysis.
This new method needs 0.100 mL sample volume only, and is a fast and low-cost
precipitation method featured by excellent recovery data (>95% for ERY and >99%
for EES) with high precision (CV ≤ 5%). Comparison with previously published data
reveals that all LLE methods are characterized by lower recoveries. They did not

Comparison of the LC-MS/MS method with procedures reported in the literature 57
control pH or used weak alkaline pH conditions, though two pH steps above the pKa
of 8.8 would be needed to achieve fully neutral ERY A and EES molecules for
complete extraction into organic solvent. This was overcome by one older method
[95], where a higher recovery is produced by a very laborious triple LLE.
Furthermore, the method saves analyzing time, with 3 minutes being more than
twice as fast as the fastest previously reported method [91]. Other reported methods
need up to 40 minutes per sample.
Only one previous method reported a similar number of validation experiments [91],
but no stability assessment during plasma sample handling and their sample
preparation process, which used LLE and evaporation at 50°C. The developed
method used cooled PPT and was tested by extensive validation experiments, like
different stability investigations, the influence of hemolyzed plasma and matrix
effects.
The most important advance of the new method is the enhanced sensitivity down to
0.156 ng/ml for erythromycin ethylsuccinate and down to 0.098 ng/mL for
erythromycin base. This in an improvement by a factor of 3 (EES) and by a factor of
10 (ERY A).
With the new LC-MS/MS method erythromycin ethylsuccinate and erythromycin base
can be measured with high sensitivity using simple protein precipitation sample work
up. With only 3 minutes runtime about 400 human plasma samples can be measured
per LC-MS/MS system per day.

58 Erythromycin Ethylsuccinate and Erythromycin A
Table 15 Analytical methods for the determination of erythromycin ethylsuccinate and erythromycin A in human plasma; grouped by analytical
technique and descending years of publication
Method Linearity Range
[[[[ng/mL ]]]]
Approx. run time
[[[[min ]]]]
Inter-day Prec / Acc
at LLOQ
[[[[%]
Inter-day Prec / Acc
of SQCs
[[[[%]]]]
Recovery (mean ± SD)
[[[[%]]]]
Sample Vol.
[mL]
Sample prep.
Internal standard
Additional VAL exp.
Application
LC-MS/MS
(current method)
EES
ERY
10-5000
4.0-2000 3.0
12.3 / 105.4
9.2 / 101.7
3.5 to 8.4 / 98.9 to 105.6
3.9 to 7.6 / 97.8 to 101.7
99.5±5.0 (EES)
95.8±1.6 (ERY) 0.100 PPT oleandomycin 1, 2a, 2b,
2c, 2d, 3 500-mg PK
API 3000™
(current method)
EES
ERY
1.25-4002
0.781-2100
2.7 / 101.3
1.2 / 96.4
6.8 to 8.8 / 95.7 to 105.2
2.2 to 10.0 / 97.6 to 101.0
91.3± 1.2 (IS)
4, 5
API 5000™
(current method)
EES
ERY
0.156-4002
0.098-2100
4.1 / 101.7
6.9 / 106.5
3.9 to 12.4 / 96.9 to 104.5
1.6 to 9.7 / 100.8 to 104.2 4, 5
LC-MS/MS [91] Gu 2006
EES
ERY 0.5-5000 6.5
17.4 / 96.0
16.1 / 96.0
0.8 to 2.1 / 94.0 to 97.3
1.5 to 5.9 / 100.9 to 102.4
56±3 to 59±4
77±7 to 82±3 0.200 LLE diazepam 1, 2b, 2c,
2d, 4 500-mg PK
LC-(FAB)-MS [92] Kokkonen 1991
EES 105-10500 13 36 / 100 12.0 / 88.6 77±4 (5250 ng/mL)
1.0 LLE [2H5]-EES n.r. n.r.
FAB-MS [93] Ottoila 1987
EES
ERY
50-5000
100-5000 n.r.
6.3 / n.r.
5.5 / n.r. n.r.
86±4 (1000 ng/mL)
90±1 (1000 ng/mL) 1.0 LLE
[2H5]-EES
[2H3]-ERY n.r.
PK
(no data)
LC/ED [94] Croteau 1987
EES
ERY
250-3000
250-10000 40 n.r.
3.2 / n.r.
10.3 / n.r.
55.8
74.0 (ERY), 68 (ROX) 2.0 LLE roxithromycin 2a
600mg-PK
(graphical)
LC/FD [95] Tsuji 1978
EES
ERY 10-n.r. 24 n.r. n.r.
96.2±4.5 (600ng/mL)
102.2±6.0 (600ng/mL) 1-3 LLE
(3x) n.r. 2b 200-mg PK
(no data)
Prec: Precision, Acc: Accuracy, SD: standard deviation, ERY: erythromycin A, EES: erythromycin ethylsuccinate, PPT: protein precipitation, LLE: liquid-liquid extraction, n.r.: not reported; 1: Specificity, 2: Stability (a) short-term, (b) long-term, (c) post-preparative, (d) freeze-thaw, 3: haemolysed plasma, 4: Matrix Effect, 5: Signal-to-noise

Application to a pharmacokinetic study 59
3.1.7 Application to a pharmacokinetic study
3.1.7.1 Study design and sample handling
The LC-MS/MS method was used to investigate the pharmacokinetics of 587.25 mg
erythromycin ethylsuccinate, equivalent to 500 mg erythromycin base in suspension,
given as a single oral dose to 10 healthy male and female volunteers under fasting
conditions. Blood collection was performed immediately before administration and at
0.25, 0.50, 0.75, 1.00, 1.25, 1.50, 2.00, 2.50, 3.00, 3.50, 4.00, 5.00, 6.00, 8.00,
10.00, 12.00, 16.00, and 24.00 hours after oral administration of study drug.
The samples were collected into ammonium heparinate monovettes and cooled in an
ice-water bath to assure the stability of erythromycin ethylsuccinate. This procedure
surpasses serum collection, where the blood has to clot for several minutes at room
temperature. The blood samples were cooled to approximately 4 °C during
centrifugation for 10 minutes at 1500 g. The plasma was subsequently transferred
into polypropylene tubes and immediately frozen at approximately -70 °C until
analysis.
3.1.7.2 Determination of plasma concentrations
The concentrations of erythromycin ethylsuccinate and its active metabolite
erythromycin A were determined using the validated LC-MS/MS method as
summarized in Table 6.
The human plasma samples were analyzed for erythromycin ethylsuccinate and
erythromycin A together with injection standards, calibration standards, study
samples and SQC samples was measured to assure quality during measurement.
Figure 13 depicts typical MRM-chromatograms of EES, ERY A and the IS
(oleandomycin) in human plasma samples:
A) Blank plasma
B) LLOQ (10 ng/mL EES / 4.0 ng/mL ERY A)
C) Study sample (t = 8.0 h) containing 13.5 ng/mL EES and 44.7 ng/mL ERY A
D) Study sample (t = 0.75 h) containing 1146 ng/mL EES and 221.8 ng/mL ERY A

60 Erythromycin Ethylsuccinate and Erythromycin A
Figure 13 Representative MRM-chromatograms for EES (top), ERY A (middle)
and OLE (IS, bottom) in human plasma
EES(HX)-BQC-545P-2000
EES(HX)-BQC-545P-2000 EES(HX)-BQC-545P-2000
EES(HX)-BQC-545P-2000
EES(HX)-BQC-545P-2000EES(HX)-BQC-545P-2000
EES(HX)-BQC-545P-2000
EES(HX)-BQC-545P-2000 EES(HX)-BQC-545P-2000 EES(HX)-BQC-545P-2000
A B C D
EES(HX)-BQC-545P-2000
EES(HX)-BQC-545P-2000 EES(HX)-BQC-545P-2000
EES(HX)-BQC-545P-2000
EES(HX)-BQC-545P-2000EES(HX)-BQC-545P-2000
EES(HX)-BQC-545P-2000
EES(HX)-BQC-545P-2000 EES(HX)-BQC-545P-2000 EES(HX)-BQC-545P-2000
A B C D
The back-calculated concentrations of calibration standards and the determined
concentrations of spiked quality control samples were compared to the theoretical
concentrations to calculate the respective accuracy. The overall precision and
accuracy is summarized in Table 16.

Application to a pharmacokinetic study 61
Table 16 Accuracy and precision of calibration standards and SQC samples
during analysis of erythromycin ethylsuccinate and erythromycin A in study samples
Theoretical Concentration
(µg/mL) Mean Accuracy
(%) Mean Precision
(%)
5.00 100.3 1.7
4.00 98.1 2.0
2.00 103.6 2.9
1.00 99.1 2.0
0.200 100.3 1.4
0.100 99.3 5.1
0.0500 96.9 6.0
0.0200 103.1 2.2
0.0150 99.1 4.1
Calibration standards
EES
0.0100 99.5 5.4
4.00 103.4 3.4
0.400 105.8 5.0
0.100 100.7 5.4
SQC samples
EES
0.0200 98.3 3.5
2.00 98.7 2.2
1.60 101.4 2.3
0.800 100.2 1.9
0.400 100.2 2.6
0.0800 100.8 3.6
0.0400 101.8 2.1
0.0200 101.4 5.2
0.00800 99.2 4.4
0.00600 98.6 7.5
Calibration standards
ERY A
0.00400 97.4 8.2
1.60 105.6 2.6
0.160 105.2 1.6
0.0400 104.7 5.1
SQC samples
ERY A
0.00800 103.8 6.0
* Accepted limits by EMA and FDA: maximal 15 % for precision and 85-115 % for accuracy
The correlation coefficient of resulting linear regressions was at least 0.9994 in all
sequences for both analytes. The inter-day precision of the spiked quality control
samples of erythromycin ethylsuccinate and erythromycin A in human plasma
analyzed within the batches of study samples was maximal 6.0 %. The mean
accuracy of all calibration standards and SQC samples was within ±106.0 %, being
well within the 15-% deviation limit and confirming the very high precision of this
assay.

62 Erythromycin Ethylsuccinate and Erythromycin A
3.1.7.3 Pharmacokinetic results
The resulting concentration data was plotted versus time after oral administration of
the EES suspension (587.25-mg EES suspension equivalent to 500 mg erythromycin
base). The mean plasma concentration profiles are displayed in Figure 14.
Figure 14 Plasma profiles (mean±SD) of EES and ERY A concentrations vs. time
following an oral dose of EES suspension (eq. to 500 mg ERY base) to healthy
volunteers (n=10)
0.001
0.010
0.100
1.000
0 2 4 6 8 10 12 14 16 18 20 22 24
Con
cent
ratio
n (µ
g/m
L)
Time (hours)
Erytromycin ethylsuccinate
Erythromycin A
LLOQ EES
LLOQ ERY A
n=7
n=6 n=6
n=6 n=4
The mean peak concentration of the pro-drug EES (1.4 µg/mL) is reached after
36 minutes on average, whereas the mean peak concentration of its active
metabolite (0.34 µg/mL) is attained on average 44 minutes later, at 1.3 hours. While
the EES plasma concentrations curve is steeply sloping (t1/2 = 5.2 h), the metabolite
concentrations are decreasing more slowly (t1/2 = 10.0 h), surpassing the EES
concentrations on average 3 hours post-dose. From approximately 10 hours post-
dose, the mean plasma concentrations of EES are slightly re-ascending, resulting in
a second intersection with the metabolite curve. This derives from the fact that part
of the samples at the time points 10, 12, 16 and 24 hours had no detectable
concentration below the lower limit of quantification, not contributing to the mean
values, which are used in the plasma profile. This is also reflected by the error bars
in Figure 14, especially at the time points 16 and 24, which are spread below the

Application to a pharmacokinetic study 63
lower limits of quantification (LLOQ) indicating that the elimination of ERY A does not
significantly overtake the elimination of EES.
In Table 17 the pharmacokinetic parameters of EES and ERY A from this study are
compared to pharmacokinetic parameters reported in previously published studies.
Very few data are available on the pharmacokinetics of erythromycin ethylsuccinate.
Only one paper [91] was found that describes data on a 500-mg oral dose, but
without providing further information on the formulation, the higher AUC and Cmax
values can hardly be explained. Croteau et al. [106] compared EES tablets,
equivalent to 600 mg ERY base, to erythromycin estolate and concluded
pharmacokinetic advantages of the estolate over the ethylsuccinate ester. The time
to reach maximum plasma concentrations is shorter for the suspensions (current
study, [107]) than for the tablets ([106], [76]) reflecting that the tablets need
additional time for dissolution before absorption can take place. It seems, that, in
addition to faster absorption, the suspension could also be characterized by more
complete absorption of EES. This may be concluded from the observation that the
EES AUC of the suspension equivalent to 500 mg ERY A is higher than the EES
AUC of the tablet equivalent to 600 mg ERY A. Comparing the ERY A AUC of the
two formulations, virtually no difference can be observed. Probably, this can be
ascribed to the fact that EES as a suspension is more supposed to the acidic
environment in the gut than EES in the tablet. However, these comparisons should
be handled carefully since erythromycin is characterized by non-linear
pharmacokinetics.
In addition, the half-lives of EES (5 h) and ERY A (10 h) from the EES suspension in
this study are much longer than the half-lives of the EES tablets (1.1 h EES, 1.5 h
ERY A) reported by Croteau et al. [106]. The longer half-life of the studied
suspension is an advantage, because longer dosing intervals can lead to more
patient compliance with the dosing regime. The observed difference may be
explained in two different ways:
Since the formulation of a drug mainly influences its absorption, which is probably
not the rate-limiting process here (tmax suspension: 0.6 h/ 1.3 h EES/ERY A), the
difference in the half-lives can be related more likely to the different doses (500 mg
suspension versus 600 mg tablet) and non-linear behaviour of volume of distribution
or elimination. As a basic compound, erythromycin binds to the saturable α-1-acid
glycoprotein (protein binding: 84 % [1]), resulting in higher free plasma
concentrations and a higher volume of distribution at higher doses. Erythromycin is

64 Erythromycin Ethylsuccinate and Erythromycin A
Table 17 Pharmacokinetic parameters (mean±SD) of erythromycin ethylsuccinate (EES) and erythromycin base in healthy subjects after
administration of a single oral dose of erythromycin ethylsuccinate
Reference No. of Subj./
Gender
Dose / Formulation t last
[h]
AUC0→→→→last
[µg·h/mL]
AUC0→→→→∞∞∞∞
[µg·h/mL]
Cmax
[µg/mL]
tmax
[h]
t1/2
[h]
Analytical method
Current study 10 / m,f 587.25 mg EES suspension (eq. to 500 mg ERY base)
24 2.49 ± 1.11 2.63 ± 1.15 1.41 ± 0.63 0.60 ± 0.24 5.21 ± 3.95 LC-MS/MS
Gu 2006 [91] 4 / m 500 mg oral / n.r. 36 2.18 2.47 0.87 0.50 n.r. LC-MS/MS
Croteau 1988 [106]
12 / m,f EES tablets (eq. to 600 mg ERY base)
12
EE
S
n.r. 1.88±1.20 0.91±0.69 1.27±0.49 1.12±0.90 LC/ED
Current study 10/m,f 587.25 mg EES suspension
(eq. to 500 mg ERY base) 24 1.76 ± 0.84 2.12 ± 1.42 0.34 ± 0.13 1.33 ± 0.95 10.0 ± 10.6 LC-MS/MS
Gu 2006 [91] 4 / m 500 mg oral / n.r. 36 3.16 3.39 0.71 0.50 n.r. LC-MS/MS
Croteau 1988 [106]
12 / m,f EES tablets (eq. to 600 mg ERY base)
12 n.r. 2.03 ± 1.93 0.58 ± 0.57 2.5 ± 1.4 1.54 ± 1.05 LC/ED
Thompson 1980 [76]
18 / m,f EES 2x400-mg film tablets
Immediately before food
Immediately after food
1h after food
8
7.48 ± 3.98
4.85 ± 3.28
5.51 ± 3.06
n.r.
2.71 ± 1.34
1.54 ± 1.05
1.72 ± 0.89
1.28 ± 0.79
2.39 ± 0.93
2.97 ± 0.81
n.r. Microbiol.
Griffith 1969 [107] 9 EES suspension (eq to 200 mg ERY base)
8
Ery
thro
myc
in b
ase
from
EE
S
n.r. n.r. 0.32
0.26
0.5 n.r. Microbiol
m: male, f: female, n.r.: not reported

Summary: Erythromycin ethylsuccinate 65
concentrated in the liver and excreted in the bile [1], whereas the main route of
elimination is metabolism [9]. Higher free drug concentrations would increase hepatic
clearance. However, given that t1/2 behaves proportional to V/CL, the hepatic
clearance needs to increase four times higher than V to achieve the observed
difference in t1/2, which is considered unlikely for an increase of the dose from
500 mg to 600 mg.
A further, probably easier explanation targets the data itself. Since the elimination
half-life is determined from the latest values of each concentration-time profile, it
strongly depends on the lower limit of quantification. If the concentrations of the last
time points of some volunteers are detectable, but below the limit of quantification, it
cannot contribute to the mean concentration of these time points. Then, the mean of
all detectable concentrations appears higher and so does the elimination half-life.
3.1.8 Summary: Erythromycin ethylsuccinate
The LC-MS/MS assay for EES and ERY A in human plasma is simple, fast, reliable,
sensitive, precise and accurate. The method employed simple protein precipitation of
100 µL of human plasma, and is linear in the range from 0.156 to 5000 ng/mL
erythromycin ethylsuccinate and 0.098 to 2100 ng/mL erythromycin A. The principal
advantage of the LC-MS/MS method described here is the simultaneous
achievement of high absolute recovery (>96 %), high sensitivity on all three mass
spectrometers (LLOQ from 0.049 to 10.0 ng/mL), high inter-day precision (≤12.3 %)
and accuracy (within ±109.6 %) for LLOQ as well as excellent linearity (r2>0.997)
with a short run time of only 3.0 minutes. These characteristics make the method
suitable for the precise and accurate measurement of low concentrations of EES and
ERY A in the context of pharmacokinetic studies. The method was successfully
applied to the analysis of human plasma samples during a pharmacokinetic study of
an erythromycin ethylsuccinate suspension equivalent to 500 mg erythromycin base.
Stability for erythromycin ethylsuccinate and erythromycin A in native human plasma
was proven for at least 2 months at approximately -20 °C and approximately -70 °C,
for at least 1.5 hours at 4 °C and during three freeze-thaw cycles. No instability was
observed after the sample preparation procedure for 24 hours at autosampler
temperature and at approximately -70 °C.
The structural analogue oleandomycin is adequate as internal standard for
erythromycin, shown by comparable recoveries of erythromycin ethylsuccinate,

66 Roxithromycin
erythromycin base and oleandomycin, as well as the absence of a matrix effect
(erythromycin A) or reduction of the matrix factor (erythromycin ethylsuccinate) with
and without oleandomycin.
The API 5000™ LC-MS/MS system significantly improves sensitivity for erythromycin
ethylsuccinate and erythromycin A down to 0.16 ng/mL and 0.098 ng/mL,
respectively. Moreover, it is possible to transfer the assay onto three different LC-
MS/MS systems, differing in technical implementation of ionization, ion inlet and
focussing. This transfer showed the good robustness of the method, and
furthermore, that it can be expanded into the pg/mL range without loosing quality
(accuracy and precision).
During study sample analysis the accuracy was between 96.9 and 105.8 % and
precision ranged from 1.4 to 8.2 %, indicating that the quality of the obtained data
was very high (allowed limits: 85-115% and maximal 15%). Only few
pharmacokinetic data on erythromycin ethylsuccinate had been previously published.
The current study adds data on a suspension formulation equivalent to 500 mg
erythromycin A. Compared to other erythromycin formulations it can be distinguished
by a pleasant flavour and a rather long half-life, which can help to increase patients’
compliance with the dosing regime and by implication to increase the quality of their
lives.
3.2 Roxithromycin
3.2.1 Chemical and pharmaceutical properties
Roxithromycin is a semi-synthetic macrolide antibiotic, which is very similar in
composition, chemical structure and mechanism of action to erythromycin. Due to
the conversion of the keto group in position 10 to an oxime roxithromycin is
chemically more stable to acids than erythromycin and former macrolides, because a
ketal formation is not possible. The stability against acids allows enhanced
bioavailability and rapid absorption following oral application, as well as high serum
concentrations and a longer serum half-life compared to erythromycin [108].
Roxithromycin is only partially metabolised, more than half of the parent compound
being excreted unchanged [109]. As a basic compound (pKa 9.2 [110] and logP 2.75

Chemical and pharmaceutical properties 67
[73]), roxithromycin binds to a small extent to albumin, mainly to α-1-acid
glycoprotein, which is saturable already at clinically relevant roxithromycin
concentrations above about 4 µg/mL [111]. At clinical relevant concentrations plasma
protein binding ranges between 80 and 96 %. Due to the relatively high plasma
protein binding of roxithromycin to the saturable α-1-acid glycoprotein, roxithromycin
is characterized by non-linear pharmacokinetics, i.e. by a substantial increase in free
plasma concentration from 4.3 to 13.4 % when the total concentration increases from
3.3 to 8.4 µg/mL [111].
Scheme 5 Chemical structure of roxithromycin (ROX)
Formula Mol. weight Exact mass pK a logP
C41H76N2O15 837.0 g/mol 836.5 amu 9.2 2.75
IUPAC Name: (3R,4S,5S,6R,7R,9R,11S,12R,13S,14R,Z)-6-(((2S,3R,4S,6R)-4-(dimethylamino)-3-hydroxy-6-methyltetrahydro-2H-pyran-2-yl)oxy)-14-ethyl-7,12,13-trihydroxy-4-(((2R,4R,5S,6S)-5-hydroxy-4-methoxy-4,6-dimethyltetrahydro-2H-pyran-2-yl)oxy)-10-(((2-methoxyethoxy)methoxy)imino)-3,5,7,9,11,13-hexamethyloxacyclotetradecan-2-one
Like erythromycin, roxithromycin is classified as a bacteriostatic agent, but,
depending upon its concentration or the micro-organism, it can act bactericidal [108].
It is the least active of the 14-membered macrolides having activity against gram-
positive and gram-negative cocci, gram-positive bacilli and some gram-negative
bacilli [9, 112-113].

68 Roxithromycin
3.2.2 Published analytical methods
The majority of the published methods to quantify roxithromycin in human serum or
plasma include liquid chromatography with different detection methods, for example
electrochemical detection (LC/ED) [114-117] or fluorescence detection (LC/FD) in
combination with derivatisation [118-119]. Although macrolides exhibit low UV
absorbance due to the lack of a strong chromophore, some spectrophotometric
methods (LC/UV) to determine macrolide antibiotics in a variety of matrices have
been reported [120-122]. Many of these approaches have been applied in
pharmacokinetic studies [116-117, 119-120].
Previously reported LC/ED, LC/FD and LC/UV methods to quantify roxithromycin
present relatively low sensitivity with lower limits of quantification (LLOQ) in the
range of 65 to 500 ng/mL, extensive and time-consuming sample preparation
procedures [114] using relatively high sample volumes [118-120] and long run times
between 6 and 25 minutes [114-116, 118-121].
Several LC-MS/MS methods have been reported to determine macrolide antibiotics
in a series of matrices like milk and yogurt [122-124], honey [125], human plasma
[80, 126], rat lung tissue [127] and waste water [128-129].
However, very few LC-MS/MS methods have been published for roxithromycin in
human plasma [49-51] to evaluate bioequivalence of roxithromycin formulations. The
methods presented either a somewhat high LLOQ of 50 ng/mL [49-50], did not report
precision and accuracy data for their LLOQ [51], needed relatively long run times of
five to approximately seven minutes [49, 51], which is not suitable for large sample
quantities.
3.2.3 LC-MS/MS method
The original LC-MS/MS method was provided by Professor Dr Fritz Sörgel and is
discussed in detail in the following chapter. Mass spectra of roxithromycin were
acquired by use of atmospheric pressure chemical ionisation (APCI) in the positive
ion mode. The precursor ion spectrum (Q1) contains an intensive peak
correspondent to the protonated molecule [M+H]+ with m/z 837.6 (exact mass 836.5
amu), as depicted in Figure 15.

LC-MS/MS method 69
Figure 15 Positive precursor ion (Q1) spectrum of roxithromycin
837.6
800 1000 1200 1400 1600m/z
1.0e6
2.0e6
3.0e6
4.0e6
5.0e6
6.0e6
7.0e6
8.0e6
9.0e6
1.0e7
1.1e7
1.2e7
1.3e7
1.4e7
The protonated molecule of roxithromycin (m/z 837.6) is fragmented by collision-
activated dissociation resulting in the MS/MS product ion mass spectrum in Figure
16.
Figure 16 Product ion mass spectrum and fragmentation scheme of roxithromycin
158.0
522.2
679.4
716.4
200 300 400 500 600 700 800 m/z
2.0e5
4.0e5
6.0e5
8.0e5
1.0e6
1.2e6
1.4e6
1.6e6
1.8e6
2.0e6
2.2e6
2.4e6
2.6e6
2.8e6
837.6
661.6
558.4
540
116.0
-oxime
- cladinose
[M+H]+
-oxime

70 Roxithromycin
The MS/MS spectrum contains the same fragments as reported by Kearney et al.
[130], namely the loss of the cladinose sugar (-158.1 amu) that leads to m/z 679.4,
which looses the oxime substituent group on the 10-position (-121.1 amu) to produce
m/z 558.3 and further losses of H2O leading to m/z 540.3 and m/z 522.3. If the oxime
substituent group (-121.1 amu) demerges first from the protonated molecule [M+H]+
m/z 716.4 is produced, which can further loose the cladinose sugar (-158.1 amu) to
form the product ion m/z 558.3.
Scheme 6 Fragmentation mechanism of the desosamine moiety of macrolides
The product ion with m/z 158.1 is generated by charge-site cleavage across the
O-C6’ bond of the D-desosamine substituent with subsequent release of the
2-methyl-4-dimethylamino-5-hydroxy-tetrahydropyrylium ion. This daughter ion may
undergo a further fragmentation step to m/z 116.1 by releasing propene (42.0 amu).
Scheme 7 Summary of the fragmentations for roxithromycin
The system parameters for roxithromycin are optimized for the most intensive
fragment signal, which is m/z 679.4. The acquired spectra of the internal standard
clarithromycin (CLA) contained the protonated molecule [M+H]+ with m/z 748.6 and

LC-MS/MS method 71
the most abundant fragment with m/z 158.2. Clarithromycin spectra are included in
chapter 3.3 Clarithromycin in Figure 19.
As with erythromycin, the mass spectrometric conditions for roxithromycin are using
APCI as ionization technique in the positive-ion mode and MRM of the following
transitions:
m/z 837.5 → m/z 679.4 (ROX) and m/z 748.5 → m/z 158.1 (CLA, IS).
System parameters were optimized for each system during spectra acquisition.
These settings were chosen to obtain the highest analytical sensitivity for
roxithromycin. They are summarized in Table 18.
Table 18 Optimized MS/MS parameters for roxithromycin
API III Plus API 3000™ API 5000™
Probe temperature 500 °C 500 °C 350 °C
Discharge needle current 3 µA 3 µA 5 µA
Orifice voltage / Declustering potential
50 V (OR) 30 V (OR) 88 V (DP)
Collision energy 25 eV 28 eV 32 eV
Nebuliser gas (APCI) 80 psi 8 (NEB) 50 psi (GS1)
Auxiliary gas (APCI) - 2 L/min 50 psi (GS2)
Nebuliser, auxiliary and curtain gas
High purity nitrogen High purity nitrogen High purity nitrogen
Collision gas High purity argon High purity nitrogen High purity nitrogen
Collision gas thickness 240·1013 atoms/cm2 6 (2.7·10-5 torr) 6 (1.9·10-5 torr)
Chromatographic separation of the weak base roxithromycin is done on a reversed
phase C18 column. The YMC ODS-AM, 3 µm (50 x 4.6 mm I.D.) column combined
with a mobile phase consisting of ammonium acetate buffer (5 mM, pH 5.0) and
acetonitrile (50/50, v/v), delivered at a flow rate of 1.0 mL/min. This combination was
suitable and fast enough for routine drug analysis: Applying these conditions,
roxithromycin elutes within a run time of 2.2 minutes. Additionally, at pH 5
roxithromycin is fully protonated and prepared for MS detection in the positive ion
mode.
The expected concentration range in plasma for roxithromycin following
administration of a 300-mg oral dose can be determined by Cmax, which reaches
concentrations between 7 and 12 µg/mL (see comparison of PK parameters from
literature in Table 24). In order to be able to detect about 5 % of Cmax, the LLOQ of

72 Roxithromycin
roxithromycin should be lower than 350 ng/mL. Due to the high system sensitivity,
the calibration range can be set from 10.0 to 4000 ng/mL.
Roxithromycin is stable regarding intramolecular ketal formation, but it may undergo
hydrolysis in aqueous and acidic conditions [131], see Scheme 8. Though human
plasma has neutral to slight basic pH, all sample handling as well as the sample
preparation procedure was done in an ice-water bath to assure the stability of
roxithromycin.
Scheme 8 Hydrolysis of the cladinose moiety of roxithromycin
After thawing the human plasma samples, calibration standards and SQC samples in
a cold water bath, the samples are mixed thoroughly and centrifuged for 5 minutes at
approximately 4 °C to separate eventually present solid components. An aliquot
(100 µL) of the plasma is deproteinised by adding 250 µL of acetonitrile. Ammonium
acetate buffer (0.1 M, pH 4.6), containing the IS clarithromycin, is added before
precipitation to ensure ionisation in solution. The IS working solution is prepared by
diluting a stock solution of clarithromycin by factor 1000 with ammonium acetate
buffer (pH 4.6) to give a clarithromycin concentration of 2 µg/mL. For the more
sensitive MS systems, the IS working solution is further diluted by a factor of 10. The
precipitated sample, containing the IS, is mixed thoroughly to facilitate
deproteinisation. The precipitate is separated by centrifuging the samples for
5 minutes at 3600 rpm (3280 g) at approximately 4 °C. An aliquot (100 µL) of the

Validation 73
supernatant is diluted with 100 µL of ammonium acetate buffer (5 mM, pH 5) to lower
the ion strength and raising the water content of the sample giving more constant
and sharper peaks. After mixing, 15 µL of each sample is injected onto the
LC-MS/MS system. In Table 19 the optimized sample preparation procedure and
LC-MS/MS conditions are summarized.
Table 19 Summary of the LC-MS/MS method for roxithromycin in human plasma
Characteristic Details
Sample preparation
100 µL plasma + 50 µL NH4CH3COO /IS (0.1 M, pH 4.6) + 250 µL CH3CN
100 µL supernatant + 100 µL NH4CH3COO (5 mM, pH 5.0)
Internal standard Clarithromycin (CLA)
Column YMC ODS-AM, 3 µm (50 x 4.6 mm I.D.)
Mobile phase 50 % CH3CN
50 % NH4CH3COO (5 mM, pH 5.0)
Flow rate 1.0 mL/min
Run time 2.2 min
Ionisation APCI – atmospheric pressure chemical ionisation
Polarity Positive ion mode
Mass transitions m/z 837.5 → m/z 679.4 (ROX)
m/z 748.5 → m/z 158.1 (CLA)
NH4CH3COO /IS: ammonium acetate buffer containing the internal standard clarithromycin (2 µg/mL)
3.2.4 Validation
The data were obtained from a previous validation on the API III Plus and the results
are explained in this chapter.
The specificity of the LC-MS/MS method was tested in ten different batches of drug-
free human plasma (five males and five females). In none of the tested plasma
samples matrix components eluted at the same retention time as roxithromycin or
the IS (clarithromycin).
The linear regression of the peak area ratios versus concentrations were fitted over
the concentration range of 9.21 to 3950 ng/mL roxithromycin in human plasma. The
mean linear regression equation of the calibration curves (N = 8) analyzed at the
beginning and at the end of each of four validation sequences was calculated:

74 Roxithromycin
y = 0.0018 (± 0.0016) + 0.0013 (± 0.0001) · x
The correlation coefficients of the weighted (1/x2) calibration curves were ≥ 0.998.
The inter-day precision and accuracy of the back-calculated calibration standards of
roxithromycin in human plasma ranged from 0.8 to 6.1 % and from 94.8 to 103.6 %,
respectively. Using 100 µL of plasma, the LLOQ was 9.21 ng/mL, which is
characterized by an inter-day precision and accuracy of 2.6 and 101.0 %,
respectively.
For the evaluation of the intra-day and the inter-day precision and accuracy of the
assay, five replicates of each SQC concentration were prepared and analyzed on
each of four validation days. The concentrations of the SQC samples were
calculated by both calibration curves for the inter-day evaluation and by the first
calibration curve for the intra-day evaluation, see Table 20.
Table 20 Intra- and inter-day precision and accuracy of roxithromycin in human
plasma (four days, five replicates per day)
Nominal concentrations
[ng/mL]
Intra-day Precision
[[[[%]]]]
Intra-day Accuracy
[[[[%]]]]
Inter-day Precision
[[[[%]]]]
Inter-day Accuracy
[[[[%]]]]
2840 2.0 102.2 4.3 98.4
940 3.1 104.5 2.8 103.2
86.6 2.2 103.3 2.8 102.0
20.7 4.2 97.9 6.1 102.8
The intra-day precision and accuracy of roxithromycin in human plasma ranged from
2.0 to 4.2 % and from 97.9 to 104.5 %, respectively. The inter-day precision of the
SQC samples ranged from 2.8 to 6.1 % with an accuracy from 98.4 to 103.2 %. The
obtained results were within the acceptance criteria of not more than 15 %.
The mean absolute extraction recovery of roxithromycin in five replicates at each of
four concentration levels between 19.2 and 2750 ng/mL was determined to be 98.2 ±
2.3 % (mean ± SD). The mean absolute extraction recovery of the IS (clarithromycin)
at the working concentration of 2000 ng/mL was determined as 104.0 ± 1.8 % (mean
± SD). The precision throughout the entire concentration range was better than
2.4 %, showing good consistency and reproducibility. Therefore, the simple one-step
protein precipitation procedure introduced to extract analytes from plasma showed
satisfactory recovery for roxithromycin in plasma.
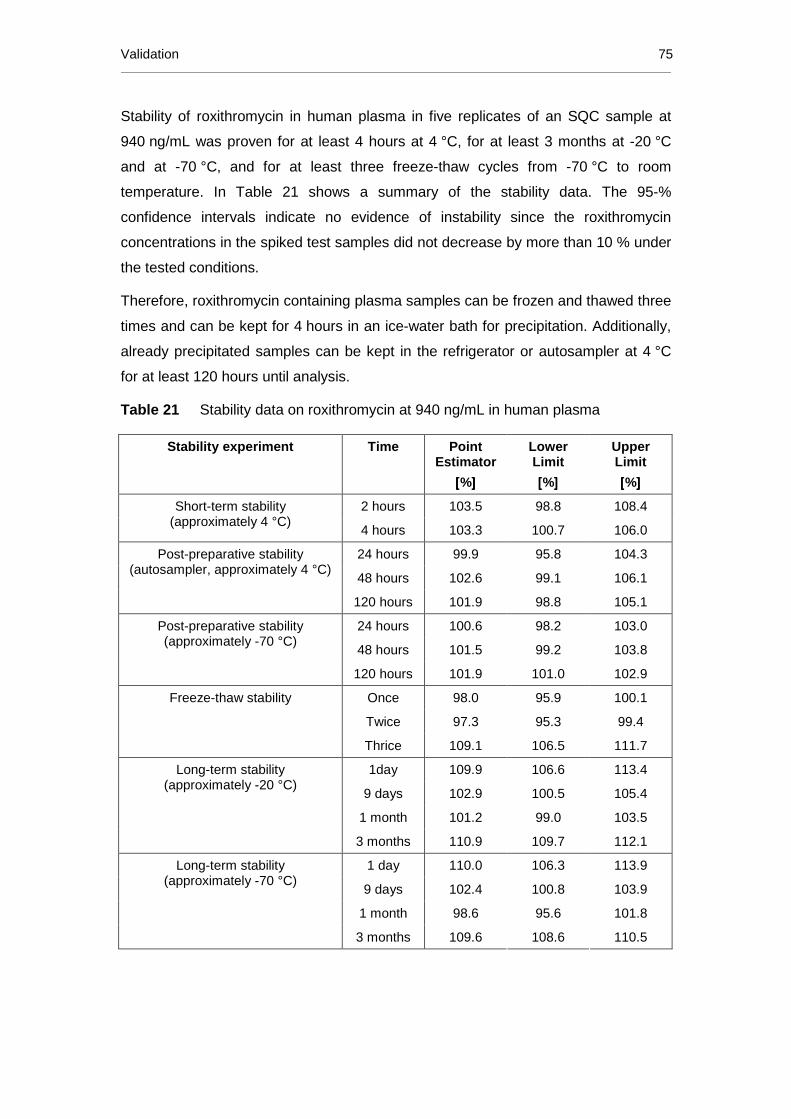
Validation 75
Stability of roxithromycin in human plasma in five replicates of an SQC sample at
940 ng/mL was proven for at least 4 hours at 4 °C, for at least 3 months at -20 °C
and at -70 °C, and for at least three freeze-thaw cycles from -70 °C to room
temperature. In Table 21 shows a summary of the stability data. The 95-%
confidence intervals indicate no evidence of instability since the roxithromycin
concentrations in the spiked test samples did not decrease by more than 10 % under
the tested conditions.
Therefore, roxithromycin containing plasma samples can be frozen and thawed three
times and can be kept for 4 hours in an ice-water bath for precipitation. Additionally,
already precipitated samples can be kept in the refrigerator or autosampler at 4 °C
for at least 120 hours until analysis.
Table 21 Stability data on roxithromycin at 940 ng/mL in human plasma
Stability experiment Time Point Estimator
[[[[%]]]]
Lower Limit
[[[[%]]]]
Upper Limit
[[[[%]]]]
2 hours 103.5 98.8 108.4 Short-term stability (approximately 4 °C)
4 hours 103.3 100.7 106.0
24 hours 99.9 95.8 104.3
48 hours 102.6 99.1 106.1
Post-preparative stability (autosampler, approximately 4 °C)
120 hours 101.9 98.8 105.1
24 hours 100.6 98.2 103.0
48 hours 101.5 99.2 103.8
Post-preparative stability (approximately -70 °C)
120 hours 101.9 101.0 102.9
Once 98.0 95.9 100.1
Twice 97.3 95.3 99.4
Freeze-thaw stability
Thrice 109.1 106.5 111.7
1day 109.9 106.6 113.4
9 days 102.9 100.5 105.4
1 month 101.2 99.0 103.5
Long-term stability (approximately -20 °C)
3 months 110.9 109.7 112.1
1 day 110.0 106.3 113.9
9 days 102.4 100.8 103.9
1 month 98.6 95.6 101.8
Long-term stability (approximately -70 °C)
3 months 109.6 108.6 110.5

76 Roxithromycin
No influence of haemolysed plasma on the accuracy and precision of the method
was observed. The mean concentration value for haemolysed plasma was within
±15 % of the nominal value (940 ng/mL) with precision and accuracy of 3.4 % and
96.9 %, respectively.
Plasma samples containing up to 9630 ng/mL roxithromycin can be pre-diluted by a
factor of 4 with drug-free human plasma. The mean concentration values were within
the recommended ±15 % of the nominal value. Mean precision and accuracy of 5
replicates on each of four validation days were 4.3 % and 98.4 %, respectively and
were therefore, well within the recommended ±15-% range. As a result, study
samples exceeding the calibration range during the first measurement can be re-
analyzed by diluting the respective sample with drug-free plasma before
precipitation.
As a result, it can be concluded that the validation data meets the criteria according
to the FDA guideline on BMV [33].
3.2.5 Method comparison on three different LC-MS/MS systems
As for erythromycin, absolute comparability of the roxithromycin experiments was
assured by optimization of the tuning parameters on each MS and by using of the
same mobile phase, column and sample preparation technique.
Due to better sensitivity of mass analyzers with a larger orifice and alternations in the
ion path directly behind the orifice, possible interferences in the extended lower
range may affect the selectivity of the method. On none of the three tested mass
analyzers interferences between matrix components of drug-free human plasma and
roxithromycin or the IS occurred in the observed concentration ranges. Even with the
most sensitive instrument samples were free from interferences down to
0.395 ng/mL.
For comparison of the linearity range and the maximal sensitivity (LLOQ) on the
different mass analyzers, calibration standards and SQC samples were prepared in
human plasma and analyzed for roxithromycin in three validation runs.
On API III Plus the quantifiable concentrations ranged from 9.21 to 3950 ng/mL,
equivalent to two orders of magnitude, whereas on API 3000™ it ranged from 3.16 to
4000 ng/mL, equivalent to three orders of magnitude.

Method comparison on three different LC-MS/MS systems 77
However, in contrast to the erythromycin method, it was not possible to increase the
linear range further on API 5000™: quantifiable roxithromycin concentrations
reached down to 0.395 ng/mL, but only up to 1646 ng/mL, covering only three orders
of magnitude. This can be ascribed to the large orifice, which enables more
molecular ions to enter the mass spectrometer and saturate the detector at higher
concentrations.
The linear regression of the peak area ratios versus concentrations were fitted over
the mentioned concentration ranges, which were (mean±SD):
API III Plus: y = 0.0018 (± 0.0016) + 0.0013 (± 0.0001) · x (r² ≥ 0.998)
API 3000™: y = -0.0022 (± 0.0015) + 0.0068 (± 0.0013) · x (r² ≥ 0.999)
API 5000™: y = 0.00001 (± 0.00003) + 0.0016 (± 0.0001) · x (r² ≥ 0.999)
Using 100 µL of plasma, the LLOQ for roxithromycin on API 3000™ (3.16 ng/mL)
versus API III Plus (9.21 ng/mL) was lower by a factor of 3, which is a rather small
step compared to ERY A (factor 5) and EES (factor 8). On the other hand, the gain in
sensitivity from API 3000™ to API 5000™ (0.395 ng/mL) was a factor of 8, as also
for EES and ERY A. The inter-day precision (1.0 to 2.6 %) and accuracy (98.6 to
101.0 %) obtained at the LLOQs for roxithromycin was very high on all three
instruments.
The signal-to-noise ratios at the LLOQ (9.21 ng/mL) on API III Plus were greater
than ten on all validation days. On API 3000™, the maximal sensitivity was tested
with high precision of the LLOQ and the corresponding SQCs, what led to an LLOQ
of 3.16 ng/mL. The signal-to-noise ratio at this concentration was 2, which “is
generally considered acceptable” by the International Conference on Harmonization
2005 [32]. However, with a concentration of 12.6 ng/mL a signal-to-noise ratio of five
was obtained, which is recommended by the FDA [132]. On API 5000™ the signal-
to-noise ratios at the LLOQ (0.395 ng/mL) were greater than ten on all validation
days, resulting from a very low noise. In contrast to API 3000™, the limiting point for
the sensitivity on API 5000™ was linearity.
The inter-day precision and accuracy of the SQC samples over 3 validation runs
measured on all three instruments ranged from 2.3 to 10.9 % and from 97.0 to
107.2 %, which is very well within the recommended acceptance criteria of <15 % for
precision and 85 to 115 % for accuracy. Therefore, all three mass spectrometers
showed similar precision and accuracy, even using the largest calibration range and
the lowest LLOQ.

78 Roxithromycin
As mass analyzers with horizontal or vertical spraying ionisation sources were
compared, the matrix effect was investigated by quantitative determination of the
matrix factor (MF) and with post column infusion. The matrix factor (MF) calculated
from roxithromycin areas was 1.00 ± 0.02 (mean ± SD) and the matrix factor
calculated from roxithromycin to clarithromycin area ratios (ROX/IS) was 0.96 ± 0.01
(mean ± SD) indicating the absence of a matrix effect in the API 3000™. The same
findings apply to the API 5000™ system, MF from roxithromycin areas being 1.00 ±
0.03 (mean ± SD) and MF from area ratios (ROX/IS) being 1.02 ± 0.01 (mean ± SD).
Via post column infusion no increase or decrease of the signal was observed at and
near the retention times of roxithromycin and clarithromycin, respectively and
therefore a matrix effect was excluded for both instruments.
Data from system-dependent validation experiments on API 3000™ and API 5000™
are summarised in Table 22 by comparison to previously obtained data on
API III Plus.
Table 22 Validation data of roxithromycin from three LC-MS/MS systems
Experiment Unit API III Plus ™ API 3000™ API 5000™
Specificity in plasma [-] no interference in 10 individuals
no interference in 20 individuals
no interference in 20 individuals
Linearity range
Orders of magnitude
[ng/mL] 9.21 – 3950
4.3·102
3.16 – 4000
1.3·103
0.395 – 1614
4.1·103
Correlation Coefficient [-] ≥ 0.998 ≥ 0.999 ≥ 0.999
LLOQ
Gain to previous API [ng/mL] 9.21
-
3.16
3 0.395
8
Precision of LLOQ
Accuracy of LLOQ
[%]
[%]
2.6
101.0
1.0
99.7
2.6
98.6
Highest SQC
Lowest SQC [ng/mL]
[ng/mL]
2840
20.7
4000
3.16 1614
0.395
Precision of SQCs
Accuracy of SQCs
[%]
[%]
2.8 to 6.1
97.0 to 103.2
2.3 to 10.9
97.0 to 98.7
2.8 to 8.1
98.3 to 107.2
Matrix Effect
ROX
ROX/IS
MF, Prec [%]
MF, Prec [%]
-
-
1.00, 2,2%
0.96, 0.9%
1.00, 2.6%
1.02, 0.8%
SQC: spiked quality control sample, LLOQ: lower limit of quantification, ROX: Roxithromycin, IS: internal standard, Prec: Precision in plasma from 6 individuals

Comparison of the LC-MS/MS method with procedures reported in the literature 79
3.2.6 Comparison of the LC-MS/MS method with proced ures reported in the
literature
Table 23 shows LLOQ, run time (min) and quality control data for previously reported
analytical methods for the determination of roxithromycin in human plasma in
comparison to the present LC-MS/MS method.
Compared to the present assay for ROX, all previously reported methods showed
less sensitivity with LLOQ values at least five times higher [49-50, 114-116, 118-
121], except Hang et al. [51], who’s LLOQ is comparable to the present one, but
needs double sample volume and a three times longer run time. The main reason for
this difference in sensitivity is presumably the detection technique, since most of
them use LC/ED, LC/FD and LC/UV [114-116, 118-121]. Even after the extraction of
1.0 mL of the plasma samples [118, 120], only LLOQs of 65 and 500 ng/mL were
achieved. As a result it can be said, that for the analysis of ROX in human plasma
the MS/MS detection is more useful. This can be ascribed to the chemical and
physical properties of ROX, since it has only few electrons suitable for UV,
fluorescence or electrochemical detection, but has a tertiary amine, which is good
ionisable for MS detection.
Independent from the sample preparation procedure, all methods show good and
reproducible recovery data. Only one method is reported [119], where SPE is
combined with a derivatisation reaction resulting in poor recovery for ROX, which is
even less than for the internal standard. Clarithromycin was used by nearly all
methods as internal standard, most likely due to its good acid stability. The
remaining two methods used erythromycin [51, 119].
Sastre Torano et al. [118] did not report precision and accuracy data at all, whereas
Taninaka et al. [116], Qin et al. [121] and Hang et al. [51] avoided precision and
accuracy data at the lower limit of quantification. Overall precision and accuracy was
better than ±15% for all methods. At the LLOQ Macek et al. [120] and Motta et al.
[49] show a ±20% limit for both parameters.
With the exception of four methods [114-115, 118, 121] all developed and validated
assays were implemented to a PK study.

80 Roxithromycin
Table 23 Comparison of current method with existent methods to quantify roxithromycin in human plasma, serum or blood; grouped by
analytical technique and descending years of publication
Method Linearity range
[[[[ng/mL ]]]]
Approx. run time
[[[[min ]]]]
Inter-day Prec / Acc at LLOQ
[[[[%]
Inter-day Prec / Acc of SQC samples
[[[[%]]]]
Recovery mean ± SD
[[[[%]]]]
Corr. coeff.
Sample Vol. [mL]
Sample preparation
Internal standard
Application
LC-MS/MS (current method)
9.21-3950 2.2 2.6 / 101.0 2.8 to 6.1 / 97.0 to 103.2 98.2*±2.3 (ROX) 104.0±1.8 (IS)
≥0.998 0.100 PPT Clarithromycin 300 mg PK
API 3000™ (current method) 3.16-4000 2.2 1.0 / 99.7 2.3 to 10.9 / 97.0 to 98.7 ≥0.999 0.100 PPT Clarithromycin -
API 5000™ (current method) 0.395-1614 2.2 2.6 / 98.6 2.8 to 8.1 / 98.3 to 107.2 ≥0.999 0.100 PPT Clarithromycin -
LC-MS/MS [50] Kousoulos 2008
50-20000 1.6 6.3 / 113.0 2.7 to 6.3 / 99.3 to 113.0 84.6-86.9 (ROX)
74.1 (IS) >0.991 0.100 automated LLE Clarithromycin 300 mg PK
LC-MS/MS [51] Hang 2007
10-20000 7.5 n.r. 8.7 to 14.8 / 92.0 to 96.9 98.2 - 104.7 n.r. 0.200 PPT Erythromycin 150 mg PK
LC-MS/MS [49] Motta 1999
50-5000 5.5 <20.0 / <120.0 6.6 to 9.8 / 99.8 to 114.3 n.r ≥0.997 0.040 LLE Clarithromycin 300 mg PK
LC/FD [119] Główka 2007
500-10000 20.0 9.1 / 112.0 n.r. 38.9, 43.1*²(ROX)
83.8±2.8 (IS) 0.997 0.550 SPE+DER Erythromycin 150 mg PK
LC/FD [118] Sastre Torano 1998
65-19500 25.0 n.r. / n.r. n.r. / n.r. 97-102 0.9998 1.0 LLE Clarithromycin n.r.
LC/UV [121] Qin 2001
250-32000 (LOD: 60)
> 5.0 n.r. / n.r. < 3.0 / n.r. 97.4 n.r. 0.500 LLE Clarithromycin n.r.
LC/UV [120] Macek 1999
500-29600 15.0 16.1 / 85.4 4.1 to 7.7 / 91.6 to 100.5 90±3 >0.9990 1.0 LLE Clarithromycin 300 mg PK
LC/ED [116] Taninaka 2000
100-10000 20.0 n.r. 1.7 to 6.2 / 100.6 to102.9 112 >0.999 0.150 LLE Clarithromycin PK in rats
LC/ED [115] Kees 1998
100-5000 15.0 3.1 / 106.6 (50 ng/mL) 0.7 to 10.3 / 100.6 to 108.6 80-90 >0.9991 0.500 LLE Clarithromycin n.r.
LC/ED [114] Hedenmo 1995
418.5-20925 9.0 5.7 / n.r. 4.0 (2678 ng/mL) 89.4±5.5 (ROX)
99.0±5.3 (IS) n.r. 0.100 SPE Clarithromycin n.r.
Prec: Precision, Acc: Accuracy, n.r.: not reported, PPT: protein precipitation, LLE: liquid-liquid extraction, SPE: solid phase extraction, DER.: Derivatisation, *: over the whole concentration range, *²: at 1500 and 10000 ng/mL, LLOQ: lower limit of quantification, PK: pharmacokinetics, LOD: limit of detection, S/N: signal-to-noise, ROX: roxithromycin, IS: internal standard, SD: standard deviation

Application of the roxithromycin assay to a pharmacokinetic study 81
3.2.7 Application of the roxithromycin assay to a p harmacokinetic study
3.2.7.1 Study design and sample handling
In the present study the pharmacokinetic profile of 300 mg roxithromycin was
investigated. Therefore, 36 healthy male and female volunteers received a single
film-coated tablet in the fasting state. A “pre-dose” sample was drawn from each
subject prior to administration and additional samples were collected at 0.25, 0.5,
0.75, 1.0, 1.5, 2.0, 2.5, 3.0, 3.5, 4.0, 5.0, 6.0, 8.0, 10.0, 12.0, 16.0, 24.0, 36.0, 48.0,
72.0, 96.0 and 120.0 hours after administration.
The blood samples containing ammonium heparinate as anticoagulant were cooled
in an ice-water bath until centrifugation for 10 minutes, which was performed at
1500 g and approximately 4 °C. Two aliquots of each sample were transferred into
different polypropylene tubes and immediately frozen at approximately -70 °C until
analysis.
3.2.7.2 Determination plasma concentrations
More than 1700 human plasma samples were analyzed for roxithromycin in a total of
fifteen sequences together with injection standards, calibration standards, and SQC
samples (in randomized order among subject samples). Each sequence was
measured within seven hours. The determined concentrations of SQC samples were
compared to theoretical concentrations to assess accuracy.
The inter-day precision and accuracy of the SQC samples of roxithromycin in human
plasma analyzed with the sequences of study samples ranged from 2.9 to 5.5 % and
from 97.6 to 101.8 %, respectively. The coefficient of correlation of resulting linear
regressions was at least 0.999. The precision and accuracy data prove the high
quality of the roxithromycin concentrations in the study samples.
For additional quality control of the assay, biological quality control (BQC) samples
with three concentrations were generated by pooling subject samples of a previous
study. After pooling samples with high, medium and low concentrations, the human
plasma was vigorously mixed and aliquots of 150 µL were frozen at approximately
-70 °C. For each sequence three BQC samples (one of each concentration) were
thawed, prepared and measured together with the study samples. The precision and
mean concentration of roxithromycin in the BQC samples was 4.0 % (5230 ng/mL),
4.8 % (1460 ng/mL), and 2.8 % (261 ng/mL). The excellent results obtained with

82 Roxithromycin
these real study samples in addition to spiked quality control (SQC) samples
demonstrated the accuracy and reproducibility of the LC-MS/MS method. However,
the main difference between the analyzed BQC samples and incurred sample re-
analysis (ISR) recommended by the regulatory authorities (see chapter 2.5.12, page
36) is that the BQC samples were pooled samples. By pooling different samples,
probable anomalous effects in those samples are diluted, minimizing the possibility
to find deviating results. Therefore, it is recommended to re-analyze ISR samples “as
is” for comparison of the first result with the second one. Additionally, fifteen
replicates of three pools of BQC samples were analyzed, while during incurred
sample re-analysis a higher number of real study samples can be re-analyzed at
once, resulting in a much larger data set.
Representative MRM-chromatograms for roxithromycin (top) and the IS (bottom) in
human plasma are depicted in Figure 17, showing: (A) Blank plasma, (B) the LLOQ
containing 9.21 ng/mL ROX, (C) a study sample (t = 120 h) containing 47.6 ng/mL
ROX, and (D) a study sample (t = 0.25 h) containing 2180 ng/mL ROX.
Figure 17 MRM-chromatograms of roxithromycin and the IS clarithromycin
A B C D

Application of the roxithromycin assay to a pharmacokinetic study 83
3.2.7.3 Pharmacokinetic results
Figure 18 shows the mean plasma concentration profile of roxithromycin after oral
administration of a 300 mg roxithromycin tablet to 36 healthy volunteers. The mean
peak concentration (Cmax) of 9.50 µg/mL was attained at 2.34 hours after
administration of the study drug.
Figure 18 Mean plasma profile of roxithromycin concentration vs. time following a
300 mg oral dose of roxithromycin to 36 healthy volunteers
0.001
0.01
0.1
1
10
100
0 12 24 36 48 60 72 84 96 108 120
Con
cent
ratio
n (µ
g/m
L)
Time after administration (h)
Table 24 summarizes the pharmacokinetic parameters of roxithromycin after oral
administration of 300 mg in comparison to pharmacokinetic parameters reported in
previously published studies [49-50, 109, 120, 133-134]. Since roxithromycin can be
characterized by a dose-dependent pharmacokinetics [109, 133-134], additional PK
data from the second common roxithromycin dosage, namely 150 mg [51, 117, 119,
134-135], are reported separately in the lower part of the table.

84 Roxithromycin
Table 24 Pharmacokinetic parameters (mean ± SD) of roxithromycin in healthy
subjects after overnight fasting and administration of a single oral dose as a tablet
Reference No. of subjects/ Gender
Dose / Formulation
t last
[[[[h]]]] AUC0→→→→last
[[[[µg·h/mL ]]]] AUC0→→→→∞∞∞∞
[[[[µg·h/mL ]]]]
Cmax
[[[[µg/mL ]]]] tmax
[[[[h]]]] t1/2
[[[[h]]]] Analytical
method
Current study
36/m,f 300 mg / film-coated tablet
120 159±65.0 160±66.1 9.50±3.41 2.34±1.74 17.0±3.34 LC-MS/MS
Kousoulos 2008 [50]
28/n.r. 300 mg / test 48 106±40.5 117±46.2 7.27±2.15 n.r. 13.3±5.1 LC-MS/MS
Kousoulos 2008 [50]
28/n.r. 300 mg / ref. n.r. 110±41.2 122±49.0 7.49±2.23 n.r. 13.0±2.8 LC-MS/MS
Huang [136] 2007
20/m (Chinese)
300 mg / test dispersive
tablet
n.r. 143.32 ±25.8
158.63 ±26.86
10.16 ±1.46
2.33±0.61 9.00±1.58 HPLC
Huang [136] 2007
20/m (Chinese)
300 mg / ref. n.r. 138.93 ±22.49
153.77 ±24.75
10.3±1.7 2.28±0.62 8.68±1.66 HPLC
Motta 1999 [49]
24/m,f 300 mg / test suspension
72 247* (216-281)
277* (241-317)
10.8* (9.57-12.2)
3.0*² (2.0-10.0)∆
18.5* (16.7-20.5)
LC-MS/MS
Motta 1999 [49]
24/m,f 300 mg / ref. tablet
n.r. 233* (199-274)
233* (199-274)
12.4* (10.9-14.1)
3.0*² (1.0-8.0)
16.7* (14.1-18.6)
LC-MS/MS
Macek 1999 [120]
26/m 300 mg / tablet
60 n.r. n.r. approx. 9.7
1.50 ca. 12.0 LC/UV
Nilsen 1992 [134]
12/m 300 mg / tablet
36 n.r. 215±82.5 11.0±2.19 2.25±1.62 16.2±7.76 LC/ED
Tremblay 1988 [133]
12/m,f 300 mg / tablet
72 132±17 n.r. 10.8±0.66 1.50±0.27 11.9±0.53 LC/ED
Puri 1987 [109]
21/m 300 mg film-coated tablet
48 114±23.8 117±28.6 9.1±1.7 1.9±1.3 10.5±5.2 n.r.
Puri 1987 [109]
40/m 300 mg 12 66.3±11.8 98.6±21.1 9.7±2.0 1.3±1.3 10.9±6.5 n.r.
Zheng [137] 2013
36/m (Chinese)
150 mg / test capsule
72 66.1 68.2 6.6 1.3±0.9 15.4±4.6 LC-MS/MS
Zheng [137] 2013
36/m (Chinese)
150 mg / ref. 72 70.3 72.4 7.0 1.4±0.7 16.1±5.6 LC-MS/MS
Hang 2007 [51]
12/m 150 mg / dispersible
tablet
72 86.7±27.0 88.4±28.2 7.51±2.11 2.3±1.0 12.5±2.1 LC-MS/MS
Glowka 2007 [119]
26/m,f 150 mg / film-coated tablet
48 51.2±14.4 53.8±17.4 6.0±1.9 1.20±1.10 6.00±3.00 LC/FD
Sun 2005 [135]
18/m 150 mg / enteric-
coated pellet
36 60.9±11.2 n.r. 5.07±0.95 2.83±0.99 n.r. Microbiol.
Sun 2005 [135]
18/m 150 mg / dispersible
tablet
36 42.7±16.3 n.r. 3.95±1.52 1.43±0.84 n.r. Microbiol.
Nilsen 1992 [134]
12/m 150 mg / tablet
36 n.r. 107±52.9 6.68±2.58 2.54±1.42 13.0±5.69 LC/ED
Birkett 1990 [117]
12/m 150 mg / film-coated tablets
48 n.r. 76.0±30.7 5.69±2.55 2.19±2.35 12.4±3.94 LC/ED
Tremblay 1988 [133]
12/m,f 150 mg / tablet
72 81±10 n.r. 7.90±0.66 1.93±0.51 10.5±1.4 LC/ED
m: male, f: female; n.r.: not reported, *: geometric mean (90% confidence interval); *²: median (range), ref.: reference formulation, test: test formulation

Summary: Roxithromycin 85
The determined value for AUC0→t 159 µg·h/mL is very close to the value for AUC0→∞
160 µg·h/mL, indicating that virtually no extrapolation was necessary, which was
achieved by the sensitive method and sample collection until 120 hours post-dose.
The determined AUC value is within the range of previously reported AUC∞ from
98.6 to 277 µg·h/mL. This large range of mean values can be explained by different
formulations of previous studies, which influence acid stability and thus, absorption
of roxithromycin. This assumption is also supported by the range of Cmax (7.27 to
12.4 µg/mL) and of tmax (1.3 to 3.0 hours), whereby the determined values for Cmax
(9.50 µg/mL) and tmax (2.3 hours) also reside within this range. The range for t1/2
(10.5 to 18.5 hours) indicates variability of roxithromycin elimination.
The nonlinear pharmacokinetics of roxithromycin can be seen by comparing the AUC
and Cmax of Nilsen et al. and Tremblay et al. [133-134]. They conducted studies
comparing a 150-mg and a 300-mg single dose of roxithromycin in tablets. The
resulting AUC and Cmax for the 300 mg dose are lower than would be expected for
linear kinetics. This can be explained by saturable plasma protein binding of
roxithromycin, of which 80-96 % are bound to α-1-acid glycoprotein. The maximum
total plasma concentration in the two studies increased from 6.7 and 7.9 µg/mL to
11.0 and 10.8 µg/mL, respectively. The higher concentrations can be related to an
increase of free roxithromycin by more than 13% [111]. This increase causes an
increase of the volume of distribution, since only free drug can cross the
membranes. In addition, the renal clearance increased as a function of the dose
studied by Tremblay et al. [133]. However, only 10 % of a roxithromycin dose are
excreted unchanged in the urine, while about 53 % are secreted into the bile [109]
and the remaining 37 % are metabolized. It seems that roxithromycin has a high
hepatic extraction ratio anyway, which may not be altered significantly by an
increase of the free plasma concentration. Apparently, the elimination half-lives from
the 150-mg dose and the 300-mg dose appear to increase by 1 hour [134] and
3 hours [133], respectively, and therefore, it could be concluded that the volume of
distribution increased by a larger factor than the elimination rate in both studies.
3.2.8 Summary: Roxithromycin
The developed and validated LC-MS/MS assay for roxithromycin in human plasma is
simple, fast, reliable, sensitive, precise and accurate on three generations of mass
spectrometers. The method employed acetonitrile protein precipitation, which
allowed quantification of roxithromycin in 100 µL human plasma for concentrations

86 Roxithromycin
ranging from 9.21 ng/mL to 3950 ng/mL, extending the upper quantification limit to
15800 ng/mL, by pre-diluting samples by a factor of four.
The principal advantage of the LC-MS/MS method described here is the
simultaneous achievement of high extraction recovery (98.2%), high sensitivity on all
three mass spectrometers (LLOQs = 9.21 ng/mL to 0.395 ng/mL), high inter-day
precision (≤2.6%) and high accuracy (98.6 to 101.0 %) for LLOQ as well as excellent
linearity (r2 ≥ 0.998) with a short run time of only 2.2 min.
These characteristics make the method suitable for the precise and accurate
measurement of low concentrations of roxithromycin in samples of pharmacokinetic
studies after single dose. The method was successfully applied to the analysis of
more than 1700 human plasma samples during a pharmacokinetic study of a single
300-mg dose of roxithromycin.
Due to the high sensitivity of the method, all samples had evaluable concentrations,
especially the smallest concentrations at 120 hours after administration. This fact
and the long sample collection interval led to a very precise determination of the area
under the curve, proven by the small difference between AUC0-t and AUC∞ and the
residual area of ≤0.6 %. The pharmacokinetic parameters were in very good
agreement with previously reported data for 300 mg roxithromycin. In addition, these
data were compared to data from 150-mg dose studies and related to chemical and
pharmaceutical properties of roxithromycin.
Roxithromycin in native human plasma is stable for at least three months at
approximately -20 °C and approximately -70 °C, for at least four hours at 4 °C and
during three freeze-thaw cycles. No instability was observed after the sample
preparation procedure over a time period of 120 hours at autosampler temperature
(approximately 4 °C) and at approximately -70 °C. The results of the 95% confidence
interval calculation suggested that there is no evidence of instability.
The structural analogue clarithromycin is adequate as internal standard for
roxithromycin, shown by the absence of a matrix effect of roxithromycin with and
without clarithromycin in the API series, and comparable recoveries.
Finally, it is possible to transfer the roxithromycin method directly to three different
LC-MS/MS systems and achieve a large sensitivity improvement by a factor of 23
accompanied by excellent accuracy and precision data, showing the good
robustness of the method.

Chemical and pharmaceutical properties 87
3.3 Clarithromycin
3.3.1 Chemical and pharmaceutical properties
Clarithromycin is composed of a 14-membered lactone ring containing ten
asymmetrically substituted carbon atoms, at two of them is attached to a sugar
group: cladinose to C(4) and desosamine to C(6), underlying IUPAC nomenclature.
Clarithromycin, C38H69NO13 (exact mass 747.5 amu) is a water-insoluble weak base
with a pKa of 8.76 [104] and a logP of 3.16 [68], see Scheme 9.
Scheme 9 Chemical structure of clarithromycin (CLA)
Formula Mol. weight Exact mass pK a logP
C38H69NO13 748.0 g/mol 747.5 amu 8.76 3.16
IUPAC Name: (3R,4S,5S,6R,7R,9R,11R,12R,13S,14R)-6-(((2S,3R,4S,6R)-4-(dimethylamino)-3-hydroxy-6-methyltetrahydro-2H-pyran-2-yl)oxy)-14-ethyl-12,13-dihydroxy-4-(((2R,4R,5S,6S)-5-hydroxy-4-methoxy-4,6-dimethyltetrahydro-2H-pyran-2-yl)oxy)-7-methoxy-3,5,7,9,11,13-hexamethyloxacyclotetradecane-2,10-dione
Clarithromycin is a broad-spectrum macrolide antibiotic used in the treatment of
respiratory tract and other infections [138]. It’s mechanism of action, blocking
bacterial protein synthesis, is already described for erythromycin in chapter 3.1.1.
Clarithromycin only differs from erythromycin A by methylation of the C(7)-hydroxyl
group, preventing intramolecular hemiketal formation with the C(10)-carbonyl group.
This modification improves its acid stability and thus the absorption by the oral route
[71]. Following oral administration of 250 mg clarithromycin, the absorption is nearly

88 Clarithromycin
complete [139], but first-pass metabolism causes an absolute bioavailability of about
55% [140], which is not altered significantly in the presence of food [141-142].
Clarithromycin is characterized by a nonlinear pharmacokinetic profile [143],
ascribing to its auto-inhibition through CYP3A4 [77, 144]. After administering of a
250-mg clarithromycin tablet to healthy adults, Cmax (0.72 to 1.2 µg/mL) is reached
after 1.6 to 2.6 hours (tmax), followed by a terminal elimination half-life (t1/2) between
1.9 and 4.9 hours and an AUC between 4.0 and 8.2 µg·h/mL [140, 145-150].
Scheme 10 Chemical structure of 14-hydroxy clarithromycin (CLA-MET)
O
O
OH
H3C
O
CH3
CH3
CH3
O
H3C
desosamine
H3C
OH
H3C
O
cladinose
OCH3
1
9
5HO 14
3
Traditional numbering IUPAC numbering
Formula Mol. weight Exact mass pK a logP
C38H69NO14 764.0 g/mol 763.5 amu - -
IUPAC Name: (3R,4S,5S,6R,7R,9R,11R,12R,13S,14R)-6-(((2S,3R,4S,6R)-4-(dimethylamino)-3-hydroxy-6-methyltetrahydro-2H-pyran-2-yl)oxy)-12,13-dihydroxy-4-(((2R,4R,5S,6S)-5-hydroxy-4-methoxy-4,6-dimethyltetrahydro-2H-pyran-2-yl)oxy)-14-((R)-1-hydroxyethyl)-7-methoxy-3,5,7,9,11,13-hexamethyloxacyclotetradecane-2,10-dione
Scheme 10 compares the traditional numbering, which gave the 14-hydroxy
metabolite it’s name and is still used by many text books [69], with the numbering
system by IUPAC [151], founded in 1919 as an international union of chemists to
achieve systematic and unambiguous names for all compounds.
Metabolism of clarithromycin occurs by CYP3A4, where oxidative N-demethylation
and 14-hydroxylation are the major routes. Clarithromycin is the only 14-membered
macrolide that exhibits the most active 14-hydroxy metabolite [142]. Clarithromycin
and 14-hydroxy clarithromycin are widely distributed into body tissues and fluids,
especially respiratory tract tissues, where concentrations reach levels, which are 3 to
30-fold higher than plasma concentrations [152-154].

Already published analytical methods 89
Like erythromycin, clarithromycin reversibly inhibits CYP3A4 [77], reducing
elimination and raising plasma levels of many other drugs. This interaction may be
beneficial (enhanced efficacy and cost-reduction of the immunosuppressant
cyclosporine) or cause mostly adverse drug response, like QT interval prolongation
(e. g. the antihistamine terfenadine) or excessive sedation (e. g. the benzodiazepine
midazolam) [77]. However, clarithromycin exhibits fewer serious drug interactions
than older macrolides [142].
3.3.2 Already published analytical methods
The majority of methods to quantify clarithromycin in serum or plasma include liquid
chromatography with electrochemical detection (LC/ED) [114-115, 147, 150, 155-
157]. Despite the lack of a large chromophore in clarithromycin, also liquid
chromatography methods with spectrophotometric detection (LC/UV) have been
used [145, 158]. Others reported derivatisation combined with liquid chromatography
and spectrofluorometric detection (LC/FD) [159]. Many of these approaches have
been applied to pharmacokinetic studies in man [145, 147, 150, 155-160] or animals
[52, 161]. Previously reported LC/ED, LC/UV and LC/FD methods present long run
times, and expensive or time-consuming sample preparation procedures using high
sample volumes.
Several LC-MS/MS methods have been reported to determine macrolide antibiotics
in a series of matrices like fish [96], eggs and milk [162], human muscle tissue [163],
animal tissues [164-165], feed supplement [166], and wastewater [167-169].
However, very few LC-MS/MS methods have been published for clarithromycin in
human plasma [53, 55, 170-173], reporting data from the application in a
pharmacokinetic study [53, 170, 173]. The methods presented either a somewhat
high LLOQ of 100 ng/mL [55, 170], had difficulties with inter-day precision [53] or did
not report inter-day precision data for their LLOQ [170-171, 173]. Furthermore, they
used rather cost-ineffective extraction methods [171-172] and did not report a
successful application of their method [55, 172].
Only two LC-MS/MS methods for quantification of clarithromycin as well as its active
14-hydroxy metabolite in human plasma have been reported [54-55]. However, one
of them was reported to have issues with carry-over and to have a high LLOQ of
100 ng/mL. Considering an expected Cmax of approximately 0.8 µg/mL (250 mg dose

90 Clarithromycin
of clarithromycin), this LLOQ would cover only three half-lives of the PK profile.
Moreover, no application in a pharmacokinetic study is reported for both methods.
Therefore, a highly sensitive, precise, accurate and fast LC-MS/MS quantitative
method in the MRM mode for clarithromycin and its 14-hydroxy metabolite in human
plasma was needed to be applied to a large pharmacokinetic study of 250 mg oral
clarithromycin and to compare different generations of mass spectrometers with
regard to sensitivity, selectivity and matrix effect.
3.3.3 LC-MS/MS method
The original LC-MS/MS method was provided by Professor Dr Fritz Sörgel, IMBP –
Institute for Biomedical and Pharmaceutical Research in Nürnberg-Heroldsberg and
is discussed in detail in the following chapter.
3.3.3.1 MS/MS spectra and tuning
The precursor ion spectra of clarithromycin and 14 hydroxy clarithromycin, recorded
by scanning Q1 from m/z 600 to m/z 1700, contain intensive signals at m/z 748.6
(CLA) and m/z 764.8 (CLA-MET) correspondent to the molecular ions [M+H]+ of
clarithromycin and 14 hydroxy clarithromycin. Scanning Q3 from m/z 100 to m/z 750,
the protonated molecules of CLA (m/z 748.6) and CLA-MET (m/z 764.8) are
fragmented by CAD resulting in the MS/MS product ion mass spectra depicted in
Figure 19 and Figure 20.
The MS/MS spectra show the same fragments as reported by others [130, 174],
namely the loss of a neutral species, i. e. the cladinose sugar (-158 amu) resulting in
m/z 590 (CLA), m/z 606 (CLA-MET) and m/z 679 (ROX, used as IS).
The mechanism of the further fragmentation of the desosamine substituent is
depicted in Scheme 6 on page 70.
The system parameters are optimized for the most intensive fragment signals, which
are m/z 158.2 for CLA and CLA-MET. The acquired spectra of the internal standards
roxithromycin (ROX) and deuterated clarithromycin (CLA-d3) contained the
protonated molecule [M+H]+ with m/z 838 (ROX) and m/z 751.5 (CLA-d3) as well as
the most abundant fragments with m/z 680 (ROX) and m/z 161.2 (CLA-d3). For
details of ROX fragmentation see Figure 16, on page 69.

LC-MS/MS method 91
Figure 19 Product ion scan of 14-hydroxy clarithromycin
606.6
158.2
116.2
764.8
[M+H]+
-cladinose
Figure 20 Product ion mass spectrum and fragmentation scheme of clarithromycin
[M+H]+
158.2
590.4
200 300 400 500 600 700 m/z
2.0e5
4.0e5
6.0e5
8.0e5
1.0e6
1.2e6
1.4e6
1.6e6
1.8e6
2.0e6
2.2e6
2.4e6
2.6e6
748.6
558.4
116.0
- cladinose-CH3OH
Based on the observations described above, the MS detection of clarithromycin and
its 14-hydroxy metabolite was performed in the positive ionization mode by using
APCI and the following MRM transitions: m/z 748.6 → m/z 158.2 (CLA),

92 Clarithromycin
m/z 764.8 → m/z 158.2 (CLA-MET) and m/z 837.5 → m/z 679.4 (ROX),
m/z 751.5 → m/z 161.2 (CLA-d3).
The optimization of temperature, gas settings and voltages was performed during
spectra acquisition to obtain the highest analytical sensitivity on each system. They
are summarized in Table 25.
Table 25 Optimized MS/MS parameters for clarithromycin (CLA) and 14-hydroxy
clarithromycin (CLA-MET)
API III Plus API 3000™ API 5000™
CLA / CLA-MET CLA / CLA-MET CLA / CLA-MET
Probe temperature 500 °C 500 °C 350 °C
Discharge needle current 3 µA 3 µA 5 µA
Orifice voltage (OR) / Declustering potential (DP)
60 V (OR) 31 V (OR) 80 V (DP)
Collision energy 25 eV / 30 eV 42 eV / 42 eV 40 eV / 41 eV
Nebulizer gas (APCI) 80 psi 80 psi 50 psi (GS1)
Auxiliary gas (APCI) - 2 L/min 50 psi (GS2)
Nebulizer, auxiliary and curtain gas
High purity nitrogen High purity nitrogen High purity nitrogen
Collision gas High purity argon High purity nitrogen High purity nitrogen
Collision gas thickness 260·1013 atoms/cm2 6 (2.7·10-5 torr) 5 (1.7·10-5 torr)
3.3.3.2 Chromatography and sample preparation
At the pH of approximately pH 4 of the mobile phase, clarithromycin (pKa 8.76), its
14-hydroxy metabolite as well as roxithromycin (pKa 9.2) will be fully protonated and
can be detected in the positive ion mode. The ammonium acetate (10 mM) in the
prepared sample solution and the mobile phase assists charge transition during
atmospheric pressure chemical ionisation. The desolvation process of the molecular
ions from the aqueous mobile phase (65 % v) is supported by a temperature of
500 °C in the APCI source. The retention time of the IS (1.7 min) is similar on a C8
column to that of clarithromycin (1.6 min) and its 14-hydroxy metabolite (0.8 min).
Typical chromatograms are shown in Figure 22.
The calibration range from 10.0 to 4000 ng/mL enables analysis of plasma
concentrations after administration of a single 250-mg clarithromycin tablet. Peak
plasma concentrations range from 0.72 to 1.2 µg/mL (CLA) and from 0.46 to

LC-MS/MS method 93
0.76 µg/mL (CLA-MET) [140, 145-150]. Thus, at least 5% of Cmax (36 ng/mL CLA
23 ng/mL CLA-MAT) can be detected.
Though clarithromycin is methylated at the (C7)-hydroxyl group, it may theoretically
undergo hemiketal formation between the (C13)-hydroxy function and the (C10)-
carbonyl group. Therefore, to prevent any degradation of CLA and CLA-MET, the
plasma samples were handled and precipitated in an ice-water bath.
Scheme 11 Acid-catalyzed degradation of clarithromycin
After thawing the human plasma samples (calibration standards and SQC samples)
in a cold water bath, the samples are mixed thoroughly and centrifuged for 5 minutes
at approximately 4 °C to separate eventually present solid components. An aliquot of
100 µL of the plasma samples (calibration standards or SQCs) is deproteinised by
adding 200 µL of acetonitrile containing the internal standard: For the API III Plus
roxithromycin at a concentration of 1 µg/mL was used, whereas on API 3000™ and
API 5000™ clarithromycin-d3 at a concentration of 0.1 µg/mL was used.
The precipitated sample, containing the IS, is mixed thoroughly to facilitate
deproteinisation. The precipitate is separated by centrifuging the samples for
10 minutes at 3600 rpm (3280 g) at approximately 4 °C. Raising the water content of
the sample gives more constant and sharper peaks. Therefore, an aliquot of 100 µL

94 Clarithromycin
of the supernatant is diluted with 100 µL of ammonium acetate buffer (10 mM, pH 4).
After mixing, 15 µL of each sample is injected onto the LC-MS/MS system. In Table
26 the optimized sample preparation procedure and LC-MS/MS conditions are
summarized.
Table 26 Summary of the clarithromycin and 14-hydroxy clarithromycin assay
Characteristic Details
Sample preparation 100 µL plasma + 200 µL CH3CN /IS
100 µL supernatant + 100 µL NH4CH3COO (10 mM, pH 4.0)
Internal standard Roxithromycin (ROX)
d3-Clarithromycin (CLA-d3)
Column Symmetry C8, 5 µm (50 x 4.6 mm I.D.)
Mobile phase 35 % CH3CN
65 % NH4CH3COO (10 mM, pH 4.0)
Flow rate 1.0 mL/min
Run time 3.0 min
Ionisation APCI
Polarity Positive ion mode
Mass transitions m/z 748.6 → m/z 158.2 (CLA)
m/z 764.8 → m/z 158.2 (CLA-MET)
m/z 838 → m/z 680 (ROX)
m/z 752 → m/z 161 (CLA-d3)
CH3CN /IS: acetonitrile containing the IS (ROX, 1 µg/mL) or (CLA-d3, 0.1 µg/mL)
3.3.4 Validation
The following experiments for full validation of clarithromycin and 14-hydroxy
clarithromycin were performed on an API III Plus mass spectrometer and by the use
of human plasma containing heparin as anticoagulant. The data were obtained from
a previous validation and the results are explained in this chapter for full
characterisation of the method and the analytes.
Being intended for a pharmacokinetic study, the present validation was conducted
according to the guidance for industry (bioanalytical method validation) [45] by the
FDA. The present LC-MS/MS method meets all criteria suggested by the guidance.
The specificity of the method was determined by analysis of drug-free plasma from
six individuals (3 males and 3 females). Matrix components did not interfere with

Validation 95
CLA, CLA-MET or the IS, over the whole concentration range, i.e. no co-eluting peak
was observed.
The linear regression of the peak area ratios versus concentrations were fitted over
the concentration range from 9.58 to 3970 ng/mL for CLA and from 9.55 to
3960 ng/mL CLA-MET in human plasma. The mean linear regression equation of the
calibration curves (N = 8) generated during the validation was determined:
y = 0.0017 (±0.0013) + 0.0015 (±0.0001) · x for clarithromycin,
y = 0.0002 (±0.0010) + 0.0006 (±0.0001) · x for 14-hydroxy clarithromycin
All correlation coefficients of the weighted (1/x2) calibration curves were > 0.998 for
CLA and > 0.997 for CLA-MET. The inter-day precision and accuracy of the back-
calculated calibration standards of CLA and CLA-MET in human plasma ranged from
3.2 to 4.9 % (CLA), 3.9 to 5.7 % (CLA-MET) and from 95.7 to 102.5 % (CLA), 98.2 to
102.1 % (CLA-MET), respectively. Using 100 µL plasma, the lower limit of
quantification was 9.58 ng/mL for CLA and 9.55 ng/mL for CLA-MET. The inter-day
precision and accuracy obtained at the LLOQ were 3.2 % (CLA), 5.0 % (CLA-MET)
and 100.7% (CLA), 99.9 % (CLA-MET), respectively.
Table 27 and Table 28 summarize the intra- and inter-day precision and accuracy for
CLA and CLA-MET, evaluated by assaying five replicates of each SQC
concentration on four validation days, each. The concentrations of the SQCs were
calculated by using both calibration curves for the inter-day precision and by using
the first calibration curve for the intra-day precision.
Table 27 Intra- and inter-day precision and accuracy of clarithromycin (CLA) in
human plasma (four days, five replicates per day)
Nominal
concentrations
[ng/mL]
Intra-day
Precision
[[[[%]]]]
Intra-day
Accuracy
[[[[%]]]]
Inter-day
Precision
[[[[%]]]]
Inter-day
Accuracy
[[[[%]]]]
2960 4.2 95.2 4.8 97.1
980 2.6 98.4 4.0 99.8
94.9 2.8 101.4 3.5 102.4
24.1 7.6 99.7 5.8 100.8

96 Clarithromycin
Table 28 Intra- and inter-day precision and accuracy of 14-hydroxy clarithromycin
(CLA-MET) in human plasma (four days, five replicates per day)
Nominal
Concentrations
[ng/mL]
Intra-day
Precision
[[[[%]]]]
Intra-day
Accuracy
[[[[%]]]]
Inter-day
Precision
[[[[%]]]]
Inter-day
Accuracy
[[[[%]]]]
2980 4.5 101.0 5.6 100.0
999 1.5 101.2 5.3 98.8
98.7 4.6 101.6 5.4 100.1
24.7 6.5 107.2 7.9 103.0
The inter-day precision of the SQC samples for CLA and CLA-MET in human plasma
ranged from 3.5 to 5.8 % (CLA), 5.3 to 7.9 % (CLA-MET) and from 97.1 to 102.4 %
(CLA), 98.8 to 103.0 % (CLA-MET), respectively. The obtained results fulfilled
excellently the acceptance criteria of not more than 15% deviation by the above cited
guidelines.
The mean absolute extraction recovery was determined to be 96.9 ± 3.6 % (CLA)
and 97.7 ± 2.2 % (CLA-MET). The mean absolute extraction recovery of the IS
(roxithromycin) at the working concentration was determined as 98.2 ± 2.0. All
recoveries had relative standard deviations better than 3.7 % throughout the entire
calibration ranges, showing good consistency and reproducibility of the simple
protein precipitation for CLA and CLA-MET in human plasma.
Plasma samples containing up to 9950 ng/mL CLA and up to 9980 ng/mL CLA-MET
can be pre-diluted by a factor 4 with drug-free human plasma. The mean
concentration values were within ±15 % of the nominal value with mean accuracies
of 96.8 % (CLA) and 99.2 % (CLA-MET) and mean precisions of 6.2 % (CLA) and
7.6 % (CLA-MET).
Stability data of CLA and CLA-MET in human plasma in five replicates of SQC
samples at concentrations of 998 ng/mL CLA and 999 ng/mL CLA-MET are compiled
in Table 29 and Table 30. The results of the 95% confidence interval calculation
suggest that there is no evidence of instability. Therefore, CLA and CLA-MET are
stable in human plasma for at least 4 hours at 4 °C, and for at least 9 weeks at
-20 °C and -70 °C. Furthermore, both analytes are stable in prepared human plasma
for at least 48 hours and during three freeze-thaw cycles, each longer than 12 hours.

Validation 97
Table 29 Stability data on clarithromycin (CLA, 998 ng/mL) in human plasma.
Stability experiment Time Point
Estimator [%]
Lower Limit [%]
Upper Limit [%]
Short-term stability 2 hours 102.95 99.77 106.22
(approximately 4 °C) 4 hours 104.21 99.77 108.84
Post-preparative stability 24 hours 99.44 94.77 104.34
(autosampler, approximately 4 °C) 48 hours 102.52 99.11 106.05
Post-preparative stability 24 hours 99.17 94.03 104.58
(approximately -70 °C) 48 hours 102.81 95.86 110.26
Freeze-thaw stability Once 103.88 97.33 110.86
(approximately -70 °C) Twice 103.06 97.98 108.42
Thrice 101.99 97.53 106.65
Long-term stability 2 weeks 100.84 97.44 104.36
(approximately -20 °C) 9 weeks 102.63 99.65 105.69
Long-term stability 2 weeks 100.50 99.03 101.99
(approximately -70 °C) 9 weeks 102.14 98.92 105.47
Table 30 Stability data on 14-hydroxy clarithromycin (CLA-MET, 999 ng/mL) in
plasma.
Stability experiment Time Point
Estimator [%]
Lower Limit [%]
Upper Limit [%]
Short-term stability 2 hours 102.97 98.77 107.35
(approximately 4 °C) 4 hours 101.92 97.23 106.83
Post-preparative stability 24 hours 97.96 89.73 106.94
(autosampler, approximately 4 °C) 48 hours 103.71 99.01 108.63
Post-preparative stability 24 hours 95.97 89.36 103.06
(approximately -70 °C) 48 hours 103.50 95.45 112.22
Freeze-thaw stability Once 103.53 95.97 111.70
(approximately -70 °C) Twice 104.67 99.19 110.45
Thrice 101.30 93.79 109.40
Freezer storage stability 2 weeks 102.39 98.30 106.65
(approximately -20 °C) 9 weeks 96.52 92.13 101.13
Freezer storage stability 2 weeks 103.94 101.78 106.15
(approximately -70 °C) 9 weeks 102.17 98.17 106.34
No influence of haemolysed plasma on the accuracy and precision of the method
was observed. The mean concentration values were within ±15 % of the nominal

98 Clarithromycin
value. Mean precision and accuracy in haemolysed plasma at 991 ng/mL CLA were
4.2 and 98.1 %, and at 997 ng/mL CLA-MET precision and accuracy were 5.1 and
102.1 %.
Determination of CLA and CLA-MET was also performed in human plasma
containing EDTA as anticoagulant. Therefore, drug-free human EDTA plasma from
six donors (3 males, 3 females) was analyzed to assess specificity. No interference
occurred with the analytes or the IS. Additionally, calibration standards and SQC
samples from 10.00 to 4000 ng/mL were prepared in EDTA plasma. The correlation
coefficient obtained using 1/x2 linear regression analysis of the calibration curve was
0.999 for clarithromycin and 0.998 for 14-hydroxy clarithromycin. The precision and
accuracy of the SQC samples (6 replicates at 4 concentration levels) ranged from
2.2 to 8.9 % and from 98.6 to 101.1 %.
3.3.5 Method comparison on three different LC-MS/MS systems
Validation experiments were chosen that show the influence of the different
ionisation sources or the alternated ion paths on the quantification of clarithromycin
and 14-hydroxy clarithromycin. These experiments were performed by using the
same chromatographic conditions and sample work-up procedure as from a previous
method on API III Plus (obtained by Professor Dr Fritz Sörgel) to assure absolute
comparability to the experiments on API 3000™ and API 5000™.
The selectivity may vary between different MS instruments when small interferences
become visible due to better sensitivity. No interference between matrix components
in drug-free plasma from twenty individuals and CLA, CLA-MET or the IS occurred
on all three tested mass analyzers in the monitored concentration ranges, even
down to 0.391 ng/mL.
The calibration range for CLA on API III Plus was linear from 9.58 to 3070 ng/mL,
equivalent to two orders of magnitude, whereas on API 3000™ and on API 5000™ it
ranged from 0.781 to 4000 ng/mL, equivalent to three orders of magnitude. The
linearity range for clarithromycin could not be extended further with the API 5000™,
because the calibration function was not linear below 0.781 ng/mL. Therefore, the
LLOQ had to be set to 0.781 ng/mL, despite good signal-to-noise ratios at this
concentration.
For CLA-MET it was possible to extend the linearity ranges with increasing sensitivity
from API III Plus, to API 3000™, to the largest range on API 5000™, covering 0.391

Method comparison on three different LC-MS/MS systems 99
up to 4000 ng/mL. The large orifice sets a relatively high number of molecular ions
into the MS, whereas the vertical spraying ion source permits most interfering un-
charged molecules to enter the mass spectrometer.
The inter-day precision and accuracy obtained at the LLOQs on all instruments and
for both analytes ranged from 2.1 to 7.0 % and from 99.0 to 102.9 %, respectively.
Compared to the accepted limits of 15 % and 85-115 %, these data are showing a
very high precision and accuracy.
The mean linear regression equations (peak area ratio versus concentration) of the
calibration curves were established:
API III Plus, CLA: y = 0.0017 (± 0.0013) + 0.0015 (± 0.0001) · x (r² ≥ 0.998)
API 3000™, CLA: y = 0.0263 (± 0.0026) + 0.0154 (± 0.0004) · x (r² ≥ 0.997)
API 5000™, CLA: y = 0.0017 (± 0.0004) + 0.0032 (± 0.0001) · x (r² ≥ 0.998)
API III Plus, CLA-MET: y = 0.0002 (± 0.0010) + 0.0006 (± 0.0001) · x (r² ≥ 0.997)
API 3000™, CLA-MET: y = -0.0028 (± 0.0011) + 0.0087 (± 0.0008) · x (r² ≥ 0.995)
API 5000™, CLA-MET: y = -0.0002 (± 0.0003) + 0.0198 (± 0.0006) · x (r² ≥ 0.998)
Good linearity and correlation coefficients were obtained on all systems.
The signal-to-noise (S/N) ratios at the LLOQ on API III Plus were greater than 10 on
all validation days. On API 3000™, the maximal sensitivity with high precision of the
LLOQ and the SQCs was tested, what led to an LLOQ of 0.781 ng/mL (CLA) and
1.56 ng/mL (CLA-MET), respectively. The S/N ratios at these concentrations were at
least 5 for both analytes which is also recommended by the FDA [132]. On
API 5000™ the S/N ratios at the LLOQ were greater than 10 on all validation days,
resulting from a very low noise. Comparing to the API 3000™, the limiting point for
the sensitivity on API 5000™ was the linearity in the lower calibration range.
Since mass analyzers with quite different ionisation sources using horizontal or
vertical spray are compared, the matrix effect may vary distinctively. The matrix
factors (MF, mean ± SD) on API 3000™ calculated from peak areas were almost
identical to those calculated from peak area ratios and were close to 1.0. This
indicates the absence of a matrix effect in the API 3000™ analytical system.
On the API 5000™, matrix factors (mean ± SD) from clarithromycin were 0.85 ± 0.02
(peak area) and 1.01 ± 0.01 (area ratio CLA/IS), whereas the matrix factors from 14-
hydroxy clarithromycin were 0.74 ± 0.03 (peak area) and 0.88 ± 0.04 (area ratio
CLA-MET/IS). The lower MF values calculated by peak areas indicate light ion

100 Clarithromycin
suppression of clarithromycin and its metabolite in the API 5000™ ionisation source.
However, the overall MF, calculated by the peak area ratios, shows that the IS
compensates for this effect. The MF does not need to be 1.0 (see EMA [34]), but has
to be constant for all analyzed matrices, which is the case here, proven by the small
standard deviations across six different plasma sources. This assures no difference
in response for calibration standards and different subject’s samples.
Via post column infusion no increase or decrease of the signal was observed at and
near the retention times of CLA, CLA-MET, see Figure 21.
Figure 21 Matrix-effect assessment via post-column infusion of clarithromycin
(top) and 14-hydroxy clarithromycin (bottom)
2.13e5 cpsXIC of +MRM (3 pairs): for 748.5 / 158.1 amu from CMPA001
0.11
0.48
0.981.19
1.34 1.65 1.771.92
2.04 2.31 2.42 2.81
0.2 0.4 0.6 0.8 1.0 1.2 1.4 1.6 1.8 2.0 2.2 2.4 2.6 2.8Time, min
5.0e4
1.0e5
1.5e5
2.0e5
2.5e5
3.0e5
3.5e5
Inte
nsit
y, cps
1.51e5 cpsXIC of +MRM (3 pairs): for 764.6 / 158.1 amu from CMPA001
0.21
0.48
0.76 1.001.18
1.34 1.511.63 1.92 2.20 2.42
2.64 2.79
0.2 0.4 0.6 0.8 1.0 1.2 1.4 1.6 1.8 2.0 2.2 2.4 2.6 2.8Time, min
5.0e4
1.0e5
1.5e5
2.0e5
2.5e5
3.0e5
Inte
nsit
y, cps
CLA
CLA-MET
Data from system-dependent validation experiments on API III Plus, API 3000™ and
API 5000™ by comparison are outlined in Table 31 and Table 32. Data from
API III Plus were obtained from previous experiments by IBMP – Institute for
Biomedical and Pharmaceutical Research.

Method comparison on three different LC-MS/MS systems 101
Table 31 Data of clarithromycin (CLA) from three LC-MS/MS systems
Experiment Unit API III Plus API 3000 ™ API 5000™
Specificity in plasma [-] no interference in
6 individuals no interference in
20 individuals no interference in
20 individuals
Linearity range
Orders of magnitude
[ng/mL]
9.58 – 3970
4.1·102
0.781 – 4000
5.1·103
0.781 – 4000
5.1·103
Correlation Coefficient [-] >0.998 >0.997 >0.998
LLOQ
Gain to previous API [ng/mL]
9.58
-
0.781
12 0.781
1
Precision of LLOQ
Accuracy of LLOQ
[%]
[%]
3.2
100.7
4.9
102.3
4.3
101.8
Highest SQC
Lowest SQC [ng/mL]
[ng/mL]
2960
24.1
4000
1.56
4000
1.56
Precision of SQCs
Accuracy of SQCs
[%]
[%]
3.5 to 5.8
97.1 to 102.4
2.9 to 14.9
101.2 to 103.0
2.2 to 12.0
96.0 to 101.4
Matrix Effect
CLA
CLA/IS
MF, Prec [%]
MF, Prec [%]
-
-
1.03, 1.8%
1.01, 1.6%
0.85, 2.9%
1.01, 1.0%
SQC: spiked quality control, LLOQ: lower limit of quantification, CLA: clarithromycin, IS:
internal standard, MF: matrix factor, Prec: Precision from plasma of 6 individuals
Table 32 14-hydroxy clarithromycin (CLA-MET) data of three LC-MS/MS systems
Experiment Unit API III Plus API 3000 ™ API 5000™
Specificity in plasma [-] no interference in
6 individuals no interference in
20 individuals no interference in
20 individuals
Linearity range
Orders of magnitude
[ng/mL]
9.55 – 3960
4.1·102
1.56 – 4000
2.6·103
0.391 – 4000
1.0·104
Correlation Coefficient [-] >0.997 >0.995 >0.998
LLOQ
Gain to previous API [ng/mL]
9.55
-
1.56
6 0.391
4
Precision of LLOQ
Accuracy of LLOQ
[%]
[%]
5.0
99.9
7.0
99.0
2.1
102.9
Highest SQC
Lowest SQC
[ng/mL]
[ng/mL]
2970
24.2
4000
3.13
4000
0.391
Precision of SQCs
Accuracy of SQCs
[%]
[%]
5.3 to 7.9
98.8 to 103.0
5.0 to 11.1
96.3 to 103.1
5.0 to 10.5
91.1 to 99.5
Matrix Effect
CLA-MET
CLA-MET/IS
MF, Prec [%]
MF, Prec [%]
-
-
0.99, 2.8%
0.97, 3.1%
0.74, 4.7%
0.88, 4.5%
SQC: spiked quality control, LLOQ: lower limit of quantification, CLA-MET: 14-hydroxy clarithromycin, IS: internal standard, MF: matrix factor, Prec: Precision from plasma of 6 individuals

102 Clarithromycin
3.3.6 Comparison of the LC-MS/MS method with proced ures reported in the
literature
In Table 33 the calibration range, run time, work-up procedure and quality control
data for several previously reported chromatographic methods for the determination
of clarithromycin and 14-hydroxy clarithromycin in human plasma is compared to the
present LC-MS/MS method.
All previously reported LC/ED [114-115, 147, 150, 155-157], LC/UV [145] and LC/FD
[159] methods need between 7 and 30 minutes analysis time, while previously
reported LC-MS/MS methods are able to analyze CLA and CLA-MET within 4.5
minutes, except one [54], needing 9 minutes per sample. The first reason for the
shorter analysis times with MS/MS detection is that, the analytes need not
necessarily be baseline separated from each other since simultaneous detection is
possible. Secondly, in contrast to other detection techniques, the high selectivity of
MS/MS detection produces no background signals in the first minutes of the
chromatograms, making shorter retention times within 1-2 minutes possible. Due to
the poorer selectivity in detection, LC/ED and LC/UV methods need more cost and
time-consuming sample preparation techniques. Some of them extract CLA from
0.5 mL or even 1.0 mL [145, 159] sample volume to reach LLOQs between 25 and
100 ng/mL. This new method uses 0.1 mL plasma for quantification of CLA and CLA-
MET down to 0.78 and 0.39 ng/mL, respectively, within 3.0 minutes.
Five previously reported LC-MS/MS methods reach LLOQ values between 2.5 and
10 ng/mL [52, 161, 171-173], of which only one is substantiated by inter-day
accuracy and precision data at the LLOQ [161]. These methods are characterised by
more cost-intense and time-consuming extraction methods like µSPE [161] or LLE
[52, 171-172], the latter using equal or thrice the sample volume.
The extraction recovery (97.1%) of Li et al. [172] compared to the recovery (80.5%)
of van Rooyen et al. [171] indicates that extraction with methyl tert-butyl ether
(MTBE) and reconstitution with 0.1% formic acid in water/methanol (1:1) is more
efficient than shaking with hexane/ethyl acetate (1:1) and reconstitution at neutral pH
(water/acetonitrile, 9:1). Both extractions were performed at pH 9.2 (and 9.5), which
is near the pKa of CLA 8.86. Obviously, the water-insolubility of CLA helps during
extraction, even if the protonation equilibrium is not shifted towards the neutrally
charged base.

Comparison of the LC-MS/MS method with procedures reported in the literature 103
The LC-MS/MS methods, reported by Shin et al. [170] and de Velde et al. [55] report
an easy to use precipitation method with a low sample volume, but are lacking
sensitivity with a ten times higher LLOQ, and omitted inter-day precision data of the
reported LLOQ [170]. Recently, Vu et al. [54] published a modification of the method
by de Velde et al. reducing the carry-over from samples with high concentrations into
samples which should not contain any analyte concentration. This had also a
positive effect on the sensitivity, which was increased by a factor of two. However, to
achieve this, a second gradient during the chromatographic separation of each
sample was introduced, increasing the run-time per sample from 3.6 minutes to 9.0
minutes.
Besides the current method, only six previously reported methods were used for
determination of both, clarithromycin and 14-hydroxy clarithromycin in plasma.
These include two LC/ED methods [147, 150], of which only sparse data is given.
Two further methods only estimated 14-hydroxy clarithromycin concentrations semi-
quantitatively: Oswald et al. [52] used LC-MS/MS to monitor the mass transition of
14-hydroxy clarithromycin in the study samples and estimated the metabolite
concentrations by comparing the peak areas to calibration standards of
clarithromycin. Lerner et al. [53] cited a time-consuming bioassay technique with
derivatisation, not reporting any quality data for 14-hydroxy clarithromycin. The last
two methods for determination of 14-hydroxy clarithromycin were developed and
modified by de Velde et al. [55] and Vu et al. [54], which were discussed a few lines
above and were not reported to be applied to a pharmacokinetic study.
To the best knowledge, this is the only LC-MS/MS method which quantifies both,
clarithromycin and its 14-hydroxy metabolite with high sensitivity, which is fully
validated and was furthermore applied to a large pharmacokinetic study.
With the present method, clarithromycin and 14-hydroxy clarithromycin can be
measured with high sensitivity using simple protein precipitation sample work up.
With only 3 min runtime it is possible to measure about 400 human plasma samples
per LC-MS/MS machine per day.

104 Clarithromycin
Table 33 Comparison of current method with other analytical methods for the determination of clarithromycin and 14-hydroxy clarithromycin
in human plasma or serum; grouped by analytical technique and descending years of publication
Method Matrix Linearity range
[[[[ng/mL ]]]]
Approx. run time
[[[[min ]]]]
Inter-day Prec / Acc at LLOQ
[[[[%]
Inter-day Prec / Acc of QC samples
[[[[%]]]]
Recovery mean ± SD
[[[[%]]]]
Sample Vol. [mL]
Sample preparation
Application
LC-MS/MS Human CLA 9.58-3970 3.0 3.2 / 100.7 3.5 to 6.2 / 96.8 to 102.4 96.9 ± 3.61 0.100 PPT 250-mg PK
(current method) plasma MET 9.55-3960 5.0 / 99.9 5.3 to 7.9 / 98.8 to 103.0 97.7 ± 2.21
API 3000™ Human CLA 0.781-4000 3.0 4.9 / 102.3 2.9 to 14.9 / 101.2 to 103.0 98.2 ± 2.0 (IS)2 0.100 PPT
(current method) plasma MET 1.56-4000 7.0 / 99.0 5.0 to 11.1 / 96.3 to 103.1
API 5000™ Human CLA 0.781-4000 3.0 4.3 / 101.8 2.2 to 12.0 / 96.0 to 101.4 0.100 PPT
(current method) plasma MET 0.390-4000 2.1 / 102.9 5.0 to 10.5 / 91.1 to 99.5
LC-MS/MS [54] Human CLA 50-10000 9.0 8.8 / n.r. 0.0 to 8.8 / 98.0 to 101.6* n.r. 0.010 PPT (30 min) n.r.
Vu 2013 plasma MET 50-10000 9.0 1.9 / n.r. 0.8 to 4.8 / 98.0 to 111.0* n.r. 0.010 PPT (30 min) n.r.
UPLC-MS/MS [161] Wang 2012
Rat plasma
CLA nano
10-4000 2.0 4.2 / 94.1 12.2 / 104.9
3.6 to 7.4 / 94.1 to 102.0 0.1 to 12.2 / 98.9 to 104.9
Referenced accuracy data as recovery
0.050 PPT + µSPE PK in rats
LC-MS/MS [52] Oswald 2011
Horse plasma
CLA/ MET
2.5-25 and 25-250
3.0 n.r. / n.r. n.r. / n.r.
6.2 to 10.0 / 100.1 to 106.2 5.1 to 8.9 / 99.9 to 108.6
77.4 to 82.8 78.0 to 81.0
0.200 LLE PK in foals
LC-MS/MS [55] Human CLA 100-10000 3.6 4.5 / 94.6 0.0 to 4.5 / 94.6 to 100.2 100.1 to 111.4 0.010 PPT n.r.
De Velde 2009 plasma MET 100-10000 3.6 6.7 / 90.5 0.0 to 6.7 / 90.5 to 105.0 101.3 to 116.8 0.010 PPT n.r.
LC-MS/MS [170] Shin 2008
Human plasma
CLA 100-5000 < 3 n.r. / n.r. 7.0 to 7.9 / 95.3 to 100.1 78.3 ± 1.4 4 , 90.5 ± 6.4 5 98.1 ± 5.4 (IS)2
0.025 PPT 500-mg PK
LC-MS/MS [173] Jiang 2007
Human plasma
CLA 10-5000 2.4 n.r. / n.r. 6.7 to 9.9 / 97.5 to 104.5 95.4 ± 3.9 to 97.0 ± 7.2 0.050 PPT 500-mg PK
LC-MS/MS [172] Li 2006
Human plasma
CLA 5-5000 3.0 n.r. / n.r. 0.8 to 5.0 / 87.4 to 108.7 97.1 to 102 0.100 LLE n.r.
LC-MS/MS [171] Van Rooyen 2002
Human plasma
CLA 2.95-20016 2.6 n.r. / n.r. 0.8 to 6.8 / 94.6 to 105.4 6 80.5-90.8 1 0.300 LLE 500-mg (no data)
Continued on the next page

Comparison of the LC-MS/MS method with procedures reported in the literature 105
Table 33 (continued) Comparison of current method with other analytical methods for the determination of clarithromycin and 14-hydroxy clarithromycin in human plasma or serum; grouped by analytical technique and descending years of publication
Method Matrix Linearity range
[[[[ng/mL ]]]]
Approx. run time
[[[[min ]]]]
Inter-day Prec / Acc at LLOQ
[[[[%]
Inter-day Prec / Acc of QC samples
[[[[%]]]]
Recovery mean ± SD
[[[[%]]]]
Sample Vol. [mL]
Sample preparation
Application
LC-MS/MS [53] Human CLA 50-10000 4.5 10.2 / 86.0 14.8 to 54.1 / 90.6 to 112.8 n.r. 0.200 LLE 500-mg PK
Lerner 2000 plasma MET n.r. n.r. n.r. n.r. n.r. n.r. DER + BIO
LC/FD [159] Bahrami 2007
Human serum
CLA 25-10000 >6.6 16.0 / 94.7 2.6 to 16.0 / 94.7 to 99.7 93±4 1.0 LLE and DER
500-mg PK
LC/UV [145] Amini 2005
Human plasma
CLA 31.3-2000 <11 7.3 / 109.5 2.8 to 7.3 / 96.5 to 109.5 92.3 ± 4.3 to 104 ± 8 1.0 LLE 250-mg PK
LC/ED [157] Zaater 2012
Human plasma
CLA 50-5000 15 3.9 / 102.0 3.0 to 3.9 / 99.0 to 100.1 95.7 ± 5.2 0.500 LLE 500-mg PK
LC/ED [150] Human CLA 55.7-3421 n.r. n.r. n.r. n.r. 0.500 LLE 250-mg PK
Koytchev 2004 plasma MET n.r. n.r. n.r. n.r.
LC/ED [155] Niopas 2001
Human plasma
CLA 100-2000 11.0 n.r. / n.r. 2.1 to 4.7 / 97.3 to 100.2 84.3 ± 4.5 3, 86.2 ± 3.4 (IS)2
0.500 LLE 500-mg PK
LC/ED [156] Choi 2001
Human plasma
CLA 100-4000 30 3.2 / 100.0 1.4 to 3.2 / 98.0 to 102.0 86.7 ± 4.1 0.100 DIL + CS 500-mg PK
LC/ED [115] Kees 1998
Human plasma
CLA 100-5000 15-20 4.1 / 115.7 (30ng/mL)
0.3 to 9.1 / 100.6 to 107.3 80-90 0.500 LLE n.r.
LC/ED [114] Hedenmo 1995
Human plasma
CLA 0.5-25µM 9.0 1.2 / n.r. 5.8 / n.r.(3.0 µM) 99.0 ± 5.3 0.100 automated SPE
n.r.
LC/ED [147] Human CLA 30- > 17.2 n.r. / n.r. <10 / n.r. 70-75 0.500 PPT, SPE 250 mg /
Kees 1995 plasma MET 50- 500 mg PK
Prec: Precision, Acc: Accuracy, SD: standard deviation, *: intra-day data for accuracy, 1: over the whole concentration range, 2: internal standard roxithromycin, 3: based on direct comparison of peak heights, 4: at 200 ng/mL clarithromycin, 5: at 4000 ng/mL clarithromycin, 6: during study sample analysis (n=6), n.r.: not reported, PPT: protein precipitation, LLE: liquid-liquid extraction, SPE: solid phase extraction, DER.: derivatisation, BIO: bioassay, DIL + CS: dilution followed by column-switching

106 Clarithromycin
3.3.7 Application to a pharmacokinetic study of ora l clarithromycin
3.3.7.1 Study design and sample handling
The pharmacokinetic profiles of clarithromycin and its active metabolite 14-hydroxy
clarithromycin were investigated by administering a single 250-mg film-coated tablet
of clarithromycin to 36 healthy male and female volunteers in the fasting state. Blood
was drawn immediately before administration and at 0.33, 0.67, 1.00, 1.33, 1.67,
2.00, 2.33, 2.67, 3.00, 3.50, 4.00, 5.00, 6.00, 8.00, 12.00, 16.00, 24.00, and 36.00
hours after oral administration of the study drug.
Shortly after collecting the human blood samples into monovettes containing
ammonium heparinate, the samples are centrifuged for 10 minutes at approximately
1500g in a cooled centrifuge. Each plasma sample is immediately transferred into at
least two storage tubes and frozen at -70 °C until analysis.
3.3.7.2 Determination of plasma concentrations
A total of 1839 human plasma samples were analyzed for clarithromycin and 14-
hydroxy clarithromycin in a total of thirteen sequences, which were measured within
eight hours respectively. Each sequence, consisted of injection standards, calibration
standards (low to high concentrations), subject samples and 3 SQC samples at each
of four concentration levels (in randomized order among subject samples).
Representative MRM-chromatograms of CLA, CLA-MET and the IS are depicted in
Figure 22: (A) a blank sample, (B) the LLOQ containing 9.81 ng/mL CLA and 9.69
ng/mL CLA-MET, (C) a high study sample 16 h after administration containing 33.0
ng/mL CLA and 63.2 ng/mL CLA-MET and (D) a low study sample 1.0 h after
administration containing1721 ng/mL CLA and 778.0 ng/mL CLA-MET.
Both, clarithromycin and 14-hydroxy clarithromycin give intense peaks with a high
signal-to-noise ratio, being separated from matrix components.

Application to a pharmacokinetic study of oral clarithromycin 107
Figure 22 Chromatograms of CLA (top), CLA-MET (middle) and ROX (IS, bottom)
CLA(BIO)-BQH-733P-2003
CLA(BIO)-BQH-733P-2003
CLA(BIO)-BQH-733P-2003
CLA(BIO)-BQH-733P-2003
CLA(BIO)-BQH-733P-2003
CLA(BIO)-BQH-733P-2003
CLA(BIO)-BQH-733P-2003
CLA(BIO)-BQH-733P-2003
CLA(BIO)-BQH-733P-2003
CLA(BIO)-BQH-733P-2003
CLA(BIO)-BQH-733P-2003
A B C D
CLA(BIO)-BQH-733P-2003
CLA(BIO)-BQH-733P-2003
CLA(BIO)-BQH-733P-2003
CLA(BIO)-BQH-733P-2003
CLA(BIO)-BQH-733P-2003
CLA(BIO)-BQH-733P-2003
CLA(BIO)-BQH-733P-2003
CLA(BIO)-BQH-733P-2003
CLA(BIO)-BQH-733P-2003
CLA(BIO)-BQH-733P-2003
CLA(BIO)-BQH-733P-2003
A B C D
In order to control the precision and accuracy of the assay during the measurement
of study samples calibration standards and SQC samples were analyzed together
with the study samples in each sequence. The determined concentrations of SQC
samples and the back-calculated concentrations of the calibration standards were
compared to the theoretical concentrations for accuracy. The accuracy and precision
for each concentration level is summarized in Table 34.
The coefficient of correlation of resulting linear regressions was at least 0.996 for
both analytes. The mean precision and accuracy of the SQC samples (N = 4 x 39) of
clarithromycin in human plasma analyzed within the batches of study samples
ranged from 6.4 % to 7.4 % and from 98.5 % to 101.8 % and for 14-hydroxy
clarithromycin (N = 4 x 39) 6.3 % to 8.4 % and from 97.7% to 101.5%, respectively,
demonstrating very high precision and accuracy of the assay as well as the
concentration data of the study samples.

108 Clarithromycin
Table 34 Accuracy and precision of calibration standards and spiked quality
control samples during analysis of CLA and CLA-MET in study samples
Theoretical Concentration
(µg/mL) Mean Accuracy*
(%) Mean Precision*
(%)
4.03 97.4 3.9 3.02 98.0 2.4 2.02 100.7 2.4 1.02 100.3 1.9
0.509 100.7 2.4 0.214 100.7 3.9 0.106 101.6 2.1 0.0527 100.4 4.1 0.0196 99.6 6.2 0.0147 102.4 6.8
Calibration standards
CLA
0.00981 98.7 5.4 3.00 98.5 6.6 1.01 99.9 6.4
0.0910 101.2 7.4
SQC samples
CLA
0.0258 101.8 7.2 3.98 98.9 4.7 2.98 101.4 3.2 1.99 103.4 3.2 1.01 101.9 2.6
0.503 98.8 4.1 0.212 94.9 5.5 0.105 101.7 3.4 0.0520 100.0 6.2 0.0193 98.6 7.2 0.0145 97.9 8.0
Calibration standards
CLA-MET
0.00969 102.2 4.9 2.94 101.3 6.3
0.990 101.5 6.9 0.0889 97.7 8.4
SQC samples
CLA-MET
0.0252 98.9 8.3 * Accepted limits by EMA and FDA: maximal 15 % for precision and 85-115 % for accuracy
3.3.7.3 Pharmacokinetic results
The measured concentration data of clarithromycin and 14-hydroxy clarithromycin is
plotted versus the time after oral administration of a 250-mg clarithromycin tablet to
36 healthy volunteers. Figure 23 displays the mean plasma concentration profile
after oral administration of the 250-mg clarithromycin tablet.

Application to a pharmacokinetic study of oral clarithromycin 109
Figure 23 Plasma profiles (mean±SD) of clarithromycin and 14-hydroxy
clarithromycin concentrations versus time after administration of a 250-mg oral
clarithromycin dose to 36 healthy volunteers
0.001
0.010
0.100
1.000
0 3 6 9 12 15 18 21 24 27 30 33 36
Con
cent
ratio
n (µ
g/m
L)
Time (h)
Clarithromycin
14-Hydroxy clarithromycin
LLOQ
n=5
n=20
n=12n=34
The mean peak concentrations (Cmax) of clarithromycin (0.83±0.33 µg/mL, mean±SD)
and 14-hydroxy clarithromycin (0.51±0.16 µg/mL, mean±SD) were attained at
1.6±1.0 hours and 2.4±1.1 hours (mean±SD) after administration, respectively.
Table 35 and Table 36 show the comparison of the pharmacokinetic parameters of
clarithromycin and its 14-hydroxy metabolite after oral administration of a 250-mg
tablet to pharmacokinetic parameters reported in previously published studies. Since
clarithromycin is characterised by dose-dependent pharmacokinetics [143-144], only
PK data from other 250-mg studies are collated.
The data for Cmax and tmax of clarithromycin and its 14-hydroxy metabolite are in very
good agreement with the data reported by others. The elimination half-life of CLA
and CLA-MET was found to be 4.33±2.57 hours (mean±SD) and 6.29±2.83 hours
(mean±SD), which is in good agreement to Goodman & Gilman [1] (3-7 hours for
CLA and 5-9 hours for CLA-MET) and within the range of reported data from 1.9±0.6
hours up to 4.88±2.97 hours for clarithromycin and from 3.9 hours up to 6.20±3.82
hours for its 14-hydroxy metabolite. Also the data for AUC0→∞ of 5.29±2.13 h·µg/mL
for CLA and 4.82±1.63 h·µg/mL for CLA-MET are comparable to the data reported
by others [140, 145-148].

110 Clarithromycin
Only one author [150] reported higher values for AUC0→∞ (8.2 and 7.4 h·µg/mL for
CLA and CLA-MET, respectively). Especially, by comparing their 14-hydroxy
clarithromycin AUC0→∞ (7.4 h·µg/mL) with their AUC0→last (5.9 h·µg/mL) it seems as if
they had to extrapolate about 25% of their AUC. This may indicate some issues with
study design or sensitivity of their bioanalytical method. Like other authors, they
collected PK samples until 24 hours post dose, covering most of the concentration-
time curve. However, collecting until 36 hours post dose, allows for a more precise
determination of the total AUC (2.5 % and 3.9 % were extrapolated for CLA and
CLA-MET in the present study). Having a closer look at the bioanalytical method,
which was used to quantify the samples of their study, it seems as if it was not
sensitive enough (LLOQ 55 ng/mL, present method: 10 ng/mL), which may be
concluded by the plasma profile of 14-hydroxy clarithromycin stopping at 14 hours
post dose. As a consequence, concentration data at 24 hours post dose are missing.
Table 35 Pharmacokinetic parameters (mean±SD) of clarithromycin in healthy
subjects after overnight fasting and administration of a single oral dose as a tablet
Reference No. of subjects / Gender
Dose / Formulation
t last
[[[[h]]]] AUC0→→→→t
[[[[h·µg/mL ]]]] AUC0→→→→∞∞∞∞
[[[[h·µg/mL ]]]]
Cmax
[[[[µg/mL ]]]] tmax
[[[[h]]]] t1/2
[[[[h]]]]
Current study
36 / m,f 250 mg / film-coated tablet
36 5.16±2.12 5.29±2.13 0.83±0.33 1.59±1.01 4.33±2.5 7
Lappin 2011 [175]
6 / m 250 mg tablet 24 n.r. 4.905 (36)*
0.958 (34)* 0.96 (85)* 3.4 (46)*
Traunmüller 2007 [149]
6 / n.r. 250 mg tablet 24 4.45±1.94 n.r. 1.09±0.35 2.6±0.5 1.9±0.6
Amini 2005 [145]
14 / n.r. 250 mg tablet 24 n.r. 6.34±1.62 1.07±0.20 1.64±0.49 4.31±0.87
Koytchev 2004 [150]
24 250 mg tablet / test
24 7.13±2.56 7.92±2.97 1.21±4.13 1.78 ± 2.70 4.35 ± 2.08
Koytchev 2004 [150]
24 250 mg tablet / reference
24 7.36±3.02 8.16±3.32 1.17±3.62 1.63 ± 1.29 4.88 ± 2.97
Kim 2001 24 / m (Korean)
250 mg tablet / test
12 n.r. 7.015 1.260 1.85 ± 0.43 n.r.
Kim 2001 24 / m (Korean)
250 mg tablet / reference
12 n.r. 6.807 1.238 1.79 ± 0.69 n.r.
Kees 1995 [147]
12 / m 250 mg / film-sealed tablets
12 5.21±1.31 5.80±1.31 0.94±0.33 2.07±1.03 3.33±0.4 6
Chu 1993 [146]
17 / m 250mg / film-coated tablets
24 n.r. 4.36±1.51 0.78±0.25 1.8±0.7 2.7 (1.8-6.5)
Guay 1993 [148]
22 / m 250 mg tablet 24 6.07±1.97 n.r. 1.10±0.33 1.70±0.60 n.r.
Chu 1992 [140]
19 / m 250 mg tablet / formul. 1
24 4.21±1.52 4.27±1.52 0.76±0.24 1.72±0.71 2.7 (1.8 -6.5)
Chu 1992 [140]
19 / m 250 mg tablet / formul. 2
24 3.96±1.55 4.03±1.56 0.72±0.25 1.92±0.97 2.6 (1.6 -9.5)
*: CV in parentheses

Summary: clarithromycin 111
Table 36 Pharmacokinetic parameters (mean ± SD) of 14-hydroxy clarithromycin
in healthy subjects after overnight fasting and administration of a single oral tablet
Reference No. of subjects / Gender
Dosis / Formulation
t last
[[[[h]]]] AUC0→→→→last
[[[[µg·h/mL ]]]] AUC0→→→→∞∞∞∞
[[[[µg·h/mL ]]]]
Cmax
[[[[µg/mL ]]]] tmax
[[[[h]]]] t1/2
[[[[h]]]]
Current study
36 / m,f 250mg / film-coated tablets
36 4.63±1.59 4.82±1.63 0.51±0.16 2.39±1.09 6.29±2.8 3
Koytchev 2004 [150]
24 250 mg tablet / test
24 5.98±1.35 7.39±1.48 0.76±0.23 2.59±2.83 6.20±3.8 2
Koytchev 2004 [150]
24 250 mg tablet / reference
24 5.86±1.55 7.38±1.62 0.75±0.21 2.33±1.03 5.90±2.8 8
Kees 1995 [147]
12 / m 250 mg / film-sealed tablets
12 3.24±1.03 4.59±1.42 0.46±0.17 2.22±0.81 6.17±2.9 7
Chu 1993 [146]
17 / m 250mg / film-coated tablets
24 n.r. 4.97±1.16 0.65±0.19 2.3±0.7 4.1 (2.7-10.1)
Guay 1993 [148]
22 / m 250 mg tablet (study 1)
24 4.28±1.16 n.r. 0.55±0.17 1.90±0.60 n.r.
Chu 1992 [140]
19 / m 250 mg tablet / formul. 1
24 4.91±1.12 4.91±1.12 0.65±0.19 2.17±0.77 4.2 (2.7-10.1)
Chu 1992 [140]
19 / m 250 mg tablet / formul. 2
24 4.58±1.16 4.63±1.17 0.64±0.20 2.32±1.17 3.9 (1.6-12.3)
3.3.8 Summary: clarithromycin
With the developed and validated method clarithromycin and its 14-hydroxy
metabolite can be quantified from 9.6 to 15,800 ng/mL using 100 µL of human
plasma. Roxithromycin was found to be the ideal candidate as internal standard by
showing a comparable extraction and chromatographic behaviour as clarithromycin
and its active metabolite.
High absolute recovery (96.9 % CLA, 97.7 % CLA-MET), high sensitivity on all three
mass spectrometers (down to 0.391 ng/mL on the API 5000™), high inter-day
precision (≤7.0 %) and high accuracy (within ±102.9 %) for LLOQ as well as
excellent linearity (r2 ³ 0.995) with a short run time of only 3.0 minutes make the
method suitable for high throughput sample measurement during clinical trials. The
method was successfully applied to the analysis of more than 1800 human plasma
samples from healthy volunteers dosed with a single 250-mg clarithromycin tablet.
The high precision of the assay contributed to the precise determination of Cmax
(0.83±0.33 µg/mL CLA, 0.51±0.16 µg/mL CLA-MET) and the high assay sensitivity
allowed the determination of concentrations until 36 hours post-dose. Therefore, only

112 Summary and conclusions: Macrolides
2.6 % (CLA) and 4.2 % (CLA-MET) of the total AUC had to be extrapolated. The
obtained PK parameters are in good agreement with data from comparable studies.
3.4 Summary and conclusions: Macrolides
3.4.1 LC-MS/MS Assays
Three assays for five macrolides were developed and validated for the determination
of plasma concentrations of erythromycin ethylsuccinate, erythromycin A,
roxithromycin, clarithromycin and 14-hydroxy clarithromycin. Probably, all macrolides
could have been analyzed simultaneously, since they are characterised by similar
chemical properties. For example, their logP values range from 2.1 (EES) to 3.2
(CLA), while their pKa values range from 7.1 (EES) to 9.2 (ROX). Especially for
residue analysis in food or water, where screening of a large number of antibiotics is
favoured [128, 169, 176-180], simultaneous detection by LC-MS/MS can save a lot
of time. However, compromises with respect to optimal extraction conditions or
optimal detection conditions have to be accepted, which may lead to issues with
sensitivity or accuracy and precision.
In the present work, high accuracy and precision, as well as the shortest possible
analysis time for each analyte was crucial for the intended application in
pharmacokinetic trials, bearing a later drug application for human beings in mind. In
the final validated methods the retention times of all macrolides were shorter than
2 minutes. Clarithromycin and roxithromycin retention times were almost identical
when analyzed by means of the ROX assay (0.9 minutes) or with the CLA/CLA-MET
assay (1.6 minutes). However, with the chromatographic conditions of the ROX
assay, 14-hydroxy clarithromycin could not be analyzed, since it would elute too
early. While ROX was separated on a C-18 column (17% carbon load, low silanol
activity), CLA and CLA-MET were separated on a C-8 column (12% carbon load, low
silanol activity), resulting in more symmetrical peaks. This can be ascribed to the
shorter C-8 chains with lower steric hindrance, allowing a more effective endcapping
process of remaining silanol groups and therefore, less peak tailing of the basic
macrolides. Erythromycin ethylsuccinate is the most “polar” of the analyzed
macrolides with two additional keto-functions within the ethylsuccinate moiety. It was
therefore, separated from erythromycin A by using a CN column, which profits from

LC-MS/MS Assays 113
the dipole-dipole interactions between the CN function and the 4 CO functions of
EES.
While most previously reported methods for the determination of CLA, ROX or ERY
use neutral (phosphate) buffers, here all validated assays use buffers for sample
preparation and mobile phase with a weakly acidic pH 4-5, supporting fast RP
chromatography and ionization in the MS. Previously reported stability data [104-
105] support this procedure, indicating stability of CLA above pH 3 and of ERY
above pH 5.
All analytes were ionized by APCI in the positive ionization mode, whereas ionization
on the desosamine nitrogen is most likely. Since all macrolides had intensive signals
in the MS, precipitation was the sample work-up procedure of choice and
concentrating the analytes by expensive techniques was not necessary.
Table 37 Validated concentration ranges (ng/mL), range of linearity and sensitivity
gain compared to prior API.
Analyte API III Plus API 3000™ API 5000™
ERY A 4.0 – 2000
102
-
0.781 – 2100 103
5
0.0977 – 2100 104
8
EES 10 – 5000
102
-
1.25 – 4002 103
8
0.156 – 4002 104
8
ROX 9.21 – 3950
102
-
3.16 – 4000 103
3
0.395 – 1614 103
8
CLA 9.58 – 3970
102
-
0.781 – 4000 103
12
0.781 – 4000 103
1
CLA-MET 9.55 – 3960
102
-
1.56 – 4000 103
6
0.391 – 4000 104
4
Moreover, the LC-MS/MS assays of the three macrolides and the 14-hydroxy
metabolite of clarithromycin were validated on three different mass analyzers. The
innovations in the ion source (horizontal vs. vertical ESI), the ionpath (replacement of
the skimmer by the QJet) and the larger orifice enabled a better sensitivity and a
larger linearity range within this mass analyzer series. All methods were extended by
larger calibration ranges. However, only the EES / ERY A assay allowed a larger
linearity range and a better LLOQ at the same time, when transferred from API III to
API 3000™ to API 5000™. When transferring the ROX method to the latter system,
an increase in sensitivity was possible, but the upper limit of quantification had to be

114 Summary and conclusions: Macrolides
dropped due to linearity. This can be ascribed to the detector being saturated at
higher concentrations or by matrix effects during ionization.
All three assays were tested for matrix effects: None was noted for the assays of
ROX and ERY A on both MS systems and for CLA and CLA-MET on API 3000, while
slight suppression of CLA (MF 0.85, API 5000), CLA-MET (MF 0.74, API 5000), and
EES (MF 0.84, both MS) were observed, whereas, the respective IS compensated
for these effects. However, it is remarkable that especially EES and CLA-MET are
the most polar molecules of the tested compounds. This can be explained by a
reduced efficiency of proton transfer during APCI from charged solvent ions in the
gaseous phase.
The LLOQ for ROX on API 3000™ (3.16 ng/mL) versus API III Plus (9.21 ng/mL)
was lower by a factor of 3, which is a rather small step compared to ERY A (factor 5)
and EES (factor 8). On the other hand, the gain in sensitivity from API 3000™ to API
5000™ (0.395 ng/mL) was a factor of 8, as also for EES and ERY A. The inter-day
precision (1.0 to 2.6 %) and accuracy (98.6 to 101.0 %) obtained at the LLOQs for
roxithromycin was very high on all three instruments.
The improved sensitivity did not affect quality or precision data on the MS analyzers.
Whereas with the API III Plus linearity ranges over 2 orders of magnitude were
common, on the API 5000™ linearity ranges of 4 orders of magnitude became
possible. This is especially advantageous when samples from clinical trials should be
analysed, that are designed to evaluate reliable data from a low-dosed or
bronchially-administered drug.
3.4.2 Pharmacokinetics and Pharmacodynamics
Each macrolide was studied in a clinical trial and the respective validated assay was
used to determine the plasma concentration-time profile. The highest concentrations
(Cmax 9.5±3.4 µg/mL) were achieved after application of 300 mg roxithromycin, which
was a lower dose than studied for ERY (500 mg) and comparable to that of CLA
(250 mg). The reason is the good bioavailability of ROX (60 %) compared to ERY
(25-50 %), deriving from improved acid stability. The bioavailability of CLA (52-55 %)
is limited, despite its good acid stability, because of a fast first-pass metabolism by
CYP3A4.
Additionally, CLA inhibits its own metabolism by CYP3A4, counteracting the first-
pass-effect and inhibiting its own metabolism. As a consequence, the elimination

Pharmacokinetics and Pharmacodynamics 115
half-life of CLA is dose-dependent and time-dependent, increasing from 2.27 hours
to 5.98 hours at doses from 100 mg to 1200 mg. [142]. The elimination half-life for
the 250-mg dose of CLA determined here (t1/2 4.33 ± 2.57 hours), fits well into this
range. The auto-inhibition was also reported for ERY and ROX, [77, 133]. However,
for ERY at therapeutical concentrations it is not reflected in a non-linear PK, but
plays an important role with regard to drug-drug interactions. The non-linear PK of
ROX is less ascribed to its auto-inhibition, but rather to its high and saturable PPB to
α1-acid glycoprotein, causing higher free ROX concentrations above 4 µg/mL and
therefore, higher renal elimination rates at times of higher plasma concentrations.
Additionally, under-proportional increase of AUC from 81±34 to 170±69 µg·h/mL is
observed with increasing ROX doses from 150 to 450 mg. The determined AUC of
160±66.1 µg·h/mL lies within this range.
Table 38 Summary of the macrolides’ chemical and pharmacokinetic properties
ERY A (from EES)
EES (prodrug)
ROX CLA CLA-MET (active)
pKa 8.8 7.1 9.2 8.4 - 8.99 -
logP 3.06 2.1 2.75 3.16 -
Acid stability low low good improved -
Bioavailability (%) 25-50 25-35 60 52-55 (first-pass-e.)
-
PPB (%) 54-74 - 73-97 41-72 -
Standard Doses, adults (mg)
- 588 tid – 1175 qid
150 bid, 300 qd
250 bid, 500 bid
-
Studied Dose (mg) 500 587.25 300 250 -
Formulation suspension film-coated tablet
film coated tablet
Cmax (µg/mL) 0.34±0.13 1.41±0.63 9.50±3.41 0.83±0.33 0.51±0.16
tmax (hours) 1.33±0.95 0.60±0.24 2.34±1.74 1.59±1.01 2 .39±1.09
AUC (µg·h/mL) 2.12±1.42 2.63±1.15 160±66.1 5.29±2.13 4.82±1.63
t1/2 (hours) 10.1±10.6 5.21±3.95 17.0±3.34 4.33±2.57 6.29±2.83
Non-linear PK negligible at therap. conc.
- saturable PPB >4µg/mL
autoinhibition CYP3A4
-
However, comparing PK data from different clinical trials of macrolides is hardly
possible, since the outcome of macrolide studies is strongly depending on the
composition and schedule of food intake. Additionally, due to the low bioavailability,

116 Summary and conclusions: Macrolides
many different formulations have been developed to improve acid stability, which
makes comparability of PK data virtually impossible.
The greatest variability of oral formulations is available for erythromycin. These are
film-coated or enteric-coated tablets, pellets, and powders for suspension, of course
containing different excipients. Additionally, erythromycin is modified by different
esters, like ethylsuccinate, stearate, estolate, and acistrate. Comparison of different
erythromycin ethylsuccinate suspensions creates the impression that even if the
shaking intensity during re-dispersing is standardised, marketed preparations differ
significantly [88]. However, the different shaking procedures used in clinical trials and
therefore, the rather large range of the resulting PK data most likely mimic the
diversity in real life patients.
Clarithromycin is the only macrolide, which is converted to the active 14-hydroxy
metabolite, which has almost half the activity as clarithromycin. However, it is even
more active against H. influenzae than clarithromycin. This is illustrated in Figure 24
(MIC90 from [181-182]), where the concentration-time curves of CLA and CLA-MET
exceed the MICs of most pathogens, i.e. T>MIC is a possible measure for its
activities. However, this is not the case for H. influenzae, indicating a lack of efficacy
against this pathogen. Indeed, clinical data are evidence for the activity of CLA and
CLA-MET against H. influenzae. Synergistic effects of CLA and CLA-MET could be
responsible for this observation, but simple addition of the CLA and CLA-MET
concentration-time profile is not sufficient as explanation (see Figure 24). Knowledge
on the site of infection, which means extracellular or intracellular localization of the
respective micro-organisms and macrolide concentrations at the respective target
location, is necessary for in-depth understanding and predicting of macrolide
pharmacodynamics.

Pharmacokinetics and Pharmacodynamics 117
Figure 24 Plasma concentration-time profile of a 250-mg oral dose of
clarithromycin to healthy subjects in comparison to different MIC90 values
0.010
0.100
1.000
0 3 6 9 12 15 18 21 24 27 30 33 36
Pla
sma
Con
cent
ratio
n (µ
g/m
L)
Time after administration (hours)
Clarithromycin
14-Hydroxy clarithromycin
H. influenzae (CLA)
H. influenzae (CLA-MET)
Streptococcus viridans (CLA)
S. pneumoniae (CLA)
Additive concentration ofCLA and CLA-MET
Therefore, the macrolides cannot be classified clearly to one of the three PK/PD
parameters AUC0-24/MIC, Cmax/MIC or T>MIC, i. e. to concentration-dependent or –
independent behaviour [108, 141]. Some authors tend to conclude that macrolides
can be classified to T>MIC [13, 183], whereas others distinguish between the
traditional erythromycin and the newer macrolides, and find, depending on the
susceptible organism, that macrolide efficacy is also influenced by AUC0-24/MIC [11,
141].

118 Flucloxacillin
4 BETA-LACTAMS
4.1 Flucloxacillin
4.1.1 Chemical and pharmaceutical properties
Flucloxacillin is a narrow-spectrum isoxazolyl penicillin antibiotic used in the
treatment of penicillin-resistant Staphylococcus aureus infections [1]. It is approved
in European countries for use against infections of the respiratory tract, skin and soft
tissues, as well as bone and bone marrow infections. Like other isoxazolyl penicillins,
flucloxacillin is not active against MRSA [9]. Flucloxacillin is pharmacologically similar
to oxacillin, cloxacillin and dicloxacillin [184], differing only by the halogen
substituents on the benzene ring.
Scheme 12 Chemical structure of flucloxacillin (FLU)
CH3
N
O
O
NH
(R) (R)
N
O(S)
SCH3
CH3
COOH
HH
Cl
F
6 5
21
Formula Mol. weight Exact mass pK a logP
C19H17ClFN3O5S 453.9 g/mol 453.1 amu 2.7 2.58
IUPAC Name: (2S,5R,6R)-6-(5-(2-chloro-6-fluorophenyl)-3-methyl-2H-pyrrole-4-carboxamido)-3,3-dimethyl-7-oxo-4-thia-1-azabicyclo[3.2.0]heptane-2-carboxylic acid
Due to the electron withdrawing side-chain flucloxacillin is stable to acids (see
Scheme 14) and can, thus, be orally administered. It is well absorbed, although
absorption is reduced in the presence of food [184]. Like most other isoxazolyl
penicillins, flucloxacillin is highly bound to serum proteins (95%) and has a short
elimination half-life of 45 to 60 minutes [185-186]. Since the major route of
flucloxacillin excretion is tubular renal secretion [187], the half-life may be
augmented in case of renal failure or due to a combined administration with
probenecid, which was used for a long time to prolong the dosage interval and to

Chemical and pharmaceutical properties 119
increase the serum level of penicillins [186, 188]. This wanted drug-drug interaction
may be helpful when flucloxacillin resistance is an issue [1]. Probenecid is a lipophilic
(logP 3.2) benzoic acid derivative (pKa 3.4), inhibitiing tubular secretion transporters
in the kidney. This mechanism is also responsible for elevated flucloxacillin levels
when administered together with piperacillin [187]. Important clinical adverse effects
of flucloxacillin are hepatotoxicity and bone-marrow depression [186].
The bactericidal activity of flucloxacillin derives from the irreversible inhibition of cell
wall synthesis by covalently binding to the transpeptidases in proliferating bacterial
cells, leading to cell lysis [69]. Important for this reaction is the three-dimensional
structure of flucloxacillin resulting in a highly reactive β-lactam ring (see Scheme 13).
The cyclic amide containing four atoms in the ring, which is called a β-lactam, is
stabilized by resonance of the nitrogen with its carbonyl group [69]. This is possible
since the nitrogen in the planar molecule is sp2-hybridised and its orbitals can
therefore overlap easily with the ones of the adjacent carbonyl group. However, in β-
lactam antibiotics, the β-lactam ring is fused to a thiazolidine ring, which forces the
amide nitrogen to sp3 hybridisation and thus, to a highly reactive “V”-shaped
molecule sensitive to nucleophilic attack.
Scheme 13 Beta-lactam structure compared to beta-lactam antibiotics
NH
S
COOH
CH3
CH3
H
NH
O
NH
O
NH
O
NH
O
C N
O
sp3
H
H H
H H
sp2
R
O
Flucloxacillin, 3-(2-chloro-6-fluorophenyl)-5-methyl-4-isoxazolylpenicillin is a weak
acid with a pKa of 2.7 [69] (and logP 2.58 [189]). It contains a large phenyl-

120 Flucloxacillin
substituted isoxazolyl moiety which protects the beta-lactam bond (N1-C7) by steric
hindrance from hydrolysis by a variety of beta-lactamases, including penicillinases,
cephalosporinases and extended spectrum beta-lactamases.
Scheme 14 Acid stability of flucloxacillin
Due to the inductive effect of the electron-withdrawing chloro-fluoro phenyl
substituted isoxazolyl moiety, the amid-enol interconversion is shifted towards the
amid, increasing acid stability of flucloxacillin compared to other penicillins. However,
at basic pH, cleavage of the β-lactam ring occurs. The mechanism is depicted in
Scheme 18 in the piperacillin chapter 4.2.1.
4.1.2 Current state of published analytical methods for flucloxacillin
Typical methods to quantify flucloxacillin in human serum or plasma include
microbiological [185, 190-191] and chromatographic techniques [58, 192-196]. Many
of these approaches have been applied in pharmacokinetic [58, 185, 191-194, 196-
198] and therapeutic drug monitoring studies [190].
Previously reported LC/UV methods present expensive and time-consuming sample
preparation procedures and long run times of 8 to 16 minutes [192, 194-195, 197],
and relatively high lower limits of quantification (LLOQs) in the range from 0.200 to
2.700 µg/mL [58, 192, 194-197], not suitable for the intended low-dose flucloxacillin
clinical trial.

LC-MS/MS method development 121
Two LC-MS/MS methods have been previously published [57-58]: one to quantify
trace amounts of penicillin contaminants in commercially available drug products and
the other to quantify flucloxacillin and ampicillin in human plasma samples of a PK
study with intravenous flucloxacillin doses (1.5 to 5 g). Both were not suitable for the
low-dose (250 mg) clinical trial.
Therefore, the aim was to develop and validate a highly sensitive, precise and fast
LC-MS/MS quantitative method for the determination of low-dose flucloxacillin in
human plasma.
4.1.3 LC-MS/MS method development
The first step in method development is acquisition of mass spectra and optimizing
the MS/MS parameters. The optimization procedure on a triple quadrupole mass
spectrometer (API 3000™) resulted in the use of a TurboIonSpray® interface for
electrospray ionisation in the negative ion mode.
Figure 25 Negative precursor ion (Q1) spectrum of flucloxacillin
311.1
335.2 353.1 372.2
388.2
408.1
452.3
474.2 488.3
350 400 450m/z, amu
2.0e5
4.0e5
6.0e5
8.0e5
1.0e6
1.2e6
1.4e6
1.6e6
1.8e6
2.0e6
2.2e6
2.4e6
2.6e6
Inte
nsi
ty, cps
452.3
The most abundant peak in the negative precursor ion spectrum of flucloxacillin at
m/z 452 corresponds to the deprotonated molecule [M-H]- of flucloxacillin (exact
mass 453.1 amu) as can be seen in Figure 25. The signals with m/z 408 and

122 Flucloxacillin
m/z 311 derive from flucloxacillin, which already dissociates to a small extent in the
electrospray ionisation source by CID. The fragment m/z 311 is predominantly
formed by CAD, as can be seen from the product ion spectrum, recorded in the Q3
of an API 3000™ (Figure 26).
Figure 26 Product ion mass spectrum and fragmentation scheme of flucloxacillin
in the negative ion mode
311.0
372.4
388.3
408.2
452.0
350 400 450m/z, amu
1.0e5
2.0e5
3.0e5
4.0e5
5.0e5
6.0e5
7.0e5
8.0e5
9.0e5
1.0e6
1.1e6
Inte
nsi
ty, cps
311.0
-CO2
-C5H7NO
[M-H]--HF
-HCl
The deprotonated flucloxacillin molecule [M-H]- with m/z 452 may easily loose two
neutral species. The loss of CO2 (-44 amu) results in the fragment ion with m/z 408,
which further looses HF (-20 amu) resulting in the fragment ion with m/z 388.
But the main fragmentation pathway of the deprotonated flucloxacillin molecule
[M-H]- leads to the most abundant ion in the product ion spectrum (see Figure 26)
with m/z 311. It corresponds to the loss of carbon dioxide and further loss of a
neutral species with 97 amu (C5H7NO) originating from the β-lactam ring as
previously suggested by Rabbolini et al. [199].
The cleavage of the C(6)-C(7) bond, the C(5)-N(1) bond, and the C(3)-S(4) bond is
typical for the fragmentation of penicillins in the negative-ion mode. The proposed
mechanism by Rabbolini et al. [199] involving intermediate radical anions in Scheme
15 is adopted to the example of flucloxacillin.

LC-MS/MS method development 123
Scheme 15 Mechanism of flucloxacillin fragmentation in the negative-ion mode
(adopted to the example of flucloxacillin from [199])
CH3
N
O
O
NH
6 5
N17
O
3
S CH3
CH3
C
Cl F
HH
O
O
-CO2
m/z 452 m/z 408
CH3
N
O
O
NH
6 5
N17
O
3
S CH3
CH3Cl F
HH
CH3
N
O
O
NH
6 5
N1C
7
O
3
S CH3
CH3Cl F
HH
-C5H7NO
-44 amu
-97 amu
CH3
N
O
O
NH
6 5
S
Cl F
HH
m/z 311
CH3
N
O
O
N
6 5
S
Cl F
HH
m/z 311
H
CH3
N
O
O
NH
6 5
N17
O
3
S CH3
CH3Cl F
HH
Mass spectra of tolbutamide (IS) are recorded under the same conditions
(pneumatically assisted electrospray, negative-ion mode) to evaluate the most
intense mass transition for the MRM mode. The Q1 spectrum shows the
deprotonated molecular ion [M-H]- of tolbutamide (exact mass 270.1 amu) with
m/z 269. The most abundant ion in the negative-mode product ion spectrum of
tolbutamide is m/z 170, which is selected for the MRM transition and corresponds to
the loss of a species of 99 amu (C5H9NO) from the deprotonated molecule.

124 Flucloxacillin
Figure 27 Precursor ion scan of tolbutamide 1.97e6 cps–Q1 MCA (10 scans): from TOL Q1 TISP NEG 02.05.02
255.3
269.3
279.2 283.2 291.2 295.2
260 270 280 290m/z, amu
2.0e5
4.0e5
6.0e5
8.0e5
1.0e6
1.2e6
1.4e6
1.6e6
1.8e6
H3C
SNH
O O
NH
O
CH3
-H+-
269.3
Figure 28 Product ion scan of tolbutamide 5.58e5 cps–Product (269) MCA (10 scans): from TOL DAU TISP NEG 02.05.02
105.9
170.2
200.8 225.6
269.3
150 200 250m/z, amu
5.0e4
1.0e5
1.5e5
2.0e5
2.5e5
3.0e5
3.5e5
4.0e5
4.5e5
5.0e5
5.5e5
[M-H] --C5H9NO
H3C
SNH
O O
NH
O
CH3
-H+-
m/z 170
170.2
-SO2
rearrangementof nitrogen
Thus, the mass spectrometer is equipped with an electrospray interface and is
operated in the negative ion mode using Multiple-reaction-monitoring (MRM) of the
following transitions: m/z 452 → m/z 311 (FLU) and m/z 269 → m/z 170 (TOL, IS).

LC-MS/MS method development 125
System parameters were optimized during spectra acquisition to obtain the highest
analytical sensitivity for flucloxacillin. They are summarized in Table 39.
Table 39 Optimized MS/MS parameters for flucloxacillin
Parameter API 3000™
Probe temperature 350 °C
Ionspray voltage -5 kV
Orifice voltage -21 V
Collision energy 16 eV
Nebulizer gas (TISP) 80 psi
Auxiliary gas (TISP) 2 L/min
Nebulizer, auxiliary and curtain gas High purity nitrogen
Collision gas High purity nitrogen
Collision gas thickness 6 (2.7·10-5 torr)
Chromatographic conditions: Isocratic conditions on the reversed phase column
(Betasil C18, 5µm, 50x4.6mm i.d.) support the high specificity of the method. The
weak acid flucloxacillin with pKa 2.7 was deprotonated in the mobile phase at
approximately pH 7 to increase the number of negatively ionized flucloxacillin
molecules to be detected in the negative ion mode. The ammonium acetate (5 mM)
in the mobile phase assisted charge transition during electrospray ionisation. The
desolvation process of the molecular ions from the aqueous mobile phase (67% v)
was assisted by heated nitrogen gas (350 °C) in the TurboIonSpray® source.
Scheme 16 Chemical structure of tolbutamide (TOL)
H3C
SNH
O O
NH
O
CH3
Formula Mol. weight Exact mass pK a logP
C12H18N2O3S 270.3 g/mol 270.1 amu 5.2 2.34
IUPAC Name: N-(butylcarbamoyl)-4-methylbenzenesulfonamide .

126 Flucloxacillin
Experience from other methods has shown, that the weak acid tolbutamide (pKa 5.2,
logP 2.34 [200]), which is also deprotonated at pH 7, has a similar retention time on
a C18 column with water – acetonitrile (67:33, v/v) and was therefore used as
internal standard. The retention times of flucloxacillin and tolbutamide were 1.1 and
1.5 min, respectively. Typical chromatograms are depicted in Figure 29 on page 133.
The expected concentration range was estimated as follows: Administration of a
250-mg flucloxacillin capsule to healthy adults, results in mean peak plasma
concentrations in the range from 7.4 to 14.5 µg/mL [193-194, 197-198]. In order to
be able to detect about 5 % of Cmax, the LLOQ of flucloxacillin should be lower than
350 ng/mL, which is the case even with the precipitation method down to 10 ng/mL.
In order to assure the stability of the β-lactam flucloxacillin, all sample handling as
well as the sample preparation procedure were done in an ice-water bath at
approximately 4 °C.
After thawing the human plasma samples, calibration standards and SQC samples in
a cold water bath, the samples are mixed thoroughly and centrifuged for 5 minutes at
approximately 4 °C to separate eventually present solid components.
As discussed in chapter 1.4.3 “Sample preparation techniques”, the most economic
sample preparation technique (material costs and time) is protein precipitation. As
flucloxacillin plasma concentrations are expected to be sufficient high, this technique
was tested first: An aliquot of 100 µL of the spiked human plasma samples is
deproteinised by adding 200 µL of acetonitrile containing the internal standard
tolbutamide. Different IS working solutions are tested to find a concentration that
results in a peak area ratio (highest analyte area/IS) of approximately 5 revealing the
following result: The IS working solution is prepared by diluting a stock solution of
tolbutamide by factor 200 with acetonitrile to give a concentration of 10 µg/mL.
The precipitated sample, containing the IS, is mixed thoroughly to facilitate
deproteinisation. The precipitate is separated by centrifuging the samples for
10 minutes at 3600 rpm (3280 g) at approximately 4 °C. Addition of 200 µL of
ammonium acetate solution (5 mM, pH 7) to 50 µL of the supernatant promoted
neutral pH in the sample and thus, prevented flucloxacillin from degradation. In
addition, this increased the water content of the sample, decreasing plasma matrix
content and improving the peak shape on the C18 reversed phase column. After
mixing, 15 µL of each sample is injected onto the LC-MS/MS system. In Table 40 the
optimized sample preparation procedure and LC-MS/MS conditions are summarized.

Validation 127
Table 40 Summary of the LC-MS/MS method for flucloxacillin in human plasma
Characteristic Details
Sample preparation 100 µL plasma + 200 µL CH3CN /IS
50 µL supernatant + 200 µL NH4CH3COO (5 mM, pH 7.0)
Internal standard Tolbutamide (TOL)
Column Betasil C18, 5 µm (50 x 4.6 mm i.d.)
Mobile phase 33 % CH3CN
67 % NH4CH3COO (5 mM, pH 7.0)
Flow rate 1.0 mL/min
Run time 2.2 min
Ionisation Electrospray Ionisation (TurboIonSpray®)
Polarity Negative ion mode
Mass transitions m/z 452 → m/z 311 (FLU)
m/z 269 → m/z 170 (TOL, IS)
CH3CN /IS: acetonitrile containing the internal standard tolbutamide (10 µg/mL)
4.1.4 Validation
Being intended for a human pharmacokinetic study, the method was validated
according to the guideline on bioanalytical method validation by the FDA [33].
The selectivity of the flucloxacillin method was determined by preparing 12 (6 males
and 6 females) different batches of drug-free human plasma with and without IS.
Matrix components did not interfere with flucloxacillin and the IS, i.e. no co-eluting
peak was observed.
Additionally, no influence on the analysis of flucloxacillin was observed for six
different batches of human plasma: all (N = 18) test samples with the high
flucloxacillin concentration (15 µg/mL) had a mean accuracy of 97.6 % ± 3.2 % and a
precision of 3.3 %. All (N = 18) test samples with the low flucloxacillin concentration
(0.0375 µg/mL) had a mean accuracy of 96.8 % ± 4.9 % and a precision of 5.0 %.
The linear regression of the peak area ratios versus concentrations were fitted over
the concentration range from 0.0100 to 15.0 µg/mL in human plasma. The mean
linear regression equation of the calibration curves on five validation days was
established: y = 0.0001 (±0.0001) + 0.0950 (±0.0179) · x. All correlation coefficients

128 Flucloxacillin
of the weighted calibration curves were ≥ 0.997. Using 100 µL of plasma, the lower
limit of quantification for flucloxacillin was 0.0100 µg/mL. The signal-to-noise ratio of
flucloxacillin at the LLOQ (10 ng/mL) was at least five on all five validation days. The
inter-day precision and accuracy of all back-calculated calibration standards ranged
from 1.1 to 6.5 % and from 97.8 to 103.1 %, respectively.
Table 41 summarizes the intra- and inter-day precision and accuracy for
flucloxacillin, evaluated by assaying the SQC samples. The inter-day precision of the
SQC samples for flucloxacillin in human plasma ranged from 4.0 to 8.6 % with an
accuracy from 97.6 to 101.4 %. The obtained results were well within the acceptance
criteria of the above cited guidelines.
Table 41 Intra- and inter-day precision and accuracy of the analysis of
flucloxacillin in human plasma (five days, five replicates per day)
Theoretical concentrations
[µg/mL]
Intra-day Precision
[[[[%]]]]
Intra-day Accuracy
[[[[%]]]]
Inter-day Precision
[[[[%]]]]
Inter-day Accuracy
[[[[%]]]]
15.0 5.0 103.9 4.5 101.4
7.50 5.3 97.6 4.0 97.6
0.375 6.0 95.8 4.2 99.2
0.0375 8.3 94.1 7.1 99.8
0.0100 9.1 93.2 8.6 101.0
The mean absolute extraction recovery of flucloxacillin was determined to be 92.8 ±
2.6 % over the whole concentration range from 0.0100 to 15.0 µg/mL. The mean
absolute extraction recovery of the IS (tolbutamide) at the working concentration was
found to be 88.4 ± 4.0 %. All recoveries had relative standard deviations better than
4.5 % throughout the entire standard concentration ranges, showing good
consistency and reproducibility of the simple one-step protein precipitation procedure
for flucloxacillin in human plasma.
Stability data of flucloxacillin at concentrations of 15 µg/mL and 0.0375 µg/mL in
human plasma is compiled in Table 42. The results of the 95 % confidence interval
calculation showed no evidence of instability during chromatography, extraction and
sample storage processes. Therefore, flucloxacillin can be regarded as stable in
human ammonium heparin plasma for at least 4 hours at 4 °C, for at least 2 months
at -20 °C, and for at least three freeze-thaw cycles from -70 °C to room temperature.
In processed human plasma, flucloxacillin is stable for at least 72 hours at 4 °C
(autosampler temperature) and at -70 °C. Flucloxacillin and the IS were stable in

Validation 129
stock solutions at concentrations of 1000 µg/mL flucloxacillin or 2000 µg/mL
tolbutamide for at least 6 hours at 4 °C.
Table 42 Statistical evaluation of the stability experiments for flucloxacillin in
human ammonium heparin plasma
Stability experiment Conc.
[[[[µg/mL ]]]]
Time Point estimator
[[[[%]]]]
Lower Limit [[[[%]]]]
Upper Limit [[[[%]]]]
2 hours 103.56 100.97 106.22 15.0 4 hours 103.62 102.92 104.32 2 hours 102.80 98.60 107.19
Short-term stability (approximately 4 °C)
0.0375 4 hours 103.41 96.82 110.45 24 hours 106.10 104.67 107.54 48 hours 95.21 93.75 96.70
15.0
72 hours 107.83 106.46 109.21 24 hours 102.96 98.38 107.75 48 hours 92.22 90.12 94.36
Post-preparative stability (autosampler temperature, approximately 4 °C)
0.0375
72 hours 106.47 103.80 109.22 24 hours 105.64 104.25 107.05 48 hours 95.59 94.22 96.98
15.0
72 hours 107.33 106.97 107.69 24 hours 100.29 96.23 104.51 48 hours 94.82 91.03 98.76
Post-preparative stability (approximately -70 °C)
0.0375
72 hours 104.69 101.78 107.69 Once 103.47 101.83 105.13 Twice 94.83 93.71 95.96
15.0
Thrice 107.67 105.95 109.42 Once 100.98 94.92 107.42 Twice 96.33 92.45 100.36
Freeze-thaw stability (approximately -70 °C)
0.0375
Thrice 105.24 102.13 108.45 2 days 94.34 92.51 96.21
1 month 97.81 95.79 99.87 15.0
2 months 91.88 90.98 92.79 2 days 94.53 93.06 96.03
1 month 105.91 103.82 108.05
Long-term stability (approximately -20 °C)
0.0375
2 months 94.86 91.84 97.97 2 days 94.05 91.56 96.60
1 month 108.20 106.96 109.45 15.0
2 months 100.97 99.41 105.55
2 days 92.76 90.01 95.60 1 month 101.88 96.14 107.96
Long-term stability (approximately -70 °C)
0.0375
2 months 93.84 91.31 96.45
No influence of haemolysed or hyperlipidaemic human plasma on the accuracy and
precision of the method was observed in five replicates of two concentration levels in
each type of plasma. The mean concentration values were within ±15 % of the

130 Flucloxacillin
nominal value. Mean precision and accuracy for flucloxacillin in haemolysed /
hyperlipidaemic plasma at 15 µg/mL were 1.5 % / 1.9 % and 104.8 % / 90.2 %,
whereas mean precision and accuracy at 0.0375 µg/mL were 3.1 % / 5.5 % and
101.4 % / 94.5 %, respectively.
Flucloxacillin plasma samples can be pre-diluted by factor 5. The mean
concentration values of five replicates were within ±15 % of the nominal value with a
mean accuracy of 102.6 %. The precision for the 1:5 diluted human plasma samples
at 60.0 µg/mL was 2.9 %.
4.1.5 Comparison of the LC-MS/MS method with proced ures reported in the
literature
In Table 43 the LLOQ, run time and quality control data for several previously
reported analytical methods for the determination of flucloxacillin in human plasma
are displayed in comparison to the present LC-MS/MS method.
All previously reported LC/UV methods needed longer run times (8-30 min compared
to the present 2.2 min) and reached less sensitivity with LLOQ values at least 20
times higher than the LLOQ value achieved in the present study [192, 194-197, 201].
Additionally, the paper published by Thijssen [192] did not report linearity, recovery,
precision and accuracy data and the authors of three methods [194, 196-197]
avoided the precision and accuracy data for LLOQ. An accurate and precise LC/UV
method was reported by Charles et al. [195] and Zhou et al. [197]. However,
compared with the actual LC-MS/MS method, they were more time-consuming in
terms of sample preparation procedure [195] and run time [197] and therefore less
suitable for high-throughput analysis of large clinical and pharmacokinetic studies.
The LC-MS/MS method of Huang et al. is characterized by similar precision data as
the present method. However, their reported recovery for FLU and the IS is 115%
and 135%, respectively. Together with the high CV values, this indicates that very
different individual results were obtained.
Furthermore, most of the previously reported methods were to the best knowledge
not reported to be applied to a clinical setting [195-196] or were applied to PK
studies with higher dosages [192, 194, 201]. Only one method [197] was also
applied to a 250-mg oral dose study, but the run time of 10 minutes is relatively long
and due to less sensitivity, the AUC had to be extrapolated by 4% (compared to
0.4% herein).

Comparison of the LC-MS/MS method with procedures reported in the literature 131
Table 43 Comparison of developed method to existent methods to quantify flucloxacillin in human plasma or serum; grouped by analytical
technique and descending years of publication
Method Linearity range
[[[[µg/mL ]]]]
Approx. run time
[[[[min ]]]]
Inter-day Prec / Acc at LLOQ
[[[[%]]]]
Inter-day Prec / Acc of SQCs
[[[[%]]]]
Recovery mean ± SD
[[[[%]]]]
Corr. coeff.
Sample Vol. [mL]
Sample preparation
Application
LC-MS/MS (current method)
0.010 - 15.0 2.2 8.6 / 1.0 4.0 to 8.6 / 97.6 to 101.4
92.8 ± 2.6 (FLU) 88.4 ± 4.0 (IS)
≥ 0.997 0.100 PPT 250-mg p.o. PK
LC-MS/MS [58] Huang et al. 2012
0.20 - 500 3.5 12.1 / 100.0 (one day)
3.7 to 11.2 / 95.1 to 102.0
115.1±9.6 to 135.6±18.2 %
0.998 0.050 PPT i.v. PK 1.5g – 5g
LC/UV [201] Mc Whinney et al. 2010
5 - 500 30 2.5 / n.r.
1.9 to 4.4 / 92.0 to 97.0
n.r. 0.995 0.200 PPT+LLE TDM
LC/UV [196] Pullen et al. 2007
5.0 – 100 (calc. LLOQ:
2.7)
n.r. 6.8 / 112.2 (at 5 µg/mL)
4.7 / 98.4 (at 25µg/mL)
101.4, 100.6 (50; 100 µg/mL)
> 0.996 0.020 LLE -
LC/UV [197] Zhou et al. 2007
0.20 - 40.0 10.0 n.r. / n.r. 5.1 to 10.5 / 100.3 to 105.0 (0.4-30 µg/mL)
87.2 0.9999 (mean)
0.100 PPT 250-mg p.o. PK
LC/UV [195] Charles et al. 1994
0.20 - 40.0 (LLOQ: 0.3)
8.0 6.8 / 93.2 3.0 to 6.8 / 93.2 to 107.7
(0.3-30 µg/mL)
60 - 70 > 0.999 0.100 LLE -
LC/UV [194] Hung et al. 1988
0.20 - 50.0 15.0 n.r. / n.r. n.r. / n.r. > 90 ≥ 0.980 0.250 PPT+ SPE 500-mg p.o. PK
LC/UV [192] Thijssen et al. 1980
0.40 - n.r. 1.0 – n.r.
16.0 n.r. / n.r. n.r. / 106.0 n.r. / 116.0
n.r. n.r. n.r. PPT + LLE 1.5-g p.o. PK
Prec: precision, Acc: accuracy, n.r.: not reported, PPT: protein precipitation, LLE: liquid-liquid-extraction, SPE: solid phase extraction

132 Flucloxacillin
4.1.6 Application to a pharmacokinetic study
4.1.6.1 Study design and sample handling
The clinical trial studied a 250-mg capsule of flucloxacillin as a single oral dose to 24
healthy male and female subjects in the fasting state. Blood was collected into
ammonium heparinate monovettes at the following time points: immediately before
administration and at 0.25, 0.50, 0.75, 1.00, 1.25, 1.50, 1.75, 2.00, 2.50, 3.00, 4.00,
5.00, 6.00, 8.00, 10.00, 12.00 and 16.00 hours after administration of the study drug.
The monovettes were cooled immediately in an ice-water bath until centrifugation for
10 minutes at 4 °C and 1500 g. The obtained plasma is subsequently transferred into
polypropylene tubes and immediately frozen at approximately -70 °C until analysis.
The concentrations of flucloxacillin are determined using the developed and
validated LC-MS/MS method as summarized in Table 40 (page 127).
4.1.6.2 Determination of flucloxacillin concentrations in human plasma
Flucloxacillin concentrations of more than 1300 human plasma samples were
measured in a total of fourteen sequences together with ten injection standards,
twelve calibration standards and twelve SQCs. Each sequence, consisting of
calibration standards (low to high concentrations), subject samples and the quality
control standards (in randomized order among subject samples) were measured
within 5.5 hours. The determined concentration of the SQC samples was compared
to theoretical concentrations to account for accuracy.
The coefficient of correlation of resulting linear regressions was at least 0.999. The
inter-day precision and accuracy of the spiked quality control standards of
flucloxacillin in human plasma analyzed with the batches of study samples ranged
from 3.9 to 7.7 % and from 97.7 to 101.3 %, respectively and were therefore of very
good quality.
All sample concentrations were detectable and within the calibration range. In
particular, no BQL samples with concentrations below the quantification limit
occurred, indicating the very good sensitivity of the developed method. Typical
MRM-chromatograms are depicted in Figure 29.

Application to a pharmacokinetic study 133
Figure 29 Representative MRM-chromatograms for flucloxacillin (top) and
tolbutamide (IS, bottom) in human plasma: (A) Blank plasma sample, (B) LLOQ
(0.0100 µg/mL), (C) Subject sample (16 hours post-dose, 0.0129 µg/mL) and (D)
Subject sample (0.75 hours post-dose, 24.37 µg/mL).
A B C DA B C DA B C D
4.1.6.3 Pharmacokinetic results
Figure 30 shows the mean plasma concentration profile of flucloxacillin obtained
after oral administration of a 250-mg capsule of flucloxacillin to 24 healthy
volunteers. The mean peak concentration (Cmax) of 8.33 ± 2.88 µg/mL (mean±SD)
was attained after 0.95 ± 0.23 hours (mean±SD) followed by an elimination half-life
of 1.89 ± 0.42 hours (mean±SD). The mean total area under the curve (AUC0→∞) was
15.5 ± 4.92 h·µg/mL (mean±SD), of which only 0.4 % had to be extrapolated.
Table 44 shows the pharmacokinetic parameters of flucloxacillin after oral
administration of 250 mg in comparison to pharmacokinetic parameters reported in
previously studies. In order to put the pharmacokinetics of flucloxacillin side by side,
given in different doses, the calculations of Cmax, AUC0→t and AUC0→∞ were dose-
corrected. Dose linearity of flucloxacillin in doses up to 1000 mg was demonstrated
by Landersdorfer et al. [202].

134 Flucloxacillin
Figure 30 Mean plasma concentration profile of flucloxacillin following a single
oral 250-mg flucloxacillin capsule to 24 healthy volunteers.
0.01
0.1
1
10
100
0 1 2 3 4 5 6 7 8 9 10 11 12 13 14 15 16
Con
cent
ratio
n (µ
g/m
L)
Time after administration (h)
Flucloxacillin (250 mg)
The pharmacokinetic data are in good agreement with the three data sets reported
by Paton et al. [193]. The elimination half-lives and times to peak concentration
reported by other authors are also comparable to the data from this study. However,
Zhou et al. [197] and Hung et al. [194] reported higher peak concentrations and AUC
values in male subjects only.
This relatively high inter-study variability observed for AUC and Cmax, can be
explained by non-specific effects like dosage accuracy, adherence to dietary
restrictions and drug assay accuracy. Other effects, like subject gender and sample
size may also contribute to a considerable intra- and inter-individual variation [185].
In the present study, non-specific variability for pharmacokinetic parameters was
minimised by using a randomized crossover design, strict adherence to dietary
restrictions and the development of a highly accurate drug assay.

Application to a pharmacokinetic study 135
Table 44 Reported values for pharmacokinetic parameters (mean ± standard deviation) of flucloxacillin in healthy subjects after overnight
fasting and administration of a single oral dose as capsule
Reference No. of subjects/ Gender
Dose / Formulation
t last
[[[[h]]]] AUC0→→→→t*
[[[[µg·h/mL ]]]] AUC0→→→→∞∞∞∞*
[[[[µg·h/mL ]]]] AUC t→→→→∞∞∞∞
[%]]]] Cmax*
[[[[µg/mL ]]]] tmax
[[[[h]]]] t1/2
[[[[h]]]] Analytical
Method
Current study 24/m,f 250 mg p.o. 16 15.4 ± 4.91 15.5 ± 4.92 0.4 ± 0.2 8.33 ± 2.88 0.95 ± 0.23 1.89 ± 0.42 LC-MS/MS
[197] Zhou 2007 20/m 250 mg / A 8 28.7 ± 1.3*² 29.8 ± 1.3*² 4 ± 2*² 14.5 ± 1.5*² 0.7 ± 0.1*² 1.9 ± 0.6*² LC/UV
(Chinese) 250 mg / B 27.9 ± 1.4*² 28.8 ± 1.3*² 3 ± 3*² 13.9 ± 1.6*² 0.8 ± 0.4*² 1.7 ± 0.4*² LC/UV
[185] Røder 1995 12/m,f 750 mg 8 n.r. 22.6*³
(17.4-27.2)
n.r. 11.5*³
(7.6-9.1)
0.75*³
(0.5-1.0)
1.27*³
(1.0-1.45)
Microbiol. Assay
[194] Hung 1988 10/m 500 mg 10 approx. 24 n.r. n.r. approx. 11 approx. 1 approx. 1.4 LC/UV
[198] Paton 1986 9/m,f 250 mg 8 18.8 ± 2.0 n.r. n.r. 7.7 ± 1.3 0.9 ± 0.1 1.5 ± 0.2 LC/UV
[193] Paton 1982 8/m,f 250 mg / A 8 15.85 ± 1.98 n.r. n.r. 7.37 ± 1.38 0.9 ± 0.1 1.39 ± 0.15 LC/UV
250 mg / B 16.96 ± 2.08 n.r. n.r. 7.98 ± 1.60 1.1 ± 0.2 1.31 ± 0.06 LC/UV
m: male, f: female, n.r.: not reported, *: if necessary, dose-corrected to 250 mg, *²: geometric mean ± SD, *³: median (first-third quartile).

136 Piperacillin
4.1.7 Summary: flucloxacillin
This is the first LC-MS/MS assay validated for determination of very low flucloxacillin
concentrations after oral administration of a 250-mg dose. The method allows
simple, fast, reliable, sensitive, precise and accurate determination of flucloxacillin in
human plasma. The method employed acetonitrile protein precipitation, which
permits quantification of flucloxacillin in human plasma for concentrations ranging
from 15.0 down to 0.0100 µg/mL using 100 µL of plasma only.
The principal advantage of the LC-MS/MS method described here is the
simultaneous achievement of high absolute recovery (92.8 %), high sensitivity
(LLOQ = 0.0100 µg/mL), high inter-day precision (8.6 %) and high accuracy (101.0
%) for LLOQ as well as excellent linearity (r2 ≥ 0.997) with a short run time of only
2.2 minutes. These characteristics make the method suitable for the precise and
accurate measurement of low concentrations of flucloxacillin in the context of
pharmacokinetic studies at low single dose concentrations. The method was
successfully applied to the analysis of more than 1300 samples during a
pharmacokinetic study.
Short sampling intervals and high assay sensitivity led to a very precise estimation of
the total AUC, whereas the mean residual area was only 0.4 %.
4.2 Piperacillin
4.2.1 Chemical and pharmaceutical properties
Piperacillin is a broad-spectrum acylureido-penicillin used in the treatment of severe
infections like respiratory tract infections, ear, nose and throat infections, severe
systemic infections, including sepsis, intra-abdominal infections, skin and skin-
structure infections, as well as bone and joint infections, including osteomyelitis.
Piperacillin as a mono-therapy is recommended only for use in patients with known
resistance profile of antimicrobial strains as it is susceptible to β-lactamases. Applied
together with tazobactam (acting as a β-lactamase inhibitor) it has the broadest
antibacterial spectrum of the penicillins, playing an important role in the treatment of
infections caused by gram-negative bacteria [1].

Chemical and pharmaceutical properties 137
Scheme 17 Chemical structure of piperacillin (PIP)
N1 2
(S)
S
(R)56 (R)
COOH8O
CH3
CH3
NH
O
(R)
HN
O
N
N
O
OH3C
HH
Formula Mol. weight Exact mass pK a logP
C23H27N5O7S 517.6 g/mol 517.2 amu 2.9 0.22
IUPAC Name: (2S,5R,6R)-6-((R)-2-(4-ethyl-2,3-dioxopiperazine-1-carboxamido)-2-phenylacetamido)-3,3-dimethyl-7-oxo-4-thia-1-azabicyclo[3.2.0]heptane-2-carboxylic acid
Like flucloxacillin, piperacillin inhibits bacterial cell wall synthesis by its highly
reactive β-lactam ring, see Scheme 13 in chapter 4.1.1. Due to its dioxo-piperazin
moiety, piperacillin is especially effective against gram-negative bacteria, but at the
same time it is instable towards acids. Therefore, piperacillin is poorly absorbed from
the GI tract and has to be administered parenterally. Following a 30-min infusion of
4g piperacillin, maximum concentrations between 220 and 280 µg/mL can be
reached, while approximately 30 % higher peak concentrations are reached after
bolus injection [203-208]. Different dosing regimens and intermittent versus
continuous infusion were studied by several authors [209-214]. Piperacillin levels
remain above the MIC90 for 2 hours post-administration [206, 215]. The plasma
protein binding is 20-30 % [216] and due to its hydrophilic character piperacillin
distributes well into water-containing tissues, especially into skin and the
gastrointestinal tract [206, 217].
Piperacillin is eliminated rapidly by glomerular filtration and tubular secretion. This
has several consequences: at first, a short half-live of about 1 hour and second, high
concentrations in urine. Third, drug-interactions between piperacillin and other drugs
mainly depend on extend and mechanism of their renal excretion, e.g. flucloxacillin,
tobramycin [187, 216, 218-219]. Non-linear pharmacokinetics, i.e. saturable
clearance at clinically used doses, could be caused by capacity limited tubular

138 Piperacillin
secretion [220-223]. However, also some PK studies found linear or probably
“pseudolinear” behaviour of elimination [211, 224-225]
The biliary route of piperacillin excretion in humans is negligible [226-227] and very
little is known about hepatic metabolism, although some metabolites have been
identified in urine [228] and bile [229].
Scheme 18 Mechanism of beta-lactam degradation at basic pH
Like other penicillins, piperacillin is a weak acid with a pKa of 2.9 [230] (and logP of
0.22 [231]), which derives from the carboxylic acid group adjacent to the
electronegative sulphur atom and the β-lactam peptide bond [232], see Scheme 17.
In aqueous solutions piperacillin is most stable at approximately pH 5 [230, 233].
Below pH 3 the β-lactam ring is hydrolysed [230]. The mechanism of the β-lactam
degradation in acidic environment is depicted in Scheme 14 (see chapter 4.1.1). At
pH 8-9 piperazinyl ring cleavage occurs [230] as well as cleavage of the β-lactam
ring (see Scheme 18).

Previously published analytical methods 139
4.2.2 Previously published analytical methods
Most previously reported methods to quantify piperacillin in human plasma or serum
used liquid chromatography with UV detection (LC/UV) [201, 211, 226, 234-241] or
with MS/MS detection (LC-MS/MS) [62], of which some were applied to therapeutic
drug monitoring [62, 201, 235, 237, 241] or pharmacokinetic studies [211, 226, 238-
239]. Most of those methods need long run times of 10 to 35 minutes per sample,
reducing the daily sample number significantly. Only three methods [62, 234, 239]
are characterized by run times between 5 and 8 minutes, but were not suitable for
the intended application for the following reasons: low sensitivity (10µg/mL)
combined with expensive and time-consuming sample preparation techniques like
liquid-liquid extraction, solid phase extraction or derivatisation.
Very few methods for piperacillin have been reported using LC-MS/MS as technique
of choice. Piperacillin was determined in waste-water [242], ground and surface
water [243], in cell culture medium [244], and in bile [226]. Only four LC-MS/MS
methods were reported for determination of piperacillin in serum [62] or plasma [59-
61], but none was validated for analysis of urine samples. All previously reported LC-
MS/MS methods were designed for simultaneous determination of several β-lactam
antibiotics, needing relatively long run times (5.5 to 8.0 minutes) or reported issues
with poor precision [59]. All of them were characterized by either costly and time-
intense sample preparation techniques (SPE, LLE), or were less sensitive (LLOQs of
0.3 to 1.5 µg/mL).
Therefore, the aim was to develop and fully validate a fast and highly sensitive LC-
MS/MS method that allows easy and cost-effective sample preparation and high-
throughput analysis of piperacillin in human plasma and urine samples and to
investigate the pharmacokinetics of a 4.5 g single intravenous dose of
piperacillin/tazobactam (4:1).
4.2.3 LC-MS/MS method development
4.2.3.1 Mass spectra and tuning
Mass spectra of piperacillin are acquired by continuous infusion into the mass
spectrometer. Testing different ionisation sources in both polarities showed that
electrospray ionisation (TurboIonSpray®) in the negative ion mode gives the best
results, what is reasonable for carboxylic acids.

140 Piperacillin
An abundant peak correspondent to the deprotonated piperacillin molecule [M-H]-
with m/z 516 (exact mass 517.2 amu) is observed in the negative ion mass spectrum
of piperacillin recorded by scanning Q1 from m/z 320 to m/z 520 (see Figure 31).
Figure 31 Precursor ion (Q1) spectrum of piperacillin (negative-ion mode) 7.41e6 cps–Q1 MCA (10 scans): from PIP Q1 TISP NEG 16.12.05
343.3
374.9
390.8
406.9
422.9
442.9
457.1
473.0489.0
516.2
350 400 450 500m/z, amu
5.0e5
1.0e6
1.5e6
2.0e6
2.5e6
3.0e6
3.5e6
4.0e6
4.5e6
5.0e6
5.5e6
6.0e6
6.5e6
7.0e6
Inte
nsity
, cps
N1
3
S
56
7
O
OHO
CH3
CH3
NH
O
HN
O
N
N
O
O
H3C
H
-H+
-
H
An MS/MS product ion mass spectrum was obtained on collision-activated
dissociation of the deprotonated molecule of piperacillin by scanning Q3 from m/z
320 to m/z 520 in the negative-ion mode (see Figure 32).
The most intensive peak has m/z 330 and is produced by the loss of carbon dioxide
(44 amu) from the deprotonated molecule subsequently followed by the loss of the
diketopiperazine residue (142 amu). Similar fragmentation occurs in the positive
ionisation mode from the protonated piperacillin molecule, but the positive charge
remains on the diketopiperazine moiety (m/z 143). This fragment was used for
quantification by other authors [229, 244-246], but due to the lower background
noise in the negative ionisation mode of the mass spectrometer, the signal-to-noise
ratio of the m/z 330 peak in the negative mode was better than of the m/z 143 peak
in the positive-ion mass spectrum. Additionally, using the 330-amu part of the
molecule in the negative mode is supposed to be more specific for the determination
of piperacillin in human matrices, as plasma and urine.

LC-MS/MS method development 141
Figure 32 Product ion spectrum and fragmentation scheme of piperacillin in the
negative-ion mode 1.11e6 cps–Product (516) MCA (10 scans): from PIP DAU TISP NEG 16.12.05
330.3
352.8
375.0
472.5497.9
516.4
350 400 450 500m/z, amu
1.0e5
2.0e5
3.0e5
4.0e5
5.0e5
6.0e5
7.0e5
8.0e5
9.0e5
1.0e6
Inte
nsi
ty,
cps
-C6H10N2O2 [M-H]--CO2
-H+
-
N1
3
S
56
7
O
OHO
CH3
CH3
NH
O
HN
O
N
N
O
O
H3C
H
- 44 amu (CO2)m/z 472
m/z 330
- 142 amum/z 375
H
The less abundant fragment ion in the negative product ion mass spectrum of
piperacillin with m/z 375 is produced by the loss of CO2 and subsequent loss of a
neutral molecule with 97 amu, which originates from the β-lactam ring and is
therefore typical for the fragmentation of penicillins in the negative-ion mode. The
same fragments were observed by Casy et al. [247]. The fragmentation pathway was
also examined by Rabbolini et al. [199] and is further detailed in chapter 4.1.3.
Scheme 19 Chemical structure of sulbactam (SUL, IS)
CH32 (S)
N1
(R)5
S
OO
OCOOH
CH3
H
Formula Mol. weight Exact mass pK a logP
C8H11NO5S 233.2 g/mol 233.0 amu 2.5 3.16
IUPAC Name: (2S,5R)-3,3-dimethyl-7-oxo-4-thia-1-azabicyclo[3.2.0]heptane-2-carboxylic acid 4,4-dioxide

142 Piperacillin
Sulbactam was tested as IS, because its chemical structure is also based on the
penicillin scaffold and has similar chemical properties.
Figure 33 Product ion mass spectrum and fragmentation scheme of sulbactam
3.34e6 cps
42.8 63.8
95.8
123.8
140.0
165.6
188.0
208.2
232.0
50 100 150 200m/z, amu
5.0e5
1.0e6
1.5e6
2.0e6
2.5e6
3.0e6
-CO2 -CO2
-C2H4O2S[M-H]-
CH3N
S
OO
O
COOH
CH3
H
-H+
-m/z 188
m/z 140
The spectrum of sulbactam (IS, exact mass 233.0 amu), recorded by scanning Q1
from m/z 150 to m/z 500 in the same ionisation mode as piperacillin, contains the
deprotonated molecule [M-H]- at m/z 232. The MS/MS product ion mass spectrum of
sulbactam was obtained from the deprotonated molecule (m/z 232) by scanning Q3
from m/z 30 to m/z 250 (see Figure 33). The most abundant fragment ion with m/z
140 is produced by the typical negative-ion fragmentation pattern for penicillins as
discussed for flucloxacillin (see Figure 26). The only difference to flucloxacillin is the
charge site cleavage, as sulbactam can be left by a small neutral molecule, probably
sulfonylethane, with m/z 92 amu.
In conclusion, the mass spectrometer is equipped with a TurboIonSpray® interface
for pneumatically-assisted electrospray ionisation and is operated in the negative ion
mode using Multiple-reaction-monitoring (MRM) of the following transitions:
m/z 516 → m/z 330 (PIP) and m/z 232 → m/z 140 (SUL; IS).
The system parameters, which were optimized during spectra acquisition to obtain
the highest analytical sensitivity for piperacillin, are summarized in Table 45.

LC-MS/MS method development 143
Table 45 Optimized MS/MS parameters for piperacillin in the negative-ion mode
Parameter API 3000™
Probe temperature 350 °C
Ionspray voltage -5 kV
Orifice voltage -26 V
Collision energy 18 eV
Nebulizer gas (ESI) 8 L/min
Auxiliary gas (ESI) 10
Nebulizer, auxiliary and curtain gas High purity nitrogen
Collision gas High purity nitrogen
Collision gas thickness 4 (2.4·10-5 torr)
4.2.3.2 Chromatography and sample preparation
Yamana et al. [230] found that piperacillin is most stable in aqueous solutions at
approximately pH 5. Therefore, the samples were buffered at pH 5.0 during sample
preparation. As β-lactams are also known for hydrolysis and ring-opening, two
actions were taken: first, all sample preparation procedures were performed in an
ice-water bath at 4 °C and second, acetonitrile instead of methanol was used for
precipitation and as organic modifier in the mobile phase.
Previously published methods used C18 columns for reversed phase
chromatography [201, 211, 226, 234, 236, 238, 241]. PIP is an organic acid, that can
be ionized in the mobile phase prior to electrospray ionisation, interaction with a
nonpolar stationary phase is moderate and allows only limited amount of organic
modifier. As organic modifiers facilitate the ionisation process in LC-MS and increase
thereby the sensitivity, the aim of the present work was to use a high amount of
organic modifier. Due to its carboxylic acid moiety, PIP is a possible candidate for
polar interactions and ion-exchange interactions with a Nucleosil amino column,
which was tested for its chromatographic behavior by using an acetate buffer
(0.01 M) and acetonitrile in varying compositions. It was observed that retention on
this column is much stronger than on a C18 column, which allows an acetonitrile
content of 60 % in the mobile phase. Starting from an ammonium acetate buffer
(0.01 M) at pH 5.0, which caused only poor retention and chromatographic

144 Piperacillin
resolution, the ammonium acetate buffer was adjusted with acetic acid to pH 3.0 and
mixed with acetonitrile through the binary HPLC pump.
Although some authors report piperacillin methods using methanol in the mobile
phase [226, 243], acetonitrile was used for the present method, because β-lactams
are known to be susceptible to degradation in methanol by hydrolysis and ring
opening [244, 248]. With the conditions described (ammonium acetate (0.01 M,
pH 3.0) - acetonitrile (40:60, v/v)), PIP elutes after 1.1 minutes and the IS after 2.9
minutes from the analytical column.
The expected peak concentration of piperacillin in human plasma resulting from
administration of a 4 g intravenous dose to healthy adults is in the range of 220-
320 µg/mL [203, 205, 217, 249]. The LLOQ should at least be lower than 5 % of
Cmax, which is below 11 µg/mL. As piperacillin has a short half-live of approx. 1 hour
and collection of plasma samples was planned up to 24 hours, an even more
sensitive method was necessary. Using simple protein precipitation and dilution of
the samples, concentrations down to 0.050 µg/mL were detectable with a high
precision.
In order to assure the stability of the β-lactam piperacillin, all sample handling as well
as the sample preparation procedures for plasma and for urine was done in an ice-
water bath at approximately 4 °C.
The human plasma samples (spiked calibration standards or spiked quality control
standards) are thawed in a cold water bath, mixed thoroughly and centrifuged for
5 minutes at approximately 4 °C to separate eventually present solid components.
The precipitation method produced sufficient sensitivity. An aliquot of 100 µL of the
human plasma samples, calibration standards, or quality control samples are mixed
with 100 µL of ammonium acetate buffer (10 mM, pH 5.0 to support stability)
containing the internal standard sulbactam (10 µg/mL) and precipitated with 400 µL
of acetonitrile.
The precipitated sample, containing the IS, is mixed thoroughly to facilitate
deproteinisation. The precipitate is separated by centrifuging the samples for
5 minutes at 3600 rpm (3280 g) at approximately 4 °C. Raising the water content of
the sample gave more constant and sharper peaks. Therefore, a 50-µL aliquot of the
supernatant is diluted with 250 µL of ammonium acetate buffer (10 mM, pH 5.0) and
after mixing, 10 µL of each sample is injected into the LC-MS/MS system.
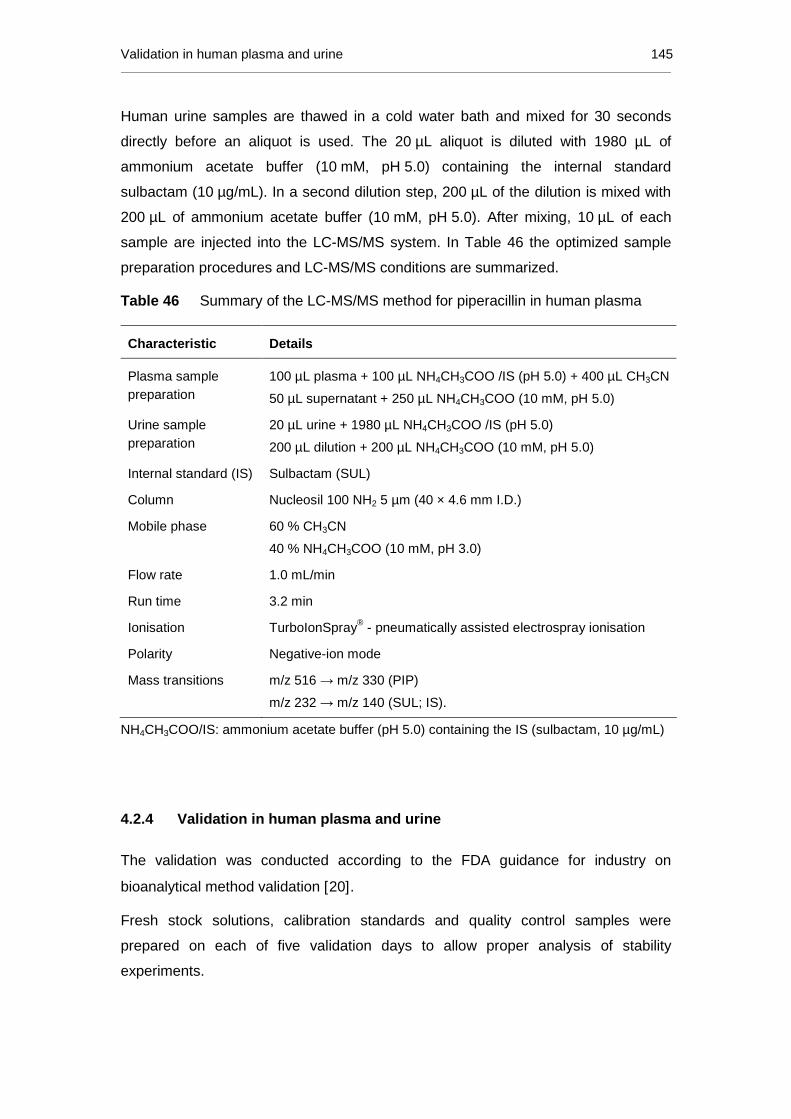
Validation in human plasma and urine 145
Human urine samples are thawed in a cold water bath and mixed for 30 seconds
directly before an aliquot is used. The 20 µL aliquot is diluted with 1980 µL of
ammonium acetate buffer (10 mM, pH 5.0) containing the internal standard
sulbactam (10 µg/mL). In a second dilution step, 200 µL of the dilution is mixed with
200 µL of ammonium acetate buffer (10 mM, pH 5.0). After mixing, 10 µL of each
sample are injected into the LC-MS/MS system. In Table 46 the optimized sample
preparation procedures and LC-MS/MS conditions are summarized.
Table 46 Summary of the LC-MS/MS method for piperacillin in human plasma
Characteristic Details
Plasma sample preparation
100 µL plasma + 100 µL NH4CH3COO /IS (pH 5.0) + 400 µL CH3CN
50 µL supernatant + 250 µL NH4CH3COO (10 mM, pH 5.0)
Urine sample preparation
20 µL urine + 1980 µL NH4CH3COO /IS (pH 5.0)
200 µL dilution + 200 µL NH4CH3COO (10 mM, pH 5.0)
Internal standard (IS) Sulbactam (SUL)
Column Nucleosil 100 NH2 5 µm (40 × 4.6 mm I.D.)
Mobile phase 60 % CH3CN
40 % NH4CH3COO (10 mM, pH 3.0)
Flow rate 1.0 mL/min
Run time 3.2 min
Ionisation TurboIonSpray® - pneumatically assisted electrospray ionisation
Polarity Negative-ion mode
Mass transitions m/z 516 → m/z 330 (PIP)
m/z 232 → m/z 140 (SUL; IS).
NH4CH3COO/IS: ammonium acetate buffer (pH 5.0) containing the IS (sulbactam, 10 µg/mL)
4.2.4 Validation in human plasma and urine
The validation was conducted according to the FDA guidance for industry on
bioanalytical method validation [20].
Fresh stock solutions, calibration standards and quality control samples were
prepared on each of five validation days to allow proper analysis of stability
experiments.

146 Piperacillin
The selectivity was proven, which can be seen from the analysis of drug-free human
plasma from different individuals (N = 6) and drug-free human urine (N = 6), where
no peaks from matrix components occurred at the retention times of piperacillin and
the IS (sulbactam).
Additionally, no interference with piperacillin was observed in the plasma from six
individuals and in the urine from six individuals. All test samples in human plasma
with the high piperacillin concentration (125 µg/mL, N = 18) had an accuracy of
97.3±6.2 % (mean±SD) and a precision of 6.4 %, whereas at the low piperacillin
concentration (0.125 µg/mL, N = 18) an accuracy of 96.2±7.8 % (mean±SD) and a
precision of 8.1 % was achieved. All test samples in human urine with the high
concentration (1250 µg/mL, N = 18) were analyzed with an accuracy of 93.3±5.2 %
(mean±SD) and a precision of 5.5 %, whereas at the low concentration (3.50 µg/mL,
N = 18) an accuracy of 99.0±7.1 % (mean±SD) and a precision of 7.2 % was
measured.
The linear regression of the peak area ratios versus concentrations were fitted over
the concentration range of 0.0500 to 125 µg/mL in human plasma and 1.25 to
1250 µg/mL in human urine. The mean linear regression equations of the calibration
curves (N=5) were determined:
y = 0.0011 (± 0.0004) + 0.1212 (± 0.0261) · x (human plasma)
y = 0.0003 (± 0.0014) + 0.0048 (± 0.0008) · x (human urine).
All correlation coefficients of the weighted (1/x2) calibration curves were ≥ 0.997 for
plasma and ≥ 0.995 for urine. The inter-day precision and accuracy of the back-
calculated calibration standards of piperacillin in human plasma ranged from 2.0 to
7.1 % and from 96.7 to 102.4 %, respectively. The inter-day precision and accuracy
obtained at the plasma LLOQ were 3.0 % and 100.2 %, respectively. The inter-day
precision and accuracy of the back-calculated calibration standards of piperacillin in
human urine ranged from 2.6 to 9.5 % and from 92.6 to 108.0 %, respectively. The
inter-day precision and accuracy obtained at the urine LLOQ were 5.1 % and
101.4 %, respectively. The signal-to-noise ratio of piperacillin at the LLOQs of
0.0500 µg/mL (plasma) and 1.25 µg/mL (urine) was at least five in all five validation
sequences.
Table 47 summarizes the intra- and inter-batch precision and accuracy for
piperacillin in human plasma and in human urine, respectively, evaluated by
assaying the SQC samples. The obtained results are proving the high accuracy and

Validation in human plasma and urine 147
precision of the bioanalytical method, because the obtained data were well within the
acceptance criteria of maximal 20 % deviation at the LLOQ (0.0500 µg/mL) and no
more than 15 % at all other concentrations.
Table 47 Intra- and inter-day precision and accuracy for the analysis of piperacillin
in human plasma and urine (five days, five replicates per day)
Nominal concentrations
[µg/mL]
Matrix Intra-day Precision
[[[[%]]]]
Intra-day Accuracy
[[[[%]]]]
Inter-day Precision
[[[[%]]]]
Inter-day Accuracy
[[[[%]]]]
125 Plasma 1.2 99.6 3.7 99.5
12.5 Plasma 6.9 92.7 7.5 101.0
1.25 Plasma 2.7 92.6 7.4 100.5
0.125 Plasma 6.6 93.2 10.7 99.8
0.0500 Plasma 9.5 96.2 10.1 93.0
1250 Urine 2.4 94.5 5.8 95.0
350 Urine 2.9 102.5 7.0 104.3
3.50 Urine 3.0 103.3 5.9 102.7
3.50 Urine 9.4 106.5 9.1 102.2
1.25 Urine 5.9 107.6 10.5 100.7
The mean absolute extraction recovery of piperacillin in five concentration levels
(0.0500 to 125 µg/mL in plasma and 1.25 to 1250 µg/mL in urine) was determined to
be 86.2±5.2 % (mean±SD) in human plasma and 92.3±3.5 % (mean±SD) in human
urine. The mean absolute extraction recovery of the IS (sulbactam) at the working
concentration was found to be 104.7±0.8 % (mean±SD) in human plasma and at the
working concentration in human urine 99.4±1.6 % (mean±SD). The simple one-step
protein precipitation procedure for plasma samples and the simple urine dilution
procedure showed satisfactory recoveries for piperacillin.
Stability data of piperacillin at concentrations of 0.125 and 125 µg/mL in ammonium
heparin plasma and at concentrations of 3.50 and 1250 µg/mL in human urine is
summarised in Table 48 and Table 49. No evidence of instability during
chromatography, extraction and sample storage processes for piperacillin in human
plasma samples or in human urine samples was observed. Furthermore, piperacillin
and the IS were stable in stock solutions at concentrations of 12.5 mg/mL and 1.00
mg/mL piperacillin in methanol and at 0.100 mg/mL sulbactam in water for at least 6
hours at 4 °C.

148 Piperacillin
Table 48 Stability data of piperacillin in human ammonium heparin plasma
Stability experiment Time Nominal Concentration
[[[[µg/mL ]]]]
Mean Accuracy
[[[[%]]]]
Mean Precision
[[[[%]]]]
Short term stability 2 hours 125 103.8 2.1
(room temperature) 0.125 104.1 7.6
4 hours 125 104.5 1.1
0.125 101.7 7.0
Post-preparative stability 24 hours 125 105.3 1.7
(autosampler, approx. 4 °C) 0.125 103.6 2.5
Post-preparative stability 24 hours 125 106.3 1.3
(approx. -70 °C) 0.125 100.1 9.1
Freeze-thaw stability once 125 103.7 2.8
(approx. -70 °C) 0.125 99.9 7.0
twice 125 105.4 1.2
0.125 99.3 4.2
thrice 125 103.3 1.0
0.125 94.6 3.5
Long-term stability 3 days 125 104.6 3.1
(approx. -20 °C) 0.125 100.0 6.3
1 month 125 92.6 2.2
0.125 104.4 6.0
2.5 months 125 100.1 2.6
0.125 102.7 7.3
Long-term stability 3 days 125 103.5 0.9
(approx. -70 °C) 0.125 97.0 5.8
1 month 125 94.5 2.2
0.125 107.7 9.2
2.5 months 125 104.5 1.3
0.125 104.1 6.8
Piperacillin plasma samples can be pre-diluted by factor 5 up to a concentration of
500 µg/mL. The mean concentration value was within ±15 % of the nominal value
with a mean accuracy of 107.8 % and a precision of 5.3 %. Human urine samples
containing piperacillin can be additionally pre-diluted by a factor of 10. Mean
precision and accuracy over five validation runs were 7.5 % and 105.1 %,
respectively.

Validation in human plasma and urine 149
Table 49 Stability data on piperacillin in human urine
Stability experiment Time Nominal Concentration
[[[[µg/mL ]]]]
Mean Accuracy
[[[[%]]]]
Mean Precision
[[[[%]]]]
Short term stability 2 hours 1250 97.0 2.4
(room temperature) 3.50 105.9 3.2
4 hours 1250 97.7 1.7
3.50 105.1 5.4
Post-preparative stability 24 hours 1250 96.4 5.0
(autosampler, approx. 4 °C) 3.50 102.9 7.0
Post-preparative stability 24 hours 1250 99.1 6.5
(approx. -70 °C) 3.50 103.4 7.1
Freeze-thaw stability once 1250 93.7 2.3
(approx. -70 °C) 3.50 98.2 7.0
twice 1250 92.0 1.4
3.50 95.3 5.7
thrice 1250 93.3 1.6
3.50 98.9 8.4
Long-term stability 2 days 1250 97.5 10.1
(approx. -20 °C) 3.50 103.8 5.6
3 months 1250 92.5 3.4
3.50 97.7 5.1
Long-term stability 2 days 1250 97.4 7.2
(approx. -70 °C) 3.50 102.0 4.0
3 months 1250 93.7 3.8
3.50 99.2 3.8
No influence of haemolysed plasma on the determination of piperacillin was
observed. Mean precision and accuracy (N=5) at 125 µg/mL were 2.3 % and 99.4 %,
respectively, whereas precision and accuracy at 0.125 µg/mL were 5.7 % and
99.3 %, respectively.
In addition, the method was tested towards analytical interference with telavancin, an
anti-infective that is excreted by the same route as piperacillin, since it was intended
to apply the method to a drug-drug-interaction study (see chapter 4.2.6, p. 156). The
data indicates no interference of telavancin with the determination of piperacillin in
human plasma or urine, as no peaks near the piperacillin peak were observed in the
matrix from 5 individuals, spiked with 120 µg/mL telavancin. Mean precision and
accuracy of piperacillin in human plasma containing 125 µg/mL piperacillin and

150 Piperacillin
120 µg/mL telavancin were 1.4 % and 92.0 %, whereas in human plasma containing
0.125 µg/mL piperacillin and 120 µg/mL telavancin mean precision and accuracy
were 9.9 % and 100.4 %, respectively.
In human urine containing 1250 µg/mL piperacillin and 1200 µg/mL telavancin, the
mean precision and accuracy were 12.0 % and 94.3 %, whereas at concentrations of
3.50 µg/mL piperacillin and 1200 µg/mL telavancin in human urine, mean precision
and accuracy were 12.7 % and 96.1 %, respectively.
The analysis of 36 incurred human urine samples (see chapter 2.5.12 for definition)
demonstrated a high precision of the analysis of piperacillin in human urine. The
mean absolute difference between the first and the second measurement was 8.0 %
and 35 of the 36 samples were within the 20-% acceptance range, and succeeding
with a 97% success rate.
4.2.5 Comparison of the LC-MS/MS method with proced ures reported in the
literature
In Table 50 the characteristic parameters of the developed method and of several
previously reported methods for the determination of piperacillin in human plasma
and urine are compared to the present LC-MS/MS method.
All previously reported methods need longer LC run times than this method
(3.2 minutes), most of them between 10 and 35 minutes, reducing the daily sample
number to at least one third compared to this method. Only three previous
publications report run times up to 5 minutes, but were not suitable for the planned
application due to other reasons: expensive and time-consuming sample preparation
techniques (derivatisation, SPE and PPT followed by LLE) combined with lower
sensitivity [59, 234, 239].
The high sensitivity of the developed LC-MS/MS method (LLOQ 0.05 µg/mL plasma)
allows easy sample preparation by plasma protein precipitation and there is no need
of expensive and time-consuming SPE [59, 62, 237-238] and LLE [60, 201, 211,
226, 235-236, 239] techniques, or even derivatisation [234]. All other methods are
characterized by LLOQs between 0.1 and 10 µg/mL, whereas the LC/UV methods
are characterized by less sensitive LLOQs between 0.25 and 10 µg/mL.
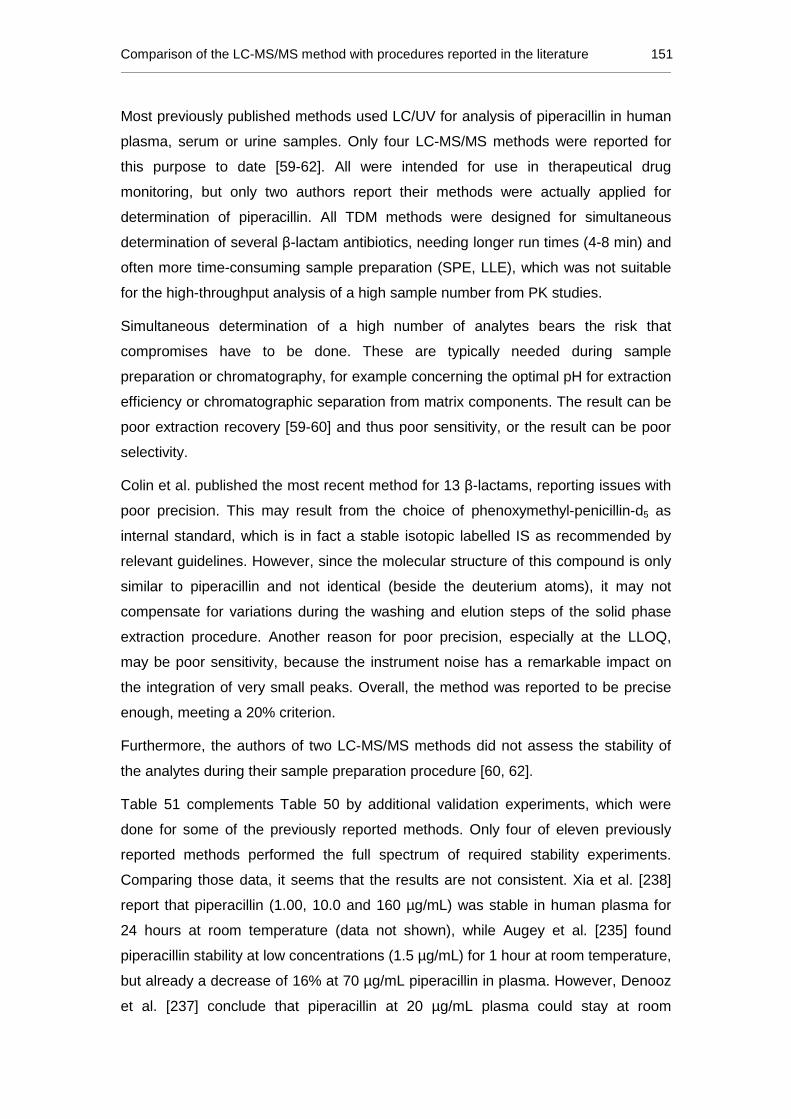
Comparison of the LC-MS/MS method with procedures reported in the literature 151
Most previously published methods used LC/UV for analysis of piperacillin in human
plasma, serum or urine samples. Only four LC-MS/MS methods were reported for
this purpose to date [59-62]. All were intended for use in therapeutical drug
monitoring, but only two authors report their methods were actually applied for
determination of piperacillin. All TDM methods were designed for simultaneous
determination of several β-lactam antibiotics, needing longer run times (4-8 min) and
often more time-consuming sample preparation (SPE, LLE), which was not suitable
for the high-throughput analysis of a high sample number from PK studies.
Simultaneous determination of a high number of analytes bears the risk that
compromises have to be done. These are typically needed during sample
preparation or chromatography, for example concerning the optimal pH for extraction
efficiency or chromatographic separation from matrix components. The result can be
poor extraction recovery [59-60] and thus poor sensitivity, or the result can be poor
selectivity.
Colin et al. published the most recent method for 13 β-lactams, reporting issues with
poor precision. This may result from the choice of phenoxymethyl-penicillin-d5 as
internal standard, which is in fact a stable isotopic labelled IS as recommended by
relevant guidelines. However, since the molecular structure of this compound is only
similar to piperacillin and not identical (beside the deuterium atoms), it may not
compensate for variations during the washing and elution steps of the solid phase
extraction procedure. Another reason for poor precision, especially at the LLOQ,
may be poor sensitivity, because the instrument noise has a remarkable impact on
the integration of very small peaks. Overall, the method was reported to be precise
enough, meeting a 20% criterion.
Furthermore, the authors of two LC-MS/MS methods did not assess the stability of
the analytes during their sample preparation procedure [60, 62].
Table 51 complements Table 50 by additional validation experiments, which were
done for some of the previously reported methods. Only four of eleven previously
reported methods performed the full spectrum of required stability experiments.
Comparing those data, it seems that the results are not consistent. Xia et al. [238]
report that piperacillin (1.00, 10.0 and 160 µg/mL) was stable in human plasma for
24 hours at room temperature (data not shown), while Augey et al. [235] found
piperacillin stability at low concentrations (1.5 µg/mL) for 1 hour at room temperature,
but already a decrease of 16% at 70 µg/mL piperacillin in plasma. However, Denooz
et al. [237] conclude that piperacillin at 20 µg/mL plasma could stay at room

152 Piperacillin
temperature for not more than 6 hours, which is in good agreement with the data by
Arzuaga et al. [241] as well as the stability data in Table 48 (plasma data) and Table
49 (urine data). The current data provide evidence that piperacillin is stable in urine
at room temperature for at least 4 hours, while Augey et al. even confirmed stability
in urine after 8 days at room temperature. The latter data is probably less meaningful
for laboratory work, but interesting for theory, since piperacillin seems to be more
stable in urine than in plasma. One reason could be that urine does not contain large
molecules like β-lactamases. The second reason is that piperacillin rapidly degrades
below pH 3 and is most stable at pH 5, while the pH of urine typically ranges
between 4.8 and 7.5 [1, 9]. However, during bacterial decomposition of urine
ammonia is produced, shifting the pH more into the alkaline region. Since at pH 8-9
cleavage of the piperazinyl ring [230] and the β-lactam ring occurs, piperacillin may
not be stable indefinitely in urine, even if kept as abacterially as possible.
The present LC-MS/MS method is one of the first methods which is confirmed by the
re-analysis of incurred samples.
Additionally, two previous methods were developed for determining piperacillin in
human serum [62, 240], which is not very common, because the stability of
β-lactams can be better ensured by plasma production directly after blood collection
in a cooled centrifuge rather than keeping the serum tube for 15 to 20 minutes at
room temperature until clotting is completed.

Comparison of the LC-MS/MS method with procedures reported in the literature 153
Table 50 Comparison of bioanalytical methods for piperacillin in human plasma, serum and urine; grouped by analytical technique and
descending years of publication
Method Matrix Linearity range
[[[[µg/mL ]]]]
Approx run time
[[[[min ]]]]
Inter-day Prec / Acc
at LLOQ [[[[%]]]]
Inter-day Prec / Acc
of QC samples [[[[%]]]]
Recovery [[[[%]]]]
Corr. Coeff.
Sample Vol. [µL]
Sample preparation
Internal standard
Additional validation
experiments
Application
P 0.050-125 3.2 3.0 / 100.2 3.7 to 10.7 / 93.0 to 101.0
86.2±5.2 (PIP) 104.7±0.8 (IS)
≥ 0.997 100 PPT sulbactam 1, 2, 3a-e, 4, 5, 7
LC-MS/MS (current method)
U 1.25-1250 3.2 5.1 / 101.4 5.8 to 10.5 / 95.0 to 104.3
92.3±3.5 (PIP) 99.4±1.6 (IS)
≥ 0.995 20 DIL sulbactam 1, 2, 3a-e, 5, 8
sd-PK [204] (4.5g PIP/TAZ)
LC-MS/MS [59] Colin 2013 P 0.32-38.06 4 n.r.
4.9 to 15.5 / n.r.
67.4±3.5 n.r. n.r. SPE Phenoxymethyl-penicillin-d5
1,2,3c,e,6 TDM
(no PIP samples)
LC-MS/MS [60] Carlier 2012 P 1.5 - 100 5.5 12.8 / 98.5
3.1 to 12.8 / 94.3 to 98.5
67.2±9.7 n.r. 20 PPT + LLE Piperacillin-d5 1,2,6 TDM
(no PIP samples)
LC-MS/MS [61] Cohen-Wolkowiez 2011
P 0.300-150 6 6.4 / 107.9 5.7 to 8.2 /
99.5 to 107.9 97.6 0.9984 50 PPT dicloxacillin 1, 3a-d, 5, 6
TDM (36 samples)
LC-MS/MS [62] Ohmori 2011
S 0.1-50 8 6.3 / 101.2 6.3 to 7.8 /
98.7 to 109.3 90.5 to 98.4 1.00 50 SPE ethylparaben 6, 7
TDM (14 samples PIP)
LC/UV [201] McWhinney 2010
P 10-1000 30 3.2 / n.r. 2.3 to 3.2 /
97.0 to 100.0 n.r. 0.9999 200 PPT + LLE oxacillin 1, 3b,c, 8
TDM (data n.r.) (400 samples)
LC/UV [236] Di Giovamberardino 2009
P 0.49-500 11 9.4 / n.r. 6.9 to 9.4 / n.r. 100.4 to 103.0 > 0.999 100 PPT + LLE n.r. 1 n.r.
LC/UV [237] Denooz 2008
P 2.5-60 30 n.r. / n.r. 3.3 to 5.6 / 98.3 to 100.0
78.3 to 81.1 (5.0-30µg/mL)
≥ 0.994 500 SPE ceforanid 3a-e, 6 TDM
(4 patients PIP)
LC/UV [238] Xia 2007
P 0.25-320 10 n.r. / n.r. 3.5 to 6.3 /
97.0 to 106.6 § 80.8 to 83.3
(1.0-100µg/mL) 0.995 800 SPE benzylpenicillin 1, 3a-e
sd-PK (PIP/TAZ) 1.25g, 2.5g, 3.75g
Continued on the next page

154 Piperacillin
Table 50 (continued) Comparison of bioanalytical methods for piperacillin in human plasma, serum and urine; grouped by analytical
technique and descending years of publication
Method Matrix Linearity range
[[[[µg/mL ]]]]
Approx run time
[[[[min ]]]]
Inter-day Prec / Acc
at LLOQ [[[[%]]]]
Inter-day Prec / Acc
of QC samples [[[[%]]]]
Recovery [[[[%]]]]
Corr. Coeff.
Sample Vol. [µL]
Sample preparation
Internal standard
Additional validation
experiments
Application
P 14 n.r. / n.r. ≤11 / 83 to 119 n.r. n.r. 300 PPT + LLE cefoxitin n.r. LC/UV [226] Ghibellini 2006
U
1-200 (dynamic
range) 14 n.r. / n.r. ≤11 / 83 to 119 n.r. n.r. n.r. DIL cefoxitin n.r.
sd-PK (2g PIP) (fat, also in bile)
LC/UV [241] Arzuaga 2005
P 2-500 20 4.9 / 105.6 1.9 to 5.9 /
101.5 to 105.6 n.r. >0.999 100 PPT penicillin G 1, 3a-e
md-PK [250] (4.5g PIP/TAZ)
LC/UV [240] Trittler 2002
S 1-16 35 2.6 / 102.6 n.r. / n.r. n.r. >0.999 n.r. DIL + Filtr none 2,7 n.r.
P 0.4-100 5 n.r. / n.r. 4.2; 4.6 / 104; 102 98.2 and 96.9 ≥ 0.998 400 DEV n.r. n.r. n.r. LC/UV [234] García-Gonzalez 1998 U 4-500 5 n.r. / n.r. 5.2; 6.9 / 99; 102 102 and 95.3 ≥ 0.998 n.r. DEV n.r. n.r. n.r.
P 0.50-200 >15 n.r. 0.38 to 3.16 / n.r. n.r. n.r. 200 PPT + LLE benzylpenicillin n.r. LC/UV [211] Occhipinti 1997
U 50-10000 >15 n.r. 2.76 to 2.94 / n.r. n.r. n.r. 40 DIL benzylpenicillin n.r.
md-PK (PIP/TAZ) (3.375g / 4.5g)
P 1.0-100 16 13.7 / 98.5 7.6 to 10.7 /
101.3 to 116.7 90.0±8.8 (PIP) 90.4± 7.1 (IS)
≥ 0.993 500 PPT + LLE benzylpenicillin 1,3a-d LC/UV [235] Augey 1996
U 1.0-100 16 14.7 / 102.0 3.5 to 17.7 / 97.7 to 103.3
83.5±8.2 ≥ 0.993 50 Online SPE none 1,3a-d
TDM (data n.r.)
LC/UV [239] Gautier 1991
P 10-100 50-500
5 n.r. / n.r. 1.6 to 5.7 /
96.2 to 102.0 77.5±1.6
(50µg/mL) 0.997 0.993
100 PPT + LLE cephalothin 1, 3a-c,e sd-PK (4g PIP)
(data n.r.)
P: Plasma, U: Urine, S: Serum, Prec: Precision, Acc: Accuracy, SD: standard deviation, LLOQ: lower limit of quanification, PPT: protein precipitation, DIL: Dilution, SPE: solid phase extraction, LLE: liquid-liquid extraction, DEV: Derivatisation, n.r.: not reported, TDM: therapeutical drug monitoring; s.d.: single dose, m.d.: multiple dose, 1: Specificity, 2: Selectivity, 3: Stability (a) short-term, (b) long-term, (c) post-preparative, (d) freeze-thaw, (e) stock solution, 4: hemolyzed plasma, 5: Dilution, 6: Matrix Effect, 7: Signal-to-noise, 8: Incurred Samples
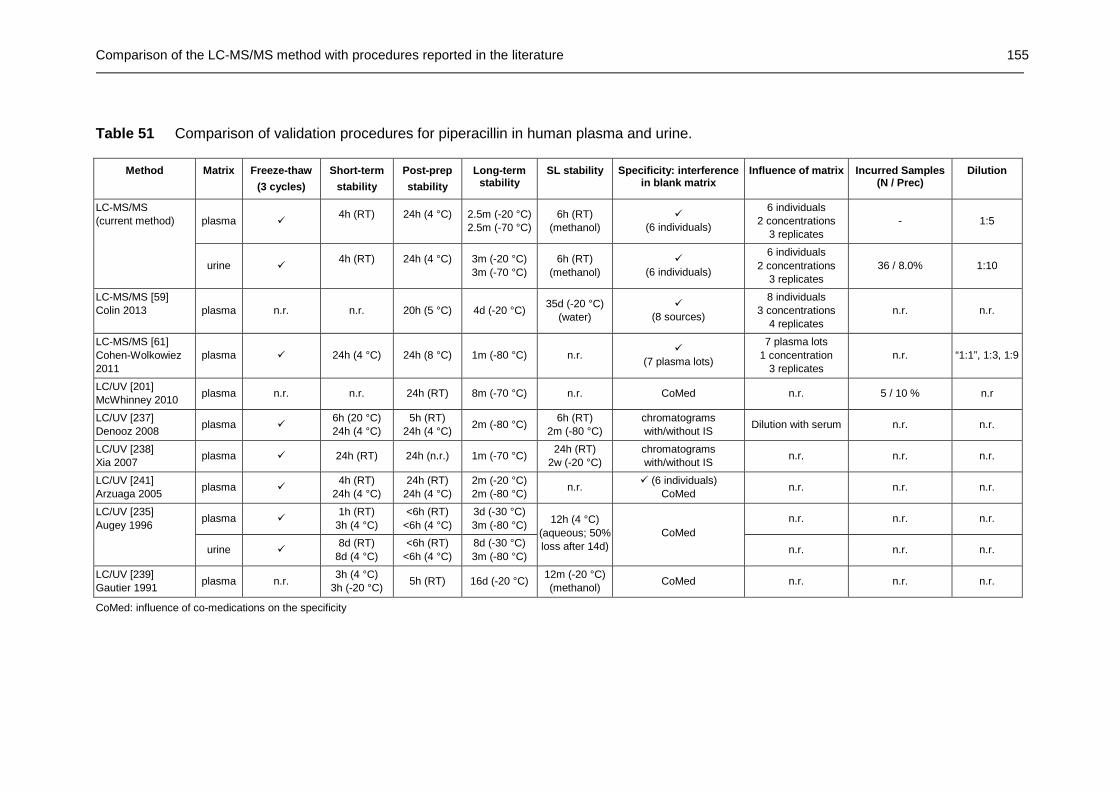
Comparison of the LC-MS/MS method with procedures reported in the literature 155
Table 51 Comparison of validation procedures for piperacillin in human plasma and urine.
Method Matrix Freeze-thaw
(3 cycles)
Short-term
stability
Post-prep
stability
Long-term stability
SL stability Specificity: interference in blank matrix
Influence of matrix Incurred Samples (N / Prec)
Dilution
plasma � 4h (RT)
24h (4 °C)
2.5m (-20 °C) 2.5m (-70 °C)
6h (RT) (methanol)
� (6 individuals)
6 individuals 2 concentrations
3 replicates - 1:5
LC-MS/MS (current method)
urine � 4h (RT)
24h (4 °C)
3m (-20 °C) 3m (-70 °C)
6h (RT) (methanol)
� (6 individuals)
6 individuals 2 concentrations
3 replicates 36 / 8.0% 1:10
LC-MS/MS [59] Colin 2013 plasma n.r. n.r. 20h (5 °C) 4d (-20 °C)
35d (-20 °C) (water)
� (8 sources)
8 individuals 3 concentrations
4 replicates n.r. n.r.
LC-MS/MS [61] Cohen-Wolkowiez 2011
plasma � 24h (4 °C) 24h (8 °C) 1m (-80 °C) n.r. �
(7 plasma lots)
7 plasma lots 1 concentration
3 replicates n.r. “1:1”, 1:3, 1:9
LC/UV [201] McWhinney 2010
plasma n.r. n.r. 24h (RT) 8m (-70 °C) n.r. CoMed n.r. 5 / 10 % n.r
LC/UV [237] Denooz 2008
plasma � 6h (20 °C) 24h (4 °C)
5h (RT) 24h (4 °C)
2m (-80 °C) 6h (RT)
2m (-80 °C) chromatograms with/without IS
Dilution with serum n.r. n.r.
LC/UV [238] Xia 2007
plasma � 24h (RT) 24h (n.r.) 1m (-70 °C) 24h (RT)
2w (-20 °C) chromatograms with/without IS
n.r. n.r. n.r.
LC/UV [241] Arzuaga 2005
plasma � 4h (RT)
24h (4 °C) 24h (RT)
24h (4 °C) 2m (-20 °C) 2m (-80 °C)
n.r. � (6 individuals)
CoMed n.r. n.r. n.r.
plasma � 1h (RT)
3h (4 °C) <6h (RT)
<6h (4 °C) 3d (-30 °C) 3m (-80 °C)
n.r. n.r. n.r. LC/UV [235] Augey 1996
urine � 8d (RT)
8d (4 °C) <6h (RT)
<6h (4 °C) 8d (-30 °C) 3m (-80 °C)
12h (4 °C) (aqueous; 50% loss after 14d)
CoMed
n.r. n.r. n.r.
LC/UV [239] Gautier 1991
plasma n.r. 3h (4 °C)
3h (-20 °C) 5h (RT) 16d (-20 °C)
12m (-20 °C) (methanol)
CoMed n.r. n.r. n.r.
CoMed: influence of co-medications on the specificity

156 Piperacillin
4.2.6 Application to a drug-drug interaction study of intravenous
piperacillin/tazobactam with telavancin
4.2.6.1 Study design and sample handling
The present method was used to analyze piperacillin concentrations in human
plasma and urine of a drug-drug interaction study of piperacillin/tazobactam with
telavancin. A single intravenous dose of 4.5 g piperacillin/tazobactam was infused
during 30 minutes to twelve healthy male and female volunteers in the fasting state.
In three study periods, the pharmacokinetics of piperacillin/tazobactam alone, of a
48-h infusion of 10 mg/kg telavancin alone, and of a combination of both treatments
was studied. Here, the piperacillin part will be described, as the concentrations were
determined by the developed and validated LC-MS/MS method.
Blood samples were drawn immediately before administration and at 0.5, 0.58, 0.67,
0.75, 0.83, 1.0, 1.25, 1.5, 2.0, 2.5, 3.5, 4.5, 6.5, 8.5, 12.5, and 24.5 hours after the
intravenous administration of piperacillin/tazobactam.
Urine collection was performed 30 minutes before the start of infusion, 0 to 7 hours,
7 to 12 hours, 12 to 24 hours and 24 to 48 hours after administration of the
piperacillin/tazobactam treatment.
The ammonium heparinate monovettes were cooled in an ice-water bath until
plasma production. The blood samples are centrifuged for 10 minutes at 2-8 °C and
3000 rpm. The plasma is subsequently transferred into polypropylene tubes and
immediately frozen at approximately -70 °C until analysis.
4.2.6.2 Chemical and pharmaceutical properties of telavancin
Telavancin is a lipoglycopeptide, derived semisynthetically from the glycopeptide
vancomycin. It was approved by the FDA in 2009 and by the EMA in 2011. Since
2012, the EMA suspended the use of Telavancin in the European Union due to a
withdrawal of the GMP authorization of the manufacturing site following an
inspection by MHRA, AFSSAPS and FDA. This suspension can only be lifted if the
Marketing Authorization Holder (MAH) provides evidence that there is an authorized
manufacturing site. Since then, in 2013, the MAH changed twice and the FDA
expanded the approved use, which was originally to treat complicated skin and skin
structure infections (cSSSI), and is now to treat also patients with hospital acquired
bacterial pneumonia caused by Staphylococcus aureus.

Application to a drug-drug interaction study of intravenous piperacillin/tazobactam with telavancin 157
Scheme 20 Chemical structure of telavancin
NH
HN
O
O
OH
NH
OHN
CH3
CH3O
HN
O
NH2
NH
O
HO
NH
HN
ONH
O
HO
O
O
OHHO
O
OH
H
H
HN P
OHOH
O
Cl
Cl
O
OOH
OH
OH
OH
CH3
CH3
O
CH3
Formula Mol. weight Exact mass pK a logP
C80H106Cl2N11O27P 3547.7 g/mol 3543.3 amu 1.6-10.0* 2.3*
*predicted value from DrugBank [251]
Telavancin acts bactericidal against a wide range of Gram-positive bacteria, like the
anaerobe Clostridium, Lactobacillus, and Corynebacterium species, but also
penicillin-resistant pneumococci, methicillin-resistant S. aureus (MRSA) and
vancomycin-resistant S. aureus [252-254]. Today, both nosocomial and community-
acquired MRSA strains have been isolated. Nosocomial MRSA can cause
pneumonia after ventilatory assistance and is associated with increased mortality
among hospitalised patients. Community-acquired MRSA is most commonly related
to skin and soft tissue infections and toxic shock syndrome by S. aureus toxins [252].
Therefore, telavancin is reserved for severe infections, like nosocomial pneumonia
caused by MRSA and when other anti-infectives are not suitable.
The rapid bactericidal effect of telavancin against MRSA derives from two
mechanisms. At first, telavancin, like vancomycin, inhibits the cell wall synthesis by

158 Piperacillin
binding to the D-alanyl-D-alanine terminus of peptidoglycan precursors [1, 252, 255].
The second mechanism is attributed to the decylaminoethyl side chain, which is
supposed to anchor in the bacterial cell wall resulting in increased membrane
permeability and leakage of intracellular ATP and K+ [252, 255]. This second
mechanism explains why telavancin is active against S. aureus already resistant
against vancomycin.
Telavancin, like other lipoglycopeptides, is poorly absorbed after oral administration,
which can be assigned to its molecular size limiting the intestinal permeability. The
peak plasma concentrations after infusing a 10 mg/kg dose of telavancin range
between 91.9 to 95.7 µg/mL [204]. Telavancin is highly bound to plasma proteins
(94-96 % [256]) and distributes well into body tissues, including skin blister fluid [257]
and epithelial lining fluid [258] proving high enough concentrations at the site of
infection.
The pharmacokinetics of telavancin appears to be linear in healthy volunteers
between 0.25 and 15 mg/kg [259]. The half-live of 6.1 to 7.9 hours in healthy
subjects allows once-daily dosing [204, 260].
Telavancin is mostly excreted unchanged via renal elimination [204, 259], whereas
renal clearance accounts for approximately 50 % of the total clearance (CLR was
7 mL/h/kg after a 10 mg/kg dose [204]). This makes telavancin a potential candidate
for drug-drug interaction with piperacillin.
4.2.6.3 Determination of piperacillin concentrations in plasma and urine
A total of 408 human plasma samples and 120 human urine samples were analyzed
for piperacillin together with injection standards, calibration standards (low to high
concentrations) and SQC samples (in randomized order among subject samples).
Human plasma samples were analyzed in a total of six sequences, each completed
within eight hours, whereas human urine samples were measured in two sequences
within five hours, each. The coefficient of correlation of resulting linear regressions
was at least 0.995 for both matrices and the determined concentrations of SQC
samples were compared to the theoretical concentrations for accuracy. The
precision and accuracy of the SQC samples of piperacillin in human plasma
analysed together with the study samples ranged from 3.8 to 6.1 % and from 92.0 to
103.4 %, respectively. Precision and accuracy of the SQC samples in human urine

Application to a drug-drug interaction study of intravenous piperacillin/tazobactam with telavancin 159
ranged from 4.7 to 8.2 % and from 89.1 to 106.7 %, respectively. These support the
high precision of the study sample concentration data.
Representative MRM-chromatograms for piperacillin (top) and sulbactam (IS,
bottom) in human plasma are depicted in Figure 34
(A) blank plasma sample;
(B) blank plasma sample spiked with piperacillin (at LLOQ = 0.0487 µg/mL);
(C) plasma sample from a volunteer 12 h after the administration of piperacillin
(piperacillin concentration= 0.0995 µg/mL) and
(D) plasma sample from a volunteer 10 min after the administration of piperacillin
(piperacillin concentration= 96.6 µg/mL).
Figure 34 Representative MRM-chromatograms of piperacillin in human plasma
PIP(TAV)-INT-866P-2005 PIP(TAV)-INT-866P-2005PIP(TAV)-INT-866P-2005
A B C D
PIP(TAV)-INT-866P-2005
Representative MRM-chromatograms for piperacillin (top) and sulbactam (IS,
bottom) in human urine are plotted in Figure 35
(A) blank urine sample;
(B) blank urine sample spiked with piperacillin (at LLOQ = 1.25 µg/mL);
(C) urine sample from a volunteer 12-24 h after the administration of piperacillin (PIP
concentration= 2.69 µg/mL) and
(D) urine sample from a volunteer 7-12 h after the administration of piperacillin (PIP
concentration= 523.9 µg/mL).

160 Piperacillin
Figure 35 Representative MRM-chromatograms of piperacillin in human urine
PIP(TAV)-INT-881U-2005
A B C D
PIP(TAV)-INT-881U-2005
The lowest analyzed piperacillin concentration in human urine of all samples was
1.341 µg/mL (the 24 samples collected before drug administration and 20 samples
collected after drug administration were below the lower limit of quantification). The
highest piperacillin concentration of all urine samples was 4339.8 µg/mL. Samples
with concentrations above the upper quantification limit were pre-diluted (1:10) with
drug-free human urine.
4.2.6.4 Pharmacokinetic results
Here, only the pharmacokinetic data of piperacillin will be described, because the
developed and validated LC-MS/MS method was applied to determine the
piperacillin concentrations of this study.
Figure 36 shows the mean plasma concentration profile of piperacillin after a 30-
minute infusion of 4 g piperacillin and 0.5 g tazobactam to 12 healthy volunteers. The
mean peak concentration of 236.9±46.8 µg/mL (mean±SD) for piperacillin was
attained at the end of the 30-minutes infusion and the elimination half-life (t1/2) was
determined to be 1.2±0.2 hours. The mean total area under the curve (AUC0→∞) was
determined as 278.2±74.4 µg·h/mL (mean±SD), of which only 0.07% had to be
extrapolated.

Application to a drug-drug interaction study of intravenous piperacillin/tazobactam with telavancin 161
Figure 36 Plasma profile (mean±SD) of piperacillin concentrations versus time
following a 4 g intravenous dose of piperacillin to healthy volunteers (n = 12)
0.01
0.10
1.00
10.00
100.00
0 2 4 6 8 10 12 14
Con
cent
ratio
n (µ
g/m
L)
Time after administration (hours)
Piperacillin
LLOQ
In Table 52 the pharmacokinetic data of piperacillin are compared to literature data.
It has been shown that tazobactam has no influence on piperacillin pharmacokinetics
[206, 217, 261]. Therefore, the pharmacokinetic data of piperacillin alone and of
piperacillin in combination with tazobactam are presented side by side. As
piperacillin pharmacokinetics are suspected to follow a non-linear behaviour [220] at
higher doses, only data from 4-g piperacillin studies are compared to each other.
When piperacillin/tazobactam was given together with 10 mg/kg telavancin, Cmax and
t1/2 remained the same, whereas total AUC increased slightly. At the same time the
total CL dropped slightly, which is in good agreement with the observed change in
AUC. Since t1/2 remained the same and the total CL decreased slightly, one could
conclude that the volume of distribution of piperacillin increased slightly in the
presence of telavancin. This could also be explained by the protein binding
behaviour of the two drugs: Telavancin seems to have a higher affinity to plasma
proteins (PPB 95-96 % [256]) than piperacillin (PPB 20-30 % [216]) and may
probably replace piperacillin from part of its binding sites. A higher free fraction of
piperacillin would also lead to an increased renal clearance of piperacillin, which was
indeed observed in this study. Obviously, the renal elimination pathway was not yet
saturated at these dose levels. Finally, the decrease of the total clearance and the
increase of the renal clearance at the same time, can only be explained, if the
hepatic clearance of piperacillin was further decreased by telavancin. However,

162 Piperacillin
these variations are not considered to be clinical relevant at these dose levels. More
details on the study and pharmacokinetic data on tazobactam and telavancin are
published elsewhere [204].
When piperacillin was given as a bolus infusion (lower part of Table 52), mean
maximal plasma concentrations were approximately 30% higher than when given as
a 30-min infusion.
Additionally, three data sets were added, which include pharmacokinetic data from
patients, whose creatinine clearance was categorized as normal (given beyond the
table). Comparison of data from patients versus healthy volunteers shows an
elevation of AUC values and concomitant decrease of clearances in patients, which
is expected as piperacillin is eliminated predominantly renally. However, two data
sets are conspicuous as the AUC values of the healthy subjects and patients with
normal renal clearance of approx. 120 mL/min [217, 249] exceed even the AUCs of
the elderly patients (CLR approx. 74 mL/min and 84 mL/min [205, 207]) while renal
clearance is unexpected low. The current data fits logically well into the data of other
previously reported pharmacokinetic data in healthy subjects and patients.
4.2.7 Summary: Piperacillin
To the best knowledge, this is the first fully validated LC-MS/MS method for high-
throughput analysis of piperacillin in human plasma and urine. The developed and
validated LC-MS/MS assay for piperacillin in human plasma and urine is simple, fast,
reliable, sensitive, precise and accurate. The method employs acetonitrile protein
precipitation, which allows quantification of piperacillin for concentrations between
0.0500 and 125.0 µg/mL from 100 µL of human plasma, and concentrations between
1.25 and 1250 µg/mL from 20 µL of urine. The principal advantage of the LC-MS/MS
method described here is the high sensitivity (LLOQ = 0.0500 µg/mL plasma and
1.25 µg/mL urine), high precision at the LLOQ in plasma and urine (3.0 and 5.1 %)
and high accuracy in plasma and urine (100.2 and 101.4 %) with a short run time of
only 3.2 minutes. These characteristics make the method suitable for the precise and
accurate measurement of piperacillin in high sample numbers of plasma and urine
from pharmacokinetic studies. Indeed, the method was successfully applied to the
analysis of more than 500 samples from a pharmacokinetic study of 4 g piperacillin
and 0.5 g tazobactam as a single intravenous dose in healthy volunteers.

Summary: Piperacillin 163
Table 52 Pharmacokinetic parameters (mean±SD or mean (CV)) for piperacillin of a single intravenous dose of 4 g piperacillin (PIP) and
0.5 g tazobactam (TAZ) to healthy volunteers or patients with normal renal function (upper part: 30-min infusion; lower part: bolus infusion)
Reference No. and gender of subjects
Dosage (Infusion Time)
t last
[[[[h]]]] Cmax
[[[[µg/mL ]]]] AUC0→→→→last
[[[[µg·h/mL ]]]] AUC0→→→→∞∞∞∞
[[[[µg·h/mL ]]]] t1/2
[[[[h]]]] CL tot
[mL/min] CLrenal
[mL/min] Analytical method
Current study [204] 12 m,f (healthy)
4g PIP, 0.5 g TAZ (30 min) 24 236.9±46.8 278.0±74.4 278.2±74.4 1.2±0.2 291.2±9 2.1 153.0±69.8 LC-MS/MS
(plasma, urine)
Current study [204] 12 m,f (healthy)
4g PIP, 0.5 g TAZ and 10mg/kg TLV 24 235.3±49.7 289.0±51.9 289.3±51.9 1.1±0.2 237.8±4 5.5 167.8±58.6 LC-MS/MS
(plasma, urine)
Cheung 1989 [203] 6 (healthy) 4g PIP, 0.5 g TAZ (30 min)
n.r. 277 (14) n.r. 278 (9) 0.83 (14) 242 (8) 109 (22) n.r.
Cheung 1989 [203] 6 (healthy) 4g PIP (30 min) n.r. 284 (15) n.r. 286 (18) 0.87 (9) 240 (17) 116 (15) n.r.
Wise 1991 [217] 6 m (healthy)
4g PIP, 0.5 g TAZ (30 min) 10 223.7±49.7 n.r. 485±82.1 1.0±0.15 145±22.7 73.1±6.5
mg/min$ Microbiol.
(serum, urine)
Kinzig 1992 [205] 18 m,f (surgery patients*1)
4g PIP, 0.5 g TAZ (30 min) 6 259±81.8 n.r. 361±80.3 1.27±0.24 194±42.9 n.r.
LC/UV
(plasma, tissue)
Bourget 1996 [249] 10 m,f (burn patients*2)
4g PIP, 0.5 g TAZ (30 min)
6 322.2±39.0 n.r. 640.3±122.9 1.8±0.3 140.5±22.8 75 .9±16.2 Microbiol. (serum, urine)
Sörgel 1994 [206] 6
(healthy)
4g PIP, 0.5 g TAZ
(5 min) n.r. 380 (27) n.r. 294 (11) 1.14 (20) 229 (8) 125 (16) n.r.
Welling 1983 [207] 5 m
(patients*3)
4g PIP
(2 min) 12 329 n.r. 384±72 1.4±0.4 153±25 95±8
Microbiol.
(serum, urine)
Schepper 1982 [208]
5 m
(healthy)
4g PIP
(3 min) 8 330.7±68 n.r. 250.3±12.5 1.02±0.05 258.4±6.2 213.8±19.6
Microbiol.
(serum, urine)
Tjandramaga 1978 [221]
5 m
(healthy)
4g PIP
(3 min) 6 330.7±67.8 n.r. 250.3±12.5 1.02±0.05 254.2±19.3 203.7±19.5
Microbiol.
(serum, urine)
n.r.: not reported, m: male, f: female, *1: creatinine clearance 72.4±21.3 mL/min (mean±SD), *2: creatinine clearance 119.8 mL/min (82-186 mL/min), *3: creatinine clearance; 84 mL/min (71-111), $ cumulative renal excretion divided by extrapolated AUC, TLV: telavancin, coadministered at a dose of 10 mg/kg

164 Summary: β-Lactams
4.3 Summary: β-Lactams
The β-lactams are clearly assigned to the PK/PD parameter T>MIC, wherefore
piperacillin efficacy can be improved by dosing more frequently or continuously [11].
In Figure 37, the determined plasma concentrations of the broad-spectrum penicillin
piperacillin is related to several MIC90 values of gram-negative aerobe bacteria
(E. coli, P. aeruginosa, Klebsiella pneumoniae [262]) and anaerobes (B. fragilis,
Clostridium spp. [263]), as well as the gram-positive Methicillin-susceptible S. aureus
[264]. It seems that anaerobe bacteria could be more susceptible to
piperacillin/tazobactam than aerobe bacteria. However, more data need to be
studied to examine this thesis. For example, for the given dose of
piperacillin/tazobactam, it would be necessary to give the next dose after 6 hours to
keep the piperacillin levels above MIC90 of B. fragilis as long as possible to achieve
an efficient therapy. However, other antimicrobials may be more efficient against this
bacterium.
Figure 37 Plasma concentration-time profile of a 30 min intravenous dose of
4 g piperacillin and 0.5 g tazobactam in relation to MIC90 data of aerobe, facultative
anaerobe and anaerobe gram-negative (empty line) or gram-positive (dotted line)
bacteria
0.01
0.10
1.00
10.00
100.00
0 2 4 6 8 10 12 14
Con
cent
ratio
n (µ
g/m
L)
Time after administration (hours)
Piperacillin plasma profileMIC90 Pseudomonas aeruginosaMIC90 Escherichia coliMIC90 Klebsiella pneumoniaeMIC90 Clostridium spp.MIC90 Bacteroides fragilisMIC90 Methicillin-susceptible S. aureus

Summary: Piperacillin 165
Though the MIC90 of P. aeruginosa is higher compared to other miroorganisms,
piperacillin/tazobactam is the most active antimicrobial (>86 % susceptibility in
Asia/Pacific Rim, Europe, and North and South America).
In Figure 38, flucloxacillin concentrations after a 250-mg dose remain above MIC90 of
Staphylococcus aureus [265] for approximately 5 hours. The concentration data
obtained by the present bioanalytical method are total plasma concentrations since
flucloxacillin is released from the reversible protein-interaction during protein-
precipitation with acetonitrile. Therefore, the free fraction of flucloxacillin was
calculated by assuming 95 % plasma protein binding of flucloxacillin. Apparently, the
curve of the free fraction never reaches effective concentrations. Therefore, higher
flucloxacillin doses may be recommended in severe infections. However, for efficacy
of a given drug, the concentration at the site of infection, i. e. respiratory tract, skin,
soft tissues, bone, is more important than plasma concentrations. To maximise
efficacy of the narrow spectrum isoxazolyl-penicillin flucloxacillin, it has been shown
that continuous infusion of 8-12g flucloxacillin per day was more effective against
MSSA than standard dosing [266].
Figure 38 Plasma concentration-time profile of a 250-g tablet of flucloxacillin in
relation to the MIC90 value of S. aureus
0.001
0.01
0.1
1
10
100
0 1 2 3 4 5 6 7 8 9 10 11 12 13 14 15 16
Con
cent
ratio
n (µ
g/m
L)
Time after administration (h)
Flucloxacillin (250 mg)Free fraction (95% PPB)MIC90 Staphylococcus aureus
analyzed
calculated

166 Moxifloxacin
5 FLUOROQUINOLONES
5.1 Moxifloxacin
5.1.1 Chemical and pharmaceutical properties
Moxifloxacin belongs to the fluoroquinolone class of antibacterials with a broad
antimicrobial spectrum against Gram-positive and Gram-negative pathogens
including multi-drug resistant strains. Originally, it was developed for respiratory tract
infections including community acquired pneumonia, acute bacterial sinusitis, and
acute bacterial exacerbation of chronic bronchitis [267], but over the years
moxifloxacin received approval for additional indications, like uncomplicated and
complicated skin and skin-structure infections, complicated intra-abdominal
infections, and ocular infections like bacterial conjunctivitis [268-272]. Still, further
applications are being studied, for example the use in bone diseases like
osteomyelitis [273-274]. It is the most recent quinolones playing a major role in
antibiotic therapy.
The bactericidal activity of moxifloxacin derives from the inhibition of the bacterial
DNA conformation process by interacting with DNA gyrase (primarily in gram-
negative bacteria) and with topoisomerase IV in important gram-positive bacteria.
The interaction takes place by stabilizing the DNA-enzyme cleavage complex with
Mg2+ and two moxifloxacin molecules [275-276].
Figure 39 Moxifloxacin-topoisomerase IV cleavage complex, reprinted with
permission from Macmillan Publishers Ltd: Nature structural & molecular biology
[275], copyright 2009
The moxifloxacin-topoisomerase IV cleavage complex is depicted in Figure 39. The
front view of the active site is shown on the left side, including moxifloxacin (red), the

Chemical and pharmaceutical properties 167
active site tyrosines (orange), the DNA G-segment (green) and the residues
responsible for resistance upon mutation (yellow). The Mg2+, which should be
located between the two moxifloxacin molecules, is not shown. The right part of
Figure 39 contains the top view of the cleaved bacterial DNA intercalated with the
moxifloxacin molecules.
Moxifloxacin is known to have an effect on cardiac repolarisation, which can clinically
be detected by QT interval measurement. Excessive prolongation of this interval can
result in life-threatening cardiac arrhythmias. Therefore, moxifloxacin should be
administered carefully in patients with known cardiac diseases [277-280].
In 2008, a so-called Red-Hand-Letter [281] was published, warning against serious
hepatotoxicity and blistering skin disease, which are both potentially life-threatening
conditions. Since then, the European prescribing information is stating that
moxifloxacin is contraindicated for patients with impaired liver function (Child Pugh
C) and cases of unwanted effects should be reported to the health authorities.
Recently, a population-based study of diabetic patients was published, where
moxifloxacin was found to increase the risk of severe dysglycemia [282-283]. This
was also observed in patients receiving moxifloxacin concomitantly with insulin [283].
Individual case reports associate moxifloxacin also with rhabdomyolysis [284], acute
interstitial nephritis [285], acute iris depigmentation [286], hepatotoxicity [63-64], and
abdominal wall hematoma if combined with warfarin [287]. However, a review of the
moxifloxacin safety in the past 14 years concluded that the safety of moxifloxacin is
essentially comparable to standard therapies since it can be characterized by a
favourable safety profile including fatal but rare toxicities [288].
Scheme 21 Chemical structures of the N-sulfate conjugate and the acyl-
glucuronide metabolites of moxifloxacin
acyl-glucuronide N-sulfate conjugate

168 Moxifloxacin
The bioavailability after oral administration of moxifloxacin is high (82 to 92 % [289-
291]), therefore no dosage adjustment is necessary when patients switch from i.v. to
oral therapy. After a single oral dose of 400 mg moxifloxacin mean peak plasma
levels can range from 2.5 µg/mL to 4.98 µg/mL [292-298]. The elimination half-life
(8.3 hours to 15.6 hours [292-298]) may allow once-daily administration. While most
quinolones are cleared predominantly by the kidney making dosage adjustment
necessary for renal failure, moxifloxacin is metabolized predominantly by the liver
and should not be used in patients with hepatic failure [1]. Moxifloxacin is
metabolized to an N-sulfate conjugate and an acyl glucuronide in humans (see
Scheme 21). The N-sulfate conjugate can be found in plasma, urine and feces, while
the acyl glucuronide can only be found in plasma and urine, but not in feces [299].
This may derive from enterohepatic recirculation of the acyl glucuronide.
Moxifloxacin is excreted unchanged in urine by 19-22% of a given oral dose [299].
Data of an SAD study of six oral moxifloxacin doses from 50 mg to 800 mg indicate
that pharmacokinetics are independent from the dose [293].
Scheme 22 Chemical structure of moxifloxacin (MOX)
H3C
O
8
6
7N
(S)
NH
(S)
F4
O
N1
C
H
H
O
O
H
non-ionic / neutral form zwitterionic form
Formula Mol. weight Exact mass pK a logP
C21H24FN3O4 401.4 g/mol 401.2 amu 6.25 / 9.29 0.832
IUPAC Name: 7-[(4aS,7aS)-1,2,3,4,4a,5,7,7a-octahydropyrrolo[3,4-b]pyridin-6-yl]-1-cyclopropyl-6-fluoro-8-methoxy-4-oxoquinoline-3-carboxylic acid
Moxifloxacin is a weak acid with pKa 6.3 and a weak base with a pKa of 9.3 at the
same time [300]. At physiological pH, zwitterionic and neutral forms are
predominating, where the neutral from has a share of approximately 10 %.
Compared to other fluoroquinolones this is a rather high number of molecules in the
most lipophilic form, contributing to an overall logP value of 0.832. Therefore,

Current state of published analytical methods 169
moxifloxacin can be considered a lipophilic fluoroquinolone [300-301], which is also
confirmed clinically by many reports studying moxifloxacin in a variety of human
body fluids [302-307], tissues [308-311], and bone [273-274, 312-314].
5.1.2 Current state of published analytical methods
Consequently, a high number of analytical methods have been reported, determining
moxifloxacin concentrations not only in human samples, but also in growth media
[315], in formulation samples [316-317], in animal body fluids and tissues [318].
Some methods are used to determine moxifloxacin among other fluoroquinolones
[319-325], as was also reviewed recently [326].
Most common methods to quantify moxifloxacin in human plasma or serum use
liquid chromatography with fluorescence detection (LC/FD) [321-322, 327-333] or
with ultraviolet detection (LC/UV) [319, 323, 334-337] or both detection techniques
[320, 338]. Application to pharmacokinetic studies for 400 mg moxifloxacin doses
was reported for most LC/FD [327-329, 331, 333] and LC/UV methods [335-336]. To
date, only four previously reported methods for moxifloxacin use liquid
chromatography with mass spectrometric detection (LC MS/MS) [65-66, 339-340],
whereas one is designed for the determination of moxifloxacin in dried blot spots
[339], one for rat plasma [340] and two methods for human plasma [65-66]. The
latter were not useful for our application, since they were characterised by either a
very high sample volume (1.0 mL plasma) associated with a laborious sample
preparation technique or less sensitivity (LLOQ of 0.050 µg/mL). Recently, an
LC-MS/MS method was published with the same sensitivity as the present method,
down to 0.005 µg/mL [340], but it is characterised by a higher sample volume and
longer run-time. The aim was to develop and validate a highly sensitive, precise and
cost-effective LC-MS/MS method, requiring only small plasma volumes from
pharmacokinetic studies.
5.1.3 LC-MS/MS method development
5.1.3.1 MS/MS spectra and tuning
The mass spectrum of moxifloxacin was recorded in the first quadrupole (Q1) of an
API 3000TM mass spectrometer operated in the positive ion mode. The latter was
selected, because more intensive signals were obtained and, additionally, due to its
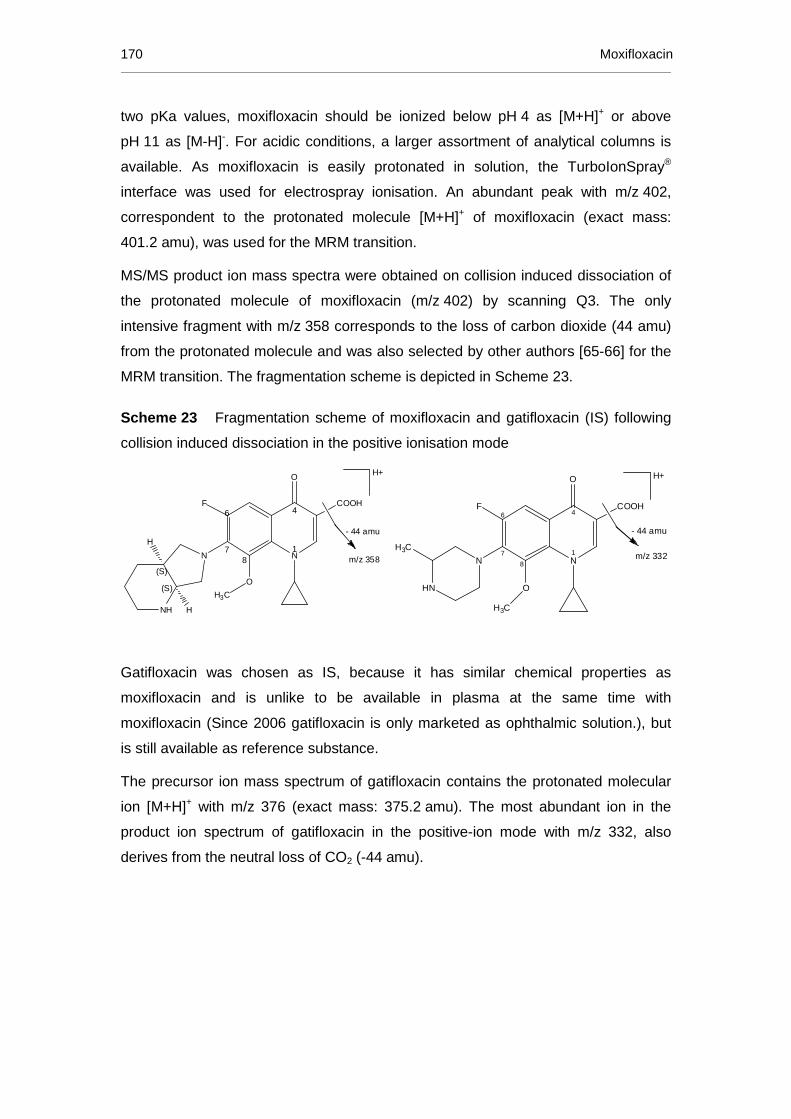
170 Moxifloxacin
two pKa values, moxifloxacin should be ionized below pH 4 as [M+H]+ or above
pH 11 as [M-H]-. For acidic conditions, a larger assortment of analytical columns is
available. As moxifloxacin is easily protonated in solution, the TurboIonSpray®
interface was used for electrospray ionisation. An abundant peak with m/z 402,
correspondent to the protonated molecule [M+H]+ of moxifloxacin (exact mass:
401.2 amu), was used for the MRM transition.
MS/MS product ion mass spectra were obtained on collision induced dissociation of
the protonated molecule of moxifloxacin (m/z 402) by scanning Q3. The only
intensive fragment with m/z 358 corresponds to the loss of carbon dioxide (44 amu)
from the protonated molecule and was also selected by other authors [65-66] for the
MRM transition. The fragmentation scheme is depicted in Scheme 23.
Scheme 23 Fragmentation scheme of moxifloxacin and gatifloxacin (IS) following
collision induced dissociation in the positive ionisation mode
H+
H3C
O
8
6
7N
(S)
NH
(S)
F4
O
N1
COOH
H
H
m/z 358
- 44 amu
H3C
N
HN
7
6
8
O
H3C
N1
4
O
COOHF
H+
m/z 332
- 44 amu
Gatifloxacin was chosen as IS, because it has similar chemical properties as
moxifloxacin and is unlike to be available in plasma at the same time with
moxifloxacin (Since 2006 gatifloxacin is only marketed as ophthalmic solution.), but
is still available as reference substance.
The precursor ion mass spectrum of gatifloxacin contains the protonated molecular
ion [M+H]+ with m/z 376 (exact mass: 375.2 amu). The most abundant ion in the
product ion spectrum of gatifloxacin in the positive-ion mode with m/z 332, also
derives from the neutral loss of CO2 (-44 amu).
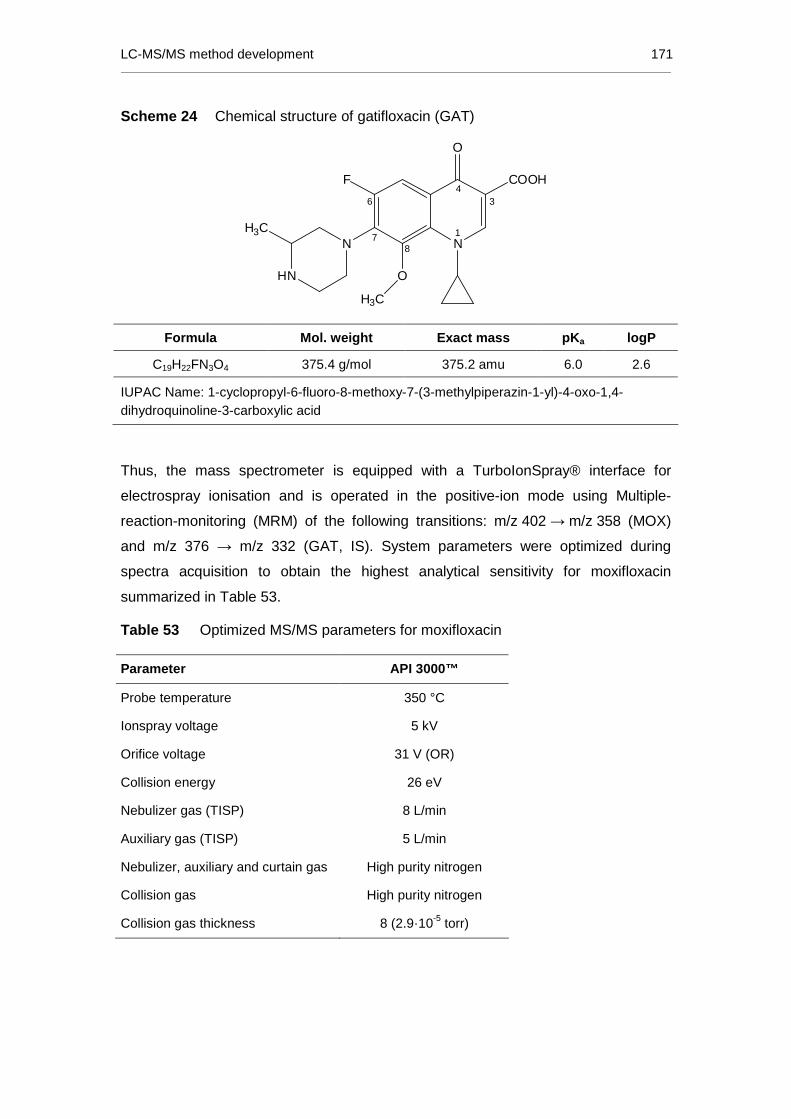
LC-MS/MS method development 171
Scheme 24 Chemical structure of gatifloxacin (GAT)
H3CN
HN
6
78
O
H3C
N1
34
O
COOHF
Formula Mol. weight Exact mass pK a logP
C19H22FN3O4 375.4 g/mol 375.2 amu 6.0 2.6
IUPAC Name: 1-cyclopropyl-6-fluoro-8-methoxy-7-(3-methylpiperazin-1-yl)-4-oxo-1,4-dihydroquinoline-3-carboxylic acid
Thus, the mass spectrometer is equipped with a TurboIonSpray® interface for
electrospray ionisation and is operated in the positive-ion mode using Multiple-
reaction-monitoring (MRM) of the following transitions: m/z 402 → m/z 358 (MOX)
and m/z 376 → m/z 332 (GAT, IS). System parameters were optimized during
spectra acquisition to obtain the highest analytical sensitivity for moxifloxacin
summarized in Table 53.
Table 53 Optimized MS/MS parameters for moxifloxacin
Parameter API 3000™
Probe temperature 350 °C
Ionspray voltage 5 kV
Orifice voltage 31 V (OR)
Collision energy 26 eV
Nebulizer gas (TISP) 8 L/min
Auxiliary gas (TISP) 5 L/min
Nebulizer, auxiliary and curtain gas High purity nitrogen
Collision gas High purity nitrogen
Collision gas thickness 8 (2.9·10-5 torr)

172 Moxifloxacin
5.1.3.2 Chromatography
As moxifloxacin was suspected to be instable under day-light [333], the sample
preparation procedure was done in an ice-water bath at approximately 4 °C and
under day-light protection. Plasma samples (100 µL) were precipitated with two parts
of acetonitrile (200 µL) for nearly complete protein removal and good vaporization in
the MS. The precipitated sample, containing the IS, is mixed thoroughly to facilitate
deproteinisation. The precipitate is separated by centrifuging the samples for
10 minutes at 3,000 rpm (approx. 3280 g) at approximately 4 °C.
Plasma samples were diluted (1:2) after precipitation with ammonium formate buffer
(1mM, pH 3.0), which decreased the organic solvent content of the sample, brought
it to the “right” pH conditions and improved peak shape. At pH 3 moxifloxacin
(pKa 6.25) is completely protonated and therefore well prepared for analysis in the
positive ion mode.
The electrospray ionisation is supported by the mobile phase, which is also
composed of acetonitrile and formate buffer (1 mM, pH 3.0). Gradient elution from
low to high acetonitrile content on a standard C18 column showed that moxifloxacin
is already eluted at low acetonitrile volumes. Therefore, the isocratic solvent system
was optimized to a buffer content of 75 % on a Phenomenex Aqua C18 column,
which is especially stable in aqueous mobile phases. Heated nitrogen gas at 350 °C
supported vaporisation of the relatively high water content of the mobile phase.
The IS gatifloxacin (pKa 6.0) is also fully protonated at pH 3 and has a similar
retention time in the chromatographic retention time in this method, which is 0.9 and
1.1 minutes for the IS and moxifloxacin, respectively. Typical chromatograms are
depicted in Figure 40.
The expected plasma concentration range following administration of a 400-mg oral
dose of moxifloxacin to healthy adults is determined by Cmax, which is between
2.5 µg/mL and 4.98 µg/mL [292-298]. Accordingly, 5 % of Cmax lies between
0.125 µg/mL and 0.250 µg/mL. However, the LLOQ was set to 0.005 µg/mL, as the
assay was already very sensitive with sample dilution by precipitation. For further
applications, like measurement of plasma concentrations after ophthalmic use of
moxifloxacin, the present method is a good starting point for scaling down the LLOQ
by a sample enrichment technique, like SPE. Currently, the calibration range is set
from 0.005 to 5.00 µg/mL.

LC-MS/MS method development 173
In the first test run of the prepared calibration curve, the IS working solution is
prepared at a concentration that equals one half of the highest calibration level of the
analyte to check the resulting peak area ratio (MOX/IS). Tests with different IS
concentrations revealed the following result: The IS working solution is prepared by
diluting a stock solution of gatifloxacin by factor 400 with acetonitrile to give a
concentration of 0.5 µg/mL. Thus, only one pipetting step was needed for IS addition
and precipitation.
All pipetting steps were carried out in 96-well plates using the MultimekTM Automated
96-Channel Pipettor, which is able to pipette 96 samples at the same time. Together
with the short chromatographic run time of only 2.0 minutes, this method is best
prepared for high-throughput analysis of biological samples.
In Table 54 the optimized sample preparation procedure and LC-MS/MS conditions
are summarized.
Table 54 Summary of the LC-MS/MS method for moxifloxacin in human plasma
Characteristic Details
Sample preparation 100 µL plasma + 200 µL CH3CN /IS
100 µL supernatant + 200 µL NH4HCOO (1 mM, pH 3.0)
Internal standard Gatifloxacin (GAT)
Column Aqua C18, 5 µm (50 x 4.6 mm I.D.)
Mobile phase 25 % CH3CN
75 % NH4HCOO (1 mM, pH 3.0)
Flow rate 1.0 mL/min
Run time 2.0 min
Ionisation Electrospray Ionisation (TurboIonSpray®)
Polarity Positive-ion mode
Mass transitions m/z 402 → m/z 358 (MOX)
m/z 376 → m/z 332 (GAT, IS)
CH3CN /IS: acetonitrile containing the internal standard gatifloxacin (0.5 µg/mL)

174 Moxifloxacin
5.1.4 Validation
The method was validated according to the FDA guidance for industry on BMV [20].
Analysis of drug-free human plasma from 12 individuals (6 males, 6 females) proved
the selectivity of the method for MOX and the IS. No co-eluting peaks with areas
above 20 % of the LLOQ peak were observed.
Additionally, no influence on the analysis of MOX was observed for 6 different
batches of human plasma. All 18 test samples with the high moxifloxacin
concentration (5.00 µg/mL) had an accuracy of 92.5 ± 3.4 % (mean±SD) with a
precision of 3.6 %. Accuracy and precision at the low MOX concentration
(0.0125 µg/mL) were 103.7 ± 9.1 % (mean±SD) and 8.8 %.
The linear regression of the peak area ratios versus concentrations were fitted over
the concentration range of 0.00500 to 5.00 µg/mL MOX in human plasma. The mean
linear regression equation of the calibration curves (N = 5) was determined:
y = 0.00129 (±0.00118) + 1.30225 (±0.32435) · x.
All correlation coefficients of the weighted calibration curves (1/x2) were ≥ 0.995. The
inter-day precision and accuracy of all back-calculated calibration standards ranged
from 1.8 to 5.3 % and from 91.1 to 107.6 %. Using 0.1 mL of plasma, the LLOQ for
moxifloxacin was 0.00500 µg/mL, analyzed with a perfect inter-day precision and
accuracy of 1.8 % and 100.0 %, respectively.
Table 55 Intra- and inter-day precision and accuracy of moxifloxacin in human
plasma (five days, five replicates per day
Theoretical concentrations
[µg/mL]
Intra-day Precision
[[[[%]]]]
Intra-day Accuracy
[[[[%]]]]
Inter-day Precision
[[[[%]]]]
Inter-day Accuracy
[[[[%]]]]
5.00 7.9 90.2 6.1 92.4
1.00 4.5 106.1 4.4 105.6
0.125 4.2 106.9 4.6 108.0
0.0125 9.7 106.8 7.7 106.6
0.00500 5.6 98.8 7.9 99.0
Table 55 summarizes the inter- and intra-run precision and accuracy for assaying
five replicates of each SQC concentration on each of five validation days. The inter-
day precision and accuracy ranged from 4.4 to 7.9 % and from 92.4 and 108.0 %,
whereas the intra-day precision and accuracy ranged 4.2 to 9.7 % and from 90.2 to

Validation 175
106.9 %. The obtained results were well within the acceptance criteria of no more
than 20% deviation at LLOQ and no more than 15% above LLOQ.
Table 56 Stability data on moxifloxacin in human plasma
Conc. Point Estimator
Lower Limit
Upper Limit
Stability experiment
[µg/mL]
Time
[%] [%] [%]
5.00 2 hours 94.6 93.2 96.0
4 hours 96.7 94.4 99.1
0.0125 2 hours 101.2 93.9 108.9
Short-term stability (room-temperature)
4 hours 100.5 93.9 107.4
5.00 48 hours 92.7 90.5 94.9 Post-preparative stability (autosampler, approx. 4 °C)
0.0125 48 hours 103.4 100.2 106.7
5.00 48 hours 93.9 91.9 96.0 Post-preparative stability (approximately -70 °C)
0.0125 48 hours 99.6 93.6 105.9
5.00 Once 98.5 97.1 99.8
Twice 95.1 91.6 98.7
Thrice 99.9 96.7 103.1
0.0125 Once 98.5 93.1 104.2
Twice 105.8 101.0 110.8
Freeze-thaw stability (approximately -70 °C)
Thrice 98.5 92.2 105.2
5.00 4 days 93.7 88.7 98.9
1 month 92.8 89.8 95.9
0.0125 4 days 102.4 97.5 107.6
Long-term stability (approximately -20 °C)
1 month 101.7 94.4 109.5
5.00 4 days 93.8 90.6 97.1
1 month 93.5 92.2 94.7
0.0125 4 days 96.7 90.0 103.7
Long-term stability (approximately -70 °C)
1 month 97.7 93.0 102.7
Stability data of MOX at concentrations of 0.0125 µg/mL and 5.00 µg/mL in human
plasma is summarised in Table 56. The results of the 95% confidence interval
calculation showed no evidence of instability during chromatography, extraction and
sample storage processes. Therefore, MOX can be regarded as stable in human
plasma for at least 4 hours at room temperature, for at least one month at -20 °C,
and for at least three freeze/thaw cycles form -70 °C to room temperature.
Additionally, MOX is stable in processed human plasma for at least 48 hours at
autosampler temperature (4 °C) and at -70 °C.

176 Moxifloxacin
The stock solutions of MOX and the IS gatifloxacin were stable for at least 6 hours at
room temperature. Additionally, no instability was observed for moxifloxacin in
human plasma and human whole blood for at least 6 hours exposed to the dark, to
artificial light or daylight.
The absolute extraction recovery of MOX from human plasma was determined to be
77.6 ± 7.9 % (mean±SD) over the whole concentration range of 0.00500 to 5.00
µg/mL. The absolute extraction recovery of the IS at the working concentration was
found to be 49.4 ± 3.3 % (mean±SD). The precision of 10 % shows good consistency
and reproducibility of the acetonitrile precipitation procedure introduced to extract
MOX from human plasma.
No influence of haemolysed or hyperlipidaemic human plasma on the accurate and
precise determination of moxifloxacin was observed. Mean accuracy and precision of
moxifloxacin in haemolysed / hyperlipidaemic plasma at 5.00 µg/mL were 94.0% /
89.6% and 5.4% / 5.5%, whereas accuracy and precision at 0.0125 µg/mL were
99.5% / 101.2% and 12.9% / 11.3%, respectively.
Human plasma samples that exceed the calibration range up to 20.0 µg/mL can be
pre-diluted with blank human plasma by a dilution factor of 5. Accuracy and precision
of the pre-diluted human plasma samples (five replicates) were 98.4% and 5.9%.
5.1.5 Comparison of the LC-MS/MS method with proced ures reported in the
literature
A direct comparison of the current LC-MS/MS assay to validated methods from the
literature is summarized in Table 57. All previously reported methods for the
determination of moxifloxacin in human plasma or serum had longer run times per
sample, whereas previously reported LC-MS/MS methods [65-66, 340] remain below
5 minutes per sample and three newer LC/FD methods remain below 10 minutes
[327, 329, 331]. But all other liquid chromatography methods need up to 30 minutes
analysis time per sample. Methods with shorter run times were applied tendentially
more often in pharmacokinetic studies [327, 329, 331, 333, 335-336] than methods
without reported application, indicating that shorter run times are more useful for
routine analysis.
A key factor for ethics is the blood volume taken from volunteers or patients during
pharmacokinetic studies. Thus, analytical methods should be sensitive enough to
keep the needed volume of plasma or serum low. The developed method and four

Comparison of the LC-MS/MS method with procedures reported in the literature 177
previously reported methods [65, 327] need only 100 µL of plasma or less, but only
the present method is very sensitive at the same time (LLOQ 0.005 µg/mL). All other
literature methods use more than twice the plasma volume, whereas two assays
even use 1.0 mL [66] and 1.2 mL [334]. Extracting moxifloxacin from a very high
volume of plasma can lead to a very low quantification limit [66], but together with the
rather expensive and time-consuming SPE sample work-up, this method was not the
first choice for the application to high sample through-put in a pharmacokinetic study.
Some authors reference the FDA guideline on bioanalytical method validation [33].
However, one should be aware that not only the type of experiments, but also the
way how to conduct them is requested there. That is, accuracy and precision data
“representing the entire range of the standard curve should be studied” [33], which
was not reported during two validations [323, 325]. Validation according to FDA
includes also several stability assessments, which were not reported for another
method [336].
With the developed and validated LC-MS/MS method, moxifloxacin can be
measured with high sensitivity using simple protein precipitation sample work-up.
Due to the cost and time effective sample preparation procedure and the 2-minutes
runtime, it is possible to measure over 500 human plasma samples per LC-MS/MS
machine per day. Additionally, the assay is characterized by high precision and
accuracy data down to the LLOQ at 5 ng/mL (CV: 1.8%). Together with the low
sample volume of 100 µL of plasma, the method is especially useful for large
pharmacokinetic studies.

178 Moxifloxacin
Table 57 Validated bioanalytical methods for the determination of moxifloxacin in human plasma or serum; grouped by analytical technique
and descending years of publication
Method Matrix Linearity range
[[[[µg/mL ]]]]
Approx. run time
[[[[min ]]]]
Inter-day Prec / Acc at LLOQ
[[[[%]]]]
Inter-day Prec / Acc
of QC samples [[[[%]]]]
Recovery (mean±SD)
[[[[%]]]]
Corr. Coeff.
Sample Vol.
[µL]
Sample Prep.
Internal standard
Additional validation
experiments
Application
LC-MS/MS (current method)
P 0.005 - 5.00 2.0 1.8 / 100.0 (n=25)
4.4 to 7.9 / 92.4 to 108.0 (n=5x25)
77.6±7.9 (MOX, n=5) 49.4±3.3 (IS, n=5)
≥0.995 (n=5)
100 Automated PPT
gatifloxacin 1,2,3a-f, 4,5,6 400-mg p.o., single-dose PK
LC-MS/MS [340] Raju 2012
P (rat) 0.005 – 0.100 4 3.2 / 100.3 1.0 to 1.8 / 96.7 to 97.6
>75 (MOX, n=6) >89 (IS, n=6)
0.998 (mean)
200 PPT gemifloxacin 1,2,3a-d,6,7 single-dose PK in rats
LC-MS/MS [65] Pranger 2010
P 0.050 - 5.00 2.5 4.8 / 107.1 1.9 to 3.7 / 102.7 to 107.1
114.2 to 122.2 96.5 (IS)
0.990 (n=3)
100 PPT Cyanoimipramine “internal control”
1,2,3a,c,d,f,6,7
TDM
LC-MS/MS [66] Vishwanathan 2002
P 0.001 - 1.00 4 11.3 / 110.0 (n=18)
2.3 to 6.8 / 97.5 to 100.5 (n=18)
90.6, 92.7 (MOX, n=5) 97.4±1.5 (IS, n=5)
>0.999 (n=3)
1000 SPE lomefloxacin n.r. n.r.
LC/UV + LC/FD [338] Cavazos-Rocha 2014
P 0.2 - 10 (UV) 0.04 - 10 (FD)
30 9.2 / n.r. 12.3 / n.r.
5.0 to 15.0 / n.r. 102 to 111 0.997 0.998
50 PPT none 2, 3b,c Mouse plasma samples
LC/UV [337] Helmy 2013
P 0.100 – 10.0 6 11.2 / 98.3 1.6 to 8.4 / 97.9 to 102.9
99.6 to 103.5 >0.999 250 PPT metronidazole 1, 2, 3b,c,d,e,8
TDM
LC/UV [336] Abdelaziz 2012
P 0.125 - 16 5.0 3.5 / 107.6 n.r. / 99.5 to 105.7 n.r. ≥0.999 (n=6)
250 PPT tinidazole 1 400-mg p.o., single-dose PK
LC/UV [335] Xu 2010
P 0.050 - 5.00 10 <15 / <115 4.5 to 9.6 / 100.4 to 108.2 (n=6)
80.5 to 91.2 0.999 (n=3)
500 LLE gatifloxacin 1,2,3a-d 400-mg p.o. Single dose PK
LC/UV [323] Baietto 2009
P 0.160 - 10.0 28 n.r. 5.5 to 14.8 / 93.1 to 114.9 (n=3x5)
75.9±5.8 (MOX, n=5) 77.9±4.1 (IS, n=5)
>0.998 300 PPT + Evaporation
quinoxaline 1, 2 TDM
LC/FD [321] De Smet 2009
P 0.020 - 7.50 17 4.8 / 102.5 (n=5)
3.0 to 5.6 / 98.3 to 100.0 (n=3x16)
92.4 (n=3x3)
0.998 (mean)
400 PPT + Evaporation
sarafloxacin 1,3c,d 400-mg i.v. (results n.r.)
LC/FD [327] Hemanth Kumar 2009
P 0.125 - 10.0 8 9.9 / 94.4 (n=6)
1.1 to 6.0 / 96.5 to 106.0 (n=3x6)
96 to 105 (n=3x6)
0.999 (mean)
100 PPT ofloxacin 1,2 400-mg p.o. Single dose PK
Continued on the next page.

Comparison of the LC-MS/MS method with procedures reported in the literature 179
Table 57 (continued) Validated bioanalytical methods for the determination of moxifloxacin in human plasma or serum; grouped by analytical
technique and descending years of publication
Method Matrix Linearity range
[[[[µg/mL ]]]]
Approx. run time
[[[[min ]]]]
Inter-day Prec / Acc at LLOQ
[[[[%]]]]
Inter-day Prec / Acc
of QC samples [[[[%]]]]
Recovery (mean±SD)
[[[[%]]]]
Corr. Coeff.
Sample Vol.
[µL]
Sample Prep.
Internal standard
Additional validation
experiments
Application
LC/UV [319] Srinivas 2008
P 0.100 - 10.0 18 <20 / ≤104.4 1.7 to 9.0 / 94.7 to 107.0 (n=4x18)
62.5 to 67.9 63.5 (IS)
≥0.999 (n=3)
500 LLE levofloxacin 1,2,3a-e n.r.
LC/FD [325] Nemutlu 2007
P 0.035 - 30.0 20 n.r. 3.9 to 7.9 / 100.7 to 101.2
96.5±1.0 (absolute) 98.3±2.1 (relative)
0.9991 500 SPE marbofloxacin 1, 2, 3a, c, d (at 1 µg/mL)
TDM
LC/FD [329] Tatar Ulu 2007
P 0.015 - 2.70 8 4.8 / 106.0 (n=6)
0.05 to 4.8 / 103.1 to 106.0 (n=6)
95.7 (n=6)
>0.999 500 4xLLE norfloxacin 1,3a,b,d 400-mg p.o. Single dose PK
LC/FD [331] 2006 Laban-Djurdjevic
P 0.003 - 1.30 9 4.5 / 105.4 n.r. / n.r. 92.5 >0.999 n.r. Filtration ofloxacin 1,3b,d 400-mg p.o.
LC/FD [328] Schulte 2006
P 0.200 - 3.50 18 1.0 / 100.0 (n=18)
1.0 to 4.1 / 97.0 to 101.0 (n=4x18)
97±1.7 (MOX, n=6) 106±1.4 (IS, n=8)
0.9995 400 PPT levofloxacin 3b, c 400-mg p.o. of one volunteer
LC/FD [322] Nguyen 2004
S 0.125 - 4.00 17 12.9 / 114.3 (n=10)
1.6 to 5.3 / 95.8 to 96.9 (n=10)
91.5 to 94.7 (n=10)
≥0.999 (n=10)
5 “on-line extraction”
none 3a,b,d n.r.
LC/UV, LC/FD [320] Liang 2002
P 0.100-10 (UV)
0.020-5.0 (FD)
15 n.r. n.r. n.r. n.r. 500 UF ciprofloxacin none for MOX
n.r.
LC/UV [334] Lemoine 2000
P 0.025 - 3.20 13 <15 / <115 1.1 to 9.1 / 100.2 to 101.8 (n=3x36)
97.4 (0.03-2.5µg/mL)
n.r. 1200 Automated SPE
enrofloxacin 1,2 n.r.
LC/FD [332] Tobin 1998
S 0.500 - 4.00 30 n.r. n.r. / 100.0 to 104.4 100.0 0.998 n.r. 2xLLE n.r. 1 n.r.
LC/FD [333] Stass 1997
P 0.0025 - 1.00 10 4.5 / 114.6 2.1 to 4.5 / 104.3 to 114.6
n.r. 0.993 250 PPT none 3a,b,d-f PK studies 200-mg / 400-mg
P: plasma, S: serum, Acc: Accuracy, Prec: Precision, SD: standard deviation, LLOQ: lower limit of quanification, PPT: protein precipitation, SPE: solid phase extraction, LLE: liquid-liquid extraction, Dil: Dilution, Deriv: Derivatisation, n.r.: not reported, TDM: therapeutical drug monitoring, UF: ultrafiltration 1: Specificity, 2: Selectivity, 3: Stability (a) short-term, (b) long-term, (c) post-preparative, (d) freeze-thaw, (e) stock solution, (f) light, 4: hemolyzed plasma, 5: lipemic plasma, 6: Dilution, 7: Matrix Effect, 8: Incurred Samples

180 Moxifloxacin
5.1.6 Application to a pharmacokinetic study
5.1.6.1 Study design and sample handling
The study was designed to investigate the pharmacokinetics of 400 mg moxifloxacin
as a film-coated tablet, given as a single oral dose to nine healthy male volunteers
under fasting conditions. Blood was collected into ammonium heparinate monovettes
according to the following schedule: immediately before administration and at 0.33,
0.67, 1.00, 1.33, 1.67, 2.00, 2.33, 2.67, 3.00, 3.50, 4.00, 4.50, 5.00, 6.00, 8.00,
12.00, 24.00, and 48.00 hours after oral administration of the study drug.
The blood samples were cooled in an ice-water bath until centrifugation for
10 minutes at 4 °C and 1500 g. The obtained plasma was subsequently transferred
into polypropylene tubes and immediately frozen at approximately -70 °C until
analysis.
The concentrations of moxifloxacin in the human plasma samples were determined
using the developed and validated LC-MS/MS method summarized in Table 54
(page 173).
5.1.6.2 Determination of moxifloxacin concentrations in human plasma
In the present study moxifloxacin concentrations of more than 700 human plasma
samples were measured in a total of five sequences. The coefficient of correlation of
resulting linear regressions was at least 0.995. The inter-day precision and accuracy
of the SQC samples of moxifloxacin in human plasma analyzed with the batches of
study samples ranged from 6.4 to 9.9 % and from 99.0 to 104.3 %, respectively and
support the high precision and accuracy of the concentration data of the study
samples (see Table 58).
Representative MRM-chromatograms are depicted in Figure 40: (A) Blank plasma
sample (B) LLOQ, containing 0.00514 µg/mL moxifloxacin (C) Subject plasma
sample (t=0.67h) containing 4.31 µg/mL moxifloxacin (D) Subject plasma sample
(t=48h) containing 0.204 µg/mL moxifloxacin

Application to a pharmacokinetic study 181
Table 58 Accuracy and precision of calibration standards and SQC samples
during analysis of moxifloxacin in study samples
Theoretical Concentration
(µg/mL) Mean Accuracy*
(%) Mean Precision*
(%)
4.97 99.2 2.4
3.73 101.3 2.7
1.02 101.8 2.7
0.255 100.6 5.4
0.0509 102.9 4.8
0.0255 93.5 8.4
0.0102 98.2 8.2
0.00816 101.5 7.2
Calibration standards
0.00514 100.9 5.9
3.81 99.0 6.8
1.09 99.8 8.0
0.108 104.3 6.4 SQC samples
0.0135 101.9 9.9
* Accepted limits by EMA and FDA: maximal 15 % for precision and 85-115 % for accuracy
Figure 40 MRM-chromatograms of moxifloxacin in human plasma: (A) Blank
plasma sample, (B) LLOQ (0.00514 µg/mL), (C) Subject plasma sample (t=0.67h,
4.31 µg/mL), (D) Subject plasma sample (t=48h, 0.204 µg/mL)
MOX(HX)-BQA-898P-2006
A B C
MOX(HX)-BQA-898P-2006
D
MOX(HX)-BQA-898P-2006

182 Moxifloxacin
5.1.6.3 Pharmacokinetic results
Figure 41 shows the mean plasma concentration profile of moxifloxacin after oral
administration of a 400-mg moxifloxacin tablet to 9 healthy volunteers. The mean
peak concentration (Cmax) of 3.47 ± 0.72 µg/mL was attained at 1.37 ± 0.89 hours
after administration. Table 4 shows the pharmacokinetic parameters of moxifloxacin
after oral administration in comparison to pharmacokinetic parameters reported in
previously published studies [292-298].
Figure 41 Plasma profile (mean±SD) of moxifloxacin concentrations versus time
after administration of a 400-mg oral moxifloxacin dose to healthy volunteers (n=9)
0.005
0.050
0.500
5.000
0 3 6 9 12 15 18 21 24 27 30 33 36 39 42 45 48
Con
cent
ratio
n (µ
g/m
L)
Time (hours)
Moxifloxacin
LLOQ
The pharmacokinetic data from the current study are in good agreement with
previously reported values for a 400-mg oral moxifloxacin dose. The maximum
concentration of 3.47 ± 0.72 µg/mL lies within the range of other studies, i.e. from
2.50 ± 1.31 [293] up to 4.98 ± 1.01 µg/mL [297], which may derive from different
tablet formulations. The mean tmax in the present study of 1.37 ± 0.89 hours is also
comparable with other data between 0.5 hours [295] and 2.0 hours [294]. The
present AUC∞ (42.59 ± 8.59 µg·h/mL) is slightly higher than the AUC∞ from Stass et
al. [293-295], i.e. between 26.9 ± 1.18 µg·h/mL and 30.9 ± 1.12 µg·h/mL, but the
present data is in good agreement with the data reported for four independent other
studies [292, 296-298]. In healthy volunteers with a gastric bypass the AUC∞ of
moxifloxacin (46.2 ± 1.4 µg·h/mL) was higher compared to data from other studies.

Summary: Moxifloxacin 183
The authors suppose that due to the gastric bypass the bile is secreted more distally
influencing the enterohepatic recirculation of moxifloxacin [341-342]. This would also
explain the longer half-life of 14 h compared to most other studies [292, 295-298,
343].
5.1.7 Summary: Moxifloxacin
The developed and validated LC-MS/MS assay for moxifloxacin in human plasma is
simple and fast (precipitation of plasma and 2.0 min run-time), reliable, sensitive,
precise and accurate. The method employes simple protein precipitation, which
allows quantification of moxifloxacin in human plasma for concentrations ranging
from 0.005 to 5.00 µg/mL. The principal advantage of the LC-MS/MS method
described here is the simultaneous achievement of high sensitivity (LLOQ
0.005 µg/mL) and a low sample volume (100 µL), and high inter-day precision (7.9
%) and accuracy (99.0 %) at the LLOQ as well as excellent linearity within a short
run time of 2.0 minutes. These characteristics make the method suitable for the
precise and accurate measurement of low moxifloxacin concentrations in human
plasma samples from pharmacokinetic studies. Similarly, the method should be
feasible for samples from animals. The method was successfully applied to the
analysis of more than 700 human plasma samples during a pharmacokinetic study,
of which the results were in good agreement with comparable studies. The mean
peak concentration of 3.47 ± 0.72 µg/mL was attained at 1.37 ± 0.89 hours after
administration. The area under the curve was 42.59 ± 8.59 µg·h/mL and the terminal
elimination half-life was determined to be 11.2 hours. The efficacy of
fluoroquinolones can be described by the Cmax/MIC and AUC/MIC [13], whereas an
AUC/MIC of 125 and a Cmax/MIC of is assumed be necessary for efficient bacterial
killing rates. The Cmax/MIC is given in Table 59 for different micro-organisms.
Table 59 Cmax/MIC for a 400-mg oral moxifloxacin dose and different micro-
organisms
Micro-organism MIC 90, µg/mL C max/MIC
Streptococcus pneumoniae [344] 0.125 28
Fusobacterium spp. (anaerobe) [263] 2 1.75
Clostridium spp. (anaerobe) [263] 32 0.1
MIC: minimal inhibitory concentration of a given micro-organism, Cmax: maximal observed plasma
concentration

184 Moxifloxacin
Table 60 Pharmacokinetic parameters (mean±SD) of moxifloxacin in healthy subjects after administration of a single oral dose
Reference Subjects / Gender BMI [kg/m²]
Dosage / Formulation
t last
[[[[h]]]] AUC0→→→→last
[[[[µg h/mL ]]]] AUC0→→→→∞∞∞∞
[[[[µg h/mL ]]]] Cmax
[[[[µg/mL ]]]] tmax
[[[[h]]]] t1/2
[[[[h]]]] Analytical
Method
Current study 9/m 400 mg / film-coated tablet 48 40.53 ± 7.61 42.59 ± 8.59 3.47 ± 0.72 1.37 ± 0.89 11.2 LC-MS/MS
[345] Kanjanawart 2013 20 (Thai)
400 mg reference tablet
400 mg test tablet 34
51.93
49.73
54.46
51.87
4.21
4.04
2.0 (0.25-8.00)a
2.0 (0.25-6.00)a n.r. LC/FD
[341] De Smet 2012 12 / m,f / 23-38 with gastric bypass 400 mg / film-coated tablet 72 n.r. 46.2 ± 1.4 3.38 ± 1.41 1.75 (0.75-4.00)a 14.1 ± 1.3 LC/FD
[308] 2011 Majcher-Peszynska
28 / m,f diabetic elderly 400 mg / tablet 24 29.36
(steady state) n.r. 2.69 2.0 (1.0-8.0)a n.r. n.r.
[343] Burkhardt 2005 12 / m,f / 22.2 (m), 25.9 (f) 400 mg / tablet (intact) 48 n.r. 39.6 ± 1.13 3.20 ± 1.12 1.75 (0.50-4.00)a 9.86 LC/FD
[298] Burkhardt 2002 12 / m / 24.2 (mean) 400 mg / tablet 24 28.2 ± 4.1 35.6 ± 6.5 3.10 ± 0.60 1.67 ± 0.96 10.6 LC/FD
[295] Stass 2001 8 / m / n.r. 400 mg / n.r. 24 n.r. 30.9 ± 1.12 3.10 ± 1.34 0.5 9.6 ± 1.12 LC/FD
[292] Lubasch 2000 12 / m,f / 67.4 kg,1.81 m² 400 mg / n.r. 48 n.r. 39.3 ± 5.35 4.34 ± 1.61 1.02 ± 0.72 9.15 ± 1.62 LC/FD
[289] Ballow 1999 10 / m / within 15% of normal
100 mg / two 50mg film-coated round tablets 48 39.44b 43.00b 4.6b 0.86 13.5 LC/FD
[296] Sullivan 1999 15 / m,f / 24.5 (m), 24.7 (f) 400 mg / encapsuled tablet 24 30.24 (14.2)c 36.68 (13.2)c 3.36 (21.5)c 1.49 (62.2)c 9.30 (12.1)c LC/FD
[297] Wise 1999 8 / m / 23.5 (mean) 400 mg / tablet 24 39.0±2.16 45.49 ± 4.68 4.98 ± 1.01 1.0 ± 0.91 8.32 ± 1.70 Micro
[294] Stass 1999 12 / m / 25.7 (mean) 400 mg / tablet 96 n.r. 29.8 ± 1.25 2.50 ± 1.29 2.0 15.6 ± 1.15 LC/FD
[293] Stass 1998 7 / m / 24.6 (mean) 400 mg / n.r. 72 n.r. 26.9 ± 1.18 2.50 ± 1.31 1.50 13.1 ± 1.06 LC/FD
m: male, f: female, n.r.: not reported, a: median, range in parentheses, b: dose-corrected to 400 mg, c: percent CV in parentheses, LC-MS/MS: liquid chromatography tandem mass spectrometry, LC/FD: liquid chromatography with fluorescence detection, Micro: Microbiological assay

Summary 185
6 SUMMARY
In the present thesis the development and validation of bioanalytical LC-MS/MS
methods for the quantification of erythromycin A, erythromycin ethylsuccinate,
roxithromycin, clarithromycin, 14-hydroxy clarithromycin, flucloxacillin, piperacillin and
moxifloxacin in human plasma and human urine (piperacillin) is introduced. All
methods were applied to analyze human plasma and urine samples from clinical
trials and therefore, have been validated according to international guidelines. The
methods were reliable in these studies and fulfilled all regulatory requirements known
at the time of the study conduct.
Table 61 Summary of the properties of the drugs and the developed LC-MS/MS
methods
ERY A EES ROX CLA 14-OH CLA
FLU PIP MOX
pKa 8.8 7.1 9.2 8.4 - 8.99 - 2.7 2.9 6.3 / 9.3
logP 3.06 2.1 2.75 3.16 - 2.58 0.22 0.83
Ionisation APCI(+) APCI(+) APCI(+) APCI(+) APCI(+) ESI(-) ESI(-) ESI(+)
LLOQ (ng/mL) 0.156 0.098 0.395 0.781 0.390 10.0 50.0 5.0
Run time (min) 3.0 3.0 2.2 3.0 3.0 2.2 3.2 2.0
Sample vol. (mL) 0.100 0.100 0.100 0.100 0.100 0.100 0.100 0.100
Inter-day Precision (%)
3.9 to 12.4
1.6 to 9.7
2.8 to 8.1
2.2 to 12.0
5.0 to 10.5
4.0 to 8.6
3.7 to 10.7
4.4 to 7.9
Inter-day Accuracy (%)
96.9 to 104.5
100.8 to 104.2
98.3 to 107.2
96.0 to 101.4
91.1 to 99.5
97.6 to 101.4
93.0 to 101.0
92.4 to 108.0
-: not known; no available data in the literature, pKa: logarithmic acid dissociation constant, logP:
partition-coefficient in octanol-water, LLOQ: lower limit of quantification, APCI(+): atmospheric pressure
chemical ionisation in the positive-ion mode, ESI(-): electrospray ionisation in the negative-ion mode,
ERY A: erythromycin A, EES: erythromycin ethylsuccinate, ROX: roxithromycin, CLA: clarithromycin,
14-OH CLA: 14-hydroxy clarithromycin, FLU: flucloxacillin, PIP: piperacillin, MOX: moxifloxacin
Moreover, the validation data of the macrolides were compared on three different
mass spectrometers (API III Plus, API 3000™, API 5000™). The new innovations in
the ion source (horizontal versus vertical electrospray), the ionpath (skimmer, QJet)
and the diameter of the orifice resulted in better sensitivity and a larger linearity range
for the majority of the analytes. Sensitivity was improved up to a factor of 12 (for
clarithromycin) between API III Plus to API 3000™ and up to a factor of 8 (for
erythromycin and roxithromycin) between API 3000™ and API 5000™, keeping the
accuracy and precision data at about the same level. The high sensitivity was a

186 Summary
benefit for example for the flucloxacillin study, because concentrations from all
subject samples were detectable up to approximately eight half-lives, i.e. no
concentrations needed to be reported below the quantification limit. Also the linearity
range were extended from two orders of magnitude to up to four orders of magnitude,
which increases the likelihood to allow to analyze all samples from a pharmacokinetic
study in the same run.
This is especially useful if a large concentration range needs to be analysed, for
example, if the method shall be applied in an ascending dose study. Then, all low
concentrations from the beginning of the study can be determined, as well as all high
concentrations, without the need to dilute and analyse single samples repeatedly.
The pharmacokinetic data were compared to previously reported literature data and
correlated graphically with MIC values of popular microorganisms which might be a
starting point for further PK/PD investigations.
Table 62 Summary of chemical and pharmacokinetic properties
ERY A (EES)
ROX CLA 14-OH CLA
FLU PIP MOX
pKa 8.8 9.2 8.4 - 8.99 - 2.7 2.9 6.3 / 9.3
logP 3.06 2.75 3.16 - 2.58 0.22 0.83
Acid stability low improved good - improved no good
Bioavailability (%)
25-50 60 52-55 (first-pass)
- 50 Low 86
PPB (%) 54-74 73-97 41-72 - 95 16-21 47
*Dose (mg) 500 po 300 po 250 po - 250 po 4000 iv 400 po
*Cmax (µg/mL) 0.34-0.71 7.3-12 0.72-1.21 0.46-0.76 7.4-14 223-322 2.5-5.0
*tmax (hours) 0.5-1.3 1.3-3.0 1.6-2.6 1.9-2.6 0.7-0.9 - 1.0-1.7
*AUC∞ (µg·h/mL) 2.1-3.4 98-277 4.0-8.2 3.2-6.0 15.4-29.8 278-640 29.8-45.5
*t1/2 (hours) 1-2 10-18 3-5 3-6 1.3-1.9 0.8-1.8 8.3-15.6
Non-linear PK negligible at therap.
conc.
saturable PPB
>4µg/mL
Autoinhib. CYP3A4
- Linear up to 1g
saturable renal
elimin.
-
*: investigated here, -: not known; no available data in the literature, pKa: logarithmic acid dissociation
constant, logP: partition-coefficient in octanol-water, PPB: plasma protein binding, Cmax: maximal
observed plasma concentration, tmax: time to peak concentration, AUC∞: area under the curve from time
of administration up to time infinity, t1/2: half-life, PK: pharmacokinetics, ERY A: erythromycin A, EES:
erythromycin ethylsuccinate, ROX: roxithromycin, CLA: clarithromycin, 14-OH CLA: 14-hydroxy
clarithromycin, FLU: flucloxacillin, PIP: piperacillin, MOX: moxifloxacin

Summary 187
The PK/PD theory is a very helpful tool for prediction of the efficacy of given drugs
against certain micro-organisms. Depending on the pharmacodynamic processes,
e. g. the mode of action, three classes of drugs have been identified:
Table 63 Classes of antimicrobial agents related to PK/PD parameters
Type PK/PD parameter Antibiotics How to maximise efficacy
I T>MIC β-Lactams Macrolides
dose more frequently, or prolong t1/2, or infuse continuously
II Cmax/MIC Fluoroquinolones Maximise concentrations, e. g. intravenously
III AUC0-24/MIC Macrolides Maximise cumulative dose, i. e. prolong t1/2
PK: pharmacokinetic, PD: pharmacodynamic, T>MIC: Duration of time when the drug concentration
exceeds the minimal inhibitory concentration of a given micro-organism, Cmax: maximal observed plasma
concentration, AUC0-24: area under the curve from time of administration up to 24 hours, t1/2: half-life
In the same way this applies to adverse effects, which need to be minimised by
reducing plasma concentrations. These coherences are not well-investigated, yet,
and are not discussed further in this thesis.
Still, a lot of research has to be done in this interdisciplinary field to minimise
uncertainty in single values, like an AUC/MIC. These include:
Improve accuracy and precision of bioanalytical methods determining total and free
concentration data in biological matrices for calculation of AUC and Cmax
These parameters are related to the MIC in pharmacodynamic considerations. Since
the determination of the MIC often underlies significant variations and also
differences between microbiological laboratories, the determination of concentrations
of anti-infectives is particular important, being achievable by scientific exact
techniques. Finally, from the volume of distribution of antibiotics can be used to
derive information about intracellular concentrations and effectivity of antiinfectives.

188 Zusammenfassung
7 ZUSAMMENFASSUNG
In der vorliegenden Arbeit wird die Entwicklung und Validierung von bioanalytischen
LC-MS/MS-Methoden zur Quantifizierung von Erythromycin A, Erythromycin-
ethylsuccinat, Roxithromycin, Clarithromycin, 14-Hydroxy-clarithromycin,
Flucloxacillin, Piperacillin und Moxifloxacin in Humanplasma und Humanurin
(Piperacillin) vorgestellt. Alle Methoden wurden für die Analyse von Plasma- und
Urinproben aus klinischen Studien beim Menschen eingesetzt und deshalb nach
international anerkannten Richtlinien validiert. In diesen Studien haben sich die
Methoden bewährt und alle Anforderungen der zum Zeitpunkt der Studie bekannten
behördlichen Ansprüche erfüllt.
Table 64 Übersicht über die Wirkstoffeigenschaften und die LC-MS/MS Methoden
ERY A EES ROX CLA 14-OH CLA
FLU PIP MOX
pKs 8.8 7.1 9.2 8.4 - 8.99 - 2.7 2.9 6.3 / 9.3
logP 3.06 2.1 2.75 3.16 - 2.58 0.22 0.83
Ionisierung APCI(+) APCI(+) APCI(+) APCI(+) APCI(+) ESI(-) ESI(-) ESI(+)
LLOQ (ng/mL) 0.156 0.098 0.395 0.781 0.390 10.0 50.0 5.0
Messzeit (min) 3.0 3.0 2.2 3.0 3.0 2.2 3.2 2.0
Probenvol. (mL) 0.100 0.100 0.100 0.100 0.100 0.100 0.100 0.100
Inter-day Präzision (%)
3.9 to 12.4
1.6 to 9.7
2.8 to 8.1
2.2 to 12.0
5.0 to 10.5
4.0 to 8.6
3.7 to 10.7
4.4 to 7.9
Inter-day Richtigkeit (%)
96.9 to 104.5
100.8 to 104.2
98.3 to 107.2
96.0 to 101.4
91.1 to 99.5
97.6 to 101.4
93.0 to 101.0
92.4 to 108.0
-: nicht bekannt; keine Daten in der Literatur verfügbar, pKs: Logarithmus der
Säuredissoziationskonstante, logP: Oktanol-Wasser Verteilungs-Koeffizient, LLOQ: Untere
Bestimmungsgrenze, APCI(+): Chemische Ionisierung bei Atmosphärendruck im Positiv-Ionen-Modus,
ESI(-): Elektrospray Ionisierung im Negativ-Ionen-Modus, ERY A: Erythromycin A, EES: Erythromycin
Ethylsuccinate, ROX: Roxithromycin, CLA: Clarithromycin, 14-OH CLA: 14-Hydroxy clarithromycin, FLU:
Flucloxacillin, PIP: Piperacillin, MOX: Moxifloxacin
Die Validierungsdaten der Makrolid-Methoden konnten zudem an drei
Massenspektrometern der selben Baureihe verglichen werden. Dabei zeigte sich,
dass die Neuerungen an der Ionenquelle (horizontale versus vertikale ESI), dem
Ionenpfad (Skimmer, QJet), sowie das immer größere Orifice in der Baureihe, nicht
nur stetig verbesserte Sensitivität ermöglichen, sondern auch immer größere
Linearitätsbereiche. So konnte ein Sensitivitätsgewinn bis zu Faktor 12
(Clarithromycin) von API III Plus auf API 3000™ und bis zu Faktor 8 (Erythromycin

Zusammenfassung 189
und Roxithromycin) von API 3000™ auf API 5000™ bei etwa gleichen Werten für die
Präzision erreicht werden. Die hohe Sensitivität zeigte sich zum Beispiel bei der
Flucloxacillin Studie von Vorteil, da alle Konzentrationen bis circa acht
Halbwertszeiten nach Wirkstoffgabe bestimmt werden konnten, ohne dass einzelne
Proben als „BLOQ“ (unter dem Quantifizierungslimit) berichtet werden mussten.
Während früher noch Linearitätsbereiche um zwei Größenordnungen üblich waren,
sind jetzt am API 5000™ Konzentrationsbereiche über bis zu vier Größenordnungen
reproduzierbar linear. Das ist insbesondere von Nutzen, wenn bei einer Substanz ein
größerer Konzentrationsbereich gemessen werden muss. Das ist beispielsweise
dann der Fall, wenn die Methode für eine Dosissteigerungsstudie eingesetzt werden
soll. Dann können sowohl alle kleinen Konzentrationen zu Beginn der Studie
gemessen werden, als auch alle hohen Konzentrationen zum Ende der Studie, und
zwar ohne, dass einzelne Proben gesondert verdünnt und wiederholt gemessen
werden müssen.
Table 65 Übersicht der chemischen und pharmakokinetischen Eigenschaften
ERY A (EES)
ROX CLA 14-OH CLA
FLU PIP MOX
pKs 8.8 9.2 8.4 - 8.99 - 2.7 2.9 6.3 / 9.3
logP 3.06 2.75 3.16 - 2.58 0.22 0.83
Säurestabilität niedrig besser gut - besser keine gut
Bioverfügbarkeit (%)
25-50 60 52-55 (first-pass)
- 50 niedrig 86
PPB (%) 54-74 73-97 41-72 95 16-21 47
*Dosis (mg) 500 po 300 po 250 po - 250 po 4000 iv 400 po
*Cmax (µg/mL) 0.34-0.71 7.3-12 0.72-1.21 0.46-0.76 7.4-14 223-322 2.5-5.0
*tmax (hours) 0.5-1.3 1.3-3.0 1.6-2.6 1.9-2.6 0.7-0.9 - 1.0-1.7
*AUC∞ (µg·h/mL) 2.1-3.4 98-277 4.0-8.2 3.2-6.0 15.4-29.8 278-640 29.8-45.5
*t1/2 (hours) 1-2 10-18 3-5 3-6 1.3-1.9 0.8-1.8 8.3-15.6
Nicht lineare PK Vernach-lässigbar bei therap. Konz.
Sättigb. PPB
>4µg/mL
Autoinhib. CYP3A4
- Linear bis 1g
Sättigb. renale Elimin.
-
*: hier untersucht, -: nicht bekannt; keine Daten in der Literatur verfügbar, pKs: Logarithmus der
Säuredissoziationskonstante, logP: Oktanol-Wasser Verteilungs-Koeffizient, PPB: Plasmaprotein-
bindung, Cmax: höchste gemessene Plasmakonzentration, tmax: Zeitpunkt der höchsten
Plasmakonzentration, AUC∞: Fläche unter der Konzentrations-Zeit-Kurve vom Zeitpunkte der Gabe bis
Unendlich, t1/2: Halbwertszeit, PK: Pharmacokinetik, ERY A: Erythromycin A, EES: Erythromycin
Ethylsuccinate, ROX: Roxithromycin, CLA: Clarithromycin, 14-OH CLA: 14-Hydroxy clarithromycin, FLU:
Flucloxacillin, PIP: Piperacillin, MOX: Moxifloxacin

190 Zusammenfassung
Die pharmakokinetischen Daten der Antibiotika wurden in den Kontext mit
Literaturdaten gestellt und graphisch mit MHK-Werten für gängige Mikroorganismen
verglichen, was den Ausgangspunkt für spätere PK/PD-Untersuchungen darstellt.
Für die Vorhersage der Wirksamkeit einer verabreichten Substanz gegenüber
bestimmten Mikroorganismen ist die PK/PD-Korrelation ein gutes Hilfsmittel. Anhand
der pharmakodynamischen Parameter, wie der Wirkungsweise, können drei
Antibiotikaklassen gebildet werden.
Table 66 Einteilung von Antiinfektiva in PK/PD Parameter
Klasse PK/PD Parameter Antibiotika Wirksamkeit maximieren durch
I T>MHK β-Lactame Makrolide
Häufiger dosieren, oder t1/2verlängern oder Dauerinfusion
II Cmax/MHK Fluoroquinolone Konzentrationen maximieren, z. B. intravenöse Verabreichung
III AUC0-24/MHK Makrolide Dosis erhöhen oder t1/2 verlängern
PK: Pharmacokinetik, PD: Pharmacodynamik, T>MIC: Zeitdauer wenn die Antibiotikakonzentration über
der minimalen Hemmkonzentration eines bestimmten Bakteriums liegt, Cmax: höchste gemessene
Plasmakonzentration, AUC0-24: Fläche unter der Konzentrations-Zeit-Kurve vom Zeitpunkt der Wirkstoff-
Gabe bis 24 Stunden danach, t1/2: Halbwertszeit
In analoger Weise gilt für die Nebenwirkungen, dass die Plasma-Konzentrationen
verringert werden müssen. Diese Zusammenhänge sind jedoch weniger gut
untersucht und werden in dieser Dissertation nicht näher diskutiert.
In diesem interdisziplinären Feld ist immer noch viel Forschung nötig um
beispielsweise Unsicherheiten bei einzelnen Werten wie z.B. AUC/MIC zu
minimieren. Diese beinhalten:
Verbesserung der Genauigkeit und Präzision von bioanalytischen Methoden welche
für die Bestimmung der Gesamtkonzentration und der freien Konzentration in
biologischen Matrices verwendet werden um AUC und Cmax zu bestimmen.
Diese Parameter werden in pharmakodynamischen Überlegungen in Beziehung zur
MHK gesetzt. Da die MHK-Bestimmung oft erheblichen Schwankungen und auch
Unterschieden zwischen verschiedenen mikrobiologischen Laboratorien unterliegt,
kommt der Konzentrationsbestimmung der Antibiotika besondere Bedeutung zu, weil
sie mit naturwissenschaftlich exakten Methoden möglich ist. Aus den
Verteilungsvolumina von Antibiotika lassen sich schließlich auch noch Informationen
über die intrazelluläre Konzentration und Wirksamkeit von Antibiotika ableiten.

List of abbreviations 191
List of abbreviations
AAPS American Association of Pharmaceutical Scientists
AC Alternating current
Ae Amount (of drug) excreted
AFSSAPS Agence française de sécurité sanitaire des produits de santé
(French Drug and Health Products Safety Agency, until 05/2012)
amu Atomic mass units
ANOVA Analysis of variance
ANSM Agence nationale de sécurité du médicament et des produits de
santé (National Drug and Health Products Safety Agency, France)
APCI Atmospheric pressure chemical ionisation
APPI Atmospheric pressure photo ionisation
ATP Adenosine triphosphate
AUC Area under the curve
AUC0-last AUC from time of administration up to the time of the last
quantifiable concentration
AUC0-∞ AUC from time of administration up to time infinity
BfArM Bundesinstitut für Arzneimittel und Medizinprodukte
(Federal Institute for Drugs and Medical Devices Germany)
bid Bis in die (twice daily)
BMV Bioanalytical method validation
BQC Biological quality control
CAD Collision-activated dissociation (MS)
CEM Channel electron multiplier (MS)
CHMP Committee for Medicinal Products for Human Use
(committee of the EMA)
CID Collision-induced dissociation
CL Clearance

192 List of abbreviations
CLA Clarithromycin
CLA-MET 14-hydroxy metabolite of clarithromycin
Clast Last quantifiable plasma concentration
Cmax Maximal observed plasma concentration
CPMP Committee for Proprietary Medicinal Products
(committee of the EMA, since 2004 named CHMP)
CR Calibration row
CS Column switching
cSSSI Complicated skin and skin structure infections
CV Coefficient of variation
CYP Cytochrome P450
D Dose
DC Direct current
Dil Dilution
DP Declustering potential
EBF European Bioanalysis Forum
EDTA Ethylene diamine tetra acetic acid
EES Erythromycin ethylsuccinate
EI Electron ionisation
ELF Epithelial lining fluid
EMA European Medicines Agency
ERY A Erythromycin A
ESI Electrospray ionisation
FDA US Food and Drug Administration
FLU Flucloxacillin
FT Freeze-thaw (stability)
g Gravitational acceleration
GBC Global Bioanalysis Forum

List of abbreviations 193
GC Gas chromatography
GCP Good clinical practice
GLP Good laboratory practice
GMP Good manufacturing practice
HN Heated Nebulizer® (APCI source)
HPLC High performance liquid chromatography
IBMP Institute for Biomedical and Pharmaceutical Research
IUPAC International Union of Pure and Applied Chemistry
ICH International Conference on Harmonization (of technical
requirements for registration of pharmaceuticals for human use
within the EU, Japan and the US)
IS Internal standard
IUPAC International union of pure and applied chemistry
iv Intravenous
JBC Japanese Bioanalysis Forum
kel Elimination rate constant
LC Liquid chromatography
LC/ED Liquid chromatography with electrochemical detection
LC/FD Liquid chromatography with spectrofluorometric detection
LC/MS Liquid chromatography coupled to mass spectrometry
LC-MS/MS Liquid chromatography coupled to tandem mass spectrometry
LC/UV Liquid chromatography with spectrophotometric detection
LLE Liquid-liquid extraction
LLOQ Lower limit of quantification
ln Natural logarithm
LOD Limit of detection
log Logarithm
logP Partition-coefficient in octanol-water

194 List of abbreviations
LT Long-term (stability)
MAH Marketing authorisation holder
MALDI Matrix-assisted laser desorption ionisation (MS)
MCA Multi channel acquisition
ME Matrix effect
MF Matrix factor
MHLW Ministry of Health, Labour and Welfare, Japan
MHRA Medicines and Healthcare Products Regulatory Agency, UK
MIC Minimum inhibitory concentration
MOX Moxifloxacin
MRM Multiple-reaction-monitoring
MRSA Methicillin-resistant Staphylococcus aureus
MS Mass spectrometry
m/z Mass to charge ratio
OECD Organisation for Economic Cooperation and Development
OR Orifice voltage
PD Pharmacodynamics
PIP Piperacillin
PK Pharmacokinetics
pKa Logarithmic acid dissociation constant
po Peroral
PPB Plasma protein binding
PPT Protein precipitation
Q Blood flow
Q1 First quadrupole of a triple-quadrupole mass spectrometer
qd Quaque die (every day, once a day)
qid Quarter in die (four times daily)
rcf Relative centrifugal force (in multiples of g)

List of abbreviations 195
RE Relative error
RF Radio frequency
RNA Ribonucleic acid
ROX Roxithromycin
rpm Revolutions per minute
RT Room temperature
SD Standard deviation
SL Stock solution
S/N Signal-to-noise ratio
SOP Standard operating procedure
SPE Solid phase extraction
SQC Spiked quality control
t1/2 Half-life
tid Ter in die (three times daily)
TISP TurboIonSpray® (ESI source)
tmax Time to peak concentration
TOF Time of flight
ULOQ Upper limit of quantification
VAL Validation
V Volume of distribution

196 References
References
1 Goodman LS, Gilman A, Brunton LL, Chabner BA, Knollmann BC, Goodman & Gilman's the pharmacological basis of therapeutics. 12th ed. New York. 2011: McGraw-Hill. xvi, 2084 p.
2 FDA, Guidance for industry: Bioavailability and bioequivalence studies for orally administered drug products - general considerations. 2003: U.S. Department of Health and Human Services, Food and Drug Administration.
3 EMA, Guideline on the investigation of bioequivalence. 2010: Committee for medicinal products for human use (CHMP), European Medicines Agency.
4 FDA, Guidance for industry, investigators, and reviewers: Exploratory IND studies. 2006: U.S. Department of Health and Human Services, Food and Drug Administration.
5 Dost FH, Der Blutspiegel: Kinetik der Konzentrationsabläufe in der Kreislaufflüssigkeit. 1953, Leipzig: Thieme.
6 Pang KS, Durk MR. Physiologically-based pharmacokinetic modeling for absorption, transport, metabolism and excretion. J Pharmacokinet Pharmacodyn 2010;37(6):591-615.
7 Jones H, Rowland-Yeo K. Basic concepts in physiologically based pharmacokinetic modeling in drug discovery and development. CPT Pharmacometrics Syst Pharmacol 2013;2:e63.
8 Barrett JS, Della Casa Alberighi O, Laer S, Meibohm B. Physiologically based pharmacokinetic (PBPK) modeling in children. Clin Pharmacol Ther 2012;92(1):40-9.
9 Mutschler E, Mutschler Arzneimittelwirkungen: Lehrbuch der Pharmakologie und Toxikologie. 9th ed. 2008, Stuttgart: Wissenschaftliche Verlagsgesellschaft. xxvi, 1243.
10 Eagle H, Fleischman R, Musselman AD. Effect of schedule of administration on the therapeutic efficacy of penicillin; importance of the aggregate time penicillin remains at effectively bactericidal levels. Am J Med 1950;9(3):280-99.
11 Craig WA. Pharmacokinetic/pharmacodynamic parameters: rationale for antibacterial dosing of mice and men. Clin Infect Dis 1998;26(1):1-10; quiz 11-2.
12 Ambrose PG, Bhavnani SM, Rubino CM, Louie A, Gumbo T, Forrest A, Drusano GL. Pharmacokinetics-pharmacodynamics of antimicrobial therapy: it's not just for mice anymore. Clin Infect Dis 2007;44(1):79-86.
13 Frimodt-Moller N. How predictive is PK/PD for antibacterial agents? Int J Antimicrob Agents 2002;19(4):333-9.
14 Schentag JJ, Gilliland KK, Paladino JA. What have we learned from pharmacokinetic and pharmacodynamic theories? Clin Infect Dis 2001;32 Suppl 1:S39-46.
15 Nielsen EI, Cars O, Friberg LE. Pharmacokinetic/pharmacodynamic (PK/PD) indices of antibiotics predicted by a semimechanistic PKPD model: a step toward model-based dose optimization. Antimicrob Agents Chemother 2011;55(10):4619-30.
16 Nobel Media AB. All Nobel Prizes in Chemistry. 2012 [cited 2012 1 Nov]; Available from: http://www.nobelprize.org/nobel_prizes/chemistry/laureates/.

References 197
17 Dole M, Mack LL, Hines RL. Molecular Beams of Macroions. Journal of Chemical Physics 1968;49(5):2240-&.
18 Kebarle P, Verkerk UH. Electrospray: from ions in solution to ions in the gas phase, what we know now. Mass Spectrom Rev 2009;28(6):898-917.
19 Iribarne JV, Thomson BA. Evaporation of Small Ions from Charged Droplets. Journal of Chemical Physics 1976;64(6):2287-2294.
20 Loscertales IG, Delamora JF. Experiments on the Kinetics of Field Evaporation of Small Ions from Droplets. Journal of Chemical Physics 1995;103(12):5041-5060.
21 Gamero-Castano M, de la Mora JF. Kinetics of small ion evaporation from the charge and mass distribution of multiply charged clusters in electrosprays. Journal of Mass Spectrometry 2000;35(7):790-803.
22 Mack LL, Kralik P, Rheude A, Dole M. Molecular Beams of Macroions .2. Journal of Chemical Physics 1970;52(10):4977-&.
23 Kebarle P. A brief overview of the present status of the mechanisms involved in electrospray mass spectrometry. J Mass Spectrom 2000;35(7):804-17.
24 Tissue, B. M. Schematic of a quadrupole filter. 2000 [cited 2012 09 June]; Available from: http://www.files.chem.vt.edu/chem-ed/ms/quadrupo.html.
25 Anonymous, The API Book. 1994: PE SCIEX.
26 Kim T, Udseth HR, Smith RD. Improved ion transmission from atmospheric pressure to high vacuum using a multicapillary inlet and electrodynamic ion funnel interface. Anal Chem 2000;72(20):5014-9.
27 Sparkman OD. Mass Spectrometry PittCon® 2005. Journal of the American Society for Mass Spectrometry 2005;16(6):967-976.
28 Polson C, Sarkar P, Incledon B, Raguvaran V, Grant R. Optimization of protein precipitation based upon effectiveness of protein removal and ionization effect in liquid chromatography-tandem mass spectrometry. J Chromatogr B Analyt Technol Biomed Life Sci 2003;785(2):263-75.
29 Bonfiglio R, King RC, Olah TV, Merkle K. The effects of sample preparation methods on the variability of the electrospray ionization response for model drug compounds. Rapid Commun Mass Spectrom 1999;13(12):1175-1185.
30 Xu RN, Fan L, Rieser MJ, El-Shourbagy TA. Recent advances in high-throughput quantitative bioanalysis by LC-MS/MS. J Pharm Biomed Anal 2007;44(2):342-55.
31 Jemal M. High-throughput quantitative bioanalysis by LC/MS/MS. Biomed Chromatogr 2000;14(6):422-9.
32 ICH, Validation of Analytical Procedures: Text and Methodology. Q2(R1). 2005: International Conference on Harmonization.
33 FDA, Guidance for Industry: Bioanalytical Method Validation. 2001, Rockville, MD: U.S. Department of Health and Human Services, Food and Drug Administration.
34 EMA, Guideline on bioanalytical method validation. 2012: Committee for medicinal products for human use (CHMP), European Medicines Agency.
35 Rocci ML, Jr., Devanarayan V, Haughey DB, Jardieu P. Confirmatory reanalysis of incurred bioanalytical samples. AAPS J 2007;9(3):E336-43.

198 References
36 Fast DM, Kelley M, Viswanathan CT, O'Shaughnessy J, King SP, Chaudhary A, Weiner R, DeStefano AJ, Tang D. Workshop report and follow-up--AAPS Workshop on current topics in GLP bioanalysis: Assay reproducibility for incurred samples--implications of Crystal City recommendations. AAPS J 2009;11(2):238-41.
37 Viswanathan CT. Incurred sample reanalysis: a global transformation. Bioanalysis 2011;3(23):2601-2.
38 Viswanathan CT, Bansal S, Booth B, DeStefano AJ, Rose MJ, Sailstad J, Shah VP, Skelly JP, Swann PG, Weiner R. Workshop/conference report—Quantitative bioanalytical methods validation and implementation: Best practices for chromatographic and ligand binding assays. AAPS J 2007;9(1):E30-E42.
39 Booth B. Incurred sample reanalysis. Bioanalysis 2011;3(9):927-8.
40 Kelley M. Incurred sample reanalysis: it is just a matter of good scientific practice. Bioanalysis 2011;3(9):931-2.
41 Thway TM, Eschenberg M, Calamba D, Macaraeg C, Ma M, DeSilva B. Assessment of incurred sample reanalysis for macromolecules to evaluate bioanalytical method robustness: effects from imprecision. AAPS J 2011;13(2):291-8.
42 Timmerman P, Luedtke S, van Amsterdam P, Brudny-Kloeppel M, Lausecker B, Fischmann S, Globig S, Sennbro CJ, Jansat JM, Mulder H, Thomas E, Knutsson M, Kasel D, White SA, Kall MA, Mokrzycki-Issartel N, Freisleben A, Romero F, Andersen MP, Knebel N, de Zwart M, Laakso S, Hucker RS, Schmidt D, Gordon B, Abbott R, Boulanger P. Incurred sample reproducibility: views and recommendations by the European Bioanalysis Forum. Bioanalysis 2009;1(6):1049-56.
43 Wang S, Cyronak M, Yang E. Does a stable isotopically labeled internal standard always correct analyte response? A matrix effect study on a LC/MS/MS method for the determination of carvedilol enantiomers in human plasma. J Pharm Biomed Anal 2007;43(2):701-7.
44 Matuszewski BK, Constanzer ML, Chavez-Eng CM. Strategies for the assessment of matrix effect in quantitative bioanalytical methods based on HPLC-MS/MS. Anal Chem 2003;75(13):3019-30.
45 Van Eeckhaut A, Lanckmans K, Sarre S, Smolders I, Michotte Y. Validation of bioanalytical LC-MS/MS assays: evaluation of matrix effects. J Chromatogr B Analyt Technol Biomed Life Sci 2009;877(23):2198-207.
46 Dams R, Huestis MA, Lambert WE, Murphy CM. Matrix effect in bio-analysis of illicit drugs with LC-MS/MS: influence of ionization type, sample preparation, and biofluid. J Am Soc Mass Spectrom 2003;14(11):1290-4.
47 EMA, Reflection paper for laboratories that perform the analysis or evaluation of clinical trial samples. 2012: GCP Inspectors Working Group.
48 MHLW, Guideline on Bioanalytical Method Validation in Pharmaceutical Development 2013: Ministry of Health, Labour and Welfare, Japan.
49 Motta M, Ribeiro W, Ifa DR, Moares ME, Moraes MO, Corrado AP, De Nucci G. Bioequivalence evaluation of two roxithromycin formulations in healthy human volunteers by high performance liquid cromatography coupled to tandem mass spectrometry. Acta Physiol Pharmacol Ther Latinoam 1999;49(4):233-41.
50 Kousoulos C, Tsatsou G, Dotsikas Y, Apostolou C, Loukas YL. Validation of a fully automated high throughput liquid chromatographic/tandem mass spectrometric

References 199
method for roxithromycin quantification in human plasma. Application to a bioequivalence study. Biomed Chromatogr 2008;22(5):494-501.
51 Hang TJ, Zhang M, Song M, Shen JP, Zhang YD. Simultaneous determination and pharmacokinetic study of roxithromycin and ambroxol hydrochloride in human plasma by LC-MS/MS. Clin Chim Acta 2007;382(1-2):20-4.
52 Oswald S, Peters J, Venner M, Siegmund W. LC-MS/MS method for the simultaneous determination of clarithromycin, rifampicin and their main metabolites in horse plasma, epithelial lining fluid and broncho-alveolar cells. J Pharm Biomed Anal 2011;55(1):194-201.
53 Lerner FE, Caliendo G, Santagada V, Santana GSM, Moraes MEA, De Nucci G. Clarithromycin bioequivalence study of two oral formulations in healthy human volunteers. Int J Clin Pharmacol Ther 2000;38(7):345-54.
54 Vu DH, Koster RA, Wessels AM, Greijdanus B, Alffenaar JW, Uges DR. Troubleshooting carry-over of LC-MS/MS method for rifampicin, clarithromycin and metabolites in human plasma. J Chromatogr B Analyt Technol Biomed Life Sci 2013;917-918:1-4.
55 de Velde F, Alffenaar JW, Wessels AM, Greijdanus B, Uges DR. Simultaneous determination of clarithromycin, rifampicin and their main metabolites in human plasma by liquid chromatography-tandem mass spectrometry. J Chromatogr B Analyt Technol Biomed Life Sci 2009;877(18-19):1771-7.
56 Abeylath SC, Turos E. Drug delivery approaches to overcome bacterial resistance to beta-lactam antibiotics. Expert Opin Drug Deliv 2008;5(9):931-49.
57 Takada W, Adachi T, Kihara N, Kitamura S, Kitagawa T, Mifune M, Saito Y. Quantitative determination method for trace amount of penicillin contaminants in commercially available drug product by HPLC coupled with tandem mass spectrometry. Chem Pharm Bull (Tokyo) 2005;53(2):172-6.
58 Huang C, Gao J, Miao L. Simultaneous determination of flucloxacillin and ampicillin in human plasma by ultra performance liquid chromatography-tandem mass spectrometry and subsequent application to a clinical study in healthy Chinese volunteers. J Pharm Biomed Anal 2012;59:157-61.
59 Colin P, De Bock L, T'Jollyn H, Boussery K, Van Bocxlaer J. Development and validation of a fast and uniform approach to quantify beta-lactam antibiotics in human plasma by solid phase extraction-liquid chromatography-electrospray-tandem mass spectrometry. Talanta 2013;103:285-93.
60 Carlier M, Stove V, Roberts JA, Van de Velde E, De Waele JJ, Verstraete AG. Quantification of seven beta-lactam antibiotics and two beta-lactamase inhibitors in human plasma using a validated UPLC-MS/MS method. Int J Antimicrob Agents 2012;40(5):416-22.
61 Cohen-Wolkowiez M, White NR, Bridges A, Benjamin DK, Jr., Kashuba AD. Development of a liquid chromatography-tandem mass spectrometry assay of six antimicrobials in plasma for pharmacokinetic studies in premature infants. J Chromatogr B Analyt Technol Biomed Life Sci 2011;879(30):3497-506.
62 Ohmori T, Suzuki A, Niwa T, Ushikoshi H, Shirai K, Yoshida S, Ogura S, Itoh Y. Simultaneous determination of eight beta-lactam antibiotics in human serum by liquid chromatography-tandem mass spectrometry. J Chromatogr B Analyt Technol Biomed Life Sci 2011;879(15-16):1038-42.

200 References
63 Roberts CH, Smith C, Breen R, Gadhok R, Murphy M, Aryee A, Cropley I, Bhagani S, Hopkins S, Lipman M. Hepatotoxicity in the treatment of tuberculosis using moxifloxacin-containing regimens. Int J Tuberc Lung Dis 2011;15(9):1275-6.
64 Verma R, Dhamija R, Batts DH, Ross SC, Loehrke ME. Moxifloxacin induced fatal hepatotoxicity in a 72-year-old man: a case report. Cases J 2009;2:8063.
65 Pranger AD, Alffenaar JW, Wessels AM, Greijdanus B, Uges DR. Determination of moxifloxacin in human plasma, plasma ultrafiltrate, and cerebrospinal fluid by a rapid and simple liquid chromatography- tandem mass spectrometry method. J Anal Toxicol 2010;34(3):135-41.
66 Vishwanathan K, Bartlett MG, Stewart JT. Determination of moxifloxacin in human plasma by liquid chromatography electrospray ionization tandem mass spectrometry. J Pharm Biomed Anal 2002;30(4):961-8.
67 EMA, Draft guideline on validation of bioanalytical methods. 2009: Committee for medicinal products for human use (CHMP), European Medicines Agency.
68 McFarland JW, Berger CM, Froshauer SA, Hayashi SF, Hecker SJ, Jaynes BH, Jefson MR, Kamicker BJ, Lipinski CA, Lundy KM, Reese CP, Vu CB. Quantitative structure-activity relationships among macrolide antibacterial agents: in vitro and in vivo potency against Pasteurella multocida. J Med Chem 1997;40(9):1340-6.
69 Foye WO, Lemke TL, Williams DA, Foye's principles of medicinal chemistry. 6th ed. 2008, Philadelphia: Lippincott Williams & Wilkins. xiv, 1377 p., 8 p. of plates.
70 Douthwaite S, Champney WS. Structures of ketolides and macrolides determine their mode of interaction with the ribosomal target site. J Antimicrob Chemother 2001;48 Suppl T1:1-8.
71 Douthwaite S. Structure-activity relationships of ketolides vs. macrolides. Clin Microbiol Infect 2001;7 Suppl 3:11-7.
72 Remington JP, Remington's pharmaceutical sciences. 1965, Mack Pub. Co.: Easton, Pa.
73 Meylan WM, Howard PH. Atom/fragment contribution method for estimating octanol-water partition coefficients. J Pharm Sci 1995;84(1):83-92.
74 Tardrew PL, Mao JC, Kenney D. Antibacterial activity of 2'-esters of erythromycin. Appl Microbiol 1969;18(2):159-65.
75 Chun AHC, Seitz JA. Pharmacokinetics and Biological Availability of Erythromycin. Infection 1977;5(Suppl. 1):14-22.
76 Thompson PJ, Burgess KR, Marlin GE. Influence of food on absorption of erythromycin ethyl succinate. Antimicrob Agents Chemother 1980;18(5):829-31.
77 Dresser GK, Spence JD, Bailey DG. Pharmacokinetic-pharmacodynamic consequences and clinical relevance of cytochrome P450 3A4 inhibition. Clin Pharmacokinet 2000;38(1):41-57.
78 Periti P, Mazzei T, Mini E, Novelli A. Pharmacokinetic drug interactions of macrolides. Clin Pharmacokinet 1992;23(2):106-31.
79 Akiyoshi T, Ito M, Murase S, Miyazaki M, Guengerich FP, Nakamura K, Yamamoto K, Ohtani H. Mechanism-based inhibition profiles of erythromycin and clarithromycin with cytochrome P450 3A4 genetic variants. Drug Metab Pharmacokinet 2013;28(5):411-5.

References 201
80 Xiao W, Chen B, Yao S, Cheng Z. Simultaneous determination of erythromycin propionate and base in human plasma by high-performance liquid chromatography-electrospray mass spectrometry. J Chromatogr B Analyt Technol Biomed Life Sci 2005;817(2):153-8.
81 Monji H, Yamaguchi M, Aoki I, Ueno H. Highly sensitive high-performance liquid chromatographic determination method for a new erythromycin derivative, EM523, and its major metabolites in human plasma and urine using post-column tris(2,2'-bipyridine) ruthenium(III) chemiluminescence detection. J Chromatogr B Biomed Sci Appl 1997;690(1-2):305-13.
82 Toreson H, Eriksson BM. Determination of erythromycin in gastric juice and blood plasma by liquid chromatography and electrochemical detection. J Chromatogr B Biomed Appl 1995;673(1):81-9.
83 Yamashita K, Motohashi M, Yashiki T. Sensitive high-performance liquid chromatographic determination of EM523, a new erythromycin derivative, in human plasma and urine with ultraviolet detection using column switching. J Chromatogr 1993;616(1):144-50.
84 Marvola M, Nykanen S, Nokelainen M. Bioavailability of erythromycin acistrate from hard gelatin capsules containing sodium bicarbonate. Pharm Res 1991;8(8):1056-8.
85 Laakso S, Scheinin M, Anttila M. Determination of erythromycin base and 2'-acetylerythromycin in human plasma using high-performance liquid chromatography with electrochemical detection. J Chromatogr 1990;526(2):475-86.
86 Cachet T, Lannoo P, Paesen J, Janssen G, Hoogmartens J. Determination of erythromycin ethylsuccinate by liquid chromatography. J Chromatogr 1992;600(1):99-108.
87 Feng YC, Hu CQ. Construction of universal quantitative models for determination of roxithromycin and erythromycin ethylsuccinate in tablets from different manufacturers using near infrared reflectance spectroscopy. J Pharm Biomed Anal 2006;41(2):373-84.
88 Deicke A, Suverkrup R. Dose uniformity and redispersibility of pharmaceutical suspensions 2: assessment of three commercial erythromycin ethyl succinate oral liquids. Eur J Pharm Biopharm 2000;49(1):73-8.
89 Tsuji K, Goetz JF. Elevated column temperature for the high-performance liquid chromatoraphic determination of erythromycin and erythromycin ethylsuccinate. Journal of Chromatography A 1978;157:185-196.
90 Liu YM, Shi YM, Liu ZL, Peng LF. Sensitive determination of tilmicosin, erythromycin ethylsuccinate and clindamycin by CE with electrochemiluminescence detection using azithromycin as internal standard and its applications. J Sep Sci 2010;33(9):1305-11.
91 Gu Y, Wang G, Sun J. Simultaneous determination of erythromycin ethylsuccinate and its metabolite erythromycin in human plasma using liquid chromatography-electrospray ionization mass spectrometry for clinical study. J Pharm Biomed Anal 2006;40(3):737-43.
92 Kokkonen PS, Niessen WM, Tjaden UR, van der Greef J. Bioanalysis of erythromycin 2'-ethylsuccinate in plasma using phase-system switching continuous-flow fast atom bombardment liquid chromatography-mass spectrometry. J Chromatogr 1991;565(1-2):265-75.

202 References
93 Ottoila P, Taskinen J. Quantitative determination of erythromycin 2'-ethylsuccinate in human plasma by fast atom bombardment mass spectrometry. Biomed Environ Mass Spectrom 1987;14(11):659-62.
94 Croteau D, Vallee F, Bergeron MG, LeBel M. High-performance liquid chromatographic assay of erythromycin and its esters using electrochemical detection. J Chromatogr 1987;419:205-12.
95 Tsuji K. Fluorimetric determination of erythromycin and erythromycin ethylsuccinate in serum by a high-performance liquid chromatographic post-column, on-stream derivatization and extraction method. J Chromatogr 1978;158:337-48.
96 Lucchetti D, Fabrizi L, Esposito A, Guandalini E, Di Pasquale M, Coni E. Simple confirmatory method for the determination of erythromycin residues in trout: a fast liquid-liquid extraction followed by liquid chromatography-tandem mass spectrometry. J Agric Food Chem 2005;53(25):9689-94.
97 Pleasance S, Kelly J, LeBlanc MD, Quilliam MA, Boyd RK, Kitts DD, McErlane K, Bailey MR, North DH. Determination of erythromycin A in salmon tissue by liquid chromatography with ion-spray mass spectrometry. Biol Mass Spectrom 1992;21(12):675-87.
98 Deubel A, Holzgrabe U. Development of an enhanced separation of erythromycin and its related substances by liquid chromatography. J Pharm Biomed Anal 2007;43(2):493-8.
99 Lai CC, Tsai PL, Yu C, Her GR. Analysis of a commercial preparation of erythromycin estolates by tandem mass spectrometry and high performance liquid chromatography/electrospray ionization tandem mass spectrometry using an ion trap mass spectrometer. Rapid Commun Mass Spectrom 2000;14(6):468-75.
100 Deubel A, Fandino AS, Sorgel F, Holzgrabe U. Determination of erythromycin and related substances in commercial samples using liquid chromatography/ion trap mass spectrometry. J Chromatogr A 2006;1136(1):39-47.
101 Volmer DA, Hui JP. Study of erythromycin A decomposition products in aqueous solution by solid-phase microextraction/liquid chromatography/tandem mass spectrometry. Rapid Commun Mass Spectrom 1998;12(3):123-9.
102 Li YX, Neufeld K, Chastain J, Curtis A, Velagaleti P. Sensitive determination of erythromycin in human plasma by LC-MS/MS. J Pharm Biomed Anal 1998;16(6):961-70.
103 Terespolsky SA, Kanfer I. Stability of erythromycin and some of its esters in methanol and acetonitrile. Int J Pharm 1995;115:123-128.
104 Nakagawa Y, Itai S, Yoshida T, Nagai T. Physicochemical properties and stability in the acidic solution of a new macrolide antibiotic, clarithromycin, in comparison with erythromycin. Chem Pharm Bull (Tokyo) 1992;40(3):725-8.
105 Cachet T, Van den Mooter G, Hauchecorne R, Vinckier C, Hoogmartens J. Decomposition kinetics of erythromycin A in acidic aqueous solutions. Int J Pharm 1989;55:59-65.
106 Croteau D, Bergeron MG, LeBel M. Pharmacokinetic advantages of erythromycin estolate over ethylsuccinate as determined by high-pressure liquid chromatography. Antimicrob Agents Chemother 1988;32(4):561-5.
107 Griffith RS, Black HR. Comparison of blood levels following pediatric suspensions of erythromycin estolate and erythromycin ethyl succinate. Clin Med 1969;76:16-18.

References 203
108 Jain R, Danziger LH. The macrolide antibiotics: a pharmacokinetic and pharmacodynamic overview. Curr Pharm Des 2004;10(25):3045-53.
109 Puri SK, Lassman HB. Roxithromycin: a pharmacokinetic review of a macrolide. J Antimicrob Chemother 1987;20 Suppl B:89-100.
110 Qiang Z, Adams C. Potentiometric determination of acid dissociation constants (pKa) for human and veterinary antibiotics. Water Res 2004;38(12):2874-90.
111 Nilsen OG. Comparative pharmacokinetics of macrolides. J Antimicrob Chemother 1987;20 Suppl B:81-8.
112 Goodman LS, Gilman A, Brunton LL, Lazo JS, Parker KL, Goodman & Gilman's the pharmacological basis of therapeutics. 11th ed. 2006, New York: McGraw-Hill. xxiii, 2021 p.
113 Bryskier A. Roxithromycin: review of its antimicrobial activity. J Antimicrob Chemother 1998;41 Suppl B:1-21.
114 Hedenmo M, Eriksson BM. Liquid chromatographic determination of the macrolide antibiotics roxithromycin and clarithromycin in plasma by automated solid-phase extraction and electrochemical detection. J Chromatogr A 1995;692(1-2):161-6.
115 Kees F, Spangler S, Wellenhofer M. Determination of macrolides in biological matrices by high-performance liquid chromatography with electrochemical detection. J Chromatogr A 1998;812(1-2):287-93.
116 Taninaka C, Ohtani H, Hanada E, Kotaki H, Sato H, Iga T. Determination of erythromycin, clarithromycin, roxithromycin, and azithromycin in plasma by high-performance liquid chromatography with amperometric detection. J Chromatogr B Biomed Sci Appl 2000;738(2):405-11.
117 Birkett DJ, Robson RA, Grgurinovich N, Tonkin A. Single oral dose pharmacokinetics of erythromycin and roxithromycin and the effects of chronic dosing. Ther Drug Monit 1990;12(1):65-71.
118 Sastre Torano J, Guchelaar HJ. Quantitative determination of the macrolide antibiotics erythromycin, roxithromycin, azithromycin and clarithromycin in human serum by high-performance liquid chromatography using pre-column derivatization with 9-fluorenylmethyloxycarbonyl chloride and fluorescence detection. J Chromatogr B Biomed Sci Appl 1998;720(1-2):89-97.
119 Glowka FK, Karazniewicz-Lada M. Determination of roxithromycin in human plasma by HPLC with fluorescence and UV absorbance detection: application to a pharmacokinetic study. J Chromatogr B Analyt Technol Biomed Life Sci 2007;852(1-2):669-73.
120 Macek J, Ptacek P, Klima J. Determination of roxithromycin in human plasma by high-performance liquid chromatography with spectrophotometric detection. J Chromatogr B Biomed Sci Appl 1999;723(1-2):233-8.
121 Qin Y, Zou Y, Liang M, Huang Y, Yu Q, Feng P. [Determination of roxithromycin in serum by high-performance liquid chromatography with ultraviolet detection]. Hua Xi Yi Ke Da Xue Xue Bao 2001;32(4):612-4.
122 Garcia-Mayor MA, Garcinuno RM, Fernandez-Hernando P, Durand-Alegria JS. Liquid chromatography-UV diode-array detection method for multi-residue determination of macrolide antibiotics in sheep's milk. J Chromatogr A 2006;1122(1-2):76-83.

204 References
123 Bogialli S, Di Corcia A, Lagana A, Mastrantoni V, Sergi M. A simple and rapid confirmatory assay for analyzing antibiotic residues of the macrolide class and lincomycin in bovine milk and yoghurt: hot water extraction followed by liquid chromatography/tandem mass spectrometry. Rapid Commun Mass Spectrom 2007;21(2):237-46.
124 Wang J, Leung D, Lenz SP. Determination of five macrolide antibiotic residues in raw milk using liquid chromatography-electrospray ionization tandem mass spectrometry. J Agric Food Chem 2006;54(8):2873-80.
125 Benetti C, Piro R, Binato G, Angeletti R, Biancotto G. Simultaneous determination of lincomycin and five macrolide antibiotic residues in honey by liquid chromatography coupled to electrospray ionization mass spectrometry (LC-MS/MS). Food Addit Contam 2006;23(11):1099-108.
126 Barrett B, Borek-Dohalsky V, Fejt P, Vaingatova S, Huclova J, Nemec B, Jelinek I. Validated HPLC-MS-MS method for determination of azithromycin in human plasma. Anal Bioanal Chem 2005;383(2):210-7.
127 Wang P, Qi M, Jin X. Determination of roxithromycin in rat lung tissue by liquid chromatography-mass spectrometry. J Pharm Biomed Anal 2005;39(3-4):618-23.
128 Gobel A, McArdell CS, Suter MJ, Giger W. Trace determination of macrolide and sulfonamide antimicrobials, a human sulfonamide metabolite, and trimethoprim in wastewater using liquid chromatography coupled to electrospray tandem mass spectrometry. Anal Chem 2004;76(16):4756-64.
129 Yang S, Carlson KH. Solid-phase extraction-high-performance liquid chromatography-ion trap mass spectrometry for analysis of trace concentrations of macrolide antibiotics in natural and waste water matrices. J Chromatogr A 2004;1038(1-2):141-55.
130 Kearney GC, Gates PJ, Leadlay PF, Staunton J, Jones R. Structural elucidation studies of erythromycins by electrospray tandem mass spectrometry II. Rapid Commun Mass Spectrom 1999;13(16):1650-6.
131 Fiese EF, Steffen SH. Comparison of the acid stability of azithromycin and erythromycin A. J Antimicrob Chemother 1990;25 Suppl A:39-47.
132 Anonymous, Guidance for Industry: Bioanalytical Method Validation. May 2001, Rockville, MD: U.S. Department of Health and Human Services, Food and Drug Administration.
133 Tremblay D, Jaeger H, Fourtillan JB, Manuel C. Pharmacokinetics of three single doses (150 mg, 300 mg, 450 mg) of roxithromycin in young volunteers. The British Journal of Clinical Practice 1988;42(Supplement 55):49-50.
134 Nilsen OG, Aamo T, Zahlsen K, Svarva P. Macrolide pharmacokinetics and dose scheduling of roxithromycin. Diagn Microbiol Infect Dis 1992;15(4 Suppl):71S-76S.
135 Sun J, Zhang T, Qiu F, Liu Y, Tang J, Huang H, He Z. Impact of pharmaceutical dosage forms on the pharmacokinetics of roxithromycin in healthy human volunteers. J Antimicrob Chemother 2005;55(5):796-9.
136 Huang T, Li T, Yang L, Xu X, Zheng P, Zhang T, Zheng J, Chen S. [Relative bioavailability of roxithromycin dispersive tablets in healthy volunteers]. Sheng Wu Yi Xue Gong Cheng Xue Za Zhi 2007;24(2):376-8.

References 205
137 Zheng L, Qin Y, Nan F, Wang Y, Xu N, Liang M. [Pharmacokinetics and relative bioavailability study of roxithromycin tablet in Chinese healthy volunteers by LC-MS/MS]. Sheng Wu Yi Xue Gong Cheng Xue Za Zhi 2009;26(6):1315-9.
138 Fernandes PB, Bailer R, Swanson R, Hanson CW, McDonald E, Ramer N, Hardy D, Shipkowitz N, Bower RR, Gade E. In vitro and in vivo evaluation of A-56268 (TE-031), a new macrolide. Antimicrob Agents Chemother 1986;30(6):865-73.
139 Ishii K, Saito Y, Itai S, Nemoto M, Takayama K, Nagai T. Comparative study of pharmacokinetic parameters between clarithromycin and erythromycin stearate in relation to their physicochemical properties. Drug Dev Ind Pharm 1998;24(2):129-37.
140 Chu SY, Deaton R, Cavanaugh J. Absolute bioavailability of clarithromycin after oral administration in humans. Antimicrob Agents Chemother 1992;36(5):1147-50.
141 Nightingale CH. Pharmacokinetics and pharmacodynamics of newer macrolides. Pediatr Infect Dis J 1997;16(4):438-43.
142 Rodvold KA. Clinical pharmacokinetics of clarithromycin. Clin Pharmacokinet 1999;37(5):385-98.
143 Chu SY, Sennello LT, Bunnell ST, Varga LL, Wilson DS, Sonders RC. Pharmacokinetics of clarithromycin, a new macrolide, after single ascending oral doses. Antimicrob Agents Chemother 1992;36(11):2447-53.
144 Abduljalil K, Kinzig M, Bulitta J, Horkovics-Kovats S, Sorgel F, Rodamer M, Fuhr U. Modeling the autoinhibition of clarithromycin metabolism during repeated oral administration. Antimicrob Agents Chemother 2009;53(7):2892-901.
145 Amini H, Ahmadiani A. Sensitive determination of clarithromycin in human plasma by high-performance liquid chromatography with spectrophotometric detection. J Chromatogr B Analyt Technol Biomed Life Sci 2005;817(2):193-7.
146 Chu S, Wilson DS, Deaton RL, Mackenthun AV, Eason CN, Cavanaugh JH. Single- and multiple-dose pharmacokinetics of clarithromycin, a new macrolide antimicrobial. J Clin Pharmacol 1993;33(8):719-26.
147 Kees F, Wellenhofer M, Grobecker H. Serum and cellular pharmacokinetics of clarithromycin 500 mg q.d. and 250 mg b.i.d. in volunteers. Infection 1995;23(3):168-72.
148 Guay DR, Craft JC. Overview of the pharmacology of clarithromycin suspension in children and a comparison with that in adults. Pediatr Infect Dis J 1993;12(12 Suppl 3):S106-11.
149 Traunmuller F, Zeitlinger M, Zeleny P, Muller M, Joukhadar C. Pharmacokinetics of single- and multiple-dose oral clarithromycin in soft tissues determined by microdialysis. Antimicrob Agents Chemother 2007;51(9):3185-9.
150 Koytchev R, Ozalp Y, Erenmemisoglu A, van der Meer MJ, Alpan RS. Studies on the bioequivalence of different strengths of tablets containing clarithromycin. Arzneimittelforschung 2004;54(9A):588-93.
151 Steinhilber D, Schubert-Zsilavecz M, Roth HJ, Medizinische Chemie: Targets - Arzneistoffe - Chemische Biologie. 2nd ed. 2010, Stuttgart: Deutscher Apotheker Verlag. xvi, 703.
152 Conte JE, Jr., Golden J, Duncan S, McKenna E, Lin E, Zurlinden E. Single-dose intrapulmonary pharmacokinetics of azithromycin, clarithromycin, ciprofloxacin, and cefuroxime in volunteer subjects. Antimicrob Agents Chemother 1996;40(7):1617-22.

206 References
153 Rodvold KA, Gotfried MH, Danziger LH, Servi RJ. Intrapulmonary steady-state concentrations of clarithromycin and azithromycin in healthy adult volunteers. Antimicrob Agents Chemother 1997;41(6):1399-402.
154 Conte JE, Jr., Golden JA, Duncan S, McKenna E, Zurlinden E. Intrapulmonary pharmacokinetics of clarithromycin and of erythromycin. Antimicrob Agents Chemother 1995;39(2):334-8.
155 Niopas I, Daftsios AC. Determination of clarithromycin in human plasma by HPLC with electrochemical detection: validation and application in pharmacokinetic study. Biomed Chromatogr 2001;15(8):507-8.
156 Choi SJ, Kim SB, Lee HY, Na DH, Yoon YS, Lee SS, Kim JH, Lee KC, Lee HS. Column-switching high-performance liquid chromatographic determination of clarithromycin in human plasma with electrochemical detection. Talanta 2001;54(2):377-82.
157 Zaater MF, Tahboub YR, Ghanem E. Determination and stability assessment of clarithromycin in human plasma using RP-LC with electrochemical detection. J Chromatogr Sci 2012;50(9):763-8.
158 Li W, Jia H, Zhao K. Determination of clarithromycin in rat plasma by HPLC-UV method with pre-column derivatization. Talanta 2007;71(1):385-90.
159 Bahrami G, Mohammadi B. Determination of clarithromycin in human serum by high-performance liquid chromatography after pre-column derivatization with 9-fluorenylmethyl chloroformate: application to a bioequivalence study. J Chromatogr B Analyt Technol Biomed Life Sci 2007;850(1-2):417-22.
160 Zakeri-Milani P, Valizadeh H, Ghanbarzadeh S, Nemati M. Pharmacokinetics and comparative bioavailability study of two clarithromycin suspensions following administration of a single oral dose to healthy volunteers. Arzneimittelforschung 2009;59(8):429-32.
161 Wang YJ, Wu YT, Lin JY, Chu CH, Huang HY, Wang YC, Chen JK, Yang CS. Rapid quantitative analysis of clarithromycin in rat plasma by UPLC-MS/MS after intravenous injection of the clarithromycin-loaded ultrafine PLGA nanoparticles. J Chromatogr B Analyt Technol Biomed Life Sci 2012;895-896:178-81.
162 Dubois M, Fluchard D, Sior E, Delahaut P. Identification and quantification of five macrolide antibiotics in several tissues, eggs and milk by liquid chromatography-electrospray tandem mass spectrometry. J Chromatogr B Biomed Sci Appl 2001;753(2):189-202.
163 Fujimura S, Sato T, Mikami T, Kikuchi T, Gomi K, Watanabe A. Combined efficacy of clarithromycin plus cefazolin or vancomycin against Staphylococcus aureus biofilms formed on titanium medical devices. Int J Antimicrob Agents 2008;32(6):481-4.
164 Martos PA, Lehotay SJ, Shurmer B. Ultratrace analysis of nine macrolides, including tulathromycin A (Draxxin), in edible animal tissues with minicolumn liquid chromatography tandem mass spectrometry. J Agric Food Chem 2008;56(19):8844-50.
165 Draisci R, Palleschi L, Ferretti E, Achene L, Cecilia A. Confirmatory method for macrolide residues in bovine tissues by micro-liquid chromatography-tandem mass spectrometry. J Chromatogr A 2001;926(1):97-104.

References 207
166 De Alwis H, Heller DN. Multiclass, multiresidue method for the detection of antibiotic residues in distillers grains by liquid chromatography and ion trap tandem mass spectrometry. J Chromatogr A 2010;1217(18):3076-84.
167 Siemens J, Huschek G, Siebe C, Kaupenjohann M. Concentrations and mobility of human pharmaceuticals in the world's largest wastewater irrigation system, Mexico City-Mezquital Valley. Water Res 2008;42(8-9):2124-34.
168 Spongberg AL, Witter JD. Pharmaceutical compounds in the wastewater process stream in Northwest Ohio. Sci Total Environ 2008;397(1-3):148-57.
169 McClure EL, Wong CS. Solid phase microextraction of macrolide, trimethoprim, and sulfonamide antibiotics in wastewaters. J Chromatogr A 2007;1169(1-2):53-62.
170 Shin J, Pauly DF, Johnson JA, Frye RF. Simplified method for determination of clarithromycin in human plasma using protein precipitation in a 96-well format and liquid chromatography-tandem mass spectrometry. J Chromatogr B Analyt Technol Biomed Life Sci 2008;871(1):130-4.
171 van Rooyen GF, Smit MJ, De Jager AD, Hundt HK, Swart KJ, Hundt AF. Sensitive liquid chromatography-tandem mass spectrometry method for the determination of clarithromycin in human plasma. J Chromatogr B Analyt Technol Biomed Life Sci 2002;768(2):223-9.
172 Li W, Rettig J, Jiang X, Francisco DT, Naidong W. Liquid chromatographic-electrospray tandem mass spectrometric determination of clarithromycin in human plasma. Biomed Chromatogr 2006;20(11):1242-51.
173 Jiang Y, Wang J, Li H, Wang Y, Gu J. Determination of clarithromycin in human plasma by liquid chromatography-electrospray ionization tandem mass spectrometry. J Pharm Biomed Anal 2007;43(4):1460-4.
174 Leonard S, Ferraro M, Adams E, Hoogmartens J, Van Schepdael A. Application of liquid chromatography/ion trap mass spectrometry to the characterization of the related substances of clarithromycin. Rapid Commun Mass Spectrom 2006;20(20):3101-10.
175 Lappin G, Shishikura Y, Jochemsen R, Weaver RJ, Gesson C, Brian Houston J, Oosterhuis B, Bjerrum OJ, Grynkiewicz G, Alder J, Rowland M, Garner C. Comparative pharmacokinetics between a microdose and therapeutic dose for clarithromycin, sumatriptan, propafenone, paracetamol (acetaminophen), and phenobarbital in human volunteers. Eur J Pharm Sci 2011;43(3):141-50.
176 Wang J, Leung D. Analyses of macrolide antibiotic residues in eggs, raw milk, and honey using both ultra-performance liquid chromatography/quadrupole time-of-flight mass spectrometry and high-performance liquid chromatography/tandem mass spectrometry. Rapid Commun Mass Spectrom 2007;21(19):3213-22.
177 Wang J. Analysis of macrolide antibiotics, using liquid chromatography-mass spectrometry, in food, biological and environmental matrices. Mass Spectrom Rev 2009;28(1):50-92.
178 Abuin S, Codony R, Compano R, Granados M, Prat MD. Analysis of macrolide antibiotics in river water by solid-phase extraction and liquid chromatography-mass spectrometry. J Chromatogr A 2006;1114(1):73-81.
179 Schlusener MP, Bester K. Determination of steroid hormones, hormone conjugates and macrolide antibiotics in influents and effluents of sewage treatment plants utilising high-performance liquid chromatography/tandem mass spectrometry with

208 References
electrospray and atmospheric pressure chemical ionisation. Rapid Commun Mass Spectrom 2005;19(22):3269-78.
180 Gobel A, Thomsen A, McArdell CS, Alder AC, Giger W, Theiss N, Loffler D, Ternes TA. Extraction and determination of sulfonamides, macrolides, and trimethoprim in sewage sludge. J Chromatogr A 2005;1085(2):179-89.
181 Hardy DJ, Hensey DM, Beyer JM, Vojtko C, McDonald EJ, Fernandes PB. Comparative in vitro activities of new 14-, 15-, and 16-membered macrolides. Antimicrob Agents Chemother 1988;32(11):1710-9.
182 Hardy DJ. Extent and spectrum of the antimicrobial activity of clarithromycin. Pediatr Infect Dis J 1993;12(12 Suppl 3):S99-105.
183 Van Bambeke F, Tulkens PM. Macrolides: pharmacokinetics and pharmacodynamics. Int J Antimicrob Agents 2001;18 Suppl 1:S17-23.
184 Sutherland R, Croydon EA, Rolinson GN. Flucloxacillin, a new isoxazolyl penicillin, compared with oxacillin, cloxacillin, and dicloxacillin. Br Med J 1970;4(5733):455-60.
185 Roder BL, Frimodt-Moller N, Espersen F, Rasmussen SN. Dicloxacillin and flucloxacillin: pharmacokinetics, protein binding and serum bactericidal titers in healthy subjects after oral administration. Infection 1995;23(2):107-12.
186 Shah PM. Oxacilline. Chemotherapie Journal 2005;14(2):35-37.
187 Landersdorfer CB, Kirkpatrick CM, Kinzig M, Bulitta JB, Holzgrabe U, Sorgel F. Inhibition of flucloxacillin tubular renal secretion by piperacillin. Br J Clin Pharmacol 2008;66(5):648-59.
188 Sörgel F, Bulitta J, Landersdorfer C. Pharmakokinetik und Pharmakodynamik der β-Lactame. Pharm Unserer Zeit 2006;35(5):438-451.
189 LOGKOW database. [cited 2014 19 March]; Available from: http://logkow.cisti.nrc.ca.
190 Kiss IJ, Farago E, Gomory A, Szamaranszky J. Investigations on the flucloxacillin levels in human serum, lung tissue, pericardial fluid and heart tissue. Int J Clin Pharmacol Ther Toxicol 1980;18(9):405-11.
191 Herngren L, Ehrnebo M, Broberger U. Pharmacokinetics of free and total flucloxacillin in newborn infants. Eur J Clin Pharmacol 1987;32(4):403-9.
192 Thijssen HH. Analysis of isoxazolyl penicillins and their metabolites in body fluids by high-performance liquid chromatography. J Chromatogr 1980;183(3):339-45.
193 Paton DM, Mander P, Avery RJ. Bioavailability and half-life of two preparations of flucloxacillin. N Z Med J 1982;95(719):766-8.
194 Hung CT, Lim JK, Zoest AR, Lam FC. Optimization of high-performance liquid chromatographic analysis for isoxazolyl penicillins using factorial design. J Chromatogr 1988;425(2):331-41.
195 Charles BG, Foo CC, Gath J. Rapid column liquid chromatographic analysis of flucloxacillin in plasma on a microparticulate pre-column. J Chromatogr B Biomed Appl 1994;660(1):186-90.
196 Pullen J, Stolk LM, Neef C, Zimmermann LJ. Microanalysis of amoxicillin, flucloxacillin, and rifampicin in neonatal plasma. Biomed Chromatogr 2007;21(12):1259-65.

References 209
197 Zhou Q, Ruan Z, Yuan H, Jiang B, Xu D. RP-HPLC analysis of flucloxacillin in human plasma: validation and application to a bioequivalence study. Pharmazie 2007;62(2):101-4.
198 Paton DM. Comparative bioavailability and half-lives of cloxacillin and flucloxacillin. Int J Clin Pharmacol Res 1986;6(5):347-9.
199 Rabbolini S, Verardo E, Da Col M, Gioacchini AM, Traldi P. Negative ion electrospray ionization tandem mass spectrometry in the structural characterization of penicillins. Rapid Commun Mass Spectrom 1998;12(22):1820-6.
200 Hansch C, Leo A, Hoekman DH, Exploring QSAR. ACS professional reference book. 1995, Washington, DC: American Chemical Society.
201 McWhinney BC, Wallis SC, Hillister T, Roberts JA, Lipman J, Ungerer JP. Analysis of 12 beta-lactam antibiotics in human plasma by HPLC with ultraviolet detection. J Chromatogr B Analyt Technol Biomed Life Sci 2010;878(22):2039-43.
202 Landersdorfer CB, Kirkpatrick CM, Kinzig-Schippers M, Bulitta JB, Holzgrabe U, Drusano GL, Sorgel F. Population pharmacokinetics at two dose levels and pharmacodynamic profiling of flucloxacillin. Antimicrob Agents Chemother 2007;51(9):3290-7.
203 Cheung WK, Greene DS, Kuye O, Shin K, Tonelli AP, Houston A, Hibberd M, Faulkner RD, Silber BM. Pharmacokinetics of YTR830H and piperacillin after intravenous coadministration. J Chemother 1989;1(4 Suppl):507-8.
204 Wong SL, Sorgel F, Kinzig M, Goldberg MR, Kitt MM, Barriere SL. Lack of pharmacokinetic drug interactions following concomitant administration of telavancin with aztreonam or piperacillin/tazobactam in healthy participants. J Clin Pharmacol 2009;49(7):816-23.
205 Kinzig M, Sorgel F, Brismar B, Nord CE. Pharmacokinetics and tissue penetration of tazobactam and piperacillin in patients undergoing colorectal surgery. Antimicrob Agents Chemother 1992;36(9):1997-2004.
206 Sorgel F, Kinzig M. Pharmacokinetic characteristics of piperacillin/tazobactam. Intensive Care Med 1994;20 Suppl 3:S14-20.
207 Welling PG, Craig WA, Bundtzen RW, Kwok FW, Gerber AU, Madsen PO. Pharmacokinetics of piperacillin in subjects with various degrees of renal function. Antimicrob Agents Chemother 1983;23(6):881-7.
208 De Schepper PJ, Tjandramaga TB, Mullie A, Verbesselt R, van Hecken A, Verberckmoes R, Verbist L. Comparative pharmacokinetics of piperacillin in normals and in patients with renal failure. J Antimicrob Chemother 1982;9 Suppl B:49-57.
209 Buck C, Bertram N, Ackermann T, Sauerbruch T, Derendorf H, Paar WD. Pharmacokinetics of piperacillin-tazobactam: intermittent dosing versus continuous infusion. Int J Antimicrob Agents 2005;25(1):62-7.
210 Burgess DS, Waldrep T. Pharmacokinetics and pharmacodynamics of piperacillin/tazobactam when administered by continuous infusion and intermittent dosing. Clin Ther 2002;24(7):1090-104.
211 Occhipinti DJ, Pendland SL, Schoonover LL, Rypins EB, Danziger LH, Rodvold KA. Pharmacokinetics and pharmacodynamics of two multiple-dose piperacillin-tazobactam regimens. Antimicrob Agents Chemother 1997;41(11):2511-7.

210 References
212 Kim MK, Capitano B, Mattoes HM, Xuan D, Quintiliani R, Nightingale CH, Nicolau DP. Pharmacokinetic and pharmacodynamic evaluation of two dosing regimens for piperacillin-tazobactam. Pharmacotherapy 2002;22(5):569-77.
213 Kim MK, Xuan D, Quintiliani R, Nightingale CH, Nicolau DP. Pharmacokinetic and pharmacodynamic profile of high dose extended interval piperacillin-tazobactam. J Antimicrob Chemother 2001;48(2):259-67.
214 Mattoes HM, Capitano B, Kim MK, Xuan D, Quintiliani R, Nightingale CH, Nicolau DP. Comparative pharmacokinetic and pharmacodynamic profile of piperacillin/tazobactam 3.375G Q4H and 4.5G Q6H. Chemotherapy 2002;48(2):59-63.
215 Fass RJ, Prior RB. Comparative in vitro activities of piperacillin-tazobactam and ticarcillin-clavulanate. Antimicrob Agents Chemother 1989;33(8):1268-74.
216 Sorgel F, Kinzig M. The chemistry, pharmacokinetics and tissue distribution of piperacillin/tazobactam. J Antimicrob Chemother 1993;31 Suppl A:39-60.
217 Wise R, Logan M, Cooper M, Andrews JM. Pharmacokinetics and tissue penetration of tazobactam administered alone and with piperacillin. Antimicrob Agents Chemother 1991;35(6):1081-4.
218 Dowell JA, Korth-Bradley J, Milisci M, Tantillo K, Amorusi P, Tse S. Evaluating possible pharmacokinetic interactions between tobramycin, piperacillin, and a combination of piperacillin and tazobactam in patients with various degrees of renal impairment. J Clin Pharmacol 2001;41(9):979-86.
219 Komuro M, Maeda T, Kakuo H, Matsushita H, Shimada J. Inhibition of the renal excretion of tazobactam by piperacillin. J Antimicrob Chemother 1994;34(4):555-64.
220 Bulitta JB, Kinzig M, Jakob V, Holzgrabe U, Sorgel F, Holford NH. Nonlinear pharmacokinetics of piperacillin in healthy volunteers--implications for optimal dosage regimens. Br J Clin Pharmacol 2010;70(5):682-93.
221 Tjandramaga TB, Mullie A, Verbesselt R, De Schepper PJ, Verbist L. Piperacillin: human pharmacokinetics after intravenous and intramuscular administration. Antimicrob Agents Chemother 1978;14(6):829-37.
222 Vinks AA, Den Hollander JG, Overbeek SE, Jelliffe RW, Mouton JW. Population pharmacokinetic analysis of nonlinear behavior of piperacillin during intermittent or continuous infusion in patients with cystic fibrosis. Antimicrob Agents Chemother 2003;47(2):541-7.
223 Bergan T, Williams JD. Dose dependence of piperacillin pharmacokinetics. Chemotherapy 1982;28(3):153-9.
224 Bulitta JB, Duffull SB, Kinzig-Schippers M, Holzgrabe U, Stephan U, Drusano GL, Sorgel F. Systematic comparison of the population pharmacokinetics and pharmacodynamics of piperacillin in cystic fibrosis patients and healthy volunteers. Antimicrob Agents Chemother 2007;51(7):2497-507.
225 Evans MA, Wilson P, Leung T, Williams JD. Pharmacokinetics of piperacillin following intravenous administration. J Antimicrob Chemother 1978;4(3):255-61.
226 Ghibellini G, Vasist LS, Hill TE, Heizer WD, Kowalsky RJ, Brouwer KL. Determination of the biliary excretion of piperacillin in humans using a novel method. Br J Clin Pharmacol 2006;62(3):304-8.

References 211
227 Westphal JF, Brogard JM, Caro-Sampara F, Adloff M, Blickle JF, Monteil H, Jehl F. Assessment of biliary excretion of piperacillin-tazobactam in humans. Antimicrob Agents Chemother 1997;41(8):1636-40.
228 Komuro M, Maeda T, Hayakawa H, Allen KL, Green CE. The formation of desethyl-piperacillin from piperacillin by human liver S9 in vitro. Biopharm Drug Dispos 1997;18(3):185-90.
229 Ghibellini G, Bridges AS, Generaux CN, Brouwer KL. In vitro and in vivo determination of piperacillin metabolism in humans. Drug Metab Dispos 2007;35(3):345-9.
230 Yamana T, Mizukami Y, Ichimura F, Shimazaki K, Ishioka M, Suda M. Stability kinetics of piperacillin in aqueous solutions. International Journal of Pharmaceutics 1982;11:71-80.
231 Yang G, Cao W, Zhu T, Bai L, Zhao Y. The QRAR model study of beta-lactam antibiotics by capillary coated with cell membrane. J Chromatogr B Analyt Technol Biomed Life Sci 2008;873(1):1-7.
232 Hou JP, Poole JW. -lactam antibiotics: their physicochemical properties and biological activities in relation to structure. J Pharm Sci 1971;60(4):503-32.
233 Saikawa I, Takano S, Yoshida C, Saito E, Yasuda T. [Studies on beta-lactam antibiotics for medicinal purpose. IV. Stability of 6-[D(-)-alpha-(4-ethyl-2,3-dioxo-1-piperazinecarboxamido)phenylacetamido)penicill anic acid (T-1220) in aqueous solution and body fluid (author's transl)]. Yakugaku Zasshi 1977;97(9):995-1001.
234 Garcia-Gonzalez JC, Mendez R, Martin-Villacorta J. Determination of piperacillin and mezlocillin in human serum and urine by high-performance liquid chromatography after derivatisation with 1,2,4-triazole. J Chromatogr A 1998;812(1-2):213-20.
235 Augey V, Grosse PY, Albert G, Audran M, Bressolle F. High-performance liquid chromatographic determination of tazobactam and piperacillin in human plasma and urine. J Chromatogr B Biomed Appl 1996;682(1):125-36.
236 Di Giovamberardino G, Ferrannini M, Testore GP, Federici G, Pastore A. High performance liquid chromatographic determination of plasma free and total tazobactam and piperacillin. J Chromatogr B Analyt Technol Biomed Life Sci 2009;877(1-2):86-8.
237 Denooz R, Charlier C. Simultaneous determination of five beta-lactam antibiotics (cefepim, ceftazidim, cefuroxim, meropenem and piperacillin) in human plasma by high-performance liquid chromatography with ultraviolet detection. J Chromatogr B Analyt Technol Biomed Life Sci 2008;864(1-2):161-7.
238 Xia CH, Xiong YQ, Wang GJ. An improved high-performance liquid chromatographic method with a solid-phase extraction for the determination of piperacillin and tazobactam: application to pharmacokinetic study of different dosage in Chinese healthy volunteers. Biomed Chromatogr 2007;21(7):680-6.
239 Gautier V, Demotes-Mainard F, Foureau M, Vincon G. Micro-method for the determination of piperacillin in plasma by high-performance liquid chromatography. J Pharm Biomed Anal 1991;9(2):183-6.
240 Trittler R, Ehrlich M, Galla TJ, Horch RE, Kummerer K. New and rapid fully automated method for determination of tazobactam and piperacillin in fatty tissue and serum by column-switching liquid chromatography. J Chromatogr B Analyt Technol Biomed Life Sci 2002;775(2):127-32.

212 References
241 Arzuaga A, Isla A, Gascon AR, Maynar J, Martin A, Solinis MA, Toral D, Pedraz JL. Quantitation and stability of piperacillin and tazobactam in plasma and ultrafiltrate from patients undergoing continuous venovenous hemofiltration by HPLC. Biomed Chromatogr 2005;19(8):570-8.
242 Langin A, Alexy R, Konig A, Kummerer K. Deactivation and transformation products in biodegradability testing of beta-lactams amoxicillin and piperacillin. Chemosphere 2009;75(3):347-54.
243 Pozo OJ, Guerrero C, Sancho JV, Ibanez M, Pitarch E, Hogendoorn E, Hernandez F. Efficient approach for the reliable quantification and confirmation of antibiotics in water using on-line solid-phase extraction liquid chromatography/tandem mass spectrometry. J Chromatogr A 2006;1103(1):83-93.
244 Violette A, Cortes DA, Bergeon JA, Falconer RA, Toth I. Optimized LC-MS/MS quantification method for the detection of piperacillin and application to the development of charged liposaccharides as oral penetration enhancers. Int J Pharm 2008;351(1-2):152-7.
245 Konishi Y, Kiyota T, Draghici C, Gao JM, Yeboah F, Acoca S, Jarussophon S, Purisima E. Molecular formula analysis by an MS/MS/MS technique to expedite dereplication of natural products. Anal Chem 2007;79(3):1187-97.
246 Uchida Y, Kamiie J, Ohtsuki S, Terasaki T. Multichannel liquid chromatography-tandem mass spectrometry cocktail method for comprehensive substrate characterization of multidrug resistance-associated protein 4 transporter. Pharm Res 2007;24(12):2281-96.
247 Casy AF, Cryer C, Ominde EM. Mass spectrometry of beta-lactam antibiotics with special reference to ionization by fast atom bombardment (FAB). J Pharm Biomed Anal 1989;7(10):1121-57.
248 Tyczkowska KL, Seay SS, Stoskopf MK, Aucoin DP. Determination of ceftazidime in dolphin serum by liquid chromatography with ultraviolet-visible detection and confirmation by thermospray liquid chromatography-mass spectrometry. J Chromatogr 1992;576(2):305-13.
249 Bourget P, Lesne-Hulin A, Le Reveille R, Le Bever H, Carsin H. Clinical pharmacokinetics of piperacillin-tazobactam combination in patients with major burns and signs of infection. Antimicrob Agents Chemother 1996;40(1):139-45.
250 Arzuaga A, Maynar J, Gascon AR, Isla A, Corral E, Fonseca F, Sanchez-Izquierdo JA, Rello J, Canut A, Pedraz JL. Influence of renal function on the pharmacokinetics of piperacillin/tazobactam in intensive care unit patients during continuous venovenous hemofiltration. J Clin Pharmacol 2005;45(2):168-76.
251 The Metabolomics Innovation Centre (TMIC). Telavancin (DB06402). 2013 [cited 2014 29 March]; Available from: http://www.drugbank.ca/drugs/DB06402.
252 Jafari Saraf L, Wilson SE. Telavancin, a new lipoglycopeptide antimicrobial, in complicated skin and soft tissue infections. Infect Drug Resist 2011;4:87-95.
253 Mendes RE, Moet GJ, Janechek MJ, Jones RN. In vitro activity of telavancin against a contemporary worldwide collection of Staphylococcus aureus isolates. Antimicrob Agents Chemother 2010;54(6):2704-6.
254 Pfaller MA, Mendes RE, Sader HS, Jones RN. Telavancin activity against Gram-positive bacteria isolated from respiratory tract specimens of patients with nosocomial pneumonia. J Antimicrob Chemother 2010;65(11):2396-404.

References 213
255 Higgins DL, Chang R, Debabov DV, Leung J, Wu T, Krause KM, Sandvik E, Hubbard JM, Kaniga K, Schmidt DE, Jr., Gao Q, Cass RT, Karr DE, Benton BM, Humphrey PP. Telavancin, a multifunctional lipoglycopeptide, disrupts both cell wall synthesis and cell membrane integrity in methicillin-resistant Staphylococcus aureus. Antimicrob Agents Chemother 2005;49(3):1127-34.
256 Hegde SS, Reyes N, Wiens T, Vanasse N, Skinner R, McCullough J, Kaniga K, Pace J, Thomas R, Shaw JP, Obedencio G, Judice JK. Pharmacodynamics of telavancin (TD-6424), a novel bactericidal agent, against gram-positive bacteria. Antimicrob Agents Chemother 2004;48(8):3043-50.
257 Sun HK, Duchin K, Nightingale CH, Shaw JP, Seroogy J, Nicolau DP. Tissue penetration of telavancin after intravenous administration in healthy subjects. Antimicrob Agents Chemother 2006;50(2):788-90.
258 Lodise TP, Jr., Gotfried M, Barriere S, Drusano GL. Telavancin penetration into human epithelial lining fluid determined by population pharmacokinetic modeling and Monte Carlo simulation. Antimicrob Agents Chemother 2008;52(7):2300-4.
259 Samara E, Shaw JP, Barriere SL, Wong SL, Worboys P. Population pharmacokinetics of telavancin in healthy subjects and patients with infections. Antimicrob Agents Chemother 2012;56(4):2067-73.
260 Wong SL, Barriere SL, Kitt MM, Goldberg MR. Multiple-dose pharmacokinetics of intravenous telavancin in healthy male and female subjects. J Antimicrob Chemother 2008;62(4):780-3.
261 Cheung WK, Greene DS, Kuye O, Smith MP, Holder A, Fernandez P, Houston A, Faulkner RD, Silber BM. Pharmacokinetics of YTR830H in healthy human subjects. J Chemother 1989;1(4 Suppl):505-6.
262 Kuo HY, Wang FD, Yen YF, Lin ML, Liu CY. In vitro activities of piperacillin or cefoperazone alone and in combination with beta-lactamase inhibitors against gram-negative bacilli. New Microbiol 2009;32(1):49-55.
263 Wybo I, Pierard D, Verschraegen I, Reynders M, Vandoorslaer K, Claeys G, Delmee M, Glupczynski Y, Gordts B, Ieven M, Melin P, Struelens M, Verhaegen J, Lauwers S. Third Belgian multicentre survey of antibiotic susceptibility of anaerobic bacteria. J Antimicrob Chemother 2007;59(1):132-9.
264 Reinert RR, Low DE, Rossi F, Zhang X, Wattal C, Dowzicky MJ. Antimicrobial susceptibility among organisms from the Asia/Pacific Rim, Europe and Latin and North America collected as part of TEST and the in vitro activity of tigecycline. J Antimicrob Chemother 2007;60(5):1018-29.
265 Nenoff P, Haustein UF, Hittel N. Activity of nadifloxacin (OPC-7251) and seven other antimicrobial agents against aerobic and anaerobic Gram-positive bacteria isolated from bacterial skin infections. Chemotherapy 2004;50(4):196-201.
266 Leder K, Turnidge JD, Korman TM, Grayson ML. The clinical efficacy of continuous-infusion flucloxacillin in serious staphylococcal sepsis. J Antimicrob Chemother 1999;43(1):113-8.
267 FDA, NDA 21-334: Biopharm Review. 2000: Center for Drug Evaluation and Research, U.S. Food and Drug Administration.
268 Giordano P, Weber K, Gesin G, Kubert J. Skin and skin structure infections: treatment with newer generation fluoroquinolones. Ther Clin Risk Manag 2007;3(2):309-17.

214 References
269 Dryden MS. Complicated skin and soft tissue infection. J Antimicrob Chemother 2010;65 Suppl 3:iii35-44.
270 Cheadle W, Lee JT, Napolitano LM, Nichols RL. Clinical update on the use of moxifloxacin in the treatment of community-acquired complicated intraabdominal infections. Surg Infect (Larchmt) 2010;11(5):487-94.
271 Robertson SM, Curtis MA, Schlech BA, Rusinko A, Owen GR, Dembinska O, Liao J, Dahlin DC. Ocular pharmacokinetics of moxifloxacin after topical treatment of animals and humans. Surv Ophthalmol 2005;50 Suppl 1:S32-45.
272 Stroman DW, Dajcs JJ, Cupp GA, Schlech BA. In vitro and in vivo potency of moxifloxacin and moxifloxacin ophthalmic solution 0.5%, a new topical fluoroquinolone. Surv Ophthalmol 2005;50 Suppl 1:S16-31.
273 Landersdorfer CB, Kinzig M, Hennig FF, Bulitta JB, Holzgrabe U, Drusano GL, Sorgel F, Gusinde J. Penetration of moxifloxacin into bone evaluated by Monte Carlo simulation. Antimicrob Agents Chemother 2009;53(5):2074-81.
274 Kanellakopoulou K, Sahinides T, Tsaganos T, Galanakis N, Giamarellou H, Giamarellos-Bourboulis EJ. In vitro elution of moxifloxacin from cancellous bone allografts. J Biomed Mater Res A 2010;92(1):52-5.
275 Laponogov I, Sohi MK, Veselkov DA, Pan XS, Sawhney R, Thompson AW, McAuley KE, Fisher LM, Sanderson MR. Structural insight into the quinolone-DNA cleavage complex of type IIA topoisomerases. Nat Struct Mol Biol 2009;16(6):667-9.
276 Leo E, Gould KA, Pan XS, Capranico G, Sanderson MR, Palumbo M, Fisher LM. Novel symmetric and asymmetric DNA scission determinants for Streptococcus pneumoniae topoisomerase IV and gyrase are clustered at the DNA breakage site. J Biol Chem 2005;280(14):14252-63.
277 FDA, NDA 21-085: Pharmacology Review. 1998: Center for Drug Evaluation and Research, U.S. Food and Drug Administration.
278 Malik M, Hnatkova K, Schmidt A, Smetana P. Electrocardiographic QTc changes due to moxifloxacin infusion. J Clin Pharmacol 2009;49(6):674-83.
279 Morganroth J, Dimarco JP, Anzueto A, Niederman MS, Choudhri S. A randomized trial comparing the cardiac rhythm safety of moxifloxacin vs levofloxacin in elderly patients hospitalized with community-acquired pneumonia. Chest 2005;128(5):3398-406.
280 Noel GJ, Natarajan J, Chien S, Hunt TL, Goodman DB, Abels R. Effects of three fluoroquinolones on QT interval in healthy adults after single doses. Clin Pharmacol Ther 2003;73(4):292-303.
281 Wingen F-J, Wroblewski H, Wichtige Information zur Arzneimittelsicherheit: Moxifloxacin (AVALOX® UND ACTIMAX®) Rote Hand Brief. 2008: Bayer Vital GmbH, MED-Information.
282 Singal DK, Mittal A, Prakash A. Recurrent episodes of hypoglycemia induced by moxifloxacin. Indian J Pharmacol 2013;45(3):301-2.
283 Chou HW, Wang JL, Chang CH, Lee JJ, Shau WY, Lai MS. Risk of severe dysglycemia among diabetic patients receiving levofloxacin, ciprofloxacin, or moxifloxacin in Taiwan. Clin Infect Dis 2013;57(7):971-80.
284 Sanjith S, Raodeo A, Clerk A, Pandit R, Karnad DR. Moxifloxacin-induced rhabdomyolysis. Intensive Care Med 2012;38(4):725.

References 215
285 Chatzikyrkou C, Hamwi I, Clajus C, Becker J, Hafer C, Kielstein JT. Biopsy proven acute interstitial nephritis after treatment with moxifloxacin. BMC Nephrol 2010;11:19.
286 Nascimento HM, Sousa JM, Campos MS, Belfort R, Jr. Acute iris depigmentation following systemic moxifloxacin. Clinics (Sao Paulo) 2013;68(7):899-900.
287 Chao CM, Lin SH, Lai CC. Abdominal wall hematoma and hemoperitoneum in an individual with concomitant use of warfarin and moxifloxacin. J Am Geriatr Soc 2013;61(8):1432-3.
288 Tulkens PM, Arvis P, Kruesmann F. Moxifloxacin safety: an analysis of 14 years of clinical data. Drugs R D 2012;12(2):71-100.
289 Ballow C, Lettieri J, Agarwal V, Liu P, Stass H, Sullivan JT. Absolute bioavailability of moxifloxacin. Clin Ther 1999;21(3):513-22.
290 Siefert HM, Domdey-Bette A, Henninger K, Hucke F, Kohlsdorfer C, Stass HH. Pharmacokinetics of the 8-methoxyquinolone, moxifloxacin: a comparison in humans and other mammalian species. J Antimicrob Chemother 1999;43 Suppl B:69-76.
291 Culley CM, Lacy MK, Klutman N, Edwards B. Moxifloxacin: clinical efficacy and safety. Am J Health Syst Pharm 2001;58(5):379-88.
292 Lubasch A, Keller I, Borner K, Koeppe P, Lode H. Comparative pharmacokinetics of ciprofloxacin, gatifloxacin, grepafloxacin, levofloxacin, trovafloxacin, and moxifloxacin after single oral administration in healthy volunteers. Antimicrob Agents Chemother 2000;44(10):2600-3.
293 Stass H, Dalhoff A, Kubitza D, Schuhly U. Pharmacokinetics, safety, and tolerability of ascending single doses of moxifloxacin, a new 8-methoxy quinolone, administered to healthy subjects. Antimicrob Agents Chemother 1998;42(8):2060-5.
294 Stass H, Kubitza D. Pharmacokinetics and elimination of moxifloxacin after oral and intravenous administration in man. J Antimicrob Chemother 1999;43 Suppl B:83-90.
295 Stass H, Kubitza D, Schuhly U. Pharmacokinetics, safety and tolerability of moxifloxacin, a novel 8-methoxyfluoroquinolone, after repeated oral administration. Clin Pharmacokinet 2001;40 Suppl 1:1-9.
296 Sullivan JT, Woodruff M, Lettieri J, Agarwal V, Krol GJ, Leese PT, Watson S, Heller AH. Pharmacokinetics of a once-daily oral dose of moxifloxacin (Bay 12-8039), a new enantiomerically pure 8-methoxy quinolone. Antimicrob Agents Chemother 1999;43(11):2793-7.
297 Wise R, Andrews JM, Marshall G, Hartman G. Pharmacokinetics and inflammatory-fluid penetration of moxifloxacin following oral or intravenous administration. Antimicrob Agents Chemother 1999;43(6):1508-10.
298 Burkhardt O, Borner K, Stass H, Beyer G, Allewelt M, Nord CE, Lode H. Single- and multiple-dose pharmacokinetics of oral moxifloxacin and clarithromycin, and concentrations in serum, saliva and faeces. Scand J Infect Dis 2002;34(12):898-903.
299 Moise PA, Birmingham MC, Schentag JJ. Pharmacokinetics and metabolism of moxifloxacin. Drugs Today (Barc) 2000;36(4):229-44.
300 Langlois MH, Montagut M, Dubost JP, Grellet J, Saux MC. Protonation equilibrium and lipophilicity of moxifloxacin. J Pharm Biomed Anal 2005;37(2):389-93.

216 References
301 Takács-Novák K, Józan M, Hermecz I, Szász G. Lipophilicity of antibacterial fluoroquinolones. International Journal of Pharmaceutics 1992;79(1–3):89-96.
302 Hariprasad SM, Shah GK, Mieler WF, Feiner L, Blinder KJ, Holekamp NM, Gao H, Prince RA. Vitreous and aqueous penetration of orally administered moxifloxacin in humans. Arch Ophthalmol 2006;124(2):178-82.
303 Leone M, Albanese J, Sampol-Manos E, Simon N, Lacarelle B, Bruguerolle B, Martin C. Moxifloxacin penetration in bronchial secretions of mechanically ventilated patients with pneumonia. Antimicrob Agents Chemother 2004;48(2):638-40.
304 Tzepi I, Vergados I, Kanellakopoulou K, Papathanassiou M, Kranidioti H, Tsaganos T, Liarakos V, Giamarellos-Bourboulis EJ, Theodossiadis P. Pharmacokinetics of intravenously administered moxifloxacin in eye compartments: an experimental study. Int J Antimicrob Agents 2009;33(2):160-2.
305 Wagenlehner FM, Kees F, Weidner W, Wagenlehner C, Naber KG. Concentrations of moxifloxacin in plasma and urine, and penetration into prostatic fluid and ejaculate, following single oral administration of 400 mg to healthy volunteers. Int J Antimicrob Agents 2008;31(1):21-6.
306 Chan KP, Chu KO, Lai WW, Choy KW, Wang CC, Lam DS, Pang CP. Determination of ofloxacin and moxifloxacin and their penetration in human aqueous and vitreous humor by using high-performance liquid chromatography fluorescence detection. Anal Biochem 2006;353(1):30-6.
307 Kumar AK, Sudha V, Srinivasan R, Ramachandran G. Simple and rapid liquid chromatography method for determination of moxifloxacin in saliva. J Chromatogr B Analyt Technol Biomed Life Sci 2011;879(30):3663-7.
308 Majcher-Peszynska J, Sass M, Schipper S, Czaika V, Gussmann A, Lobmann R, Mundkowski RG, Luebbert C, Kujath P, Ruf BR, Koch H, Schareck W, Klar E, Drewelow B. Pharmacokinetics and penetration of moxifloxacin into infected diabetic foot tissue in a large diabetic patient cohort. Eur J Clin Pharmacol 2011;67(2):135-42.
309 Kees MG, Weber S, Kees F, Horbach T. Pharmacokinetics of moxifloxacin in plasma and tissue of morbidly obese patients. J Antimicrob Chemother 2011;66(10):2330-5.
310 Ober MC, Hoppe-Tichy T, Koninger J, Schunter O, Sonntag HG, Weigand MA, Encke J, Gutt C, Swoboda S. Tissue penetration of moxifloxacin into human gallbladder wall in patients with biliary tract infections. J Antimicrob Chemother 2009;64(5):1091-5.
311 Wacke R, Forster S, Adam U, Mundkowski RG, Klar E, Hopt UT, Drewelow B. Penetration of moxifloxacin into the human pancreas following a single intravenous or oral dose. J Antimicrob Chemother 2006;58(5):994-9.
312 Malincarne L, Ghebregzabher M, Moretti MV, Egidi AM, Canovari B, Tavolieri G, Francisci D, Cerulli G, Baldelli F. Penetration of moxifloxacin into bone in patients undergoing total knee arthroplasty. J Antimicrob Chemother 2006;57(5):950-4.
313 Metallidis S, Charokopos N, Nikolaidis J, Alexiadou E, Lazaraki G, Koumentaki E, Tsona A, Theodoridis G, Nikolaidis P. Penetration of moxifloxacin into sternal bone of patients undergoing routine cardiopulmonary bypass surgery. Int J Antimicrob Agents 2006;28(5):428-32.
314 Metallidis S, Topsis D, Nikolaidis J, Alexiadou E, Lazaraki G, Grovaris L, Theodoridou A, Nikolaidis P. Penetration of moxifloxacin and levofloxacin into cancellous and cortical bone in patients undergoing total hip arthroplasty. J Chemother 2007;19(6):682-7.

References 217
315 Ba BB, Etienne R, Ducint D, Quentin C, Saux MC. Determination of moxifloxacin in growth media by high-performance liquid chromatography. J Chromatogr B Biomed Sci Appl 2001;754(1):107-12.
316 Djurdjevic P, Ciric A, Djurdjevic A, Stankov MJ. Optimization of separation and determination of moxifloxacin and its related substances by RP-HPLC. J Pharm Biomed Anal 2009;50(2):117-26.
317 Guerra FL, Paim CS, Steppe M, Schapoval EE. Biological assay and liquid chromatographic method for analysis of moxifloxacin in tablets. J AOAC Int 2005;88(4):1086-92.
318 Jain GK, Jain N, Pathan SA, Akhter S, Talegaonkar S, Chander P, Khar RK, Ahmad FJ. Ultra high-pressure liquid chromatographic assay of moxifloxacin in rabbit aqueous humor after topical instillation of moxifloxacin nanoparticles. J Pharm Biomed Anal 2010;52(1):110-3.
319 Srinivas N, Narasu L, Shankar BP, Mullangi R. Development and validation of a HPLC method for simultaneous quantitation of gatifloxacin, sparfloxacin and moxifloxacin using levofloxacin as internal standard in human plasma: application to a clinical pharmacokinetic study. Biomed Chromatogr 2008;22(11):1288-95.
320 Liang H, Kays MB, Sowinski KM. Separation of levofloxacin, ciprofloxacin, gatifloxacin, moxifloxacin, trovafloxacin and cinoxacin by high-performance liquid chromatography: application to levofloxacin determination in human plasma. J Chromatogr B Analyt Technol Biomed Life Sci 2002;772(1):53-63.
321 De Smet J, Boussery K, Colpaert K, De Sutter P, De Paepe P, Decruyenaere J, Van Bocxlaer J. Pharmacokinetics of fluoroquinolones in critical care patients: A bio-analytical HPLC method for the simultaneous quantification of ofloxacin, ciprofloxacin and moxifloxacin in human plasma. J Chromatogr B Analyt Technol Biomed Life Sci 2009;877(10):961-7.
322 Nguyen HA, Grellet J, Ba BB, Quentin C, Saux MC. Simultaneous determination of levofloxacin, gatifloxacin and moxifloxacin in serum by liquid chromatography with column switching. J Chromatogr B Analyt Technol Biomed Life Sci 2004;810(1):77-83.
323 Baietto L, D'Avolio A, De Rosa FG, Garazzino S, Patanella S, Siccardi M, Sciandra M, Di Perri G. Simultaneous quantification of linezolid, rifampicin, levofloxacin, and moxifloxacin in human plasma using high-performance liquid chromatography with UV. Ther Drug Monit 2009;31(1):104-9.
324 Donnenfeld ED, Comstock TL, Proksch JW. Human aqueous humor concentrations of besifloxacin, moxifloxacin, and gatifloxacin after topical ocular application. J Cataract Refract Surg 2011;37(6):1082-9.
325 Nemutlu E, Kır S, Özyüncü Ö, Beksaç MS. Simultaneous Separation and Determination of Seven Quinolones Using HPLC: Analysis of Levofloxacin and Moxifloxacin in Plasma and Amniotic Fluid. Chromatographia 2007;66(Suppl 1):S15-S24.
326 Sousa J, Alves G, Fortuna A, Falcao A. Analytical methods for determination of new fluoroquinolones in biological matrices and pharmaceutical formulations by liquid chromatography: a review. Anal Bioanal Chem 2012.
327 Hemanth Kumar AK, Ramachandran G. Simple and rapid liquid chromatography method for determination of moxifloxacin in plasma. J Chromatogr B Analyt Technol Biomed Life Sci 2009;877(11-12):1205-8.

218 References
328 Schulte S, Ackermann T, Bertram N, Sauerbruch T, Paar WD. Determination of the newer quinolones levofloxacin and moxifloxacin in plasma by high-performance liquid chromatography with fluorescence detection. J Chromatogr Sci 2006;44(4):205-8.
329 Tatar Ulu S. High-performance liquid chromatography assay for moxifloxacin: pharmacokinetics in human plasma. J Pharm Biomed Anal 2007;43(1):320-4.
330 Nemutlu E, Kir S, Eroglu H, Katlan D, Ozek A, Oyuncu O, Beksac MS. Comparison of pharmacokinetic profiles of moxifloxacin in Caesarean versus non-pregnant sectioned women by fully validated HPLC with fluorescence detection. Comb Chem High Throughput Screen 2010;13(6):502-9.
331 Laban-Djurdjevic A, Jelikic-Stankov M, Djurdjevic P. Optimization and validation of the direct HPLC method for the determination of moxifloxacin in plasma. J Chromatogr B Analyt Technol Biomed Life Sci 2006;844(1):104-11.
332 Tobin CM, Sunderland J, White LO, MacGowan AP, Reeves DS. An isocratic high performance liquid chromatography (HPLC) assay for moxifloxacin, a new 8-methoxyquinolone. J Antimicrob Chemother 1998;42(2):278-9.
333 Stass H, Dalhoff A. Determination of BAY 12-8039, a new 8-methoxyquinolone, in human body fluids by high-performance liquid chromatography with fluorescence detection using on-column focusing. J Chromatogr B Biomed Sci Appl 1997;702(1-2):163-74.
334 Lemoine T, Breilh D, Ducint D, Dubrez J, Jougon J, Velly JF, Saux MC. Determination of moxifloxacin (BAY 12-8039) in plasma and lung tissue by high-performance liquid chromatography with ultraviolet detection using a fully automated extraction method with a new polymeric cartridge. J Chromatogr B Biomed Sci Appl 2000;742(2):247-54.
335 Xu YH, Li D, Liu XY, Li YZ, Lu J. High performance liquid chromatography assay with ultraviolet detection for moxifloxacin: validation and application to a pharmacokinetic study in Chinese volunteers. J Chromatogr B Analyt Technol Biomed Life Sci 2010;878(32):3437-41.
336 Abdelaziz AA, Elbanna TE, Gamaleldeen NM. validated microbiological and HPLC methods for the determination of moxifloxacin in pharmaceutical preparations and human plasma. Braz J Microbiol 2012;43(4):1291-301.
337 Helmy SA. Simultaneous quantification of linezolid, tinidazole, norfloxacin, moxifloxacin, levofloxacin, and gatifloxacin in human plasma for therapeutic drug monitoring and pharmacokinetic studies in human volunteers. Ther Drug Monit 2013;35(6):770-7.
338 Cavazos-Rocha N, Carmona-Alvarado I, Vera-Cabrera L, Waksman-de-Torres N, Salazar-Cavazos MD. HPLC Method for the Simultaneous Analysis of Fluoroquinolones and Oxazolidinones in Plasma. J Chromatogr Sci 2014.
339 Vu DH, Koster RA, Alffenaar JW, Brouwers JR, Uges DR. Determination of moxifloxacin in dried blood spots using LC-MS/MS and the impact of the hematocrit and blood volume. J Chromatogr B Analyt Technol Biomed Life Sci 2011;879(15-16):1063-70.
340 Raju B, Ramesh M, Borkar RM, Padiya R, Banerjee SK, Srinivas R. Development and validation of liquid chromatography-mass spectrometric method for simultaneous determination of moxifloxacin and ketorolac in rat plasma: application to pharmacokinetic study. Biomed Chromatogr 2012;26(11):1341-7.

References 219
341 De Smet J, Colin P, De Paepe P, Ruige J, Batens H, Van Nieuwenhove Y, Vogelaers D, Blot S, Van Bocxlaer J, Van Bortel LM, Boussery K. Oral bioavailability of moxifloxacin after Roux-en-Y gastric bypass surgery. J Antimicrob Chemother 2012;67(1):226-9.
342 Stass H, Kubitza D, Moller JG, Delesen H. Influence of activated charcoal on the pharmacokinetics of moxifloxacin following intravenous and oral administration of a 400 mg single dose to healthy males. Br J Clin Pharmacol 2005;59(5):536-41.
343 Burkhardt O, Stass H, Thuss U, Borner K, Welte T. Effects of enteral feeding on the oral bioavailability of moxifloxacin in healthy volunteers. Clin Pharmacokinet 2005;44(9):969-76.
344 Rossi F, Franco MR, Rodrigues HM, Andreazzi D. Streptococcus pneumoniae: susceptibility to penicillin and moxifloxacin. J Bras Pneumol 2012;38(1):66-71.
345 Kanjanawart S, Gaysonsiri D, Phunikom K, Simasathiansopon S, Tangsucharit P, Vannaprasaht S, Kaewkamson T, Tassaneeyakul W. Comparative bioavailability of two moxifloxacin tablet products after single dose administration under fasting conditions in a balanced, randomized and cross-over study in healthy volunteers. Int J Clin Pharmacol Ther 2013;51(3):249-54.

220 Publications
Publications
Full Papers
1 Bulitta JB, Kinzig M, Jakob V, Holzgrabe U, Sörgel F, Holford NH: Nonlinear pharmacokinetics of piperacillin in healthy volunteers – implications for optimal dosage regimens. Br J Clin Pharmacol. Nov;70(5):682-93, 2010.
2 Stevenson JM, Patel JH, Churchwell MD, Vilay AM, Depestel DD, Sorgel F, Kinzig M, Jakob V, Mueller BA: Ertapenem clearance during modeled continuous renal replacement therapy. Int J Artif Organs. Dec;31(12):1027-34, 2008.
3 Fuhr U, Boettcher M I, Kinzig-Schippers M, Weyer A, Jetter A, Lazar A, Taubert D, Tomalik-Scharte D, Pournara P, Jakob V, Harlfinger S, Klaassen T, Berkessel A, Angerer J, Sörgel F and Schömig E: Toxicokinetics of acrylamide in humans after ingestion of a defined dose in a test meal to improve risk assessment for acrylamide carcinogenicity. Cancer Epidemiol Biomarkers Prev. Feb;15(2):266-71, 2006.
4 Kinzig-Schippers M, Tomalik-Scharte D, Jetter A, Scheidel B, Jakob V, Rodamer M, Cascorbi I, Doroshyenko O, Sörgel F, Fuhr U: Should we use N-acetyltransferase type 2 genotyping to personalize isoniazid doses? Antimicrob Agents Chemother. May;49(5):1733-8, 2005.
5 Jetter A, Kinzig-Schippers M, Skott A, Lazar A, Tomalik-Scharte D, Kirchheiner J, Walchner-Bonjean M, Hering U, Jakob V, Rodamer M, Jabrane W, Kasel D, Brockmöller J, Fuhr U, Sörgel F: Cytochrome P450 2C9 phenotyping using low-dose tolbutamide. Eur J Clin Pharmacol. May;60(3):165-71, 2004.
6 Sörgel F, Kinzig-Schippers M, Bulitta J, Jakob V: Pharmakokinetische und -dynamische Grundlagen bei der Antibiotika-Therapie am Beispiel der Fluorochinolone. Chemotherapie Journal 11(Suppl. 21), 2002.
Congress Presentations
1 Rodamer M, Jakob V, Mees ST, Kinzig M, Hüttner S, Sörgel F: Development and validation of a liquid chromatography-tandem mass spectrometry procedure for the quantification of tigecycline in human serum: application to drug monitoring. Abstr. P1668, 19th European Congress of Clinical Microbiology and Infectious Diseases Helsinki, Finland, May 16-19, 2009.
2 Rodamer M, Sörgel F, Jakob V, Kinzig M, Basel B, Krüger W, Peiffer M, Lodise T, Bulitta J: Epithelial lining fluid concentrations of antibiotics methodological artifacts? Abstr. P1654, 19th European Congress of Clinical Microbiology and Infectious Diseases Helsinki, Finland, May 16-19, 2009.
3 Jakob V, Abduljalil K, Kinzig M, Bulitta J, Horkovics-Kovats S, Fuhr U, Sörgel F: Modelling the auto-inhibition of clarithromycin metabolism during repeated oral administration. Abstr. P1655, 19th European Congress of Clinical Microbiology and Infectious Diseases Helsinki, Finland, May 16-19, 2009.
4 Rodamer M, Jakob V, Strauss R, Ganslmayer M, Gleich C, Sörgel F, Kinzig M: New horizons to modern therapeutic drug monitoring use of tandem mass spectrometry to analyze the 40 most important anti-infectives. Abstr. P1651, 19th European Congress of Clinical Microbiology and Infectious Diseases Helsinki, Finland, May 16-19, 2009.
5 Bulitta J, Landersdorfer C, Drusano G, Holzgrabe U, Naber KG, Kinzig M, Rodamer M, Jakob V, Sörgel F: Pharmacokinetic (PK) / Pharmacodynamic (PD) comparison of ciprofloxacin (CIP) and levofloxacin (LEV) by a population PK meta-analysis and monte carlo simulation (MCS). Abstr. 3359, AAPS Annual Meeting and Exposition; San Diego, CA, USA, November 11 - 15, 2007.

Publications 221
6 Landersdorfer C, Bulitta J, Drusano G, Holzgrabe U, Kinzig M, Jakob V, Sörgel F: Penetration into bone and pharmacodynamic profile of amoxicillin and clavulanic acid evaluated by population pharmacokinetics and monte carlo simulation. Abstr. 1968, AAPS Annual Meeting and Exposition; San Diego, CA, USA, November 11 - 15, 2007.
7 Jakob V, Kinzig-Schippers M, Sörgel F, Clark T, Bauer W: ESI-MS in Drug Discovery: Complexation of metal ions with tetracyclines to predict the bioactivity of tetracyclines. Abstr. 97, DPhG Doktorandentagung, Nürnberg-Heroldsberg, Germany, September 6 - 9, 2006.
8 Kinzig-Schippers M, Sorgel F, Jakob V, Hüttner S: Validation of an Elisa for Recombinat Human Granulocyte Colony Stimulating Factor (G-CSF) According to FDA-Requirements. Abstr. 3033, AAPS Annual Meeting and Exposition; San Antonio, TX, USA, October 30 to November 1, 2006.
9 Kinzig-Schippers M, Rodamer M, Jakob V, Sörgel F: Drug Monitoring of HMR 1726 (Active Metabolite of Leflunomide) in Human Plasma by LC-MS/MS. Abstr. 3004, AAPS Annual Meeting and Exposition; San Antonio, TX, USA, October 30 to November 1, 2006.
10 Bulitta J, Landersdorfer C, Kinzig-Schippers M, Jakob V, Rodamer M, Drusano GL, Thyroff-Friesinger U, Holzgrabe U, Sörgel F: Population Pharmacokinetics (PK), Pharmacodynamics (PD) and Breakpoints of Cefuroxime Axetil in Healthy Volunteers via Monte Carlo Simulation (MCS). Presentation number: A-1119; 46th Interscience Conference on Antimicrobial Agents and Chemotherapy, San Francisco, CA, USA; September 27 - 30, 2006.
11 Jakob AV, Rodamer M, Skott A, Kinzig-Schippers M, Jetter A, Fuhr U, Schömig E, Sörgel F: Toxicokinetics of acrylamide following ingestion of acrylamide containing food. Jahrestagung der Deutschen Pharmazeutischen Gesellschaft DPhG, Mainz, Germany, October 5-8, 2005.
12 Sörgel F, Bulitta J, Horkovics-Kovats S, Kinzig-Schippers M, Borek M, Nesme B, Jakob V: Crucial role of “appropriate” reference product and food effects in clinical trials – a plea for drug level measurements in phase III - trials. Abstr. ICAAC04-A-2685-ASM, 44th ICAAC Interscience Conference on Antimicrobial Agents and Chemotherapy; Washington DC, USA; October 30 - November 2, 2004.
13 Naber KG, Bulitta J, Jakob V, Kinzig-Schippers M, Sörgel F: Limitations in the use of drug cocktails (DC) to compare the pharmacokinetics (PK) of drugs: ciprofloxacin (CIP) vs. levofloxacin (LEV). Abstr. 213, WCDA World Conference on Magic Bullets, Nürnberg, Germany, September 9-11, 2004.
14 Kinzig-Schippers M, Jakob V, Rodamer M, Skott A, Sörgel F: High sensitivity LC-MS/MS analysis to assess phenotyping of a drug cocktail. Abstr. 214, WCDA World Conference on Magic Bullets, Nürnberg, Germany, September 9-11, 2004.
15 Rodamer M, Landersdorfer C, Jakob V, Skott A, Hindr M, Kinzig-Schippers M, Sörgel F: Tissue penetration of cefditoren (CEE) into bronchial mucosa (BM) and epithelial lining fluid (ELF) in patients undergoing fiberoptic bronchoscopy. Abstr. 446, WCDA World Conference on Magic Bullets, Nürnberg, Germany, September 9-11, 2004.
16 Kinzig-Schippers M, Landersdorfer C, Jakob V, Rodamer M, Skott A, Holzgrabe U, Sörgel F: Sensitive analysis of roxithromycin in human plasma by LC-MS/MS. Abstr. 516, WCDA World Conference on Magic Bullets, Nürnberg, Germany, September 9-11, 2004.
17 Kinzig-Schippers M, Tomalik-Scharte D, Jetter A, Wahode H, Jakob V, Cascorbi I, Sörgel F, Fuhr U: Personalized isoniazid (INH) dosing based on genotyping for arylamine N-acetyltransferase type 2 (NAT2). Abstr. A-30, 43rd ICAAC Interscience Conference on Antimicrobial Agents and Chemotherapy; Chicago, Illinois, USA; September 14-17, 2003.
18 Jakob V, Rodamer M, Bulitta J, Kinzig-Schippers M, Heß K-J, Sörgel F: Prediction of caffeine half-life by subject age. Poster P K8, Jahrestagung der Deutschen Pharmazeutischen Gesellschaft DPhG, Würzburg, Germany, October 8-11, 2003.
19 Bulitta J, Kinzig-Schippers M, Naber C K, Naber K G, Jakob V, Rodamer M, Holzgrabe U, Sörgel F: Limitations in the use of drug cocktails (DC) to compare the pharmacokinetics (PK) of drugs: ciprofloxacin (CIP) vs. levofloxacin (LEV). Abstr. R5168, AAPS Annual Meeting and Exposition; Denver, Colorado, USA; October 21-25, 2001.