
Metabolic fingerprinting of rat urine by LC/MS
7
Journal of Chromatography B, 828 (2005) 14–20 Metabolic fingerprinting of rat urine by LC/MS Part 2. Data pretreatment methods for handling of complex data Helena Idborg a , Leila Zamani a , Per-Olof Edlund a , Ina Schuppe-Koistinen b , Sven P. Jacobsson a,∗ a Department of Analytical Chemistry, Stockholm University, Svante Arrhenius v¨ ag 10-12, SE-106 91 Stockholm, Sweden b Molecular Toxicology, Safety Assessment, AstraZeneca R&D, SE-151 85 S¨ odert¨ alje, Sweden Received 25 January 2005; accepted 16 July 2005 Available online 28 September 2005 Abstract Metabolic fingerprinting of biofluids like urine is a useful technique for detecting differences between individuals. With this approach, it might be possible to classify samples according to their biological relevance. In Part 1 of this work a method for the comprehensive screening of metabolites was described [H. Idborg, L. Zamani, P.-O. Edlund, I. Schuppe-Koistinen, S.P. Jacobsson, Part 1, J. Chromatogr. B 828 (2005) 9], using two different liquid chromatography (LC) column set-ups and detection by electrospray ionization mass spectrometry (ESI-MS). Data pretreatment of the resulting data described in [H. Idborg, L. Zamani, P.-O. Edlund, I. Schuppe-Koistinen, S.P. Jacobsson, Part 1, J. Chromatogr. B 828 (2005) 9] is needed to reduce the complexity of the data and to obtain useful metabolic fingerprints. Three different approaches, i.e., reduced dimensionality (RD), MarkerLynx TM , and MS Resolver TM , were compared for the extraction of information. The pretreated data were then subjected to multivariate data analysis by partial least squares discriminant analysis (PLS-DA) for classification. By combining two different chromatographic procedures and data analysis, the detection of metabolites was enhanced as well as the finding of metabolic fingerprints that govern classification. Additional potential biomarkers or xenobiotic metabolites were detected in the fraction containing highly polar compounds that are normally discarded when using reversed-phase liquid chromatography. © 2005 Elsevier B.V. All rights reserved. Keywords: High-throughput profiling; Metabonomics; Metabolomics; Metabolite profiling; Metabolic profiling; Metabolic fingerprints; Biomarker; Biological fluids; Hydrophilic interaction; HILIC; LC/MS; ZIC-HILIC column; Data pre-treatment; Classification; Chemometrics 1. Introduction Metabolic fingerprinting by LC/MS, e.g., as described in Part 1 of this work, generates a wealth of data [1]. The data structure is a matrix for each sample, i.e., retention time in one direction and mass spectra in the other direction (Fig. 1). There are thou- sands of data entries per sample, complicated by a vast amount of noise, artifacts, and redundancy in the data. Chemometric methods are therefore needed to reduce the large number of variables and obtain information-rich fingerprints suitable for pattern recognition and classification. DOI of related article:10.1016/j.jchromb.2005.07.031. ∗ Corresponding author. Fax: +46 8 156391. E-mail address: [email protected] (S.P. Jacobsson). As it is difficult to visualize and handle two-way data, full- scan LC/MS data are often reported as total ion chromatograms (TICs), base peak intensity (BPI) chromatograms, or recon- structed ion chromatograms (RICs), i.e., the dimensionality has been reduced. With this approach, resolution and hence infor- mation will be lost. In addition to the problem of overlapping peaks, there are also problems of shifts in retention time and mass number, resulting in instability of sample fingerprints. TICs and similar approaches are one way of handling LC/MS data, although they will not, for instance, reduce the amount of noise or get rid of artifacts like electronic spikes. Furthermore, TICs might not give enough information to be used as a fingerprint and so alternative approaches might be needed. It would, of course, be attractive to use the information in the mass axes, i.e., the full data matrix with all m/z values at all time points. Data-analysis 1570-0232/$ – see front matter © 2005 Elsevier B.V. All rights reserved. doi:10.1016/j.jchromb.2005.07.049
-
Upload
independent -
Category
Documents
-
view
2 -
download
0
Transcript of Metabolic fingerprinting of rat urine by LC/MS

Journal of Chromatography B, 828 (2005) 14–20
Metabolic fingerprinting of rat urine by LC/MSPart 2. Data pretreatment methods for handling
of complex data
Helena Idborga, Leila Zamania, Per-Olof Edlunda, Ina Schuppe-Koistinenb,Sven P. Jacobssona,∗
a Department of Analytical Chemistry, Stockholm University, Svante Arrhenius vag 10-12,SE-106 91 Stockholm, Sweden
b Molecular Toxicology, Safety Assessment, AstraZeneca R&D, SE-151 85 Sodertalje, Sweden
Received 25 January 2005; accepted 16 July 2005Available online 28 September 2005
Abstract
might bemetabolites, using twoeatment of8 (2005) 9]ensionality
ltivariaterocedures. Additionalrded when
ll-ramscon-has
infor-ing
andICs
data,oiseICst andurse,e fullsis
Metabolic fingerprinting of biofluids like urine is a useful technique for detecting differences between individuals. With this approach, itpossible to classify samples according to their biological relevance. In Part 1 of this work a method for the comprehensive screening ofwas described [H. Idborg, L. Zamani, P.-O. Edlund, I. Schuppe-Koistinen, S.P. Jacobsson, Part 1, J. Chromatogr. B 828 (2005) 9]different liquid chromatography (LC) column set-ups and detection by electrospray ionization mass spectrometry (ESI-MS). Data pretrthe resulting data described in [H. Idborg, L. Zamani, P.-O. Edlund, I. Schuppe-Koistinen, S.P. Jacobsson, Part 1, J. Chromatogr. B 82is needed to reduce the complexity of the data and to obtain useful metabolic fingerprints. Three different approaches, i.e., reduced dim(RD), MarkerLynxTM, and MS ResolverTM, were compared for the extraction of information. The pretreated data were then subjected to mudata analysis by partial least squares discriminant analysis (PLS-DA) for classification. By combining two different chromatographic pand data analysis, the detection of metabolites was enhanced as well as the finding of metabolic fingerprints that govern classificationpotential biomarkers or xenobiotic metabolites were detected in the fraction containing highly polar compounds that are normally discausing reversed-phase liquid chromatography.© 2005 Elsevier B.V. All rights reserved.
Keywords: High-throughput profiling; Metabonomics; Metabolomics; Metabolite profiling; Metabolic profiling; Metabolic fingerprints; Biomarker; Biological fluids;Hydrophilic interaction; HILIC; LC/MS; ZIC-HILIC column; Data pre-treatment; Classification; Chemometrics
1. Introduction
Metabolic fingerprinting by LC/MS, e.g., as described in Part1 of this work, generates a wealth of data[1]. The data structureis a matrix for each sample, i.e., retention time in one directionand mass spectra in the other direction (Fig. 1). There are thou-sands of data entries per sample, complicated by a vast amountof noise, artifacts, and redundancy in the data. Chemometricmethods are therefore needed to reduce the large number ofvariables and obtain information-rich fingerprints suitable forpattern recognition and classification.
DOI of related article:10.1016/j.jchromb.2005.07.031.∗ Corresponding author. Fax: +46 8 156391.
E-mail address: [email protected] (S.P. Jacobsson).
As it is difficult to visualize and handle two-way data, fuscan LC/MS data are often reported as total ion chromatog(TICs), base peak intensity (BPI) chromatograms, or restructed ion chromatograms (RICs), i.e., the dimensionalitybeen reduced. With this approach, resolution and hencemation will be lost. In addition to the problem of overlapppeaks, there are also problems of shifts in retention timemass number, resulting in instability of sample fingerprints. Tand similar approaches are one way of handling LC/MSalthough they will not, for instance, reduce the amount of nor get rid of artifacts like electronic spikes. Furthermore, Tmight not give enough information to be used as a fingerprinso alternative approaches might be needed. It would, of cobe attractive to use the information in the mass axes, i.e., thdata matrix with allm/z values at all time points. Data-analy
1570-0232/$ – see front matter © 2005 Elsevier B.V. All rights reserved.doi:10.1016/j.jchromb.2005.07.049

H. Idborg et al. / J. Chromatogr. B 828 (2005) 14–20 15
Fig. 1. The structure of LC/MS data is shown. A matrix is obtained for eachsample.
methods that can handle three-way data, e.g., PARAFAC[2] andTucker[3], were not used in this work as they are very demand-ing in terms of computer power and are thus not suitable for thedirect data analysis of non-pretreated data.
In this second part of the work, three different meth-ods/software packages have been used for data pretreatment:
• Reduction of dimensionality, i.e., reducing dimensionality bycollapsing the mass axis (TICs) or by collapsing the time axis(Summ/z).
• MarkerLynxTM, i.e., a peak detection algorithm, where eachmass number is analyzed separately in a search for peaks[4].The area of these peaks will be given an identity ofm/z andretention time and used as a fingerprint.
• MS ResolverTM, i.e., two-way analysis by multivariate curveresolution (MCR) techniques[5]. Those are techniques thatcan recover response profiles, e.g., spectra, time profiles, oelution profiles, of components in an unresolved mixture. Noprior information is needed about the composition of the mix-ture.
The results were compared in regard to their ability to giveappropriate data for classifying urine samples using PCA[6]or PLS[7] discriminant analysis (PLS-DA) and differ betweendosed and control rats. The question of interpretation and thability to detect putative biomarkers/xenobiotic metabolites wasa
2
thisw
2
on-t rats# ior todd ther
2.2. Sample preparation and LC/ESI-MS analysis
Solid-phase extraction was used for sample preparation, asdescribed in Part 1 of this work[1]. The wash fraction wasinjected onto a ZIC®-HILIC column and the eluate onto a C18column. Both hydrophilic interaction liquid chromatography(HILIC) and reversed-phase liquid chromatography (RP-LC)have previously been described in[1].
An electrospray ionization (ESI) interface was used and themass spectrometry (MS) detection was performed in full scanmode, alternating between positive and negative ion mode. Dataobtained in profile mode fromm/z 50 to 600 were recorded at aspeed of 1 s/scan, as described in[1].
2.3. Data pretreatment
The data obtained are a matrix for each sample, i.e., retentiontime in one direction and mass spectra in the other direction.Each data file is a matrix of 551m/z values for each scan (Fig. 1).
2.3.1. Reduction of dimensionality (RD)LC/MS data obtained by Masslynx (Waters, Mass., USA)
were converted to cdf files using the program DataBridge(Waters, Mass., USA). The data (.cdf) was then imported toMATLAB 6.5 [9]. The three-dimensional structure of each sam-ple was then collapsed in the same way as when reporting totali itieso s nowa t).
eenst thisw r, asa times ereo ded,t
atai timea ed( nsi-t thodp nel,w ld
willd eryi ., ions emso plea ea n thisct
lost,a sac-r ative
lso discussed.
. Experimental
The workflow of the analysis is summarized in Part 1 ofork [1].
.1. Urine samples
Urine from eleven male Wistar rats dosed with vehicle crol (rats #1–5) or 130 mg of experimental drug X/kg/day (6–11) was collected. It was collected on one occasion prosing and on day 14 of the study. In a previous paper[8] a moreetailed description of the study design is given, althoughats were dosed with different compounds.
r
e
on current (TIC) chromatograms, i.e., summing the intensf all mass numbers at each retention time. Each sample ivector that can be used as the sample pattern (fingerprinWith this approach, problems of retention time shifts betw
amples might occur. These may be reduced by bucketing[10],hough at the expense of additional loss of information. Inork bucketing was not performed on this data; howevell samples were analyzed on the same day, the retentionhifts are not that crucial, although larger retention shifts wbserved when using HILIC compared to RP-LC. If nee
here are many methods available for peak alignment[11].A second approach to reducing dimensionality of d
nvolves collapsing the data in the other direction, i.e., thexis. The intensities for onem/z value over time are summSumm/z) and a row for each sample is obtained with inteies for each mass number. Our method differs from the meroposed by Bylund et al.[12] since it sums each mass chanhile Bylund’s method uses the maximum for eachm/z channeetected.
With this approach, the problems of retention time shiftsisappear. This is similar to direct infusion except for the v
mportant fact that the sample matrix effects are reduced, e.guppression effects. The difficulty lies in handling the problf shifts in the mass axis. One straightforward and very simpproach to bucketing is to define anm/z axis in the same rangs the scan range (50–600) and divide it into segments, iase segments of 0.1m/z. The intensities of eachm/z value arehen distributed to the appropriate segment.
By using these methods essential information may belthough the fingerprints obtained might be sufficient. Thisifice might also be needed to enable information on put
16 H. Idborg et al. / J. Chromatogr. B 828 (2005) 14–20
biomarkers to be obtained. If a putative marker is detected, it ispossible to go back to the raw data and obtain reconstructed ionchromatograms for that particular ion. Thism/z might then giverise to several peaks at different retention times that need to beevaluated, although this is much more feasible in this reduceddata set.
2.3.2. MarkerLynxTM
MarkerLynxTM Application Manager (version 1.0) is a soft-ware package from Waters (Mass., USA) for peak detection[4].It uses ApexTrackTM peak detection to integrate peaks in LC/MSdata, the identities of the peak areas being reported as retentiontime (RT) andm/z. Following peak detection, the peaks fromdifferent samples are aligned so that the same peaks (RT,m/z),i.e., most probably the same compound, are found in the samerow for all samples. The retention times are allowed to differ by±0.2 min and them/z values by±0.5 Thomson. The detectedpeaks were then exported to MATLAB v6.5 and processed asdescribed in 2.4. Data obtained in negative mode resulted in 1105peaks and in positive mode 844 peaks using HILIC. When usingRP-LC, 226 peaks in negative mode and 297 peaks in positivemode were obtained.
If one compound is fragmented, the compound is reportedas two different compounds, i.e., compound A as (RT,m/zA)and compound B as (RT,m/zB). However, this will not leadto problems for the classification, although it might make ther thim evef
2ch-
n , timp mix-t n oft
or-wf lvest ch ts xo ,tt curst ber( gmt timeW ks, tp s-t ens sa thes nter-v d hab ther[
Data obtained in negative mode resulted in 55 peaks and inpositive mode 56 peaks using HILIC, and 45 from negative dataand 62 peaks from positive data using RP-LC.
By using the MSResolverTM approach, the information inboth them/z direction and the retention time direction will betaken into consideration. In addition, problems of retention timeshifts will be taken into account. Although this is an iterativemethod and there is no unique solution, the results are goodenough for some pattern recognition problems. However, thereare probably a lot of peaks that will not be resolved. In addition,the resolution of each sample is quite time-consuming (approx-imately 5 min per sample), although it is much faster than directmethods such as HELP[15]. If high-resolution data are to beanalyzed, this method is not an option, as the calculation timewill increase dramatically.
2.4. Classification
The data (obtained as described in the Section2.3, datapretreatment) were further processed using Matlab version6.5. To prevent the largest peak from excessive influence onto the model, different scalings were evaluated. Four differ-ent processing methods were evaluated, i.e., mean centering,log10 transform + mean centering, fourth root + mean centering,or scaling of the matrix to mean zero (mean centering) and unitvariance. When only mean centering was used the largest peakh on them quali ratedi
lysis[ ssifi-c re ofc hed obisd ndary.A devi-a at thec 95%,a
2pre-
t erm LCn 163f ivem sp stud-i
o dataf sets,i ICn mod-e priaten newP ents
esults harder to interpret. The major advantage of usingethod is that the software is easy to use and is very fast,
or calculations of high-resolution data.
.3.3. MS ResolverTM
Multivariate curve resolution (MCR) techniques are teiques that can recover response profiles, e.g., spectrarofiles, or elution profiles, of components in an unresolved
ure. No prior information is needed about the compositiohe mixture.
MS ResolverTM (Pattern Recognition Systems, Bergen, Nay) is a software package based on theGentle algorithm[5,13]
or multivariate curve resolution, which mathematically resohe data into peaks. This method is an iterative approaolving the equationX = CST + E, whereX is the data matribtained for one sample,C the true chromatographic profilesS
he spectra for all components, andE is the residuals.s1 is thenhe spectrum for the first peak, and if no fragmentation ochis vector will have numbers close to zero at all mass numm/z 50–600) except for onem/z, which will be 1, correspondinost probably to the [M + H]+ ion of that peak.c1 will con-
ain information about the concentration at each retentionhen data from each sample have been resolved into pea
eaks are aligned using ReOrderTM (Pattern Recognition Syems, Bergen, Norway). ReOrderTM compares peaks betweamples within a certain time interval, in this case±30 s. Peakre aligned so that if their spectra are similar (comparingeven most intense fragments) within the current time ial, they are said to be the same compound. This methoeen used in previous work and is also briefly described
8,14].
sn
e
o
,s
.he
se
ad the largest variance and thereby the largest influenceodel. For the last scaling method all peaks were given e
mportance in the model and the two other methods genentermediate scaling properties.
The data were analyzed using principal component ana6] to study data patterns. PLS-DA was then used for claation [7]. The classification was evaluated using measulass separation (MCS)[16], which takes account of both tistribution within each class and the minimum Mahalanistance between the two classes, and a defined class boun MCS > 1 means that the class boundary is >1 standardtion from the nearest class center. MCS > 1.96 means thlasses are fully separated with a confidence interval ofssuming that the population is infinite.
.4.1. Data fusionData obtained from HILIC and RP-LC, respectively and
reated using MS ResolverTM were concatenated to yield a largatrix of 11 samples× 218 variables (peaks 1–45 from RP-egative mode, 46–107 from RP-LC positive mode, 108–
rom HILIC negative mode, and 164–218 from HILIC positode). The new matrix was log10 transformed and PLS-DA waerformed. Concatenated data from MarkerLynx were also
ed.Hierarchical modeling was used as a second approach t
usion[17]: a model was obtained for each of the four data.e. RP-LC positive, RP-LC negative, HILIC positive and HILegative, and these were nominated the lower level PLSls. Scores vectors from these models, based on the approumber of PLS components, were then used to obtain aLS model (higher level PLS). The number of PLS compon
H. Idborg et al. / J. Chromatogr. B 828 (2005) 14–20 17
in lower level PLS was based on minimum root mean squareerror of prediction (RMSEP) and in higher level PLS the PLScomponents numbered 2.
Two rats, one from the control group and one dosed, wereused as a test set to perform a brief evaluation of the models.However, this is not discussed further as the scope of this workwas not to obtain predictive models but only to illustrate theadvantages when using two different chromatographic set-ups.
The combination of different pretreatments and modes of dataanalysis gives a large number of different approaches that can beexamined. Thus, in this study on the basis of experience and theliterature, in the authors’ best judgment, only the most obviousones were examined. Although more fruitful approaches might,of course, exist, the aim was to demonstrate the improvements inresults that could be achieved by multivariate data analysis. Fur-thermore, the main purpose was to show that additional analysisof the SPE wash fraction on a ZIC®-HILIC column improvesthe metabolic fingerprints.
3. Results and discussion
In Part 1 of this work, it was shown that by using a ZIC®-HILIC column to analyze highly polar compounds and a C18column to analyze less polar compounds in urine, additionalmetabolites could be detected. In order to increase still fur-ther the number of reported metabolites and obtain sufficientm pret prod tiono
fin-g thesc possbd ta-t igha thec pectd bso
lute loadings corresponds to a retention time of 7.2 min. Spectraaround this time were obtained and RICs for selected ions werestudied, although it is difficult to suggest a putative biomarker.In addition to the problems of interpretation, there are also prob-lems of shifts in retention time. As described in[1], the retentiontime shifts were larger when using a ZIC®-HILIC column thanwhen using a C18 column, 0.2 min compared to 0.02 min. Thisindicates the need for proper peak alignment methods[11].
Instead of summing the intensities at allm/z values to obtaina TIC, the summation can be made in the other direction, i.e.,summing the intensities of a particularm/z value at all timepoints. There are some difficulties in how to define the axisas them/z values are float numbers, which results in that theaxes between different samples cannot be compared. In addition,shifts in them/z direction occur, although these are not as severeas for retention times. Different ways of defining them/z-axisgenerated as profile data are undergoing evaluation, but here asimple and straightforward approach has been used, as describedin Section2.3.1. The scores plots from PLS-DA of this dataalso showed good separation between the two classes (Table 1,Fig. 2). Due to the shift in mass number of several variables,i.e., mass numbers, monitoring the same compound, this resultsin very complex data. This illustrates the difficulties with thefluctuations in them/z direction and calls for methods ofm/zstandardization or more intelligent bucketing.
The classification of dosed and control samples based ond sa dst rkersa asest s canb canb bero tion isw tingb
s, thea hed entm
TT t me
mm/z
N 01PPP %P 60%,
D log10 tra evens porte
entio
etabolic fingerprints, three different procedures for datareatment were studied. These were compared in order touce information-rich fingerprints suitable for the classificaf dosed and control samples.
A straightforward method is to use the TICs as metabolicerprints. In a scores plot obtained from PLS-DA of TICs,amples were assigned to two groups (Table 1). In this simplease where the rats had been dosed for 14 days, it wasle to classify dosed and control samples (Fig. 2). However, it isifficult to interpret the loadings plot if the aim is to identify pu
ive biomarkers or xenobiotic metabolites. Variables with hbsolute loadings in principal component 1 were studied asorrespond to variables that increased or decreased in resosed or control samples. One of the variables with high a
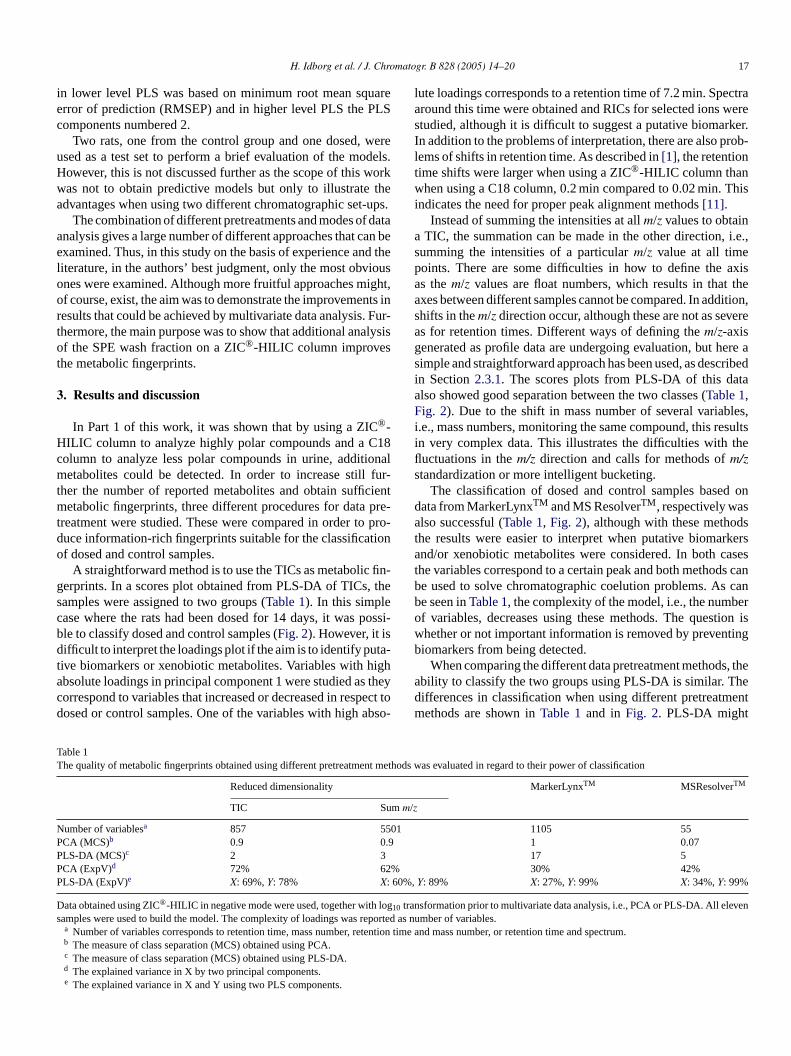
able 1he quality of metabolic fingerprints obtained using different pretreatmen
Reduced dimensionality
TIC Su
umber of variablesa 857 55CA (MCS)b 0.9 0.9LS-DA (MCS)c 2 3CA (ExpV)d 72% 62LS-DA (ExpV)e X: 69%,Y: 78% X:
ata obtained using ZIC®-HILIC in negative mode were used, together withamples were used to build the model. The complexity of loadings was rea Number of variables corresponds to retention time, mass number, retb The measure of class separation (MCS) obtained using PCA.c The measure of class separation (MCS) obtained using PLS-DA.d The explained variance in X by two principal components.e The explained variance in X and Y using two PLS components.
--
i-
yto-
ata from MarkerLynxTM and MS ResolverTM, respectively walso successful (Table 1, Fig. 2), although with these metho
he results were easier to interpret when putative biomand/or xenobiotic metabolites were considered. In both c
he variables correspond to a certain peak and both methode used to solve chromatographic coelution problems. Ase seen inTable 1, the complexity of the model, i.e., the numf variables, decreases using these methods. The queshether or not important information is removed by preveniomarkers from being detected.
When comparing the different data pretreatment methodbility to classify the two groups using PLS-DA is similar. Tifferences in classification when using different pretreatmethods are shown inTable 1and in Fig. 2. PLS-DA might
thods was evaluated in regard to their power of classification
MarkerLynxTM MSResolverTM
1105 551 0.0717 530% 42%
Y: 89% X: 27%,Y: 99% X: 34%,Y: 99%
nsformation prior to multivariate data analysis, i.e., PCA or PLS-DA. All eld as number of variables.
n time and mass number, or retention time and spectrum.

18 H. Idborg et al. / J. Chromatogr. B 828 (2005) 14–20
Fig. 2. Data from HILIC in negative mode was used and scores plots from the four different pretreatment methods are shown: upper plots were obtained using PLSon data pretreated by reduced dimensionality, TICs to the left (A) with a MCS of 1.8 and Summ/z to the right (B) with a MCS of 2.6. The lower left plot (C) wasobtained by PLS on MarkerlynxTM data (MCS = 16.6) and the lower right (D) PLS on MS ResolverTM data (MCS = 5.3). Control samples (non-filled squares) anddosed samples (filled rhombs) were well separated in all cases with plot A (TICs) as the only exception.
overestimate the classification power (poor predictions), but isvery useful in this case as the aim is to find metabolites thatvary in accordance with the two groups. When comparing themeasure of class separation, the separation was increased whenusing data from both ZIC®-HILIC and RP-LC data (Table 2).To illustrate what a measure of class separation (MCS) of sixmeans, a scores plot is shown inFig. 3. The best MCS wasobtained when using MarkerlynxTM as a pretreatment methodand data from RP-LC positive, RP-LC negative, HILIC positiveand HILIC negative were concatenated (Table 2). However, allresults reported inTable 2showed sufficient class separation.
The difficulty in the interpretation of loading plots also varieswhen using different pretreatment methods, as mentioned ear-lier. The reasons were primarily the difference in number of
Table 2Comparison of different PLS-DA models based on separate models (C18 orZIC®-HILIC data and positive or negative ions) and a model based on concate-nated data and finally a model obtained using hierarchical modelling
MCSa (PLS-DA) MarkerLynxTM MSResolverTM
C18 neg 45 7C18 pos 36 6ZIC®-HILIC neg 20 5ZIC®-HILIC pos 13 5Concatenate 57 12Hierarchical modelling 40 27
A est sM d.
variables generated from the various pretreatments, and thenature of the variables, thus loading displayed. For all four meth-ods, each variable in the loading plot corresponds to a metabolitein some way: the total ion intensity at a particular retentiontime (TICs), the intensity of a particularm/z value over time(Sum m/z), the area for a peak at a particular retention time
Fig. 3. The above scores plot is obtained from PLS of data obtained using RP-L TM edo ure ofc trol rat)i
ll models were based on nine samples as two rats were used as the teasures of class separation for dosed and control samples are reportea The measure of class separation (MCS) obtained using PLS-DA.
et.C in positive mode and MS Resolver for pretreatment. The model is basn four control samples (X) and five dosed samples (O) and the measlass separation was 6. In addition, the test set (one dosed and one con
s projected onto this plot and marked with circles.

H. Idborg et al. / J. Chromatogr. B 828 (2005) 14–20 19
Table 3Variables with high absolute loadings in PLS component 1 obtained using datafrom RP-LC and HILIC in both positive and negative ion mode are reported
Putative biomarkersa Rankb
RP-LC (±) + HILIC (±)c
Var 48, RT = 3.4 min, 76m/z 1 (C18 +)Var 79, RT = 9.9 min, 477m/z 2 (C18 +)Var 130, RT = 10.7 min, 159m/z 3 (ZIC®-HILIC −)Var 184, RT = 10.8 min, 159m/z 4 (ZIC®-HILIC +)Var 168, RT = 3.8 min, 188m/z 5 (ZIC®-HILIC +)Var 91, RT = 11.4 min, 488m/z 6 (C18 +)Var 93, RT = 11.7 min, 424m/z 7 (C18 +)Var 121, RT = 6.8 min, 166m/z 8 (ZIC®-HILIC −)Var 175, RT = 5.8 min, 261m/z 9 (ZIC®-HILIC +)Var 86, RT = 10.5 min, 170m/z 10 (C18 +)
In both cases MS ResolverTM and log10 transformed data were used. Additionalputative biomarkers were detected using the combined method.
a Putative biomarkers are reported as retention time (RT) andm/z value.b The variable with the highest absolute loading in PLS component 1 is ranked
number 1. The LC/MS procedure used to obtain this peak, i.e., variable, is shownin parenthesis.
c Results from PLS-DA on concatenated data where variable nos. 1–45 arefrom C18 negative mode, 46–107 from C18 positive mode, 108–163 from ZIC®-HILIC negative mode, and 164–218 from ZIC®-HILIC positive mode.
andm/z value (MarkerLynxTM) or the peak area for a peak at aparticular retention time with a particular mass spectrum (MSResolverTM).
3.1. Putative biomarkers
By using the proposed method, additional putative biomark-ers can be detected compared to when only using RP-LC. InTable 3, the putative biomarkers found by using both RP-LC andHILIC (concatenated data) are reported. Reconstructed ion chromatograms (RICs) of the two highest ranked putative biomarkerfound using ZIC®-HILIC are shown inFig. 4. The results fromthe concatenated data using MarkerLynx for pretreatment are noshown as the ten highest ranked variables were found to orig
F rs aresh gH ainedi
inate from the same compound. Of course, more of the highlyranked variables could be studied.
In a parallel study, rats were dosed with citalopram[8] insteadof, as in this case, substance X. Both substances were found toinduce phospholipidosis[18,19], and by studying data from bothcompounds it might be possible to find putative biomarkers forphospholipidosis without running the risk of assigning xenobi-otic metabolites as putative biomarkers. Naturally, the markersneed to be identified to confirm that they are not monitoring adifferent phenomenon due to the dosage instead of phospholipi-dosis.
4. Conclusions
The classification of samples for diagnosis of a particulardisease is based on suitable metabolic fingerprints. It is there-fore important to obtain relevant data, i.e., fingerprints reflectingthe discrimination. In Part 1 of this work, data were obtainedby LC/MS using two chromatographic systems (RP-LC andHILIC). However, just as important as collecting suitable datais having the right tools to extract the information from the dataand transform the data into useful fingerprints.
The metabolic fingerprints were improved by using data fromboth ZIC®-HILIC and RP-LC as the separation of dosed andcontrol samples increased. It was shown that MarkerLynxTM
a TM odst ntiont rkers,a bio-l
A
ternR oft-w rdH Lynx.W gripf
R
obs-
35.York,
pe-
[ Dear,Com-
[ P.
ig. 4. Reconstructed ion chromatograms (RICs) from potential biomarkehown to illustrate the chromatography of the ZIC®-HILIC column. The thirdighest ranked variable from the concatenated data (Table 3) was obtained usinILIC and negative ion mode (upper RIC), while the fourth highest was obt
n positive mode using the same ZIC®-HILIC column (lower RIC).
-s
t-
nd MSResolver were two good data pretreatment methhat gave interpretable results. Peaks at a particular reteime and mass number were suggested as putative biomalthough further investigations are needed to assign them
ogical significance.
cknowledgements
The authors would like to thank Olav Kvalheim and Patecognition Systems in Bergen, Norway, for providing the sare of MS ResolverTM. We would also like to thank Siguermansson at Waters Sweden for analysis using Markere are grateful to Fredrik O. Andersson and Ralf J.O. Tor
or helpful discussions regarding Matlab.
eferences
[1] H. Idborg, L. Zamani, P.-O. Edlund, I. Schuppe-Koistinen, S.P. Jacson, J. Chromatogr. B 828 (2005) 9.
[2] R. Bro, Chemometr. Intell. Lab. Syst. 38 (1997) 149.[3] L.R. Tucker, Psychometrika 31 (1966) 279.[4] www.waters.com.[5] R. Manne, B.-V. Grande, Chemometr. Intell. Lab. Syst. 50 (2000)[6] J.E. Jackson, A Users Guide to Principal Components, Wiley, New
1991.[7] S. Wold, Chemometr. Intell. Lab. Syst. 58 (2001) 109.[8] H. Idborg-Bjorkman, P.-O. Edlund, O.M. Kvalheim, I. Schup
Koistinen, S.P. Jacobsson, Anal. Chem. 75 (2003) 4784.[9] The MathWorks, 2002.10] R.S. Plumb, C.L. Stumpf, M.V. Gorenstein, J.M. Castro-Perez, G.J.
M. Anthony, B.C. Sweatman, S.C. Connor, J.N. Haselden, Rapidmun. Mass Spectrom. 16 (2002) 1991.
11] J. Forshed, R.J.O. Torgrip, M.K.Aberg, B. Karlberg, J. Lindberg, S.Jacobsson, J. Pharma. Biomed. Anal. 38 (2005) 824.

20 H. Idborg et al. / J. Chromatogr. B 828 (2005) 14–20
[12] D. Bylund, J. Samskog, K.E. Markides, S.P. Jacobsson, J. Am. MassSpectrom. 14 (2003) 236.
[13] H. Shen, B. Grung, O.M. Kvalheim, I. Eide, Anal. Chim. Acta 446(2001) 313.
[14] H. Idborg, P-O. Edlund, S.P. Jacobsson, Rapid Commun. Mass Spec-trom. 18 (2004) 944.
[15] O.M. Kvalheim, Y.Z. Liang, Anal. Chem. 64 (1992) 936.[16] M. Aberg, Variance reduction in analytical chemistry, thesis, Stockholm
University, Stockholm, 2004.[17] S. Wold, N. Kettaneh, K. Tjessem, J. Chemometr. 10 (1996) 463.[18] U.P. Kodavanti, H.M. Mehendale, Pharma. Rev. 42 (1990) 327.[19] H. Halliwell, Toxicol. Pathol. 25 (1997) 53.