Agilent 1220 Infinity LC
180
Agilent 1220 Infinity LC Solutions for Easy-to-Use and Affordable UHPLC Application Compendium
-
Upload
khangminh22 -
Category
Documents
-
view
0 -
download
0
Transcript of Agilent 1220 Infinity LC

Agilent 1220 Infinity LC Solutions for Easy-to-Use and Affordable UHPLC
Application Compendium

2

3
Table of Contents
Introduction . . . . . . . . . . . . . . . . . . . . . . . . . . . . . . . . . . . . . . . . . . . . . . . . . . . . . . . . . . . . . . . . . . . . . . . . . . . . . . . . . . . . . . . . . .5
Performance of the Agilent 1220 Infinity LC . . . . . . . . . . . . . . . . . . . . . . . . . . . . . . . . . . . . . . . . . . . . . . . . . . . . . . . . . . . .7-34
Performance characteristics of the Agilent 1220 Infinity Gradient LC System . . . . . . . . . . . . . . . . . . . . . . . . . . . . .9
Enhancing the capabilities of the Agilent 1220 Infinity LC System
with the Agilent 1260 Infinity Fluorescence Detector . . . . . . . . . . . . . . . . . . . . . . . . . . . . . . . . . . . . . . . . . . . . . . . .17
Time- and peak-based fraction collection with the Agilent 1220 Infinity LC System . . . . . . . . . . . . . . . . . . . . . .21
Using the Agilent Instrument Control Framework to control the
Agilent 1220 Infinity LC system through Waters Empower software . . . . . . . . . . . . . . . . . . . . . . . . . . . . . . . . . . . . . .27
Using the Agilent Instrument Control Framework to control the
Agilent 1220 Infinity LC System through Dionex Chromeleon software . . . . . . . . . . . . . . . . . . . . . . . . . . . . . . . . . . . . .31
Performance of the Agilent 1220 Infinity Mobile LC . . . . . . . . . . . . . . . . . . . . . . . . . . . . . . . . . . . . . . . . . . . . . . . . . . . . . . .35
Performance Characteristics of the Agilent 1220 Infinity Gradient LC System
with Diode Array Detector and Mobile Upgrade Kit . . . . . . . . . . . . . . . . . . . . . . . . . . . . . . . . . . . . . . . . . . . . . . . . . .37
Environmental Applications . . . . . . . . . . . . . . . . . . . . . . . . . . . . . . . . . . . . . . . . . . . . . . . . . . . . . . . . . . . . . . . . . . . . . . . .49-69
Screening for EU banned dyes in textiles by LC/MS . . . . . . . . . . . . . . . . . . . . . . . . . . . . . . . . . . . . . . . . . . . . . . . . .51
Analysis of herbicides in drinking water using the Agilent 1120 Compact LC . . . . . . . . . . . . . . . . . . . . . . . . . . . .59
Analysis of DNPH-derivatized Aldehydes and Ketones using the
Agilent 1220 Infinity LC System with Diode Array Detector . . . . . . . . . . . . . . . . . . . . . . . . . . . . . . . . . . . . . . . . . . .63
Food Applications . . . . . . . . . . . . . . . . . . . . . . . . . . . . . . . . . . . . . . . . . . . . . . . . . . . . . . . . . . . . . . . . . . . . . . . . . . . . . . . . . . . .71
Analysis of plant stanyl fatty acid esters in enriched margarine
usng an on-line coupled Agilent 1220 Infinity LC – 7890 GC System . . . . . . . . . . . . . . . . . . . . . . . . . . . . . . . . . . .73
Analysis of antioxidants in chewing gum using the Agilent 1120 Compact LC . . . . . . . . . . . . . . . . . . . . . . . . . . .77
Analysis of preservatives in food and cosmetics with the Agilent 1120 Compact LC . . . . . . . . . . . . . . . . . . . . .81
Analysis of sweeteners in food and beverages with the Agilent 1120 Compact LC . . . . . . . . . . . . . . . . . . . . . .85
Determination of preservatives in food and drugstore products with the Agilent 1120 Compact LC . . . . . . . .89
Determination of water soluble vitamins with the Agilent 1120 Compact LC
after method development with the Agilent 1200 Series Rapid Resolution LC System and back transfer . . . .95
Quantitative liquid chromatography analysis of melamine in dairy products
using Agilent's 1120 Compact LC and 1200 Series Rapid Resolution LC . . . . . . . . . . . . . . . . . . . . . . . . . . . . . . .103
Quality analysis of virgin olive oils – Part 1: Thermal treatment analysis –
determination of 3,5-stigmastadienes in olive oil using the
Agilent 1220 Infinity LC System with Diode Array Detector . . . . . . . . . . . . . . . . . . . . . . . . . . . . . . . . . . . . . . . . . .109

Pharmaceutical Applications . . . . . . . . . . . . . . . . . . . . . . . . . . . . . . . . . . . . . . . . . . . . . . . . . . . . . . . . . . . . . . . . . . . . .115-177
Analysis of amoxicillin and five impurities on the Agilent 1220 Infinity LC System . . . . . . . . . . . . . . . . . . . . . .117
Analysis of Paracetamol and Aspirin in pain relievers on the
Agilent 1220 Infinity Isocratic LC System with manual injector . . . . . . . . . . . . . . . . . . . . . . . . . . . . . . . . . . . . . . .123
Analysis of ginseng and American ginseng using the Agilent 1120 Compact LC . . . . . . . . . . . . . . . . . . . . . . . .127
Development and validation of a method for simultaneous determination of
paracetamol, diclofenac and ibuprofen using the Agilent 1120 Compact LC . . . . . . . . . . . . . . . . . . . . . . . . . . . .131
In-process control for Aripiprazole manufacturing with the
Agilent 1120 Compact LC and ZORBAX C-18 columns . . . . . . . . . . . . . . . . . . . . . . . . . . . . . . . . . . . . . . . . . . . . . . .135
Detector linearity testing for Aripiprazole quality control with
the Agilent 1120 Compact LC and ZORBAX C-18 columns . . . . . . . . . . . . . . . . . . . . . . . . . . . . . . . . . . . . . . . . . . .139
Injector linearity testing for Tramadol quality control with the
Agilent 1120 Compact LC and Agilent TC C18(2) columns . . . . . . . . . . . . . . . . . . . . . . . . . . . . . . . . . . . . . . . . . . .143
System suitability testing for Aripiprazol quality control with the
Agilent 1120 Compact LC and ZORBAX C-18 columns . . . . . . . . . . . . . . . . . . . . . . . . . . . . . . . . . . . . . . . . . . . . . . .149
System suitability testing for Tramadol quality control with the
Agilent 1120 Compact LC and ZORBAX C-18 columns . . . . . . . . . . . . . . . . . . . . . . . . . . . . . . . . . . . . . . . . . . . . . . .153
Development and validation of an HPLC method to analyze ibuprofen and impurities
according to the European Pharmacopoeia . . . . . . . . . . . . . . . . . . . . . . . . . . . . . . . . . . . . . . . . . . . . . . . . . . . . . . . .157
USP purity analysis of pravastatin sodium using the Agilent 1120 Compact LC . . . . . . . . . . . . . . . . . . . . . . . . .161
Development, validation, and comparison of an HPLC method to
analyze paracetamol and related impurities according to the
European Pharmacopoeia (EP) and USP using the Agilent 1120
Compact LC and the Agilent 1200 Series LC System . . . . . . . . . . . . . . . . . . . . . . . . . . . . . . . . . . . . . . . . . . . . . . . .165
Determination of degradation products of Metoprolol tablets
with the Agilent 1120 Compact LC after method development
with the Agilent 1200 Series Rapid Resolution LC System . . . . . . . . . . . . . . . . . . . . . . . . . . . . . . . . . . . . . . . . . . .171
Specifications of the Agilent 1220 LC System . . . . . . . . . . . . . . . . . . . . . . . . . . . . . . . . . . . . . . . . . . . . . . . . . . . . . . . . . . .179
4

5
Introduction
This compendium is a collection of technical information and applications
performed on the Agilent 1220 Infinity LC and its predecessor the Agilent 1120
Compact LC.
Based on well-established Agilent LC technologies, the 1120 Compact LC
featured simplified functions and easy-to-use software to facilitate conventional
HPLC up to 400 bar. The 1120 Compact LC was mainly deployed in small to
medium sized quality control or research laboratories.
A customer survey conducted by Agilent revealed the requirements for more
instrument flexibility and a wider power range. In response Agilent introduced
the 1220 Infinity LC, leveraging the latest technology by sharing components
with the Agilent 1260 Infinity LC while maintaining excellent value and
compatibility.
Key Features• Pressure range up to 600 bar – for UHPLC in combination with
Agilent Poroshell columns
• Integrated diode array detector with spectra analysis – for impurity
characterization
• Hardware upgrade paths such as isocratic to gradient for higher method
flexibility, manual to automated injection for higher sample throughput,
and a click-in column oven for better chromatographic reproducibility
• Seamless addition of any Agilent LC detector or analytical-scale fraction
collector, including integrated software control
• Scalable software choices from basic workstation packages to distributed
client/server solutions, including options for regulatory compliance
• A special mounting plate absorbs shocks and vibration during transport or
operation for onsite analysis in remote areas

6

7
Performance of the Agilent 1220 Infinity LCThe first part of the Agilent 1220 Infinity LC Application
Compendium demonstrates the typical performance of the
1220 Infinity LC. This includes high precision of retention
time and area, precise gradient formation, and excellent
signal-to-noise ratio.
Additional technical details describe the integration of the
1220 Infinity LC with third party software related to
instrument control.
Furthermore, analysis in combination with fraction collection
and analysis of PAHs with fluorescence detection show the
flexibility of the 1220 Infinity LC.

8

Performance characteristics of theAgilent 1220 Infinity Gradient LC SystemAn integrated LC system for conventional LC
and UHPLC
IntroductionThe Agilent 1220 Infinity Gradient LC is a liquid chromatography (LC) system for rou-tine standard analysis. Due to its extraordinary pressure range up to 600 bar, thesystem can also perform UHPLC applications. It is an integrated LC system consist-ing of a binary low pressure mixing (‘dual gradient’) pump, autosampler, columncompartment and variable wavelength detector (VWD). The dual gradient pump hasa flow range from 0.2 up to10 mL/min (5 mL at 600 bar, 10 mL at 200 bar), low pres-sure mixing and an integrated degasser. The VWD detector features 80 Hz dataacquisition rate and a wavelength range from 190 nm up to 600 nm. The autosam-pler can operate up to 600 bar, with an injection volume range from 0.1 to 100 μLand a capacity of 100 2 mL vials. The column oven holds one 25 cm column and themaximum temperature is 60 °C.
In this Technical Overview the following parameters were tested on the Agilent1220 Infinity Gradient LC:
The pump was tested for:
• Precision of retention time
• Performance of step gradients
The autosampler was tested for
• Precision of areas
• Carryover
• Injection volume linearity
The variable wavelength detector was tested for:
• Noise and drift
• Linearity
Method transfer from conventional to UHPLC is another important applicationwhich will be demonstrated.
Technical Overview
min0 0.5 1 1.5 2 2.5 3
mAU
0
10
20
30
40
50
60
70
6
9 5990-6025EN

10
ExperimentalThe Agilent 1220 Infinity LC
Gradient System (G4290B) was
equipped with dual gradient pump,
autosampler, column compartment
and the variable wavelength detec-
tor.
Pumpperformance–Precision ofretention timesOptimum retention time precision
depends mainly on:
• Pump performance, the most
important issue
• Equilibration status of the columns
• Equilibration status of the com-
plete system
• Degassing of the solvent
• Temperature stability of the col-
umn compartment
The most important parameter is
the pump performance itself, how-
ever, other parameters can influ-
ence precision of retention times.
For example, if a solvent was
changed the column needs at least
ten column volumes for proper equi-
libration. If gradients are applied, at
least five column volumes are need-
ed to equilibrate the column to the
start conditions. Furthermore, if the
column compartment temperature
was changed, for example from 30
°C to 60 °C, it requires approximate-
ly 20 minutes until the column is
equilibrated to the new tempera-
ture. Proper degassing influences
the precision positively.
In this Technical Overview, retention
time precision was tested with different
gradient and isocratic conditions using
4.6 and 3 mm internal diameter (id)
columns. The relative standard
deviation (RSD) for retention times is
typically < 0.2% RSD for gradient analy-
sis. In Figure 1, an example of an iso-
cratic application is shown. Here the
flow precision is typically < 0.07% RSD
for retention times.
6 consecutive runs
min0 1 2 3 4 5 6 7 8
mAU
0
20
40
60
80
100
VWD1 A, Wavelength=254 nm (1220 DATAF...ON 250BAR_2JUNE7 2010-06-07 12-25-26\ISOCRATIC_250BAR_7JUNE210.D)
Peak RSD RT (%) RSD area (%) 5 μL
1 0.048 0.1221
2 0.055 0.1872
3 0.060 0.1168
4 0.094 0.0958
Figure 1Retention time and area precision for an isocratic run run with dynamic mixing.
Sample Isocratic test sample (p/n 01080-68707)
Column Agilent ZORBAX Eclipse Plus C18 4.6 × 150 mm, 1.8 μm (PN 959994-902), 245 bar
Mobile phase A = Water
B = Acetonitrile
Isocratic 30/70 A/B
Flow rate 1.2 mL/min
Stop time 9 min
Injection volume 5 μL , draw speed 200 μL/min
Column temperature 40 °C
VWD 254 nm
Flow cell 10 mm
Peak width: PW 0.05 min (10 Hz)
5990-6025EN

11
In Figure 2 an example for a gradient
run is shown. The retention time preci-
sion is < 0.045%RSD, except for the
first peak
In Figure 3 an example for a fast gradi-
ent run at 563 bar is shown. In this
application Poroshell columns were
used. The retention time precision is
< 0.15%RSD.
min0 2 4 6 8 10
mAU
0
50
100
150
200Peak6 consecutive runs RSD RT (%) RSD area (%)
1 μL
1 0.179 0.3876
2 0.039 0.3914
3 0.036 0.3977
4 0.024 0.4520
5 0.027 0.4400
6 0.040 0.4863
7 0.043 0.5367
8 0.039 0.4960
9 0.016 0.4669
Figure 2Precisions for a gradient run at 445 bar with a RT precision < 0.045% RSD except for the first peak.
Sample RRLC checkout sample (p/n 5188-6529)
Column Agilent ZORBAX Eclipse Plus C18 3 × 100 mm, 1.8 μm
Mobile phase A = Water
B = Acetonitrile
Gradient 20% B to 95% B in 10 min
Flow rate 1 mL/min
Stop time 12 min
Post time 5 min
Injection volume 1 μL
Column temperature 40 °C
VWD 245 nm
Flow cell 10 mm
Peak width > 0.05 min (10 Hz)
Figure 3Retention time and area precision at 563 bar for a fast gradient application. RSD RT is < 0.15.
Sample RRLC checkout sample (p/n 5188-6529)
Column Agilent Poroshell 120 EC-C18, 3.0 × 50 mm, 2.7 μm
Mobile phase A = Water
B = Acetonitrile
Gradient 30% B to 95% B in 1 min
Flow rate 3.5 mL/min
Stop time 1.5 min
Post time 1 min
Injection volume 1 μL
Column temperature 40 °C
VWD 245 nm
Flow cell 10 mm
Peak width PW > 0.0125 min (40 Hz)
Peak RSD RT (%) RSD area (%) 1 μL
1 0.149 0.3003
2 0.096 0.3128
3 0.070 0.4475
4 0.090 0.6441
5 0.060 0.5561
6 0.106 0.3719
7 0.097 0.3338
8 0.073 0.8496
9 0.059 0.6734
6 consecutive runs
min0 0.2 0.4 0.6 0.8 1 1.2 1.4
mAU
0
50
100
150
200
5990-6025EN
12
Performance of step gradientTracer experiments are also frequently
used to verify the solvent mixing ripple
at different gradient mixtures, to evalu-
ate pump performance. The delay vol-
ume, the accuracy and precision of gra-
dients are also evaluated using step
gradients. Figure 4 shows a step gradi-
ent from 0 to 100% in 10% steps.
Caffeine was selected as the tracer
compound. Acetone is not ideal for
testing step gradient performance
because acetone is too easily removed
in the degasser at low flow rates. For
testing the step gradient performance
of the Agilent 1120 Infinity LC, we rec-
ommend using non-volatile compounds.
The performance results are :
• Ripple on 10% step = 0.03%
• Ripple on 50% step = 0.08%
• Ripple on 90% step = 0.08%
• Precision of step height for 50% step
= <0.1%RSD for 3 runs
• Delay volume: 860 μL
Injector performance–Area precisionPrecise injection is mandatory for good
quantitative results in liquid chromatog-
raphy. The Agilent 1220 injector can
inject precisely over an injection range
from 0.5 up to 100 μL. Examples are
given in Figures 1 to 3 . In Figure 1 the
Area precision is < 0.19% RSD for 5 μL
injection volume. Figure 2 shows an
example of a conventional gradient. The
area precision for 1 μL is < 0.54% RSD.
The area precision for 1 μL is <0.85%
RSD for a fast gradient run as shown in
Figure 3.
The injector settings are very important
for optimum precision of areas. For
example, if highest precision is needed
the draw speed of the injector should
be set to lower values, especially if
large volume or viscous sample are
injected.
carryover (Figure 5) was found to be
< 0.031% for the conditions used. After
a 500 ng sample injection,
unadulterated solvent was injected.
CarryoverCarryover was tested using the built in
Agilent 1220 autosampler. The injection
draw speed was set to 20 μL/min and
an exterior needle wash was used. The
500 ng Caffeine
Carryover: 0.031% using a wash vial for cleaning
the exterior of the needle
min0 0.25 0.5 0.75 1 1.25 1.5 1.75 2 2.25
mAU
-2
-1
0
1
2
3
4
5
min0 10 20 30 40 50 60
mAU
0
100
200
300
400
500
600 Overlay of 3 consecutive runs at 283 bar
Figure 4Overlay of 3 step gradients.
Column Restriction capillary with 283 bar backpressure
Mobile phase A = Water +20% Isopropanol
B = Water + 20% Isopropanol +10 mg/L Caffeine
Step gradient from 0% to 100% B in 10% steps
Flow rate 1 mL/min
Stop time 70 min
Post time 5 min
Column temperature 36 °C
VWD 273 nm
Flow cell 10 mm
Peak width > 0.025 min (20 Hz)
Figure 5Carryover of 500 ng injection of Caffeine is 0.031%.
Sample Caffeine 500 ng/μL
Column Agilent Poroshell 120 EC C-18 3 × 50 mm, 2.7 μm
Mobile phase A = Water
B = Acetonitrile
Isocratic 10% B
Flow rate 0.8 mL/min
Stop time 2.5 min
Injection volume 1 μL , draw speed 20 μL/min, wash vial in position 41
Column temperature 30 °C
VWD 273 nm
Flow cell 10 mm
Peak width PW > 0.025 min (20 Hz)
5990-6025EN

13
Injection volume linearityInjection volume linearity was tested
using Primidone standards. All injection
volumes contained 781.26 ng of
Primidone. The injection volume varied
but the injected amount was the same,
(Figure 6). The peak heights and areas
are expected to be the same for all
injection volumes. The experiments
show that all areas were within 0.82%
RSD over the complete injection volume
range of 0.8 to 100 μL. Each injection
volume was injected 3 times and the
resulting 24 runs were evaluated for
area precision.
Prepare an accurate dilution series to
obtain good linearity. One way is to
dilute large volumes, for example start-
ing with one liter. If only small volume
should be diluted special care has to be
taken: The pipettes should be calibrat-
ed, and the same pipette should be
used for the complete dilution series.
Otherwise there is a big risk that a dilu-
tion error is measured rather than
linearity.
Detector performanceEvaluation of baseline noise according
to guidelines of the American Society
for Testing and Materials (ASTM) and
drift of the 10 mm and 60 mm path
length cell.
ASTM noise and drift was evaluated
using a restriction capillary instead of a
column and water as the mobile phase.
The variable wavelength detector was
set to a four seconds response time.
The resulting ASTM noise of the 10 mm
path length cell was found to be
±2.2 μAU and the drift was1.2 mAU/h
(Figure 7).
Figure 6Injection volume linearity from 0.8 to 100 μL using Primidone as test compound.
Sample Primidone 25 mg/25 mL, 7 times 1:2 diluted
Column Agilent ZORBAX Eclipse Plus C18 150 × 4.6 mm,1.8 μm
Mobile phase A = Water
B = Acetonitrile
Isocratic 30% B
Flow rate 0.8 mL/min
Stop time 2.5 min
Injection volume 0.78 to 100 μL , draw speed 50 μL/min
Column temperature 40 °C
VWD 220 nm
Flow cell 10 mm
Peak width PW > 0.025 min (20 Hz)
Figure 7VWD noise and drift measurement.
Column Restriction capillary with 42 bar backpressure
Mobile phase A = Water isocratic
Flow rate 1 mL/min
Stop time 30 min
Column temperature 36 °C
VWD 254 nm
Flow cell 10 mm
Peak width > 0.2 min (4 s response) (2.5 Hz)
min0 1 2 3 4 5 6 7
mAU
0
100
200
300
400
500
3.13 μL
1.56 μL 100 μL
50 μL
25 μL
12.5 μL
6.25 μL
0.78 μL
min0 5 10 15 20 25
mAU
-0.05
-0.04
-0.03
-0.02
-0.01
0
0.01
VWD1 A, Wavelength=254 nm (1220 DATA ...EDRIFT\1220NOISEAND DRIFT 2010-04-22 08-09-24\1220NOISE_DRIFT5.D)
ASTM noise: ± 2.2355 μAU
Drift: -1.151 mAU/h
5990-6025EN

14
Linearity for different caffeineconcentrationsLinearity was tested using caffeine
standards from 1.5 ng to 750 ng of
injected amount. For this concentration
range, very good linearity was obtained.
The coefficient of correlation was
0.99996. The response factors were all
within the 5% error range from 1.5 up to
750 ng (Figure 8).
Method transfer from conven-tional to UHPLCIn this experiment, columns of different
pore size and length were employed to
shorten analysis and optimize resolu-
tion (Figure 9).
It has been shown that the Agilent 1220
Infinity LC system is an instrument that
can be used for conventional chro-
matography (Figure 9, blue trace) as
well as UHPLC (other traces). It is pos-
sible to progress step by step to UHPLC
and optimize for resolution (Figure 9,
green trace) or for speed (pink trace).
Chromatographic conditions
Sample from Sigma Aldrich:
• Reversed Phase Test Mix (Order No.:
47641-U)
• 1 × 1 mL (uracil, phenol, n,n-diethyl-m-
toluamide, toluene)
• HPLC Gradient System Diagnostic Mix
(Order No.: 48271)
• 6 × 1 mL (phenol, methyl parabens,
ethyl parabens, propyl parabens, butyl
parabens, hepthyl parabens, uracil)
Figure 8VWD linearity using Caffeine as sample compound.
Sample Caffeine standards
Column Agilent Poroshell 120 EC-C18, 3.0 × 50 mm, 2.7 μm
Mobile phase A = Water
B = Acetonitrile
Isocratic 10% B
Flow rate 0.8 mL/min
Stop time 1.5 min
Post time 1 min
Injection volume 3 μL
Column temperature 30 °C
VWD 273 nm
Flow cell 10 mm
Peak width PW 0.025 min (20 Hz)
Sample preparationDilute each sample to 5 mL with water/acetonitrile 1:1. Mix the two diluted samples 1:1
Column Agilent ZORBAX Eclipse Plus C18, 3 x 50, 1.8 μm, 3 x 100, 1.8 μm, 3 x 100, 3.5 μm
3 x 150, 5 μm
Mobile phase A = Water
B = Acetonitrile
Gradient: 0 min 20 % B
3 min, 6 min, 6 min, 9 min 100% B
Flow rate 1.2 mL/min
Stop time 3.2 min, 5.7 min, 5.5 min, 7.5 min
Injection volume 3 μL
Column temperature 40 °C
VWD 254 nm
Flow cell 10 mm
Peak width > 0.005 min (80 Hz)
Figure 9Optimization of resolution and speed by changing step by step from conventional to UHPLC.
1.60E -01
1.80E -01
2.00E -01
2.20E -01
2.40E -01
2.60E -01
2.80E -01
3.00E -01
3.20E -01
3.40E -01
1.5 3 6 12 60 150 300 375 750R
esp
on
se f
act
or
(am
ou
nt/
are
a)
Amount (injected ng)
1220VWD linearity
Correlation 0.999936
5% range
min1 2 3 4 5 6 7
mAU
0
20
40
60
80
100
120
140
3 × 150, 5 μm, Tg = 9 minResolution peak 6 = 1.23Run time = 7.5 min
3 × 100, 3.5 μm, Tg = 6 minResolution peak 6 = 1.29Run time = 5.5 min
3 × 100, 1.8 μm, Tg = 6 minResolution peak 6 = 1.7Run time = 5.7 min
3 × 50, 1.8 μm, Tg = 3 min Resolution peak 6 = 1.09Run time = 3.2 min
6
5990-6025EN

15
It is also possible to obtain better reso-
lution in less time by further increasing
the flow rate, (Figure 10).
Chromatographic conditions
Sample from Sigma Aldrich:
Reversed Phase Test Mix (Order No.:
47641-U)
1 × 1 mL (uracil, phenol, n,n-diethyl-m-
toluamide, toluene)
HPLC Gradient System Diagnostic Mix
(Order No.: 48271)
6 × 1 mL (phenol, methyl parabens,
ethyl parabens, propyl parabens, butyl
parabens, hepthyl parabens, uracil)
Sample preparation:
Dilute each sample to 5 mL with
water/acetonitrile 1:1
Mix the two diluted samples 1:1
Figure 10Improving speed and resolution by increasing the flow rate.
Column Agilent ZORBAX Eclipse Plus C18 3 × 50 mm, 1.8 μm
Mobile phase A = Water
B = Acetonitrile
Gradient 0 min 20 % B
3 min 100 % B
3.3 min 100 % B
Flow rate 1.2 mL/min
Stop time 3.3 min
Post time 3 min
Injection volume 3 μL
Column temperature 40 °C
VWD 254 nm
Flow cell 10 mm
Peak width > 0.003 min (80 Hz)
min0 0.5 1 1.5 2 2.5 3
mAU
0
10
20
30
40
50
60
70
VWD1 A, Wavelength=254 nm (TEST1220\PART14000001.D)
min0 0.5 1 1.5 2 2.5 3
mAU
0
10
20
30
40
50
60
VWD1 A, Wavelength=254 nm (TEST1220\PART21000001.D)
3 × 50 mm, 1.8 μm column
at 1.2 mL/min at 315 bar,
40 °C, 80 Hz
Resolution for peak 6 = 1.09
3 × 50 mm, 1.8 μm column
at 2.4 mL/min at 510 bar,
50 °C, 80 Hz
Resolution for peak 6 = 2.53
6
6
Column Agilent ZORBAX Eclipse Plus C18 3 × 50 mm, 1.8 μm
Mobile phase A = Water
B = Acetonitrile
Gradient 0 min 20 % B
1.5 min 100 % B
1.7 min 100 % B
Flow rate 2.4 mL/min Pressure
Stop time 1.7 min
Post time 2 min
Injection volume 3 μL
Column temperature 50 °C
DAD 254 nm / 4 (360 nm / 100)
Flow cell 10 mm
Peak width > 0.003 min (80 Hz)
5990-6025EN

ConclusionThe performance of the Agilent 1220
Gradient LC system fulfills all needs of
modern analytical liquid chromatogra-
phy. It is especially well suited for 3 mm
and 4.6 mm id columns and can be
used for conventional and for rapid res-
olution (RR) or ultra fast LC on columns
packed with 1.8 μm particles.
Precision of retention times is typically
</= 0.2% RSD. The precision for areas
is typically < 0.25% for injection vol-
umes >/= 5 μL. Carryover is typically
< 0.05% with external needle cleaning.
The VWD combines lowest noise
(ASTM noise for the 10 mm path length
cell was found to be ± 3.5 μAU) with a
linear range up to 2 mAU.
165990-6025EN

17
Proof of Performance
Enhancing the capabilities of the Agilent 1220 Infi nity LC System with the Agilent 1260 Infi nity Fluorescence Detector
Technical Overview
Abstract
The Agilent 1220 Infi nity LC is an integrated, robust and easy-to-use system for
HPLC and UHPLC. Capable of handling back pressures up to 600 bar at fl ow rates
up to 5 mL/min, the 1220 Infi nity LC is ideal for UHPLC applications that deploy
sub-2-μm or superfi cially porous columns with an id of 3 – 4.6 mm. In addition,
instrument-to-instrument method transfer has been implemented by design in
the 1220 Infi nity LC, enabling the system to run legacy methods from any Agilent
1100 Series, Agilent 1200 Series, or Agilent 1200 Infi nity Series instrument. In this
Technical Overview, we demonstrate how the integrated 1220 Infi nity LC can be
enhanced with an external Agilent 1260 Infi nity Fluorescence Detector and how a
method for the analysis of polynuclear aromatic hydrocarbons can be transferred
easily from an Agilent 1260 Infi nity LC system.
Author
Udo Huber
Agilent Technologies, Inc.
Waldbronn, German
5990-9397EN

18
Introduction
Polynuclear aromatic hydrocarbons
(PAHs) are hydrocarbons with multiple
ring structures. This class of com-
pounds is suspected to be mutagenic
and/or contain toxic compounds. As a
result, many countries have introduced
maximum permission levels, which has
led to the need for suitable monitor-
ing methods. Such HPLC and UHPLC
methods were described in a previous
Agilent Application Note1. Detection
using a fl uorescence detector (FLD)
with its high selectivity and sensitivity
has proven to be ideal for the
quantitative analysis of PAHs.
The Agilent 1220 Infi nity LC system is
ideally suited for this type of analyses
but does not have an integrated FLD.
Using the Controller Area Network
(CAN) it is easy to connect any other
Agilent module to the 1220 Infi nity LC
system. In this Technical Overview, the
CAN connection was used to connect
an FLD to the 1220 Infi nity LC system
for the analysis of PAHs. To demon-
strate the instrument-to-instrument
method transfer by design, the reten-
tion times of the PAH compounds
measured on the 1220 LC system and
on a 1260 Infi nity LC system from
a previous Application Note1 were
compared.
Experimental
Instruments and softwareAn Agilent 1220 Infi nity LC Gradient
System (G4290B), including a gradi-
ent pump (max. pressure 600 bar) with
integrated degasser, autosampler,
column oven, and variable wavelength
detector with standard fl ow cell
(10 mm path length) was used.
The Agilent 1200 Infi nity Series
Fluorescence Detector (G1321B) was
equipped with the standard fl ow cell
(8 μL) and connected via CAN to the
1220 Infi nity LC.
The system was controlled using the
Agilent OpenLAB CDS ChemStation
Edition Rev. C.01.03.
Samples and solventsSS EPA 610 PAH Mix in Methanol/
Methylene Chloride (1:1), (Supelco
Analytical), containing the following
PAHs: Naphtalene, Acenaphtylene,
Acenaphtene, Fluorene, Phenanthrene,
Anthracene, Fluoranthene, Pyrene,
Benzo(a)anthracene, Chrysene,
Benzo(b)fl uoranthene, Benzo(k)
fl uoranthene, Benzo(a)pyrene,
Dibenzo(a,h)anthracene, Benzo(g,h,i)
perylene and Indeno(1,2,3-cd)pyrene
Acetonitrile was LC grade. Fresh
ultrapure water was obtained from a
Milli-Q Integral system equipped with
a 0.22 μm membrane point-of-use
cartridge (Millipak).
Parameter Setting
Column: Agilent ZORBAX Eclipse PAH 4.6 x 150 mm, 5 μm
Mobile phase: A = Water, B = Acetonitrile
Gradient: at 0 min 40% B
at 20 min 95% B
at 30 min 95% B
Stop time: 30 min
Post time: 10 min
Flow rate: 1.5 mL/min
Injection volume: 3 μL
Column temp.: 25 °C
VWD: 230 nm
FLD: Emission: 260 nm
Excitation: 350, 420, 440, and 500 nm (A, B, C, D)
Chromatographic conditions
5990-9397EN

19
Results and discussion
The PAH sample was analyzed on
a dedicated PAH column applying a
gradient using water and acetonitrile
as mobile phase. Since the PAHs have
their emission maximums at different
wavelengths, the multi-signal acquisi-
tion feature of the Agilent 1260 Infi nity
FLD was applied. In addition, the UV
signal of the integrated variable wave-
length detector (VWD) of the Agilent
1220 Infi nity LC system was used for
the analysis of acenaphthylene.
Figure 1 shows the multisignal chroma-
togram for the analysis of PAHs using
fl uorescence detection.
A major advantage of the 1220 Infi nity
LC system is the “instrument-to-
instrument method transfer by design”,
which means that methods from any
Agilent 1100 Series, Agilent 1200
Series, or Agilent 1200 Infi nity LC
system can be transferred without
modifi cations and lead to the same
results, for example, the same reten-
tion time. In this Technical Overview,
the transfer was even done from an
Agilent 1260 Infi nity Series Binary
Pump, which is a high-pressure mixing
pump, to the 1220 Infi nity System,
with a built-in low-pressure mixing
pump. But even when the transfer is
done from a pump using a different
operation and mixing principle2, the
retention time differences are 2.2 %
or less as shown in Table 1. While the
experiments on the 1260 Infi nity LC
and the 1220 Infi nity LC system were
done on the identical column, several
weeks passed and many injections
were meanwhile done on that column.
Therefore, this value lies well within
the limits that would be expected from
column aging over this time.
Compound Signal RT (1260 Infi nity) RT (1220 Infi nity) D (%)
Naphthalene FLD A 7.24 7.08 2.2
Acenaphthylene VWD 8.24 8.06 2.2
Acenaphthene FLD A 9.72 9.57 1.5
Fluorene FLD A 10.1 9.95 1.5
Phenanthrene FLD A 11.11 10.97 1.3
Anthracene FLD B 12.22 12.07 1.2
Fluoranthene FLD C 13.34 13.17 1.3
Pyrene FLD B 14.16 14.00 1.1
Benzo(a)anthracene FLD B 16.95 16.86 0.5
Chrysene FLD B 17.63 17.56 0.4
Benzo(b)fl uoranthene FLD C 19.82 19.82 0.0
Benzo(k)fl uoranthene FLD B 20.86 20.90 0.2
Benzo(a)pyrene FLD B 21.68 21.76 0.4
Dibenzo(a,h)anthracene FLD B 23.37 23.46 0.4
Benzo(ghi)perylene FLD B 24.47 24.50 0.1
Indeno(1,2,3-cd)pyrene FLD D 25.75 25.66 0.3
Table 1Retention time differences between the Agilent 1260 Infi nity Binary LC System and the Agilent 1220 Infi nity LC System.
Figure 1Multi-signal chromatogram for the analysis of PAHs using fl uorescence detection (acenaphthylene was determined using UV detection).
180
160
140
120
100
80
60
40
20
0
0 5 10 15 20 25 min
1
2
3
4 5
67
8
9
10
11
12
13
14
15
16
1 Napthalene
2 Acenaphtylene
3 Acenaphtene
4 Fluorene
5 Phenantrene
6 Anthracene
7 Fluoranthene
8 Pyrene
9 Benzo(a)anthrecene
10 Chrysene
11 Benzo(b)fluoranthene
12 Benzo(k)fluoranthene
13 Benzo(a)pyrene
14 Dibenzo(a,h)anthracene
15 Benzo(g,h,i)perylene
16 Indeno(1,2,3-cd)pyrene
5990-9397EN
20
Conclusion
In this Technical Overview, we have
shown the enhancement of an Agilent
1220 Infi nity LC system by simply
adding an Agilent 1260 Infi nity FLD
through CAN bus connection. Using
the analysis of PAHs as an example,
we could also demonstrate the simple
method transfer between systems
leading to identical results.
References
1
“Agilent Application Solution: Analysis
of PAHs in soil according to EPA 8310
method with UV and fl uorescence
detection” Agilent Technologies
Application Note, 2011, publication
number 5990-8414EN
2
“Scope of low and high pressure mixing
Comparing the Agilent 1260 Infi nity
Quaternary and Binary Pumps” Agilent
Technologies Technical Overview, 2011,
publication number 5990-7143EN
5990-9397EN

21
Proof of Performance
Time- and peak-based fraction collection with the Agilent 1220 Infi nity LC System
Technical Overview
Abstract
Analytical-scale purifi cation of compounds can be performed easily using standard
HPLC or UHPLC equipment that is capable of delivering fl ow rates up to 10 mL/min.
In this fl ow rate range, columns with ids from 4 up to 10 mm can be operated close
to their vanDeemter optimum, facilitating the purifi cation of crude compounds at
amounts between 1 and 10 mg. In this Technical Overview, we demonstrate the
combination of the Agilent 1220 Infi nity LC System with the Agilent 1260 Infi nity
Analytical-scale Fraction Collector for time- and peak-based fraction collection
using a generic compound mixture. Triggering of fractions is done based on reten-
tion time windows as well as based on the signal of the built-in variable wave-
length detector (VWD) of the 1220 Infi nity LC System. The collected fractions are
re-analyzed to demonstrate the purity of the isolated compounds.
Author
Udo Huber
Agilent Technologies, Inc.
Waldbronn, Germany
5990-9396EN

22
Introduction
Preparative LC is not defi ned by column
diameters or fl ow rates but by what
happens to the compounds after they
are separated on the column. While
in analytical LC, the compounds are
passed to waste after the last detector
in the system, in preparative LC, they
are transferred to a fraction collector.
Based on selectable triggering criteria
such as retention time windows or
detector signals, the fraction collec-
tor transfers the desired parts of the
chromatogram to dedicated fraction
containers, for example, tubes, vials,
or well plates. To ensure that only the
desired part of the chromatogram such
as a specifi c peak is collected with high
purity and recovery, two prerequisites
have to be fulfi lled by the system:
• The fi rst requirement is an accurate
determination of the delay time of
the system. When a compound is
detected by the detector, the fraction
collector has to wait until the com-
pound has travelled to the fraction
collector diverter valve. This delay
time has to be determined before-
hand. Manual procedures usually
involve some sort of a dye and a stop
watch — but they are usually very
tedious, unreliable, and inaccurate.
With the patented Agilent Delay
Sensor1 and a protocol executed
within the Agilent LabAdvisor
software, the delay calibration is a
simple, fast, and accurate task.
• The second requirement is mini-
mized system dispersion between
the detector and the fraction col-
lector. Unnecessarily long or wide
capillaries lead to broadening of
the peak travelling from the detec-
tor to the fraction collector due to
dispersion effects. Since the time
the diverter valve of the fraction col-
lector remains in the collect position
is determined by the width of the
peak in the detector, excessive peak
broadening can lead to decreased
recovery and purity. The Agilent 1260
Infi nity Analytical-scale Fraction
Collector was especially designed to
minimize system dispersion by using
optimized connection capillaries and
by positioning the diverter valve as
close as possible to the fraction
collection needle.
While both requirements have to be
fulfi lled for any preparative LC system,
they are especially important when
working at low fl ow rates such as used
in analytical-scale preparative LC.
Experimental
Instruments and softwareAn Agilent 1220 Infi nity LC Gradient
System (G4290B), including a gradi-
ent pump (max. pressure 600 bar) with
integrated degasser, autosampler,
column oven, and variable wavelength
detector with standard fl ow cell
(10 mm path length) was used.
Fractions were collected using an
Agilent 1260 Infi nity Analytical-scale
Fraction Collector (G1364C), equipped
with a 4-well plate tray and four vial
plates for 54 × 2 mL vials.
The system was controlled using the
Agilent OpenLAB CDS ChemStation
Edition Rev. C.01.03.
The delay calibration was performed
using the Agilent Lab Advisor Software
Rev. B.02.01.
Samples and solventsSS EPA 610 PAH Mix in Methanol/
Methylene Chloride (1:1), (Supelco
Analytical), containing the following
PAHs: Naphtalene, Acenaphtylene,
Acenaphtene, Fluorene, Phenanthrene,
Anthracene, Fluoranthene, Pyrene,
Benzo(a)anthracene, Chrysene,
Benzo(b)fl uoranthene,
Benzo(k)fl uoranthene,
Benzo(a)pyrene,
Dibenzo(a,h)anthracene,
Benzo(g,h,i)perylene, and
Indeno(1,2,3-cd)pyrene
Acetonitrile was LC grade. Fresh
ultrapure water was obtained from a
Milli-Q Integral system equipped with
a 0.22 μm membrane point-of-use
cartridge (Millipak).
Parameter Setting
Column: Agilent ZORBAX Eclipse PAH 4.6 × 150 mm, 5 μm
Mobile phase: A = Water, B = Acetonitrile
Gradient: at 0 min 40% B
at 12 min 80% B
at 12.1 min 95% B
at 25 min 95% B
Stop time: 25 min
Post time: 5 min
Flow rate: 1.5 mL/min
Injection volume: Various
Column temperature: 25 °C
Variable wavelength
detector:
230 nm
Chromatographic conditions
5990-9396EN

23
Results and discussion
Delay calibrationThe delay calibration procedure
determines the delay time between
the detector and the fraction collector
in the system. The delay time is used
to compensate for the time it takes for
the compound to travel between the
point of detection in the detector and
the point of collection in the frac-
tion collector. With the Agilent 1260
Infi nity Fraction Collector, the delay
calibration procedure is done using
the fraction delay sensor (FDS), a very
simple detector built in into the fraction
collector.
Together with the signal from the
Agilent 1220 LC Systems’ UV detec-
tor the signal from the FDS facilitates
determination of the delay time
between detector and fraction col-
lector as shown in Figure 1. The delay
calibration procedure is a completely
automated process using the Agilent
Lab Advisor Software. The result is a
delay volume, which is then recalcu-
lated into a delay time for any given
fl ow rate in the actual fraction collec-
tion method. For the system setup used
in this Technical Overview, the delay
volume of the system was determined
to be 83 μL as shown in Figure 2. This
delay volume is stored in the fraction
collector confi guration.
Figure 1Delay calibration procedure.
Figure 2Result of the delay calibration procedure using the Agilent Lab Advisor Software.
UV tD
FDS
0 1 2 3 4 5 6 7 8 9 min
0 1 2 3 4 5 6 7 8 9 min
Inject delay
calibration sample
(no column)
Detector Diverter
valveWaste
Fraction delay
sensor
Fraction collector
5990-9396EN

24
Time-based fraction collectionBesides manually-triggered fraction
collection, time-based fraction collec-
tion is the easiest method to collect
fractions from a chromatographic run.
In the experiment shown in Figure 3,
fractions of 1 minute were taken
between 6 and 16 minutes in the
chromatogram.
Another possibility of time-based frac-
tion collection with the Agilent 1260
Infi nity Fraction Collector is to divide
a time window into a certain number
of equidistant fractions. Regardless of
what mode of time-based fraction col-
lection is applied, this triggering mode
is very unspecifi c. In this example,
this can be clearly seen when the
collected fractions are re-analyzed.
In the example from Figure 3, fraction
number three contains only one, pure
compound eluting at about 8.8 minutes
(Figure 4a). Fractions number one and
two (Figure 4b) contain both the com-
pound eluting at 7.5 minutes. This is a
typical problem when using time-based
fraction collection, especially when
retention times start to shift due to
column aging.
mAU
2500
2000
1500
1000
500
0
2.5 5.0 7.5 10.0 12.5 15.0 17.5 20.0 22.5 min
Figure 3Result of time-based fraction collection.
Figure 4aRe-analysis of fraction 3.
Figure 4bReanalysis of fractions 1 (blue) and 2 (red).
mAU
140
120
100
80
60
40
20
0
3 4 5 6 7 8 9 10 11 min
Norm.
300
250
200
150
100
50
0
3 4 5 6 7 8 9 10 11 min
5990-9396EN

25
Peak-based fraction collectionPeak-based fraction collection is a
more dedicated method to collect only
the desired peaks and not unwanted
baseline. To identify a peak and trigger
the fraction collector, several param-
eters such as threshold, up slope, and
down slope are available for the Agilent
1260 Infi nity Fraction Collector2. In
this experiment, simply a threshold of
500 mAU was set for peak identifi ca-
tion. The resulting chromatogram and
fraction collection results are shown in
Figure 5.
As a result, only the major peaks are
collected in dedicated fractions with
high purity. This can be seen when
re-analyzing the fractions, as shown for
the fi rst three fractions as an example
in Figures 6 a–c.
Conclusion
In this Technical Overview, we show
the combination of the Agilent 1220
Infi nity LC System and the Agilent 1260
Infi nity LC Analytical-scale Fraction
Collector as a simple and cost-effective
system for analytical-scale preparative
LC. Dedicated features such as the
automated delay calibration procedure
and the design of the fraction collector
for lowest delay volumes, ensure infi -
nitely better fraction collection leading
to high purities and recoveries.
mAU
2500
3000
3500
4000
2000
1500
1000
500
0
2.5 5.0 7.5 10.0 12.5 15.0 17.5 20.0 22.5 min
Figure 5Peak-based fraction collection using a threshold of 500 mAU.
Figures 6 a –cRe-analysis of fractions 1 – 3.
mAU
600
500
400
300
200
100
0
3 4 5 6 7 8 9 10 11 min 3 4 5 6 7 8 9 10 11 min 3 4 5 6 7 8 9 10 11 min
mAU
600
500
400
300
200
100
0
mAU
600
500
400
300
200
100
0
a b c
5990-9396EN

26
References
1.
“Principles in preparative HPLC”
Agilent Technologies Primer, 2004,
publication number 5989-0652EN
2.
“Sophisticated peak-based fraction
collection – working with up and
down slope” Agilent Technologies
Application Note, 2010, publication
number 5989-0511EN
5990-9396EN

27
Using the Agilent Instrument Control Framework to control the Agilent 1220 Infi nity LC System through Waters Empower softwareInstrument set up and performance
Technical Overview
Abstract
The Agilent Instrument Control Framework (ICF) enables other providers of LC data
acquisition and processing software to simplify the development of the control
of Agilent LC instrumentation. In this Technical Overview, we demonstrate how
Agilent ICF facilitates enhanced control of the Agilent 1220 Infi nity LC system
through Waters Empower chromatography data software versions 2 and 3. The
combination of Agilent ICF and Waters Empower software provides easy access to
advanced features of the 1220 Infi nity LC system such as overlapped injections.
Author
A.G.Huesgen
Agilent Technologies, Inc.
Waldbronn, Germany
5990-9399EN

28
Introduction
The Agilent Instrument Control
Framework (ICF) is a software com-
ponent that makes it easier and faster
for software providers to implement
control of Agilent LC equipment in
their chromatographic data systems or
workstations1,2. Based on new standard
instrument drivers from Agilent, ICF
eliminates much of the delay and effort
of using low-level instrument control
codes and the need of software devel-
opers to write their own native drivers.
In this Technical Overview, we
demonstrate:
• What prerequisites have to be
fulfi lled to ensure seamless interac-
tion between Agilent 1220 Infi nity LC
systems, Waters Empower software,
and Agilent ICF
• How instruments are confi gured
and methods are created for the
Agilent 1220 Infi nity LC system
using Waters Empower software in
combination with Agilent ICF
• That the performance of the Agilent
1220 Infi nity LC system fulfi lls
expectations in combination with
Waters Empower data acquisition
and processing tools
Experimental
An Agilent 1220 Infi nity LC system with
the following confi guration was used
for the precision measurement:
• Gradient pump
• Autosampler
• Column oven
• Variable wavelength detector
• Agilent ZORBAX RRHT Eclipse Plus
C-18 column packed with 1.8-μm
particles
Prerequisites for the combination of Empower and ICF
• Only Agilent 1220 Infi nity LC sys-
tems containing an autosampler
are supported. Instruments with a
manual injector are not supported by
Empower 2 or 3.
• All Agilent LC modules must have
fi rmware version A.06.32 or B.06.32
or B.06.41 or higher.
• All Agilent LC modules must have
RC.Net drivers.
• Agilent Infi nity LC ICS 1.0.0
• Empower 2, feature release 3 or
higher or Empower 3 software3
• Windows XP with service pack 3 or
higher3
Results and discussion
Agilent ICF facilitates access to
advanced features of Agilent LC instru-
ments that were previously not sup-
ported by earlier revisions of Empower
with drivers provided by Waters. Now,
all features are supported and avail-
able though the new On line screen,
which has been added to the familiar
Empower screen, see Figure 1. A right-
click on one of the module fi elds gives
access to all control, method and other
advanced features of the module.
For supported modules and functions,
refer to the Appendix.
Chromatographic conditions for precision measurementCompounds: RRLC Checkout sample
(p/n 5188-6529), acetanilide,
acetophenone, propiophenone,
butyrophenone, benzophenone,
valerophenone, hexanophenone,
heptanophenone, octanophenone
Column: Agilent ZORBAX RRHT Eclipse
Plus C-18, 4.6 × 100 mm, 1.8 μm
Mobile phases: A = Water, B = Acetonitrile
Gradient: 20% to 80% B in 8 min,
at 9 min 80% B,
at 9.01 min 20% B
Flow rate: 1.2 mL/min
Stop time: 12 min
Column
temperature: 30 °C
Injection
volume: 1 μL
VWD: 245, 10 Hz
Software: Empower 2 Build 2154,
Installed Service Packs: A-D
Installed
feature
releases: 1-4, with ICF version A.01.02 SP1
5990-9399EN

2929
Confi guring the Agilent 1220 Infi nity LC system• Set up the DHCP of the Empower
node.
• Set all DIP switches of the Agilent
module to 0. This module is con-
nected to the Empower node
through LAN.
• The LC receives an IP address from
the DHCP server.
• To connect the Agilent instrument,
confi gure the DHCP server through
Properties of the Empower Nodes.
• Use Edit to set the instrument type
and a unique name.
• Click File and New chromatographic system to make the new LC system
accessible for data acquisition.
After this last confi guration step, the
Agilent 1220 Infi nity LC system is On Line and ready for use.
These confi guration steps have to be
followed whenever a new module is
added or removed. Previously, the old
confi guration has to be deleted from
the DHCP server confi guration. Then
the Empower software has to be shut
down and the LAN connection to the
module has to be switched off and on
again. When the LAN connection has
been restored, the new confi guration
procedure can be started.
Creating an instrument method and a method setHaving confi gured the instrument, the
instrument method and the method set
can be created in the Empower Run
sample screen. The Instrument method
is set up through the Edit method. All
parameters that are available in the
Agilent ChemStation are now typically
accessible in Empower.
The created instrument method is
saved and used to set up a method set.
The method set can then be used to
create sequences.
Creating a sequenceA sequence is created by fi lling the
sample set table with name of sample,
position of vials, number of injection
per vial, method set to be used, and
so forth.
Performance of the Agilent LC systems using Waters Empower data processing toolsTo demonstrate that the Agilent 1220
Infi nity LC system fulfi lls the expected
performance the following tests were
done using the RRLC Checkout sample:
• Precision of retention time
• Precision of areas
Figure 1Agilent Instrument Status screen under Empower software and ICF, captured while a sequence was running.
Precision of retention time and areas Precision of retention times and areas
for a 1 μL injection are combined in
Table 1. Data were evaluated using the
Empower Component summary report.
The precision for the retention times
for six consecutive runs is less than
0.24% RSD, for the area the precision is
less than 0.9% RSD.
Peak name RSD RT (%)
RSD Area (%) (1 μL injection volume)
acetanilide 0.236 0.229
acetophenone 0.149 0.308
propiophenone 0.066 0.392
butyrophenone 0.034 0.518
benzophenone 0.041 0.334
valerophenone, 0.051 0.459
hexanophenone 0.050 0.510
heptanophenone 0.039 0.605
octanophenone 0.038 0.838
Table 1Precision of retention times and areas for six consecutive runs.
5990-9399EN

30
4.
“Using the Agilent Instrument Control
Framework to control the Agilent 1260
Infi nity LC through Waters Empower
software- Instrument set up and
performance”, Agilent Publication,
Publication number 5990-9092EN,
November 2011
5.
“Using the Agilent Instrument Control
Framework to control the Agilent 1290
Infi nity LC through Waters Empower
software - Instrument set up and
performance”, Agilent Publication,
Publication number 5990-9093EN,
November 2011
Conclusion
The Agilent Instrument Control
Framework (ICF) is a software com-
ponent that makes it easier and faster
for software providers to implement
control of Agilent liquid chromatogra-
phy systems in their chromatographic
data systems or workstations. In our
application example, ICF was used to
control the Agilent 1220 Infi nity LC
system in combination with Waters
Empower software. The instrument
was confi gured in Empower and data
were acquired and processed. The
combination of ICF and Empower
software facilitates access to all avail-
able Agilent instrument features such
as overlapped injection. The Agilent
Instrument Status screen is used to
set up On Line methods, to switch
the system on or off, to equilibrate
columns, to view the status of single
module, and to access special features
using the Control function available for
each Agilent LC module. As expected,
the Agilent 1220 Infi nity LC system
shows the same excellent performance
for data acquired and processed using
Empower and ICF.
References
1.
“The Agilent Technologies Instrument
Control Framework”, Technical
Overview, Publication number 5990-
6504EN, November 2010
2.
“The Agilent Technologies Instrument
Control Framework”, Short overview,
Publication number 5990-5756EN,
June 2010
3.
“Agilent Infi nity LC Instrument
Component software Version 1.0
for Empower software”, Waters
Installation note, Publication number
716003453 Rev.A, August 2011
Appendix
Supported Not supported
G4286B Isocratic, Manual Injector X
G4288B/C Gradient, Manual Injector X
G4290B/C Gradient, Autosampler X
Table 2Supported and not supported instruments.
5990-9399EN

31
Using the Agilent Instrument Control Framework to control the Agilent 1220 Infi nity LC System through Dionex Chromeleon software Instrument set up and performance
Technical Overview
Abstract
The Agilent Instrument Control Framework (ICF) enables other providers of LC
data acquisition and processing software to simplify the development of software
control for Agilent LC instruments. Dionex Chromeleon 6.80SR11 A in combination
with Agilent ICF provides enhanced control functions for all Agilent LC instru-
ments. As an example, the Agilent 1220 Infi nity LC System was connected to the
new software features in the Dionex Chromeleon architecture. Nearly all Agilent
1220 Infi nity LC instrument features are now accessible through the combination of
Agilent ICF and Dionex Chromeleon software, such as overlapped injection.
Author
A.G.Huesgen
Agilent Technologies, Inc.
Waldbronn, Germany
5990-0157EN

32
Introduction
The Agilent Instrument Control
Framework (ICF) is a software com-
ponent that makes it easier and faster
for software providers to implement
control of Agilent LC equipment in
their chromatographic data systems or
workstations1. Based on new standard
instrument drivers from Agilent, ICF
eliminates much of the delay and effort
of using low-level instrument control
codes and the need for software
developers to write their own native
drivers 1, 2.
In this Technical Overview, the Agilent
1220 Infi nity LC System was con-
nected to Dionex Chromeleon and the
functionality and performance was
evaluated. The following is discussed:
• What prerequisites have to be
fulfi lled to ensure seamless interac-
tion with 1220 Infi nity LC Systems,
Dionex Chromeleon software, and
Agilent ICF
• How instrument methods and
sequences for the 1220 Infi nity LC
system are set up in the Dionex
Chromeleon software
• That the 1220 Infi nity LC system also
fulfi lls performance specifi cations
under Dionex Chromeleon software
• Supported confi gurations are listed
in the Appendix, Table 2
Experimental
EquipmentThe instrument used was an Agilent
1220 Infi nity LC System (G4290B),
equipped with:
• Binary pump with vacuum
degasser
• Autosampler
• Column oven
• Variable wavelength detector
• Agilent ICF and Agilent LC Driver
Package (version A.01.02 or higher)
installed on the PC
• All hardware installed and instru-
ment connected to the PC through
LAN.
Results and discussion
With Agilent ICF, it is now possible to
support Agilent LC instrument fea-
tures which were not supported with
previous Dionex Chromeleon software
versions, using native Dionex drivers.
Especially features available in the
On Line screen which is added to the
other Dionex Chromeleon screens,
(Figure 1). Click the ICF Status window
in the Dionex Chromeleon control panel
screen to start the 1220 Infi nity Status
window. A right mouse-click in one of
the module windows gives access to all
control, methods and other features of
this module. For more detailed informa-
tion, see3,4.
The user interface is used for direct
control of the 1220 Infi nity LC System.
Right mouse click in Grad. Pump
and then select Method to open the
Method screen for the pump. Flow
rate and organic percentage can be
selected to equilibrate the system. This
is for control and equilibration only; no
instrument method is created here.
Chromatographic conditionsCompounds: Uracil, Phenol, methyl-, ethyl-,
propyl-, butyl- and heptylparaben
Column: Agilent ZORBAX Eclipse C18
RRHT,
4.6 × 100 mm, 1.8 μm
Mobile phases: A=Water, B=Acetonitrile
Gradient: 20% B to 90% B in 8 min
20% B at 8.01 min
Flow rate: 1.2 mL/min
Stop time: 12 min
Column
temperature: 40 °C
Injection
volume: 3 μL
Detection: 254 nm, 20 Hz
Figure 1New Agilent Instrument Status screen under Dionex Chromeleon software and ICF software.
The minimum prerequisites needed to
run the Agilent 1220 Infi nity LC with
Dionex Chromeleon and Agilent ICF
include:
• Dionex Chromeleon software version
6.80 SR11A
5990-0157EN

33
Creating a methodAfter confi guration and integration of
the Agilent LC system in the Dionex
Chromeleon architecture, the instru-
ment method can be set up by click-
ing File, New and Program File. New
sequences, reports and so on are
created here.
Click Launch Agilent ICF IME to start
the 1220 Infi nity LC system method
setup screens for pump, autosampler,
column oven, and VWD.
After selecting the appropriate method
values for all parameters, store the
Method (Program) fi le in an appropriate
directory.
Creating a sequenceA sequence is created using the
Sequence Wizard. The wizard leads
the user through a dialog, for example,
sample name, setting position of vials,
number of injections per vial, instru-
ment method, and other entries. To
save the created sequence and start
the sequence, click Batch and Start, (Figure 2). When all runs are done, the
Status column shows Finished for all
runs, and data processing can be done.
Performance of Agilent LC systems using Dionex Chromeleon data processing tools
Precision of retention time and areas Figure 3 shows the chromatogram of
the paraben sample. Precision of reten-
tion times and areas for a 3-μL injec-
tion are combined in Table 1. Data were
evaluated using the Dionex Chromeleon Peak Summary report. The precision for
the retention times for six consecutive
runs is <0.04% RSD, for the area the
precision is <0.51% RSD. Both values
are well within the specifi cation limits
for the 1220 Infi nity LC System.
Figure 2The Agilent 1220 Infi nity LC system shown in the Dionex Chromeleon software, showing a sequence run.
Figure 3 Chromatogram of the parabene sample for evaluation of retention time and area precision.
5990-0157EN

34
References
1.
“The Agilent Technologies Instrument
Control Framework”, Technical
Overview, Publication number
5990-6504EN, 2010.
2.
“The Agilent Technologies Instrument
Control Framework” Short overview,
Publication number 5990-5756EN,
2010.
Conclusion
The Agilent Instrument Control
Framework is a software component,
that makes it faster and easier for
other software providers to enable and
control Agilent liquid chromatography
systems through their chromatographic
data systems or workstations. In our
application example, the ICF software
was used to control the Agilent 1220
Infi nity LC System in combination
with Dionex Chromeleon software.
The instrument was confi gured in
Dionex Chromeleon and data were
acquired and processed. The combina-
tion of ICF software (version A.01.02
or higher) and Dionex Chromeleon
6.80 SR11A software allows access to
nearly all Agilent instrument features
such as injector programming. The
Agilent instrument status screen is
used to set up On Line methods, to
switch the system on or off, to equili-
brate columns, to view the status of
single modules, and to access special
features using the control function
that is available for each Agilent LC
module. As expected the 1220 Infi nity
LC System shows the same excellent
performance for data acquired and
processed using Dionex Chromeleon
and ICF software.
Appendix
Supported
G4286B Isocratic, Manual Injector x
G4288B/C Gradient, Manual Injector x
G4290B/C Gradient, Autosampler x
Table 2Supported Agilent LC modules.
Peaknumber Peak name RSD RT (%)
RSD Area (%) (3 μL injection volume)
1 Phenol 0.031 0.309
2 Methylparabene 0.029 0.182
3 Ethylparabene 0.038 0.252
4 Propylparabene 0.027 0.179
5 Butylparabene 0.024 0.203
6 Heptylparabene 0.013 0.501
Table 1Precision of retention times and areas for six consecutive runs.
3.
Operation of the Agilent 1290 Infi nity
LC under Dionex Chromeleon soft-
ware using Instrument Control
Framework (ICF) Instrument set up and performance, Publication Number
5990-7215EN, 2011.
4.
Operation of the Agilent 1260 Infi nity
LC under Dionex Chromeleon 6.8
software using the Agilent Instrument
Control Framework (ICF), Publication
Number 5990-7232EN, 2011.
5990-0157EN

35
Performance of the Agilent 1220 Infi nity Mobile LC
This section describes the performance characteristics of the
Agilent 1220 Infinity Mobile LC. The 1220 Infinity LC Mobile
Upgrade Kit consists of functional parts that enable the 1220
Infinity LC system to be mounted in a mobile laboratory vehicle so
it can be moved to different locations to access remote
measurement sites. The main component is the attenuation unit
that acts as a shock absorber to protect the instrument during
transit or from influences of operators moving in the mobile
laboratory. A solvent bottle unit keeps the bottles fixed to the
instrument. Wire mesh keeps the column safe in the column oven,
and the mobile solvent compartment secures the solvent bottles
during operation.

36

37
Performance Characteristics of the Agilent 1220 Infi nity Gradient LC System with Diode Array Detector and Mobile Upgrade Kit
Technical Overview
Abstract
The Agilent 1220 Infi nity Gradient LC system is now available with a built-in diode
array detector that offers a data acquisition rate of 80 Hz for full spectra. In com-
bination with the Agilent 1220 Infi nity Mobile Upgrade Kit, the system is resistant
against shocks or vibrations during transportation in a mobile vehicle. The 1220
Infi nity Mobile LC Solution is a robust and rugged system for onsite measurement.
The performance of the system before and after vibration tests on a moving tray
was evaluated with respect to retention time and area precision as well as noise
and drift of the diode array detector. The performance of the diode array detector
was analyzed in detail.
Author
Sonja Schneider
Agilent Technologies, Inc.
Waldbronn, Germany
1.6
1.8
2.0
2.2
2.4
2.6
2.8
3.0
3.2
3.4×10⁻¹
1.5 3 6 12 60 150 300 375 750
Re
spo
nse
fa
cto
r (a
mo
un
t/a
rea
)
Amount (ng)
5% rangeAgilent 1220 Infinity LC DAD linearity Correllation = 0.99999
5991-1544EN

38
Introduction
The 1220 Infi nity Gradient LC system
is an integrated, binary-gradient liquid
chromatography system with a pres-
sure range of up to 600 bar, supporting
both HPLC and UHPLC technology,
including sub-2 μm and superfi cially
porous columns. The system is avail-
able with a built-in diode array detector
(DAD) for multiwavelength detec-
tion and spectra analysis. The DAD
features a data acquisition rate 80 Hz,
multiwavelength detection and spec-
tral analysis. Other system modules
include a dual-channel gradient pump,
autosampler and column oven. The
gradient pump has a fl ow rate range
from 0.2 to 10 mL/min (5 mL at 600 bar,
10 mL at 200 bar), low pressure mixing
and an integrated degassing unit. The
autosampler operates with an injection
volume range from 0.1 to 100 μL and a
capacity of one hundred 2-mL vials. The
column oven holds one 25-cm column,
and the maximum temperature is 60 °C.
The 1220 Infi nity LC Mobile Upgrade
Kit consists of functional parts that
enable the 1220 Infi nity LC system
to be mounted in a mobile laboratory
vehicle so it can be moved to different
locations to access remote measure-
ment sites. The main component is the
attenuation unit that acts as a shock
absorber to protect the instrument
during transit or from infl uences of
operators moving in the mobile labora-
tory. A solvent bottle unit keeps the
bottles fi xed to the instrument. Wire
mesh keeps the column safe in the
column oven, and the mobile solvent
compartment secures the solvent
bottles during operation.
This Technical Overview shows that a
wide range of parameters were tested
with detailed DAD performance evalu-
ation.
The pump and autosampler were tested
for:
• Precision of retention times
• Precision of areas
The DAD was tested for:
• ASTM drift and noise for the
10-mm path length cell
• Linearity over a wide range
• Limit of detection for anthracene for
the 10-mm path length cell
• Spectral performance
As the 1220 Infi nity Gradient LC
System with DAD is a mobile solution,
the robustness and ruggedness was
tested regarding pump, autosampler,
and detector performance (noise and
drift) before and after vibration tests on
a moving tray.
Experimental
InstrumentationThe Agilent 1220 Infi nity Gradient LC
System (G4294B) was equipped with
a dual-channel gradient pump with
integrated degassing unit, autosampler,
column compartment, and the diode
array detector. For transportation, the
system was mounted on a transporta-
tion plate, 1220 Infi nity Mobile Upgrade
Kit (G4292A).
Software• Agilent OpenLAB CDS ChemStation
Edition for LC & LC MS Systems,
Rev. C.01.04 [35]
• Agilent OpenLAB CDS 3D UV
Add-On Software.
5991-1544EN

39
Pump and Autosampler Performance – Precision of Retention Times and AreasRetention time precision was tested
with different gradient and isocratic
conditions using 4.6 and 3-mm id col-
umns. The relative standard deviation
(RSD) of retention times is typically
< 0.2% for gradient analysis. Figure 1
shows an example of an isocratic
application. The fl ow precision was
< 0.015% RSD for the retention times.
1
2
3
4
Time (min)0 1 2 3 4 5 6 7 8
mAU
0
100
200
300
400
500
600
700
800
900Peak RSD RT (%) RSD area (%)
1 0.013 0.52
2 0.008 0.52
3 0.005 0.48
4 0.009 0.51
Chromatographic conditions
Sample: Isocratic test sample (p/n 01080-68707)
Column: Agilent ZORBAX RRHT, Eclipse Plus C18, 4.6 × 150 mm, 1.8 μm (p/n 959994-902)
Mobile phase: A = Water
B = Acetonitrile
Isocratic: 30/70 A/B
Flow rate: 1.2 mL/min
Stop time: 9 minutes
Injection volume: 5 μL, draw speed 200 μL/min
Column temperature: 40 °C
Detection: 254 nm/10 nm, Ref.: 360 nm/80 nm
Flow cell: 10 mm
Peak width: > 0.025 minutes (0.5 second response time, 10 Hz)
Figure 1Precision for an isocratic run at 230 bar with a retention time (RT) precision < 0.015% RSD.
5991-1544EN

40
Figure 2 shows an example of a gradi-
ent run. The retention time precision
was < 0.063% RSD, except for the fi rst
peak.
1
2
34
5
67
89
Time (min)
0 2 4 6 8 10
mAU
0
50
100
150
200
250
Peak RSD RT (%) RSD area (%)
1 0.101 0.79
2 0.062 0.96
3 0.033 0.99
4 0.017 1.11
5 0.013 1.09
6 0.011 1.10
7 0.011 1.24
8 0.015 1.46
9 0.012 1.56
Chromatographic conditions
Sample: Agilent 1200 Series Rapid Resolution LC system checkout sample
(p/n 5188-6529)
Column: Agilent ZORBAX Solvent Saver HT, Eclipse Plus C18,
3.0 × 100 mm, 1.8 μm (p/n 959964-302)
Mobile phase: A = Water
B = Acetonitrile
Gradient: 20% B to 90% B in 10 minutes
Flow rate: 1.0 mL/min
Stop time: 12 minutes
Post-time: 5 minutes
Injection volume: 1 μL
Column temperature: 40 °C
Detection: 245 nm/10 nm, Ref.: 360 nm/80 nm
Flow cell: 10 mm
Peak width: > 0.025 minutes (0.5 second response time, 10 Hz)
Figure 2Precision for a gradient run at 434 bar with a RT precision < 0.063% RSD except for the fi rst peak.
5991-1544EN
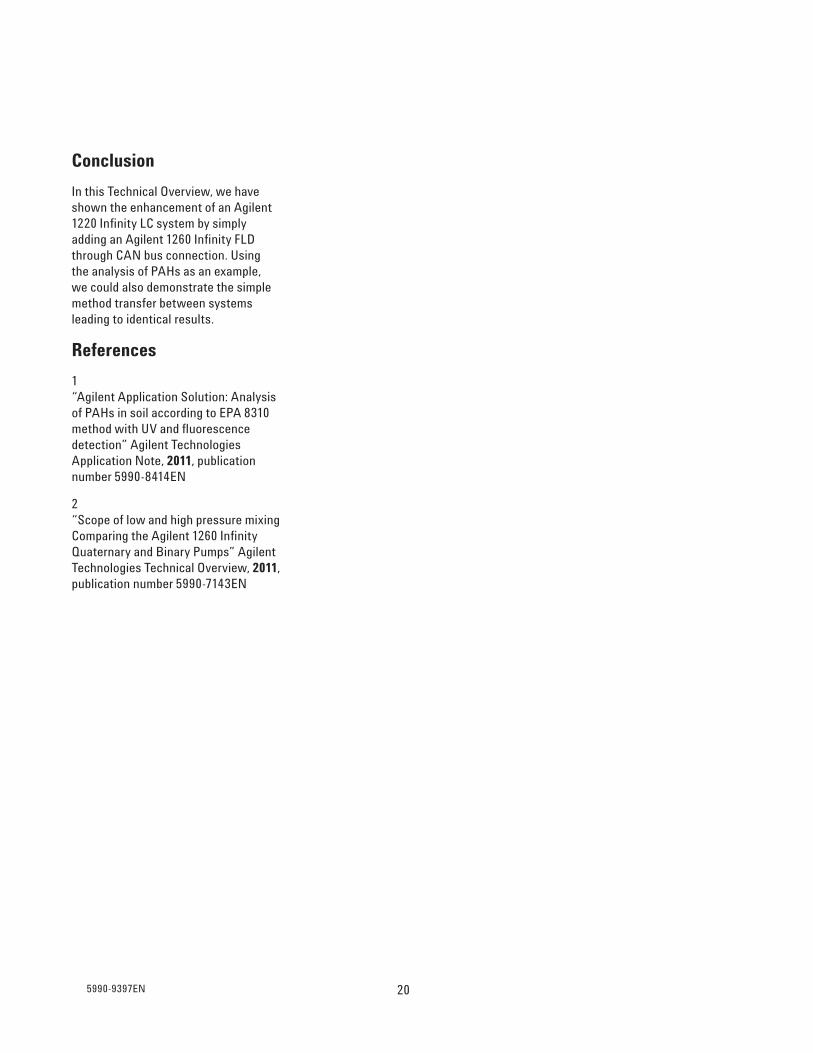
41
Figure 3 shows an example of a fast
gradient run at 590 bar. In this experi-
ment, an Agilent Poroshell 120 EC-C18
column was used. The retention time
precision was < 0.08% RSD.
1
2
34
5
67
89
Time (min)
0 0.2 0.4 0.6 0.8 1.0 1.2 1.4
mAU
0
25
50
75
100
125
150
175
Figure 3Precision for a gradient run at 590 bar with a RT precision < 0.080% RSD.
Peak RSD RT (%) RSD area (%)
1 0.045 0.86
2 0.078 0.43
3 0.056 0.51
4 0.028 0.45
5 0.028 0.74
6 0.023 0.48
7 0.037 0.66
8 0.016 0.73
9 0.048 0.77
Chromatographic conditions
Sample: Agilent 1200 Series Rapid Resolution LC system checkout sample
(p/n 5188-6529)
Column: Agilent Poroshell 120 EC-C18, 3.0 × 50 mm, 2.7 μm (p/n 699975-302)
Mobile phase: A = Water
B = Acetonitrile
Gradient: 30% B to 95% B in 1 minute
Flow rate: 3.4 mL/min
Stop time: 1.5 minutes
Post-time: 1.0 minutes
Injection volume: 1 μL
Column temperature: 40 °C
Detection: 245 nm/10 nm, Ref.: 360 nm/80 nm
Flow cell: 10 mm
Peak width: > 0.0063 minutes (0.13 second response time, 40 Hz)
5991-1544EN

42
Detector Performance
Noise and DriftEvaluation of baseline noise was
performed according to guidelines of
the American Society for Testing and
Materials (ASTM) in addition to drift
measurements of the 10-mm path
length fl ow cell. ASTM noise and drift
was evaluated using a restriction capil-
lary instead of a column and water as
the mobile phase. The DAD was set
to 1.25 Hz (4 second response). The
resulting ASTM noise was ± 6.65 μAU
and the drift was 0.0324 mAU.
Time (min)
5 10 15 20 25
mAU
-0.02
-0.01
0
0.01
0.02
ASTM noise ± 6.65 μAU
Drift = 0.0324 mAU/h
Chromatographic conditions
Column: Restriction capillary, backpressure 48 bar
Mobile phase: Water, isocratic
Flow rate: 1.0 mL/min
Stop time: 30 minutes
Column temperature: 36 °C
Detection: 254 nm/10 nm, Ref.: 360 nm/80 nm
Flow cell: 10 mm
Peak width: > 0.20 minutes (4.0 second response time, 1.25 Hz)
Figure 4Noise and drift of the DAD.
5991-1544EN

43
Linearity for Different Caffeine
ConcentrationsCertifi ed caffeine standards from 1.5 to
750 ng of injected amount were used
to test detection linearity. Excellent
linearity was obtained for this con-
centration range. The coeffi cient of
correlation was 0.99999. The response
factors were all within the ±5% error
range from 1.5 to 750 ng, see Figure 5.
Figure 5Linearity using certifi ed caffeine standards as sample compound.
1.6
1.8
2.0
2.2
2.4
2.6
2.8
3.0
3.2
3.4
1.5 3 6 12 60 150 300 375 750
Re
spo
nse
fa
cto
r (a
mo
un
t/a
rea
)
Amount (ng)
5% rangeAgilent 1220 Infinity LC DAD linearity
Correllation = 0.99999
×10-1
Chromatographic conditions
Sample: Certifi ed caffeine standards
Column: Agilent Poroshell 120 EC-C18, 3.0 × 50 mm, 2.7 μm (p/n 699975-302)
Mobile phase: A = Water
B = Acetonitrile
Isocratic: 90/10 A/B
Flow rate: 0.8 mL/min
Injection volume: 3 μL
Stop time: 1.5 minutes
Column temperature: 30 °C
Detection: 273 nm/10 nm, Ref.: 360 nm/80 nm
Flow cell: 10 mm
Peak width: > 0.013 minutes (0.25 second response time, 20 Hz)
5991-1544EN

44
Limit of Detection for AnthraceneThe limit of detection (LOD) for anthra-
cene was evaluated using the DAD at
2.5 Hz. The injected concentration was
as low as 5 pg/μL, see Figure 6. The
LOD for a signal-to-noise ratio of 3 was
3 pg.
Time (min)
1.0 1.2 1.4 1.6 1.8 2.0 2.2 2.4
mAU
0
0.05
0.10
0.15
0.20
0.25
0.30
Parameter
Agilent 1220 Infi nity DAD with 10-mm cell
Peak-to-peak noise [mAU] 0.05467
Peak height [mAU] 0.284822
Signal-to-noise 14
LOD [pg] 3
Figure 6Limit of detection for anthracene.
Chromatographic conditions
Sample: Anthracene, 5 pg in 1 μL
Column: Agilent ZORBAX RRHD SB C18, 2.1 × 50 mm, 1.8 μm (p/n 857700-902)
Mobile phase: A = Water
B = Acetonitrile
Isocratic: 35/65 A/B
Flow rate: 0.5 mL/min
Stop time: 3.0 minutes
Column temperature: 36 °C
Detection: 251 nm/4 nm, Ref.: 450 nm/80 nm,
8 mm slit width
Flow cell: 10 mm
Peak width: > 0.10 minutes (2.0 second response time, 2.5 Hz)
5991-1544EN

45
Spectral Conformation of Trace-level Compounds Using Ultrafast Chromatographic Conditions A library search was performed for
the measured trace-level spectrum.
Match factors were calculated and
tabulated in the library research table.
Highest spectral match was achieved
for nifedipin with a match factor of 996.
The spectral library analysis confi rmed
the compound identifi cation based on
chromatographic retention. This posi-
tive spectral confi rmation signifi cantly
enhances confi dence in qualitative
analytical results, see Figure 7.
Figure 7Analysis of nifedipin, nimodipin, and nisoldipin for spectral and purity evaluation.
Nifedipin
min0.3 0.4 0.5 0.6 0.7 0.8 0.9
min0.3 0.4 0.5 0.6 0.7 0.8 0.9
mAU
mAU
0
20
40
60
80
100
120
140200 ng/μL
2 ng/μL
Nimodipin
Nisoldipin
Match factor = 996
nm220 240 260 280 300 320 340 360 380
Norm
0
0.5
1.0
1.5
2.0
1.5
2.0
2.5
3.0
3.5
Nifedipin
Nimodipin
Nisoldipin
Chromatographic conditions
Sample: Nifedipin, nimodipin, and nisoldipin each 200 ng/μL and 2 ng/μL
Column: Agilent ZORBAX RRHT SB C18, 4.6 × 50 mm, 1.8 μm (p/n 827975-902)
Mobile phase: A = Water + 0.05% TFA
B = Acetonitrile + 0.045% TFA
Gradient: 65% B to 70% B in 0.85 minutes
Flow rate: 3.0 mL/min
Injection volume: 1 μL, needle cleaning with methanol
Column temperature: 36 °C
Detection: 254 nm/4 nm, Ref.: 450 nm/80 nm,
8 mm slit width, all spectra
Stop time: 1 minute
Post time: 1 minute
5991-1544EN

46
Peak Purity Analysis of Trace-level Compounds Using Ultrafast Chromatographic ConditionsThe 1220 Infi nity Gradient LC System
with DAD enables peak purity analysis
under ultrafast LC conditions, even for
trace-level compounds. The spectral
analysis confi rmed that the nifedipin
peak, as identifi ed by chromatographic
retention, was pure. This positive
purity confi rmation signifi cantly
increases confi dence in quantitative
chromatographic results, see Figure 8.
Figure 8Analysis of nifedipin, nimodipin, and nisoldipin for spectral and purity evaluation.
Purity factor: 998.468
min0.3 0.4 0.5 0.6 0.7 0.8 0.9
mAU
0
0.25
0.50
0.75
1.00
1.25
1.50
1.75
2.00
min0.24 0.26 0.28 0.30
Calculated
| |' ' ' '
++++++++++++++++
nm220 240 260 280 300 320 340 360 380
5991-1544EN

47
Performance After Vibration Tests
To prove the robustness and rugged-
ness of the 1220 Infi nity Gradient
LC System with a DAD as a mobile
solution, the system was subject to
vibration tests on a moving tray. After
the vibration tests, pump and autosam-
pler performance was repeated as well
as noise and drift measurement of the
DAD.
Table 1 shows the results for the RSD
values with respect to retention time
and area before and after the vibration
test. The values are all in a similar
range before and after the test, result-
ing in the conclusion that the vibration
did not affect pump and autosampler
performance referring to RSD of
retention times and areas.
Table 2 shows the results of the detec-
tor performance tests including the
noise and drift measurements before
and after the vibration tests. No major
differences were found between the
analysis before and after vibration.
Experiment
% RSD RT % RSD area
Test After test Before test After test
Long gradient run < 0.063 < 0.069 < 1.6 < 1.0
Short gradient run < 0.08 < 0.125 < 0.9 < 0.6
Isocratic run < 0.014 < 0.011 < 0.055 < 0.045
Table 1RSD of RT and area before and after vibration tests.
Table 2Detector performance.
Experiment Result
Noise < 10 μAU (before and after vibration test)
Drift < 0.04 (before and after vibration test)
Detector linearity 0.99999
LOD anthracene 3 pg
Conclusions
The Agilent 1220 Infi nity Gradient LC
system is now equipped with a DAD for
multiwavelength detection and spectra
analysis. This Technical Overview
shows that the performance of the
1220 Infi nity LC system with a DAD
meets the requirements of modern
analytical liquid chromatography. The
1220 Infi nity Gradient LC system with
a DAD is a mobile solution for onsite
measurement, which is proved by the
reproducibility of very good RSD values
for retention time and area before and
after vibration tests. In addition, noise
and drift measurements gave very
similar results before and after vibra-
tion, showing that the 1220 Infi nity
Gradient LC system is a robust and
rugged system for onsite measure-
ment. The detailed performance analy-
sis of the DAD revealed high linearity
and sensitivity with optional spectral
confi rmation analysis.
5991-1544EN

48

49
Environmental Applications
Today, environmental analysis must be done more
reliably, more efficiently, and with even higher quality
results than ever before. This application area covers
the measurement of organic and inorganic chemicals
in water, soil and textiles. The 1220 Infinity LC exhibits high
robustness and flexibility for these applications.

50
Screening for EU banned dyes in textilesusing the Agilent 1120 Compact LC withan Agilent 6140 Single QuadrupoleLC/MS system and the Analytical StudioBrowser software
Increased productivity by quickly identifyingsamples that fail regulatory requirements
AbstractThe European commission has restricted the commercialization of textiles contain-
ing certain types of azo dyes. The azo bond (-N=N-) in the dyes can undergo reduc-
tive cleavage to produce by-products such as aromatic amines, some of which are
potential carcinogens. Twenty-two aromatic amines are classified by European
directives as carcinogens whose concentration in textiles should not exceed 30 ppm
for each amine. In this work, a literature method has been modified to include MS-
compatible buffers for analysis of EU banned dyes in textiles. Analysis was per-
formed using an Agilent 1120 Compact LC coupled to an Agilent 6140 Single
Quadrupole LC/MS system and Agilent Analytical Studio Browser (ASB) software.
ASB allows quick visual identification of samples that exceed regulatory require-
ments. Such a setup is beneficial for textile testing laboratories where large num-
bers of textile samples are tested for qualification.
Author
Syed Salman Lateef
Agilent Technologies
Bangalore, India
Application Note
Environmental
51 5990-5731EN

52
IntroductionThe EU has listed 22 aromatic amines
as potential carcinogens and maintains
an acceptable upper limit of 30 ppm for
each in textiles. This testing method
involves the reduction of dyes in tex-
tiles with reducing agents, followed by
the extraction of by-products. The by-
products are matched with the list of 22
restricted amines and their concentra-
tion determined. In addition to official
methods, there are other methods
reported in literature that maximize the
recovery. A modified literature method1
that uses MS-compatible buffers during
reduction and extraction is shown here.
An Agilent 1120 Compact LC, with the
Agilent 6140 Single Quadrupole
Mass Spectrometer is operated by
ChemStation B.04.02.
Analytical Studio Browser (ASB) is a
visual tool that allows rapid identifica-
tion of samples exceeding threshold
levels set by the analyst. It is an add-on
software to ChemStation. The main
features of ASB provide the user with
the following capabilities:
• Browse very large amounts of LC/MS
data very quickly.
• Assess the quality of data taken from
a variety of detectors.
• Edit data and override data process-
ing decisions made by automated
systems.
• Report the data in a format that fits
the particular needs of their work
environment.
The methodology can be extended to
analysis of other consumer samples
such as toys or food products where a
simple visual assessment of pass or fail
is required.
ExperimentalThe standards of 22 restricted aromatic
amines were purchased from Sigma
Aldrich. Four colored polyester textile
samples were purchased from local
stores in India for analysis.
Twenty-two aromatic aminesstandard stock solutionThe 22 aromatic amine standards were
dissolved in acetonitrile (90:10): 25 mM
ammonium acetate solution to a con-
centration ~3000 ppm (100% methanol
also can be used). The solution was fur-
ther diluted to 100-ppm solutions. The
100-ppm solutions were further diluted
in 10% mobile phase B and 90% mobile
phase A to 1-ppm solutions for deter-
mining the fragmentor voltage.
Textile sample A 1.0-mL amount of freshly prepared,
1M aqueous ammonium hydroxide con-
taining 50 mg of sodium dithionite was
added to 0.1 g of shredded textile sam-
ples and heated at 80 °C for 90 min.
Next, 1 mL of 100% mobile phase B
was added to the textile sample and
microwaved (1350 W) for 10 sec, then
pipetted out. The procedure was
repeated twice, using 10% mobile
phase B and 90% mobile phase A as
the extracting solvent. The extracted
solutions were combined and 100 μL of
formic acid were added to neutralize
the pH. The solution was diluted to the
5-mL mark with water. An EU upper
limit content of 30 ppm in 0.1 g of tex-
tile corresponds to 3 μg in 5 mL. The
solution was syringe-filtered with a
0.45 μm filter before analysis.
Aqueous linearity samplesTwenty-two restricted amines were pre-
pared to concentrations: 9 μg/5 mL,
6 μg/5 mL, 3 μg/5 mL, 1 μg/5 mL,
0.6 μg/5 mL in 5% mobile phase B.
Experimental Parameters Details
Column Agilent ZORBAX Eclipse Plus C18, 150 mm × 3.0 mm,
3.5 μm p/n 959963-302; operated at 30 °C
Mobile phase Buffer A: Water 0.1% formic acid
Buffer B: Methanol with 0.1% formic acid
Gradient run Run time (min): 42 min
8.8% B – 0 min
10% B – 10 min
16% B – 10.1 min
22% B – 20 min
53% B – 20.1 min
62% B – 30 min
100% B – 30.5 min
100% B – 35 min
8.8% B – 35.1 min
8.8% B – 42 min
Flow 0.7 mL/min
Injection volume 5 μL
Variable wavelength detection (VWD) 254 nm
6140 MSD parameters Drying gas 13.0 L/min
ESI Source: Positive mode Nebulizer pressure 40 psig
SIM mode, peak width 0.03 min Dry gas temperature 350 °C
Capillary voltage 4000 V
ASB parameters (B.02.00) TIC – integration set to off at all time points
BPI – 40%
5990-5731EN

53
Positive controlAcid red 4 (control 1) and direct blue 15
dyes (control 2) were dissolved in
methanol to dye polyester textiles. A
0.1-g sample of dyed textile was used
as a positive control.
Results and discussionMethod development and analy-sis of a standards mixture A mixture of 22 aromatic amines (each
1 ppm) was analyzed using VWD and
MSD in series. A linear water-methanol
gradient of 10% to 90% B with a
150 mm Agilent ZORBAX Eclipse Plus
C18 column resolved most of the peaks
well, compared to a phenyl column. In
addition, methanol proved to be better
than acetonitrile or a mixture of
methanol and acetonitrile on a ZORBAX
Eclipse Plus C18 column. A flatter gra-
dient in combination with 30 °C column
oven temperature was used to resolve
overlapping peaks (9 and 10, 14 and 15).
The specificity of the method was
increased by operating the MSD in
time-programmed SIM mode. Here, four
time groups were added in data acquisi-
tion: 0 – 5 min, 5 – 10 min, 10 – 20 min
and 20 min – 42 min to contain specific
molecular ions in that time segment,
thereby increasing the dwell time
(Table 1). Figure 1 shows the MS total
ion chromatogram and UV chro-
matogram for the standard mix (3 μg/
5 mL) of 22 restricted amines. UV based
detection of 22 restricted amines
shows a varying response to 254 nm.
The advantage of MS-based detection
is increased sensitivity and selectivity
compared to UV-based detection.
Figure 1Total ion chromatogram (TIC) of the mixture of 22 aromatic amines operated in time-programmed SIMmode. UV detection at 254 shows varying responses to different aromatic amines. UV chromatogram(A) shows baseline shifts due to a rapidly changing gradient; UV chromatogram (B) shows the UVbaseline is relatively straight when formic acid is not added in mobile phase B.
0
100K
200K
300K
400K
500K
1.3
25
1.3
88
1.5
43
1.6
58
2.3
94
2.8
01
3.2
48
5.6
22
6.8
17
7.1
52
8.1
02
12
.32
0
14
.57
11
5.1
85
16
.53
81
7.2
89
22
.80
52
3.1
38
28
.38
42
9.1
06
29
.48
9
32
.94
1
min0 5 10 15 20 25 30
min0 5 10 15 20 25 30
min0 5 10 15 20 25 30mAU
0
2
4
6
8
10
12
14
7
171410
63
11 15
5
2118
1
8 191612 20 2213
4
171063 15 2118 19 20 22139
9
2
MS: TIC
UV: 254 nm (A)
mAU
0
1
2
3
4
5
6 UV: 254 nm (B)
5990-5731EN
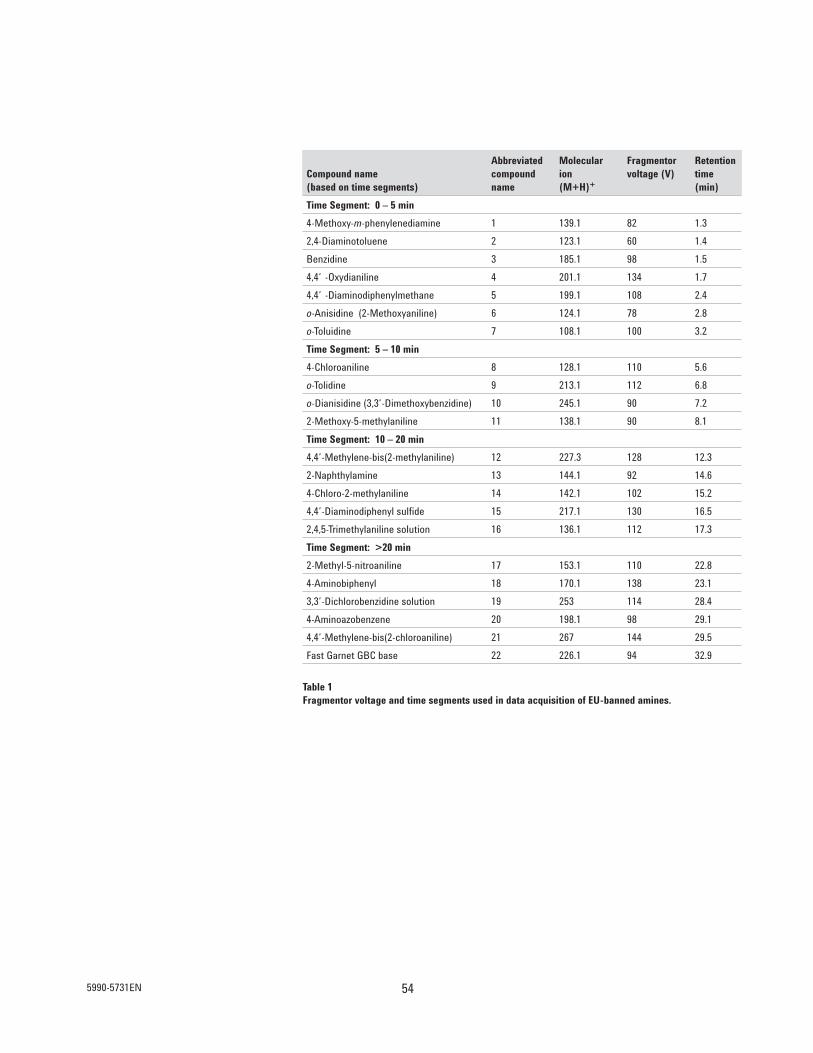
54
Abbreviated Molecular Fragmentor Retention Compound name compound ion voltage (V) time(based on time segments) name (M+H)+ (min)
Time Segment: 0 – 5 min
4-Methoxy-m-phenylenediamine 1 139.1 82 1.3
2,4-Diaminotoluene 2 123.1 60 1.4
Benzidine 3 185.1 98 1.5
4,4’ -Oxydianiline 4 201.1 134 1.7
4,4’ -Diaminodiphenylmethane 5 199.1 108 2.4
o-Anisidine (2-Methoxyaniline) 6 124.1 78 2.8
o-Toluidine 7 108.1 100 3.2
Time Segment: 5 – 10 min
4-Chloroaniline 8 128.1 110 5.6
o-Tolidine 9 213.1 112 6.8
o-Dianisidine (3,3’-Dimethoxybenzidine) 10 245.1 90 7.2
2-Methoxy-5-methylaniline 11 138.1 90 8.1
Time Segment: 10 – 20 min
4,4’-Methylene-bis(2-methylaniline) 12 227.3 128 12.3
2-Naphthylamine 13 144.1 92 14.6
4-Chloro-2-methylaniline 14 142.1 102 15.2
4,4’-Diaminodiphenyl sulfide 15 217.1 130 16.5
2,4,5-Trimethylaniline solution 16 136.1 112 17.3
Time Segment: >20 min
2-Methyl-5-nitroaniline 17 153.1 110 22.8
4-Aminobiphenyl 18 170.1 138 23.1
3,3’-Dichlorobenzidine solution 19 253 114 28.4
4-Aminoazobenzene 20 198.1 98 29.1
4,4’-Methylene-bis(2-chloroaniline) 21 267 144 29.5
Fast Garnet GBC base 22 226.1 94 32.9
Table 1Fragmentor voltage and time segments used in data acquisition of EU-banned amines.
5990-5731EN
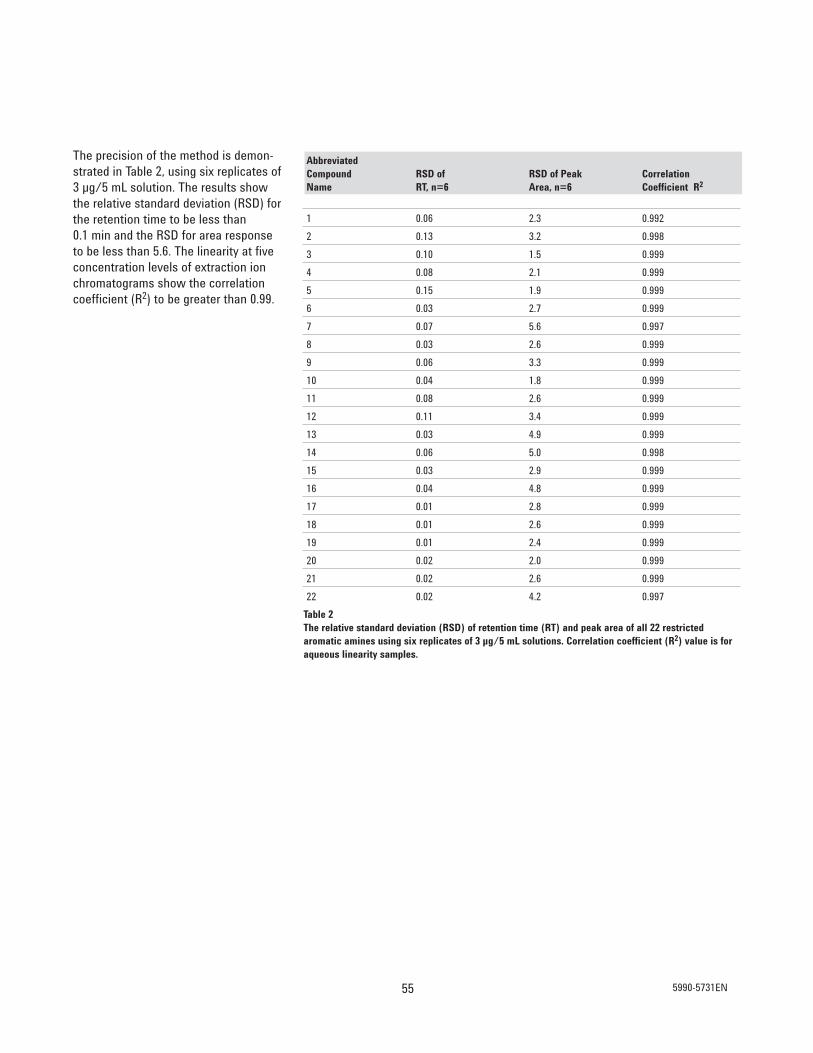
55
The precision of the method is demon-
strated in Table 2, using six replicates of
3 μg/5 mL solution. The results show
the relative standard deviation (RSD) for
the retention time to be less than
0.1 min and the RSD for area response
to be less than 5.6. The linearity at five
concentration levels of extraction ion
chromatograms show the correlation
coefficient (R2) to be greater than 0.99.
Table 2The relative standard deviation (RSD) of retention time (RT) and peak area of all 22 restricted aromatic amines using six replicates of 3 μg/5 mL solutions. Correlation coefficient (R2) value is foraqueous linearity samples.
AbbreviatedCompound RSD of RSD of Peak Correlation Name RT, n=6 Area, n=6 Coefficient R2
1 0.06 2.3 0.992
2 0.13 3.2 0.998
3 0.10 1.5 0.999
4 0.08 2.1 0.999
5 0.15 1.9 0.999
6 0.03 2.7 0.999
7 0.07 5.6 0.997
8 0.03 2.6 0.999
9 0.06 3.3 0.999
10 0.04 1.8 0.999
11 0.08 2.6 0.999
12 0.11 3.4 0.999
13 0.03 4.9 0.999
14 0.06 5.0 0.998
15 0.03 2.9 0.999
16 0.04 4.8 0.999
17 0.01 2.8 0.999
18 0.01 2.6 0.999
19 0.01 2.4 0.999
20 0.02 2.0 0.999
21 0.02 2.6 0.999
22 0.02 4.2 0.997
5990-5731EN
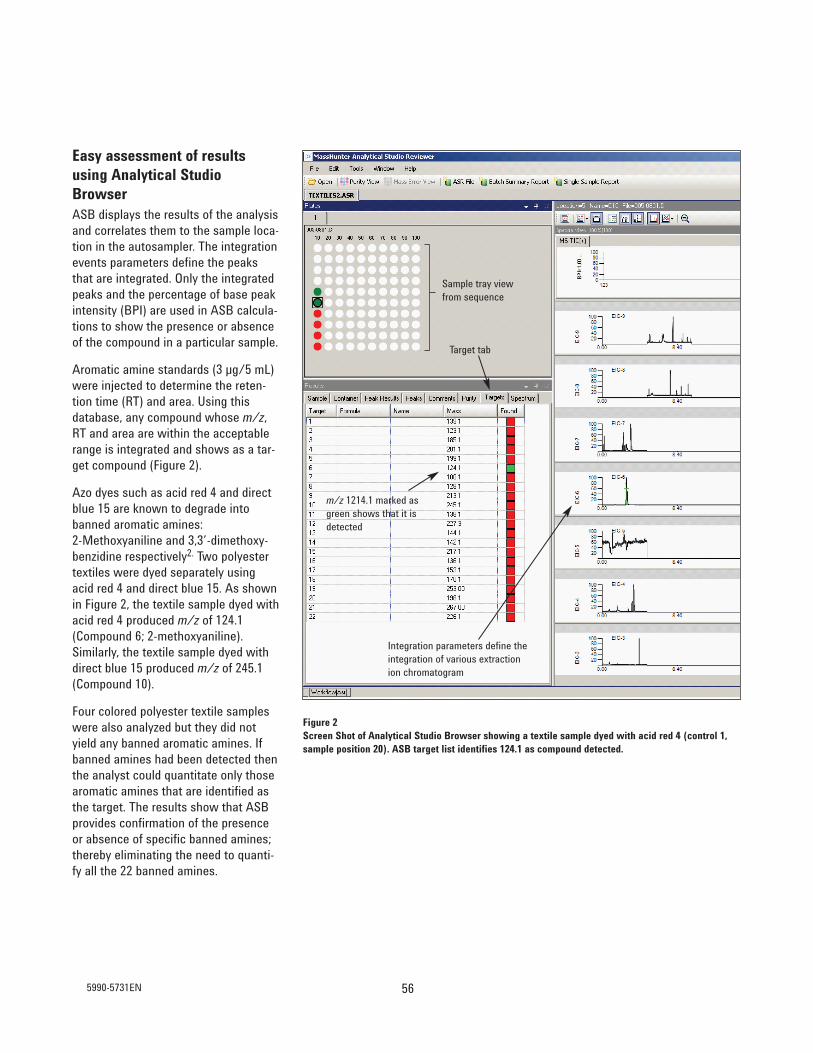
56
Figure 2Screen Shot of Analytical Studio Browser showing a textile sample dyed with acid red 4 (control 1,sample position 20). ASB target list identifies 124.1 as compound detected.
Easy assessment of resultsusing Analytical StudioBrowser ASB displays the results of the analysis
and correlates them to the sample loca-
tion in the autosampler. The integration
events parameters define the peaks
that are integrated. Only the integrated
peaks and the percentage of base peak
intensity (BPI) are used in ASB calcula-
tions to show the presence or absence
of the compound in a particular sample.
Aromatic amine standards (3 μg/5 mL)
were injected to determine the reten-
tion time (RT) and area. Using this
database, any compound whose m/z,RT and area are within the acceptable
range is integrated and shows as a tar-
get compound (Figure 2).
Azo dyes such as acid red 4 and direct
blue 15 are known to degrade into
banned aromatic amines:
2-Methoxyaniline and 3,3’-dimethoxy-
benzidine respectively2. Two polyester
textiles were dyed separately using
acid red 4 and direct blue 15. As shown
in Figure 2, the textile sample dyed with
acid red 4 produced m/z of 124.1
(Compound 6; 2-methoxyaniline).
Similarly, the textile sample dyed with
direct blue 15 produced m/z of 245.1
(Compound 10).
Four colored polyester textile samples
were also analyzed but they did not
yield any banned aromatic amines. If
banned amines had been detected then
the analyst could quantitate only those
aromatic amines that are identified as
the target. The results show that ASB
provides confirmation of the presence
or absence of specific banned amines;
thereby eliminating the need to quanti-
fy all the 22 banned amines.
Sample tray view
from sequence
Target tab
m/z 1214.1 marked as
green shows that it is
detected
Integration parameters define the
integration of various extraction
ion chromatogram
5990-5731EN

57
ConclusionThe combination of the Agilent 6140
Single Quadrupole LC/MS system with
the Analytical Studio Browser software
provides a versatile tool for quick
screening of textiles for compliance
with regulatory standards. Quick identi-
fication of failed samples leads to
reduced analysis time. Analytical Studio
Browser provides visualization of sam-
ples that fail requirements.
References1. L. H. Ahlstrom, J. Raab,
L. Mathiasson, “Application of stan-
dard addition methodology for the
determination of banned dyes in dif-
ferent leather types,” Analytica
Chimica Acta, 552: 76-80, 2005.
2. L. H. Ahlstrom, E. Bjorklund,
L. Mathiasson, “Optimization of an
analytical procedure for the determi-
nation of banned azo dyes in leather,”
Anal Bioanal Chem, 382: 1320-1327,
2005.
5990-5731EN

58

Abstract
The Agilent 1120 Compact LC is the system of choice for conventional, analytical
scale liquid chromatography. It is an intergrated LC designed for ease of use,
performance and reliability. It is ideally suited for the analysis of herbicides on
account of its capability to achieve highly precise retention times and peak
areas, and low detection limits for the analyzed compounds. In this Application
Note, data is presented that demonstrates:
• Excellent retention time precision of less than 0.1 % RSD
• Excellent peak area precision of less than 0.5 % RSD
• Limit of detection (LOD) less than 150 pg for all herbicides analyzed
Angelika Gratzfeld-HuesgenApplication Note
Analysis of herbicides in drinking waterusing the Agilent 1120 Compact LC
5989-7455EN59

Introduction
The analysis of herbicides in various
environmental and biological matrices
is highly important in the protection of
nature and the environment. In most
countries, regulations limit the con-
centration of herbicides that are
allowed in drinking water and other
foodstuffs. Several analytical tech-
niques are used in the control these
limits. For compounds that are ther-
mally unstable, high performance liq-
uid chromatography (HPLC) is the rec-
ommended analysis technique.
In this study, nine herbicides were
analyzed and the precision of retention
times and peak areas was measured.
Further, the limit of detection (LOD) of
the compounds was determined.
Drinking water spiked with trace
amounts of the nine herbicides was
used as sample.
Experimental
Equipment• Agilent 1120 Compact LC comprising
gradient pump with integrated
degasser, autosampler with vial tray,
column oven and variable wave-
length detector, see figure 1
• Agilent HC-C18(2), high carbon load,
150 x 4.6 mm, 5 μm particle size col-
umn
• Agilent EZChrom Elite Compact soft-
ware
• Nine herbicides were selected for
the experiments and purchased from
Sigma/Aldrich, see table 1.
Chromatographic conditions• Mobile phase: A: Water, B: ACN
• Gradient: 10 to 90 %B in 15 min
• Flow rate: 1.5 mL/min
• Injection volume:
5 μL for 1:100 dilution
20 μL for 1:1000 dilution
20 μL for 1:10,000 dilution
• Column temperature: 40 °C
• Detection wavelength: 225 nm
Peakwidth: > 0.0025 min
Response time: 0.06 s
Results and discussion
Analyzing herbicides with UV detec-
tion means that precision of retention
times is of utmost importance. In addi-
tion, precision of peak areas must be
less than
1 % in the low ng range.
According to the United States
Environmental Protection Agency the
tolerance level for diuron in different
food commodities is about 0.1–2.0
ppm. This corresponds to about 1–20
ng per 10 μL. For simazine, the toler-
ance level in different commodities is
0.02–0.25 ppm, corresponding to
200–2500 pg per 10 μL.
As a consequence the demands on
this application can be summarized as
follows.
• Relative standard deviation of reten-
tion times less than 0.1 %
• Relative standard deviation of peak
areas (in low ng range)
less than 1 %
• Limit of detection (LOD) less than
150 pg for a 20 μL injection
The 1:100 dilution of the stock solution
was used to evaluate the chromato-
graphic conditions and the resulting
chromatogram is shown in figure 2.
Figure 1Agilent 1120 Compact LC
Compound Stock Solution 1:100 dilution 1:1000 dilution 1:10,000 dilutionmg/10 mL 5 μL inj. vol. 20 μL inj. vol. 20 μL inj. vol.
(ng per inj.) (ng per inj.) (ng per inj.)
Metamitron 3.3 16.5 6.6 0.66
Chloridazone 2.5 12.5 5 0.5
Simazine 2.5 12.5 5 0.5
Cyanazine 3.7 18.5 7.4 0.74
Prometryn 4.8 24 9.6 0.96
Chlortoluron 9.6 48 19.2 1.920
Diuron 2 10 4 0.4
Propazine 4.6 23 9.2 0.92
Terbuthylazine 5.8 29 11.6 1.160
Table 1Analyzed Herbicides and used concentrations.
605989-7455EN

To evaluate the relative standard devia-
tion six runs were performed using the
1:1000 dilution of the stock solution
and the results are shown in table 2.
The limits of detection were deter-
mined using 20 μL injections of the
1:10,000 dilution of the stock solution.
The results are shown in figure 3 and
table 3.
Figure 2Chromatogram from analysis of the 1:100 dilution for evaluation of chromatographic conditions.
Time [min]
0 2 4 6 8 10 12 14
Ab
sorb
an
ce
[m
AU
]
0
10
20
30
40
1
2
3
5
4
9
76
8
Peak Compound % RSD % RSDRet. Times Areas
1 Metamitron 0.07 0.19
2 Chloridazone 0.07 0.17
3 Cyanazine 0.05 0.10
4 Simazine 0.05 0.12
5 Prometryn 0.06 0.39
6 Diuron 0.02 0.34
7 Propazine 0.02 0.16
8 Terbuthylazine 0.02 0.33
9 Chlortoluron 0-04 0.26
Table 2Relative standard deviations of retention timesand peak areas in the low ng range.
Figure 3Chromatogram from analysis of the 1.10,000 dilution with an injection volume of 20 μL.
Time [min]
4 5 6 7 8 9 10 11
Ab
sorb
an
ce
[m
AU
]
0.5
1.0
1.5
2.0
2.5
Peak Compound LOD with S/N = 3P-to-P noise 0.02 mAU
(pg)
1 Metamitron 132
2 Chloridazone 50
3 Cyanazine 49
4 Simazine 50
5 Prometryn 144
6 Diuron 34
7 Propazine 34
8 Terbuthylazine 37
9 Chlortoluron 128
Table 3Limits of detection for the analyzed herbices.
5989-7455EN61

Analysis of herbicides in drinkingwater
600 μL of drinking water was spiked
with 100 μL of the 1:1000 dilution and
300 μL of acetonitrile. Acetonitrile was
added to avoid adhesion of the trace
amounts of the herbicides on the glass
surface of the vial. The resulting con-
centration was equivalent to the
1:10,000 dilution of the stock solution.
Figure 4 shows the chromatograms of
the analyses of the blank drinking
water sample (lower trace), spiked
drinking water sample (center trace)
and the 1:10,000 dilution of the stock
solution. The chromatographic condi-
tions were the same as for the analy-
sis shown in figure 1.
The chromatograms showed that
these herbicides can be analyzed in
the low pg range using the described
chromatographic conditions.
Conclusion
The Agilent 1120 Compact LC was
used for the analysis of herbicides in
drinking water. This instrument was
able to analyze these compounds at
levels as low as 0.02 ppm, for example,
for simazine. The identification of
these compounds using retention
times was based on the excellent
retention time precision of less than
0.08 %. The quantification in the low
nanogram range yielded relative stan-
dard deviations less than 0.4 % for the
peak areas and allowed accurate
determination of the compounds.
Figure 4Chromatogram of analysis of spiked drinking water:Upper trace – 1:10,000 diluted stock solutionCenter trace – spiked drinking water sampleLower trace – blank drinking water sample
Time [min]0 2 4 6 8 10 12 14
Ab
sorb
an
ce
[m
AU
]
-2
-1
0
1
2
3
4
625989-7455EN

63
Analysis of DNPH-derivatized Aldehydes and Ketones using the Agilent 1220 Infi nity LC System with Diode Array Detector
Application Note
Abstract
Aldehydes and ketones are important compounds in the chemical industry.
However, these compounds can be hazardous when released into the environment.
This Application Note describes the successful analysis of 13 DNPH-derivatized
aldehydes and ketones using the Agilent 1220 Infi nity Gradient LC system with
built-in diode-array detector (DAD). In combination with the Agilent 1220 Infi nity
Mobile Upgrade Kit, the system can be installed in a vehicle and measurements can
be performed at different test sites. Using both 1.8-μm and 5-μm columns achieved
excellent precision and linearity as well as low limits of detection (LOD) and limits
of quantifi cation (LOQ) for all carbonyl-containing compounds.
Author
Sonja Schneider
Agilent Technologies, Inc.
Waldbronn, Germany
1
2 3 45 6
78
9 10 1112 13
[min]5 10 15 20 25 30
[mAU]
50
75
100
125
150
175
200
225
250
5991-1545EN

64
Introduction
The environmental analysis of alde-
hydes and ketones is important due to
the toxic and potentially carcinogenic
nature of some of these carbonyl
compounds. As combustion products
from, for example, automotive exhaust
or tobacco smoke, aldehydes and
ketones are signifi cant air pollutants
and can also be detected in water and
soil. Atmospheric carbonyl compounds
are also created by thermal degradation
of polymers in the plastic processing
industry.
Of all the atmospheric carbonyl
compounds, acetaldehyde and
formaldehyde are the most abundant.
In addition, formaldehyde has the
largest technical relevance because
it an essential precursor for polymers
and many other chemical compounds.
It is also frequently used as disinfect-
ant and preservative (for example,
formalin). Also, acetaldehyde is one of
the most important aldehydes because
it is highly prevalent in nature and a
signifi cant compound in the chemical
industry. Many other aldehydes and
ketones are also found in the chemical
industry, for example, in rubber, syn-
thetic resin, and plastic production.
The determination of aldehydes and
ketones in several environmental matri-
ces is mostly conducted with high pres-
sure liquid chromatography (HPLC) with
UV detection based on the derivatiza-
tion of the carbonyl compounds with
2,4-dinitrophenylhydrazine (DNPH).
This Application Note presents
the analysis of DNPH-derivatized
aldehydes and ketones using the
1220 Infi nity Gradient LC system with
built-in DAD. As an integrated, binary-
gradient liquid chromatography (LC)
system with a pressure range of up
to 600 bar, 5-μm and 1.8-μm columns
could be deployed due to the ultra-
HPLC (UHPLC) capabilities of the
system. Using the 1220 Infi nity LC
Mobile Upgrade Kit, the following appli-
cation can be carried out in a mobile
laboratory.
Experimental
InstrumentationThe Agilent 1220 Infi nity Gradient LC
System (G4294B) was equipped with
a dual-channel gradient pump with
integrated degassing unit, autosam-
pler, column compartment and diode
array detector. For transportation, the
system was mounted on a transporta-
tion plate, Agilent 1220 Infi nity Mobile
Upgrade Kit (G4292A).
Software• Agilent OpenLAB CDS ChemStation
Edition for LC & LC MS Systems,
Rev. C.01.04 [35]
• Agilent OpenLAB CDS 3D UV
Add-On Software.
SampleThe mixture of aldehyde-2,4-dinitro-
phenylhydrazones and ketone-2,4-di-
nitrophenylhydrazones was certifi ed
reference material from Sigma-Aldrich
(Catalog No. 47651-U) diluted in ace-
tonitrile. In the mixture, each analyte
had a concentration of 30 μg/mL of
carbon. For analysis, the mixture was
diluted in dimethyl sulfoxide (DMSO)
in a ratio of 1:10. Table 1 shows the
elution order for all analytes depicted
in all fi gures. Acetone and DMSO were
LC grade. Fresh ultrapure water was
obtained from a Milli-Q Integral system
equipped with a 0.22-μm membrane
point-of-use cartridge (Millipak).
Peak Substance
1 Formaldehyde-2,4-dinitrophenylhydrazone
2 Acetaldehyde-2,4-dinitrophenylhydrazone
3 Acrolein-2,4-dinitrophenylhydrazone
4 Acetone-2,4-dinitrophenylhydrazone
5 Propionaldehyde-2,4-dinitrophenylhydrazone
6 Crotonaldehyde-2,4-dinitrophenylhydrazone
7 Methacrolein-2,4-dinitrophenylhydrazone
8 2-Butanone-2,4-dinitrophenylhydrazone
9 Butyraldehyde-2,4-dinitrophenylhydrazone
10 Benzaldehyde-2,4-dinitrophenylhydrazone
11 Valeraldehyde-2,4-dinitrophenylhydrazone
12 m-Tolualdehyde-2,4-dinitrophenylhydrazone
13 Hexaldehyde-2,4-dinitrophenylhydrazone
Table 1Elution order of aldehyde and ketone mixture.
5991-1545EN

65
Results and Discussion
The DNPH-derivatized aldehydes and
ketones were separated using an
Agilent ZORBAX Eclipse Plus C18, 4.6 ×
150 mm, 5 μm column and the relative
Figure 1Six consecutive runs of DNPH-derivatized aldehydes and ketones separated on an Agilent ZORBAX Eclipse Plus C18, 4.6 × 150 mm, 5 μm column at 90 bar.
standard deviation (RSD) of retention
times and areas was determined for
six consecutive runs, see Figure 1.
All RSDs of the retention times were
below 0.01 %. The area precision was
found to be below 0.4 %. In addition
to the 13 carbonyl compounds, some
impurities were detected.
Parameter Conditions (4.6 mm id columns) Conditions (2.1 mm id columns)
Columns: Agilent ZORBAX Eclipse Plus C18,
4.6 × 150 mm, 5 μm (p/n 959993-902)
Agilent ZORBAX RRHT Eclipse Plus C18,
4.6 × 150 mm, 1.8 μm (p/n 959994-902)
Agilent ZORBAX RRHD Eclipse Plus C18,
2.1 × 150 mm, 1.8 μm (p/n 959759-902)
Mobile Phase: A: Water
B: Acetone
A: Water
B: Acetone
Flow rate: 1.2 mL/min 0.25 mL/min
Gradient: 0 minutes: 45 %B
12 minutes: 53 %B
28 minutes: 67 %B
32 minutes: 67 %B
33 minutes: 95 %B
0 minutes: 45 %B
12 minutes: 53 %B
28 minutes: 67 %B
32 minutes: 67 %B
33 minutes: 95 %B
Stop time: 34 minutes 34 minutes
Post time: 20 minutes 20 minutes
Injection volume: 10 μL 2.1 μL
Temperature: 45 °C 45 °C
Detection: 360 nm/10 nm Ref.: off
Peak width > 0.025 minutes (0.5 second response time, 10 Hz)
360 nm/10 nm Ref.: off
Peak width > 0.025 minutes (0.5 second response time, 10 Hz)
Chromatographic conditions
1
2
34
56
7
8
9
[min]5 10 15 20 25 30
[mAU]
0
20
40
60
80
100
120
10 1112 13
Impurities
Peak RSD RT (%) RSD Area (%)
1 0.060 0.230
2 0.051 0.198
3 0.051 0.239
4 0.048 0.219
5 0.050 0.212
6 0.044 0.221
7 0.049 0.168
8 0.050 0.172
9 0.049 0.232
10 0.045 0.268
11 0.044 0.326
12 0.040 0.288
13 0.034 0.239
5991-1545EN

66
The same sample was also separated
using a ZORBAX RRHT Eclipse Plus
C18, 4.6 × 150 mm, 1.8 μm column at a
higher pressure of 420 bar. The RSD of
retention times and areas was deter-
mined for six consecutive runs, see
Figure 2.
The precision of retention times and
areas were found similar to those
achieved with the 5-μm column. All
RSDs of the retention times were
below 0.016 %. The area precisions
were found to be below 0.4 %. Using
sub-two μm columns, an improvement
in resolution was visible by a factor of
approximately two, especially visible
for peak 11 and 12, see Figure 2 and
Table 2.
Table 2Improvement in resolution from 5-μm to 1.8-μm columns.
[mAU]
Impurities
1
2
34
56
7
8
910 11
12 13
[min]5 10 15 20 25 30
0
20
40
60
80
100
120
140
160
180Peak RSD RT (%) RSD area (%)
1 0.115 0.526
2 0.150 0.163
3 0.078 0.318
4 0.082 0.340
5 0.080 0.341
6 0.054 0.289
7 0.060 0.350
8 0.063 0.313
9 0.077 0.283
10 0.084 0.187
11 0.065 0.248
12 0.071 0.394
13 0.058 0.233
Figure 2Six consecutive runs of DNPH-derivatized aldehydes and ketones separated on an Agilent ZORBAX Eclipse Plus C18, 4.6 × 150 mm, 1.8 μm column at 420 bar.
PeakResolution (5-μm columns)
Resolution (1.8-μm columns)
1 – -
2 1.45 2.35
3 8.41 14.50
4 2.88 4.78
5 2.01 3.32
6 0.89 1.27
7 2.18 3.75
8 1.58 2.61
9 2.29 3.89
10 3.33 6.41
11 2.29 3.68
12 1.09 2.55
13 2.02 3.14
5991-1545EN

67
Using the ZORBAX RRHT Eclipse Plus
C18 4.6 × 150 mm, 1.8 μm column,
the linearity, LOD and LOQ were
determined for a dilution series of
the DNPH-derivatized aldehydes and
ketones from 3 μg/mL down to 4 ng/mL.
An excellent correlation was found for
all carbonyl-containing compounds. All
correlation curves showed very high
linearity with correlation factors of 1 or
0.99999, see Table 3.
Table 3Correlation factors of all carbonyl components.
Compound Correlation coeffi cient
Formaldehyde-2,4-dinitrophenylhydrazone 1
Acetaldehyde-2,4-dinitrophenylhydrazone 0.99999
Acrolein-2,4-dinitrophenylhydrazone 1
Acetone-2,4-dinitrophenylhydrazone 1
Propionaldehyde-2,4-dinitrophenylhydrazone 1
Crotonaldehyde-2,4-dinitrophenylhydrazone 1
Methacrolein-2,4-dinitrophenylhydrazone 1
2-Butanone-2,4-dinitrophenylhydrazone 1
Butyraldehyde-2,4-dinitrophenylhydrazone 1
Benzaldehyde-2,4-dinitrophenylhydrazone 1
Valeraldehyde-2,4-dinitrophenylhydrazone 1
m-Tolualdehyde-2,4-dinitrophenylhydrazone 0.99999
Hexaldehyde-2,4-dinitrophenylhydrazone 1
5991-1545EN

68
Figure 3 shows the correlation curves
of four of the compounds together with
the response factors, which were in the
± 5 % deviation range.
Figure 3Linearity of four of the carbonyl compounds.
6.00E-02
5.60E-02
5.20E-02
4.80E-0240 10 20 30
1
2
34567
Amount [ng/μL]
12 37 111 333 1,000 3,000
Re
sp
on
se
fa
cto
rs
ng/mL
600
Are
a
500
400
± 5%300
200
100
0
AcetaldehydeArea = 18.2366376 × Amt + 0.4516287
Rel. Res. % (7): _
33.849
Correlation: 0.99999
6.80E-02
6.40E-02
6.00E-02
5.60E-02
5.20E-02
1
2
34567
0 10 20 30
Amount [ng/μL]
Re
sp
on
se
fa
cto
rs
ng/mL
4 12 37 111 333 1,000 3,000
500
Are
a
400
300
200
100
0
PropionaldehydeArea = 15.9522012 × Amt + 0.1317915
Rel. Res. % (7): _
18.608
Correlation: 1.00000
1
2
567
34
0 10 20 30
Amount [ng/μL]
6.80E-02
6.40E-02
6.00E-02
5.60E-02
5.20E-02
Re
sp
on
se
fa
cto
rs
ng/mL
4 12 37 111 333 1,000 3,000
500
Are
a
400
300
200
100
0
2-ButanoneArea = 16.3155042 × Amt + 0.1051591
Rel. Res. % (7): _
13.414
Correlation: 1.00000
1
2
5673
4
0 10 20 30
Amount [ng/μL]
1.00E-02
9.60E-02
9.20E-02
8.80E-02
8.40E-02
8.00E-02
Re
sp
on
se
fa
cto
rs
ng/mL
4 12 37 111 333 1,000 3,000
250
300
350
Are
a 200
150
100
50
0
ValeraldehydeArea = 10.6032659 × Amt + 0.1564496
Rel. Res. % (7): _
23.360
Correlation: 1.00000
± 5%
± 5%
± 5%
5991-1545EN
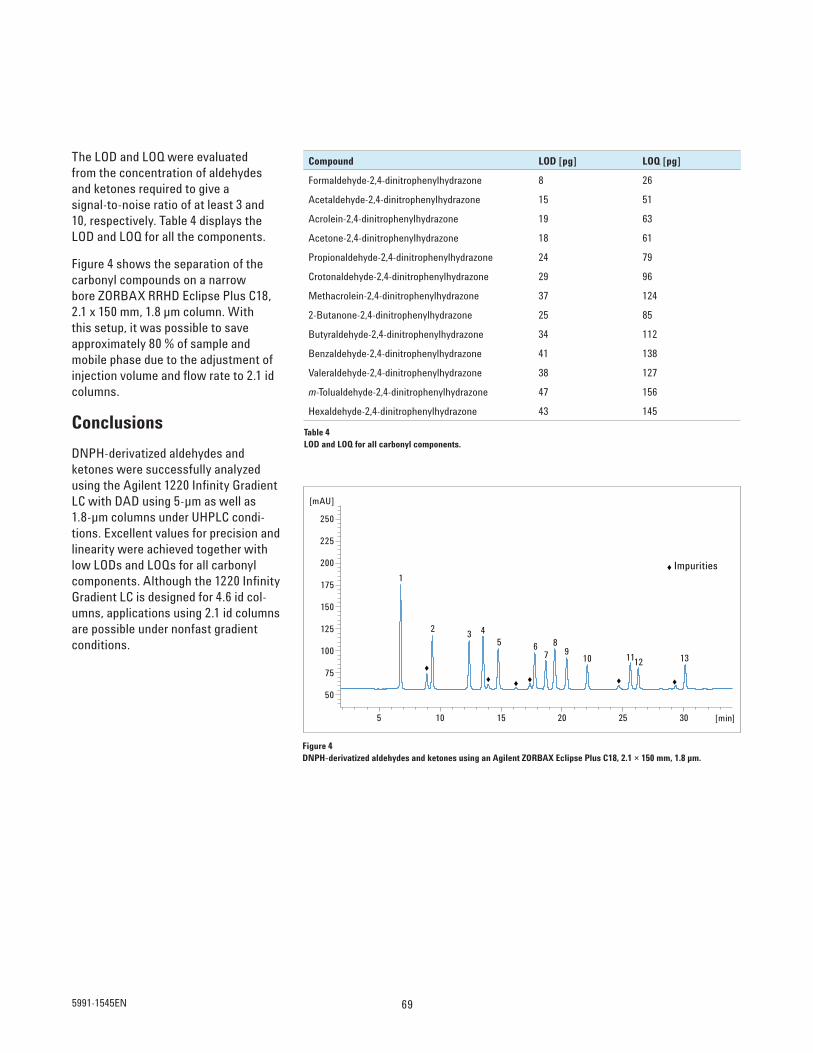
69
Figure 4DNPH-derivatized aldehydes and ketones using an Agilent ZORBAX Eclipse Plus C18, 2.1 × 150 mm, 1.8 μm.
Table 4LOD and LOQ for all carbonyl components.
The LOD and LOQ were evaluated
from the concentration of aldehydes
and ketones required to give a
signal-to-noise ratio of at least 3 and
10, respectively. Table 4 displays the
LOD and LOQ for all the components.
Figure 4 shows the separation of the
carbonyl compounds on a narrow
bore ZORBAX RRHD Eclipse Plus C18,
2.1 x 150 mm, 1.8 μm column. With
this setup, it was possible to save
approximately 80 % of sample and
mobile phase due to the adjustment of
injection volume and fl ow rate to 2.1 id
columns.
Conclusions
DNPH-derivatized aldehydes and
ketones were successfully analyzed
using the Agilent 1220 Infi nity Gradient
LC with DAD using 5-μm as well as
1.8-μm columns under UHPLC condi-
tions. Excellent values for precision and
linearity were achieved together with
low LODs and LOQs for all carbonyl
components. Although the 1220 Infi nity
Gradient LC is designed for 4.6 id col-
umns, applications using 2.1 id columns
are possible under nonfast gradient
conditions.
Compound LOD [pg] LOQ [pg]
Formaldehyde-2,4-dinitrophenylhydrazone 8 26
Acetaldehyde-2,4-dinitrophenylhydrazone 15 51
Acrolein-2,4-dinitrophenylhydrazone 19 63
Acetone-2,4-dinitrophenylhydrazone 18 61
Propionaldehyde-2,4-dinitrophenylhydrazone 24 79
Crotonaldehyde-2,4-dinitrophenylhydrazone 29 96
Methacrolein-2,4-dinitrophenylhydrazone 37 124
2-Butanone-2,4-dinitrophenylhydrazone 25 85
Butyraldehyde-2,4-dinitrophenylhydrazone 34 112
Benzaldehyde-2,4-dinitrophenylhydrazone 41 138
Valeraldehyde-2,4-dinitrophenylhydrazone 38 127
m-Tolualdehyde-2,4-dinitrophenylhydrazone 47 156
Hexaldehyde-2,4-dinitrophenylhydrazone 43 145
Impurities1
23 4
56
7
89
10 1112 13
[min]5 10 15 20 25 30
[mAU]
50
75
100
125
150
175
200
225
250
5991-1545EN

70

71
Food ApplicationsFood and beverages need to be provided of consistent
quality and uncompromising safety. Especially
quality control of incoming ingredients (raw material)
or the final product are part of this application area,
for example, perservatives and melamine testing.

72

73
Analysis of plant stanyl fatty acid esters in enriched margarine using an on-line coupled Agilent 1220 Infi nity LC-7890 GC System
Application Note
Food
Abstract
This Application Note describes the investigation of intact plant stanyl fatty acid
esters in an enriched commercial margarine using an on-line coupled Agilent 1220
Infi nity LC-7890A GC system. The lipid extract was directly analyzed without prior
purifi cation steps. The LC fraction of plant stanyl esters was transferred on-line
into the GC system using the solvent vent mode of the multimode inlet for solvent
evaporation. The on-line LC-GC combination showed very good linearity and repeat-
ability.
Authors
Andreas Barnsteiner, Rebecca Esche,
Karl-Heinz Engel
Technische Universität München
Lehrstuhl für Allgemeine
Lebensmitteltechnologie
Maximus-von-Imhof-Forum 2
85350 Freising, Germany
Walter Kohlert, Stefan Fenzel
Agilent Technologies, Inc.
Waldbronn, Germany
5990-8251EN

74
Introduction
Plant steryl and stanyl esters
(Figure. 1) are added to food products
like skimmed milk-drinking yogurts or
margarines because of their choles-
terol-lowering properties. The capillary
gas chromatographic investigation
of plant stanyl fatty acid esters from
skimmed milk products can be per-
formed directly after the lipid extrac-
tion1. However, the presence of di- and
triglycerides may hamper the direct GC
quantifi cation. Therefore, the analysis
in lipid extracts from foods with high
fat contents like margarine requires a
fractionation prior to the GC separation
by laborious off-line techniques, such
as TLC or SPE. The on-line coupling
of LC and GC offers an effi cient and
elegant alternative. The plant stanyl
esters can be fractionated by liquid
chromatography and transferred on-
line into the GC system. In this way, the
pre-fractionation step and the capillary
gas chromatographic analysis of the
transferred LC fraction are performed
in a closed system in one run. Hence,
the risk of sample loss and contami-
nation is reduced and the approach
results in better repeatability2, 3.
In a recently published paper1, the
analysis of plant stanyl esters in
enriched margarines using an on-line
LC-GC system equipped with a loop-
type interface was reported. Using
the loop-type interface, the solvent
evaporation was performed in the
GC capillary columns by means of a
pre-column system in combination
with an early solvent vapor exit. Due to
the high solvent amounts which were
loaded on the pre-column system with
each transfer, a loss of resolution was
observed after a few runs.
The on-line coupling of an Agilent
1220 Infi nity LC system and an
Agilent 7890A GC system, with a
2-position/6-port switching valve using
the solvent vent mode of the multimode
inlet of the GC, allowed for the evapora-
tion of the solvent prior to the capillary
column4. A pre-column system and/or
a solvent vapor exit were not neces-
sary. This combination was already
suitable for the analysis of cholesteryl
esters4.
In this Application Note, the use of an
Agilent on-line coupled LC-GC combi-
nation for the quantifi cation of plant
stanyl esters in enriched margarine is
presented.
Experimental
Chemicals and materials
The plant stanyl ester mixture “plant
stanol ester, STAEST-115” was pro-
vided by Raisio Group (Raisio, Finland).
The internal standard cholesteryl
palmitate (¡ 98%) was obtained from
Sigma Aldrich (Taufkirchen, Germany).
Benecol (taste-type Kevyt kasviras-
valevite 32%, with added plant stanyl
esters) margarine was purchased in
a supermarket in Finland; the plant
stanol content was labeled as 8 wt-%,
total lipids as 32 wt-%.
Sample preparation of margarine1
The margarine sample (20–40 mg,
accuracy of ± 0.1 mg) was weighed into
a vessel; internal standard (cholesteryl
palmitate, 750 μg), 5 mL of n-hexane/
MTBE (3:2) and sodium sulfate (anhy-
drous) were added and sonicated for
1 minute. The solution was fi ltered
through a 0.45 μm membrane fi lter
assembled with a 5 mL syringe. The
vessel and the fi lter were washed
twice with 5 mL n-hexane/MTBE (3:2).
After dilution (1:5) of the combined
extracts, the solution was used for
on-line LC-GC analysis.
O
O
O
O
O
O
RO RO
Campestanyl- Sitostanyl-
R = 16:0
18:0
18:1
18:2
18:3
20:0
Figure 1 Structures of plant stanyl fatty acid esters.
5990-8251EN

75
Chromatographic conditionsLC conditionsInjection volume: 2 μL
Eluent: n-hexane/tert-butylmethyl ether (96:4, v/v)
Column temperature; 27 °C
Column fl ow: 0.200 mL/min
Column type: Eurospher-100Si (250 x 2 mm I.D., 5 μm)
Wavelength: 205 nm
LC controlled interfaceTransfer valve: 4.25 min: Position 1 & 2
7.50 min: Position 2 & 1
GC start: 4.20 min: Change contacts switch contact A to closed
4.25 min: Change contacts switch contact A to open
GC conditionsFront MM inlet: Mode: Solvent vent
Carrier: H2
Pressure: 7.8 psi
Septum purge fl ow: 3 mL/min
Vent pressure: 4 psi until 0.5 min
Vent fl ow: 1000 mL/min
Temperature program: Initial: 50 °C for 0.5 min
Rate 1: 900 °C/min to 350 °C for 2 min
Purge fl ow to split vent: 2.5 mL/min at 0.5 min
Gas saver: 20 mL/min after 5 min
Column number 1: Column type: Restek Rtx-200MS: 30 m × 250 μm; 0.1 μm df;
Constant fl ow: 1.5 mL/min
Column number 2: Transfer line, controlled by PCM C-1
Pressure program: Initial: 5 psi for 0.3 min
Rate 1: 10 psi/min to 20 psi
Oven: Temperature program: Initial: 40 °C for 2 min
Rate 1: 100 °C/min to 100 °C for 0 min
Rate 2: 15 °C/min to 310 °C for 2 min
Rate 3: 1.5 °C/min to 340 °C for 3 min
Detector: FID: 360 °C
(H2: 30 mL/min, Air: 400 mL/min; Makeup: 25 mL/min)
Table 1Liquid and gas chromatographic conditions.
Quantifi cation
The fi ve-point calibration functions of
nine individual stanyl esters were gen-
erated in a range of 0.2 – 1.0 μg of total
stanyl ester (“plant stanol ester,
STAEST-115”) per 2 μL i.v. Each calibra-
tion point was done in triplicate. Linear
regression analysis was performed in
coordinate ratios of areas (individual
stanyl ester/IS) and amounts
(individual stanyl ester/IS).
Equipment
The coupling of the Agilent 1220
Infi nity LC system to the Agilent 7890A
GC system was accomplished using
an Agilent 2-position/6-port switching
valve equipped with a 200 μL sample
loop (Table 1). The evaporation of the
eluent was performed using the tem-
perature programmable MM Inlet in the
PTV solvent vent mode4.
Results and discussion
The chromatograms obtained by
on-line LC-GC analysis of a mar-
garine enriched with plant stanyl
esters are presented in Figure 2. The
LC-fractionation (Figure 2a) was
performed isocratically on a silica gel
column with n-hexane/MTBE
(96+4; v+v) as mobile phase. The plant
stanyl esters eluted after approxi-
mately 4 minutes. The transfer was
performed 4.25 minutes after injec-
tion. The transfer conditions for the
analysis of cholesteryl esters4 were
also suitable for plant stanyl esters.
The GC separation of the transferred
fraction was similar to that reported for
the on-line LC-GC analysis via a loop
type interface1. The intact plant stanyl
fatty acid esters were distinguishable
according to their carbon number and,
in the case of unsaturated fatty acid
moieties, to the number of double
bonds; only the esters of saturated and
monounsaturated fatty acids of the
same chain length eluted at the same
time.
min0 5 10 15 20 25 30
mAU
0
2
4
6
8
10
12
14(a)
Transfer window
Figure 2 Analysis of plant stanyl esters in enriched margarine by online LC-GC/FID; (a) LC-chromatogram and (b) GC-chromatogram of the transferred LC-fraction; peak numbering according to Table 2; (IS) internal standard cholesteryl palmitate.
pA
0
2
4
6
8
10
12
(b)
IS
12
3
45
6
7
8 9
min0 5 10 15 20 25 30
5990-8251EN
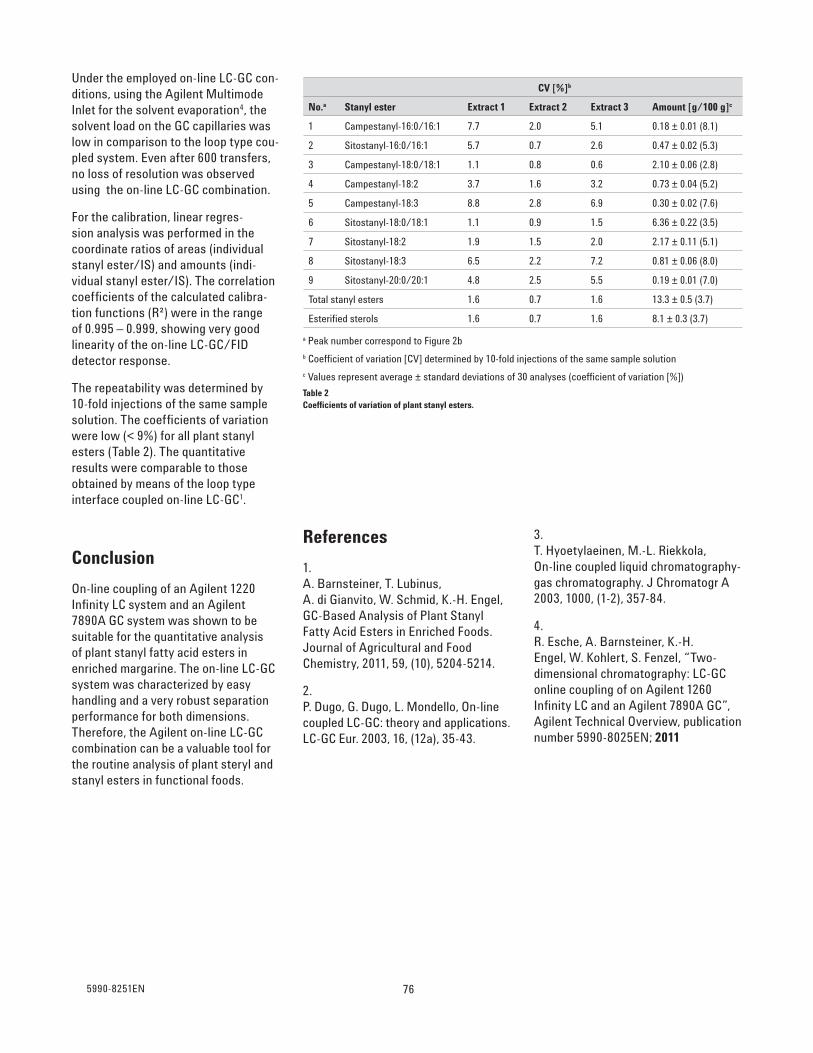
Under the employed on-line LC-GC con-
ditions, using the Agilent Multimode
Inlet for the solvent evaporation4, the
solvent load on the GC capillaries was
low in comparison to the loop type cou-
pled system. Even after 600 transfers,
no loss of resolution was observed
using the on-line LC-GC combination.
For the calibration, linear regres-
sion analysis was performed in the
coordinate ratios of areas (individual
stanyl ester/IS) and amounts (indi-
vidual stanyl ester/IS). The correlation
coeffi cients of the calculated calibra-
tion functions (R²) were in the range
of 0.995 – 0.999, showing very good
linearity of the on-line LC-GC/FID
detector response.
The repeatability was determined by
10-fold injections of the same sample
solution. The coeffi cients of variation
were low (< 9%) for all plant stanyl
esters (Table 2). The quantitative
results were comparable to those
obtained by means of the loop type
interface coupled on-line LC-GC1.
Conclusion
On-line coupling of an Agilent 1220
Infi nity LC system and an Agilent
7890A GC system was shown to be
suitable for the quantitative analysis
of plant stanyl fatty acid esters in
enriched margarine. The on-line LC-GC
system was characterized by easy
handling and a very robust separation
performance for both dimensions.
Therefore, the Agilent on-line LC-GC
combination can be a valuable tool for
the routine analysis of plant steryl and
stanyl esters in functional foods.
References
1.
A. Barnsteiner, T. Lubinus,
A. di Gianvito, W. Schmid, K.-H. Engel,
GC-Based Analysis of Plant Stanyl
Fatty Acid Esters in Enriched Foods.
Journal of Agricultural and Food
Chemistry, 2011, 59, (10), 5204-5214.
2.
P. Dugo, G. Dugo, L. Mondello, On-line
coupled LC-GC: theory and applications.
LC-GC Eur. 2003, 16, (12a), 35-43.
3.
T. Hyoetylaeinen, M.-L. Riekkola,
On-line coupled liquid chromatography-
gas chromatography. J Chromatogr A
2003, 1000, (1-2), 357-84.
4.
R. Esche, A. Barnsteiner, K.-H.
Engel, W. Kohlert, S. Fenzel, “Two-
dimensional chromatography: LC-GC
online coupling of on Agilent 1260
Infi nity LC and an Agilent 7890A GC”,
Agilent Technical Overview, publication
number 5990-8025EN; 2011
CV [%]b
No.a Stanyl ester Extract 1 Extract 2 Extract 3 Amount [g/100 g]c
1 Campestanyl-16:0/16:1 7.7 2.0 5.1 0.18 ± 0.01 (8.1)
2 Sitostanyl-16:0/16:1 5.7 0.7 2.6 0.47 ± 0.02 (5.3)
3 Campestanyl-18:0/18:1 1.1 0.8 0.6 2.10 ± 0.06 (2.8)
4 Campestanyl-18:2 3.7 1.6 3.2 0.73 ± 0.04 (5.2)
5 Campestanyl-18:3 8.8 2.8 6.9 0.30 ± 0.02 (7.6)
6 Sitostanyl-18:0/18:1 1.1 0.9 1.5 6.36 ± 0.22 (3.5)
7 Sitostanyl-18:2 1.9 1.5 2.0 2.17 ± 0.11 (5.1)
8 Sitostanyl-18:3 6.5 2.2 7.2 0.81 ± 0.06 (8.0)
9 Sitostanyl-20:0/20:1 4.8 2.5 5.5 0.19 ± 0.01 (7.0)
Total stanyl esters 1.6 0.7 1.6 13.3 ± 0.5 (3.7)
Esterifi ed sterols 1.6 0.7 1.6 8.1 ± 0.3 (3.7)
a Peak number correspond to Figure 2b
b Coeffi cient of variation [CV] determined by 10-fold injections of the same sample solution
c Values represent average ± standard deviations of 30 analyses (coeffi cient of variation [%])
Table 2Coeffi cients of variation of plant stanyl esters.
5990-8251EN 76

Abstract
The Agilent 1120 Compact LC is the system of choice for conventional, analytical
scale liquid chromatography. It is an intergrated LC designed for ease of use,
performance and reliability. It is ideally suited for the analysis of antioxidants
on account of its capability to achieve highly precise retention times and peak
areas, and low detection limits for the analyzed compounds. The data in this
Application Note demonstrates:
• Excellent retention time precision of less than 0.07 % RSD
• Excellent peak area precision of less than 0.3 % RSD for
baseline separated peaks
• Limit of detection <1 to 75 ng for all antioxidants analyzed
Angelika Gratzfeld-HuesgenApplication Note
Analysis of antioxidants in chewing gumusing the Agilent 1120 Compact LC
5989-7456EN77

Introduction
Antioxidants are widely used in the
food industry. For example, butylated
hydroxyanisole (BHA) is used in bis-
cuits, fruit cake, candy and walnuts as
well as in chewing gum. Estimated
and proven risks of these compounds
have led to regulations for the maxi-
mum allowed concentrations in food-
stuffs. Some antioxidants such as
BHA are not allowed in baby foods
because of their influence on the
accelerated digestion of vitamin D.
BHA also has a detrimental influence
on the blood level of lipids and choles-
terol.
In this study, eight antioxidants were
analyzed and the precision of retention
times and areas was measured.
Further, the limit of detection (LOD) of
the compounds was determined. As a
real-life example, the level of BHA in
chewing gum was measured.
Experimental
Equipment• Agilent 1120 Compact LC comprising
gradient pump with integrated
degasser, autosampler with vial tray,
column oven and variable wave-
length detector, see figure 1
• Agilent HC-C18(2), high carbon load,
150 x 4.6 mm, 5 μm particle size col-
umn
• Agilent EZChrom Elite Compact soft-
ware
Chromatographic conditions• Mobile phase:
A: Water + 0.045 % TFA
B: ACN + 0.045 % TFA
• Gradient: 10 to 90 %B in 15 min
• Flow rate: 1.5 mL/min
• Injection volume: 5 μL
• Column temperature: 40 °C
• Detection wavelength: 260 nm
Peakwidth: > 0.0025 min
Response time: 0.06 s
Sample1. Vitamin C
2. Propyl gallat (PG)
3. 2,4,5-trihydroxy-butyrophenone
(THBP)
4. mono-tert-butyl-hydroquinone
(TBHQ)
5. Butylated hydroxyanisole (BHA)
6. 4-hydroxymethyl-2.6-di(tert-
butyl)phenol (ionox 100)
7. Butylated-hydroxytoluene (BHT)
8. Ascorbyl-palmitate (ACP)
Results and discussion
Eight antioxidants were chosen for the
determination of precision of retention
time and areas. The limits of detection
were also evaluated. All compounds
were separated with excellent resolu-
tion, using conventional chromato-
graphic conditions with a flow rate of
1.5 mL/min and a 15 min gradient, see
figure 2.
Figure 2Upper trace–Antioxidant standards, 1350-200ng, 1:10 dilutionLower trace–Antioxidant standards, 135-20ng, 1:100 dilution
1
5
6
7
8
4
32
Time [min]0 2 4 6 8 10 12 14 16 18
Ab
sorb
an
ce
[m
AU
]
0
10
20
30
40
50
Figure 1Agilent 1120 Compact LC
785989-7456EN

The concentration levels used in this
study are listed in table 1. The preci-
sion of retention times and areas was
determined using the 1:10 dilution.
The results are shown in table 2.
Even for peaks with heights less than
or equal to 20 mAU, the precision of
areas was less than 0.3 %, which is an
excellent result. The area precision for
vitamin C (peak 1) was affected by the
continuous decomposition of this com-
pound in solution. The precision of
ACP (peak 8) was influenced by a
small broad peak that eluted just
before the ACP peak. Both peaks were
not completely separated and quantifi-
cation at about 12 mAU was not as
good as for the other fully separated
compounds.
The precision of retention times for all
compounds was less than 0.05 % rela-
tive standard deviation (RSD). Figure 2
shows the overlaid chromatograms six
consecutive runs.
The limit of detection was calculated
based on the chromatogram of the
1:100 dilution, see figure 1. The results
are shown in table 3.
Peak Compound Stock Solution 1:10 dilution 1:100 dilutionmg/10 mL 5 μL inj. vol. 5 μL inj. vol.
(ng per inj.) (ng per inj.)
1 Vitamin C 20 1000 100
2 PG 21 1050 105
3 THBP 15 750 75
4 TBHQH 21 1050 105
5 BHA 11 500 50
6 Ionox100 14 700 70
7 BHT 27 1350 135
8 ACP 4 200 20
Table 1Concentration levels of the analyzed antioxidants.
Figure 3Overlay of six consecutive runs.
Time [min]
0 2 4 6 8 10 12 14 16 18
Ab
sorb
an
ce
[m
AU
]
0
100
200
300
400
Peak Compound LOD with S/N = 31:100 dilution
(ng)
1 Vitamin C <1*
2 PG <1
3 THBP 75
4 TBHQH 6
5 BHA 3
6 Ionox100 2.3
7 BHT 2.5
8 ACP 2
Table 3Limits of detection for the antioxidants (*rapid decomposition made determination oftraces difficult).
Peak Compound % RSD % RSD Peak heightRet. Times Areas (mAU)
1 Vitamin C 0.04 2.01* ~200
2 PG 0.03 0.08 ~400
3 THBP 0.02 0.12 ~200
4 TBHQH 0.01 0.23 <25
5 BHA 0.02 0.21 <15
6 Ionox 100 0.01 0.10 <20
7 BHT 0.01 0.26 <50
8 ACP 0.01 1.74** ~12
Table 2Precision of retention times and areas (*decomposition; **integration problem with front peak).
5989-7456EN79

The BHA content in chewing gum was
determined using the method devel-
oped in this study. Figure 4 shows
complete chromatograms of standard
and chewing gum extract. Figure 5
shows the part of the chromatogram
between 9 and 13 minutes enlarged
for more detailed. The sample was
prepared by cutting 14.1 g of sugar-
free chewing gum in small pieces and
extracting with acetonitrile in an ultra-
sonic bath for 30 min. See figure 1 for
other conditions. About 25 ppb BHA
could be determined in 1 g of chewing
gum. This is a relative value because
recovery rates were not evaluated.
Conclusion
The Agilent 1120 Compact LC was
used for the analysis of antioxidants.
This instrument was able to analyze
these compounds with high precision.
Retention time precision was less than
0.05 % RSD and area precicion of
baseline separated peaks was less
than 0.3 % RSD. The limit of detection
was between 1 and 75 ng. In a real-life
example, 25 ppb of BHA were found in
1 g of chewing gum after extraction
with acetonitrile in an ultrasonic bath.
Figure 4Upper trace–chewing gum extract, lower trace–antioxidant standards.
Time [min]
0 2 4 6 8 10 12 14 16 18
Ab
sorb
an
ce
[m
AU
]
0
20
40
60
80
100
120
140
1 5 6 7 8432
See figure 5
Time [min]
9.0 9.5 10.0 10.5 11.0 11.5 12.0 12.5
Ab
sorb
an
ce [
mA
U]
0
2
4
6
8
10
12
14
16
BHA
Figure 5Enlarged view of figure 4, showing the chewing gum extract (upper trace) and the BHA peak at10.55 min, equivalent to about 25 ng/g or 25 ppb.
805989-7456EN

Analysis of preservatives in food and cosmetics with the Agilent 1120 CompactLC system
Abstract
An HPLC method was developed for simultaneous determination of the nine
preservatives most often used in food and cosmetics. The system suitability
results showed that the Agilent 1120 Compact LC is the system of choice for
conventional, analytical scale liquid chromatography. This integrated HPLC system
was designed for ease of use, performance, and reliability. The quantitative
analysis of typical samples is demonstrated in this Application Note.
Rongjie Fu,
Zhixiu XuApplication Note
5989-8960EN81

Introduction
Preservatives are very popular in the
food and cosmetics industries
because they prevent these products
from degrading within the warranty
time. But preservatives are strictly reg-
ulated because their overuse can
cause some health problems in
humans. For example, some preserva-
tives can accumulate in the human
body and negatively influence the
metabolism process. Today’s trends in
food and cosmetics increasingly
emphasize the concepts of healthy
and green. That means use of safer
raw materials, as well as fewer preser-
vatives and control of preservatives
within a safe limit.
In developing countries like China, the
regulation of preservatives in food and
cosmetics is approaching the interna-
tional standards, such as the common-
ly used regulations adopted by the
Codex Alimentarius Commission
(CAC). In general, the regulations set
the concentration limits on the preser-
vatives in cosmetics and food. With
increased research on safety of food
and cosmetics, it might be necessary
to analyze more preservatives in the
future.
Some popular preservatives were ana-
lyzed in this application. A face condi-
tioner and glace fruit were selected as
typical samples that contain certain
kinds of preservatives. The manufac-
turers of these products need to con-
trol the quality of their products before
they go to market. The
regulatory agencies check these prod-
ucts in the market very carefully to see
if the amount of preservative is within
the limit.
The experiments in this Application
Note were performed with the Agilent
1120 Compact LC, which is the system
of choice for conventional, analytical
scale liquid chromatography. It is an
integrated HPLC system designed for
ease of use, performance, and reliabili-
ty. It is ideally suited for routine analy-
ses in the food and fine chemical
industries because of its capability to
achieve very precise retention times
and peak areas, as well as low detec-
tion limits for the analyzed com-
pounds.
Experimental
Equipment• Agilent 1120 Compact LC system
with gradient pump (degasser
inside), autosampler, column com-
partment, and variable wavelength
detector (VWD)
• EZChrom Elite Compact software
Chemicals and reagents• Reference standards were purchased
from Sinopharm Chemical Reagent
Co. Ltd., Shanghai, China.
• Water was obtained from a Millipore
water purifier.
• Acetonitrile (Fisher Scientific) was
HPLC purity. All other reagents were
analytical purity.
Sample preparationGlace fruit: The fruit was cut into
pieces and 1.5 g was weighed and
diluted to 10 mL with water. The mix-
ture was treated with an ultrasonic for
15 minutes, and was filtered with a
0.45 μm filter prior to injection.
Face conditioner: 1 mL was diluted to
10 mL with water, and the sample was
filtered with a 0.45 μm filter prior to
injection.
Chromatographic conditions
• Column: Agilent HC-C18(2),
4.6 x 250 mm, 5 μm
• Mobile phase: A = 20 mM
acetate buffer, pH 4.2;
B = acetonitrile
• Gradient: 0 – 25 min,
30 %B – 45 %B
• Flow rate: 1 mL/min
• Wavelength:
0 min 260 nm
5 min 230 nm
5.6 min 260 nm
9.2 min 230 nm
10.2 min 260 nm
• Injection volume: 5 μL
• Temperature: 30 °C
Results and discussion
Development of a method for these
preservatives in food and cosmetics
must consider the run time and the
separation of the nine compounds. The
other fact that must be considered is
that the matrix of the real samples
may influence the separation. The
HPLC system needs a column with
good efficiency, and for quantitative
analysis of the preservatives, it must
deliver good precision for retention
times and peak areas.
Because the compounds used as
preservatives have different ultraviolet
(UV) spectra, the wavelength program
of the variable wavelength detector
was used in this study to detect all the
compounds at their most sensitive
wavelength.
The overlaid chromatograms of two
real samples and the preservative
standards are shown in figure 1. The
corresponding peak names are listed
in table 1. In glace fruit, the benzoic
acid and sorbic acid were found. In the
face conditioner sample, only methyl-
paraben was found.
825989-8960EN

The system reproducibility was tested
with the nine compounds (table 1).
The high precision of the retention
times gives high confidence when
comparing the standards and real sam-
ples.
The linear range of the standards was
tested with this Agilent 1120 Compact
LC system. The results are listed in
table 2. The data shows that very good
regression factors (values of r2) were
achieved for each compound.
The quantitative results from the two
samples are shown in table 3.
Conclusion
The Agilent 1120 Compact LC is ideal
for the routine analysis of preserva-
tives in food and cosmetics. Excellent
resolution and good separation were
achieved, and system suitability exper-
iments showed the robustness and
high precision for this kind of applica-
tion. The high precision of the reten-
tion times and peak areas ensures reli-
able results when quantitation is need-
ed for quality control. The variable
wavelength detector can be used with
programmed wavelength to adjust to
the maximum absorbance for all the
compounds.
Figure 1Overlaid chromatograms of preservative standards and real samples.
Time [min]0 5 10 15 20 25 30
mA
U
0
100
200
300
400
Sorbic
acid
Methylparaben
12
3 4
56 7
Benzoic
acid
Cosmetics:face conditioner
Glace fruit
Standard
8 9
Peak Compound % RSD retention times % RSD areas
1 Benzoic acid 0.03 1.11
2 Sorbic acid 0.03 0.16
3 Methylparaben 0.03 0.11
4 Dehydroacetic acid (DHA) 0.04 1.05
5 Ethylparaben 0.03 0.10
6 Isopropylparaben 0.03 0.11
7 n-Propylparaben 0.02 0.07
8 Isobutylparaben 0.02 0.10
9 n-Butylparaben 0.02 0.11
Table 1Reproducibility of six injections of nine preservative standards.
Peak Compound Range (ng) r2
1 Benzoic acid 45.5 - 455 0.9998
2 Sorbic acid 35 - 350 0.9998
3 Methylparaben 66.5 - 665 0.9998
4 Dehydroacetic acid (DHA) 135 - 1350 0.9991
5 Ethylparaben 64.5 - 645 0.9998
6 Isopropylparaben 67 - 670 0.9998
7 n-Propylparaben 71.5 - 715 0.9998
8 Isobutylparaben 76.5 - 765 0.9998
9 n-Butylparaben 63.5 - 635 0.9998
Table 2Linearity of the nine preservative standards.
Benzoic acid Sorbic acid Methylparaben
Glace fruit 101.63 mg/Kg 70.59 mg/kg ND*
Face conditioner ND ND 1.07 mg/mL
Table 3The amount of preservatives in the real samples.
*ND = not detected
5989-8960EN83

References
1.
X. Ping, “Analysis of preservatives in
beverage using Agilent TC C18 col-
umn”, Agilent TechnologiesApplication Note, publication number5989-3638CHCN, 2005.
2.
B. Huang, “Analysis of 8 preservatives
and 3 sweeteners in sauce and bever-
age by HPLC”, Chinese Journal ofHealth Laboratory Technology, 15(10),1208, 2005.
845989-8960EN
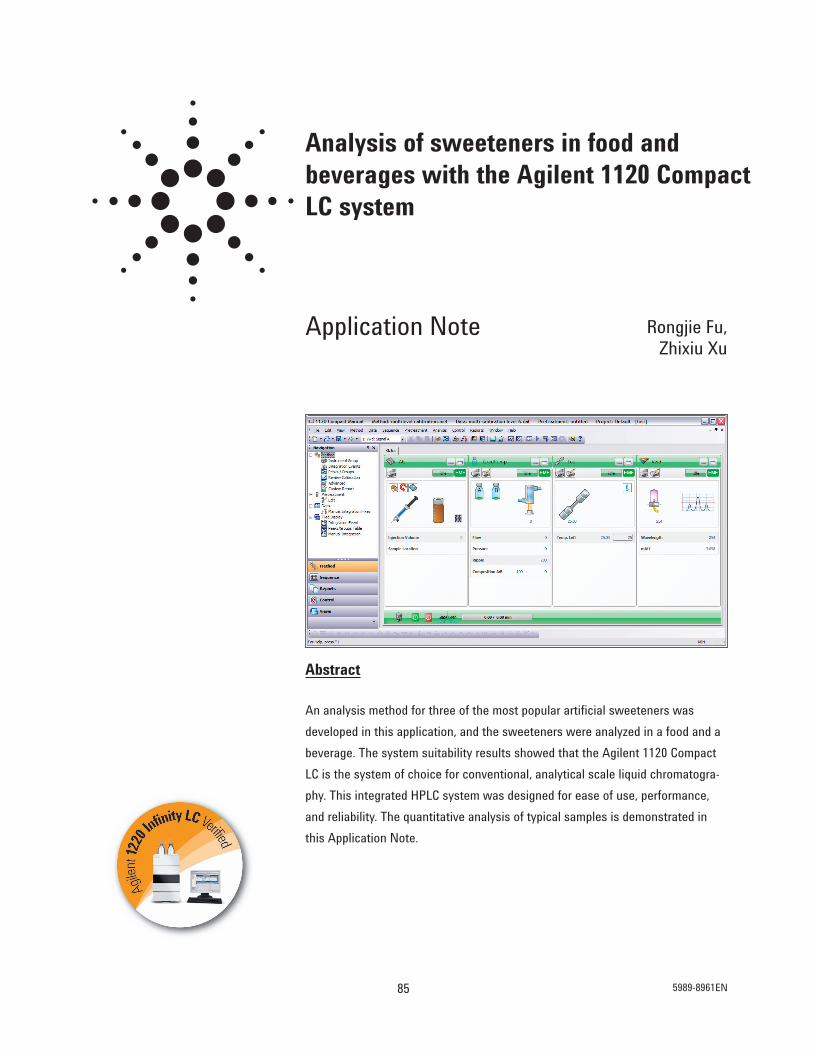
Analysis of sweeteners in food and beverages with the Agilent 1120 CompactLC system
Abstract
An analysis method for three of the most popular artificial sweeteners was
developed in this application, and the sweeteners were analyzed in a food and a
beverage. The system suitability results showed that the Agilent 1120 Compact
LC is the system of choice for conventional, analytical scale liquid chromatogra-
phy. This integrated HPLC system was designed for ease of use, performance,
and reliability. The quantitative analysis of typical samples is demonstrated in
this Application Note.
Rongjie Fu,
Zhixiu XuApplication Note
5989-8961EN85
Introduction
Artificial sweeteners are widely used
all over the world, and some of them
have a long history. For example, sac-
charin was invented nearly 100 years
ago. Artificial sweeteners taste similar
to cane sugar, but are low-calorie.
They benefit overweight people and
those who have problems with sugar
metabolism. Artificial sweeteners are
also cheaper than natural sugar and
can reduce the cost for some foods
and beverages. However, scientific
research has shown that some of
them can cause tumors in certain ani-
mals, so to prevent potential danger to
humans, it is necessary to control the
amount of sweeteners in foods and
beverages.
Regulations set an upper limit on the
concentration of artificial sweeteners
in foods and beverages. The labels of
foods and beverages should list what
kinds of sweeteners are used. Quality
control or spot-checking can use a
conventional HPLC method to deter-
mine the amount of the sweeteners in
the samples.
For this application, the most widely
used sweeteners were analyzed in
samples of yogurt and a beverage. The
analysis was performed with the
Agilent 1120 Compact LC, which is the
system of choice for conventional,
analytical scale liquid chromatography.
It is an integrated HPLC system
designed for ease of use, performance,
and reliability. It is ideally suited for
routine analyses in
the food industry because of its
capability to achieve very precise
retention times and peak areas, as
well as low detection limits for the
analyzed compounds.
Experimental
Equipment• Agilent 1120 Compact LC system
with gradient pump (degasser
inside), autosampler, column com-
partment, and variable wavelength
detector (VWD)
• EZChrom Elite Compact
software
Chemicals and reagents• Reference standards were
purchased from Sinopharm Chemical
Reagent Co. Ltd., Shanghai, China.
• Water was obtained from a Millipore
water purifier.
• Acetonitrile (Fisher Scientific) was
HPLC purity. All other reagents were
analytical purity.
Sample preparationYogurt: 5 mL was diluted with
5 mL methanol, and then the mixture
was stirred and centrifuged. The sam-
ple was filtered with a 0.45 μm filter
prior to injection.
Diet Coke: The sample was treated
with an ultrasonic for 10 minutes, and
then was filtered with a 0.45 μm filter
prior to injection.
Chromatographic conditions• Column: Agilent TC-C18(2),
4.6 x 250 mm, 5 μm
• Mobile phase: A = 20 mM
KH2PO4 buffer, pH 3.0;
B = acetonitrile
• Gradient: 0 min 15 %B
5 min 35 %B
10 min 80 %B
• Flow rate: 1 mL/min
• Wavelength: 214 nm
• Injection volume: 5 μL
• Temperature: 30 °C
865989-8961EN

Results and discussion
The separation of standards of three
sweeteners (acesulfame, saccharin,
and aspartame) was done in eight min-
utes. To make sure the other compo-
nents of the real sample were eluted
from the column, the final method
needed 11 minutes runtime.
By overlaying the chromatograms of
the standards and the real samples,
one can easily find out which kind of
sweeteners are used in specific sam-
ples. As shown in figure 1, the sam-
ples of yogurt and Diet Coke that were
used for this test contained both ace-
sulfame and aspartame, but no sac-
charin.
The linearity of the compounds was
tested within the concentration range
from 18.75 to 1500 ng, which covers
the most likely concentrations in real
samples. The results are shown in
table 1. The data shows that very good
regression factors (values of r2) were
achieved for each compound.
The system reproducibility was also
tested with the three compounds. The
high precision of the retention times
gives high confidence when comparing
the standards and real samples.
The quantitative results from the two
samples are shown in table 3.
Conclusion
The Agilent 1120 Compact LC is ideal
for the routine analysis of sweeteners
in foods and beverages. Excellent reso-
lution and good separation were
achieved, and system suitability exper-
iments showed the robustness and
high precision for this kind of applica-
tion. The high precision of the reten-
tion times and peak areas ensures reli-
able results when quantitation is need-
ed for quality control.
Figure 1Overlaid chromatograms of sweetener standards and real samples.
Time [min]0 1 2 3 4 5 6 7 8 9 10 11 12
0
200
400
600
800
1000
2 Saccharin
Yogurt
Standard
Diet cola
1 Acesulfame3 Aspartame
mA
U
Peak Compound % RSD retention times % RSD areas
1 Acesulfame 0.075 0.09
2 Saccharin 0.070 0.24
3 Aspartame 0.033 0.23
Table 2Reproducibility of the 10 injections of sweetener standards.
Peak Compound Range (ng) r2
1 Acesulfame 18.75 - 1500 0.99999
2 Saccharin 18.75 - 1500 0.99997
3 Aspartame 18.75 - 1500 0.99998
Table 1Linearity of the sweetener standards.
Acesulfame Aspartame
Yogurt 0.09 mg/mL 0.027 mg/mL
Diet Coke 0.205 mg/mL 0.146 mg/mL
Table 3The amount of sweeteners in the real samples.
5989-8961EN87
References
1.
X. Ping, “Analysis of sweeteners in
food and beverage using Agilent TC
C18”, Agilent Technologies ApplicationNote, publication number 5989-3890CHCN, 2005.
2.
W. Liu, “Determination of Antiseptic
and Sweetener in wine by HPLC”,
Liaoning Chemical Industry, 35(4), 238,2006.
3.
X. Sheng, “Solid phase extraction-liq-
uid chromatography/mass spectrome-
try for simultaneous determination of
artificial synthetic sulfa sweeteners in
food”, Chinese Journal of AnalysisLaboratory, 25(7), 75, 2006.
885989-8961EN

5990-4377EN89
Food
Application Note
Authors
Detlef Wilhelm
ANATOX GmbH & Co. KG
Fuerstenwalde
Germany
Abstract
This Application Note describes the analysis of several well known preservatives like
benzoic acid, sorbic acid or the esters p-hydroxy benzoic acid (methyl-, ethyl- and
propyl-) with the Agilent 1120 Compact LC.
Conventional LC methods are often used in routine analyses to characterize or moni-
tor products for this purpose. The presented data show the determination of these
ingredients in several consumer products such as chewing gum, ketchup, and barbe-
cue sauce, which demonstrates the relevance of this method for quality control test-
ing and monitoring of products for consumer protection.
This Application Note shows that the Agilent 1120 Compact LC works as a reliable
and highly robust instrument for standard LC. It can be used for routine analyses.
The use of methanol for separating the components reduces cost and allows a 15-min
determination of all components with an overall resolution of >3. The results of
reliability, quality, system suitability and performance testing are shown.
Determination of preservatives in foodand drugstore products with the Agilent1120 Compact LC

IntroductionSeveral consumer products contain
preservatives, which can be harmful to
some people. The most common
preservatives are benzoic or sorbic acid
as well as the esters p-hydroxy benzoic
acid. These ingredients inhibit microbi-
ological growth in food or drugstore
products and are used either alone or
as a mixture. During manufacturing, the
products are analyzed for quality con-
trol and monitored for consumer pro-
tection. Standardized conventional LC
methods are often used in routine
analyses to characterize or monitor
products.
There are several requirements for the
analytical instrumentation: reliability,
flexibility, and ease of use. In addition,
the instrument should provide low
ownership cost.
This Application Note shows that the
Agilent 1120 Compact LC works as a
reliable and highly robust instrument
for standard LC. It can be used in rou-
tine analyses, for preservatives found in
several consumer products. These
analyses are done in independent con-
trol laboratories; therefore the use of
methanol for separating the compo-
nents should be optimized to reduce
cost and pollution.
The results of reliability, quality, system
suitability and performance tests are
shown.
Configuration of the Agilent 1120 Compact LC
Gradient pump and vacuum degasser
Auto sampler
Column oven
Variable wavelength detector
Software: EZ-Chrom Elite Compact 3.3
Column ZORBAX Eclipse XDB C18, 150 mm ˘ 4.6 mm, 5 μm
Mobile phasesPhase A: Dissolve 6.8 g potassium dihydrogen phosphate in 900 mL
water. The pH value should be adjusted to pH = 2.3 with
phosphoric acid and then filled to 1000 mL with water.
Phase B: Methanol
Gradient (linear): Time (min)
0 80% A/20% B
9.6 47% A/53% B
12 33% A/67% B
13 33% A/67% B
13.1 80% A/20% B
Pump settingsStop time: 15 min
Post time: 5 min
Flow rate: 1.75 mL/min
AutosamplerInjection volume: 20 μL
Thermostatted column compartmentTemperature: 40 °C
Detector 14 μL cell, Peak width: >0.05 min, 1 s response time (10 Hz),
Signal: 220 nm
InstrumentationAn Agilent 1120 Compact LC with the
following configuration was used:
Preparation of samplesReference samples
Dissolve 10 mg of each vitamin in
water and dilute to 100 mL with the
Chromatographic conditions
same solvent. Mix and dilute 1 mL of
each solution to 20 mL with mobile
phase.
The following common preservatives
were checked:
Benzoic acid, sorbic acid, methyl-,
ethyl- and propylesters of p-hydroxy
benzoic acid (Methyl-PHB, Ethyl-PHB,
Propyl-PHB).
Samples from food and drugstores
Dissolve 1g of sample in 10 mL of
water. Solution and extraction can be
improved by treating for 10 min in a
ultrasonic bath. Next, filter the samples
with syringe filters; first through a 2-μm
filter, followed by a 0.45-μm syringe
filter to prepare the clear solution for
injection.
905990-4377EN

System suitability and performancetest: For system suitability testing, the refer-
ence solution with the limits listed
below was used. This was in accor-
dance with Q3A(R)- Impurities in New
Drug Substances:2
• Resolution: minimum 1.5 between
each peak
• Precision of areas must be < 2 % RSD.
• Precision of retention times must be
< 0.5 % RSD.
With these limits and settings for test-
ing, the samples in Table 1 were pre-
pared and analyzed.
Results and discussionThe separation was achieved with
methanol, since it was able to separate
the critical pair of benzoic and sorbic
acid.2 The results in Figure 1 show good
separation of all preservatives with the
Agilent ZORBAX Eclipse XDB C18 mate-
rial on the Agilent 1120 Compact LC and
EZChrom Elite Compact Software.
For the detection of all components, the
Agilent 1120 Compact LC variable wave-
length detector was set for 260 nm.
This setting was chosen because all
target analytes except benzoic acid has
a maximum adsorption near 260 nm.
Detailed data are listed in Table 2. The
first limit for resolution (>1.5) is fulfilled
for all peaks. The data for resolution
show good selectivity with the ZORBAX
Sample Purpose Number of injections
Blanc solution Verify baseline stability and identify artifacts 2
Calibration samples Verify linearity 3 of each level
Control sample Verify sensitivity and resolution for 6
reference solution
Suitability sample Verify precision of areas and retention times 10
for reference solution
Table 1Setup for testing.
Minutes0 1 2 3 4 5 6 7 8 9 10 11 12 13 14 15
mA
U
0
50
100
150
200
250
5.0
95
Be
nzo
ic a
cid
5.9
97
So
rbic
ac
id
6.7
23
Me
thy
l pa
rab
en
e
9.3
90
Eth
yl p
ara
be
n
11.8
53
Pro
py
l pa
rab
en
e
Figure 1Standard chromatogram of preservatives with the Agilent 1120 Compact LC.
Retention Compound time (min) Resolution
Benzoic acid 5.06 –
Ascorbic acid 5.96 4.31
Methyl-PHB 6.69 5.25
Ethyl-PHB 9.39 18.55
Propyl-PHB 11.85 17.83
Table 2Results for control sample: Retention times andresolution.
5990-4377EN91

Minutes
0 1 2 3 4 5 6 7 8 9 10 11 12 13 14 15
mA
U
_2
_1
0
1
2
3
4
5
6
7
8
9
10
Be
nzo
ic a
cid
So
rbic
ac
id
Me
thy
l pa
rab
en
e
Eth
yl p
ara
be
n
Pro
py
l pa
rab
en
e
Figure 2Analysis of preservative "free" chewing gum.
Retention time RSD RT RSD Area AsymmetryCompound (min) n = 10 n = 10 n = 10
Benzoic acid 5.06 0.408 0.188 0.64
Ascorbic acid 5.96 0.153 0.235 1.00
Methyl-PHB 6.69 0.277 0.260 1.09
Ethyl-PHB 9.39 0.039 0.112 1.09
Propyl-PHB 11.85 0.009 0.074 1.10
Table 3Suitability sample: Precision of retention times and areas for the Agilent 1120 Compact LC.
Compound m b r
Benzoic acid 2151314.8 25187.3 0.999
Ascorbic acid 10188005.0 119381.1 1.0
Methyl-PHB 4459268.1 83135.1 1.0
Ethyl-PHB 3097910.6 57372.8 1.0
Propyl-PHB 3024691.2 24203.6 1.0
Table 4Calibration data of the Agilent 1120 Comapct LC (Setting "Ignore Origin",
Y = mx + b, 1.0 μg/mL–20.0 μg/mL.)
925990-4377EN
Eclipse XDB C18 material.
The areas and retention time precision
results of all compounds of the suitabil-
ity sample are shown in Table 3. The
data demonstrate the high reliability
and precision of the Agilent 1120
Compact LC. The data show that the
system can be used for QC methods,
since the criteria for retention times
and areas are fulfilled for all com-
pounds.
The data in Tables 3 and 4 prove high
precision and reliability of the autosam-
pler. The correlation coefficient for each
calibration curve is very close to 1.0
showing high versatility and quality for
QC testing and monitoring.
It can be seen that with the selected
column, as well as with the Agilent
1120 Compact LC, characterization and
monitoring of products from foods and
drugs is possible. The following exam-
ples demonstrate the performance of
the system:
• The chromatogram of Figure 2 illus-

trates that the chewing gum is free of
all of the preservatives tested.
• The chromatogram of Figure 3 shows
that the mouthwash tested is free of
preservatives tested, but it is possible
that different preservatives were used
to inhibit microbial growth.
• The chromatograms in Figures 4 and 5
show the analysis of a beauty cream
and a toothpaste. The declared preser-
vative (Methyl-PHB) is part of the
product. This chromatogram verifies
Be
nzo
ic a
cid
So
rbic
ac
id
Me
thy
l pa
rab
en
e
Eth
yl p
ara
be
n
Pro
py
l pa
rab
en
e
Minutes
0 1 2 3 4 5 6 7 8 9 10 11 12 13 14 15
mA
U0
4
8
12
16
20
24
28
Figure 3Analysis of mouthwash.
Be
nzo
ic a
cid
So
rbic
ac
id
Eth
yl p
ara
be
n
Pro
py
l pa
rab
en
e
6.7
32
Me
thy
l p
ara
be
ne
13
.37
7
Minutes
0 1 2 3 4 5 6 7 8 9 10 11 12 13 14 15
mA
U
0
4
8
12
16
20
24
28
Figure 4Chromatogram of a beauty cream.
Figure 5Chromatogram of a toothpaste.
5990-4377EN93

All results explicitly show the applica-
bility of the Agilent 1120 Compact LC
for quality control testing with reduced
costs per system and improved simplici-
ty of use. In addition to the instrument
capabilities, the new version of the
EZChrom Elite compact software allows
full control of the Agilent 1120 Compact
LC with a wide range of features for
data analysis and results reporting.
The results for resolution and asymme-
try show good selectivity and perfor-
mance with the ZORBAX Eclipse XDB.
The Agilent 1120 Compact LC is quali-
fied and optimized for everyday produc-
tivity and routine analysis.
References1.
“Analysis of Preservatives in White
Wine an Salad Dressing using HPLC,”
1997, Agilent Technologies publication
5966-0629E
2.
Q3A(R) Impurities in New Drug
Substances, Rev. 2,
http://www.fda.gov/cder/guidance/
7838fnl.pdf,
that the method can be used for quali-
ty control as well as for monitoring.
• The chromatograms in Figures 6 and 7
show the method can monitor super-
market products. The preservative-
free brand of ketchup is proven to be
free of the tested preservatives. The
preservative-free barbecue sauce con-
tains some considerable amounts of
benzoic acid and methyl-PHB.
All examples show minimal influence of
the matrix on the separation. It can be
seen that it is easy to detect any of the
tested preservatives.
ConclusionThe Agilent 1120 Compact LC is
designed for users in independent labs
who require LC methodology with relia-
bility, ease-of-use, and low ownership
cost, to characterize or monitor products.
This Application Note shows a reliable
approach for the determination of
preservatives in food or drugstore prod-
ucts. The data prove high precision of
retention time, and provide clear chro-
matographic parameters such as reso-
lution and asymmetry.
As shown in Table 2, the resolution of
all main peaks was found to be greater
than 3.0. The calibration data of each
compound shows that the instrument
can be operated as required in a quality
control environment. All criteria for pre-
cision, such as areas and retention
times are fulfilled (see Table 3). The
results indicate that the use of the
Agilent 1120 Compact LC in QA/QC lab-
oratories to characterize products con-
taining preservatives is appropriate. In
addition, it is possible to identify any of
the tested preservatives independent of
the matrix.
12
.59
81
2.9
28
13
.43
81
3.6
88
14
.18
71
4.4
88
Be
nzo
ic a
cid
So
rbic
ac
id
Me
thy
l pa
rab
en
e
Eth
yl p
ara
be
n
Pro
py
l pa
rab
en
e
Minutes
0 1 2 3 4 5 6 7 8 9 10 11 12 13 14 15m
AU
0
4
8
12
16
20
24
28
Figure 6Analysis of a "preservative free" ketchup brand.
5.0
10
Be
nzo
ic A
cid
6.7
52
Me
thy
l pa
rab
en
e
So
rbic
ac
id
Eth
yl p
ara
be
n
Pro
py
l pa
rab
en
e
Minutes
0 1 2 3 4 5 6 7 8 9 10 11 12 13 14 15
mA
U
0
4
8
12
16
20
24
28
Figure 7Analysis of a "preservative free" barbecue sauce.
945990-4377EN

Determination of water soluble vitaminswith the Agilent 1120 Compact LC aftermethod development with the Agilent1200 Series Rapid Resolution LC systemand back transfer
Abstract
Quality control to characterize products is often done with standardized liquid chro-
matography (LC) methods. The needed analytical instrumentation requires optimal
cost-of-ownership instruments with high reliability, high flexibility, and ease of use.
The analysis of several water soluble vitamins with the Agilent 1120 Compact LC is
described. The preceding method development was done with Agilent 1200 Series
Rapid Resolution (RR). This Application Note starts with the final results of that
method development. The transfer of those results by the Method Translator Software
to conventional LC parameters and columns shows that this method can be used with
standard LC equipment.
This Application Note shows that the Agilent 1120 Compact LC works as a reliable
and highly robust instrument for routine LC analyses and everyday quality control test-
ing. Full separation was achieved by using an ion pairing eluent and Agilent ZORBAX
Eclipse Plus material. The analysis of a typical nutritional mixture of vitamins shows
no disturbances by other peaks. The results for reliability and quality testing, system
suitability, and performance are shown.
Author
Detlef Wilhelm
ANATOX GmbH & Co. KG
Fuerstenwalde
Germany
Application Note
Food
5990-4379EN95

IntroductionQuality control is a main consideration
in the field of standard LC product
analyses. The analytical instrumenta-
tion has several requirements, such as
optimal cost-of-ownership, high reliabil-
ity, high flexibility, and ease of use.
This Application Note targets routine
quality control testing, and shows that
the Agilent 1120 Compact LC is a reli-
able and highly robust instrument for
standard methodology. The Agilent
1120 Compact LC can also be used for
determinations after method develop-
ment with an Agilent 1200 Series RRLC
system. Back transfer from the RR sep-
aration to conventional columns can be
achieved by the Method Translator
Software, and the results of reliabiltiy,
quality, system suitability, and perfor-
mance testing are shown.
InstrumentationAn Agilent 1200 Series Rapid
Resolution LC system and an Agilent
1120 Compact LC were used for the
method development. Table 1 lists the
configurations used for each instru-
ment.
Configuration of the Agilent 1200 LC Series Configuration of the Agilent 1120 Compact LC
Binary pump and vacuum degasser Gradient pump and vacuum degasser
Well-plate autosampler Autosampler
Column compartment Column oven
Diode array detector Variable wavelength Detector
Software: Chemstation B.04.01 Software: EZ-Chrom Elite Compact 3.3
Preparation of samples
Reference samples
Dissolve 10 mg of each vitamin in water
and dilute to 100 mL with the same sol
O O
OH OH
HOHO
H
N NH2
O
OHO
NH
O
OHOHH
N
OHOH
OH
N
N N+
NH2
CH3
S
CH3
OH
N
N
N NCo+
CH3
NN
CH3
CH3
CH3
NH2
O
NH2 O
NH2
O
HC 3
NH2 O
CH3
H
NH
O
CH3O
P OOHO
O
OH
OH
CH3
CH3
R
NH2O
HC 3
CH3
NH2O
Ascorbic acid (Vit. C)
Nicotinamide (Vit. B3)
Ca-Pantothenate (Vit. B5)
Pyridoxine (Vit. B6)
Thiamin (Vit. B1)
Cyanocobalamin (Vit. B12)
Figure 1Substances to check.
Table 1Instrumentation configurations used for method development
965990-4379EN
vent. Dilute 1 mL of the solution to
20 mL with the mobile phase. Figure 1
illustrates the substances to check.

System suitability and performancetest:
For system suitability testing the
reference solution with the following
limits was used:
• Resolution: minimum 1.5 between
peaks.
Sample Purpose Number of injections
Blanc solution Verify baseline stability and identify artifacts 2
Calibration samples Verify linearity 3 of each level
Control sample Verify sensitivity and resolution for 6
reference solution
Suitability sample Verify precision of areas and retention times 10
for reference solution
Column For method development: ZORBAX Eclipse Plus C18, 50 mm ˘ 2.1 mm, 1.8 μm
For routine testing: ZORBAX Eclipse Plus C18, 150 mm ˘ 4.6 mm, 5 μm
Mobile phasesPhase A: Dissolve 1.03 g hexane sulfonic acid and 6.8 g potassium
dihydrogene phosphate in 1000 mL water. The pH value
should be adjusted to pH = 2.3 with phosphoric acid.
Phase B: Acetonitrile
Gradient (linear): Time (min)
0 100% A/0% B
6 80% A/20% B
9 50% A/50% B
10 100% A/0% B
Pump settingsStop time: 10 min
Post time: 5 min
Flow rate: 1.0 mL/min
AutosamplerInjection volume: 30 μL
Thermostatted column compartmentTemperature: 40 °C
Detector 14-μL cell for the Agilent 1120 LC system,
Peak width: >0.05 min, 1 s response time (10Hz),
Signal: 220 nm
13-μL cell for the Agilent 1200 LC system,
Peak width: >0.05 min, 1 s response time (10Hz),
Signal: 220 nm
Table 2Setup for testing
• Precision of areas must be < 2 % RSD.
• Precision of retention times must be
< 0.5 % RSD.
With these limits and settings for test-
ing, the samples in Table 2 were pre-
pared and analyzed.
Chromatographic conditions
5990-4379EN97

Figure 3Conversion of LC parameters found by Rapid Resolution to parameters suitable for conventional HPLC with the Method Translator software.
0.5 1 1.5 2 2.5
mAU
_2
0
2
4
6
8
10
12
0.2
10
- A
sc
orb
ic a
cid
0.7
81
- N
ico
tin
am
ide
1.2
17
- C
a-P
an
toth
en
at
2.1
65
- P
yri
do
xin
2.5
96
- T
hia
min
e
2.7
80
- V
it. B
12
Minutes
Figure 2Example chromatogram of water soluble vitamins with the Agilent 1200 Series RRLC system.
985990-4379EN
Results and discussionHexanesulfonic acid was chosen as the
ion-pairing agent to achieve the best
separations for all peaks. The results in
Figure 2 show good separation of all vit-
amins with the ZORBAX Eclipse Plus
C18 material on an Agilent 1200 Series
RRLC system.
The parameters found during method
development with the Agilent 1200
Series RRLC system were transferred to
parameters suitable for using 5-μm
columns with conventional HPLC sys-
tems with the Agilent Method
Translator Software (see Figure 3).

Because Ca-pantothenate has no sig-
nificant absorbance at wavelengths
>230 nm, a 220 nm setting on the
Agilent 1120 Compact LC wavelength
detector was selected to detect all
components. Figure 4 shows a chro-
matogram, achieved after transfer of
the parameters from the 50 mm ˘
2.1 mm Rapid Resolution column to a
150 mm ˘ 4.6 mm (5-μm material) col-
umn with the Agilent 1120 Compact LC
and EZ-Chrom Elite Compact Software.
As Figure 4 shows, the elution order is
the same, which proves that the selec-
tivity does not change with the particle
size. Only small differences can be seen
in the resolution between nicotinamide
and Ca-pantothenate, but full baseline
separation still exists. Detailed data are
listed in Table 3. As a main result it can
be emphasized that it is possible to
transfer LC parameters from Rapid
Resolution to conventional LC systems
and columns with 5-μm particles.
The only difference in parameters
between the Agilent 1200 Series binary
system and the Agilent 1120 Compact
LC is that the 1120 LC separation result-
ed in slightly later eluting peaks, as
seen in Figures 2 and 3. The reason can
be found in the difference of gradient
mixing. With the Agilent 1120 Compact
LC, the gradient is mixed at the low
pressure site whereas with the Agilent
1200 binary system the mixing is done
at the high pressure site. The different
mixing volumes (delay volumes) are
responsible for the different raise of the
gradients in the columns.
However, as seen in Figure 3 the reso-
lution of all peaks is unaffected by the
different gradient mixing. In addition, all
other impurities in the fine chemicals
are separated.
Minutes
0 1 2 3 4 5 6 7 8 9 10
mA
U
0
100
200
300
400
500
600
700
1.8
73
As
co
rbic
ac
id
2.8
37
Nic
oti
na
mid
5.3
70
Ca
-Pa
nto
the
na
t
6.2
67
Py
rid
ox
in
6.8
57
Th
iam
in
7.1
87
Vit
. B1
2
VWD: Signal A, 220 nm
Retention Time
Name
Figure 4Example chromatogram of water soluble vitamins with the Agilent 1120 Compact LC.
nm225 250 275 300 325 350 375 400
Norm.
0
200
400
Ascorbic acid
Ca-pantothenate
Nicotinamid
Pyridoxin HCl
Thiamin
Vitamin B12
Figure 5UV spectra of all vitamins aquired by the Agilent 1200 Series Diode Array Detector.
Retention time Retention time Resolution ResolutionCompound 1200er (min) 1120 (min) 1200er 1120
Ascorbic acid 0.210 1.873 – –
Nicotinamide 0.781 2.837 12.78 9.24
Ca-Pantothenate 1.217 5.370 7.27 23.18
Pyridoxine 2.165 6.267 16.68 10.10
Thiamine 2.596 6.857 9.76 6.83
Vitamin B12 2.780 7.187 2.24 3.38
Table 3Results for control sample: Retention times and resolution.
5990-4379EN99

The results shown in Table 3 illustrate
good separation achieved with the ZOR-
BAX Eclipse Plus C18 material. The
high resolution (every peak >2) for both
systems shows that this column mater-
ial is highly suitable for this determina-
tion, because of its good performance
(see data for asymmetry in Table 4).
Table 4 shows the areas and retention
time precision results of all compounds
in the suitability sample. The reliability
and precision of the Agilent 1120
Compact LC is demonstrated. The crite-
ria (see “System suitabiltiy and perfor-
mance tests”) of precision of retention
times and areas are fulfilled for all com-
pounds. This shows that the system
can be used for QC methods.
The high precision and reliability of the
autosampler is best shown by the data
in Tables 4 and 5. The correlation coeffi-
cient for each calibration curve is very
close to 1.0 showing high versatility
and quality for QC testing.
The chromatogram in Figure 6, shows
the determination of a nutritional mix-
ture of vitamins with great differences
in concentration of each vitamin, which
illustrates the capabilities of the
method.
VWD: Signal A, 220 nmRetention Time
Name
Minutes
0 1 2 3 4 5 6 7 8 9 10
mA
U
0
100
200
300
400
500
1.8
48
Vit
C
2.6
70
Nic
oti
na
mid
e
5.3
27
Ca
-Pa
nto
the
na
te
6.2
27
Py
rid
ox
ine
6.7
77
Th
iam
ine
6.8
33
7.7
00
Vit
. B1
2
Figure 6Chromatogram of a typical nutritional mixture of vitamins.
Compound m b r
Ascorbic acid 1601035.9 48890.7 0.999
Nicotinamide 17812069.2 17303.5 1.0
Ca-Pantothenate 2231477.8 3546.1 1.0
Pyridoxine 35097452.7 75231.6 0.999
Thiamine 26988637.8 40978.7 0.999
Vitamin B12 104653435.3 19666.3 0.999
Table 5Calibration data of the Agilent 1120 Comapct LC (Setting "Ignore Origin", Y = mx + b, 1.6–16.1 μg/mL for ascorbic acid and 0.11–1.12 mg/L for the other vitamins).
Retention time RSD RT RSD Area AsymmetryCompound (min) n = 10 n = 10 1120
Ascorbic acid 1.873 0.225 0.234 1.186
Nicotinamide 2.837 0.398 0.236 1.185
Ca-Pantothenate 5.370 0.277 0.508 1.238
Pyridoxine 6.267 0.323 0.325 1.178
Thiamine 6.857 0.407 0.374 1.193
Vitamin B12 7.187 0.145 0.652 1.116
Table 4Suitability sample: Precision of Retention times and areas for the Agilent 1120 Compact LC.
1005990-4379EN

ConclusionThe Agilent 1120 Compact LC is a good
choice for medium to small sized com-
pany users who need high reliability,
ease-of-use, and lowest cost-of-owner-
ship for standard QA/QC LC method-
ology.
This Application Note shows the setup
for the determination of water soluble
vitamins after method development
with rapid resolution. This reliable
approach is proven with precision of
areas and retention time data, as well
as chromatographic parameters such as
resolution and asymmetry. The results
from a system optimized for everyday
productivity and calibration meet the
requirements for routine analysis.
As shown in Table 3 the resolution of
all peaks was found to be greater than
3.0 with values near 1.0 for the asym-
metry of all main peaks. It is concluded
from the calibration data that the
instrument can be operated in a quality
control environment.
The results in Table 4 show that all cri-
teria for the determination of precision
(areas, retention times) are fulfilled.
From these results, it can be concluded
that the Agilent 1120 Compact LC can
be used in QA/QC laboratories to deter-
mine water soluble vitamins in samples
for nutritional purposes.
All results show the applicability of the
Agilent 1120 Compact LC for quality
control testing by reduced costs per
system and improved simplicity of use.
In addition to the instrument capabili-
ties, the new version of the EZChrom
Elite compact software allows full con-
trol of the Agilent 1120 Compact LC
with a wide range of features for data
analysis and results reporting.
The results for resolution and asymme-
try show good selectivity and perfor-
mance of the ZORBAX Eclipse Plus
material, independent of the particle
size. The data also show good flow
design of the LC systems ensuring that
no band broadening and peak distortion
will occur during method transfer. In
summary, this Application Note shows
that fast method development can be
achieved with an Agilent 1200 Series
Rapid Resolution LC system and the
results can be back transferred to a
conventional HPLC such as the Agilent
1120 Compact LC. This approach will
meet the highest requirements for
everyday productivity.
5990-4379EN101

102
Quantitative liquid chromatographyanalysis of melamine in dairy productsusing Agilent's 1120 Compact LC and1200 Series Rapid Resolution LC
Abstract
In this application, three different LC methods are developed for the determination of
melamine in dairy products. The first is a modification of the U.S. FDA method [1]. An
Agilent LC system (1120 or 1200) is used with a ZORBAX SB-C8 LC column to run in
reversed-phase ion-pair mode for routine quantitation of melamine. The second
method is targeted for high throughput using an Agilent Rapid Resolution LC (RRLC)
system (1200SL) to speed melamine analysis by more than three times with a Rapid
Resolution High Throughput (RRHT) column. The third is an alternative ion-exchange
LC method where a ZORBAX 300SCX column is employed to successfully retain
melamine using a simple mobile phase of buffered water/acetonitrile without the
presence of ion-pair reagent. Due to the complexity of dairy product matrices, a
cleanup step using solid phase extraction (SPE) is required for the above methods.
The Agilent SampliQ SCX, a mixed-mode polymer SPE cartridge with combined
reversed-phase and strong cation exchange properties, is used to successfully remove
matrix interferences.
Authors
Hua Wu, Rong An, Yao Xiao, Zhixu
Zhang, and Ping Li
Agilent Technologies Co., Ltd.
3 Wang Jing Bei Lu,
Beijing 100102
China
Editor
Wei Luan
Agilent Technologies Co., Ltd.
412 Ying Lun Road
Shanghai 200131
China
Application Note
Food Safety
5989-9949EN103

IntroductionIn March 2007, imported pet food ingredients contaminated
with melamine caused renal failure in dogs and cats across
the United States. Once again, this compound is in the news
as an illicit adulterant in milk and milk products. The same
contaminant is now being detected in other food products
that contain milk imported from China and as global concern
rises, widespread testing for melamine is proceeding.
The published analytical approaches include LC, LC/MS, and
GC/MS. The LC method is being used for quantitative analy-
ses of melamine. Liquid chromatographic separation of this
small polar compound can be achieved by reversed-phase
ion-pair liquid chromatography. The U.S. FDA developed this
methodology for melamine in pet food in 2007. With a slight
modification of the proportion of mobile phase, the method
can be successfully applied to separate melamine from a
variety of dairy product matrices.
The disadvantage of conventional HPLC is time and solvent
consumption. The Agilent 1200 Series Rapid Resolution LC
system is designed for highest throughput without loss of
resolution or with better resolution in combination with the
Agilent ZORBAX RRHT columns. In this application note, the
conventional HPLC method is transferred from a 4.6 mm ˘
250 mm, 5 μm ZORBAX SB-C8 column to a 4.6 mm ˘ 50 mm,
1.8 μm RRHT ZORBAX SB-C8 column with equivalent results,
and the LC run time is shortened from almost 20 minutes to
6 minutes.
An alternative approach for liquid chromatographic separation
of this small polar compound is ion exchange chromatogra-
phy. Agilent ZORBAX 300SCX is an ionic bonded-phase col-
umn packing used for cation exchange high-performance liq-
uid chromatography. This packing consists of an aromatic sul-
fonic acid moiety covalently bonded to ZORBAX porous silica.
This column is successfully applied to retain melamine using
a simple mobile phase of buffered water/acetonitrile without
the presence of ion-pair reagent.
For complex dairy product matrices, it is necessary to remove
interferences such as protein, sugar, and fat before LC injec-
tion. Solid-phase extraction (SPE) is a simple way to clean up
the complex matrix extract. SampliQ is a new family of SPE
cartridges from Agilent with a wide range of sorbent
chemistries. Among this family, the mixed-mode SampliQ
Strong Cation Exchange (SCX) cartridge is a sulfonic acid-
modified divinyl benzene polymer with both ion exchange and
reversed-phase retention properties. This makes the SampliQ
SCX very effective for cleanup after solvent extraction.
Experimental
Standard Preparation
A stock solution of melamine at 1,000 μg/mL is prepared in
methanol by sonication. Dilutions in mobile phase are made
up at 0.05, 0.1, 0.5, 1.0, 5.0, 10.0, 50.0, and 100.0 μg/mL
concentrations.
Sample Preparation
The sample preparation process is a modification of the China
national standard [2].
Sample Extraction Procedure
For liquid milk, milk powder, yogurt, ice cream, and creamy
candy samples:
• Weigh 2 ± 0.01 g of sample and add to a 50-mL centrifuge
tube, add 15 mL of 5% trichloroacetic acid in water and
5 mL of acetonitrile, then cap.
• Sonicate for 10 min and then place samples on vertical
shaker for 10 min. Centrifuge for 10 min at 4000 rpm.
• Wet filter paper with 5% trichloroacetic acid in water,
then filter the supernatant into a 25.0-mL volumetric
flask, and bring to volume with 5% trichloroacetic acid in
water.
• Transfer a 5.0-mL aliquot of the extract into a glass tube,
and then add 5.0 mL purified water. Vortex to mix
thoroughly.
For cheese, cream, and chocolate samples:
• Weigh 2 ± 0.01 g of sample, grind with 8~12 g of sea
sand in a mortar, and then transfer into a 50-mL cen-
trifuge tube.
• Wash the used mortar with 5 mL of 5% trichloroacetic
acid in water three times, transfer washings into a 50-mL
centrifuge tube, and then add 5 mL of acetonitrile.
• Proceed with the sonication and other steps as described
in the previous preocedure..
• If the sample is very fatty, defat the extract using liquid-
liquid extraction with hexane saturated with 5%
trichloroacetic acid in water before cleanup by SPE.
1045989-9949EN
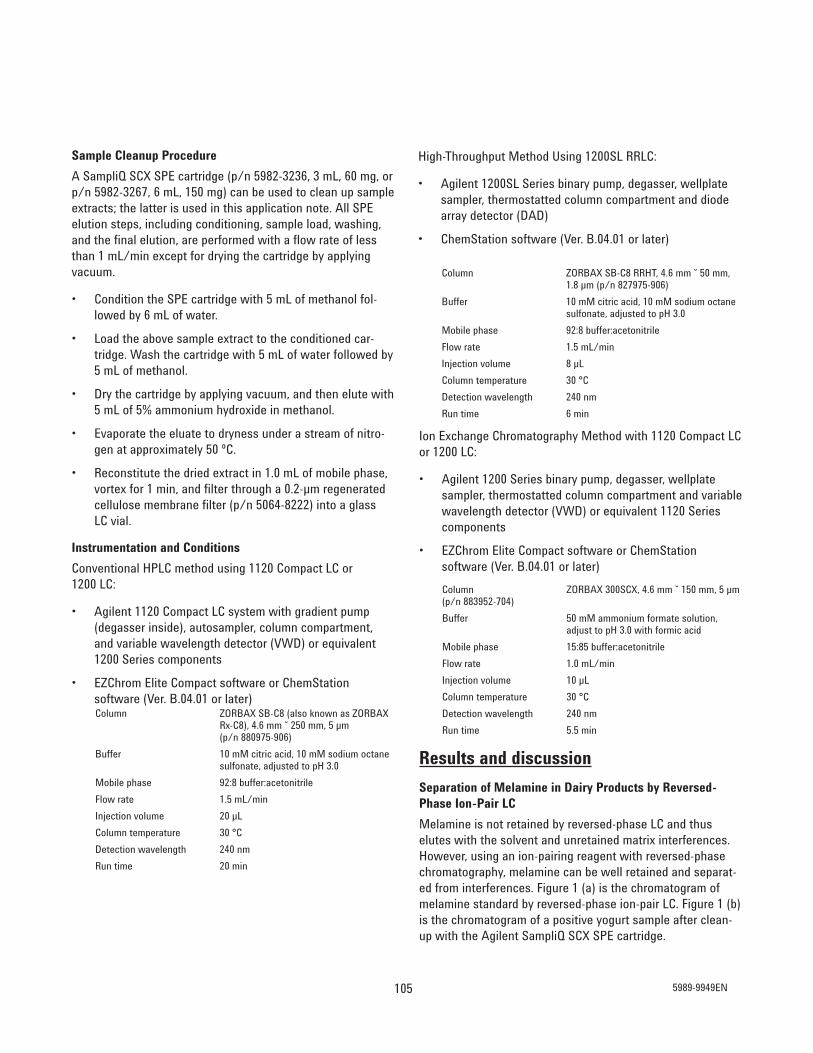
Sample Cleanup Procedure
A SampliQ SCX SPE cartridge (p/n 5982-3236, 3 mL, 60 mg, or
p/n 5982-3267, 6 mL, 150 mg) can be used to clean up sample
extracts; the latter is used in this application note. All SPE
elution steps, including conditioning, sample load, washing,
and the final elution, are performed with a flow rate of less
than 1 mL/min except for drying the cartridge by applying
vacuum.
• Condition the SPE cartridge with 5 mL of methanol fol-
lowed by 6 mL of water.
• Load the above sample extract to the conditioned car-
tridge. Wash the cartridge with 5 mL of water followed by
5 mL of methanol.
• Dry the cartridge by applying vacuum, and then elute with
5 mL of 5% ammonium hydroxide in methanol.
• Evaporate the eluate to dryness under a stream of nitro-
gen at approximately 50 ºC.
• Reconstitute the dried extract in 1.0 mL of mobile phase,
vortex for 1 min, and filter through a 0.2-μm regenerated
cellulose membrane filter (p/n 5064-8222) into a glass
LC vial.
Instrumentation and Conditions
Conventional HPLC method using 1120 Compact LC or
1200 LC:
• Agilent 1120 Compact LC system with gradient pump
(degasser inside), autosampler, column compartment,
and variable wavelength detector (VWD) or equivalent
1200 Series components
• EZChrom Elite Compact software or ChemStation
software (Ver. B.04.01 or later)
Results and discussion
Separation of Melamine in Dairy Products by Reversed-Phase Ion-Pair LC
Melamine is not retained by reversed-phase LC and thus
elutes with the solvent and unretained matrix interferences.
However, using an ion-pairing reagent with reversed-phase
chromatography, melamine can be well retained and separat-
ed from interferences. Figure 1 (a) is the chromatogram of
melamine standard by reversed-phase ion-pair LC. Figure 1 (b)
is the chromatogram of a positive yogurt sample after clean-
up with the Agilent SampliQ SCX SPE cartridge.
Column ZORBAX SB-C8 (also known as ZORBAX
Rx-C8), 4.6 mm ˘ 250 mm, 5 μm
(p/n 880975-906)
Buffer 10 mM citric acid, 10 mM sodium octane
sulfonate, adjusted to pH 3.0
Mobile phase 92:8 buffer:acetonitrile
Flow rate 1.5 mL/min
Injection volume 20 μL
Column temperature 30 °C
Detection wavelength 240 nm
Run time 20 min
High-Throughput Method Using 1200SL RRLC:
• Agilent 1200SL Series binary pump, degasser, wellplate
sampler, thermostatted column compartment and diode
array detector (DAD)
• ChemStation software (Ver. B.04.01 or later)
Column ZORBAX SB-C8 RRHT, 4.6 mm ˘ 50 mm,
1.8 μm (p/n 827975-906)
Buffer 10 mM citric acid, 10 mM sodium octane
sulfonate, adjusted to pH 3.0
Mobile phase 92:8 buffer:acetonitrile
Flow rate 1.5 mL/min
Injection volume 8 μL
Column temperature 30 °C
Detection wavelength 240 nm
Run time 6 min
Ion Exchange Chromatography Method with 1120 Compact LC
or 1200 LC:
• Agilent 1200 Series binary pump, degasser, wellplate
sampler, thermostatted column compartment and variable
wavelength detector (VWD) or equivalent 1120 Series
components
• EZChrom Elite Compact software or ChemStation
software (Ver. B.04.01 or later)
Column ZORBAX 300SCX, 4.6 mm ˘ 150 mm, 5 μm
(p/n 883952-704)
Buffer 50 mM ammonium formate solution,
adjust to pH 3.0 with formic acid
Mobile phase 15:85 buffer:acetonitrile
Flow rate 1.0 mL/min
Injection volume 10 μL
Column temperature 30 °C
Detection wavelength 240 nm
Run time 5.5 min
5989-9949EN105

High-Throughput Analysis by Agilent 1200SL RRLC withRRHT Column
With the Agilent 1200 Series RRLC system, high throughput is
possible. In combination with the Agilent ZORBAX RRHT
columns, excellent chromatographic resolution can be
achieved at much shorter run times than with a conventional
LC system. A RRLC method is developed to dramatically
increase the sample throughput for the determination of
melamine in dairy products. Figure 2 (a) is the chromatogram
of a melamine standard by the RRLC method with the reten-
tion time of melamine at 2.8 minutes.
Figure 2 (b) is the chromatogram of the same yogurt sample
in Figure 1 (b). In order to make sure that the column is clear
for the next injection, the total run time is extended to 6 min-
utes. The high throughput RRLC method is applied in the vari-
ety of dairy products matrices, including yogurt, liquid milk,
and milk powder to demonstrate that the same resolution is
achieved as with the conventional HPLC method. The calibra-
tion curve for the RRLC method is shown in Figure 3. The cali-
bration includes 0.8, 2.0, 20.0, 40.0, and 80.0 μg/mL. The
instrumental LOD (limit of detection) of the RRLC method is
0.03 μg/mL.
min0.5 1 1.5 2 2.5 3 3.5
mAU
0
0.5
1
1.5
2
2.5
3
3.5
min0.5 1 1.5 2 2.5 3 3.5
mAU
0
0.5
1
1.5
2
2.5
3
3.5
2.8
73
2.8
77
3.1
51
Melamine
Melamine
(a)
(b)
Figure 2Separation of (a) 0.8 μg/mLmelamine standard, and (b) pos-itive yogurt sample after cleanupby SampliQ SCX SPE cartridge.Retention time of melamine is2.8 minutes.
2 4 6 8 10 12 14 16 18
_2.5
0
2.5
5
7.5
10
12.5
15
17.5mAU
min
mAU
1
0.5
0
0.5
1
1.5
2
2.5
Melamine
Melamine
2 4 6 8 10 12 14 16 18 min
(a)
(b) Figure 1Separation of (a) 20 μg/mLmelamine standard, and (b)positive yogurt sample aftercleanup by SampliQ SCX SPEcartridge. Retention time ofmelamine is 14.2 minutes.
1065989-9949EN

Ion Exchange Chromatographic Method
An alternative to ion-pair reversed-phase chromatography for
melamine is ion exchange chromatography (IEC). The Agilent
ZORBAX 300SCX is used for cation exchange high-perfor-
mance liquid chromatography (HPLC). This column is
employed to separate melamine in dairy product matrices
with sufficient retention to separate matrix interferences.
Figure 4 shows the separation of melamine from interfer-
ences without the SPE cleanup step. Generally, the total run
time of the ion exchange chromatography is only 5.5 minutes
with an LOD of 0.05 μg/mL, as shown in Figure 5. The calibra-
tion curve for the IEC method is shown in Figure 6. The cali-
bration points include 0.5, 1.0, 5.0, 10, 50, and 100 μg/mL.
Although the separation is shown to be interference free for
raw milk and liquid milk without any additive, it is still recom-
mended that the cleanup step be included to ensure robust
methodology for running many samples and samples of differ-
ent matrices.
0 50
5
4
3
21
Amount (wt %)
Measured point (0.833, 11.732)0
200
400
600
800
1000
1200
Area y = 17.76x _3.07
R2 = 0.99996
Figure 3Calibration curve of RRLC method.
min0 1 2 3 4 5
mAU
0
20
40
60
80
Melamine
Figure 4Separation of melamine in milk powder sample by IEC without cleanup by SPE.
5989-9949EN107

ConclusionsThree approaches are described in this application note; the
first is a reversed-phase ion-pair LC method employing
Agilent 1120 compact LC or 1200 HPLC with an SB-C8 col-
umn. The second is a high-throughput method, which reduces
the LC run time from 20 minutes to 6 minutes using the
Agilent 1200 RRLC with the ZORBAX RRHT SB-C8 column.
The last is an IEC method using the Agilent ZORBAX 300SCX
column. Each successfully separates melamine from matrix
interferences and provides identification by retention time
and quantitative results. The results of this study, including
sample cleanup with SampliQ SCX SPE cartridges and the
three separation approaches, show that a complete solution
from Agilent for the determination of melamine in dairy prod-
ucts is provided. The reversed-phase ion-pair method is
based on the FDA and China national standards. However, the
min0 1 2 3 4 5
mAU
-0.5
-0.4
-0.3
-0.2
-0.1
0
0.1
0.2
0.3
0.4 Melamine, S/N = 3.9
Figure 5Limit of detection (LOD) for melamine at the concentration of 0.05 μg/mL.
y = 15.054x
R2 = 0.9998
0
200
400
600
800
Are
a
1000
1200
1400
1600
0 20 40 60 80 100 120
Concentration (μg/mL)
Figure 6Calibration curve of IEC method.
IEC method is simple, quick, sensitive, and robust. With this
method, melamine can be successfully retained using a sim-
ple mobile phase without the presence of an ion-pair reagent.
References1. Updated FCC Developmental Melamine Quantitation
(HPLC-UV), April 2, 2007
2. GB/T 22388-2008 Determination of melamine in raw milk
and dairy products, October 7, 2008
1085989-9949EN
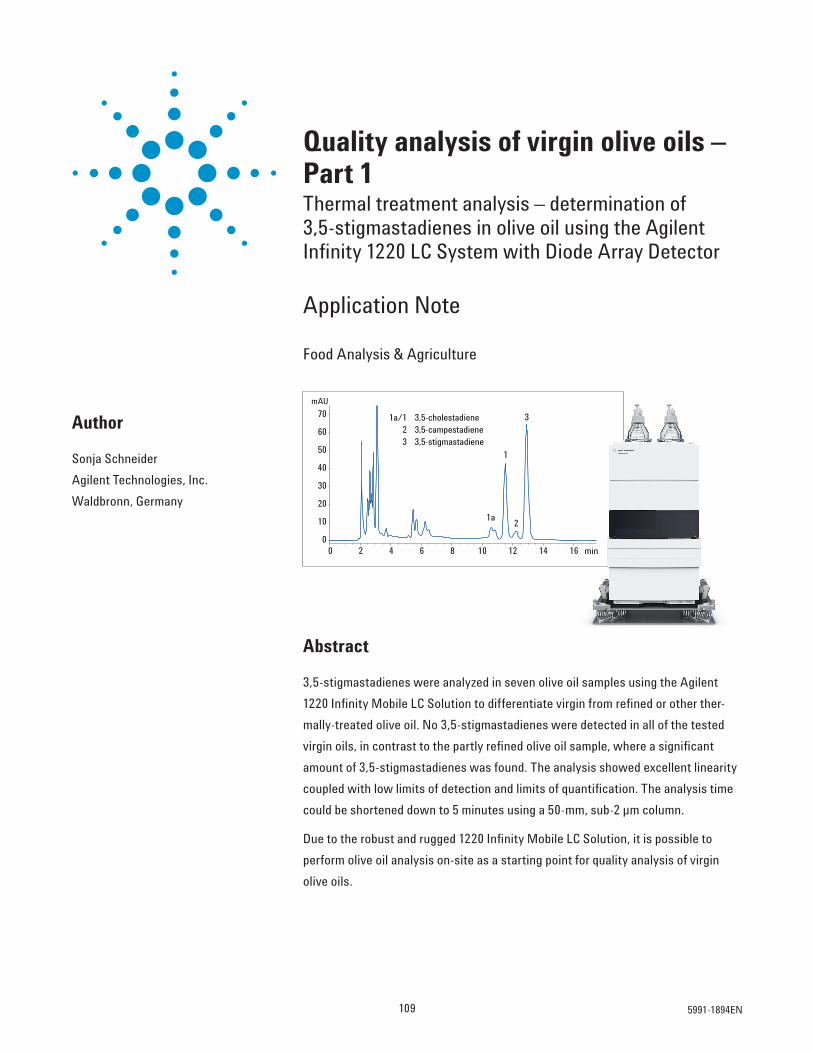
109
Quality analysis of virgin olive oils – Part 1Thermal treatment analysis – determination of
3,5-stigmastadienes in olive oil using the Agilent
Infi nity 1220 LC System with Diode Array Detector
Application Note
Food Analysis & Agriculture
Abstract
3,5-stigmastadienes were analyzed in seven olive oil samples using the Agilent
1220 Infi nity Mobile LC Solution to differentiate virgin from refi ned or other ther-
mally-treated olive oil. No 3,5-stigmastadienes were detected in all of the tested
virgin oils, in contrast to the partly refi ned olive oil sample, where a signifi cant
amount of 3,5-stigmastadienes was found. The analysis showed excellent linearity
coupled with low limits of detection and limits of quantifi cation. The analysis time
could be shortened down to 5 minutes using a 50-mm, sub-2 μm column.
Due to the robust and rugged 1220 Infi nity Mobile LC Solution, it is possible to
perform olive oil analysis on-site as a starting point for quality analysis of virgin
olive oils.
Author
Sonja Schneider
Agilent Technologies, Inc.
Waldbronn, Germany1a
1
2
3
min0 2 4 6 8 10 12 14 16
mAU
0
10
20
30
40
50
60
70 1a/1
2 3,5-campestadiene
3 3,5-stigmastadiene
3,5-cholestadiene
5991-1894EN

110
Introduction
Virgin olive oil can be created only by
mild, cold pressing of the olives (Olea europea L.). Thermal or chemical treat-
ment is not allowed in the procedure.
After pressing, the virgin olive oils are
only purifi ed and fi ltered. The name,
virgin olive oils, is only given to those
oils produced by physical techniques
such as pressing, fi ltration, decanta-
tion, and centrifugation (Regulation
(EG) Nr. 1234/2007, Appendix XVI).
Refi ning crude vegetable oils removes
impurities (for example, pigments,
odors, fl avoring, or bitter substances),
which can have negative effects on the
quality of the oils. Refi ning can improve
fl avor, stability, aroma, and color.
However, during refi ning processes,
many secondary metabolites are also
removed or chemically altered.
There are different analytical methods
to differentiate virgin from refi ned or
thermally-treated olive oils. In addition
to the determination of stigmasta-
dienes and chlorophyll degradation
products1, the analysis of the concen-
tration of polymerized triacylglycerides
in olive oil is another important factor2.
The quality of olive oils (especially
regarding nutritive value) can be
described in the amount of tocopherols,
squalen, and fatty acid composition.
Additional thermal treatment analysis
and analysis regarding nutritive
benefi ts will be addressed in upcoming
Application Notes.
Virgin olive oils, obtained by cold
pressing, do not contain measurable
amounts of 3,5-stigmastadiene, less
than 0.01 mg/kg3. Due to high tem-
peratures in the bleaching and deo-
dorizing part of the refi ning process,
3,5-stigmastadienes are formed by the
dehydration of b-sitosterol (Figure 1),
which is the most abundant steradiene
found in vegetable oils4.
The amount of stigmastadienes in
commercially refi ned vegetable oils is
dependent on the conditions applied
during the refi ning process4. The
determination of stigmastadienes in
olive oils also detects minor amounts
of refi ned oils in virgin olive oils and
is, therefore, an important quality
characteristic for virgin olive oils.
Commercially refi ned vegetable oils
normally contain a steradiene level
between 1 and 100 mg/kg. The amount
of 3,5-stigmastadiene in refi ned
olive oils ranges between 0.3 and
0.9 mg/kg4.
There are two major analytical meth-
ods for steradiene analysis in vegetable
oils. The AOCS Offi cial Method Cd26-
96 (1990) and the IUPAC method4. Both
methods describe sample preparation
with saponifi cation of the triacylg-
lycerols and extraction using silica
gel solid phase extraction (SPE) with
subsequent gas chromatographic
separation. However, the gas chroma-
tographic separation runs the risk of
interferences with other hydrocarbons.
Another method for steradiene analysis
is reversed phase HPLC according
to EN ISO 15788-3:2004 (D) and
Fiebig (1999)5, which was used in this
Application Note.
The 1220 Infi nity Mobile LC Solution is
a robust and rugged system for on-site
measurement. It is resistant against
shocks or vibrations during transpor-
tation in a mobile van. Due to the UV
detection of the stigmastadienes analy-
sis method, the 1220 Infi nity Mobile
LC Solution can be used in a mobile
laboratory as a starting point for olive
oil quality analysis before further qual-
ity analyses are applied in a stationary
lab.
b-sitosterol 3,5-stigmastadiene
– H2O
H
H
H
HO
H
H
H
H H
Figure 1Formation of b-sitosterol to 3,5-stigmastadiene by dehydration.
5991-1894EN

111
Experimental
The Agilent 1220 Infi nity Gradient LC
system with a DAD (G4294B) was
equipped with a dual gradient pump
with integrated degasser, autosampler,
column compartment, and the diode
array detector. For transportation, the
LC can be mounted on a transportation
plate, 1220 Infi nity Mobile Upgrade Kit
(G4292A).
SampleThe internal standard 3,5-cholesta-
diene was purchased from Sigma-
Aldrich, St. Louis, MO, USA and
dissolved in 50% ACN and 50% methyl
tert-butyl ether. Several olive oils
(virgin and partly refi ned olive oil)
were purchased in local stores. The
SPE extraction was carried out using
Agilent Bond Elut SI cartridges 5 g, 20
mL (p/n 14256026). Sample prepara-
tion was carried out according to EN
ISO 15788-3:2004 (D) using the internal
standard method.
SolventsAcetonitrile (ACN), petroleum
ether, and methyl tert-butyl ether
were LC grade and purchased from
Sigma-Aldrich, St. Louis, MO, USA.
ColumnsAgilent LiChrospher C18, 4 × 250 mm,
5 μm (p/n 79925OD-584), Agilent
ZORBAX Extend-C18 RRHT, 4.6 ×
50 mm 1.8 μm (p/n 727975-902)
Software• OpenLAB CDS ChemStation Edition
for LC & LC MS Systems, Rev.
C.01.04 [35]
• OpenLAB CDS 3D UV Add-On
software.
Results and Discussion
The injected 3,5-cholestadien standard
(10 μg/mL) showed the following chro-
matogram, (Figure 2) comprising two
peaks for 3,5-cholestadien standard
(1a and 1).
Long run Short run
Mobile phase: ACN/methyl tert-butyl ether (70:30)
Flow rate: 1 mL/min
Isocratic run: Stop time – 30 minutes Stop time – 5 minutes
Injection volume: 10–50 μL 20 μL
Temperature TCC: RT
DAD: 235 nm/4 nm Ref.: off
Peak width: >0.05 minutes (1.0 seconds response time) (5 Hz)
Table 1Chromatographic conditions.
Chromatographic conditions
1a
1
1a/1 3,5-cholestadiene
min0 2 4 6 8 10 12 14 16
mAU
0
5
10
15
20
25
30
35
40
45
Figure 23,5-cholestadien standard solution separated on an Agilent LiChrospher C18, 4 × 250 mm, 5 μm.
5991-1894EN
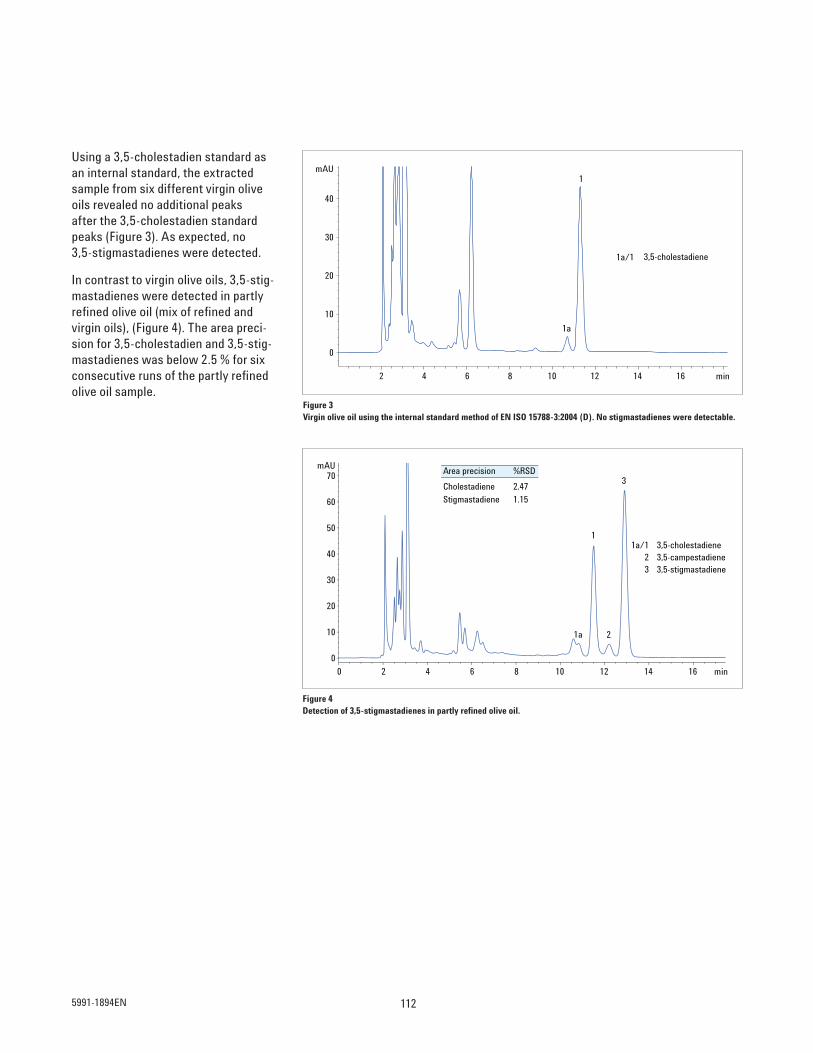
112
Using a 3,5-cholestadien standard as
an internal standard, the extracted
sample from six different virgin olive
oils revealed no additional peaks
after the 3,5-cholestadien standard
peaks (Figure 3). As expected, no
3,5-stigmastadienes were detected.
In contrast to virgin olive oils, 3,5-stig-
mastadienes were detected in partly
refi ned olive oil (mix of refi ned and
virgin oils), (Figure 4). The area preci-
sion for 3,5-cholestadien and 3,5-stig-
mastadienes was below 2.5 % for six
consecutive runs of the partly refi ned
olive oil sample. Figure 3Virgin olive oil using the internal standard method of EN ISO 15788-3:2004 (D). No stigmastadienes were detectable.
1a
1
min2 4 6 8 10 12 14 16
mAU
0
10
20
30
40
1a/1 3,5-cholestadiene
1a
1
2
3
min0 2 4 6 8 10 12 14 16
mAU
0
10
20
30
40
50
60
70
1a/1
2 3,5-campestadiene
3 3,5-stigmastadiene
3,5-cholestadiene
Area precision %RSD
Cholestadiene 2.47
Stigmastadiene 1.15
Figure 4Detection of 3,5-stigmastadienes in partly refi ned olive oil.
5991-1894EN
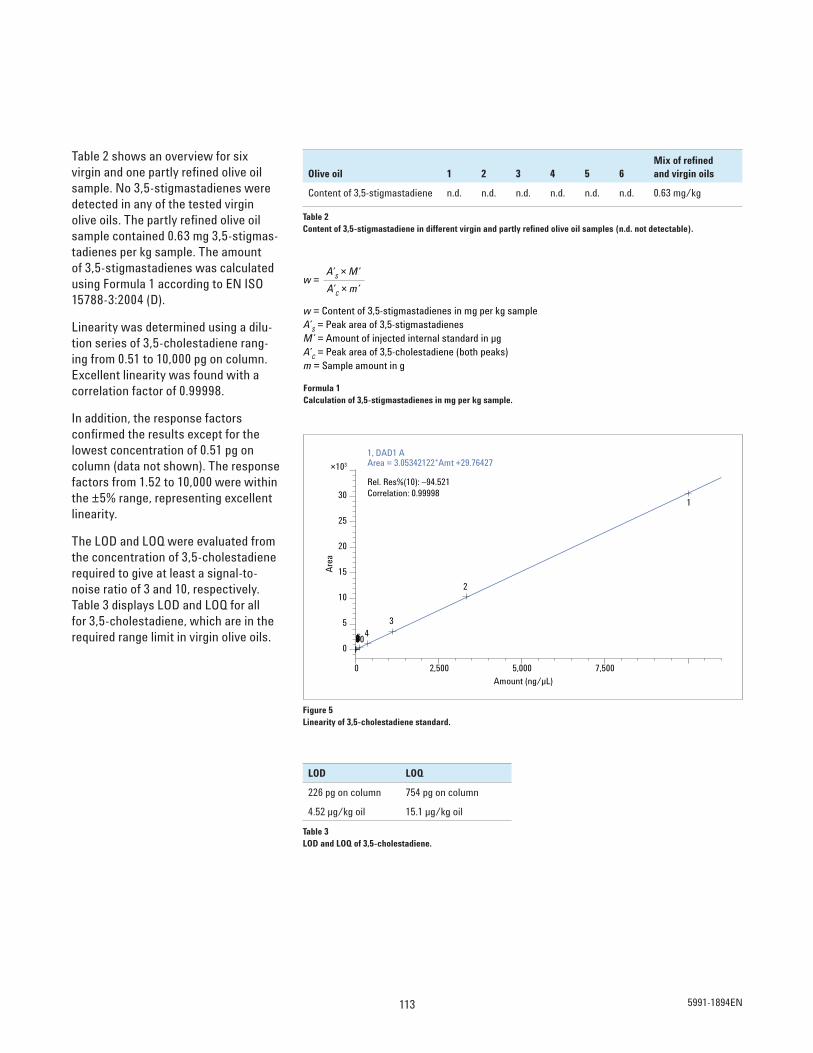
113
Table 2 shows an overview for six
virgin and one partly refi ned olive oil
sample. No 3,5-stigmastadienes were
detected in any of the tested virgin
olive oils. The partly refi ned olive oil
sample contained 0.63 mg 3,5-stigmas-
tadienes per kg sample. The amount
of 3,5-stigmastadienes was calculated
using Formula 1 according to EN ISO
15788-3:2004 (D).
Linearity was determined using a dilu-
tion series of 3,5-cholestadiene rang-
ing from 0.51 to 10,000 pg on column.
Excellent linearity was found with a
correlation factor of 0.99998.
In addition, the response factors
confi rmed the results except for the
lowest concentration of 0.51 pg on
column (data not shown). The response
factors from 1.52 to 10,000 were within
the ±5% range, representing excellent
linearity.
The LOD and LOQ were evaluated from
the concentration of 3,5-cholestadiene
required to give at least a signal-to-
noise ratio of 3 and 10, respectively.
Table 3 displays LOD and LOQ for all
for 3,5-cholestadiene, which are in the
required range limit in virgin olive oils.
w =A’
S × M’
A’C × m’
w = Content of 3,5-stigmastadienes in mg per kg sample
A’S = Peak area of 3,5-stigmastadienes
M’ = Amount of injected internal standard in μg
A’C = Peak area of 3,5-cholestadiene (both peaks)
m = Sample amount in g
Formula 1Calculation of 3,5-stigmastadienes in mg per kg sample.
Olive oil 1 2 3 4 5 6Mix of refi ned and virgin oils
Content of 3,5-stigmastadiene n.d. n.d. n.d. n.d. n.d. n.d. 0.63 mg/kg
Table 2Content of 3,5-stigmastadiene in different virgin and partly refi ned olive oil samples (n.d. not detectable).
Amount (ng/μL)
0 2,500 5,000 7,500
Are
a
0
5
10
15
20
25
30
×103
10987654
3
2
1
1, DAD1 A
Rel. Res%(10): –94.521
Correlation: 0.99998
Area = 3.05342122*Amt +29.76427
Figure 5Linearity of 3,5-cholestadiene standard.
Table 3LOD and LOQ of 3,5-cholestadiene.
LOD LOQ
226 pg on column 754 pg on column
4.52 μg/kg oil 15.1 μg/kg oil
5991-1894EN
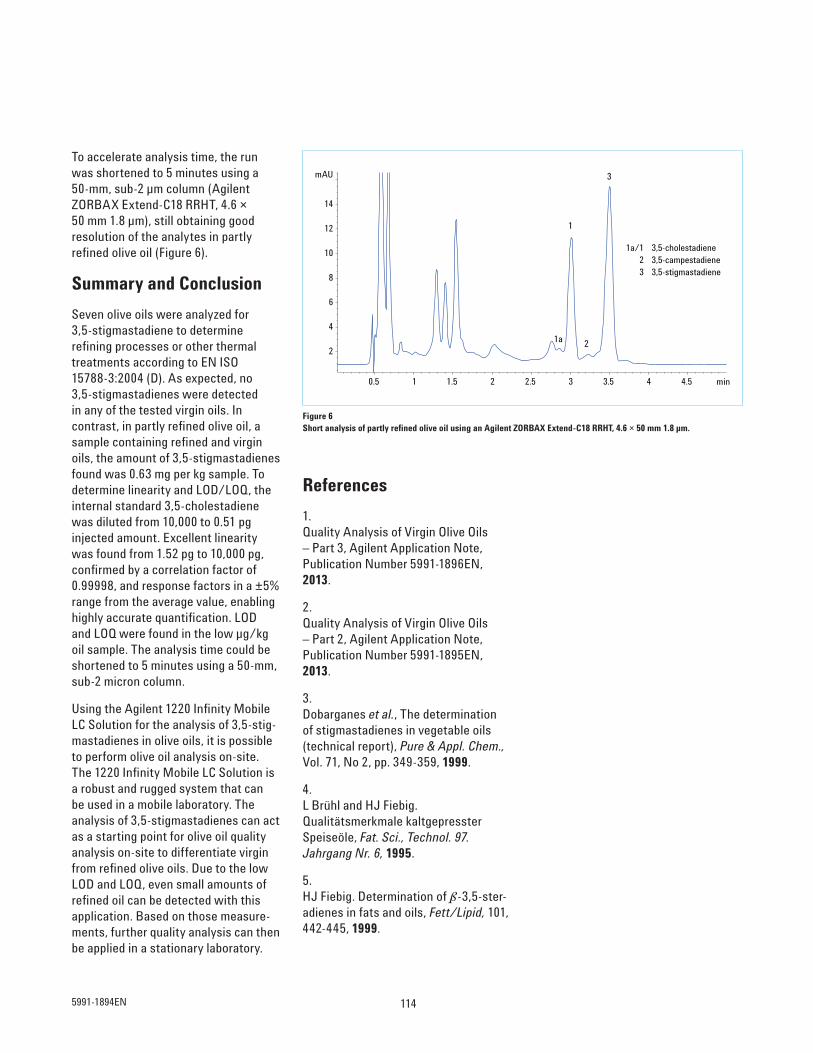
114
References
1.
Quality Analysis of Virgin Olive Oils
– Part 3, Agilent Application Note,
Publication Number 5991-1896EN,
2013.
2.
Quality Analysis of Virgin Olive Oils
– Part 2, Agilent Application Note,
Publication Number 5991-1895EN,
2013.
3.
Dobarganes et al., The determination
of stigmastadienes in vegetable oils
(technical report), Pure & Appl. Chem., Vol. 71, No 2, pp. 349-359, 1999.
4.
L Brühl and HJ Fiebig.
Qualitätsmerkmale kaltgepresster
Speiseöle, Fat. Sci., Technol. 97.
Jahrgang Nr. 6, 1995.
5.
HJ Fiebig. Determination of b-3,5-ster-
adienes in fats and oils, Fett/Lipid, 101,
442-445, 1999.
To accelerate analysis time, the run
was shortened to 5 minutes using a
50-mm, sub-2 μm column (Agilent
ZORBAX Extend-C18 RRHT, 4.6 ×
50 mm 1.8 μm), still obtaining good
resolution of the analytes in partly
refi ned olive oil (Figure 6).
Summary and Conclusion
Seven olive oils were analyzed for
3,5-stigmastadiene to determine
refi ning processes or other thermal
treatments according to EN ISO
15788-3:2004 (D). As expected, no
3,5-stigmastadienes were detected
in any of the tested virgin oils. In
contrast, in partly refi ned olive oil, a
sample containing refi ned and virgin
oils, the amount of 3,5-stigmastadienes
found was 0.63 mg per kg sample. To
determine linearity and LOD/LOQ, the
internal standard 3,5-cholestadiene
was diluted from 10,000 to 0.51 pg
injected amount. Excellent linearity
was found from 1.52 pg to 10,000 pg,
confi rmed by a correlation factor of
0.99998, and response factors in a ±5%
range from the average value, enabling
highly accurate quantifi cation. LOD
and LOQ were found in the low μg/kg
oil sample. The analysis time could be
shortened to 5 minutes using a 50-mm,
sub-2 micron column.
Using the Agilent 1220 Infi nity Mobile
LC Solution for the analysis of 3,5-stig-
mastadienes in olive oils, it is possible
to perform olive oil analysis on-site.
The 1220 Infi nity Mobile LC Solution is
a robust and rugged system that can
be used in a mobile laboratory. The
analysis of 3,5-stigmastadienes can act
as a starting point for olive oil quality
analysis on-site to differentiate virgin
from refi ned olive oils. Due to the low
LOD and LOQ, even small amounts of
refi ned oil can be detected with this
application. Based on those measure-
ments, further quality analysis can then
be applied in a stationary laboratory.
Figure 6Short analysis of partly refi ned olive oil using an Agilent ZORBAX Extend-C18 RRHT, 4.6 × 50 mm 1.8 μm.
1a
1
2
3
min0.5 1 1.5 2 2.5 3 3.5 4 4.5
mAU
2
4
6
8
10
12
14
1a/1
2 3,5-campestadiene
3 3,5-stigmastadiene
3,5-cholestadiene
5991-1894EN

115
Pharmaceutical ApplicationsThroughout all stages of the pharmaceutical value chain,
from early drug discovery to launching successful products,
there is increasing pressure to obtain reliable results
quickly. Specifically in pharmaceutical manufacturing the
QA/QC laboratory must ensure that quality standards are
constantly met to guarantee outstanding quality of raw
materials, intermediates and final products. For herbal
medicines and Traditional Chinese Medicines (TCM), it
must also be assured that regulatory standards are met.
Applications in this section show high reliability of data
of the 1220 Infinity LC.

116

117
Analysis of amoxicillin and five impuritieson the Agilent 1220 Infinity LC SystemLC analysis of impurities down to the 0.01%
level with long sub-2-μm columns, high flow
rates and back pressure greater than 400 bar
Abstract
Amoxicillin is an antibacterial drug widely used against gram-positive and gram-nega-
tive organisms. In pharmaceutical drug discovery and development, it is crucial to
analyze impurities due to their potential for toxic effects on humans. Amoxicillin and
its impurities were analyzed on the Agilent 1220 Infinity LC System on a
150 mm × 4.6 mm column with 1.8 μm particles. When using a flow rate of 2 mL/min
(at 525 bar), the analysis was completed within seven minutes. Under these condi-
tions, impurities down to a level of 0.01% could be detected. The Agilent 1220 Infinity
LC System is an ideal instrument for impurity analysis in a pharmaceutical quality
control laboratory.
Authors
A. Koeberlein
Frankenthal, Germany
A.G. Huesgen
Agilent Technologies
Waldbronn, Germany
Application Note
Drug Development and Pharmaceutical QA/QC
min0 0.5 1 1.5 2 2.5 3 3.5 4 4.5
mAU
0
2
4
6
8 Imp
uri
ty A
Imp
uri
ty C
Imp
uri
ty B
Am
ox
icil
lin
Imp
uri
ty D
Imp
urt
ity
E
5989-6093EN
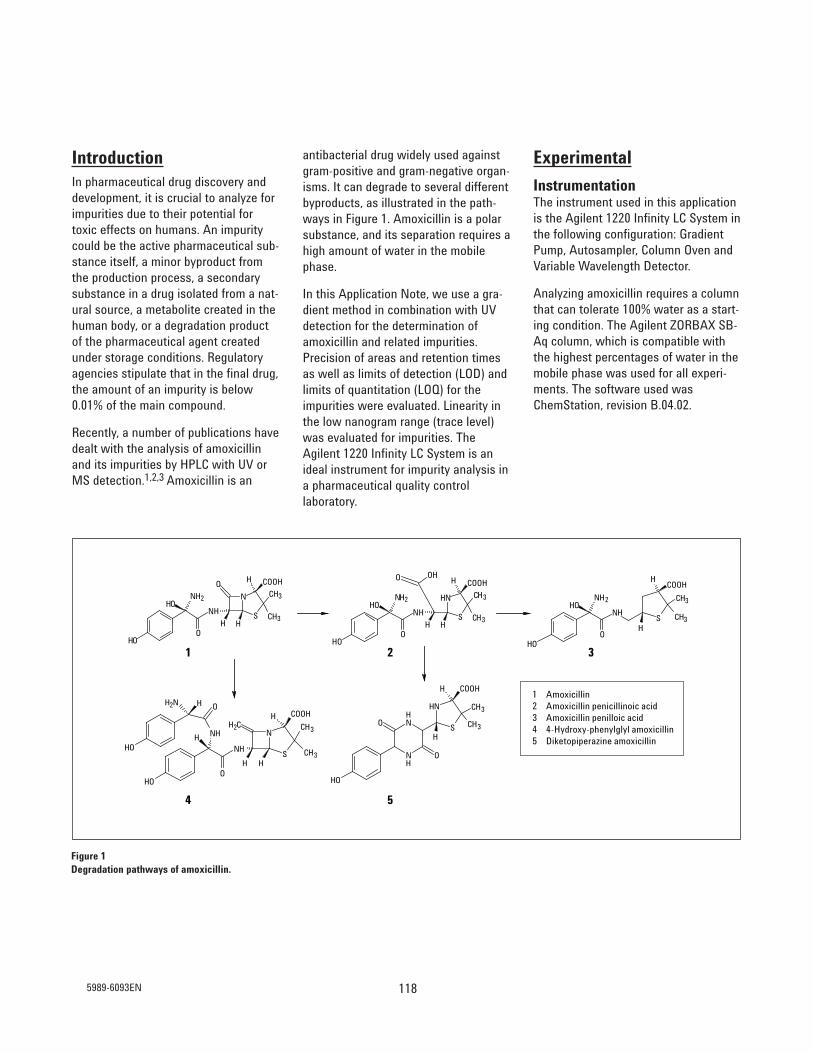
118
IntroductionIn pharmaceutical drug discovery and
development, it is crucial to analyze for
impurities due to their potential for
toxic effects on humans. An impurity
could be the active pharmaceutical sub-
stance itself, a minor byproduct from
the production process, a secondary
substance in a drug isolated from a nat-
ural source, a metabolite created in the
human body, or a degradation product
of the pharmaceutical agent created
under storage conditions. Regulatory
agencies stipulate that in the final drug,
the amount of an impurity is below
0.01% of the main compound.
Recently, a number of publications have
dealt with the analysis of amoxicillin
and its impurities by HPLC with UV or
MS detection.1,2,3 Amoxicillin is an
antibacterial drug widely used against
gram-positive and gram-negative organ-
isms. It can degrade to several different
byproducts, as illustrated in the path-
ways in Figure 1. Amoxicillin is a polar
substance, and its separation requires a
high amount of water in the mobile
phase.
In this Application Note, we use a gra-
dient method in combination with UV
detection for the determination of
amoxicillin and related impurities.
Precision of areas and retention times
as well as limits of detection (LOD) and
limits of quantitation (LOQ) for the
impurities were evaluated. Linearity in
the low nanogram range (trace level)
was evaluated for impurities. The
Agilent 1220 Infinity LC System is an
ideal instrument for impurity analysis in
a pharmaceutical quality control
laboratory.
Experimental
InstrumentationThe instrument used in this application
is the Agilent 1220 Infinity LC System in
the following configuration: Gradient
Pump, Autosampler, Column Oven and
Variable Wavelength Detector.
Analyzing amoxicillin requires a column
that can tolerate 100% water as a start-
ing condition. The Agilent ZORBAX SB-
Aq column, which is compatible with
the highest percentages of water in the
mobile phase was used for all experi-
ments. The software used was
ChemStation, revision B.04.02.
Figure 1Degradation pathways of amoxicillin.
N
S
H
CH3
CH3COOHO
H
OHO
NHOH
NH2
H
NH
S
H
CH3
CH3COOH
H
OHO
NHOH
NH2
H
OHO
OHO
NHOH
NH2
S
H COOH
CH3H
CH3
NH
NH
O
NH
SO
OH
CH3CH3
H
COOHH
NH
O
NH
N
S
CH2
CH3
CH3
COOHH
HH
OHNH2
OH
OH
H
1 Amoxicillin
2 Amoxicillin penicillinoic acid
3 Amoxicillin penilloic acid
4 4-Hydroxy-phenylglyl amoxicillin
5 Diketopiperazine amoxicillin
1 2
4 5
3
5989-6093EN
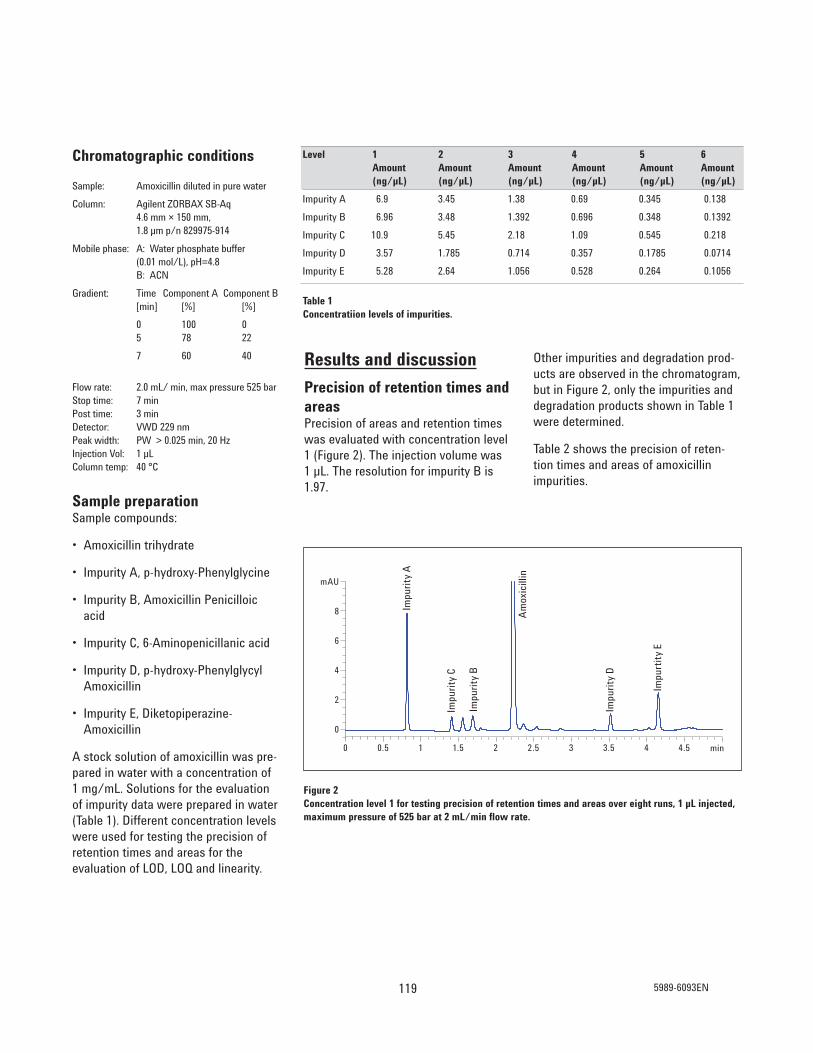
119
Results and discussion
Precision of retention times andareasPrecision of areas and retention times
was evaluated with concentration level
1 (Figure 2). The injection volume was
1 μL. The resolution for impurity B is
1.97.
Chromatographic conditions
Sample: Amoxicillin diluted in pure water
Column: Agilent ZORBAX SB-Aq
4.6 mm × 150 mm,
1.8 μm p/n 829975-914
Mobile phase: A: Water phosphate buffer
(0.01 mol/L), pH=4.8
B: ACN
Gradient: Time Component A Component B
[min] [%] [%]
0 100 0
5 78 22
7 60 40
Flow rate: 2.0 mL/ min, max pressure 525 bar
Stop time: 7 min
Post time: 3 min
Detector: VWD 229 nm
Peak width: PW > 0.025 min, 20 Hz
Injection Vol: 1 μL
Column temp: 40 °C
Sample preparationSample compounds:
• Amoxicillin trihydrate
• Impurity A, p-hydroxy-Phenylglycine
• Impurity B, Amoxicillin Penicilloic
acid
• Impurity C, 6-Aminopenicillanic acid
• Impurity D, p-hydroxy-Phenylglycyl
Amoxicillin
• Impurity E, Diketopiperazine-
Amoxicillin
A stock solution of amoxicillin was pre-
pared in water with a concentration of
1 mg/mL. Solutions for the evaluation
of impurity data were prepared in water
(Table 1). Different concentration levels
were used for testing the precision of
retention times and areas for the
evaluation of LOD, LOQ and linearity.
Table 1Concentratiion levels of impurities.
Other impurities and degradation prod-
ucts are observed in the chromatogram,
but in Figure 2, only the impurities and
degradation products shown in Table 1
were determined.
Table 2 shows the precision of reten-
tion times and areas of amoxicillin
impurities.
min0 0.5 1 1.5 2 2.5 3 3.5 4 4.5
mAU
0
2
4
6
8 Imp
uri
ty A
Imp
uri
ty C
Imp
uri
ty B
Am
ox
icil
lin
Imp
uri
ty D
Imp
urt
ity
E
Figure 2 Concentration level 1 for testing precision of retention times and areas over eight runs, 1 μL injected,maximum pressure of 525 bar at 2 mL/min flow rate.
Level 1 2 3 4 5 6Amount Amount Amount Amount Amount Amount(ng/μL) (ng/μL) (ng/μL) (ng/μL) (ng/μL) (ng/μL)
Impurity A 6.9 3.45 1.38 0.69 0.345 0.138
Impurity B 6.96 3.48 1.392 0.696 0.348 0.1392
Impurity C 10.9 5.45 2.18 1.09 0.545 0.218
Impurity D 3.57 1.785 0.714 0.357 0.1785 0.0714
Impurity E 5.28 2.64 1.056 0.528 0.264 0.1056
5989-6093EN

120
The precision of retention times is
between 0.002% and 0.24% RSD for all
peaks.
The precision of areas is between 0.5%
and 3.9% RSD for impurities with area
counts between 1.9 and 11 mAU’s.
LinearityLinearity was tested over all six con-
centration levels (Figure 3). The lineari-
ty is better than 0.999 for the factor of
correlation.
Table 2 Precision of RT and areas of amoxicillin and impurities for level 1 concentration.
Amount[n/μL]0 2 4 5
Area
0
1
2
3
4
5
654
3
2
1
Impurity E,
Area = 1.01627257*Amt +0.032396
Correlation: 0.99987
Rel. Res%(3): 1.476
Amount[n/μL]
0 2.5 5 7.5
0
2
4
6
8
10
Area
76 5
4
3
2
1
Impurity A,
Area = 1.50060346*Amt +0.0444007
Correlation: 0.99999
Rel. Res%(3): 2.2539e
Amount[n/μL]
0 5 10
Area
0
0.25
0.5
0.75
1
1.25
1.5
1.75
2
654
3
2
1
Impurity C,
Area = 0.1737413*Amt +0.0169083
Correlation: 0.99987
Rel. Res%(4): 1.994
Area
0
0.5
1
1.5
2
2.5
3
65
43
2
1
Impurity B,
Area = 0.44339034*Amt +0.1022271
Correlation: 0.99962
Rel. Res%(1): _6.1865e-1
Amount[n/μL]
0 2.5 5 7.5
Amount[n/μL]0 2 4
Area
0
0.5
1
1.5
2
54
3
2
1
Impurity D,
Area = 0.62843264*Amt +0.0186353
Correlation: 0.99998
Rel. Res%(3): _1.013
Figure 3Linearity of impurities over all six concentration levels.
Impurity A Impurity B Impurity C Amoxicillin Impurity D Impurity ERet Time Area Ret Time Area Ret Time Area Ret Time Area Ret Time Area Ret Time Area
n=8 (min) (mAU’s) (min) (mAU’s) (min) (mAU’s) (min) (mAU’s) (min) (mAU’s) (min) (mAU’s)
Mean: 0.818 10.670 1.404 1.884 1.686 2.373 2.224 60.416 3.515 2.487 4.152 5.675
S.D.: 2.890E-04 9.549E-02 3.330E-03 1.254E-02 2.560E-03 9.084E-02 2.240E-03 1.868E-01 7.860E-04 3.342E-02 4.220E-04 2.803E-02
RSD: 0.035 0.895 0.237 0.666 0.152 3.828 0.101 0.309 0.002 1.344 0.022 0.494
5989-6093EN

121
The limit of detection for the impurities
was between 0.02 ng and 0.17 ng
injected amount with a signal-to-noise
ratio of 2 (Figure 4 red trace). Level 6
was used to determine the minimum
detectable level. The limit of quantita-
tion was 20 times higher, close to con-
centration level 4, (Figure 5 blue trace).
In Table 3, the results for LOD and LOQ
are combined.
Concentration level 4 (LOQ blue) and 6 (LOD red)
min0 0.5 1 1.5 2 2.5 3 3.5 4
mAU
_0.2
0
0.2
0.4
0.6
0.8
Imp
uri
ty C
Imp
uri
ty B
Imp
uri
ty D
Imp
uri
ty E
Imp
uri
ty A
Noise range
Figure 4 Concentration level 4 (blue trace) and level 6 (red trace), 1 μL injected.
Concentration LOQ ConcentrationLOD level 6 (times 20 LOD) level 4amount (ng/μL) amount (ng/μL) amount (ng/μL) amount (ng/μL)
Impurity A 0.02 0.138 0.4 0.69
Impurity C 0.17 0.1392 3.4 0.696
Impurity B 0.06 0.218 1.2 1.09
Impurity D 0.075 0.0714 1.5 0.357
Impurity E 0.047 0.1056 0.94 0.528
Table 3Results for LOD and LOQ.
5989-6093EN

ConclusionAmoxicillin and its impurities were
analyzed on the Agilent 1220 Infinity LC
System using a 150 mm × 4.6 mm col-
umn with 1.8 μm particles. At a flow
rate of 2 mL/min (at 525 bar) the analy-
sis was completed within seven min-
utes. Under these conditions,
impurities down to a level of 0.01%
could be detected. This shows that the
Agilent 1220 Infinity LC System is an
ideal instrument for impurity analysis in
a pharmaceutical quality control
laboratory.
References1. Ch.B.V.N.Raju, et al., “RP-HPLC
method for analysis of related sub-
stances in Amoxicllin Drug sub-
stance,” Acta Chromatographia 21, 1,
57–70, 2009
2. Edgar Naegele et al., “Structure eluci-
dation of degradation products of the
antibiotic drug Amoxicillin,” Agilent
Technologies publication 5989-
2470EN, 2005
3. Edgar Naegele, “Statistic evaluation
of mass accuracy measurements by
ESI TOF with a sample of degradation
products from the antibiotic drug
Amoxicillin,” Agilent Technologies
publication 5989-3561EN, 2005
122
Analysis of the amoxicillin sampleFigure 5 shows the chromatogram of
the amoxicillin sample. The sample was
dissolved in water to a final concentra-
tion of 1 mg/mL.
The results are presented in Table 4,
showing that impurities in the 0.01%
range can be detected. Amoxicillin is
present at a percentage level of 96%.
The percentage levels for the impurities
are calculated in relation to this level.
Imp
uri
ty A
Imp
uri
ty C
Imp
uri
ty B
Am
ox
icil
lin
Imp
uri
ty D
Imp
urt
ity
E
Sample amount: 1 mg/mL test sample
min0 0.5 1 1.5 2 2.5 3 3.5 4 4.5
mAU
0
2
4
6
8
Figure 5Amoxicillin sample, 1 μL injected.
Area (mAU’s) ng/μL Percentage
Impurity A 18.35269 12.20062 0.5
Impurity C 0.340461 1.86227 0.01
Impurity B 3.96829 8.71932 0.11
Impurity D 8.67657 13.77702 0.25
Impurity E 0.719148 0.675756 0.02
Amoxicillin 3360.63696 96
Table 4Results of real life sample.
5989-6093EN

Analysis of Paracetamol and Aspirin inpain relievers on the Agilent 1220 InfinityIsocratic LC System with manual injector
Excellent chromatographic results at lowest costs
Abstract
The Agilent 1220 Infinity LC System is an integrated LC system consisting of an iso-
cratic pump, manual injector and variable wavelength detector. This Application Note
describes the analysis of paracetamol and aspirin to demonstrate that typical accep-
tance criteria for a USP method can be fulfilled. These criteria are:
• Precision of areas < 2% RSD
• Precision of retention times < 0.5% RSD
• Resolution > 1.4
• Tailing factor < 1.2
The data from this analysis show that the Agilent 1220 Infinity LC System provides
excellent performance at low costs.
Author
A.G.Huesgen
Agilent Technologies
Waldbronn, Germany
Application Note
Pharmaceuticals
N
NN
N
O
CH3
CH3OCH3
O
CH3
O OH
O
O CH3
Caffeine
Acetylsalicylic acid
Paracetamol/Acetaminophen
HN
HO
123 5989-6268EN

124
IntroductionThe Agilent 1220 Infinity LC System is a
liquid chromatography (LC) system for
routine standard analysis. Due to its
extraordinary pressure range up to
600 bar, the system can perform UHPLC
applications. It is an easy to use, inte-
grated LC system consisting of an iso-
cratic pump, manual injector and vari-
able wavelength detector (VWD).
The isocratic pump has a flow range of
0.2 to 10 mL/min (5 mL at 600 bar,
10 mL at 200 bar) and an integrated
degasser. The VWD detector features
80 Hz data acquisition rate and a wave-
length range from 190 nm to 600 nm.
The system can be upgraded according
to growing needs with:• Oven upgrade kit – adds a click-in
oven to your Agilent 1220 Infinity LCSystem
• Isocratic to gradient pump upgradekit – adds gradient capabilities toyour isocratic Agilent 1220 Infinity LCSystem
• Manual injector to autosamplerupgrade kit – exchanges your manualinjector with an autosampler
Paracetamol and aspirin were chosen
as examples in this analysis to demon-
strate that typical acceptance criteria
for a USP method can be fulfilled
(Fgure 1). The isocratic USP method
with UV detection according to USP/NF
23 was applied for analysis.
ExperimentalInstrumentationFor the analysis of paracetamol, aspirin
and caffeine, an Agilent 1220 Infinity LC
System with the following configuration
was used:• Agilent 1220 Infinity LC System
(G4286B) consisting of an isocraticpump, manual injector and VWD
• 20 μL loop (p/n 0100-1922) installed
The original method was changed
according to the typically allowed
changes for chromatographic parame-
ters (Table 1).
Figure 1Structures of acetaminophen (paracetamol), aspirin and caffeine.
N
NN
N
O
CH3
CH3OCH3
O
CH3
O OH
O
O CH3
Caffeine
Acetylsalicylic acid
Paracetamol/Acetaminophen
HN
HO
Chromatographic parameter Typically allowed changes
Mobile phase pH ± 0.2 units
Concentration of salts in buffers ± 10%
Ratio of mobile phase percentages ± 30% of the minor component, or 0.2% absolute of that
component, whichever is greater. However a change in
any component cannot exeed ± 10% absolute, nor can the
final concentration be reduced to zero
Wavelength of UV detector No change permitted
Column length ± 70%
Internal diameter of column ± 50%
Particle size of column packing material Can be reduced by 50%
Flow rate ± 50%
Injection volume Increased up to twice the volume specified,
provided no adverse effects.
Must be within stated linearity range of the method
Column compartment temperature ± 10°C
Table 1Typically accepted changes for USP methods.
Chromatographic conditions according to USP method
Column: Agilent ZORBAX Eclipse Plus C18 Column, 3 mm × 100 mm, 3.5 μm (internal diameter
35% less than original method, particle size 30% less than original method)
Mobile phase: Water/methanol/acetic acid = 69/28/3
Pump settings: No gradient (in accordance with EP regulations)
Stop time: 6 min
Flow rate: 1 mL/min, isocratic (50% less than original method)
Injection volume: 20 μL
Column temp: Ambient (Laboratory temperature between 24 °C and 25 °C)
Detector: Agilent 1220 Infinity LC System with 10 mm path length flow cell
Peak width 0.05 min (10 Hz)
Signal 275 nm
5989-6268EN

Stock solution in mobile phase 1:5 diluted in water
Acetaminophen 5.5 mg/10 mL 1.1 μg/10 μL
Caffeine 1.3 mg/10 mL 0.26 μg/10 μL
Aspirin 3.9 mg/10 mL 0.78 μg/10 μL
Benzoic acid 4 mg/10 mL 0.8 μg/10 μL
Salicylic acid 4 mg/10 mL 0.8 μg/10 μL
125
Preparation of samplesThe reference solution was prepared
according to the concentrations listed
in Table 2.
Results and discussionSystem suitability testing was per-
formed to verify that the LC system ful-
fills the acceptance criteria typical for
USP methods. The following accep-
tance criteria had to be fulfilled:
• Precision of areas must be < 2% RSD
• Precision of retention times must be
< 0.5% RSD
• Resolution must be > 1.4 for benzoic
acid
• Tailing factor < 1.2
An overlay of six consecutive chro-
matograms is shown in Figure 2.
Table 3 combines the results to show
that the acceptance criteria are ful-
filled.
ConclusionThe Agilent 1220 Infinity LC system is a
liquid chromatography (LC) system for
routine standard analysis. Due to its
extraordinary pressure range up to
600 bar, the system can also perform
UHPLC applications. It is an integrated
LC system consisting of an isocratic
pump, manual injector and variable
wavelength detector (VWD). The appli-
cation example of the analysis of pain
relievers shows that typical USP accep-
tance criteria are fulfilled on the Agilent
1220 Infinity LC system, showing excel-
lent performance at lowest costs.
Table 2Sample concentration.
min0 1 2 3 4 5
mAU
0
100
200
300
400
Figure 2 Overlay of chromatograms, six consecutive runs injected with manual loop injector.
Table 3Results for retention time and area precision, resolution data and peak tailing.
Retention time (min) ResolutionCompound Average RSD RT (%) RSD area (%) (hH) Peak tailing
Acetaminophen 0.784 0.208 0.371 1.179
Caffeine 1.341 0.209 0.341 8.117 1.105
Aspirin 3.756 0.147 0.100 19.557 1.041
Benzoic acid 4.730 0.129 0.195 4.600 0.800
Salicylic acid 4.991 0.117 0.191 1.139 1.005
5989-6268EN

126

Abstract
The Agilent 1120 Compact LC is the system of choice for conventional, analytical
scale liquid chromatography. It is an intergrated LC designed for ease of use, per-
formance and reliability. It is ideally suited for the routine analysis of Traditional
Chinese Medicines (TCMs) on account of its capability to achieve highly precise
retention times and peak areas, and low detection limits for the analyzed com-
pounds. This Application Note shows the chromatograms obtained with optimizd
methods for the most well-known TCMs ginseng and American ginseng, which
show different peak profiles and different concentrations of certain saponins.
Zhixiu XuApplication Note
Analysis of ginseng and American ginsengusing the Agilent 1120 Compact LC
Rg1
Re
Rb1
5989-7458EN127

Introduction
Traditional Chinese Medicines (TCMs)
have a long history of use and their
therapeutic effects are well known in
China and other countries. Ginseng,
perhaps the most well-known TCM,
has long been used as a tonic, anti-
fatigue, sedative and anti-gastric ulcer
drug. It is also widely used in different
TCM preparations. Another well-
known TCM, American ginseng, has
similar therapeutic effects as ginseng
but there are also some differences
because of the different saponin con-
tents.
According to the method in the phar-
macopeia of the People's Republic of
China1, ginseng must be analyzed by
HPLC to determine the ginsenosides
Rg1, Re and Rb1. Similar requirements
exist for the determination of these
ginsenosides in American ginseng.
These requirements make the determi-
nation of the ginsenosides Rg1, Re
and Rb1 in ginseng and American gin-
seng important for quality control of
TCM raw materials and final prepara-
tions.
In this study an HPLC analysis method
was developed using the Agilent 1120
Compact LC for the determiniation of
ginsenosides in ginseng and American
ginseng.
Experimental
Equipment• Agilent 1120 Compact LC comprising
gradient pump with integrated
degasser, autosampler with vial tray,
column oven and variable wave-
length detector, see figure 1
• Agilent HC-C18(2), high carbon load,
150 x 4.6 mm, 5 μm particle size col-
umn
• Agilent EZChrom Elite Compact soft-
ware
Samples and sample preparationGinseng and American ginseng were
purchased from a local TCM store and
samples prepared as follows. 1 g of
powder was weighed and dissolved in
50 mL of water saturated n-butanol.
The solution was treated ultrasonically
for 30 minutes and centrifuged for 5
minutes at 300 rpm. The solvent was
evaporated and the residue dissolved
in 5 mL methanol. The final solution
was filtered through a 0.20 μm mem-
brane before injection.
Chromatographic conditions• Mobile phase:
A: Water, B: ACN
• Gradient: 0 min, 19 %B;
35 min, 19 %B; 55 min, 29 %B;
70 min, 29 %B; 100 min, 40 %B
• Flow rate: 1.0 mL/min
• Injection volume: 10 μL
• Column temperature: 40 °C
• Detection wavelength: 203 nm
Results and discussion
The chromatogram of the ginseng sep-
aration is shown in figure 2. The
method used to obtain this chro-
matogram was the same as the
method specified in the pharmacopeia
of People’s Republic of China. The
chromatogram shows excellent sepa-
ration of all the target compounds. The
ginsenosides Rg1 and Re are well sep-
arated, demonstrating that the Agilent
1120 Compact LC is well suited for this
analysis.
The chromatogram of the American
ginseng separation is shown in figure
3. The chromatogram shows excellent
separation of the target ginsenosides.
From the chromatograms of ginseng
and American ginseng, it can be seen
that the profiles of the two samples as
well as the concentrations of the gin-
senosides are different. For complex
TCM samples such as ginseng and
American ginseng, the Agilent 1120
Compact LC is a reliable tool to obtain
good results in routine analysis work.
Figure 1Agilent 1120 Compact LC
1285989-7458EN

Conclusion
Although Traditional Chinese
Medicines are complex natural prod-
ucts, this study demonstrated that the
Agilent 1120 Compact LC
was capable of analyzing the active
components and achieving excellent
separation performance. The results
proved that the Agilent 1120 Compact
LC is ideal for routine quality control
testing of complex TCM samples.
Reference
1.
Pharmacopeia of the People's Republic
of China, Volume I, 2005. Figure 2Chromatogram of ginseng analyzed with the CHP method on an Agilent 1120 Compact LC system.
10 20 30 40 50 60 70 80 90 100
0
10
20
30
40
50
60
70
Rg1
ReRb1
Time [min]
Ab
sorb
an
ce [
mA
U]
Figure 3Chromatogram of American ginseng analyzed on an Agilent 1120 Compact LC system.
Rg1
Re
Rb1
Time [min]
0 20 40 60 80 100 120
Ab
sorb
an
ce
[m
AU
]
0
50
100
150
200
250
300
5989-7458EN129

130

Abstract
The Agilent 1120 Compact LC is the system of choice for conventional, analytical
scale liquid chromatography. It is an intergrated LC designed for ease of use,
performance and reliability. It is ideally suited for the analysis of pharmaceuticals
on account of its capability to achieve highly precise retention times and peak
areas, and low detection limits for the analyzed compounds. In this Application
Note, data is presented that demonstrates:
• Excellent retention time precision < 0.07 % RSD
• Excellent area precision < 1.0 % RSD for baseline separated peaks
• Excellent linearity with coefficient of correlation > 0.9999
• Limit of detection (LOD) 13 – 298 pg for all compounds analyzed
Angelika Gratzfeld-Huesgen
Patrik Hoerth
Daniel Thielsch
Application Note
Development and validation of a method for simultaneous determination of paracetamol, diclofenac and ibuprofenusing the Agilent 1120 Compact LC
5989-7457EN131

Figure 1Agilent 1120 Compact LC
Introduction
For the routine analysis of pharmaceu-
ticals compounds and impurities in
QA/QC it is important to use LC sys-
tems that are highly accurate, precise
and robust. The Agilent 1120 Compact
LC is based on a proven robust design
and delivers the required quality of
data. This makes it ideally suited for
routine QA/QC analysis of pharmaceu-
tical compounds. In this study, the pre-
cision, linearity and limits of detection
(LOD) of several pharmaceutical com-
pounds were evalutated.
Experimental
Equipment• Agilent 1120 Compact LC comprising
gradient pump with integrated
degasser, autosampler with vial tray,
column oven and variable wave-
length detector, see figure 1
• Agilent TC-C18(2), high carbon load,
150 x 4.6 mm, 5 μm particle size col-
umn
• Agilent EZChrom Elite Compact soft-
ware
Chromatographic conditions• Mobile phase:
A: Water + 0.05 % TFA
B: ACN + 0.045 % TFA
• Gradient:
0 min, 25 %B;
1 min, 25 %B;
4 min, 60 %B;
7 min, 70 %B
• Flow rate: 1.5 mL/min
• Injection volume: 3 μL
• Column temperature: 40 °C
• Detection wavelength: 230 nm
Peakwidth: > 0.05 min
• Run time: 8 min
• Post time: 2 min
Results and discussion
Paracetamol, ibuprofen and diclofenac
were chosen as example compounds
for the evaluation of precision, linearity
and LOD. Benzoic acid was used as
internal standard (ISTD). Table 1 lists
the concentration levels used.
The chromatographic method was set
up so that all compounds were base-
line separated. Paracetamol posed a
particular problem because it elutes
from the C-18 phase column with
almost no retention. The start condi-
tions were therefore selected so that
paracetamol showed at least some
retention on the selected column.
Further, the objective of method devel-
opment was to keep the total analysis
Time [min]
0 1 2 3 4 5 6 7 8
Ab
sorb
an
ce [
mA
U]
0
20
40
60
80
Ibuprofen
Paracetamol
Diclofenac
Benzoic acid (ISTD)
Figure 2Analysis of pharmaceutical drugs, showing excellent resolution.
Compound Ibuprofen Benzoic acid Paracetamol Diclofenacng/3 μL ng/3 μL ng/3 μL ng/3 μL
Level 1 38.15 71.25 56.7 25.2
Level 2 19.075 36.625 28.35 12.6
Level 3 9.538 18.313 14.175 6.3
Level 4 4.769 9.156 7.088 3.15
Level 5 2.384 4.578 3.544 1.575
Level 6 1.192 2.289 1.772 0.788
Level 7 0.596 1.145 0.886 0.394
Table 1Drug compounds and concentration levels.
1325989-7457EN

time as short as possible. The run and
equilibration time could be limited to
10 minutes (figure 2). The mobile
phase contained trifluoric acetic acid
as modifier. This influenced positively
both retention and peak shape. The
first gradient slope at 4 minutes was
fast enough to keep the time between
the first and second peaks as short as
possible.
PrecisionAnalyzing drugs with UV detection
means that precision of retention
times is of utmost importance. In addi-
tion, precision of peak areas must be
less than 1 % in the low ng range to be
compliant with official regulations. The
precision of retention times and areas
was determined using level 2 concen-
tration. The results are shown in figure
3 and table 2. In figure 3 ten consecu-
tive runs were overlaid.
Limit of detectionThe limit of detection was calculated
based on the chromatogram obtained
for concentration level 7, see table 3.
The limit of detection was in the low 3-
digit pg range for ibuprofen and
diclofenac, and in the low 2-digit pg
range for paracetamol and benzoic
acid.
LinearityLinearity was tested using concentra-
tion levels 1 through 7. Figure 4 shows
the linearity of paracetamol as an
example. The results showed excellent
linearity over the entire concentration
range. Table 4 shows the correlation
coefficients for all compounds.
SummaryThe Agilent 1120 Compact LC was
used for the analysis of pharmaceuti-
cal compounds. The instrument was
able to analyze these compounds with
high precision for retention times and
areas. The precision for retention
Ibuprofen
Paracetamol
Benzoic acid (ISTD)
Time [min]0 1 2 3 4 5 6 7 8
Ab
sorb
an
ce [
mA
U]
0
10
20
30
40
Diclofenac
Figure 3Precision of retention times and areas, showing overlay of 10 consecutive runs.
% RSD % RSDRet. Times Areas
Paracetamol 0.060 0.297
Benzoic acid 0.022 0.179
Diclofenac 0.020 0.807
Ibuprofen 0.016 0.962
Table 2Precision of retention times and areas for concentration level 2.
Injected amount Calculated(3 μL injection) LOD [ng]
Paracetamol 0.394 0.013
Benzoic acid 1.145 0.019
Diclofenac 0.394 0.197
Ibuprofen 0.596 0.298
Table 3Limits of detection.
Figure 4Linearity for paracetamol from 0.886 to 56.7ng per 3 μL injection.
0
400,000
800,000
1,200,000
1,600,000
0 20 40 60ng
Areas
Correlation coefficient
Paracetamol 0.999966
Benzoic acid 0.999954
Diclofenac 0.999975
Ibuprofen 0.999910
Table 4Correlation coefficients.
5989-7457EN133

times is less than 0.07 % RSD and less
than 1.0 % RSD for areas of baseline
separated peaks. The limits of detec-
tion were between 13 and 298 pg. The
results showed excellent linearity over
the tested concentration range and the
correlation coefficient was between
0.999910 and 0.999975.
1345989-7457EN

In-process control for Aripiprazole manufacturing with the Agilent 1120Compact LC and ZORBAX C-18 columns
Abstract
The Agilent 1120 Compact LC is the system of choice for conventional, analytical-
scale liquid chromatography. It is an integrated LC designed for ease of use,
performance, and reliability. It is well-suited for in-process control during drug
manufacturing, due to the highly precise retention times and peak areas.
This Application Note shows:
• Excellent retention time precision, with a relative standard deviation
(RSD) < 0.07 %.
• Excellent area precision, with RSD < 0.25 % for baseline-separated peaks.
Siji Joseph,
Patric HörthApplication Note
0 2 4 6 8
0
20
40
60
80
mA
U
Column: ZORBAX Eclipse XDB-C18,
5 μm, 150 x 4.6 mm
Time [min]
5989-8330EN135

Introduction
During manufacturing of Active
Pharmaceutical Ingredients (APIs) it is
mandatory to monitor the levels of
precursors or by-products that are
formed during the chemical reactions.
To ensure these criteria, manufactur-
ing chemists have to carry out several
analyses called in-process analyses.
HPLC is commonly used as a tech-
nique, primarily because it separates
individual analytes and also helps to
perform qualitative and quantitative
analysis. The developed chromato-
graphic methods must be robust and
reliable over a number of years.
The purpose of the present study was
to develop an HPLC method for the
analysis of Aripiprazole and its precur-
sors with desired specificity and sensi-
tivity. This Application Note describes
the advantages obtained from in-
process control of Aripiprazole by
reversed-phase high-performance liq-
uid chromatography (RP-HPLC). The
power to carry out thorough in-
process control of samples taken dur-
ing the course of the entire process is
highlighted.
Experimental
EquipmentThe Agilent 1120 Compact LC system
included:
• A gradient pump with low-pressure
mixing
• An autosampler with vial tray
• A column compartment for a column
up to 250 mm in length
• A variable wavelength detector
(VWD)
A ZORBAX Eclipse XDB C18,
5 μm, 150 x 4.6 mm, was used.
The instrument was controlled by
Agilent EZChrome Elite Compact
Compliance software.
Synthetic reactionThe antipsychotic drug Aripiprazole
and its two starting materials were
used for the study.
1-(2,3-Dichlorophenyl)piperazine
hydrochloride (starting material-1) and
7-(4-bromobutoxy)-3,4-dihydrocar-
bostyril (starting material-2) are the
two starting materials for the synthe-
sis of Aripiprazole. The synthetic
scheme is shown in figure 2.
SamplesIn order to simulate in-process control
samples, we prepared samples with
varying concentrations of starting
materials 1, 2 and the product
Aripiprazole. During the reaction, the
concentrations of the starting materi-
als decrease, while the concentration
of the product increases.
Chromatographic parametersExperiments were performed to estab-
lish the best chromatographic condi-
tions for the analysis of Aripiprazole
and related compounds. Based on
Figure 1Agilent 1120 Compact LC.
Figure 2The synthesis of Aripiprazole from starting materials 1 and 2.
mA
U
100
200
300
400
Sorbic
acid
Methylparaben
12
3 4
56 7
Benzoic
acid
Cosmetics:face conditioner
Glace fruit
Standard
8 9
1365989-8330EN

these experiments, the following
conditions were chosen:
• Sample: 1-(2,3-dichlorophenyl)pi-per-
azine hydrochloride, 7-(4-bro-mobu-
toxy)-3,4-dihydrocarbostyril and
Aripiprazole
• Column: ZORBAX Eclipse XDB C18,
5 μm, 150 x 4.6 mm
• Mobile phase:
A = water + 0.2 % trifluoroacetic acid
(TFA),
B = acetonitrile + 0.16 % TFA
(The TFA improves retention and
peak shape.)
• Flow rate: 1.0 mL/min
• Gradient: at 0 min 30 %B, at
7 min 70 %B, then hold the ratio for
two more minutes
• Injection volume: 5 μL
• Autosampler programmed with a
wash vial (acetonitrile) for rinsing
exterior of the needle
• Run time: 9 min
• Post time: 5 min
• VWD: 254 nm,
peak width (PW) > 0.05 min
Sequence tableTable 1 shows the sequence table that
was created. The concentrations of the
three compounds were varied from vial
2 to vial 9, and each sample was
injected three times so that an RSD
could be calculated.
Results and discussion
The chromatographic method was set
up such that all compounds were
baseline-separated. Figure 3 shows the
separation of starting materials 1 and
2 and the product Aripiprazole. The
separation time was nine minutes; the
total run time (including equilibration)
could be limited to 14 minutes, includ-
ing re-equilibration time.
The chromatographic overlay of the
reaction monitoring analysis is dis-
played in figure 4.
Figure 3Chromatogram of Aripiprazole and starting materials 1 and 2, with retention times.
0 2 4 6 8
0
20
40
60
80
Time [min]
mA
U
Sta
rtin
g m
ate
ria
l-1
Ari
pip
razo
le
Sta
rtin
g m
ate
ria
l-2
Figure 4Chromatographic overlay of the in-process control samples, (x-axis offset).
2 4 6 8 100
100
200
300
400
500
600
mA
U
Time [min]
In-process
control -1
In-process
control - 8
Line Location Sample name # Injections Injection volume (μL)
1 Vial 1 Blank 2 5
2 Vial 2 In-process control-1 3 5
3 Vial 3 In-process control-2 3 5
4 Vial 4 In-process control-3 3 5
5 Vial 5 In-process control-4 3 5
6 Vial 6 In-process control-5 3 5
7 Vial 7 In-process control-6 3 5
8 Vial 8 In-process control-7 3 5
9 Vial 9 In-process control-8 3 5
Table 1Sequence table for the analysis.
5989-8330EN137

Figure 5 represents the overlay of the
three injections of the last in-process
control sample of this series, plus a
blank run. The in-process control sam-
ple contained Aripiprazole and starting
material-1 at a level of 0.025 % of the
main compound. The zoom-in of the
starting material area is shown.
The assay precision (RSD) was
assessed by expressing the standard
deviation of repeated measurements
as a percentage of the mean value.
Intra-day precision was estimated from
three replicates at eight levels of a
standard mixture. The retention time
and area precisions of three consecu-
tive injections of each in-process
check sample are summarized in table
2. The RSD for peak area was less
than 0.25 %.
Conclusion
An HPLC method was developed for
the simultaneous determination of
Aripiprazole and potential precursor
products. Furthermore, the chromato-
graphic method was demonstrated to
be useful for the in-process control of
Aripiprazole synthesis. The Agilent
1120 Compact LC system is an excel-
lent choice for in-process control, as it
provides reproducible results with high
precision for retention times and
areas. For our example, the precision
for retention times was < 0.06 % RSD
and for areas of baseline-separated
peaks was < 0.25 % RSD.
Figure 5Zoomed chromatogram of 0.025 % starting material-1 with respect to main compound.
0 2 4 6 8
mA
U
0
1000
2000
3000
4000
Sta
rtin
g m
ate
ria
l-1
Ari
pip
razo
le
Sta
rtin
g m
ate
ria
l-2
3.5 4.0 4.5 5.0 5.5 6.0 6.5
mA
U
0
2
4
6
8
Time [min]
Time [min]
RSD of retention time RSD of area Sample Starting Aripiprazole Starting Starting Aripiprazole Starting
material 1 material 2 material 1 material 2
1 0.021 % No peak 0.017 % 0.083 % No peak 0.073 %
2 0.027 % 0.018 % 0.014 % 0.126 % 0.208 % 0.183 %
3 0.047 % 0.018 % 0.009 % 0.025 % 0.248 % 0.055 %
4 0.009 % 0.018 % 0.009 % 0.114 % 0.226 % 0.136 %
5 0.027 % 0.009 % 0.009 % 0.055 % 0.024 % 0.137 %
6 0.027 % 0.009 % 0.009 % 0.099 % 0.069 % 0.140 %
7 0.027 % 0.018 % 0.009 % 0.134 % 0.246 % 0.103 %
8 0.056 % 0.009 % 0.009 % 0.241 % 0.191 % 0.230 %
Table 2Summary of the in-process analysis results.
1385989-8330EN
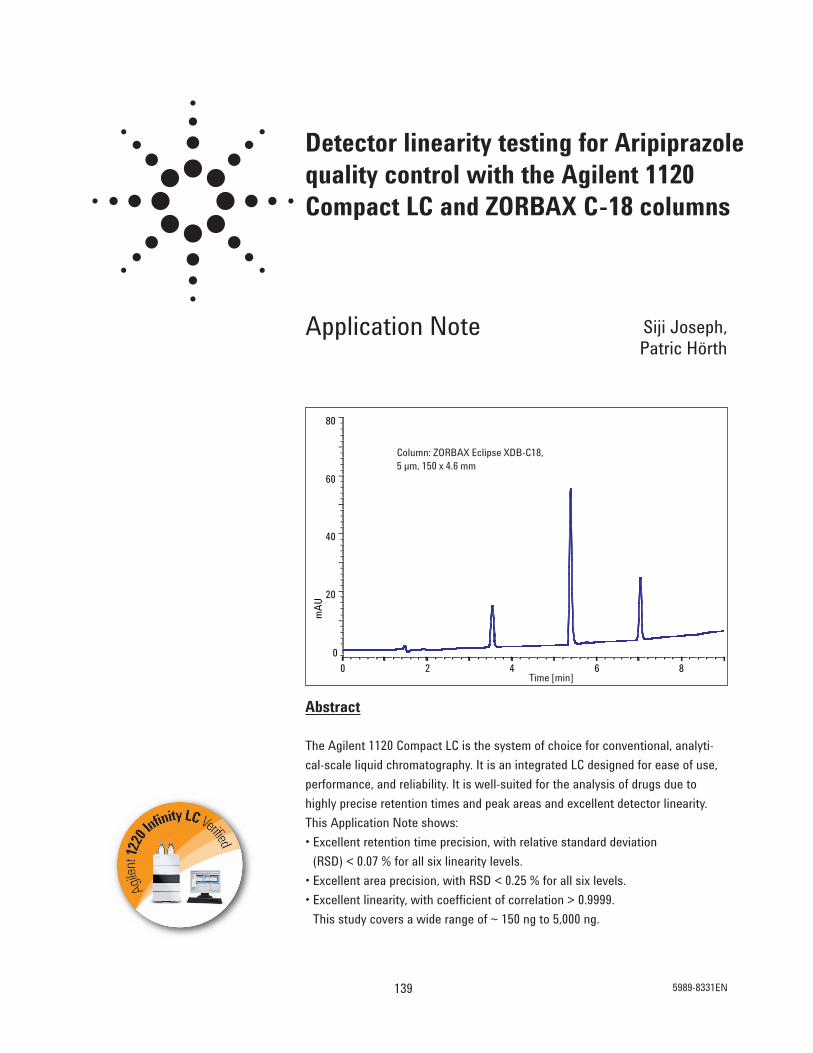
Detector linearity testing for Aripiprazolequality control with the Agilent 1120Compact LC and ZORBAX C-18 columns
Abstract
The Agilent 1120 Compact LC is the system of choice for conventional, analyti-
cal-scale liquid chromatography. It is an integrated LC designed for ease of use,
performance, and reliability. It is well-suited for the analysis of drugs due to
highly precise retention times and peak areas and excellent detector linearity.
This Application Note shows:
• Excellent retention time precision, with relative standard deviation
(RSD) < 0.07 % for all six linearity levels.
• Excellent area precision, with RSD < 0.25 % for all six levels.
• Excellent linearity, with coefficient of correlation > 0.9999.
This study covers a wide range of ~ 150 ng to 5,000 ng.
Siji Joseph,
Patric HörthApplication Note
0 2 4 6 8
0
20
40
60
80
mA
U
Column: ZORBAX Eclipse XDB-C18,
5 μm, 150 x 4.6 mm
Time [min]
5989-8331EN139

Introduction
In the development of an HPLC
method for analysis, the detector plays
a very important role as it defines the
limits of concentrations over which
the method can perform satisfactorily.
The purpose of this Application Note
was to evaluate the detector linearity
and precision of peak areas and reten-
tion times for the Agilent 1120
Compact LC system using the antipsy-
chotic drug Aripiprazole (figure 2) as a
test compound.
Experimental
EquipmentThe Agilent 1120 Compact LC system
included:
• A gradient pump with low-pressure
mixing
• An autosampler with vial tray
• A column compartment for a column
up to 250 mm in length
• A variable wavelength detector
(VWD)
A ZORBAX Eclipse XDB C18,
150 x 4.6 mm, 5 μm was used for all
separations.
The instrument was controlled by
Agilent EZChrome Elite Compact
Compliance software.
Chromatographic parametersThe chromatographic conditions were
as follows:
• Sample: Aripiprazole
• Column: ZORBAX Eclipse XDB C18, 5
μm, 150 x 4.6 mm,
• Mobile phase:
A = water + 0.2 % TFA,
B = acetonitrile + 0.16 % TFA
• Flow rate: 1.0 mL/min
• Gradient: at 0 min 30 %B, at 7 min 70
%B, then hold the ratio for another
two minutes
• Injection volume: 5 μL
• Autosampler programmed with a
wash vial (using acetonitrile) for rins-
ing exterior of the needle
• Run time: 9 min
• Post time: 5 min
• Column oven: 40 °C
Figure 2Structure of Aripiprazole.
mA
U
100
200
300
400
Sorbic
acid
Methylparaben
12
3 4
56 7
Benzoic
acid
Figure 1Agilent 1120 Compact LC.
Serial # Weight or volume Diluted to Expected concentration Solution name
1 20.00 mg of Aripiprazole 10 mL 2.000 mg/mL or 2,000 ng/μL A ( Stock)
2 500 μL of A 1 mL 1.000 mg/mL or 1,000 ng/μL B, Level-6
3 500 μL of B 1 mL 0.500 mg/mL or 500 ng/μL C, Level-5
4 250 μL of B 1 mL 0.250 mg/mL or 250 ng/μL D, Level-4
5 125 μL of B 1 mL 0.125 mg/mL or 125 ng/μL E, Level-3
6 62.5 μL of B 1 mL 0.0625 mg/mL or 62.5 ng/μL F, Level-2
7 31.25 μL of B 1 mL 0.03125 mg/mL or 31.25 ng/μL G, Level-1
Table 1Sample preparation.
Note: To prepare the stock solution, Aripiprazole was initially dissolved in methanol (20 % of the total make-up vol-
ume) and the solution was then made up to the mark with diluent.
1405989-8331EN

• VWD: 254 nm, peak width (PW) >
0.05 min
• Diluent / blank: 60:40
acetonitrile:water
Sample preparationThe samples for the linearity test were
prepared as per table 1.
Sequence tableTable 2 shows the sequence table that
was set up in the Agilent EZChrom
Elite Compact Compliance software.
Results and discussion
Figure 3 shows the chromatogram of
Aripiprazole. The mobile phase con-
tained trifluoroacetic acid as modifier,
which improved retention and peak
shape.
Figure 4 shows the chromatographic
overlay of all six linearity levels. The
results of the linearity results are sum-
marized in table 3, and the linearity
plot is displayed in figure 5. The
observed linearity correlation was r-
squared > 0.9999.
Figure 3Chromatogram of Aripiprazole.
0 2 4 6 8
0
200
400
600
800
1000
1200
mA
U
Time [min]
5.3
62
Ari
pip
razo
le
Line Location Sample name # Injections Injection volume (μL)
1 Vial 1 Blank 2 5
2 Vial 2 Linearity Level-1 6 5
3 Vial 3 Blank 2 5
4 Vial 4 Linearity Level-2 6 5
5 Vial 5 Blank 2 5
6 Vial 6 Linearity Level-3 6 5
7 Vial 7 Blank 2 5
8 Vial 8 Linearity Level-4 6 5
9 Vial 9 Blank 2 5
10 Vial 10 Linearity Level-5 6 5
11 Vial 11 Blank 2 5
12 Vial 12 Linearity Level-6 6 5
Table 2Sequence table.
Figure 4Overlay of the chromatograms of all six concentration levels (with time and absorbance offset).
1 2 3 4 5 6 7 8 9
0
1000
2000
Time [min]
mA
U
Linearity Level-1 Linearity Level-6
5989-8331EN141

Conclusion
The variable wavelength detector with-
in the Agilent 1120 Compact LC gives
excellent linearity over a very wide
range of concentrations. The instru-
ment is able to analyze Aripiprazole
with high precision for retention times
and peak areas. In this study, the pre-
cision for retention times was < 0.03 %
RSD and for areas of baseline-separat-
ed peaks was < 0.24 % RSD.
The Agilent 1120 Compact LC system
is well-suited for this application, as it
delivers the needed data quality and is
based on a proven robust design. This
Application Note also demonstrates
that the Agilent 1120 Compact LC sys-
tem meets the detector linearity
requirements of a pharmaceutical
QA/QC lab.Figure 5Linearity curve for Aripiprazole from~ 150 to 5,000 ng injected.
Detector linearity
0
1000
2000
3000
4000
5000
6000
0 40000000 80000000 120000000 160000000
Area
Co
nce
ntr
ati
on
(n
g/
uL
)
Results Level-1 Level-2 Level-3 Level-4 Level-5 Level-6
RSD of area 0.243% 0.159% 0.126% 0.218% 0.124% 0.210%
RSD of retention time 0.017% 0.023% 0.025% 0.020% 0.022% 0.020%
Table 3Linearity results.
1425989-8331EN

Injector linearity testing for Tramadol quality control with the Agilent 1120Compact LC and Agilent TC C18(2)columns
Abstract
The Agilent 1120 Compact LC is the system of choice for conventional, analytical-
scale liquid chromatography. It is an integrated LC designed for ease of use, perfor-
mance, and reliability. It is well-suited for the analysis of drugs due to the highly pre-
cise retention times and peak areas, excellent detector linearity, and excellent injector
linearity. This Application Note shows:
• Excellent retention time precision, with relative standard deviation
(RSD) < 0.07 % for all 22 linearity levels.
• Excellent area precision, with RSD < 0.5 % for all 22 levels.
• Excellent injector linearity, with coefficient of correlation (R2) > 0.9999.
This study covers a wide range of 1 μL to 100 μL injected, and the solution
concentration used was 100 ng/μL Tramadol.
Siji Joseph,
Patric HörthApplication Note
Column: Agilent TC-C18(2),
250 x 4.6 mm, 5 μm
Time [min]
Ab
sorb
an
ce
5989-8335ENA143

Introduction
For the analysis of drugs in routine
QA/QC, it is very important to have
highly precise, accurate, linear, and
robust LC systems. The performance
of the autosampler plays a major role
in the accuracy of the analysis. The
design of the Agilent 1120 Compact LC
autosampler is well known for its
accuracy and precision in injection. It
delivers the needed data quality and is
based on a proven robust design. In
this Application Note, the linearity per-
formance of the Agilent 1120 Compact
LC autosampler is demonstrated via
injections of Tramadol, an analgesic.
Experimental
EquipmentThe Agilent 1120 Compact LC system
included:
• A gradient pump with low-pressure
mixing
• An autosampler with vial tray (maxi-
mum injection volume is 100 μL)
• A column compartment for a column
of up to 250 mm in length
• An Agilent TC (Typical
Carbon load) C18(2) column,
250 x 4.6 mm, 5 μm
• A variable wavelength detector
(VWD)
The instrument was controlled by
Agilent EZChrom Elite Compact soft-
ware.
Sample preparationStock solution: A stock solution of 1
mg/mL Tramadol was prepared.
Linearity test sample (diluted stock
solution): 1 mL of the stock solution
was diluted to 10 mL, resulting in a
concentration
of 0.1 mg/mL (100 ng/μL).
Chromatographic parametersA chromatographic method was devel-
oped to separate Tramadol and its
potential impurities.
This method was then used (with
Tramadol alone) for the injector lineari-
ty tests. The conditions were:
• Sample: Tramadol
• Column: Agilent TC-C18(2),
250 x 4.6 mm, 5 μm
• Mobile phases:
A = water + 0.2 % TFA,
B = acetonitrile + 0.16 % TFA
• Flow rate: 1.2 mL/min
• Gradient: at 0 min 30 %B, at
9 min 85 %B, then hold the ratio for
three more minutes
• Injection volume:
varied from 1 μL to 100 μL
• Autosampler programmed
with a wash vial
• Run time: 12 min
• Post time: 5 min
• Column oven: 30 °C
• VWD: 270 nm, peak width (PW) >
0.05 min
• Diluent / blank: 30:70
acetonitrile:water
Figure 2Chemical structure of Tramadol.
OCH3
OH
NCH3
CH3
Figure 1Agilent 1120 Compact LC.
1445989-8335ENA
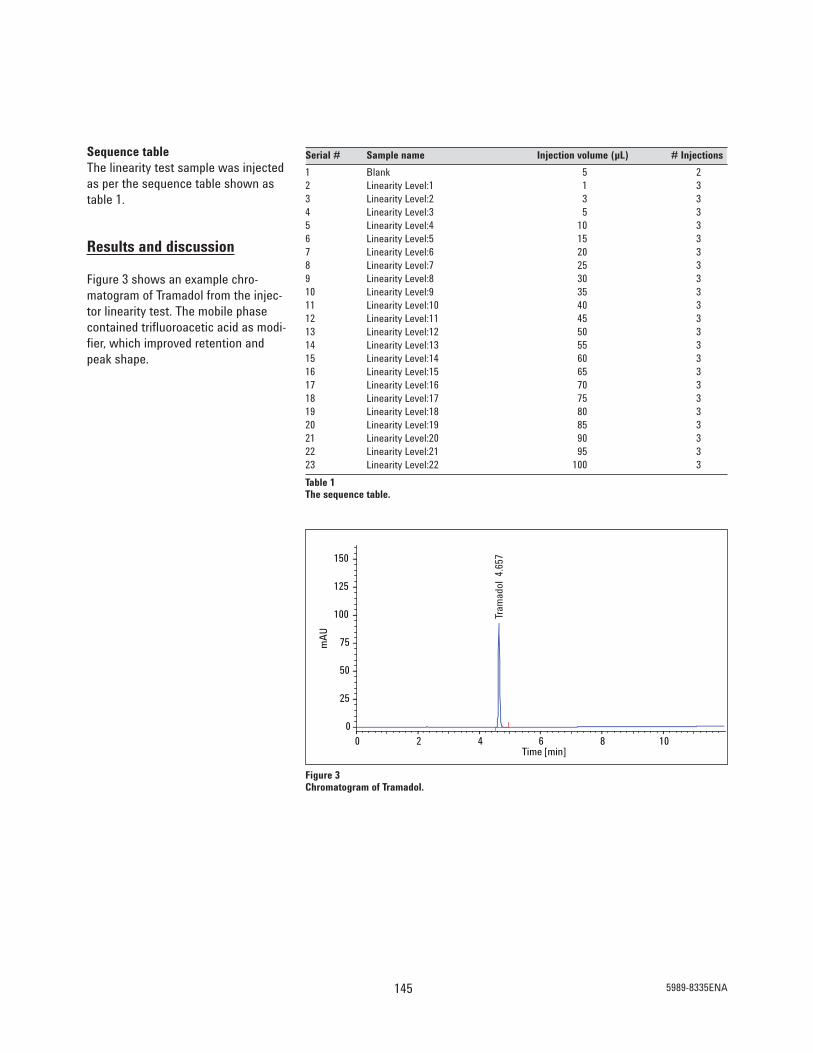
Sequence tableThe linearity test sample was injected
as per the sequence table shown as
table 1.
Results and discussion
Figure 3 shows an example chro-
matogram of Tramadol from the injec-
tor linearity test. The mobile phase
contained trifluoroacetic acid as modi-
fier, which improved retention and
peak shape.
Figure 3Chromatogram of Tramadol.
Time [min]0 2 4 6 8 10
0
25
50
75
100
125
150
mA
U
Tra
ma
do
l 4
.65
7
Serial # Sample name Injection volume (μL) # Injections
1 Blank 5 2
2 Linearity Level:1 1 3
3 Linearity Level:2 3 3
4 Linearity Level:3 5 3
5 Linearity Level:4 10 3
6 Linearity Level:5 15 3
7 Linearity Level:6 20 3
8 Linearity Level:7 25 3
9 Linearity Level:8 30 3
10 Linearity Level:9 35 3
11 Linearity Level:10 40 3
12 Linearity Level:11 45 3
13 Linearity Level:12 50 3
14 Linearity Level:13 55 3
15 Linearity Level:14 60 3
16 Linearity Level:15 65 3
17 Linearity Level:16 70 3
18 Linearity Level:17 75 3
19 Linearity Level:18 80 3
20 Linearity Level:19 85 3
21 Linearity Level:20 90 3
22 Linearity Level:21 95 3
23 Linearity Level:22 100 3
Table 1The sequence table.
5989-8335ENA145

Table 2 lists the average peak heights
and peak areas for each concentration
that was injected.
The chromatographic overlay of all lin-
earity levels is shown in
figure 4.
Figure 4Chromatographic overlay of all linearity levels.
Time [min]4 6 8 10 12
0
100
200
300
400
500
600
mA
U
Sample name On-column concentration (μg) Peak height Peak area
Linearity Level:1 0.1 157336 522936
Linearity Level:2 0.3 472170 1570002
Linearity Level:3 0.5 786250 2622929
Linearity Level:4 1.0 1553884 5244121
Linearity Level:5 1.5 2289525 7857707
Linearity Level:6 2.0 3000436 10471135
Linearity Level:7 2.5 3680418 13077010
Linearity Level:8 3.0 4338134 15685629
Linearity Level:9 3.5 4974238 18305228
Linearity Level:10 4.0 5584654 20913229
Linearity Level:11 4.5 6186702 23513327
Linearity Level:12 5.0 6750352 26119986
Linearity Level:13 5.5 7323479 28725172
Linearity Level:14 6.0 7800501 31103171
Linearity Level:15 6.5 8328025 33699927
Linearity Level:16 7.0 8833069 36264800
Linearity Level:17 7.5 9328439 38847902
Linearity Level:18 8.0 9811331 41437670
Linearity Level:19 8.5 10317715 44113978
Linearity Level:20 9.0 10734428 46673257
Linearity Level:21 9.5 11175523 49272540
Linearity Level:22 10 11601457 51871167
Table 2Tabulation of peak areas and heights.
1465989-8335ENA

The linearity plot is displayed in figure 5.
Figure 6 shows the % RSD of retention
times for each linearity level.
Figure 5Injector linearity of the Agilent 1120 Compact LC using 1 μL to 100 μL of a solution of Tramadol.The observed linearity correlation (R2) is > 0.9999.
Linearity curve
y = 519215.2143255x
R2 = 0.9999662
0
10000000
20000000
30000000
40000000
50000000
60000000
0 20 40 60 80 100
Injection volume (μL)
Are
a
Figure 6% RSDs for retention times. RSDs of all levels are within the limit of < 0.07 %.
0.000%
0.010%
0.020%
0.030%
0.040%
0.050%
0.060%
0.070%
1 5 15 25 35 45 55 65 75 85 95
Retention time % RSD
5989-8335ENA147

Figure 7 shows the % RSD of the peak
areas for each linearity level.
Conclusion
The autosampler that is integrated into
the Agilent 1120 Compact LC gives
excellent injection precision over a
wide range of injection volumes (1 μL
to 100 μL), and is a best choice for
pharmaceutical QA/QC and drug dis-
covery. Our study with Tramadol
shows that the system is able to ana-
lyze this compound with high precision
for retention times (< 0.07 % RSD) and
for peak areas (< 0.5 % RSD). Figure 7% RSDs of peak areas. RSDs of peak areas for all the levels are within the limit of < 0.5 %.
Area % RSD
0.000%
0.100%
0.200%
0.300%
0.400%
0.500%
0.600%
1 5 15 25 35 45 55 65 75 85 95
Injection volume
% R
SD
1485989-8335ENA

System suitability testing for Aripiprazolequality control with the Agilent 1120Compact LC and ZORBAX C-18 columns
Abstract
The Agilent 1120 Compact LC is the system of choice for conventional, analytical-
scale liquid chromatography. It is an integrated LC designed
for ease of use, performance, and reliability. It is well-suited for the analysis of
drugs due to highly precise retention times and peak areas and low detection
limits. This Application Note shows:
• Excellent retention time precision, with relative standard deviation (RSD) < 0.07 %.
• Excellent area precision, with RSD < 0.25 % for baseline-separated peaks.
• Excellent height precision, with RSD < 0.25 % for baseline-separated peaks.
Siji Joseph,
Patric HörthApplication Note
ClCl
N NHNH
O
BrH2C
O
+
NH
O O
N
N Cl
Cl
5989-8333EN149

Introduction
In the pharmaceutical industry, liquid
chromatography is a versatile tool for
separation of individual analytes.
Innumerable methods have been devel-
oped for analysis on HPLC as it is
proven to be very reliable and repro-
ducible at all stages from drug discov-
ery to manufacturing. As a result, it is
necessary to verify that any HPLC sys-
tem performs within an acceptable range
of precision and accuracy every day.
System Suitability Testing (SST)
is a measure of instrument perfor-
mance on a day-to-day basis. These
tests ensure that the method and the
HPLC system can generate results of
acceptable accuracy and precision.
The criteria selected is based on criti-
cal chromatographic parameters such
as resolution, reproducibility in reten-
tion time, peak area and height, col-
umn efficiency and their variation
(Standard Deviation) within acceptable
limits which are defined during the
method validation experiments.
In this Application Note, we focus on
this final validation step and evaluate
the suitability of the Agilent 1120
Compact LC system for the analysis of
Aripiprazole and its precursors.
Experimental
EquipmentThe Agilent 1120 Compact LC system
included:
• A gradient pump with low-pressure
mixing
• An autosampler with vial tray
• A column compartment for a column
up to 250 mm in length
• A variable wavelength detector
(VWD)
An Agilent ZORBAX Eclipse XDB C18,
5μm, 150 x 4.6 mm was used
The instrument was controlled by
Agilent EZChrome Elite Compact
Compliance software.
Compounds1-(2,3-Dichlorophenyl)piperazine
hydrochloride (starting material-1) and
7-(4-bromobutoxy)-3,4-dihydrocar-
bostyril (starting material-2) are the
two starting materials for the synthe-
sis of Aripiprazole. The synthetic
scheme is shown in figure 2. For this
study, the two starting materials are
treated as impurities.
Preparation of samplesStock preparation: 2 mg/mL of the
Aripiprazole and 5 mg/mL of starting
material-1 and -2 were prepared as
individual stock solutions. Aripiprazole
and the two starting materials were
initially dissolved in methanol (20 % of
the total make-up volume), and diluent
was then added up to the marks.
System suitability sample: A test mix
for system suitability was
prepared with 10 μg/mL Aripiprazole and
each of the impurities at
5 μg/mL.
Chromatographic parametersThe chromatographic method was set
up such that all compounds were
baseline-separated. The
conditions were:
• Sample: 1-(2,3-dichlorophenyl)pi-per-
azine, 7-(4-bromobutoxy)-3,4-dihydro-
carbostyril, and Aripiprazole
• Column: Agilent ZORBAX Eclipse XDB
C18, 5μm, 150 x 4.6 mm
• Mobile phases: A = water + 0.2 % tri-
fluoroacetic acid (TFA),
B = acetonitrile + 0.16 % TFA
• Flow rate: 1.0 mL/min
• Gradient: at 0 min 30 %B, at
7 min 70 %B, then hold the ratio for
two more minutes
• Injection volume: 10 μL
• Autosampler programmed with a
wash vial (using acetonitrile) for rins-
ing exterior of the needle
• Run time: 9 min
• Post time: 5 min
• Column oven: 40 °C
• VWD: 254 nm, peak width (PW) >
0.05 min
• Diluent / blank: 60:40
acetonitrile:water
Figure 1Agilent 1120 Compact LC.
1505989-8333EN

Sequence tableBased on the recommendations by
ICH (International Conference on
Harmonization) for system suitability
tests, the sequence table shown as
table 1 was set up in the Agilent
EZChrom Elite Compact Compliance
software.
Results and discussion
In figure 3, an example chromatogram
for system suitability testing shows
excellent resolution. The separation
time was nine minutes; the total run
time (including the re-equilibration)
could be limited to 14 minutes. The
mobile phase contained trifluoroacetic
acid as modifier, which improved
retention and peak shape.
When analyzing drugs with UV detec-
tion, precision of retention times is of
utmost importance. The precision of
retention times and areas was deter-
mined from 10 replicate injections of
system suitability sample. Figure 4
shows an overlay of 10 consecutive
runs.
The acceptance criteria for this system
suitability study are tabulated in table 2.
Figure 2Structures of starting material-1 and -2 and the product Aripiprazole.
ClCl
N NHNH
O
BrH2C
O
+
NH
O O
N
N Cl
Cl
Figure 3Chromatogram of Aripiprazole and its impurities.
0 2 4 6 8
0
20
40
60
80
mA
U
Sta
rtin
g m
ate
ria
l-1
Ari
pip
razo
le
Sta
rtin
g m
ate
ria
l-2
Time [min]
Line Location Sample name # Injections Injection volume (μL)
1 Vial 1 Blank 3 10
2 Vial 2 System suitability 10 10
3 Vial 3 Blank 1 10
Table 1Sequence table.
Parameter Limit
RSD of retention time (RT) < 0.07 %
RSD of area < 1.00 %
Resolution > 2.00
Asymmetry < 2.00
Theoretical plates > 2000
Peak width < 0.08 min
RSD of height < 0.50 %
Table 2Acceptance criteria.
5989-8333EN151

The results of the system suitability
testing are shown in figure 4 and are
summarized in table 3.
These results of the system
suitability test for Aripiprazole demon-
strate that the Agilent 1120 Compact
LC meets the stringent performance
requirements for pharmaceutical
QA/QC analysis.
Conclusion
For the analysis of drugs in routine
QA/QC, it is very important to have
highly precise, accurate, and robust LC
systems. This enables reliable analysis
of pharmaceutical drugs and their
impurities. The Agilent 1120 Compact
LC system is well-suited for this appli-
cation because it delivers the needed
data quality and is based on a proven
robust design.
Figure 4Overlay of 10 repetitive chromatograms.
2 4 6 8 10
0
20
40
60
80
mA
U
Time [min]
Table 3System suitability test results.
Compound Amount RSD of RSD of Reso- PW Asymmetry Theoretical RSD of Passed(μg/mL) RT (%) area (%) lution plates height (%) (yes/no)
Starting material-1 5.15 0.033 0.189 NA 0.07 1.02470 >14000 0.228 Yes
Aripiprazole 10.1 0.027 0.129 17.87 0.05 1.14031 >58000 0.183 Yes
Starting material-2 5.4 0.021 0.137 17.48 0.06 1.09432 >60000 0.169 Yes
*N/A = not applicable
1525989-8333EN

System suitability testing for Tramadolquality control with the Agilent 1120Compact LC and ZORBAX C-18 columns
Abstract
The Agilent 1120 Compact LC is the system of choice for conventional, analytical-
scale liquid chromatography. It is an integrated LC designed for ease of use,
performance, and reliability. It is well-suited for the analysis of drugs due to the
highly precise retention times and peak areas. This Application Note shows:
• Excellent retention time precision, with relative standard deviation (RSD) < 0.07 %.
• Excellent area precision, with RSD < 0.25 % for baseline-separated peaks.
• Excellent height precision, with RSD < 0.25 % for baseline-separated peaks.
Siji Joseph,
Patric HörthApplication Note
3 4 5 6 7 8 9 10
0
2
4
6
mA
U
Time [min]
Column: ZORBAX Eclipse-C18,5 μm,
250 x 4.6 mm
5989-8334EN153

Introduction
System Suitability Testing (SST) is a
measure of instrument performance
on a day-to-day basis. These tests
ensure that the method and the HPLC
system can generate results of accept-
able accuracy and precision. The crite-
ria selected is based on critical chro-
matographic parameters such as reso-
lution, reproducibility in retention time,
peak area and height, column efficien-
cy and their variation (Standard
Deviation) within acceptable limits
which are defined during the method
validation experiments. Currently SST
measurements have become a part of
the analytical procedures, and are also
recommended by the pharmacopeias
and accepted by the United States
Food and Drug Administration (FDA).
In this Application Note, we focus on
this final validation step and evaluate
the suitability of the Agilent 1120
Compact LC system for the analysis of
the analgesic drug Tramadol and
potential impurities from its produc-
tion.
Experimental
EquipmentThe Agilent 1120 Compact LC system
included:
• A gradient pump with low-pressure
mixing
• An autosampler with vial tray
• A column compartment for a column
up to 250 mm in length
• A variable wavelength detector
(VWD)
A ZORBAX Eclipse XDB C18,
5 μm, 250 x 4.6 mm, was used.
The instrument was controlled by
Agilent EZChrome Elite Compact
Compliance software.
Structures of compounds usedFigure 2 shows the synthesis of
Tramadol, highlighting both starting
materials and potential byproducts.
This study focused on analysis of all of
these compounds except for impurity
E, which is an ultraviolet (UV)-inactive
starting material.
Figure 1Agilent 1120 Compact LC.
Figure 2Structures of the compounds from the synthesis of Tramadol.
Time [min]0 5 10 15 20 25 30
mA
U
0
100
200
300
400
Sorbic
acid
Methylparaben
12
3 4
56 7
Benzoic
acid
Cosmetics:face conditioner
Glace fruit
Standard
8 9
1545989-8334EN

Sample preparationStock preparation: 2 mg/mL of
Tramadol and 5 mg/mL each of start-
ing material (3-bromoanisole) and
impurities A, B, C, and D were pre-
pared as the six stock solutions.
System suitability sample: A test mix
for system suitability was pre-pared
with Tramadol at 10 μg/mL and all other
starting materials/impurities at 5 μg/mL
each. This test mix was injected six
times for the calculation of system
suitability.
Chromatographic parametersThe chromatographic method was set
up such that all compounds were
baseline-separated. The conditions
were:
• Sample: Tramadol; impurities A, B, C,
and D; and 3-bromoanisole
• Column: ZORBAX Eclipse XDB C18,
5 μm, 250 x 4.6 mm,
• Mobile phases:
A = water + 0.2 % TFA,
B = acetonitrile + 0.16 % TFA
• Flow rate: 1.2 mL/min
• Gradient: at 0 min 30 %B, at
9 min 85 %B, then hold the ratio for
three more minutes
• Injection volume: 10 μL
• Autosampler programmed with a
wash vial (using acetonitrile) for
cleaning the needle exterior
• Run time: 12 min
• Post time: 5 min
• Column oven: 30 °C
• VWD: 270 nm,
peak width (PW) > 0.05 min
• Diluent / blank: 30:70
acetonitrile:water
Sequence tableBased on the recommendations by
ICH (International Conference on
Harmonization) for system suitability
performance tests, the sequence table
shown as table 1 was set up in the
Agilent EZChrom Elite Compact soft-
ware.
Figure 3Chromatogram of Tramadol with impurities and starting material.
0 2 4 6 8 10 12
0.0
2.5
5.0
7.5
10.0
12.5
15.0
Time [min]
mA
U
Imp
uri
ty D
2.4
98
Imp
uri
ty A
3.3
32
Tra
ma
do
l 3.6
30
Imp
uri
ty C
5.0
72
Imp
uri
ty B
5.2
97
3-B
rom
o a
nis
ol 1
0.1
12
Line Location Sample name # Injections Injection volume (μL)
1 Vial 1 Blank 3 10
2 Vial 2 System suitability 6 10
3 Vial 3 Blank 1 10
Table 1Sequence table.
Figure 4Overlay of 6 repetitive chromatograms..
0 2 4 6 8 10 12
0
10
20
30
40
50
mA
U
Time [min]
5989-8334EN155

Results and discussion
In figure 3, an example chromatogram
for system suitability testing shows
excellent resolution. The separation
time was 12 minutes and the total run
time (including time for re-equilibra-
tion) could be limited to 17 minutes.
The mobile phase contained trifluo-
roacetic acid as modifier, which
improved peak shape.
When analyzing drugs with UV detec-
tion, precision of retention times is of
utmost im-portance. The precision of
retention times and areas was determined
from the six replicate injections of system
suitability sample. Figure 4 shows an over-
lay of six consecutive runs.
The acceptance criteria for this system
suitability study are tabulated in table 2.
The results of the system suitability
testing are shown in figure 4 and are
summarized in table 3. These results
of the system suitability test for
Tramadol demonstrate that the Agilent
1120 Compact LC meets the stringent
performance requirements for pharma-
ceutical QA/QC analysis.
Conclusion
The Agilent 1120 Compact LC is ideally
suited for QA/QC of pharmaceuticals
because the system gives excellent
precision for retention times and
areas. In this study, the precision for
retention times was < 0.07 % RSD and
for areas of baseline-separated peaks
was < 0.25 % RSD.
Parameter Limit
RSD of retention time (RT) < 0.07 %
RSD of area < 1.00 %
Resolution > 2.00
Asymmetry < 2.00
Theoretical plates > 2000
Peak width < 0.08 min
RSD of height < 0.50 %
Table 2Acceptance criteria.
Compound Results on 250 x 4.6 mm Agilent TC-C18 5 μm column Passed
Amount RSD of RSD of Reso- PW Asymmetry Theoretical RSD of (yes/no)(μg/mL) RT (%) area (%) lution (min) plates height (%)
Tramadol 10.1 0.037 0.150 3.23 0.05 1.16130 >25000 0.207 Yes
Impurity A 5.2 0.068 0.234 8.91 0.05 1.14739 >20000 0.347 Yes
Impurity B 5.3 0.013 0.191 2.47 0.05 1.14858 >50000 0.439 Yes
Impurity C 5.2 0.017 0.165 15.83 0.05 1.17513 >50000 0.199 Yes
Impurity D 5.1 0.066 0.237 NA 0.05 1.16080 >11500 0.413 Yes
3-Bromoanisole 5.2 0.008 0.212 45.17 0.07 1.28923 >60000 0.281 Yes
Table 3System suitability test results.
*N/A = not applicable
1565989-8334EN

Development and validation of an HPLC method to analyze ibuprofen andimpurities according to the EuropeanPharmacopoeia
Abstract
This Application Note describes the development of a fast, accurate, and
reproducible method to analyze ibuprofen and related impurities according to
European Pharmacopoeia (EP) regulations1, using an Agilent 1120 Compact LC.
The experiments described in this Application Note include determination of
precision of areas and retention times, as well as chromatographic parameters
like resolution and signal-to-noise ratios. The experiments prove precise results
from a system that was optimized for everyday productivity, and they fulfill
regulatory compliance.
Detlef Wilhelm
ANATOX GmbH & Co. KG,Germany
Application Note
Time [min]0 5 10 15 20 25 30
mA
U
0
100
200
300
400
Sorbic
acid
Methylparaben
12
3 4
56 7
Benzoic
acid
Cosmetics:face conditioner
Glace fruit
Standard
8 9
5989-9241EN157

Introduction
Performing routine testing in a quality
control laboratory with standardized
methods for active pharmaceutical
ingredients (APIs) or final products
requires analytical instrumentation
with high reliability and ease-of-use,
combined with optimal cost-of-owner-
ship.
This Application Note shows how the
Agilent 1120 Compact LC2, a highly
robust and reliable instrument for
standard LC methodology, can be used
effectively in a routine environment to
efficiently measure pharmaceutical
compounds such as ibuprofen and
related impurities.
Ibuprofen impurities A, B, C, D, and E
were analyzed on an Agilent 1120
Compact LC system according to
methodology described in the EP, and
system suitability and performance
tests were executed.
Experimental
EquipmentAn Agilent 1120 Compact LC system
with the following built-in modules
was used:
• Gradient pump and vacuum degasser
• Autosampler
• Column oven
• Variable wavelength detector
Preparation of samplesThe impurities A, B, C, D, and E were
chosen according to the EP. A refer-
ence solution was prepared as fol-
lows:
Step 1 – Preparation of individual
stock solutions of each impurity at 1
mg/mL: 10 mg of each impurity was
dissolved in 2 mL acetonitrile and was
then diluted to 10 mL with mobile
phase A.
Step 2 – Preparation of solution
of all impurities at 0.06 mg/mL: 600 μL
of each stock solution from step 1 was
combined and the mixture was diluted
to 10 mL with mobile phase A.
Step 3 – Preparation of reference solu-
tion: 20 mg of a certified reference
standard (CRS) of ibuprofen was dis-
solved in 2 mL acetonitrile. Then 1 mL
of the impurity solution from step 2
was added and the mixture was dilut-
ed to 10 mL with mobile phase A. The
final concentrations were 2 mg/mL
ibuprofen and 0.006 mg/mL
(6 μg/mL) of each of the impurities.
Various dilutions of the reference solu-
tion were made to establish calibration
curves for ibuprofen and the impuri-
ties.
Chromatographic conditions• Column: Agilent ZORBAX SB-C18, 150
mm x 4.6 mm, 5 μm particle size
• Injection volume: 20 μL, as described
in the EP regulations
• Column temperature: 30 °C, as
described in the EP regulations
• Detector: 14 μL cell, peak width: 0.1
min (5 Hz), signal: 214 nm
Solvents, gradient, and pump settings Solvent A was prepared by mixing 340
volumes acetonitrile, 0.5 volumes
phosphoric acid, and 600 volumes
water; then allowing to equilibrate and
diluting to 1000 volumes with water.
The procedure is described in the EP
regulations. Solvent B was acetonitrile.
The gradient described in the
EP regulations was as follows:
0-25 min 100 %A, 25-55 min 85 %B,
55-70 min 85 %B, 70-75 min 100 %A.
Use of the EP gradient would lead to a
runtime of 85 minutes. To achieve high
resolution at short retention times
with the column required by EP, the
gradient time was reduced accordingly
until all peaks were eluted (in 42.5
minutes including backflushing) with
the same gradient slope, so that the
same elution could be achieved as
with the long gradient.
The final gradient and pump parame-
ters were as follows:
• Gradient: 0-25 min 100 %A,
25-35 min 28.3 %B,
35.1-42.5 min 100 %A
• Stop time: 42.5 min
• Post time: 10 min (usually not
necessary with the
chosen conditions)
• Flow rate: 2 mL/min
System suitability and performancetest In accordance with Q3A(R) Impurities
in New Drug Substances3, the follow-
ing parameters must be tested and the
limit settings below must be fulfilled:
• Precision of areas must be
< 2 % RSD.
• Precision of retention times must be
< 0.5 % RSD.
• Resolution must be
> 1.5 for all peaks.
• Signal-to-noise ratio must be
> 50 for all peaks.
• Calibration for impurities and main
peak must be linear without dilution.
With these requirements for testing,
the samples shown in table 1 were
prepared and analyzed.
An Agilent publication was used as a
reference for this work.4
1585989-9241EN

Results and discussion
The figure on the cover page shows an
example chromatogram of ibuprofen
and its impurities. The results of the
control sample are shown in table 2.
At the lowest calibration concentra-
tion, all criteria were fulfilled. The
required sensitivity was obtained for
all peaks and resolution > 1.5 was
achieved for all compounds in the mix-
ture.
Table 3 shows the precision of the
areas and retention times for the main
compound and the impurities in the
suitability sample. The reliability and
precision of the Agilent 1120 Compact
LC system was proven. For all compo-
nents, the criteria for precision of
retention times and areas were ful-
filled, showing that the system can be
used for QC methods.
The results of all calibration
runs are summarized in table 4.
Linearity is shown from the lowest
calibration concentration (10 % of the
concentration of the reference solu-
tion) to the highest concentration
(150 % of the concentration of the
reference solution). No dilution of
the main compound was necessary
and no enrichment was required to
detect the impurities.
The average calculated limit of detec-
tion (with S/N of 10) for all com-
pounds was 0.10 μg/mL by using this
method.
The disregard limit according to EP for
each impurity is 0.05 times the area of
ibuprofen in a reference solution that
has a concentration of 20 μg/mL for
ibuprofen and 1 μg/mL for each of the
impurities. The results of the control
sample showed a signal-to-noise ratio
of > 50 at 0.6 μg/mL, so the require-
ments for limit of detection were ful-
filled.
The excellent results shown here
reflect a system that was designed for
robust operation. The high perfor-
mance of the new pump is strongly
demonstrated by the good results for
the precision of the retention times.
Also, the high S/N ratios (> 50 for
each component down to the disre-
gard limit) are a result of the low pump
pulsation. The high precision of the
Sample Purpose Number of injections
Blank solution Verify baseline stability and identify artifacts 2
Calibration mixture 1-6 Verify stability of response and correctness of 6 of each
calibration, linearity
Control sample Verify sensitivity and resolution for 6
lowest calibration sample
Suitability sample Verify precision of areas and retention 6
times for reference solution
Table 1Setup for testing system suitability and performance.
Retention time (min) Amount Resolution S/N
Impurity D 5.573 0.6 μg/mL 3.89 56.9
Impurity C 10.783 0.6 μg/mL 16.29 223.7
Impurity A 27.516 0.6 μg/mL 27.82 128.8
Ibuprofen 28.874 0.2 mg/mL 1.98 5300
Impurity B 30.231 0.6 μg/mL 2.61 195.2
Impurity E 32.625 0.6 μg/mL 5.49 407.6
Table 2Results for control sample: resolution and signal-to-noise (S/N) ratio.
Compound Retention time (min) Amount RSD RT RSD area(μg/mL) n=6 n=6
Impurity D 5.573 6 0.225 0.089
Impurity C 10.783 6 0.267 0.535
Impurity A 27.516 6 0.222 0.159
Ibuprofen 28.874 2,000 0.448 0.061
Impurity B 30.231 6 0.142 0.236
Impurity E 32.625 6 0.078 0.088
Table 3Suitability sample: precision of retention times and areas. (RSD = relative standard deviation; RT= retention time).
m b Residual rstandard deviation
Impurity D 14872.3 11189.7 2778.9 1
Impurity C 19818.7 3086.1 19463.5 0.9999
Impurity A 24614.7 -40068 24769 0.99989
Ibuprofen 6417010 689238 895680.5 1
Impurity B 19969.4 -13173 7292 0.99999
Impurity E 35314.4 -19975.5 5740.8 1
Table 4Calibration (Setting “Ignore Origin”, y=mx+b, 0.6 to 9 μg/mL for impurities and 0.2 to 3 mg/L foribuprofen).
injector is shown with the good corre-
lation results (r>0.999) during calibra-
tion, which is also proof of very low
carryover.
5989-9241EN159
Conclusion
The Agilent 1120 Compact LC is
designed for users in medium- to
small-size companies who need the
highest reliability and ease-of-use, as
well as the lowest cost-of-ownership
for standard LC methodology in a
QA/QC environment.
In order to prove precise results from
a system that was optimized for every-
day productivity, and to fulfill regulato-
ry compliance, the experiments in this
Application Note included determina-
tion of precision of areas and retention
times, as well as chromatographic
parameters like resolution, linearity,
and signal-to-noise ratios. The results
show that the instrument is within the
limits of the regulatory requirements
for a quality control environment.
The results show explicitly the applica-
bility of the 1120 LC system for phar-
maceutical testing in QA/QC depart-
ments. In addition to the instrument
capabilities, the new version of the
Agilent EZChrom Elite Compact soft-
ware allows the full control of the
Agilent 1120 Compact LC with a wide
range of features for data analysis and
reporting of the results.
References
1.
European Pharmacopoeia 4.2, Councilof Europe, 2737-9, 2002.
2.
“Agilent 1120 Compact Liquid
Chromatograph: Overview,
Specifications, Ordering,” AgilentTechnologies publication number 5989-7454ENA, 2008.
3.
Q3A Impurities in New Drug
Substances, Revision 2,
http://www.fda.gov/cder/
guidance/7838fnl.pdf, 2008.
4.
Huesgen, A.G., “Impurity Profiling with
the Agilent 1200 Series LC System.
Part 5: QA/QC Application Example
Using a Fast LC Method for Higher
Sample Throughput,” AgilentTechnologies publication number 5989-5621EN, 2006.
1605989-9241EN

Time [min]2 4 6 8 10 12 14 16 18 20 22 24
mAU
0
100
200
300
400
5006
'-E
pip
rava
sta
tin
Pra
vast
ati
n
Re
late
d C
om
po
un
d A
Pra
vast
ati
n la
cto
ne
Co
mp
act
in
5989-9869EN161
Manufacturing QA/QC
Application Note
Authors
Syed S. Lateef, Siji Joseph
Agilent Technologies
Bangalore, India
AbstractPravastatin sodium helps to reduce cholesterol biosynthesis, thereby preventing car-
diovascular disease. The chromatographic method for purity that was established by
the United States Pharmacopeia (USP) for pravastatin sodium was performed on the
Agilent 1120 Compact LC, and system suitability parameters were verified. The sys-
tem suitability mixture containing pravastatin 1,1,3,3-tetramethylbutylamine and the
impurity known as Related Compound A displayed a resolution of 6.3, which is well
above the acceptance limit of not less than 2.0. The detector in the Agilent 1120
Compact LC produced a linear response of Related Compound A down to a concentra-
tion of 0.09 μg/mL.
USP purity analysis of pravastatinsodium using the Agilent 1120Compact LC

• Standard sample: Pravastatin 1,1,3,3-
tetramethylbutylamine was dissolved
in diluent to a concentration of 1.25
μg/mL. The standard sample was
used to determine the relative stan-
dard deviation (RSD) of the peak
areas.
• RRT test sample: Pravastatin sodium
and four of its impurities – 6 -
epipravastatin, Related Compound A,
pravastatin lactone, and compactin –
were dissolved in diluent to a concen-
tration of 65 μg/ml for pravastatin and
7.5 μg/mL for the impurities. The RRT
test sample was prepared to deter-
mine the RRT of each impurity, for
comparison with values reported in
the USP. Pravastatin lactone and com-
pactin were obtained from VARDA
Biotech. Related Compound A was
obtained from the USP and
6’-epipravastatin was obtained from
the European Pharmacopeia (EP).
• Detector linearity test samples:Seven concentration levels of Related
Compound A from 0.09 μg/mL to 1.20
μg/mL were prepared as spiked
amounts in the pravastatin sodium
sample, which had a constant con-
centration of 0.5 mg/mL. These sam-
ples were used to test the detector
response for linearity at low concen-
trations of the impurity.
EquipmentThe Agilent 1120 Compact LC system
included:
• A binary pump with integrated
degasser
• An autosampler with vial tray
• A variable wavelength detector
(VWD)
The instrument was controlled by the
Agilent EZChrom Elite Compact software.
Introduction
The USP chromatographic method for
purity of pravastatin sodium1 was per-
formed on the Agilent 1120 Compact
LC, and system suitability parameters
were tested. The system suitability test
sample consisted of USP pravastatin
1,1,3,3-tetramethylbutylamine and USP
Related Compound A, which is a sodi-
um salt for the impurity 3a-hydrox-yiso-
compactin. Pravastatin sodium and
Related Compound A are positional iso-
mers (figure 1).
Pravastatin sodium has six impurities
that are reported by USP:
1. 3”-Hydroxypravastatin
2. 6 -Epipravastatin
3. 3a-Hydroxyisocompactin
(also called Related Compound A)
4. Pentanoyl impurity
5. Pravastatin lactone
6. Compactin
Only impurities 2, 3, 5, and 6 were used
to demonstrate the impurity method on
the Agilent 1120 Compact LC.
Experimental
Sample preparation• Diluent: A 1:1 mixture of methanol
and water was prepared. The
methanol was HPLC grade (J.T.
Baker). Milli-Q water (Millipore) was
used for the experiment.
• System suitability sample:Pravastatin 1,1,3,3-tetramethylbuty-
lamine and Related Compound A were
dissolved in diluent to obtain a con-
centration of 0.6 mg of pravastatin
1,1,3,3-tetramethylbutylamine and
0.001 mg of Related Compound A per
mL. The system suitability sample
was used to determine the value of
the relative retention time (RRT) of
Related Compound A versus pravas-
tatin. Both pravastatin 1,1,3,3-tetra-
methylbutylamine and Related
Compound A were obtained from the
USP.
Figure 1A) Pravastatin sodium. B) USP Related Compound A.
CH3
OH
O
OOHOH
O
CH3
CH3
O
H
Na
CH3
O
OOHOH
O
CH3
CH3
O
H
OH
Na
B
A
1625989-9869EN

Results and Discussion
System suitability resultsAccording to the USP monograph on
pravastatin sodium, the system suitabil-
ity sample containing pravastatin
1,1,3,3-tetramethylbutylamine and
Related Compound A should show a
resolution of not less than (NLT) 2.0
and Related Compound A should show
an RRT of about 1.1. (USP suggests
that there are no acceptance criteria
applied to RRT, as RRT is an aid in peak
identification only.)
Figure 2 shows six replicate injections
of the system suitability sample. The
results show that Related Compound A
has an RRT of 1.1 for all runs and a res-
olution of 6.3, which is better than the
USP limit of NLT 2.0.
Standard deviations of pravastatinpeak areasThe standard sample containing
1.25 μg/mL of pravastatin 1,1,3,3-
tetramethylbutylamine was injected six
times to test the relative standard devi-
ation of the peak areas of pravastatin.
According to the USP method, six repli-
cate injections of the standard sample
should have a relative standard devia-
tion (RSD) of the peak areas of not
more than (NMT) 10.0 %. A value of 0.3
% RSD was obtained, suggesting the
excellent precision of the injector in the
Agilent 1120 Compact LC. Figure 3
shows the six injections from the stan-
dard sample.
Retention times of the impurities rela-tive to the pravastatin retention timeFigure 4 shows the chromatogram of
the RRT test sample analyzed according
to the USP test for chromatographic
purity for pravastatin. The test was
used to calculate RRTs and compare
them with the RRTs provided by the
USP. Table 2 shows the comparison and
excellent match between the RRTs
obtained experimentally and those
reported by the USP.
Figure 2Overlay of six replicate injections of the system suitability sample. The insert shows the full view ofthe replicate injections.
Overlay of 6 replicates
Full view of 6 replicates
Pra
vast
ati
n 1
,1,3
,3-t
etr
am
eth
ylb
uty
lam
ine
Re
late
d C
om
po
un
d A
25.0
22.5
20.0
17.5
02 4 6 8 10 12 14 16 18 20 22 min
200
400
600
800
1000
1200
mAU
15.0
12.5
10.0
7.5
5.0
2.5
7.2 7.4 7.6 7.8 8.0 8.2 8.4 8.6 8.8 9.0 9.2 9.4 9.6 9.8
Time [min]
mAU
Parameters Detail
Wavelength for VWD 238 nm
Column Agilent ZORBAX SB-C18, 4.6 x 75 mm, 3.5 μm
Diluent 50:50 methanol:water
Injection volume 10 μL
Needle wash Flush port, 3 sec using diluents
Sample temperature Ambient
Column temperature 25 °C
Mobile phase Buffer pH 7.0: 0.08 M phosphoric acid solution adjusted
with triethylamine to pH 7.0
Buffer A: Water:buffer pH 7.0:acetonitrile (52:30:18)
Buffer B: Water:buffer pH 7.0:acetonitrile (10:30:60)
Gradient Time % Buffer B
0 0
3.0 0
26.5 100
26.6 0
30 0
Post-time 3 min
Flow 1 mL/min
Table 1Instrument parameters.
Name USP-reported Experimentally obtained relative retention time relative retention time
3”-Hydroxypravastatin 0.33 -*
6’-Epipravastatin 0.92 0.91
3a-Hydroxyisocompactin 1.1 1.1
Pentanoyl impurity 1.2 -*
Pravastatin lactone 1.8 1.8
Compactin 3.1 3.1
Table 2Experimentally determined RRTs of four out of the six impurities reported in the USP method.
5989-9869EN163
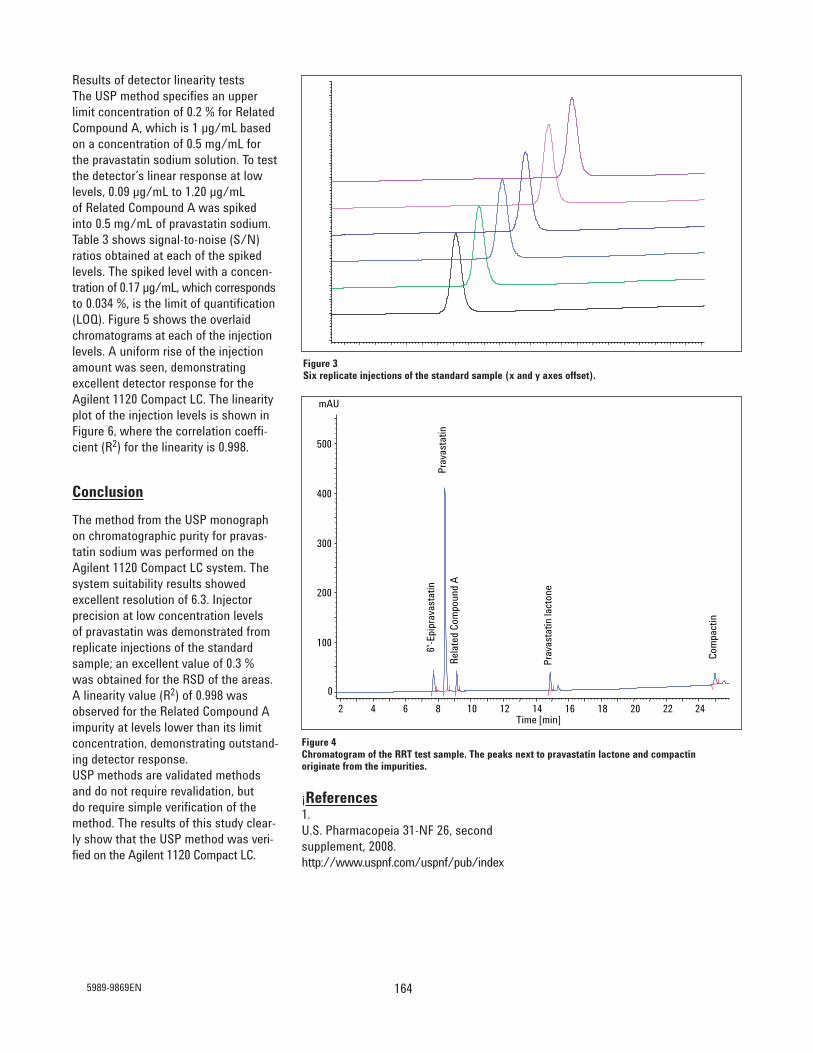
¡References1.
U.S. Pharmacopeia 31-NF 26, second
supplement, 2008.
http://www.uspnf.com/uspnf/pub/index
Results of detector linearity tests
The USP method specifies an upper
limit concentration of 0.2 % for Related
Compound A, which is 1 μg/mL based
on a concentration of 0.5 mg/mL for
the pravastatin sodium solution. To test
the detector’s linear response at low
levels, 0.09 μg/mL to 1.20 μg/mL
of Related Compound A was spiked
into 0.5 mg/mL of pravastatin sodium.
Table 3 shows signal-to-noise (S/N)
ratios obtained at each of the spiked
levels. The spiked level with a concen-
tration of 0.17 μg/mL, which corresponds
to 0.034 %, is the limit of quantification
(LOQ). Figure 5 shows the overlaid
chromatograms at each of the injection
levels. A uniform rise of the injection
amount was seen, demonstrating
excellent detector response for the
Agilent 1120 Compact LC. The linearity
plot of the injection levels is shown in
Figure 6, where the correlation coeffi-
cient (R2) for the linearity is 0.998.
Conclusion
The method from the USP monograph
on chromatographic purity for pravas-
tatin sodium was performed on the
Agilent 1120 Compact LC system. The
system suitability results showed
excellent resolution of 6.3. Injector
precision at low concentration levels
of pravastatin was demonstrated from
replicate injections of the standard
sample; an excellent value of 0.3 %
was obtained for the RSD of the areas.
A linearity value (R2) of 0.998 was
observed for the Related Compound A
impurity at levels lower than its limit
concentration, demonstrating outstand-
ing detector response.
USP methods are validated methods
and do not require revalidation, but
do require simple verification of the
method. The results of this study clear-
ly show that the USP method was veri-
fied on the Agilent 1120 Compact LC.
Figure 3Six replicate injections of the standard sample (x and y axes offset).
Figure 4Chromatogram of the RRT test sample. The peaks next to pravastatin lactone and compactin originate from the impurities.
Time [min]2 4 6 8 10 12 14 16 18 20 22 24
mAU
0
100
200
300
400
500
6'-
Ep
ipra
vast
ati
nP
rava
sta
tin
Re
late
d C
om
po
un
d A
Pra
vast
ati
n la
cto
ne
Co
mp
act
in
1645989-9869EN

Development, validation, and comparison ofan HPLC method to analyze paracetamol andrelated impurities according to the EuropeanPharmacopoeia (EP) and USP using theAgilent 1120 Compact LC and the Agilent1200 Series LC system
Abstract
This Application Note compares the results of the development of an accurate and
reproducible method to analyze paracetamol and related impurities according to
European Pharmacopoeia (EP) and USP regulations1, using an Agilent 1120 Compact
LC and a 1200 Series LC system. The experiments described in this Application Note
include the determination of the precision of areas and retention times, as well as chro-
matographic parameters such as resolution and signal-to-noise ratios. The well-suited
Agilent ZORBAX StableBond RP8 column shows good selectivity for this application.
The results of these experiments prove that the Agilent 1120 Compact LC is a reliable
instrument for routine testing that is able to fulfill the requirements of the European
and U.S. regulations and can produce results comparable to those of a standard
Agilent 1200 Series LC system.
Author
Detlef Wilhelm
ANATOX GmbH & Co. KG
Fuerstenwalde, Germany
Application Note
Pharmaceuticals
Minutes
0 5 10 15 20 25 30 35 40 45
mA
U
0
1
2
3
4
5
6
7
2.5
00
- I
mp
uri
ty K
3.6
13
- P
ara
ce
tam
ol
5.3
53
- I
mp
uri
ty B
6.6
33
- I
mp
uri
ty A
13
.24
0 -
Im
pu
rity
H
30
.42
0 -
Im
pu
rity
I
35
.51
3 -
Im
pu
rity
J
VWD: Signal A, 245 nm
Standard 2
Retention Time
Name
5990-3739EN165

IntroductionThe analytical instrumentation for rou-
tine analysis of samples with standard-
ized LC methods, especially for quality
control testing, have several require-
ments. Foremost are high reliability,
ease of use, and an optimal cost of
ownership.
This Application Note shows how the
Agilent 1120 Compact LC, in compari-
son with a standard Agilent 1200 Series
LC system, works as a highly robust
and reliable instrument for standard LC
methodology and can be used effective-
ly in a routine environment to efficiently
measure pharmaceutical compounds,
such as paracetamol and related
impurities.
According to the EP regulations, parac-
etamol impurities A, B, F, H, I, J, and K
were analyzed on both LC systems, and
system suitability and performance
tests were executed.
ExperimentalInstrumentationAn Agilent 1120 Compact LC system and a standard Agilent 1200 Series LC system
with the following configurations were used:
Configuration of the 1120 Compact LC Configuration of the 1200 Series system
Gradient pump and vacuum degasser Quaternary pump and vacuum degasser
Auto sampler Standard autosampler
Column oven Column compartment
Variable wavelength detector Diode array detector
Software: EZChrom Elite Compact 3.3 Software: ChemStation B.04.01
Chromatographic conditionsColumn Agilent ZORBAX StableBond-C8, 4.6 x 250 mm, 5 μm
Mobile phase Mix together 375 mL of a 17.9 g/L solution of disodium hydrogen
phosphate, 375 mL of a 7.8 g/L solution of sodium dihydrogen phos-
phate, and 250 mL of methanol containing 6 mL of a 400 g/L solution
of tetrabutylammonium hydroxide in methanol
Pump settings No gradient (in accordance with EP regulations)
Stop time 45 min
Flow rate 1.5 mL/min, isocratic
Injection volume 20 μL
Column compartment temp. 35 °C
Detector
1120 LC system 14 μL
1200 Series system 13 μL
Peak width 0.1 min (5 Hz)
Signal 245 nm
Preparation of samples The reference solution was prepared as follows, in accordance with EP regulations.
5 mg of paracetamol and 5 mg of each impurity were dissolved in methanol and
diluted to 20 mL with the same solvent. 1 mL of the solution was diluted to 250 mL
with mobile phase. The substances to be checked were paracetamol and impurities
K, A, B, H, I, J, and F.
System suitability and performance testThe EP regulations for paracetamol require system suitability testing with a refer-
ence solution, as described in Preparation of samples, above. The testing included
the following limits:
Resolution 4.0 minimum between peaks to impurity K and to paracetamol
Signal-to-noise ratio 50 minimum for the peak due to impurity J
Relative retentions Impurity K = 0.8
(paracetamol) Impurity F = 3
Impurity J = 7
1665990-3739EN

Sample Purpose Number of injections
Blank solution Verify baseline stability and identify 2
artifacts
Control sample Verify sensitivity and resolution for 6
reference solution
Suitability sample Verify precision of areas and retention 10
times for reference solution
Table 1Setup for testing.
No special regulations for paracetamol come from the USP. However, according to
USPC Official 8/1/08, General Chapter <621> (Chromatography, System Suitability,
p. 28) if there are no special requirements in the monographs, the data of five repli-
cate injections should have a relative standard deviation of less than 2% for each
calculated parameter.
From these above-mentioned requirements and to check and compare the chroma-
tographic performance of both LC systems, the following parameters were tested
and the limit settings below were fulfilled:
• Precision of areas must be < 2% RSD
• Precision of retention times must be < 0.5% RSD
• Resolution must be > 4 for impurity K and Paracetamol
• Signal-to-noise ratio must be > 50 for impurity J
With these limits and settings for testing, the samples in Table 1 were prepared and
analyzed.
5990-3739EN167

min5 10 15 20 25 30 35 40
mAU
0
1
2
3
4
5
2.4
99
- I
mp
uri
ty K
3.6
60
- P
ara
ce
tam
ol
5.4
54
- I
mp
uri
ty B
6.7
90
- I
mp
uri
ty A
13
.70
4 -
Im
pu
rity
H
31
.54
1 -
Im
pu
rity
I
37.
02
2 -
Im
pu
rity
J
Results and discussionFigure 1 shows a chromatogram
achieved with the 1200 Series system
and ChemStation, whereas Figure 2
shows the chromatogram yielded with
the 1120 Compact LC and EZChrom
Elite Compact. The data for both chro-
matograms, shown in Tables 2 and 3,
are very similar.
Figure 1 Example chromatogram of paracetamol and impurities with the Agilent 1200 Series system.
Minutes
0 5 10 15 20 25 30 35 40 45
mA
U
0
1
2
3
4
5
6
7
2.5
00
- I
mp
uri
ty K
3.6
13
- P
ara
ce
tam
ol
5.3
53
- I
mp
uri
ty B
6.6
33
- I
mp
uri
ty A
13
.24
0 -
Im
pu
rity
H
30
.42
0 -
Im
pu
rity
I
35
.51
3 -
Im
pu
rity
J
VWD: Signal A, 245 nm
Standard 2
Retention Time
Name
Figure 2Example chromatogram of paracetamol and impurities with the Agilent 1120 Compact LC.
1685990-3739EN

As shown in Figures 1, 2, and 3, the res-
olution and relative retention meet the
EP requirement for both paracetamol
and impurity F.
The results of the control sample,
shown in Table 2, fulfill all criteria. The
sensitivity was given for all peaks and
resolution was achieved for all relevant
compounds of the mixture. Not only for
impurity K and paracetamol, but for all
other relevant peaks the resolution was
greater than 4, showing very good
selectivity for the ZORBAX StableBond
RP8 material and the good performance
of the system. The data for peak sym-
metry (not shown) for all peaks ranged
from 0.88–1.02.
minutes5 10 15 20 25 30 35 40
mA
U
0
2.5
5
7.5
10
12.5
15
17.5
2.5
09
- I
mp
uri
ty K
3.6
64
- P
ara
ce
tam
ol
5.4
46
- I
mp
uri
ty B
6.7
62
- I
mp
uri
ty A
13
.61
7 -
Im
pu
rity
H
31
.27
7 -
Im
pu
rity
I
36
.68
9 -
Im
pu
rity
J
32
.72
1 -
Im
pu
rity
F
Figure 3Chromatogram with all relevant impurities.
Retention time (minutes) ResolutionAgilent 1200 Agilent 1120 Agilent 1200 Agilent 1120
Compound Series LC system Compact LC Series LC system Compact LC
Impurity K 2.498 2.507 – –
Paracetamol 3.659 3.620 7.19 7.03
Impurity B 5.454 5.353 9.22 9.04
Impurity A 6.792 6.633 5.75 5.51
Impurity H 13.716 13.240 19.52 18.35
Impurity I 31.562 30.387 26.25 24.89
Impurity J 37.066 35.480 5.47 5.03
Table 2Results for control sample: retention times and resolution.
5990-3739EN169
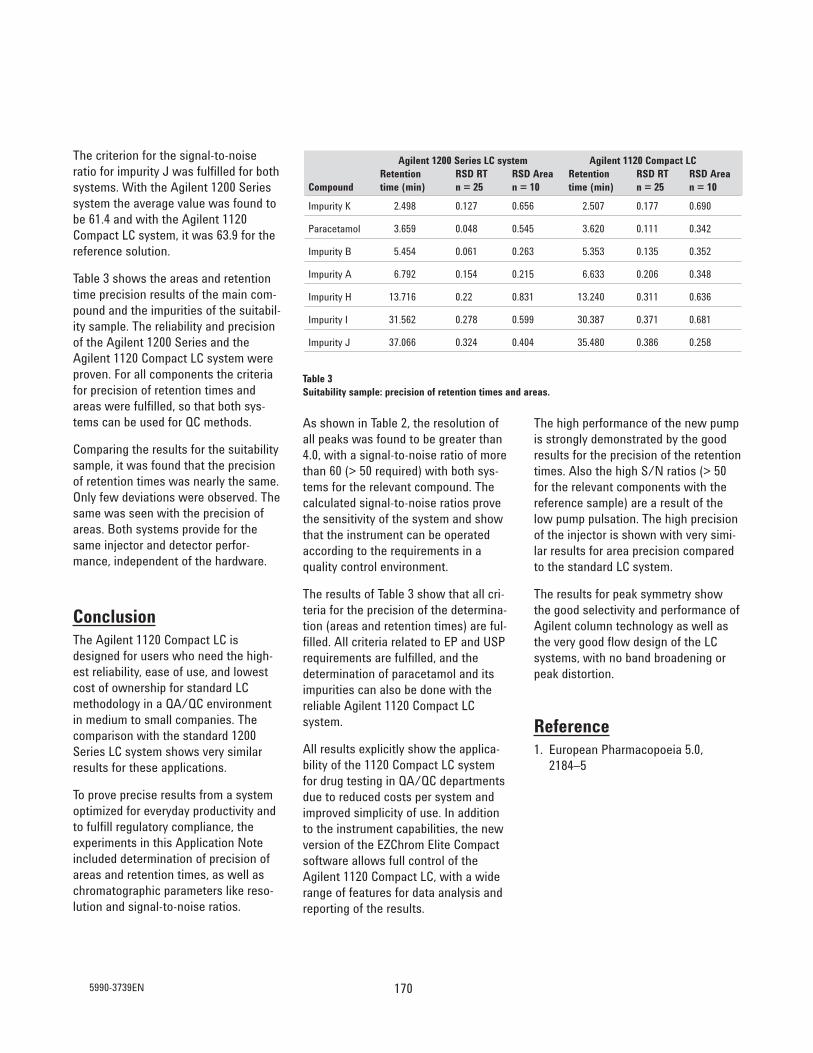
As shown in Table 2, the resolution of
all peaks was found to be greater than
4.0, with a signal-to-noise ratio of more
than 60 (> 50 required) with both sys-
tems for the relevant compound. The
calculated signal-to-noise ratios prove
the sensitivity of the system and show
that the instrument can be operated
according to the requirements in a
quality control environment.
The results of Table 3 show that all cri-
teria for the precision of the determina-
tion (areas and retention times) are ful-
filled. All criteria related to EP and USP
requirements are fulfilled, and the
determination of paracetamol and its
impurities can also be done with the
reliable Agilent 1120 Compact LC
system.
All results explicitly show the applica-
bility of the 1120 Compact LC system
for drug testing in QA/QC departments
due to reduced costs per system and
improved simplicity of use. In addition
to the instrument capabilities, the new
version of the EZChrom Elite Compact
software allows full control of the
Agilent 1120 Compact LC, with a wide
range of features for data analysis and
reporting of the results.
The high performance of the new pump
is strongly demonstrated by the good
results for the precision of the retention
times. Also the high S/N ratios (> 50
for the relevant components with the
reference sample) are a result of the
low pump pulsation. The high precision
of the injector is shown with very simi-
lar results for area precision compared
to the standard LC system.
The results for peak symmetry show
the good selectivity and performance of
Agilent column technology as well as
the very good flow design of the LC
systems, with no band broadening or
peak distortion.
Reference1. European Pharmacopoeia 5.0,
2184–5
The criterion for the signal-to-noise
ratio for impurity J was fulfilled for both
systems. With the Agilent 1200 Series
system the average value was found to
be 61.4 and with the Agilent 1120
Compact LC system, it was 63.9 for the
reference solution.
Table 3 shows the areas and retention
time precision results of the main com-
pound and the impurities of the suitabil-
ity sample. The reliability and precision
of the Agilent 1200 Series and the
Agilent 1120 Compact LC system were
proven. For all components the criteria
for precision of retention times and
areas were fulfilled, so that both sys-
tems can be used for QC methods.
Comparing the results for the suitability
sample, it was found that the precision
of retention times was nearly the same.
Only few deviations were observed. The
same was seen with the precision of
areas. Both systems provide for the
same injector and detector perfor-
mance, independent of the hardware.
ConclusionThe Agilent 1120 Compact LC is
designed for users who need the high-
est reliability, ease of use, and lowest
cost of ownership for standard LC
methodology in a QA/QC environment
in medium to small companies. The
comparison with the standard 1200
Series LC system shows very similar
results for these applications.
To prove precise results from a system
optimized for everyday productivity and
to fulfill regulatory compliance, the
experiments in this Application Note
included determination of precision of
areas and retention times, as well as
chromatographic parameters like reso-
lution and signal-to-noise ratios.
Agilent 1200 Series LC system Agilent 1120 Compact LCRetention RSD RT RSD Area Retention RSD RT RSD Area
Compound time (min) n = 25 n = 10 time (min) n = 25 n = 10
Impurity K 2.498 0.127 0.656 2.507 0.177 0.690
Paracetamol 3.659 0.048 0.545 3.620 0.111 0.342
Impurity B 5.454 0.061 0.263 5.353 0.135 0.352
Impurity A 6.792 0.154 0.215 6.633 0.206 0.348
Impurity H 13.716 0.22 0.831 13.240 0.311 0.636
Impurity I 31.562 0.278 0.599 30.387 0.371 0.681
Impurity J 37.066 0.324 0.404 35.480 0.386 0.258
Table 3Suitability sample: precision of retention times and areas.
1705990-3739EN

Determination of degradation productsof Metoprolol tablets with the Agilent1120 Compact LC after method develop-ment with the Agilent 1200 Series RapidResolution LC system
Abstract
Conventional LC methods used in routine analyses to characterize or monitor chemi-
cals are often standardized for quality control of pharmaceutical products. This
Application Note describes the analysis of several degradation products of metoprolol
with the Agilent 1120 Compact LC. The preceding method development was done
with the Agilent 1200 Series Rapid Resolution LC (RRLC) system.
This Application Note starts with the final result of method development, to prove
that no further development is necessary.1 It shows that the Agilent 1120 Compact LC
works as a reliable and highly robust instrument for standard LC methodology. The
transfer from rapid resolution separation material to conventional columns by the
Method Translator Software is shown. The results of system suitability and perfor-
mance tests prove the reliability and quality of the Agilent 1120 Compact LC system
for everyday quality control testing.
Authors
Detlef Wilhelm
ANATOX GmbH & Co. KG
Fuerstenwalde
Germany
Application Note
Pharmaceuticals
5990-4322EN171

IntroductionThe Agilent 1120 Compact LC was
designed to meet the highest require-
ments for analytical instrumentation
used in routine analysis. In the field of
quality control testing, products are
often characterized with standard LC
methods. Therefore, instruments used
for these purposes need optimal cost-
of-ownership, high reliability, high flexi-
bility, and ease of use.
In the last few years the method devel-
opment of new tests with a high-end
Agilent 1200 Series RRLC system
became familiar. In the Application
Note "Agilent 1200 Series LC Method
Development Solution for the analysis
of degradation products of metoprolol
tablets, Agilent Technologies publica-
tion 5989-9339EN" the results of the
Agilent method development solution
are shown.
This Application Note starts with the
final results of method development, to
prove that no further enhancement is
necessary. It then shows that the
Agilent 1120 Compact LC works as a
reliable and highly robust instrument
for standard LC methodology. It also
shows that the Agilent 1120 Compact
LC can be used for determinations after
back transfer from rapid resolution sep-
aration material to conventional
columns by the Agilent Method
Translator Software. The results of sys-
tem suitability and performance tests in
this Application Note prove the reliabili-
ty and quality of Agilent 1120 Compact
LC for everyday quality control testing.
InstrumentationFor method development an Agilent
1200 Series RRLC system and an
Agilent 1120 Compact LC with the fol-
lowing configurations were used:
H3OC
O
CH3
NH
CH3OH
H
H3OC
O
CH3
NH
CH3
OH
H
Structure of Metoprolol (both isomers)
Preparation of samples
Reference samples
Samples were prepared in the same
manner as those described in another
Application Note.1 Two 50-mg metro-
prolol tablets were powdered. One of
the samples was dissolved in water.
The other tablet was heated to 80 °C
for 3 hours, and the residue also dis-
solved in water. Both solutions were
two step filtered by syringe filters: first
by an Agilent p/n 5064-8222, 2-μm
filter followed by an Agilent p/n 5064-
8221, 0.45-μm filter. Five microliters of
the resulting liquids were injected.
Configuration of the Agilent 1200 Series Configuration of the Agilent 1120 Compact LCRapid Resolution LC System
Binary pump (low delay configuration) Gradient pump and vacuum degasser
and vacuum degasser
Wellplate autosampler Auto sampler
2 Column compartments Column oven
Diode array detector Variable wavelength detector
Software: ChemStation B.04.01 Software: EZ-Chrom Elite Compact 3.3
1725990-4322EN

System suitability and performance test
The following limits were used for sys-
tem suitability testing the reference
samples (see Reference Sample
Preparation):
Similar peak pattern according to sepa-
ration with rapid resolution
Precision of areas must be < 2 % RSD.
Precision of retention times must be
< 0.5 % RSD.
The following samples were prepared
and analyzed, using the limits and set-
tings recorded in Table 1.
Sample Purpose Number of injections
Blanc solution Verify baseline stability and identify artifacts 2
Suitability sample Verify precision of areas and retention times 10
for reference solution
Column For method development: Agilent ZORBAX StableBond C18, 50 mm ˘ 2.1 mm, 1.8 μm
For routine testing: Agilent ZORBAX StableBond C18, 150 mm ˘ 4.6 mm, 5 μm
Mobile Phase A: Water + 0.2% TFA
Mobile Phase B: Acetonitrile + 0.16% TFA
Gradient (linear): Time (min) % B
0 5
45 50
Pump settingsStop time: 45 min
Post time: 5 min
Flow rate: 2.0 mL/min
AutosamplerInjection volume: 15 μL
Thermostatted column compartmentTemperature: 30 °C
Detector 14 μL cell, Peak width: >0.05 min, 1 s response time (10 Hz),
Signal: 210 nm
Table 1Setup for testing.
Chromatographic conditions
5990-4322EN173

Results and discussionConditions for the method transfer were
chosen from the Agilent 1200 Series
RRLC method development system (see
Preparation of samples).
The first step was to select the same
column selectivity and column efficien-
cy. The efficiency for the 50 mm ˘
2.1 mm, 1.8 μm rapid resolution high
throughput (RRHT) column was esti-
mated to nearly 12000 plates whereas
for the 150 mm ˘ 4.6 mm, 5 μm conven-
tional column, 10700 plates were calcu-
The Agilent Method Translator software
calculates the new LC parameters,
which should be used as starting condi-
tions. Some parameters such as the dif-
ferent delay volumes of the pumps and
different types of gradient mixing (high
pressure versus low pressure) could
not be converted satisfactorily. Some-
times these parameters must be adapt-
ed by experimentally optimizing the gra-
dient steps.
lated. Agilent provides materials with
the same selectivity independent of the
particle size. As a final result of method
development, the Agilent ZORBAX
StableBond C18 material was found to
separate all compounds.
According to these data, the RRLC para-
meters were transferred into the
Agilent Method Translator to transform
them to parameters suitable for con-
ventional HPLC systems by selecting
the simple conversion option (see
Figure 1).
Figure 1Conversion of LC parameters found by rapid resolution to parameters suitable for conventional HPLC with Method Translator software.
1745990-4322EN

After transfering the parameters from
the 50 mm ˘ 2.1mm, 1.8 μm RRHT col-
umn to the 150 mm ˘ 4.6 mm, 5 μm col-
umn, the analysis of pure metoprolol
tablets with the Agilent 1120 Compact
LC system and EZ-Chrom Elite Compact
Software obtained chromatograms simi-
lar to those in Figure 2. As a result of
the Method Translator, the flow was set
to 2 mL/min, which prolonged the
analysis time without any influence on
the resolution.
The chromatogram in Figure 3 shows
the appropriate separation of the degra-
dation products from the Metoprolol
peak. With the variable wavelength
detector, several peaks at 210 nm are
detected. The pattern looks very similar
to the pattern obtained after separation
with the Agilent 1200 Series RRLC sys-
tem (see “Preparation of samples”). Minutes
0.0 5.0 10.0 15.0 20.0 25.0 30.0 35.0 40.0 45.0
mA
U
_400
_200
0
200
400
600
800
1000
1200
1400
1600
1800
2000
19
.49
0 M
eto
pro
lol
Figure 2Analysis of metoprolol tablet after powdering, dissolving in water and filtering.
mA
U
0
500
1000
1500
3.2
17
3.4
43
3.6
77
3.9
13
6.7
47
14
.37
3
16
.14
7
16
.95
31
7.3
67
17.
96
01
8.6
07
19
.69
7 M
eto
pro
lol
21
.05
32
1.8
60
VWD: Signal A, 210 nm
Metoprolol
Retention Time
Name
Minutes
0.0 5.0 10.0 15.0 20.0 25.0 30.0 35.0 40.0 45.0
Figure 3Analysis of a "stressed" metoprolol tablet after powdering, dissolving in water and filtering.
5990-4322EN175
Compared to the results obtained with
the Agilent 1200 Series RRLC system
(see Table 2) the chromatogram in
Figure 3 shows that the elution order
has not changed. It shows that the
selectivity does not change with the
particle size. Detailed data for some
selected peaks (see Figure 4) are listed
in Table 3. As a main result it can be
emphasized that it is possible to trans-
fer LC parameters from rapid resolution
by the Method Translator to conven-
tional LC systems and columns with
5-μm particles.
The adaptation of method development
results with rapid resolution to the
Agilent 1120 Compact LC was success-
ful. The appropriate separation with the
Agilent ZORBAX StableBond C18 mate-
rial is proven by the data shown in
Table 3. High resolution for every peak
> 2 shows that this column material is
highly suitable for the determination of
the degradation peaks of Metoprolol.
To demonstrate the reliability and preci-
sion of the Agilent 1120 Compact LC
the suitability sample was analyzed 10
times. The data presented in Table 4
show the areas and retention time pre-
cision results of all compounds.
To use the system for QC methods the
criteria (see System suitability and per-
formance test) must be fulfilled for all
compounds due to strong limits . The
data for precision of retention times
and areas show that all data are within
the limits.
The high precision of retention times
for all components is also a result of
performance and reliability of the pump-
ing system. The high reproducibility of
the autosampler is best shown by the
data for area precision. These data allo-
cate the Agilent 1120 Compact LC to be
used for QC testing.
Parameter Agilent 1200 SL System Agilent 1120 Compact LC System
Column-dimensions 50 mm x 2.1 mm 150 mm x 4.6 mm
Particle-size 1.8 μm 5 μm
Flow 0.50 mL/min 2.0 mL/min
Temperature 30 °C 30 °C
Gradient time 0-15 min 0–45 min
Composition 5% to 50% 5% to 50%
Delay volume Low delay (120 μL) Normal delay (approx. 1 mL)
Table 2Detailed parameters for instrument setup.
VWD: Signal A, 210 nm
Metoprolol_5.1
Retention Time
Name
6.7
47
De
gra
da
tio
n P
ea
k 1
14
.37
7 D
eg
rad
ati
on
Pe
ak
2
16
.14
7 D
eg
rad
ati
on
Pe
ak
3
17.
95
7 D
eg
rad
ati
on
Pe
ak
4
19
.68
0 M
eto
pro
lol
21
.07
0 D
eg
rad
ati
on
Pe
ak
5
Minutes
0.0 5.0 10.0 15.0 20.0 25.0 30.0 35.0 40.0 45.0
mA
U
0
500
1000
1500
Figure 4Selection of some representative peaks of a “stressed” metoprolol tablet for evaluating thestability of the separation.
Retention-timeCompound (min) Resolution
Degradation peak 1 6.747 –
Degradation peak 2 14.377 37.84
Degradation peak 3 16.147 8.02
Degradation peak 4 17.957 5.23
Metoprolol 19.680 2.78
Degradation peak 5 21.070 2.25
Table 3Results for retention times and resolution.
Retention-time RSD RT RSD AreaCompound (min) n=10 n=10
Degradation peak 1 6.747 0 0.633
Degradation peak 2 14.377 0.023 0.747
Degradation peak 3 16.147 0.016 0.702
Degradation peak 4 17.957 0.048 0.601
Metoprolol 19.680 0.063 0.664
Degradation peak 5 21.070 0.048 0.895
Table 4Suitability sample: Precision of retention times and areas .
1765990-4322EN

5990-4322EN177
ties, the new version of the EZChrom
Elite compact software allows the full
control of the Agilent 1120 Compact LC
with a wide range of features for data
analysis and reporting of results.
The high resolution results show that
selectivity and performance of the
Agilent ZORBAX StableBond material
is independent of the particle size. The
data also show that the design of the
LC systems eliminates band broadening
and peak distortion, and enhances the
method transfer. In summary, an Agilent
1200 Series RRLC system provides fast
method development and back transfer
of results to conventional HPLC. The
Agilent 1120 Compact LC is qualified for
such an approach and meets the high-
est requirements for ordinary productiv-
ity.
References1.
Agilent 1200 Series LC Method
Development Solution for the analysis
of degradation products of Metoprolol
tablets, Agilent Technologies publica-
tion 5989-9339EN, 2009
ConclusionThe Agilent 1120 Compact LC was
designed for conventional chromatogra-
phy. Users from medium to small size
companies, who have high require-
ments of reliability, ease-of-use and
lowest cost-of-ownership for standard
LC methodology in a QA/QC environ-
ment should be supported with this
compact nonmodular LC system.
This Application Note shows the easy
transfer of parameters determined by
method development with Rapid
Resolution (see Table 2). This approach
is reliable and provides precision of
areas and retention times, and high
chromatographic resolution. The results
show a system optimized for everyday
productivity, which meets the highest
requirements for routine analysis.
With the results shown in Table 3 the
resolution of all main peaks was found
to be greater than 2. The results in
Table 4 show that all criteria for the pre-
cision of determination, such as area
and retention times are fulfilled. The
results allow the use of the Agilent
1120 Compact LC in QA/QC laborato-
ries to determine degradation products
of Metoprolol tablets.
All results show the applicability of the
Agilent 1120 Compact LC for quality
control testing with reduced costs per
system and improved simplicity of use.
In addition to the instrument capabili-

178

179
Pump
Hydraulic system Dual plunger in series pump with proprietary servo-controlled variable stroke drive, fl oating plungers and passive inlet valve
Settable fl ow range 0.001 – 10 mL/min, in 0.001 mL/ min increments
Flow range 0.2 – 10 mL/min
Flow precision <0.07 % RSD, or < 0.02 min SD whatever is greater, based on retention time at constant room temperature
Flow accuracy ± 1 % or 10 µL/min whatever is greater
Pressure Operating range 0 – 60 MPa (0 – 600 bar, 0 – 8700 psi) up to 5 mL/min
Operating range 0 – 20 MPa (0 – 200 bar, 0 – 2950 psi) up to 10 mL/min (all versions)
Pressure pulsation < 2 % amplitude (typically < 1 %), at 1 mL/min isopropanol, at all pressures > 1 MPa (10 bar)
Recommended pH range
1.0 – 12.5, solvents with pH < 2.3 should not contain acids which attack stainless steel
Gradient formation (gradient pump or optional; two solvents)
Low pressure dual mixing/gradient capability using proprietary high-speed proportioning valve
Delay volume 800 – 1100 µL, dependent on back pressure
Composition range 0 – 95 % or 5 – 100 %, user selectable
Sampler
Pressure Operating range: 0 – 60 MPa (0 – 600 bar, 0 – 8700 psi)
Injection range 0.1 – 100 µL in 0.1 µL increments Up to 1500 µL with multiple draw (hardware modifi cation required)
Replicate injections 1 – 99 from one vial
Precision < 0.25 % RSD from 5 – 100 µL, < 1% RSD 1 – 5 µL variable volume
Minimum sample volume
1 µL from 5 µL sample in 100 µL microvial, or 1 µL from 10 µL sample in 300 µL microvial
Carryover Typically < 0.1 %, < 0.05 % with external needle cleaning
Sample viscosity range
0.2 – 50 cp
Sample capacity 100 × 2-mL vials in 1 tray40 × 2-mL vials in ½ tray15 × 6-mL vials in ½ tray (Agilent vials only)
Injection cycle time Typically 50 s depending on draw speed and injection volume
Column Oven
Temperature range 5 °C above ambient to 80 °C
Temperature stability
± 0.15 °C
Temperature accuracy
± 0.8 °C with calibration ± 0.5 °C
Column capacity One 25-cm column
Variable Wavelength Detector (G4286B, G4288B, G4290B)
Light source Deuterium lamp
Wavelength range 190 – 600 nm
Short term noise ± 0.35 × 10⁻⁵ AU, at 230 nm
Drift 3 × 10⁻⁴ AU/hr, at 254 nm
Linearity > 2 AU (5 %) upper limit
Wavelength accuracy
± 1 nm; self-calibration with deuterium lines, verifi cation with holmium oxide fi lter
Band width 6.5 nm typical
Diode Array Detector (G4294B only)
Detector type 1024-element diode array
Light source Deuterium and tungsten
Number of signals 8
Maximum sampling rate
80 Hz
Short-term noise < ± 0.7 x 10⁻⁵ AU at 254/4 nm and at 750 nm, TC 2 s
Drift < 0.9 x 10⁻³ AU/hr at 254 nm
Linearity > 2.0 AU (5 %) at 265 nm
Wavelength range 190-950 nm
Wavelength accuracy
± 1 nm, self-calibration with deuterium lines verifi cation with holmium oxide fi lter
Slit width Programmable: 1, 2, 4, 8, 16 nm
Diode width < 1 nm
Specifi cations of the Agilent 1220 Infinity LC System
www.agilent.com/chem/1220
© Agilent Technologies, Inc., 2009-2013
Published in the USA, April 1, 2013
5991-1023EN


![Q1_FY_2012_final_290711.ppt [Read-Only] [Compatibility ... - Infinity](https://static.fdokumen.com/doc/165x107/63207975e9691360fe01ce09/q1fy2012final290711ppt-read-only-compatibility-infinity.jpg)