Urine Microscopy Findings Predict Outcomes In Hospitalized ...
43
Yale University EliScholar – A Digital Platform for Scholarly Publishing at Yale Yale Medicine esis Digital Library School of Medicine January 2011 Urine Microscopy Findings Predict Outcomes In Hospitalized Patients With Acute Kidney Injury Patricia Peter Follow this and additional works at: hp://elischolar.library.yale.edu/ymtdl is Open Access esis is brought to you for free and open access by the School of Medicine at EliScholar – A Digital Platform for Scholarly Publishing at Yale. It has been accepted for inclusion in Yale Medicine esis Digital Library by an authorized administrator of EliScholar – A Digital Platform for Scholarly Publishing at Yale. For more information, please contact [email protected]. Recommended Citation Peter, Patricia, "Urine Microscopy Findings Predict Outcomes In Hospitalized Patients With Acute Kidney Injury" (2011). Yale Medicine esis Digital Library. 1583. hp://elischolar.library.yale.edu/ymtdl/1583
-
Upload
khangminh22 -
Category
Documents
-
view
0 -
download
0
Transcript of Urine Microscopy Findings Predict Outcomes In Hospitalized ...

Yale UniversityEliScholar – A Digital Platform for Scholarly Publishing at Yale
Yale Medicine Thesis Digital Library School of Medicine
January 2011
Urine Microscopy Findings Predict Outcomes InHospitalized Patients With Acute Kidney InjuryPatricia Peter
Follow this and additional works at: http://elischolar.library.yale.edu/ymtdl
This Open Access Thesis is brought to you for free and open access by the School of Medicine at EliScholar – A Digital Platform for ScholarlyPublishing at Yale. It has been accepted for inclusion in Yale Medicine Thesis Digital Library by an authorized administrator of EliScholar – A DigitalPlatform for Scholarly Publishing at Yale. For more information, please contact [email protected].
Recommended CitationPeter, Patricia, "Urine Microscopy Findings Predict Outcomes In Hospitalized Patients With Acute Kidney Injury" (2011). YaleMedicine Thesis Digital Library. 1583.http://elischolar.library.yale.edu/ymtdl/1583

Urine Microscopy Findings Predict Outcomes in Hospitalized Patients with Acute
Kidney Injury
A Thesis Submitted to the
Yale University School of Medicine
in Partial Fulfillment of the Requirements for the
Degree of Doctor of Medicine
by
Patricia Peter
2011

ABSTRACT URINE MICROSCOPY FINDINGS PREDICT OUTCOMES IN HOSPITALIZED
PATIENTS WITH ACUTE KIDNEY INJURY
Patricia R. Peter, Isaac E. Hall, Steven G. Coca, and Chirag R. Parikh. Section of
Nephrology, Department of Internal Medicine, Yale University School of Medicine, New
Haven, CT
Though urine microscopy has long been highly regarded by nephrologists as an essential
diagnostic tool, its potential utility in predicting outcome in acute kidney injury (AKI)
warrants further exploration. In this study, urine sediment microscopy was performed on
165 hospitalized patients on the first day of their clinical AKI diagnosis to determine
whether microscopy findings early in the course of this disease correlate with
“worsening,” a composite of increasing AKI stage and in-hospital mortality. Microscopy
findings were recorded as individual cells and casts along with a microscopy score
derived from renal tubular epithelial (RTE) cells and granular casts. Our data suggest
that both increasing numbers of granular casts and a higher microscopy score are
predictive of overall worsening (p = 0.027 and p = 0.046, respectively), but other
microscopy features such as the number of RTE cells are not. These data demonstrate
that urine microscopy even at the time of initial diagnosis can be predictive of eventual
outcome, potentially serving as a useful adjunct to clinical and other biochemical data in
the study of AKI.
ACKNOWLEDGEMENTS
I would like to thank Dr. Chirag Parikh for mentoring me over the past several
years on this project and for providing me with invaluable guidance. I would like to
thank Isaac Hall for all of his hard work, boundless patience, and incredible amount
assistance. I would also like to thank Steven Coca, Umo Iyanam, Madiha Koraishy, and
other members of the lab who assisted with various portions of this project.
Additionally, I would like to thank my closest friends for being such important
sources of support, comfort, and laughter for me throughout medical school: Janet
Chiang, Michael Ma, Henry Park, Sascha Qian, and John Thomas. Last but not least, I
would like to thank my wonderful parents for making me who I am today and my furry
younger brother, Pippin, for his unconditional love.

1
TABLE OF CONTENTS
Introduction
Uroscopy: Early Physicians and the Art of Looking at Urine 2
A Brief History of Urine Microscopy 4
Limitations of Urine Microscopy and Future Directions 8
Acute Kidney Injury: Definition, Pathophysiology and Clinical Features 10
Urine Microscopy’s Role in the Study of Acute Kidney Injury 15
Goals of This Study 21
Methods 22
Results 26
Discussion 32
References 36

2
INTRODUCTION
Uroscopy: Early Physicians and the Art of Looking at Urine
As urine was one of the most readily available and easily accessible bodily fluids,
early physicians and scientists focused their efforts on gleaning all the information they
could about the mysterious workings of the human body by noting the physical
characteristics of urine, a process known as uroscopy. Though ancient Sanskrit and
Sumerian texts indicate that several ancient civilizations were making important
observations about the properties of urine, it is the Greeks and Hippocrates, in particular,
who are often credited with being the first uroscopists (1). Hippocrates’ treatise,
Prognostics, became one of the most widely propagated texts on the subject of uroscopy,
delineating the properties of urine that would be studied for many centuries to follow
including its color (white, red, black), consistency (thin, thick, watery, clear, cloudy),
sediment (smooth, leafy, farinaceous, absent), odor (fetid), and volume (deficient) (2).
Hippocrates’ initial observations were later expanded by the Roman physician Galen who
believed that the study of the urine was an important means of determining the relative
balance of the four humors (blood, phlegm, yellow and black bile), which he
hypothesized were the determinants of disease (2).
By the 13th century, uroscopy was a well-established field and efforts were being
made to improve its scientific accuracy. In order to view the urine more clearly and to
more accurately describe its properties, physicians debated the appropriate characteristics
of the vessel in which urine should be stored. Since it was believed that urine would
behave most physiologically in a receptacle that was bladder-shaped, the matula was
born, a clear glass vessel with a rounded-bottom that was held up to the light for best
3
inspection of the urine held within (1). Uroscopy had become so entrenched in the
practice of medicine that soon after the matula was introduced into common practice, it
quickly became the symbol of the Medieval physician and was widely depicted in art of
the time (2). The matula itself would undergo many changes throughout the centuries,
gradually acquiring increasing layers of complexity. In fact, by the 16th century, the
matula had become human-body shaped and had been subdivided into twenty-four levels
in an effort to improve the precision of diagnosis. It was thought that the urine vapors
would congregate into the level corresponding to the diseased body part (2).
In fact, so much store was set in the powerful diagnostic value of uroscopy that by
the 14th century, it quickly became subject to much abuse. Charlatans began dabbling in
the art of uroscopy, recognizing its moneymaking potential. These unscrupulous quacks
would offer to analyze the urine of their unsuspecting public, come to an outrageous
diagnosis, and offer their now terrified ‘patient’ an incredibly expensive ‘cure’(2).
Ironically, physicians were in no small part contributing to this behavior. As their
confidence in their uroscopy skills grew, physicians began claiming that physical
examination of the patient had been rendered unnecessary as all necessary diagnostic
information could be obtained by examination of the urine (2). Textbooks on uroscopy
became available to the general public so that people began diagnosing and treating
themselves after observing the characteristics of their own urine (1). By the late 16th
century, the excesses of the field had grown to such a degree that ‘uromancy’ was born
which focused on divining the future from examination of the urine (1).
In response to these excesses, the 16th century saw a backlash against the practice
of examining urine in diagnostic medicine. Author Thomas Brian wrote Pisse Prophet in

4
1637, a scathing attack on uroscopy which quickly made the matula and physicians who
used it the subject of much ridicule and scorn (1). Thomas Linacre, the founding
president of the College of Physicians in England, instituted a statute preventing
physicians from continuing the practice of examining urine in lieu of examining their
patients, and members of the college began producing works that favored a more
measured view of the benefits and limits of uroscopy (2). The Enlightenment’s focus on
rationality and science helped shift the focus of uroscopy from the observable physical
characteristics of urine to a more sophisticated biochemical analysis of urine’s
components, a shift that would be aided immensely by the invention of the microscope.
A Brief History of Urine Microscopy
Though the first observation of the urine with the aid of a microscope was likely
performed in the 17th century, technology at the time was rudimentary at best and so the
analyses possible at that time were also. Early uses of microscopy focused on the study
of kidney stones as this was a disease of the rich and one in which microscopic analysis
of the urine for stone precursors was thought to be quite promising (3). Urine
microscopy remained quite limited until the first half of the 19th century when advances
in the technology and availability of microscopes made it possible for the field of urine
microscopy to grow and begin to contribute to our understanding of renal pathology.
Three Frenchmen share the distinction of being some of the earliest physicians to
perform sophisticated analyses of urine via microscopy: Pierre Rayer, a physician at
l’Hôpital de la Charité in Paris, his intern, Eugène Vigla, and their contemporary and
academic rival, Alfred Donné (4). Though Donné published some of the first
daguerrotypes of the microscopic elements of urine, it was truly Rayer and Vigla who
5
more methodically described and more clearly articulated the potential clinical
implications of their findings (3). Their extensive findings were initially published in the
French journal l’Expérience in 1835 before being included in a comprehensive textbook
Traité des maladies des reins (4). Rayer and Vigla developed the first standards of how
to properly handle urine and identified important microscopic constituents of urine
including crystals, squamous cells, mucus, pus, blood, lipids, sperm, yeast, and possibly
even casts (4). They also began to recognize and describe the microscopic appearance of
clinical syndromes, recognizing the potential utility of microscopy in clinical nephrology.
For example, they noted that in acute nephritis there was often a collection of blood,
mucus, squamous cells, and fibrin in the urine while in nephrotic syndrome they
described thin lamellae of amorphous substance (possibly casts), mucus, lipids, blood,
and uric acid crystals (5). Thus, even when in its infancy, urine microscopy was found to
have observable patterns that not only correlated with clinical findings but could perhaps
be instrumental in differentiating between clinical syndromes.
These early advances in France led to a wave of discovery in England and
Germany, the leading scientific nations at the time. Johann Simon in Germany focused
on casts, recognizing them as different in character and appearance from other cells in the
urine. He and other German scientists Julius Vogel and Hermann Nasse first understood
that the casts they were identifying were derived from the tubular epithelium (4).
Meanwhile, in England, Golding Bird published Urinary deposits. Their diagnosis,
pathology, and therapeutical indications in 1844, a work that expanded on many of the
findings of his French colleagues and introduced microscopy to the English scientific

6
community (4). Bird’s work was limited in that its primary focus was on crystals with
only one chapter focusing on the noncrystalline elements of urine (3).
The second half of the 19th century saw further improvements in the technology of
lenses, leading to improved image quality and thus, to further advances in the field of
urine microscopy. The concept of staining was also being introduced to the field at this
time, a key development that would allow the Italian scientist Carlo Rovida to make the
observation that casts were composed of a unique protein which would only be identified
almost a century later (3). Centrifugation of the urine sample prior to microscopy also
became standard practice, ensuring that all the salient features of the sediment were
captured and examined. By the end of the century, atlases were published around the
world carefully detailing the typical urine sediment found in different renal diseases and
urine microscopy was beginning to be incorporated in medical school curricula in North
America, signs that urine microscopy was becoming a well-established part of clinical
practice.
In the 20th century, urine microscopy as practiced today was perfected. In the
1920s the Scottish-American Thomas Addis did his famous studies on his
glomerulonephritis patients, following their urines serially and noting that their sediment
findings would become blander as their disease transitioned from the acute phase to the
chronic. He also developed his own method of quantifying urine microscopy findings
using collection of timed urine and counting chambers, a method that would eventually
be named after him and which is still in use today (3). With this method, Addis was able
to describe ‘renal failure casts,’ broad casts that were found in extremely high quantities
in the urine of patients who were dying of uremia (6).

7
Table 1 Urinalysis findings in renal disease The latter half of the 20th century saw
the introduction of new types of microscopy
to the study of the urine, including
immunofluorescence, transmission electron
microscopy and phase contrast, the first of
which would be instrumental in the
identification of Tamm-Horsfall glycoprotein
in the matrix of casts (9). Phase contrast
microscopy was quickly recognized as far
superior to its predecessor, as it allowed for
more precise visualization of structures in the
sediment (10). In the 1980s, interest in urine
microscopy was renewed when Fairley and
colleagues noted that the morphology of
RBCs could be a useful key to distinguishing
glomerular from non-glomerular hematuria (11).
Component Clinical significanceCellular Eosinophils AIN, atheroembolic disease,
pyelonephritis, glomerular disease
Granulocytes infection, nephritis Red blood cells (dysmorphic RBCs)
glomerular disease
RTE cells AKI, AIN, glomerular disease Uroepithelial cells
neoplasia, stones, UTI
Casts Hyaline non-specific, normal finding Granular ATN Waxy chronic renal impairment Fatty nephrotic syndrome RBC casts glomerular disease WBC casts AIN, pyelonephritis,
glomerular disease RTE cell casts ATN, AIN, nephrotic
syndrome, glomerular disease
Other Lipids nephrotic syndrome Bacteria infection Crystals inherited metabolic disorders,
toxins
AIN = allergic interstitial nephritis; UTI = urinary tract infection Adapted from DeLanghe 2000 (7) and Fogazzi 2011 (8)
Thus, the study of the urine, whether with the eye as in ancient times or more
recently with the aid of microscopy, has always played been an important role in
improving our understanding of renal diseases. As a result of the work of these
pioneering scientists and physicians, sophisticated interpretation of urinalysis is now
routine and serves a useful tool in the diagnosis of kidney pathology (see Table 1).

8
Limitations of Urine Microscopy and Future Directions
Despite its well-established place as a diagnostic tool in the field of nephrology,
urine microscopy does not come without its limitations, most of which have been well-
documented (7). Primary among these limitations is the considerable variability inherent
in the technique in everything from how samples are prepared to who or what is
analyzing them. A study by Winkel et al in 1978 methodically explored many of these
sources of error, concluding that the greatest source of error lay in sample preparation,
especially in centrifugation (12, 13).
In addition to questions of how best to prepare and handle samples, there has been
some debate as to the best means of quantifying urine sediment findings. The typical
method involves counting the number of cells per high power field (HPF) which is a
lower cost and less labor intensive method than chamber counting, a more quantitative
technique which allows for identifying cellular elements per mL of sample. One study by
Kesson et al showed that in a series of 88 duplicate urines, abnormal numbers of casts or
white or red blood-cells were detected by the quantitative method in 74% of patients with
abnormal renal function but in only 36% by the HPF method (14). Though it is known
that urine sediment findings are imprecisely recorded with the HPF method, current
guidelines still recommend this method over chamber counting because its ease of use
and low cost make it much more feasible in daily practice (15).
Another much noted source of considerable error is of course interobserver
variability. A study by Tsai et al found that this variability could potentially have a
significant impact on a physician’s ability to make the proper diagnosis. Urine samples
were taken from 26 patients diagnosed with acute kidney injury (AKI) who were seen by

9
the nephrology consultation service. These samples were independently analyzed by a
nephrologist (nephrologist A) and by the hospital laboratory technicians. Nephrologist A
correctly diagnosed the cause of AKI in 24 patients (92%) after his examination of the
urine while nephrologist B, given only the laboratory UA report, was correct only 5 times
(19%), improving to 69% (18 patients) after reviewing nephrologist A’s UA report. Both
nephrologists were blinded to the patient’s clinical history. Significant differences
existed between nephrologist A’s microscopy report compared with the clinical
laboratory’s report with nephrologist A reporting a higher number of RTE cells (P <
0.0001), granular casts (P = 0.0017), hyaline casts (P = 0.0233), and RTE casts (P =
0.0008). There were no significant differences in the reporting of other urinary
sediments, including WBCs, WBC casts, RBCs, RBC casts, transitional epithelial cells,
oval fat bodies, bacteria, yeast, and crystals (16). These findings argue for the
importance of relying on trained observers in analyzing urine microscopy. However, as
shown recent study by Wald et al., interobserver variability can be significant even
amongst highly trained nephrologists. Ten nephrologists of different levels of experience
were asked to identify structures in the microscopy images of 86 patients who had been
seen by the nephrology service. Using the ĸ statistic to determine the level of agreement,
they found that squamous epithelial cells (κ = 0.54) and hyaline casts (κ = 0.52) had the
highest levels of interobserver agreement, while identification of transitional epithelial
cells (κ = 0.14) and fatty casts (κ = 0.06) had the lowest levels. They also measured
overall agreement in the presence or absence of a structure, finding that complete
agreement for most types of casts was generally better (59%-79%) than for most cellular
elements (31%-39%) with the notable exception of coarse and fine granular casts (32%

10
and 37%, respectively) (17). Thus, even in identification of simple cellular elements,
measurable and significant variability can exist between trained observers.
Different types of microscopy also offer their own advantages and disadvantages.
Though traditional bright field microscopy is easiest and often most commonly used, its
relatively poor visualization capabilities make it difficult to distinguish bacteria from
amorphous debris or leukocytes from small tubular cells (10). In fact, all of the most
recent urinalysis guidelines put out by Finnish, Japanese, and European societies note to
the inadequacy of bright field microscopy even if accompanied by supravital staining,
recommending phase contrast microscopy instead (10, 15).
In an effort to minimize these potential sources of error and to improve
standardization and reliability of urine microcopy results, there has been a move towards
automated microscopy over manual microscopy in the field. Several studies have shown
that the automated systems currently in use (ie the Sysmex UF-100, sediMAX, and the
Iris iQ200) are more precise than manual techniques in identifying cellular elements
though not casts (18-21). Even as technology evolves and automated identification of
casts improves, nephrologists undoubtedly will continue to rely on a combination of
automated and manual techniques to assist them in their study of renal diseases.
Acute Kidney Injury: Definition, Pathophysiology and Clinical Features
Acute kidney injury (AKI), formerly known as acute renal failure, affects
somewhere between 2-18% of all hospitalized patients and as many as 25-30% of
patients in the ICU (22). Though it has been recognized as a disease entity since World
War II, there had been as many as 35 different definitions of the disease in the literature
until 2002 when the Acute Dialysis Quality Initiative (ADQI) sought to establish a

11
consensus definition to facilitate the production of more precise and accurate research on
the subject (23). They proposed the Risk, Injury and Failure, Loss of function and End-
stage kidney disease (RIFLE) staging system which defined three stages of severity of
AKI (risk, injury, failure) based on serum creatinine (Scr) and urine output criteria and
included two outcome criteria (loss and end-stage renal disease) based on duration of
RRT therapy (22) (see Table 2). Subsequent studies have indicated that even more
modest changes in creatinine could lead to significant morbidity, prompting a re-
evaluation of the definition and staging system in 2005 by the Acute Kidney Injury
Network (AKIN) (24-26) (see Table 2). Though some recent studies have suggested that
the new criteria have failed to show any improvement in predicting outcomes over the
RIFLE criteria, the potential advantages of this new staging system have yet to be fully explored (27, 28). Table 2 RIFLE and AKIN staging systems Criteria Serum creatinine Urine output Drop in GFRA RIFLE Risk ↑SCr ≥ 1.5 * baselineB <0.5ml/kg/h ≥ 6h ≥25% Injury ↑SCr ≥ 2.0 * baseline <0.5ml/kg/h ≥ 12h ≥50% Failure ↑SCr ≥ 3.0 * baseline or
↑SCr ≥ 0.5mg/dL from baseline or SCr ≥ 4.0mg/dL
<0.3ml/kg/h ≥ 24h or anuria ≥ 12h
≥75%
Loss Loss of kidney function >4wks
ESRD Loss of kidney function >3mos
AKIN Stage 1 ↑SCr ≥ 1.5 * baselineC or
↑SCr ≥ 0.3mg/dL from baseline <0.5ml/kg/h ≥ 6h
Stage 2 ↑SCr ≥ 2.0 * baseline <0.5ml/kg/h ≥ 12h Stage 3 ↑SCr ≥ 3.0 * baseline or
↑SCr ≥ 0.5mg/dL from baseline or SCr ≥ 4.0mg/dL or initiation of RRT
<0.3ml/kg/h ≥ 24h or anuria ≥ 12h
A Only one of the three RIFLE criteria has to be fulfilled to qualify for a specific stage B Baseline SCr is considered to be within one week for RIFLE C Baseline SCr is considered to be within 48 hours for AKIN AKIN = Acute Kidney Injury Network; ESRD = End-stage renal disease; RIFLE = Risk, Injury, and Failure, Loss of function and ESRD; RRT = renal replacement therapy Table adapted from Lines 2009 (21)

12
The most common cause of AKI is ischemic injury, the pathogenesis of which has
been clearly elucidated (29, 30). The renal tubular epithelial cells of the kidney are
susceptible to injury due to their blood supply located in the medulla, an area that is
particularly prone to ischemia. Once ischemic injury occurs, the cytoskeletal architecture
of the renal tubular epithelial cells is disrupted, leading to a loss of cellular polarity and
the shedding of the proximal tubule’s brush border. During this initiation phase of AKI,
though intracellular ATP depletion is severe, the injury to the endothelium remains
sublethal and reversible, allowing for a complete recovery if the instigating insult is
removed. Tamm-Horsfall protein, normally secreted by the thick ascending limb as a
monomer, becomes a gel-like polymer in the high sodium environment of the distal
tubule where it can combine with the debris of injured cells and brush border membranes
to form casts (30). Casts and sloughed off cells obstruct the lumen, contributing to the
kidney’s declining glomerular filtration rate (GFR).
During the extension phase of the injury, blood flow returning to the renal cortex
leads to reperfusion-related cell death while continued vasoconstriction in the medulla
contributes to further RTE cell death (30). Leukocytes are recruited to the site of injury
and produce inflammatory mediators and reactive oxygen species that worsen the cellular
damage. RTE cells also contribute to this deleterious response by secreting chemokines
and cytokines that perpetuate the cycle of inflammation.
During the maintenance phase, parenchymal injury is established and GFR
reaches its nadir (30). At this time, a balance is maintained between continued cell death
and incipient attempts at cellular regeneration. The process of cellular recovery involves
dedifferation of viable cells followed by proliferation and eventual restoration of the

13
normal epithelium (30). Finally, during the recovery phase of the injury, the GFR
gradually improves as the integrity of the epithelial cells is restored. Though the kidney
has the capacity to fully and completely repair itself after sustaining this type of acute
injury, a partial repair can generate a state of persistent inflammation in the kidney that
can eventually manifest years later as end-stage renal disease (ESRD) (29).
The etiologies of AKI are typically divided into three categories: pre-renal,
intrinsic, and post-renal. Outside of the ICU, 55-60% of AKI is pre-renal, 35-40% is
intrinsic and <5% is post-renal (31). Determining the cause of AKI necessitates a
diagnostic workup consisting of a history, a focused physical to assess volume status,
basic laboratory tests including a BUN/Cr ratio, and imaging studies such as a renal
ultrasound, if necessary. Special attention is of course paid to examination of the urine,
especially to the measurement of urine electrolytes (in particular the fractional excretion
of sodium or FeNa) and to the analysis of the urine sediment via microscopy. Together,
these various aspects of the diagnostic workup can lead to a definitive diagnosis (see
Table 3). For example, an elevated BUN/Cr ratio with a FeNa < 1% and a bland urine
Table 3 Urine studies in acute kidney injury
Hypovolemia ATN AIN Glomerulonephritis ObstructionSediment Bland Broad,
brownish granular
casts
WBCs, eosinophils,
cellular casts
RBCs, RBC casts Bland or bloody
Protein None or low None or low
Minimal >100mg/dL Low
Urine Na (mEq/L)
<20 >30 >30 <20 <20 (acute) >40 (few days)
Urine Osm (mOsm/kg)
>400 <350 <350 >400 <350
FeNa (%) <1 >1 Varies <1 <1 (acute) >1(few days)
AIN = allergic interstitial nephritis; ATN = acute tubular necrosis; FeNa = fractional excretion of sodium; Na = Sodium; Osm = osmolality; RBC = red blood cell; WBC = white blood cell Table adapted from Singri 2003 (32)
14
sediment is highly suggestive of a pre-renal etiology. If the AKI has progressed to acute
tubular necrosis (ATN), the urine sediment often shows brownish granular casts with
renal tubular epithelial cells. The urine sediment is also very helpful in identifying other
potential cause of intrinsic renal disease such a glomerulonephritis or vasculitis in which
proteinuria, dysmorphic red blood cells, and red blood cell casts may be seen (32).
Treatment of AKI is of course dependent on etiology and it remains primarily
supportive. Pre-renal AKI requires appropriate volume resuscitation while other forms of
AKI, including ATN, are often harmed by volume overload and require instead
electrolyte repletion, avoidance of renal toxins, and RRT in cases of refractory
hyperkalemia, volume overload, metabolic acidosis or uremia. Unfortunately, despite our
improved understanding of AKI and advances in supportive care, mortality from the
disease has remained at around 50% for the past four decades (33). Additionally,
morbidity from AKI remains significant with some studies indicating as much as a three-
fold greater risk for developing ESRD over the course of a decade when compared to
controls (34).
One avenue towards improving outcomes in AKI lies in finding a more accurate
and sensitive biomarker that will enable earlier detection of kidney injury and thus allow
for administration of potentially therapeutic interventions before lasting damage occurs.
Research in this field has thus far focused on several potential biomarkers of kidney
disease such as cystatin C, neutrophil gelatinase-associated lipocalin (NGAL), kidney
injury molecule-1 (KIM-1), and interleukin-18 (IL-18), initially identified via microarray
analysis and genomics (35). As we await large, prospective multicenter trials to
determine these biomarkers’ ultimate clinical utility and application, the search continues
15
for other laboratory tests that will aid in early detection of AKI. Also, though the AKIN
stage has been shown to correlate with eventual outcomes in AKI, the need for
identifying additional prognostic factors besides creatinine and urine output remains, as
this would help individualize therapy in AKI, determining appropriate aggressiveness of
intervention required and aiding in long-term planning of patient care (36, 37).
Urine Microscopy’s Role in the Study of Acute Kidney Injury
Though tradition and consensus have suggested that urine microscopy and other
urinary indices can provide important clues to the differential diagnosis of acute kidney
injury, there is little evidence to support these widely held beliefs. In fact, in a systematic
review of the literature of septic AKI, Bagshaw et al found that that no single measure of
urinary biochemistry, derived index, or pattern on microscopy could be used reliably to
diagnose AKI or predict the clinical course of AKI in these patients (38). A follow-up
review by the same group then reviewed experimental studies that utilized urinary
findings to monitor the progress of septic AKI in animal models, concluding that
sustained oliguria, decline in glomerular filtration, and evidence of sodium retention by
UNa <20 mmol/L, FeNa <1%, and Uosm >400 mosm/L appeared to be the most reliable
indices of worsening AKI and that there were not enough studies that used urinary
microscopy in this particular review for its utility to be determined (39). The limitations
of both of these reviews were that the studies examined in each were far too heterogenous
for any quantitative analysis to be performed. Also, as pointed out by the authors
themselves, many of the studies reviewed had major design flaws including small study
populations and retrospective design, failure to include a control group, a heterogenous
patient population, failure to account for potential confounding factors, variable timing in
16
measurements, and inconsistent reporting of several individual urinary tests (38). Thus,
the question of the utility of urinary indices, including microscopy in the study of AKI, is
still very much unsettled, and several studies in the existing body of literature have
attempted to prove that urine microscopy can in fact hold many useful clues to
differential diagnosis and prognosis in AKI.
In an effort to firmly establish the importance of urine microscopy as a validated
diagnostic tool in AKI, a study by Perazella et al in 2008 showed that urinary microscopy
findings could be used in conjunction with a clinically determined pretest probability to
quite definitively distinguish pre-renal AKI from ATN. In patients with a high pretest
probability of ATN, any casts or renal tubular epithelial cells (RTECs) resulted in very
high positive predictive value (100%) and low negative predictive value (44%) for a final
diagnosis of ATN. Conversely, the negative predictive value of the absence of casts or
RTECs in patients with low pretest probability of disease was 91% (40). This study
helped establish likelihood ratios that would enable clinicians to calculate posttest
probability of either ATN or prerenal azotemia once they have estimated the pretest
probability of either cause of AKI (41). A study by Marcussen et al also examined this
link between urine microscopy and the diagnosis of AKI. They found a significantly
higher number of collecting duct cells and casts (p <0.05 and p<0.03, respectively) in the
urine of 34 patients with ATN when compared to the 17 patients with non-ATN AKI
(42). Similarly, a much earlier study by Gay et al analyzed the urine sediment in children
who had AKI of varying etiologies and concluded that the cause of AKI could be
determined by the urine sediment results, sometimes prompting an alteration of a
previously made diagnosis (43).
17
Other studies have focused on the potential role of urine microscopy in predicting
severity of AKI and thus subsequent outcomes. Schentag et al conducted daily
examinations of the urine of 154 critically ill patients in order to compare cast excretion
among sick patients, sick patients given aminoglycosides, and sick patients with
aminoglycoside nephrotoxicity. Their results indicated that cast counts in the 30
nephrotoxic patients were 625 ± 364, significantly higher than either ICU patients who
had not received aminoglycosides (44 ± 51 casts) or those who had been given
aminoglycosides without a significant rise in serum creatinine (153 ± 196 casts). In some
cases, cast counts began rising significantly as early as 9 days before serum creatinine
first rose, indicating that urine microscopy can be an early predictor of worsening AKI
(44).
In a study of patients with non-AKI renal disease, Gyory et al evaluated the
correlation between the severity of pathologic changes found on renal biopsy with the
number of casts excreted in the urine prior to biopsy, concluding that there was in fact a
significant positive correlation (r = 0.630, p <0. 01) (45).
More recent work has further established a strong link between findings on urine
microscopy and outcomes in AKI. In the previously mentioned study by Marcussen et al,
they found that in addition to distinguishing ATN from other causes of AKI, urine
sediment results also predicted outcomes, as patients who would eventually require
dialysis consistently had higher numbers of renal cells and casts in their urine sediment
(42). Chawla et al in their 2008 study established a cast scoring index (CSI) based on the
numbers of granular and epithelial cell casts in the urine to improve standardization of
reporting urine microscopy results and to determine whether a correlation existed

18
between a higher CSI and worse outcomes such as death or need for dialysis. Though the
study was quite small and only included 18 patients, the patients that had worse outcomes
had a higher CSI when compared with patients that recovered renal function (2.55 ± 0.93
vs. 1.57 ± 0.79, p = 0.04). The ROC area under the curve for CSI to diagnose worsening
was 0.79 (46).
Recent work done by Perazella et al has attempted to prospectively study the
relationship between urine microscopy findings at the time of nephrology consultation
and clinical outcomes in AKI. Using a urinary sediment scoring system based on the
number of RTECs and granular casts, they graded the urine of 197 patients with either
pre-renal AKI or ATN and found that their urinary scoring system was significantly
associated with increased risk of worsening AKI (adjusted relative risk: 7.3; for
worsening with score of ≥3 versus score of 0) and was more predictive than AKI
Network stage at the time of consultation (47).
Even electron microscopy has been used in this endeavor in studies by Mandal et
al (48-50). Urinary sediments from 31 patients with oliguric acute tubular necrosis
(ATN) were divided into three categories based on the severity of ultrastructural changes
observed in the RTECs. Type I cells showed signs of severe and significant damage with
an abundance of necrotic cells and cellular fragments, disrupted plasma membranes,
dysmorphic mitochondria, and absent nuclei. Type II sediments displayed the mildest
changes and were composed of a relatively homogenous population of modestly damaged
RTECs. In these sediments, cellular and subcellular organelle membranes remained
largely intact, and they contained normal appearing mitochondria and nuclei. Type III
sediments were quite heterogenous and displayed changes intermediate to those seen in

19
the Type I and Type II sediments. In this study, a correlation was found between the
sediment type and the severity of the clinical illness (p <0.05) with only 2 out of 11
patients with Type I sediment surviving while 7 of the 8 patients with Type II sediment
survived (48). Despite the potential advantages of EM, it remains prohibitively
expensive to incorporate into routine practice.
Of course, some of these studies have flaws like small sample sizes, absence of
control groups, and inconsistency in when the urine microscopy was performed in
relation to the onset of AKI (see Table 4). Nonetheless, taken together, they support the
notion that urine microscopy can play an important role in determining the cause and
subsequent outcomes of AKI. Though biomarkers currently under investigation show
much promise in improving our understanding of AKI, urine microscopy continues to be
a simple, inexpensive, and potentially powerful way of assessing kidney dysfunction.
Table 4 Summary of studies reviewed Author Goals Population Results Limitations
Gyory 1984 Assess whether urine sediment microscopy was predictive of histological evidence of renal disease
22 patients undergoing renal biopsy
Microscopy on day of biopsy
Number of casts in sediment correlated with degree of histological change on biopsy with strong predictive value
Small population No details on types of casts studied
Mandal 1985 Assess whether ultrastructural changes on TEM corresponded to outcomes in AKI
TEM in 31 patients with ATN
Severity of ultrastructural changes in sediment correlated with worse outcomes
Small population TEM difficult to translate to routine practice
Gay 1987 Determine utility of microscopy in differential diagnosis of AKI
31 children with AKI
Microscopy within 5 days of onset
Urinary sediment examination was valuable in determining AKI diagnosis
Small population No details about pattern of casts in the urine
Schentag 1987 Assess the value of quantitative cast excretion as a marker of AKI
154 ICU patients; 30 with AG toxicity
Daily microscopy
Cast counts were highest in those with AG toxicity
In some cases, cast count rose prior to creatinine rise
Daily microscopy difficult to translate to routine practice
Only studied AG-related AKI
Marcussen 1995 Assess utility of 51 hospitalized Higher numbers Small population

20
microscopy in differential diagnosis and outcome prediction in AKI
patients with AKI
Microscopy within two weeks of peak creatinine
of cells and casts in patients with ATN than those with non-ATN AKI
Higher numbers of casts in patients who needed dialysis
Microscopy performed at variable times
Bagshaw 2006
Determine what indices have proven to be useful in diagnosis of AKI
Meta-analysis of 27 studies that recorded urinary indices in patients with septic AKI
No measured index was consistently reliable
Insufficient data to draw conclusions about microscopy
Heterogeneity precluded quantitative analysis
Inconsistent and variable recording of measurements across studies
Bagshaw 2007 Determine what indices could theoretically be useful in understanding AKI
Meta-analysis of 27 studies of experimental models of septic AKI
Sustained oliguria, decline in GFR and evidence of Na retention were reliable indices of worsening
Insufficient data to draw conclusions about microscopy
Heterogeneity of studies
Difficult to extrapolate from animal models to humans
Chawla 2008 Devise a more uniform way to evaluate urine
Determine if their score was predictive of outcome
30 patients with ATN though outcomes were only looked at in 18
Microscopy at time of consult
Score was highly reproducible
Patients that did not recover renal function had higher scores than those that did
Small population
Perazella 2008 Assess utility of microscopy in differential diagnosis of AKI
267 hospitalized patients with AKI
Microscopy at time of consult
Presence or absence of casts or RTE cells in conjunction with clinical pretest probability was highly predictive of diagnosis
No biopsy-confirmed diagnoses
Observers were not blinded to diagnostic impressions at time of microscopy
Perazella 2010 Determine
whether urine microscopy score was predictive of outcome
197 hospitalized patients with AKI
Microscopy at time of consult
Higher score was associated with increased risk of worsening
Score was more predictive of outcome than AKIN stage
Observers were not blinded to clinical data
Microscopy performed at time of consult
AG = aminoglycoside, AKI = Acute Kidney Injury, ATN = Acute Tubular Necrosis, GFR = glomerular filtration rate, ICU = Intensive Care Unit, Na = sodium, TEM = Transmission Electron Microscopy
21
GOALS OF THIS STUDY
Current research in the study of AKI is focused on the search for better ways of
identifying incipient renal disease and for prognostic factors that can help guide
treatment. Based on a small but consistent body of literature, it appears that in this
endeavor, urine microscopy can be of significant utility. In particular, much work has
been done in establishing a correlation between findings on urine microscopy and
outcomes in AKI, but the timing of urine microscopy in these studies has been variable or
late in the course of the disease (ie at the time of nephrology consultation). This study
hopes to build on earlier work by prospectively analyzing urine samples collected earlier
in the evolution of AKI when information about prognosis is perhaps most helpful and
most needed. In particular, we attempted to ascertain whether urine microscopy results at
the time of first clinical AKI diagnosis correlated with worse outcomes. If so, urine
microscopy results can potentially be used to determine prognosis at a very early stage of
disease and thus help direct the treatment of patients with AKI.

22
METHODS
Patients admitted to Yale-New Haven Hospital from July 2008 to August 2009 were
prospectively screened for inclusion in this study. Patients with end-stage kidney disease
or kidney transplant, those discharged within 24 hours of enrollment, those transferred
from another institution, or those whose urine samples could not be analyzed within four
hours of collection were excluded from the study. All adult patients on medical and
surgical floors and in intensive care units (ICUs) were screened for AKI on a daily basis
using electronic medical records to follow trends in serum creatinine (SCr). Real-time
SCr graphs were utilized to detect an increase of 0.3 mg/dL or 50% over 48 hours from a
previously determined baseline. For patients who had AKI within 48 hours of admission,
baseline SCr was determined from outpatient medical records. For those who developed
AKI later in their hospital stay, baseline SCr was defined as the admission SCr. For the
few patients whose admission SCr was higher than the SCr at enrollment, then the lowest
stable SCr within two days before the AKI episode was used as the baseline. Waiver of
written consent permitted the collection of de-identified patient information and urine
samples.
Upon enrollment, a 10mL urine sample was obtained either from catheter tubing
or from clean catch samples. Samples were centrifuged for 5 minutes at 1500 rpm. The
supernatant was decanted, leaving a 0.5 ml residual. The pellet was then resuspended
with a pipette. 1 drop of sediment was pipetted onto a glass slide and a coverslip was
placed on top. The slide was analyzed under standard light microscopy at low power
(10x), high power (40x), and polarization when crystals were identified. Red and white
blood cells, RTE cells, RTE casts, granular casts, and hyaline casts were identified

23
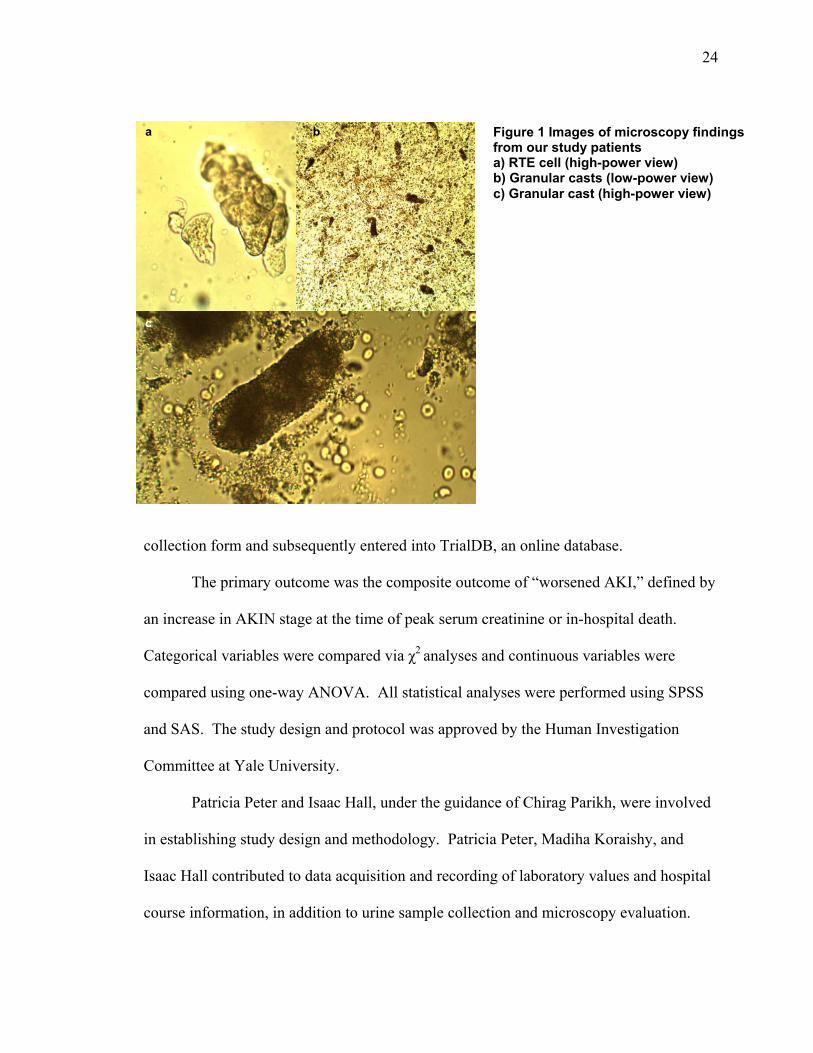
according to standard definitions and their numbers were recorded (40) (see Figure 1).
Additionally, the urinary sediment scoring system designed by Perazella et al was used to
facilitate subsequent analysis (47). As demonstrated in Table 5, the score was calculated
by summing the points that corresponded to the numbers of RTE cells and/or granular
casts in the sediment. All investigators who performed the microscopy were instructed
by faculty from the Section of Nephrology at Yale through didactic sessions and hands-
on demonstrations on the proper identification of important cellular elements in the urine.
Patients were followed until discharge from the hospital, resulting in the
collection of demographic data (ie age, gender, and race), as well as information on the
patients’ relevant comorbidities such as diabetes, hypertension (HTN), peripheral
vascular disease (PVD), congestive heart failure (CHF), coronary artery disease (CAD),
and chronic kidney disease (CKD). FeNa, urine dipstick analysis and serum creatinine
concentrations (baseline, peak, and at time of discharge) were also recorded when
available. Primary and secondary outcomes data collected on enrolled patients included
in-hospital initiation of dialysis, death during hospitalization, and need for nephrology
consultation. Etiologies of AKI were adjudicated retrospectively via chart review. Acute
tubular necrosis was defined as AKI that did not respond to fluid resuscitation (ie Scr
remained stable or increased) within 48 hours of treatment. Prerenal was defined as AKI
that responded to fluid resuscitation with an improvement of Scr within 48 hours of
treatment. All other diagnosis were recorded as “other.” Results were recorded on a data
Table 5 Urine sediment scoring system based on numbers of granular casts and RTE cells Granular casts (per LPF)
RTE cells (per HPF)
0 (0 points)
1-5 (1 point)
≥6 (2 points)
0 (0 points) 0 1 2 1-5 (1 point) 1 2 3 ≥6 (2 points) 2 3 4
Adapted from Perazella et al (47)
24
Figure 1 Images of microscopy findings from our study patients a) RTE cell (high-power view) b) Granular casts (low-power view) c) Granular cast (high-power view)
b
c
a
collection form and subsequently entered into TrialDB, an online database.
The primary outcome was the composite outcome of “worsened AKI,” defined by
an increase in AKIN stage at the time of peak serum creatinine or in-hospital death.
Categorical variables were compared via χ2 analyses and continuous variables were
compared using one-way ANOVA. All statistical analyses were performed using SPSS
and SAS. The study design and protocol was approved by the Human Investigation
Committee at Yale University.
Patricia Peter and Isaac Hall, under the guidance of Chirag Parikh, were involved
in establishing study design and methodology. Patricia Peter, Madiha Koraishy, and
Isaac Hall contributed to data acquisition and recording of laboratory values and hospital
course information, in addition to urine sample collection and microscopy evaluation.
25
Statistical analysis was performed by Patricia Peter with assistance from Isaac Hall and
Umo Iyanam.

26
RESULTS
Table 6 Baseline characteristics of study population by worsened AKI Characteristic N (N %)A or
mean ± SD (N=165)
WorsenedB or died
(N=49)
Did not worsen or die
(N=116)
PC
Age (years) 66.1 ±16.2 67.5 ±15.1 65.4 ±16.7 0.461 Gender 0.316 Male 94 (57) 25 (51) 69 (60) Female 71 (43) 24 (49) 47 (41) Race 0.551 White 126 (76) 37 (76) 89 (77) Black 28 (17) 10 (20) 18 (16) Other 11 (7) 2 (4) 9 (8) Body Mass Index 29.4 ±7.7 30.4 ±8.4 29 ±7.3 0.294 Baseline ScrD 1.3 ± 0.5 1.3 ± 0.6 1.3 ± 0.4 0.832
Baseline GFR 65 ± 28 66 ± 31 64 ± 27 0.683 Baseline CKD stage 0.050 Stage 1 (GFR≥ 90) 29 (18) 9 (18) 20 (17) Stage 2 (GFR 60-89.9) 51 (31) 19 (39) 32 (28) Stage 3 (GFR 30-59.9) 74 (45) 15 (31) 59 (51) Stage 4-5 (GFR 0-29.9) 11 (7) 6 (12) 5 (4) Past Medical History Known CKD 44 (27) 12 (26) 32 (28) 0.799 Hypertension 114 (69) 32 (65) 82(71) 0.445 Diabetes 67 (41) 23 (47) 44 (38) 0.301 CHF 66 (40) 19 (39) 47 (41) 0.835 CAD 68 (41) 17 (35) 51 (44) 0.312 Cirrhosis 14 (9) 5 (10) 9 (8) 0.606 COPD 33 (20) 8 (16) 25 (22) 0.443 Stroke 23 (14) 7 (15) 16 (14) 0.895 Dementia 18 (11) 6 (13) 12 (10) 0.655 Active cancer 37 (22) 18 (38) 19 (16) 0.003*
OSA 18 (11) 4 (8) 14 (12) 0.486 # of Comorbidities 0.323 None 10 (6) 2 (4) 8 (7) One 19 (12) 3 (7) 16 (14) Two or more 129 (78) 40 (89) 89 (79) Tobacco use 0.214 Never 81 (49) 25 (57) 56 (53) Prior 35 (21) 13 (30) 22 (21) Current 33 (20) 6 (14) 27 (26) Enrollment location 0.032* ICU 90 (55) 33 (67) 57 (49) Floor 75 (46) 16 (33) 59 (51) AKI Stage at enrollment 0.001* Stage 1 139 (84) 34 (69) 105 (91)

27
Stage 2 26 (16) 15 (31) 11 (10) A Numbers may not sum to totals due to missing data; Row and column percentages for totals may not sum to 100% due to missing data and rounding. B Worsened AKI is defined as progression to a higher AKI stage at time of peak serum creatinine when compared to AKI stage on day of enrollment. C P-values obtained from analysis of variance F-test (continuous variable) or χ2 test (categorical variable). D Scr = Serum creatinine. Baseline Scr = Admission Scr. If admission Scr is missing or admission Scr is greater than Scr on the day of enrollment (day 0), then baseline Scr = minimum of Scr collected two days before enrollment (day -2 and day -1). GFR = Glomerular Filtration Rate, CKD = Chronic Kidney Disease, CHF = Congestive Heart Failure, CAD = Coronary Artery Disease, COPD = Chronic Obstructive Pulmonary Disease, OSA = Obstructive Sleep Apnea, ICU = Intensive Care Unit
165 patients admitted to Yale-New Haven Hospital from July 2008 to August
2009 were prospectively enrolled in this study on the first day of their AKI as determined
by standard serum creatinine criteria (see Methods section above). 115 patients were
ultimately diagnosed with prerenal AKI, 35 with ATN, and the remaining 15 with other
causes of AKI including allergic interstitial nephritis, hepatorenal syndrome, obstructive
nephropathy, contrast nephropathy, lupus nephritis, and IgA nephropathy.
49 of these patients experienced the composite outcome of worsened AKI or
death. Those who worsened were more likely to have an active cancer diagnosis
(p<0.003), to be located in the ICU (p<0.032), and to have a higher AKI stage at the time
of enrollment (p<0.001) (see Table 6). Otherwise, no significant differences existed in
age, gender, or comorbidities between the two populations. Also of note, there were no
differences in baseline kidney function prior to injury between the two populations
whether measured as serum creatinine, GFR, or CKD stage.
Patients who worsened were more likely to experience secondary outcomes such
as oliguria or anuria during their hospitalization (p<0.001), higher peak serum creatinines
(3.2 ± 1.5 versus 1.9 ± 0.6, p<0.001), higher discharge serum creatinines (2.0 ± 1.4 versus
1.4 ± 0.5, p = 0.001), and longer lengths of stay (32.4 ± 33.6 versus 18.2 ± 24.5, p =
0.003) (see Table 7). The average AKI stage at peak serum creatinine was 2.4 for those
28
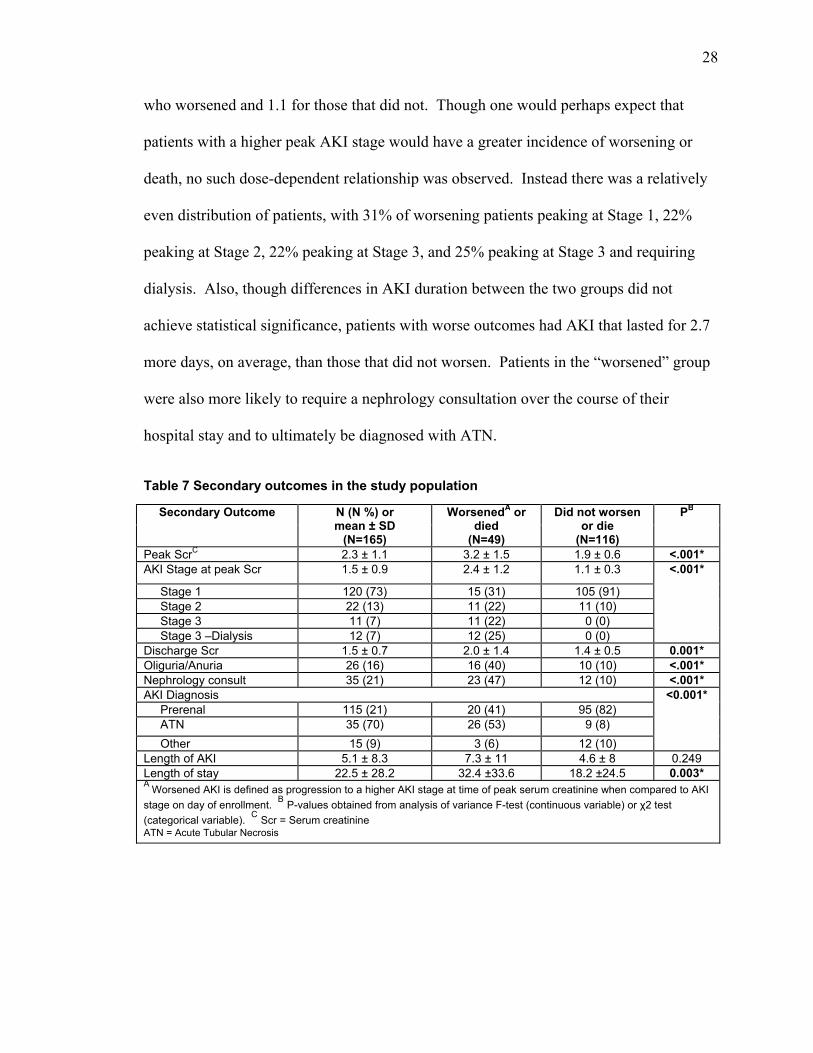
who worsened and 1.1 for those that did not. Though one would perhaps expect that
patients with a higher peak AKI stage would have a greater incidence of worsening or
death, no such dose-dependent relationship was observed. Instead there was a relatively
even distribution of patients, with 31% of worsening patients peaking at Stage 1, 22%
peaking at Stage 2, 22% peaking at Stage 3, and 25% peaking at Stage 3 and requiring
dialysis. Also, though differences in AKI duration between the two groups did not
achieve statistical significance, patients with worse outcomes had AKI that lasted for 2.7
more days, on average, than those that did not worsen. Patients in the “worsened” group
were also more likely to require a nephrology consultation over the course of their
hospital stay and to ultimately be diagnosed with ATN.
Table 7 Secondary outcomes in the study population
Secondary Outcome N (N %) or mean ± SD
(N=165)
WorsenedA or died
(N=49)
Did not worsen or die
(N=116)
PB
Peak ScrC 2.3 ± 1.1 3.2 ± 1.5 1.9 ± 0.6 <.001*AKI Stage at peak Scr 1.5 ± 0.9 2.4 ± 1.2 1.1 ± 0.3 <.001*
Stage 1 120 (73) 15 (31) 105 (91) Stage 2 22 (13) 11 (22) 11 (10) Stage 3 11 (7) 11 (22) 0 (0) Stage 3 –Dialysis 12 (7) 12 (25) 0 (0) Discharge Scr 1.5 ± 0.7 2.0 ± 1.4 1.4 ± 0.5 0.001*Oliguria/Anuria 26 (16) 16 (40) 10 (10) <.001*Nephrology consult 35 (21) 23 (47) 12 (10) <.001*AKI Diagnosis <0.001* Prerenal 115 (21) 20 (41) 95 (82) ATN 35 (70) 26 (53) 9 (8) Other 15 (9) 3 (6) 12 (10) Length of AKI 5.1 ± 8.3 7.3 ± 11 4.6 ± 8 0.249 Length of stay 22.5 ± 28.2 32.4 ±33.6 18.2 ±24.5 0.003*A Worsened AKI is defined as progression to a higher AKI stage at time of peak serum creatinine when compared to AKI stage on day of enrollment. B P-values obtained from analysis of variance F-test (continuous variable) or χ2 test (categorical variable). C Scr = Serum creatinine ATN = Acute Tubular Necrosis

29
The microscopy results shown in Table 8 reveal a significant association between
worsening AKI and a greater number of granular casts in the urine (p = 0.027). Though
no association was found between worsening and the number of RTE cells individually, a
higher overall microscopy score was found in the sediment of patients who worsened or
died (p = 0.046). Interestingly, the microscopy score was related to worsening with a
dose-dependent trend, as 6% of patients who worsened had a score of 0, 25% had a score
of 1, and 49% had a score of 2. This trend did not hold at microscopy scores of 3 or
greater, however, which only occurred in 20% of patients who worsened.
Table 8 Microscopy results by worsened AKI Characteristic N (N %)A
or mean ± SD (N=165)
WorsenedB or died
(N=49)
Did not worsen or die
(N=116)
PC
RTE cells/HPF 0.261 0 35 (21) 7 (14) 28 (24)
1-5 121 (73) 38 (78) 83 (72) WBCs/HPF 0.372
0 42 (26) 9 (18) 33 (28) 1-5 82 (50) 27 (55) 55 (47)
6-20 27 (16) 7 (14) 20 (17) RBCs/HPF 0.424
0 44 (27) 10 (20) 34 (29) 1-5 70 (42) 20 (41) 50 (43)
6-20 27 (16) 11 (22) 16 (14) RTE cell casts/LPF 0.234
0 112 (68) 30 (61) 82 (71) 1-5 53 (32) 19 (39) 34 (29)
Granular casts/LPF 0.027*0 58 (35) 11 (22) 47 (41)
1-5 95 (58) 32 (65) 63 (54) 6-20 10 (6) 4 (8) 6 (5)
WBC casts/LPF 0.580 0 145 (88) 42 (86) 103 (89)
1-5 20 (12) 7 (14) 13 (11) Hyaline casts/LPF 0.942
0 69 (42) 20 (41) 49 (42) 1-5 60 (36) 17 (35) 43 (37)
6-20 29 (18) 10 (20) 19 (16) Microscopy ScoreD 0.046*
0 21 (13) 3 (6) 18 (16) 1 51 (31) 12 (25) 39 (34) 2 74 (45) 24 (49) 50 (43)
≥3 19 (12) 10 (20) 9 (8) A Numbers may not sum to totals due to missing data; Row and column percentages for totals may not sum to 100% due to missing data and rounding. B Worsened AKI is defined as progression to a higher AKI stage at time of peak serum creatinine when compared to AKI stage on day of enrollment. C P-values obtained from analysis of variance F-test (continuous variable) or χ2 test (categorical variable). D Microscopy score calculated from Table 5.

30
Subgroup analysis was subsequently performed to further investigate the
relationship between microscopy scores on day one of AKI and eventual outcomes.
Patients with a higher microscopy score on the first day of their AKI were significantly
more likely to suffer the composite outcome of worsening AKI or death (p = 0.046) and
more likely to eventually require a nephrology consultation during the course of their
admission (p = 0.010), both associations occurring in a dose-dependent manner (see
Table 9). The incidence of worsened AKI or death rose consistently from 14% of
patients with a microscopy score of 0, 24% with a score of 1, 32% with a score of 2, and
finally to 53% in patients with scores of greater than or equal to 3. A similar pattern was
found with need for nephrology consultation during hospitalization (with incidences of
worsening at 0%, 18%, 26%, and 37% corresponding to scores of 0, 1, 2, and greater than
or equal to 3, respectively). Though there was no statistically significant association
between microscopy score and the individual outcomes of higher AKI stage at peak
serum creatinine, dialysis, death, or ATN diagnosis, there was a noticeable trend of
increased incidence of death with successively higher microscopy scores (5%, 16%, 23%,
and 32% at scores of 0, 1, 2, and 3 or greater, respectively), a relationship made clear in
the graphical representation below (see Figure 2).

31
Table 9 Subgroup analysis of outcomes by microscopy score
MicroscopyA Score
OutcomeWorsenedB or
died AKI
stage at peak SCr
Dialysis Death Nephrology consult
Diagnosis
ATN Prerenal Other
0 (n=21) 3 (14) 3 (14) 0 (0) 1 (5) 0 (0) 3 (14) 15 (71) 3 (14)
1 (n=51) 12 (24) 9 (18) 4 (8) 8 (16) 9 (18) 8 (16) 40 (78) 3 (6)
2 (n=74) 24 (32) 10 (14) 4 (5) 17 (23) 19 (26) 15 (20) 51 (69) 8 (11)
≥3 (n=19) 10 (53) 8 (42) 4 (21) 6 (32) 7 (37) 9 (47) 9 (47) 1 (5)
PC = 0.046* 0.055 0.078 0.117 0.010* 0.119
All values are reported as N (N%). A Microscopy score calculated from Table 5. B Worsened AKI is defined as progression to a higher AKI stage at time of peak serum creatinine when compared to AKI stage on day of enrollment. C P-values obtained from Fisher’s exact test using χ2 analysis. AKI = acute kidney injury, ATN = acute tubular necrosis, SCr = serum creatinine
Figure 1 Association between increasing microscopy score and outcomes
0
10
20
30
40
50
60
0 (n=21) 1 (n=51) 2 (n=74) ≥3 (n=19)
Microscopy Score
Perc
enta
ge o
f Pat
ient
s w
ith O
utco
me
(%)
Dialysis Death Nephrology Consult Worsening AKI or death
*
*
*
*
*
*
*
*
32
DISCUSSION
Despite the wealth of research devoted to the field, AKI remains a prevalent
disease that has seen little improvement in outcomes over the past several decades. In
response, current research has focused on identifying diagnostic tests that will allow for
earlier detection of AKI, more accurate determination of etiology, and better prediction of
morbidity and mortality from the disease. In this study, we examine the potential value
of urine microscopy in achieving at least some of these goals. Our results show that
higher numbers of granular casts and RTE cells in the urine sediment of hospitalized
patients (as captured in our microscopy score) on the first day of AKI are associated with
increased incidence of worsening AKI or death in a dose-dependent fashion. These
results build on earlier work from our group in reinforcing the potential utility of urine
microscopy in better evaluating and risk stratifying patients with AKI at an early stage of
their disease course (40, 41, 47).
Predicting outcomes in AKI has to potential to help guide management as more
aggressive interventions could be conducted earlier on patients who are thought to have a
poorer prognosis. Additionally, prognostic information would help to better inform
physicians about the likelihood that their patients will develop more serious long-term
sequela of AKI, helping both patients and their providers to prepare for such
consequences. Current efforts to risk stratify patients with AKI rely heavily on
established staging criteria since a stepwise increase in risk of death going from Risk to
Injury to Failure in the RIFLE criteria has been studied and validated in both small
studies and systematic reviews (36, 37, 51). However, the staging criteria are imperfect
in predicting outcomes. Firstly, there is a paucity of prospective data supporting the
33
predictive ability of these staging systems (only about 2% of patients studied were
featured in prospective studies) (52). Also, since these criteria were initially designed to
simply standardize definitions of AKI, they focus solely on markers of kidney function
without consideration for extrinsic factors that might affect outcomes (ie hospital
complications, age, etc) (52). Previous attempts at devising AKI-specific severity scores
to aid in the determination of prognosis have included variables focused primarily on age,
gender, and a variety of hospital course events such as mechanical ventilation,
hypotension, sepsis, heart failure, or oliguria with some contributions from biomarkers
such as creatinine or urea. Many of these scores have not been externally validated for
their ability to accurately predict outcome, and so the search continues for better means
of risk-stratifying patients with AKI (53). Our results suggest that as part of the
continued effort to identify different stages of AKI severity and to better predict
subsequent outcomes, urine microscopy should be considered as a potentially valuable
adjunct to clinical and demographic characteristics.
In addition to finding better methods for predicting outcomes, much research in
the field of AKI has focused on discovering biomarkers that will more quickly and
accurately diagnose AKI early in the course of the disease. The current staging systems
rely on serum creatinine as a marker of kidney dysfunction which is believed to be an
imperfect and late indicator of true renal injury. This potential delay in diagnosis and
treatment of AKI could be contributing in large part to the poor outcomes in this disease
(54). Serum creatinine is influenced by many factors extrinsic to renal injury such as age,
muscle mass, gender, medications and hydration status. Additionally, serum creatinine
requires a steady-state equilibrium to accurately depict kidney function, something that is

34
often only achieved days after the initial insult. Thus, this need for a more accurate and
sensitive marker coupled with an improved understanding of the pathophysiology of
kidney injury has led to the identification of many potential urinary biomarkers such as
cystatin C, neutrophil gelatinase-associated lipocalin (NGAL), kidney injury molecule-1
(KIM-1), and interleukin-18 (IL-18), several of which have showed much promise
improving the accuracy of AKI diagnosis (29, 55-58). As seen in our study, urine
microscopy results even early in the course of AKI can provide valuable information
about the ultimate degree of renal dysfunction, well before serum creatinine values reach
their peak. In this way, urine microscopy when combined with this new class of more
powerful biomarkers will greatly enrich our ability to identify and characterize AKI
earlier and more precisely.
There are, of course, many limitations to this work. One of the most crucial
limitations is the absence of validation of the microscopy findings by an external
reviewer and the failure to calculate inter-observer agreement on microscopy findings.
Though the microscopy was conducted by investigators who were well-trained to
examine urine, they were not subjected to an externally validated test of proficiency.
However, the problem of observer bias was minimized in that at the time of microscopy,
investigators were not aware that the study would be focused on associating microscopy
results with patient outcomes. Other flaws in study design include the absence of a group
of patients without AKI to serve as a control and the relatively small sample size that
experienced our composite outcome of worsening or death. Additionally, given that
creatinine is an admittedly imperfect marker of kidney injury, our microscopy results
could in fact be capturing a later time point in the disease course than initially suspected.

35
Also, though the use of a logistic regression model would perhaps have been a more
robust means of statistical analysis, our primary interest was to simply identify
potentially significant associations between findings on urine microscopy and outcome.
Other work in our lab hopes to go further by then using urine microscopy results along
with other potential prognostic indicators such as urine biomarkers to create a powerful
new model for understanding and characterizing AKI.
Ultimately, the numbers of granular casts and RTE cells present in the urine of
hospitalized patients on the first day of their AKI can be helpful in determining
prognosis, including worsening of disease or in-hospital death. A simple diagnostic tool
that has long been well-regarded in the field of nephrology for its ability to provide
impressive insight into the workings of the kidney, urine microscopy has the potential to
expand its role as an invaluable clinical tool in the diagnosis of AKI to include predicting
outcomes in AKI, likely as part of a panel of clinical measures and biomarkers. As a
component of current and future efforts to find markers that will improve diagnosis and
outcome prediction in AKI, urine microscopy will hopefully continue to provide critical
information that will help guide management and ultimately improve outcomes of this
disease.

36
REFERENCES
1. Armstrong, J.A. 2007. Urinalysis in Western culture: a brief history. Kidney Int 71:384-387.
2. Eknoyan, G. 2007. Looking at the urine: the renaissance of an unbroken tradition. Am J Kidney Dis 49:865-872.
3. Fogazzi, G.B., and Cameron, J.S. 1996. Urinary microscopy from the seventeenth century to the present day. Kidney Int 50:1058-1068.
4. Fogazzi, G.B., and Cameron, J.S. 1995. The introduction of urine microscopy into clinical practice. Nephrol Dial Transplant 10:410-413.
5. Vigla, E. 1837. Etude microscopique de l'urine, eclairee par l'analyse chimique. L'Experience 12:177-190.
6. Addis, T. 1925. Renal failure casts. JAMA 84:1013-1015. 7. Delanghe, J.R., Kouri, T.T., Huber, A.R., Hannemann-Pohl, K., Guder, W.G.,
Lun, A., Sinha, P., Stamminger, G., and Beier, L. 2000. The role of automated urine particle flow cytometry in clinical practice. Clin Chim Acta 301:1-18.
8. Fogazzi, G. 2011. Urinalysis. In Comprehensive Clinical Nephrology. J. Floege and J. Feehally, editors. St. Louis: Mosby.
9. McQueen, E.G. 1962. The nature of urinary casts. J Clin Pathol 15:367-373. 10. Brody, L., Webster, M., and Kark, R. 1968. Identification of elements of urinary
sediment with phase contrast microscopy. JAMA 206:1777-1781. 11. Birch, D.F., Fairley, K.F., Whitworth, J.A., Forbes, I., Fairley, J.K., Cheshire,
G.R., and Ryan, G.B. 1983. Urinary erythrocyte morphology in the diagnosis of glomerular hematuria. Clin Nephrol 20:78-84.
12. Winkel, P., Statland, B.E., and Jorgensen, K. 1974. Urine microscopy, an ill-defined method, examined by a multifactorial technique. Clinical chemistry 20:436-439.
13. Gadeholt, H. 1964. Quantitative estimation of urinary sediment, with special regard to sources of error. Br Med J 1:1547-1549.
14. Kesson, A.M., Talbott, J.M., and Gyory, A.Z. 1978. Microscopic examination of urine. Lancet 2:809-812.
15. The European Urinalysis Group of the European Confederation of Laboratory Medicine. 2000. European urinalysis guidelines. Scand J Clin Lab Invest Suppl 231:1-86.
16. Tsai, J.J., Yeun, J.Y., Kumar, V.A., and Don, B.R. 2005. Comparison and interpretation of urinalysis performed by a nephrologist versus a hospital-based clinical laboratory. Am J Kidney Dis 46:820-829.
17. Wald, R., Bell, C.M., Nisenbaum, R., Perrone, S., Liangos, O., Laupacis, A., and Jaber, B.L. 2009. Interobserver reliability of urine sediment interpretation. Clin J Am Soc Nephrol 4:567-571.
18. Chien, T.I., Kao, J.T., Liu, H.L., Lin, P.C., Hong, J.S., Hsieh, H.P., and Chien, M.J. 2007. Urine sediment examination: a comparison of automated urinalysis systems and manual microscopy. Clin Chim Acta 384:28-34.
19. Elin, R.J., Hosseini, J.M., Kestner, J., Rawe, M., Ruddel, M., and Nishi, H.H. 1986. Comparison of automated and manual methods for urinalysis. Am J Clin Pathol 86:731-737.

37
20. Zaman, Z., Fogazzi, G.B., Garigali, G., Croci, M.D., Bayer, G., and Kránicz, T. 2010. Urine sediment analysis: Analytical and diagnostic performance of sediMAX - a new automated microscopy image-based urine sediment analyser. Clin Chim Acta 411:147-154.
21. Hannemann-Pohl, K., and Kampf, S.C. 1999. Automation of urine sediment examination: a comparison of the Sysmex UF-100 automated flow cytometer with routine manual diagnosis (microscopy, test strips, and bacterial culture). Clin Chem Lab Med 37:753-764.
22. Lines, S., and Lewington, A. 2009. Acute kidney injury. Clin Med 9:273-277. 23. Hoste, E.A., and Schurgers, M. 2008. Epidemiology of acute kidney injury: how
big is the problem? Crit Care Med 36:S146-151. 24. Levy, E.M., Viscoli, C.M., and Horwitz, R.I. 1996. The effect of acute renal
failure on mortality. A cohort analysis. JAMA 275:1489-1494. 25. Lassnigg, A., Schmidlin, D., Mouhieddine, M., Bachmann, L.M., Druml, W.,
Bauer, P., and Hiesmayr, M. 2004. Minimal changes of serum creatinine predict prognosis in patients after cardiothoracic surgery: a prospective cohort study. J Am Soc Nephrol 15:1597-1605.
26. Mehta, R.L., Kellum, J.A., Shah, S.V., Molitoris, B.A., Ronco, C., Warnock, D.G., Levin, A., and Network, A.K.I. 2007. Acute Kidney Injury Network: report of an initiative to improve outcomes in acute kidney injury. Crit Care 11:R31.
27. Bagshaw, S.M., George, C., and Bellomo, R. 2008. A comparison of the RIFLE and AKIN criteria for acute kidney injury in critically ill patients. Nephrol Dial Transplant 23:1569-1574.
28. Chang, C.H., Lin, C.Y., Tian, Y.C., Jenq, C.C., Chang, M.Y., Chen, Y.C., Fang, J.T., and Yang, C.W. 2010. Acute kidney injury classification: comparison of AKIN and RIFLE criteria. Shock 33:247-252.
29. Bagshaw, S.M., Bellomo, R., Devarajan, P., Johnson, C., Karvellas, C.J., Kutsiogiannis, D.J., Mehta, R., Pannu, N., Romanovsky, A., Sheinfeld, G., et al. 2010. [Review article: Acute kidney injury in critical illness]. Can J Anaesth 57:985-998.
30. Devarajan, P. 2006. Update on mechanisms of ischemic acute kidney injury. J Am Soc Nephrol 17:1503-1520.
31. Lameire, N., Van Biesen, W., and Vanholder, R. 2008. Acute kidney injury. Lancet 372:1863-1865.
32. Singri, N., Ahya, S.N., and Levin, M.L. 2003. Acute renal failure. JAMA 289:747-751.
33. Hoste, E.A., and Kellum, J.A. 2007. Incidence, classification, and outcomes of acute kidney injury. Contrib Nephrol 156:32-38.
34. Wald, R., Quinn, R.R., Luo, J., Li, P., Scales, D.C., Mamdani, M.M., and Ray, J.G. 2009. Chronic dialysis and death among survivors of acute kidney injury requiring dialysis. JAMA 302:1179-1185.
35. Bagshaw, S.M., and Bellomo, R. 2007. Early diagnosis of acute kidney injury. Curr Opin Crit Care 13:638-644.
36. Hoste, E.A., Clermont, G., Kersten, A., Venkataraman, R., Angus, D.C., De Bacquer, D., and Kellum, J.A. 2006. RIFLE criteria for acute kidney injury are
38
associated with hospital mortality in critically ill patients: a cohort analysis. Crit Care 10:R73.
37. Uchino, S., Bellomo, R., Goldsmith, D., Bates, S., and Ronco, C. 2006. An assessment of the RIFLE criteria for acute renal failure in hospitalized patients. Crit Care Med 34:1913-1917.
38. Bagshaw, S.M., Langenberg, C., and Bellomo, R. 2006. Urinary biochemistry and microscopy in septic acute renal failure: a systematic review. Am J Kidney Dis 48:695-705.
39. Bagshaw, S.M., Langenberg, C., Wan, L., May, C.N., and Bellomo, R. 2007. A systematic review of urinary findings in experimental septic acute renal failure. Critical care medicine 35:1592-1598.
40. Perazella, M.A., Coca, S.G., Kanbay, M., Brewster, U.C., and Parikh, C.R. 2008. Diagnostic value of urine microscopy for differential diagnosis of acute kidney injury in hospitalized patients. Clin J Am Soc Nephrol 3:1615-1619.
41. Perazella, M.A., and Parikh, C.R. 2009. How can urine microscopy influence the differential diagnosis of AKI? Clin J Am Soc Nephrol 4:691-693.
42. Marcussen, N., Schumann, J., Campbell, P., and Kjellstrand, C. 1995. Cytodiagnostic urinalysis is very useful in the differential diagnosis of acute renal failure and can predict the severity. Ren Fail 17:721-729.
43. Gay, C., Cochat, P., Pellet, H., Floret, D., and Buenerd, A. 1987. [Urinary sediment in acute renal failure]. Pediatrie 42:723-727.
44. Schentag, J.J., Gengo, F.M., Plaut, M.E., Danner, D., Mangione, A., and Jusko, W.J. 1979. Urinary casts as an indicator of renal tubular damage in patients receiving aminoglycosides. Antimicrob Agents Chemother 16:468-474.
45. Gyory, A.Z., Hadfield, C., and Lauer, C.S. 1984. Value of urine microscopy in predicting histological changes in the kidney: double blind comparison. Br Med J 288:819-822.
46. Chawla, L.S., Dommu, A., Berger, A., Shih, S., and Patel, S.S. 2008. Urinary sediment cast scoring index for acute kidney injury: a pilot study. Nephron Clin Pract 110:c145-150.
47. Perazella, M.A., Coca, S.G., Hall, I.E., Iyanam, U., Koraishy, M., and Parikh, C.R. 2010. Urine microscopy is associated with severity and worsening of acute kidney injury in hospitalized patients. Clin J Am Soc Nephrol 5:402-408.
48. Mandal, A.K., Sklar, A.H., and Hudson, J.B. 1985. Transmission electron microscopy of urinary sediment in human acute renal failure. Kidney Int 28:58-63.
49. Mandal, A.K. 1986. Transmission electron microscopy of urinary sediment in renal disease. Semin Nephrol 6:346-370.
50. Mandal, A.K. 1988. Analysis of urinary sediment by transmission electron microscopy. An innovative approach to diagnosis and prognosis in renal disease. Clin Lab Med 8:463-481.
51. Ricci, Z., Cruz, D., and Ronco, C. 2008. The RIFLE criteria and mortality in acute kidney injury: A systematic review. Kidney Int 73:538-546.
52. Cruz, D.N., Ricci, Z., and Ronco, C. 2009. Clinical review: RIFLE and AKIN--time for reappraisal. Crit Care 13:211.

39
53. Uchino, S. 2008. Outcome prediction for patients with acute kidney injury. Nephron Clin Pract 109:c217-223.
54. Nickolas, T.L., Barasch, J., and Devarajan, P. 2008. Biomarkers in acute and chronic kidney disease. Curr Opin Nephrol Hypertens 17:127-132.
55. Parikh, C.R., Mishra, J., Thiessen-Philbrook, H., Dursun, B., Ma, Q., Kelly, C., Dent, C., Devarajan, P., and Edelstein, C.L. 2006. Urinary IL-18 is an early predictive biomarker of acute kidney injury after cardiac surgery. Kidney Int 70:199-203.
56. Haase-Fielitz, A., Bellomo, R., Devarajan, P., Story, D., Matalanis, G., Dragun, D., and Haase, M. 2009. Novel and conventional serum biomarkers predicting acute kidney injury in adult cardiac surgery--a prospective cohort study. Crit Care Med 37:553-560.
57. Herget-Rosenthal, S., Poppen, D., Husing, J., Marggraf, G., Pietruck, F., Jakob, H.G., Philipp, T., and Kribben, A. 2004. Prognostic value of tubular proteinuria and enzymuria in nonoliguric acute tubular necrosis. Clin Chem 50:552-558.
58. Nickolas, T.L., O'Rourke, M.J., Yang, J., Sise, M.E., Canetta, P.A., Barasch, N., Buchen, C., Khan, F., Mori, K., Giglio, J., et al. 2008. Sensitivity and specificity of a single emergency department measurement of urinary neutrophil gelatinase-associated lipocalin for diagnosing acute kidney injury. Ann Intern Med 148:810-819.