
Can consumption predict advertising expenditures?
21
CAN CONSUMPTION PREDICT ADVERTISING EXPENDITURES? 1 Can Consumption Predict Advertising Expenditures?: The Advertising-Consumption Relation Before and After the Dot-Com Crisis in Germany Juliane A. Lischka, Stephanie Kienzler, Ulrike Mellmann Institute of Mass Communication and Media Research (IPMZ), University of Zurich Keywords: Advertising budgeting, private household consumption, consumer behavior, activist view, deterministic view, economic crisis, Granger causality, impulse response function Abstract Two contradictory schools of thought—the activists and the determinists—predict that either diffusion of knowledge (e.g., through advertising) leads to economic growth or that economic growth increases marketing and advertising activities. This study assesses the causal relation between corporate advertising expenditures and private consumption applying vector autoregressive (VAR) models to aggregate German quarterly data from 1991 to 2009. Results indicate a break in the advertising-consumption relation after the dot-com crisis. Hence, the macroeconomic advertising-consumption relation is not stable over time. Since 2001, consumption has Granger-caused advertising expenditures. This change suggests a higher relevance of consumer behavior for advertising budgeting decisions. Corresponding author: Juliane A. Lischka Address: IPMZ, Andreasstrasse 15, CH-8050 Zurich, Switzerland Phone: +41 (0)44 635 20 75 Fax: +41 (0)44 634 49 34 E-mail: [email protected] Authors’ note: This study was conducted for the project “The Impact of Changes in Advertising on the Media”, funded by the Swiss National Science Foundation (grant number 100017_130367). The authors would like to thank the anonymous reviewers for their most useful comments.
Transcript of Can consumption predict advertising expenditures?

CAN CONSUMPTION PREDICT ADVERTISING EXPENDITURES? 1
Can Consumption Predict Advertising Expenditures?:
The Advertising-Consumption Relation Before and After the Dot-Com Crisis in
Germany
Juliane A. Lischka, Stephanie Kienzler, Ulrike Mellmann
Institute of Mass Communication and Media Research (IPMZ), University of Zurich
Keywords: Advertising budgeting, private household consumption, consumer behavior,
activist view, deterministic view, economic crisis, Granger causality, impulse response function
Abstract
Two contradictory schools of thought—the activists and the determinists—predict that either
diffusion of knowledge (e.g., through advertising) leads to economic growth or that economic
growth increases marketing and advertising activities. This study assesses the causal relation
between corporate advertising expenditures and private consumption applying vector
autoregressive (VAR) models to aggregate German quarterly data from 1991 to 2009. Results
indicate a break in the advertising-consumption relation after the dot-com crisis. Hence, the
macroeconomic advertising-consumption relation is not stable over time. Since 2001,
consumption has Granger-caused advertising expenditures. This change suggests a higher
relevance of consumer behavior for advertising budgeting decisions.
Corresponding author: Juliane A. Lischka
Address: IPMZ, Andreasstrasse 15, CH-8050 Zurich, Switzerland
Phone: +41 (0)44 635 20 75
Fax: +41 (0)44 634 49 34
E-mail: [email protected]
Authors’ note: This study was conducted for the project “The Impact of Changes in
Advertising on the Media”, funded by the Swiss National Science Foundation (grant number
100017_130367). The authors would like to thank the anonymous reviewers for their most
useful comments.

CAN CONSUMPTION PREDICT ADVERTISING EXPENDITURES? 2
INTRODUCTION
Advertising expenditures are closely related to the economic cycle1 as companies tend to cut
down their expenses in a recession. Hence, advertising markets struggle during economic crises.
Being the most dominant contributor to media, media markets struggle as a result.2
Consumption as a measure of aggregate consumer behavior should show an even closer
connection to advertising expenditures since most advertising is consumer targeted. While the
dynamic interrelation between advertising and private consumption has been widely discussed,3
a consensus has yet to be reached. The debate is based on two contradictory schools of thought,
the “activist” and “deterministic” view:
According to the activist view, one of advertising’s purposes is to activate demand by
diffusion of knowledge and by influencing consumers’ inter-temporal preferences.4 This is
based on the endogenous growth theory, which states that diffusion and accumulation of
knowledge lead to economic growth. Therefore, both consumption and economic growth are
expected to increase in response to advertising activity. Accordingly, lower advertising
expenditures can negatively impact household consumption and, consequently, overall
economic performance.
In the deterministic view, consumption is a determinant of advertising expenditures. On the
one hand, it refers to a microeconomic point of view based on the idea that increasing income
leads to an increase in demand. “Companies that want to have their share of the growing
economic pie, for example, use advertising to attract new customers, and growing demand for
personnel boosts recruitment advertising.”5 On the other hand, it can be traced back to the
“principle of relative constancy (PRC)” that was originally formulated by McCombs in 1972
postulating a parallel development of consumers' as well as advertisers' spending on mass media
and the general economy.6 Thus, increasing (decreasing) revenues should result in increasing

CAN CONSUMPTION PREDICT ADVERTISING EXPENDITURES? 3
(decreasing) advertising expenditures. Accordingly, one would assume the opposite direction
of influence running from consumption to advertising expenditures.
In face of these arguments, the goal of this study is to detect whether consumption is useful
to predict advertising expenditures that would enable decision makers to better anticipate future
developments in media markets. From a media economic point of view, advertising is one of
the most important financing sources for media organisations and a key factor for the existence
of mass media systems. Being able to predict advertising revenues of media companies would
close one important research gap in media economics. Therefore, we ask the following research
question:
When can household consumption predict companies’ advertising expenditures?
Our paper is structured as follows. First, we use a circular flow model to illustrate the
economic relation between corporate advertising expenditures and household consumption.
Then, we summarize the literature on this relation. We review the activist and deterministic
argument and describe empirical results. Next, we apply vector autoregression (VAR) models,
Granger-causality tests, and impulse response functions (irf) to German quarterly data on
advertising expenditures and household consumption. The data cover the period fiscal quarter
1 in 1991 to fiscal quarter 4, 2009, therefore covering the period of the dot-com crisis in 2000.
After discussing results, we close with conclusions and the study’s limitations.
THEORETICAL REVIEW AND EMPIRICAL RELATIONS
A circular flow model illustrates potential relationships (in terms of accounting entities) in
which economic behavior occurs. Household consumption and advertising expenditures of
companies are parts of the circular flow that are not directly linked with each other (see
Figure 1). Advertising expenditures can be considered company investments or expenses7 that
underlie a decision-making process generally involving costs, expected revenues, and therefore

CAN CONSUMPTION PREDICT ADVERTISING EXPENDITURES? 4
also demand.8 Household consumption can be considered returns to companies in trade of real
goods or services that were subject to consumer choice.
Figure 1. Simple Circular Flow Model With Illustration of Activists’ and Determinists’
Assumptions
Companies Households
Investments / expenses
Consumption
SavingsSavings
Working force
Consumer goods market
Labour market
Capital
Salaries / wages
Goods / services
Activists
Determinists
Note. Capital market not displayed
Source: Compiled by the authors
Of central concern in this study, the activists and deterministic arguments are visualized in
the circular flow model (see
Figure 1). Representing the activist view, already Galbraith claims that advertising serves as
a central instrument of an “effective management of consumer behavior.”9 Advertising
expenditures are said to create demand for products (see bold black arrow in
Figure 1) by drawing income from savings to consumption. Contrarily, the deterministic
view assumes that consumption drives advertising because higher sales derived from increased
consumption lead to more advertising activities (see dotted arrow in

CAN CONSUMPTION PREDICT ADVERTISING EXPENDITURES? 5
Figure 1). This cause-and-effect chain is considered to be consistent with the practitioners’
rule wherein the advertising budget should comprise a share of sales, market share, or similar.10
Accordingly, Hsu et al. find that, “whenever manufacturers realise more revenues from sales,
they tend to spend more on advertising.”11 Note that these rules can be optimal for a company
when the elasticity of demand increases with advertising expenditures.12
However, “[c]ommunications activities alone or in combination do not simply cause market
impact…. In fact, a myriad of controllable and uncontrollable factors complicate the
relationship between, say, a product advertisement run and the product sales afterward”13
(emphasis in original) on the micro level. Therefore, empirical results testing the directional
relation between advertising and consumption fail to provide a unified picture.
On the one hand, a set of studies often support that advertising has an impact on aggregate
consumption. Taylor and Weiserbs14 and Molinari and Turino15 confirm the causal direction
argued by the activists, running from advertising expenditures to aggregate consumption, using
U.S. annual data from 1929 to 1968 and U.S. quarterly data from 1971 to 2005, respectively.
In addition, Rehme and Weisser,16 using German annual data from 1950 to 2000, show that
advertising expenditures Granger-cause consumption. Also Sturgess and Wilson17 show that
advertising precedes consumption for German quarterly data from 1974 to 1982.
On the other hand, many studies support the determinists, finding a unidirectional causal
relation from consumption to advertising expenditures. Ashley, Granger, and Schmalensee
conclude from quarterly U.S. data from 1956 to 1975 that “fluctuations in aggregate
consumption cause fluctuations in aggregate advertising.”18 Quarles and Jeffres19 apply a path
analytic framework for 53 countries, confirming the influence of income on consumption,
which in turn influences advertising expenditures. Also Duffy20 finds support for the
deterministic view using quarterly U.K. data from 1963 to 1985 for non-durables. Hsu et al.21
apply a VAR model including Granger-causality tests and impulse-response functions to annual

CAN CONSUMPTION PREDICT ADVERTISING EXPENDITURES? 6
U.S. aggregate data to examine advertising expenditures and consumption from 1848 to 1995.
Whereas impulse response functions do not show significant impacts between changes in
consumption and advertising, Granger-causality tests show that consumption helps to predict
future advertising—but not the other way around.
Additionally, there are also studies that find both directions of influence22 or no causal
relation.23
Inconsistent results of former studies might derive from different time horizons or different
levels of temporal aggregation. Most importantly however, none of the studies considered
possible shifts in the relation between advertising and consumption during their observation
periods, although “model stability over such a long period of time is highly unlikely.”24 Within
each observation period, there could be periods with structural changes and therefore different
causal relations between both variables. Ignoring structural changes is perilous and could lead
to inaccurate forecasts.25
METHOD
Sample and Procedures
This study analyzes the relation between total advertising expenditures (on newspapers,
magazines, journals, television, and radio) and aggregate private household consumption,
accounting for potential structural breaks over time. We also include GDP—which correlates
with consumption as well as advertising expenditures—in order to eliminate the impact it might
have on the relationship between our two focal variables. This way, we make sure that the
relation between consumption and advertising is not solely driven by GDP. We use quarterly
data for Germany from fiscal quarter 1, 1991 to fiscal quarter 4, 2009. Data on advertising
expenditures stem from Nielsen Media Research, as published in Media Perspektiven; data on
aggregate household consumption, and GDP were retrieved from Eurostat.

CAN CONSUMPTION PREDICT ADVERTISING EXPENDITURES? 7
Compared to annual data, quarterly data contain additional information on causal relations
that occur within one year.26 Due to the German reunion in 1990, only German data from 1991
onward are used. Because advertising expenditures strongly decrease from 2010 onwards due
to the financial crisis, the observation period ends in fiscal quarter 4, 2009. German data were
selected due to the size of Germany’s economy and the lack of research on German data,
compared to U.S. or U.K. data. All data are deflated by the Organisation for Economic Co-
operation and Development (OECD) Consumer Price Index to eliminate possible inflation
noise. Furthermore, data were seasonally adjusted because all variables follow a specific pattern
over the four quarters of each year. By cleaning up the seasonal component, we make sure that
our results are not merely based on spurious correlations of these short-term movements, but
effectively capture the fundamental relation between the variables.
Figure 2 plots multiplicative seasonally adjusted quarterly advertising expenditures, private
consumption, and GDP against time. Observations are z-transformed by subtracting the mean
and dividing by the standard deviation. Thus, we can display all data on one scale that indicates
the standard score (i.e., the signed number of standard deviations of which the data are above
or below the mean (0)). From visual observation, the fourth quarter in 2000 of advertising
expenditure forms a clear break in the series. Advertising expenditures seriously dropped after
the dot-com crisis due to a loss of confidence in business.27

CAN CONSUMPTION PREDICT ADVERTISING EXPENDITURES? 8
Figure 2: Advertising Expenditures, Private Consumption, and GDP (Seasonally
Adjusted, Z-Standardized)
Besides the burst of the dot-com bubble in March 2000, the observation period from 1991
to 2009 includes further external global and local events that could confound the advertising-
consumption relation. For example, the founding of European Union in 1993, the terrorist attack
on September 9, 2001, in New York, the introduction of the Euro currency in January of 2002
or even the 2006 FIFA World Cup in Germany could change consumer or business confidence
and therefore purchasing or advertising investing decisions. Further, recessions or economic
upturns can moderate advertising expenditures as well as private consumption. The German
economy experienced several upturns (e.g., the German post-reunification boom phase until
1992, 2005 to 2008) as well as recessions (e.g., troughs in 1993, 1996, 2004, and 2009)28 during
the observation period.
To test potential impacts of external events to the data series, we apply break date analyses.
Following Stock and Watson (2012), it is important to test for break dates in time series. The
Quandt likelihood ratio (QLR) test29 for unknown breaks with 15 percent trimming30 calculates
-3
-2
-1
0
1
2
3
1991
q1
1991
q4
1992
q3
1993
q2
1994
q1
1994
q4
1995
q3
1996
q2
1997
q1
1997
q4
1998
q3
1999
q2
2000
q1
2000
q4
2001
q3
2002
q2
2003
q1
2003
q4
2004
q3
2005
q2
2006
q1
2006
q4
2007
q3
2008
q2
2009
q1
2009
q4
Sta
ndar
d sc
ore
Time (quarters)
Advertising expenditures Consumption GDP
CAN CONSUMPTION PREDICT ADVERTISING EXPENDITURES? 9
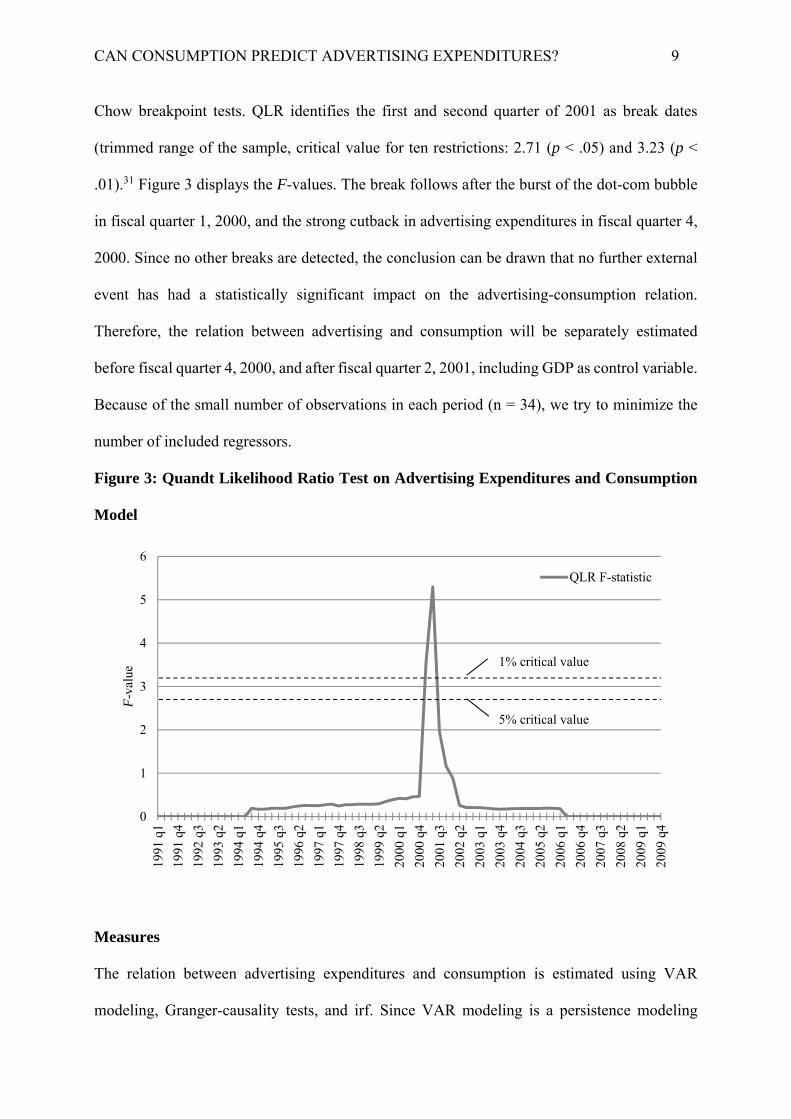
Chow breakpoint tests. QLR identifies the first and second quarter of 2001 as break dates
(trimmed range of the sample, critical value for ten restrictions: 2.71 (p < .05) and 3.23 (p <
.01).31 Figure 3 displays the F-values. The break follows after the burst of the dot-com bubble
in fiscal quarter 1, 2000, and the strong cutback in advertising expenditures in fiscal quarter 4,
2000. Since no other breaks are detected, the conclusion can be drawn that no further external
event has had a statistically significant impact on the advertising-consumption relation.
Therefore, the relation between advertising and consumption will be separately estimated
before fiscal quarter 4, 2000, and after fiscal quarter 2, 2001, including GDP as control variable.
Because of the small number of observations in each period (n = 34), we try to minimize the
number of included regressors.
Figure 3: Quandt Likelihood Ratio Test on Advertising Expenditures and Consumption
Model
Measures
The relation between advertising expenditures and consumption is estimated using VAR
modeling, Granger-causality tests, and irf. Since VAR modeling is a persistence modeling
0
1
2
3
4
5
6
1991
q1
1991
q4
1992
q3
1993
q2
1994
q1
1994
q4
1995
q3
1996
q2
1997
q1
1997
q4
1998
q3
1999
q2
2000
q1
2000
q4
2001
q3
2002
q2
2003
q1
2003
q4
2004
q3
2005
q2
2006
q1
2006
q4
2007
q3
2008
q2
2009
q1
2009
q4
F-v
alue
QLR F-statistic
1% critical value
5% critical value

CAN CONSUMPTION PREDICT ADVERTISING EXPENDITURES? 10
procedure32 and allows dynamic and interdependent analyses between intervening variables of
different time lags without the a priori definition of endogenous or exogenous variables,33 it
can well be employed to the dynamic advertising-consumption relation.
Before estimating the advertising-consumption relation in a VAR, we tested the relation
between consumption and GDP as well as advertising and GDP by estimating separate VAR
models. For consumption, current GDP and GDP of the first lag are relevant. On the other hand,
GDP and advertising are in no relation. Therefore, current GDP and the first lag of GDP are
included to the advertising-consumption model as external variable. The resulting VAR model
for consumption (C) and advertising expenditures (A), including p lags as well as GDP (G), can
be written as advertising and consumption equations
At = μ1 + π11At-1 + π12Ct-1 +…+ π1pAt-p + π1pCt-p + λ1Gt + λ12Gt-1 + u1t
Ct = μ2 + π21Ct-1 + π22At-1 +…+ π2pAt-p + π2pCt-p + λ2Gt + λ22Gt-1 + u2t
where μ, π, and λ are coefficients and u1 and u2 are the error terms.
Commonly used augmented Dickey–Fuller (ADF) test, Kwiatkowski–Phillips–Schmidt–
Shin (KPSS) test and Zivot-Andrews unit root test allowing for one structural break prove that
neither advertising expenditures nor consumption first differences contain unit roots but are
trend and level stationary (see Appendix A). As a standard procedure, seasonal components are
eliminated from the consumption and GDP series by including external dummy variables. Due
to different seasonal patterns before and after 2001, advertising expenditures are deseasonalised
before estimating the VAR. The appropriate lag order of the VAR model is selected using
Akaike’s information criterion, Schwarz’s Bayesian information criterion, the Hannan–Quinn’s
information criterion, and Wald lag exclusion statistics. VAR model adequacy is verified using
Lagrange multiplier test for residual serial correlation and Portmanteau test and Bartlett’s (B)
statistic for white noise in the residuals (see Appendix C). Please see Appendix B for advertising
and consumption coefficients of the VAR models.

CAN CONSUMPTION PREDICT ADVERTISING EXPENDITURES? 11
ESTIMATION RESULTS AND DISCUSSION
The break in 2001 proves true since different advertising-consumption relations can be detected
before and after 2001. The results of Granger-causality tests in Table 1 show that consumption
tends to be better predicted when changes in advertising expenditures are taken into account
before 2001. The irf results in
Figure 4 also show a tendency of advertising impacting consumption—for both periods.
Likewise, the VAR coefficients confirm that changes in advertising expenditures influence
future consumption before and after 2001 (Appendix B). After 2001, advertising expenditures
can be predicted better using previous changes in consumption. Irf in Figure 5 support this
result: after 2001, a change in consumption will cause a positive change in advertising
expenditures in the next quarter. Before 2001, there was no impact of consumption on
advertising. The underlying VAR (Appendix B) identifies coefficients of consumption of lags
one, two, and three as influencers of advertising expenditures after 2001. Therefore, the strong
effect of consumption changes on the next quarter might die out until three quarters ahead.
In sum, the influence of advertising on consumption exists throughout the observation
period, which is in line with the activist view. But the impact of consumption on advertising
evolves only after the dot-com crises and the drop of advertising expenditures. Therefore, after
2001, private consumption helps to predict corporate advertising expenditures. On a macro
level, this result supports the deterministic point of view.
Within the next paragraphs, we interpret these findings from a meso perspective (i.e., we
discuss what might have changed with the organization’s budget-setting process).

CAN CONSUMPTION PREDICT ADVERTISING EXPENDITURES? 12
Table 1. Granger-causality Test Before and After the Break in 2001 q1 and q2
Causal direction 1992 q2 – 2000 q3 2001 q3 – 2009 q4
F p F p
Advertising expenditures consumption 1.6588 0.0967 1.7838 0.1717
Consumption advertising expenditures 2.3716 0.2036 3.2622 0.0326
Note. n = 34 observations each, 1992 q2 – 2000 q3 and 2001 q3 – 2009 q4
Figure 4: Impulse Response Function of Advertising Expenditures Consumption
-50000
0
50000
100000
0 1 2 3 4 5 6 7 8 0 1 2 3 4 5 6 7 8
2001 q3 - 2009 q41992 q2 - 2000 q3
95% CI impulse response function (irf)
step

CAN CONSUMPTION PREDICT ADVERTISING EXPENDITURES? 13
Figure 5. Impulse Response Function of Consumption Advertising Expenditures
First of all, these results are in line with observations that a new generation of marketing
manager pays closer attention to strengths and opportunities.34 There are also findings
indicating that companies adjust their marketing strategy and activities during recessions and
are thus more reactive to consumer behavior during crises.35 In this respect, the crisis might
have served as a catalyst to foster a general trend among decision makers to rely more heavily
on data.36 Studies also show that, in times of uncertainty, planning horizons become shorter,37
and scholars argue that “real option” approaches are more suitable than commonly used static
decision-making frameworks.38 Here, the idea is to pursue a dynamic and flexible decision-
making process; that is, to constantly incorporate new information in order to get better
results.39 In addition to that, Deleersnyder et al.40 show that, with higher stock market pressure,
advertising expenditures react more sensitively to economic situations. As stock market
pressure may have increased since the dot-com crisis, advertising activities are more closely
-5.000e-06
0
5.000e-06
.00001
0 1 2 3 4 5 6 7 8 0 1 2 3 4 5 6 7 8
1992 q2 - 2000 q3 2001 q3 - 2009 q4
95% CI impulse response function (irf)
step

CAN CONSUMPTION PREDICT ADVERTISING EXPENDITURES? 14
adjusted to consumer behavior. To sum it up, the impact of consumption on advertising
expenditures after the crisis can be interpreted as the result of a more short-term-oriented and
data-driven decision-making process due to the uncertainties managers were facing. Hence, a
deterministic advertising budgeting may not involve mechanical decisions, but, rather, is
dynamically consumption driven. In general, consumer choice is important to a company’s
marketing strategy,41 which is especially true during crises. Dutt and Padmanabhan42 argue that
the impact of a crisis on a company is best understood by considering changes in consumer
behavior. Further, during the last decade, managers may have increasingly recognized that
successful marketing requires understanding of and reacting to the demand side. This new
mindset is essential for successful resonance marketing,43 which adapts to changes in
consumption. The burst of the dot-com bubble might have operated as a catalyst leading to more
carefully planned advertising activities considering external information, such as previous
consumer choice instead of expected demand.
SUMMARY AND CONCLUSIONS
This study assesses the relation between advertising expenditures and consumption in a VAR
model using German quarterly data from 1991 to 2009. Results reveal that macroeconomic
relations may not be stable over time. Changes in relations can occur due to breaks caused by
major, dramatic events in the environment. The advertising-consumption relation is susceptible
to such breaks due to changes in corporate advertising activities.
The dot-com crisis in 2000 accounts for a strong negative impact on advertising expenditures
in 2001. Separate analyses of the periods before vs. after the dot-com crisis show that this
dramatic event inverted the Granger-causality between advertising expenditures and
consumption. Before the crisis, the estimation shows that advertising expenditures tend to
Granger-cause consumption. From 2001 onwards, consumption changes can predict changes in
advertising expenditures, revealing a closer adjustment of advertising activities to previous

CAN CONSUMPTION PREDICT ADVERTISING EXPENDITURES? 15
consumer behavior and resulting revenues. Hence, periods of different causal relations between
advertising expenditures and consumption exist and can be determined by detecting structural
breaks. We argue that a change in advertising budgeting occurred since 2000 that is detectable
on aggregate level. This change incorporates a higher relevance of previous consumer behavior
for decision making about advertising budgeting. Since the results also indicate an influence of
advertising on consumption, this study finds support for a circular advertising-consumption
relation.
To establish our findings, the relation between consumption and advertising expenditures
must be explored before and after other recent crises in different countries. In addition, it may
be valuable to assess differences in this relation for various media, between consumer and
durable goods, and industries. As our study draws conclusions on a micro level using aggregate
data that might lead to a loss of information,44 it is desirable to analyze the advertising-
consumption relation on temporal45 and sectoral disaggregate levels. Yet, accessing advertising
expenditure data on a disaggregated level is often difficult.46
We conclude that, besides the economic cycle, consumer behavior is relevant for the
prediction of advertising activity of companies. The drop of advertising expenditures after the
dot-com crisis is a dramatic event that changed advertising behavior in Germany in terms of a
closer adaptation of advertising budget to previous consumption. Changes in consumption
behavior have become more relevant than ever for the advertising income of media companies
today.

CAN CONSUMPTION PREDICT ADVERTISING EXPENDITURES? 16
Appendix A: Augmented Dickey–Fuller (ADF) and Kwiatkowski–Phillips–Schmidt–
Shin (KPSS) Tests for Stationarity
Variable ADF test KPSS testb Zivot-Andrews test
Test statistica Trend
stationarity
test statisticc
Level
stationarity
test statisticd
Minimum t-
statistice
Advertising
expenditures
-13.30 .06 .10 -13.85
Conclusion:
no unit root
Conclusion:
trend
stationary
Conclusion:
level
stationary
Conclusion: trend
stationary process
that allows for a
one time break
Consumption -10.22 .04 .37 -10.80
Conclusion:
no unit root
Conclusion:
trend
stationary
Conclusion:
level
stationary
Conclusion: trend
stationary process
that allows for a
one time break
Note.
a Critical value for H0: “Y contains unit root” is -3.475 at the 5% level of significance.
b Test statistics are reported at lag order 4.
c Critical value for H0: “Y is trend stationary” is 0.146 at the 5% level of significance.
d Critical value for H0: “Y is level stationary” is 0.463 at the 5% level of significance.
e Critical value for H0: “Y is a unit root process with drift that excludes exogenous structural
change” -5.08 at the 5% level of significance.

CAN CONSUMPTION PREDICT ADVERTISING EXPENDITURES? 17
Appendix B: VAR Coefficients of Advertising Expenditures and Consumption
1992 q2 – 2000 q3
Consumption equation Advertising expenditures
Coef. Std. Err.
t p Consump-tion
Coef. Std. Err.
t p
At-1 1.70E+04
2.50E+04
0.68 0.50 Ct-1 -0.42 0.16 -2.56 0.02
At-3 5.63E+04
2.60E+04
2.16 0.04 Ct-2 0.02 0.08 0.20 0.84
At-4 5.05E+04
2.82E+04
1.79 0.09 Ct-3 0.21 0.10 2.23 0.04
Advertising exenditures equation Advertising expenditures
Coef. Std. Err.
t p Consump-tion
Coef. Std. Err.
t p
At-1 -0.04 0.19 -0.19 0.85 Ct-1 -2.11E-06
1.28E-06
-1.65 0.11
At-3 -0.45 0.20 -2.25 0.03 Ct-3 -7.10E-07
6.01E-07
-1.18 0.25
At-4 0.41 0.22 1.87 0.08 Ct-4 -6.00E-07
7.42E-07
-0.81 0.43
2001 q3 – 2009 q4
Consumption equation Advertising expenditures
Coef. Std. Err.
t p Consump-tion
Coef. Std. Err.
t p
At-1 -3.02E+04
1.70E+04
-1.78 0.09 Ct-1 -0.30 0.19 -1.60 0.13
At-2 2.21E+04
1.69E+04
1.31 0.21 Ct-2 -0.15 0.21 -0.71 0.49
At-3 1.77E+04
1.03E+04
1.72 0.10 Ct-2 0.03 0.19 0.17 0.87
At-4 1.30E+04
5.46E+03
2.37 0.03 Ct-3 -0.45 0.16 -2.87 0.01
Advertising expenditures equation Advertising expenditures
Coef. Std. Err.
t p Consump-tion
Coef. Std. Err.
t p
At-1 -0.06 0.17 -0.33 0.74 Ct-1 5.65E-06
1.87E-06
3.01 0.01
At-2 -0.40 0.17 -2.33 0.03 Ct-2 4.57E-06
2.11E-06
2.17 0.04
At-3 -0.07 0.10 -0.66 0.51 Ct-3 4.05E-06
1.89E-06
2.15 0.04
At-4 0.06 0.05 1.06 0.30 Ct-4 1.48E-06
1.57E-06
0.94 0.36

CAN CONSUMPTION PREDICT ADVERTISING EXPENDITURES? 18
Appendix C: Post Estimation of VAR Residuals
Lagrange Multiplier Test
H0: No autocorrelation at lag order
Lag 1992 q2 – 2000 q3 2001 q3 – 2009 q4
χ2 df p χ2 df p
1 1.73 4 0.79 6.34 4 0.17
2 6.66 4 0.15 3.38 4 0.50
3 3.48 4 0.48 5.44 4 0.25
4 7.14 4 0.13 6.07 4 0.19
5 7.10 4 0.13 3.31 4 0.51
6 3.72 4 0.45 1.20 4 0.88
White Noise Tests
Estimation Portmanteau (Q) test
H0: No serial correlation
Bartlett’s test
H0: White-noise process
Q statistic p B statistic p
1992 q2 – 2000 q3 12.44 0.65 0.47 0.98
2001 q3 – 2009 q4 16.96 0.32 0.46 0.99
1 Richard Van Der Wurff, Piet Bakker, And Robert G. Picard, “Economic Growth And Advertising Expenditures In Different Media In Different Countries,” Journal of Media Economics 21, no. 1 (2008), doi:10.1080/08997760701806827. Barbara Deleersnyder et al., “The Role Of National Culture In Advertising's Sensitivity To Business Cycles: An Investigation Across Continents,” Journal of Marketing Research (JMR) 46, no. 5 (2009), doi:10.1509/jmkr.46.5.623.; Gerard J. Tellis and Kethan Tellis, “Research On Advertising In A Recession: A Critical Review And Synthesis,” Journal of Advertising Research 49, no. 3 (2009), doi:10.2501/S0021849909090400.; Robert G. Picard, “Effects Of Recessions On Advertising Expenditures: An Exploratory Study Of Economic Downturns In Nine Developed Nations,” Journal of Media Economics 14, no. 1 (2001), doi:10.1207/S15327736ME1401_01. 2 Karl E. Gustafsson, “Advertising And The Development Of Media: The Forgotten Connection,” Journal of

CAN CONSUMPTION PREDICT ADVERTISING EXPENDITURES? 19
Media Business Studies 3, no. 1 (2006); Dennis A. Kopf, Ivonne M. Torres, and Carl Enomoto, “Advertising's Unintended Consequence,” Journal of Advertising 40, no. 4 (2011), doi:10.2753/JOA0091-3367400401; Gabriele Siegert, Ulrike Mellmann, and Loris Russi, “Comparing Advertising Markets: Case Studies Of Eight Countries” Working Paper of IPMZ Division 4 media economics media management and advertising 7 (2010) (unpublished manuscript, July 25, 2010); van der Wurff, Bakker and Picard, “Economic Growth." 3 Kyle Bagwell, “The Economic Analysis of Advertising,” in Handbook of Industrial Organization Volume 3: Volume 3, vol. 3, edited by Mark Armstrong and Robert Porter, Handbook of Industrial Organization (Elsevier, 2007), 1701–844, 3.; Richard F. Beltramini, “Communications Budgeting,” In Wiley International Encyclopedia of Marketing, edited by Jagdish Sheth and Naresh K. Malhotra (Chichester, UK: John Wiley & Sons, Ltd, 2010), 1–2, http://onlinelibrary.wiley.com/doi/10.1002/9781444316568.wiem01007/pdf.; Marnik G. Dekimpe et al., “Time-series Models in Marketing,” in Handbook of marketing decision models, vol. 121, edited by Frederick S. Hillier and Berend Wierenga, International Series in Operations Research & Management Science (Boston, Mass.: Springer US, 2008), 373–98, 121.; Kopf, Torres and Enomoto, “Advertising's Unintended Consequence”; Ronald Savitt, “The State of the Art in Marketing and Economic Development,” Research in Marketing 4, no. 4 (1988). 4 Kyle Bagwell, The Economics of Advertising, The international library of critical writings in economics 136 (Cheltenham: Elgar, 2001), http://www.gbv.de/dms/hbz/toc/ht013424801.pdf; John Philip Jones, When Ads Work: New Proof that Advertising Triggers Sales, 2nd ed. (Armonk, NY: Sharpe, 2007); Kopf, Torres and Enomoto, “Advertising's Unintended Consequence.” 5 van der Wurff, Bakker, and Picard, “Economic growth and advertising expenditures” 29. 6 Byeng-Hee Chang and Sylvia M. Chan-Olmsted, “Relative Constancy of Advertising Spending: A Cross-national Examination of Advertising Expenditures and Their Determinants,” International Communication Gazette 67, no. 4 (2005), doi:10.1177/0016549205054283. 7 See the discussion on advertising as expense versus advertising as investment in Deleersnyder et al., “The Role of National Culture in Advertising's Sensitivity,” 625. 8 Richard F. Beltramini, “Communications Budgeting,” in Wiley International Encyclopedia of Marketing, edited by Jagdish Sheth and Naresh K. Malhotra (Chichester, UK: John Wiley & Sons, Ltd, 2010), 1–2, http://onlinelibrary.wiley.com/doi/10.1002/9781444316568.wiem01007/pdf; Gary L. Lilien and Philip Kotler, Marketing Decision Making: A Model-Building Approach (New York: Harper & Row, 1983). 9 John Kenneth Galbraith, The New Industrial State, 3rd ed. (Boston: Houghton Mifflin, 1967), 210. 10 Maxwell K. Hsu et al., “Does Advertising Stimulate Sales or Mainly Deliver Signals? A Multivariate Analysis,” International Journal of Advertising 21, no. 2 (2002); Lilien and Kotler, Marketing Decision Making; Malcolm Wright, “A New Theorem for Optimizing the Advertising Budget,” Journal of Advertising Research 49, no. 2 (2009), doi:10.2501/S0021849909090229. 11 Hsu et al., “Does Advertising Stimulate Sales?,” 187. 12 See, for example, Robert Dorfman and Peter O. Steiner, “Optimal Advertising and Optimal Quality,” The American Economic Review 44, no. 5 (1954); Wright, “A New Theorem for Optimizing the Advertising Budget,” We would like to thank an anonymous reviewer for pointing that out. 13 Richard F. Beltramini in Wiley international encyclopedia of marketing, ed. Jagdish N. Sheth and Naresh K. Malhotra (Chichester, West Sussex, U.K: Wiley, 2010), 1. 14 Lester D. Taylor and Daniel Weiserbs, “Advertising and the Aggregate Consumption Function,” American Economic Review 62, no. 4 (1972). 15 Benedetto Molinari and Francesco Turino, “The Role of Advertising in the Aggregate Economy: The Working-Spending Cycle,” Universitat Pompeu Fabra, accessed September 12, 2011, http://sugarhoover.co.uk/articulosrecibidos/Molinari-Turino.pdf. 16 Günther Rehme and Sara-Frederike Weisser, “Advertising, Consumption and Economic Growth: An Empirical Investigation,” Technische Universität Darmstadt, accessed December 22, 2011, http://www.econstor.eu/handle/10419/32093. 17 Brian T. Sturgess and Nicholas Wilson, “Advertising Expenditure and Aggregate Consumption in Britain and West Germany: An Analysis of Causality,” Managerial and Decision Economics 5, no. 4 (1984), doi:10.2307/2487580. 18 Richard Ashley, Clive W. J. Granger, and Richard Schmalensee, “Advertising and Aggregate Consumption: An Analysis of Causality,” Econometrica 48, no. 5 (1980): 1163, doi:10.2307/1912176. 19 Rebecca C. Quarles and Leo W. Jeffres, “Advertising and National Consumption: A Path Analytic Re-examination of the Galbraithian Argument,” Journal of Advertising 12, no. 2 (1983), doi:10.1080/00913367.1983.10672835. 20 Martyn Duffy, “Advertising in Demand Systems: Testing a Galbraithian Hypothesis,” Applied Economics 23, no. 3 (1991): 494. 21 Hsu et al., “Does Advertising Stimulate Sales or Mainly Deliver Signals?,” 22 Chulho Jung and Barry J. Seldon, “The Macroeconomic Relationship Between Advertising and Consumption,” Southern Economic Journal 61, no. 3 (1995), doi:10.2307/1060982.

CAN CONSUMPTION PREDICT ADVERTISING EXPENDITURES? 20
23 Abdur R. Chowdhury, “Advertising Expenditures and the Macro-Economy: Some New Evidence,” International Journal of Advertising 13, no. 1 (1994); Douglas J. Lamdin, “Galbraith on Advertising, Credit, and Consumption: A Retrospective and Empirical Investigation with Policy Implications,” Review of Political Economy 20, no. 4 (2008), doi:10.1080/09538250802308984. 24 Kenneth O. Cogger, “A Time-Series Analytic Approach to Aggregation Issues in Accounting Data,” Journal of Accounting Research 19, no. 2 (1981): 287. 25 Bruce E. Hansen, “The New Econometrics of Structural Change: Dating Breaks in US Labor Productivity,” Journal of Economic Perspectives 15, no. 4 (2001): 127, doi:10.1257/jep.15.4.117. 26 Brendan O'Donovan, David Rae, and Arthur Grimes, “Determinants of Advertising Expenditures: Aggregate and Cross-Media Evidence,” International Journal of Advertising 19, no. 3 (2000). 27 “European Adspend Trends in 2001,” International Journal of Advertising 20, no. 3 (2001). 28 Beate Schirwitz, “A Comprehensive German Business Cycle Chronology,” Empirical Economics 37, no. 2 (2009), doi:10.1007/s00181-008-0233-y. 29 Richard E. Quandt, ed., The Collected Essays of Richard E. Quandt. Volume 1 (Economists of the Twentieth Century series; Aldershot, U.K; Elgar; distributed in the U.S. by Ashgate, Brookfield, Vt, 1992). 30 James H. Stock and Mark W. Watson, Introduction to Econometrics, 3rd ed., The Pearson Series in Economics (Essex: Pearson Education Limited, 2012), 600–3. 31 See ibid., 601. 32 Marnik G. Dekimpe et al., “Time-Series Models in Marketing,” in Handbook of marketing decision models, vol. 121, ed. Frederick S. Hillier and Berend Wierenga, International Series in Operations Research & Management Science (Boston, MA: Springer US, 2008), 373–98, 121. 33 Christopher Sims, “Macroeconomics and Reality,” Econometrica 48, no. 1 (1980), doi:10.2307/1912017. 34 Deborah Morrison, “Talent Shift: a New Generation of Professionals Means a New Profession in the Making,” Advertising & Society Review 10, no. 1 (2009), doi:10.1353/asr.0.0024. 35 Swee H. Ang, “Crisis Marketing: A Comparison Across Economic Scenarios,” International Business Review 10, no. 3 (2001); Shintaro Okazaki and Barbara Mueller, “The Impact of the Lost Decade on Advertising in Japan,” International Journal of Advertising 30, no. 2 (2011), doi:10.2501/IJA-30-2-205-232; Raji Srinivasan, Arvind Rangaswamy, and Gary L. Lilien, “Turning Adversity Into Advantage: Does Proactive Marketing During a Recession Pay Off?,” International Journal of Research in Marketing 22, no. 2 (2005), doi:10.1016/j.ijresmar.2004.05.002. 36 For an overview, see Graeme L. Harrison, “The Accountant’s Role in Marketing: A Bibliographic Study and Analysis of its Origins and Development,” in Financial dimensions of marketing: A sourcebook, ed. Wilson, Richard M. S (London [u.a.]: Macmillan, 1981), 22–57. See also e. g. David W. Stewart, “How Marketing Contributes to the Bottom Line,” Journal of Advertising Research 48, no. 1 (2008): 94, doi:10.2501/S0021849908080112; Malcolm McDonald, “The Future of Marketing: Brightest Star in the Firmament, or a Fading Meteor? Some Hypotheses and a Research Agenda,” Journal of Marketing Management 25, 5-6 (2009), doi:10.1362/026725709X461786; Shuba Srinivasan, Marc Vanhuele, and Koen Pauwels, “Mind-Set Metrics in Market Response Models: An Integrative Approach,” Journal of Marketing Research 47, no. 4 (2010): 672,681, doi:10.1509/jmkr.47.4.672; Marcel Corstjens, Andris Umbljis, and Chao Wang, “The Power of Inertia,” Journal of Advertising Research 51, no. 2 (2011), doi:10.2501/JAR-51-2-356-372; Morten Holm, V. Kumar, and Carsten Rohde, “Measuring Customer Profitability in Complex Environments: An Interdisciplinary Contingency Framework.,” Journal of the Academy of Marketing Science 40, no. 3 (2012): 387; Juliane A. Lischka, Stephanie Kienzler, and Ulrike Mellmann, “Sales Drive Advertising Expenditures: Evidence for Consumer Packaged and Durable Goods in Germany,” International Journal of Marketing Studies 6, no. 1 (2014), doi:10.5539/ijms.v6n1p31. 37 Robert M. Grant, “Strategic Planning in a Turbulent Environment: Evidence from the Oil Majors,” Strategic Management Journal 24, no. 6 (2003), doi:10.1002/smj.314. 38 Charlotte Krychowski and Bertrand V. Quélin, “Real Options and Strategic Investment Decisions: Can They Be of Use to Scholars?,” Academy of Management Perspectives 24, no. 2 (2010). 39 Erik Brynjolfsson, Lorin M. Hitt, and Heekyung H. Kim, “Strength in Numbers: How Does Data-Driven Decisionmaking Affect Firm Performance?,” Working papers series; Krychowski and Quélin, “Real Options and Strategic Investment Decisions: Can They Be of Use to Scholars?,”; S. M. Young, James J. Gong, and Van der Stede, Wim A., “Using Real Options to Make Decisions in the Motion Picture Industry.,” Strategic Finance 93, no. 11 (2012). 40 Deleersnyder et al., “The Role of National Culture in Advertising's Sensitivity to Business Cycles,” 41 Eric K. Clemons, “How Information Changes Consumer Behavior and How Consumer Behavior Determines Corporate Strategy,” Journal of Management Information Systems 25, no. 2 (2008): 15, doi:10.2753/MIS0742-1222250202. 42 Pushan Dutt and V. Padmanabhan, “Crisis and Consumption Smoothing,” Marketing Science 30, no. 3 (2011), doi:10.1287/mksc.1100.0630. 43 Clemons, “How Information Changes Consumer Behavior and How Consumer Behavior Determines

CAN CONSUMPTION PREDICT ADVERTISING EXPENDITURES? 21
Corporate Strategy,” 44 Cogger, “A Time-Series Analytic Approach to Aggregation Issues in Accounting Data,” 45 Gerard J. Tellis and Doyle L. Weiss, “Does TV Advertising Really Affect Sales? The Role of Measures, Models, and Data Aggregation,” Journal of Advertising 24, no. 3 (1995). 46 Gabriele Siegert, Nathan Thomas, and Ulrike Mellmann, “The Development of Advertising: Difficulties of Empirical Measurement and Implications for Media,” in The Media as a Driver of the Information Society: Economics, Management, Policies and Technologies, ed. Alan B. Albarran, Paulo Faustino and Rogério Santos (Lisbon: MediaXXI/Formalpress, 2009), CD-Rom.