Schooling attainment, schooling expenditures, and test scores what causes economic growth?
Upload
independentCategory
view
3download
0
MODELLING THE IMPACT OF AGINGON SOCIAL SECURITY EXPENDITURES
Documentos OcasionalesN.º 0601
Juan F. Jimeno, Juan A. Rojasand Sergio Puente
2006

MODELLING THE IMPACT OF AGING ON SOCIAL SECURITY EXPENDITURES

MODELLING THE IMPACT OF AGING ON SOCIAL SECURITY
EXPENDITURES (*)
Juan F. Jimeno
BANCO DE ESPAÑA, CEPR, AND IZA
Juan A. Rojas
BANCO DE ESPAÑA
Sergio Puente
BANCO DE ESPAÑA
(*) This paper was written as a contribution for the Seminar on Ageing and Pensions organised by the ECB WorkingGroup on Econometric Modelling, Frankfurt 6-7 December 2005.
Documentos Ocasionales. N.º 0601
2006

The Occasional Paper Series seeks to disseminate work conducted at the Banco de España, in the performance of its functions, that may be of general interest. The opinions and analyses in the Occasional Paper Series are the responsibility of the authors and, therefore, do not necessarily coincide with those of the Banco de España or the Eurosystem. The Banco de España disseminates its main reports and most of its publications via the INTERNET atthe following website: http://www.bde.es Reproduction for educational and non-commercial purposes is permitted provided that the source is acknowledged. © BANCO DE ESPAÑA, Madrid, 2006 ISSN: 1696-2222 (print) ISSN: 1696-2230 (on line) Depósito legal: M.5491-2006 Imprenta del Banco de España

Abstract
In this paper we survey the features of different approaches available in the
literature used to study the effects of the aging of the population on Social Security
expenditures. We comment on the weaknesses and strengths of each of them, and
perform a quantitative analysis by comparing the results they imply in the particular
case of the Spanish economy. Finally, we highlight some elements of the modelling
strategies on which more evidence is needed for a correct evaluation of the
problem at hand.

1 Introduction
During the forthcoming decades in most European countries the demographic scenariowill dramatically change. The fall in fertility experienced during the last quarter of theXXth Century and the continuation of the rise in longevity will lead to a significantincrease in the proportion of the older population. Thus, Social Security programmes,whose expenditures are very much determined by the size of the older population,will come increasingly under financial stress.At least since the early 1980s there have been many studies trying to quantify
the rise in Social Security expenditures as a result of population aging (see, for in-stance, World Bank, 1994, Roseveare et al. 1996). Nowadays, the task continues,as many political institutions are concerned by the budgetary implications of demo-graphic changes. Over the years, the methodologies used to yield some quantitativeforecasts of the likely evolution of Social Security expenditures have been improvedand, nowadays there is a menu of alternative approaches to perform this task. In thispaper, we survey the features of different approaches available in the literature usedto study the effects of the aging of the population on the sustainability of the socialsecurity system. We group them into three categories that we label as: i) aggregateaccounting, ii) general equilibrium models, and iii) individual life-cycle profiles. Wehighlight the weakness and strengths of each of them, and compare their predictionsabout the evolution of Social Security expenditures for the Spanish case. As it willbe made clear, there are some crucial elements of these modelling strategies on whichmore evidence is needed for a correct evaluation of the problem at hand. Notwith-standing, all of the quantitative exercises we perform conclude that the points of GDPwhich, under the current pension schemes, would have to be devoted to expendituresin Social Security are significantly higher than current expenditures.The survey is structured in four more Sections. Sections 2 to 4 present the main
features of the three approaches we analyze (aggregate accounting, general equilibriummodels, individual life-cycle profiles). Section 5 comments on the results from eachapproach when they are applied to study the Spanish situation. Finally, Section 6contains some concluding remarks, mainly addressed to highlight some elements onwhich more microeconomic evidence is needed to improve the modelling of the impactof aging on Social Security expenditures.
2 Aggregate Accounting
A first approach at performing projections of the financial situation of Social Secu-rity consists of making a certain set of assumptions about the evolution of several keydemographic and economic variables, and then using accounting identities to infer ex-penditures and revenues. Here we only focus on expenditures. Under this approach,the behavior of some agents and the functioning of markets is not explicitly mod-eled. This feature is precisely the main difference between these models and general
2
BANCO DE ESPAÑA 9 DOCUMENTO OCASIONAL N.º 0601

equilibrium models, which are discussed in the next section.By definition, pension expenditures are given by the following equation:
Pension Expenditures = Number of pensions ·Average pension (1)
Typically the number of pensions are projected using population and employmentforecasts over the future, where, for earnings-related pension schemes, employmentyears are converted into pension entitlements. Similarly, using some macroeconomicscenario for wage growth, average pensions into the future are computed by, first,computing the rate of growth of the benefits of new and current retirees and, sec-ondly, taking out the benefits corresponding to exits due to deaths. There are manydimensions in which population and macroeconomic scenarios are enriched to improvethe forecasting of Social Security expenditures.In the next section we discuss the main ingredients needed to perform this type of
exercises, that is, demographic and macroeconomic projections. But before discussingthem, it is noteworthy that, under the same approach, there is an alternative, simplerway of making projections of Social Security expenditures. By scaling expenditureswith respect to GDP1:
Pension Expend.GDP = Retired Population
Employment · Average pension per retireeAverage labor productivity = (2)
= Retired populationWorking age population ·
Working age populationEmployment · Average pension per retireeAverage labor productivity (3)
it follows that the ratio of pension expenditures to GDP is just the product of threefactors: i) a demographic factor -the ratio of the retired population to working agepopulation,2, ii) a labor market factor -the inverse of the employment rate-, and iii) aninstitutional-economic factor -the ratio of average pension per retiree to average laborproductivity, that very much depends on rules about computation of pension benefitsand indexation of pensions, and other provisions determining how wage growth getstranslated into the rate growth of the average pension. Using this breakdown, theuncertainty about the evolution of Social Security expenditures is reduced since i)the age structure of the population is easier to predict that just the size of each agecohort, ii) the employment rate has a lower range of variation that total employment,and iii) the ratio of average pension per retiree to average labor productivity is alsoeasier to foresee as it depends on precise rules which can be specified under differentscenarios.Admittedly, these three factors may be interrelated, as alternative rules concerning
the computation of benefits may imply different coverages rate of pensions, and may
1As done, for instance, in Boldrin et al. (1999).2This ratio is often referred to as the "dependency ratio". If the coverage rate of the pension
system -the number of pensions to the eligible population, remains contant, then this dependencyratio is just the quotient between the ratio of the number of pensions to employment and the coveragerate.
3
BANCO DE ESPAÑA 10 DOCUMENTO OCASIONAL N.º 0601

have different labor supply incentives so that the employment rate may also vary.To the extent that this effect can be considered of second-order importance withrespect to the main determinants of each of the three ratios, equation (2) provides a,plausibly, rough approximation to the evolution of pension expenditures and to theimpact of a particular pension reform on those expenditures.
2.1 Demographic Scenario
Any projection of Social Security expenditures relies on some conjectures about de-mographic developments. Typically, several pension projections are obtained by usingalternative demographic scenarios. The key demographic variables determining thedemographic scenarios are i) fertility rates, ii) life expectancy, and iii) migration flows.Current fertility rates determine the size of the working age population two decades
ahead. Obviously, a fall in fertility rates implies, in the forthcoming decades, a higherratio of older population with respect to the working age population, and this riseof the dependency ratio lasts for more than just one generation, since in the futurethe size of women in childbearing age will be lower. As seen in Figure 1a, therewas a noticeable fall in fertility rates in EU countries along the1970s that seems tobe all but transitory, and, hence, will limit the size of the working age populationsin the forthcoming decades. Nowadays, most population forecasts are based on theassumption of constant or only slightly increasing fertility rates in the near future.Figure 1b plots the assumption used by EUROSTAT for its more recent populationforecasts (base 2004) in the baseline scenario.
1
1,5
2
2,5
3
1960
1962
1964
1966
1968
1970
1972
1974
1976
1978
1980
1982
1984
1986
1988
1990
1992
1994
1996
1998
2000
2002
2004
European Union (25 countries) Euro-zone (EUR-11 up to 31.12.2000 / EUR-12 from 1.1.2001)Germany (including ex-GDR from 1991) SpainFrance ItalyUnited Kingdom United States
Figure 1a. Total fertility rates
4
BANCO DE ESPAÑA 11 DOCUMENTO OCASIONAL N.º 0601
1,2
1,3
1,4
1,5
1,6
1,7
1,8
1,9
2
2004
2006
2008
2010
2012
2014
2016
2018
2020
2022
2024
2026
2028
2030
2032
2034
2036
2038
2040
2042
2044
2046
2048
2050
Germany (including ex-GDR from 1991) Spain France Italy United Kingdom
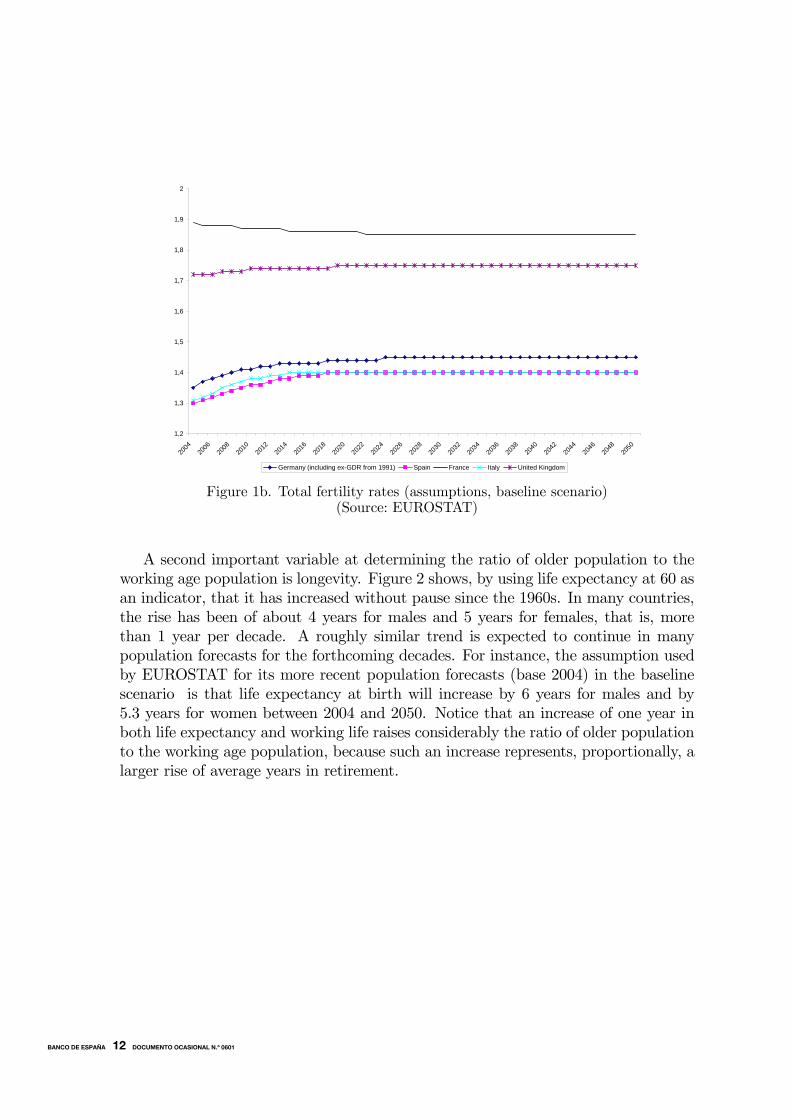
Figure 1b. Total fertility rates (assumptions, baseline scenario)(Source: EUROSTAT)
A second important variable at determining the ratio of older population to theworking age population is longevity. Figure 2 shows, by using life expectancy at 60 asan indicator, that it has increased without pause since the 1960s. In many countries,the rise has been of about 4 years for males and 5 years for females, that is, morethan 1 year per decade. A roughly similar trend is expected to continue in manypopulation forecasts for the forthcoming decades. For instance, the assumption usedby EUROSTAT for its more recent population forecasts (base 2004) in the baselinescenario is that life expectancy at birth will increase by 6 years for males and by5.3 years for women between 2004 and 2050. Notice that an increase of one year inboth life expectancy and working life raises considerably the ratio of older populationto the working age population, because such an increase represents, proportionally, alarger rise of average years in retirement.
5
BANCO DE ESPAÑA 12 DOCUMENTO OCASIONAL N.º 0601

15
16
17
18
19
20
21
22
1960
1962
1964
1966
1968
1970
1972
1974
1976
1978
1980
1982
1984
1986
1988
1990
1992
1994
1996
1998
2000
2002
European Union (25 countries) Euro-zone (EUR-11 up to 31.12.2000 / EUR-12 from 1.1.2001)Germany (including ex-GDR from 1991) SpainFrance ItalyUnited Kingdom
Figure 2a. Life expectancy at 60. Males.
15
17
19
21
23
25
27
1960
1962
1964
1966
1968
1970
1972
1974
1976
1978
1980
1982
1984
1986
1988
1990
1992
1994
1996
1998
2000
2002
European Union (25 countries) Euro-zone (EUR-11 up to 31.12.2000 / EUR-12 from 1.1.2001)Germany (including ex-GDR from 1991) SpainFrance ItalyUnited Kingdom
Figure 2b. Life expectancy at 60. Women.(Source EUROSTAT)
Finally, there is migration, that could fill the gap in working age derived from thefall in births. Although there has been a surge of immigration into EU countries inthe recent years, in particular into Southern Europe (see Figure 3a), there are tworeasons to expect that immigration could not significantly change the age structureof the European population in the forthcoming decades. The first reason is that
6
BANCO DE ESPAÑA 13 DOCUMENTO OCASIONAL N.º 0601

immigration flows are expected to either remain constant or fall (see Figure 3b). Thesecond reason is that the effect of migration on the age structure of the population,even for large migration flows, depend on the age structure of migrants and its returnpatterns. Moreover, since immigrants will eventually age and retire, it could be thecase that immigration could worsen the demographic pressures coming from ageingpopulations, more so in the case of a transitory higher level of immigration.
0
200000
400000
600000
800000
1000000
1200000
1985 1986 1987 1988 1989 1990 1991 1992 1993 1994 1995 1996 1997 1998 1999 2000 2001 2002 2003
Germany (including ex-GDR from 1991) Spain France Italy United Kingdom
Figure 3a. Immigration flows (extra-EU, less than 65 years old)
0
100000
200000
300000
400000
500000
600000
2004
2006
2008
2010
2012
2014
2016
2018
2020
2022
2024
2026
2028
2030
2032
2034
2036
2038
2040
2042
2044
2046
2048
2050
Germany (including ex-GDR from 1991) Spain France Italy United Kingdom
Figure 3b. Net migration (assumptions, baseline scenario)(Source EUROSTAT)
7
BANCO DE ESPAÑA 14 DOCUMENTO OCASIONAL N.º 0601
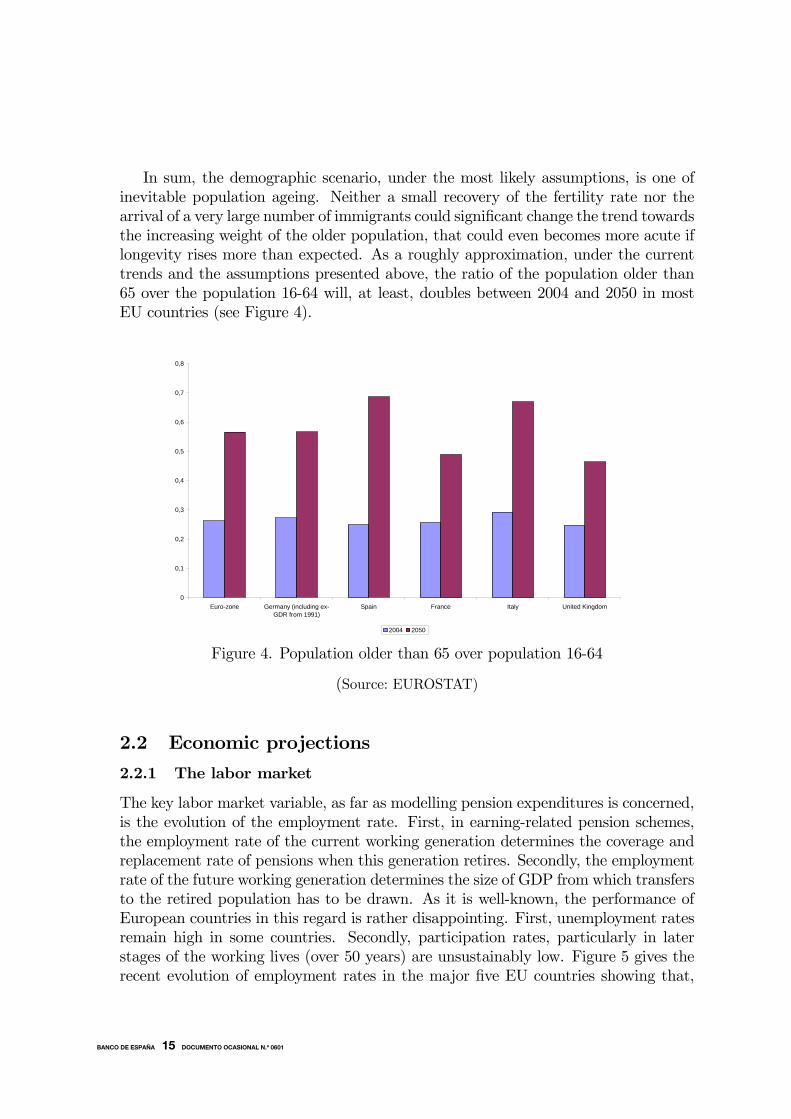
In sum, the demographic scenario, under the most likely assumptions, is one ofinevitable population ageing. Neither a small recovery of the fertility rate nor thearrival of a very large number of immigrants could significant change the trend towardsthe increasing weight of the older population, that could even becomes more acute iflongevity rises more than expected. As a roughly approximation, under the currenttrends and the assumptions presented above, the ratio of the population older than65 over the population 16-64 will, at least, doubles between 2004 and 2050 in mostEU countries (see Figure 4).
0
0,1
0,2
0,3
0,4
0,5
0,6
0,7
0,8
Euro-zone Germany (including ex-GDR from 1991)
Spain France Italy United Kingdom
2004 2050
Figure 4. Population older than 65 over population 16-64
(Source: EUROSTAT)
2.2 Economic projections
2.2.1 The labor market
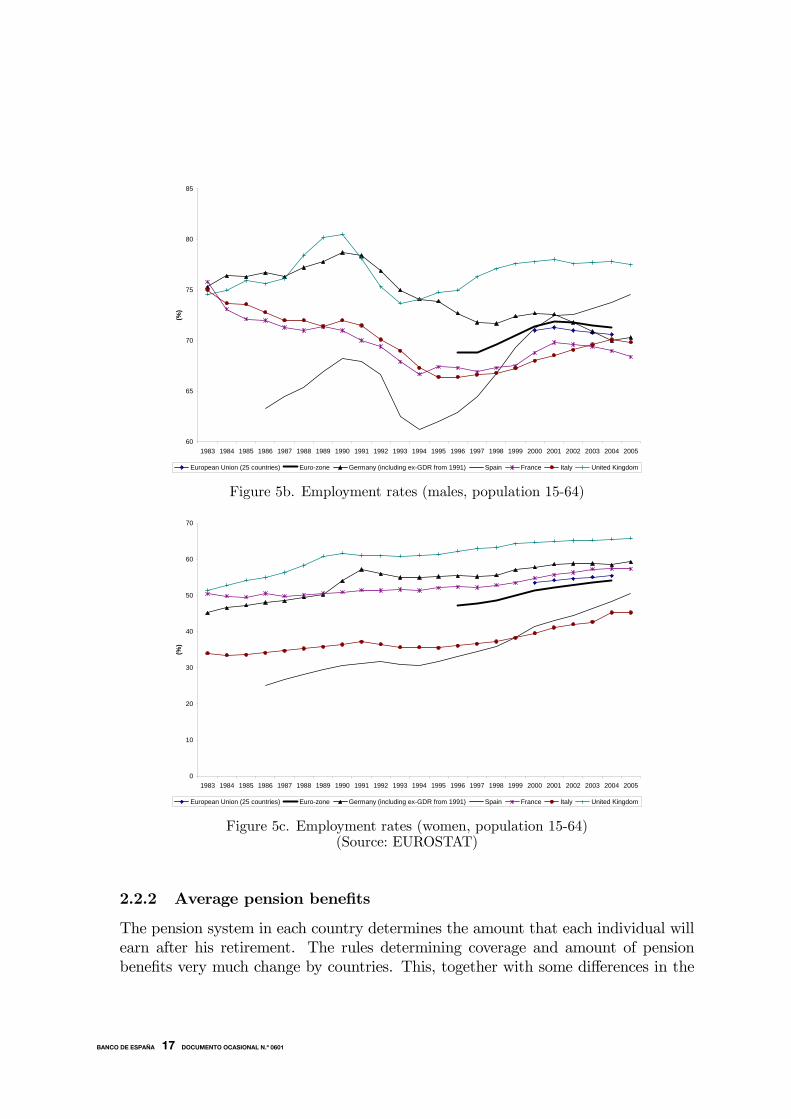
The key labor market variable, as far as modelling pension expenditures is concerned,is the evolution of the employment rate. First, in earning-related pension schemes,the employment rate of the current working generation determines the coverage andreplacement rate of pensions when this generation retires. Secondly, the employmentrate of the future working generation determines the size of GDP from which transfersto the retired population has to be drawn. As it is well-known, the performance ofEuropean countries in this regard is rather disappointing. First, unemployment ratesremain high in some countries. Secondly, participation rates, particularly in laterstages of the working lives (over 50 years) are unsustainably low. Figure 5 gives therecent evolution of employment rates in the major five EU countries showing that,
8
BANCO DE ESPAÑA 15 DOCUMENTO OCASIONAL N.º 0601

apart for the catch-up of the Spanish employment rate, there is not any significantrise in the overall employment rate, and that the slightly increasing trend in femaleemployment rates has just compensated for a fall in the male employment rate.The future evolution of the employment rate will obviously depend on reforms
undertaken to affect the functioning of European labour markets and, in particular,to augmenting the incentives to employment at older ages (see OECD 2005). Inthis regard, two points are worth noticing at this stage. First, under the currentpace of reforms it is unlikely that employment rates in France, Germany, Italy orSpain will get closer to the Lisbon objective (70% in 2010). Secondly, as the share ofolder workers (45-65) increases, reforms will be especially needed to rise older workersemployment.
40
45
50
55
60
65
70
75
1983 1984 1985 1986 1987 1988 1989 1990 1991 1992 1993 1994 1995 1996 1997 1998 1999 2000 2001 2002 2003 2004 2005
(%)
European Union (25 countries) Euro-zone Germany (including ex-GDR from 1991) Spain France Italy United Kingdom
Figure 5a. Employment rates (population 15-64)
9
BANCO DE ESPAÑA 16 DOCUMENTO OCASIONAL N.º 0601
60
65
70
75
80
85
1983 1984 1985 1986 1987 1988 1989 1990 1991 1992 1993 1994 1995 1996 1997 1998 1999 2000 2001 2002 2003 2004 2005
(%)
European Union (25 countries) Euro-zone Germany (including ex-GDR from 1991) Spain France Italy United Kingdom
Figure 5b. Employment rates (males, population 15-64)
0
10
20
30
40
50
60
70
1983 1984 1985 1986 1987 1988 1989 1990 1991 1992 1993 1994 1995 1996 1997 1998 1999 2000 2001 2002 2003 2004 2005
(%)
European Union (25 countries) Euro-zone Germany (including ex-GDR from 1991) Spain France Italy United Kingdom
Figure 5c. Employment rates (women, population 15-64)(Source: EUROSTAT)
2.2.2 Average pension benefits
The pension system in each country determines the amount that each individual willearn after his retirement. The rules determining coverage and amount of pensionbenefits very much change by countries. This, together with some differences in the
10
BANCO DE ESPAÑA 17 DOCUMENTO OCASIONAL N.º 0601

current age structure of the population and the differences in employment rates, yieldsome heterogeneity in the levels of expenditures in social protection in old age (seeFigures 6a and 6b).Typically the projections of pension expenditures are done under the assump-
tion of "unchanged rules". In many instances, this assumption delivers projectionsof pension expenditures well above the current levels. And it is easy to see why:Coming back to equation (2), if the demographic ratio increases by a factor of 2, theemployment rate does not rise by much, and there is no change in the replacementrate of pensions since rules are unchanged, the proportion of GDP devoted to pensionexpenditures would have to increase also by a factor of 2.
0,06
0,07
0,08
0,09
0,1
0,11
0,12
0,13
0,14
Euro-zone Germany Spain France Italy United Kingdom
Figure 6a. Social protection benefits (Old Age, %GDP)
11
BANCO DE ESPAÑA 18 DOCUMENTO OCASIONAL N.º 0601

0,05
0,1
0,15
0,2
0,25
0,3
Euro-zone Germany Spain France Italy United Kingdom
Figure 6b. Average benefit per retiree/GDP per worker*(*By retiree we mean person aged 65 and older. The average benefit is computed
as:Social protection expenditures in old age as a percentage of GDP*Employment rateRatio of population older than 65 over population 15-64 )
2.2.3 The role of labor productivity growth
As employment rates, labor productivity affects the proportion of GDP devoted topension expenditures in two ways. First, by determining current wages, in earnings-related schemes, it is closely related to future pension benefits. Secondly, underdifferent scenarios for labor productivity growth, future average benefits as proportionof future average GDP per worker may change. There are several reasons. First, inmany countries pension benefits are indexed to prices, rather than wages, so that highproductivity growth implies a declining ratio of benefits to average productivity duringthe retirement period. Secondly, in many countries with earnings-related schemes,there is a cap on maximum pension, also typically indexed to prices, so that not allincreases in wages are translated into future benefits.Thus, non-linearities in the definition of pension entitlements (coverage and re-
placement rates) interact with both labor productivity growth and employment ratesto change pension expenditures. Let’s consider two examples. First, the number ofyears worked usually enters in the determination of pensions with a ceiling, i.e. yearsworked above some level will not improve pensions. Consequently, an improvementin the participation rate will either increase future pensions or not depending on theparticular history of each agent. Hence, if the model does not take into account theheterogeneity in years worked, some bias can appear in the projection of average pen-
12
BANCO DE ESPAÑA 19 DOCUMENTO OCASIONAL N.º 0601
sions. Second, pensions are often non linear in wages earned.3 Consequently, wagevariations will have different effects on pension levels depending on the wage level ofeach individual. Again, the absence of heterogeneity in wage levels in the analysiscan produce biases.Apart from heterogeneity considerations, what is important in projection exercises
is to ensure that pension projections are consistent with the future evolution of wagesand participation rates. To the extent that wages are undoubtedly related to laborproductivity in the medium term, it can be expected that the evolution of pensionswill be similar to the evolution of labor productivity, with a certain lag and apartfrom the effect of non-linearities commented above.Finally, the evolution of employment, labor productivity and real GDP is linked
by the fact that the latter is the product of the first two. Consequently, aggregateaccounting models usually fix projections for two of them, and then use the mentionedaccounting identity to infer the remaining variable. The way in which this is donecan be problematic, because sensible projections for two variables need not imply asensible evolution of the remaining variable. As an example, consider a demographicscenario characterized by a process of ageing, which imply that employment will fall.If, at the same time, the researcher assumes a real GDP growth in line with past rates,the consequence will be a very high and unbelievable productivity growth. Hence,it seems to be better to assume some trends for productivity and employment, andthen infer real GDP.
3In Spain, there are minimum and maximum pension levels. Therefore, wage variations whenthe wage is outside certain interval will not imply any variations in pension levels.
13
BANCO DE ESPAÑA 20 DOCUMENTO OCASIONAL N.º 0601

-0,005
0
0,005
0,01
0,015
0,02
0,025
0,03
France Germany Italy Spain U.K. U.S.A
1990-2004 1995-2004
Figure 7. GDP per hour worked growth rate
(Source: Groningen Growth and Development Centre Database)
2.3 Sources of Heterogeneity
The sources of heterogeneity in an aggregate accounting model arise from agents withdifferent ages, productivity, probability of employment, etc. The inclusion of each ofthese sources in the model will generate more accurate projections, but at the cost ofincreasing complexity and data needs.Heterogeneity in age is usually taken into account. The procedure often involves
an estimation of a life cycle wage profile.4 The inclusion of several age groups inthe model is very important when analyzing the ageing process, because individualswith different ages will have different productivity, and therefore a change in the agecomposition of the labor force implies a level effect on average productivity.The inclusion of heterogeneity in productivity is very data demanding. For this
reason, it is hardly included in aggregate accounting models. Its importance is, how-ever, considerable. As mentioned above, there are non linearities in pension systemsthat cause the effects of certain changes to be different depending on the individualaffected. Productivity can also be affected by other sources of heterogeneity, likeeducation in different cohorts.
4The data source for this estimation that is often used fo Spain is the Encuesta de EstructuraSalarial. It includes wage records for different variables, including age, for one year.
14
BANCO DE ESPAÑA 21 DOCUMENTO OCASIONAL N.º 0601

Agents can take different decisions concerning labor participation, or can have dif-ferent employment histories. This source of heterogeneity is important again becauseof the existence of non linearities in the pension system.Finally, the consideration of heterogeneity is also relevant when trying to model
policy reforms, because the response of different agents to a policy change will bein general different. These responses involve, among other decisions, labor marketparticipation, educational choices and voluntary retirement. However, the absence ofan economic model in aggregate accounting models makes difficult the assessment ofthe effects of policy changes. As we will see in the next section, general equilibriummodels can cope better with this problem.
3 General Equilibrium Models
3.1 Main Features and Methodology
The methodology underlying this approach consists of studying an artificial economypopulated by rational agents (consumers, firms, etc.) that feature some preferenceobjective function, the planning horizon and the nature of the uncertainty they face.Then, taking into account these objective functions, agents take decisions so as tomaximize lifetime utility in the case of consumers, and profits, in the case of firms.The optimal decision rules obtained are aggregated and allow the researcher to de-rive the aggregate evolution of the macroeconomic variable of interest, which in turn,determine prices. An equilibrium is found when the prices used by individuals tooptimize behavior are those that are consistent with the aggregate variables obtainedfrom the aggregation of individual choices. Consequently, there is consistency betweenindividual behavior and aggregate dynamics, a feature that is not always satisfied byother approaches. In the specific case of this paper, population aging will require somechanges in government policies, which in turn will affect the behavior of the house-holds composing the macroeconomy. For this reason, it is important to constructmodels that take into account how household behavior changes when the structure oftaxes and transfers changes. This approach will yield results that are not subject tothe Lucas’ critique as compared to other methods that treat households’ consump-tion, labor and savings decisions as constant and aggregate them according to thenew demographic projections. Consequently the advantages of the large overlappinggenerations model are:
• They are microfounded and study equilibrium transitions induced by the agingof the population under several social security scenarios allowing for a perfectconsistency between the evolution of micro and macro variables.
• They account for the endogeneity of factor prices and feedback effects.
15
BANCO DE ESPAÑA 22 DOCUMENTO OCASIONAL N.º 0601

• In most of them, since labor supply is endogenous, it is possible to capture labormarket distortions associated with the reaction of the social security systemto population aging. The source of endogeneity of labor supply may changedepending on the study considered. For instance, in Sanchez-Martin (2001)the changes in the aggregate labor supply comes from variations in the optimalretirement age, while in Auerbach and Kotlikoff (1987) comes from changes inthe age profile of labor effort, taking the retirement age as exogenously given.
3.2 A Benchmark General Equilibrium OLG Model
Demographics. The standard economy in this class of models is populated byagents that live a maximum of I periods. Each type of agent is indexed by age iand time t. Upon arrival at the age of IA an agent starts taking decisions. Eachindividual is endowed with 1 unit of time that can be allocated to work or leisureup to age IR−1. After this age agents retire. Each agent faces an age dependentprobability of surviving between age i and age i + 1 at t denoted by si,t. Then theunconditional probability of reaching age i for an individual that has age v at t isπiv,t =
Qik=v+1 sk−1,t+k−v−1 with πvv,t = 1. Let µi,t be the share of age-i individuals
over the total population at time t.
Individual’ behavior. At each point in time agents are assumed to maximizelifetime utility. The problem of the typical agent that at t has age i = v (v ≥ IA) isto choose consumption ci,t and leisure li,t = 1− hi,t to solve
MaxIX
i=v
βi−vπiv,tU(ci,t+i−v, hi,t+i−v)
subject to the following period-by-period constraint
ai+1,t+1 = (1 + rt(1− τk))ai,t + yi,t − ci,t
with ai+1,t+1 ≥ 0, a1,t = 0, aI+1,t = 0. The discount parameter is β, and is assumedto be the same for all agents. Borrowing is not possible and agents accumulate assetholdings to smooth consumption over time. rt is the interest rate net of depreciation,ai+1,t+1 denotes next period asset holdings, yi,t is labor income net of taxes plustransfers and τk is a proportional capital income tax. Let ei be the efficiency index,τ ss,t the social security proportional tax, τ l a proportional labor income tax and di,tthe social security benefits. Finally wt denotes real wages and Bt is the accidentalbequest received at t. These considerations allow us to define the labor income netof taxes plus transfers as yi,t = wteihi,t(1− τ l − τ ss,t) + di,t +Bt.
Firms. Production in period t is usually given by a standard constant returnsto scale production function that converts capital Kt and labor Nt into output. The
16
BANCO DE ESPAÑA 23 DOCUMENTO OCASIONAL N.º 0601

technology At improves over time at a constant rate because of labor augmentingtechnological change, At+1 = (1 + λ)At, i.e
Yt = F (Kt, AtNt)
Public Sector. The government levies a proportional social security tax onlabor income τ ss,t to finance a benefit di,t per retiree. This system is assumed to beself-financed, i.e.
IR−1Xi=IA
µi,twi,thi,teiτ ss,t =IX
i=IR
µi,tdi,t
The government also levies a proportional tax on capital τk and labor τ l income tofinance per capita government consumption Gt such that
IXi=IA
µi,t(rtai,tτk + wi,thi,teiτ l) = Gt.
Equilibrium. In this economy a Competitive Equilibrium is a list of sequencesof quantities ci,t, hi,t, ai,t, µi,t, di,t, Lt, Nt, Kt, prices wl,t, wh,t, rt, social security taxrates τ ss,t and an income tax rates such that, at each point in time t:1) firms maximize profits setting wages and the interest rate equal to marginal prod-ucts,
wt = FN(Kt, AtNt)
rt = FK(Kt, AtNt)− δ
2) agents maximize lifetime utility subject to the period budget constraints takingwages, the interest rate, taxes, transfers, survival probabilities and the age structureof the population as given,3) the age structure of the population {µi,t} is generated by the following aggregatelaw of motion given initial conditions µi,0, where nt is the population growth rateand pi+1,t+1 is the age specific immigration rate and µ1,t+1 is the next period share ofnewly born agents
µi+1,t+1 =si,tµi,t1 + nt
+ pi+1,t+1; µ1,t+1 = 1−IX
i=2
µi,t+1.
4) Market clearing conditions for capital and labor,
17
BANCO DE ESPAÑA 24 DOCUMENTO OCASIONAL N.º 0601

Kt =IX
i=IA
µi,tai,t Nt =
IR−1Xi=IA
µi,tei,thi,t
5) Finally, the budget constraint of the government is satisfied period by period.Hence with these conditions the goods market clears every period,
F (Kt, Nt) + (1− δ)Kt = Kt+1 +Gt +Xi
µi,tci,t.
3.3 Exogenous Parameters in these models: Calibration
The first step is to specify the primitives of the model, such as the form of the utilityfunction and the production function. Second, in order to use this approach to answerquantitatively the question at hand, the model parameters (for instance the degreeof risk aversion and the intertemporal subjective discount factor) have to be chosen.Usually, this step is performed by setting most of them in such a way that after solvingthe model for the initial year of the simulation, the artificial model economy matchessome key macroeconomic aggregates of the real economy studied. Those parametersthat cannot be chosen in such a way, are usually set to some range based on someempirical work. In what follows we show how a model of this type can be calibrated.Agents reach adulthood at 20 and may live up to age 95, after which death is
certain. Each model period corresponds to 5 years. We may take the age structureof the population of 1995 as the initial condition. The standard models use a utilityfunction of the constant relative risk-aversion class
u(c, l) =(cθl1−θ)1−σ
1− σ(4)
where the inverse of the elasticity of substitution σ and the share of consumptionθ is usually set such that the average time spent working is around 1/3 and theintertemporal elasticity of substitution is consistent with the empirical estimates asthose reviewed in Auberbach and Kotlikoff (1987). Hence σ = 2 and θ = 0.33.The discount rate parameter is set equal to β = 0.987 so as to reproduce a privatecapital-output ratio of 2.5 in the Spanish economy as reported by Puch and Licandro(1997). As is standard in large overlapping generations models, in order to allow forthe fact that earnings grow with experience agents are endowed with an exogenousprofile of age specific efficiency units ei. This may be done using the cross-sectionaldistribution of gross hourly wages in 1993 available in the European Household Panel(1994). The endowment of efficiency units is determined by dividing each cohort’s
18
BANCO DE ESPAÑA 25 DOCUMENTO OCASIONAL N.º 0601
average wage by the average of the sample and then by smoothing the wage profilewith a polynomial of degree two.The production function is Cobb-Douglas where the capital share parameter is
α = 0.375 following the estimates of Domenech and Taguas (1995) for the Spanisheconomy. The productivity growth has been set to λ = 1.5% in annual terms whichis the average growth of per-capita consumption over the period 1960-1995. Hence,
Yt = F (Kt, AtNt) = Kαt (AtNt)
1−α (5)
Finally, firms rent labor and capital at given wages and net interest rate to maximize
F (Kt, AtNt)− (rt + δ)Kt − wtNt
where δ is the depreciation rate for capital and is set to match the average ratio of grossinvestment over output I/Y=24%. This yields a value of δ = 9% in annual terms.Social security benefits are computed as follows. Upon retirement an individual’spension is computed applying a replacement rate over the average of earnings ofthe last 8 years before retirement. This replacement rate is 100% if the individualhas contributed for at least 35 years. The pension system in Spain also includesa maximum and a minimum pension level but given that individuals of the samegeneration are assumed to be homogeneous in this basic model we abstract fromthis feature. The capital and labor income tax rates are τk = 0.186 and τ l = 0.17respectively as reported by Bosca et al. (1999). These values generate a governmentto output ratio of G/Y = 0.13 which is consistent with the average of this numberfrom 1970 to 1994 in Spain.Having specified the primitives and the parameter values of the model, the only
additional input required in order to obtain the future evolution of the aggregatevariables that includes the percentage of GDP spent in pensions is the expected evo-lution of the demographic structure of the population. In particular, the procedure topropagate the economy after the initial year uses the law of motion of the populationshown in the definition of equilibrium and some database (like INE or Eurostat De-mographic Statistics 1996) to obtain the expected evolution of the population growthrate, the mortality rates and the migration rates from 1995 to 2050. In order tocompute the final steady state, after 2050 we may fix the net migration rates andthe survival probabilities of that year and let the age structure run until it reachesa stationary structure characterized by a population growth rate equal to zero. Thismeans that in contrast to other approaches this modelling strategy does not requireany assumption about future behavior of other variables like labor supply and wages,since those are endogenously determined into the model, after the proper aggregationof individual choices and macroeconomic equilibrium conditions.In summary,
19
BANCO DE ESPAÑA 26 DOCUMENTO OCASIONAL N.º 0601
• Dynamic general equilibrium models only require specifying the primitives andsome base parameters and can endogenously display the dynamics of macro-economic variables, accounting for the behavioral response of individuals. Incontrast, the Accounting Approach requires many assumptions about futurevariables and more importantly, behavioral responses to fiscal policies are notconsidered. This question is important in order to ensure aggregate consistencyacross variables. To put an example, in the accounting approach, the evolutionof GDP growth rate and the pension level per retiree are exogenously and in-dependently specified, meanwhile in the general equilibrium methodology, bothvariables are linked and endogenously determined as a function of the demo-graphic projection specified.
3.4 Sources of Heterogeneity
One of the features of the standard overlapping generations model outlined above isthat there is no intragenerational heterogeneity. This may be an important shortcom-ing for at least for two reasons. First, if all the members of the same generation areequal, there is no way of analyzing several aspects of pay-as-you-go (PAYG) systems,such as the incentives and distributive effects created by the existence of minimumand maximum pension levels. In addition, a PAYG system may be welfare improvingbecause it partially substitutes for missing markets that help individuals to insureagainst income risk (Imrohoroglu et al (1995)). Consequently, if a researcher is inter-ested in analyzing these issues, individuals of the same generation must either facesome income risk so as to generate ex-post intra-generational heterogeneity or beex-ante herogeneous in terms of, for instance, labor market productivity.An example of the first approach is De Nardi, Imrohoroglu, and Sargent (1999)
and an example of the second is Kotlikoff, Smetters and Walliser (2000). For thespecific case of the Spanish economy there are two studies that model deterministicheterogeneity explicitly. Sanchez-Martin (2001) considers the case of four educationalcategories in each cohort, allowing for the study of early retirement patterns of thoseindividuals with low income levels and Rojas (2005) considers the case of 21 incomelevels per generation. Although in the latest the retirement decision is exogenous, inboth cases the high level of heterogeneity and the fact that the pattern of pensionbenefits is correlated with labor earnings before retirement allows them to take explicitaccount of the existence of maximum and minimum pension limits when analyzingthe impact of aging on the finances of the social security.Since solving this kind of models is computationally very intensive, there is still
room for improving the way heterogeneity is modeled. For instance, this methodologyusually abstracts from unemployment risk, and the way in which different socialsecurity regimes may affect the incentives to accept or reject job offers. A shortcutroute to capture a richer labor market’s status is taken by Borsch-Supan, Heiss,Ludwig and Winter (2002) who use a general equilibrium overlapping generations
20
BANCO DE ESPAÑA 27 DOCUMENTO OCASIONAL N.º 0601

model in which members of the same generation are sorted into the categories ofemployment, unemployment, non participating and retirement so as to be able totrack the possible evolution of aggregate labor supply, with the aim of studying theeffects of aging on the rate of return on capital. Although in their model generationstake consumption and saving decisions as in the standard model outlined above,the labor market status is deterministic and exogenously given to households, andconsequently there is no feedback from changes in aggregate conditions (like pensionrules) into individual’s incentives to retire early or to participate or not in the labormarket. Moreover, since the decision maker is a generation, although members ofthe same generation are composed of individuals with different labor market status,they all take the same consumption and saving decisions, i.e. it is like having full risksharing among all the members of a cohort.
4 Individual life-cycle profiles
4.1 Main Features and Methodology
Typically in most pension systems benefits are computed in two steps: first, conditionsfor eligibility, and, secondly, determination of the amount of benefits. As an example,under earnings-related system eligibility is achieved only with a minimum number ofyears of contribution. Benefits are awarded depending on some average wage with thefirst years of contribution giving less "pension points" than the years of contributionsclose to the retirement age. These formulae are not always easy to replicate in a simplecondition to be introduced in general equilibrium models. And being non-linear, theyimply that, under heterogeneity, the benefits for the average worker is not the sameas the average benefit across workers. Although, admittedly, some heterogeneity canbe introduced in general equilibrium models, as discussed above, this can be doneonly to a limited extent, as the aggregation of many heterogenous agents soon facecomputation constraints.Thus, when facing distributional issues related to pension reforms, some stud-
ies have dropped the general equilibrium discipline and turn to simulations of manydifferent individual profiles to compute the distribution of pension benefits underdifferent rules. For instance, Deaton, Gourinchas and Paxton (1999) analyse the im-plications of pension reforms for consumption inequality along the life cycle and findthat defined-contribution systems yield more inequality before and after retirement.Coronado, Fullerton and Glass (2000) show that the degree of progressivity in the USpension system depends upon assumptions on discount rates and the expected dura-tion of the life cycle across cohorts of different income levels. Feldstein and Liebman(2000) compute pension benefits that cohorts born during the period 1925-1929 wouldhave receive under a defined-contribution, fully-funded system. Finally, Bosworth andBurtless (2002) perform a simulation analysis of the risk that individuals would face
21
BANCO DE ESPAÑA 28 DOCUMENTO OCASIONAL N.º 0601

after a transition to a defined-contribution, fully-funded system.This approach, namely, simulating many individual life-cycle profiles and comput-
ing outcomes under different alternative pension rules, is, in spirit, close to the Gener-ational Accounting framework proposed by Auerbach and Kotlikoff (200x). Under thisframework, individual accounts of net transfers with the government are computedto make some judgements of the sustainability of government finances. Similarly, forindividual following different employment status along the life cycle, entitlements topension benefits can be computed under different rules. In the next subsection weprovide more details about the implementation. What it is worth noticing at thisstage is that the richness of considering many different individual life-cycle profilescome at some costs: i) in contrast with general equilibrium models, the evolution offactor prices (wages and interest rates) is assumed to be determined by exogenousfactors, other than labour demand and labour supply, and the saving decisions ofthe individual, respectively, ii) the changes in behavior introduced by changes in thepension system rules are also conjectured rather than estimated or calibrated fromsome microeconomic evidence.5
4.2 Implementation: An example
As commented above, the simulation of life-cycle profiles is usually performed to com-pare the distributional consequences of alternative pension schemes. As a by-product,with the appropriate assumptions about demographic evolutions (size and composi-tion of the population), it can also yield accurate forecasts of the financial flows ofalternative pension systems. We now describe how this approach is implementedand how could be used for the quantitative analysis of the impact of aging on SocialSecurity expenditures.The main ingredients are group-specific variables determining employment sta-
tus and life duration. For each age cohort, some composition by education, gender,and any other co-variate needs to be postulated. Within each cohort, individualsenter the labour market with a different age depending on educational attainment.Given group-specific flow rates between inactivity, unemployment and employment,the employment status of each individual at each period is drawn from any den-sity mimicking the observed flow rates. Group-specific survival rates determined thelife duration of each individual. Before retirement , individuals contribute to So-cial Security. Contributions, given some pension rules, could vary depending on theindividuals’ employment status and wages, which are drawn from the empirical dis-tribution of wages by age, educational levels, and other available co-variates. Afterretirement, individuals receive pension benefits determined by their years of contri-bution and earnings, according to existing pension rules. The retirement age could be
5Even under general equilibrium, in a small open economy the interest rate is determined exoge-nously. As for microeconomic evidence on the labour supply incentives of alternative pension rules,we will come back to this issue in the final section.
22
BANCO DE ESPAÑA 29 DOCUMENTO OCASIONAL N.º 0601
either exogenously determined, using also the empirical distribution of the flows intoretirement by the observed co-variate, or, alternatively, by the flows into inactivityand unemployment of individuals close to retirement age. Aggregating across individ-uals, average pension benefits and its average duration for each cohort can be easilycomputed. Total pension expenditures at a given period is obtained by aggregationacross all age cohorts.This approach has one main advantage and some loopholes. The former is that
it allows to characterize a richer distribution of contributions and benefits regardingSocial Security than the one which can be constructed under general equilibriummodels. The latter arise from the possible effects of pension reforms on labour supplyand labour demand decisions that are behind the flows among employment statesand the wage distribution. In this regard, some informed conjectures could be addedto the computation of the impact of aging on Social Security finances, but this is anissue to which we will return in the final Section of the paper.
5 Illustration: Results from the different approachesapplied to the Spanish case
In this section we will try to present some examples of the different approaches re-viewed previously, applied to the Spanish case. We compare them in terms of theirimplications for variables like the ratio of pension expenses over GDP, or the ratioof average pension over average labor productivity. We do so by using the currentsituation of the Spanish pension system. We draw on some projections under thethree different approaches available in the literature and perform some simple, newprojections under the first approach. We will also consider the predictions of eachapproach with regards to the impact of a specific (parametric) pension reform onpension expenditures. Thus, we comment on the consequences for expenditures ofa change in the computation formula of benefits of an earnings-related scheme (asit is the Spanish pension scheme) coming from the rise in the number of years ofcontribution considered for the determination of pension benefits.For this exercise, our demographic scenario is based on the new set of demographic
projections made available by the Spanish Statistical Office (Instituto Nacional de Es-tadística, INE, www.ine.es). Among the different scenarios contemplated by INE, wechoose the scenario with the lowest rise in the ratio of older population to the workingage population. In Figures 8a to 8c we plot the assumptions for the demographic vari-ables underlying this scenario. These are more optimistic than those of EUROSTATregarding the recovery of fertility and the arrival of new immigrants. Figure 8d plotthe resulting ratio of the population 65 and older over the working age population(16-64) resulting from these assumptions. This ratio is projected to rise from 25.1%in 2004 to 56.0% in 2050 and to 53.3% in 2059.
23
BANCO DE ESPAÑA 30 DOCUMENTO OCASIONAL N.º 0601

75
77
79
81
83
85
87
89
2004
2006
2008
2010
2012
2014
2016
2018
2020
2022
2024
2026
2028
2030
2032
2034
2036
2038
2040
2042
2044
2046
2048
2050
2052
2054
2056
2058
Life expectancy at birth-Males (INE) Life expectancy at birth-Women (INE)Life expectancy at birth-Males (EUROSTAT) Life expectancy at birth-Women (EUROSTAT)
Figure 8a. Demographic assumptions. Life expectancy at birth
1,25
1,30
1,35
1,40
1,45
1,50
1,55
2004
2006
2008
2010
2012
2014
2016
2018
2020
2022
2024
2026
2028
2030
2032
2034
2036
2038
2040
2042
2044
2046
2048
2050
2052
2054
2056
2058
Fertility rate (INE) Fertility rate (EUROSTAT)
Figure 8b. Demographic assumptions. Total fertility rate
24
BANCO DE ESPAÑA 31 DOCUMENTO OCASIONAL N.º 0601

0
100.000
200.000
300.000
400.000
500.000
600.000
2004
2006
2008
2010
2012
2014
2016
2018
2020
2022
2024
2026
2028
2030
2032
2034
2036
2038
2040
2042
2044
2046
2048
2050
2052
2054
2056
2058
Net inmigration flows (INE) Net inmigration flows (EUROSTAT)
Figure 8c. Demographic assumptions. Net immigration flows
0,2
0,25
0,3
0,35
0,4
0,45
0,5
0,55
0,6
2004
2006
2008
2010
2012
2014
2016
2018
2020
2022
2024
2026
2028
2030
2032
2034
2036
2038
2040
2042
2044
2046
2048
2050
2052
2054
2056
2058
Figure 8d. Population 65 and older over population 15-64 (INE, assumptions)
As for the employment rate, in our baseline scenario we use the current employ-ment rates by age groups (in 5 year cohorts and by educational attainments -primary,secondary, and tertiary). We assume that these employment rates remain at the cur-rent levels (see Figure 9a) and that the composition of the population by age changesaccording to the INE projections. We assume that the educational composition ofthe cohorts older than 30 years of age in 2050 converges to the current composition
25
BANCO DE ESPAÑA 32 DOCUMENTO OCASIONAL N.º 0601

of the cohort 30-35 years of age. As a result, the employment rate is 64.5% in theyear 2050, just about 1.5 p.p higher than the current one. In this projection, thereare two opposite effects. As the population ages, the overall employment rate falls,since older workers have lower employment rates than prime-age workers. On theother hand, education levels of the older cohorts are projected to increase and, thus,the overall employment rate rises.
0,2
0,3
0,4
0,5
0,6
0,7
0,8
0,9
1
16-19 years 20-24 years 25-29 years 30-34 years 35-39 years 40-44 years 45-49 years 50-54 years 55-59 years 60-64 years
Primary Education Secondary Education Tertiary Education
Figure 10a. Employment rates by age and education. Males
0
0,1
0,2
0,3
0,4
0,5
0,6
0,7
0,8
0,9
16-19 years 20-24 years 25-29 years 30-34 years 35-39 years 40-44 years 45-49 years 50-54 years 55-59 years 60-64 years
Primary Education Secondary Education Tertiary Education
Figure 10b. Employment rate by age and education. Women(Source: Labour Force Survey)
26
BANCO DE ESPAÑA 33 DOCUMENTO OCASIONAL N.º 0601

Table 1 reports the projections of pension expenditures under different method-ologies and scenarios. In the baseline scenario described above, pension expenditureswould rise by 10 p.p. of GDP, from 9% to 19.6% of GDP, despite the increase in theemployment rate, brought up by the educational upbuilding of older cohorts, and theinvariance in the "generosity" of pensions, measured as the ratio of average benefitper retiree to GDP per worker. Alternatively, under a more favorable scenario, as-suming that the employment rate reaches 70% and that higher productivity growthcan reduce the ratio of average benefit per retiree to GDP per worker by 10%, therise in pension expenditures between 2005 and 2050 would be 7 p.p. of GDP, from9% to 16% of GDP.6
As for the general equilibrium approach, there are several studies that have ad-dressed the effects of aging on the social security system in Spain using computableoverlapping generations models. The first was Montero (2000). Using a model cal-ibrated to Spain, she analyzed the aggregate impact of two demographic scenarios.One characterized by the survival probabilities of 1995 and the average populationgrowth rate between 1961 and 1995, and another characterized by zero populationgrowth rate. Although she does not report the change in the percentage of GDPspent on pensions, she finds that keeping constant the level of pension per-capitawould imply an increase of 10% points in the social security tax rate. Unfortunately,in that paper there is no transitional dynamics and consequently it cannot be usedto provide medium-term forecasts of the pension-GDP ratio.However two recent papers have used official demographic projections for the
Spanish economy to report different measures of the sustainability of the pensionsystem from 1995 to 2050. Rojas (2005) studies the impact of demographic projec-tions in the Spanish economy by comparing the equilibrium allocations in two modeleconomies (G.E. 1 and G.E. 2, respectively) where households choose consumption,saving and labor supply optimally along the life-cycle, but differ from each other inthe degree of substitution of workers with different experience levels. Results indicatethat there are quantitatively relevant differences between both economies. For in-stance it is found that if the rule used to compute pension benefits is left untouched,in the standard model (G.E. 1) the percentage of GDP spent on pensions will increasefrom 7.7% in 2000 to 19.4% in 2050. In contrast, in the model economy with cohortsize effects (G.E. 2) this percentage will increase from 7.6% in 2000 to 15.9% in 2050.The mechanism that accounts for such difference is the lower pension benefits of in-dividuals belonging to the baby-boom generation in the model economy with cohortsize effects. This is so due to the fall in the experience premium and the reduction oflabor effort before retirement displayed by the members of the baby-boom generationas part of the intertemporal reallocation of hours worked in response to the fall inrelative wages.
6For other projections of pension expenditures using the aggregate accounting approach, seeJimeno (2000), Blanco et al. (2000) and Herce and Alonso (2000).
27
BANCO DE ESPAÑA 34 DOCUMENTO OCASIONAL N.º 0601

Table 1: Pension Expenditures: Projections under DifferentMethodologies and Scenarios
Aggregate Accounting Aggregate Accounting General Equ ilibrium
(Baseline) (+Employment, +Productiv ity) (G .E .1) (G .E .2)
2005 2005 2005
Dep endency Ratio (+65/(16-64))(% ) 25.1 25.1 25.5 25.5
Average b enefi t p er retiree/GDP per worker (% ) 22.6 22.6
Employm ent rate 63 63
Pension expenditures/GDP 9.0* 9.0* 7.9 7.7
2050 2050 2050
Dep endency Ratio (+65/(16-64))(% ) 56.0 56.0 56.5 56.5
Labor Productiv ity grow th (2005-2025) 2 2 1.6 2.0
Labor Productiv ity grow th (2025-2050) (% ) 2 2 1.5 1.5
Average p ension/average productiv ity (% ) 22.6 20.0
Employm ent rate 64.5 70.0
Pension Exp end iture/GDP (% ) 19.6 16.0 19.4 15.9
Note: *Benefits under the Social Security General Regime (provisional estimate)
An unpleaseant feature of this model is that the retirement age is exogenous. Incontrast, other recent study is Sanchez-Martin (2001), who considers a large overlap-ping generations model where the changes in the labor supply stems from changes inthe retirement age endogenously chosen by individuals. Under a plausible calibrationof several aspects of the pension rules in Spain, he successfully reproduces the patternof early retirement of low income households. He also studies the effect of populationaging under alternative social security’s scenarios and finds that if the pension rulesare left untouched at the level of 1995, the aging of the population will almost doublethe percentage of GDP spent on pensions from 2000 to 2050. In addition, he findsthat the retirement pattern across income groups (and the average retirement age) isnot affected by the macroeconomic changes induced by aging. A result that might beexplained by the low level of intra-generational heterogeneity (4 income groups) andthe log utility function assumed. An interesting route to follow would be to studywhether this result survives the introduction of more complex heterogeneity and moregeneral utility functions. In this sense, a recent paper by Diaz-Saavedra (2005) findsthat in a model calibrated to the spanish economy the average retirement age is likelyto increase, due to the change in the educational composition of the population overthe coming decades.Finally, it is worth noticing that the results under the different approaches can
differ for a number of reasons that are not directly related to the nature of eachmethodology. First, the base year and the sources of input data do not necessarilycoincide. Secondly, they use in general different definitions of pension expenditures,including different concepts in the definition. Finally, the structure of the model andthe calibration procedure in general equilibrium models could cause certain variables
28
BANCO DE ESPAÑA 35 DOCUMENTO OCASIONAL N.º 0601
to be different than observed ones. All of the above must be kept in mind whencomparing the figures in Table 1. However, despite all these cautions, the commonmessage is that the impact of ageing on Social Security expenditures could be quitesignificant, even under the most favorable scenarios and with or without accountingfor other changes in macroeconomic variables brought up by ageing.
5.1 Quantifying the impact of a pensions reform
The methodologies outlined above are used not only to project pension expendituresinto the future, but also to simulate the effect of alternative pension reforms. Whilethere are many pension reforms which could be considered, they are typically clas-sified into two groups: i) parametric reforms, involving some changes in the rulesfor entitlements and the computation of benefits, and ii) non-parametric reforms,changing the nature of existing pension schemes, such as, for instance, moving from"Pay-As-You-Go-Sytems" (PAYG) to fully capitalized systems.7. As far as the goalof this paper is concerned, i.e., modelling the impact of ageing on pension expendi-tures, we focus on the first class of reforms. We illustrate the results of the differentmethodologies at analyzing parametric reforms, by considering a change in the benefitcomputation formula in the Spanish pension scheme.Currently, in Spain, old-age pension benefits are computed as a proportion (deter-
mined by the years of contribution and age at retirement) of the average contributionbase during the last 15 years of the working life.8 Both the contribution base andthe resulting pension are capped by minimum and maximum bounds. As a measureto control expenditures and also to improve the "equity" of the system, it is oftenpostulated to increase to 30 years, or even to the whole working life, the period usedto compute the average contribution base entered into the benefit formula. In whatfollows, we report the results of different studies which have simulated the effect ofthis type of reform on the projections of pension expenditures.In aggregate accounting models, the only effect of this type of parametric reforms
that are considered in the analysis is its impact on the evolution of benefits. Indirecteffects on the employment rate or on productivity growth coming from labour supplyor labour demand effects are not computed. By contrast, in general equilibriummodels, reforms are analyzed starting from an initial steady state characterized by theexisting pension rules, and the associated behavior of individuals that, by assumption,are assumed to believe that these rules will not change. Then, an unexpected policychange (or announcement of a change) occurs and then individuals start re-optimizing
7In our view, a more useful classification is that distinguishing between i) measures addressed atcontrolling expenditures, and ii) changes in the sources of finances for pension expenditures.
8This proporion is 0 if the number of years of contribution is less than 15. It is 50% for 15 yearsof contribution and retirement at 65, and then increase (not linearly) up to 100% for 35 years ofcontribution and retirement at 65 years. The proportion falls by 6-8 p.p., (depending on personalcircumstances and years of contribution) for each year of retirement before 65 years of age.
29
BANCO DE ESPAÑA 36 DOCUMENTO OCASIONAL N.º 0601

their behavior according to the new pension rules. Computation problems precludethat this re-optimization could be contemplated for individuals with many differentemployment histories. Thus, as an alternative, when considering the impact of reformsusing individual life-cycle profiles, labour supply and labour demand effects are notreally modelled, but included, if anything, by ad hoc assumptions.Table 2 presents some results concerning the impact of extending the number of
years used to compute pension benefits from the current level of 15 to 30. It draws,for the aggregate accounting approach, from Jimeno (2000), updating his results withthe new demographic and labour market scenario. Sanchez-Martin (2001) and Diaz-Saavedra (2005) provide the analysis of this reform using the general equilibriumapproach, while Jimeno (2003) does it under the individual life profile approach.For the first and third approaches, the results assume the baseline demographic andlabour market scenarios (see Table 1), and an annual average growth rate of laborproductivity of 2%.The aggregate accounting approach and the individual life profile approach use
the same demographic and labor market scenarios. The only difference between themis the consideration of heterogeneity and caps in benefits and contributions whencomputing the impact of the reform on average benefits. In the aggregate accountingapproach, it is assumed that average benefits grow at the same rate that wages, andthat wages grow at the same rate that GDP per worker. Thus, the only reduction inaverage benefits brought up by the reform arises from the fact that pension benefitsare indexed to prices, rather than wages. This implies a reduction in the ratio ofaverage benefit to GDP per worker of 4.5%. By simulating individual life profiles, wealso considered the impact of caps on contributions and benefits and heterogeneity.As a result, the reduction in the ratio of average benefit to GDP per worker is 10%.This translates into a reduction of pension expenditures to GDP of about 1 p.p., inthe first case, and 2 p.p., in the second. These results are in line with those reportedin Da-Rocha and Lores (2005).Using the general equilibrium methodology the results are slightly more pro-
nounced. Sanchez-Martin (2001) and Diaz-Saavedra (2005) find that the percentageof GDP spent on pensions would be respectively 2 p.p. and 5 p.p lower than thecase without pension reform. In both cases the incentives to early retirement are notsubstatially affected, and the main forces driving down the pension expediture overGDP is first, the lower pension levels to which individuals qualify, since now pensionbenefits are computed taking into account the earnings of the initial periods of thelife-cycle which are those when individuals are less productive. And second, the fallin the tax rate needed to balance the aggregate government budget induces a higherlevel of output, since the capital stock increases as a result of both lower pensionbenefits and lower saving distorsions which, in the case of Diaz-Saavedra (2005) areassociated with the sharp reduction in the consumption tax after the reform from34.17% to 25.47%.
30
BANCO DE ESPAÑA 37 DOCUMENTO OCASIONAL N.º 0601
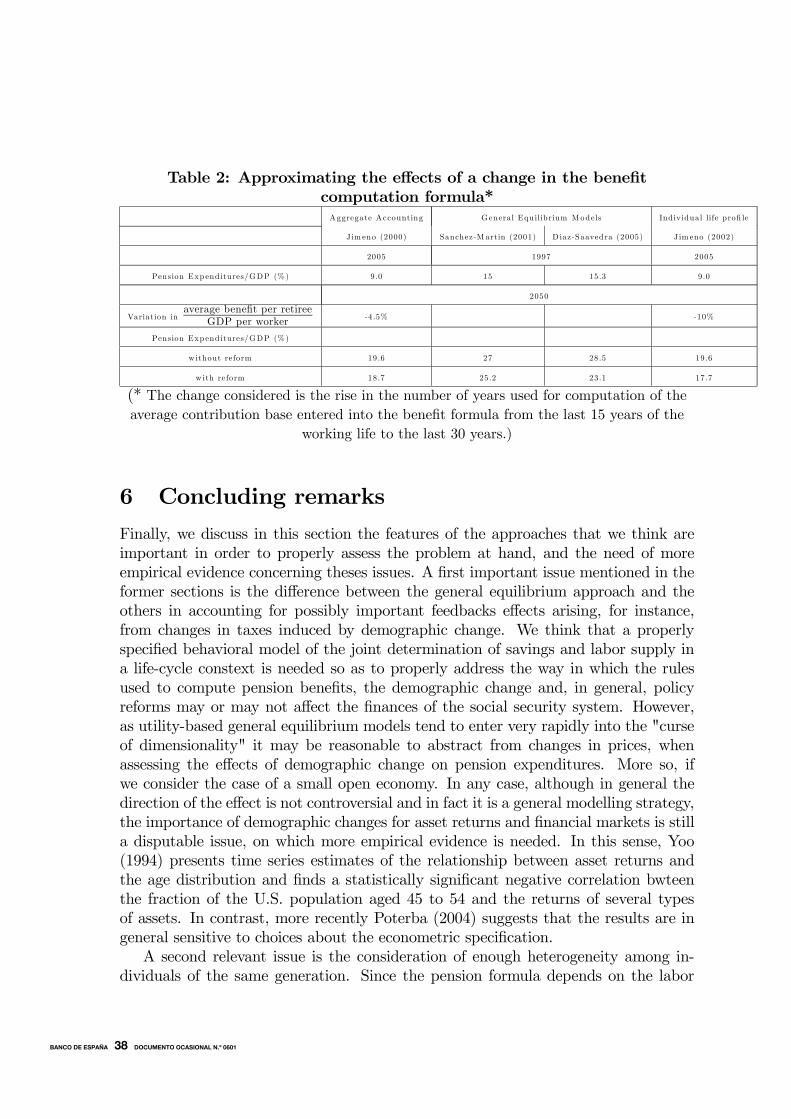
Table 2: Approximating the effects of a change in the benefitcomputation formula*Aggregate Accounting General Equ ilibrium Models Indiv idual life profi le
J im eno (2000) Sanchez-M artin (2001) D iaz-Saavedra (2005) Jim eno (2002)
2005 1997 2005
Pension Expenditures/GDP (% ) 9.0 15 15.3 9.0
2050
Variation inaverage benefit per retiree
GDP per worker -4.5% -10%
Pension Expenditures/GDP (% )
w ithout reform 19.6 27 28.5 19.6
w ith reform 18.7 25.2 23.1 17.7
(* The change considered is the rise in the number of years used for computation of theaverage contribution base entered into the benefit formula from the last 15 years of the
working life to the last 30 years.)
6 Concluding remarks
Finally, we discuss in this section the features of the approaches that we think areimportant in order to properly assess the problem at hand, and the need of moreempirical evidence concerning theses issues. A first important issue mentioned in theformer sections is the difference between the general equilibrium approach and theothers in accounting for possibly important feedbacks effects arising, for instance,from changes in taxes induced by demographic change. We think that a properlyspecified behavioral model of the joint determination of savings and labor supply ina life-cycle constext is needed so as to properly address the way in which the rulesused to compute pension benefits, the demographic change and, in general, policyreforms may or may not affect the finances of the social security system. However,as utility-based general equilibrium models tend to enter very rapidly into the "curseof dimensionality" it may be reasonable to abstract from changes in prices, whenassessing the effects of demographic change on pension expenditures. More so, ifwe consider the case of a small open economy. In any case, although in general thedirection of the effect is not controversial and in fact it is a general modelling strategy,the importance of demographic changes for asset returns and financial markets is stilla disputable issue, on which more empirical evidence is needed. In this sense, Yoo(1994) presents time series estimates of the relationship between asset returns andthe age distribution and finds a statistically significant negative correlation bwteenthe fraction of the U.S. population aged 45 to 54 and the returns of several typesof assets. In contrast, more recently Poterba (2004) suggests that the results are ingeneral sensitive to choices about the econometric specification.A second relevant issue is the consideration of enough heterogeneity among in-
dividuals of the same generation. Since the pension formula depends on the labor
31
BANCO DE ESPAÑA 38 DOCUMENTO OCASIONAL N.º 0601

market history of individuals, a suitable model should in principle account for someheterogenity along several dimensions, that could be modelled either deterministicallyor stochastically. For instance, heterogeneity in terms of education could in principlebe modelled in a deterministic way, upon which there is no uncertainty. However,individuals should also face enough labor market risk and choose optimally laborsupply along the life-cycle so as to properly study the way in which the features ofthe social security system affect that decision. For instance Lazear (1985) suggestedthat defined-contribution pension systems are more efficient in the sense that thereis a close link between contributions and benefits that is taken fully into account byindividuals when deciding how much work. In addition it is likely that the incen-tives created by the penalties for early retirement will be a function of accumulatedfinancial wealth and social security entitlements. Jimenez (2005) has carefully studythe monetary incentives for early retirement in Spain, although the estimation per-formed abstracts from financial wealth accumulation decisions. In addition, althoughhis approach can incorporate very detailed sources of heterogeneity and consequentlyof explaining factors, they may not be very useful to address the welfare consequencesof policy changes and the estimated relationships may not be necessarely stable. Inaddition, general equilibrium models (Sanchez 2001) do not find a significant effectof changes in the number of years used to compute pension benefits on the retire-ment pattern of older workers. Consequently, more microeconomic empirical evidenceconcerning these issues is clearly needed ir order to shed some light on the topic.
References
[1] Auerbach, A., and L. Kotlikoff (1987). Dynamic Fiscal Policy, Cambridge Uni-versity Press, Cambridge.
[2] Blanco, A., J. Montes and V. Antón (2000). Modelo para Simular Escenarios deGasto en Pensiones Contributivas de Jubilación de la Seguridad Social, DirecciónGeneral de Análisis y Programación Presupuestaria, Ministerio de Economía yHacienda, Working Paper SGAPRS-2000-01.
[3] Boldrin, M., J. J. Dolado, J. F. Jimeno and F. Peracchi (1999). "The future ofpension systems in Europe" Economic Policy, 29, pp. 287-320.
[4] Borsch-Supan, A., Heiss, F., Ludwig and A., J. Winter (2002). Pension reform,capital markets and the rate of return, University of Mannheim, manuscript.
[5] Bosca, J. E., Fernandez, M. and D. Taguas (1999). Estructura Impositiva en lospaises de la OCDE, Ministerio de Economía y Hacienda, Madrid, unpublishedmanuscript.
32
BANCO DE ESPAÑA 39 DOCUMENTO OCASIONAL N.º 0601
[6] Bosworth, B., and G. Burtless (2002). Pension reform in the presence of financialmarket risk, Center for Retirement Research at Boston College, Working Paper2002-1.
[7] Coronado, J. L., D. Fullerton and T. Glass (2000). The Progressivity of SocialSecurity, NBER Working Paper 7520.
[8] Da-Rocha, J. M., and F. X. Lores (2005). ¿Es urgente reformar la seguridadsocial?, Mimeo, Universidade de Vigo.
[9] Deaton, A., P. O. Gourinchas and C. Paxson (1999). Social Security and Inequal-ity over the Life Cycle, Princeton University, manuscrito.
[10] De Nardi, M., S. Imrohoroglu and T. Sargent (1999). "Projected U.S. Demo-graphics and Social Security", Review of Economic Dynamics, 2 (3), pp. 575-615.
[11] Diaz-Saavedra, J. (2005). A Parametric Reform of the Spanish Public Pen-sion System, Department of Business Administration, Universidad Carlos IIIde Madrid, manusript.
[12] Feldstein, M. and J. Liebman (2000). "The Distributional Effects of anInvestment-based Social Security System", in The Distributional Effects of SocialSecurity and Social Security Reform, Martin Feldstein and Jeffrey B. Liebman(eds.), Chicago: University of Chicago Press, 2002.
[13] Herce, J. A., and J. Alonso (2000). La Reforma de las Pensiones ante la Revisióndel Pacto de Toledo, Colección Estudios Económicos, 19, Servicio de Estudios deLa Caixa.
[14] Imrohoroglu, S., and D. Joines (1995). "A life-cycle Analysis of Social Security",Economic Theory, 6, pp. 83-114.
[15] Jimenez, S. (2005). Evaluating the labor supply effects of alternative refroms ofthe Spanish pension system, Mimeo, Universitat Pompeu Fabra.
[16] Jimeno, J. F. (2000). El Sistema de Pensiones Contributivas en España: Cues-tiones Básicas y Perspectivas en el Medio Plazo, FEDEAWorking Paper 2000-15.
[17] — (2003). "La equidad intrageneracional de los sistemas de pensiones", Revistade Economía Aplicada, 33, XI, pp. 5-48.
[18] Kotlikoff, L., K. Smetters and J. Walliser (2002). "Distributional Effects in aGeneral Equilibrium Analysis of Social Security", in Martin Feldstein and Jef-frey Liebman (eds.) Distributional Aspects of Social Security Reform, NationalBureau of Economic Research, University of Chicago Press.
33
BANCO DE ESPAÑA 40 DOCUMENTO OCASIONAL N.º 0601

[19] Lazear, E. (1985). "Incentives Effects of Pensions" in DavidWise (ed.), Pensions,Labor, and Individual Choice, National Bureau of Economic Research, Universityof Chicago Press.
[20] Montero, M. (2000). "Estructura demografica y sistemas de pensiones. Un anal-isis de equilibrio general aplicado a la economia española", Investigaciones Eco-nomicas 24 (2).
[21] OECD (2005). Ageing and Employment Policies, Synthesis Report, OECD,Paris.
[22] Poterba, J. (2004). The Impact of population Aging on Financial Markets,Mimeo, MIT.
[23] Puch, L., and O. Licandro (1997). "Are there any special features of the Spanishbusiness cycle?", Investigaciones Economicas, XXI (2), pp. 361-394.
[24] Rojas, J. A. (2005). "Life-cycle earnings, Cohort size effects and Social Security:A Quantitative Exploration", Journal of Public Economics, 89, pp. 465-485.
[25] Roseveare, D., W. Leibfritz, D. Fore and E. Wurzel (1996). Ageing Populations,Pensions Systems and Government Budgets: Simulations for 20 OECD Coun-tries, OECD Economics Department, Working Paper 168.
[26] Sanchez-Martin, A. (2001). Endogenous Retirement and Public Pension SystemReform in Spain, Working Paper 01-35, Universidad Carlos III de Madrid.
[27] World Bank (1994). Averting the Old Age Crisis: Policies to Protect the Old andPromote Growth, World Bank: Washington.
34
BANCO DE ESPAÑA 41 DOCUMENTO OCASIONAL N.º 0601
BANCO DE ESPAÑA PUBLICATIONS
OCCASIONAL PAPERS
0301 GIANLUCA CAPORELLO AND AGUSTÍN MARAVALL: A tool for quality control of time series data. Program
TERROR.
0302 MARIO IZQUIERDO, ESTHER MORAL AND ALBERTO URTASUN: Collective bargaining in Spain: an individual
data analysis. (The Spanish original of this publication has the same number.)
0303 ESTHER GORDO, MARÍA GIL AND MIGUEL PÉREZ: Los efectos de la integración económica sobre
la especialización y distribución geográfica de la actividad industrial en los países de la UE.
0304 ALBERTO CABRERO, CARLOS CHULIÁ AND ANTONIO MILLARUELO: An assessment of macroeconomic
divergences in the euro area. (The Spanish original of this publication has the same number.)
0305 ALICIA GARCÍA HERRERO AND CÉSAR MARTÍN MACHUCA: La política monetaria en Japón: lecciones a
extraer en la comparación con la de los EEUU.
0306 ESTHER MORAL AND SAMUEL HURTADO: Evolución de la calidad del factor trabajo en España.
0307 JOSÉ LUIS MALO DE MOLINA: Una visión macroeconómica de los veinticinco años de vigencia
de la Constitución Española.
0308 ALICIA GARCÍA HERRERO AND DANIEL NAVIA SIMÓN: Determinants and impact of financial sector FDI to
emerging economies: a home country’s perspective.
0309 JOSÉ MANUEL GONZÁLEZ-MÍNGUEZ, PABLO HERNÁNDEZ DE COS AND ANA DEL RÍO: An analysis of the
impact of GDP revisions on cyclically adjusted budget balances (CABS).
0401 J. RAMÓN MARTÍNEZ-RESANO: Central Bank financial independence.
0402 JOSÉ LUIS MALO DE MOLINA AND FERNANDO RESTOY: Recent trends in corporate and household balance
sheets in Spain: macroeconomic implications. (The Spanish original of this publication has the same number.)
0403 ESTHER GORDO, ESTHER MORAL AND MIGUEL PÉREZ: Algunas implicaciones de la ampliación de la UE para
la economía española.
0404 LUIS JULIÁN ÁLVAREZ GONZÁLEZ, PILAR CUADRADO SALINAS, JAVIER JAREÑO MORAGO AND ISABEL
SÁNCHEZ GARCÍA: El impacto de la puesta en circulación del euro sobre los precios de consumo.
0405 ÁNGEL ESTRADA, PABLO HERNÁNDEZ DE COS and JAVIER JAREÑO: Una estimación del crecimiento
potencial de la economía española.
0406 ALICIA GARCÍA-HERRERO AND DANIEL SANTABÁRBARA: Where is the Chinese banking system going with
the ongoing reform?
0407 MIGUEL DE LAS CASAS, SANTIAGO FERNÁNDEZ DE LIS, EMILIANO GONZÁLEZ-MOTA AND CLARA MIRA-
SALAMA: A review of progress in the reform of the International Financial Architecture since the Asian crisis.
0408 GIANLUCA CAPORELLO AND AGUSTÍN MARAVALL: Program TSW. Revised manual. Version May 2004.
0409 OLYMPIA BOVER: The Spanish Survey of Household Finances (EFF): description and methods of the 2002
wave. (There is a Spanish version of this edition with the same number.)
0410 MANUEL ARELLANO, SAMUEL BENTOLILA AND OLYMPIA BOVER: Paro y prestaciones: nuevos resultados
para España.
0501 JOSÉ RAMÓN MARTÍNEZ-RESANO: Size and heterogeneity matter. A microstructure-based analysis of
regulation of secondary markets for government bonds.
0502 ALICIA GARCÍA-HERRERO, SERGIO GAVILÁ AND DANIEL SANTABÁRBARA: China’s banking reform: an
assessment of its evolution and possible impact.
0503 ANA BUISÁN, DAVID LEARMONTH AND MARÍA SEBASTIÁ BARRIEL: An industry approach to understanding
export performance: stylised facts and empirical estimation.
0504 ANA BUISÁN AND FERNANDO RESTOY: Cross-country macroeconometric heterogeneity in EMU.
0505 JOSÉ LUIS MALO DE MOLINA: Una larga fase de expansión de la economía española.
0506 VICTOR GARCÍA-VAQUERO AND JORGE MARTÍNEZ: Fiscalidad de la vivienda en España.
0507 JAIME CARUANA: Monetary policy, financial stability and asset prices.
0601 JUAN F. JIMENO, JUAN A. ROJAS AND SERGIO PUENTE: Modelling the impact of aging on Social Security
expenditures.
Unidad de Publicaciones Alcalá, 522; 28027 Madrid
Telephone +34 91 338 6363. Fax +34 91 338 6488 e-mail: [email protected]
www.bde.es

Copyright © 2022 FDOKUMEN