Acoustic fingerprinting for rock identification during drilling
17
Int. J. Mining and Mineral Engineering, Vol. 5, No. 2, 2014 89 Copyright © 2014 Inderscience Enterprises Ltd. Acoustic fingerprinting for rock identification during drilling Srisharan Shreedharan, Chiranth Hegde, Sunil Sharma and Harsha Vardhan* Department of Mining Engineering, The National Institute of Technology Karnataka, Srinivasnagar PO, Mangalore, Karnataka, 575025, India E-mail: [email protected] E-mail: [email protected] E-mail: [email protected] E-mail: [email protected] *Corresponding author Abstract: During the process of mining, it is imperative to know the type and properties of the rocks being handled. The current technology for this involves core drilling, and subsequently subjecting the drilled cores to various tests in the laboratory, to identify the rocks and establish their properties. In many cases, obtaining a sample may be cumbersome and/or non-profitable. This paper presents a novel method to monitor and evaluate the sounds produced as undesirable by-products, at the drill-bit and rock interface, to predict the type of rock being drilled. A rotary drill was fabricated in the laboratory and vertical drilling was carried out on cubical rock samples, keeping various drilling parameters constant. The results obtained are promising and reinforce that it may be possible to extend the proposed methodology in the field as well, with appropriate modifications. This method may be extrapolated further in the estimation of rock properties as well. Keywords: drilling; FFT; fast Fourier transform; frequency analysis; mining; igneous rocks; rock identification. Reference to this paper should be made as follows: Shreedharan, S., Hegde, C., Sharma, S. and Vardhan, H. (2014) ‘Acoustic fingerprinting for rock identification during drilling’, Int. J. Mining and Mineral Engineering, Vol. 5, No. 2, pp.89–105. Biographical notes: Srisharan Shreedharan is with Department of Mining Engineering at National Institute of Technology Karnataka, Surathkal. His areas of research interest include rock drilling, blasting, rock mechanics and mine ventilation. Chiranth Hegde is with Department of Mining Engineering at National Institute of Technology Karnataka, Surathkal. His interests lie in the fields of rock mechanics, acoustic emissions and numerical simulations in rock fragmentation. Sunil Sharma is with Department of Mining Engineering at National Institute of Technology Karnataka, Surathkal. His interests lie in the fields of rock mechanics and acoustic emissions.
-
Upload
independent -
Category
Documents
-
view
1 -
download
0
Transcript of Acoustic fingerprinting for rock identification during drilling

Int. J. Mining and Mineral Engineering, Vol. 5, No. 2, 2014 89
Copyright © 2014 Inderscience Enterprises Ltd.
Acoustic fingerprinting for rock identification during drilling
Srisharan Shreedharan, Chiranth Hegde, Sunil Sharma and Harsha Vardhan* Department of Mining Engineering, The National Institute of Technology Karnataka, Srinivasnagar PO, Mangalore, Karnataka, 575025, India E-mail: [email protected] E-mail: [email protected] E-mail: [email protected] E-mail: [email protected] *Corresponding author
Abstract: During the process of mining, it is imperative to know the type and properties of the rocks being handled. The current technology for this involves core drilling, and subsequently subjecting the drilled cores to various tests in the laboratory, to identify the rocks and establish their properties. In many cases, obtaining a sample may be cumbersome and/or non-profitable. This paper presents a novel method to monitor and evaluate the sounds produced as undesirable by-products, at the drill-bit and rock interface, to predict the type of rock being drilled. A rotary drill was fabricated in the laboratory and vertical drilling was carried out on cubical rock samples, keeping various drilling parameters constant. The results obtained are promising and reinforce that it may be possible to extend the proposed methodology in the field as well, with appropriate modifications. This method may be extrapolated further in the estimation of rock properties as well.
Keywords: drilling; FFT; fast Fourier transform; frequency analysis; mining; igneous rocks; rock identification.
Reference to this paper should be made as follows: Shreedharan, S., Hegde, C., Sharma, S. and Vardhan, H. (2014) ‘Acoustic fingerprinting for rock identification during drilling’, Int. J. Mining and Mineral Engineering,Vol. 5, No. 2, pp.89–105.
Biographical notes: Srisharan Shreedharan is with Department of Mining Engineering at National Institute of Technology Karnataka, Surathkal. His areas of research interest include rock drilling, blasting, rock mechanics and mine ventilation.
Chiranth Hegde is with Department of Mining Engineering at National Institute of Technology Karnataka, Surathkal. His interests lie in the fields of rock mechanics, acoustic emissions and numerical simulations in rock fragmentation.
Sunil Sharma is with Department of Mining Engineering at National Institute of Technology Karnataka, Surathkal. His interests lie in the fields of rock mechanics and acoustic emissions.
90 S. Shreedharan et al.
Harsha Vardhan completed his BTech Mining Engineering from NITK, Surathkal and PhD from ISM, Dhanbad. At present, he is working as Associate Professor at NITK Surathkal. He is a member of several professional societies and is actively involved in Research and Consultancy. He is in the Editorial Board and is a Reviewer of several professional journals in the area of his expertise. He has received ‘Award for Best Research Publication’ from Govt. of Karnataka; ‘Engineering Gold Medal’ and ‘D N Thakur Award’ from MGMI, Kolkata; ‘Certificate of Merit’ from IE, India. He was also honoured with ‘Career Award for Young Teachers’’ from AICTE, New Delhi and ‘Young Scientist Award’ from the Ministry of Science and Technology, Government of India.
1 Introduction
The process of drilling always emits sound as a by product. Acoustic studies related to rock bursts were started very early in the industry and initiated by Obert (1941), Obert and Duvall (1942). The analysis and alternative use of this by product can be very lucrative. Drilling is closely related to the rock mass and its properties, which might be extended to the sound produced during drilling as well (Kumar et al., 2010, 2011a, 2011b, 2011c). Rock distinguishing based on the frequency spectrum was carried out using the fast Fourier transform (FFT) by Zborovjan et al. (2003) and Miklusova et al. (2006). The acoustic and physiological effects of sounds due to rock cutting have been done in depth by Krepelka et al. (2010). The methods of measurement and analysis have been described valiantly by Futó et al. (2009).
For rock engineering purposes, the acoustic analysis of drilling is still in its nascent stages. The application of a similar method has been clearly illustrated by Vardhan et al. (2009), Kumar et al. (2010, 2011a, 2011b, 2011c, 2012), Vardhan and Yadav (2011) and the authors stress on the need for further research in this domain.
It is quite evident from the above discussions that very limited literature and research work exists in the field of application of sound based parameters to predict rock classes and characteristics, at present. The acoustic evaluation of different rocks using the same drill machine yields different FFT graphs for each rock. This variation can be used for rock characterisation and will be a utile method of rock evaluation in field sites or unconventional sites where core analysis cannot always be carried out. The objective of this experimental study was the acoustic evaluation of rocks during drilling with respect to frequency and FFT of the subjects. In this paper, it has been attempted to establish that, theoretically, it is possible to devise a method by which a small number of holes drilled into the strata, using a drill of known configuration and parameters, will help in distinguishing the type of rock. The sample collected in this case is a noise sample/acoustic emission of the rock, using a microphone, during drilling. Throughout the course of this experiment, the drill-bit diameter, number of flutes on the drill-bit, downward thrust on the drill and speed of the drill have all been kept constant. This idea is also indicative of a further extension of this concept towards the calculation of rock properties. This method can potentially have enormous application as a cost-effective rock identification process during exploratory drilling to identify the strata at various depths, to help make optimum blast designs and selecting suitable explosives for different sites by taking the type of strata into consideration.
Acoustic fingerprinting for rock identification during drilling 91
2 Experiment
2.1 Description of drill setup
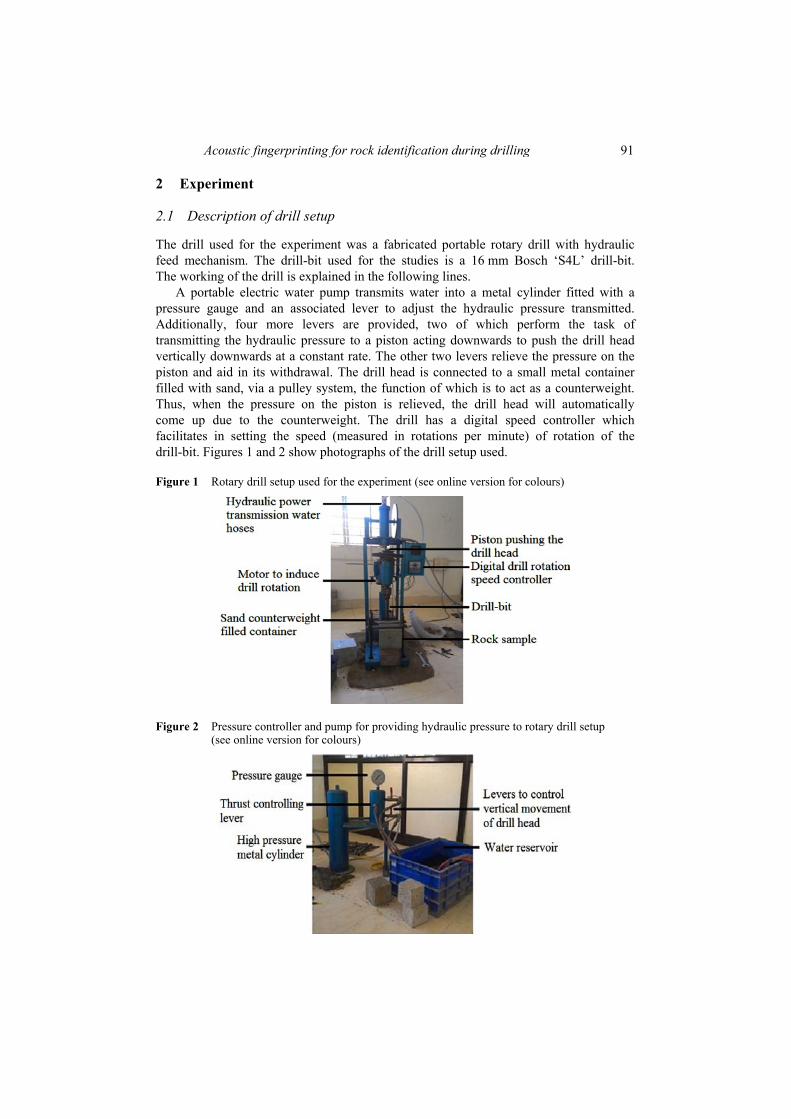
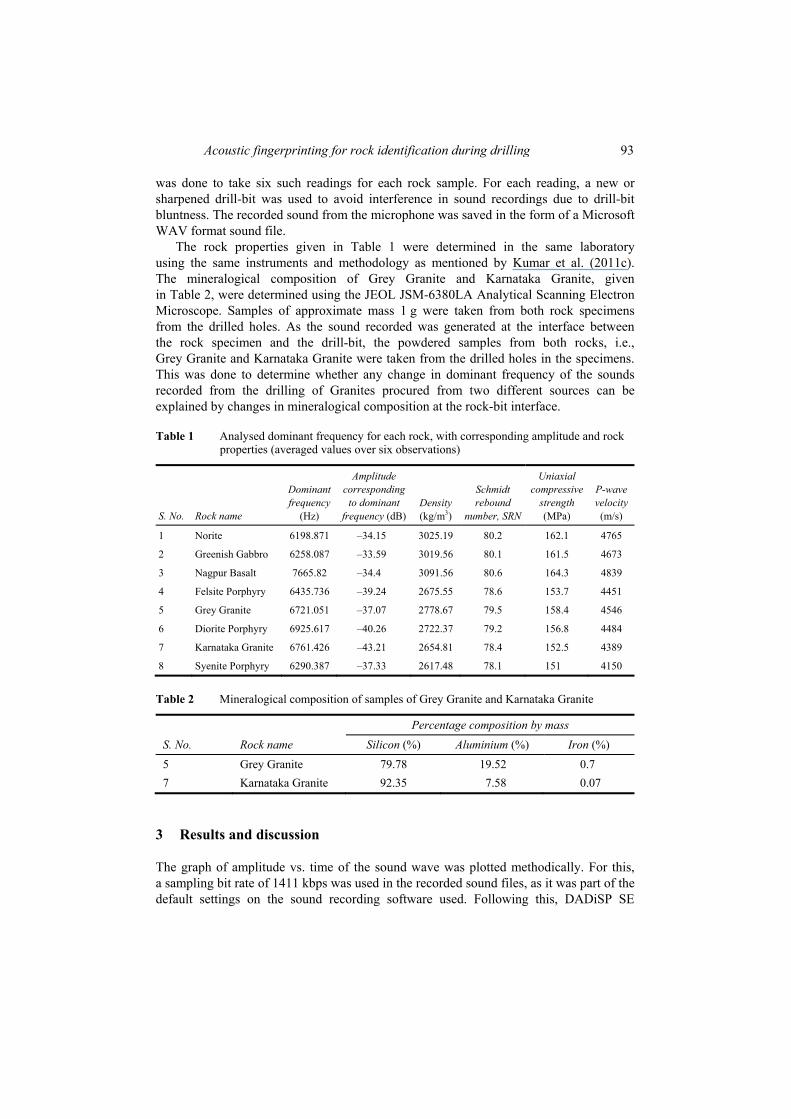
The drill used for the experiment was a fabricated portable rotary drill with hydraulic feed mechanism. The drill-bit used for the studies is a 16 mm Bosch ‘S4L’ drill-bit. The working of the drill is explained in the following lines.
A portable electric water pump transmits water into a metal cylinder fitted with a pressure gauge and an associated lever to adjust the hydraulic pressure transmitted. Additionally, four more levers are provided, two of which perform the task of transmitting the hydraulic pressure to a piston acting downwards to push the drill head vertically downwards at a constant rate. The other two levers relieve the pressure on the piston and aid in its withdrawal. The drill head is connected to a small metal container filled with sand, via a pulley system, the function of which is to act as a counterweight. Thus, when the pressure on the piston is relieved, the drill head will automatically come up due to the counterweight. The drill has a digital speed controller which facilitates in setting the speed (measured in rotations per minute) of rotation of the drill-bit. Figures 1 and 2 show photographs of the drill setup used.
Figure 1 Rotary drill setup used for the experiment (see online version for colours)
Figure 2 Pressure controller and pump for providing hydraulic pressure to rotary drill setup (see online version for colours)

92 S. Shreedharan et al.
2.2 Instruments used
2.2.1 Philips dynamic microphone SBC MD110 The microphone used for the investigations was a Philips SBC MD110 model dynamic microphone, with a 25 mm diaphragm and a 3.5 mm connector jack for connecting to a computer. It has an omni-directional polar pattern with a sensitivity of –80 dB ± 3 dB and an impedance of 600 . It has a frequency range of 20–16,000 Hz.
2.2.2 Fabricated drill The drill set up used in the experiment was completely fabricated in the lab. Its working is as described in the previous section, i.e., ‘Description of drill setup’.
2.2.3 16 mm Bosch S4L drill-bits The drill-bits used during the investigation were 16 mm diameter Bosch S4L Drill-bits made of Tungsten Carbide. The bits have an overall length of 310 mm and a working length of 250 mm. They are ideally suited for concrete, granite and masonry work as suggested by the manufacturer.
2.3 Rock samples used in the investigation The experiment was carried out using cube shaped rock samples of side 15 cm. A total of eight different rock samples were used in this experiment. They are all intact igneous rock samples obtained from different locations from all over South India. They were used in the following order:
Norite, Greenish Gabbro, Nagpur Basalt, Felsite Porphyry, Grey Granite, Diorite Porphyry, Karnataka Granite, Syenite Porphyry.
2.4 Procedure The drill was set into motion and the speed was adjusted to 325 rotations per minute (rpm) using the digital speed controller. The speed was so chosen by trial and error to ensure optimum penetration rate, minimum drill motor noise and minimum wear and heating at the drill-bit tip. A pressure of 25 MPa was set accurately using the pressure lever of the pump, as any pressure level below 20 MPa was found to decrease the penetration rate of the drill to nearly zero and any pressure above 27 MPa resulted in heavy vibrations of the connection hoses and subsequent leakage and spillage of water. A higher pressure also decreases the life of the metal cylinders used. Hence, a safe pressure level of 25 MPa was incorporated to optimise penetration rate of the drill and life of the equipments and to reduce leakage of water from the hydraulic systems. Once the microphone was in position, at a distance of 1 cm from the drill-bit rock interface, the down thrust was applied, pushing the drill-bit vertically towards the rock sample. The acoustic emission was recorded using the given microphone for a total of 30 s. The recorded acoustic emissions of different rocks were systematically analysed using the Fast Fourier Transformation technique. This method
Acoustic fingerprinting for rock identification during drilling 93
was done to take six such readings for each rock sample. For each reading, a new or sharpened drill-bit was used to avoid interference in sound recordings due to drill-bit bluntness. The recorded sound from the microphone was saved in the form of a Microsoft WAV format sound file.
The rock properties given in Table 1 were determined in the same laboratory using the same instruments and methodology as mentioned by Kumar et al. (2011c). The mineralogical composition of Grey Granite and Karnataka Granite, given in Table 2, were determined using the JEOL JSM-6380LA Analytical Scanning Electron Microscope. Samples of approximate mass 1 g were taken from both rock specimens from the drilled holes. As the sound recorded was generated at the interface between the rock specimen and the drill-bit, the powdered samples from both rocks, i.e., Grey Granite and Karnataka Granite were taken from the drilled holes in the specimens. This was done to determine whether any change in dominant frequency of the sounds recorded from the drilling of Granites procured from two different sources can be explained by changes in mineralogical composition at the rock-bit interface.
Table 1 Analysed dominant frequency for each rock, with corresponding amplitude and rock properties (averaged values over six observations)
S. No. Rock name
Dominantfrequency
(Hz)
Amplitude corresponding
to dominant frequency (dB)
Density(kg/m3)
Schmidtrebound
number, SRN
Uniaxialcompressive
strength(MPa)
P-wavevelocity(m/s)
1 Norite 6198.871 –34.15 3025.19 80.2 162.1 4765
2 Greenish Gabbro 6258.087 –33.59 3019.56 80.1 161.5 4673
3 Nagpur Basalt 7665.82 –34.4 3091.56 80.6 164.3 4839
4 Felsite Porphyry 6435.736 –39.24 2675.55 78.6 153.7 4451
5 Grey Granite 6721.051 –37.07 2778.67 79.5 158.4 4546
6 Diorite Porphyry 6925.617 –40.26 2722.37 79.2 156.8 4484
7 Karnataka Granite 6761.426 –43.21 2654.81 78.4 152.5 4389
8 Syenite Porphyry 6290.387 –37.33 2617.48 78.1 151 4150
Table 2 Mineralogical composition of samples of Grey Granite and Karnataka Granite
S. No. Rock name Percentage composition by mass
Silicon (%) Aluminium (%) Iron (%)5 Grey Granite 79.78 19.52 0.7 7 Karnataka Granite 92.35 7.58 0.07
3 Results and discussion
The graph of amplitude vs. time of the sound wave was plotted methodically. For this, a sampling bit rate of 1411 kbps was used in the recorded sound files, as it was part of the default settings on the sound recording software used. Following this, DADiSP SE

94 S. Shreedharan et al.
software was used in calculating the FFT of the given wave. The Hanning window was used to smoothen the wave. The Hanning window is preferred over other smoothening functions because of its implications in drilling, as the frequency of interest is between 4000 Hz and 9000 Hz (Zborovjan, 2001, 2002), and it is also widely used as the optimum windowing function.
The FFTs of different rocks were analysed, specifically in the range of 4000–9000 Hz as it is the frequency band containing maximum information about the rock being drilled (Zborovjan, 2001, 2002). It was observed that there is a clear demarcation and difference in the FFT graph of the wave as the rock sample is changed. Each rock attained a unique frequency where amplitude is the highest, inside the frequency range of 4000–9000 Hz. This frequency has been referred to as ‘dominant frequency’ of the rock throughout this paper. It was noticed that every rock analysed has an identity in terms of the frequency of sound produced during drilling, keeping all the other parameters constant. This frequency can safely be used as a tool to distinguish rocks from each other.
For instance, it can be observed from Table 1 that each rock has a unique frequency which is not similar to any of the other seven rocks analysed. Similarly, the converse can also be said to be true by observing the frequency values of Grey Granite and Karnataka Granite, i.e., they both have nearly same dominant frequencies with a difference not exceeding 0.5% which is a reasonably good accuracy level. But this particular aspect has not been dealt with in detail in this paper due to the lack of similar rocks during the period of experimentation. But it would not be absolutely erroneous to say that the same rock procured from different sites will tend to show very similar results from the point of view of acoustic analysis.
Furthermore, a comparison of three sets of two rocks each has also been shown. The ‘overplot’ function was used in the DADiSP SE software, which allowed the comparison of the FFT wave form by overlapping one waveform over another. A screenshot of the overplotting has been taken and displayed in Figures 3–5. Three graphs representing the overplots of Diorite Porphyry and Greenish Gabbro, Diorite Porphyry and Karnataka Granite, Greenish Gabbro and Karnataka Granite, respectively, have been shown in Figures 3–5, respectively. An overplot of all eight rocks could not be done on a single graph without compromising the graph clarity. Hence, this method of overplotting two rocks per graph has been adopted. Keeping minimal complexity and space consumption in mind, all possible combinations of the eight rocks tested have not been given.
From Figures 3–5, it can be seen with great clarity that the FFTs of different rocks are very different, when analysed keeping other parameters constant. Looking at Figure 3, we see the difference between Greenish Gabbro and Diorite Porphyry as there is no clear overlap and, while Greenish Gabbro attains a dominant frequency of approximately 6300 Hz (as seen in Figure 3), Diorite Porphyry’s dominant frequency occurs at nearly 7250 Hz. The exact frequency values along with corresponding physical and mechanical properties of the rocks tested have been tabulated in Table 1. A similar explanation can be extended to the readings seen in Figures 4 and 5. This establishes that one can differentiate rocks based on the frequency of noise produced during drilling. This property can be made use of for comparing and identifying different rocks.

Acoustic fingerprinting for rock identification during drilling 95
A plot of rock serial number (as in Table 1) vs. the dominant frequency has been given in Figure 6. It is observed that it is not a straight line parallel to the x-axis, which further reinforces the notion that different rocks are observed to have different dominant frequencies. An important observation that can be made from Figure 6 is that the range 4000–9000 Hz is a larger range than required for the rock samples under consideration as extensive variations are noticed in the frequency range of 5800–7800 Hz.
Figure 3 Overplotted FFT graphs of Greenish Gabbro and Diorite Porphyry (see online version for colours)
Figure 4 Overplotted FFT graphs of Karnataka Granite and Diorite Porphyry (see online version for colours)

96 S. Shreedharan et al.
Figure 5 Overplotted FFT graphs of Greenish Gabbro and Karnataka Granite (see online version for colours)
Figure 6 Rock serial number vs. dominant frequency (see online version for colours)
Figures 7–14 show the frequency vs. amplitude curves obtained for each rock sample analysed during the course of the experiment. These curves represent the average values over the six readings recorded for each rock. It was also observed that the overplotting of the six readings for each rock, on DADiSP, resulted in a nearly perfectly overlapping graph. An important inference that can be drawn from this observation is that the frequency readings used in Table 1 are, in fact, contributed by the specific rock sample and not by any external noise source. Thus, not only the dominant frequency but the pattern of frequency vs. amplitude graph itself is unique for each rock, and this property can be made use of for designing an extensive database of rock FFT graphs, from where rocks can be compared and identified. The slightly different frequency readings obtained for Granites from different sources, namely Grey Granite (6721.051 Hz) and Karnataka Granite (6761.426 Hz) can be attributed to the fact that the percentage composition of different minerals in the rock samples obtained from different locations will invariably be different, as displayed in Table 2.

Acoustic fingerprinting for rock identification during drilling 97
Figure 7 Frequency (Hz) vs. relative sound pressure level (dB) for Norite (see online version for colours)
Figure 8 - Frequency (Hz) vs. relative sound pressure level (dB) for Greenish Gabbro (see online version for colours)
Figure 9 Frequency (Hz) vs. relative sound pressure level (dB) for Nagpur Basalt (see online version for colours)

98 S. Shreedharan et al.
Figure 10 Frequency (Hz) vs. relative sound pressure level (dB) for Felsite Porphyry (see online version for colours)
Figure 11 Frequency (Hz) vs. relative sound pressure level (dB) for Grey Granite (see online version for colours)
Figure 12 Frequency (Hz) vs. relative sound pressure level (dB) for Diorite Porphyry (see online version for colours)

Acoustic fingerprinting for rock identification during drilling 99
Figure 13 Frequency (Hz) vs. relative sound pressure level (dB) for Karnataka Granite (see online version for colours)
Figure 14 Frequency (Hz) vs. relative sound pressure level (dB) for Syenite Porphyry (see online version for colours)
As seen in Figures 7–14, the graph shows amplitude levels starting from 0 dB and approaching –65 dB near the origin. This is due to the fact that actual absolute value of sound is not measured by the microphone, unlike in a noise dosimeter, which gives the absolute A-weighted average sound level. The sound levels used for the graph obtained from microphone recordings are purely relative to a peak value of 0 dB. This means that if 0 dB corresponds to a peak value of, say, 102.5 dB, then –39 dB would correspond to a true sound level value of 63.5 dB (102.5–39). For all practical purposes, the graph showing the relative amplitude levels can be considered, as using a true sound level value will merely result in shifting of the x-axis to an appropriate value above 0 dB.
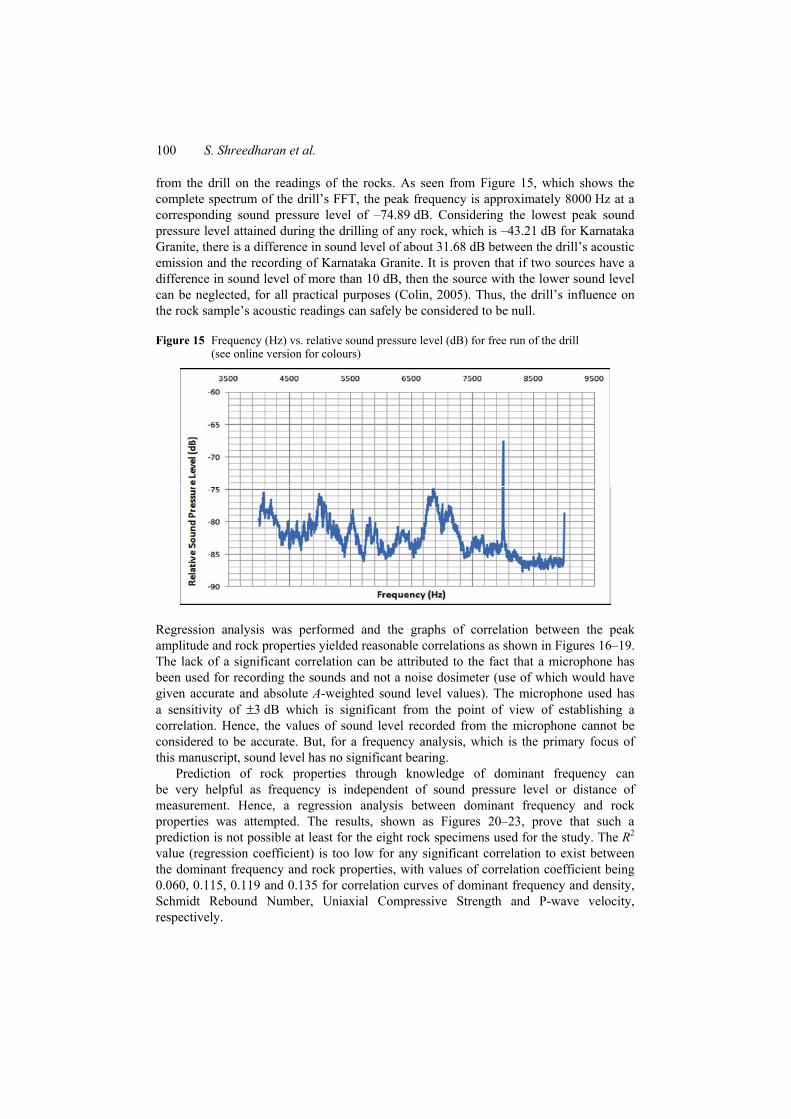
Furthermore, it was observed that the dominant frequency and its corresponding amplitude for an acoustic emission recording of the drill running freely without any significant resistance apart from air resistance was 7999.584 Hz and –74.89 dB, respectively. This activity was performed to eliminate the possibility of interference
100 S. Shreedharan et al.
from the drill on the readings of the rocks. As seen from Figure 15, which shows the complete spectrum of the drill’s FFT, the peak frequency is approximately 8000 Hz at a corresponding sound pressure level of –74.89 dB. Considering the lowest peak sound pressure level attained during the drilling of any rock, which is –43.21 dB for Karnataka Granite, there is a difference in sound level of about 31.68 dB between the drill’s acoustic emission and the recording of Karnataka Granite. It is proven that if two sources have a difference in sound level of more than 10 dB, then the source with the lower sound level can be neglected, for all practical purposes (Colin, 2005). Thus, the drill’s influence on the rock sample’s acoustic readings can safely be considered to be null.
Figure 15 Frequency (Hz) vs. relative sound pressure level (dB) for free run of the drill (see online version for colours)
Regression analysis was performed and the graphs of correlation between the peak amplitude and rock properties yielded reasonable correlations as shown in Figures 16–19. The lack of a significant correlation can be attributed to the fact that a microphone has been used for recording the sounds and not a noise dosimeter (use of which would have given accurate and absolute A-weighted sound level values). The microphone used has a sensitivity of ±3 dB which is significant from the point of view of establishing a correlation. Hence, the values of sound level recorded from the microphone cannot be considered to be accurate. But, for a frequency analysis, which is the primary focus of this manuscript, sound level has no significant bearing.
Prediction of rock properties through knowledge of dominant frequency can be very helpful as frequency is independent of sound pressure level or distance of measurement. Hence, a regression analysis between dominant frequency and rock properties was attempted. The results, shown as Figures 20–23, prove that such a prediction is not possible at least for the eight rock specimens used for the study. The R2
value (regression coefficient) is too low for any significant correlation to exist between the dominant frequency and rock properties, with values of correlation coefficient being 0.060, 0.115, 0.119 and 0.135 for correlation curves of dominant frequency and density, Schmidt Rebound Number, Uniaxial Compressive Strength and P-wave velocity, respectively.

Acoustic fingerprinting for rock identification during drilling 101
Figure 16 Regression curve of density (kg/m3) and relative sound pressure level (dB) (see online version for colours)
Figure 17 Regression curve of SRN and relative sound pressure level (dB) (see online version for colours)
Figure 18 Regression curve of UCS (MPa) and relative sound pressure level (dB) (see online version for colours)

102 S. Shreedharan et al.
Figure 19 Regression curve of P-wave velocity (m/s) and relative sound pressure level (dB) (see online version for colours)
Figure 20 Regression curve of dominant frequency (Hz) and density (kg/m3) (see online version for colours)
Figure 21 Regression curve of dominant frequency (Hz) and SRN (see online version for colours)

Acoustic fingerprinting for rock identification during drilling 103
Figure 22 Regression curve of dominant frequency (Hz) and UCS (MPa) (see online version for colours)
Figure 23 Regression curve of dominant frequency (Hz) and P-wave velocity (m/s) (see online version for colours)
While these conclusions have been arrived at using only eight rocks, one may argue that it may be possible for two rocks not listed here, to have the same frequency. While this reasoning is valid, it can be noticed from the graphs that, even if this occurs, it is improbable that the two rocks will also have the same slope on either side of the dominant frequency. Thus, in case of coinciding frequencies, this technique of looking at the slope can be used to distinguish the rocks.
This idea can be taken forward so as to create a virtual database of FFT spectrum graphs of various rocks, from where one can easily match the corresponding FFT. If a database of FFT graphs and/or of dominant frequencies are made for all the rocks, using a standard set of reference parameters for drilling and recording (parameters include thrust given to drill, rotation speed of drill-bit, type of drill-bit, brand of microphone used), a rock acoustic emission recorded at a site, using the same standard drilling parameters, can be compared with the standard values and/or graphs and correlated with any rock. A reading with a good correlation coefficient value (nearly 1) can be returned as a ‘match’.

104 S. Shreedharan et al.
A simple algorithm can be written on these lines. This will be very useful to the industry and has various applications in civil as well as mining engineering, specifically during the exploratory stages of mining and petroleum explorations and in structural foundation stability assessment.
4 Conclusions
A study on rock identification using the frequency of sounds produced during drilling was carried out successfully. It has been deemed possible that rock class based identification can be carried out using the FFT analysis of sounds recorded digitally during rotary rock drilling. One observed drawback is that the drill-bit tends to become blunt soon due to high hardness of the rocks. This can be overcome by using drill-bits of suitable strength and diameter. It has also been observed that, while rock identification can be satisfactorily performed by this method, it is not possible to predict rock properties using the Dominant Frequency.
Studies can be extended further to sedimentary and metamorphic rocks. It is also possible to carry out further studies to prove that the converse is also true, i.e., if two or more rocks have perfectly overlapping graphs for a given set of drilling parameters, then they are part of the same class. Similarly, studies can be carried out to establish a relationship between the dominant frequency and various physico-mechanical properties of the rock, like uniaxial compressive strength (UCS), Young’s modulus, etc. for more rocks by creating suitable regression based models. Further studies can also be carried out on the relationship between the power spectrum density (PSD) of the acoustic emission and physico-mechanical properties of the rock, as the PSD essentially contains information on the energy delivered by each frequency in the spectrum. This study, if applied to the field data with a suitably designed drill and other miscellaneous novel improvisations, will greatly benefit the mining and civil engineering industries.
References Colin, H. (2005) Noise Control from Concept to Application, Taylor and Francis, New York. DADiSP SE (Version 6.5) [Computer software], DSP Development Corporation, Boston, MA. Futó, J., Krepelka, F., Chlebová, Z. and Ivani ová, L. (2009) ‘Measuring procedure of experimental
data acquisition and data evaluation of acoustic emission in rock disintegration’, Acta Montanistica Slovaca, Vol. 14, No. 3, pp.254–259.
Krepelka, F., Futó, J. and Ivani ová, L. (2010) ‘Acoustic and physiological effects of the surroundings in rock cutting process’, Acta Montanistica Slovaca, Vol. 15, No. 3, pp.220–224.
Kumar, B.R., Vardhan, H. and Govindaraj, M. (2010) ‘Estimating rock properties using sound level during drilling: field investigation’, International Journal of Mining and Mineral Engineering,Vol. 2, No. 3, pp.169–184.
Kumar, B.R., Vardhan, H. and Govindaraj, M. (2011a) ‘A new approach for estimation of properties of metamorphic rocks’, International Journal of Mining and Mineral Engineering,Vol. 3, No. 2, pp.109–123.
Kumar, B.R., Vardhan, H. and Govindaraj, M. (2011b) ‘Prediction of uniaxial compressive strength, tensile strength and porosity of sedimentary rocks using sound level produced during rotary drilling’, Rock Mechanics and Rock Engineering, Vol. 44, No. 5, pp.613–620.

Acoustic fingerprinting for rock identification during drilling 105
Kumar, B.R., Vardhan, H. and Govindaraj, M. (2011c) ‘Sound level produced during rock drilling vis-à-vis rock properties’, Engineering Geology, Vol. 123, No. 4, pp.333–337.
Kumar, B.R., Vardhan, H., Govindaraj, M. and Saraswathi, P.S. (2012) ‘Artificial neural network model for prediction of rock properties from sound level produced during drilling’, Geomechanics and Geoengineering: An International Journal, doi:10.1080/ 17486025.2012.661469.
Miklusova, V., Usalova, L., Ivani ová, L. and Krepelka, F. (2006) ‘Acoustic signal–new feature in monitoring of rock disintegration process’, Contributions to Geophysics and Geodesy,Vol. 36, pp.125–133.
Obert, L. (1941) Use of Sub Audible Noise for Prediction of Rock Bursts – Part I, U.S. Bureau of Mines R.I, 3555.
Obert, L. and Duvall, W.I. (1942) Use of Sub Audible Noise for Prediction of Rock Bursts – Part II, U.S. Bureau of Mines R.I, 3654.
Vardhan, H. and Yadav, B. (2011) ‘An experimental study and analytical approach for estimating rock properties using sound levels from drilling’, Exploration and Production: Oil and Gas Review, Vol. 9, No. 2, pp.25–28.
Vardhan, H., Adhikari, G.R. and Govindaraj, M. (2009) ‘Estimating rock properties using sound levels produced during drilling’, International Journal of Rock Mechanics and Mining Sciences, Vol. 46, No. 3, pp.604–612.
Zborovjan, M. (2001) ‘Identification of minerals during drilling process via acoustic signal’, Metallurgy and Foundry, Krakow, Poland, Vol. 26, No. 4, pp.367–374.
Zborovjan, M. (2002) Identification of Minerals from Sound During Drilling, Semestral Project, TU-Kosice, Poland.
Zborovjan, M., Lesso, I. and Dorcak, L. (2003) ‘Acoustic identification of rocks during drilling process’, Journal of Acta Montanistica Slovaca, Vol. 8, No. 4, pp.91–93.