Thin chip microsprayer system coupled to quadrupole time-of-flight mass spectrometer for...
10
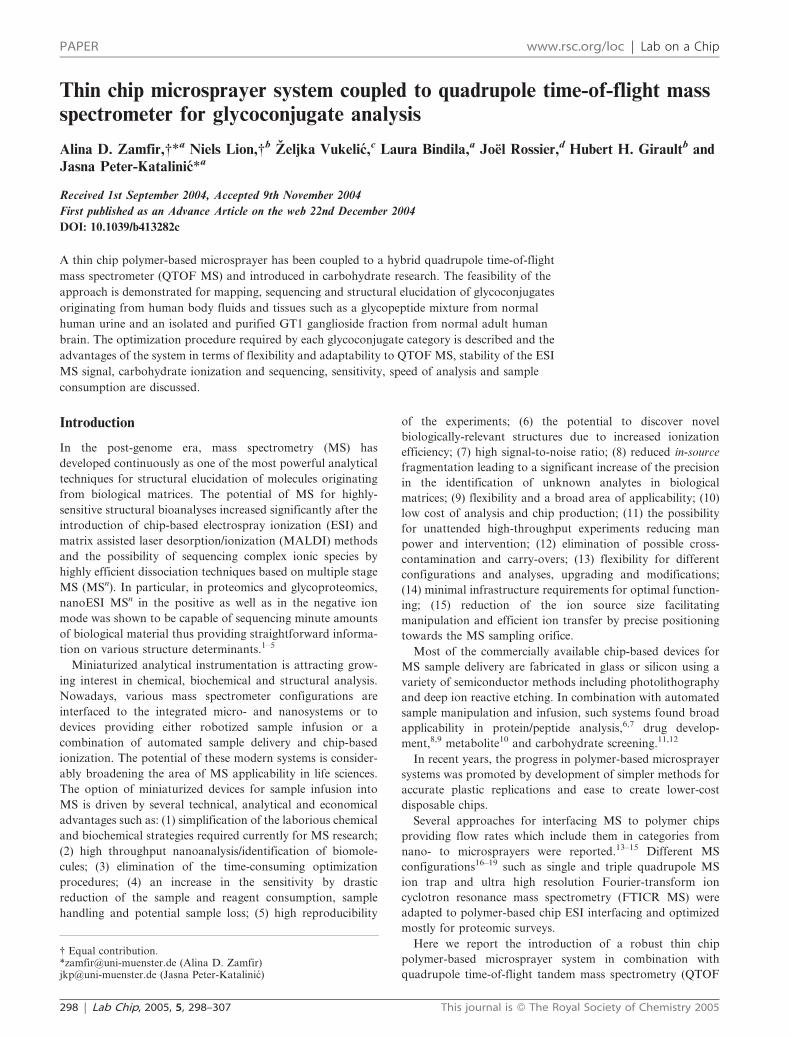
Thin chip microsprayer system coupled to quadrupole time-of-flight mass spectrometer for glycoconjugate analysis Alina D. Zamfir,{* a Niels Lion,{ b Z ˇ eljka Vukelic ´, c Laura Bindila, a Joe ¨l Rossier, d Hubert H. Girault b and Jasna Peter-Katalinic ´ * a Received 1st September 2004, Accepted 9th November 2004 First published as an Advance Article on the web 22nd December 2004 DOI: 10.1039/b413282c A thin chip polymer-based microsprayer has been coupled to a hybrid quadrupole time-of-flight mass spectrometer (QTOF MS) and introduced in carbohydrate research. The feasibility of the approach is demonstrated for mapping, sequencing and structural elucidation of glycoconjugates originating from human body fluids and tissues such as a glycopeptide mixture from normal human urine and an isolated and purified GT1 ganglioside fraction from normal adult human brain. The optimization procedure required by each glycoconjugate category is described and the advantages of the system in terms of flexibility and adaptability to QTOF MS, stability of the ESI MS signal, carbohydrate ionization and sequencing, sensitivity, speed of analysis and sample consumption are discussed. Introduction In the post-genome era, mass spectrometry (MS) has developed continuously as one of the most powerful analytical techniques for structural elucidation of molecules originating from biological matrices. The potential of MS for highly- sensitive structural bioanalyses increased significantly after the introduction of chip-based electrospray ionization (ESI) and matrix assisted laser desorption/ionization (MALDI) methods and the possibility of sequencing complex ionic species by highly efficient dissociation techniques based on multiple stage MS (MS n ). In particular, in proteomics and glycoproteomics, nanoESI MS n in the positive as well as in the negative ion mode was shown to be capable of sequencing minute amounts of biological material thus providing straightforward informa- tion on various structure determinants. 1–5 Miniaturized analytical instrumentation is attracting grow- ing interest in chemical, biochemical and structural analysis. Nowadays, various mass spectrometer configurations are interfaced to the integrated micro- and nanosystems or to devices providing either robotized sample infusion or a combination of automated sample delivery and chip-based ionization. The potential of these modern systems is consider- ably broadening the area of MS applicability in life sciences. The option of miniaturized devices for sample infusion into MS is driven by several technical, analytical and economical advantages such as: (1) simplification of the laborious chemical and biochemical strategies required currently for MS research; (2) high throughput nanoanalysis/identification of biomole- cules; (3) elimination of the time-consuming optimization procedures; (4) an increase in the sensitivity by drastic reduction of the sample and reagent consumption, sample handling and potential sample loss; (5) high reproducibility of the experiments; (6) the potential to discover novel biologically-relevant structures due to increased ionization efficiency; (7) high signal-to-noise ratio; (8) reduced in-source fragmentation leading to a significant increase of the precision in the identification of unknown analytes in biological matrices; (9) flexibility and a broad area of applicability; (10) low cost of analysis and chip production; (11) the possibility for unattended high-throughput experiments reducing man power and intervention; (12) elimination of possible cross- contamination and carry-overs; (13) flexibility for different configurations and analyses, upgrading and modifications; (14) minimal infrastructure requirements for optimal function- ing; (15) reduction of the ion source size facilitating manipulation and efficient ion transfer by precise positioning towards the MS sampling orifice. Most of the commercially available chip-based devices for MS sample delivery are fabricated in glass or silicon using a variety of semiconductor methods including photolithography and deep ion reactive etching. In combination with automated sample manipulation and infusion, such systems found broad applicability in protein/peptide analysis, 6,7 drug develop- ment, 8,9 metabolite 10 and carbohydrate screening. 11,12 In recent years, the progress in polymer-based microsprayer systems was promoted by development of simpler methods for accurate plastic replications and ease to create lower-cost disposable chips. Several approaches for interfacing MS to polymer chips providing flow rates which include them in categories from nano- to microsprayers were reported. 13–15 Different MS configurations 16–19 such as single and triple quadrupole MS ion trap and ultra high resolution Fourier-transform ion cyclotron resonance mass spectrometry (FTICR MS) were adapted to polymer-based chip ESI interfacing and optimized mostly for proteomic surveys. Here we report the introduction of a robust thin chip polymer-based microsprayer system in combination with quadrupole time-of-flight tandem mass spectrometry (QTOF { Equal contribution. *[email protected] (Alina D. Zamfir) [email protected] (Jasna Peter-Katalinic ´) PAPER www.rsc.org/loc | Lab on a Chip 298 | Lab Chip, 2005, 5, 298–307 This journal is ß The Royal Society of Chemistry 2005
-
Upload
independent -
Category
Documents
-
view
5 -
download
0
Transcript of Thin chip microsprayer system coupled to quadrupole time-of-flight mass spectrometer for...
Thin chip microsprayer system coupled to quadrupole time-of-flight massspectrometer for glycoconjugate analysis
Alina D. Zamfir,{*a Niels Lion,{b Zeljka Vukelic,c Laura Bindila,a Joel Rossier,d Hubert H. Giraultb andJasna Peter-Katalinic*a
Received 1st September 2004, Accepted 9th November 2004
First published as an Advance Article on the web 22nd December 2004
DOI: 10.1039/b413282c
A thin chip polymer-based microsprayer has been coupled to a hybrid quadrupole time-of-flight
mass spectrometer (QTOF MS) and introduced in carbohydrate research. The feasibility of the
approach is demonstrated for mapping, sequencing and structural elucidation of glycoconjugates
originating from human body fluids and tissues such as a glycopeptide mixture from normal
human urine and an isolated and purified GT1 ganglioside fraction from normal adult human
brain. The optimization procedure required by each glycoconjugate category is described and the
advantages of the system in terms of flexibility and adaptability to QTOF MS, stability of the ESI
MS signal, carbohydrate ionization and sequencing, sensitivity, speed of analysis and sample
consumption are discussed.
Introduction
In the post-genome era, mass spectrometry (MS) has
developed continuously as one of the most powerful analytical
techniques for structural elucidation of molecules originating
from biological matrices. The potential of MS for highly-
sensitive structural bioanalyses increased significantly after the
introduction of chip-based electrospray ionization (ESI) and
matrix assisted laser desorption/ionization (MALDI) methods
and the possibility of sequencing complex ionic species by
highly efficient dissociation techniques based on multiple stage
MS (MSn). In particular, in proteomics and glycoproteomics,
nanoESI MSn in the positive as well as in the negative ion
mode was shown to be capable of sequencing minute amounts
of biological material thus providing straightforward informa-
tion on various structure determinants.1–5
Miniaturized analytical instrumentation is attracting grow-
ing interest in chemical, biochemical and structural analysis.
Nowadays, various mass spectrometer configurations are
interfaced to the integrated micro- and nanosystems or to
devices providing either robotized sample infusion or a
combination of automated sample delivery and chip-based
ionization. The potential of these modern systems is consider-
ably broadening the area of MS applicability in life sciences.
The option of miniaturized devices for sample infusion into
MS is driven by several technical, analytical and economical
advantages such as: (1) simplification of the laborious chemical
and biochemical strategies required currently for MS research;
(2) high throughput nanoanalysis/identification of biomole-
cules; (3) elimination of the time-consuming optimization
procedures; (4) an increase in the sensitivity by drastic
reduction of the sample and reagent consumption, sample
handling and potential sample loss; (5) high reproducibility
of the experiments; (6) the potential to discover novel
biologically-relevant structures due to increased ionization
efficiency; (7) high signal-to-noise ratio; (8) reduced in-source
fragmentation leading to a significant increase of the precision
in the identification of unknown analytes in biological
matrices; (9) flexibility and a broad area of applicability; (10)
low cost of analysis and chip production; (11) the possibility
for unattended high-throughput experiments reducing man
power and intervention; (12) elimination of possible cross-
contamination and carry-overs; (13) flexibility for different
configurations and analyses, upgrading and modifications;
(14) minimal infrastructure requirements for optimal function-
ing; (15) reduction of the ion source size facilitating
manipulation and efficient ion transfer by precise positioning
towards the MS sampling orifice.
Most of the commercially available chip-based devices for
MS sample delivery are fabricated in glass or silicon using a
variety of semiconductor methods including photolithography
and deep ion reactive etching. In combination with automated
sample manipulation and infusion, such systems found broad
applicability in protein/peptide analysis,6,7 drug develop-
ment,8,9 metabolite10 and carbohydrate screening.11,12
In recent years, the progress in polymer-based microsprayer
systems was promoted by development of simpler methods for
accurate plastic replications and ease to create lower-cost
disposable chips.
Several approaches for interfacing MS to polymer chips
providing flow rates which include them in categories from
nano- to microsprayers were reported.13–15 Different MS
configurations16–19 such as single and triple quadrupole MS
ion trap and ultra high resolution Fourier-transform ion
cyclotron resonance mass spectrometry (FTICR MS) were
adapted to polymer-based chip ESI interfacing and optimized
mostly for proteomic surveys.
Here we report the introduction of a robust thin chip
polymer-based microsprayer system in combination with
quadrupole time-of-flight tandem mass spectrometry (QTOF
{ Equal contribution.*[email protected] (Alina D. Zamfir)[email protected] (Jasna Peter-Katalinic)
PAPER www.rsc.org/loc | Lab on a Chip
298 | Lab Chip, 2005, 5, 298–307 This journal is � The Royal Society of Chemistry 2005

MS–MS) in carbohydrate research. For the first time to our
knowledge the feasibility of such an approach for mapping,
sequencing and structural elucidation of this biopolymer
category is demonstrated.
The novel mass spectrometric strategy was applied to
glycoconjugates originating from human body fluids and
tissues such as a glycopeptide mixture from normal human
urine and an isolated and purified GT1 ganglioside fraction
extracted from normal adult human brain. The optimization
procedure required for each type of glycoconjugate is
described. Moreover, the advantages of the system in terms
of flexibility and adaptability to QTOF MS, stability of the
ESI MS signal, carbohydrate ionization and sequencing,
sensitivity, speed of analysis and sample consumption are here
discussed.
Experimental
Biological glycoconjugate samples
Mixture of O-glycosylated amino-acids and peptides from
normal human urine. The complex mixture of O-glycosylated
amino-acids and peptides investigated in this work was
obtained and partially purified previously from urine of a
healthy subject. The extraction, separation and purification
procedure was described by us previously.20,21 The sample is
denoted Ty. Stock solutions of the Ty mixture at 1 mg ml21
were prepared by dissolving the dried material in 100% MeOH
and freezing it at 220 uC. Dilution of the stock solutions in
pure MeOH yielded working aliquots at a concentration of 5.0
and 1.25 pmol ml21 calculated for an average molecular weight
of 2000 Da.
GT1 ganglioside fraction from normal adult human cerebrum.
Normal adult (45 years of age) human cerebrum, without
pathological signs according to morphoanatomical and
histopathological examination was obtained from the Depart-
ment of Forensic Medicine, Faculty of Medicine, University of
Zagreb, Croatia. Permission for experiments with human
tissue for scientific purposes was obtained from The Ethical
Commission of the University of Zagreb, Croatia, under
Project no.108120 by the Ministry of Science and Technology
of the Republic of Croatia.
The brain tissue was weighed and stored at 220 uC until the
extraction procedure. The native fraction of GT1 gangliosides
was extracted, isolated and purified in our laboratory as
described in detail elsewhere.22 The ganglioside sample,
denoted GT1, was dried in a Speed Vac SPD 111V system
(Savant, Dusseldorf, Germany). For microchip ESI MS
analysis, a stock solution of the sample at approximately
1 mg ml21 was prepared by dissolving the dried material in
methanol to be stored at 220 uC. Dilution of the stock
solution in 100% methanol yielded the working aliquots at a
concentration of approximately 5 pmol ml21 of ganglioside
extract.
Reagents and materials
Methanol was obtained from Merck (Darmstadt, Germany)
and used without further purification. Distilled and deionized
water (Milli-Q water systems Millipore, Bedford, MA, USA)
was used for the preparation of the sample solutions. Sample
solutions were dried in a SpeedVac SPD 111V system
from Savant (Dusseldorf, Germany) and centrifuged in an
Eppendorf 5415 C centrifuge (Hamburg, Germany).
Instrumentation
Mass spectrometry. Mass spectrometry was performed on an
orthogonal hybrid quadrupole time-of-flight mass spectro-
meter (QTOF2 Micromass, Manchester, U.K.) in Micromass
Z-spray geometry. The QTOF mass spectrometer is interfaced
to a PC computer running the MassLynx software under the
Windows N.T. system to control the instrument, acquire and
process MS data. Nitrogen was used as dissolvation gas and
the source block temperature was kept at 80 uC. The sampling
cone potential and voltage applied on the microsprayer were
adjusted to provide an optimal ionization, minimal in-source
fragmentation and a high and sustained electrospray signal.
Tandem mass spectrometry was performed by collision-
induced dissociation (CID) at low energies using Ar as a
collision gas. In order to obtain a maximum coverage of
sequence ions, the collision energy was kept at 40 eV for
glycopeptide sequencing and adjusted during the ongoing
experiment from 40 to 70 eV for sequencing of GT1 species.
All mass spectra were acquired in the negative ion mode.
For mapping and sequencing of glycoconjugates, the negative
ion detection was shown to be advantageous in comparison
with the positive ion mode.23,24 In particular, the assignment of
already known or previously unknown components in bio-
logical mixtures is easier due to a lower degree of heterogeneity
caused by cation attachment to molecular and/or fragment
ions.23–26
After acquisition, the spectra were calibrated using sodium
iodide as a calibrant.
Thin chip microsprayer system. The microchip fabrication
has been described previously.27 Basically, a photoresist is
patterned on a 75 mm thick, copper-coated polyimide foil
through a printed slide acting as a mask. The photoresist is
then developed, and chemical etching is then used to remove
the deprotected copper where microchannels are to be
patterned. Polyimide is plasma-etched to the desired depth.
The final microchannels are 120 mm wide, 45 mm deep (nearly
‘‘half moon’’ cross section), with gold-coated microelectrodes
placed at the bottom of the microchannel. A 35 mm
polyethylene–polyethylene terephthalate is laminated to close
the channels. Finally, one end of each channel is manually cut
in a tip shape, so that the outlet of the microchannel is located
on the edge of the chip, as described by Gobry et al.28 For
sample dispensing, a reservoir is pasted over the inlet of the
microchannel, or the chip is sandwiched in a home-made chip
holder with an integrated reservoir.
The whole chip/reservoir assembly was mounted to the
QTOF MS. In order to realize the electrical contact to the ESI
power supply, the ESI QTOF source was removed and the chip
system was directly connected to the ESI high voltage plate,
which is a fixed part of the QTOF conventional Micromass
ESI source. Exchange between the original source and chip
This journal is � The Royal Society of Chemistry 2005 Lab Chip, 2005, 5, 298–307 | 299

system interface did not require any definitive dismantling or
special mechanical modifications to the original assembly and
no further modifications of the QTOF instrument were
necessary. The position of the chip emitter was adjusted in
the vicinity of the entrance hole of the sampling cone by the
source assembly, which can be manipulated in the x, y and z
direction via micrometer screws. The microsprayer tip was
placed at a distance less than 5 mm, although fine positioning
of the microsprayer tip turned out not to be a critical
parameter.
The electrical contact was ensured by a conductive wire with
one terminal connected to the chip electrode and the other
fixed on the ESI high voltage plate. The spray could be
initiated at values of 2–3 kV, in the negative ion mode, applied
to the nanoESI plate and 80–100 V applied to the sampling
cone without the need for nebulizer gas. The chip micro-
channel was flushed with methanol between two consecutive
experiments with the same sample. For all experiments,
desolvation at 80 uC under drying gas was effective, so that
the chip unit could be left connected to the mass spectrometer
during the channel rinse.
For each sample a fresh chip was used thus any contamina-
tion was prevented. Under the same ESI QTOF MS con-
ditions, the in-run reproducibility of the experimental data
in terms of sensitivity, spray stability, number of detected
components/fragments, ion intensity and charge state was
almost 100% while the day-to-day reproducibility was 95–
100% with a maximum mass deviation of 10 ppm, which is
within in the normal range for a QTOF I instrument. The
minimum number of replicates for an experiment was 3.
The flow rate generated under the employed source and
solution parameters was about 200 nl min21.
Results and discussion
Determination of O-GalNAc-Ser/Thr expression in normal
human urine
In human urine, carbohydrates are catabolic products excreted
as either oligosaccharides or glycopeptides and their concen-
tration, amount and structure is known to vary under different
physiological and/or pathological conditions. For this reason,
screening and identification of glycopeptide expression in
human urine is of major biological importance.
A Ty mixture of O-GalNAc glycosylated amino acids and
peptides extracted from normal human urine was dissolved in
pure methanol to a concentration of 5 pmol ml21. An aliquot
of 10 ml was dispensed into a reservoir pasted over the inlet of
the chip microchannel. The (2) ion mode electrospray process
was initiated at 2.8 kV applied to the ESI high voltage plate
and 100 V potential of the sampling cone. Under these well-
defined conditions a constant and stable spray accompanied
by a high intensity of the total ion current was generated. In
Fig. 1a, the (2)chipESI QTOF MS1 of the Ty sample at a
5 pmol ml21 concentration is presented. The signal was
acquired over 20 scans (40 seconds) which at the flow rate of
about 200 nl min21 is equivalent to a sample consumption of
0.66 pmol. The spectrum combined over 20 scans exhibits a
high signal/noise ratio and 26 different saccharide components.
15 species detected as singly and/or doubly charged ions are
expressing the O-GalNAc-Ser/Thr core-motif extended by
either sialylation or fucosylation. The mixture is dominated by
Ser- and Thr- linked disialo saccharides with chain lengths
ranging from tetra- to octasaccharide. The monosialylated
glycopeptides are also well represented in the spectrum in
Fig. 1a, being detected as singly charged ions at m/z 760.12,
NeuAcHexHexNAc-Ser, and 774.12, NeuAcHexHexNAc-
Thr. Mono- and disialylated free oligosaccharides are
observed as singly charged ions at m/z 470.03 corresponding
to disaccharide NeuAcHex, m/z 673.12 assigned to
NeuAcHexHexNAc trisaccharide and m/z 964.16 assigned to
NeuAc2HexHexNAc tetrasaccharide. The tetrasaccharide is
also observed as a doubly charged ion at m/z 481.09.
Interestingly, two new structures, not detectable before by
any MS-related methods, are visible as doubly charged ions at
m/z 1069.19 and 1076.20. The species could originate from
glycopeptides with extended and further modified chains.
In order to test the limit of microchip sensitivity for
glycoconjugate detection, Ty solution was diluted in pure
methanol yielding an aliquot at 1.25 pmol ml21 concentration.
In Fig. 1b, the (2) microchip ESI QTOF MS1 of the Ty
sample at 1.25 pmol ml21 concentration is presented. Setting
the same source parameters, the signal was acquired over
20 scans, which is equivalent to 0.16 pmol sample consumption
for this experiment. Even under these restrictive concentration
conditions, a fair signal/noise ratio and 13 different compo-
nents in the mixture could be identified.
In Table 1 the assignment of the major species present in the
Ty sample and detected by microchip ESI QTOF MS1 is given.
An interesting feature of the spectra in Fig. 1 is that at 100 V
cone potential, the charge distribution is not shifted towards
lower values as observed in the capillary-based ESI QTOF MS
experiments, the intensity of the signals corresponding to
doubly charged ions being the highest. Moreover, the
advantage of the microchip ESI MS regarding the minimiza-
tion of the in-source decay is clearly illustrated in Fig. 1 where
the in-source fragmentation of molecular ions is not observed
at such a high value of the sampling cone potential.
To investigate the possibility of performing rapid and
accurate glycopeptide sequencing by MS/MS using the
polymer chip for sample infusion, the doubly charged ion at
m/z 532.08, assigned according to the m/z value to the already
known structure of NeuAc2HexHexNAc-Thr, was isolated
and submitted to low-energy CID (2) microchip ESI QTOF
MS/MS. Collision energy, collision gas pressure and precursor
ion isolation parameters were carefully adjusted to provide the
full set of structural information upon the molecule. The
product ion spectrum of the doubly charged ion at m/z 532.08
is depicted in Fig. 2. The spectrum was obtained after 30 scans
(1 min) of signal acquisition, resulting in a sample consump-
tion of 1.23 pmols.
The product ion spectrum exhibits a high signal/noise ratio
and reveals a significant number of fragment ion fingerprints
for detailed structural elucidation of the molecule. The
abundant fragment ion detected as a singly charged ion at
m/z 483.07, assigned to Hex-HexNAc-Thr, corresponds to
the loss of both sialic acid moieties from the precursor ion. The
stripping of only one sialic acid moiety is indicated by the
doubly charged ion at m/z 386.56 and the singly charged at m/z
300 | Lab Chip, 2005, 5, 298–307 This journal is � The Royal Society of Chemistry 2005

Fig. 1 Microchip ESI QTOF MS1 of the Ty mixture of O-glycosylated amino acids and peptides from human urine. ESI voltage 2.8 kV; sampling
cone potential 100 V; signal acquisition 20 scans. Solvent: MeOH; average sample concentration: (a) 5 pmol ml21; (b) 1.25 pmol ml21.
This journal is � The Royal Society of Chemistry 2005 Lab Chip, 2005, 5, 298–307 | 301

774.13 along with the ions obtained by further neutral loss of
H2O at m/z 756.10 and of CO2 at m/z 730.13. The trisaccharide
ion C3/B1b at m/z 673.06 is assigned to NeuAc-Hex-HexNAc.
Of particular interest for the localization of the sialic acid
residue are the singly charged ions at m/z 470.05, assigned to
NeuAc-Hex (C2a) and at m/z 493.07, corresponding to NeuAc-
HexNAc (C3/C2a). These ions indicating the attachment of the
NeuAc moiety represent valuable diagnostic elements for the
sialylation pattern of the core 1 O-GalNAc mucine molecules.
In addition, the ion generated only by the glycosidic-amino
acid bond cleavage, with retention of sialic acid entities, is
evidenced by the doubly charged ion at m/z 481.60, assigned to
(NeuAc2)Hex-HexNAc (C3). In the spectrum in Fig. 2, two
relevant ring cleavage ions at m/z 350.04 and at m/z 306.08
corresponding to 0,4A2 and 0,4A2–CO2 are detected. According
to our previous studies29,30 these cleavages are diagnostic for
the NeuAca2–6 linkage.
Characterization of GT1 ganglioside fraction from normal adult
human cerebrum
Gangliosides are sialylated glycosphingolipids (GSLs) consist-
ing of mono- to poly- sialylated oligosaccharide chains of
variable length attached to the ceramide portion. For analysis
of complex ganglioside mixtures from biological sources by
MS methods, either with ESI or MALDI, specific conditions
related to the ionization process and a reliable assessment of
the heterogeneity of composition, followed by identification of
the molecule architecture, are required.
Optimization of a procedure for capillary-based
(2)nanoESI QTOF MS and tandem MS for characterization
of native ganglioside mixture from brain tissues was recently
reported by us.22,33,34 In these studies, requirements for
elevated values of ionization parameters and an extended time
for signal acquisition implying relatively high sample con-
sumption for identification and structural elucidation were
defined.
To test the feasibility and advantages of the microchip ESI
QTOF MS analysis concerning information that could be
provided by both MS1 and MS/MS, as well as to define
corresponding appropriate conditions for the GSL molecular
class detection and structural characterization, a rather
structurally complex polysialylated ganglioside fraction,
GT1, was chosen as the testing sample. The analyzed GT1
ganglioside fraction, showing migration properties of GT1b
species in high performance thin-layer chromatography
(HPTLC), was isolated from the total native ganglioside
mixture purified from adult human cerebrum.
For (2) microchip ESI QTOF MS analysis, GT1 sample
was dissolved in pure MeOH to a concentration of 5 pmol ml21
and an aliquot of 10 ml was loaded into the microchip
reservoir. To optimize the ionic current value, the (2)ESI
voltage and cone potential were increased from zero following
a ramping procedure. The maximum current value was
obtained at 3 kV ESI and 100 V applied on the sampling
cone. In Fig. 3a the total ion current (TIC) of GT1 acquired
for 6 min is presented. The TIC profile indicates a sustained
spray varying only by ESI source parameter variation, as well
as an efficient ionization at 3 kV ESI and 100 V sampling cone
voltages, proved by the high intensity of ionic current. Starting
with 1.5 min, the signal was acquired for 4 minutes under 3 kV
and 100 V, to give a constant ESI signal documented by the
flat region of the TIC. By combining in progress over all TIC
Table 1 The compositional mapping of the purified native Ty mixture of glycopeptides from normal human urine as detected by (2) microchipESI QTOF MS1
m/z (monoisotopic) Charge state Putative structure 5 pmol ml21 1.25 pmol ml21
470.05 12 NeuAcHex + +481.11 22 NeuAc2HexHexNAc + +525.08 22 NeuAc2HexHexNAc-Ser + +532.08 22 NeuAc2HexHexNAc-Thr + +543.10 22 NeuAc2HexHexNAc-Thr (Na) + +571.62 22 NeuAc2HexHexNAc-Thr-Pro–H2O + +580.62 22 NeuAc2HexHexNAc-Thr-Pro + +673.12 12 NeuAcHexHexNAc + +707.61 22 NeuAc2Hex2HexNAc2-Ser + +714.61 22 NeuAc2Hex2HexNAc2-Thr + +760.12 12 NeuAcHexHexNAc-Ser + +774.12 12 NeuAcHexHexNAc-Thr + +853.16 12 NeuAcHexHexNAc-Thr-Pro –H2O + +871.19 12 NeuAcHexHexNAc-Thr-Pro + +890.14 22 NeuAc2Hex3HexNAc3-Ser + +897.17 22 NeuAc2Hex3HexNAc3-Thr + +912.64 22 NeuAc2Hex2HexNAc4-Ser –H2O (Na) +919.69 22 NeuAc2Hex2HexNAc4-Thr –H2O (Na) +923.65 22 NeuAc2Hex2HexNAc4-Ser –H2O (2Na) +930.67 22 NeuAc2Hex2HexNAc4-Thr –H2O (2Na) +964.16 12 NeuAc2HexHexNAc +
1051.18 12 NeuAc2HexHexNAc-Ser + +1065.19 12 NeuAc2HexHexNAc-Thr + +1069.19 22 n.a. +1076.20 22 n.a. +1087.19 22 n.a. + +1144.19 12 NeuAc2HexHexNAc-Thr-Pro –H2O ++ ions detected at the given concentration. n.a. not assigned.
302 | Lab Chip, 2005, 5, 298–307 This journal is � The Royal Society of Chemistry 2005

scans of constant current intensity, a spectrum of high signal/
noise was obtained (Fig. 4) however, a fair signal/noise ratio
was already visible after 60 scans (30 seconds) of acquisition.
A reproducible compositional mapping of molecular com-
ponents in the GT1 fraction mixture was obtained from both
sets of formed molecular ions, the triply and the doubly
charged related to gangliosides containing a number of lipid
variants (Table 2). The enlarged area of the spectrum (m/z
range 1030–1125), containing a rich pattern of doubly charged
molecular ions all attributed to GT1 species, is presented
in Fig. 4b. In particular, each specific GT1 species is
characterized exclusively by one triply charged [M–3H+]32
ion, while the corresponding doubly charged [M–2H+]22 ion is
mostly accompanied by the same charge state [M+Na–3H+]22
and/or [M–2H+]22–H2O ions.
The presence of three minor GT1 molecular species is
documented only by very low intensity ion signals at m/z
1094.20, 1108.20 and 1109.21, which can be assigned by
calculation to GT1 (d18:1/21:1), GT1 (d18:1/23:1) and GT1
(d18:1/23:0), respectively.
As is obvious from the spectrum pattern, only a low level of
in-source fragmentation occurs during the MS1 ionization
process, according to the ions assigned to disialylated product
ions resulting from the cleavage of one sialic acid residue from
the intact trisialylated GT1 species. The NeuAc residue linked
to the terminal Gal residue as a monosialo group is known
to be more susceptible to enzymatic cleavage, such as that by
V. cholerae neuraminidase. The loss of the NeuAc residue(s)
bound to the inner Gal would produce a high extent of disialo
ions along with NeuAc-Gg4Cer (GM1-like) fragment ions,
which are not detectable in the spectrum. A significantly lower
extent of in-source induced fragmentation using chip-based
ESI vs. conventional capillary-based ion source has already
been observed and documented,35 representing one of the
major advantages of chip usage in MS analysis.
It is well-known that in the case of ganglioside fragmenta-
tion by CID MS/MS, a long signal acquisition time under
variable collision energy is necessary to obtain a sufficient
abundance of fragment ions for structure elucidation. This
approach, though successfully applied by using capillary-based
ESI,22,33,34 often encounters difficulties associated with spray
instability and/or signal interruptions. In the case of microchip
ESI MS/MS the triply charged ion detected at m/z 717.50 could
be successfully fragmented. The TIC profile of the sequencing
events given in Fig. 3b) documents the stability of the MS/MS
signal for each of the employed collision energy values used for
this experiment and the corresponding dependence of the ionic
current on this parameter. The MS/MS product ion spectrum
Fig. 2 Microchip ESI QTOF MS/MS of the NeuAc2HexHexNAc-Ser doubly charged ion at m/z 532.08. ESI voltage 2.8 kV; sampling cone
potential 100 V; solvent: MeOH; average sample concentration 5 pmol ml21; collision energy 40 eV; signal acquisition 30 scans; sample
consumption 1.23 pmols. The nomenclature for assignment of fragment ions is according to Domon and Costello nomenclature.31,32
This journal is � The Royal Society of Chemistry 2005 Lab Chip, 2005, 5, 298–307 | 303

of the triply charged precursor ion at m/z 717.63, correspond-
ing to the GT1 (d18:1/20:0) species is depicted in Fig. 5. The
spectrum was acquired under variable energy (VE-CID)36 by
combining scans at collision energy values of 40 and 70 eV.
The fragmentation process gave rise to product ions for
reliable assignment of the entire carbohydrate sequence of the
GT1b isomer species, as well as for characterization of the type
of its ceramide portion. However, certain ions indicative for
positional isomers, particularly those of GT1a, GT1c and/or
even GT1a, in the mixture with GT1b, are present as minor
components. The ion assignment in the shown spectrum
defines the GT1b product ions as represented in the
accompanying fragmentation scheme (Fig. 6).
The triply charged, still highly abundant precursor ion is
clearly detectable in the spectrum. As a general characteristic,
a predominance of the singly over the doubly and triply
charged fragment ions can be pointed out. Also, no sodiated
counterparts are observed. The complete sequence of the
GT1b is deducible from the ions arising from the non-reducing
end of the molecule where dominating Y type ions are
accompanied by Z and ring cleavage X type ions appearing
at lower abundance, as deduced from the corresponding
fragmentation scheme (Fig. 6). The d18:1/18:0 type of
ceramide is represented by both Y0 ion and a minor Z0 at
m/z 592.50 and 574.55, respectively. The Glc-Cer sequence is
also shown by Y0 and Z0 counterparts at m/z 754.49 and
736.55, respectively. The Y2a/B2b ion at m/z 916.55 gives rise to
the Gal–Glc–Cer sequence which might originate from either
GT1a or GT1b isomer after the respective desialylation of
either NeuAc or NeuAc2 residue from the inner Gal residue, or
might hypothetically originate from an isomer containing the
non-substituted inner Gal (potential GT1d isomer). The 2,4X2a
ion resulting from ring cleavage at the GalNAc residue
corresponds to the inner Gal disialylated structure, GalNAc–
(NeuAc2)Gal–Glc–Cer, consistent with the GT1b isomer. The
disialylation at the inner Gal residue is finally confirmed by
the doubly charged Y2a ion at m/z 748.80, detected at
lower abundance. The highly abundant doubly charged
signal at m/z 931.39 correspondingly to GT1b isomer, can be
attributed to both Y4a and Y3b ions giving rise to the presence
of a disialylated Gg4Cer sequence; these ions, however, do not
indicate the attachment sites of sialic acid residues at the
neutral Gg4 core. Except for the Y2a and the2,4X2a specific for
the GT1b isomer, all ions could also arise from other isomers,
such as GT1a, GT1a, GT1c or even, the as yet not reliably
proven to exist, GT1d isomer. The GT1 corresponding
sequence was finally corroborated by the triply charged signal
at m/z 643.64 consistent with 0,2 type ring cleavage at one
of the terminal sialic acid residues which, in the case of
GT1b species, can be formed from both 0,2X4a–2H+ and0,2X3b–2H+ ion.
Further support and deeper insight into the detailed
structural composition of the chosen molecular ion is provided
by a set of ions formed from the reducing end. In particular,
informative C and B type ions are present and observed to be
similarly favored under the defined conditions. Structurally
significant and/or considerably abundant A type ring cleavage
ions were not found. The B type ion with the highest intensity
at m/z 290.08, attributable to both the B1a and B1b linkage
cleavages, and the accompanying C type counterpart ion,
specifying both the C1a and C1b cleavages, characterize the
cleaved monosialo residue. The presence of the disialo group is
evidenced by the abundant B2b ion at m/z 581.13. The C2a ion
(m/z 470.12) representing the NeuAc–Gal sequence confirms
the attachment of the monosialo group to the terminal Gal
residue, which is consistent with the GT1b but also the GT1aa
structural motif. The signal might potentially include the ions
formed from the sialylated inner Gal residue by multiple
internal cleavages. The counterpart signals at m/z 673.15 and
655.21, arising from GT1b as C3a and B3a ions, respectively,
represent both NeuAc–Gal–GalNAc and Gal–GalNAc–
NeuAc sequences, and could therefore arise from any
GT1 isoform. The signal at m/z 364.09 corresponding to the
Gal–GalNAc sequence, assigned to the GT1b internal cleavage
B3a/B1a ion, is however more characteristic for the GT1c
isomer (the B2a ion) bearing the non-substituted terminal
Gal–GalNAc residue. The GT1c isoform is further supported
by the structure-specific ion at m/z 966.39 assigned to the2,4X2a ring cleavage ion containing the three sialo structural
motif. Finally, the prominent ion at m/z 493.10 attributed
to the B type NeuAc–GalNAc2 ion can arise exclusively
from the GT1a isoforms (potentially GT1aa and/or
GT1ba), characterized by the sialylation of the GalNAc
residue. This ion strongly supports the hypothesized presence
of at least one GT1a isoform in the purified GT1 mixture
from human brain, containing the GT1b isomer as the major
component.
Fig. 3 Microchip ESI QTOF TIC of the GT1 ganglioside fraction
from normal adult human brain. Maximal ionic current at 3 kV ESI
voltage and 100 V sampling cone potential. Solvent: MeOH; average
sample concentration 5 pmol ml21; (a) MS1 mode; (b) MS/MS mode
for the triply charged ion at m/z 717.50.
304 | Lab Chip, 2005, 5, 298–307 This journal is � The Royal Society of Chemistry 2005

Fig. 4 Microchip ESI QTOF MS1 of the GT1 fraction derived by combining the TIC MS scans at 3 kV ESI voltage and 100 V sampling cone
potential. (a) m/z range: (650–1175); (b) zoom out of the m/z range: (1030–1125).
This journal is � The Royal Society of Chemistry 2005 Lab Chip, 2005, 5, 298–307 | 305

Conclusions
A thin yet sturdy polymer microchip has been for the first time
coupled to QTOF MS and introduced in carbohydrate
research. Two complex carbohydrate mixtures containing
glycoforms from different biological sources and belonging
to different structural systems, a mixture of O-glycopeptides
from human urine and the isolated GT1 ganglioside fraction
from normal adult human brain were explored by this
approach. The potential of the methodology developed here
is beneficial for glycomics due to particular advantages
provided by microchip ESI infusion: (i) a high signal-to-noise
ratio within a short scanning time; (ii) a stable spray of
biological samples under different solvent and instrumental
conditions; (iii) almost 100% reproducibility of the obtained
data under the same experimental conditions; (iv) reduced
in-source fragmentation; (v) high sensitivity and resolution in
detecting molecular ions; (vi) efficient fragmentation in
tandem MS and (vii) the possibility to discover in a single
MS experiment new carbohydrate species present in biological
mixtures.
Due to the high sensitivity for detection of minor relative to
major carbohydrate species in mixtures and other here
demonstrated advantages, the microchip ESI QTOF MS has
the potential to be introduced in medical diagnostics/pharmacy
for comparative compositional analysis of homologous bio-
logical glycoconjugate mixtures from either tissues/body
fluids or natural products in pharmaceutics. For instance,
the microchip ESI QTOF MS analysis of a pathological vs.
control glycoconjugate mixture would offer reliable, fast, one-
step biochemical diagnosis of diseases. It could be optimized
Table 2 The compositional mapping of the purified native GT1ganglioside fraction (exhibiting HPTLC migration properties of theGT1b species) separated from the total ganglioside mixture isolatedfrom adult human brain tissue as detected by (2) microchip ESIQTOF MS1
m/z(monoisotopic)
Type of detectedmolecular ion Putative structure
708.18 [M–3H+]32 GT1 (d18:1/18:0)1062.69 [M–2H+]22
1073.69 [M+Na+–3H+]22
1053.70 [M+2H+]22–H2O712.85 [M–3H+]32 GT1 (d18:1/19:0)
1070.19 [M–2H+]22
1081.18 [M+Na+–3H+]22
717.50 [M–3H]32 GT1 (d18:1/20:0)1076.70 [M–2H]22
1087.69 [M+Na–3H]22
1067.69 [M+2H+]22–H2O1094.20a [M+Na+–3H+]22 GT1 (d18:1/21:1)722.18 [M–3H+]32 GT1 (d18:1/21:0)
1084.20 [M–2H]22
1095.20 [M+Na+–3H+]22
726.85 [M–3H+]32 GT1 (d18:1/22:0)1108.20a [M+Na+–3H+]22 GT1 (d18:1/23:1)1109.21a [M+Na+–3H+]22 GT1 (d18:1/23:0)a Low intensity ions. d 5 dihydroxy sphingoid base.
Fig. 5 Microchip ESI QTOF MS/MS of the triply charged ion at m/z 717.50 corresponding to GT1 (d18:1/20:0). ESI voltage 3 kV. Sampling cone
potential 100 V. The spectrum is derived by combining the scans corresponding to 40 and 70 eV in the TIC MS/MS from Fig. 3b. The nomenclature
for assignment of fragment ions is according to Domon and Costello nomenclature.31,32
306 | Lab Chip, 2005, 5, 298–307 This journal is � The Royal Society of Chemistry 2005

even for differential biochemical diagnosis of certain clinically
similar diseases i.e. differentiation of the three Schindler/
Kanzaki disease subgroups, clinically classified as type I, II
and III.
The high sequencing efficiency of the microchip ESI QTOF
MS/MS resulted in an information-rich fragmentation pattern.
This feature is of particular importance for elucidating the
presence of structural isomers or isobars as distinct species.
In many cases these species play a particular physiological
and/or pathological role and may, therefore, be of specific
diagnostic relevance.
Alina D. Zamfir,{*a Niels Lion,{b Zeljka Vukelic,c Laura Bindila,a
Joel Rossier,d Hubert H. Giraultb and Jasna Peter-Katalinic*a
aInstitute for Medical Physics and Biophysics, Biomedical Analysis,University of Munster, Germany. E-mail: [email protected];[email protected]; Fax: +49-251-8355140; +49-251-8355194;Tel: +49-251-8352308bLaboratoire d’Electrochimie Physique et Analytique, EcolePolytechnique Federale de Lausanne, SwitzerlandcDepartment of Chemistry and Biochemistry, Faculty of Medicine,University of Zagreb, CroatiadDiagnoSwiss SA, Monthey, Switzerland
References
1 X. Czeszak, W. Morelle, G. Ricart, D. Tetaert and J. Lemoine,Anal. Chem., 2004, 76, 4324.
2 M. Wuhrer, C. H. Hokke and A. M. Deelder, Rapid Commun.Mass Spectrom., 2004, 18, 1741.
3 Y. O. Tsybin, M. Ramstrom, M. Witt, G. Baykut andP. Hakansson, J. Mass Spectrom., 2004, 39, 719.
4 J. E. Syka, J. J. Coon, M. J. Schroeder, J. Shabanowitz andD. F. Hunt, Proc. Natl. Acad. Sci. USA, 2004, 101, 9528.
5 N. G. Karlsson, B. L. Schulz and N. H. Packer, J. Am. Soc. MassSpectrom., 2004, 15, 659.
6 S. Zhang, C. K. Van Pelt and J. D. Henion, Electrophoresis, 2003,24, 3620.
7 S. Zhang, C. K. Van Pelt and D. B. Wilson, Anal. Chem., 2003, 75,3010.
8 C. K. Van Pelt, S. Zhang, E. Fung, I. Chu, T. Liu, C. Li,W. A. Korfmacher and J. Henion, Rapid Commun. MassSpectrom., 2003, 17, 1573.
9 J. T. Kapron, E. Pace, C. K. Van Pelt and J. Henion, RapidCommun. Mass Spectrom., 2003, 17, 2019.
10 J. M. Dethy, B. L. Ackermann, C. Delatour, J. D. Henion andG. A. Schultz, Anal. Chem., 2003, 75, 805.
11 A. Zamfir, S. Vakhrushev, A. Sterling, H. J. Niebel, M. Allen andJ. Peter-Katalinic, Anal. Chem., 2004, 76, 2046.
12 S. Zhang and D. Chelius, J. Biomol Technol., 2004, 15, 120.13 M. Schilling, W. Nigge, A. Rudzinski, A. Neyer and
R. Hergenroder, Lab Chip, 2004, 4, 220.14 K. Huikko, P. Ostman, K. Grigoras, S. Tuomikoski, V. M. Tiainen,
A. Soininen, K. Puolanne, A. Manz, S. Franssila, R. Kostiainenand T. Kotiaho, Lab Chip, 2003, 3, 67.
15 M. Svedberg, M. Veszelei, J. Axelsson, M. Vangbo andF. Nikolajeff, Lab. Chip, 2004, 4, 322.
16 S. Le Gac, J. Carlier, J. C. Camart, C. Cren-Olive and C. Rolando,J. Chromatogr., B: Anal. Technol. Biomed. Life Sci., 2004, 808, 3.
17 V. Gobry, J. van Oostrum, M. Martinelli, T. C. Rohner,F. Reymond, J. S. Rossier and H. H. Girault, Proteomics, 2002,2, 405.
18 J. Rossier, N. Youhnovski, N. Lion, E. Damoc, S. Becker,F. Reymond, H. H. Girault and M. Przybylski, Angew. Chem., Int.Ed., 2003, 42, 53.
19 Y. Yang, J. Kameoka, T. Wachs, J. D. Henion andH. G. Craighead, Anal. Chem., 2004, 76, 2568.
20 H. U. Linden, R. A. Klein, H. Egge, J. Peter-Katalinic,J. Dabrowski and D. Schindler, Biol. Chem. Hoppe Seyler, 1989,370, 661.
21 O. P. van Diggelen, D. Schindler, W. J. Kleijer, J. G. M. Huijmans,H. Galjaard, H. U. Linden, J. Peter-Katalinic, H. Egge,U. Dabrowski and M. Cantz, Lancet, 1987, 2, 804.
22 W. Metelmann, Z. Vukelic and J. Peter-Katalinic, J. MassSpectrom., 2001, 36, 21.
23 J. Peter-Katalinic, Mass Spectrom. Rev., 1994, 13, 77.24 J. Zaia, Mass Spectrom. Rev., 2004, 23, 161.25 A. Zamfir and J. Peter-Katalinic, Electrophoresis, 2004, 25, 1949.26 C. Thanawiroon, K. G. Rice, T. Toida and R. J. Linhardt, J. Biol.
Chem., 2004, 279, 2608.27 J. S. Rossier, C. Vollet, A. Carnal, G. Lagger, V. Gobry,
H. H. Girault, P. Michel and F. Reymond, Lab. Chip, 2002, 2, 145.28 V. Gobry, J. van Oostrum, M. Martinelli, T. Rohner, J. S. Rossier
and H. H. Girault, Proteomics, 2002, 2, 405.29 I. Meisen, J. Peter-Katalinic and J. Muthing, Anal. Chem., 2003,
75, 5719.30 L. Bindila, R. Almeida, A. Sterling, M. Allen, J. Peter-Katalinic
and A. Zamfir, J. Mass. Spectrom., 2004, 39, 1190.31 B. Domon and C. E. Costello, Glycoconjugate J., 1988, 5, 397.32 C. E. Costello, P. Juhasz and H. Perreault, Progr. Brain Res., 1994,
101, 45.33 Z. Vukelic, W. Metelmann, J. Muthing, M. Kos and J. Peter-
Katalinic, Biol. Chem., 2001, 382, 259.34 A. Zamfir, Z. Vukelic and J. Peter-Katalinic, Electrophoresis, 2002,
23, 2894.35 A. Zamfir, Z. Vukelic, L. Bindila, R. Almeida, A. Sterling, M. Allen
and J. Peter-Katalinic, J. Am. Soc. Mass Spectrom., 2004, 15, 1649.36 A. Zamfir, D. G. Seidler, H. Kresse and J. Peter-Katalinic,
Glycobiology, 2003, 13, 733.
Fig. 6 The structure and the corresponding fragmentation scheme of the GT1b species. The product ions detected from the spectrum depicted in
Fig. 5 are assigned.
This journal is � The Royal Society of Chemistry 2005 Lab Chip, 2005, 5, 298–307 | 307