Development and validation of a novel method for the analysis of chlorinated pesticides in soils...
86
Development and validation of a novel method for serotonin and 5-hydroxyindole-acetic acid determination in plasma using liquid chromatography tandem mass spectrometry By Romanus O. Abia Thesis for the degree of European Master in Quality in Analytical Laboratories Bergen, Norway May 2014 Department of chemistry National Institute of Nutrition University of Bergen and Seafood Research Bergen, Norway Bergen, Norway
-
Upload
independent -
Category
Documents
-
view
2 -
download
0
Transcript of Development and validation of a novel method for the analysis of chlorinated pesticides in soils...

Development and validation of a novel method for serotonin and
5-hydroxyindole-acetic acid determination in plasma using liquid
chromatography tandem mass spectrometry
By
Romanus O. Abia
Thesis for the degree of
European Master in Quality in Analytical Laboratories
Bergen, Norway
May 2014
Department of chemistry National Institute of Nutrition
University of Bergen and Seafood Research
Bergen, Norway Bergen, Norway

Development and validation of a novel method for serotonin and
5-hydroxyindole acetic acid determination in plasma using liquid
chromatography tandem mass spectrometry
By
Romanus O. Abia
Thesis for the degree of
European Master in Quality in Analytical Laboratories
Supervisors
Pedro Araujo, PhD
Professor, National Institute of Nutrition and Seafood Research
Bjørn Grung, PhD
Professor, Department of Chemistry, University of Bergen
Bergen, Norway
May 2014
‘’All models are wrong, but some are useful’’
-George Box, 1978 (Statistician)
I therefore opine that a good model allows you to manipulate, play and make mistakes at low
cost. However, models maybe quite different from the real thing.
i
ACKNOWLEDGEMENTS
This master thesis was carried out at the National Institute of Nutrition and Seafood Research
(NIFES) and the Chemistry Department of the University of Bergen, Norway with financial
support from the European commission through the Erasmus Mundus Master in Quality in
Analytical Laboratories (EMQAL) programme. I am very much grateful for both bodies for
the timely and successful completion of the master study.
I extend my warmest regards to my thesis supervisor, Prof. Pedro Araujo for his sincere,
kindly and inspiring approach throughout the period of this master thesis. I especially
appreciate his constructive criticisms and suggestions, as well as his contributions and
guidance throughout my research work at NIFES; I say a big thank you Prof. Pedro.
I deeply appreciate Prof. Bjorn Grung for his inestimable support in organising some logistics
and follow up comments. I humbly appreciate his assistance and guidance in arranging every
facilities and administrative issues throughout my stay in Bergen.
I will not forget to extend my greetings to Prof. Miguel Palma Lovillo for his responsive
approach to issues throughout my stay at the University of Cadiz, Spain and to other staff of
the Chemistry department of the University of Cadiz, Spain. I sincerely appreciate your
efforts to making this master study a success. I also appreciate Prof. Isabel Cavaco, the
Director of the EMQAL programme at the University of Algarve, Portugal; I say a very big
thank you for providing the logistics to making my full participation in EMQAL programme a
success story.
I seize this opportunity to thank all the EMQAL professors from various Universities of the
consortium for sharing their knowledge and experience throughout the duration of the taught
part of the EMQAL programme.

ii
My warm and deepest regards to all the staff of NIFES, especially Dr. Lisbeth Dahl for
providing the samples used in the study and for arranging the vaccination and other necessary
logistics needed for the research project, may God bless you all.
And to all my family members, I say a very big thank you for all your supports throughout
this stage of my education.
To my friends and colleagues, Ephrem Tilahun, Habtewold Deti, Pedro Sousa, Kasahun
Abeje, Carlos Goncalves, Anabel Medina, Edgar Magas, Kamila Smieszkol and Yang Yang
thank you all for making this master programme a life time experience.
Finally to Ngozi Edith I appreciate your moral support and encouragement throughout this
research project, may you remain blessed.
Romanus O. Abia
Bergen, 2014.
iii
TABLE OF CONTENTS ACKNOWLEDGEMENTS ..................................................................................................................... i
LIST OF TABLES .................................................................................................................................. v
LIST OF FIGURES ................................................................................................................................. v
ABBREVIATIONS ................................................................................................................................ vi
ABSTRACT ......................................................................................................................................... viii
1. INTRODUCTION ............................................................................................................................... 1
1.1 Biology of serotonin ...................................................................................................................... 1
1.2 Neurophysiology of serotonin ....................................................................................................... 4
1.3 Project scope.................................................................................................................................. 7
1.3.1 Project significance ................................................................................................................ 7
1.3.2 Project brief at the onset ......................................................................................................... 8
1.3.3 Objectives of the study ........................................................................................................... 8
1.4 Biosynthesis of serotonin .............................................................................................................. 9
1.5 5-HIAA/5-HT ratio in depression ........................................................................................... 12
1.6 Stability of serotonin ................................................................................................................... 14
2. THEORETICAL BACKGROUND .................................................................................................. 16
2.1 Analysis of serotonin by chromatography ................................................................................... 16
2.2 Mass spectrometry and chromatography ..................................................................................... 21
2.2.1 Low pressure chromatography ............................................................................................. 23
2.2.2 High performance liquid chromatography ........................................................................... 23
2.3 Sample preparation/extraction methods for serotonin in plasma ................................................ 25
2.4 Theory on internal standard ......................................................................................................... 26
2.5 Experimental design and optimisation ........................................................................................ 27
2.5.1 Doehlert design ..................................................................................................................... 28
2.6 Matrix effects .............................................................................................................................. 29
2.7 Theory on method validation....................................................................................................... 30
2.7.1 Accuracy ............................................................................................................................... 31
2.7.2 Precision ............................................................................................................................... 31
2.7.3 Specificity/selectivity ........................................................................................................... 32
2.7.4 Linearity ............................................................................................................................... 33
2.7.5 Range .................................................................................................................................... 34
2.7.6 Limit of detection and Limit of quantification ..................................................................... 34
3. METHOD DEVELOPMENT ........................................................................................................... 37
3.1 Reagents ...................................................................................................................................... 37
3.2 Plasma samples............................................................................................................................ 37
iv
3.3 Analytes extraction and optimisation .......................................................................................... 38
3.3.1 Selection of extraction solvents ............................................................................................ 38
3.4 Mobile phase selection and optimisation of the gradient system ................................................ 39
3.5 Optimising the addition of internal standard ............................................................................... 45
3.5 Application of Doehlert design to select optimal amounts of internal standards. ....................... 45
3.6 Plasma sample protocol ............................................................................................................... 48
3.7 Method validation ........................................................................................................................ 49
3.8 Liquid chromatography ion trap mass spectrometry ................................................................... 49
3.9 Statistics ...................................................................................................................................... 50
4. RESULT AND DISCUSSIONS ....................................................................................................... 51
4.1 Selection of optimal extraction solvent ................................................................................... 51
4.2 Selection of the optimal gradient system ..................................................................................... 51
4.3 Procedure for addition of internal standard ................................................................................. 54
4.3.1 Optimisation of the internal standard ................................................................................... 54
4.4 Modelling the RF as a function of 5-HT and 5-HIAA and their internal standards (5-CH3o-HT
and d2-5-HIAA respectively). ............................................................................................................ 56
4.5 Validation and analytical assessment .......................................................................................... 64
4.6 Method application on plasma samples from a research study ................................................... 66
4.7 Concluding remarks .................................................................................................................... 67
REFERENCES ...................................................................................................................................... 69
v
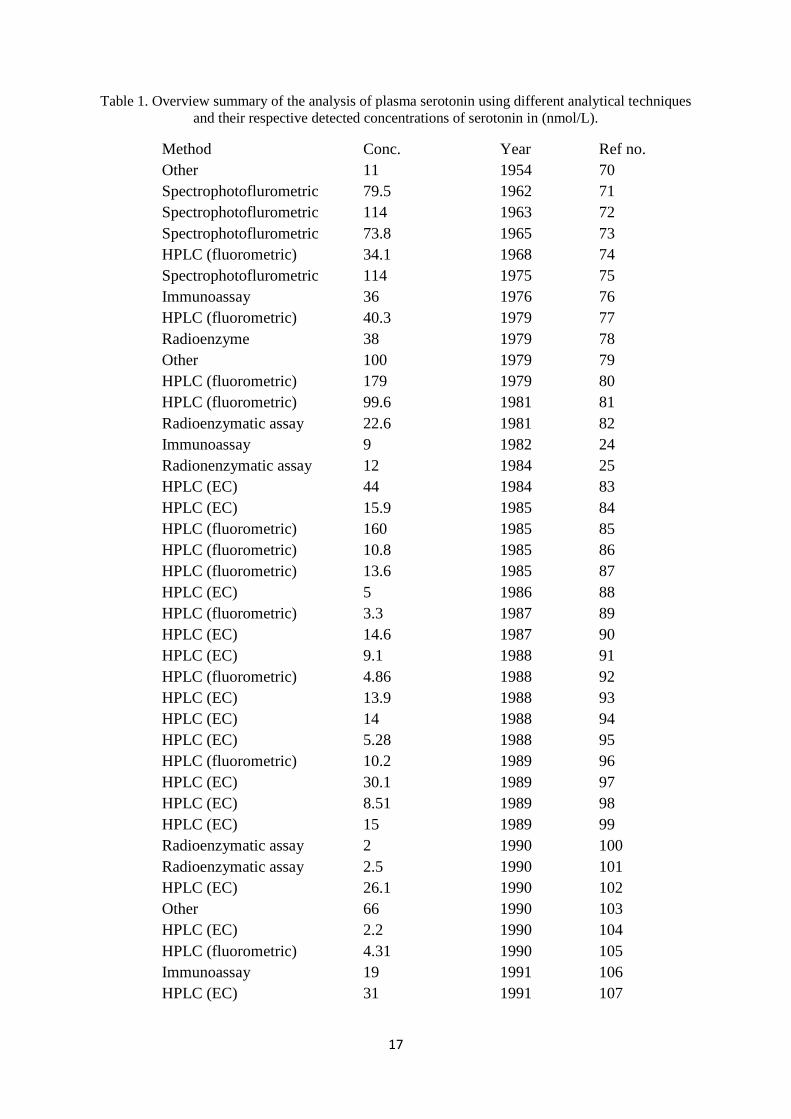
LIST OF TABLES Table 1. Overview summary of the analysis of plasma serotonin using different analytical techniques
and their respective detected concentrations of serotonin in (nmol/L).................................................. 17
Table 2. Concentration of serotonin and 5-hydroxyindole-acetic acid and their respective internal
standards in the plasma at each experimental point in the two-factor Doehlert design ........................ 46
Table 3. Gradients programme of the mobile phase (eluent). ............................................................... 53
Table 4. Summary of RFs for the analytes (5-HT and 5-HIAA) at each experimental points expressed
as mean±standard deviation .................................................................................................................. 55
Table 5. Plasma concentration of serotonin and its acid metabolite in plasma samples from 10
vegetarian patients. ................................................................................................................................ 67
LIST OF FIGURES Figure 1. Interconnection between norepinephrine, dopamine and serotonin (monoamine
neurotrasmitters). ..................................................................................................................................... 2
Figure 2. The raphe nuclei (where serotonin is active) represents the major nuclei with both ascending
and descending serotonergic fibers projecting to the forebrain and the descending fibers that extend to
the medulla and spinal cord. .................................................................................................................... 4
Figure 3. Connection between serotonin receptors and the serotonin neuron. ........................................ 5
Figure 4. Connection between serotonin transporter and serotonin neuron. ........................................... 6
Figure 5. The metabolic pathway of tryptophan metabolism to serotonin (5-HT) and subsequently to 5-
hydroxyindole-acetic acid (5-HIAA). [13]. ........................................................................................... 10
Figure 6. Biosynthetic and degradative routes in the metabolism of serotonin. .................................... 12
Figure 7. Schematic of tandem mass spectrometry ............................................................................... 21
Figure 8. Set up of a reverse phase HPLC system showing the pump, injection port, column, detector
and a read out (display) system. ............................................................................................................ 24
Figure 9. Spatial distribution of experimental points in a two-factor Doehlert uniform shell design,
[62] ........................................................................................................................................................ 28
Figure 10. Graphical illustration of linearity, measuring range, limit of detection, limit of quantitation,
and sensitivity [68]. ............................................................................................................................... 36
Figure11. A chart of the solvent composition trials. ............................................................................. 38
Figure 12 (A-J). Trials during the selection of gradient condition and other instrumental parameters. 44
Figure 13. Two-factor Doehlert design showing the coded and natural levels of the analytes and
internal standard at each experimental point. ........................................................................................ 46
Figure 14. Flow chart of sample preparation protocol. ......................................................................... 48
Figure 15. The chromatograms of the different gradient conditions ..................................................... 52
Figure 16. The chromatogram of the best gradient condition showing reproducible retention times of
the analytes. ........................................................................................................................................... 53
Figure 17. The chromatogram of large injection volume. ..................................................................... 53
Figure 18. Overlap chromatogram of the two procedures for adding internal standard using two
different concentrations (A=25µg/mL, B=30 µg/mL). ......................................................................... 54
Figure 19. A. Modelling of the response factor as a function 5-HIAA and d2-5-HIAA, B. Modelling of
the response factor as a function 5-HT and 5-CH3o-HT ....................................................................... 57
Figure 20. Chromatogram of 5-HT (A) and its mass spectrum (B). ..................................................... 59
Figure 21. Chromatogram of 5-CH3o-HT (A) and its mass spectrum (B). ........................................... 60

vi
Figure 22. Chromatogram of 5-HIAA (A) and its mass spectrum (B). ................................................. 61
Figure 23. Chromatogram of d25-HIAA (A) and its mass spectrum (B). .............................................. 62
Figure 24. A. Overlay chromatogram of 5-HT and its internal standard, showing their fragment
masses. B. Overlay chromatogram of 5-HIAA and its internal standard, showing their fragment
masses. ................................................................................................................................................... 63
Figure 25. A. Linear regression graph of the signal of the ratio 5-HIAA and d2-5HIAA against the
concentrations.B. Linear regression graph of the signal of the ratio 5-HT and 5-CH3o-HT against the
concentrations. ....................................................................................................................................... 65
ABBREVIATIONS
AADC: Aromatic-L-amino acid decarboxylase
ACN: Acetonitrile
ADH: Aldehyde dehydrogenase
Alc DH: Alcohol dehydrogenase
Ald DH: Aldehyde dehydrogenase
CAD: Coronary artery disease
CNS: Central Nervous system
CT: Column temperature
CV: Coefficient of variance
DOE: Design of experiments
EC: European commission
ED: Electrochemical detection
EDTA: Ethylenediaminetetraacetic acid
ESI: Electrospray ionisation
FPD: Flame photometry detection
FR: Flow rate
FWHM: Full width at half maximum
GC-MS: Gas chromatography mass spectrometry
GIT: Gastrointestinal tract
HIOMT: Hydroxyindole-O-methyl transferase
HPLC: High performance liquid chromatography
5-CH3o-HT: 5-methoxytryptamine
d2-5-HIAA: 5-hydroxyindole-3-acetic-2,2-d2 acid
vii
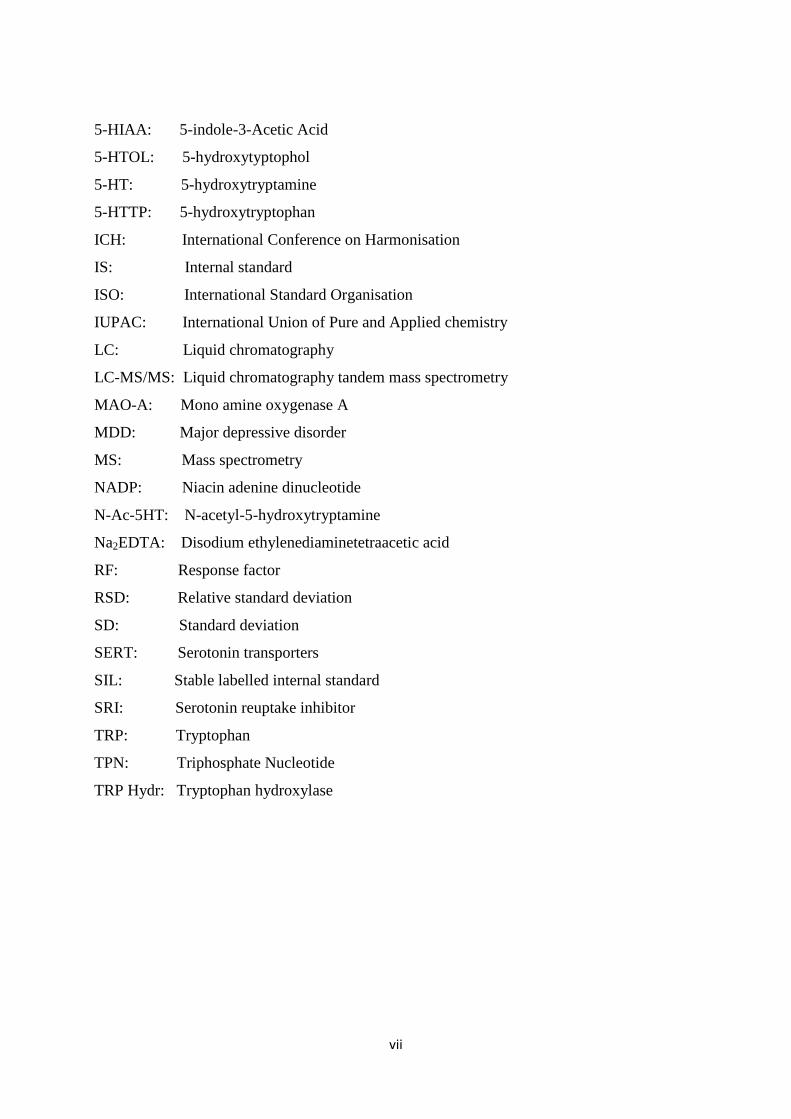
5-HIAA: 5-indole-3-Acetic Acid
5-HTOL: 5-hydroxytyptophol
5-HT: 5-hydroxytryptamine
5-HTTP: 5-hydroxytryptophan
ICH: International Conference on Harmonisation
IS: Internal standard
ISO: International Standard Organisation
IUPAC: International Union of Pure and Applied chemistry
LC: Liquid chromatography
LC-MS/MS: Liquid chromatography tandem mass spectrometry
MAO-A: Mono amine oxygenase A
MDD: Major depressive disorder
MS: Mass spectrometry
NADP: Niacin adenine dinucleotide
N-Ac-5HT: N-acetyl-5-hydroxytryptamine
Na2EDTA: Disodium ethylenediaminetetraacetic acid
RF: Response factor
RSD: Relative standard deviation
SD: Standard deviation
SERT: Serotonin transporters
SIL: Stable labelled internal standard
SRI: Serotonin reuptake inhibitor
TRP: Tryptophan
TPN: Triphosphate Nucleotide
TRP Hydr: Tryptophan hydroxylase
viii
ABSTRACT
5-Hydroxytryptamine (5-HT) also known as serotonin is a biomarker in gastrointestinal
disorder and several other pathological diseases where 5-HT and its metabolite 5-
hydroxyindole-acetic acid (5-HIAA) are implicated. A sensitive and precise method has been
developed and validated for the determination of serotonin and 5-hydroxyindole-acetic acid in
human plasma. The method involves a simple protein precipitation step requiring no further
downstream sample preparation. The method was developed using a Zorbax Eclipse-C8 RP
(150mm × 4.6mm, 5µm) column (Agilent Technologies, Palo Alto, CA, USA). The column
temperature was kept at 20°C and the solvent in gradient mode consisted of water with 0.1%
formic acid (v/v) (B), acetonitrile with 0.1% formic acid (v/v) (C) and ethanol (D) and a UV
detector at 254nm and the flow rate was maintained at 0.2mL/min. Linearity of the method
was studied over the range of 0.5-50µg/mL. The correlation coefficient was r2
= 0.9823 for
serotonin and r2
= 0.9892 for 5-hydroxyindole-acetic acid which indicates strong correlation
between the studied concentration of the analytes and the signal. The precision of the method
for 5-HT and 5-HIAA were achieved based on repeatability with RSD of 3.07-7.73% and
3.93-9.99% respectively. The percentage recoveries were 83-119% and 84-116% for 5-HT
and 5-HIAA respectively, which shows good accuracy of the developed method. The limit of
detection and limit of quantification were 0.5µg/mL and 1µg/mL respectively suggesting
good sensitivity of the method. The developed method was applied in the analysis of human
plasma samples from a project related to the determination of serotonin and its metabolite in
plasma from pathological patients subjected to a diet rich in vegetables.

1
1. INTRODUCTION
1.1 Biology of serotonin
Neurotransmitters are chemicals that allow signal transmission, and thus communication
among the nerve cells (neurons). One of the neurotransmitters used by neurons throughout the
brain is 5-hydroxytryptamine also known as serotonin (5-HT). Serotonin is produced in and
released from neurons that originate within discrete regions in the brain. Serotonin was
originally discovered by Italian Vittorio Erspamer in Rome in 1935 [1] and American
scientists, Maurice M. Rapport, Arda Green, and Irvine Page of the Cleveland Clinic isolated
and named in 1948 [2]. The name ''serotonin'' is often referred to as a misnomer and reflects
the circumstances of the compound's discovery [3]. It was initially identified as a
vasoconstrictor substance in blood serum – hence ''serotonin'', a serum agent affecting
vascular tone. This agent was later chemically identified as 5-hydroxytryptamine [2] and, as
the broad range of physiological roles were elucidated, 5-HT became the most widely used
and preferred name in the pharmacological field. Serotonin is a central and a peripheral
neurotransmitter. It is biochemically synthesized from the amino acid tryptophan and it plays
a great role in regulating various physiological functions such as sleep, hemostasis, and
behavior regulation; in pathological conditions such as carcinoid syndrome, hypertension,
thrombosis, and in cardiovascular diseases as well as psychiatric and neurological disorders
such as schizophrenia, Huntington’s disease, including many others [4, 5]. Serotonin is
widespread in nature and can be found in foods, nuts, and animals.

2
It is synthesized in the serotonergic neurons in the central nervous system and in the
enterochromaffin cells of the gut constitutes 80% of total production and storage and it is
subsequently released when triggered by different stimuli [6] such as chemical and electrical
synapses between taste cells and synapses and from taste cells to sensory afferent fibers.
Serotonin is generally interconnected to norepinephrine and dopamine (Fig.1). The three
compounds are monoamine neurotransmitters. While serotonin is involved in cognitive
impulses, relaxation as shown in the blue ring (Fig. 1), norepinephrine is involved in
socialization, concentration etc, whereas dopamine is involved in behaviour, cognitive and
voluntary movements. The three compounds are necessary for mind and emotional stability.
Figure 1. Interconnection between norepinephrine, dopamine and serotonin (monoamine
neurotrasmitters).
(Source: http://www.horses-helping-troubled-teens.com/teen-depression.html)

3
Early detection of carcinoid tumour in the small intestine is diagnosed by measuring blood
serotonin and 5-hydroxyindole-acetic acid (5-HIAA) secreted by the enterochromaffin cells
[7]. Following the release of 5-HT, it is rapidly sequestered by platelets or otherwise
metabolised by the liver or kidney to 5-HIAA by the catalytic action of the mitochondrial
flavoprotein monoamine oxygenase (EC 1.4.3.4) and aldehyde dehydrogenase (EC 1.2.1.3).
The 5-HIAA is a major metabolite of serotonin and it is often eliminated in urine; this will be
highlighted in the course of the present research thesis. Serotonin is associated with coronary
artery disease (CAD), [8]. Age has a defining trend in risk factor on most endogenous
biological molecules such as cholesterol and homocysteine, these risk factors are often in
increased levels in advancing age [9, 10], but serotonin seems to be inversely related to age,
having higher levels in younger age groups in which it has a significant relationship with
acute cardiac invents [8]. Serotonin is often tightly bound to protein and thus very small free
serotonin concentrations can be found in the plasma [11, 12].
4
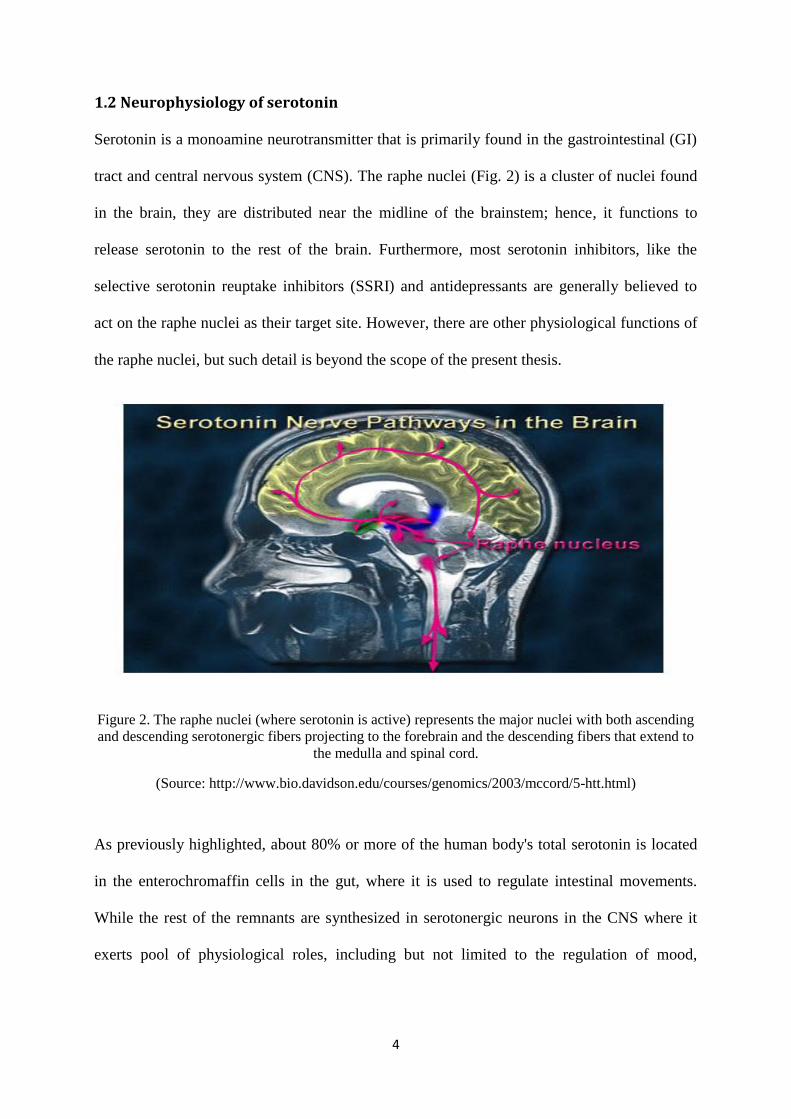
1.2 Neurophysiology of serotonin
Serotonin is a monoamine neurotransmitter that is primarily found in the gastrointestinal (GI)
tract and central nervous system (CNS). The raphe nuclei (Fig. 2) is a cluster of nuclei found
in the brain, they are distributed near the midline of the brainstem; hence, it functions to
release serotonin to the rest of the brain. Furthermore, most serotonin inhibitors, like the
selective serotonin reuptake inhibitors (SSRI) and antidepressants are generally believed to
act on the raphe nuclei as their target site. However, there are other physiological functions of
the raphe nuclei, but such detail is beyond the scope of the present thesis.
Figure 2. The raphe nuclei (where serotonin is active) represents the major nuclei with both ascending
and descending serotonergic fibers projecting to the forebrain and the descending fibers that extend to
the medulla and spinal cord.
(Source: http://www.bio.davidson.edu/courses/genomics/2003/mccord/5-htt.html)
As previously highlighted, about 80% or more of the human body's total serotonin is located
in the enterochromaffin cells in the gut, where it is used to regulate intestinal movements.
While the rest of the remnants are synthesized in serotonergic neurons in the CNS where it
exerts pool of physiological roles, including but not limited to the regulation of mood,

5
appetite, sleep, muscle contraction, and some cognitive functions as well as memory and
learning; and in blood platelets where it helps to control hemostasis and blood clotting.
The connection between serotonin receptors and the serotonin neuron (Fig. 3) defines its
storage site in nerve terminal. Serotonin is stored in small vesicles within the nerve terminal
of a neuron, the pink colored image in Fig. 3. Electrical impulses arising in the raphe nucleus
traveling down the axon toward the terminal causes the release of serotonin from small
vesicles into the synaptic space. Once in the synaptic space, the serotonin binds to special
proteins, called serotonin receptors, on the membrane of a neighboring neuron. When
serotonin binds to serotonin receptors
Figure 3. Connection between serotonin receptors and the serotonin neuron. (Source:http://psychminded.wordpress.com/2011/10/10/and-i-guess-thats-why-they-call-it-the-blues/)
it causes a change in the electrical properties of the receiving neuron that generally results in a
decrease in its activity rate.
6
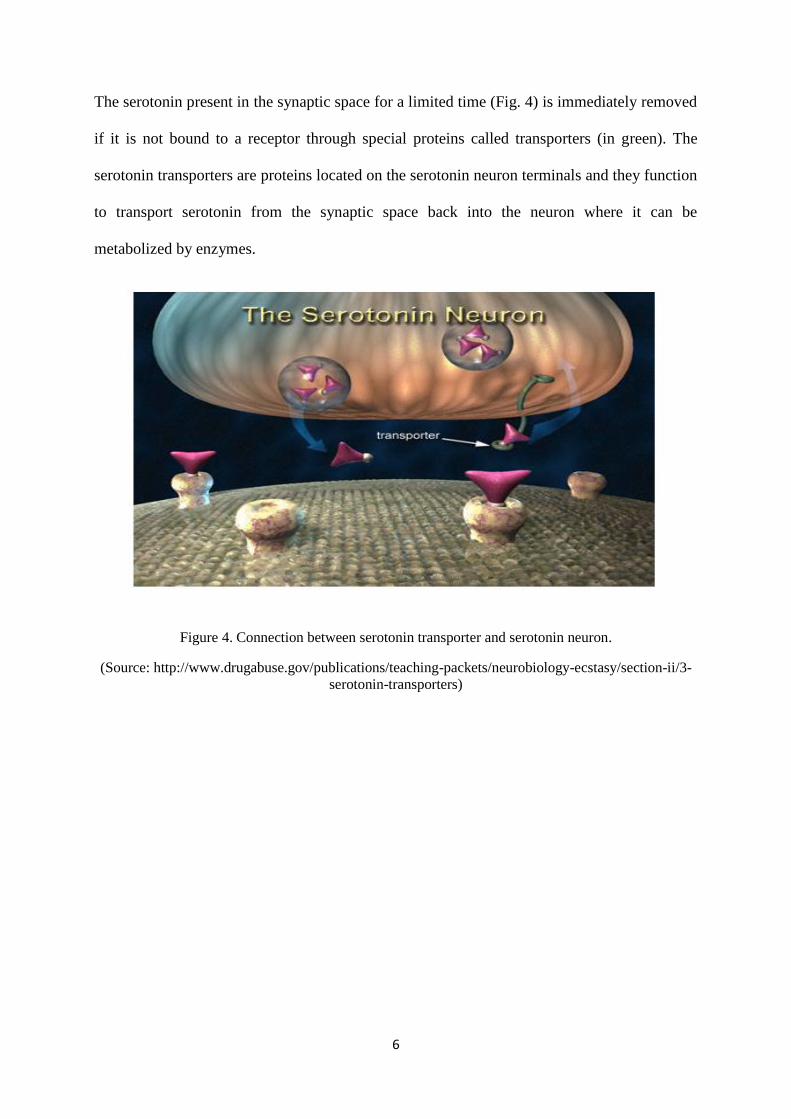
The serotonin present in the synaptic space for a limited time (Fig. 4) is immediately removed
if it is not bound to a receptor through special proteins called transporters (in green). The
serotonin transporters are proteins located on the serotonin neuron terminals and they function
to transport serotonin from the synaptic space back into the neuron where it can be
metabolized by enzymes.
Figure 4. Connection between serotonin transporter and serotonin neuron.
(Source: http://www.drugabuse.gov/publications/teaching-packets/neurobiology-ecstasy/section-ii/3-
serotonin-transporters)
7
1.3 Project scope
Development and validation of a novel method for the determination of serotonin and 5-
hydroxyindole-acetic acid (5-HIAA) in human plasma using liquid chromatography tandem
mass spectrometry (LC-MS/MS).
1.3.1 Project significance
The National Institute of Nutrition and Seafood Research (NIFES) has been involved in
different human trials where the potential modulation of serotonin through diets and its
determination in plasma has been proposed as key components to understand the functional
role of serotonin in mental and physical health.
Therefore, NIFES is in urgent need of a reliable method for the analysis of serotonin (5-HT)
and its 5-hydroxyindole-acetic acid metabolite (5-HIAA) in plasma samples. Unfortunately,
there is a scarcity of published methods for the determination of 5-HT and 5-HIAA in plasma
using LC-MS/MS. The main focus of the related literature has been on the analysis of 5-HT
and 5-HIAA in urine. Whereas serotonin is more evident to emotional related routine
measurements; 5-HIAA is more often measured in the assessment of carcinoid tumours.
Consequently, it is important to develop a novel and robust method for the determination of 5-
HT and 5-HIAA that can assist NIFES in the analysis of a high volume of plasma samples
from various nutritional research projects. The new method will be optimised and validated
and could become part of NIFES battery of nationally accredited analytical methods.
.
8
1.3.2 Project brief at the onset
Serotonin is synthesized from the amino acid tryptophan. Tryptophan undergoes a
hydroxylation reaction to form 5-hydroxy tryptophan (this reaction is catalysed by the enzyme
tryptophan hydroxylase). 5-hydroxy tryptophan undergoes a decarboxylation reaction
(catalysed by amino acid decarboxylase) to form serotonin in one of the fate of tryptophan’s
metabolic pathways. Serotonin subsequently undergoes oxidative deamination followed by
concomitant oxidation to form 5-hydroxyindole-acetic acid (5-HIAA), which is the
predominant metabolite in urine. Hence, this metabolite is mainly analysed and studied in
urine. Therefore, the need for a robust and rapid method using liquid chromatography coupled
to tandem mass spectrometry in the determination of the parent compound, 5-
hydroxytryptamine and its acid metabolite in human plasma.
1.3.3 Objectives of the study
To develop a novel and rapid method for extracting serotonin and 5-hydroxyindole-
acetic acid from human plasma and further quantification by using liquid
chromatography tandem mass spectrometry (LC-MS/MS).
To optimise and validate the developed method.
To apply the novel method in the analysis of plasma samples from nutritional
intervention studies.
9
1.4 Biosynthesis of serotonin
Serotonin is derived from the amino acid tryptophan. The metabolic pathway through which
tryptophan is converted to serotonin is outlined in Fig. 5. The first step involves hydroxylation
of tryptophan to form 5-hydroxytryptophan, 5-HTP. The reaction requires oxygen and it is
catalysed by a hydroxylase, which is dependent upon the presence of the reduced form of
coenzyme, niacin adenine dinucleotide phosphate (NADP) also known as triphospyridine
nucleotide (TPN). In the next step of the biosynthetic pathway, the hydroxylated tryptophan
(5-HTP) undergoes a decarboxylation reaction to yield 5-hydroxytryptamine (serotonin), this
decarboxylation reaction is catalysed by a decarboxylase enzyme (aromatic amino acid
decarboxylase) also known to be involved in the decarboxylation of other amino acids such
as tyrosine to form tryramine or of 3-4-dihydrophenylalanine to form dihydrophenylalanine,
an intermediate precursor of norepinephrine and subsequently epinephrine, another member
of monoamine neurotransmitter and neuromodulator. The decarboxylase enzyme requires a
pyridoxal phospahate (vitamin B6) as a cofactor. This route of production of serotonin from
tryptophan is thus one of the minor fates of the ubiquitous routes of tryptophan metabolism;
consequently about one percent of tryptophan takes this pathway.

10
On the contrary, the major route of tryptophan metabolism proceeds through the kynurenine,
hydroxyanthanilic acid, and quinolinic acid and to nicotinic acid, a very important end
product of tryptophan metabolism proved by isotopic studies which revealed that the nitrogen
of the indole ring of pyridine ring of the tryptophan is retained as the nitrogen of the pyridine
ring of nicotinic acids [13].
Figure 5. The metabolic pathway of tryptophan metabolism to serotonin (5-HT) and subsequently to 5-
hydroxyindole-acetic acid (5-HIAA), [13].
In many animals, the conversion of tryptophan to nicotinic acid renders the supply of vitamin
in the diet unnecessary as long as protein containing tryptophan is ingested. In other mammals
such as rat, rabbit, dog and pig for instance tryptophan can replace completely the vitamin in
the diet. In humans, about 60 mg of tryptophan produces 1 mg of nicotinic acid, thus this
implies that the nutritional deficiency of nicotinic acid that often occurs in pellagra must be
considered a protein and vitamin (tryptophan and nicotinic acid) deficiency respectively [13].
11
Biochemically, it may be necessary to observe that carcinoid produces abnormality of
tryptophan metabolism in which as much as 60 %, other than the normal 1 %, of tryptophan
may follow the serotonergic pathway. In addition to the production of the excess amines, the
switch in the metabolism shuts adequate production of nicotinic acid which would lead to
nitrogen imbalance and subsequently nicotinic acid deficiency.
Furthermore, the majority of serotonin produced in the tissues is further metabolized via
oxidative deamination to form 5-hydroxyindole-acetic acid (5-HIAA). The series of this event
involves the serotonin produced from L-tryptophan subsequently undergoing oxidative
deamination followed by concomitant oxidation and conjugation in the liver, lungs and
thrombocytes catalysed by monoamine oxygenase A (MAO-A) and aldehyde dehydrogenase
(ADH) to form 5-HIAA, which is the predominant metabolite in urine. Hence, this metabolite
is mainly analysed and studied in urine. Consequently the pertinent of a robust and rapid
method using the tandem mass spectrometric technique that can simultaneously determine the
parent compound, serotonin and its metabolite, 5-HIAA in human plasma. A comprehensive
biosynthetic and degradative pathway of serotonin metabolism is shown in Fig. 6.
12
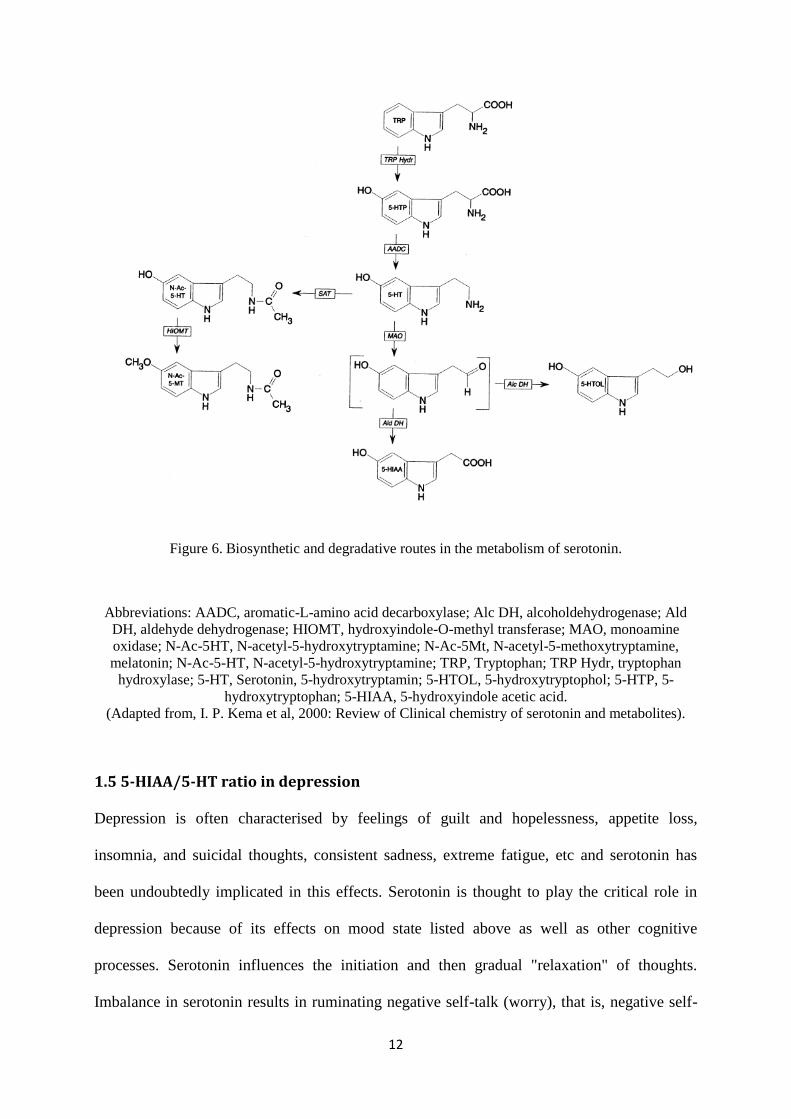
Figure 6. Biosynthetic and degradative routes in the metabolism of serotonin.
Abbreviations: AADC, aromatic-L-amino acid decarboxylase; Alc DH, alcoholdehydrogenase; Ald
DH, aldehyde dehydrogenase; HIOMT, hydroxyindole-O-methyl transferase; MAO, monoamine
oxidase; N-Ac-5HT, N-acetyl-5-hydroxytryptamine; N-Ac-5Mt, N-acetyl-5-methoxytryptamine,
melatonin; N-Ac-5-HT, N-acetyl-5-hydroxytryptamine; TRP, Tryptophan; TRP Hydr, tryptophan
hydroxylase; 5-HT, Serotonin, 5-hydroxytryptamin; 5-HTOL, 5-hydroxytryptophol; 5-HTP, 5-
hydroxytryptophan; 5-HIAA, 5-hydroxyindole acetic acid.
(Adapted from, I. P. Kema et al, 2000: Review of Clinical chemistry of serotonin and metabolites).
1.5 5-HIAA/5-HT ratio in depression
Depression is often characterised by feelings of guilt and hopelessness, appetite loss,
insomnia, and suicidal thoughts, consistent sadness, extreme fatigue, etc and serotonin has
been undoubtedly implicated in this effects. Serotonin is thought to play the critical role in
depression because of its effects on mood state listed above as well as other cognitive
processes. Serotonin influences the initiation and then gradual "relaxation" of thoughts.
Imbalance in serotonin results in ruminating negative self-talk (worry), that is, negative self-

13
talk thoughts that keep reoccurring and will not go away, this constitutes a major problem in
depression. Most of the antidepressants exact their effects by inhibiting serotonin reuptake
(SRI's). During serotonergic neurotransmission, serotonin is released into the synaptic cleft
(junction between two neurons), Fig. 4. After exerting its action in the postsynaptic neuron,
part of the serotonin is transported again into the presynaptic neuron by specific transporters
(SERT). Once again in the presynaptic neuron, part of this serotonin is incorporated again into
vesicles (Fig. 3) and part is metabolized by the monoamine oxidase (MAO) and other
enzymes to form 5-HIAA. In summary, when the serotonergic activity is high, more serotonin
is released in the synapses, and consequently, metabolized to 5-HIAA. Therefore, the 5-
HIAA/5-HT ratio would be higher. In addition, metabolism of certain body molecules means
that there is both anabolism (syntheses, in this case from L-tryptophan to 5-HT) and
catabolism (from 5-HT to 5-HIAA) of that molecule. It is possible to assume on the basis of
5-HIAA levels that only the impairments in catabolism step, from 5-HT to 5-HIAA
(impairments in MAO or aldehyde dehydrogenase activity) and not in the syntheses step.
Serotonin turnover has been reported to be indeed related to stress, and it is known that
chronic stress may lead to depression. In different animal models it is known that stress
induce an increase in serotonergic turnover, but often also in dopaminergic and noradrenergic
turnover [14]. These alterations are transient if the stress is acute (for example a persecution
by a predator). If the stress becomes chronic (for example, cohabitation with a dominant
specimen), important and long-lasting changes in the monoaminergic systems could occur.
Also, chronically stressed animals may present symptoms similar to those observed
in Major Depressive Disorder, (MDD) patients [14]. The 5-HIAA/5-HT ratio could be useful
for different purposes. One of them is its use as an estimator of the serotonergic activity (for
example, a group of acutely stressed rats is expected to have a higher 5-HIAA/5-HT ratio than
control rats, due to their higher serotonergic turnover).
14
Furthermore, as pointed earlier the biosynthesis of serotonin in humans represents only a
minor route for tryptophan and in normal conditions this accounts for less than 2% of ingested
tryptophan, the major part of tryptophan is utilized in protein synthesis and catabolism
proceeds to give kynurenine and 3-hdroxyanthranilic acid [15,16]. Serotonin synthesis in
brain is controlled by mechanisms that activate or inhibit tryptophan hydroxylase (the rate
limiting enzyme in the 5-HT biosynthetic route). Calcium-induced phosphorylation renders
the enzyme inactive, while an intra-neuronal serotonin pool inhibits it through negative
feedback mechanism. Irregular variation in tetrahydrobiopterin concentrations could also be
involved in the regulation of tryptophan hydroxylation roles and actions [17].
Serotonin and 5-HIAA are mainly excreted in free forms whereas the minor catabolic product
of serotonin; 5-hydroxytryptophol is predominantly excreted as a conjugate. As a potent
vasoactive amine, serotonin in circulation is almost completely confined to platelets [12] and
thus functionally rendered inactive.
Elevated plasma serotonin are hazardous, many rapid elimination mechanisms have evolved
to clear excess 5-HT. Platelets possess an active serotonin reuptake system [18], the liver
catabolises serotonin, pulmonary endothelial cells take up serotonin while some
macromolecules binds free serotonin. Liver is also involved in the clearance of excess
serotonin in the plasma with subsequent formation of 5-HIAA.
1.6 Stability of serotonin
Serotonin is well known to be an unstable compound, it degrades almost completely if not
properly and carefully treated. For example 5-HT decomposes at high temperature and at
acidic pH, but at pH 6 it is stable up to 35°C [19]. Serotonin can be preserved in EDTA
because the compound chelates metal ion thus prevents decomposition. In a broader sense, the
instability of serotonin can be circumvented by employing several pre-analytical
15
considerations such as immediate refrigeration after sample collection, avoidance of repeated
thawing and freezing, acidification (pH>2), and addition of antioxidants such as ascorbic acid,
perchloric acid, sodium metabisulfite, L-cysteine, EDTA etc.
It has been reported that the stability of serotonin and 5-HIAA is poor in acidic medium that
only contain Na2EDTA [19]. Markedly improvement can be noticed with the addition of L-
cysteine and ascorbic acid. It had been observed that the ability of Na2EDTA to complex
metal ions diminishes at pH below 5 and the strength of ascorbic acid to act as antioxidant
diminishes at lower pH, since the protonation reduces its ability to become oxidized.
16
2. THEORETICAL BACKGROUND
2.1 Analysis of serotonin by chromatography
There has been an increased interest in serotonin chemistry. This interest could be attributed
to the increased availability of HPLC methods for research and routine studies. A
considerable number of articles published in the mid-80s employed this technique with
different detections in the study of serotonin in biological matrices. Analyses of serotonin and
its major metabolite, 5-hydroxyindole-acetic acid (5-HIAA) are indispensable for the study of
their pathophysiological roles. While serotonin is more evident to emotional related routine
measurements, its metabolite, 5-HIAA is more often measured in the assessment of carcinoid
tumours. Compared to other biogenic amines such as catecholamines and histamine, serotonin
can be said to be recently discovered. Studies have elucidated its main function significance in
recent years.
The presence of serotonin in tissues is still a subject of investigation [20] and such
investigation will not have been possible without the development of accurate, reliable,
precise, and sensitive methods for the analyses of serotonin and its metabolites in biological
fluids. Several analytical methods have been applied in quantitative and qualitative
determination of serotonin in various derivatives of blood. An overview (Table 1) of the
different methods for the analysis of serotonin in human plasma revealed that 33.3% of the
reported articles used HPLC with fluorometric detection, 40.4% electrochemical detection,
10.1% employed radioimmunoassay techniques, while only 1.01% used gas chromatography
and 6.06% used other types of assays such as electrochemical sensors and biosensor based
techniques. It is evident from (Table 1) that electrochemical detection is the most popular
method for serotonin analysis in plasma [21, 22].
17
Table 1. Overview summary of the analysis of plasma serotonin using different analytical techniques
and their respective detected concentrations of serotonin in (nmol/L).
Method Conc. Year Ref no.
Other 11 1954 70
Spectrophotoflurometric 79.5 1962 71
Spectrophotoflurometric 114 1963 72
Spectrophotoflurometric 73.8 1965 73
HPLC (fluorometric) 34.1 1968 74
Spectrophotoflurometric 114 1975 75
Immunoassay 36 1976 76
HPLC (fluorometric) 40.3 1979 77
Radioenzyme 38 1979 78
Other 100 1979 79
HPLC (fluorometric) 179 1979 80
HPLC (fluorometric) 99.6 1981 81
Radioenzymatic assay 22.6 1981 82
Immunoassay 9 1982 24
Radionenzymatic assay 12 1984 25
HPLC (EC) 44 1984 83
HPLC (EC) 15.9 1985 84
HPLC (fluorometric) 160 1985 85
HPLC (fluorometric) 10.8 1985 86
HPLC (fluorometric) 13.6 1985 87
HPLC (EC) 5 1986 88
HPLC (fluorometric) 3.3 1987 89
HPLC (EC) 14.6 1987 90
HPLC (EC) 9.1 1988 91
HPLC (fluorometric) 4.86 1988 92
HPLC (EC) 13.9 1988 93
HPLC (EC) 14 1988 94
HPLC (EC) 5.28 1988 95
HPLC (fluorometric) 10.2 1989 96
HPLC (EC) 30.1 1989 97
HPLC (EC) 8.51 1989 98
HPLC (EC) 15 1989 99
Radioenzymatic assay 2 1990 100
Radioenzymatic assay 2.5 1990 101
HPLC (EC) 26.1 1990 102
Other 66 1990 103
HPLC (EC) 2.2 1990 104
HPLC (fluorometric) 4.31 1990 105
Immunoassay 19 1991 106
HPLC (EC) 31 1991 107

18
HPLC (EC) 141 1992 108
HPLC (fluorometric) 28 1992 109
Radioenzymatic assay 2.8 1992 110
HPLC (fluorometric) 17 1992 111
HPLC (EC) 119 1992 21
Radioenzymatic assay 2.6 1993 112
HPLC (EC) 6.7 1993 113
HPLC (fluorometric) 18.5 1993 114
GC-MS 0.77 1993 115
HPLC (EC) 94.3 1993 116
HPLC (EC) 2.8 1993 117
Radioenzymatic assay 3.4 1994 118
HPLC (fluorometric) 39.7 1994 119
HPLC (fluorometric) 61 1995 120
Radioenzymatic assay 1.05 1995 121
Radioenzymatic assay 0.6 1995 122
Other 9.08 1995 123
Other 14.2 1995 124
HPLC (EC) 14 1996 125
HPLC (fluorometric) 15.5 1997 126
HPLC (fluorometric) 3.5 1998 127
HPLC (EC) 16.85 1998 128
HPLC (EC) 14.6 1998 129
HPLC (EC) 39.6 1998 130
HPLC (EC) 10.8 1999 131
Spectrophometry 54.2 1999 132
HPLC (EC) 161 1999 133
Radioenzymatic assay 9.6 2000 134
HPLC (EC) 11 2000 135
HPLC (fluorometric) 16.9 2000 136
HPLC (EC) 3.52 2000 137
HPLC (fluorometric) 32.9 2000 138
HPLC (EC) 32.3 2003 139
HPLC (EC) 3.73 2003 140
HPLC (fluorometric) 25.5 2003 141
HPLC (fluorometric) 5.7 2004 142
HPLC (fluorometric) 6 2004 143
HPLC (EC) 42.6 2004 144
HPLC (EC) 26 2004 145
HPLC (EC) 9.8 2004 146
Immunoassay 2.6 2004 147
HPLC (fluorometric) 1.8 2005 148
HPLC (EC) 33 2005 149
HPLC (EC) 15 2005 150

19
HPLC (fluorometric) 13.1 2006 151
HPLC (fluorometric) 21.3 2006 152
HPLC (EC) 33.5 2006 153
HPLC (EC) 90.8 2006 154
Immunoassay 50 2006 155
Immunoassay 10 2007 156
Other 10.1 2007 157
HPLC (EC) 90 2007 158
HPLC (EC) 63.1 2007 159
HPLC (fluorometric) 10.2 2007 160
HPLC (fluorometric) 12.7 2007 161
Immunoassay 40 2008 162
Immunoassay 0.63 2008 163
HPLC (EC) 44 2009 164
Immunoassay 12.3 2010 165
LC-MS/MS 4.6 2010 53
However, fluorometric methods for serotonin determination are not specific and are preceded
by poor separations from interfering compounds (poor selectivity), while radio-isotopic
method are outrageously expensive to be employed in routine analysis. Thin layer
chromatography [23], radio immunoassay [24, 25], enzyme immunoassay [26], gas
chromatography mass spectrometry [27-31], HPLC with UV [32], electrochemical detection
(EC), [33], and mass spectrometry [34] all have been employed in the determination of
serotonin and consequently other related indoles and biogenic amines in biological fluids.
Although different kinds of detectors have been applied in conjunction with the HPLC, EC
detectors are the most popular [35-38]. Notwithstanding the popularity of HPLC with EC
detectors, liquid chromatography mass spectrometry either single or tandem have been
successfully employed in the determination of 5-HT in a wide range of biological fluids or
tissues [39-48].
In addition, the use of Liquid chromatography tandem mass spectrometry (LC-MS/MS) for
determining serotonin in other body fluids are widely reported but to the best of our

20
knowledge there are few reported validated method using the LC-MS/MS technique in
determination of serotonin in plasma. Liquid chromatography tandem mass spectrometry has
a wide application in the analyses and quantification of biological fluids; its robust nature
cannot be over emphasized [49]. LC-MS has evolved into a technique characterized by
sensitivity, selectivity, and specificity, allowing for the analysis of trace amounts of target
analytes in complex mixtures such as biological fluids. LC-MS either tandem or single has
been applied in determination of serotonin in wide variety of biological samples such as gut
lavage fluid [50], tissues [39], plasma, whole blood [41], serum [49] urine [51, 52], brain and
cell cultures including many others. Furthermore, it has been reported that the use of LC-
MS/MS in the analysis of serotonin offers merits in relation to specificity and linear range, as
well as permitting for simultaneous determination of its metabolites [41]. There are a number
of clinical applications of LC-MS, the technique is more generally applicable than gas
chromatography mass spectrometry (GC-MS); this is due to the broader range of biological
molecules that can be analysed and more powerful use of LC separations in clinical
laboratories. This trend of preferring LC-MS over LC with conventional detectors could be
traced to the high specificity and its ability to handle complex mixtures.
Moreover, it is generally supposed that the highly specific nature of LC-MS/MS allows the
use of short chromatographic run time, minimal sample clean-up and devoid of derivatisation
which is often the case with GC. However, as the demand continues to grow for the analyses
of drugs in body fluids, the most common preferred chromatographic technique is gas
chromatography; it permits efficient separation with sensitive detection of the analytes in
complex matrices.
21
2.2 Mass spectrometry and chromatography
Mass spectrometry (MS) is an analytical technique that produces spectra of the masses of the
atoms or molecules of a sample. The spectra are employed to determine the elemental
or isotopic identity and composition of a sample, the masses of particles and of molecules,
and to elucidate the chemical structures of molecules, such as serotonin [53] and wide variety
of chemical compounds. An MS works by ionizing chemical compounds to generate charged
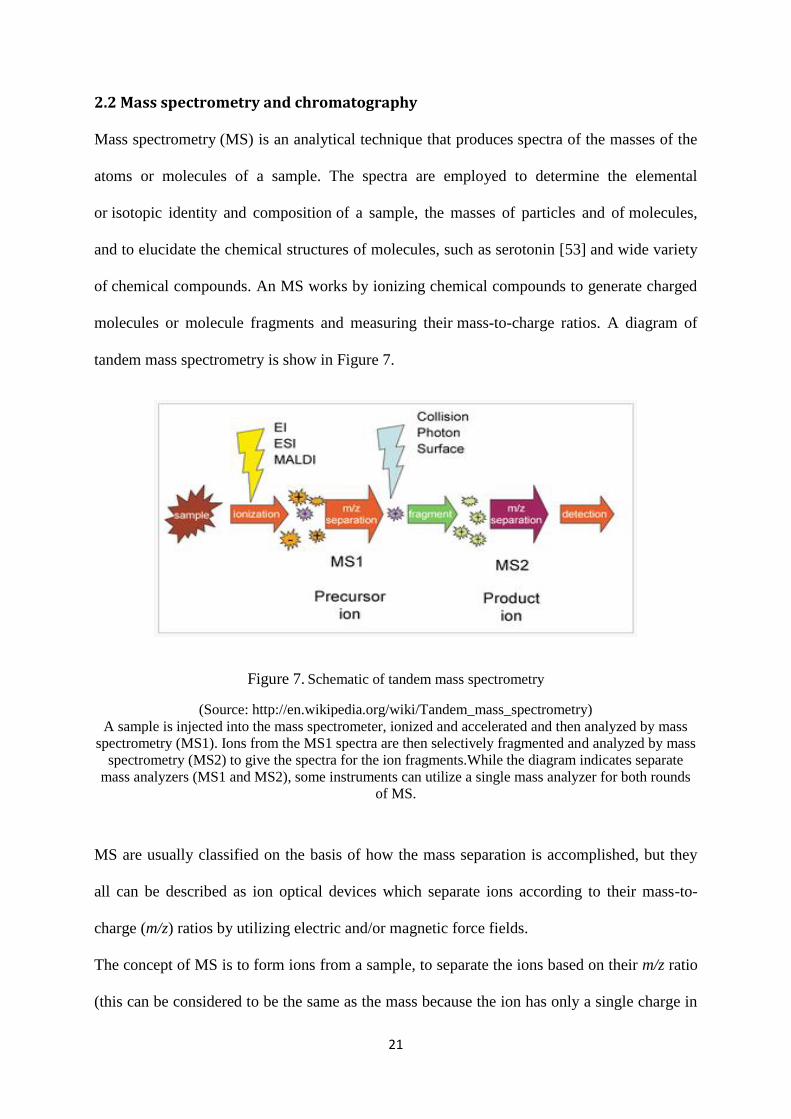
molecules or molecule fragments and measuring their mass-to-charge ratios. A diagram of
tandem mass spectrometry is show in Figure 7.
Figure 7. Schematic of tandem mass spectrometry
(Source: http://en.wikipedia.org/wiki/Tandem_mass_spectrometry)
A sample is injected into the mass spectrometer, ionized and accelerated and then analyzed by mass
spectrometry (MS1). Ions from the MS1 spectra are then selectively fragmented and analyzed by mass
spectrometry (MS2) to give the spectra for the ion fragments.While the diagram indicates separate
mass analyzers (MS1 and MS2), some instruments can utilize a single mass analyzer for both rounds
of MS.
MS are usually classified on the basis of how the mass separation is accomplished, but they
all can be described as ion optical devices which separate ions according to their mass-to-
charge (m/z) ratios by utilizing electric and/or magnetic force fields.
The concept of MS is to form ions from a sample, to separate the ions based on their m/z ratio
(this can be considered to be the same as the mass because the ion has only a single charge in

22
most cases), and to measure the abundance of the ions. In modern MS instrumentation, all of
the functions (ionization, separation of the ions, rate of data acquisition, detection of the ions,
and storage of the data) are under computer control. Gaseous molecules are ionized in the ion
source to form molecular ions in which some will fragment. By various processes, ions of
differing m/z values pass through the mass analyzer once at a time to reach the detector. When
the ions strike the detector, they are converted into an electrical signal, which in turn is
converted into a digital response that can be stored by the computer. Furthermore, powerful
new technologies of ion-analyses (tandem MS, time-of- flight MS, ion-trap MS) substantially
increased the capabilities of MS analyzers with respect to specificity and to the extent of data
read out. These developments suggest a more widespread use of MS techniques superior to
other analytical methods in routine laboratory medicine. The knowledge of the m/z of the ions
enables one to determine what is present, while the measured ion intensities answer the
question of how much is present. Only ions are detected in mass spectrometer and any
nonionic particles that have no charge are removed from the mass spectrometer by the
continuous pumping that maintains the vacuum. The effluents from the chromatographic
column are introduced into the mass spectrometer and it then enters the ionisation chamber
through the capillary to which a charge is applied. The charge droplets emerge from the tip of
the capillary and the charge to volume ratio increases as the droplets evaporate. The positive
charges are repelled and free proton-adducts of the molecules emerge. The adducts are
selected in an electromagnetic field in the first quadrupole according to their mass to charge
ratio (m/z). From there they enter the second quadrupole, where they are collided with gas
molecules, usually nitrogen, and thus fragment to form product ions, also called daughter
ions. Consequently, the abundant product ion is selected in the third quadrupole according to
its m/z ratio and allowed to reach the detector.

23
Furthermore, since tandem mass spectrometry is a selective method, several ions may be
measured even if they are not distinctly chromatographically separated; this is achieved by
monitoring several molecular transitions intermittently, also called multiple reactions
monitoring (MRM). The amount of analyte in a sample may not correlate directly with the
ion-current intensity of its mass spectrometric signal.
2.2.1 Low pressure chromatography
Chromatography systems are often defined by their pressure characteristics, acronyms such as
LPLC and HPLC are used to refer to low-pressure and high performance liquid
chromatography respectively. Low pressure chromatography operates at a pressure <50psi
(~3bar), thus they are often used for sample purification and simple protein separations that
do not require high resolutions. Low pressure chromatography techniques are time
consuming, their retention times are excessively long (over 30 minutes for 5-HT/5-HIAA),
they exhibit poor limit of detection and thus may not be suitable for a routine analysis because
of the poor sample through-put, also such techniques are often encompassed by poor
sensitivity and thus unreliable [54-56]. Low pressure chromatography systems can only force
liquid along flow path provided the pressure capabilities of the systems exceeds the resistance
or back pressure after the pump. However, LPLC has some advantages over HPLC in that the
tubing and pumps used in low pressure chromatography are easy to clean or replace and thus
clogging the pump and cross contamination are often not a source of worry. They are
inherently easier to use and maintain and are less prone to licking etc.
2.2.2 High performance liquid chromatography
HPLC is an improved form of column chromatography that is used to separate, purify,
identify and quantify chemical compounds. Chromatography uses the principle of the
differences in surface interaction between analytes and eluent molecules to separate
compounds within one sample. In HPLC system, the analytical instrument composes of two
24
phases. The stationary phase (absorbent) is the solid support situated within the column often
packed with silica bonded hydrocarbons. The mobile phase (eluent) refers to the solvent
which is continually added to the column. When injecting a sample into the instrument it will
migrate through the column according to its affinity to the mobile and stationary phases, this
means compounds that have less strong affinity to the mobile and stationary phases will elute
faster than compounds that have stronger affinity to the phases. In HPLC system the
continuously applied pressure ensures that the analytes and the mobile phase are forced
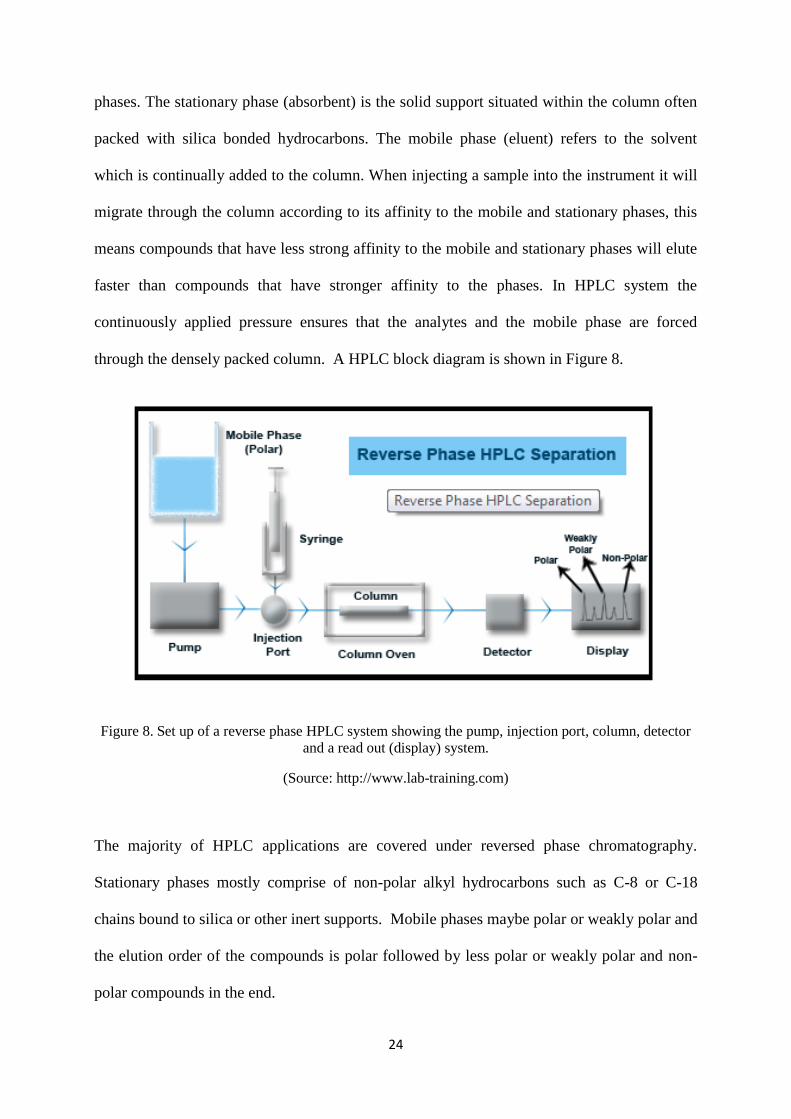
through the densely packed column. A HPLC block diagram is shown in Figure 8.
Figure 8. Set up of a reverse phase HPLC system showing the pump, injection port, column, detector
and a read out (display) system.
(Source: http://www.lab-training.com)
The majority of HPLC applications are covered under reversed phase chromatography.
Stationary phases mostly comprise of non-polar alkyl hydrocarbons such as C-8 or C-18
chains bound to silica or other inert supports. Mobile phases maybe polar or weakly polar and
the elution order of the compounds is polar followed by less polar or weakly polar and non-
polar compounds in the end.

25
2.3 Sample preparation/extraction methods for serotonin in plasma
There are several clean-up procedures during the analysis of biological fluids. This includes
the selective clean-up of sample by selective removal of all endo- and exogenous compounds
in the matrix that could clog the chromatographic column or interfere with the separation of
the analyte of interest. Several sample preparation techniques have been used for clean-up of
complex matrices in plasma and other bio-fluids. Such techniques include solid phase
extraction (SPE) [57-59], protein precipitation [60], liquid-liquid extraction (LLE) as well as
online solid phase extraction (SPE) [49]. In most bioanalytical methods, the sample
preparation is usually done by liquid-liquid extraction or solid phase extraction.
LLE is a method used to separate compounds based on their solubility in two immiscible
liquids, usually water and organic solvents; thus, it is an extraction of a substance from one
liquid into another liquid. LLE is highly selective, depending on the choice of the solvent and
pH, the analytes can be extracted from most of the endogenous compounds and recoveries can
be improved by successive extractions. On the other hand, SPE is a separation process by
which compounds that are dissolved or suspended in a liquid mixture are separated from other
compounds in the mixture according to their physical and chemical properties; with SPE
technique many of the drawbacks associated with LLE can be avoided, such as incomplete
phase separation, poor recoveries, and use of expensive fragile glassware as well as use of
large quantities of organic solvents. SPE is more efficient than the LLE; it is more rapid and
can be automated. However, both of these methods are laborious and tedious and often
imprecise. Thus, since the present work also aims at developing simple and reliable sample
preparation techniques for the analysis of serotonin and its metabolite, 5-hydroxyindole-acetic
acid, it is therefore, particularly important to consider sample preparations that is less
laborious, but still efficient. Protein precipitation with miscible organic solvents (such as
acetonitrile) has been successfully employed in preparation of plasma samples because of its
26
low cost and minimal method development requirements. This method involves the addition
of organic solvent, vortex mixing and subsequent centrifugation to separate the resultant
protein precipitates from the analytes and it provides sufficient clean-up for LC-MS/MS
analyses.
2.4 Theory on internal standard
Internal standard (IS) is a chemical substance with very similar but not necessarily identical
physicochemical properties to the analyte and it provides several advantages in the analysis of
biomolecules by liquid chromatography tandem mass spectrometric (LC-MS/MS). It is often
added in a constant amount to the samples in a chemical analysis to aid in quantification, this
is also known as spiking. It is very advantageous in that: it improves intra injection
reproducibility, it corrects the loss of analyte during sample preparation and it markedly
reduces matrix interferences and ionization effects. An IS can be a structural analogue or
stable labelled internal standard but the latter is often preferred in bioanalysis.
During chromatographic quantitative analysis using the IS method, the analyte concentration
can be determined using the response factor (the ratio of the sensitivities of the analyte and
the internal standard). The IS needs to provide a signal that is similar to the analyte in most
ways but markedly distinguishable by the instrument. It is believed that stable labelled
internal standard yield better assay performance in bioanalytical liquid chromatography mass
spectrometry assays. Internal standard with similar chemical properties as the analyte may
cover up assay problems with stability, recovery, and ion suppression. However, stable
labelled internal standards are not always available and are very expensive; thus structural
analogues can also be used as IS.
Using IS in quantitative bioanalysis by liquid chromatography tandem mass spectrometry is
mainly aimed to compensate for matrix/measurement effects [61].
27
Mass detection unarguably represents unequalled sensitivity and selectivity and it is thus a
clear candidate for LC-based quantitative assays. Quantitative detection is often complicated
by effect of matrix interferences, for example in plasma or urine constituents. When an
analyte is introduced into the ion source it will compete with other compounds introduced into
the ion source simultaneously. The matrix components decreases the analyte signal, this is
known as ion suppression, most notably in electrospray ionisation (ESI)-based MS detection
as used in this thesis. The extent of ion suppression will largely depend on the chemical
structure of the analyte of interest; which entails that if an analyte and IS are not structurally
similar, the ratio of analyte and IS detectors responses may vary due to different degrees of
ion suppression, thereby compromising the quantitation.
In HPLC analysis a solution of a known analyte ([A]) and internal standard ([IS])
concentration is often first run under certain column conditions. The ratio of the detector
signal of the analyte (SA) and the internal standard (SIS) is calculated to measure the response
factor (RF) using Eq.1. Subsequently a known concentration of the internal standard and the
calculated RF are used to determine the concentration of the unknown analyte by solving [A]
in (Eq.1).
Eq. (1)
2.5 Experimental design and optimisation
Experimental design and optimization are tools that are used to systematically examine
different types of problems that arise within research, development and production.
Experimental design such as response surface and factorial design are multivariate approach
suitable for development of analytical methods. Experimental design is a powerful tool to
reduce large number of data to manageable size to examine the effects of experimental

28
variables and their interactions and to optimise simultaneously methodological and/or
instrumental conditions.
2.5.1 Doehlert design
Doehlert design is a type of multivariate experimental design where different factors are
studied at different number of levels. It is often referred to as a uniform shell design in that
there is a regular distribution of experimental points on the surface of the spherical shells. A
diagram of Doehlert uniform shell design for two variables is shown in Fig. 9.
Figure 9. Spatial distribution of experimental points in a two-factor Doehlert uniform shell design,
[62]
The design displays an equally spaced distribution of experimental points circumscribed to a
sphere of radius 1, in this way the variance of the estimated response is the same at all points
on the sphere centered at the origin [62]. For a number of K factors, the total number of
experiments to be measured is given by ; hence the total number of experiments
for two variables is 7.
29
The two-factor Doehlert design (Fig. 9), is a hexagon with vertices 2, 3, 4, 5, 6 and 7 and a
central point 1, The hexagon in question define five levels (-1.00, -0.50, 0.00, +0.50, +1.00)
for factor 1 (X1) and three levels (-0.866, 0.00, +0.866) for factor 2 (X2).
Doehlert uniform shell design is an appropriate tool to model the response factor (RF)
behaviour as a function of the concurrent variation of the concentrations of internal standard
and analyte [63]. Such model can be a first (Eq. 2) or second (Eq. 3) order polynomial
function.
Eq. (2)
Eq. (3)
where is the intercept
and - the linear term coefficients
- the interaction coefficients of the analyte [A] and [IS].
and represents the effect of the second order coefficients.
2.6 Matrix effects
Matrix effect is the combined effect of all components of the sample other than the analyte to
be quantified. This often affects the selectivity of a bioanalytical techniques and it is
frequently the case when using liquid chromatography tandem mass spectrometry in
bioanalysis. In order to minimize matrix interferences in LC-MS/MS a number of approaches
can be applied. Such approaches can be instrumental modifications or method improvements,
such as extraction modification, ionisation switching as well as monitoring the elution
solvents.

30
Matrix effect is not solely unique to LC-MS/MS detectors but has also been observed in other
detectors such as fluorescence [64] and electron capture techniques.
Other detectors used in gas chromatography can cause matrix irreproducibility, for instance
flame dampening caused by lipids and some plasma constituents has been observed in flame
photometric (FPD) or mass spectrometry (MS) detectors in GC [65]. Thus matrix effects may
not be solely related to the interferences during ionisation process of LC-MS/MS or sample
preparation and extraction but should be well-thought-out when developing new analytical
methods in which reproducibility, robustness, limit of detection and quantification as well as
other analytical parameters are of paramount importance.
2.7 Theory on method validation
Method validation encompasses the procedures of establishing the performance characteristics
and limitations of a method and the identification of the influences which may change these
characteristics and to what extent. Specifically, according to the International Standard
Organisation (ISO/IEC 17025), method validation is the process of proving that an analytical
method conforms and fulfills the requirements for the intended use. It is aimed at
demonstrating that the procedure when correctly applied, produces results that are fit for
purpose [66].
The analytical parameters that are often considered in method validation include: accuracy,
precision, repeatability, intermediate precision, specificity, detection limit, quantitation limit,
linearity and range.
31
2.7.1 Accuracy
The accuracy of an analytical procedure is defined as the closeness of agreement between an
accepted conventional true value or an accepted reference value and the experimental value.
This is often referred to as trueness.
There are different approaches used to assess accuracy of an analytical method, these
technique includes but not limited to (i) comparing the result of the analytical measurement
with a certified reference value, this approach assumes that the uncertainty of the reference
method is known; (ii) analysing a sample of known concentration and comparing the results
of the analytical method in question with an established reference method; (iii) when the
certified control samples are not available, a blank matrix of interest can be spiked with a
known concentration of the analyte and the percentage of recovery is calculated; (iv) use of
the standard addition method [67-69].
Furthermore, following the extraction of the analyte from the matrix and subsequent
submission to the analytical instrument, its recovery can be determined by comparing the
calculated (Ccalculated) and nominal (Cnominal) concentrations by using the following expression
[68].
Eq. (4)
2.7.2 Precision
The precision of an analytical procedure expresses the closeness of agreement (degree of
scatter) between a series of measurements obtained from multiple sampling of the same
homogeneous sample under the same analytical conditions. The International Conference on
Harmonization (ICH) has defined precision to contain three components: repeatability,
intermediate precision and reproducibility.

32
Precision of an analytical method can be determined based on standard deviation (SD),
relative standard deviation (RSD) also known as coefficient of variation (CV), or Variance
(SD2) of the analytical measurement results.
The equations used for determining the SD and CV parameters are:
√∑
Eq. (5)
∑
Eq. (6)
Eq. (7)
where is the mean value, n is the number of measurements.
2.7.3 Specificity/selectivity
Specificity/selectivity refers to the ability of an analytical method to differentiate the analytes
or the internal standard from closely related endogenous matrices. According to
recommendation of the International Union of Pure and Applied Chemistry (IUPAC), the
term selectivity is defined as the extent to which an analytical method can determine
particular analytes under given conditions in mixtures or matrices, simple or complex, without
interferences from other components. Specificity is the “ultimate” of selectivity [68, 69].
Notwithstanding, the term specificity entails that there is no interference or that there is 100%
selectivity.
There are several approaches to assessing the selectivity of a method: (i) comparison of
chromatogram of a blank sample with and without spiking known analytes; (ii) analysis of
standard or certified reference material; (iii) comparison of the chromatographic response of
the sample with or without matrice interference [68].
33
Specificity in liquid chromatography is obtained by selecting optimal columns and setting
chromatographic conditions, such as eluent composition, column temperature and detector
wavelength.
2.7.4 Linearity
The linearity of an analytical method is its ability to obtain a test result which is directly
proportional to the concentration of analyte in the same sample within a given range.
Linearity is generally demonstrated by using a series of standards (dissolved in pure solvent
or spiked in a blank sample) at a minimum of five levels of concentrations, determining the
intensity of the signals generated by the standards, constructing the signal versus
concentration curves and performing regression and statistical analysis to judge whether or
not the linearity over the studied range is fulfilled. Validation of linearity is often regarded as
a verification of the assumed response function without or with an acceptable deviation. It is
primarily performed by means of graphical evaluation of the experimental data from the
assumed response model (residual analysis), also called residual plots. For linear ranges, the
deviations should be equally distributed between positive and negative values when the
residual are plotted. Linearity is expressed mathematically as:
Eq. (8)
where is the analytical response, is the amount (or concentration) of analyte, is the
sensitivity (or slope of the calibration curve), is the intercept of the calibration curve (error
of measurement of the dependent variable - ).
34
There are statistical established means of determining each of the defined parameters above
based on least square method of linear regression analysis:
∑ ∑ ∑
∑ ∑ Eq. (9)
∑ ∑ ∑ ∑
∑ ∑ Eq. (10)
∑ ∑ ∑
√ ∑ ∑ ∑ ∑ Eq. (11)
The correlation coefficient ( ) is often used to explain linearity, and an analytical method is
most times reported as being linear if is close to unity. The term is used as a measure of the
strength of the relation between the dependent and independent variables. In other words it
measures the relationship between a concentration and the signal. However, low does not
necessarily mean that there is no relationship between the variables, just that it is not a linear
relationship.
2.7.5 Range
The range of an analytical method is the interval between the upper and lower values that is
proven to have a suitable level of precision, accuracy, and as well demonstrate to be linear
using a particular analytical method. The range must be expressed in the same unit as the test
results.
2.7.6 Limit of detection and Limit of quantification
Limit of detection (LOD) is the lowest concentration that can be measured (detected) but not
necessarily quantified by a given analytical procedure with statistical significance. It is the
point at which a measured point is larger than the uncertainty associated with it.
35
In chromatography, the detection limit is the amount injected that produces a peak with a
height at least two or three times higher than the baseline or noise level. Limit of
quantification (LOQ) is the smallest amount or the lowest concentration of a substance that
can possibly be determined by means of a given analytical procedure with established
accuracy, precision and uncertainty.
There are several approaches to determine the detection and quantification limits of an
analytical method [68], such approaches include:
Visual assessment: in this approach the detection limit is determined by analysing
samples of known concentration and establishing the minimum level at which the
analyte can be conveniently detected.
Based on the standard deviation of the blank: this involves the measurement of the
analytical background performed by analysing an appropriate number of blank
samples and calculating the standard deviation of the responses.
By using a minimum of six blank analyses results, the limit of detection is expressed as the
analyte concentration in relation to the sample blank value added to three times the standard
deviation.
Eq. (12)
) Eq. (13)
where is the mean concentration of the analyte in a sample, is the standard
deviation of the blank sample. However, there are other procedures to determining the LOQ
other than using Eq.13, such as using 6 or 7xSDblank with acceptable accuracy and precision.
36
Determination from the calibration curve at low concentration, whereby a minimum of
three concentrations near to the estimated quantification limits are analysed and linear
regression of the points computed to determine the LOD and LOQ.
Eq. (14)
Eq. (15)
where SDres-residual standard deviation
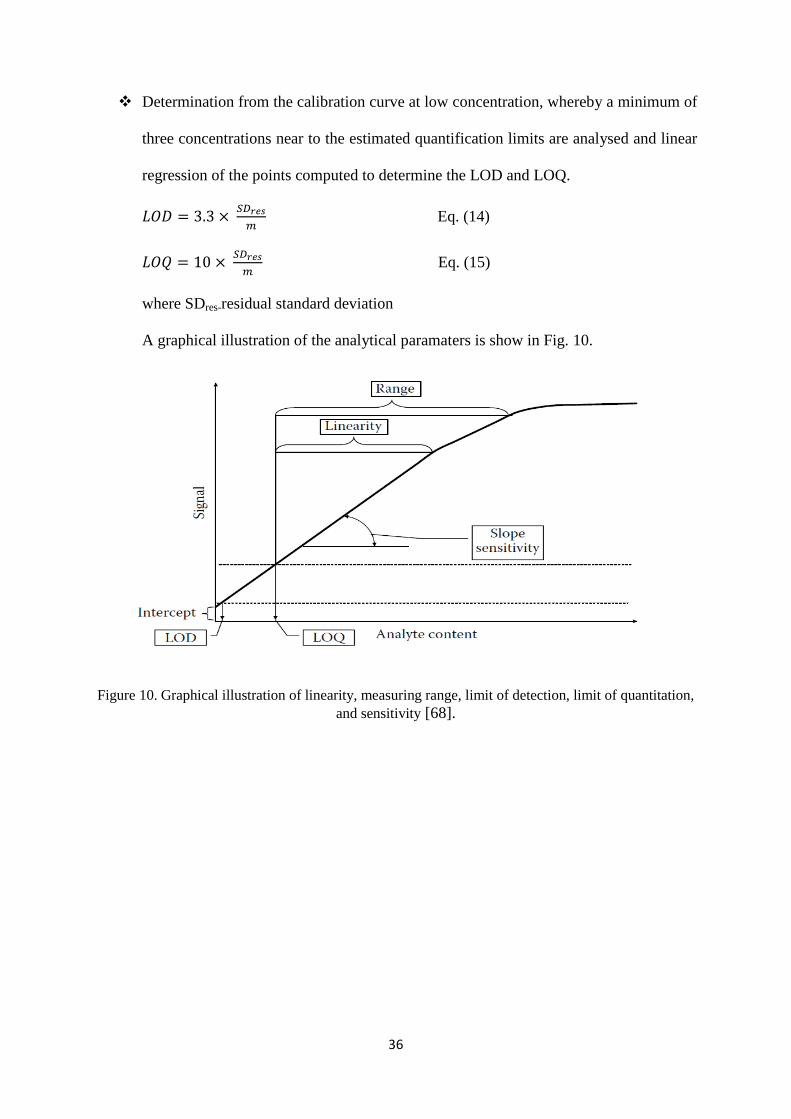
A graphical illustration of the analytical paramaters is show in Fig. 10.
Figure 10. Graphical illustration of linearity, measuring range, limit of detection, limit of quantitation,
and sensitivity [68].

37
3. METHOD DEVELOPMENT
3.1 Reagents
Serotonin hydrochloride (cat No. H9523) purity and internal standard 5-
methoxytryptamine (Cat No. 286583) purity, 5-hydroxyindole-3-acetic acid,
purity (CAS No.54-16-0) were purchased from Sigma-Aldrich Co. (St. Louis, MO, USA).
Deuterated internal standard, 5-hydroxyindole-3-acetic-2,2-d2 acid (CAS No. 56209-31-5)
purity was purchased from CDN Isotopes Inc. (Pointe-Claire Quebec, Canada).
HPLC-grade acetonitrile and ethanol were from Merck (Darmstadt, Germany) and formic
acid ( purity) was from Fluka Chemie (Basel, Switzerland). De-ionised water was
purified in a Milli-Q system (Millipore, Milford, MA, USA).
3.2 Plasma samples
Blank plasma used for developing and validating the method was from an anonymous donor.
A set of 10 plasma samples from an anonymous clinical biobank involving pathological
patients subjected to a diet rich in vegetables (Cancer and Diet Project Code CV-2012-2013)
were analysed by using the validated method. All plasma samples considered in this thesis
were collected in EDTA tubes and stored in -80˚C prior to use. Patient written consent
and Ethical approval from Research Ethics Committee were obtained prior to the study.

38
3.3 Analytes extraction and optimisation
Blank plasma sample (approx. 15mL) from an anonymous donor was used for the analysis
carried out during the development of the extraction method. From the plasma samples 5mL
was spiked with 500µg/mL of the analytes (5-HT and 5-HIAA) and kept at -80˚C until further
experiments.
3.3.1 Selection of extraction solvents
Based on literature search, protein precipitation was proposed as the most suitable, simple and
rapid method to be employed in the extraction of the analytes for a selective LC-MS/MS
method analysis. During the development of the extraction protocols, the first step was the
selection of suitable solvent (s) composition to extract 5-HT and 5-HIAA from the plasma
samples. The choice of solvents to be evaluated was based on published articles using protein
precipitation techniques. The commonly applied solvents are acetonitrile (ACN), methanol,
water formic acid and their mixtures. A pseudo 3-dimensional chart showing several
extraction trials is shown in Fig. 11.
Figure11. A chart of the solvent composition trials.
(MEOH=methanol, ACN=acetonitrile, ETOH=ethanol, Formic=Formic acid)
0
20
40
60
80
100
120
140
160
180
200
ACNMEOH
ETOHWATER
FORMIC
Vo
lum
e o
f so
lven
ts in
µL
SOLVENTS
SOLVENT SELECTION CHART
ACN 50
ACN 100
ACN 200
ACN 300
ACN 400
(Volume of plasma = 100µL)
39
The preliminary experiments for selection of extraction solvents were carried out using blank
plasma samples spiked with equal amounts of 5-HT and 5-HIAA (10µg/mL). The general
procedures applied involves: test tubes containing 100µL plasma samples were treated with
extracting solvents as shown in Fig. 11. At each step of the solvent addition, the test tubes
were vortex mixed for approximately 30s then centrifuged for 5 min at 3500 rpm. The
resultant supernatants were visually evaluated for their clarity. From the test tubes that
provide clear supernatants, extracts were taken and submitted to LC-MS/MS, the resulting
signals and clear separation of the monitored peaks were visually assessed. The remaining
solutions were kept over-night to check if there would be further precipitation.
Furthermore, based on the obtained results the extraction solvent system yielding clear
supernatant, well resolved peaks was selected as the optimal system for extracting 5-HT and
5-HIAA from human plasma.
3.4 Mobile phase selection and optimisation of the gradient system
The selection of the mobile phase was based on previous articles that employed gradient
mode in the study of biogenic and monoamines. Acetonitrile, formic acid, water and methanol
are the frequently most applied solvents in the study of such compounds.
Varying compositions of these solvents and/or their mixtures were tried randomly during the
selection of the mobile phase gradient condition. Some of the solvent programs tried during
the optimisation process are shown in Fig 12 (A-J). The chromatograms of the different
conditions will be shown in section 4.2.

40
(B=water, 0.1%formic acid, C=acetonitrile, 0.1% formic acid, D=methanol, 0.1% formic acid)
FR=0.2mL/min, CT=20˚C.(CT=column temperature, FR=flow rate).
(B=water, 0.1%formic acid, C=acetonitrile, 0.1% formic acid, D=methanol, 0.1% formic acid)
FR=0.2mL/min, CT=20˚C.
A
B

41
(B=water, 0.1%formic acid, C=acetonitrile, 0.1% formic acid)
FR=0.2mL/min, CT=20˚C.
(B=water, 0.1%formic acid, C=acetonitrile, 0.1% formic acid, D=ethanol)
FR=0.5mL/min, CT=20˚C.
C
D

42
(B=water, 0.1%formic acid, C=acetonitrile, 0.1% formic acid, D=ethanol)
FR=0.2mL/min, CT=20˚C.
(B=water, 0.1%formic acid, C=acetonitrile, 0.1% formic acid, D=ethanol)
FR=0.2mL/min, CT=20˚C.
F
E
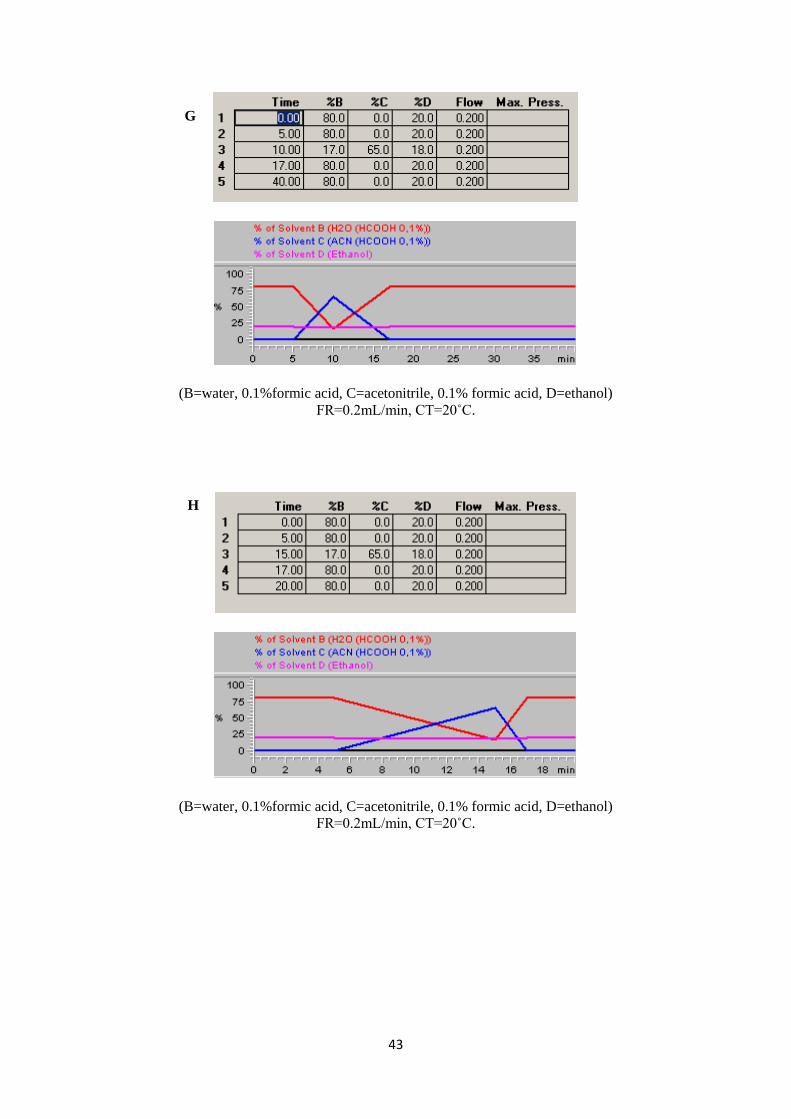
43
(B=water, 0.1%formic acid, C=acetonitrile, 0.1% formic acid, D=ethanol)
FR=0.2mL/min, CT=20˚C.
(B=water, 0.1%formic acid, C=acetonitrile, 0.1% formic acid, D=ethanol)
FR=0.2mL/min, CT=20˚C.
G
H
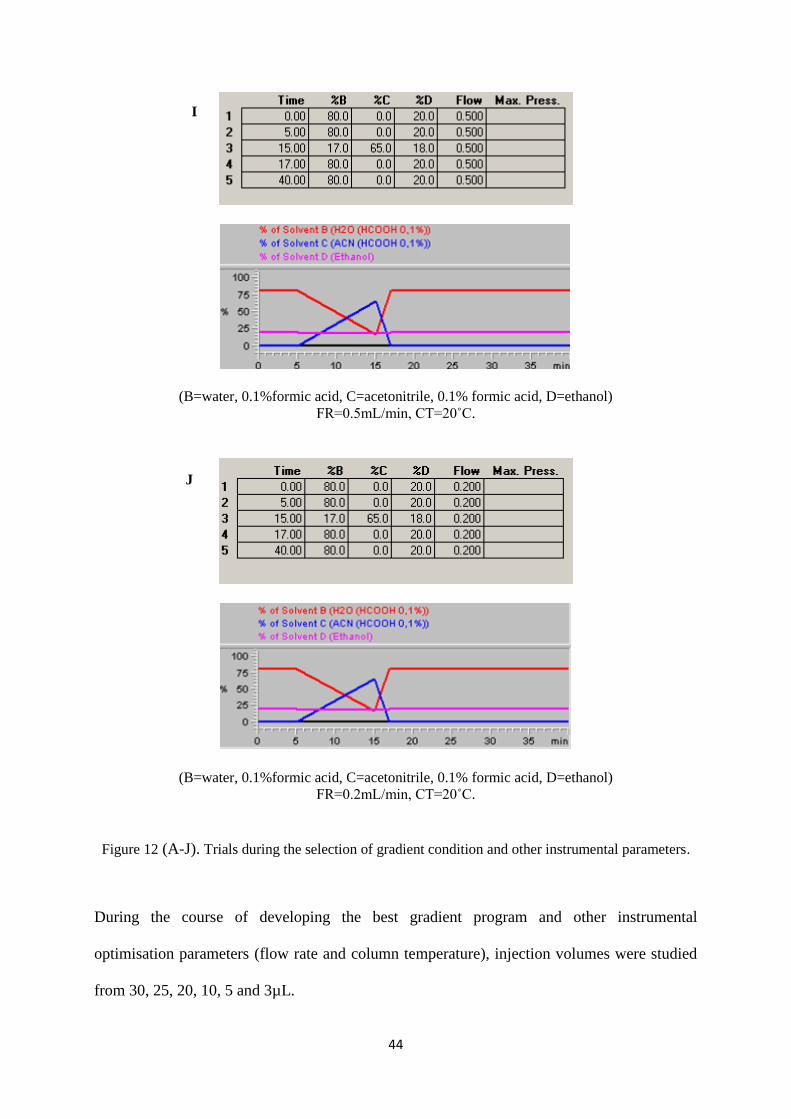
44
(B=water, 0.1%formic acid, C=acetonitrile, 0.1% formic acid, D=ethanol)
FR=0.5mL/min, CT=20˚C.
(B=water, 0.1%formic acid, C=acetonitrile, 0.1% formic acid, D=ethanol)
FR=0.2mL/min, CT=20˚C.
Figure 12 (A-J). Trials during the selection of gradient condition and other instrumental parameters.
During the course of developing the best gradient program and other instrumental
optimisation parameters (flow rate and column temperature), injection volumes were studied
from 30, 25, 20, 10, 5 and 3µL.
I
J
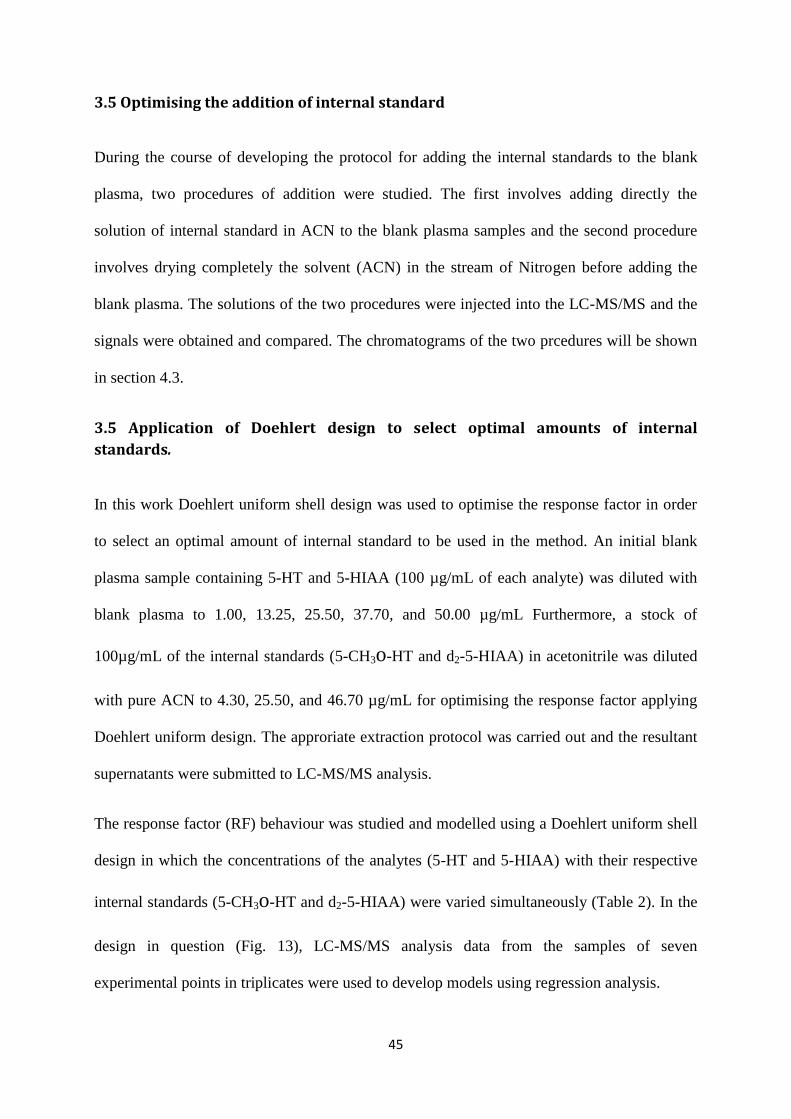
45
3.5 Optimising the addition of internal standard
During the course of developing the protocol for adding the internal standards to the blank
plasma, two procedures of addition were studied. The first involves adding directly the
solution of internal standard in ACN to the blank plasma samples and the second procedure
involves drying completely the solvent (ACN) in the stream of Nitrogen before adding the
blank plasma. The solutions of the two procedures were injected into the LC-MS/MS and the
signals were obtained and compared. The chromatograms of the two prcedures will be shown
in section 4.3.
3.5 Application of Doehlert design to select optimal amounts of internal
standards.
In this work Doehlert uniform shell design was used to optimise the response factor in order
to select an optimal amount of internal standard to be used in the method. An initial blank
plasma sample containing 5-HT and 5-HIAA (100 µg/mL of each analyte) was diluted with
blank plasma to 1.00, 13.25, 25.50, 37.70, and 50.00 µg/mL Furthermore, a stock of
100µg/mL of the internal standards (5-CH3o-HT and d2-5-HIAA) in acetonitrile was diluted
with pure ACN to 4.30, 25.50, and 46.70 µg/mL for optimising the response factor applying
Doehlert uniform design. The approriate extraction protocol was carried out and the resultant
supernatants were submitted to LC-MS/MS analysis.
The response factor (RF) behaviour was studied and modelled using a Doehlert uniform shell
design in which the concentrations of the analytes (5-HT and 5-HIAA) with their respective
internal standards (5-CH3o-HT and d2-5-HIAA) were varied simultaneously (Table 2). In the
design in question (Fig. 13), LC-MS/MS analysis data from the samples of seven
experimental points in triplicates were used to develop models using regression analysis.
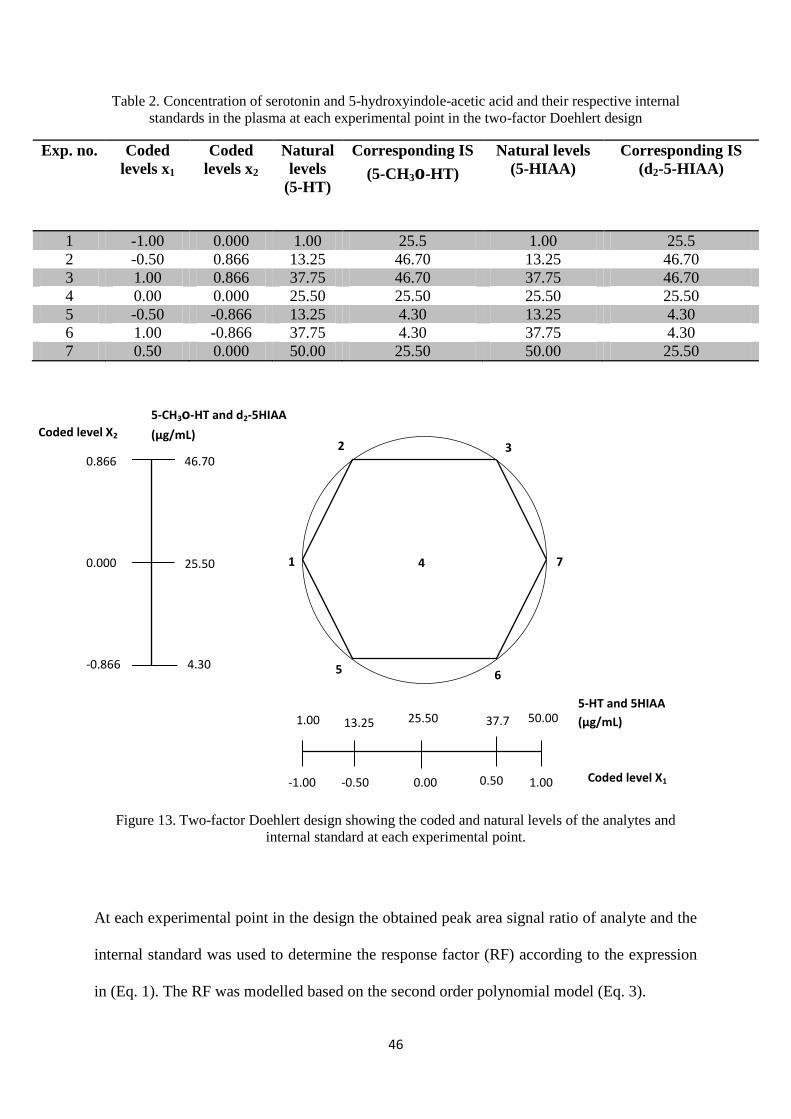
46
Table 2. Concentration of serotonin and 5-hydroxyindole-acetic acid and their respective internal
standards in the plasma at each experimental point in the two-factor Doehlert design
Exp. no. Coded
levels x1
Coded
levels x2
Natural
levels
(5-HT)
Corresponding IS
(5-CH3o-HT)
Natural levels
(5-HIAA)
Corresponding IS
(d2-5-HIAA)
1 -1.00 0.000 1.00 25.5 1.00 25.5
2 -0.50 0.866 13.25 46.70 13.25 46.70
3 1.00 0.866 37.75 46.70 37.75 46.70
4 0.00 0.000 25.50 25.50 25.50 25.50
5 -0.50 -0.866 13.25 4.30 13.25 4.30
6 1.00 -0.866 37.75 4.30 37.75 4.30
7 0.50 0.000 50.00 25.50 50.00 25.50
Figure 13. Two-factor Doehlert design showing the coded and natural levels of the analytes and
internal standard at each experimental point.
At each experimental point in the design the obtained peak area signal ratio of analyte and the
internal standard was used to determine the response factor (RF) according to the expression
in (Eq. 1). The RF was modelled based on the second order polynomial model (Eq. 3).
4
6
2
1
3
5
7
46.70 0.866
25.50
4.30 -0.866
0.000
1.00 25.50 13.25
-0.50 1.00
37.7
5
50.00
0.00 0.50 -1.00
Coded level X2
5-CH3o-HT and d2-5HIAA
(µg/mL)
Coded level X1
5-HT and 5HIAA
(µg/mL)
47
The adequacy of the developed models from the obtained data was evaluated by statistical
approach that describes the variation of the obtained values to that of the predicted model;
where by the variances of the lack-of-fit and pure error are estimated by dividing their
summation with respective degrees of freedom. The variance ratio of the lack-of-fit error to
that of pure error known as experimental F-value (Fexp) is used to conclude if the model fits
the data by comparing with the theoretical F-value (Ftheo). If the Fexp is lower than the Ftheo
(obtained from F-distribution table) it therefore means that the model is fitted. The procedure
(Eq. 16-20) employed for calculating the Fexp involves: calculation of the experimental RF
according to (Eq. 1) and the average of each replicates were obtained. From
the regression model, calculated RF was obtained and the sum of residual error ( ),
pure error ( ) and lack of fit ( ) were calculated according to the following equations:
Eq. (16)
Eq. (17)
Eq. (18)
∑
∑ Eq. (19)
Eq. (20)
where VPE is the variance of pure error, VRE is variance of residual error, VLOF is variance of
lack-of-fit, K is the number of regression coefficients, N is the number of experiments, P is
the number of the experimental points, and DF is the degree of freedom.
In the present work, the F-values were obtained at 97.5% confidence level.

48
3.6 Plasma sample protocol
The plasma was thawed at room temperature. 100 µL of plasma containing the analytes was
added to eppendorf tubes, and 100 µL of acetonitrile (ACN) solution containing the internal
standards (20 µg/mL) was added to the eppendorf tubes containing the plasma. The solution
was vortex-mixed (Banderlin RK 100 ultra-mixer, Berlin Germany) for approximately 30s
and centrifuged (Eppendorf AG centrifuge, Hamburg, Germany) at 3500 rpm for 5 min. The
supernatants were collected and 100 µL of pure ACN was added to each collected
supernatant. To completely precipitate the proteins and prepare the samples for LC-MS/MS
analysis, the supernatants were again vortex-mixed and centrifuged at 3500 rpm for 5min.
A simplified and concise flow chart of the sample preparation protocol is shown in Fig. 14.
Figure 14. Flow chart of sample preparation protocol.
49
3.7 Method validation
The selectivity of the method was evaluated by spiking a blank sample with the analytes and
the internal standards (5-HT, 5-HIAA, and 5-CH3o-HT, d2-5-HIAA). The extracted ion
chromatograms (177→160,129 m/z for 5-HT, 192→157,146 m/z for 5-HIAA, and
191→174,143 m/z for 5-CH3o-HT, 194→175 m/z for -5HIAA) of the spiked samples were
compared to the ones from the blank samples. The calibration experiment was performed
using blank plasma samples spiked with 5-HT and 5-HIAA in the concentration range of 0.5-
50 µg/mL. Six concentration levels (0.5, 1.0, 13.25, 25.5, 37.7 and 50 µg/mL) in triplicates
were prepared according to the protocol previously described in section 3.6 using 20 µg/mL
of 5-CH3o-HT and d2-5-HIAA internal standards. A linear regression analysis was performed
for both 5-HT and 5-HIAA. The results will be presented in section 4.5. The LOD (3×SDblank)
and LOQ (6×SDblank) were estimated visually by using sequential dilution of the spiked
analytes in plasma. The recovery was determined by comparison of the nominal (spiked blank
samples) and the calculated concentrations based on the constructed calibration curve models.
The precision was determined based on repeatability and this was evaluated by determining
the relative standard deviation (RSD) values of the signal ratio of the analyte to that of the
internal standard data for the calibration curves.
3.8 Liquid chromatography ion trap mass spectrometry
An Agilent 110 series LC/MSD trap, SL model with an electrospray interface (ESI), a
quaternary pump, degasser, autosampler, thermostatic column compartment, and a variable
wavelength UV detector was used. The injection volume was 10µL. The column, a Zorbax
Eclipse-C8 RP 150mm × 4.6mm, 5µm (Agilent Technologies, Palo Alto, CA, USA) was a
double endcapped column 100% water compatible, which could be operated at a pH range of

50
2-9. It provided improved basic peaks of amines such as serotonin, because of the polar
groups embedded in the stationary phase and fast conditioning column.
The column temperature was kept at 20°C and the solvent in gradient mode consisted of water
with 0.1% formic acid (v/v) (B), acetonitrile with 0.1% formic acid (v/v) (C) and ethanol (D).
The flow rate was maintained at 0.2mL/min and the UV detector at 254nm.
The initial condition 80% of B, 20% of D was maintained from 0-5 min and then changed to
17% of B, 65% of C and 18% of D in 10 min, returned to 80% of B, 20% of D in 2 min held
for 23 min. The total analysis time was 40 min.
Using this gradient condition, reproducible retention times were obtained and peak areas were
monitored from sample to sample. Nitrogen was used as nebulizing (50 psi) and drying gas
(8L/min) at 350°C. The ESI source was operated in positive mode and ion optics responsible
for getting the ions in the ion trap such as capillary exit, skimmer, lens and octapoles voltage
were controlled by using the smart view option with a resolution of 13000 m/z/s (Full width at
half maximum, FWHM/m/z = 0.6-0.7). A complete system control, data acquisition and
processing were done using the Chem Station for LC/MSD version from Agilent. The
transitions were monitored at, m/z 177→160,129 for serotonin, m/z 192→157,146 for 5-
hydroxyindole-acetic acid, and m/z 191→174,143 for 5-CH3o-HT, m/z 194→175 for -
5HIAA internal standards respectively. The magnitude of the signals was recorded in ion
counts per seconds (icps).
3.9 Statistics
The response factors for the analytes (5-HT and 5-HIAA) are expressed as mean values and
the standard deviation. The models were generated and simplified using linear regression
analysis in Microsoft Excel 2010. The statistical adequacy of the models was established by
an F-test at a 97.5% confidence level as previously mentioned.

51
4. RESULT AND DISCUSSIONS
4.1 Selection of optimal extraction solvent
Different extraction protocols were evaluated using several solvents, such as methanol, formic
acid, acetonitrile (ACN) and water as previously discussed in section 3.3.1. Following several
trials acetonitrile proved to be the most effective extraction solvent, since it leaves the plasma
sample free of more protein precipitates unlike other solvents (methanol, formic acid and
water) or their mixtures that leaves the extract cloudy and thus unsuitable to be injected into
the LC-MS/MS. The volume of ACN to be used was as well optimised, 1:1, 1:2, 1:3 and 1:4
of plasma to ACN respectively were evaluated. It was found that; 1:1 leaves the supernatant
cloudy after long standing hours. The supernatant were only clear for up to 8 hours post
deproteinisation after which it started to form more precipitates, therefore making it
unsuitable to be submitted to the LC-MS/MS after long hours. The plasma with high volume
of ACN was concentrated in vacuum drier (stream of nitrogen was also tried) and re-dissolved
in ACN during the development of the extraction protocols. During this process, 1:2 of
plasma to ACN was selected as the most suitable ratio for the precipitation process. Using this
ratio the supernatant were clear when kept overnight. This is good because the method can be
successfully applied in routine analysis where numerous samples are often analysed and some
samples are bound to be kept for long hours after preparation.
4.2 Selection of the optimal gradient system
During the course of optimising the gradient program several gradient system, flow rates and
injection volumes were studied (section 3.4). The chromatograms of the conditions studied
are shown in Fig. 15. Generally, as can be seen in Fig. 15, some of the gradient conditions
presented no clear signal, poor separation and/or some background noise. The best gradient
condition (Table 3) was used with a flow rate of 0.2mL/min, and reproducible retention times
and well resolved peaks were obtained (Fig. 16).
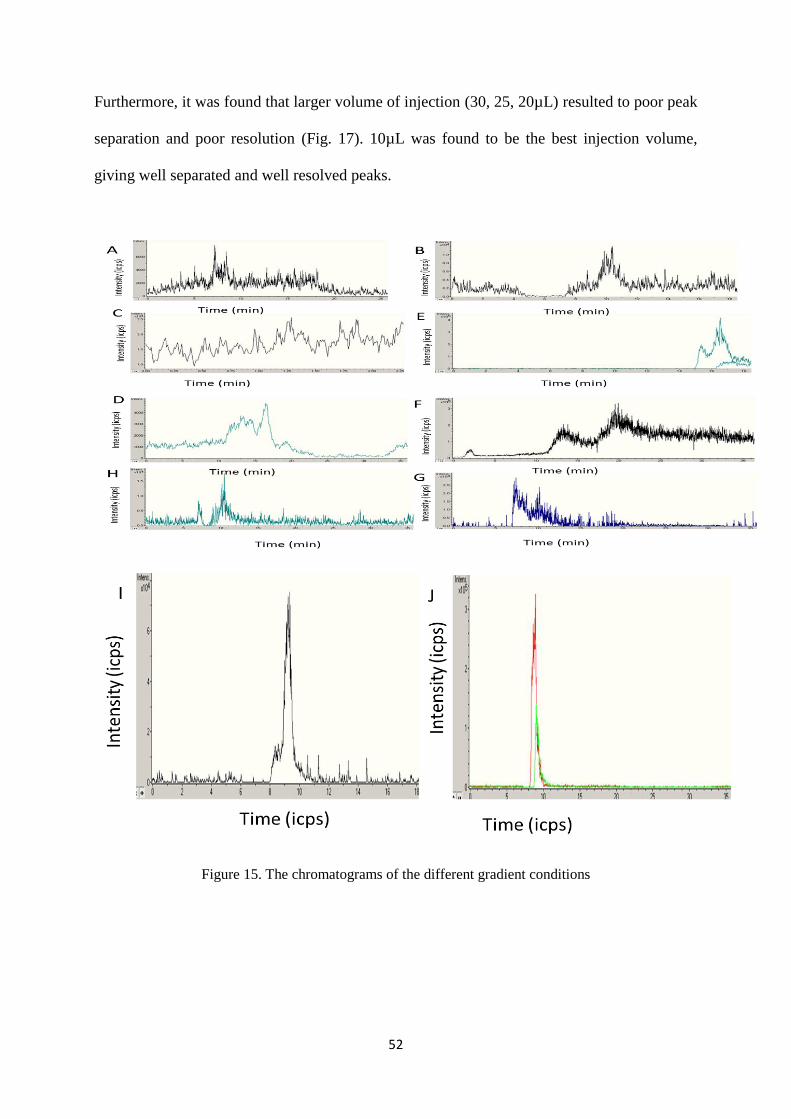
52
Furthermore, it was found that larger volume of injection (30, 25, 20µL) resulted to poor peak
separation and poor resolution (Fig. 17). 10µL was found to be the best injection volume,
giving well separated and well resolved peaks.
Figure 15. The chromatograms of the different gradient conditions

53
Figure 16. The chromatogram of the best gradient condition showing reproducible retention times of
the analytes.
Figure 17. The chromatogram of large injection volume.
Table 3. Gradients programme of the mobile phase (eluent).
TIME
(min)
B%
(H20, 0.1% HCOOH)
C%
(ACN, 0.1% HCOOH)
D%
(ETHANOL)
0 80 0 20
5 80 0 20
15 17 65 18
17 80 0 20
40 80 0 20
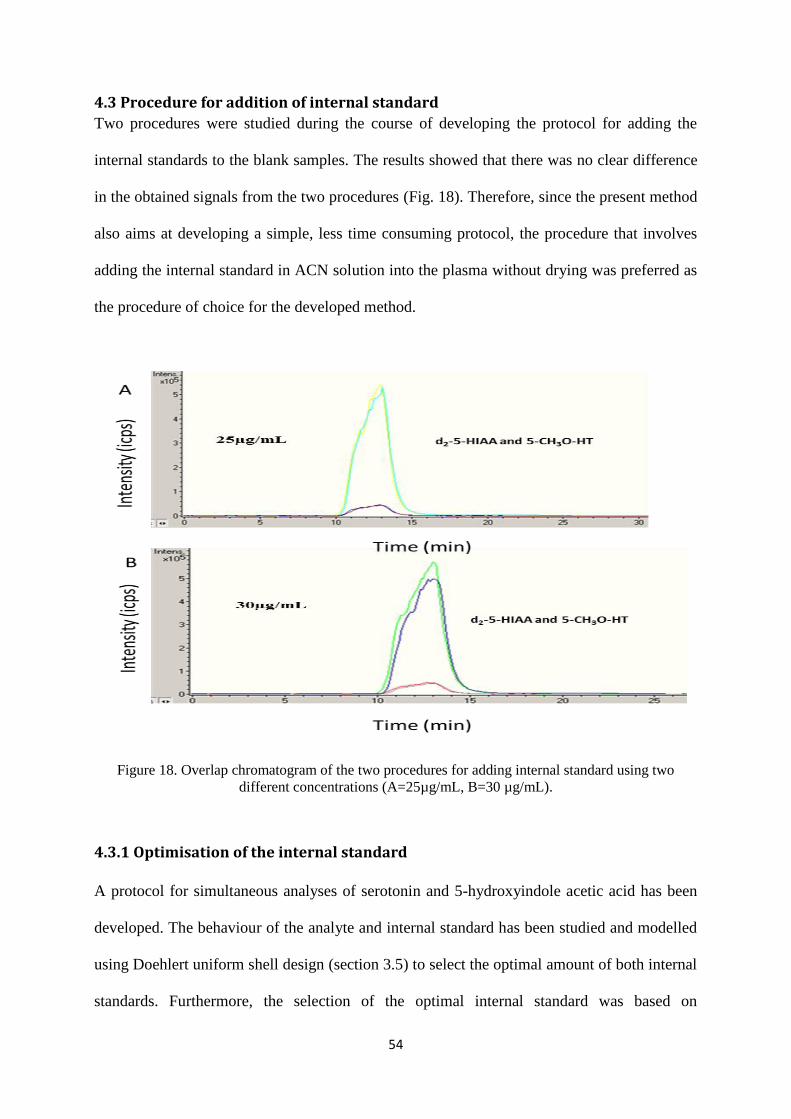
54
4.3 Procedure for addition of internal standard
Two procedures were studied during the course of developing the protocol for adding the
internal standards to the blank samples. The results showed that there was no clear difference
in the obtained signals from the two procedures (Fig. 18). Therefore, since the present method
also aims at developing a simple, less time consuming protocol, the procedure that involves
adding the internal standard in ACN solution into the plasma without drying was preferred as
the procedure of choice for the developed method.
Figure 18. Overlap chromatogram of the two procedures for adding internal standard using two
different concentrations (A=25µg/mL, B=30 µg/mL).
4.3.1 Optimisation of the internal standard
A protocol for simultaneous analyses of serotonin and 5-hydroxyindole acetic acid has been
developed. The behaviour of the analyte and internal standard has been studied and modelled
using Doehlert uniform shell design (section 3.5) to select the optimal amount of both internal
standards. Furthermore, the selection of the optimal internal standard was based on
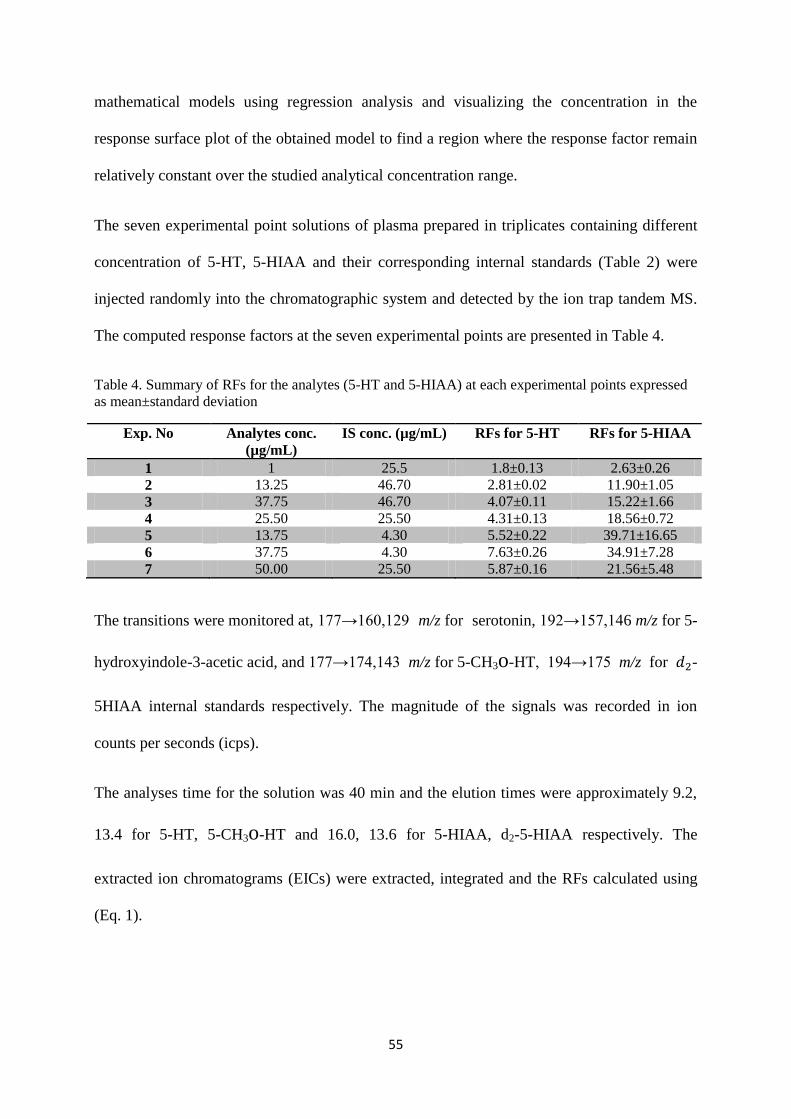
55
mathematical models using regression analysis and visualizing the concentration in the
response surface plot of the obtained model to find a region where the response factor remain
relatively constant over the studied analytical concentration range.
The seven experimental point solutions of plasma prepared in triplicates containing different
concentration of 5-HT, 5-HIAA and their corresponding internal standards (Table 2) were
injected randomly into the chromatographic system and detected by the ion trap tandem MS.
The computed response factors at the seven experimental points are presented in Table 4.
Table 4. Summary of RFs for the analytes (5-HT and 5-HIAA) at each experimental points expressed
as mean±standard deviation
Exp. No Analytes conc.
(µg/mL)
IS conc. (µg/mL) RFs for 5-HT RFs for 5-HIAA
1 1 25.5 1.8±0.13 2.63±0.26
2 13.25 46.70 2.81±0.02 11.90±1.05
3 37.75 46.70 4.07±0.11 15.22±1.66
4 25.50 25.50 4.31±0.13 18.56±0.72
5 13.75 4.30 5.52±0.22 39.71±16.65
6 37.75 4.30 7.63±0.26 34.91±7.28
7 50.00 25.50 5.87±0.16 21.56±5.48
The transitions were monitored at, 177→160,129 m/z for serotonin, 192→157,146 m/z for 5-
hydroxyindole-3-acetic acid, and 177→174,143 m/z for 5-CH3o-HT, 194→175 m/z for -
5HIAA internal standards respectively. The magnitude of the signals was recorded in ion
counts per seconds (icps).
The analyses time for the solution was 40 min and the elution times were approximately 9.2,
13.4 for 5-HT, 5-CH3o-HT and 16.0, 13.6 for 5-HIAA, d2-5-HIAA respectively. The
extracted ion chromatograms (EICs) were extracted, integrated and the RFs calculated using
(Eq. 1).

56
4.4 Modelling the RF as a function of 5-HT and 5-HIAA and their internal standards
(5-CH3o-HT and d2-5-HIAA respectively).
Various polynomial models were evaluated for the system 5-HT, 5-HIAA and their internal
standards (5-CH3o-HT, d2-5-HIAA respectively) and it was found that full second order
polynomial model with six coefficients (Eq. 3) was adequate to describe the behaviour of
serotonin and 5-hydroxyindole-acetic acid and their corresponding internal standards. The
adequacy of the model was established by comparing the experimental lack of fit to pure error
variance ratio (Fexp = 3.57 for 5-HIAA, Fexp = 6.24 for 5-HT ) with the theoretical (Ftheo = 6.42
for 5-HIAA, 6.93 for 5-HT at 97.5% confidence levels) values at determined degrees of
freedom (Eq. 20). The compared variances gives enough evidence to support the adequacy of
Eq. 21 and 22 to predict the RF over the experimental domain in the study.
During the modelling, models with lesser number of coefficients were also considered (Eq. 2),
but it was found that this type of model with lower number of terms was not statistically
adequate for modelling the behaviour of the RF as a function of the analytical concentrations.
The models did not fulfil the condition stated in section 3.5 (that if the Fexp is lower than the
Ftheo it means that the model is fitted).
The result of the RFs are presented as mean values in the surface plot (Fig. 19) generated
from the obtained model. The models are shown below (Eq. 21 and 22).
Eq. (22)
Eq. (21)
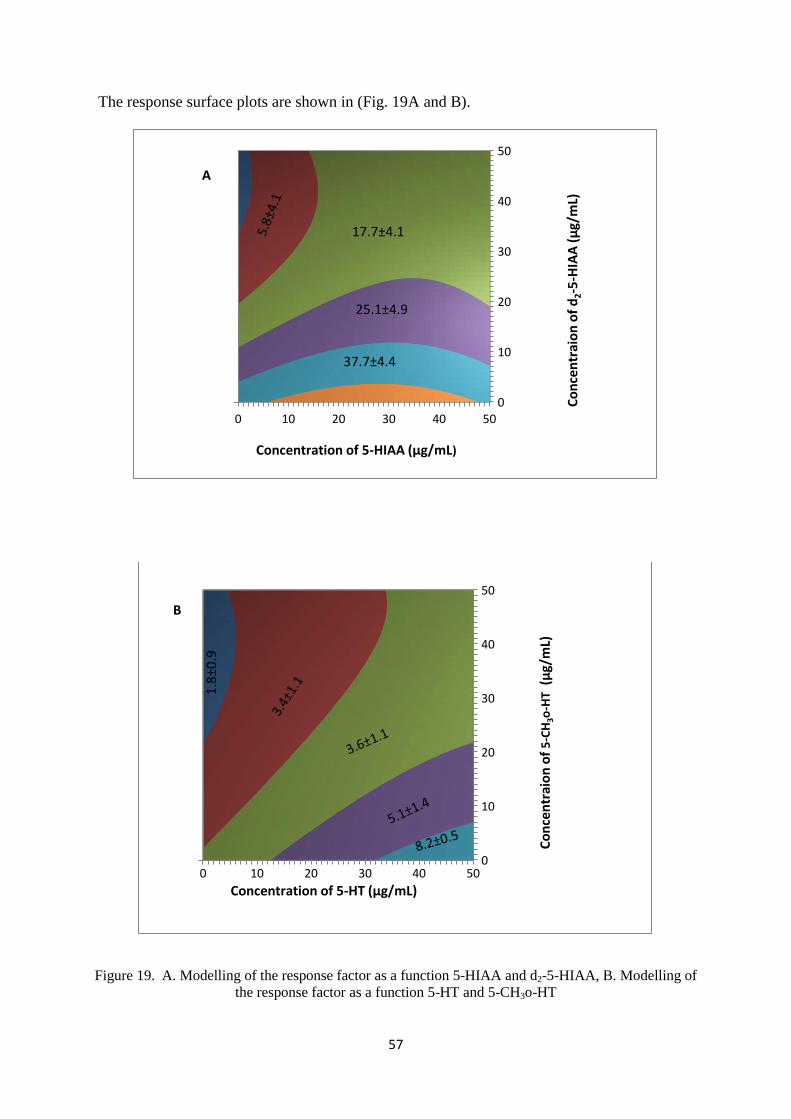
57
The response surface plots are shown in (Fig. 19A and B).
Figure 19. A. Modelling of the response factor as a function 5-HIAA and d2-5-HIAA, B. Modelling of
the response factor as a function 5-HT and 5-CH3o-HT
0
10
20
30
40
50
0 10 20 30 40 50
Co
nce
ntr
aio
n o
f d
2-5
-HIA
A (
µg/
mL)
Concentration of 5-HIAA (µg/mL)
17.7±4.1
25.1±4.9
37.7±4.4
A
0
10
20
30
40
50
0 10 20 30 40 50
Co
nce
ntr
aio
n o
f 5
-CH
3o-H
T (
µg/
mL)
Concentration of 5-HT (µg/mL)
B
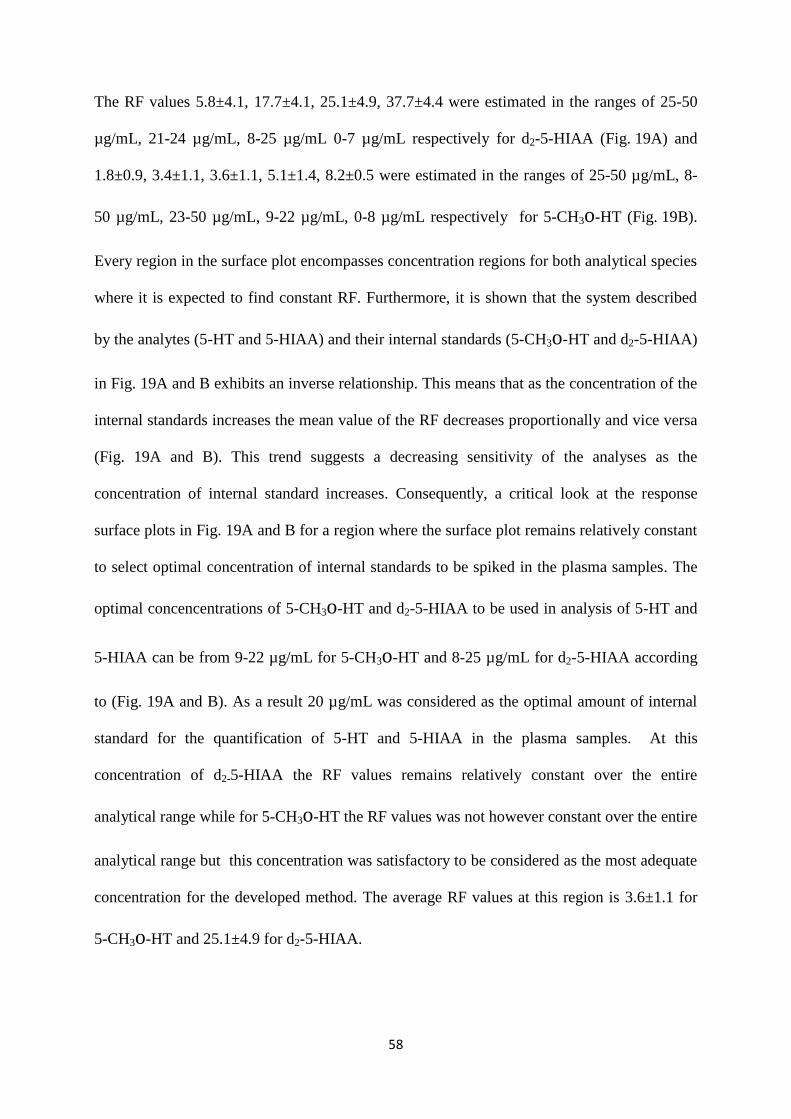
58
The RF values 5.8±4.1, 17.7±4.1, 25.1±4.9, 37.7±4.4 were estimated in the ranges of 25-50
µg/mL, 21-24 µg/mL, 8-25 µg/mL 0-7 µg/mL respectively for d2-5-HIAA (Fig. 19A) and
1.8±0.9, 3.4±1.1, 3.6±1.1, 5.1±1.4, 8.2±0.5 were estimated in the ranges of 25-50 µg/mL, 8-
50 µg/mL, 23-50 µg/mL, 9-22 µg/mL, 0-8 µg/mL respectively for 5-CH3o-HT (Fig. 19B).
Every region in the surface plot encompasses concentration regions for both analytical species
where it is expected to find constant RF. Furthermore, it is shown that the system described
by the analytes (5-HT and 5-HIAA) and their internal standards (5-CH3o-HT and d2-5-HIAA)
in Fig. 19A and B exhibits an inverse relationship. This means that as the concentration of the
internal standards increases the mean value of the RF decreases proportionally and vice versa
(Fig. 19A and B). This trend suggests a decreasing sensitivity of the analyses as the
concentration of internal standard increases. Consequently, a critical look at the response
surface plots in Fig. 19A and B for a region where the surface plot remains relatively constant
to select optimal concentration of internal standards to be spiked in the plasma samples. The
optimal concencentrations of 5-CH3o-HT and d2-5-HIAA to be used in analysis of 5-HT and
5-HIAA can be from 9-22 µg/mL for 5-CH3o-HT and 8-25 µg/mL for d2-5-HIAA according
to (Fig. 19A and B). As a result 20 µg/mL was considered as the optimal amount of internal
standard for the quantification of 5-HT and 5-HIAA in the plasma samples. At this
concentration of d2-5-HIAA the RF values remains relatively constant over the entire
analytical range while for 5-CH3o-HT the RF values was not however constant over the entire
analytical range but this concentration was satisfactory to be considered as the most adequate
concentration for the developed method. The average RF values at this region is 3.6±1.1 for
5-CH3o-HT and 25.1±4.9 for d2-5-HIAA.
59
Extracted ion chromatograms of 5-HT, 5-HIAA, 5-CH3o-HT and d2-5-HIAA and their
corresponding mass spectra are shown in Fig. 20-23.
Figure 20. Chromatogram of 5-HT (A) and its mass spectrum (B).

60
Figure 21. Chromatogram of 5-CH3o-HT (A) and its mass spectrum (B).
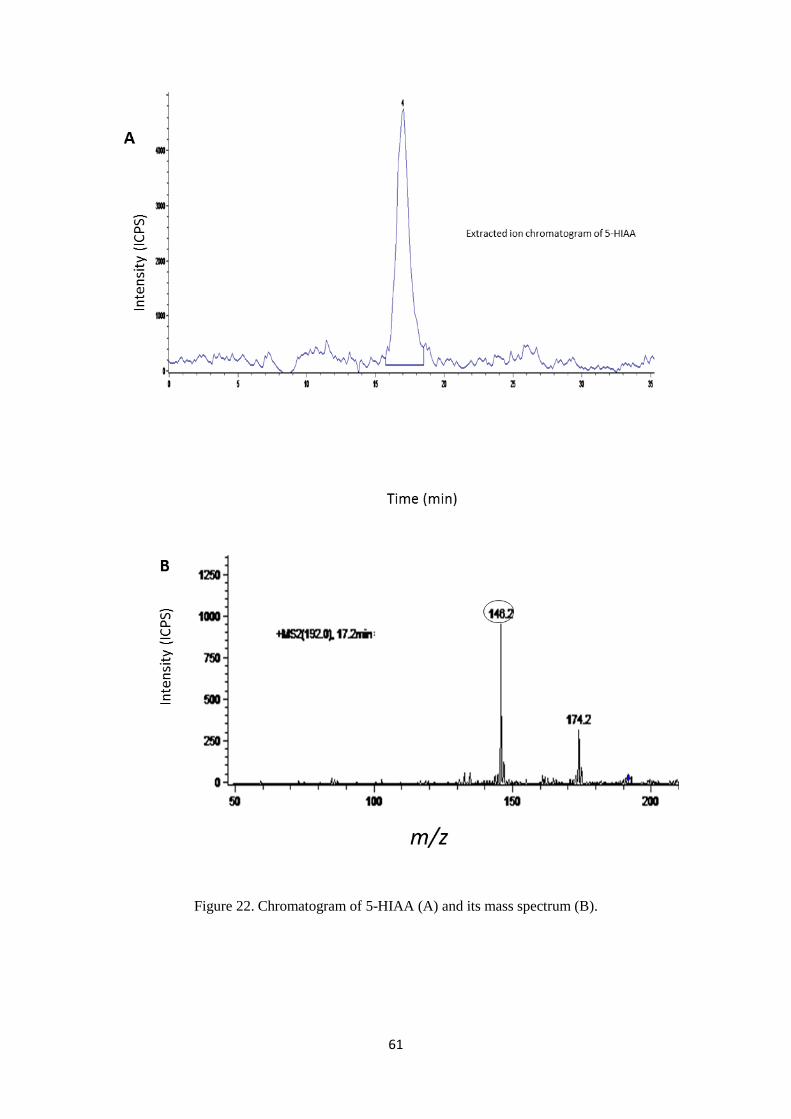
61
Figure 22. Chromatogram of 5-HIAA (A) and its mass spectrum (B).

62
Figure 23. Chromatogram of d25-HIAA (A) and its mass spectrum (B).

63
Figure 24. A. Overlay chromatogram of 5-HT and its internal standard, showing their fragment
masses. B. Overlay chromatogram of 5-HIAA and its internal standard, showing their fragment
masses.

64
4.5 Validation and analytical assessment
Plasma calibration samples containing a mixture of 5-HT and 5-HIAA in the range of 0-
50µg/mL were spiked with fixed and optimal amount of the corresponding internal standards
(20µg/mL of 5-CH3o-HT and d2-5-HIAA respectively) selected from the result of the
response factor behaviour. The analytical performance parameters such as; range, linearity,
selectivity, recovery, precision, limit of detection and limit of quantification were determined.
The method was linear over the studied range of concentration. The correlation coefficients
was r2
= 0.9823 for serotonin and r2
= 0.9892 for 5-hydroxyindole-acetic acid which indicates
strong correlation between the studied concentration of the analytes and the signal. However
the response of the metabolite, 5-HIAA was not linear when the solution was analysed after
some hours of standing. This could be attributed to degradation. The linear regression graph
of the two species are shown in Fig. 25A and B.
y = 0.0052x + 0.0108 R² = 0.9892
0
0.05
0.1
0.15
0.2
0.25
0.3
0.35
0 10 20 30 40 50 60
SIG
NA
L (i
cps)
5-H
IAA
/d2-
5H
IAA
Concentration (µg/mL)
A

65
Figure 25. A. Linear regression graph of the signal of the ratio 5-HIAA and d2-5HIAA against the
concentrations.B. Linear regression graph of the signal of the ratio 5-HT and 5-CH3o-HT against the
concentrations.
The selectivity of the method was determined by the EIC of a sample spiked with 5-HT and 5-
HIAA to the EIC from a blank plasma samples. The method was very selective towards the
two analytical species as seen in the overlay chromatogram (Fig. 24A and B). The precision
of the method for 5-HT and 5-HIAA was achieved based on repeatability with RSD of 3.07-
7.73% and 3.93-9.99% respectively. The percentage recoveries were 83-119% and 84-116%
for serotonin and 5-HIAA respectively, which shows good accuracy of the developed method.
The limit of detection and limit of quanitification for both analytes were determined to be 0.5
µg/mL and 1 µg/mL respectively suggesting good sensitivity of the method. Furthermore, in
comparison of the present study to previous research. Several analytical methods [70-165]
have been employed in the study of serotonin in plasma. LC-MS/MS has been used; 4.6
nmol/L was reported by De Jong et al. [53], 18.2 nmol/L by Moriarty et el. [52], 1.5 nmol/L
by Monaghan et al. [60]. HPLC with different detections have been employed as well and
varying concentrations have been reported, 114 nmol/L [72], 44 nmol/L [83], 141 nmol/L
[108] etc. Radioenzymatic assay has also been employed and different concentrations such as
y = 0.006x + 0.0179 R² = 0.9823
0
0.05
0.1
0.15
0.2
0.25
0.3
0.35
0 10 20 30 40 50 60
SIG
NA
L (i
cps)
5-H
T/5
-CH
3o-H
T
Concentration (µg/mL)
B

66
38 nmol/L [78], 22.6 nmol/L [82], 2 nmol/L [100], and 0.6 nmol/L [122] have been reported.
As seen in Table 1, mass spectrometric [53, 115] and radioenzymatic methods reported lower
estimate of serotonin in plasma compared to HPLC methods. The present study has reported
LOD of 0.5µg/mL (0.003 nmol/L) and LOQ of 1 µg/mL (0.006 nmol/L) which has given it
superiority over the previous methods. A random search using key words such as “normal
plasma levels of serotonin” and “plasma concentration of serotonin” revealed varying and
conflicting values. However, majority of the search results seems to be within the range of
0.4-5 µg/mL (0.002-0.030 nmol/L). Also the levels of serotonin and its associated metabolite
is age dependent thus the reported values accounts for normal adult, since the level is
increased in children and younger age groups [8]. Therefore, supposing that the above range
is correct, it can be said that some of the previous methods reported values that may give false
positives.
4.6 Method application on plasma samples from a research study
Ten human plasma samples from a project related to the determination of serotonin and
associated metabolites in plasma from pathological patients subjected to a diet rich in
vegetables were examined by using the developed method under optimal conditions.
The quantitative analyses (Table 5) revealed that in the majority of the samples the serotonin
levels were lower than the 5-hydroxyindole-acetic acid levels.

67
Table 5. Plasma concentration of serotonin and its acid metabolite in plasma samples from 10
vegetarian patients.
No 5-HT (µg/ml) 5-HIAA (µg/ml)
1 10.21±1.08 16.03±1.48
2 Below LOD 2.36±0.27
3 13.26±1.17 16.31±1.03
4 8.60±0.57 11.35±0.96
5 11.60±1.10 13.46±1.23
6 Below LOD Below LOQ
7 11.99±0.56 15.35±0.87
8 Below LOD below LOQ
9 7.69±0.72 9.30±0.69
10 12.60±1.36 15.75±1.47
The results are expressed as mean±standard deviation of triplicate values; LOD means limit of
detection (0.5 µg/mL), and LOQ means limit of quanitification (1 µg/mL).
This observation supports the earlier report [18], that intake of foods which are rich in
tryptophan (precursor of serotonin) increases the synthesis of serotonin. Thus, there will be
surplus serotonin in circulation, which will result to proportional increase in plasma levels of
5-HIAA since more serotonin will be available for degradation by the liver to 5-HIAA. Also
when the serotonergic activity is high, more serotonin is released in the synapses, and
consequently, metabolized to 5-HIAA. Biochemically, in certain health conditions such as
carcinoid tumour, the carcinoid causes abnormal of tryptophan metabolism, in which as much
as 60 %, other than the normal 1 %, of tryptophan may follow the serotonergic pathway [13].
Moreover, elevated plasma serotonin levels are hazardous, rapid elimination mechanisms
evolve to clear the excess 5-HT thereby converting it to its acid metabolite.
4.7 Concluding remarks
5-hydroxyindole-acetic acid has been utilised as a biomarker for carcinoid tumours and other
pathological diseases and serotonin has been used as an index for assessment of
gastrointestinal disorders (such as irretable bowel syndrome) as well as emotional related
complications (including depression). We have developed a method that proposes a simple

68
and rapid protocol for the simultaneous extraction and subsequent determination of serotonin
and 5-hydroxyindole-acetic acid in human plasma by liquid chromatogaphy tandem mass
spectrometry. The extraction protocols and other sample preparation steps are quite simple
and do not require much downstream preparation protocols. Nonethless, there were dificulties
encountered during the method development process most notably in the development of the
extraction protocols. Such set backs includes the clogging of the LC-MS/MS by protein
precipitates, however, the set back was subsquently circumvented by reevaluating the sample
preparation procedures.
The method may be suitable to be applied as a biomarker for determination of 5-HT and 5-
HIAA in plasma in patients suffering from several neuronal and pathological diseases such as
carcinoid tumour (in which elevated levels of these compunds may occur) and depression
related complications where both compounds are implicated and thus may be adequate to be
applied in routine analysis of 5-HT and 5-HIAA. The physiological concentration of 5-HT in
plasma is several times lower than compared to whole blood concentration, thus making the
measurement of serotonin in plasma very demanding and require a very sensitive technique as
the method reported here. The developd method proved to be quite sensitive, selective and
relatively no background noise in the chromatogram as shown in Fig. 24A and B.
In addition, to the best of our knowledge this is the first reported method that used a Doehlert
design to optimize multiple amounts of internal standard for the simultaneous determination
of serotonin and 5-hydroxyindole-acetic acid in plasma samples. This approach is
advantageous in that it helps to simulate different concentrations of internal standards across
several concentrations of the analytes as if it were in real terms thus avoiding the preparation
of several solutions. The developed method has reproducible retention times with acceptable
variations of less than 0.5% between samples.

69
REFERENCES
[1]. R. G Tinadaro. Peptides. 21 (11) (2000) 1585–1586.
[2]. M. M. Rapport, A. A. Green, H. Irvine Page. J. Biol. Chem. 176 (1948) 1243-1251.
[3]. M. Maurice Rapport. J. Biol. Chem. 180 (1949) 96.
[4]. E. Garelis, Adv. Exp. Med. Biol., 133 (1981) 717.
[5]. J. Barchas, E. Usdin, Eds, in "Serotonin and Behaviour", Academic Press, New York,
(1973) 192-194
[6]. T. Nagai, D.J. Kim, R.J. Delay, S.D. Roper. Chem. Senses 21(1996) 353–365.
[7]. C. Dreux, B. Bousquet, and D. Halter, Annal. Biol. Clin., 31 (1979) 283.
[8]. K. Vikenes, M. Farsyad and J.E. Nordrehaug. Circulation 100 (1999) 483-489
[9]. O.C. Ingebretsen, A.M Bakken, M. Fartsat. Clin. Chem. 31 (1985) 695-698.
[10]. O. Nygard, J.E. Nordrehaug, H. Refsum, P.M. U. Farstad, S.E. Volleset. N Engl. J. Med.
337(1991) 230-236.
[11]. H. Tamir, W. J. Kupsky, Y. L. Huang, M. D. Gershon. J. Cell Sci. 62 1(983) 439-458.
[12]. B. K. Kim, M. Steiner, M.G. Baldini. Anal. Biochem. 106 (1980) 92-98.
[13]. A. Harold. PH.D Harper. Biochemistry of serotonin. Diseases of the Colon & Rectum. 7
(2) (1964) 83-86.
[14]. F. Macchi, J. R. Homberg, F. Calabrese, C. Zecchillo, G. Racagni, M. A. Riva, R.
Molten. J. Neuroinflammation 10 (2013) 116.
[15]. C.R.J. Ruthven, M. Sandler, S.S. Brown, F.L. Mitchell, D.S. Young (Eds), Elsevier,
Amsterdam (1979) 1217-91
[16]. G.M. Tyce, P.M. VanHoute (Ed), "Biochemistry of Serotonin" Raven Press, Newyork,
(1985) 1-14.
[17]. M. Hamon, J. Glowinsky, Life Sci. 15 (1975) 1533.
[18]. S.M.O. Hourani, N.J. Cusak, Pharmacol. Rev. 43 (1991) 243.
[19]. K. Thorre, M. Pravda, S. Sarre, G. Ebinger, Y. Michotte, J. Chromatogr. B 694 (1997)
297.
[20]. P.I. Kema, G.E. Elisabeth de Vries, A.J. Frits Mustkiet. J. Chromatogr. B 747 (2000) 33-
48.
[21]. I. Blum, Y. Vered, E. Graff, Y. Grosskopf, R. Don, A. Harsat, O. Raz. Metabolism 41
(1992) 137–40.
[22]. B.L. Jacobs, E.C. Azmitia. Physiol Rev 72 (1992) 165–229.
[23]. D. Toneli, E. Gattavecchia, M. Gandolfi, J. Chromatgr. 231 (1982) 283.
[24]. F. Engbaek, B. Voldby. Clin. Chem. 28 (1982) 624–8.
[25]. I. Hindberg. Scand J. Clin Lab Invest 44 (1984) 47–51.
[26]. J. Chauveau, V. Fert, A.M. Morel, M.A. Delaage, Clin. Chem. Acta 62 (1991) 1178.
[27]. B.L. Goodwin, C.R.J. Ruthven, M.W.Weg, M. Sandler, Clin. Chem. Acta 62 (1975)
439.
[28]. S. Baba, M. Utoh, M. Horie, Y. Mori, J. Chromatogr. 307 (1984) 1.
[29]. M. Mumtaz, N. Narasimhachari, R.O. Friedel, G.N. Pandey, J.M. Davis, Res. Commun.
Chem. Pathol. Pharmacol. 36 (1982) 45.
[30]. N. Narasimhachari, M.C. Boadle-Biber, R.O. Friedel, Res. Commun. Chem. Pathol.
Pharmacol. 37 (1982) 413.

70
[31]. C.W. Tsang, C.L. Chan, P. Li, S.F. Pang, J. Chromatogr. B 682 (1996) 185.
[32]. P.S. Draganac, S.J. Steindel, W.G. Trawick, Clin. Chem. 26 (1980) 910.
[33]. P.T. Kissinger, C.S. Bruntlett, R.E. Shoup, Life Sci. 28 (1981) 455.
[34]. F. Artigas, E. Gelpi, J. Chromatogr. 394 (1987) 123.
[35]. Y. Qu, L. Moons, F. Vandesande J. Chromatogr. B 704 (1997) 351–358.
[36]. J. Wagner, P. Vital, M.g. Palfreyman, M. Zraika, S. Huot, J. Neurochem.
38 (5) (1982) 1241-1254.
[37]. P.T Kisinger, J. Pharmaceut Biomed. Anal. 14 (8-10) (1996) 871-880.
[38]. C.F. Saller, A.I Salama, J. Chromatogr. Biomed. Appl. 309 (1984) 287-298.
[39]. I.P. Kema, A.M.J. Schellings, C.J.M Hoppenbrouwers, H.M. Rutgers, E.G.E de Vries,
F.A.J. Muskiet, Clin. Chem. Acta 221 (1993) 143.
[40]. S. Sasa, C.L. Blank, Anal. Chim. Acta 104 (1979) 29.
[41]. J.P. Danaceau, G.M. Anderson, W.M. McMahon, D.J. Crouch, Anal. Toxicol. 27 (2003)
440.
[42]. D. Bose, A. Durgbanshi, M.E Capela-Peiro, M. Gil-Agusti, J. Esteve-Romero, S. Carda-
Broch, J. Pharm. Biomed. Anal. 36 (2004) 357.
[43]. K.L. Locker, D. Morrison, A.P. Watt, J. Chromatogr. B 750 (2001) 13.
[44]. R.D. Johnson, R.J. Lewis, D.V. Canfield, C.L Blank, J. Chromatogr. B 805 (2004) 223.
[45]. R.J. Slingerland, A.B.P. Van Kuilenburg, J.M Bodlaeder, H. Overmars, P.A Voute, A.H.
Van Gennip, J. Chromatogr. B 716 (1998) 65.
[46]. P. Pastore, G. Favaro, D. Badocco, A. Tapparo, S. Cavalli, G. Saccani, J. Chromatogr. A
1098 (2005) 111.
[47]. M. Ruth, R.M Williams, L. Bauce, W. Robert, R.W Lea, J. Singh, A. Keith, K.A.S
Sharkey, J. Autom. Nervous Syst. 61 (1996) 37.
[48]. T. Haung, P. Kissinger, Curr. Sep. 14 (1996) 114.
[49]. M. Moriarty, A. Lee, B. O’Connel, M. Lahane, H. Keeley, A. Furey. Chromatographia
75 (2012) 1257-1269.
[50]. K. Gregersen, L. Froyland, A. Berstad, P. Araujo. Talanta 75 (2008) 466-472.
[51]. M. Moriarty, A. Lee, B. O’Connel, M. Lahane, H. Keeley, A. Furey. Anal. Bioanal.
Chem. 401 (2011) 2481-2493.
[52]. T. Brand and G.M. Anderson. Clin. Chem. 57 (10) (2011) 1376-1386
[53]. W.H. De Jong, M.H. Wilkens, E.G. de Vries, I.P. Kema. Anal. Bioanal. Chem. 396
(2010) 2609–16.
[54]. A. Yoshida, T. Yamazaki, and T. Sakai, Clin. Chem. Acta 77 (1977) 95.
[55]. H.H. Brown, M.C. Rhindress, and R.E Griswold. Clin. Chem. 17 (1971) 92.
[56]. D.D. Chilcote, Clin. Chem, 18 (1972) 1379.
[57]. Z.D. Peterson, M.L. Lee, S.W. Graves. J. Chromatogr. B Anal. Technol. Biomed. Life
Sci 810 (1) (2004) 101-110
[58]. K. Eriksson, A. Ostin, J.O. Levin. J. Chromatogr. B Anal. Technol. Biomed. Life Sci
794 (1) (2003) 781-790
[59]. N. Stephanson, H. Dahl, A. Helander, O. Beck. J. Chromatogr. Biomed. 816 (1-2)
(2005) 107-112
[60]. P.J. Monaghan, H.A. Brown, L.A Houghton, B.G. Keevil. J. Chromatogr. B 877 (22)
(2009) 2163-2167.
71
[61]. J. Wieling. J. Chromatogr. 55 (2002) 107.
[62]. P.W. Araujo, R. G. Brereton. Trends in anal. Chem. 15 (1996) 2.
[63]. P. Araujo, S. Janagap, E. Holen. J. Chromatogr. A. 1260 (2012) 102-110.
[64]. L. Hing-Biu, P. E. Thomas, M. L. Svoboda. J. Chromatogr. A 1139 (2007) 45-52.
[65]. A.G. French, J. L. Martinez Vidal, J. L. Fernando Moreno, R. Romero-Gonzalez. J.
Chromatogr. A 1216 (2009) 4798-4808.
[66]. ISO/IEC 17025/2005: International organisation for standardization, (2005) 14.
[67]. P. Araujo. J. Chromatogr. B. 887 (2009) 2224-2234.
[68]. L. Huber. Validation of Analytical Method:http://www.chem.agilent.com/Library/primer
s/Public/5990-5140EN.pdf accessed in December, 2013, p. 15-25.
[69]. H. Y. Aboul-Enein. Accred. Qual. Assur. 5 (2005) 180-181.
[70]. J.H. Humphrey, R. Jaques. J. Physiol. 24 (1954) 305–10.
[71]. N. Crawford, B.T. Rudd. Clin. Chem. Acta 7 (1962) 114–21.
[72]. N. Crawford. Clin. Chem. Acta 8 (1963) 39–45.
[73]. N. Crawford. Clin. Chem. Acta 12 (1965) 274–81.
[74]. I.K.Genefke, P. Mandel. Clin. Chem Acta 19 (1968) 131–8.
[75]. B. Somerville, H. Hinterberger. Clin. Chem. Acta 65 (1975) 399–402.
[76]. J.M Kellum, M.J. Bernard. Gastroenterol 70 (1976) 516–22.
[77]. P. Frattini, M.L. Cucchi, G. Santagostino, G.L. Corona. Clin. Chem. Acta 92 (1979)
353–60.
[78]. M. Da Prada, G.B. Picotti. Br J. Pharmacol. 65 (1979) 653–62.
[79]. B.A. Bassiouni, A. A. Rafei. Eur J. Obstet. Gynecol. Reprod. Biol. 9 (1979) 81–8.
[80]. A. Parbtani, J.S. Cameron. I. Thromb. Res. 15 (1979) 109–25.
[81]. A. Yuwiler, G.L. Brammer, J.E. Morley, M.J. Raleigh MJ, J.W. Flannery, E. Geller.
Arch Gen Psychiatry 38 (1981) 619–26.
[82]. M.N. Hussain, M.J. Sole. Anal. Biochem. 111 (1981) 105–10.
[83]. P.C. Tagari, D.J. Boullin, C.L. Davies. Clin. Chem. 30 (1984) 131–5.
[84]. B. Marasini, M.L. Biondi, P. Pietta, A. Agostoni. Ric. Clin. Lab. 15 (1985) 63–9.
[85]. M.J. Schouten, J. Bruinvels. Anal. Biochem. 147 (1985) 401–9.
[86]. K. Sjölund, A. Nobin. Scand J. Gastroenterol 20 (1985) 304–8.
[87]. F. Artigas, M.J. Sarrias, E. Martinez, E. Gelpi. Life Sci 37 (1985) 441–7.
[88]. F. Artigas, J. Ortiz, M.J. Sarrias, E. Martinez, E. Gelpi. Clin. Chem. 32 (1986) 1985– 6.
[89]. G.M. Anderson, F.C. Feibel, D.J. Cohen. Life Sci 40 (1987) 1063–70.
[90]. M.J. Sarrias, F. Artigas, E. Martinez, E. Gelpi, E. Alvarez, C. Udina, M. Casas. Biol
Psychiatry 22 (1987) 1429–38.
[91]. Y. Sagara, Y. Okatani, S. Yamanaka, T. Kiriyama. J. Chromatogr. 431 (1988) 170–6.
[92]. E.H. Cook, B.L. Leventhal, D.X. Freedman. Biol. Psychiatry 24 (1988) 488–91.
[93]. M.L. Biondi, B. Marasini, E. Bianchi, A. Agostoni. Intl. J. Cardiol 19 (1988) 335–9.
[94]. Y. Imai, S. Ito, K. Maruta, K. Fujita. Clin. Chem. 34 (1988) 528–30.
[95]. J. Ortiz, F. Artigas, E. Gelpi. Life Sci 43 (1988) 983–90.
[96]. M.J.Sarrias, F. Artigas, E. Martinez, E. Gelpi. Biol Psychiatry 26 (1989) 695–706.
[97]. M.D. Ferrari, J. Odink, C. Tapparelli, G.M. Van Kempen, E.J. Pennings, G.W. Bruyn.
Neurology 39 (1989) 1239–42.

72
[98]. F. Artigas, M.J. Sarrias, E. Martıinez, E. Gelpi, E. Alvarez, C. Udina.
Psychopharmacology (Berl) 99 (1989) 328–32.
[99]. B. Marasini, M.L. Biondi, A. Agostoni. J. Clin. Chem. Clin. Biochem 27 (1989) 419–
21.
[100]. P. Herve, L. Drouet, C. Dosquet, J.M. Launay, B. Rain, G. Simonneau. Am J. Med 89
(1990) 117–20.
[101]. O. Naesh, I. Hindberg. Thromb. Res. 57 (1990) 665–8.
[102]. S. Nityanand, B.L. Tekwani, M. Chandra, K. Shanker, B.N. Singh. Life Sci 46 (1990)
367–72.
[103]. P.H. Winocour, P. Klimiuk, A. Grennan, R.D. Baker, C. Weinkove. Ann. Clin.
Biochem. 27 (1990) 238–43.
[104]. N.M. Barnes, J. Ge, W.G. Jones, R.J. Naylor, J.A. Rudd. Br. J. Cancer 62 (1990) 862–
4.
[105]. M.J. Sarrias, P. Cabre, E. Martinez, F. Artigas. J. Neurochem. 54 (1990) 783–6.
[106]. J. Chauveau, V. Fert, A.M. Morel, M.A .Delaage. Clin. Chem. 37 (1991) 1178–84.
[107]. B. Takkenberg, E. Endert, H.E. van Ingen, M. Ackermans. J. Chromatogr. 565 (1991)
430–5.
[108]. I. Blum, L. Nessiel, A. David, E. Graff, A. Harsat, L. Weissglas. J. Clin. Endocrinol.
Metab 75 (1992) 924–9.
[109]. M.H. Pietraszek, Y. Takada, A. Takada, M. Fujita, T. Watanabe, A. Taminato, T.
Yoshimi. Thromb. Res. 66 (1992) 765–74.
[110]. I. Hindberg, O. Naesh. Clin. Chem. 38 (1992) 2087–9.
[111]. I. P. Kema, A. M. Schellings, G. Meiborg, C.J. Hoppenbrouwers, F.A. Muskiet. Clin.
Chem. 38 (1992) 1730–6.
[112]. O. Naesh, C. Haedersdal, I. Hindberg, J. Trap-Jensen. Clin. Physiol. 13 (1993) 299–
307.
[113]. J. Ortiz, C. Mariscot, E. Alvarez, F. Artigas F. J. Affect Disor 29 (1993) 227–34.
[114]. J. Ishida, R. Iizuka, M. Yamaguchi. Clin. Chem. 39 (1993) 2355–6.
[115]. O. Beck, N.H. Wallen, A. Bröijersen, P.T. Larsson, P. Hjemdahl. Biochem. Biophys.
Res. Commun. 196 (1993) 260–6.
[116]. I. Blum, L. Nessiel, E. Graff, A. Harsat, U. Gabbay, J. Sulkes. Am J. Clin. Nutr. 57
(1993) 486–9.
[117]. C.M. Middelkoop, G.A. Dekker, A. A. Kraayenbrink, C. Popp-Snijders. Clin. Chem.
39 (1993) 1675–8.
[118]. P. Beaudry, A. Hadengue, J. Callebert, C. Gaudin, H. Soliman, R. Moreau. Hepatology
20 (1994) 800–3.
[119]. J. Malyszko, T. Urano, R. Knofler, A. Taminato, T. Yoshimi, Y. Takada, A. Takada.
Thromb. Res. 75 (1994) 569–76.
[120]. C.P. Bearcroft, M.J. Farthing, D. Perrett. Biomed. Chromatogr. 9 (1995) 23–7.
[121]. C. Matuchansky, J.M. Launay. Gastroenterol. 108 (1995) 743–51.
[122]. P. Herve, J.M. Launay, M.L. Scrobohaci, F. Brenot, G. Simonneau, P. Petitpretz.
Am J. Med. 99 (1995) 249–54.
[123]. K. Taniguchi. J. Obstet. Gynaecol. 21(1995) 37–42.

73
[124]. D. Fekkes, L. Timmerman, L. Pepolinkhuizen. Eur Neuropsychopharmacol 5 (1995)
286–7.
[125]. E. Pussard, N. Guigueno, O. Adam, J.F. Giudicelli. Clin. Chem. 42 (1996) 1086-91.
[126]. J. Ishida, M. Takada, M. Yamaguchi. J. Chromatogr. B Biomed. Sci Appl 692 (1997)
31–6.
[127]. C.P. Bearcroft, D. Perrett, M.J. Farthing. Gut. 42 (1998) 42–6.
[128]. G. Carrasco, M.A. Cruz, V. Gallaido, P. Miguel, M. Lagos, C. Gonzalez. Life Sci 62
(1998) 1323–32.
[129]. X. Paez, L. Hernandez. J. Chromatogr. B Biomed. Sci Appl 720 (1998) 33–8.
[130]. C.G. Missouris, F.P. Cappuccio, E. Varsamis, J.L. Barron, E. Carr, N.D. Markandu,
G.A. MacGregor. Am Heart J 135 (1998) 838–43.
[131]. A.M. Castejon, X. Paez, L. Hernandez, L.X. Cubeddu. J. Pharmacol. Exp. Ther. 291
(1999) 960–6.
[132]. W. Zhao, L. Zhao, W. Zhao. Zhonghua Fu Chan Ke Za Zhi 34 (1999) 406–8.
[133]. B. Spivak, Y. Vered, E. Graff, I. Blum, R. Mester, A. Weizman. Biol. Psychiatry 45
(1999) 840–5.
[134]. A. Kereveur, J. Callebert, M. Humbert, P. Herve, G. Simonneau, J, M. Launay.
Arterioscler Thromb. Vasc. Biol. 20 (2000) 2233–9.
[135]. H.J. Gijsman, R.J. Verkes, J.C. Schouten-Verhagen, R.C. Schoemaker, J.M. Van
Gerven, R.H. De Rijk, G.M. Van Kempen. Hum. Psychopharmacol 15 (2000) 417–21.
[136]. J. Ishida, M. Takada, N. Hitoshi, R. Iizuka, M. Yamaguchi J. Chromatogr. B Biomed.
Sci Appl 738 (2000) 199-206
[137]. M.S. Lee, F.C. Cheng, H.Z. Yeh, T.Y. Liou, J.H. Liu. Clin. Chem. 46 (2000) 422–3.
[138]. S.M. Dursun, A. Szemis, H. Andrews, P. Whitaker, M.A. Reveley. J. Psychiatry
Neurosci 25 (2000) 347–52.
[139]. Y. Vered, P. Golubchik, T. Mozes, R. Strous, A. Nechmad, R. Mester. Hum.
Psychopharmacol 18 (2003) 395–99.
[140]. A.A. Patkar, R. Gopalakrishnan, P.C. Naik, H.W. Murray, M.J. Vergare, C.A Marsden.
Alcohol Alcohol 38 (2003) 224 –31.
[141]. L.A. Houghton, W. Atkinson, R.P. Whitaker, P.J. Whorwell, M.J. Rimmer. Gut. 52
(2003) 663–70.
[142]. Y. Hirowatari, H. Katsuko, K. Hiroshi, T. Iwasaka, H. Takahashi. Clin. Biochem. 37
(2004) 191–7.
[143]. K. Hara, Y. Hirowatari, M. Yoshika, Y. Komiyama, Y. Tsuka, H. Takahashi. J. Lab
Clin. Med. 144 (2004) 31–7.
[144]. B. Spivak, P. Golubchik, T. Mozes, Y. Vered, A. Nechmad, A. Weizman, R.D. Strous.
Neuropsychobiology 50 (2004) 157–60.
[145]. M.T. Morgadinho, C.A. Fontes Ribeiro, T.R. Macedo. Biomed. Chromatogr. 18 (2004)
739–44.
[146]. F.M.M.A Van der Heijden, S. Tuinier, D. Fekkes D, A.E.S. Sijben, R.S. Kahn, W.M.A
Verhoeven. Eur. Neuropsychopharmacol 14 (2004) 259–65.
[147]. Y.S. Jeong, H. Park, E.J. Choi, Y.G. Kim, S.I. Lee. Korean J. Gastroenterol. 44 (2004)
142–6.
74
[148]. R. Ohkawa, Y. Hirowatari, K. Nakamura, S. Ohkubo, H. Ikeda, M. Okada, M. Tozuka.
Clin. Biochem. 38 (2005) 1023–6.
[149]. Y. Mohri, M. Fumoto, I. Sato-Suzuki, M. Umino, H. Arita. Pain 118 (2005) 35–42.
[150]. S.P. Dunlop, N.S. Coleman, E. Blackshaw, A.C. Perkins, G. Singh, C.A. Marsden,
R.C. Spiller. Clin. Gastroenterol. Hepatol. 3 (2005) 349–57.
[151]. W. Atkinson, S.J. Lockhart, L.A. Houghton, B.G. Keevil. J. Chromatogr. B Anal.
Technol. Biomed. Life Sci (832) 2006 173–6.
[152]. W. Atkinson, S. Lockhart, P.J. Whorwell, B. Keevil, L.A. Houghton. Gastroenterol.
130 (2006) 34–43.
[153]. S. Tyano, G. Zalsman, H. Ofek, I. Blum, A. Apter, L. Wolovik. Eur
Neuropsychopharmacol 16 (2006) 49-57.
[154]. H. Mitani, Y. Shirayama, T. Yamada, R. Kawahara. Prog Neuropsychopharmacol Biol.
Psychiatry 30 (2006) 53–4.
[155]. M.B. Hansen, F. Arif, L. Wallin, J.F. Pedersen. Scand J. Clin. Lab. Invest 66 (2006)
395–406.
[156]. N.S. Coleman, S. Foley, S.P. Dunlop, J. Wheatcroft, E. Blackshaw, A.C. Perkins. Clin.
Gastroenterol. Hepatol. 4 (2006) 874–81.
[157]. Y. Ban, T. Watanabe, A. Miyazaki, Y. Nakano, T. Tobe, T. Idei. Atherosclerosis 195
(2007) 153–9.
[158]. R. Teradaira, Y. Itoh, K. Kawai, H. Ishikawa, K. Ohashi, Y. Nagamura. Int. Congr.
Ser. 1304 (2007) 175–9.
[159]. D.M. Culafic, D.S. Mirkovic, M.D. Vukcevic, J.S. Rudic. World J. Gastroenterol. 13
(2007) 5750–3.
[160]. A. Ertugrul, G. Ucar, K. Basar, B. Demir, S. Yabanoglu, B. Ulug. Psychiatry Res. 149
(2007) 49–57.
[161]. L. A. Houghton, W. Atkinson, C. Lockhart, P.J. Whorwell, B. Keevil.
Neurogastroenterol Motil 19 (2007) 724–31.
[162]. M.B.Hansen, F. Arif, H. Gregersen, H. Bruusgaard, L. Wallin. Physiol. Res. 57 (2008)
63–71.
[163]. D.J. Lederer, E.M. Horn, E.B. Rosenzweig, W. Karmally, M. Jahnes, R.J. Barst, S.M.
Kawut. Pulm Pharmacol. Ther. 21 (2008) 112–4.
[164]. P. Golubchik, T. Mozes, Y. Vered, A. Weizman. Prog Neuropsychopharmacol Biol.
Psychiatry 33 (2009) 1223–5.
[165]. M. Frost, T.E. Andersen, V. Yadav, K. Brixen, G. Karsenty, M. Kassem. J. Bone
Miner Res. 25 (2010) 673–5.