Headspace solid-phase microextraction gas chromatography-mass spectrometry determination of volatile...
9
Analytical Methods Headspace solid-phase microextraction gas chromatography–mass spectrometry determination of volatile compounds in different varieties of African star apple fruit (Chrysophillum albidum) Ola Lasekan a,⇑ , Alfi Khatib c , Hanisah Juhari b , Parveen Patiram a , Seye Lasekan b a Department of Food Technology, University Putra Malaysia, Serdang, UPM 43400, Malaysia b Department of Food Science, University Putra Malaysia, Serdang, UPM 43400, Malaysia c Department of Pharmaceutical Technology, International Islamic University Malaysia, Malaysia article info Article history: Received 15 July 2011 Received in revised form 4 January 2013 Accepted 2 May 2013 Available online 24 May 2013 Keywords: African star apple fruit HS-SPME Volatiles PLS-DA PLS-regression coefficient abstract The volatile compounds in four selected African star apple fruit (Chrysophyllum albidum) varieties were isolated and identified using the headspace solid-phase microextraction (HS-SPME) coupled with gas chromatography–mass spectrometry (GC–MS). A total of 59 compounds were identified. Application of the aroma extract dilution analysis (AEDA) to the aroma distillates from the fruits revealed 45 odour- active compounds in the flavour dilution (FD) factor range of 4–128. Among them, the highest odour activities (FD factors) were determined for methylhexanoate, acetophenone and ethyl dodecanoate. Moreover, aroma lipophilicity appears to reflect molecular conformation. Further analysis of the similar- ities and differences between the fruit varieties in terms of the key odourants by the application of PLS-DA and PLS-regression coefficient showed strong positive correlation between the very sweet/sweet varieties and 10 key odourants. The odourants included ethyl acetate, acetyl methyl carbinol, methylhex- anoate, sabinene, p-cymene, methylbenzoate, ethylbenzoate, geraniol, cis-a-bergomotene, acetophenone, and ethyl dodecanoate. Ó 2013 Elsevier Ltd. All rights reserved. 1. Introduction African star apple fruit, locally called, ‘agbalumo’ and ‘udara’, is the species Chrysophyllum albidum, which grows in many ecozones of West Africa (Bada, 1997). The fruit belongs to the family Sapot- aceae. African star apple is a large berry containing 4–5 flattened seeds (Keay, 1989). Nine fruit types have been identified based on the ripe fruit size, colour and taste which varied from very sweet to sour (Oyebade, Ekeke, & Adeyemo, 2011). The fruit pulp is rich in iron and vitamin C (CENTRAD., 1999). The fleshy pulp of the fruit is eaten as snacks and relished by both young and old (Centrad, 1999). Also, the fruit has been found to have the highest content of ascorbic acid with 1000–3330 lg of ascorbic acid per 100 g of edible fruit (Abiodun & Oladapo, 2011). Currently, the fruit pulp is being used in the formation of diet soft drinks in some bev- erage industries (Oyelade, Odugbenro, Abioye, & Raji, 2005). From a consumer perspective, the most appealing features of a beverage are its flavour and nutrition. Beverage flavour apprecia- tion is one of the first evaluation signals along with beverage appearance that is encountered by consumers during consumption of a beverage. Volatile compounds play an important role in the organoleptic characteristic of fruit beverages. It has been recogni- sed that the aroma constituents of a beverage have a leading con- tribution to its varietal character. The flavour of a beverage is extremely complex due to the great number of compounds present which have different polarities, volatilities and occurs in a wide range of concentrations (Vila, Mira, Lucena, & Recamales, 1999). Therefore, sample preparation, especially, extraction and concen- tration of aroma compounds remain one of the critical areas in ar- oma volatiles analysis. Continuous liquid–liquid extraction has been widely used in sample preparation for the determination of wine volatiles (Diez, Cela, & Perez-Bustamante, 1985). Other meth- ods include XAD-2 resin extraction (Zhou, Riesen, & Gilpin, 1996), supercritical fluid extraction (Lasekan & Abbas, 2010), headspace solid-phase microextraction (Liu & Yang, 2002; Miller & Stuart, 1999) and ultrasound (Vila et al., 1999). However, headspace so- lid-phase microextraction (HS-SPME) has become very popular for studying the aroma profile of fruits (Liu & Yang, 2002). Also, it isolates volatiles and semi-volatiles and can be suitable for defin- ing marker compounds for the discrimination of samples. The interactions between sugars and acids on several flavour characteristics in complex media such as foods or beverages have received some reviews (Balwin et al., 1998; Stampanoni, 1993). For instance, Stampanoni (1993) showed that ethyl butyrate in- creased in intensity with the addition of sucrose in lemon. Balwin 0308-8146/$ - see front matter Ó 2013 Elsevier Ltd. All rights reserved. http://dx.doi.org/10.1016/j.foodchem.2013.05.081 ⇑ Corresponding author. Tel.: +60 3 8946 8535; fax: +60 3 8942 3552. E-mail address: [email protected] (O. Lasekan). Food Chemistry 141 (2013) 2089–2097 Contents lists available at SciVerse ScienceDirect Food Chemistry journal homepage: www.elsevier.com/locate/foodchem
Transcript of Headspace solid-phase microextraction gas chromatography-mass spectrometry determination of volatile...

Food Chemistry 141 (2013) 2089–2097
Contents lists available at SciVerse ScienceDirect
Food Chemistry
journal homepage: www.elsevier .com/locate / foodchem
Analytical Methods
Headspace solid-phase microextraction gas chromatography–massspectrometry determination of volatile compounds in different varietiesof African star apple fruit (Chrysophillum albidum)
0308-8146/$ - see front matter � 2013 Elsevier Ltd. All rights reserved.http://dx.doi.org/10.1016/j.foodchem.2013.05.081
⇑ Corresponding author. Tel.: +60 3 8946 8535; fax: +60 3 8942 3552.E-mail address: [email protected] (O. Lasekan).
Ola Lasekan a,⇑, Alfi Khatib c, Hanisah Juhari b, Parveen Patiram a, Seye Lasekan b
a Department of Food Technology, University Putra Malaysia, Serdang, UPM 43400, Malaysiab Department of Food Science, University Putra Malaysia, Serdang, UPM 43400, Malaysiac Department of Pharmaceutical Technology, International Islamic University Malaysia, Malaysia
a r t i c l e i n f o a b s t r a c t
Article history:Received 15 July 2011Received in revised form 4 January 2013Accepted 2 May 2013Available online 24 May 2013
Keywords:African star apple fruitHS-SPMEVolatilesPLS-DAPLS-regression coefficient
The volatile compounds in four selected African star apple fruit (Chrysophyllum albidum) varieties wereisolated and identified using the headspace solid-phase microextraction (HS-SPME) coupled with gaschromatography–mass spectrometry (GC–MS). A total of 59 compounds were identified. Application ofthe aroma extract dilution analysis (AEDA) to the aroma distillates from the fruits revealed 45 odour-active compounds in the flavour dilution (FD) factor range of 4–128. Among them, the highest odouractivities (FD factors) were determined for methylhexanoate, acetophenone and ethyl dodecanoate.Moreover, aroma lipophilicity appears to reflect molecular conformation. Further analysis of the similar-ities and differences between the fruit varieties in terms of the key odourants by the application ofPLS-DA and PLS-regression coefficient showed strong positive correlation between the very sweet/sweetvarieties and 10 key odourants. The odourants included ethyl acetate, acetyl methyl carbinol, methylhex-anoate, sabinene, p-cymene, methylbenzoate, ethylbenzoate, geraniol, cis-a-bergomotene, acetophenone,and ethyl dodecanoate.
� 2013 Elsevier Ltd. All rights reserved.
1. Introduction
African star apple fruit, locally called, ‘agbalumo’ and ‘udara’, isthe species Chrysophyllum albidum, which grows in many ecozonesof West Africa (Bada, 1997). The fruit belongs to the family Sapot-aceae. African star apple is a large berry containing 4–5 flattenedseeds (Keay, 1989). Nine fruit types have been identified basedon the ripe fruit size, colour and taste which varied from verysweet to sour (Oyebade, Ekeke, & Adeyemo, 2011). The fruit pulpis rich in iron and vitamin C (CENTRAD., 1999). The fleshy pulpof the fruit is eaten as snacks and relished by both young and old(Centrad, 1999). Also, the fruit has been found to have the highestcontent of ascorbic acid with 1000–3330 lg of ascorbic acid per100 g of edible fruit (Abiodun & Oladapo, 2011). Currently, the fruitpulp is being used in the formation of diet soft drinks in some bev-erage industries (Oyelade, Odugbenro, Abioye, & Raji, 2005).
From a consumer perspective, the most appealing features of abeverage are its flavour and nutrition. Beverage flavour apprecia-tion is one of the first evaluation signals along with beverageappearance that is encountered by consumers during consumptionof a beverage. Volatile compounds play an important role in the
organoleptic characteristic of fruit beverages. It has been recogni-sed that the aroma constituents of a beverage have a leading con-tribution to its varietal character. The flavour of a beverage isextremely complex due to the great number of compounds presentwhich have different polarities, volatilities and occurs in a widerange of concentrations (Vila, Mira, Lucena, & Recamales, 1999).Therefore, sample preparation, especially, extraction and concen-tration of aroma compounds remain one of the critical areas in ar-oma volatiles analysis. Continuous liquid–liquid extraction hasbeen widely used in sample preparation for the determination ofwine volatiles (Diez, Cela, & Perez-Bustamante, 1985). Other meth-ods include XAD-2 resin extraction (Zhou, Riesen, & Gilpin, 1996),supercritical fluid extraction (Lasekan & Abbas, 2010), headspacesolid-phase microextraction (Liu & Yang, 2002; Miller & Stuart,1999) and ultrasound (Vila et al., 1999). However, headspace so-lid-phase microextraction (HS-SPME) has become very popularfor studying the aroma profile of fruits (Liu & Yang, 2002). Also,it isolates volatiles and semi-volatiles and can be suitable for defin-ing marker compounds for the discrimination of samples.
The interactions between sugars and acids on several flavourcharacteristics in complex media such as foods or beverages havereceived some reviews (Balwin et al., 1998; Stampanoni, 1993).For instance, Stampanoni (1993) showed that ethyl butyrate in-creased in intensity with the addition of sucrose in lemon. Balwin

2090 O. Lasekan et al. / Food Chemistry 141 (2013) 2089–2097
et al. (1998) associated aldehydes such as cis-3-hexenal, cis-3-hex-enol and trans-2-hexenal with sourness in tomato respectively.However, there is no similar information on African star apple.
The aim of this study was to establish an integrated flavour pro-file for the African star apple and to observe differences in the fla-vour profiles with respect to fruit types (e.g. sweet or sour).Volatile constituents were quantified with HS-SPME, GC–MS andresults were statistically analysed with multivariate statisticaltechniques (principal component analysis).
2. Materials and methods
2.1. Samples
Four different fruit varieties of C. albidum of differing morpho-logical features were sampled and collected from different partsof Nigeria. Each variety contained 25 fruits and characterisationwas based on ripe fruit colour, fruit length, fruit diameter, fruitshape, pulp colour and taste. Samples were separated individually,randomized and stored (20 �C, 85% RH). Four fruit types (verysweet, sweet, sour and bitter) in the colour stages 8–9 (CBT-scale)(Anonymous, 1999) were used.
2.1.1. ChemicalsThe following chemicals; 1-propanol, ethyl acetate, 1-butanol,
acetyl methyl carbinol, 3-methyl-1-butanol, hexanal, ethyl (E)-2-butenoate, methional, methylhexanoate, ethylhexanoate, meth-ylbenzoate and ethylhexanoate were obtained from (Aldrich,Steinhein, Germany). 1-Penten-3-ol, 2,3-hexanedione, a-pinene,limonene, 2-phenethyl alcohol, hexylbutanoate, nerol, a-copaneand ethyldodecanoate were from (Merck, Chemicals, Darmstadt,Germany).
Stock standard solutions of 103 or 104 lg mL�1of each compo-nent was prepared by dissolving 50 mg (approximately 3 drops)of each pure standard in a 10 mL flask. The flask was made up tothe 10 mL mark with ethanol (40% v/v) and labelled A. Two milli-litres (2 mL) sample was taken from flask A and transferred intoanother 10 mL flask. The new flask was subsequently made up tothe 10 mL mark with ethanol. The solutions with concentrationsof 103 or 104 lg mL�1 were stored at 4 �C. The fruit juice (50 mL)was spiked with 0.5–1 mL of this solution.
2.2. Chemical analyses
The acid and sugar analyses were carried out as double estima-tions per sample with 6 fruits per sample. After blending, 50 g ofhomogenised fruit pulp was diluted with 100 mL distilled waterand boiled for 5 min. After cooling, the sample was diluted to250 mL with distilled water and filtered. The content of titratableacid was determined by titrating 0.1 M NaOH with 50 mL of the fil-trate (LMBG, 1983).
The sugar content was measured by the enzymatic detection ofglucose and fructose as reported by Krumbein, Peters, and Bruch-ner (2004). Results were summarised as reducing sugars (mg g�1).
2.3. Extraction by headspace solid-phase microextraction (HS-SPME)
The pulp of the African star apple fruit (50 g) was blended for30 s and the mixture was held for 180 s. 50 mL of CaCl2 was addedto the mixture and blended for 10 s. The fruit juice was placed in a10 mL vial containing a magnetic stirring bar. NaCl (26%) wasadded to the sample matrix to decrease the solubility of volatilecompounds in the water phase and give the ‘salting-out’ effect.The sample vial was sealed by an air-tight Teflon septum and analuminium cap. The SPME fibre, coated with 2 cm–50/30 lm
divinylbenzene (DVB)/carboxen/polydimethylsiloxane (PDMS), bySupelco (Bellefonte, PA, USA) was manually inserted into the head-space of the sample vial. The extraction was done at 50 �C for30 min prior to injection into the GC–MS.
2.4. HPLC lipophilicity measurement
Compound lipophilicity was determined based on its retentiontime on a reversed phase HPLC column. The HPLC used was aHewlett–Packard series 1100 with diode array and HP1097Arefractive index detection (Avondale, PA). The column used(250 mm � 4 mm) was packed with Nucleosil 50-5 C18, particlesize 5 lM (Macherey–Nagel, Oenstinger, Switzerland). The mobilephase was made up volumetrically from various combinations(30–70%) of methanol and a solution containing 3-morpholinopro-pane sulphonic acid buffer (0.01 M) and n-decylamine (0.2%, v/v).The pH of the aqueous solution was adjusted before to 7.4. Reten-tion time (tr) were measured at room temperature with a1.0 mL min�1 flow rate. The column dead time (t0) was determinedwith uracil. The capacity factor was defined as K = (tr� t0)/t0. LogKfor 100% water (logKw) was linearly extrapolated from results ob-tained from different mobile phase compositions.
2.5. GC–MS analysis
The fruit extract was analysed using a Shimadzu (Kyoto, Japan)QP-5050A GC–MS instrument equipped with a GC-17A Ver. 3 gaschromatograph with a flame ionisation detector (FID). The columnwas a non-polar BP X 5 (5% phenylpolysilphenylenesiloxane) cap-illary columns (30 m � 0.25 mm i.d., film thickness 0.25 lm Scien-tific Instrument Services, Inc, NJ; USA). Helium was used as carriergas at a flow rate of 1.5 mL min�1, injection temperature, 250 �C;detector temperature, 280 �C; temperature program commencedat 50 �C and held for 3 min, then raised to 250 �C at a rate of15 �C.min�1, held for 10 min and then increased to 280 �C at a rateof 10 �C. min�1, with a final hold time of 5 min. The effluent fromthe capillary column was split into 2:1 (by vol.) onto two uncoatedbut deactivated fused silica capillaries (50 cm � 0.32 mm) leadingto a FID and a sniffing port.
The mass spectrometer was operated in electron impact modewith the following conditions. The source temperature was250 �C; the quadruple temperature selected was 280 �C and therelative electron multiplier voltage (EM) applied was 400 V witha resulting voltage of 1553 V. In order to improve the detectionlimits, the selected ion monitoring (SIM) mode was used. The dataacquisition was carried out with the HP-Chemstation Software andidentified using the NIST/NBS75 K database.
2.5.1. Gas chromatography–olfactometryGC separations were carried out on an Agilent 6890 N instru-
ment equipped with a split-splitless injector, a FID and an ODP 2Olfactory Detector Port (Gerstel, Mulheim, Germany). At the col-umn outlet, the eluate was split 1:1 to simultaneously detect vol-atile compounds by FID and sniffing. Samples (4 ll) were separatedon a 30 m � 0.25 mm i.d., 0.25 lm film thickness BPx5 column(Scientific Instrument Services, Inc, NJ, USA) according to the sametemperature programme as reported for GC–MS analysis. Heliumwas used as carrier gas at the flow rate of 1.5 mL min�1. Injector(split ratio 1:7) and FID temperatures were 250 �C; hydrogen, airand nitrogen (makeup) flow rates were 30, 450 and 30 mL min�1,respectively.
Quantitative data were obtained by relating the peak area ofeach compound to that of the corresponding external standardand were expressed as mg kg�1. Identified compounds without areference compound were expressed as miligrammes per kilo-gramme methyl butanoate equivalent.

Table 2Slopes for extracted compounds sampled individually and in mixture for the exposuretime of 30 min.
Compounds Sampling time (30 min)
Individual compounds Compounds in mixture
1-Propanol 0.76 ± 0.0 0.78 ± 0.0Ethyl acetate 0.81 ± 0.0 0.84 ± 0.01-Butanol 0.95 ± 0.1 0.96 ± 0.0Acetyl methyl carbinol 0.13 ± 0.0 0.15 ± 0.0
O. Lasekan et al. / Food Chemistry 141 (2013) 2089–2097 2091
The GC–O analyses were performed by three trained panelists,who presented normalised response and satisfactory sensitivityand reproducibility and agreement with one another. For eachGC–O analysis, sniffing was divided into three parts of 20 minand each panelist participated in the sniffing. All panelists evalu-ated each of the two replicate samples once for each fruit variety.Samples were presented in a completely randomised order blockedby sample replication. Only the odours detected by all the threepanelists were considered to be valid.
3-Methyl-1-butanol 0.23 ± 0.0 0.31 ± 0.0Hexanal 0.56 ± 0.1 0.60 ± 0.0Ethyl-(E)-2-butenoate 1.19 ± 0.2 1.22 ± 0.1Methional 0.41 ± 0.0 0.45 ± 0.1Methyl hexanoate 0.15 ± 0.0 0.17 ± 0.01-Penten-3-ol 0.52 ± 0.1 0.53 ± 0.0a-Pinene 0.79 ± 0.2 0.83 ± 0.1Limonene 0.55 ± 0.0 0.56 ± 0.12-Phenethyl alcohol 0.28 ± 0.0 0.30 ± 0.0Hexyl butanoate 0.10 ± 0.0 0.13 ± 0.0Nerol 0.42 ± 0.0 0.44 ± 0.1Ethyl dodecanoate 4.98 ± 0.3 5.01 ± 0.6Methyl butanoate 0.41 ± 0.0 0.42 ± 0.0
2.6. Aroma extracts dilution analysis
The flavour dilution (FD) factors of the odour-active compoundswere determined by GC–olfactometry (GC/O) of serial dilutionsusing the AEDA approach (Schieberle, 1995). The following dilutionseries: the original fruit extracts (400 ll) from 600 mL of fresh juicewas diluted stepwise by addition of dichloromethane (1:1) until noodourant was detectable by sniffing of the highest dilution. GC/Owas performed with aliquots (0.5 ll), using capillary BPX5. In total,three experienced sniffers were used to perform the AEDA experi-ments. Their response to the individual compounds did not differby >2 FD factors.
2.7. Determination of odour thresholds
Odour threshold was determined as described by Schieberle(1996), but using water instead of sunflower oil as solvent. Thesamples were presented in order of increasing concentrations in1:1 dilution steps. The odour thresholds of the compounds werenasally determined by the triangle test and by using odourlesstap water as a blank. Determinations were performed in three sep-arate sessions and values were averaged.
2.8. Statistical analysis
Partial least square discriminate analysis (PLS-DA) and PLS-regression coefficient were chosen as an exploratory technique todescribe and summarise data by grouping variables that are corre-lated. The multivariate statistical analyses were performed withthe SIMCA-P software (v. 10.0, Umetricus, Umea, Sweden) usingmean centred scaling method. Dimension of data matrices was241 � 18.
Table 1Characteristics of the calibration curves.
Analyte Aroma threshold (lg L�1) [ref] C
1-Propanol 9000a 0Ethyl acetate 500 01-Butanol 1280 0Acetyl methyl carbinol 800 03-Methyl-1-butanol 1810 0Hexanal 5.8 0Ethyl-(E)-2-butenoate 13.6 0Methional 0.40a 0Methyl hexanoate 130 01-Penten-3-ol 400a 02,3-Hexanedione Nd 0a-Pinene 120a 0Limonene 10 02-Phenethyl alcohol 1000a 0Hexyl butanoate 250 0Nerol 300 0Ethyl dodecanoate 1500a 0Methyl butanoate 28 0
a Rychlik, Schieberle and Grosch (1998).
3. Results and discussion
3.1. Validation
Table 1 shows the calibration range over which the high correla-tion coefficients were achieved consistently for each analyte in theextracted African star apple juice matrices. The extracts were spikedwith increasing levels of the combined dilute stock solution of ana-lytes, so that for methyl butanoate (for example) the resulting con-centrations were made from (0.1–500 lg l�1) in the SPME vials. Theresultant calibration functions showed high linearity (r2 > 0.9974)(Table 1). To check the influence of a sample matrix on the analytesextraction, the target compounds were sampled in a mixture withincreasing levels for two different sampling times (30 and 5 min)respectively. Linear calibration curves were achieved in all cases.The slopes determined were compared to the slopes obtained whencompounds were sampled individually (data not shown). Identicalresults were noticed and this shows that there is no competitiveadsorption due to other analytes or moisture.
3.2. Volatile compounds in African star apple
HS-SPME/GC–MS analyses of the juices obtained from fourdifferent varieties of African star apples (C. albidum) led to the
alibration range (lg L�1) Equation R2
.1–500 y = 0.762x 1.0000
.1–500 y = 0.807x + 0.001 0.9999
.2–200 y = 0.952x + 0.003 0.9996
.2–500 y = 0.127x + 0.001 0.9986
.1–200 y = 0.226x + 0.009 0.9984
.1 – 200 y = 0.526x + 0.005 0.9974
.1–200 y = 1.186x + 0.223 0.9999
.5–500 y = 0.408x + 0.013 0.9986
.1–200 y = 0.148x + 0.039 0.9998
.5–500 y = 0.523x + 0.007 0.9999
.1–500 y = 0.181x + 1.701 0.9997
.2–500 y = 0.789x + 0.003 0.9999
.2–500 y = 0.551x + 0.258 0.9988
.2–500 y = 0.280x + 0.034 0.9996
.1–200 y = 0.098x + 0.001 0.9994
.2–100 y = 0.417x + 0.004 0.9994
.1–500 y = 4.975x + 0.008 0.9998
.1–500 y = 0.408x + 0.001 0.9999

2092 O. Lasekan et al. / Food Chemistry 141 (2013) 2089–2097
identification of 59 odour-active compounds. However, the appli-cation of the aroma extracts dilution analysis (AEDA) on the freshjuice revealed 45 odour-active compounds in the FD factor range of4–128 (Table 2). A great variety of odour qualities, such as fruity,
Table 3Volatile compounds of African star fruit identified by HS-SPME/GC–MS.
No. Compound Odour descriptiona R
1 1-Propanol 52 Ethyl acetate Fruity, brandy-like 63 1-Butanol 74 1-Penten-3-ol Green,grassy 75 Acetyl methyl carbinol Buttery 76 3-Methyl-1-butanol Solvent 77 2,3-Hexanedione Sweet creamy 78 Hexanal Green, grassy 89 Ethyl (E)-2-butenoate Fruity 810 (Z)-3-Hexen-1-ol Green,grassy 811 p-Xylene Sweet 812 Methional Potato-like 913 Methylhexanoate Pineapple-apricot 914 a-Pinene Dry woody 915 Sabinene Citrus,woody 916 b-Pinene Woody 917 Myrcene Spicy,balsam-like 918 Ethylhexanoate Fruity 919 d-3-Carene Sweet pungent 120 p-Cymene Woody,spicy 121 Limonene Orange-like 122 Benzyl alcohol Mild fruity 123 (Z)-b-Ocimene Woody-green 124 Cyclohexyl acetate Fruity 125 Y-Terpinene Lemon-like 126 Acetophenone Cherry-like 127 Methyl benzoate Flora,almond 128 2-Phenethyl alcohol Honey 129 Ethyl benzoate Fruity 130 Terpinen-4-ol Earth 131 p-Cymen-8-ol 132 a-Terpineol Flora,sweet 133 Hexyl butanoate Apricot-like 134 Nerol Rose-like 135 3-isopropylbenzaldehyde 136 Geraniol Sweet, floral 137 Methyl decanoate 138 a-Copaene Woody 139 cis-a-Bergamotene Floral 140 2-(4-Isobutylphenyl)propanal 141 2-Methyl oxime undecanone Green 142 a-Muurolene Woody 143 b-Bisabolene Balsamic 144 Ethyl dodecanoate Sweet,floral 145 Hexadecane Waxy 146 Heptadecane 147 3-Methyl octadecane 148 1,2,3-Tributylbenzene 149 Hexadecanoic acid Waxy 150 2,3-Dimethyl nonadecane 151 n-Eicosane 252 Octadecanoic acid Fatty 253 1-Octadecanol acetate 254 Bis (2-ethylhexyl)-phthalate 255 Malonic acid, 3 –methylbutyl Pentadecyl ester Slighty fruity 256 8,8-Dipenthyl heptadecane 257 2,2-Methylene bis (6-tert-butyl)p-cresol 258 Urs-12-en-28-ol 259 Lup-20(29)-ene-3b;28-diol 3
a Odour impressions perceived by panelists during olfactometry.b Retention index on BPX5.c Flavour dilution (FD) factor determined in extract containing the juice volatiles.d Identification on the basis of: AMS database, retention index and spiking with authe
spectra data with literature, 1Tatsuka, Suckane, Sakai, and Sumitani (1990); 2Kusmierz,(2008); 5Ramsey, Lee, Osseltan, and Moffat (1980); 6Kenig et al. (2005); VSVery sweet vaequivalent. kg of product�1; log Kw lipophilicity.
grassy, woody, or citrus-like were perceived. Sniffing of serialdilutions of the extract revealed the highest FD factors for the pine-apple, apricot-like methylhexanoate (no. 13), cherry-like, aceto-phenone (no. 26) and ethyldodecanoate which elicits sweet floral
Ib on BPX5 FDc logKw Conc. (mg/kg) IDd
VS SW B So
68 Nd 0.006 0.02 0.04 0.02 0.01 A15 64 0.003 0.71 0.82 0.63 0.20 A15 Nd 0.057 0.01 0.01 0.01 0.01 A19 32 0.096 0.01 0.01 1.41 1.99 A20 32 0.201 0.96 1.10 0.98 0.80 A36 4 0.230 1.12 1.40 1.13 1.03 B86 16 0.233 0.02 0.01 0.02 0.01 B01 8 0.240 0.01 0.00 0.03 0.02 A35 64 0.253 0.34 0.34 1.26 1.32 A50 32 0.260 0.41 0.42 0.51 1.52 B84 8 0.276 0.66 0.44 0.77 0.63 C10 4 0.287 0.03 0.00 0.01 0.07 B33 128 0.314 2.13 1.87 2.01 0.02 A40 4 0.320 1.38 0.85 0.15 0.17 B76 32 0.325 0.96 1.08 0.07 0.01 B80 8 0.331 0.84 0.61 0.12 0.31 C92 16 0.343 0.01 0.02 - 0.01 B97 64 0.357 1.41 1.09 1.25 0.54 A010 32 0.370 0.21 0.29 0.15 1.14 A028 32 0.381 1.14 0.95 0.01 0.01 A032 32 0.386 0.30 0.32 0.80 1.12 A033 4 0.389 0.56 0.59 0.33 0.57 A040 8 0.391 0.91 1.00 0.41 0.38 B043 16 0.395 0.03 0.01 0.04 0.51 B062 16 0.409 0.03 0.01 0.04 0.51 B065 128 0.416 0.73 0.75 1.01 1.33 A091 64 0.430 0.77 0.82 0.55 0.56 A111 16 0.444 0.53 0.51 0.31 0.43 A172 32 0.446 0.64 0.72 0.98 1.42 A179 4 0.449 0.33 0.29 0.40 0.41 B185 Nd 0.451 0.22 0.15 0.18 0.21 B189 16 0.455 0.11 0.01 0.01 0.10 A190 64 0.457 1.19 1.00 1.01 1.00 A228 8 0.459 0.30 0.26 0.27 0.30 A235 Nd 0.467 0.10 0.12 0.11 0.27 C257 64 0.462 1.10 1.26 0.34 0.23 A327 Nd 0.475 0.01 0.01 0.06 0.01 B376 32 0.478 0.97 0.82 0.93 0.96 A415 32 0.499 1.05 1.17 0.61 0.70 A463 Nd 0.505 0.06 0.01 0.02 0.01 C483 4 0.505 0.06 0.01 0.54 0.49 C498 32 0.538 1.01 0.54 0.83 1.54 B570 8 0.542 0.01 0.01 0.11 0.21 T580 128 0.543 36.90 23.54 9.71 8.58 A612 4 0.576 1.05 0.80 1.53 0.31 B7111, 4 Nd 0.579 0.53 0.61 0.01 0.01 C8462 Nd 0.585 0.37 0.24 0.35 0.34 C9153 Nd 0.587 0.16 0.15 0.14 0.09 C973 32 0.601 0.01 0.01 1.74 1.98 B980 Nd 0.605 0.54 0.58 0.02 0.01 T0091, 4 Nd 0.619 1.94 1.94 0.98 1.13 C1721 32 0.626 0.01 0.01 1.63 1.80 C1774 Nd 0.626 0.83 0.82 0.67 0.81 C5065 Nd 0.633 1.12 0.97 0.02 0.01 C578 4 0.636 0.33 0.31 0.21 0.11 T6216 Nd 0.640 0.71 0.70 0.69 0.73 C788 Nd 0.646 1.67 1.50 0.86 1.40 T928 Nd 0.651 0.51 0.35 0.01 1.41 T090 Nd 0.681 3.01 3.02 3.00 3.11 T
ntic standard; BMS database and retention index; CRetention index and comparingMalinski, Czerniec, and Szafranek (1985); 3Svob and Deur-Siftar (1974): 4Goodnerriety; SWSweet variety; BBitter variety; SOSour variety; Conc.Mg of methylbutanoate
O. Lasekan et al. / Food Chemistry 141 (2013) 2089–2097 2093
nuance (no. 44) Table 2. Somewhat lower FD factors were obtainedfor the fruity, ethyl acetate (no. 2), ethyl-(E)-2-butenoate (no. 9),ethylhexanoate (no. 18), methylbenzoate (no. 27) and hexylbut-anoate (no. 33).
Among the volatile compounds identified in the fruits wereeighteen terpenes (Table 2). The importance of terpenoids in fruitjuices are well documented (Marais, 1983; Pino, Marbot, & Rosado,2002; Qiao et al., 2008; Tietel, Plotto, Fallik, Lewinsohn, & Porat,2011). For instance, limonene, terpinen-4-ol, myrcene, a-terpinol,nerol, Y-terpinene and geraniol have been identified as importantaroma contributors to sweet orange (Citrus sinensis Osbeck) (Dhar-manwan, Kasapis, Curran, & Johnson, 2007), Clementine (Citrusreticulate x C. sinensis) (Tietel et al., 2011), grape fruits (Marais,1983) and star apple (Chrysophyllum cainito) (Pino et al., 2002)respectively. Another group of researchers Perez-Lopez andCarbonell-Barrachina (2006) quantified the aroma volatiles intwo Spanish mandarin varieties and concluded that D-limonene,myrcene, sabinene and a-pinene were the predominant com-pounds in the juices. In the present study, 8 terpenes (sabinene,d-3-carene, p-cymene, limonene, geraniol, a-copaene, cis-a-ber-gomotene and a-muurolene) produced an appreciable FD factor
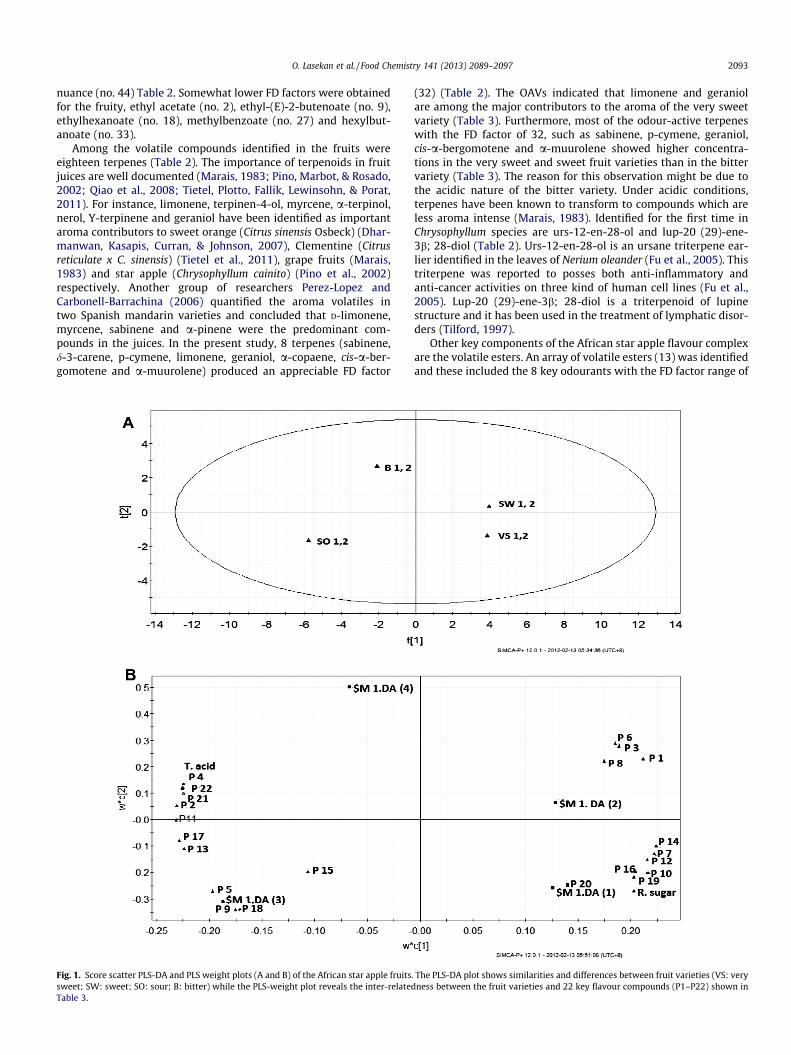
Fig. 1. Score scatter PLS-DA and PLS weight plots (A and B) of the African star apple fruitssweet; SW: sweet; SO: sour; B: bitter) while the PLS-weight plot reveals the inter-relatedTable 3.
(32) (Table 2). The OAVs indicated that limonene and geraniolare among the major contributors to the aroma of the very sweetvariety (Table 3). Furthermore, most of the odour-active terpeneswith the FD factor of 32, such as sabinene, p-cymene, geraniol,cis-a-bergomotene and a-muurolene showed higher concentra-tions in the very sweet and sweet fruit varieties than in the bittervariety (Table 3). The reason for this observation might be due tothe acidic nature of the bitter variety. Under acidic conditions,terpenes have been known to transform to compounds which areless aroma intense (Marais, 1983). Identified for the first time inChrysophyllum species are urs-12-en-28-ol and lup-20 (29)-ene-3b; 28-diol (Table 2). Urs-12-en-28-ol is an ursane triterpene ear-lier identified in the leaves of Nerium oleander (Fu et al., 2005). Thistriterpene was reported to posses both anti-inflammatory andanti-cancer activities on three kind of human cell lines (Fu et al.,2005). Lup-20 (29)-ene-3b; 28-diol is a triterpenoid of lupinestructure and it has been used in the treatment of lymphatic disor-ders (Tilford, 1997).
Other key components of the African star apple flavour complexare the volatile esters. An array of volatile esters (13) was identifiedand these included the 8 key odourants with the FD factor range of
. The PLS-DA plot shows similarities and differences between fruit varieties (VS: veryness between the fruit varieties and 22 key flavour compounds (P1–P22) shown in

Fig. 2. The validation plot for PLS and PLS-DA models. The R2 and Q2 were 0.0316 and �0.48 respectively.
2094 O. Lasekan et al. / Food Chemistry 141 (2013) 2089–2097
32–128 (Table 3). Volatile esters are generated by esterification ofalcohols and acyl-CoAs derived from both fatty acid and amino acidmetabolism; in a reaction catalysed by the enzyme alcohol o �acyltransferase (AAT) (Lara et al., 2003). Also, studies have shownthat there is a strong correlation between substrate specificityand the volatile esters present in the aroma of a fruit (Dixon &Hewett, 2000; Perez, Sanz, Olias, Rios, & Olias 1996).
Meanwhile, a preponderance of hydrocarbons, ketones, alde-hydes, acids, alcohols, including aromatic alcohols was detectedin the African star apple fruits. The results of the AEDA revealed22 odour-active compounds as the key odourants of the Africanstar apple (Table 3). The compounds included ethyl acetate (fruity),1-penten-3-ol (fish-like), acetyl methyl carbinol (buttery), ethyl-(E)-2-butenoate (fruity), (Z)-3-hexen-1-ol (grassy), methylhexano-
Table 4Relationships between the key volatile compounds of the four different African star apple
No. Compoundsa Fruit verities
Very sweet Sweet
P1 Ethyl acetate 0.71 ± 0.01 0.82 ± 0.01P2 1-Penten-3-ol 0.01 ± 0.00 0.02 ± 0.00P3 Acetyl methyl carbinol 0.96 ± 0.07 1.10 ± 0.05P4 Ethyl-(E)-2-butenoate 0.34 ± 0.01 0.33 ± 0.01P5 (Z)-3-Hexen-1-ol 0.41 ± 0.00 0.43 ± 0.01P6 Methylhexanoate 2.13 ± 0.12 1.87 ± 0.18P7 Sabinene 0.96 ± 0.04 1.08 ± 0.01P8 Ethylhexanoate 1.41 ± 0.11 1.09 ± 0.02P9 d-3-Carene 0.21 ± 0.00 0.29 ± 0.04P10 p-Cymene 1.14 ± 0.13 0.95 ± 0.03P11 Limonene 0.30 ± 0.00 0.32 ± 0.01P12 Methylbenzoate 0.77 ± 0.04 0.82 ± 0.03P13 Ethylbenzoate 0.64 ± 0.01 0.72 ± 0.02P14 Geraniol 1.10 ± 0.02 1.26 ± 0.07P15 a-Copaene 0.97 ± 0.01 0.82 ± 0.01P16 cis-a-Bergomotene 1.05 ± 0.13 1.17 ± 0.26P17 Acetophenone 0.73 ± 0.01 0.75 ± 0.03P18 a-Muurolene 1.01 ± 0.37 0.54 ± 0.01P19 Ethyl dodecanoate 36.90 ± 5.3 23.54 ± 3.1P20 Hexylbutanoate 1.19 ± 0.03 1.0 ± 0.00P21 Hexadecanoic acid 0.01 ± 0.00 0.01 ± 0.00P22 Octadecanoic acid 0.02 ± 0.00 0.01 ± 0.00
Reducing sugars (RS) (mg g-1) 11.2 ± 1.9 10.1 ± 0.9Titratable acidity (TA) (mg g-1) 0.1 ± 0.01 0.4 ± 0.01
[1]Rychlik et al. (1998)Mg of methyl butanoate equivalent. Kg of product�1.
a Key volatile compounds with FD factor range of 32–128.b The OVAs (very sweet fruits) were calculated by dividing the concentration of the o
ate (pineapple-like), sabinene (citrus, woody), ethylhexanoate (fru-ity), d-3-carene (sweet, pungent), p-cymene (woody, spicy),limonene (orange-like), methylbenzoate (floral), geraniol (sweetfloral), a-copaene (woody), cis-a-bergomotene (floral), acetophe-none (cherry-like), a-muurolene (woody), ethyldodecanoate(sweet floral), hexylbutanoate (fruity), hexadecanoic acid (fatty)and octadecanoic acid (fatty). The results of the OAVs indicatedthat ethyl hexanoate, limonene, geraniol, ethyl-(E)-2-butenoateand ethyl dodecanoate, contributed intensely to the aroma of thevery sweet variety (Table 4).
Aroma lipophilicity also plays a determining role in the olfac-tory response (i.e. aroma transport across the aqueous mucusand binding to the olfactory receptors). In aroma research, the lipo-philicity of a flavouring compound is an indicator of its behaviour
s and their chemical constituents (reducing sugars and titratable acidity TA).
Odour threshold in water
Sour Bitter (lg L�1) [Ref.] OAVsb
0.20 ± 0.0 0.63 ± 0.02 500 1.421.95 ± 0.02 1.41 ± 0.01 400[1] <10.80 ± 0.01 0.98 ± 0.4 800 1.21.32 ± 0.01 1.26 ± 0.01 13.6 251.52 ± 0.10 0.51 ± 0.02 500 [1] <10.02 ± 0.00 2.01 ± 0.16 130 16.380.01 ± 0.00 0.07 ± 0.00 Nd Nd0.54 ± 0.01 1.25 ± 0.34 1.9 73.681.14 ± 0.35 0.15 ± 0.00 Nd Nd0.03 ± 0.00 0.01 ± 0.00 Nd Nd1.12 ± 0.61 0.80 ± 0.02 10 300.56 ± 0.08 0.55 ± 0.01 Nd Nd1.47 ± 0.96 0.98 ± 0.02 60 [1] 10.70.23 ± 0.01 0.34 ± 0.03 40 [1] 27.50.96 ± 0.05 0.93 ± 0.01 Nd Nd0.70 ± 0.01 0.61 ± 0.01 Nd Nd1.33 ± 0.11 1.01 ± 0.02 Nd Nd1.54 ± 0.21 0.83 ± 0.01 Nd Nd8.58 ± 1.71 9.71 ± 0.93 1500 [1] 24.6
1.0 ± 0.00 1.0 ± 0.00 250 4.81.98 ± 0.32 1.74 ± 0.10 Nd Nd1.83 ± 0.14 1.63 ± 0.06 Nd Nd
4.7 ± 0.3 3.1 ± 0.13.0 ± 0.40 2.7 ± 0.01
dourants by their thresholds in water.
O. Lasekan et al. / Food Chemistry 141 (2013) 2089–2097 2095
in the food matrix, generally composed of water and less hydro-philic constituents such as proteins, lipids and polysaccharides(Landy, Druaux, & Voilley, 1995). The present RP-HPLC data (i.e.logKw) which is the capacity factor extrapolated to 100% water in
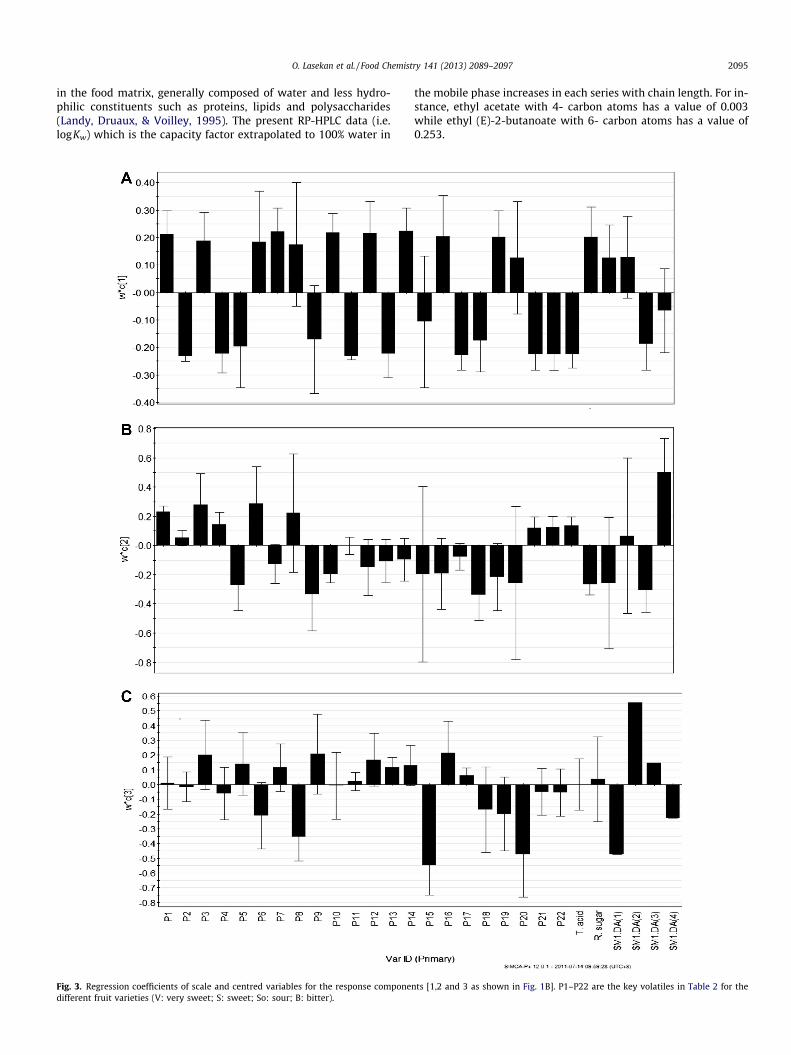
Fig. 3. Regression coefficients of scale and centred variables for the response componedifferent fruit varieties (V: very sweet; S: sweet; So: sour; B: bitter).
the mobile phase increases in each series with chain length. For in-stance, ethyl acetate with 4- carbon atoms has a value of 0.003while ethyl (E)-2-butanoate with 6- carbon atoms has a value of0.253.
nts [1,2 and 3 as shown in Fig. 1B]. P1–P22 are the key volatiles in Table 2 for the

2096 O. Lasekan et al. / Food Chemistry 141 (2013) 2089–2097
3.3. Multivariate analysis
In order to examine the similarities and differences between thefour different African star apple varieties in terms of the key vola-tile compounds associated with each variety, principal componentanalysis (PCA) was employed. PCA provided an easy visualisationof the complete data set in a reduced dimension plot, showing var-iability between volatile compounds and chemical constituents ofeach variety. This method was employed to establish relationshipsbetween varieties and their key flavour volatile compounds. Basedon the samples grouping from PCA, a partial least square discremi-nant analysis (PLS-DA) was established (Fig. 1A). The scatter plot ofscores of the first two components (in the PLS-DA which explained90.78% of the total variance in the data) showed the distinctionsamong the different four apple varieties. The corresponding PLSweight plot (Fig. 1B) established the relative importance of eachvolatile component and chemical constituents to the star applesamples.
The PLS-DA model was however validated using the response ofpermutation test through 100 permutations (Fig. 2). A model issaid to be valid when the intercept of R2 is <0.3 and intercept ofQ2 is <0.05 (Eriksson, Johanssen, Kettaneh-Wold, & Wold, 2006).In the present study, the R2 = (0.0, 0.0316) and Q2 = (0.0, �0.5).This plot (Fig. 2) strongly indicates that the original model is validbecause the regression line of the Q2-points intersects the verticalaxis (on the left) at, or below zero.
The African star apples were separated according to their tastedifferences (Fig. 1A). Low negative component 1 and high positivecomponent 2 corresponded to the bitter star apple variety. Thesour apple variety was characterised with low negative component1 and high negative component 2 respectively. Moreover, the verysweet variety was within the area of positive component 1 and lownegative component 2 respectively. However, the sweet varietywas situated in the area of positive components 1 and 2 respec-tively. The inter-relationship between the chemical constituents(reducing sugar and titratable acidity, TA), fruit varieties and the22 key flavour volatiles were examined by the PLS-weight plot(Fig. 1B). The PLS is a regression extension of PCA, which is usedto correct the information in two blocks of variables, x and y, toeach other. The results revealed that the reducing sugar and TAwere situated far apart in the weight plot (Table 4). The reducingsugar was situated in the lower right quadrant as well as the verysweet fruit variety, while the TA was located in the upper leftquadrant as well as the bitter fruit variety. The results also showedthat the very sweet variety had some correlations with the fruityethyl acetate, acetyl methyl carbinol (buttery), methylhexanoate(pineapple, apricot-like), sabinene (citrus, woody), p-cymene(woody, spicy), methylbenzoate (floral), geraniol (sweet, floral),cis-a-bergomotene (floral) and ethyldodecanoate (sweet, floral)(Fig. 1B).
The sweet star apple variety was correlated with ethyl acetate,acetyl methyl carbinol, methylhexanoate and ethylhexanoate.Meanwhile, 7 flavour volatile compounds, (Z)-3-hexen-1-ol, b-3-carene, limonene, a-copaene, ethylbenzoate and acetophenonewhich elicits cherry-like aroma were closely correlated with thesour star apple variety (Fig. 1B). In the case of the bitter star applevariety, 4 volatile compounds showed some correlation. The com-pounds were ethyl-(E)-2-butenoate, 1-penten-3-ol, hexadecanoicacid and octadecanoic acid respectively (Fig. 1B).
To elucidate the significance of the observed association be-tween the flavour volatile compounds and the star apple varieties,the PLS regression coefficients of scaled and centred variables forthe flavour volatiles were determined (Figs. 3A–C). While the verysweet variety showed strong positive correlation with the 9 afore-mentioned flavour volatile compounds and the reducing sugar, ithowever, revealed strong negative correlation with the following
compounds (Z)-3-hexen-1-ol, d-3-carene, a-copaene and a-muurolene (Fig 3A). This observation is in agreement with the find-ings of Young, Stect, Paterson, McMath and Ball (1995) on thevolatile compounds affecting kiwifruit flavour. Positive correlationwas found between sweetness of kiwifruit and methylhexanoate,ethylbutanoate and methylbenzoate. A further experiment to testif esters do indeed affect the sweet flavour and acidic flavour wasconducted by Young, Stec, Paterson, McMath, and Ball (1995).The volatile flavour compounds were stripped from kiwifruit juiceusing Amberlite XAD-2 resin and panellists were asked to deter-mine the intensity of sweet aroma flavour, and acidic aroma fla-vour in the samples of the base juice to which the selectedcompounds have been added at various concentrations. Resultsshowed that methylhexanoate, ethylbutanoate and methylbenzo-ate increased the intensity of sweet aroma and sweet flavour sig-nificantly. Similarly, Narain and Thomas (1990) reported thatethylbutanoate affected the sweet flavour in peaches, while, Binderand Flath (1989) found that methylbenzoate contributed to thesweet aroma of guava.
The terpenes were also well represented in the very sweet vari-ety. Most of these terpenes have been identified as important con-tributors to the aroma of sweet oranges (Dharmanwan et al., 2007).Although, there has been little or no report of the causal effect ofterpenoids on fruit’s aroma and flavour, it is likely that the identi-fied terpenes in the sweet star apple variety contributed to thesweet aroma and flavour of the fruit.
Meanwhile, the sweet and sour star apple varieties exhibitedpositive correlation with ethylbenzoate, and the aromatic ketoneacetophenone (Fig 3C). The bitter variety showed strong positivecorrelation with acetyl methyl carbinol, ethyl-(E)-2-butenoate,methylhexanoate, hexadecanoic and octadecanoic acids respec-tively (Fig 3B). Fig 3B also revealed a strong negative correlationbetween the bitter variety and the terpenes. The reason for thisobservation might be due to the acidic nature of the fruit.
4. Conclusion
The analysis by HS-SPME/GC–MS of the volatile compounds offour African star apple fruit varieties, allowed the identificationof 59 compounds. The results of the AEDA revealed 22 odour-activecompounds with FD factors in the range of 32–128 as the keyodourants of the fruit. However, OAVs revealed that ethyl hexano-ate, limonene, geraniol, ethyl-(E)-2-butenoate and ethyl dodecano-ate, contributed intensely to the aroma of the very sweet variety.Moreover, aroma lipophilicity appears to reflect molecular confor-mation as depicted by the esters and the alcohols. Further analysisof the similarities and differences between the fruit varieties interms of the key odourants by the application of PLS-DA andPLS- regression coefficients showed strong positive correlation be-tween the very sweet/sweet varieties and 10 key odourants. Theodourants included ethyl acetate, acetyl methyl carbinol, methyl-hexanoate, sabinene, p-cymene, methylbenzoate, ethylbenzoate,geraniol, cis-a-bergomotene, acetophenone and ethyldodecanoate.The bitter variety exhibited strong positive correlation with acetylmethyl carbinol, ethyl-(E)-2-butenoate, methylhexanoate, hexa-decanoic and octadecanoic acids respectively.
References
Abiodun, O. A., & Oladapo, A. S. (2011). Physicochemical properties of African starapple (Chrysophyllum albidum) components. Nutrition and Food Science, 41,8–11.
Anonymous. (1999). Kleur stadia tomaten. Central Bureau Van deTuinbouwveilingen in Nederland, 2803 PE Gouda.
Bada, S. O. (1997). Preliminary information on the ecology of Chrysophyllumalbidum, in West and Central Africa. In D. A. Denton, D. O. Ladipo, M. A. Adetoro,& M. B. Serum (Eds.), Proceedings of national workshop on the potential of the starapple in nigeria (pp. 16–25).

O. Lasekan et al. / Food Chemistry 141 (2013) 2089–2097 2097
Balwin, E. A., Scott, J. W., Einstein, M. A., Malundo, T. M., Carr, B. T., Shewfelt, R. L.,et al. (1989). Relationship between sensory and instrumental analysis fortomato. Journal of American Society of Horticultural Science, 123, 906–915.
Binder, R. G., & Flath, R. A. (1989). Volatile components of pineapple guava. Journalof Agricultural and Food Chemistry, 37, 734–736.
CENTRAD. (1999). Centre for Environmental Renewable Natural ResourcesManagements, Research and Development, Jericho, Ibadan, Nigeria. ForestryResearch Institute of Nigeria (FRIN), Publication No CEN., 011/85.
Dharmanwan, J., Kasapis, S., Curran, P., & Johnson, J. R. (2007). Characterization ofvolatile compounds in selected citrus fruits from Asia. Part 1: Freshly-squeezedjuice. Flavour and Fragrance Journal, 22, 228–232.
Diez, J., Cela, R., & Perez-Bustamante, J. A. (1985). Development of some sherrybrandy aroma components along the solera system. American Journal of Enologyand Viticulture, 36, 98–99.
Dixon, J. J., & Hewett, E. W. (2000). Factors affecting apple aroma/flavour volatileconcentration: A review. New Zealand Journal of Crop and Horticultural Science,28, 155–173.
Eriksson, L., Johanssen, E., Kettaneh-Wold, N., & Wold, S. (2006). Multi andmegavariate data analysis. Umea, Sweden: Umetrics AB.
Fu, L., Zhang, S., Li, N., Wang, J., Zhao, M., Sakai, J., et al. (2005). Three newtriterpenes from Nerium oleander and biological activity of the isolatedcompounds. Journal of Natural Product, 68, 198–206.
Goodner, K. L. (2008). Practical retention index models of OV-101, DB-1, DB-5, andDB-wax for flavour and fragrance compounds. LWT–Food Science andTechnology, 41, 951–958.
Keay, R. W. (1989). Trees of Nigeria. In R. W. Keay, C. F. A. Onoche, & D. P. Stanfield(Eds.), A revised version of Nigerian trees (pp. 476). Oxford: Clarendon Press.
Kenig, F., Simons, D. J. H., Crich, D., Cowen, J. P., Ventura, G. T., & Rehbein-Khalily, T.(2005). Structure and distribution of branched aliphatic alkanes withquaternary carbon atoms in Cenomanian and Turonian black shales ofPasquia Hills (Saskatchewan, Canada). Organic Chemistry, 36, 117–138.
Krumbein, A., Peters, P., & Bruchner, B. (2004). Flavour compounds and quantitativedescriptive analysis of tomatoes of different cultivars in short-term storage.Postharvest Biology Technology, 32, 15–28.
Kusmierz, J., Malinski, E., Czerniec, W., & Szafranek, J. (1985). Kovats retentionindices of high molecular-weight mono- methyl-, cyclopentyl-, cyclohexyl- andphenyl alkanes. Journal of Chromatography, 331, 219–228.
Landy, P., Druaux, C., & Voilley, A. (1995). Retention of aroma compounds byproteins in aqueous solution. Food Chemistry, 54, 387–392.
Lara, I., Miro, R. M., Fuentes, T., Sayez, G., Graell, J., & Lopez, M. L. (2003).Biosynthesis of volatile aroma compounds in pear fruit stored under long-termcontrolled atmosphere conditions. Postharvest Biology Technology, 29, 29–39.
Lasekan, O., & Abbas, K. (2010). Analysis of volatile flavour compounds andacrylamide in roasted Malaysian tropical almond (Terminalia catappa) nutsusing supercritical fluid extraction. Food and Chemical Toxicology, 48,2212–2216.
Liu, T. T., & Yang, T. S. (2002). Optimization of solid-phase microextraction analysisfor studying Changes of headspace flavour compounds of banana duringripening. Journal of Agricultural and Food Chemistry, 50, 653–657.
LMBG (1983). Amthiche sammlung von untersuchungsverfahren nach § 35 LMBG.bestimmung des gesamtsauregehaltes von tomatenmark (potentiometrischemethode) L 26, no. 11, pp. 3–4.
Marais, J. (1983). Terpenes in the aroma of grapes and wines: A review. South AfricanJournal of Enology and Viticulture, 4, 49–60.
Miller, M. E., & Stuart, J. D. (1999). Comparison of gas-sampled and SPME-sampledstatic headspace for the determination of volatile flavour components.Analytical Chemistry, 71, 23–27.
Narain, N., & Thomas, D. M. H. (1990). Dynamic headspace concentration and gaschromatography of volatile flavour components in peach. Journal of FoodScience, 55, 1303–1307.
Oyebade, B. A., Ekeke, B. A., & Adeyemo, F. C. (2011). Fruits categorization anddiagnostic analysis of Chrysophyllum albidum in Nigeria. Advances in AppliedScience Research, 2, 7–15.
Oyelade, O. J., Odugbenro, P. O., Abioye, A. O., & Raji, N. L. (2005). Some physicalproperties of African star apple seeds. Journal of Food Engineering, 67, 435–440.
Perez, A. G., Sanz, C., Olias, R., Rios, J. J., & Olias, J. M. (1996). Evolution of strawberryalcohol acyltransferase activity during fruit development and storage. Journal ofAgricultural and Food Chemistry, 44, 3286–3290.
Perez-Lopez, A. G., & Carbonell-Barrachina, A. A. (2006). Volatile odour-compoundsand sensory quality of fresh and processed mandarin juices. Journal of Science ofFood and Agriculture, 86, 2404–2411.
Pino, J., Marbot, R., & Rosado, A. (2002). Volatile constituents of star apple(Chrysophyllum cainito L) from Cuba. Flavour Fragrance Journal, 17, 401–403.
Qiao, X., Xie, B. J., Zhang, Y., Zhang, Y., Fan, G., Yao, X. L., et al. (2008).Characterization of aroma-active compounds in fruit juice & peel oil ofJinchen sweet orange fruit (Citrus sinensis Osbeck) by GC–MS & GC–O.Molecules, 13, 1333–1344.
Ramsey, J. D., Lee, T. D., Osseltan, M. D., & Moffat, A. C. (1980). Gas–liquidchromatographic retention indices of 296 non-drug substances on SE-30 or OV-1 likely to be encountered in toxicological analyses. Journal of Chromatography,184, 185–206.
Rychlik, M., Schieberle, P., & Grosch, W. (1998). Compilation of odour thresholds,odour qualities and retention indices of key food odourants. Garching, Germany:Deutsche Forschungsanstalt fur Lebensmittel-chemie.
Schieberle, P. (1996). Odour-active compounds in moderately roasted sesame. FoodChemistry, 55, 145–154.
Schieberle, P. (1995). New developments in methods for analysis of volatile flavourcompounds and their precursors. In A. G. Gaonkar (Ed.), Characterization of food:Emerging methods (pp. 403–431). Amsterdam, the Netherlands: ElsevierScience.
Stampanoni, C. R. (1993). Influence of acid and sugar content on sweetness,sourness and the flavour profile of beverages and sherbets. Food QualityPreference, 4, 169–176.
Svob, V., & Deur-Siftar, D. (1974). Kovats retention indices in the identification ofalkyl–benzene degradation products. Journal of Chromatography, 91, 677–689.
Tatsuka, K., Suckane, S., Sakai, Y., & Sumitani, H. (1990). Volatile constituents of kiwifruit flowers: Simultaneous distillation and extraction versus headspacesampling. Journal of Agricultural Food Chemistry, 38, 2176–2180.
Tietel, Z., Plotto, A., Fallik, E., Lewinsohn, E., & Porat, R. (2011). Taste and aroma offresh and stored mandarins: A review. Journal of Science of Food and Agriculture,91, 14–23.
Tilford, G. L. (1997). Edible and medicinal plants of the West Missouri. Mountain Press(pp. 10–200).
Vila, D. H., Mira, F. J. H., Lucena, R. B., & Recamales, M. A. F. (1999). Optimization ofan extrusion method of aroma compounds in white wine using ultrasound.Talanta, 56, 413–421.
Young, H., Stec, M., Paterson, V. J., McMath, K., & Ball, R. (1995). Volatile compoundsaffecting kiwifruit flavour. Washington, DC: American Chemical Society (ACSSymposium Series, pp. 55–67).
Zhou, Y., Riesen, R., & Gilpin, C. S. (1996). Comparison of Amberlite XAD-2/Freon 11extraction with liquid/liquid extraction for the determination of wine flavourcomponent. Journal of Agricultural and Food Chemistry, 44, 818–822.