Headspace solid-phase microextraction followed by gas chromatography tandem mass spectrometry for...
11
ORIGINAL PAPER Headspace solid-phase microextraction followed by gas chromatography tandem mass spectrometry for the sensitive determination of benzotriazole UV stabilizers in water samples Inmaculada Carpinteiro & Brais Abuín & Isaac Rodríguez & Rafael Cela & Maria Ramil Received: 15 December 2009 / Revised: 11 February 2010 / Accepted: 12 February 2010 / Published online: 14 March 2010 # Springer-Verlag 2010 Abstract A sensitive procedure for the determination of five ultraviolet (UV) absorbers, belonging to the benzo- triazole class, in environmental water samples is proposed. Analytes were first extracted and concentrated from the matrix and then selectively determined by gas chromatog- raphy in combination with tandem mass spectrometry detection. The high lipophilic character of some of the investigated species resulted in a strong trend to remain sorbed on solid surfaces, even after addition of considerable percentages of methanol (up to 30%) to water. Thus, minimizing sample handling during the enrichment step is mandatory in order to obtain acceptable accuracy and precision. Solid-phase microextraction (SPME), as sample preparation approach, fulfilled the above requirement and provided acceptable figures of merit for the determination of target species in environmental water samples, including raw wastewater. Optimization of SPME conditions showed that the combination of headspace extraction, with a sample temperature of 100 °C and addition of 15 mg of NaCl per milliliter of sample rendered the best compromise in terms of extraction efficiency for all species. Considering a sampling time of 30 min with a poly(dimethylsiloxane)– divinylbenzene-coated SPME fiber, limits of quantification below 2 ng l -1 and relative standard deviations between 5% and 12% were achieved. Three of the five species included in this research were determined in raw wastewater with a maximum concentration of 57 ng l -1 for the Tinuvin 326 UV absorber. Keywords UV stabilizers . Benzotriazoles . Water samples . Solid-phase microextraction . Gas chromatography . Mass spectrometry Introduction Environmental and toxicological aspects related to anthropo- genic compounds designed to absorb ultraviolet (UV) wave- lengths of solar radiation are receiving an increased attention. Most of the available information concerns the so-called UV filters, which are included in the formulation of solar screens and other personal care products applied directly on the human skin [1, 2]. Some of the most often employed UV filters, e.g., certain cinnamates, camphors, and octocrylene, have been detected at relevant concentrations, not only in water samples but also in other solid matrices, such as sediments, sludge, and even in the tissues of fish living in recreational areas or aquatic environments affected by urban wastewater discharges [3–6]. In vitro studies indicate that some of the above compounds behave as endocrine disrupters [7]. In addition to personal care products, UV absorbers are also added to polymeric materials and paints (particularly car paints) to improve their stability and prevent light- induced degradation and yellowing [8]. These additives are referred to under the generic name of UV stabilizers. In terms of production and use, the 2-hydroxyphenyl derivatives of benzotriazole constitute one of the most important families of UV stabilizers [9]. In contrast to the polar benzotriazole species, its phenolic derivatives show medium to extremely high hydrophobic character and thus, as happens with the less polar UV filters, a potential to be accumulated in solid environmental matrices and even to be magnified through the trophic chain. Multiresidue studies, focused on aquatic I. Carpinteiro : B. Abuín : I. Rodríguez : R. Cela : M. Ramil (*) Departamento de Química Analítica, Nutrición y Bromatología, Instituto de Investigación y Análisis Alimentarios, Universidad de Santiago de Compostela, 15782 Santiago de Compostela, Spain e-mail: [email protected] Anal Bioanal Chem (2010) 397:829–839 DOI 10.1007/s00216-010-3584-0
-
Upload
independent -
Category
Documents
-
view
5 -
download
0
Transcript of Headspace solid-phase microextraction followed by gas chromatography tandem mass spectrometry for...
ORIGINAL PAPER
Headspace solid-phase microextraction followedby gas chromatography tandem mass spectrometryfor the sensitive determination of benzotriazole UVstabilizers in water samples
Inmaculada Carpinteiro & Brais Abuín &
Isaac Rodríguez & Rafael Cela & Maria Ramil
Received: 15 December 2009 /Revised: 11 February 2010 /Accepted: 12 February 2010 /Published online: 14 March 2010# Springer-Verlag 2010
Abstract A sensitive procedure for the determination offive ultraviolet (UV) absorbers, belonging to the benzo-triazole class, in environmental water samples is proposed.Analytes were first extracted and concentrated from thematrix and then selectively determined by gas chromatog-raphy in combination with tandem mass spectrometrydetection. The high lipophilic character of some of theinvestigated species resulted in a strong trend to remainsorbed on solid surfaces, even after addition of considerablepercentages of methanol (up to 30%) to water. Thus,minimizing sample handling during the enrichment step ismandatory in order to obtain acceptable accuracy andprecision. Solid-phase microextraction (SPME), as samplepreparation approach, fulfilled the above requirement andprovided acceptable figures of merit for the determinationof target species in environmental water samples, includingraw wastewater. Optimization of SPME conditions showedthat the combination of headspace extraction, with a sampletemperature of 100 °C and addition of 15 mg of NaCl permilliliter of sample rendered the best compromise in termsof extraction efficiency for all species. Considering asampling time of 30 min with a poly(dimethylsiloxane)–divinylbenzene-coated SPME fiber, limits of quantificationbelow 2 ng l−1 and relative standard deviations between 5%and 12% were achieved. Three of the five species includedin this research were determined in raw wastewater with amaximum concentration of 57 ng l−1 for the Tinuvin 326UV absorber.
Keywords UV stabilizers . Benzotriazoles .
Water samples . Solid-phase microextraction .
Gas chromatography .Mass spectrometry
Introduction
Environmental and toxicological aspects related to anthropo-genic compounds designed to absorb ultraviolet (UV) wave-lengths of solar radiation are receiving an increased attention.Most of the available information concerns the so-called UVfilters, which are included in the formulation of solar screensand other personal care products applied directly on thehuman skin [1, 2]. Some of the most often employed UVfilters, e.g., certain cinnamates, camphors, and octocrylene,have been detected at relevant concentrations, not only in watersamples but also in other solid matrices, such as sediments,sludge, and even in the tissues of fish living in recreationalareas or aquatic environments affected by urban wastewaterdischarges [3–6]. In vitro studies indicate that some of theabove compounds behave as endocrine disrupters [7].
In addition to personal care products, UV absorbers arealso added to polymeric materials and paints (particularlycar paints) to improve their stability and prevent light-induced degradation and yellowing [8]. These additives arereferred to under the generic name of UV stabilizers. In termsof production and use, the 2-hydroxyphenyl derivatives ofbenzotriazole constitute one of the most important families ofUV stabilizers [9]. In contrast to the polar benzotriazolespecies, its phenolic derivatives show medium to extremelyhigh hydrophobic character and thus, as happens with the lesspolar UV filters, a potential to be accumulated in solidenvironmental matrices and even to be magnified through thetrophic chain. Multiresidue studies, focused on aquatic
I. Carpinteiro : B. Abuín : I. Rodríguez : R. Cela :M. Ramil (*)Departamento de Química Analítica, Nutrición y Bromatología,Instituto de Investigación y Análisis Alimentarios,Universidad de Santiago de Compostela,15782 Santiago de Compostela, Spaine-mail: [email protected]
Anal Bioanal Chem (2010) 397:829–839DOI 10.1007/s00216-010-3584-0

environments heavily impacted by industrial sewage waterdischarges, demonstrated the accumulation and persistence ofseveral benzotriazole-type UV stabilizers in sediments[10–12]. The recent research carried out by Nakata andcoworkers in Japan has also confirmed the presence of thesecompounds in sediments as well as their bioaccumulation inthe marine food chain [13]. However, with the exception ofthe above studies, the analytical determination of benzotria-zole UV stabilizers and the assessment of their occurrenceand fate in the aquatic media have been scarcely investigated.
Solid–liquid extraction approaches followed by gas(GC), liquid (LC), and even supercritical chromatographywith UV, mass spectrometry (MS), and less often infraredspectroscopy detection have been used for the determina-tion of microgram per gram levels of benzotriazolederivatives in host materials [8, 14–16]. GC–MS and LC–MS are also suitable for the determination of trace residuesof the above compounds in environmental samples [10, 13].However, in this case, they need to be combined witheffective sample preparation approaches providing highenrichment factors. As regards water samples, solid-phaseextraction (SPE) and solid-phase microextraction (SPME)fulfill the above requirement; they are available in mostlaboratories, and they present just a moderate, or even null,consumption of organic solvents. In addition, their selec-tivity can be somehow controlled by selecting an appropri-ate sorbent or SPME coating. Both approaches have beenalso applied to the determination of UV filters in watersamples [17, 18]; however, as far as we could trace, theirperformance for the extraction and concentration ofbenzotriazole-type UV stabilizers has never been reported.
The basic aim of this research was to optimize andvalidate a procedure for the determination of five benzo-triazole UV stabilizers in environmental water samples at thelow nanogram per liter level. Headspace (HS) SPME wasevaluated as sample concentration technique, and com-pounds were determined using GC in combination withtandem MS (MS/MS) detection. Parameters affecting theperformance of SPME sample preparation (fiber coating;sample temperature, pH, ionic strength, and stirring; sam-pling mode and time) are carefully evaluated together withdetermination steps, and preliminary data related to thepresence of target compounds in sewage water are provided.
Experimental
Reagents, sorbents, and samples
HPLC-grade methanol, acetone, and ethyl acetate (traceanalysis grade) were obtained from Merck (Darmstadt,Germany). Standards of 2-(2H-benzotriazol-2-yl)-4-methyl-phenol (Tinuvin P), 2-(2H-benzotriazol-2-yl)-4-methyl-6-(2-
propen-1-yl)-phenol (Allyl-bzt) 2-(5-chloro-2H-benzotriazol-2-yl)-6-(1,1-dimethylethyl)-4-methyl-phenol (Tinuvin 326),2-(2H-benzotriazol-2-yl)-4,6-bis(1,1-dimethylpropyl)-phenol(Tinuvin 328), and 2-(5-chloro-2H-benzotriazol-2-yl)-4,6-bis(1,1-dimethylethyl)-phenol (Tinuvin 327) were acquired fromAldrich (Milwaukee, WI, USA). Their chemical structures,molecular weights, pKa values, octanol–water partitioncoefficients (log Kow), and water solubilities are summarizedin Table 1. Individual stock solutions of each UV stabilizer(approximately 1,000 μg ml−1) were made in acetone. Furtherdilutions and mixtures of target species were prepared in thesame solvent, when used to fortify water samples, and inethyl acetate when employed to optimize GC–MS/MSdetection conditions.
Oasis HLB (60 mg) SPE cartridges were acquired fromWaters (Milford, MA, USA). A manual SPME holder andfibers coated with different polymers: poly(dimethylsiloxane)(PDMS, 100 μm film thickness), polyacrylate (PA, 85-μm filmthickness), Carboxen–PDMS (CAR–PDMS, 75-μm film thick-ness), and PDMS–divinylbenzene (PDMS–DVB, 65-μm filmthickness) were obtained from Supelco (Bellefonte, PA, USA).Before being used for first time, SPME fibers were thermallyconditioned following conditions recommended by the supplier.
Ultrapure (Milli-Q), river, and wastewater samples,obtained from the inlet and outlet streams of an urbansewage treatment plant, equipped with primary and acti-vated sludge units, were employed throughout this study.Blind specimens of raw wastewater were supplied by alocal laboratory. River and wastewater samples were passedthrough a glass fiber filter and stored in the dark at 4 °C, fora maximum of 48 h, until analysis.
Sample preparation
Optimization of extraction conditions was carried out withspiked aliquots of ultrapure water. SPE assays were performedwith 100-ml volume samples, containing variable percentagesof methanol (up to 30%). SPME extractions were made in22-ml glass vessels, sealed with a polytetrafluoroethylene(PTFE)-layered rubber septa, maintained at different tem-peratures, and containing variable amounts of sodiumchloride (NaCl). Under final working conditions, SPMEwas selected as the extraction technique. A PDMS–DVB-coated fiber was exposed to the HS of the vessel containing15 ml of water, a 15% of NaCl (2.25 g), and a PTFE-covered stirrer (10 mm×3 mm). The sample vessel wasequilibrated in a water bath at 100 °C for 5 min, and thenthe fiber was exposed to its HS for 30 min.
Determination
Analytes were selectively determined by GC–MS/MS,using a Varian (Walnut Creek, CA, USA) 450 GC
830 I. Carpinteiro et al.
instrument connected to an ion trap Varian 240 MS,furnished with an electron impact source in the externalconfiguration mode. Separations were carried out in aVarian Factor Four, BP-5 type column (30 m×0.25 mm i.d.,df 0.25 µm), operated at a constant helium flow of1.2 ml min−1. The GC oven was programmed as follows:80 °C (held for 1 min), first rate 12 °C min−1 to 245 °C,second rate 25 °C min−1 to 285 °C (held for 10 min). Thetemperature of the injector was maintained at 270 °C, andstandards, in ethyl acetate, were injected in the splitlessmode, with the solenoid valve changing to the split positionafter 1 min. SPME fibers were desorbed at the sametemperature, increasing the splitless as well as the initial
oven temperature times from 1 to 3 min. Transfer line andelectron impact ionization source and trap were set at 285,180, and 120 °C, respectively. The helium dumping gasflow was fixed at 0.8 ml min−1.
The mass spectrometer was operated in the electronimpact ionization mode (70 eV). MS spectra were acquiredin the m/z range from 70 to 400. The base peak in thespectra of each compound was isolated with a window of 3amu and subjected to collision-induced dissociation inorder to obtain the corresponding MS/MS spectra. Underfinal conditions, compounds were detected in the MS/MSmode, applying an offset +200 V to the electron multiplierand a filament emission current of 50 μA.
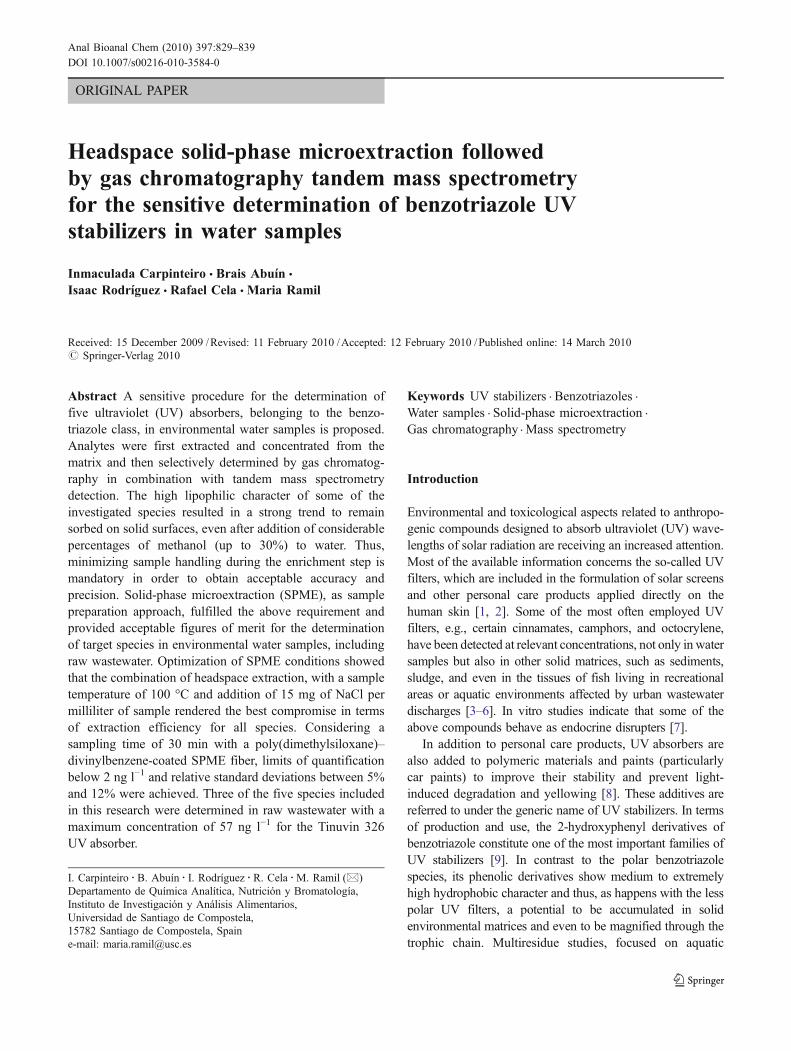
Table 1 Abbreviated names, CAS numbers, chemical structures, and some relevant properties of selected UV stabilizers
a Values obtained from SciFinder Scholar Database, http://www.cas.org/products/sfacad/b pH 7, 25 °C
SPME followed by GC–MS/MS for the determination of benzotriazole UV stabilizers 831

Results and discussion
GC–MS/MS parameters
Table 2 summarizes some relevant data related to GC–MS/MS detection conditions. The parent ion of eachcompound, appearing at m/z ratios of [M]+ (Tinuvin P),[M-15]+ (Allyl-BzT, Tinuvin 326, and Tinuvin 327), and[M-29]+ (Tinuvin 328), was isolated in the trap and furtherfragmented using a resonant wavelength. Individualacquisition segments were defined for each species, exceptTinuvin 328 and Tinuvin 327, whose chromatographicpeaks were not baseline-resolved. Thus, their MS/MStransitions were recorded in the multiple reaction mode.Tinuvin 328 and 327 followed a similar MS/MS fragmen-tation pattern. It consisted of the replacement of one of thealkyl chains bonded to the phenolic ring by hydrogen torender the corresponding [M-29-70]+ and [M-15-56]+
product ions appearing at m/z ratios of 252 and 286,without any further noticeable transition. The other threeanalytes involved in this research showed a higher numberof transitions and a more complex fragmentation pattern.Figure 1 presents the tentative structures assigned to thedaughter ions in their spectra. Some of them can be onlyexplained assuming the opening of the aromatic phenolicgroup.
The linearity in the response of the GC–MS/MSsystem was evaluated with standards at six differentconcentrations in the range from 1 to 500 ng ml−1.Within this interval, linear response plots (peak areaversus concentration) were obtained for all compounds,with correlation coefficients (R2) higher than 0.999. Theinstrumental limits of quantification (LOQs), defined asthe concentration given a chromatographic peak with asignal ten times higher than the baseline noise, remainedbelow 0.5 ng ml−1, considering an injection volume of2 μl, Table 2. The repeatability of the system forinjections performed in the same day ranged from 2%to 4%, depending on the compound and the concentra-tion level.
Sample preparation
Solid-phase extraction
SPE was initially chosen as concentration technique for thesensitive determination of target compounds in watersamples. The OASIS HLB polymer, which has beenpreviously tested for the concentration of different familiesof organic species with large differences of polarities [19],was used. Compounds were recovered from this sorbentwith 2 ml of ethyl acetate. This extract was evaporated to1 ml and injected in the GC–MS/MS system. Recoveryvalues, corresponding to spiked (5 ng ml−1) 100-ml aliquotsof ultrapure water (pH 6), ranged from 70% for Tinuvin Pand allyl-bzt up to only 5% for the most hydrophobicTinuvin 328 and 327. On the other hand, values above 90%were achieved when compounds were added directly to thesorbent, and then, the same volume of unspiked ultrapurewater was passed through the cartridge. The above behaviorsuggests that the most lipophilic UV stabilizers are lost dueto adsorption on glass beakers, containing the spikedsamples, and PTFE connections with the SPE cartridge. Inorder to minimize this problem, increasing percentages ofmethanol were added to the spiked water samples. Evenconsidering 30% of methanol, the recoveries obtained forTinuvin 328 and 327 remained around 50% (data notshown); thus, the use of SPE as enrichment technique wasdiscarded.
SPME optimization
Performance of SPME extractions is affected by a consid-erable number of variables, among them the coating of theSPME fiber, the temperature of the sample, and thesampling mode are some of the most important ones.Preliminary assays, using an exposure time of 30 min,showed that (1) the extraction efficiency of the CAR–PDMS sorbent was much lower than those provided by theother three fiber coatings considered in this study and that(2) increasing the temperature of the sample improved the
Table 2 Retention times, MS/MS detection parameters, linearity, and instrumental LOQs of the GC–MS/MS system
Compound Ret. time(min)
Parent ion(m/z)
Storage level(m/z)
Excitationvoltage (V)
Productions (m/z)
Linearity (R2) LOQ(ng ml−1)
Tinuvin P 16.66 225 86 0.9 196, 168 0.9995 0.5
Allyl-bzt 18.30 250 95 1.1 194, 132, 131 0.9990 0.4
Tinuvin 326 19.47 300 114 0.95 272, 154, 147 0.9999 0.5
Tinuvin 328 20.09 322 123 1.1 252 0.9998 0.1
Tinuvin 327 20.15 342 130 1.05 286 0.9998 0.2
a Italicized ions were used for quantification in the MS/MS detection mode
832 I. Carpinteiro et al.

yield of the extraction, particularly in the HS mode, datanot shown.
In a second series of experiments, the effect of the abovevariables was simultaneously investigated using a mixed-mode 31×22 experimental factorial design. Extractionswere carried out in 22-ml vessels, containing a magneticstir bar and 15-ml aliquots of ultrapure water (pH 6) spikedwith 1 ng ml−1 of compounds. The percentage of acetone inthe SPME vessel was maintained below 1%. Again, thesampling time was limited to 30 min. After this period,fibers were desorbed at 270 °C for 3 min. Table 3summarizes the domain of the design and the codifiedvalue for each factor. Responses (peak areas) obtained in
the 12 experiments involved in the above design wereprocessed using the StatGraphics Centurion XV software(Manugistics, Rockville, MD, USA) in order to obtain themain effects associated to each factor and also the two-factor interactions. The absolute value of the main effect fora given factor is proportional to the variation in theefficiency of the SPME process, when it changes from thelow to the high level, within the domain of the design. Apositive sign indicates an improvement in the yield of theextraction and a negative one the opposite effect.
Numerical values of main effects and significant two-factor interactions are summarized in Table 3. The variabletemperature (code C) played a positive effect on the
Tinuva
b
c
in P
N
N+
N
CH3
OH
N
N+
N
C C C
CH2
CH3
N
N+
N
C C C CH2
m/z = 225 m/z= 196
m/z = 168
-C2H4
-·COH
Tinuvin 326
N
N
N
CH3
C+
Cl
OH
CH3
CH3
N
N
N
CH3
CH2+
Cl
OH
m/z = 300m/z = 272
-C2H4
N
NH2+
N
Cl
m/z = 154
C
O
C+
CH3
CH3
CH3
m/z = 147
Allyl-bzt
N
N
N C+
OH
CH2
N
N
N C+
N
N+
N
CH2N
N
N+
CH
m/z = 250 m/z = 194
m/z = 132 m/z = 131
-CH2CHCH2
-OH
Fig. 1 Proposed structures forproduct ions observed in theMS/MS spectra of Tinuvin P(a), allyl-bzt (b), and Tinuvin326 (c)
SPME followed by GC–MS/MS for the determination of benzotriazole UV stabilizers 833

efficiency of the SPME, being statistically significant (95%confidence level) for all species, except Tinuvin P. Theextraction mode (code B) was also an important factor.Tinuvin 326, 328, and 327 were recovered in a significantlyhigher extension in the HS mode, whereas direct exposureof the fiber to the water sample was preferred for Tinuvin Pand allyl-bzt but without achieving the statistically signif-icant boundary. Finally, the type of fiber (code A) was theleast important of the three evaluated factors. As regardstwo-factor interactions, just the term BC (exposure mode-temperature) showed a significant importance for Tinuvin326, 328, and 327. Main effects and interaction plotsprovided by the StatGraphics software for Tinuvin P andTinuvin 328 are shown in Fig. 2. Allyl-bzt followed thesame trend as Tinuvin P, whereas Tinuvin 326 and 327behaved similarly to Tinuvin 328. The curvature associatedto the factor fiber (code A) in the main effect graph for
Tinuvin P indicates that the highest response for thisspecies corresponded to the PDMS–DVB coating, whereasvery little differences were noticed among the three fibersfor Tinuvin 328, Fig. 2a. The two-factor interaction plot forTinuvin 328 shows that the effect of the temperature (C)depended on the sampling mode (B). When the fiber isdipped into the sample, little differences in the efficiency ofthe extraction were observed as function the temperature. Onthe other hand, in the HS mode, maintaining the sample at100 °C was much more favorable than operating at 60 °C.
On the basis of the above results, the PDMS–DVB fiberwas chosen and extractions were carried out after equili-bration of the samples at 100 °C. The effect of the samplingmode was further evaluated for samples without and with a20% of NaCl. Increasing the ionic strength of water alsoincreases the distribution coefficients of nonionic speciesbetween the coating of the SPME fiber and the sample, at
Tinuvin P
-
-
+ +-
-+
+
-1 +1 -1 +1AB AC BC
-1 +1
-
-
+
+
0
2
4
6
8
10
Tinuvin P
A B C
-1 +1 -1 +1 -1 +10
2
4
6
8Tinuvin 328
0
1
2
3
4
5
A B C-1 +1 -1 +1 -1 +1
Tinuvin 328
Pea
k ar
ea (
x 10
7 )P
eak
area
(x
107 )
Pea
k ar
ea (
x 10
6 )P
eak
area
(x
106 )
- -
+ +
--
+ +
--+
+
0
2
4
6
8
10
-1 +1 -1 +1AB AC BC
-1 +1
A
B
Fig. 2 Main effects (a) andtwo-factor interaction (b) plotsfor Tinuvin P and Tinuvin 328.Values corresponding to −1, 0,and 1 levels for each factor aregiven in Table 3
Table 3 Experimental domain, standardized values for main effects, and the interaction extraction mode-sample temperature
Factor Code Level Standardized value
−1 0 +1 Tinuvin P Allyl-bzt Tinuvin 326 Tinuvin 328 Tinuvin 327
Fiber A PDMS PDMS–DVB PA 0.5 0.04 1.7 0.7 1.0
Sampling mode B Direct – HS −2.2 −2.4 14.6a 12.0a 19.4a
Temperature (°C) C 60 – 100 0.7 3.5a 20.1a 11.9a 20.1a
Samp. mode-temperature BC – – – 0.1 1.2 15.8a 10.0a 16.8a
a Statistically significant factors and interactions at the 95% confidence level
834 I. Carpinteiro et al.
the expense of slower extraction kinetics (particularly in thedirect mode) due to a diminution in the diffusion coefficientsof the analytes in the sample.
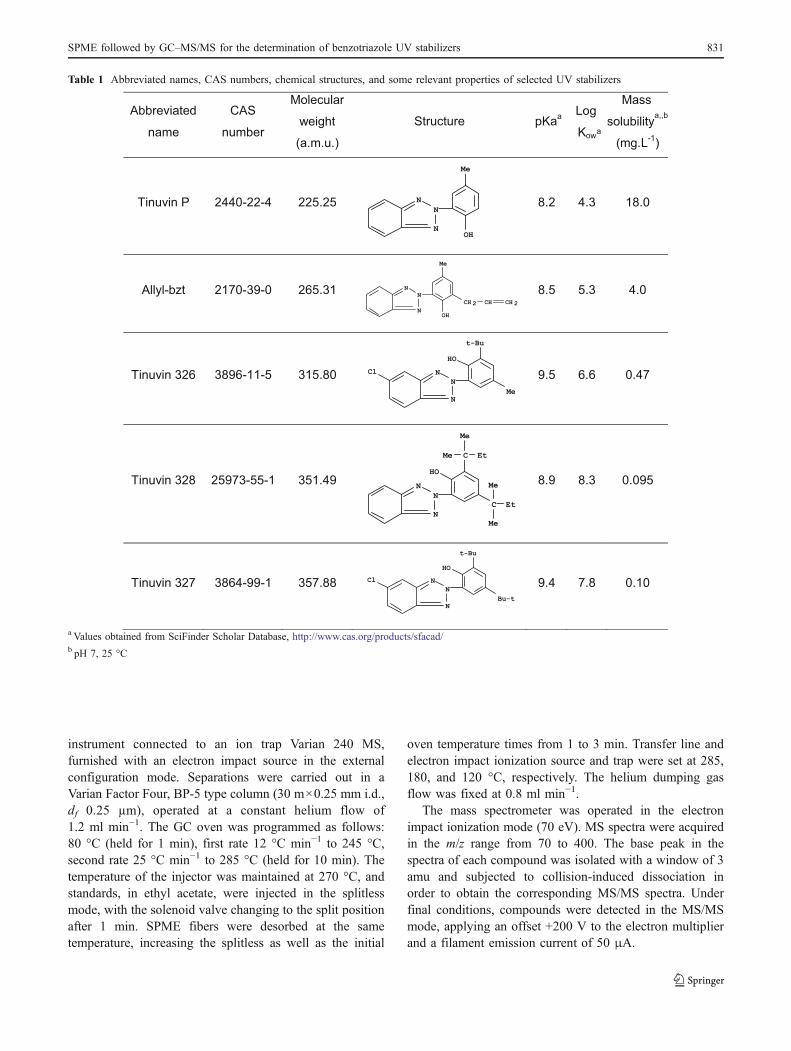
The highest responses for all compounds were attained inthe HS mode either without NaCl (Tin 326, 327, and 328) orwith 20% NaCl (Tin P and allyl-bzt). Taking into account thispattern, in addition to the higher selectivity of HS extractions,this modewas adopted for further experiments and the optimalconcentration of NaCl was evaluated in detail. Obtained dataare shown in Fig. 3. For the large molecular weight and morelipophilic species (Tinuvin 328 and 327, log Kow 8.3 and7.8), the efficiency of the extraction underwent a steadydecrease with the increase in the NaCl content in the sample.The effect observed for Tinuvin P (log Kow 4.3) was just theopposite. Responses for allyl-bzt and Tinuvin 326 increaseduntil NaCl concentrations of 15% and then started todecrease. The depicted behavior matched with that previous-ly reported for other families of compounds with variable
polarities [20]. As a compromise solution, 15% of NaCl wasadded to water samples.
Stirring is another variable that potentially affects the yieldof SPME extractions. Experimental data showed no signifi-cant differences between responses measured for Tinuvin Pand allyl-bzt in stirred (600 rpm) and nonstirredHS extractionsof aliquots from the same sample. On the other hand, forTinuvin 326, 328, and 327, higher extraction efficiencies werenoticed for stirred samples, data not shown. Probably, stirringcontributes to increase (1) the migration of these highlylipophilic species to the interfacewith the gas phase and (2) thesurface of contact between the sample and the HS due to theformation of a vortex. The neat result was an improvement inthe yield of the extraction for a fixed sampling time.
The presence of a phenol group in the structure of thebenzotriazole UV stabilizers confers them a slightly acidiccharacter; therefore, the performance of the HS SPMEprocess might decrease in wastewater samples, showing pH
0.0E+00
2.0E+06
4.0E+06
6.0E+06
8.0E+06
1.0E+07
1.2E+07
1.4E+07
0 20 40 60 80 100 120
Time (min)
Re
spo
nse
(p
ea
k a
rea
)
Tinuvin P Allyl-bzt Tinuvin 326 Tinuvin 328 Tinuvin 327Fig. 4 Time-course of the HSSPME at 100 °C
0.0E+00
1.0E+06
2.0E+06
3.0E+06
4.0E+06
5.0E+06
6.0E+06
7.0E+06
8.0E+06
9.0E+06
0 5 10 15 20 25 30
NaCl (%)R
espo
nse
(pea
k ar
ea)
Tinuvin P Allyl-bzt Tinuvin 326 Tinuvin 328 Tinuvin 327Fig. 3 Effect of NaCl concen-tration (%) on the HS SPMEresponses of UV-stabilizers.Average values for duplicateextractions
SPME followed by GC–MS/MS for the determination of benzotriazole UV stabilizers 835
values close to the pKa of target species (between 8.3 and9.5 units). Extractions carried out with samples adjusted atthree different pH, 4, 6, and 9, showed no differences in theamount of compounds transferred to the fiber, data notshown. Consequently, the pH of real-life water samples wasnot modified, unless it falls outside of the above interval.
HS SPME kinetics
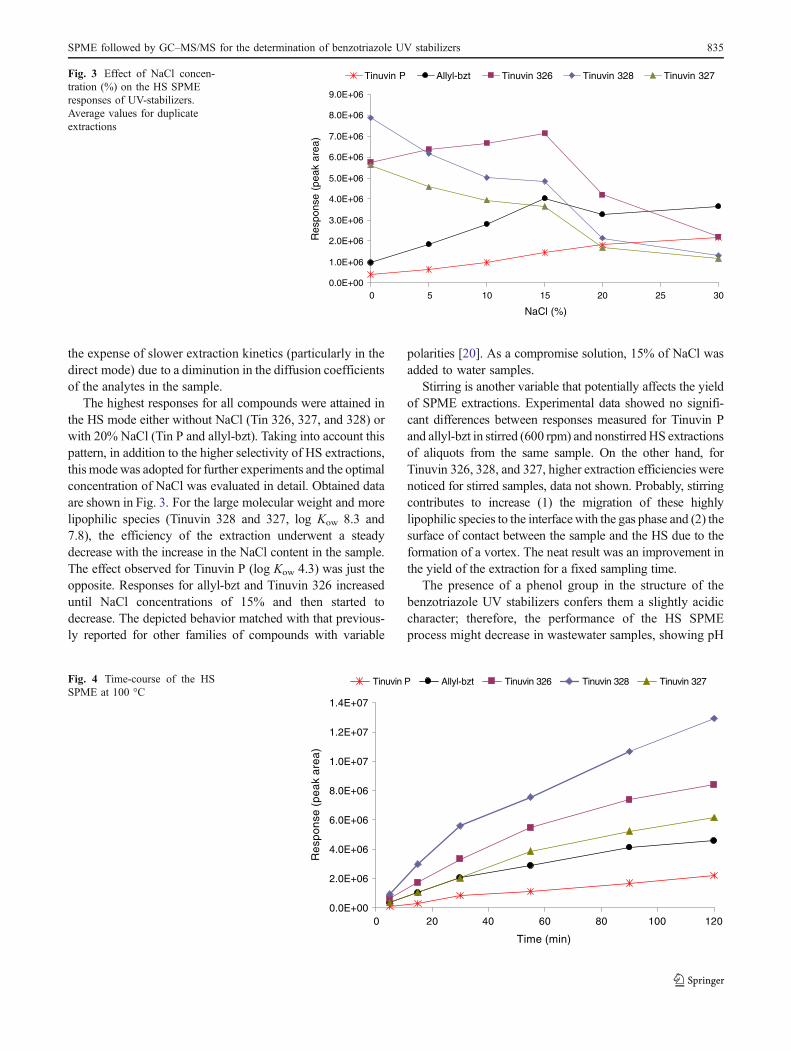
Figure 4 shows the time course plots of the HS SPMEextraction. As observed, equilibrium conditions were notachieved for any compound after 2 h of sampling at 100 °C.For practical reasons, the sampling time was maintained at30 min, assuming the corresponding loss of sensitivity atthe expense of improving the productivity of the method.Obviously, automation of the microextraction step will
make feasible the use of longer extraction steps, in order toreduce the overall LOQs of the method.
Figures of merit of the HS SPME method
Data related to the performance of the optimized protocolare summarized in Table 4. Linearity was evaluated withsamples spiked at seven concentration levels, from 2 to1,000 ng l−1. The plot of peak area versus concentrationfitted a linear response model with correlation coefficients(R2) higher than 0.997. Repeatability of the HS SPMEmethod ranged from 5% to 12%, for samples spiked at twodifferent concentration levels (50 and 500 ng l−1) andextracted within the same day (n=4 replicates). Reproduc-ibility for extractions carried out in three consecutive days(n=9 replicates) remained between 9% and 11% for a
17 18 19 20 Min.
0.0
2.5
5.0
7.5
10.0
kCounts
TinuvinP
Allyl-bzt Tinuvin326
Tinuvin 328 Tinuvin 327
m/z 168+196
m/z 132+194 m/z 147+272
m/z 252 m/z 286
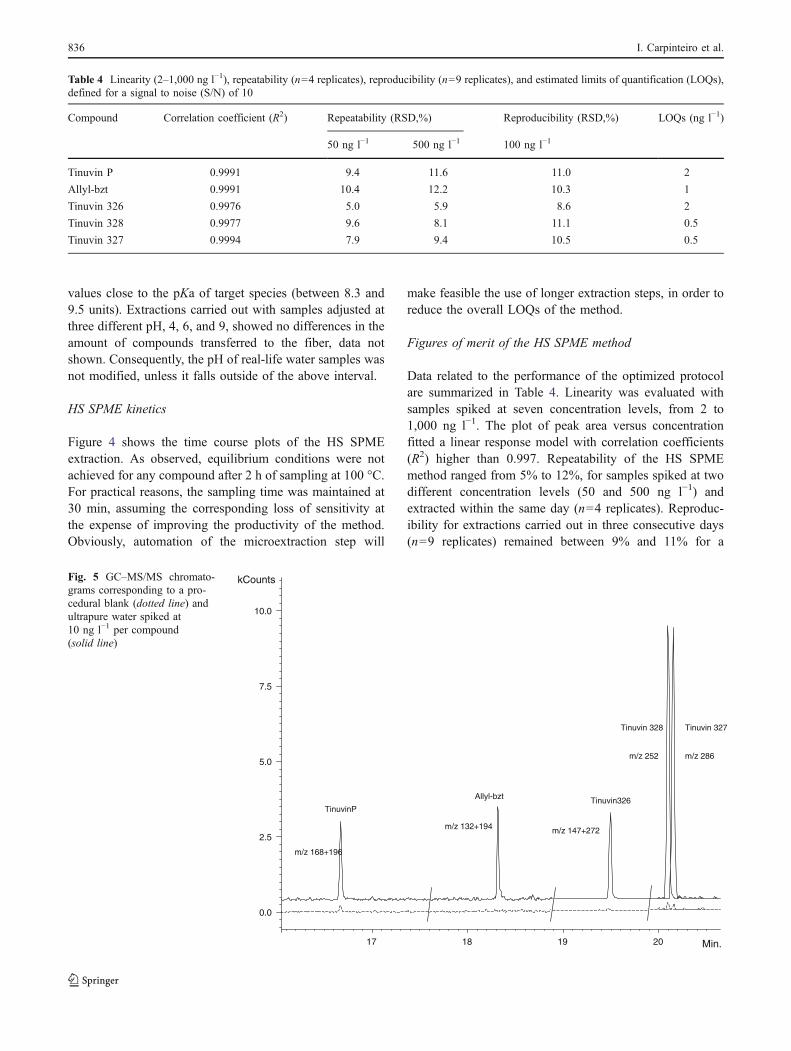
Fig. 5 GC–MS/MS chromato-grams corresponding to a pro-cedural blank (dotted line) andultrapure water spiked at10 ng l−1 per compound(solid line)
Table 4 Linearity (2–1,000 ng l−1), repeatability (n=4 replicates), reproducibility (n=9 replicates), and estimated limits of quantification (LOQs),defined for a signal to noise (S/N) of 10
Compound Correlation coefficient (R2) Repeatability (RSD,%) Reproducibility (RSD,%) LOQs (ng l−1)
50 ng l−1 500 ng l−1 100 ng l−1
Tinuvin P 0.9991 9.4 11.6 11.0 2
Allyl-bzt 0.9991 10.4 12.2 10.3 1
Tinuvin 326 0.9976 5.0 5.9 8.6 2
Tinuvin 328 0.9977 9.6 8.1 11.1 0.5
Tinuvin 327 0.9994 7.9 9.4 10.5 0.5
836 I. Carpinteiro et al.

concentration level of 100 ng l−1. Overall LOQs, estimatedconsidering the S/N ratios of chromatographic peaks in thelowest levels of the linearity study and the presence of traceamounts of some species in the procedural blanks (Fig. 5),varied between 0.5 and 2 ng l−1, depending on thecompound. As commented in previous sections, targetcompounds are prone to remain sorbed on solid surfaces.The use of new vessels for each extraction is mandatory toavoid cross-contamination problems. Teflon-layered mag-netic stir bars are another source of contamination betweensamples. Replacement of conventional stirrers by a dispos-able metallic screw (10 mm×3 mm) wrapped with Teflontape, minimizes cross-contamination problems. Finally,incomplete desorption of PDMS–DVB fibers may also bea source of carryover problems. Experimental data showedthat between 0.6% and 1.5% of the compounds remained inthe PDMS–DVB fiber after a desorption step of 3 min at270 °C, with 1.2 ml min−1 of helium flowing through theliner. Thus, before exposing the fiber to the next sample, itwas kept at the same temperature for 5 min under a heliumflow rate of 20 ml min−1. In addition to above consid-erations, procedural blanks must be processed systemati-cally to avoid the report of false positives duringapplication of the method to environmental water samples.
The effect of the sample matrix on the efficiency of the HSSPME process was evaluated with aliquots of river and urbanwastewater. After filtration, each sample was divided in twoaliquots. One was processed directly and the other spiked withselected compounds at 500 ng l−1. Differences betweenresponses attained for spiked and nonspiked fractions ofeach sample were normalized to those obtained for ultrapurewater. As shown in Table 5, similar efficiencies were noticed
among ultrapure, river, and treated wastewater. On the otherhand, significant enhancement and suppression effects werenoticed for raw wastewater, depending on the considered UVstabilizer. Taking this behavior into account, externalcalibration against spiked aliquots of ultrapure water can beused as quantification technique to determine the presence oftarget compounds in river and treated wastewater; however,the standard addition methodology is required for theiraccurate quantification in raw wastewater.
Real sample analysis
The developed methodology was used to investigate thepresence of UV stabilizers in filtered aliquots of river water(n=3 samples), two samples taken in the inlet and outletstreams of an urban wastewater plant and four additionalspecimens of raw wastewater samples provided by a locallaboratory. Compounds were not detected either in river or intreated wastewater. As regards raw wastewater samples, allyl-bzt and Tinuvin 327 also remained under the LOQ of themethod; however, the rest of species were noticed at concen-trations up to 57 ng l−1, Table 6. Chromatographic traces andMS/MS spectra for species quantified in sample code 2(Table 6) are shown in Fig. 6.
Conclusions
GC–MS/MS and SPME have been combined for the firsttime for the sensitive and selective determination of fivebenzotriazole UV stabilizers in water samples. Performanceof the sample preparation step is mainly controlled by the
Code Conc (ng l−1) ± SD
Tinuvin P Allyl-bzt Tinuvin 326 Tinuvin 328 Tinuvin 327
1 16±1 nd 39±6 19±2 nd
2 6±1 nd 57±9 16±4 nd
3 16±4 nd 19±1 nd nd
4 nd nd nd 1.0±0.1 nd
5 5±2 nd 3.5±0.5 2.0±0.1 nd
Table 6 Concentrations of UVstabilizers in raw wastewatersamples, n=3 replicates
nd not detected
Compound Normalized values with standard deviations within parenthesis
Ultrapure water River water Treated wastewater Raw wastewater
Tinuvin P 100 (8) 105 (7) 109 (5) 144 (14)
Allyl-bzt 100 (7) 108 (2) 107 (7) 92 (14)
Tinuvin 326 100 (6) 94 (9) 102 (8) 44 (2)
Tinuvin 328 100 (6) 89 (11) 91 (7) 30 (4)
Tinuvin 327 100 (3) 86 (12) 89 (6) 28 (1)
Table 5 Effect of the type ofwater sample on the relativeefficiency of the HS SPMEmethod
Normalized responses to thoseachieved for ultrapure water.Addition level 500 ng l−1 , n=4replicates
SPME followed by GC–MS/MS for the determination of benzotriazole UV stabilizers 837

extraction temperature, mode, ionic strength, and samplingtime. A suitable combination of the above factors, inaddition to the use of a PDMS–DVB fiber, allows theeffective extraction of selected compounds in the HS modewith the inherent advantages of higher selectivity and betterstability of the SPME coating, in comparison to the directexposure mode. Considering a sampling period of 30 min,
similar to the duration of the GC separation step, LOQs inthe low and even the sub-nanogram per liter level andacceptable precision were achieved. Trace amounts of someof the investigated species have been detected in filteredsamples of raw wastewater samples. This fact confirms thecontribution of sewage water to the introduction of UVstabilizers in the aquatic environment, where they are likely
minutes
Unspiked sample
16.00 16.25 16.50 16.75 17.00 17.25
0
100
200
300
400
500
600
700
800
Counts
225 168+196
TINUVIN P
165 170 175 180 185 190 195 200m/z
0%
25%
50%
75%
100%168.1
182.1
196.1
240 245 250 255 260 265 270m/z
0%
25%
50%
75%
100%
250.2
252.2
Procedural blank
20.0 20.1 20.2 20.3 20.4 minutes
0
100
200
300
400
500
600
700
Counts
TINUVIN 328
322 252
150 175 200 225 250 275 m/z
0%
25%
50%
75%
100%
147.1
154.1
272.2
19.0 19.1 19.2 19.3 19.4 19.5 19.6 19.7 19.8 19.9minutes
0
1
2
3
4kCounts
TINUVIN 326
300 272+147
Fig. 6 Chromatographic tracesand MS/MS spectra ofTinuvin P, 326 and 328 in anon-spiked wastewater sample(code 2, Table 6)
838 I. Carpinteiro et al.

fixed to suspended particles and sediments. Further re-search is necessary to evaluate the suitability of theproposed HS SPME method for the analysis of unfilteredwastewater and even sludge, in order to obtain anestimation of the concentrations of benzotriazole UVstabilizers discharged through urban wastewater.
Acknowledgments This study has been supported by the Xunta deGalicia, Spanish Government and E.U. FEDER funds (projectsPGIDIT08MDS008CT and CTQ2009-08377). I.C. and M.R. thanktheir FPU and Isidro Parga Pondal contracts to the Spanish Ministry ofScience and Innovation and the Xunta de Galicia, respectively.
References
1. Giokas DL, Salvador A, Chisvert A (2007) Trends Anal Chem26:360–374
2. Díaz-Cruz MS, Llorca M, Barceló D (2008) Trends Anal Chem27:873–887
3. Cuderman P, Heath E (2007) Anal Bioanal Chem 387:1343–13504. Rodil R, Moeder M (2008) Anal Chim Acta 612:152–1595. Plagellat C, Kupper T, Furrer R, Alencastro LF, Grandjean D,
Tarradellas J (2006) Chemosphere 62:915–925
6. Buser HR, Balmer ME, Schmid P, Kohler M (2006) Environ SciTechnol 40:1427–1431
7. Schlumpf M, Cotton B, Conscience M, Haller V, Steinmann B,Lichtensteiger W (2001) Environ Health Perspect 109:239–244
8. Himmelsbach M, Buchberger W, Reingruber E (2009) PolymDegrad Stab 94:1213–1219
9. Crawford JC (1999) Prog Polym Sci 24:7–4310. López-Avila V, Hites RA (1980) Environ Sci Technol 14:1382–139011. Reddy CM, Quinn JG, King JW (2000) Environ Sci Technol
34:973–97912. Hartmann PC, Quinn JG, Cairns RW, King JW (2005) Mar Poll
Bull 50:388–39513. Nakata H, Murata S, Filatreau J (2009) Environ Sci Technol
43:6920–692614. Carrott MJ, Jones DC, Davidson G (1998) Analyst 123:1827–
183315. Raynor MW, Bartle KD, Davies IL, Willians A, Clifford AA,
Chalmers JM, Cook BW (1988) Anal Chem 60:427–43316. Garrido-López A, Tena MT (2005) J Chromatogr A 1099:75–8317. Rodil R, Quintana JB, López-Mahía P, Muniategui-Lorenzo S,
Prada-Rodríguez D (2008) Anal Chem 80:1307–131518. Lambropoulou DA, Giokas DL, Sacas VA, Albanis TA, Karayannis
MI (2002) J Chromatogr A 967:243–25319. Rodil R, Quintana JB, López-Mahía P, Muniategui-Lorenzo S,
Prada-Rodríguez D (2009) J Chromatogr A 1216:2958–296920. Canosa P, Rodríguez I, Rubí E, Bollaín MH, Cela R (2006) J
Chromatogr A 1124:3–10
SPME followed by GC–MS/MS for the determination of benzotriazole UV stabilizers 839