Optimization of ultrasound assisted-emulsification-dispersive liquid–liquid microextraction...
10
Analytica Chimica Acta 683 (2010) 126–135 Contents lists available at ScienceDirect Analytica Chimica Acta journal homepage: www.elsevier.com/locate/aca Optimization of ultrasound assisted-emulsification-dispersive liquid–liquid microextraction by experimental design methodologies for the determination of sulfur compounds in wines by gas chromatography–mass spectrometry Viviana P. Jofré a,∗ , Mariela V. Assof a , Martín L. Fanzone a , Héctor C. Goicoechea b,e , Luis D. Martínez b,d , María F. Silva b,c a Laboratorio de Aromas y Sustancias Naturales, Estación Experimental Agropecuaria Mendoza, Instituto Nacional de Tecnología Agropecuaria (INTA), San Martín 3853, CP 5700, Mendoza, Argentina b Consejo Nacional de Investigaciones Científicas y Técnicas (CONICET), Avda. Rivadavia 1917, CP C1033AAJ, Buenos Aires, Argentina c IBAM, Facultad de Ciencias Agrarias, Universidad Nacional de Cuyo, CONICET. Alte. Brown 500, CP 5505, Chacras de Coria, Mendoza, Argentina d INQUISAL, Departamento de Química, Universidad Nacional de San Luis, CONICET. Chacabuco y Pedernera. CP D5700BWS. San Luis, Argentina e Laboratorio de Desarrollo Analítico y Quimiometría (LADAQ), Cátedra de Química Analítica I, Facultad de Bioquímica y Ciencias Biológicas, Universidad Nacional del Litoral, Ciudad Universitaria, CP S3000ZAA, Santa Fe, Argentina article info Article history: Received 20 August 2010 Received in revised form 7 October 2010 Accepted 10 October 2010 Available online 15 October 2010 Keywords: Sulfur compound Ultrasound assisted-emulsification-dispersive liquid–liquid microextraction/gas chromatography–mass spectrometry Experimental design Wine abstract A new method was developed for analyzing sulfur compounds in the aroma of white wines using ultrasound assisted-emulsification-dispersive liquid–liquid microextraction coupled with gas chromatography–mass spectrometry detection. In the present work, the analytical method for simultane- ous determination of seven sulfur compounds (methylmercaptoacetate, methyl(methylthio)acetate, 2- methylthioethanol, 3-methylthiopropanol, 3-methylthiohexanol, 4-methylthio-4-methyl-2-pentanone and hexanethiol) is reported. Parameters that affect the efficiency of the methodology such as extract- ing and dispersing solvents, sample volume, ion strength, cavitation time and centrifugation time were investigated using a fractionated factorial 2 6–1 (R = V) screening design. Then, the factors presenting sig- nificant positive effects on the analytical response (extracting volume, ion strength, cavitation time and centrifugation time) were considered in a further central composite design to optimize the operational conditions for the ultrasound assisted-emulsification-dispersive liquid–liquid microextraction proce- dure. Additionally, multiple response simultaneous optimization by using the desirability function was used to find the optimum experimental conditions. The best results were obtained using pH sample 4.25, extractant volume 150 L, ionic strength 8.75% NaCl, cavitation time 20 s and centrifugation time 50 s. The use of the optimized ultrasound assisted-emulsification-dispersive liquid–liquid microextrac- tion technique allowed to obtain the best extraction results with the minimum interference from other substances from the matrix, and it allowed to quantify the analytes in white wine samples by calibration graphs. Recoveries ranging from 91.99% to 125.87% for all sulfur compounds proved the accuracy of the proposed method in white wine samples. Method detection limits were in the range of 0.36–1.67 ng mL −1 and limits of quantitation were between 0.63 and 3.02 ng mL −1 for sulfur compounds in white wine sam- ples. The proposed methodology was successfully applied for the determination concentrations of sulfur compounds in different commercial Chardonnay wine samples from Mendoza, Argentine. © 2010 Elsevier B.V. All rights reserved. Abbreviations: SCs, sulfur compounds; GC–MS, gas chromatography–mass spectrometry; LLE, liquid–liquid extraction; DLLME, dispersive liquid–liquid microextraction; SPME, solid-phase micro-extraction; LPME, liquid–liquid microex- traction; USALLE, ultrasound assisted liquid–liquid extraction; USAEME, ultrasound assisted emulsification–microextraction; CCD, central composite design; IS, internal standard; OFAT, one-factor-a-time methodology; EF, enrichment factors; MTMP, 4- methylthio-4-methyl-2-pentanone; MTH, 3-methylthiohexanol; MTA, methylmer- captoacetate; MMTA, methyl(methylthio)acetate; MTE, 2-methylthioethanol; ME, 2-mercaptoethanol; MTP, 3-methylthiopropanol; HT, hexanethiol. ∗ Corresponding author. Tel.: +54 261 4963020; fax: +54 261 4963020. E-mail address: [email protected] (V.P. Jofré). 1. Introduction Wine is not only considered as one of the oldest beverages of the world, it may be also the beverage with the most sophisticated diversity. Wine is a hidroalcoholic solution containing hundreds of compounds; this complexity originates from three major sources: the raw material, which originates from thousands of grape vari- eties growing on a wide array of geological formations in different climates and altitudes, the fermentation process accomplished by a multitude of yeast and malolactic bacteria species and strains, and the ageing process, which varies owing to different storage 0003-2670/$ – see front matter © 2010 Elsevier B.V. All rights reserved. doi:10.1016/j.aca.2010.10.010
-
Upload
independent -
Category
Documents
-
view
3 -
download
0
Transcript of Optimization of ultrasound assisted-emulsification-dispersive liquid–liquid microextraction...
Oms
VLa
Cb
c
d
e
C
a
ARRAA
KSUalcEW
smtasmc2
0d
Analytica Chimica Acta 683 (2010) 126–135
Contents lists available at ScienceDirect
Analytica Chimica Acta
journa l homepage: www.e lsev ier .com/ locate /aca
ptimization of ultrasound assisted-emulsification-dispersive liquid–liquidicroextraction by experimental design methodologies for the determination of
ulfur compounds in wines by gas chromatography–mass spectrometry
iviana P. Jofréa,∗, Mariela V. Assofa, Martín L. Fanzonea, Héctor C. Goicoecheab,e,uis D. Martínezb,d, María F. Silvab,c
Laboratorio de Aromas y Sustancias Naturales, Estación Experimental Agropecuaria Mendoza, Instituto Nacional de Tecnología Agropecuaria (INTA), San Martín 3853,P 5700, Mendoza, ArgentinaConsejo Nacional de Investigaciones Científicas y Técnicas (CONICET), Avda. Rivadavia 1917, CP C1033AAJ, Buenos Aires, ArgentinaIBAM, Facultad de Ciencias Agrarias, Universidad Nacional de Cuyo, CONICET. Alte. Brown 500, CP 5505, Chacras de Coria, Mendoza, ArgentinaINQUISAL, Departamento de Química, Universidad Nacional de San Luis, CONICET. Chacabuco y Pedernera. CP D5700BWS. San Luis, ArgentinaLaboratorio de Desarrollo Analítico y Quimiometría (LADAQ), Cátedra de Química Analítica I, Facultad de Bioquímica y Ciencias Biológicas, Universidad Nacional del Litoral,iudad Universitaria, CP S3000ZAA, Santa Fe, Argentina
r t i c l e i n f o
rticle history:eceived 20 August 2010eceived in revised form 7 October 2010ccepted 10 October 2010vailable online 15 October 2010
eywords:ulfur compoundltrasoundssisted-emulsification-dispersiveiquid–liquid microextraction/gashromatography–mass spectrometryxperimental designine
a b s t r a c t
A new method was developed for analyzing sulfur compounds in the aroma of white winesusing ultrasound assisted-emulsification-dispersive liquid–liquid microextraction coupled with gaschromatography–mass spectrometry detection. In the present work, the analytical method for simultane-ous determination of seven sulfur compounds (methylmercaptoacetate, methyl(methylthio)acetate, 2-methylthioethanol, 3-methylthiopropanol, 3-methylthiohexanol, 4-methylthio-4-methyl-2-pentanoneand hexanethiol) is reported. Parameters that affect the efficiency of the methodology such as extract-ing and dispersing solvents, sample volume, ion strength, cavitation time and centrifugation time wereinvestigated using a fractionated factorial 26–1 (R = V) screening design. Then, the factors presenting sig-nificant positive effects on the analytical response (extracting volume, ion strength, cavitation time andcentrifugation time) were considered in a further central composite design to optimize the operationalconditions for the ultrasound assisted-emulsification-dispersive liquid–liquid microextraction proce-dure. Additionally, multiple response simultaneous optimization by using the desirability function wasused to find the optimum experimental conditions. The best results were obtained using pH sample4.25, extractant volume 150 �L, ionic strength 8.75% NaCl, cavitation time 20 s and centrifugation time50 s. The use of the optimized ultrasound assisted-emulsification-dispersive liquid–liquid microextrac-
tion technique allowed to obtain the best extraction results with the minimum interference from othersubstances from the matrix, and it allowed to quantify the analytes in white wine samples by calibrationgraphs. Recoveries ranging from 91.99% to 125.87% for all sulfur compounds proved the accuracy of theproposed method in white wine samples. Method detection limits were in the range of 0.36–1.67 ng mL−1and limits of quantitation were between 0.63 and 3.02 ng mL−1 for sulfur compounds in white wine sam-ples. The proposed methodolocompounds in different comm
Abbreviations: SCs, sulfur compounds; GC–MS, gas chromatography–masspectrometry; LLE, liquid–liquid extraction; DLLME, dispersive liquid–liquidicroextraction; SPME, solid-phase micro-extraction; LPME, liquid–liquid microex-
raction; USALLE, ultrasound assisted liquid–liquid extraction; USAEME, ultrasoundssisted emulsification–microextraction; CCD, central composite design; IS, internaltandard; OFAT, one-factor-a-time methodology; EF, enrichment factors; MTMP, 4-ethylthio-4-methyl-2-pentanone; MTH, 3-methylthiohexanol; MTA, methylmer-
aptoacetate; MMTA, methyl(methylthio)acetate; MTE, 2-methylthioethanol; ME,-mercaptoethanol; MTP, 3-methylthiopropanol; HT, hexanethiol.∗ Corresponding author. Tel.: +54 261 4963020; fax: +54 261 4963020.
E-mail address: [email protected] (V.P. Jofré).
003-2670/$ – see front matter © 2010 Elsevier B.V. All rights reserved.oi:10.1016/j.aca.2010.10.010
gy was successfully applied for the determination concentrations of sulfurercial Chardonnay wine samples from Mendoza, Argentine.
© 2010 Elsevier B.V. All rights reserved.
1. Introduction
Wine is not only considered as one of the oldest beverages ofthe world, it may be also the beverage with the most sophisticateddiversity. Wine is a hidroalcoholic solution containing hundreds ofcompounds; this complexity originates from three major sources:
the raw material, which originates from thousands of grape vari-eties growing on a wide array of geological formations in differentclimates and altitudes, the fermentation process accomplished bya multitude of yeast and malolactic bacteria species and strains,and the ageing process, which varies owing to different storage
himica
mia
iscraticebbct
tivlfctt
lwbhAcucpc
tit[dcSqtq
wl(JmpotTee
m[esv
V.P. Jofré et al. / Analytica C
ethods, container size and material, such as oak barrels of vary-ng origin, but also owing to stocking time, which may range fromfew weeks to more than several decades [1].
Flavour is one of the most important parameters of wine qual-ty, since the interaction of aromatic substances with the senses ofmell and taste leads to consumer acceptance or rejection. Sulfurompounds have a great sensorial impact and play an importantole in flavour of wines. Despite their structure, these compoundsre classified in different families: thiol, sulphides, polysulphides,hioesters and heterocyclic compounds [2]. A variety of sensorympressions are possible for wines depending on their uniqueoncentrations, their aromatic properties and synergist–antagonistffect [3]. In general, these compounds are associated to off-flavourecause these are described in wines like cauliflower, potato, cab-age, onion, rubber, etc. [4,5]. Nevertheless, there are some sulfurompounds which are typical of some varieties which contributeo varietal aroma of these wines [6–11].
There is therefore a growing interest in developing more sensi-ive and selective analytical methods to analyze sulfur compoundsn wine. Nevertheless, few analytical methods for quantifyingolatile or semivolatile thiols in wine have been developed. Ana-yzing these compounds in wine is a great challenge due to theollowing facts: the complexity of the sample matrix, the low con-entration levels (below ng mL−1), and the highly reactive nature ofhese compounds owing to their oxidation tendency during extrac-ion [12–14].
The most commonly used methods are based on theiquid–liquid extraction (LLE) of sulfur compounds from wine
ith an azeotropic mixture [9,10,15], or extraction followedy the formation of a reversible complex of thiols with p-ydroxymercurybenzoate [11,15] prior to gas-chromatography.lthough these methods result in very clean extracts with highoncentration factors and good sensitivity, they require large vol-mes of samples and organic solvents and, some one of them, usearcinogenic mercuric derivatives. Moreover, they are often com-licated and numerous steps are needed thus increasing the risk ofompound loss [16].
Solid-phase micro-extraction (SPME) is a solvent-free extrac-ion technique which combines extraction and preconcentrationn one step. Different authors have been studied diverse condi-ions in order to analyze sulfur compounds from wine samples17–19]. The SPME technique has been associated with chemicalerivatization for determination of volatile and semivolatile sulfurompounds in wines [20–22]. All the described methods that usePME are too expensive and require well-trained analysts. Conse-uently, they have a restrictive application in the routine analyseso determine sulfur compounds in wine in order to control wineuality or winemaking process.
LPME is a solvent-miniaturized procedure of LLE, compatibleith capillary gas chromatography, capillary electrophoresis and
iquid chromatography [23,24]. The single drop microextractionSDME) method of sample preparation was initially proposed byeannot and Cantwell [25]. This technique, which uses a liquid
icrodrop with an appropriate density, surface-tension and vaporressure, requires high manual dexterity [26]. The reproducibilityf this method is often poor due to the instability of the microdrophat can easily be dislodged from the tip of microsyringe needle.he latter generates inconveniences to reach the thermodynamicquilibrium and, in the worst in the cases, it results in a failedxperiment [23].
Dispersive liquid–liquid microextraction (DLLME) is a fairly new
ethod of sample preparation, initially proposed by Rezaee et al.27]. DLLME is a miniaturized LLE that uses microliter volumes ofxtraction solvent. This method is based on a ternary componentolvent system in which the extraction solvent and disperser sol-ent are injected into aqueous sample by syringe. The mixture is
Acta 683 (2010) 126–135 127
shaken and a cloudy solution is formed in the test tube. After cen-trifugation, the extract is taken with a micro syringe and analyzed.The advantages of DLLME are simplicity of operation, rapidness,low cost, high recovery and robustness, high enrichment factors,and environmental benignity [27,28].
On the other hand, the application of ultrasonic radiationis a powerful aid in the acceleration of various steps of theanalytical process, therefore ultrasound assisted liquid–liquidextraction (USALLE) has been used as an alternative to conventionalLLE [29,30]. Regarding liquid–liquid extraction, the main effectsof ultrasounds can be summarized as follows: an enormouslyextended contact surface between both phases to form emulsionswith submicron droplet size, the homogenization of the externalphase by the action of acoustic flows, and the momentary andlocalized strong increments of pressure and temperature [30,31].In this way, ultrasound assisted emulsification–microextraction(USAEME) can be employed as a simple and efficient extractionand preconcentration procedure for organic compounds in aqueoussamples [32].
To best of our knowledge, there is no report on the use ofUSAEME for the analysis of SCs in wine. The aim of the currentwork was to develop a fast and sensitive method for the extrac-tion by USAEME and determination by gas chromatography–massspectrometry (GC–MS) with pressure pulse injection of sulfur com-pounds (SCs) in white wine samples. Taking into account that aconsiderable number of variables can affect the extraction yieldin the USAEME procedure, and they may also be correlated, opti-mization was carried out through a multivariate approach. Firstly, afractionated fractional design was employed as a screening step forthe main parameters affecting the extraction and preconcentrationprocesses and then, a central composite design (CCD) was used tooptimize the values of the significant variables in order to obtainthe best responses. The multiple response criterium was success-fully used to optimize peak areas of analytes and the analysis timeusing the desirability function. The optimized procedure was suc-cessfully applied to the determination of SCs in commercial whitewines from Mendoza, Argentine.
2. Materials and methods
2.1. Standards, reagents and samples
The sulfur compounds studied were: 2-mercaptoethanol[60–24–2] supplied by Fluka (Buchs, Switzerland), whilemethylmercaptoacetate [2365–48–2], 3-methylthiopropanol[505–10–2], 3-methylthiohexanol [51755–66–9], 4-methylthio-4-methyl-2-pentanone [23550–40–5], hexanethiol [111–31–9],2-methylthioethanol [5271–38–5], and the internal standard(I.S.) methyl(methylthio)acetate [16630–66–3] were purchasedfrom Aldrich (Milwaukee, WIS, USA). Individual methanolic stocksolutions of each SCs were made. A standard mixture solution ofall target compounds was prepared in methanol at a final concen-tration of about 1 �g mL−1. Different standard working solutionswere prepared weekly by appropriate dilution and stored in ambercolored vials at −20 ◦C.
Methanol, ethanol, acetonitrile, acetone, dichloromethane,pentane, carbon tetrachloride, tretrachloroethylene, 1,2-dichloroethane, 1-chlorobenzene, 1,2-dichlorobenzene,1,2,4-trichlorobenzene (spectroscopic or chromatographic grade)were purchased from Merck (Darmstadt, Germany). Sodiumchloride, sodium hydroxide and charcoal were purchased from
Merck. Citric acid, glycerol, d(+)-glucose and d(−)-fructose weresupply by Sigma (Steinheim, Germany), and lactic acid by Fluka.All reactives were analytical grade or superior. Ultra pure waterwas obtained from a RiO/Elix3-Sinergy185 purification system(Millipore, Sao Pablo, Brazil).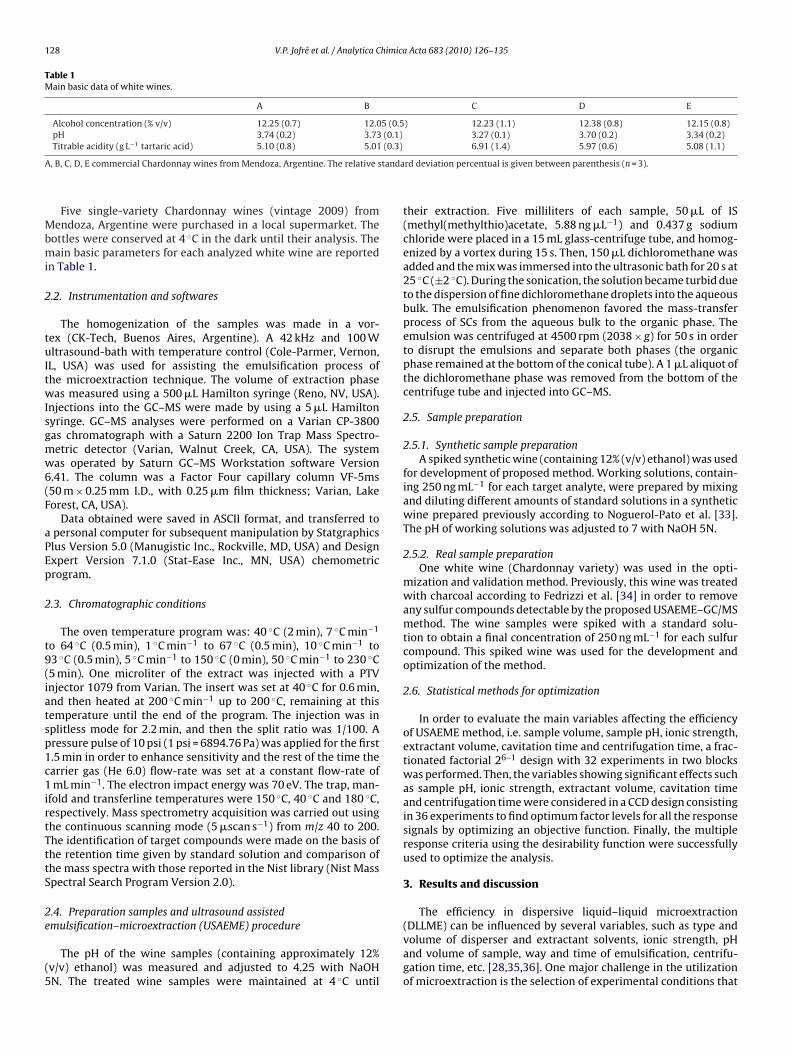
128 V.P. Jofré et al. / Analytica Chimica Acta 683 (2010) 126–135
Table 1Main basic data of white wines.
A B C D E
Alcohol concentration (% v/v) 12.25 (0.7) 12.05 (0.5) 12.23 (1.1) 12.38 (0.8) 12.15 (0.8)pH 3.74 (0.2) 3.73 (0.1) 3.27 (0.1) 3.70 (0.2) 3.34 (0.2)
(0.3)
A tanda
Mbmi
2
tuItwIsgmw6(F
aPEp
2
t9(iatsp1c1irtTttS
2e
(5
Titrable acidity (g L−1 tartaric acid) 5.10 (0.8) 5.01
, B, C, D, E commercial Chardonnay wines from Mendoza, Argentine. The relative s
Five single-variety Chardonnay wines (vintage 2009) fromendoza, Argentine were purchased in a local supermarket. The
ottles were conserved at 4 ◦C in the dark until their analysis. Theain basic parameters for each analyzed white wine are reported
n Table 1.
.2. Instrumentation and softwares
The homogenization of the samples was made in a vor-ex (CK-Tech, Buenos Aires, Argentine). A 42 kHz and 100 Wltrasound-bath with temperature control (Cole-Parmer, Vernon,
L, USA) was used for assisting the emulsification process ofhe microextraction technique. The volume of extraction phaseas measured using a 500 �L Hamilton syringe (Reno, NV, USA).
njections into the GC–MS were made by using a 5 �L Hamiltonyringe. GC–MS analyses were performed on a Varian CP-3800as chromatograph with a Saturn 2200 Ion Trap Mass Spectro-etric detector (Varian, Walnut Creek, CA, USA). The systemas operated by Saturn GC–MS Workstation software Version
.41. The column was a Factor Four capillary column VF-5ms50 m × 0.25 mm I.D., with 0.25 �m film thickness; Varian, Lakeorest, CA, USA).
Data obtained were saved in ASCII format, and transferred topersonal computer for subsequent manipulation by Statgraphicslus Version 5.0 (Manugistic Inc., Rockville, MD, USA) and Designxpert Version 7.1.0 (Stat-Ease Inc., MN, USA) chemometricrogram.
.3. Chromatographic conditions
The oven temperature program was: 40 ◦C (2 min), 7 ◦C min−1
o 64 ◦C (0.5 min), 1 ◦C min−1 to 67 ◦C (0.5 min), 10 ◦C min−1 to3 ◦C (0.5 min), 5 ◦C min−1 to 150 ◦C (0 min), 50 ◦C min−1 to 230 ◦C5 min). One microliter of the extract was injected with a PTVnjector 1079 from Varian. The insert was set at 40 ◦C for 0.6 min,nd then heated at 200 ◦C min−1 up to 200 ◦C, remaining at thisemperature until the end of the program. The injection was inplitless mode for 2.2 min, and then the split ratio was 1/100. Aressure pulse of 10 psi (1 psi = 6894.76 Pa) was applied for the first.5 min in order to enhance sensitivity and the rest of the time thearrier gas (He 6.0) flow-rate was set at a constant flow-rate ofmL min−1. The electron impact energy was 70 eV. The trap, man-
fold and transferline temperatures were 150 ◦C, 40 ◦C and 180 ◦C,espectively. Mass spectrometry acquisition was carried out usinghe continuous scanning mode (5 �scan s−1) from m/z 40 to 200.he identification of target compounds were made on the basis ofhe retention time given by standard solution and comparison ofhe mass spectra with those reported in the Nist library (Nist Masspectral Search Program Version 2.0).
.4. Preparation samples and ultrasound assisted
mulsification–microextraction (USAEME) procedureThe pH of the wine samples (containing approximately 12%v/v) ethanol) was measured and adjusted to 4.25 with NaOHN. The treated wine samples were maintained at 4 ◦C until
6.91 (1.4) 5.97 (0.6) 5.08 (1.1)
rd deviation percentual is given between parenthesis (n = 3).
their extraction. Five milliliters of each sample, 50 �L of IS(methyl(methylthio)acetate, 5.88 ng �L−1) and 0.437 g sodiumchloride were placed in a 15 mL glass-centrifuge tube, and homog-enized by a vortex during 15 s. Then, 150 �L dichloromethane wasadded and the mix was immersed into the ultrasonic bath for 20 s at25 ◦C (±2 ◦C). During the sonication, the solution became turbid dueto the dispersion of fine dichloromethane droplets into the aqueousbulk. The emulsification phenomenon favored the mass-transferprocess of SCs from the aqueous bulk to the organic phase. Theemulsion was centrifuged at 4500 rpm (2038 × g) for 50 s in orderto disrupt the emulsions and separate both phases (the organicphase remained at the bottom of the conical tube). A 1 �L aliquot ofthe dichloromethane phase was removed from the bottom of thecentrifuge tube and injected into GC–MS.
2.5. Sample preparation
2.5.1. Synthetic sample preparationA spiked synthetic wine (containing 12% (v/v) ethanol) was used
for development of proposed method. Working solutions, contain-ing 250 ng mL−1 for each target analyte, were prepared by mixingand diluting different amounts of standard solutions in a syntheticwine prepared previously according to Noguerol-Pato et al. [33].The pH of working solutions was adjusted to 7 with NaOH 5N.
2.5.2. Real sample preparationOne white wine (Chardonnay variety) was used in the opti-
mization and validation method. Previously, this wine was treatedwith charcoal according to Fedrizzi et al. [34] in order to removeany sulfur compounds detectable by the proposed USAEME–GC/MSmethod. The wine samples were spiked with a standard solu-tion to obtain a final concentration of 250 ng mL−1 for each sulfurcompound. This spiked wine was used for the development andoptimization of the method.
2.6. Statistical methods for optimization
In order to evaluate the main variables affecting the efficiencyof USAEME method, i.e. sample volume, sample pH, ionic strength,extractant volume, cavitation time and centrifugation time, a frac-tionated factorial 26–1 design with 32 experiments in two blockswas performed. Then, the variables showing significant effects suchas sample pH, ionic strength, extractant volume, cavitation timeand centrifugation time were considered in a CCD design consistingin 36 experiments to find optimum factor levels for all the responsesignals by optimizing an objective function. Finally, the multipleresponse criteria using the desirability function were successfullyused to optimize the analysis.
3. Results and discussion
The efficiency in dispersive liquid–liquid microextraction
(DLLME) can be influenced by several variables, such as type andvolume of disperser and extractant solvents, ionic strength, pHand volume of sample, way and time of emulsification, centrifu-gation time, etc. [28,35,36]. One major challenge in the utilizationof microextraction is the selection of experimental conditions that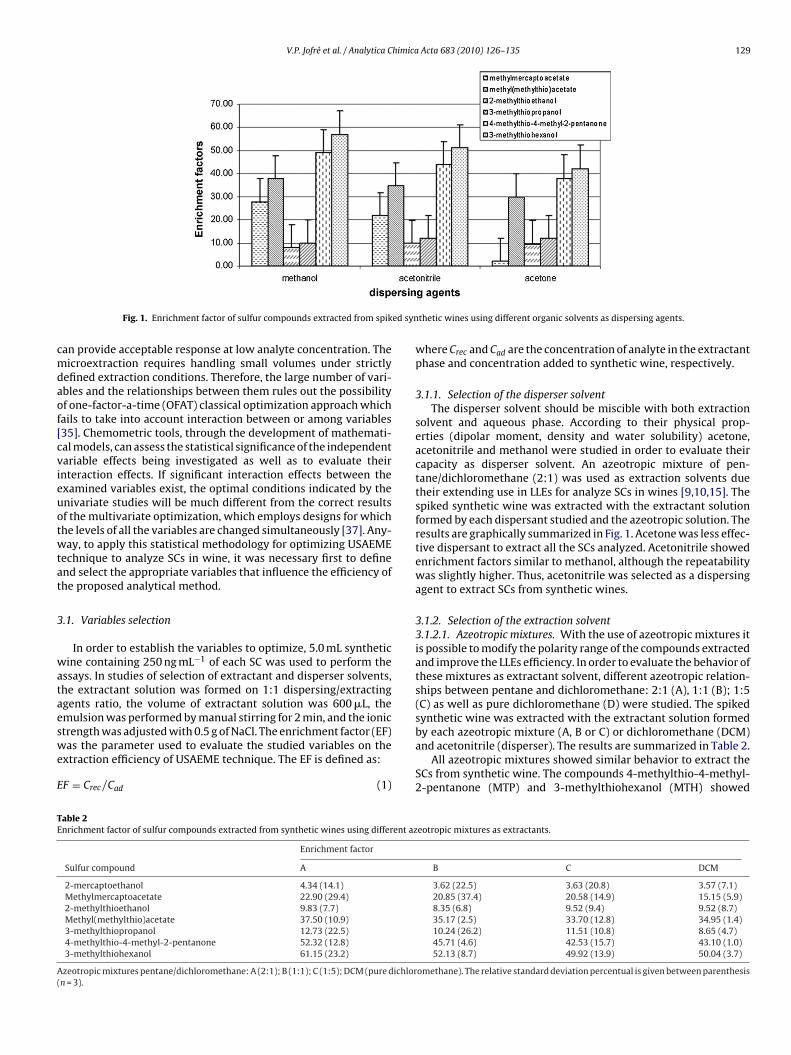
V.P. Jofré et al. / Analytica Chimica Acta 683 (2010) 126–135 129
ed syn
cmdaof[cvieuotwtat
3
wataeswe
E
TE
A(
Fig. 1. Enrichment factor of sulfur compounds extracted from spik
an provide acceptable response at low analyte concentration. Theicroextraction requires handling small volumes under strictly
efined extraction conditions. Therefore, the large number of vari-bles and the relationships between them rules out the possibilityf one-factor-a-time (OFAT) classical optimization approach whichails to take into account interaction between or among variables35]. Chemometric tools, through the development of mathemati-al models, can assess the statistical significance of the independentariable effects being investigated as well as to evaluate theirnteraction effects. If significant interaction effects between thexamined variables exist, the optimal conditions indicated by thenivariate studies will be much different from the correct resultsf the multivariate optimization, which employs designs for whichhe levels of all the variables are changed simultaneously [37]. Any-ay, to apply this statistical methodology for optimizing USAEME
echnique to analyze SCs in wine, it was necessary first to definend select the appropriate variables that influence the efficiency ofhe proposed analytical method.
.1. Variables selection
In order to establish the variables to optimize, 5.0 mL syntheticine containing 250 ng mL−1 of each SC was used to perform the
ssays. In studies of selection of extractant and disperser solvents,he extractant solution was formed on 1:1 dispersing/extractinggents ratio, the volume of extractant solution was 600 �L, themulsion was performed by manual stirring for 2 min, and the ionic
trength was adjusted with 0.5 g of NaCl. The enrichment factor (EF)as the parameter used to evaluate the studied variables on thextraction efficiency of USAEME technique. The EF is defined as:
F = Crec/Cad (1)
able 2nrichment factor of sulfur compounds extracted from synthetic wines using different az
Enrichment factor
Sulfur compound A
2-mercaptoethanol 4.34 (14.1)Methylmercaptoacetate 22.90 (29.4)2-methylthioethanol 9.83 (7.7)Methyl(methylthio)acetate 37.50 (10.9)3-methylthiopropanol 12.73 (22.5)4-methylthio-4-methyl-2-pentanone 52.32 (12.8)3-methylthiohexanol 61.15 (23.2)
zeotropic mixtures pentane/dichloromethane: A (2:1); B (1:1); C (1:5); DCM (pure dichlorn = 3).
thetic wines using different organic solvents as dispersing agents.
where Crec and Cad are the concentration of analyte in the extractantphase and concentration added to synthetic wine, respectively.
3.1.1. Selection of the disperser solventThe disperser solvent should be miscible with both extraction
solvent and aqueous phase. According to their physical prop-erties (dipolar moment, density and water solubility) acetone,acetonitrile and methanol were studied in order to evaluate theircapacity as disperser solvent. An azeotropic mixture of pen-tane/dichloromethane (2:1) was used as extraction solvents duetheir extending use in LLEs for analyze SCs in wines [9,10,15]. Thespiked synthetic wine was extracted with the extractant solutionformed by each dispersant studied and the azeotropic solution. Theresults are graphically summarized in Fig. 1. Acetone was less effec-tive dispersant to extract all the SCs analyzed. Acetonitrile showedenrichment factors similar to methanol, although the repeatabilitywas slightly higher. Thus, acetonitrile was selected as a dispersingagent to extract SCs from synthetic wines.
3.1.2. Selection of the extraction solvent3.1.2.1. Azeotropic mixtures. With the use of azeotropic mixtures itis possible to modify the polarity range of the compounds extractedand improve the LLEs efficiency. In order to evaluate the behavior ofthese mixtures as extractant solvent, different azeotropic relation-ships between pentane and dichloromethane: 2:1 (A), 1:1 (B); 1:5(C) as well as pure dichloromethane (D) were studied. The spikedsynthetic wine was extracted with the extractant solution formed
by each azeotropic mixture (A, B or C) or dichloromethane (DCM)and acetonitrile (disperser). The results are summarized in Table 2.All azeotropic mixtures showed similar behavior to extract theSCs from synthetic wine. The compounds 4-methylthio-4-methyl-2-pentanone (MTP) and 3-methylthiohexanol (MTH) showed
eotropic mixtures as extractants.
B C DCM
3.62 (22.5) 3.63 (20.8) 3.57 (7.1)20.85 (37.4) 20.58 (14.9) 15.15 (5.9)8.35 (6.8) 9.52 (9.4) 9.52 (8.7)35.17 (2.5) 33.70 (12.8) 34.95 (1.4)10.24 (26.2) 11.51 (10.8) 8.65 (4.7)45.71 (4.6) 42.53 (15.7) 43.10 (1.0)52.13 (8.7) 49.92 (13.9) 50.04 (3.7)
omethane). The relative standard deviation percentual is given between parenthesis
130 V.P. Jofré et al. / Analytica Chimica Acta 683 (2010) 126–135
Table 3Enrichment factor of sulfur compounds extracted from synthetic wines using different organic solvents as extractants.
Enrichment factor
Sulfur compound DCM CT TCE DCE CB DCB TCB
2-mercaptoethanol 3.57a (7.1) nd nd nd nd nd ndMethylmercaptoacetate 15.15a (5.9) 1.05c (50.1) nd 7.03b (58.2) nd nd nd2-methylthioethanol 9.52a (8.7) nd nd 3.53b (50.7) nd nd ndMethyl(methylthio)acetate 34.95a (1.4) 15.63b (24.0) 9.30c (47.8) 18.61b (51.6) 12.83b (29.4) nd nd3-methylthiopropanol 8.65a (4.7) 0.60c (22.0) nd 3.27b (48.9) 0.86c (10.8) 9.25a (5.2) nd4-methylthio-4-methyl-2-pentanone 43.10a (1.1) 20.23b (22.8) 22.84b (26.4) 22.16b (53.9) 10.85c (38.8) nd nd3-methylthiohexanol 50.04a (3.7) 21.69b (27.7) 11.23c (59.7) 26.33b (46.7) 9.25c (59.6) nd nd
O ethyl1 en pas
hed(ohod
tatSve
3etcattehaTt(tw
FE
rganic solvents: DCM dichloromethane; CT carbon tetrachloride; TCE tretrachloro,2,4-trichlorobenzene. The relative standard deviation percentual is given betweignificant differences with 95% confidence level (Tukey test HD).
igher enrichment factors (EF), followed by methylmercaptoac-tate (MTA) and methyl(methylthio)acetate (MMTA) with interme-iate EF, whereas 2-methylthioethanol (MTE), 2-mercaptoethanolME) and 3-methylthiopropanol (MTP) showed the lowest valuesf EF. The azeotrope A showed EF values (for all analytes) slightlyigher than the others. However, due to the inherent variabilityf the different treatments, there were no statistically significantifferences for the analytes extracted from synthetic wine.
The repeatability for each analyte from synthetic wine betweenhe treatments showed a different performance depending on thezeotropic mixture. In summary, all the treatments showed no sta-istically significant differences in EF related to the extraction forCs extracted from synthetic wines. Accordingly, as explained pre-iously, dichloromethane was the solvent that was better suited asxtracting agent for DLLME methodology.
.1.2.2. Organic solvents. Organic solvents are, by far, the most usedxtractant phases in DLLME methodology [36]. In general terms,he choice of a proper organic solvent is based on the old prin-iple “like dissolves like”, although it is advisable to take intoccount the physical properties of organic solvents according tohe microextraction methodology applied. In DLLME the extrac-ant phase should have higher density than water, be efficient toxtract the targeted compounds, form a stable cloudy solution andave low solubility in water. Considering the above, it was evalu-ted the ability of various organic solvents to act as extracting agent.
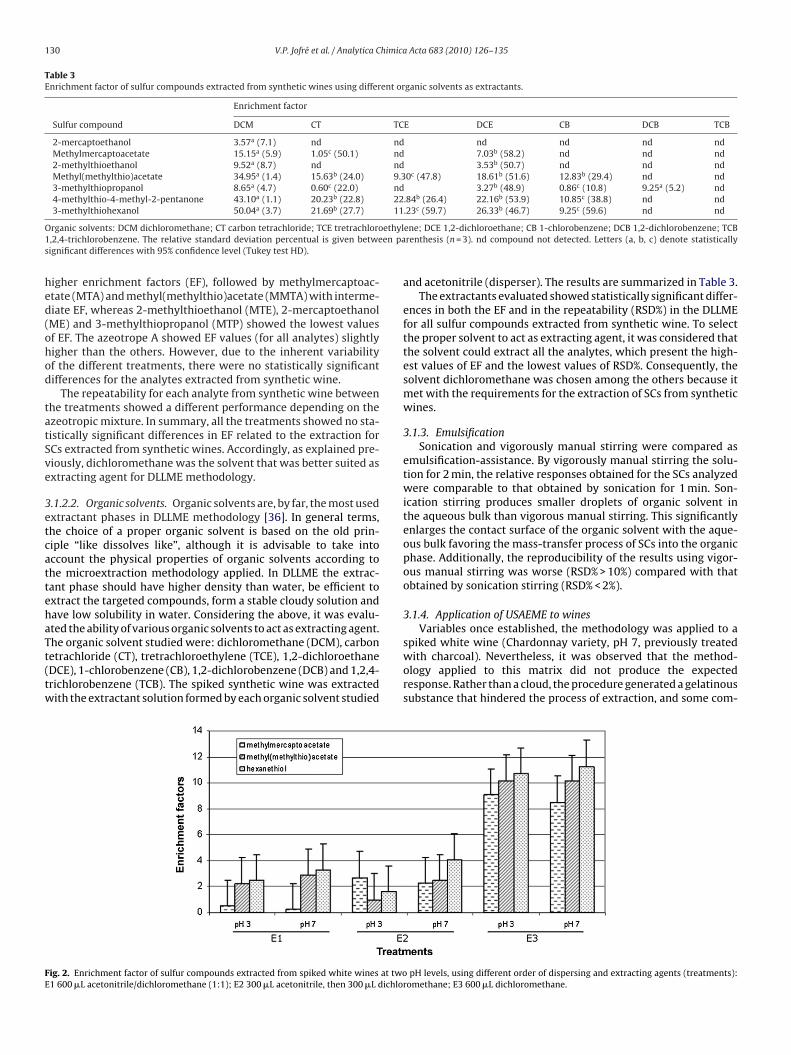
he organic solvent studied were: dichloromethane (DCM), carbonetrachloride (CT), tretrachloroethylene (TCE), 1,2-dichloroethaneDCE), 1-chlorobenzene (CB), 1,2-dichlorobenzene (DCB) and 1,2,4-richlorobenzene (TCB). The spiked synthetic wine was extractedith the extractant solution formed by each organic solvent studiedig. 2. Enrichment factor of sulfur compounds extracted from spiked white wines at two1 600 �L acetonitrile/dichloromethane (1:1); E2 300 �L acetonitrile, then 300 �L dichlor
ene; DCE 1,2-dichloroethane; CB 1-chlorobenzene; DCB 1,2-dichlorobenzene; TCBrenthesis (n = 3). nd compound not detected. Letters (a, b, c) denote statistically
and acetonitrile (disperser). The results are summarized in Table 3.The extractants evaluated showed statistically significant differ-
ences in both the EF and in the repeatability (RSD%) in the DLLMEfor all sulfur compounds extracted from synthetic wine. To selectthe proper solvent to act as extracting agent, it was considered thatthe solvent could extract all the analytes, which present the high-est values of EF and the lowest values of RSD%. Consequently, thesolvent dichloromethane was chosen among the others because itmet with the requirements for the extraction of SCs from syntheticwines.
3.1.3. EmulsificationSonication and vigorously manual stirring were compared as
emulsification-assistance. By vigorously manual stirring the solu-tion for 2 min, the relative responses obtained for the SCs analyzedwere comparable to that obtained by sonication for 1 min. Son-ication stirring produces smaller droplets of organic solvent inthe aqueous bulk than vigorous manual stirring. This significantlyenlarges the contact surface of the organic solvent with the aque-ous bulk favoring the mass-transfer process of SCs into the organicphase. Additionally, the reproducibility of the results using vigor-ous manual stirring was worse (RSD% > 10%) compared with thatobtained by sonication stirring (RSD% < 2%).
3.1.4. Application of USAEME to winesVariables once established, the methodology was applied to a
spiked white wine (Chardonnay variety, pH 7, previously treatedwith charcoal). Nevertheless, it was observed that the method-ology applied to this matrix did not produce the expectedresponse. Rather than a cloud, the procedure generated a gelatinoussubstance that hindered the process of extraction, and some com-
pH levels, using different order of dispersing and extracting agents (treatments):omethane; E3 600 �L dichloromethane.
V.P. Jofré et al. / Analytica Chimica Acta 683 (2010) 126–135 131
Table 4Probability values for main factors and double interactions obtained when applying ANOVA to the responses studied with fractionated factorial desing (26–1) built for factorselection.
MMA MTE MMTA HT
pvaluea,b
FactorsSample volume 0.1874 0.1275 0.4307 0.1653Sample pH 0.0004 (−) 0.0003 (−) 0.0041 (−) 0.2238Extractant volume 0.0018 (−) 0.0063 (+) 0.0001 (−) 0.0001 (−)Cavitation time 0.4167 0.1664 0.1379 0.2774Ionic strength 0.1194 0.4015 0.0019 (+) 0.3414Centrifugation time 0.866 0.0302 (−) 0.0762 (+) 0.2524
Interaction factorsSample pH–ionic strength 0.1005 0.1001Extractant volume–ionic strength 0.0046 0.0844Cavitation time–ionic strength 0.0002 0.0126 0.002 0.0268Ionic strength–centrifugation time 0.0197 0.0332 0.097
R yl(me
ptcttdwpa
wdmwtsTtbtiwi(da
wbopat
TS
esponses: MMA methylmercaptoacetate; MTE 2-methylthioethanol; MMTA metha Considered significant when pvalue < 0.10.b Signs between parenthesis correspond to the effects on the variables.
ounds could not be determined chromatographically. Faced withhis situation, methodological changes were made. Studies wereonducted separately adding a dispersing agent (300 �L acetoni-rile) and then extracting agent (300 �L dichloromethane); anotherest that consisted of adding only the extracting agent (300 �Lichloromethane) without the addition of dispersant. Also, theyere carried out at different pH values (3 and 7) to evaluate if theroblems encountered were associated with this effect. The resultsre graphically summarized in Fig. 2.
Methylmercaptoacetate (MMA) was not extracted fromine samples by E1 treatment. There were no significantifferences in extraction behavior, given by the EF, theethyl(methylthito)acetate (MMTA) and hexanotiol (HT) whenine samples were processed by the E1 and E2 treatments. Also,
he E3 treatment showed elevated EF values for the analytes undertudy compared to E1 and E2 for both treatments at pH 3 and 7.he latter could be ascribed to the gel-like formed in the E1 and E2reatments which constitute a barrier to the homogeneous distri-ution of the extracting agent (dichloromethane), and it reduceshe ability of acetonitrile to act as an appropriate dispersing agentn DLLME for the extraction/preconcentration of SCs from real
ines. In the E3 treatment, the dichloromethane was dispersedn the matrix by ethanol. This compound is present at high levels12% v/v) in wines, with the same physical properties (density andipolar moment) as methanol which behavior as performed wells a dispersing agent (Fig. 1).
On the other hand it was found that the EFs in real winesere lower than those obtained in synthetic wine. This could
e due to the different types of intermolecular interactions thatccur between volatile analytes and macromolecules (polyphenols,olysaccharides, proteins, etc.) present in wines [38]. These inter-ctions, which occur at the molecular level, generate changes inhermodynamic equilibria involving the analytes, such as volatil-
able 5tatistical value when applying ANOVA of lack of fit and regression of the selected model
Model pva
Response (enrichment factor) Mo
Methylmercaptoacetate Linear 0.02-methylthioethanol Quadratic 0.0Methyl(methylthio)acetate Linear <0.Hexanethiol Linear 0.03-methylthiopropanol Linear 0.14-methylthio-4-methyl-2-pentanone Linear <0.3-methylthiohexanol Linear <0.
a Considered significant when pvalue < 0.05.
thylthio)acetate; HT hexanethiol.
ity, solubility and transport phenomena between the aqueous andorganic phases.
3.2. Optimization of USAEME procedure
3.2.1. Screening phaseThe USAEME procedure is depending on numerous factors, the
sequential study of all the potential factors being too complex, andinvolving a prohibitive long experimental time. Consequently, anexperimental fractionated factorial 26–1 design (R = V) was built forthe determination of the main factors affecting the extraction effi-ciency. The analyzed factors were evaluated at two levels, selectedaccording to previous experiments. They were: sample volume(5 mL and 10 mL), extracting agent volume (100 �L and 300 �L),sample pH (3 and 7), ionic strength (5% and 10% NaCl), cavitationtime (15 s and 45 s) and centrifugation time (30 s and 60 s). Theevaluation consisted in analyzing a white wine sample, spiked at250 ng mL−1 of each analyte, evaluating EF in each case. Then, ananalysis of variance (ANOVA) test was applied to the experimentaldata to obtain an estimate of standard errors in the coefficients.As a conclusion of this analysis, all the variables were shownto be significant (pvalue < 0.1), with positive and negative effects(Table 4).
The sample volume had no significant effect on the extractionprocess, and it showed no interaction with the other variables.The cavitation time did not prove to be an important effect onUSAEME, but this variable showed a significant interaction effectwith ionic strength for all the analytes. The extraction volume and
the centrifugation time showed different patterns for the differentSCs evaluated. The sample pH showed negative effects (decreas-ing the extraction efficiency) when levels changed from low tohigh values, but this variable had significant interaction with ionicstrength. Also, ionic strength improved the extraction of MMTA fors.
luea R2 adj. CV%
del Lack of fit
029 0.2547 0.448 12.8035 0.7477 0.397 18.50001 0.2765 0.671 13.5001 0.3498 0.562 10.7315 0.0581 0.243 11.00001 0.2099 0.636 16.00001 0.0029 0.634 11.4
1 himica Acta 683 (2010) 126–135
hwso
3
eEiitupdt(icpup
cbUlmbevai
pTtims
scaiw
3
igff
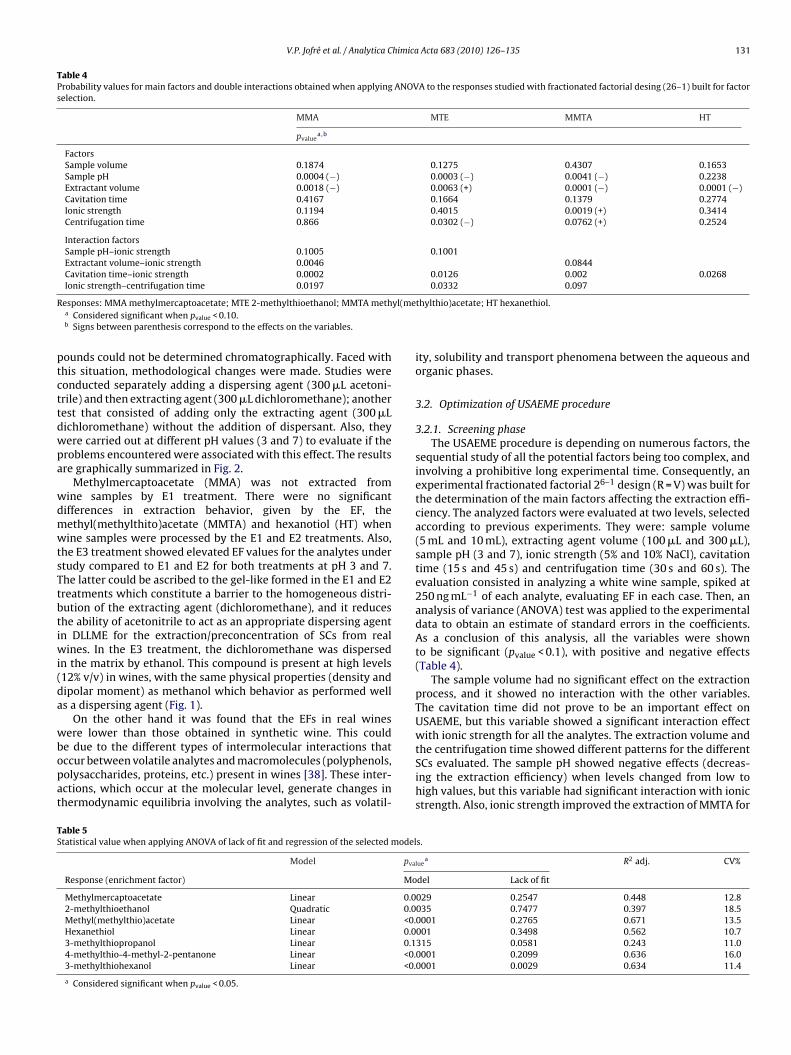
Fig. 3. Response surface plots corresponding to the desirability function when opti-mizing the following pair of factors, while maintaining constant the remaining one
TP
F
32 V.P. Jofré et al. / Analytica C
igh value, although significant interaction effects were observedith other variables for all analytes (Table 4). Consequently, the
ample volume is the factor that remains fixed (5.0 mL), while thether factors were included in the following optimization process.
.2.2. Response surface designAn optimization procedure was applied in order to find out the
xact values of the most important factors to obtain maximumF. Systematic optimization procedures are carried out by select-ng an objective function, finding the most important factors andnvestigating the relationship between responses and factors byhe so-called response surface methodology (RSM) [39]. A CCD wassed to optimize the five variables (extracting agent volume, sam-le pH, ionic strength, cavitation time and centrifugation time). Theesign consisted of 36 experiments that resulted from the combina-ion of the selected independent variables in the following ranges:a) extracting agent volume: 100–300 �L, (b) sample pH: 3–8 (c)onic strength: 5–10% NaCl (d) cavitation time: 10–50 s and (e)entrifugation time: 20–60 s. These ranges were selected based onrior knowledge about the system under study. The sample vol-me was set fixed according to the results obtained in the screeninghase (see above).
Experiments for the CCD were performed in two blocks (twoonsecutive days) in order to remove the expected variation causedy some change during the course of the experiment [39] bySAEME of white wine samples spiked at 250 ng mL−1 of each ana-
ytes. EF for all the experiments were fitted to linear or quadraticodels, once outliers were removed by analyzing the difference
etween fitted values test (DFFITS). This test measures the influenceach point has on the predicted value, computing a standardizedalue, which can be interpreted as the number of standard devi-tion units owed to experimental data exerts disproportionatenfluence on the model [39].
The model coefficients were calculated by backward multi-le regression and validated by the ANOVA. As can be seen inable 5, linear and modified quadratic models are those which bet-er explain the behavior of EF under the studied factors, althoughrrelevant main terms were maintained in order to fit hierarchical
odels. As can be appreciated in Table 5, the lack of fit test is notignificant (pvalue > 0.05) in all cases.
Table 6 shows the probability values for each factor corre-ponding to the selected model. The pvalue showed that at 95%onfidence level, the sample pH affects the EF of MTA and MTP, andll responses were affected by the extractant volume. Besides, thenteractions between the squared of sample pH and ionic strength
ere significant for 2-methylthioethanol EF.
.2.3. Multi response optimization
When a single response is being analyzed, the model analysisndicates areas in the design region where the process is likely toive desirable results, which is a relatively easy task. However, aunction of more than one response can be used: the desirabilityunction, which includes the researcher’s priorities and desires on
able 6robability values for each factor corresponding to the selected model when applying AN
pvaluea
Sulfur compound B C
Methylmercaptoacetate 0.0006 0.01762-methylthioethanol 0.819Methyl(methylthio)acetate 0.9302 <0.0001Hexanethiol 0.0628 <0.00013-methylthiopropanol 0.0219 0.03694-methylthio-4-methyl-2-pentanone 0.9248 <0.00013-methylthiohexanol 0.0039 <0.0001
actors: B sample pH; C extractant volume; D cavitation time; E ionic strength; F centrifua Considered significant when pvalue < 0.05.
at their optimum values: (A) extractant volume–sample pH; ionic strength 8.75%NaCl, cavitation time 20 s, centrifugation time 50 s; (B) ionic strength–sample pH;extractant volume 150 �L, cavitation time 20 s, centrifugation time 50 s.
building the optimization procedure. Its application involves creat-
ing a function for each individual response dj and finally obtaining aglobal function D that should be maximized choosing the best con-ditions of the designed variables. The latter function varies from0 (value totally undesirable) to 1 (all responses are in a desirableOVA test.
D E F B2 E2
0.2178 0.4513 0.61840.8823 0.0004 0.0533
0.8612 0.504 0.40080.7263 0.7026 0.66540.6208 0.4329 0.63690.5128 0.5114 0.38320.1564 0.9407 0.2802
gation time.
V.P. Jofré et al. / Analytica Chimica Acta 683 (2010) 126–135 133
F on, an( thylth
r
D
wrsrwTvr(rttta
tfFwbeip
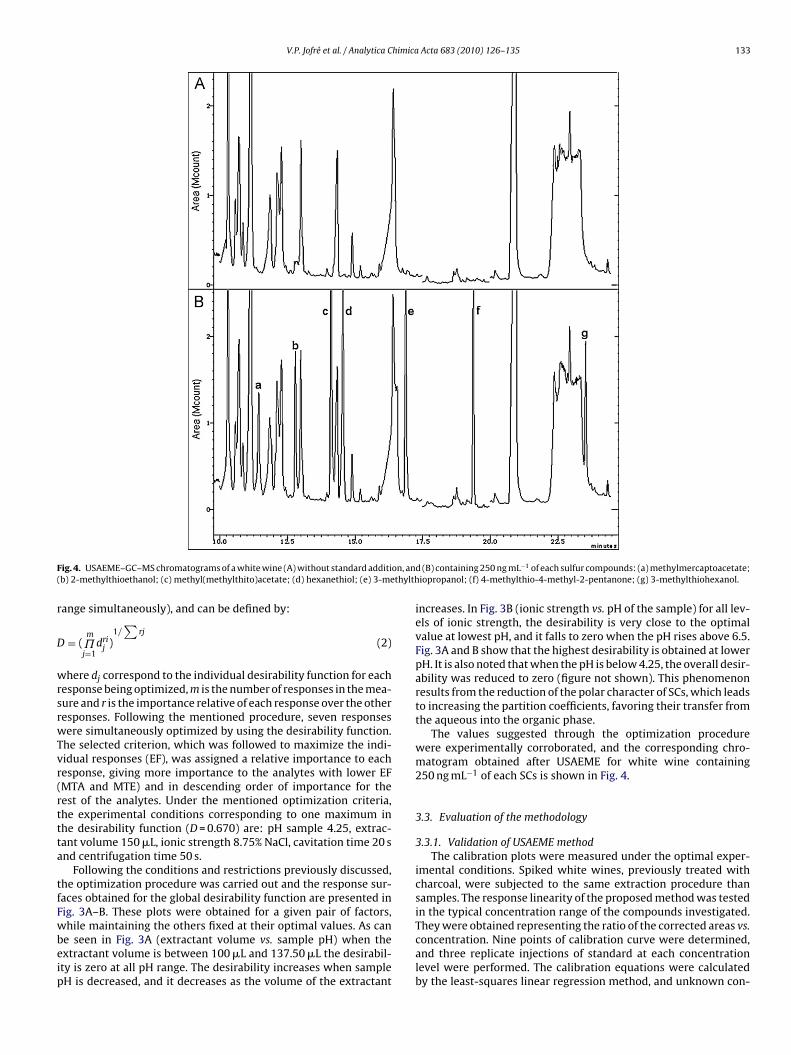
ig. 4. USAEME–GC–MS chromatograms of a white wine (A) without standard additib) 2-methylthioethanol; (c) methyl(methylthito)acetate; (d) hexanethiol; (e) 3-me
ange simultaneously), and can be defined by:
= (m˘j=1
drij )
1/∑
rj
(2)
here dj correspond to the individual desirability function for eachesponse being optimized, m is the number of responses in the mea-ure and r is the importance relative of each response over the otheresponses. Following the mentioned procedure, seven responsesere simultaneously optimized by using the desirability function.
he selected criterion, which was followed to maximize the indi-idual responses (EF), was assigned a relative importance to eachesponse, giving more importance to the analytes with lower EFMTA and MTE) and in descending order of importance for theest of the analytes. Under the mentioned optimization criteria,he experimental conditions corresponding to one maximum inhe desirability function (D = 0.670) are: pH sample 4.25, extrac-ant volume 150 �L, ionic strength 8.75% NaCl, cavitation time 20 snd centrifugation time 50 s.
Following the conditions and restrictions previously discussed,he optimization procedure was carried out and the response sur-aces obtained for the global desirability function are presented inig. 3A–B. These plots were obtained for a given pair of factors,
hile maintaining the others fixed at their optimal values. As cane seen in Fig. 3A (extractant volume vs. sample pH) when thextractant volume is between 100 �L and 137.50 �L the desirabil-ty is zero at all pH range. The desirability increases when sampleH is decreased, and it decreases as the volume of the extractant
d (B) containing 250 ng mL−1 of each sulfur compounds: (a) methylmercaptoacetate;iopropanol; (f) 4-methylthio-4-methyl-2-pentanone; (g) 3-methylthiohexanol.
increases. In Fig. 3B (ionic strength vs. pH of the sample) for all lev-els of ionic strength, the desirability is very close to the optimalvalue at lowest pH, and it falls to zero when the pH rises above 6.5.Fig. 3A and B show that the highest desirability is obtained at lowerpH. It is also noted that when the pH is below 4.25, the overall desir-ability was reduced to zero (figure not shown). This phenomenonresults from the reduction of the polar character of SCs, which leadsto increasing the partition coefficients, favoring their transfer fromthe aqueous into the organic phase.
The values suggested through the optimization procedurewere experimentally corroborated, and the corresponding chro-matogram obtained after USAEME for white wine containing250 ng mL−1 of each SCs is shown in Fig. 4.
3.3. Evaluation of the methodology
3.3.1. Validation of USAEME methodThe calibration plots were measured under the optimal exper-
imental conditions. Spiked white wines, previously treated withcharcoal, were subjected to the same extraction procedure thansamples. The response linearity of the proposed method was testedin the typical concentration range of the compounds investigated.
They were obtained representing the ratio of the corrected areas vs.concentration. Nine points of calibration curve were determined,and three replicate injections of standard at each concentrationlevel were performed. The calibration equations were calculatedby the least-squares linear regression method, and unknown con-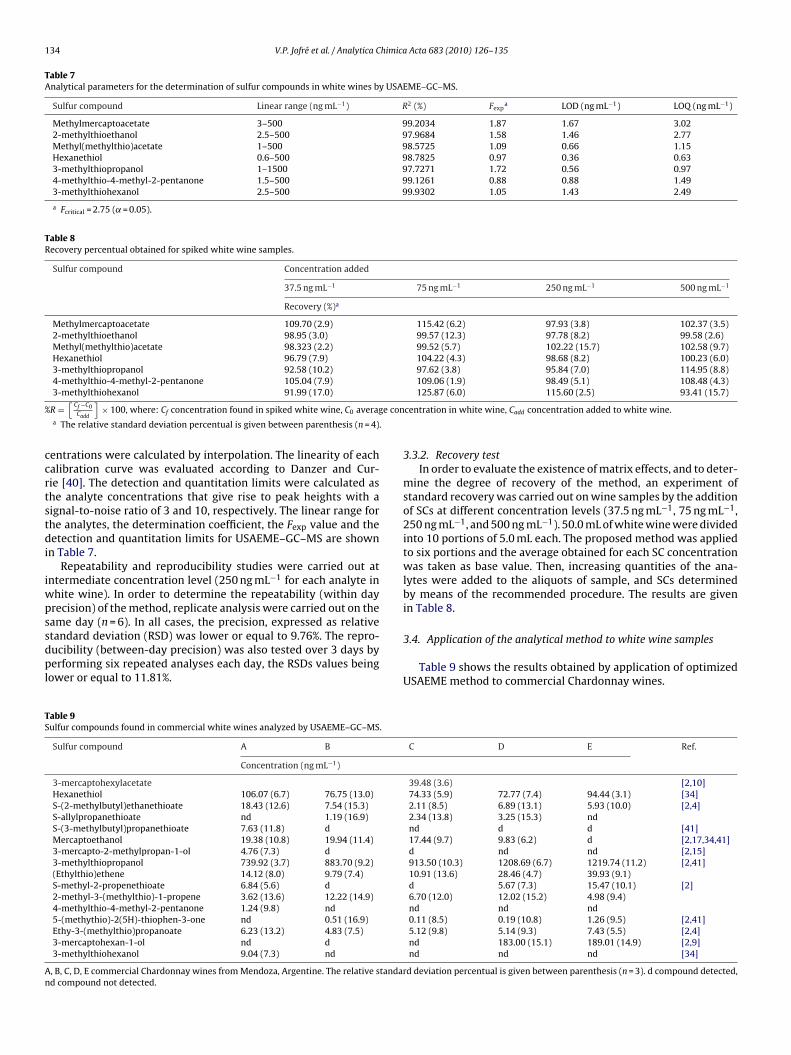
134 V.P. Jofré et al. / Analytica Chimica Acta 683 (2010) 126–135
Table 7Analytical parameters for the determination of sulfur compounds in white wines by USAEME–GC–MS.
Sulfur compound Linear range (ng mL−1) R2 (%) Fexpa LOD (ng mL−1) LOQ (ng mL−1)
Methylmercaptoacetate 3–500 99.2034 1.87 1.67 3.022-methylthioethanol 2.5–500 97.9684 1.58 1.46 2.77Methyl(methylthio)acetate 1–500 98.5725 1.09 0.66 1.15Hexanethiol 0.6–500 98.7825 0.97 0.36 0.633-methylthiopropanol 1–1500 97.7271 1.72 0.56 0.974-methylthio-4-methyl-2-pentanone 1.5–500 99.1261 0.88 0.88 1.493-methylthiohexanol 2.5–500 99.9302 1.05 1.43 2.49
a Fcritical = 2.75 (˛ = 0.05).
Table 8Recovery percentual obtained for spiked white wine samples.
Sulfur compound Concentration added
37.5 ng mL−1 75 ng mL−1 250 ng mL−1 500 ng mL−1
Recovery (%)a
Methylmercaptoacetate 109.70 (2.9) 115.42 (6.2) 97.93 (3.8) 102.37 (3.5)2-methylthioethanol 98.95 (3.0) 99.57 (12.3) 97.78 (8.2) 99.58 (2.6)Methyl(methylthio)acetate 98.323 (2.2) 99.52 (5.7) 102.22 (15.7) 102.58 (9.7)Hexanethiol 96.79 (7.9) 104.22 (4.3) 98.68 (8.2) 100.23 (6.0)3-methylthiopropanol 92.58 (10.2) 97.62 (3.8) 95.84 (7.0) 114.95 (8.8)4-methylthio-4-methyl-2-pentanone 105.04 (7.9) 109.06 (1.9) 98.49 (5.1) 108.48 (4.3)
% e con
.
ccrtstdi
iwpssdpl
TS
An
3-methylthiohexanol 91.99 (17.0)
R =[
Cf −C0Cadd
]× 100, where: Cf concentration found in spiked white wine, C0 averag
a The relative standard deviation percentual is given between parenthesis (n = 4)
entrations were calculated by interpolation. The linearity of eachalibration curve was evaluated according to Danzer and Cur-ie [40]. The detection and quantitation limits were calculated ashe analyte concentrations that give rise to peak heights with aignal-to-noise ratio of 3 and 10, respectively. The linear range forhe analytes, the determination coefficient, the Fexp value and theetection and quantitation limits for USAEME–GC–MS are shown
n Table 7.Repeatability and reproducibility studies were carried out at
ntermediate concentration level (250 ng mL−1 for each analyte inhite wine). In order to determine the repeatability (within dayrecision) of the method, replicate analysis were carried out on the
ame day (n = 6). In all cases, the precision, expressed as relativetandard deviation (RSD) was lower or equal to 9.76%. The repro-ucibility (between-day precision) was also tested over 3 days byerforming six repeated analyses each day, the RSDs values beingower or equal to 11.81%.
able 9ulfur compounds found in commercial white wines analyzed by USAEME–GC–MS.
Sulfur compound A B
Concentration (ng mL−1)
3-mercaptohexylacetateHexanethiol 106.07 (6.7) 76.75 (13.0)S-(2-methylbutyl)ethanethioate 18.43 (12.6) 7.54 (15.3)S-allylpropanethioate nd 1.19 (16.9)S-(3-methylbutyl)propanethioate 7.63 (11.8) dMercaptoethanol 19.38 (10.8) 19.94 (11.4)3-mercapto-2-methylpropan-1-ol 4.76 (7.3) d3-methylthiopropanol 739.92 (3.7) 883.70 (9.2)(Ethylthio)ethene 14.12 (8.0) 9.79 (7.4)S-methyl-2-propenethioate 6.84 (5.6) d2-methyl-3-(methylthio)-1-propene 3.62 (13.6) 12.22 (14.9)4-methylthio-4-methyl-2-pentanone 1.24 (9.8) nd5-(methythio)-2(5H)-thiophen-3-one nd 0.51 (16.9)Ethy-3-(methylthio)propanoate 6.23 (13.2) 4.83 (7.5)3-mercaptohexan-1-ol nd d3-methylthiohexanol 9.04 (7.3) nd
, B, C, D, E commercial Chardonnay wines from Mendoza, Argentine. The relative standard compound not detected.
125.87 (6.0) 115.60 (2.5) 93.41 (15.7)
centration in white wine, Cadd concentration added to white wine.
3.3.2. Recovery testIn order to evaluate the existence of matrix effects, and to deter-
mine the degree of recovery of the method, an experiment ofstandard recovery was carried out on wine samples by the additionof SCs at different concentration levels (37.5 ng mL−1, 75 ng mL−1,250 ng mL−1, and 500 ng mL−1). 50.0 mL of white wine were dividedinto 10 portions of 5.0 mL each. The proposed method was appliedto six portions and the average obtained for each SC concentrationwas taken as base value. Then, increasing quantities of the ana-lytes were added to the aliquots of sample, and SCs determinedby means of the recommended procedure. The results are givenin Table 8.
3.4. Application of the analytical method to white wine samples
Table 9 shows the results obtained by application of optimizedUSAEME method to commercial Chardonnay wines.
C D E Ref.
39.48 (3.6) [2,10]74.33 (5.9) 72.77 (7.4) 94.44 (3.1) [34]2.11 (8.5) 6.89 (13.1) 5.93 (10.0) [2,4]2.34 (13.8) 3.25 (15.3) ndnd d d [41]17.44 (9.7) 9.83 (6.2) d [2,17,34,41]d nd nd [2,15]913.50 (10.3) 1208.69 (6.7) 1219.74 (11.2) [2,41]10.91 (13.6) 28.46 (4.7) 39.93 (9.1)d 5.67 (7.3) 15.47 (10.1) [2]6.70 (12.0) 12.02 (15.2) 4.98 (9.4)nd nd nd0.11 (8.5) 0.19 (10.8) 1.26 (9.5) [2,41]5.12 (9.8) 5.14 (9.3) 7.43 (5.5) [2,4]nd 183.00 (15.1) 189.01 (14.9) [2,9]nd nd nd [34]
d deviation percentual is given between parenthesis (n = 3). d compound detected,
himica
obOfc
biTtctw
C
gs
4
metAlueaUomac
A
Aa
R
[[
[
[
[
[[
[[[[[
[[[[[[
[
[
[[[
[
[
[
[
[
V.P. Jofré et al. / Analytica C
As can be seen the majority of the analytes studied are not foundr found at low levels, which is quite normal since all the wines hadeen stored in optimum conditions of darkness and temperature.nly hexanethiol, mercaptoetanol and 3-methylthiopropanol were
ound in all wines, the latter being the one which was found at highoncentrations, but still in the normal range [2,41].
Also it has been observed that other sulfur compounds coulde determined in the analyzed wines in concentration ranges sim-
lar to those presented by other authors (see references in Table 9).hese compounds were identified by comparison their mass spec-ra with of the mass spectra with those reported in the Nist library,onsidering a forward match (FM) equal or greater than 700. Quan-ification was done by relating the area of the identified compoundith the area of the internal standard, according to Eq. (3):
id = Aid
AIS× CIS (3)
Where Cid, Aid, CIS and AIS are concentrations and chromato-raphic peak areas of the identified compound and the internaltandard, respectively.
. Conclusions
Ultrasound assisted-emulsification-dispersive liquid–liquidicroextraction coupled to gas chromatography–mass spectrom-
try provides a simple, efficient and selective methodology forhe determination of sulfur compounds in white wine samples.lso, this methodology is characterized by its short-time and
ow cost of the analysis. The multivariate optimization strategysed, i.e. experimental design and response surface methodologynhanced by the application of desirability function, allowed theppropriate determination of the optimal USAEME conditions.SAEME–GC–MS has been successfully applied to the analysisf organic sulfur compounds in wines. Using this technique, theatrix effect is taken into account and the method developed
ppears to be suitable for determining a large number of sulfurompounds in white wines.
cknowledgements
This work was supported by the National Institute ofgropecuary Technology (INTA) through the projects AETA282821nd PNFRU053941.
eferences
[1] U. Fischer, in: R.G. Berger (Ed.), Flavours and Fragrances: Chemistry, Biopro-cessing and Sustainability, Springer, Berlin, 2007, pp. 241–267.
[
[
[[
Acta 683 (2010) 126–135 135
[2] M. Mestres, O. Busto, J. Guasch, J. Chromatogr. A 881 (2000) 569–581.
[3] N. Martin, V. Neelz, H.-E. Spinnler, Food Qual. Pref. 15 (2004) 247–257.[4] A. Beloqui, A. Bertrand, Ital. J. Food Sci. 3 (1995) 279–288.[5] A. Rapp, M. Güntert, J. Almy, Am. J. Enol. Vitic. 36 (1985) 219–221.[6] E. Campo, J. Cacho, V. Ferreira, J. Agric. Food Chem. 53 (2005) 5682.[7] V. Ferreira, N. Ortin, A. Escudero, R. Lopez, J. Cacho, J. Agric. Food Chem. 50
(2002) 4048.[8] M. Murat, T. Tominaga, D. Dubourdieu, J. Int. Sci. Vigne Vin 35 (2001) 99–
105.[9] T. Tominaga, A. Furrer, R. Henry, D.D. Dubourdieu, Flavor Fragrance J. 13 (1998)
159–162.10] T. Tominaga, P. Darriet, D. Dubourdieu, Vitis 35 (1996) 207–210.11] P. Darriet, T. Tominaga, V. Lavigne, J.N. Boidron, D. Dubourdieu, Flavor Fragrance
J. 10 (1995) 385–392.12] B. Fedrizzi, G. Versini, I. Lavagnini, D. Badocco, G. Nicolini, F. Magno, Anal. Chim.
Acta 621 (2008) 38–43.13] L. Blanchard, P. Darriet, D. Dubourdieu, Am. J. Enol. Vitic 55 (2004) 115–
120.14] M.L. Murat, T. Tominaga, C. Saucier, Y. Glories, D. Dubourdieu, Am. J. Enol. Vitic
54 (2003) 135–138.15] P. Bouchilloux, Ph. Darriet, D. Dubourdieu, J. Int. Sci. Vigne Vin 30 (1996) 23–29.16] J.J. Rodríguez-Bencomo, R. Schneider, J.P. Lepoutre, P. Rigou, J. Chromatogr. A
1216 (2009) 5640–5646.17] R. Lopez, A.C. Lapena, J. Cacho, V. Ferreira, J. Chromatogr. A 1143 (2007) 8–15.18] Yu Fang, M. Qian, J. Chromatogr. A 1080 (2005) (2005) 177–185.19] M. Mestres, O. Bustos, J. Guasch, J. Chromatogr. A 808 (1998) 211–218.20] L. Mateo-Vivaracho, J. Cacho, V. Ferreira, J. Chromatogr. A 1185 (2008) 9–18.21] L. Mateo-Vivaracho, J. Cacho, V. Ferreira, J. Chromatogr. A 1146 (2007) 242–
250.22] L. Mateo-Vivaracho, V. Ferreira, J. Cacho, J. Chromatogr. A 1121 (2006) 1–9.23] A. Sarafraz-Yazdi, A. Amiri, Trends Anal. Chem. 29 (2010) 1–14.24] Q. Xiao, Ch. Yu, J. Xing, B. Hu, J. Chromatogr. A 1125 (2006) 133–137.25] M.A. Jeannot, F.F. Cantwell, Anal. Chem. 68 (1996) 2236–2240.26] J. Smith, J. Chromatogr. A 1000 (2003) 3–27.27] M. Rezaee, Y. Assadi, M.-R. Milani Hosseini, E. Aghaee, F. Ahmadi, S. Berijani, J.
Chromatogr. A 1116 (2006) 1–9.28] X.-H. Zang, Q.-H. Wu, M.-Y. Zhang, G.-H. Xi, Z. Wang, Chin. J. Anal. Chem. 37
(2009) 161–168.29] D. Hernanz, V. Gallo, A.F. Recamales, A.J. Meléndez-Martinez, F.J. Heredia,
Talanta 76 (2008) 929–935.30] M.D. Luque de Castro, F. Priego-Capote, Anal. Chim. Acta 583 (2007) 2–9.31] M.D. Luque de Castro, F. Priego-Capote, Talanta 72 (2007) 321–334.32] J. Regueiro, M. Llompart, C. Garcia-Jares, J.C. Garcia-Monteagudo, R. Cela, J.
Chromatogr. A 1190 (2008) 27–38.33] R. Noguerol-Pato, C. González-Barreiro, B. Cancho-Grande, J. Simal-Gándara.
Food Chem. 117 (2009) 473–484.34] B. Fedrizzi, F. Magno, S. Moser, G. Nicolini, G. Versini, Rapid Commun. Mass
Spectrom. 21 (2007) 707–714.35] C. Stalikas, Y. Fiamegos, V. Sakkas, T. Albanis, J. Chromatogr. A 1216 (2009)
175–189.36] F. Pena-Pereira, I. Lavilla, C. Bendicho, Spectrochim. Acta Part B 64 (2009)
1–15.37] S.L.C. Ferreira, R.E. Bruns, H.S. Ferreira, G.D. Matos, J.M. David, G.C. Brandäo,
E.G.P. da Silva, L.A. Portugal, P.S. dos Reis, A.S. Souza, W.N.L. dos Santos, Anal.Chim. Acta 597 (2007) 179–186.
38] M.A. Pozo-Bayón, G. Reineccius, in: M.V. Moreno-Arribas, C. Polo (Eds.), WineChemistry and Biochemistry, Springer, New York, 2009, pp. 417–435.
39] L. Vera-Candioti, M.D. Gil García, M. Martínez Galera, H.C. Goicoechea, J. Chro-matogr. A 1211 (2008) 22–32.
40] K. Danzer, L.A. Currie, Pure & Appl. Chem. 70 (1988) 933–1014.41] M. Mestres, O. Busto, J. Guash, J. Chromatogr. A 945 (2002) 211–219.