Bacterial Footprints in Elastic Pillared Microstructures - clok ...
Upload
khangminh22Category
view
3download
0

Emulsification with Microstructures
Koen C. van Dijke
Thesis committee
Thesis supervisor
Prof. dr. ir. R. M. Boom
Professor of Food Process Engineering, Wageningen University
Thesis co-supervisor
Dr. ir. C.G.P.H. Schroën
Assistant professor Food Process Engineering Group, Wageningen University
Other members
Dr. I. Kobayashi
National Food Research Institute, Japan
Prof. dr. F. Mugele
University of Twente
Prof. dr. ir. W. Norde
Wageningen University
Prof. dr. ir. G. van Straten
Wageningen University
This research has been conducted under auspices of the Graduate School VLAG.
Emulsification with Microstructures
Koen Cornelis van Dijke
Submitted in partial fulfilment of the requirements for the degree of doctor
at Wageningen University by the authority of the Rector Magnificus
Prof. dr. M.J. Kropff, in the presence of the
Thesis Committee appointed by the Doctorate Board to be defended in public
on Friday 13 November 2009 at 1.30 PM in the Aula

van Dijke, Koen C. Emulsification with Microstructures 181 pages. Thesis, Wageningen University, Wageningen, The Netherlands (2009) With propositions, with references, with summaries in Dutch and English ISBN: 978-90-8585-495-1


1. Introduction
2. Microchannel emulsification: from
computational fluid dynamics to predictive
analytical model
3. Effect of viscosities of dispersed and
continuous phases in microchannel
oil-in-water emulsification
4. Simultaneous formation of many droplets in
a single microfluidic droplet formation
unit
5. The mechanism of droplet formation in
microfluidic EDGE systems
6. Parallelized Edge-based Droplet
Generation Devices
7. EDGE emulsification for
food-grade dispersions
8. Discussion and outlook
References
Summary
Samenvatting
Dankwoord
Publications
Curriculum Vitae
Training activities
Contents
1
13
39
59
71
97
115
133
149
157
163
169
175
179
181


Chapter 1 Introduction

Emulsification with microstructures
2
Introduction
Food processing Food is a primary requirement for any living organism. In the early days, food collection
and processing by humans was mainly limited to harvesting, catching (fish) or hunting
(land animals), followed by cleaning or peeling, and some forms of preservation. During
the development of human culture, processing raw materials in various ways to enable
storage and improve the nutritional value, taste, attractiveness, convenience, digestibility,
safety and variety became important and probably contributed to the unique position of
humans (Wrangham, 2009). The origin of food processing goes at least all the way back
to ancient Egypt. The origins of beer and bread can be traced back to Babylon and Egypt
in the period from 3,000 to 5,000 BC. Examples of common food processing techniques
are: • Mixing • Peeling • Chopping • Squeezing • Evaporation • Spray drying
• Crystallization • Emulsification • Drying • Boiling • Frying • Steaming
• Baking • Grilling • Pasteurization • Fermentation • Chilling • Freezing
Most of these treatments were developed or applied without any systematic knowledge of
the phenomena behind them. Moreover, we still do not accurately understand many
aspects of commonly used processes and observed changes during food processing,
irrespective of whether we use them everyday in the kitchen at home or whether they are
implemented in large-scale industrial production plants. As a consequence, several
common techniques seem to be far from optimal from a technical point of view. Nicholas
Kurti, one of the founding fathers of the relatively new field of Molecular Gastronomy, in
which the physical and chemical processes in food during cooking are studied, is often
quoted to have stated:
"I think it is a sad reflection on our civilization that while we can, and do, measure the
temperature in the atmosphere of Venus we do not know what goes on inside our
soufflés."

Introduction
3
Obviously, there is still a lot of room for improvement, and for new technologies, and for
this reason, food researchers, and engineers all over the world work on the ongoing
understanding and development of our food, keeping in mind sustainable food production
of the future. This constitutes an interesting challenge, not only due to the technological
complexity of food and food processing as investigated by technologists and engineers,
but also due to the combination with ethical, emotional, economic, and environmental
aspects that is crucial in this worldwide development.
Next to improvement of existing processes, also completely new food products can be
developed by implementing new technology and knowledge, initially often on small scale.
One of the world’s most famous restaurants, Ferran Adria’s elBulli, has stated on their
website a ‘synthesis of elBulli cuisine’ in which one of the terms is (www.elbulli.com):
As has occurred in most fields of human evolution down the ages, new technologies are a
resource for the progress of cooking.
Making unexpected structures of existing products by changing the common way of
processing can result in for example a Gibbs or a Baumé. The first one is an oil-in-egg
white emulsion trapped in a gel obtained by cooking the emulsion in a microwave in
which the water phase expands while the proteins coagulate simultaneously. The second
product is an egg which has been put in ethanol for a month, resulting in a strangely
coagulated egg (This, 2006).
Mostly, developments in food technology are not this pioneering, but are aimed at
improving the effectiveness and efficiency of the preparation of foods or ingredients, or
improving the sensorial (taste) and nutritional (health) quality of foods, and often a
combination of these. Generally speaking, foods consist of many different substances, and
the quality of a product is determined not only by their molecular composition, but also by
the way the constituents are present as a result of preparation. Most products are
multiphase products, in which at least one phase is dispersed into another, and the
morphology of the dispersion is a major determinant of the sensorial and nutritional
characteristics of the product. Given the large variation in the exact formulations and
preparation methods of food products, it is useful to consider dispersions as a separate
Emulsification with microstructures
4
class of systems, and to study how their preparation could be improved, to obtain better
products, and to improve the efficiency of the preparation.
Dispersions and emulsions A dispersion is a mixture of at least two immiscible phases. These phases may have any
aggregation state. Dispersions are generally made by intensive mixing or shearing, or by
mechanical disintegration, which breaks up one phase into small domains, and disperses
these into another phase. Table 1 gives some examples. Most dispersions are
thermodynamically unstable, which means that they tend to separate into isolated or
aggregated phases. The stability of the product therefore generally depends on kinetic
arrest. For the stabilization of dispersions, the interfaces between the phases need to be
stabilized, such that the domains cannot aggregate or coalesce into larger ones.
From the types of dispersions mentioned in the table, we will focus mostly on emulsions,
as these are by far the most common dispersion in food products. Milk, sauces, creams,
mayonnaise, and dressings are examples of oil-in-water emulsions (O/W), and butter is an
example of water-in-oil (W/O) emulsion.
The droplet size and the droplet size distribution both are important for the product
properties, and for its stability. The droplet size affects the taste and appearance of a
product. For example, an O/W emulsion with smaller droplets suppresses bitterness
(Nakaya et al., 2006). An emulsion with larger droplets will be more opaque and whitish,
while emulsions with smaller droplets will be more transparent. In the extreme case that
the droplets become clearly smaller than the wavelength of visible light, the emulsion can
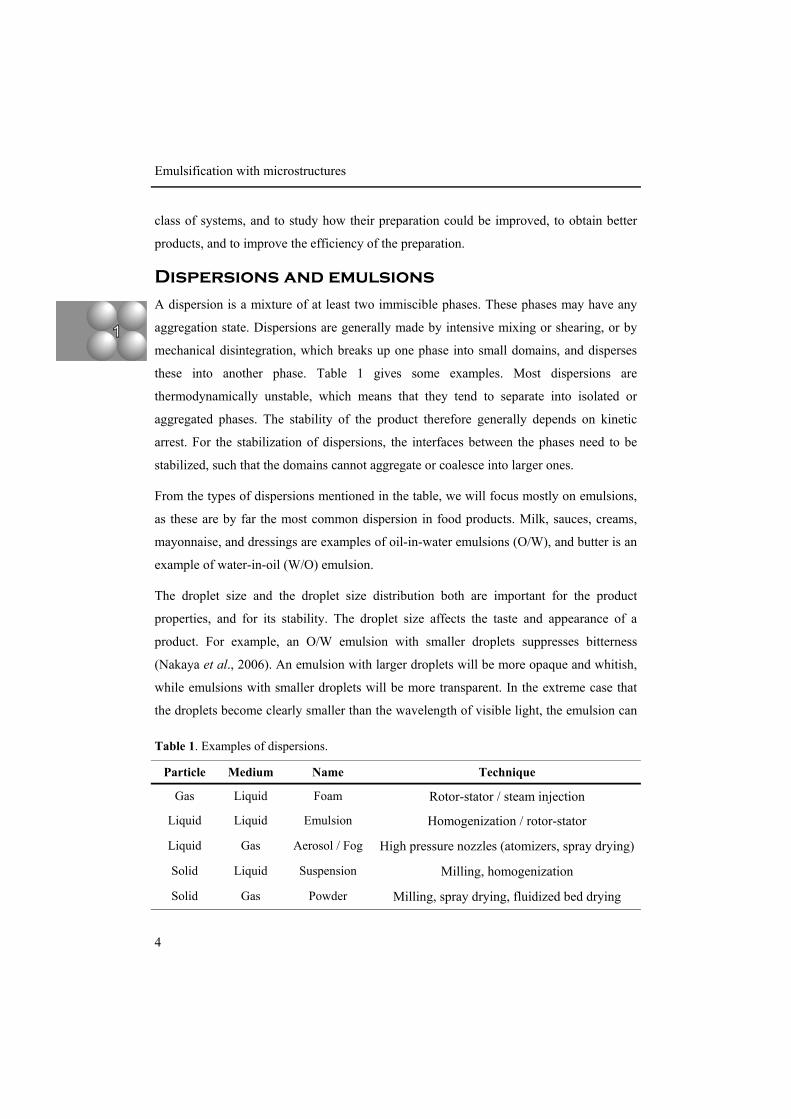
Particle Medium Name Technique
Gas Liquid Foam Rotor-stator / steam injection Liquid Liquid Emulsion Homogenization / rotor-stator Liquid Gas Aerosol / Fog High pressure nozzles (atomizers, spray drying) Solid Liquid Suspension Milling, homogenization Solid Gas Powder Milling, spray drying, fluidized bed drying
Table 1. Examples of dispersions.
Introduction
5
even become transparent (Wooster et al., 2008). The stability of the emulsion, which is its
susceptibility to destabilize into two (or more) separate phases, is influenced in different
ways:
• Creaming or sedimentation • Flocculation • Coalescence • Ostwald ripening
In practice, two or more of these instability phenomena may operate concurrently,
depending on the system (McClements, 1999). In addition, phase inversion may take
place, which is the transformation of an oil-in-water emulsion into a water-in-oil emulsion
or visa-versa. This usually takes place only during processing, or during consumption in
the mouth. Destabilization is even more relevant for multiple emulsions such as water-in-
oil-in-water (W/O/W) or oil-in-water-in-oil (O/W/O) emulsions, which both contain more
interfaces, and are more unstable than single emulsions, see Figure 1, and are intrinsically
hard to prepare because of these instabilities (see also next section).
It is clear that the droplet size and droplet size distribution are both important for the
properties and stability of emulsion based products. However, traditional techniques to
produce emulsions are far from optimal to fulfill the requirements for desired emulsion
properties, but a number of new techniques have the potential to do so. We will therefore
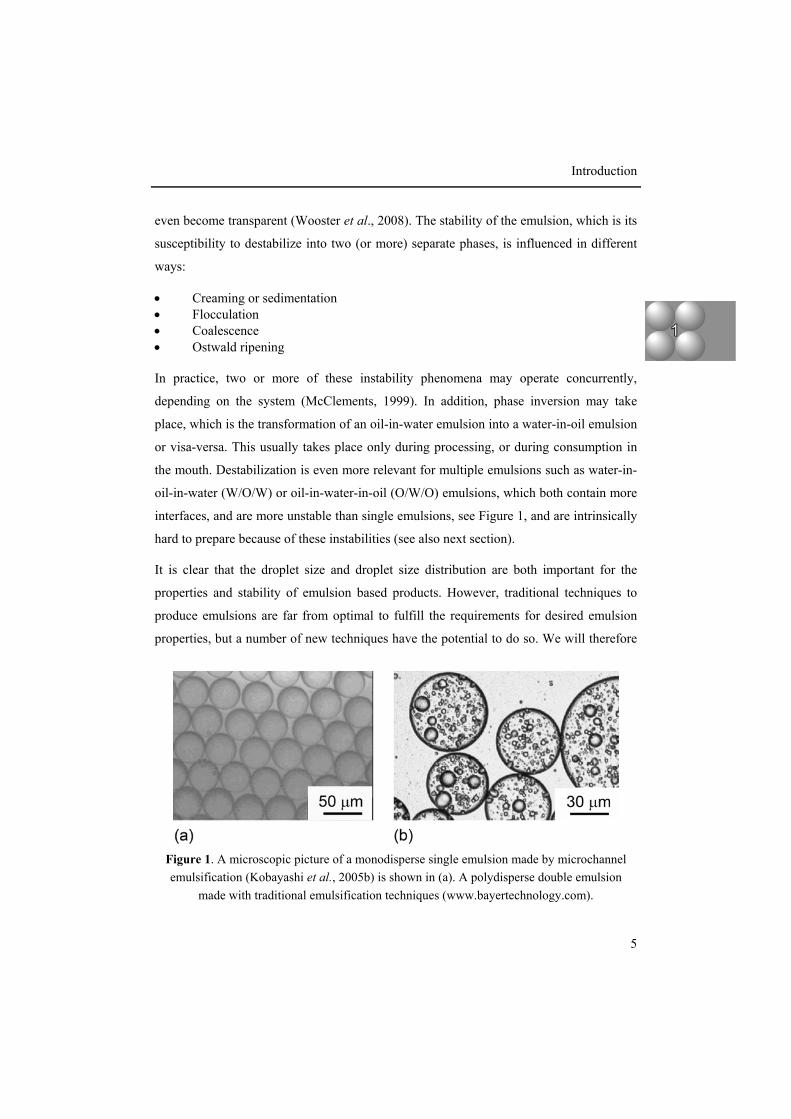
Figure 1. A microscopic picture of a monodisperse single emulsion made by microchannel emulsification (Kobayashi et al., 2005b) is shown in (a). A polydisperse double emulsion
made with traditional emulsification techniques (www.bayertechnology.com).

Emulsification with microstructures
6
first discuss some of the traditional emulsification techniques, and subsequently some of
the newer techniques.
Conventional emulsification Usually, emulsions are produced starting from a coarse pre-mix emulsion obtained by
gentle mixing. The actual emulsification is performed by disrupting the pre-mix droplets
in intense laminar or turbulent flow, or a combination of those, where the shear forces on
the droplets have to exceed the interfacial tension forces that keep a droplet together for
droplet break up. In order to facilitate the creation of an emulsion with small droplet sizes,
lowering the interfacial tension by adding an emulsifier is advantageous. It should be kept
in mind that not only the interfacial tension itself but also the rate at which emulsifiers
adsorb to the interface is of importance. A high adsorption rate causes a newly formed
droplet to quickly lower its interfacial tension, possibly leading to further disruption.
Additionally, re-coalescence is prevented by quickly stabilizing the formed droplets
(Walstra et al., 2006).
The most commonly used devices for emulsification in the preparation of foods are
schematically shown in Figure 2. The high-pressure homogenization systems (Figure 2a),
rotor-stator devices (Figure 2b) and ultrasound systems (Figure 2c) all use a large amount
of kinetic energy to create the emulsions and most of it is dissipated as heat in the product,
therewith possibly causing heat damage. These processes can be classified as being
energy inefficient (McClements, 1999): more than 90 – 99% of all energy is not used in
emulsification, but dissipated in heating up the product. Another disadvantage of the
present techniques is the considerable polydispersity of the obtained emulsions (Saito et
al., 2006).
Further, the traditional methods are too crude to be applied in the production of double
emulsions, since the forces exerted in the break-up of the secondary droplets also break up
the primary droplets, and thus disrupt the inner phase (Kobayashi et al., 2005d). Multiple
emulsions can in theory lead to a whole range of new products as they have potential for
reduced calorie products and encapsulation of (healthy) components in the inner phase. A
mayonnaise for example, is a concentrated emulsion of oil in egg yolk, salt, pepper,

Introduction
7
mustard, and vinegar (or lemon). A low-calorie mayonnaise can be obtained by filling the
oil droplets with water (or a solution with the to-be-encapsulated ingredient), making use
of a double emulsion structure. For these products, new microtechnological techniques
hold a great advantage over traditional techniques, since they do not rely on inducing
large-scale, intense force fields, but rather rely on mechanical constraining combined with
localized flow to induce the formation of droplets.
Emulsification with membranes and micro- technological devices Almost two decades ago, Nakashima et al. (1991) published their first article on an
alternative emulsification method, using a porous membrane. Emulsion droplets were
formed by pressing the to-be-dispersed phase through the membrane pores into the cross-
flowing continuous phase. The method produces droplets in a much more gentle way, and
therefore, the energy efficiency is better as found by Schröder and Schubert (1999). This
direct droplet formation method with membranes and the rapid development in
microtechnological engineering in the electronics technology led to devices in which
droplet formation could be achieved in channels in the same size range as the droplets
themselves. Microfluidic devices distinguish themselves from traditional membranes by
their precisely designed geometry of pores and channels, which makes them suited for the
production of small and monodisperse droplets.
Figure 2. Schematically representation of traditional emulsification apparatus. (a) high pressure homogenizer (b) rotor-stator system (c) ultrasound device.
Emulsification with microstructures
8
The emulsification mechanism in microfluidic devices is, amongst others, determined by
the size of the channels and their geometric design. In so-called T-junctions, the droplets
are snapped off by the shear force of the cross-flowing continuous phase (van der Graaf et
al., 2005; Garstecki et al., 2006; De Menech et al., 2008). In flow-focusing devices, the
dispersed phase forms droplets due to elongation by the shear exerted through extensional
flow of the continuous phase (Umbanhowar et al., 2000; Utada et al., 2007, Anna et al.
2003). Besides shear-based methods, also spontaneous droplet formation is investigated,
in which the flow of the continuous phase is not needed for droplet snap off. In the
spontaneous emulsification devices, which are often referred to as microchannel (MC)
emulsification, the driving force for droplet detachment is the interfacial tension, which
can be relatively important at the typical dimensions in microdevices.
In the shear based systems, the obtained droplet sizes are dependent both on the system
geometry and on the process conditions (flow rate of continuous and dispersed phases
mostly). In spontaneous emulsification or microchannel devices, the droplet size is only
determined by the geometry of the system (as long as the process conditions are within a
certain window), and therefore these devices show the highest potential for the production
of monodisperse emulsions. Therefore this thesis focuses on these systems.
Microchannel emulsification If a non-wetting dispersed phase is pressed through a small channel into a continuous
phase, droplets can snap-off at the outlet of such a channel if there is enough space for the
continuous phase to intrude into channel. The reason for this is that the dispersed phase is
first confined in the channel, but can assume a spherical shape (having a smaller
interfacial area and hence less interfacial energy) when it is no longer confined. This
interfacial tension induced break-up is characteristic for microchannel emulsification,
leading to narrow droplet size distributions.
Generally, two configurations of microchannel emulsification systems can be
distinguished in literature; their difference is mainly the orientation of the microchannels.
In grooved systems, the channels are etched parallel to the surface of a substrate; in a
straight-through device the channels are positioned perpendicular to the surface. The
Introduction
9
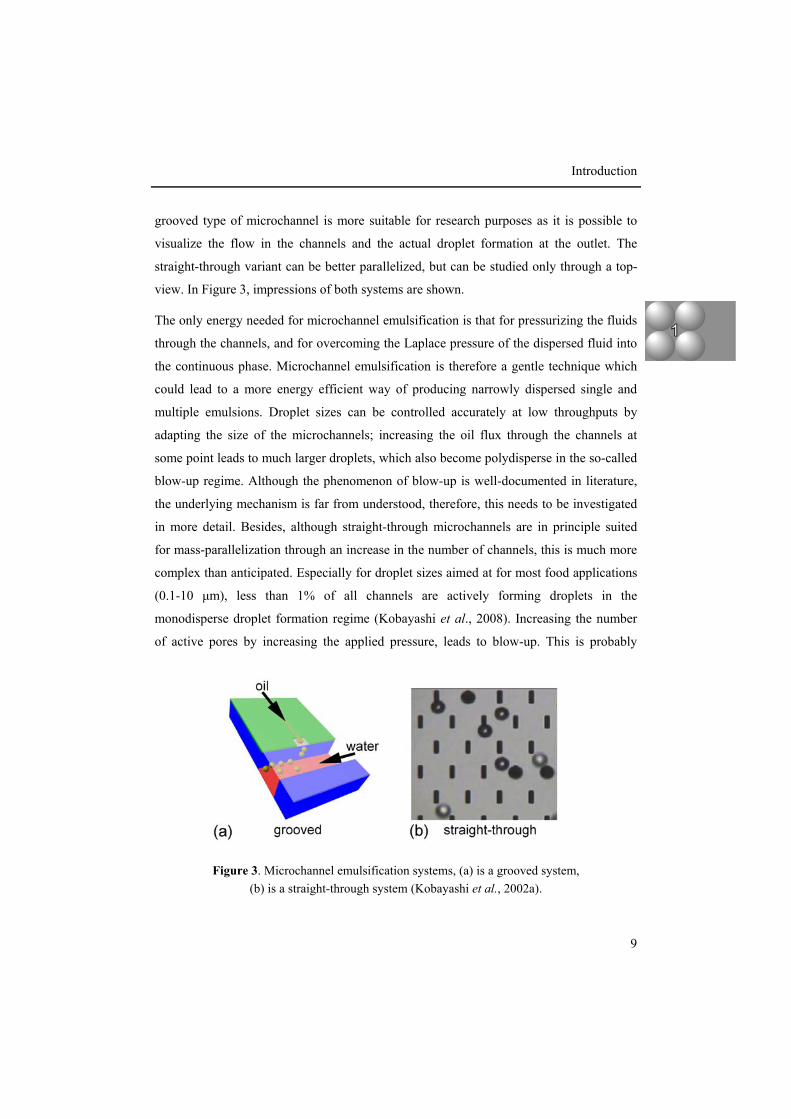
grooved type of microchannel is more suitable for research purposes as it is possible to
visualize the flow in the channels and the actual droplet formation at the outlet. The
straight-through variant can be better parallelized, but can be studied only through a top-
view. In Figure 3, impressions of both systems are shown.
The only energy needed for microchannel emulsification is that for pressurizing the fluids
through the channels, and for overcoming the Laplace pressure of the dispersed fluid into
the continuous phase. Microchannel emulsification is therefore a gentle technique which
could lead to a more energy efficient way of producing narrowly dispersed single and
multiple emulsions. Droplet sizes can be controlled accurately at low throughputs by
adapting the size of the microchannels; increasing the oil flux through the channels at
some point leads to much larger droplets, which also become polydisperse in the so-called
blow-up regime. Although the phenomenon of blow-up is well-documented in literature,
the underlying mechanism is far from understood, therefore, this needs to be investigated
in more detail. Besides, although straight-through microchannels are in principle suited
for mass-parallelization through an increase in the number of channels, this is much more
complex than anticipated. Especially for droplet sizes aimed at for most food applications
(0.1-10 µm), less than 1% of all channels are actively forming droplets in the
monodisperse droplet formation regime (Kobayashi et al., 2008). Increasing the number
of active pores by increasing the applied pressure, leads to blow-up. This is probably
Figure 3. Microchannel emulsification systems, (a) is a grooved system, (b) is a straight-through system (Kobayashi et al., 2002a).
Emulsification with microstructures
10
caused by interaction between the channels, or fabrication inaccuracies, while fouling of
the channels can not be ruled out; clearly, these effects are not fully understood yet.
Despite its potential, spontaneous emulsification is currently not sufficiently understood to
allow scale-up. This thesis aims at elucidating those aspects of microchannel
emulsification that are necessary to mature the technology further.
Aim of the thesis The goal of this research project was to gain a thorough understanding of the principles
and dynamics of spontaneous droplet generation in microfluidic devices, and to use this
understanding to design improved devices for the preparation of better products.
The existing microchannel devices are investigated experimentally and theoretically on
their droplet formation mechanism, and its dynamics. From the mechanistic insights, new
designs are proposed. Since the focus of this dissertation is on the droplet formation
process itself, the stability of the produced emulsions is considered outside the scope,
although some aspects of surfactant dynamics will be discussed.
Outline of the thesis The first part of the thesis focuses on the fundamental mechanism of droplet formation in
grooved microchannel systems.
In Chapter 2, an analytical model for droplet formation in a single channel with a terrace
structure is derived from extensive CFD simulations and experiments. The analytical
model is used to predict the resulting droplet size and study the effect of several
parameters on the droplet formation process.
In Chapter 3, the analytical model presented in the previous chapter is extended for the
influence of the viscosity of the continuous phase or, more in general, the viscosity ratio
of both phases used in the emulsification process. Experiments and CFD calculations are
performed to elucidate the effect of the viscosities.
A new emulsification device that also uses spontaneous droplet generation is introduced in
Chapter 4. In this Edge-based Droplet GEneration (EDGE) device, droplets of the to-be-

Introduction
11
dispersed phase are formed at the edge of a shallow but relatively wide plateau, from
which multiple droplets can be generated simultaneously. In the chapter, results for a
limited number of process parameters are presented.
In Chapter 5, fundamental work on EDGE is described, considering various aspects of
the droplet formation mechanism. Experiments, CFD simulations, as well as geometrical
modeling are performed, in order to elucidate the essential complete filling of the plateau,
and further, details on droplet formation positions, the minimal droplet size, and the
influence of the viscosity ratio are discussed.
Chapter 6 shows the parallelization of EDGE units for larger-scale production and the
effect of nozzle design. Various design parameters are investigated, and guidelines for the
process productivity and stability are presented, including ways to scale up massively.
For food related applications, different requirements have to be met. Chapter 7 shows the
possibilities to use EDGE for food-grade dispersions such as single emulsions, double
emulsions and foams. The options for scale-up of EDGE systems are discussed for the
various products that were investigated.
To finalize the thesis, Chapter 8 summarizes and discusses the research strategy followed
in this research project. Furthermore, it gives a short outlook and personal view on the
expected trends.


Chapter 2 Microchannel emulsification: From
Computational Fluid Dynamics to Predictive Analytical Model
Abstract
Emulsion droplet formation was investigated in terrace-based microchannel systems that
generate droplets through spontaneous Laplace pressure driven snap-off. The droplet
formation mechanism was investigated through high-speed imaging and computational
fluid dynamics simulation, and we found good agreement in the overall shape of the
phases during droplet formation. An analytical model was derived from the insights that
were gained from the CFD simulations, which describes the droplet diameter as a function
of applied pressure. The analytical model covers the influence of both process parameters
and geometry of the terrace well and can be used for fast optimization and evaluation
studies.
This chapter has been published as: Van Dijke, K.C.; Schroën, K; Boom, R.M. Microchannel emulsification: From Computational Fluid Dynamics to Predictive Analytical Model Langmuir 2008, 24, 10107

Emulsification with microstructures
14
Introduction
An emulsion is a dispersion of two (or more) immiscible fluids. They are important to
several industries, such as food, cosmetics, and pharmaceutics. Common emulsions are
margarine, mayonnaise, cream liqueurs, hair and skin creams, paints and some medical,
vitamin or hormone products. Furthermore, emulsions are used as the basic structure for
several types of microspheres (Kobayashi et al., 2001; Sugiura et al., 2000; Sagis et al.,
2008).
The traditional preparation of emulsions is based on mechanical disruption of droplets into
smaller ones, and subsequent stabilization of the newly formed interface. Frequently used
industrial devices are colloid mills, high pressure homogenizers, and mixers. These
machines use high shear and extensional stresses, which results in poor control over
droplet size, and droplet size distribution, while they require high energy input
(McClements, 1999).
In the last decade and a half, novel techniques have been developed in which small
droplets are formed in one step instead of disruption of larger droplets. The trendsetter
here was Nakashima et al. (1991) with the cross-flow membrane emulsification method.
For example, for the production of an oil-in-water emulsion, the oil is pressurized through
a hydrophilic membrane and the droplets are formed in the cross-flowing continuous
water phase. The newest developments in this field, related to the use of microfluidic
devices for the production of emulsions, can be traced back to the 1960’s. The quick
developments in the field of micromachining techniques to produce micro-electronic
circuits are now used to create new types of structures on micron scale. These devices
distinguish themselves from the traditional membranes by their precisely designed
geometry of pores and channels.
Several microfluidic devices have been proposed, and it was shown that they can generate
monodisperse droplets. One can roughly distinguish two types of break-up mechanisms in
these devices: shear-induced (Anna et al., 2003; Link et al., 2004; van der Graaf et al.,
2005; Nisisako et al., 2002; Abrahamse et al., 2002) or spontaneous (Kawakatsu et al.,
MC emulsification: From Computational Fluid Dynamics to Predictive Analytical Model
15
1997; Sugiura et al., 2001; Kobayashi et al., 2002a). For shear-induced break-up, a
flowing continuous phase is necessary to detach droplets from a channel end; for
spontaneous droplet formation, the interfacial tension is the driving force for snap-off;
therefore no flow of the continuous phase is needed.
In this paper, we will focus on spontaneous droplet formation, since this seems to be the
most promising technique for monodisperse droplet formation. Terrace-based
microchannel (MC) emulsification as proposed by Kawakatsu et al. (1997) gave
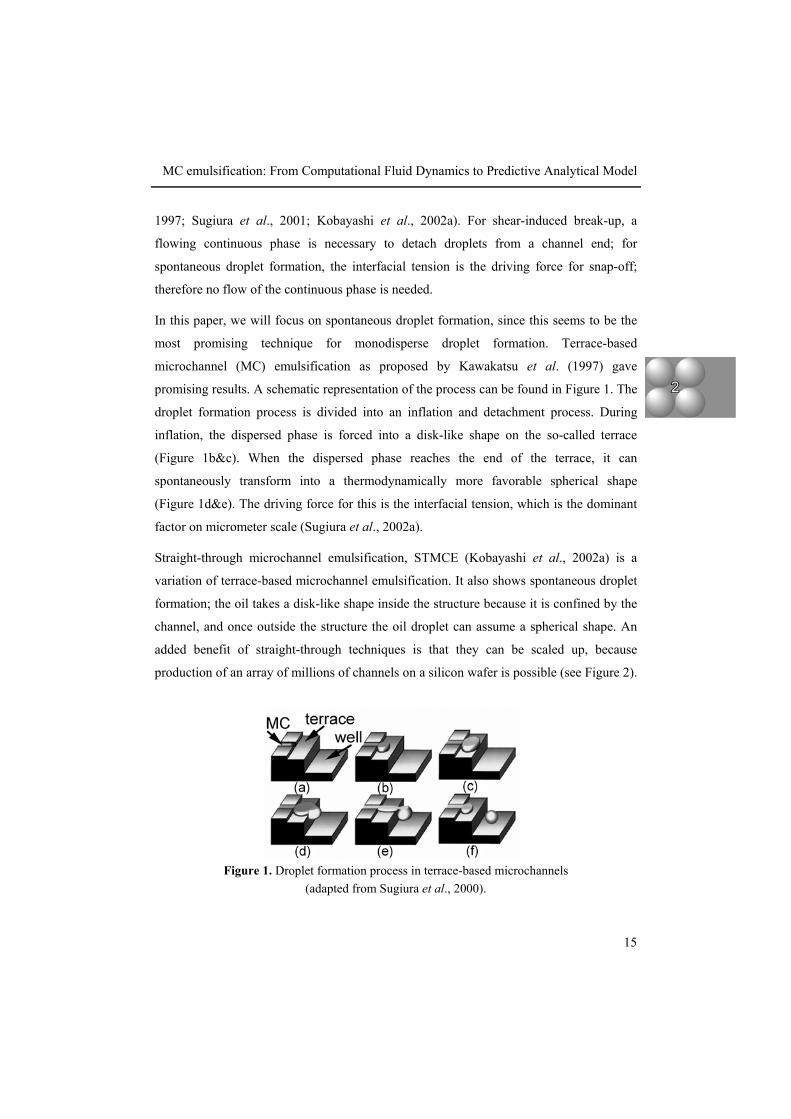
promising results. A schematic representation of the process can be found in Figure 1. The
droplet formation process is divided into an inflation and detachment process. During
inflation, the dispersed phase is forced into a disk-like shape on the so-called terrace
(Figure 1b&c). When the dispersed phase reaches the end of the terrace, it can
spontaneously transform into a thermodynamically more favorable spherical shape
(Figure 1d&e). The driving force for this is the interfacial tension, which is the dominant
factor on micrometer scale (Sugiura et al., 2002a).
Straight-through microchannel emulsification, STMCE (Kobayashi et al., 2002a) is a
variation of terrace-based microchannel emulsification. It also shows spontaneous droplet
formation; the oil takes a disk-like shape inside the structure because it is confined by the
channel, and once outside the structure the oil droplet can assume a spherical shape. An
added benefit of straight-through techniques is that they can be scaled up, because
production of an array of millions of channels on a silicon wafer is possible (see Figure 2).
Figure 1. Droplet formation process in terrace-based microchannels (adapted from Sugiura et al., 2000).

Emulsification with microstructures
16
In spite of this, we here work with the terrace-based systems because these systems allow
observation of the actual droplet break-up mechanism inside the structure; the scaled up
systems can only be investigated from the top. However, since the basic mechanism is the
same in both systems, we expect that the results can be (qualitatively) translated to
STMCE.
The main issue that is touched upon in this paper is the dynamics of droplet formation in
MC systems. In literature, some interesting observations have been reported regarding
systems that use spontaneous droplet formation; however, detailed insight in how the
droplets are formed seems lacking. For example, Sugiura and coworkers (2002b) observed
that the microchannel should be narrow and long to ensure higher production rates.
Besides this, they also reported that shorter terraces produce smaller droplets, and at the
same time become easily unstable due to the narrow space available for the continuous
phase (Sugiura et al., 2000; Kawakatsu et al., 2000). In some of the publications, the
capillary number (Ca), which is the ratio between viscous and interfacial forces, is used to
characterize the regimes of droplet formation. Above a critical value of the capillary
number, the droplet size, and polydispersity, increase quite rapidly and, with further
increase of Ca, even continuous outflow of the oil takes place (Sugiura et al., 2002a;
Figure 2. Straight-through microchannels (Kobayashi et al., 2002a).

MC emulsification: From Computational Fluid Dynamics to Predictive Analytical Model
17
Kobayashi et al. 2005). In other work, Sugiura and co-workers (2002c; 2004a) tried to
quantify some of the effects, deriving a relation between droplet sizes and the
microchannel geometry. However, it has to be mentioned that this relation is not based on
the physical processes that rule droplet break-up and that the necessary detachment length
is very difficult to determine experimentally, if at all, therefore the predictive value of the
equation is rather limited. In addition, the relation only covers the effects of the geometry,
and not those of the process conditions, such as flow rates.
The exact role of the terrace and microchannel geometry and of the process conditions is
not clear and cannot be easily optimized. It is obvious that the underlying mechanisms
need to be investigated in more detail, and in this work we use Computational Fluid
Dynamics for this.
In the field of emulsification, only a few researchers have modeled droplet formation
through CFD. Abrahamse et al. (2001) simulated droplet formation out of a cylindrical
pore in laminar cross-flow with the Volume of Fluids method. Van der Graaf et al. (2006)
used a lattice Boltzmann simulation method for T-shaped microchannels (as a model for
cross-flow membrane emulsification). Both Abrahamse and Van der Graaf and their
coworkers modeled shear-based systems. Up-to-date only Kobayashi et al. (2004; 2005a;
2006) and Rayner et al. (2004) simulated spontaneous droplet formation for straight-
through MC emulsification with the VOF method, and the Surface Evolver, respectively.
The simulations of Kobayashi give insight in velocities and pressures during droplet
formation. The increase in pressure difference between the neck and the growing oil
droplet promotes flow of oil into the droplet. When a critical value is reached, an
imbalance in flow in the neck causes break-up. The critical velocity at which the droplet
detachment behavior changes drastically (at the so-called critical capillary number) is
significantly influenced by the viscosity. This delays the formation of a circular neck and
increases the diameter of the resulting droplet (Kobayashi et al., 2006). Rayner et al.
(2004) used the Surface Evolver, which is an interactive finite element program for the
study of interfaces at rest, shaped by interfacial tension. The point of instability due to free
energy could be identified and thus droplet diameter could be determined. The error of

Emulsification with microstructures
18
predictions was on average only 8% for the experimental data of Kobayashi and Nakajima
(2002b). Although the model could be used to predict the maximum stable volume, no
fundamental insight in the complete system is obtained. The Surface Evolver simulations
can only model equilibrium situations, and therefore necessarily cannot capture all
dynamic effects.
In summary, considerable amounts of work have been done, both experimentally and
computationally, but the link between the results seems to be missing, as is a simple
model to describe the effects of various parameters that play a role during droplet
formation. In this paper, we start with CFD simulations of terrace based systems (see also
materials and methods section for description of the geometry). Based on the results from
the extensive CFD simulations we propose an analytical model that can be used to
describe the resulting droplet size. The effect of several important parameters follows
directly from this model.
Material and Methods
Chemicals. In the experiments, n-hexadecane (C16H34) 99% for synthesis from Merck
KGaA (Darmstadt, Germany) or sunflower oil from the local supermarket were used as
the to-be-dispersed phase. The viscosity of sunflower oil can be different, depending on
the exact composition. Here we take an average value of 30 mPa s, which is about ten
times the viscosity of hexadecane. For simplicity reasons, the to-be-dispersed phase will
be called the dispersed phase even before droplet formation has taken place. As the
continuous phase, MilliQ ultra-pure water with or without 1% SDS was used.
Microstructures. The microchips used in the experiments are produced by Micronit
Microfluidics BV (Enschede, The Netherlands). The microchip is a silicon plate (1.5 x 1.5
cm); into which the microchannels were etched with the Deep Reactive Ion Etching
(DRIE) technique to ensure straight corners (round-off < 1 µm). A glass plate was bonded
on top of the silicon plate to close the channels. Hydrophilic microchannels needed for
oil-in-water emulsion production and suitable for visual inspection were created in this
way. The emulsification systems consisted of a long dispersed phase channel (10 µm high

MC emulsification: From Computational Fluid Dynamics to Predictive Analytical Model
19
x 10 µm wide) connected to a terrace of 10 µm high (H) and varied width (WT) and length
(LT), which ended in a much deeper continuous phase channel (150 x 100 µm). A
schematic representation of a typical microchip is shown in Figure 3, as well as a 3-D
drawing.
The microchip was placed in a module designed by Micronit Microfluidics BV. Both the
continuous phase, and the dispersed phase were guided into the microchip through fused
silica tubing (Polymicro Technologies, Phoenix, USA) connected to Hamilton gastight
luer lock syringes (1700 series). The connections were Nanotight fittings and sleeves in
combination with quick connect luer lock adapters, both fabricated by Upchurch
Scientific. The syringes were placed into two separate Harvard syringe pumps (types PHD
2000 and 11plus).
Microscope video system. A high-speed camera (Motion Pro HS-4, Redlake MASD Inc.,
San Diego, USA) imaging system, up to 10.000 frames/second was connected to a
microscope (Zeiss AxioPlan Upright microscope, Carl Zeiss B.V., Sliedrecht, The
Figure 3. Typical lay-out and 3-D drawing of a microchannel system on the chips.
Emulsification with microstructures
20
Netherlands) to observe the droplet formation process in the microchip. The camera was
controlled with MotionPro Central software (Redlake MASD Inc.). The module with the
microchip was placed on the microscope table and illuminated (Schott KL2500) via the
objectives. ImagePro plus (Media Cybernetics Inc.) was used to analyze the movies.
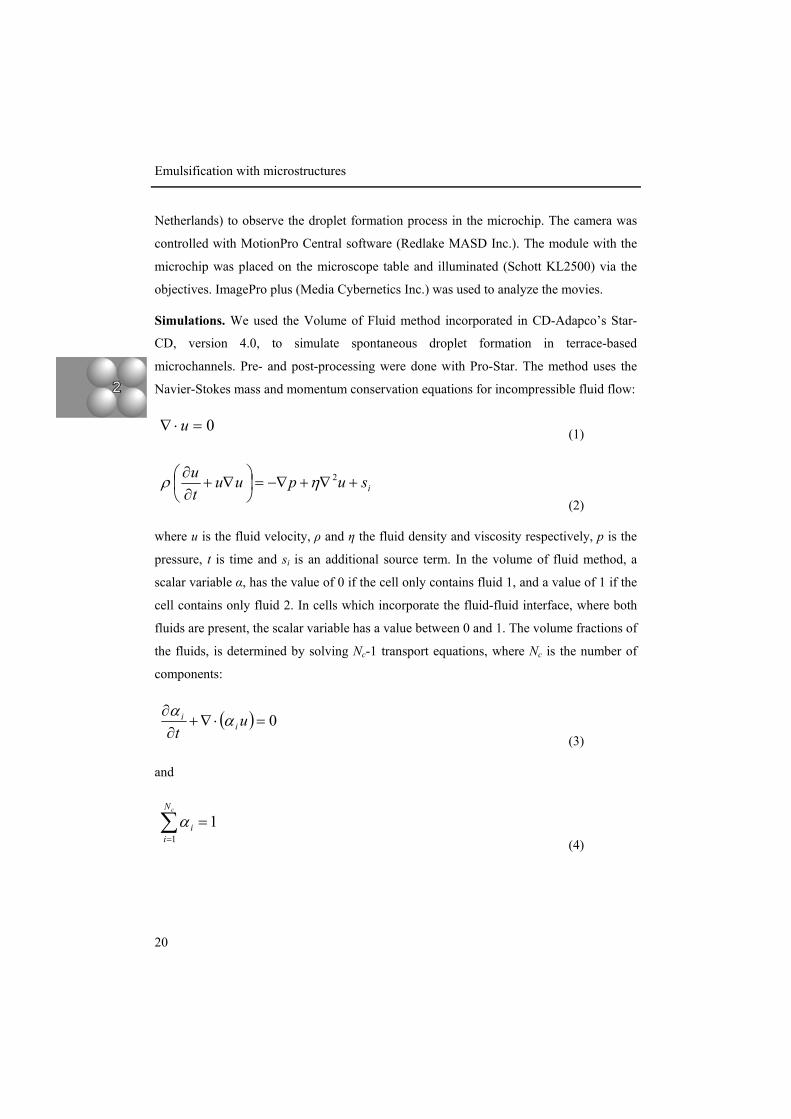
Simulations. We used the Volume of Fluid method incorporated in CD-Adapco’s Star-
CD, version 4.0, to simulate spontaneous droplet formation in terrace-based
microchannels. Pre- and post-processing were done with Pro-Star. The method uses the
Navier-Stokes mass and momentum conservation equations for incompressible fluid flow:
(1)
(2)
where u is the fluid velocity, ρ and η the fluid density and viscosity respectively, p is the
pressure, t is time and si is an additional source term. In the volume of fluid method, a
scalar variable α, has the value of 0 if the cell only contains fluid 1, and a value of 1 if the
cell contains only fluid 2. In cells which incorporate the fluid-fluid interface, where both
fluids are present, the scalar variable has a value between 0 and 1. The volume fractions of
the fluids, is determined by solving Nc-1 transport equations, where Nc is the number of
components:
(3)
and
(4)
0=⋅∇ u
isupuutu
+∇+−∇=⎟⎠⎞
⎜⎝⎛ ∇+
∂∂ 2ηρ
( ) 0=⋅∇+∂
∂ ut i
i αα
11
=∑=
cN
iiα

MC emulsification: From Computational Fluid Dynamics to Predictive Analytical Model
21
The interface is reconstructed using the High-Resolution Interface Capturing (HRIC)
method. The normal force caused by the surface tension (σ) is modeled using the
continuum surface force (CSF) model of Brackbill et al. (1992). This model introduces a
volumetric source term in the momentum equation that is expressed as:
(5)
The wall contact angle of the free surface with a solid wall is imposed as a constraint on
the free-surface orientation at the contact line. Dynamic interfacial tension effects cannot
be taken into account. For a detailed mathematical description of the model, we refer to
the methodology manual of the software.
Half of the actual geometry of the terrace-based MC structure was modelled, since the
system has a symmetry plane in the middle (y = 0). The dimensions of the grid in Figure 4
are such that they correspond to a MC structure with channel length, Lc, of 270 µm, and
11
1 ααασσ ∇⎟
⎟⎠
⎞⎜⎜⎝
⎛
∇∇
∇−=s
Figure 4. Computational grid of a system with LT = 30 µm.
Emulsification with microstructures
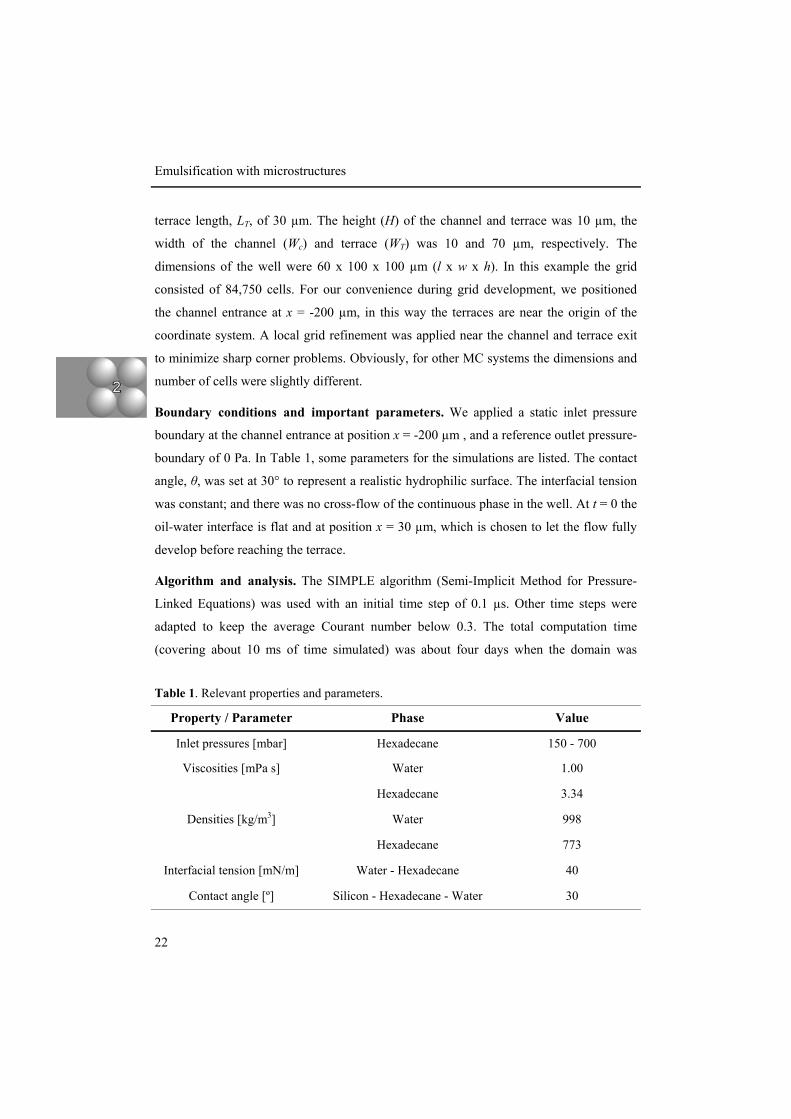
22
terrace length, LT, of 30 µm. The height (H) of the channel and terrace was 10 µm, the
width of the channel (Wc) and terrace (WT) was 10 and 70 µm, respectively. The
dimensions of the well were 60 x 100 x 100 µm (l x w x h). In this example the grid
consisted of 84,750 cells. For our convenience during grid development, we positioned
the channel entrance at x = -200 µm, in this way the terraces are near the origin of the
coordinate system. A local grid refinement was applied near the channel and terrace exit
to minimize sharp corner problems. Obviously, for other MC systems the dimensions and
number of cells were slightly different.
Boundary conditions and important parameters. We applied a static inlet pressure
boundary at the channel entrance at position x = -200 µm , and a reference outlet pressure-
boundary of 0 Pa. In Table 1, some parameters for the simulations are listed. The contact
angle, θ, was set at 30° to represent a realistic hydrophilic surface. The interfacial tension
was constant; and there was no cross-flow of the continuous phase in the well. At t = 0 the
oil-water interface is flat and at position x = 30 µm, which is chosen to let the flow fully
develop before reaching the terrace.
Algorithm and analysis. The SIMPLE algorithm (Semi-Implicit Method for Pressure-
Linked Equations) was used with an initial time step of 0.1 µs. Other time steps were
adapted to keep the average Courant number below 0.3. The total computation time
(covering about 10 ms of time simulated) was about four days when the domain was
Inlet pressures [mbar] Hexadecane 150 - 700
Water 1.00
Hexadecane 3.34
Densities [kg/m3] Water 998
Hexadecane 773
Interfacial tension [mN/m] Water - Hexadecane 40
Contact angle [º] Silicon - Hexadecane - Water 30
Viscosities [mPa s]
Property / Parameter Phase Value
Table 1. Relevant properties and parameters.
MC emulsification: From Computational Fluid Dynamics to Predictive Analytical Model
23
divided over two nodes running under Linux 2.6.8 with each two 2994 Mhz Intel®
Pentium® IV XEON™ processors and a physical memory of 3044 MB.
The diameter of the resulting droplets was measured with the help of a distance-measuring
tool in the post-processing software. The pressure graphs (see Figure 8) were extracted
from the output files, with the use of 40 ‘sensors’ on vertices along a straight line in the
middle of the channel, and part of the well. In this way, the position and time dependent
pressures during the process can be visualized.
Analytical model. The equations in the analytical model are presented in the results
section. For the calculations with the analytical model, we used the value of the previous
time-step to solve the explicit relation in Matlab (version 7.4.0.287, The MathWorks,
Inc.).
Comparison of CFD results and experiments (Figure 6): The purpose of Figure 6 is to
visually compare the experiment and the simulation. The parameters that are used in the
simulation are corresponding to those for the liquids used in the experiment, and we tried
to stay as close to the experimental conditions as we possibly could, albeit that this is not
an easy feat.
Due to the small dimensions of the channels, it is not possible to keep the flow rate
constant (as this is also determined by Laplace pressure, as also followed from the
simulations). Further, the applied pressure in experiments can not be measured, again due
to the dimensions of the channel. An extra check was done using the time of droplet
formation, which is in the same order of magnitude for experiment and simulation.
Results and Discussion
Experiments and validation We use the results of our experiments mainly to validate the
CFD simulations. In Figure 5 some screenshots of recorded movies from experiments
with a system with terrace dimensions LT = 30 µm and WT = 70 µm and hexadecane as oil
phase, as well as a system with LT = 30 µm and WT = 30 µm and sunflower oil as oil phase
are depicted. The continuous phase is MilliQ ultra-pure water with 1 % SDS in both cases.

Emulsification with microstructures
24
From the screenshots, it can be seen that hexadecane droplet formation at the larger
terrace is very fast. In the sunflower oil experiments, droplet formation took around 120
ms; for hexadecane, the process goes much faster as it only takes around 23 ms. It is very
difficult to conclude from the experiments which parameters cause which effect.
Therefore, we used CFD simulations to elucidate the effect of the various parameters
during droplet formation in microchannels, and later used these simulations to derive an
analytical model which describes the effects of all the parameters individually.
We validate our CFD model quantitatively in Figure 6 (see also Materials and Methods
section), in which the experimental and computational results of a system with terrace
length of 30 µm, and terrace width of 70 µm can be seen. Figure 6 presents photos of the
droplet formation process in our microchip. Directly below these pictures, simulation
Figure 5. Screenshots of droplet formation in two different systems. On the left hand side, a large terrace (LT = 30 µm and WT = 70 µm) with hexadecane is used and on the right hand side a smaller terrace (LT = 30 µm and WT = 30 µm) with sunflower oil.
MC emulsification: From Computational Fluid Dynamics to Predictive Analytical Model
25
results are depicted, in which the interface is approximated to be at α = 0.5. The applied
pressure in the simulation was 185 mbar. Hexadecane was used as oil phase and pure
water as continuous phase, and the parameters used in the simulations were in accordance
(e.g. σ = 40 mN/m).
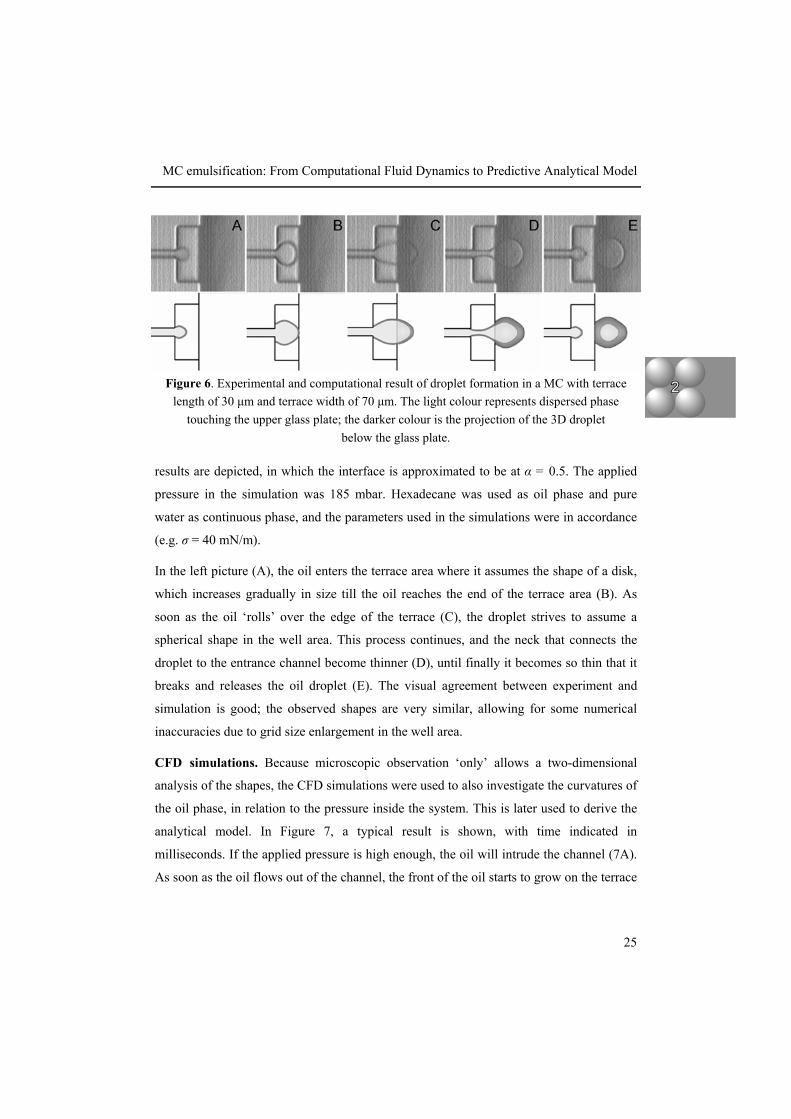
In the left picture (A), the oil enters the terrace area where it assumes the shape of a disk,
which increases gradually in size till the oil reaches the end of the terrace area (B). As
soon as the oil ‘rolls’ over the edge of the terrace (C), the droplet strives to assume a
spherical shape in the well area. This process continues, and the neck that connects the
droplet to the entrance channel become thinner (D), until finally it becomes so thin that it
breaks and releases the oil droplet (E). The visual agreement between experiment and
simulation is good; the observed shapes are very similar, allowing for some numerical
inaccuracies due to grid size enlargement in the well area.
CFD simulations. Because microscopic observation ‘only’ allows a two-dimensional
analysis of the shapes, the CFD simulations were used to also investigate the curvatures of
the oil phase, in relation to the pressure inside the system. This is later used to derive the
analytical model. In Figure 7, a typical result is shown, with time indicated in
milliseconds. If the applied pressure is high enough, the oil will intrude the channel (7A).
As soon as the oil flows out of the channel, the front of the oil starts to grow on the terrace
Figure 6. Experimental and computational result of droplet formation in a MC with terrace length of 30 µm and terrace width of 70 µm. The light colour represents dispersed phase
touching the upper glass plate; the darker colour is the projection of the 3D droplet below the glass plate.

Emulsification with microstructures
26
(7B). In the well, the growing droplet will become spherical, eventually break-up occurs
and the process repeats itself (7C-7E).
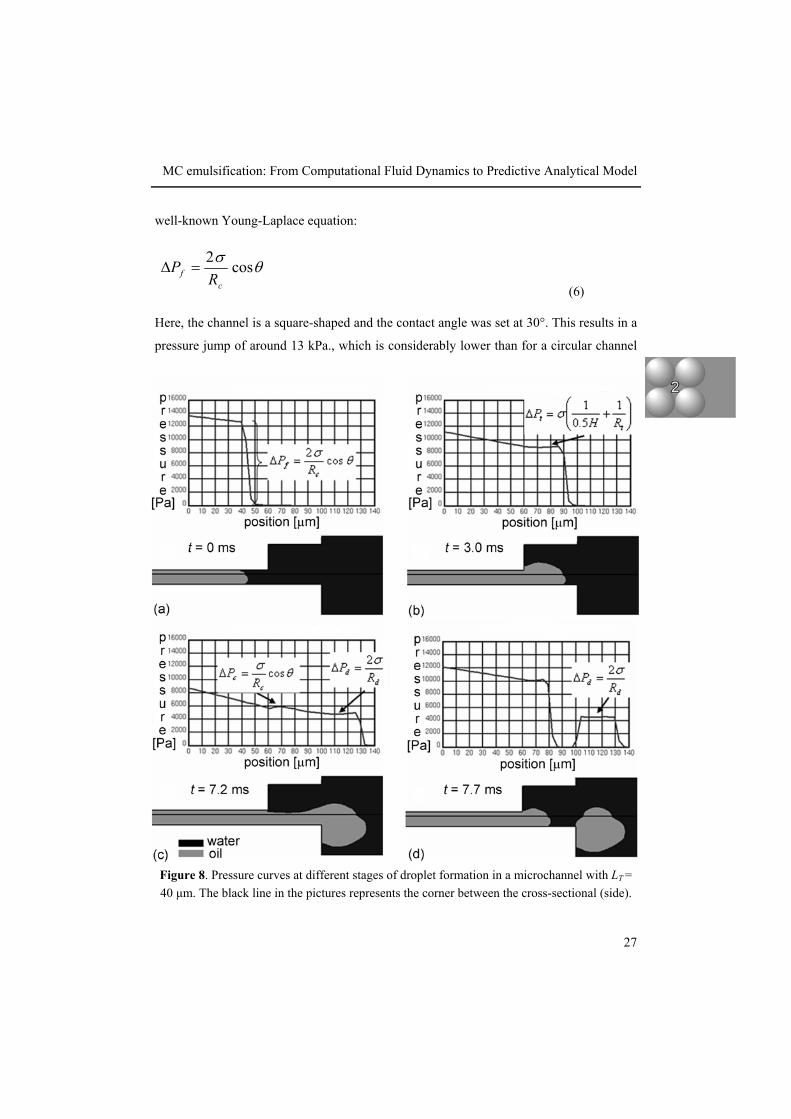
The pressure profile during droplet formation on a terrace with LT = 40 µm was
investigated in detail. We applied a pressure of 18.5 kPa at a position of x = -200 µm (not
visible). The pressure in the middle of the channel was plotted as a function of position
along the central axis in Figures 8a-d for the oil profiles shown directly underneath. The
channel was rotated and positioned in such a way that the position value of the graph is at
the same level as in the picture. Please note that the oil profiles contain a symmetry plane,
therefore only half of the actual simulation is shown. The oil-water interface in the middle
of the channel as well as (half of) the interface against the top wall (glass plate in reality)
are visible in this way. In the graphs, the minimal pressure to intrude the channel is clearly
visible as the ‘jump’ in pressure (Pf) near the interface, see Figure 8a. In a cylindrical
channel with radius Rc, this pressure difference at the oil front can be calculated with the
Figure 7. Typical CFD result of droplet formation in a microchannel with a terrace length of 40 µm. In A the whole channel is depicted, B until E zoom in on the channel exit area.
Time is indicated in milliseconds.
MC emulsification: From Computational Fluid Dynamics to Predictive Analytical Model
27
well-known Young-Laplace equation:
(6)
Here, the channel is a square-shaped and the contact angle was set at 30°. This results in a
pressure jump of around 13 kPa., which is considerably lower than for a circular channel
θσ cos2
cf R
P =∆
Figure 8. Pressure curves at different stages of droplet formation in a microchannel with LT = 40 µm. The black line in the pictures represents the corner between the cross-sectional (side).

Emulsification with microstructures
28
as expected (Lago and Araujo, 2003). As long as the oil is in the channel, the pressure
drop over the oil remains relatively constant, due to the shape of the front (results not
shown). At the channel exit, the oil will form a disk-shape, as it is not confined by the
channel walls anymore (Figure 8b).
The ruling Laplace pressure is now that of the growing disk (Pt) which is determined by
the radius of this disk, Rt, and the height of the terrace:
(7)
The actual values from the simulations are in agreement with this. As Rt will continuously
increase, the pressure in the disk on the terrace will decrease. When the oil reaches the end
of the terrace, it will flow over the edge and will grow into a spherical shape with radius
Rd (Figure 8c and 8d). The Laplace pressure in this to-be-formed droplet (Pd) can be
calculated with:
(8)
Also here, the values found with the simulations are in agreement. Due to the increase in
droplet radius, the Laplace pressure will decrease and the pressure curve will become
steeper, as the applied pressure (Papplied) is fixed. The oil that was in the disk-like shape
will flow quite rapidly into the well and a neck will be formed on the terrace. Due to the
formation of the neck, the pressure will eventually reach the minimum possible Laplace
pressure of an oil column on the terrace (Pc). Since one of the curvatures in this stage is
almost infinite, the value of the Laplace pressure is mainly determined by half the height
of the terrace, which is equal to the radius of the channel, Rc (Figure 8c).
(9)
⎟⎟⎠
⎞⎜⎜⎝
⎛+=∆
tt RH
P 15.01σ
dd R
P σ2=∆
θσ cosc
c RP =∆

MC emulsification: From Computational Fluid Dynamics to Predictive Analytical Model
29
The pressure cannot decrease further, and as a result a pressure gradient appears between
Pc (on the terrace) and Pd (in the growing droplet that is still attached to the oil phase).
The radius of the droplet keeps increasing, which leads to a larger pressure gradient, and
consequently the larger oil flux from the terrace into the droplet. At the same time, the
flow through the channel is determined by the applied pressure and the minimal possible
pressure of the oil column on the terrace (Figure 8c). As soon as the oil flux supply from
the inlet channel is lower than the oil flux toward the droplet, break-up will occur as
shown in Figure 8d. The process repeats itself from this stage.
Analytical model. The analytical model is based on the results from the CFD simulations.
The starting point of the model is the situation depicted in Figure 8c. Ideally, the whole
trajectory of oil flow through the system (which is in principle also possible with this
model) is covered by the model. But this would lead to description of very complex
dynamic behavior, which is far beyond the scope of the model that we envision.
Therefore, the situation in Figure 8c is taken as a starting point. At this point, all the oil
from the maximum disk shape on the terrace minus the volume needed for the neck is in
the to-be-formed droplet, but the droplet is still connected to the oil phase, and is fed with
additional oil from the channel. This volume, Vstart, corresponds to the volume of a disk
with a diameter equal to the terrace length minus that of a cylinder with a diameter and a
length equal to the dimensions of the terrace. The radius of this droplet can be calculated
with:
(10)
with
(11)
31
0, 43
⎟⎠⎞
⎜⎝⎛== π
starttd
VR
2 21 14 4start T TV L H H Lπ π= −
Emulsification with microstructures
30
If at this starting point:
(12)
(Please note that even if the cross-section of the neck is not always the same, the Laplace
pressure will hardly be influenced, since the largest curvature of the neck hardly adds to
the pressure.) First, the flux through the entire system is calculated with the familiar
Hagen-Poiseuille equation:
(13)
Equation 13 is valid for laminar flow in a cylindrical tube and with no-slip conditions. We
use it here as a reasonable approximation. The flux will result in an increase in the droplet
volume, from which the new radius can be calculated:
(14)
At some stage, the droplet will become so large that:
(15)
Now we need to define two fluxes, one through the channel (comparable to equation 13):
(16)
and one through the neck on the terrace:
⎟⎟⎠
⎞⎜⎜⎝
⎛−==Φ
tdapp
c
ct R
PL
RdtdV
,
4 28
σηπ
31
,, 4
3⎟⎟⎠
⎞⎜⎜⎝
⎛=
πtdrop
td
VR
⎟⎟⎠
⎞⎜⎜⎝
⎛−==Φ
capp
ch
ctch R
PLR
dtdV θσ
ηπ cos
8
4
,
cd PP < , and cd RR
θσσ cos2<
cd PP ≥ , then
θσσ cos2
cd RR≥

MC emulsification: From Computational Fluid Dynamics to Predictive Analytical Model
31
(17)
The lengths Ln and Lch over which the pressure differences act, need to be defined. Here
they are taken to be dependent on the droplet radius, as is observed in experiments and
simulations. A straight line is constructed through points (Rd, Rd) and (0, Rc), as shown in
Figure 9, and intersects with the central axis of the channel at a distance ½ Ln (the position
at which the neck is expected to break) from the channel exit. From this definition
follows:
(18)
and consequently:
(19)
⎟⎟⎠
⎞⎜⎜⎝
⎛−==Φ
tdcn
ctn RRL
RdtdV
,
4
,2cos
8σθσ
ηπ
⎟⎟⎠
⎞⎜⎜⎝
⎛ −=
d
cd
cdn
RRR
RRL 2)(
)()( dncdch RLLRL −=
Figure 9. Schematic cross-section of a microchannel system and the definition of Ln and Lch.

Emulsification with microstructures
32
Using equations 18 and 19, Rd,t is calculated in the same way as described before, see
Equation 14. The droplet break-up criterion is defined as:
(20)
The input parameters for the analytical model are dimensions of the channel and terrace,
viscosity of the oil phase, surface tension, and contact angle. Only the contact angle has to
be estimated, and possibly the surface tension if surfactants are present.
The results of the analytical model are compared to experimental results from Sugiura et
al. (2002a) for four different terrace systems (see Table 2). Triolein with a viscosity of 60
mPa s was used as oil phase and the surface tension in the system was 4.5 mN/m. We
tchtn ,, Φ>Φ
MC plate Depth [µm] LT [µm] Lc [µm]
MC-2 2 15 7.7
MC-4 4 28 14
MC-8 8 57 32
MC-16 16 113 68
Table 2. Dimensions of the MC plates used by Sugiura et al. (2002a).
Figure 10. Predicted droplet diameter as a function applied pressure in different MC plates: MC-2 (◊), MC-4 (∆), MC-8 (□) and MC-16 (○).

MC emulsification: From Computational Fluid Dynamics to Predictive Analytical Model
33
assume a contact angle of 30°, which represents a hydrophilic surface. The model results
are shown in Figure 10 as a function of the applied pressure.
It is obvious that less pressure is needed to form droplets with the larger channels due to
the lower minimum required Laplace pressure, see Equation 6. The droplet size is stable
below a certain pressure above which an increase in diameter occurs. In practice, the
pressure range with constant droplet diameter is the desired regime to produce droplets
with the MC system. The smaller MC plates have wider operational pressure range, albeit
that higher pressure is needed to push the oil in the smaller channels. In the work of
Sugiura and coworkers, the calculated average velocity of the oil in the system was used;
therefore, our data were re-plotted and compared to the experimental data points in Figure
11. Please note that the actual oil velocity cannot be controlled experimentally, this is an
average value.
For the smaller terraces (2, 4, and 8), the calculated and measured droplet sizes are in
good agreement in the stable velocity ranges (plateau values). Only for MC-16, the model
Figure 11. Measured (by Sugiura and co-workers (2002a)) and calculated droplet diameter as a function of average velocity of the oil through the channel for several MC plates: MC-2 (◊/♦), MC-4 (∆/▲), MC-8 (□/■) and MC-16 (○/●). Filled marker: data from Sugiura et al.
(2002a), open marker: calculated data. The line represents the calculated data for MC-16 with σ = 7.5 mN/m.

Emulsification with microstructures
34
overestimates the droplet size slightly. The difference in critical velocity, e.g. the velocity
at which the diameter starts to increase, is most probably related to differences between
the average velocity determined from size and frequency, as done by Sugiura and co-
workers, and the average value deduced from the model. We took the calculated velocity
of the oil phase in the channel, where the pressure drop is still constant because the
curvature does not change here. Besides this, dynamic interfacial tension effects could
play a role. There will be very rapid creation of new interface when the oil moves into the
well. This will cause (at least temporarily) a higher surface tension in the system. If we
use a surface tension of 7.5 mN/m, instead of 4.5 mN/m, the experimental data of MC-16,
and the model results almost overlap (Figure 11). Thus, the differences between
predictions and experimental observations can be explained from the assumptions made in
the model (e.g., static interfacial tension), while the overall predictions are adequate.
The model can therefore be used to estimate the effect of various process parameters and
geometrical dimensions (please keep in mind that these simulations only use static
interfacial tensions). We defined a standard system with LT = 50 µm, WT = 70 µm, HT = 10
µm, η = 3.34 mPa s (n-hexadecane, room temperature), θ = 30°, σ = 40 mN/m, and Lc =
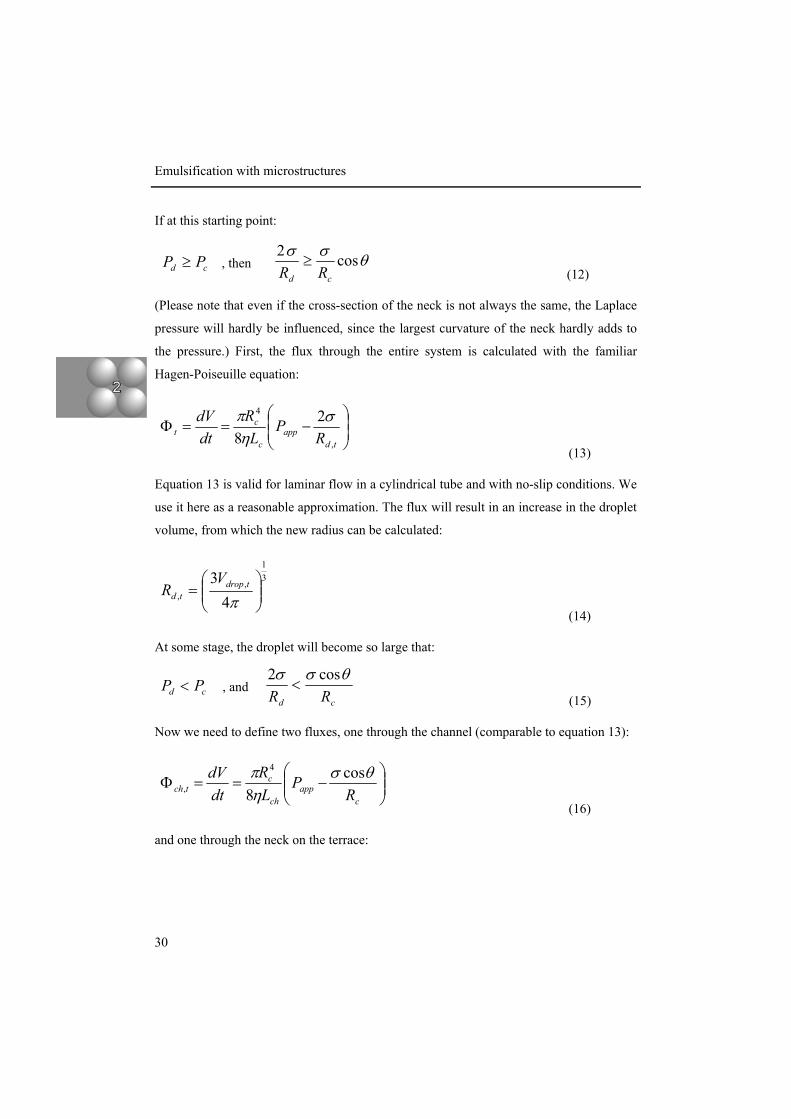
250 µm. The effects of variations in contact angle, interfacial tension, channel length, and
terrace length, on the droplet diameter are shown in Figure 12. We choose to plot the
droplet diameter as function of the applied pressure, because the average velocity is not a
controllable input parameter.
In Figure 12a the effect of the terrace length is shown. For larger terraces, the amount of
oil present on the terrace will result in an (attached) droplet radius which is large enough
to generate immediate droplet formation. With the smaller terraces, this effect does not
occur; the droplets still grow after they have first moved into the well, and the size is
dependent on the applied pressure. A lower contact angle, i.e. a more hydrophilic surface,
results in a broader working range for stable oil droplet formation. The same holds for a
higher surface tension; as expected the applied pressures need to be higher. A longer
channel also results in a wider pressure operation range, as was also observed
experimentally by Sugiura et al. (2002b). At the same applied pressure, the pressure drop
MC emulsification: From Computational Fluid Dynamics to Predictive Analytical Model
35
over a short channel will be bigger. For droplet snap-off, a higher pressure drop will be
needed between terrace and droplet, in order for the flux through the neck to become
higher than the flux through the channel. Therefore, the droplets from short channels will
become bigger. Besides the four parameters described in Figure 12, also, viscosity was
investigated, and it was found that it does not affect the pressure-curves. The only effect is
that the oil will flow faster or slower at the same pressure ranges, resulting in different
droplet formation frequencies (productivity). Contrary to the work described here, which
uses a pressure boundary that can be applied in practice, the study of Kobayashi and co-
Figure 12. Influence of several parameters on droplet diameter as function of the applied pressure. In a, b, c and d, the effect of LT, θ, σ and Lc respectively are shown. In each plot there is the standard system (●), with LT = 50 µm, HT = 10 µm, η = 3.34 mPa s, θ = 30°,
σ = 40 mN/m, and Lc = 250 µm and a higher (∆) and lower (∇) value shown. The results in Figure 12 c, can be used to evaluate
dynamic interfacial tension effects.
Emulsification with microstructures
36
workers uses a velocity boundary (which can not be applied in experiments) and these
authors have reported an effect of viscosity on the droplet size. It should be pointed out
that these models are so essentially different, that it is not possible to compare the results.
The model can also be applied to slightly different terraces with a width smaller than
length. Further, the same approach will be applicable to straight-through microchannels
(Kobayashi et al., 2002a) and asymmetric through-holes (Kobayashi et al., 2005b). The
big advantage of the analytical model is that neither extensive experimentation, nor
computation is necessary for a fast evaluation and possibly optimization of an
emulsification system.
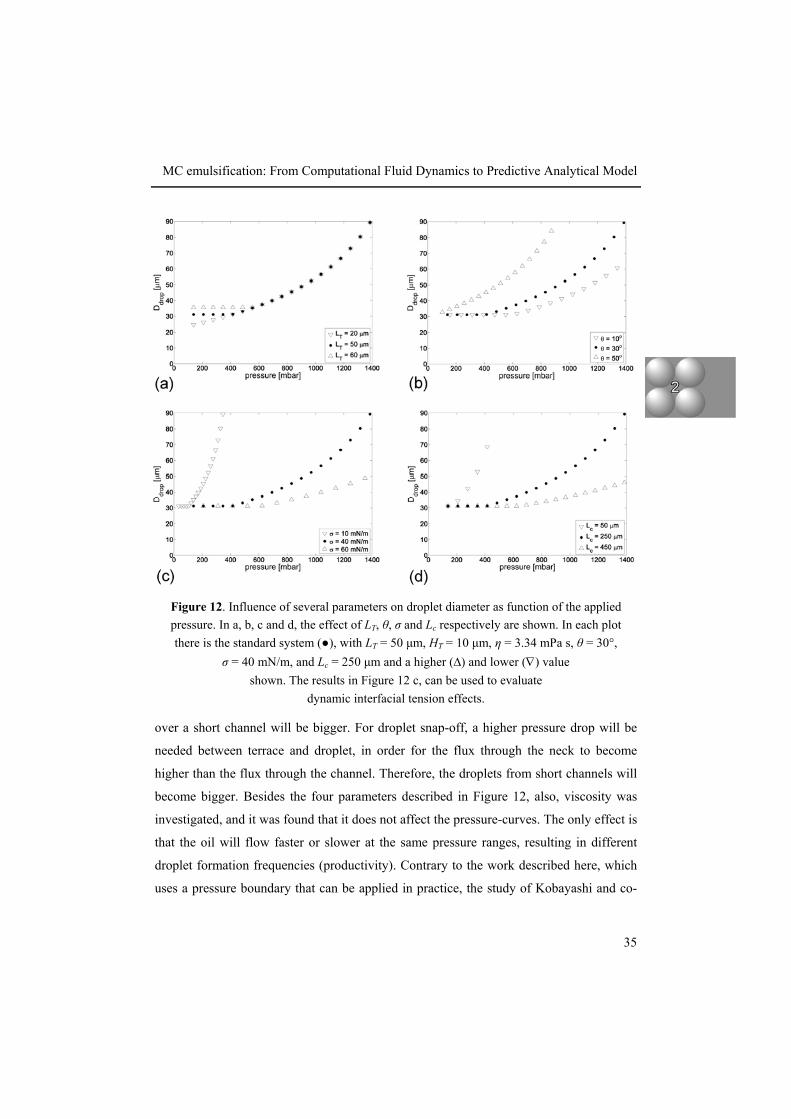
In summary, the analytical model predicts all effects that were noted in literature or that
we observed ourselves. In Figure 13, a generalized result is shown, and the two criteria
that eventually determine the droplet size are indicated. At low applied pressures, the
volume on the terrace will determine the diameter of the droplet, since this volume is big
enough to generate immediate droplet formation due to the pressure difference that is
created between terrace and droplet. At higher pressures, the pressure difference between
droplet and channel is not big enough for immediate droplet formation, and the flux
criterion determines the droplet size. The droplet can grow until the flux through the neck
Figure 13. Generalized result for terrace based emulsification systems.

MC emulsification: From Computational Fluid Dynamics to Predictive Analytical Model
37
is higher than the flux through the channel. The actual droplet diameter is described by the
solid line in Figure 13.
Conclusions
Computational Fluid Dynamics simulations were done on microchannel emulsification.
On the basis of these results, a simple analytical model which describes the droplet
diameter as function of the applied pressure was proposed. The model was able to predict
all available experimental data adequately. In addition, the influence of process
parameters such as dimensions of the channel, surface tension, contact angle, dispersed
phase viscosity, and applied pressure on droplet formation could be predicted. Besides
this, it was shown that the terrace dimensions determine the operational stability of the
process. The analytical model is obviously an easy tool to use in the design of future
emulsification systems, and helps in capturing the mechanistic understanding of these
systems.
Acknowledgement The authors thank Cees van Rijn for communicating his initial insights in spontaneous
droplet formation. Linda van Eijk, Siyu Zhao and Sophie Bartels are kindly acknowledged
for performing the measurements.


Chapter 3 Effect of viscosities of dispersed and
continuous phases in microchannel oil-in-water emulsification
Abstract
It is expected that during droplet formation in microchannel emulsification systems, the
inflow of the continuous phase should be sufficiently fast for droplet formation. The ratio
of the viscosities therefore influences the droplet formation process. This ratio was varied
by using a range of continuous and dispersed phases. At high viscosity ratio (ηd / ηc), the
droplet size is constant; the inflow of the continuous phase is fast compared to the outflow
of the dispersed phase. At lower ratios, the droplet diameter increases, until a viscosity
ratio is reached at which droplet formation is no longer possible (the minimal ratio). This
was confirmed and elucidated through CFD simulations. The limiting value is shown to
be a function of the microchannel design, and is a design parameter that needs to be
adapted to the two fluids.
This chapter has been accepted for publication as: van Dijke, K.C.; Kobayashi, I.; Schroën, K.; Uemura, K.; Nakajima, M.; Boom, R.M. Effect of viscosities of dispersed and continuous phases in microchannel oil-in-water emulsification Microfluidics and Nanofluidics

Emulsification with microstructures
40
Introduction
Microfluidic emulsification of immiscible fluids is of interest to several different
application areas because of the high monodispersity of the obtained emulsions. The
gentle and controlled formation of droplets is a benefit compared to traditional techniques
which use intense force fields to disrupt large, premixed droplets into smaller and
relatively polydisperse droplets. Commonly used and studied microtechnological
emulsification devices can be driven by transversal flow (T- and Y-junctions (Garstecki et
al., 2006; van der Graaf et al., 2005; Steegmans et al., 2009)), coflow (flow-focusing
devices (Anna et al., 2003; Xu and Nakajima, 2004)) or by interfacial tension (also called
spontaneous droplet formation; grooved microchannels (Kawakatsu et al., 1997) and
straight-through microchannels (Kobayashi et al., 2002a)). Several researchers explored
the influence of system parameters on microemulsification processes and observed that
droplet size can be varied by the design of the microfluidic device (Chapter 2; Sugiura et
al., 2002b; Kobayashi et al., 2005b), the flow rates of both phases (Garstecki et al., 2004),
and the properties of the liquids and other ingredients (Saito et al., 2005; Vladisavljević et
al., 2008).
Spontaneous droplet formation devices yield a combination of good monodispersity,
relatively high throughputs (if parallelized) and robustness. The influence of many of the
geometric parameters in these systems has been explored. However, the influence of the
viscosity of the continuous phase is not yet clear, and is therefore explored here. During
the snap-off of a droplet, the dispersed phase flowing out of the nozzle has to be replaced
by an equal amount of continuous phase; otherwise the drainage of the dispersed phase
out of the nozzle will be hindered and the droplet will not snap off. In grooved
microchannel devices the terrace structure facilitates the inflow of the continuous phase.
Kobayashi and co-workers (2004) found a minimum aspect (length/width) ratio for
straight-through channels of 3-3.5 necessary to produce oil droplets. At a lower aspect
ratio, the droplet will block the complete opening of the terrace, preventing inflow of the
continuous phase, and thus preventing snap-off of the droplet. This was confirmed by
Rayner et al. (2004) using static minimization of the surface area during the process. Next

Effect of viscosities of dispersed and continuous phases in MC oil-in-water emulsification
41
to that, dynamic interfacial tension effects may occur, and if diffusion is the driving force
behind surfactant transport to the interface, an effect of continuous phase viscosity is
expected.
We here report on the effect of the viscosities of the phases by performing emulsification
experiments with several dispersed phases into various polyethylene glycol (PEG)-water-
SDS mixtures as continuous phase, supported by fluid dynamics calculations of a
comparable MC-system with a single channel.
Material and Methods
Chemicals. In the emulsification experiments, refined soybean oil, hexadecane and
several silicon oils (S200, S500, S1000 and S5000) were used as dispersed phase.
Polyethylene glycol (PEG) was added in different amounts to MilliQ water with 1 wt%
sodium dodecyl sulfate (SDS) to vary the viscosity (ηc) of the continuous phase. All
chemicals were purchased from Wako Pure Chemical Industries, Ltd. (Osaka, Japan),
except for the silicon oils which came from Shin-Etsu Chemical Co., Ltd. (Tokyo, Japan).
The viscosities of the chemicals and mixtures were measured with a Vibro viscometer
SV-10 (A&D Company, Ltd., Tokyo, Japan), except for the silicon oils of which the
viscosities were given by the manufacturer. The density (ρ) was determined with a density
meter (model DA-130N, KEM Co., Ltd., Kyoto, Japan). The static equilibrium interfacial
tensions (σeq) were measured with the pendant drop method (PD-W, Kyowa Interface
Science Co., Ltd., Saitama, Japan). All measurements and experiments were performed at
25°C.
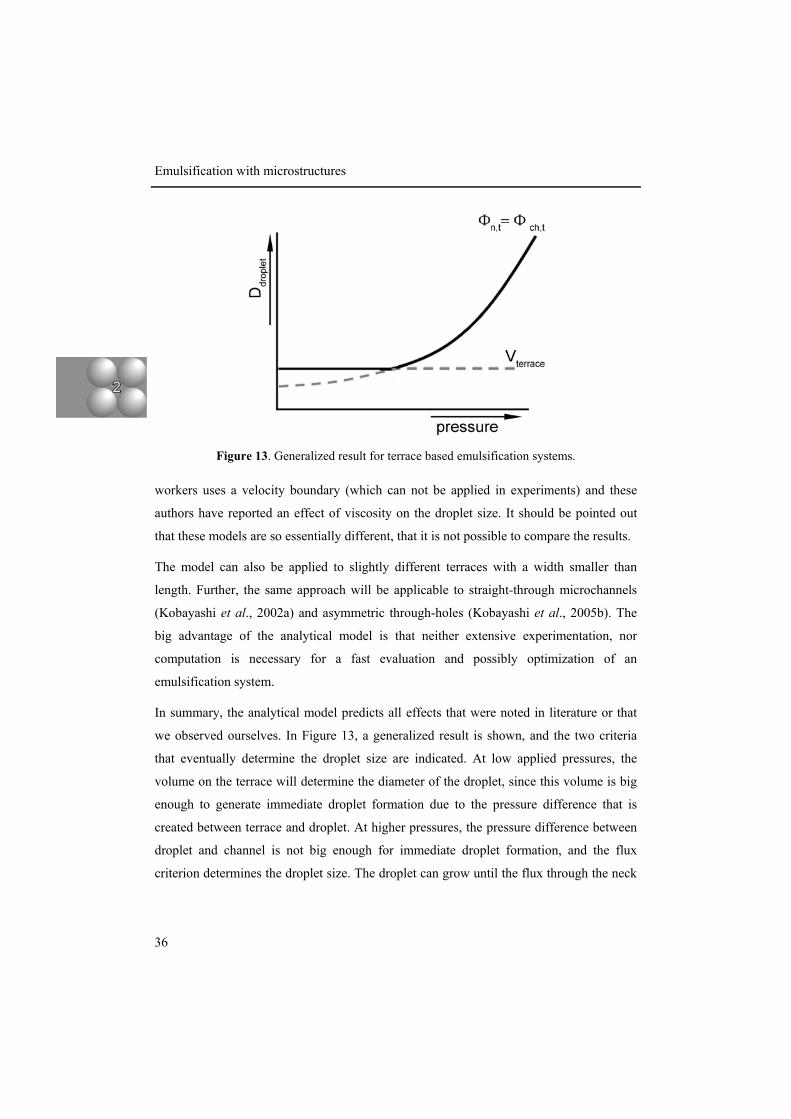
In Table 1, the viscosity, density, equilibrium interfacial tension of the dispersed phases in
contact with SDS solution (σ eq,SDS) and the average equilibrium interfacial tensions of the
oil in contact with a PEG-SDS- solution (σ eq,PEG) are shown. Next to that, the viscosity
and density of the water phases are given.
The addition of PEG to the water-SDS solutions results in an increased viscosity of the
continuous phase; up to 68.2 mPa s for a 20 wt% PEG - 1wt% SDS - water solution. The
Emulsification with microstructures
42
equilibrium interfacial tension is influenced by the oil that is used, with the most apolar
oils having the highest values. Further, addition of PEG plays a role as is reflected in SDS
systematically giving lower values when in absence of PEG. The influence of the PEG
concentration on the interfacial tension is however minor, and therefore these values are
represented as the average of all the measurements done with different PEG
concentrations for a specific oil.
Microchannel device and peripherals. In this study, we used a silicon 1.5 x 1.5 cm
grooved microchannel device with 150 channels at each side of the chip; for simplicity
reasons we will call this chip design 1. In Figure 1, schematic representations of the
hydrophilic MC array plate with several relevant dimensions of chip design 1 are shown.
The channel depth (H) is 8 µm, the channel length (Lc) is 25.3 µm and terrace length (LT)
is 51.7 µm. The cross-section of the channel is shown in Figure 1b. The hydraulic
diameter (deq), which is defined as four times the area over the perimeter, is 8 µm. Before
the first experiments were carried out, the chip was subjected to plasma oxidation in a
plasma reactor (PR41, Yamato Science Co.Ltd., Tokyo, Japan). After each measurement,
Dispersed phase
ηd
[mPa s] ρd
[kg m-3] σ eq,SDS
[mN m-1] σ eq,PEG * [mN m-1]
Continuous phase:
PEG in water [wt%]**
ηc [mPa s]
ρc [kg m-3]
Hexadecane 2.32 769 9.1 10.7 0 0.91 997
Soybean oil 48.7 916 4.7 8.1 1 1.40 1000
Silicon oil 200 965 9.7 12.5 2.5 2.10 1002
Silicon oil 500 970 10 - 5 4.83 1006
Silicon oil 1000 970 10.6 13.3 7.5 7.84 1011
Silicon oil 5000 970 15 - 10 13.9 1015
20 68.2 1032
Table 1. Measured properties of phases used in the experiments at 25°C.
* average value is average for all PEG concentrations; σ eq,PEG decreased only slightly at higher wt% PEG, therefore, only one value is shown to represent all in the series. ** all solutions contain 1 wt% SDS.

Effect of viscosities of dispersed and continuous phases in MC oil-in-water emulsification
43
the chip was cleaned with ethanol and a neutral detergent solution (Clean Ace Neutral) in
an ultrasound water bath for 20 minutes and stored in 0.1 M nitric acid for future usage.
We also used a comparable microchannel chip albeit with a longer channel (Lc,MCL= 70
Figure 1. Schematic representation of the microchannel system. (a) chip layout (b) cross-section of a microchannel (c) top-view of three microchannels (d) three dimensional
drawing of part of microchannel system producing droplets. Dimensions are in micrometers if not mentioned.

Emulsification with microstructures
44
µm), shorter terrace (LT,MCL= 30 µm) and channel depth (HMCL= 7 µm) in a few
measurements; and this chip we will indicate with design 2. The MC plates were placed in
the module shown in Figure 2, which was initially filled with the continuous phase; we
observed droplet formation with a microscopic high-speed video system.
The to-be-dispersed phase was pressurized via hydrostatic pressure (by increasing the
height of the supplying vessel) until the break-through pressure was reached and droplets
start to form. (Figure 1d shows a schematic representation of four active microchannels.)
The theoretical break-through pressure for a cylindrical channel with diameter Dch and
contact angle θ, can be calculated with Laplace’s law:
(1)
This equation can be used to calculate the approximate value of the break-through
pressures in the systems used in this work.
chDP θσ cos4
min =∆
Figure 2. Schematic drawing of all peripherals for microchannel emulsification.
Effect of viscosities of dispersed and continuous phases in MC oil-in-water emulsification
45
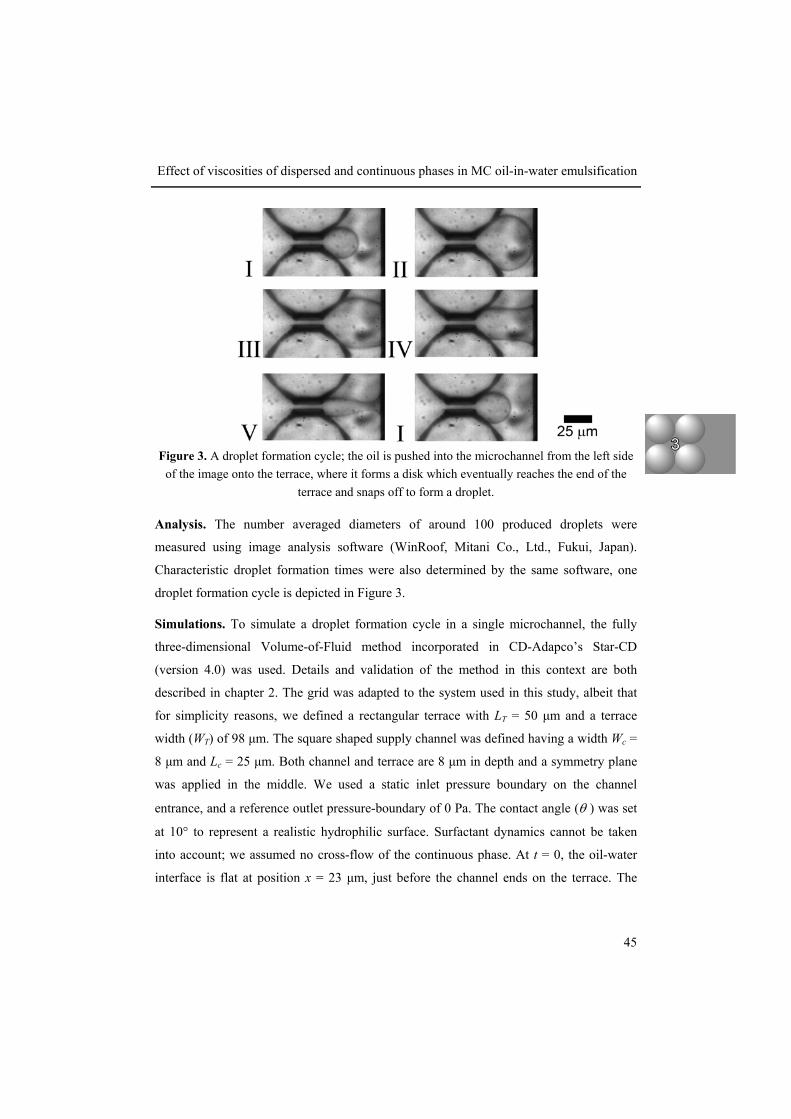
Analysis. The number averaged diameters of around 100 produced droplets were
measured using image analysis software (WinRoof, Mitani Co., Ltd., Fukui, Japan).
Characteristic droplet formation times were also determined by the same software, one
droplet formation cycle is depicted in Figure 3.
Simulations. To simulate a droplet formation cycle in a single microchannel, the fully
three-dimensional Volume-of-Fluid method incorporated in CD-Adapco’s Star-CD
(version 4.0) was used. Details and validation of the method in this context are both
described in chapter 2. The grid was adapted to the system used in this study, albeit that
for simplicity reasons, we defined a rectangular terrace with LT = 50 µm and a terrace
width (WT) of 98 µm. The square shaped supply channel was defined having a width Wc =
8 µm and Lc = 25 µm. Both channel and terrace are 8 µm in depth and a symmetry plane
was applied in the middle. We used a static inlet pressure boundary on the channel
entrance, and a reference outlet pressure-boundary of 0 Pa. The contact angle (θ ) was set
at 10° to represent a realistic hydrophilic surface. Surfactant dynamics cannot be taken
into account; we assumed no cross-flow of the continuous phase. At t = 0, the oil-water
interface is flat at position x = 23 µm, just before the channel ends on the terrace. The
Figure 3. A droplet formation cycle; the oil is pushed into the microchannel from the left side of the image onto the terrace, where it forms a disk which eventually reaches the end of the
terrace and snaps off to form a droplet.

Emulsification with microstructures
46
material properties were defined as measured for the systems with 1% SDS solution,
except for the viscosity values. Contrary to the experiments, in the computations we could
change the viscosity of the continuous phases without affecting the interfacial tension or
density (in reality changes are caused by adding PEG as denoted in Table 1). As a result,
we were able to define the applied pressure at a value just above the minimally required
pressure for all systems, which allowed us to consider viscosity effects only.
The average computation time was about 5 days when the grid domain was divided over
two nodes running under Linux 2.6.8.; each with two 2994 MHz Intel Pentium IV XEON
processors and a physical memory of 3044 MB. Due to computation capacity limitations,
only hexadecane was used in the simulations as dispersed phase. The pressure values at
different positions and time stages during droplet formation were extracted with Pro-Star,
the post-processing program of the software package and enhanced and combined with
Canvas software (version 11, ACD Systems of America, Inc.); see Figure 6.
Results and Discussion
Emulsification. Figure 4 shows three microscopic photographs of droplet formation in a
grooved microchannel system just above breakthrough pressure where uniform droplets
can be produced (a-c), and a picture of a system in the blow-up regime (d).
In (a), hexadecane droplets are formed in a continuous phase with viscosity ηc = 4.83
mPa s (giving a viscosity ratio of 0.48, see Eq. 2). The low viscosity of hexadecane results
in a high rate of droplet formation. The droplets are non-spherical in front of the channel
outlet: the viscous continuous phase hinders the motion of the droplets, and squeezes them
together. Further away from the terrace, the droplets become more spherical. In a
continuous phase with low viscosity, the droplets were spherical everywhere. Figure 4(b)
shows droplet formation of a silicon oil with viscosity ηd = 1000 mPa s in a 20 wt% PEG
- 1 wt% SDS aqueous solution with ηc= 68.2 mPa s (viscosity ratio = 14.7). Although the
continuous phase is more viscous than in (a), the formed droplets are spherical and that is
most probably due to the much slower droplet formation, which will be discussed later in
more detail. In (c), oil with an even higher viscosity is used, in a 1 wt% SDS solution, and

Effect of viscosities of dispersed and continuous phases in MC oil-in-water emulsification
47
again spherical droplets were formed. Most emulsification experiments performed at
pressures below the blow-up pressure resulted in equally sized droplets with a coefficient
of variation below 5% (see also Table 2). In highly viscous continuous phases, the c.v. of
droplets formed from low viscosity oils is somewhat higher, and this is probably caused
by the deformed droplets, which are more difficult to characterize. In picture (d), blow-up
of a soybean oil system in a continuous phase with ηc = 68.2 is shown (viscosity ratio
0.71). This occurs at elevated pressures, which is similar to earlier reported behavior of
MC systems. In contrast to systems with lower viscosity of the continuous phase, this
blow-up behavior is self re-enforcing: as soon as one channel starts to blow-up all active
channels will follow shortly thereafter. Besides, for some systems with high continuous
phase viscosity, we observed time dependent blow-up, which implies that after several
hundred droplets blow-up occurred without increasing the pressure. Most probably, this is
caused by limitation of surfactant transfer to the interfaces which will be discussed later.
Table 2 shows an overview of the droplet diameters, corresponding coefficients of
Figure 4. Typical emulsification results. (a) Squeezed hexadecane droplets in 5 wt% PEG – 1 wt% SDS solution, (b) Silicon oil (ηd = 1000 mPa s) in 20 wt% PEG – 1 wt% SDS solution (c) Silicon oil (ηd = 5000 mPa s) in 1 wt% SDS solution. (d) blow-up at elevated pressure, shown
at lower magnification.

Emulsification with microstructures
48
variation and total droplet formation times of the experiments performed with
microchannel design 1. To compare the experiments we have chosen to define the
viscosity ratio (ξ) as the ratio of the to-be-dispersed phase viscosity (ηd) over the
continuous phase viscosity (ηc):
(2)
and the dimensionless droplet diameter D as the resulting droplet diameter Ddrop divided
by the height of the terrace H:
c
d
ηηξ =
oil ηc [mPa s]
Ddrop [µm]
c.v. [%]
tdrop [ms]
oil ηc [mPa s]
Ddrop [µm]
c.v. [%]
tdrop [ms]
Hexadecane η = 2.32 mPa s
0.91 34.8 2.5 42 Silicon oil η = 200 mPa s
0.91 32.6 2 169
1.40 36.8 3.7 30 4.83 34.6 4.1 303
2.10 39.8 3.9 33 13.9 34.4 5.1 347
4.83 41.6 9.6 34 68.2 36.2 9.3 470 *
7.84 - Silicon oil η = 500 mPa s
0.91 33.0 4.2 284
13.9 - Silicon oil η = 1000 mPa s
0.91 33.6 2.7 442
68.2 - 4.83 33.6 3.3 1236
Soybean oil η = 48.7 mPa s
0.91 32.0 2.1 404 13.9 33.6 4.1 1284
4.83 33.4 3.8 290 68.2 33.6 3.7 1714
13.9 34.4 2.9 518 Silicon oil η = 5000 mPa s
0.91 33.6 3.8 2420
68.2 39.6 12.2 432 *
Table 2: Results of performed experiments with chip design 1.
* = time dependent blow-up
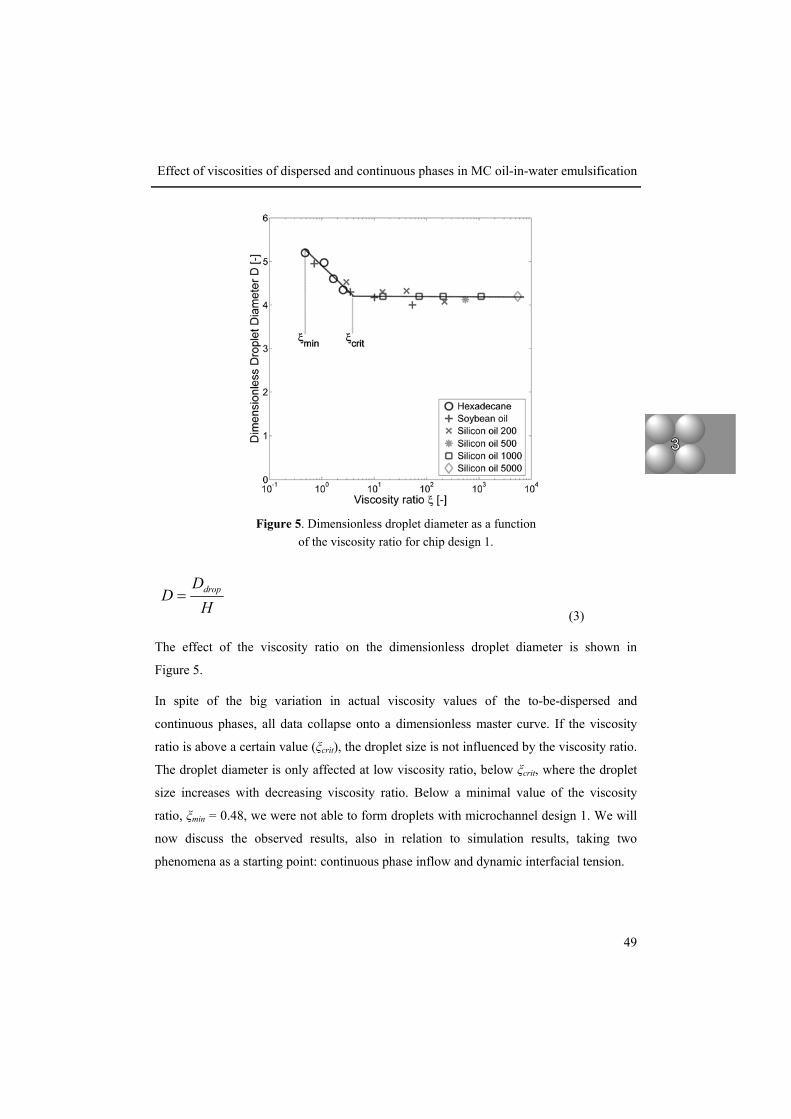
Effect of viscosities of dispersed and continuous phases in MC oil-in-water emulsification
49
(3)
The effect of the viscosity ratio on the dimensionless droplet diameter is shown in
Figure 5.
In spite of the big variation in actual viscosity values of the to-be-dispersed and
continuous phases, all data collapse onto a dimensionless master curve. If the viscosity
ratio is above a certain value (ξcrit), the droplet size is not influenced by the viscosity ratio.
The droplet diameter is only affected at low viscosity ratio, below ξcrit, where the droplet
size increases with decreasing viscosity ratio. Below a minimal value of the viscosity
ratio, ξmin = 0.48, we were not able to form droplets with microchannel design 1. We will
now discuss the observed results, also in relation to simulation results, taking two
phenomena as a starting point: continuous phase inflow and dynamic interfacial tension.
HD
D drop=
Figure 5. Dimensionless droplet diameter as a function of the viscosity ratio for chip design 1.

Emulsification with microstructures
50
Continuous phase inflow. For microchannel systems, it is known from literature that
they facilitate inflow of the continuous phase near the location of droplet snap-off. In
grooved microchannels, as well as in asymmetric straight-through channels, the terrace
structure enhances microchannel emulsification (Sugiura et al., 2002b; Kobayashi et al.,
2004; Kobayashi et al., 2005b) and for oblong straight-through channels it is well
documented that the aspect ratio of the channels needs to be larger than 3-3.5 in order to
obtain monodisperse droplet formation. Through CFD simulations, it was shown that this
minimal aspect ratio was indeed necessary to have enough intrusion possibilities for the
continuous phase; i.e. water (Kobayashi et al., 2004). At a lower aspect ratio, the growing
droplet will completely block the microchannel, and inhibit the ingression of the
continuous phase. This is however a static effect.
In this work, we take the CFD simulations a step further and use higher continuous phase
viscosities to understand the observed dynamics in the experiments. As an example, we
show in Figure 6 the pressure fields at similar stages in droplet formation plotted for a
continuous phase viscosity of ηc = 0.91 mPa s (ξ = 2.55) and ηc = 4.83 mPa s (ξ = 0.48);
both simulations are for hexadecane as to-be-dispersed phase, and other details are given
in the materials and methods section.
In Figure 6, only half of the terrace structure is shown to allow detailed observation of the
pressure field; a symmetry plane is used in the middle. As the computational grids are
slightly rotated, the top views as well as the cross-sections are visible. The pressure values
relative to atmospheric pressure are indicated in the ‘color’ bars (the one with the full
color is for the negative range, the one with the hatched lines is for the positive relative
pressures); the interface is at the black line. Due to the Laplace pressure over the interface
between water and oil, the pressure values in the to-be-dispersed phase are much higher
and gradients are larger compared to the continuous phase.
In Figure 6, stage I is the inflation stage where the oil flows onto the terrace in a disk-like
shape. Similar behavior is observed in both situations, although at low ξ the process is
somewhat slower. The crucial difference between high and low continuous phase
viscosity ratios becomes visible during stage II, where the disk-like oil on the terrace

Effect of viscosities of dispersed and continuous phases in MC oil-in-water emulsification
51
flows into the spherical growing droplet in the well. While the terrace is emptied, the
generated inward gradient on the terrace causes the continuous phase to flow onto it. With
a higher viscosity of the continuous phase, this gradient is clearly steeper, resulting in
lower values of the pressure. In stage III, the droplet is close to snap-off, and the gradients
that were present in the continuous phase during stage II, have practically leveled out
again.
Figure 6. Pressure fields during 3 stages of droplet formation for emulsification systems with a high (left) and low viscosity ratio (right).

Emulsification with microstructures
52
The analytical model derived for MC systems in Chapter 2, was developed for the
situation with a high ξ (low viscosity of the continuous phase). Given the differences in
local pressures that we noted in the simulation, the analytical model should be refined,
since it is based on the local pressures at three locations in the system. For the model, we
use the breakthrough pressure mentioned earlier (Eq. 1), which is the lowest pressure
applied at the channel entrance which enables oil flow into the channel, the pressure in the
oil on the terrace (Pd) and the pressure in the droplet (Pdrop). Break-up occurs if the flux to
the droplet (Φn: caused by a pressure difference between terrace and droplet) exceeds the
supplying flux through the channel (Φch: caused by a pressure difference between channel
entrance and terrace), so:
(4)
If this criterion is fulfilled immediately after emptying the terrace, the process generates
small droplets and is in the monodisperse droplet generation regime. If not, a quasi-static
neck will be present to supply oil to the droplet until the criterion is fulfilled.
The pressure in the droplet ∆Pdrop, defined by:
(5)
(with, σ the interfacial tension, and Rd the droplet diameter), and the breakthrough
pressure at the channel entrance (Eq. 1) will not be affected by the continuous phase
viscosity. In contrast, as shown in the simulations, a higher continuous phase viscosity
results in a steeper gradient and lower pressure values in the continuous phase on the
terrace (Pc) as can be seen in Figure 6, and this effectively influences the pressure
differences in the to-be-dispersed phase (Pd) on the terrace, which follow from:
(6)
chn Φ>Φ
ddrop R
P σ2=∆
θσ cos11
21⎟⎟⎠
⎞⎜⎜⎝
⎛+=−=∆
RRPPP cdterrace

Effect of viscosities of dispersed and continuous phases in MC oil-in-water emulsification
53
In which, R1 and R2 are the principle radii of curvature of the oil shape on the terrace, and
θ is the contact angle. R1 is determined by the height of the terrace, H, while R2 varies
during stage II in Figure 6 (emptying terrace), and further, the contact angle is assumed to
be constant. In case of a higher viscosity of the continuous phase, the pressure in the oil
phase on the terrace (Pd) is lower, and consequently, the supply flow of dispersed phase
from the channel to the terrace will be high. As a result, a larger volume of dispersed
phase will flow into the well during this stage of droplet formation, and larger droplets
will be formed at low ξ, as is visible in stage II of the droplet formation process in
Figure 6.
Interfacial tension. From the results depicted in Figure 5 and Table 2, and the measured
static equilibrium interfacial tensions shown in Table 1, we can conclude that there is no
direct link between static interfacial tension and resulting droplet size. There seems to be
a link between the static interfacial tension and the droplet formation times, as can be seen
in Table 2. These observations are in line with the results from Sugiura et al. (2004b),
who also reported an influence on the time of droplet formation. The reason for more
rapid droplet formation at higher interfacial tension values is the larger absolute pressure
difference between the local pressures defined in the previous paragraph (the curvatures
are expected to be similar); which is co-determined by the local interfacial tension.
If the process is extremely slow in every sense, the surfactant will have sufficient time to
cover the surface area, and the interfacial tension will be equal to the equilibrium
interfacial tension. However, given the timescales at which emulsification occurs, it is
reasonable that in at least some of the experiments, dynamic interfacial tension effects
play a role. Here we try to evaluate the importance of the dynamic interfacial tension by
investigating the timescale for diffusion of the surfactant molecules (τd) for molecular
diffusion near the droplets in laminar flow at low Reynolds numbers (Lucassen-Reynders
and Kuijpers, 1992):
(7)
22⎟⎠⎞
⎜⎝⎛ Γ
=dcd
Ddiffdτ

Emulsification with microstructures
54
in which, Ddiff is the diffusion coefficient of the surfactants, Γ the adsorbed amount and c
the surfactant concentration. Further, the relative rate of new surface area creation (κ) can
be defined as:
(8)
The numerical value of τd depends strongly on the concentration of the emulsifier, and its
diffusion coefficient; theoretical values for SDS are in the order of 10-3 s (Vlahovska et
al., 1997; Sasaki et al., 1977). The interfacial tension will be at its equilibrium value if the
diffusion of the surfactant molecules is fast enough to cover the newly created interface
instantaneously:
(9)
The interface will be free of emulsifier if:
(10)
From the definition of the time scale of diffusion, it follows that τd is inversely
proportional with the diffusion coefficient Ddiff, and we expect Ddiff inversely proportional
to the viscosity, if we follow the Stokes- Einstein relation:
(11)
and this would imply that τd is proportional to the viscosity:
(12)
tdAd ln
=κ
( ) eqdtd
Ad σστκ ≈⇒<<= −1ln
( ) 01ln σστκ ≈⇒>>= −dtd
Ad
rTkD B
diff πη6=
cd ητ ∝

Effect of viscosities of dispersed and continuous phases in MC oil-in-water emulsification
55
We can approximate the surface creation rate from the droplet surface area Adrop, and the
initial oil disk area Astart and the droplet formation cycle time tdrop:
(13)
Hexadecane has the fastest area creation rate in the performed experiments; κ ranges from
60-80 s-1. Using the value of τd from literature, it can be concluded that for this low
viscous continuous phase, diffusion is fast enough to cover the interface, κ << (τd)-1, and
reduce interfacial tension instantaneously to a value close to its equilibrium value.
Increasing the viscosity of the continuous phase has two straightforward effects related to
interfacial tension effects; it will lower the diffusional mobility of the surfactant (Eq. 12)
and it will affect the droplet formation rate (see also Figure 6), and thus the surface
creation rate (κ). In addition, several indirect effects can influence droplet formation. An
increase in dynamic interfacial tension value will influence the droplet formation rate as
described earlier for a static value, therewith affecting its own dynamic behavior. The
generation of a great multitude of droplets or smaller sized droplets (total surface area
formation larger) will result in a faster depletion of surfactant from the continuous phase,
therewith inducing effects on droplet formation rate and stability. Further, we noted in our
experiments that a cross-flow can be of great importance for supply of ‘fresh’ surfactant
(and transport of formed droplets that may hinder the surfactant supply process) especially
at a high viscosity of the continuous phase, where blow-up is more likely to occur.
In our CFD simulations, in which a constant interfacial tension was assumed, we see
similar trends in droplet size as we found experimentally. For these low viscosity ratios,
the influence of the dynamic nature of the interfacial tension on the droplet size in the
monodisperse regime seems limited, and we expect that the differences in droplet size are
caused by slower continuous phase inflow.
System design. Several aspects of droplet formation can be influenced with the design of
the microchannel device. Based on the explanation of the observed phenomena, it should
drop
startdrop
tAA lnln −
≈κ
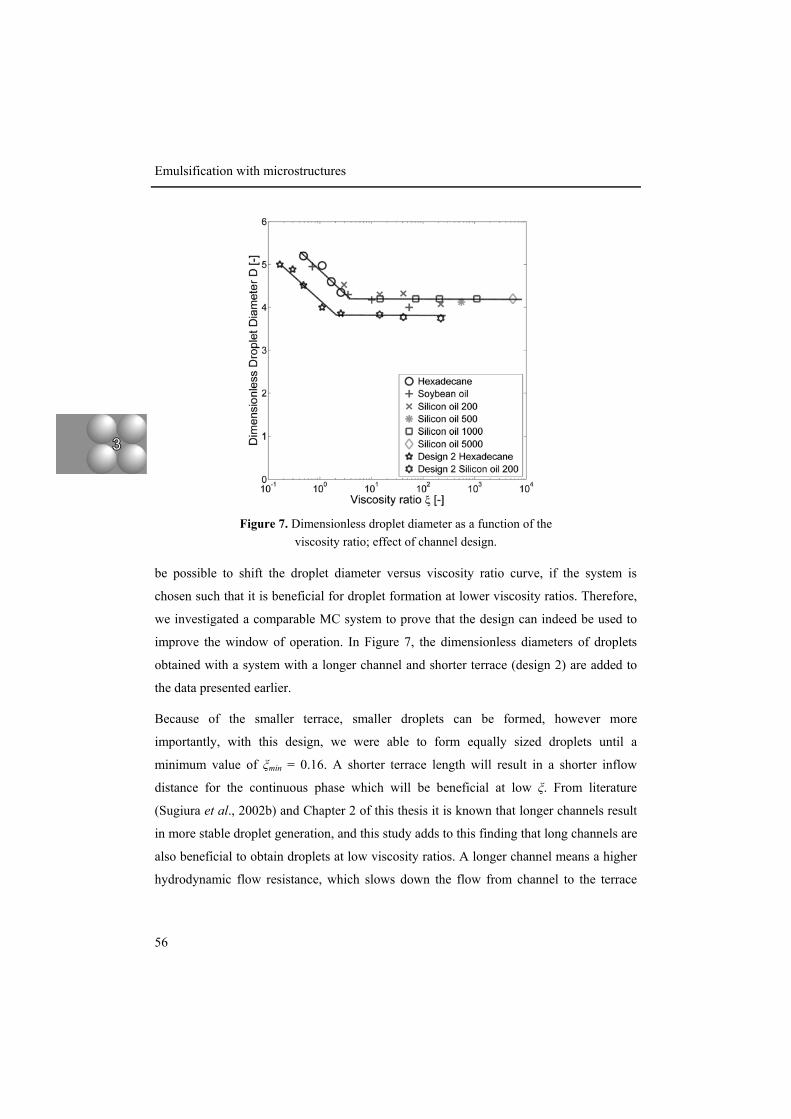
Emulsification with microstructures
56
be possible to shift the droplet diameter versus viscosity ratio curve, if the system is
chosen such that it is beneficial for droplet formation at lower viscosity ratios. Therefore,
we investigated a comparable MC system to prove that the design can indeed be used to
improve the window of operation. In Figure 7, the dimensionless diameters of droplets
obtained with a system with a longer channel and shorter terrace (design 2) are added to
the data presented earlier.
Because of the smaller terrace, smaller droplets can be formed, however more
importantly, with this design, we were able to form equally sized droplets until a
minimum value of ξmin = 0.16. A shorter terrace length will result in a shorter inflow
distance for the continuous phase which will be beneficial at low ξ. From literature
(Sugiura et al., 2002b) and Chapter 2 of this thesis it is known that longer channels result
in more stable droplet generation, and this study adds to this finding that long channels are
also beneficial to obtain droplets at low viscosity ratios. A longer channel means a higher
hydrodynamic flow resistance, which slows down the flow from channel to the terrace
Figure 7. Dimensionless droplet diameter as a function of the viscosity ratio; effect of channel design.
Effect of viscosities of dispersed and continuous phases in MC oil-in-water emulsification
57
during droplet formation, therewith keeping the inflow of dispersed phase through the
microchannel more constant.
In summary, from all our findings it is clear that not only the design of the microchannel
itself is important for stable emulsification, but that also the design needs to be adapted to
the components (dispersed and continuous phases, and surfactant) that are to be
emulsified.
Conclusions
We report the effect of viscosity of both continuous and to-be-dispersed phases on
microchannel emulsification. At high ratios of the viscosities of the dispersed and
continuous phases, the droplet size is not influenced, but at low viscosity ratios, the
droplets become larger, and there is a ratio below which successful emulsification is not
possible. This minimum viscosity ratio at which emulsification can still take place can be
influenced by the design of the microchannel device; for example, a shorter terrace and
longer channel leads to a lower critical ratio.
From CFD simulations, we found that the increased droplet size at low ratios is caused by
the increased oil supply to the terrace due to a steeper pressure gradient in the continuous
phase that surrounds the dispersed phase that is draining from the terrace. Surfactant
dynamics are expected to have minor effects during droplet formation, although some
secondary effects could play a role in the blow-up of the process, where depletion of
available surfactant is expected to occur.
Acknowledgement Koen van Dijke and the Food Process Engineering group of Wageningen University want
to thank the National Food Research Institute and the University of Tsukuba for their
hospitality and willingness for cooperation.

Chapter 4 Simultaneous formation of many droplets in a single microfluidic droplet formation unit
Abstract
In this chapter, we introduce a new microfluidic droplet formation unit with which we are
able to produce multiple monodisperse emulsion droplets simultaneously. In this Edge-
based Droplet GEneration (EDGE) device, droplet formation occurs along the edge of a
plateau located between the oil supply channel and the continuous phase channel. The
EDGE system has a broad practical pressure range at which a monodisperse emulsion can
be produced and is self-regulating. Next to that, it is hardly sensitive for fouling, and
further it is reasonable to assume that these droplet formation units can be scaled-up
easily.
This chapter has been accepted for publication as: Van Dijke, K.C.; Veldhuis, G.; Schroën, K.; Boom, R.M. Simultaneous formation of many droplets in a single microfluidic droplet formation unit AIChE Journal 2009 DOI: 10.1002/aic.11990 Supplementary material online available at the journal’s home page.

Emulsification with microstructures
60
Introduction
Narrowly dispersed emulsions with droplet size of 0.1-100 µm are of great importance in
both science and industry. However, conventional emulsification techniques yield wide
droplet size distributions with typical coefficients of variation of around 40% (Saito et al.,
2006). Next to that, most of the energy put into the product is dissipated as heat (Walstra
et al., 2006)
Recently, several new energy-efficient microfluidic droplet formation systems have been
developed which give more monodisperse emulsions. Highly monodisperse droplets can
be produced by single-drop technologies such as flow-focusing devices (Anna et al.,
2003; Garstecki et al., 2005), co-flowing systems (Umbanhowar et al., 2000), T-, Y- or
cross-junctions (van der Graaf et al., 2005; Nisisako et al., 2002; Steegmans et al., 2009),
and microchannels (Kawakatsu et al., 1997; Kobayashi et al., 2002a; chapter 2). Some of
these techniques produce droplets in the desired range; however, the volumetric
productivity of one unit is considered too low to be of practical relevance for larger scale
applications.
To realize a higher volumetric production rate it is essential to upscale these systems. In
the single-drop technologies the droplets are formed sequentially, which requires mass
parallelization of the droplet formation units (DFU). In shear-based systems such as flow-
focusing, co-flowing devices, and e.g. T- and Y-junctions, both the to-be-dispersed and
continuous phase flows need to be precisely controlled at each DFU as the flow rates have
a huge influence on the droplet size. Consequently, a parallelized shear-based droplet
generator is complex, since it not only involves more units but also the control of the
flows in all units. Nisisako and Torii (2008) succeeded in mass-production of
monodisperse droplets of around 100 µm with CV of 1.3% using large-scale microfluidic
integration on a chip (256 droplet formation units). Although it is in principle possible to
parallelize smaller channels, therewith leading to mass production of much smaller
droplets, the difficulties with control of the flows are expected to increase exponentially
as the characteristic size of the system decreases, and are expected to be far from trivial.

Simultaneous formation of many droplets in a single microfluidic droplet formation unit
61
In microchannel (MC) systems as studied by Kawakatsu et al. (1997), Sugiura et al.
(2000), Kobayashi et al. (2002a), and our group (Chapter 2), only the flow of the to-be-
dispersed phase needs to be controlled. The continuous flow rate is not a parameter that
plays a role in droplet generation, since droplet formation is induced by Laplace pressure
differences, and is often referred to as spontaneous droplet formation. A low flow rate is
only applied for droplet removal from the DFU, since otherwise it would be blocked by
the droplets. These systems seem to be more suitable for scale-up; especially the straight-
through microchannel devices of Kobayashi and co-workers look promising.
Monodisperse emulsions with droplet diameters of 4.4 – 9.8 µm with CV from 5.5 – 2.7%
were successfully produced using straight-through MC plates with different channel
dimensions (Kobayashi et al., 2008). Unfortunately, the channel efficiency, which is the
percentage of droplet producing channels, was < 1% for the plate with the smallest
microchannels, and only up to 12.3% for the larger ones. This is most probably due to
pressure gradients in the system, as was extensively discussed by Gijsbertsen-Abrahamse
et al. (2004) for emulsification with microsieves which resemble the devices of
Kobayashi. Next to that, fabrication inaccuracies could also cause low channel efficiency
as mentioned by Kobayashi and co-workers.
In the microchannels discussed in the previous section, droplets are generated one at a
time from a so-called terrace that practically empties to form the droplet. In this Chapter,
we present a new droplet formation unit, EDGE (Edge-based Droplet GEneration), in
which a multi-droplet formation mechanism occurs that generates many narrowly
dispersed droplets simultaneously from the same droplet formation unit. Contrary to the
microchannels, where the volume of the droplets is roughly in the same order of
magnitude as the volume of the terrace from which they are spontaneously generated, the
volume of the droplets formed in this new device is only a small fraction of the volume of
oil present on the so-called plateau.

Emulsification with microstructures
62
Experimental
The structures and channels were etched with the Deep Reactive Ion Etching (DRIE)
technique (Micronit Microfluidics, The Netherlands) in a silicon microchip of 1.5 x 1.5
cm. A glass plate was bonded on top of the chip to close the channels. Hydrophilic
surfaces needed for oil-in-water emulsion production were created in this way. The unit
consists of an oil supply channel of 100 µm wide and 200 µm deep, and a continuous
phase supply channel with similar dimensions. In between those channels, there is a
plateau with fixed width (Wp = 500 µm) and length (Lp = 200 µm). The plateaus that were
used have either of two depths (Hp): 1.2 or 2.6 µm; the plateau being the actual the droplet
formation unit in this EDGE system. We define both systems as EDGE-1.2 and EDGE-
2.6 respectively (see also Figure 1 for an image of the lay-out and the dimensions). The
oil, in our case hexadecane (viscosity η = 3.34 mPa s), is guided to the plateau via the oil
Figure 1. Topview of an EDGE unit; from left oil is led through the oil channel to the plateau and into the water channel after droplet formation at the edge of the plateau. A magnification of droplet formation is shown in the top left corner. Typical dimensions of the structure are
indicated in the image.

Simultaneous formation of many droplets in a single microfluidic droplet formation unit
63
channel. We use a digital pressure controller (Bronkhorst, The Netherlands) to set and
control the applied pressure. The pressure needed for hexadecane to flow onto the plateau
is determined by Laplace’s law:
(1)
where σ is the interfacial tension, R1 and R2 are the radii of curvature of the oil-water
interface, and θ is the contact angle. For simplicity reasons, we assume a contact angle of
0°, and since the curvature R2 is very large compared to R1, the minimal pressure needed
here is determined by the smallest curvature, as shown in the right part of Equation 1. If
the pressure exceeds this value, the oil flows on the plateau and droplets will be formed at
the edge, where the droplets ‘fall over the edge’ into the channel with MilliQ ultra pure
water with 1 % SDS as surfactant, which is supplied to the channel with a syringe pump.
Typical flow rates for the continuous phase are 300-1000 µl/hour.
The emulsification process is visualized using a high-speed camera connected to a
microscope. In Figure 1, a snapshot from a movie of a typical experiment with an EDGE-
2.6 µm system is depicted; the view is straight from above, and the depth of the various
structures is indicated in the image. In the top left corner, an enlarged image of a forming
droplet is shown.
Droplet formation at the edge of the plateau occurs seemingly at random along the width
of the DFU, and at many locations simultaneously, albeit that the corners of the plateau
are not used due to Laplace pressure differences. In an EDGE system, similar sized
hexadecane droplets can typically be formed at frequencies of >1500 and >2000 Hz per
DFU, for EDGE-2.6 and EDGE-1.2, respectively.
Results and discussion
The droplet sizes of emulsions produced with both EDGE systems are analyzed through
image analysis and with the Mastersizer 2000 (Malvern Instruments Ltd., United
121
11cosRRR
P σθσ ≈⎟⎟⎠
⎞⎜⎜⎝
⎛+=∆
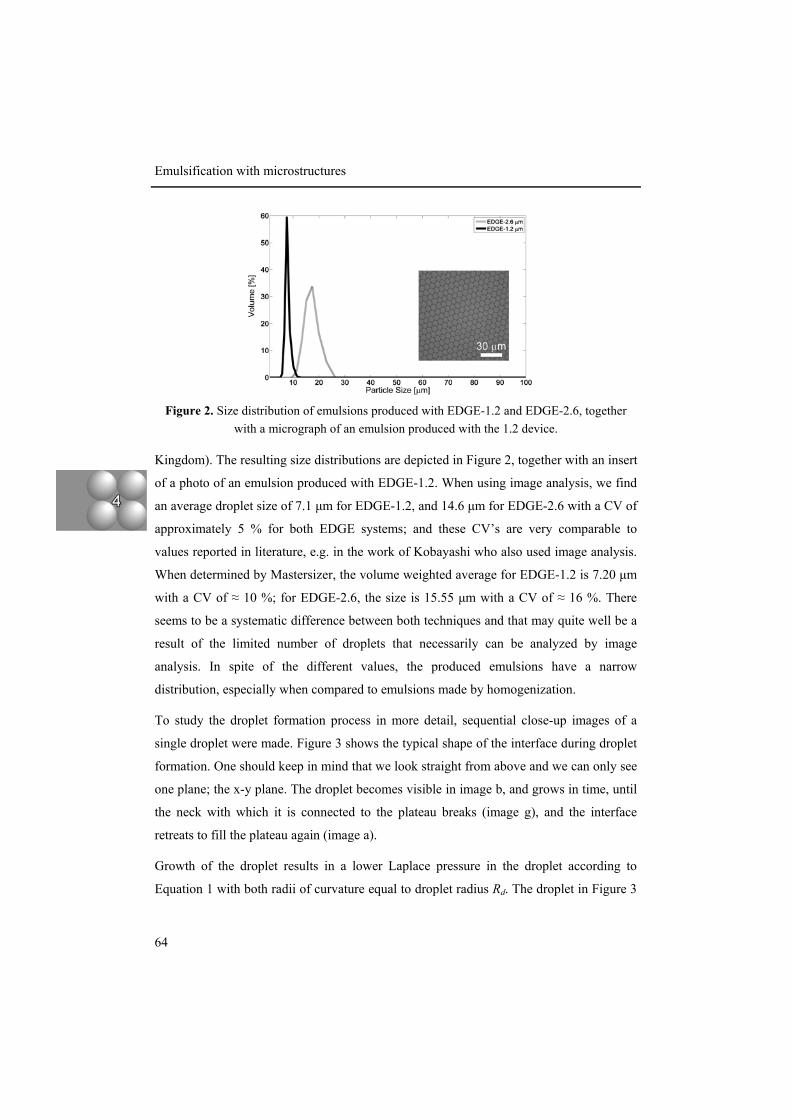
Emulsification with microstructures
64
Kingdom). The resulting size distributions are depicted in Figure 2, together with an insert
of a photo of an emulsion produced with EDGE-1.2. When using image analysis, we find
an average droplet size of 7.1 µm for EDGE-1.2, and 14.6 µm for EDGE-2.6 with a CV of
approximately 5 % for both EDGE systems; and these CV’s are very comparable to
values reported in literature, e.g. in the work of Kobayashi who also used image analysis.
When determined by Mastersizer, the volume weighted average for EDGE-1.2 is 7.20 µm
with a CV of ≈ 10 %; for EDGE-2.6, the size is 15.55 µm with a CV of ≈ 16 %. There
seems to be a systematic difference between both techniques and that may quite well be a
result of the limited number of droplets that necessarily can be analyzed by image
analysis. In spite of the different values, the produced emulsions have a narrow
distribution, especially when compared to emulsions made by homogenization.
To study the droplet formation process in more detail, sequential close-up images of a
single droplet were made. Figure 3 shows the typical shape of the interface during droplet
formation. One should keep in mind that we look straight from above and we can only see
one plane; the x-y plane. The droplet becomes visible in image b, and grows in time, until
the neck with which it is connected to the plateau breaks (image g), and the interface
retreats to fill the plateau again (image a).
Growth of the droplet results in a lower Laplace pressure in the droplet according to
Equation 1 with both radii of curvature equal to droplet radius Rd. The droplet in Figure 3
Figure 2. Size distribution of emulsions produced with EDGE-1.2 and EDGE-2.6, together with a micrograph of an emulsion produced with the 1.2 device.

Simultaneous formation of many droplets in a single microfluidic droplet formation unit
65
b-f is still connected to the plateau through a neck. Very close to the edge of the plateau, it
can be assumed that the local pressure in the neck will be approximately equal to the
Laplace pressure in the droplet. And this implies that Laplace pressure due to the two
curvatures of the neck has to be in accordance with that of the droplet. The curvatures can
be found on the plateau, one of them (x-z plane) is fixed at a value of half the height of the
plateau (Rp1). The curvature in the x-y plane (Rp2) can have different values and has to
become negative if the droplet radius (Rd) becomes twice as large as the fixed curvature
(Rp1) on the plateau, due to the decrease of the pressure in the growing droplet. We can
describe this balance with:
(2)
Figure 3. Droplet formation in an EDGE-2.6 device. In image a, the plateau is completely filled with oil, and in image b, the forming droplet becomes visible, in the subsequent
images the droplet grows and is connected through a neck to the plateau, until in image g the neck breaks and a droplet is released.
)()(
2
21tRRtR ppd
σσσ−= ; if Rd > 2 Rp1, Rp2 < 0

Emulsification with microstructures
66
In the close-up movies (Figure 3), we observed that the curvature in the x-y plane Rp2
indeed becomes more and more negative in time, which underpins the explanation of the
observed interfacial behavior. With the forced decrease in Rp2 a quasi-static neck near the
edge is created because the Laplace pressure in the droplet, and thus neck, does not
change very rapid anymore with the growth of the droplet. As long as the amount of oil
flowing into the droplet does not exceed the amount of oil flowing into the neck from the
surrounding area on the plateau, the droplet will remain attached otherwise the neck will
break.
This description also implies that the pressure dependency of the droplet size should not
be very strong, unless blow-up of the neck occurs. This is investigated experimentally for
both EDGE systems (Figure 4); Ddrop is in this case determined with image analysis
software (ImagePro Plus), and 100 droplets have been measured. To make comparison
between both systems easier, the dimensionless droplet diameter D, defined as the droplet
diameter Ddrop divided by the height Hp of the DFU, is plotted versus the dimensionless
applied pressure (the ratio of applied pressure and minimal pressure necessary to invade
the plateau). At low pressures, D seems constant (around 6 Hp); possibly, a very small
Figure 4. Dimensionless droplet diameter of emulsions produced with the EDGE-1.2 and EDGE-2.6 systems as a function
of the dimensionless applied pressure.
Simultaneous formation of many droplets in a single microfluidic droplet formation unit
67
increase could be noted, only when a certain pressure is exceeded the droplet size
increases very rapidly.
The main factor that determines the droplet diameter in the pressure independent range
(Figure 4) is the height of the plateau, (as mentioned, a scaling factor of 6 is found), and
further investigation is necessary to elucidate this factor in detail. Compared to scaling
factors reported for other microchannel systems, (2.5 – 4 times the smallest channel
dimension), the values here are higher.
The droplet size generated by EDGE is not very sensitive to pressure changes and that is a
big benefit compared to other micro technological emulsification devices. Further,
problems that are mentioned in literature for other systems, e.g. fabrication accuracy
(microchannels), flow conditions (any shear based technique), and pressure distributions
(up-scaled microsieves or microchannels) are unlikely to happen.
The large plateaus are not a serious challenge for the modern etching techniques. In
addition, each DFU can be considered as self-regulating; the droplet formation position
along the edge is not forced to be on a specific spot but can be anywhere and at many
places at the same time. Besides, we noted that operation of the plateaus was
straightforward; after pressurization, the plateaus fill with oil, and even if some disturbing
factor (e.g., a speck of dust) is present, which influences the flow pattern, the wide plateau
system fills regularly. Overall, the system is very stable, which is essential for any
practical application, and we expect EDGE to be a promising candidate for scale-up.
In addition to oil-in-water emulsions, the mechanism presented here is expected to be
suitable for double emulsions (water in oil in water), and for the production of foam. If
hydrophobic chips become available, it is also expected that W/O emulsions can be
produced.
In summary, we have shown a new microfluidic droplet formation unit which
simultaneously produces multiple micron-sized droplets with a narrow size distribution.
Interfacial tension is the driving force for the process and the observed behavior can be
described with basic physical laws. We believe that this EDGE-system is very suitable for
Emulsification with microstructures
68
scale-up, which could be of great significance for further development of mild
emulsification processes.
Acknowledgement We would like to thank Sophie Bartels and Abid Maan for performing the measurements.


Chapter 5 The mechanism of droplet formation
in microfluidic EDGE systems
Abstract
Edge based droplet generation (EDGE) emulsification, which produces multiple,
monodispersed droplets simultaneously at one droplet forming unit (introduced in the
previous chapter), is studied in more detail with high-speed imaging, computational fluid
dynamics and geometric modeling as research tools. Complete filling of the plateau,
essential for multiple droplet generation, is caused by the difference in pressure needed to
invade the plateau and the pressure necessary to start droplet formation. In addition, the
droplet formation unit has the highest hydrodynamic flow resistance in the system, which
ensures oil supply and promotes plateau filling. The locations at which droplets are
formed were found to be very evenly spaced with about 25 times the plateau height
between them. CFD simulations showed that there is a scaling relation with the viscosity
ratio, similar to that of microchannel systems. At high viscosity ratios, a minimal droplet
diameter is found, which is typically 5.5-6.5 times the plateau height and can be estimated
from geometric considerations only.
This chapter has been accepted for publication as: van Dijke, K.C.; de Ruiter, R.; Schroën, K.; Boom, R.M. The mechanism of droplet formation in microfluidic EDGE systems Soft Matter DOI: 10.1039/b916141d. Supplementary material online available at the journal’s home page.

Emulsification with microstructures
72
Introduction
Conventional emulsification equipment such as high-pressure homogenizers, colloid
mills, and mixers is energy inefficient (McClements, 1999) and produces emulsions with
considerable polydispersity in droplet size (Sugiura et al., 2002b). Novel emulsification
techniques that use membranes or microfluidic devices, hold a considerable advantage
over the classic techniques as they allow better control over droplet size and size
distribution, through lower shear stresses, and consequently higher energy efficiency.
However, these novel techniques are still in the initial stages of development, and more
understanding of these processes is needed before industrial application can become a
reality.
Microfluidic devices distinguish themselves from traditional membranes by their precisely
designed geometry of pores and channels, which makes them suitable for the production
of monodisperse droplets of small size. Microfluidic emulsification techniques reported in
literature may use shear-induced droplet formation, as is the case in T- and Y-junctions
(van der Graaf et al., 2005, Garstecki et al., 2006, De Menech et al., 2008, Tan et al.,
2006, Steegmans et al. 2009), co-flow and flow-focusing devices which rely on
extensional flow (Umbanhowar et al., 2000; Utada et al., 2007). Alternatively, the
droplets may be snapped off driven by the interfacial tension, which is also called
spontaneous droplet formation. This principle is exploited in microchannel emulsification
(Chapter 2 and 3, Kawakatsu et al., 1997; Sugiura et al., 2002a; Kobayashi et al., 2002a),
in which no shear is needed. All mentioned methods have in common that they are single-
drop technologies, in which the droplets are formed sequentially from one droplet
formation unit.
Recently, we introduced a new microfluidic droplet formation system: the Edge-based
Droplet GEneration (EDGE) device (see Chapter 4), in which multiple droplets are
produced simultaneously from one droplet formation unit (see also Figure 1). Droplet
formation occurs through a spontaneous mechanism, since no cross-flow is required for
droplet formation. Scaling-up of these systems is less complex compared to single-drop

The mechanism of droplet formation in microfluidic EDGE systems
73
and shear-based systems; Chapter 6 shows the suitability for scale-up of EDGE droplet
formation units as they are relatively insensitive to flow conditions, including pressure
distributions, and fabrication inaccuracy or fouling.
EDGE devices have been tested with food grade components; in the production of single
and double emulsions and foams. The systems were found to operate in a remarkably
stable way (Chapter 7). All these aspects make EDGE an interesting technique for larger-
scale application; that is, if the underlying mechanism can be better understood, and from
this, design rules derived.
As mentioned, droplet formation in EDGE systems is expected to be analogous to other
spontaneous droplet generation processes. However, there are also distinct differences
with e.g. microchannel emulsification. Typical behavior in EDGE is that droplet
formation takes place seemingly at random along the edge of a completely filled plateau.
Figure 1. Top-view of Edge-based Droplet Generation. Multiple droplets are formed simultaneously along the edge of a shallow and wide plateau. In the upper left
corner, a magnification of the characteristic curvatures during droplet formation is shown (see also Chapter 4).

Emulsification with microstructures
74
Comparable terrace or plateau structures are described in literature, but none of them
shows the droplet formation found in EDGE devices (Kawakatsu et al., 1997; Sugiura et
al., 2002c); here droplet formation takes place only at a fixed position, in the front centre
of the microchannels. For EDGE, the droplet size scales with the height of the droplet
formation unit as is the case for microchannel devices, but the proportionality factor in
EDGE is considerably larger compared to other systems from literature. In this work, we
study the EDGE process in more detail with experiments, computational fluid dynamics
and through geometric analysis to elucidate various aspects of the droplet formation
mechanism, with the ultimate aim to arrive at scaling relations.
Materials and Methods
Materials
Chemicals. In the experiments, n-hexadecane for synthesis from Merck KGaA
(Darmstadt, Germany), and air were used as the dispersed phase. As the continuous phase,
MilliQ ultrapure water with 1% (w/w) sodium dodecyl sulfate (SDS) from Sigma-Aldrich
(Saint Louis, MO) was used. Some properties can be found in Table 1, such as densityρ,
interfacial tension with water σwater, and equilibrium interfacial tension with SDS solution
σeq,SDS.
EDGE – chips. The microfluidics chips used in the experiments were produced by
Micronit Microfluidics BV (Enschede, The Netherlands), and the codes that are used
throughout the manuscript denote the height of their droplet formation unit, the plateau.
The microfluidic chip was a silicon plate (1.5 x 1.5 cm), into which the microchannels and
Dispersed phase ρ [kg m-3] η [mPa s] σwater [mN m-1] σeq,SDS [mN m-1]
air 1.2 0.018 72a 39a
hexadecane 773 3.34 44c 9.1b
a Nakahara et al., 2008, b Chapter 3, c van der Graaf et al., 2005.
Table 1. Some properties of the various phases used.
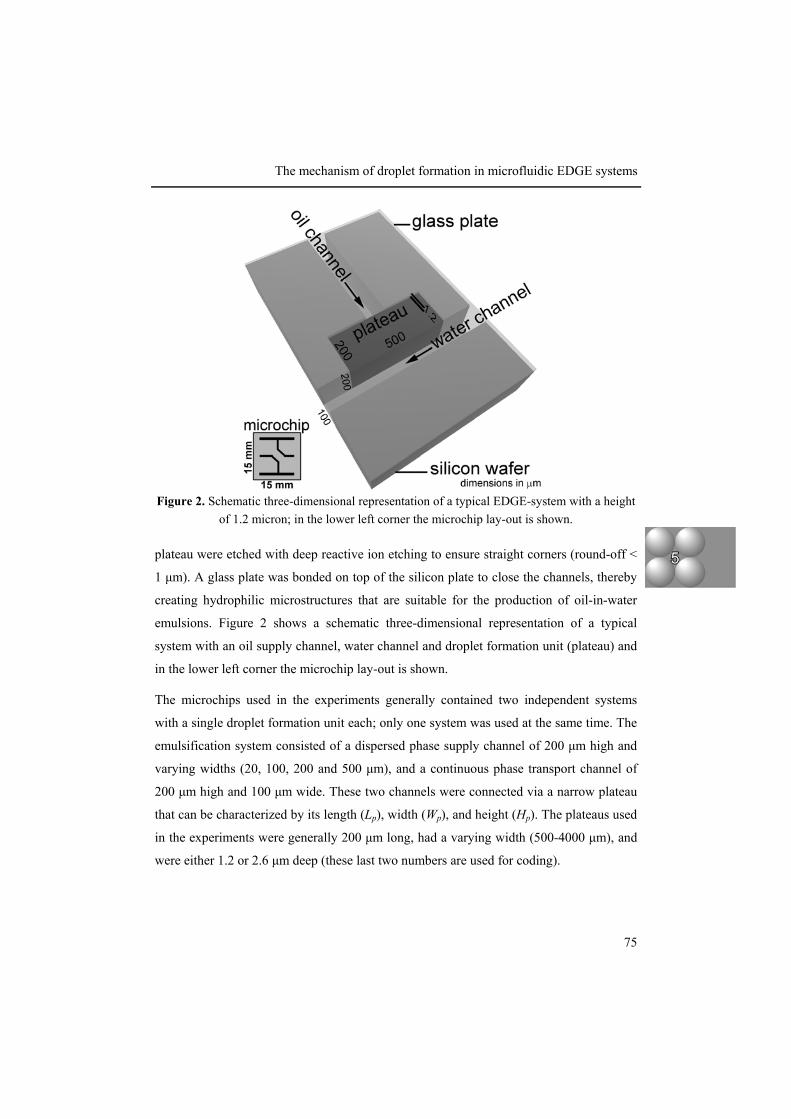
The mechanism of droplet formation in microfluidic EDGE systems
75
plateau were etched with deep reactive ion etching to ensure straight corners (round-off <
1 µm). A glass plate was bonded on top of the silicon plate to close the channels, thereby
creating hydrophilic microstructures that are suitable for the production of oil-in-water
emulsions. Figure 2 shows a schematic three-dimensional representation of a typical
system with an oil supply channel, water channel and droplet formation unit (plateau) and
in the lower left corner the microchip lay-out is shown.
The microchips used in the experiments generally contained two independent systems
with a single droplet formation unit each; only one system was used at the same time. The
emulsification system consisted of a dispersed phase supply channel of 200 µm high and
varying widths (20, 100, 200 and 500 µm), and a continuous phase transport channel of
200 µm high and 100 µm wide. These two channels were connected via a narrow plateau
that can be characterized by its length (Lp), width (Wp), and height (Hp). The plateaus used
in the experiments were generally 200 µm long, had a varying width (500-4000 µm), and
were either 1.2 or 2.6 µm deep (these last two numbers are used for coding).
Figure 2. Schematic three-dimensional representation of a typical EDGE-system with a height of 1.2 micron; in the lower left corner the microchip lay-out is shown.
Emulsification with microstructures
76
Peripherals. The droplet formation process was observed with a high-speed camera
(MotionPro HS-4, Redlake MASD Inc., San Diego, CA) system, connected to a
microscope (Axiovert 200 MAT, Carl Zeiss B.V., Sliedrecht, The Netherlands). The
camera was controlled with MotionPro Studio software (Redlake MASD Inc.). The
maximum magnification was 2500x (microscope: 10x, objective: 100x, and Optovar:
2.5x) and the maximum frame rate was 10,000 frames s-1. The combination of
magnification and frame rate is limited by the amount of light that reaches the high-speed
camera. During all experiments, the shutter speed was chosen such that the best
compromise between contrast and resolution of the images was obtained.
The continuous phase was guided into the continuous phase channel of the microstructure
through 0.030” PEEK tubing (Grace Davison Discovery Sciences, Deerfield, IL)
connected to a 10 mL Hamilton gastight Luer Lock syringe (Bonaduz, Switzerland). The
continuous phase was flow rate controlled by placing the syringe in a Harvard Apparatus
(Holliston, MA) PHD 2000 syringe pump; the continuous phase channel is thus wide that
no pressure build-up occurs. The dispersed phase was guided into the dispersed phase
channel of the microstructure through PEEK tubing connected to a pressurized vessel
(hexadecane) or gas cylinder (air). The connections were NanoTight fittings in
combination with quick connect female luer to female adapters, and Super Flangeless
Ferules, all from Upchurch Scientific (Oak Harbor, WA). A digital pressure controller
(Bronkhorst, Veenendaal, The Netherlands) was used to set and regulate the applied
pressure of the dispersed phase, and was controlled with FlowPlot V3.25 and FlowView 2
V1.15 software (Bronkhorst). Two separate pressure controllers for hexadecane and air
were used. The microchip was placed in a module designed by Micronit Microfluidics
BV, and placed on the microscope table. The microchip was illuminated (KL 2500 LCD,
Zeiss) via the objectives of the microscope, and the emulsification was observed with the
microscope video system. After the experiments, the microchips were cleaned with
ethanol and sonicated in ethanol for 90 minutes. After overnight drying in an oven at
550 °C, the chips were stored in MilliQ ultrapure water until further use.
The mechanism of droplet formation in microfluidic EDGE systems
77
Methods Various aspects of droplet formation are investigated in this paper with high speed
imaging, and Computational Fluid Dynamics simulation software to investigate the local
pressures in the EDGE systems during droplet formation, and to investigate other system
parameters systematically. A geometric analysis is used to elucidate the minimal droplet
diameter in relation to plateau height and contact angle.
High speed imaging and image analysis. With the previously described microchips and
equipment, high speed images were obtained during EDGE emulsification. The droplet
formation process at the edge of the plateau was characterized by image analysis with a
series of MATLAB routines. First, the analyzed movie was viewed frame by frame to
select 100 consecutive droplets. For every droplet, two frame numbers were stored; the
frame in which the neck was visible for the first time and the frame just before the droplet
detached. The latter frame was used to identify the position of droplet detachment, which
was stored together with its corresponding time.
CFD simulations. We modeled the EDGE system using a three-dimensional Volume-of-
Fluid method incorporated in CD-Adapco’s Star-CD (version 4.0). Details of this method
and validation for spontaneous droplet formation in microchannels are described in
Chapter 2. The grid was adapted to the system used in this study; a large shallow plateau
(width Wp = 96 µm, height Hp = 1 µm and length Lp = 100 µm) and a well. The total
number of cells was 195,000. At both sides of the plateau and well, a periodic boundary
was applied. A straight interface near the edge of the plateau was used as the starting
configuration in this case, without problems with abrupt initial changes near wall
boundaries, due to contact angle effects. This approach is efficient in computation time as
the timescales of flow over the plateau and droplet formation are very different.
At t = 0, the oil-water interface is flat at position x = 98 µm. We used a static inlet
pressure boundary on the DFU entrance, and a reference outlet pressure-boundary of 0 Pa
in the well. The inlet pressure was chosen to be just above breakthrough pressure which
was calculated with Laplace’s law:
Emulsification with microstructures
78
(1)
where one of the curvatures (R1) corresponds to the plateau height (Hp), and the other one
(R2) to the width of the plateau (Wp), which implies that this curvature is very large,
compared to R1 and can be neglected in the calculation of the minimum pressure. The
contact angle (θ ) was set at 10° to represent a hydrophilic surface. It was assumed that
there was no cross-flow of the continuous phase. Surfactant dynamics (i.e., time or
location dependent interfacial tension) were not taken into account in this method.
Geometric modeling. We start our geometric analysis with observations made through
high speed recording. During droplet formation a quasi-static neck exists close to the edge
of the plateau (see Figure 1 and Chapter 4). The geometric model presented here is based
on the assumption that the curvature of the interface at the plateau is the result of the
pressure drop generated by the growing droplet. In Figure 3a-d, the defined parameters are
indicated in cross sections in several planes. The dispersed phase, surrounded by the
continuous phase, has a contact angle θ with the silicon oxide walls, defined for the
dispersed phase and indicated in Figure 3a. As a result of this definition, –1 ≤ cos(θ) ≤ 0.
In Figure 3a, the solid curved line represents the droplet interface. Deviations from a
spherical shape are neglected, so the Laplace pressure in the droplet is described by only
one radius of curvature, the droplet radius Rd. In Figure 3b, the position of the interface at
half the height of the plateau (a circle with radius Rdp) is indicated by the dotted line, the
maximum size of the droplet (much deeper in the channel) is indicated with a solid line.
The cross-sections of the neck in the y-z plane are shown in Figures 3c and 3d.
The first radius of curvature of the interface at the edge of the plateau, Rp1, is determined
by the height of the plateau and the contact angle (see Figure 3c), and is positive and
constant in time:
(2)
θσ cos11
21min ⎟⎟
⎠
⎞⎜⎜⎝
⎛+=∆
RRP
)cos(21 θp
p
HR
−=

The mechanism of droplet formation in microfluidic EDGE systems
79
Figure 3. Geometric analysis of the droplet formation process in an EDGE-system. Cross-sections in several planes are depicted and parameters needed for the analysis are
defined; the actual analysis is described in the main text.

Emulsification with microstructures
80
The second radius of curvature of the interface at the edge of the plateau, Rp2, is defined in
Figure 3b. As shown in the following analysis, this second radius of curvature changes in
time and becomes (more) negative upon droplet growth.
The Laplace pressures in the droplet and at the edge of the plateau are assumed equal
during the droplet formation process, so:
(3)
As Rd increases during droplet growth and Rp1 remains constant, Rp2 changes in time to
satisfy Equation 3, and:
(4)
Equation 2 and 4 are combined to obtain an expression for Rp2 that only depends on Hp, θ,
and Rd
(5)
Please note that this relationship is assumed to be valid at the edge of the plateau only.
We assume that the neck can be defined by two circles with radius Rp2 in the x,y-plane at
half the EDGE plateau height, where the droplet has a radius of Rdp (see Figure 3b). The
center of the circles is chosen at the edge of the plateau, thereby satisfying the assumption
that the thinnest part of the neck – where ultimately detachment occurs – is at the plateau
edge as soon as Rp2 becomes negative. Further, we only consider the droplet formation
process from the moment the droplet size satisfies Equation 6, as the growing droplet is
assumed to be non-spherical at smaller radius (see also Equation 17):
21
2
ppd RRRσσσ
+=
dp
dpp RR
RRR
−=
1
12 2
))cos((22 θdp
dpp RH
RHR
+=

The mechanism of droplet formation in microfluidic EDGE systems
81
(6)
As shown in Figure 3a, the radius of the cross-section of the droplet at half the plateau
height Rdp is given by:
(7)
(Rd – h) is the principal radius of curvature of the droplet minus the height of the spherical
cap:
(8)
Combining Equation 7 and 8 yields an expression for Rdp that only depends on Hp, θ, and
Rd.
(9)
The coordinates of the centers of the two circles defining the neck (Mx,p2, My,p2), as well as
the coordinates of the circle of the cross-section in the growing droplet (Qx,dp, Qy,dp; see
Figure 3b), both at half the plateau height can be described as:
(10)
(11)
and
)21cos()cos( πθθ ++
−> p
d
HR
22 )2
)(( pdddp
HhRRR −−−=
))cos(θdd RhR −=−
22 )2
)cos(( pdddp
HRRR +−= θ
02, =pxM
2222, ))cos(()( θddpppy RRRM −−±=
Emulsification with microstructures
82
(12)
(13)
The neck diameter is equal to the distance between the two circles along the edge that
define the neck:
(14)
(15)
In Equation 15, for Rp2 < 0, we had to take the sign of Rp2 into account, as the value is
negative. The neck contracts during droplet growth, until the critical neck diameter, dn,crit,
is reached, see Figure 3d. Further contraction of the neck results in a continuing and fast
increase of the local Laplace pressure – as Rp1 start to decrease –, leading to rapid collapse
of the neck. This detachment criterion is adapted from Van der Zwan et al. (2009b) to
include the contact angle θ. The theoretical critical neck diameter varies from zero at θ =
π/2 to Hp at θ = π:
(16)
The neck diameter with increasing droplet diameter is calculated by a MATLAB routine.
As soon as Equation 16 is fulfilled, i.e. the critical neck diameter is reached, the
corresponding droplet diameter Rd is defined to be the diameter of the minimal generated
droplet of an EDGE system with height Hp and contact angle θ.
)cos(, θddpx RQ −=
0, =dpyQ
)(2 2,2 pypn MRd −= 02 >pR
)(2 22, ppyn RMd −= 02 <pR
( ), 1
tan( ) 12 2 tan( )2cos( ) 2 cos( )
p pn crit p p
H Hd R a H
θθ
θ θ− −⎛ ⎞ ⎛ ⎞
= − = − = −⎜ ⎟ ⎜ ⎟⎝ ⎠⎝ ⎠
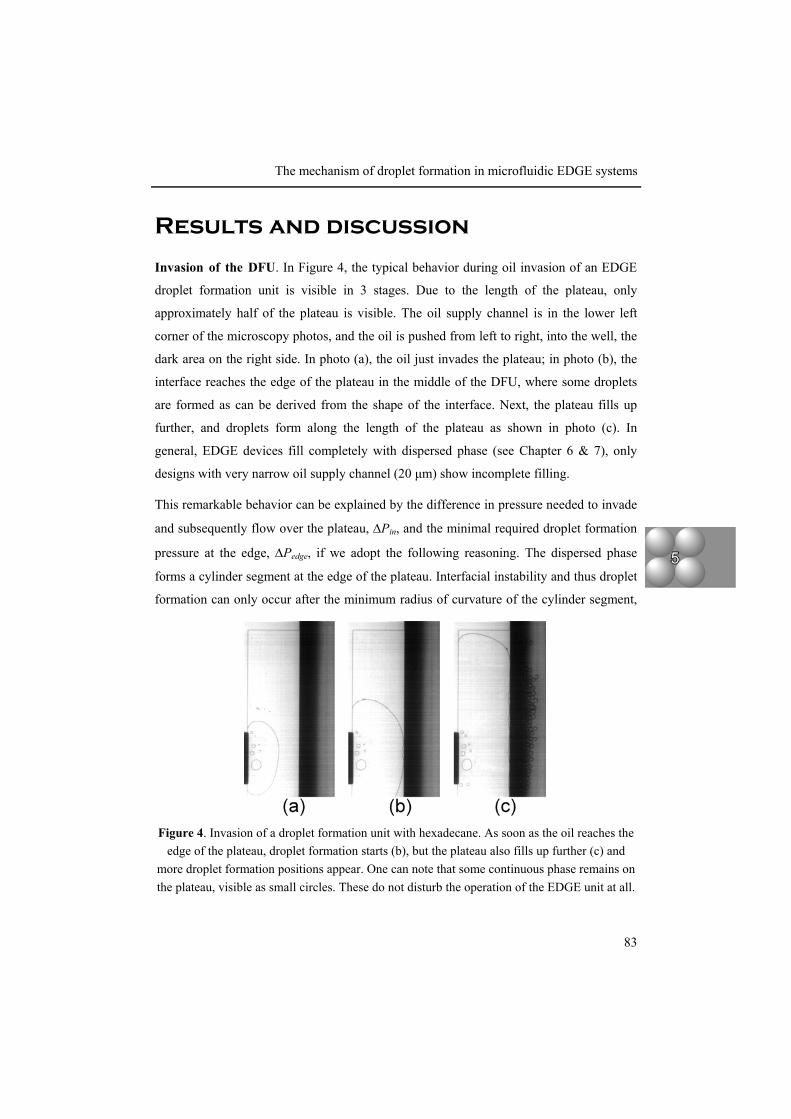
The mechanism of droplet formation in microfluidic EDGE systems
83
Results and discussion
Invasion of the DFU. In Figure 4, the typical behavior during oil invasion of an EDGE
droplet formation unit is visible in 3 stages. Due to the length of the plateau, only
approximately half of the plateau is visible. The oil supply channel is in the lower left
corner of the microscopy photos, and the oil is pushed from left to right, into the well, the
dark area on the right side. In photo (a), the oil just invades the plateau; in photo (b), the
interface reaches the edge of the plateau in the middle of the DFU, where some droplets
are formed as can be derived from the shape of the interface. Next, the plateau fills up
further, and droplets form along the length of the plateau as shown in photo (c). In
general, EDGE devices fill completely with dispersed phase (see Chapter 6 & 7), only
designs with very narrow oil supply channel (20 µm) show incomplete filling.
This remarkable behavior can be explained by the difference in pressure needed to invade
and subsequently flow over the plateau, ∆Pin, and the minimal required droplet formation
pressure at the edge, ∆Pedge, if we adopt the following reasoning. The dispersed phase
forms a cylinder segment at the edge of the plateau. Interfacial instability and thus droplet
formation can only occur after the minimum radius of curvature of the cylinder segment,
Figure 4. Invasion of a droplet formation unit with hexadecane. As soon as the oil reaches the edge of the plateau, droplet formation starts (b), but the plateau also fills up further (c) and
more droplet formation positions appear. One can note that some continuous phase remains on the plateau, visible as small circles. These do not disturb the operation of the EDGE unit at all.

Emulsification with microstructures
84
and therewith the highest pressure ∆Pedge, is reached. The radius of curvature in a grooved
system, i.e. with a glass cover plate and a well, can be defined by:
(17)
if θ is the contact angle with the disperse phase with the glass plate and φ is the contact
angle of the dispersed phase with the substrate relative to the plateau, and Hp the height of
the plateau. The contact angle of the dispersed phase on the plateau with the glass plate is
assumed constant during droplet formation. For the corner φ between the substrate and oil
interface holds φ = θ at the plateau and φ = π at the edge of the plateau, when the critical
pressure is reached. According to Laplace’s law, the pressure is:
(18)
with σ the interfacial tension. Only the small curvature caused by the plateau height is
essential here, as the one determined by the width is very large. In Figure 5, dimensionless
ϕθ coscos +−= pH
R
pHP )cos(cos θϕσ +
−=∆
Figure 5. Dimensionless invasion (∆P*in) and edge (∆P*
edge) pressures as function of the contact angle.
The mechanism of droplet formation in microfluidic EDGE systems
85
∆P*in (with φ = θ) and ∆P*
edge (with φ = π) values are plotted as function of the contact
angle (∆P made dimensionless by multiplication with Hp/σ). The differences between the
two pressures are large at small contact angle θ, which implies that the pressure needed to
start droplet generation is significantly higher than the pressure needed for the to-be-
dispersed phase to fill the plateau if surface properties are in that range, resulting in
complete filling. The difference in pressure becomes smaller as the contact angle θ gets
larger, and it reaches zero at θ = π. This implies that with a system with θ = π, or
complete wetting by the continuous phase, the dispersed phase will not spread over the
plateau if the oil supply is more narrow compared to the plateau, and efficient use of the
available EDGE length is unlikely to happen.
In several other studies known from literature, a wide terrace was used, but no complete
filling was observed (Kawakatsu et al., 1997; Sugiura et al., 2002c, chapter 3). This is
expected to be caused by the difference in design of the microdevices. In EDGE, we do
not use a narrow supply channel, and the invasion pressure is determined by the plateau
only. In e.g. microchannels, the narrow supply channel requires a high pressure to push
the oil onto the terrace, and if this pressure exceeds ∆Pedge, the to-be-dispersed phase will
not fill the terraces completely. Furthermore, the highest flow resistance in these systems
is in the microchannels, while in EDGE systems, it is the plateau that has the highest
hydrodynamic resistance in the whole system. Therefore, in the EDGE system, the
dispersed phase will spread over the plateau, and droplet generation will occur along the
length of the system.
Location of droplet formation. The typical locations at which droplet detachment took
place are shown in Figure 6, with –1 being the lower end, and 1 being the upper end of the
plateau. The time at which the first droplet detached was defined as t = 0 s. Figure 6
shows an example of a result for constant applied pressure. Each marker indicates the
detachment position and detachment time of one analyzed droplet. The acquired droplet
detachment positions, and the times at which the droplets started to form and finally
detached, were subsequently used to calculate the mean distance, δdrop, between two
neighboring locations for droplet detachment and droplet formation frequencies. As

Emulsification with microstructures
86
observed in Figure 6, the droplets detached rather evenly spaced although positions
shifted temporarily, which is an indication that the locations of droplet formation are not
determined by local defects in the system geometry.
In Figure 7, the average droplet formation locations are shown as a function of applied
pressure. Droplet formation starts as soon as the front of the interface reaches the edge of
the droplet formation unit, which is at relatively low pressure. By increasing the pressure,
the oil spreads further over the plateau, and the EDGE length available for droplet
formation becomes longer resulting in more droplet formation locations (see ∆Papplied =
143 mbar). Increasing the pressure after the plateau has been completely filled results first
in an increased droplet formation frequency (∆Papplied = 154 mbar). An extra droplet
formation location occurs if pressure is increased further, and all the other locations adapt
to this, resulting in a decrease in droplet formation distance (δdrop) and a shift in
positions, however, the droplets are no longer monodisperse at ∆Papplied = 220 mbar.
The distance between formation positions for an EDGE-2.6 system in the monodisperse
Figure 6. Droplet formation positions in a completely filled EDGE-2.6 plateau producing equally sized droplets. The locations are spaced regularly with sometimes a
clear deviation from the formation position.
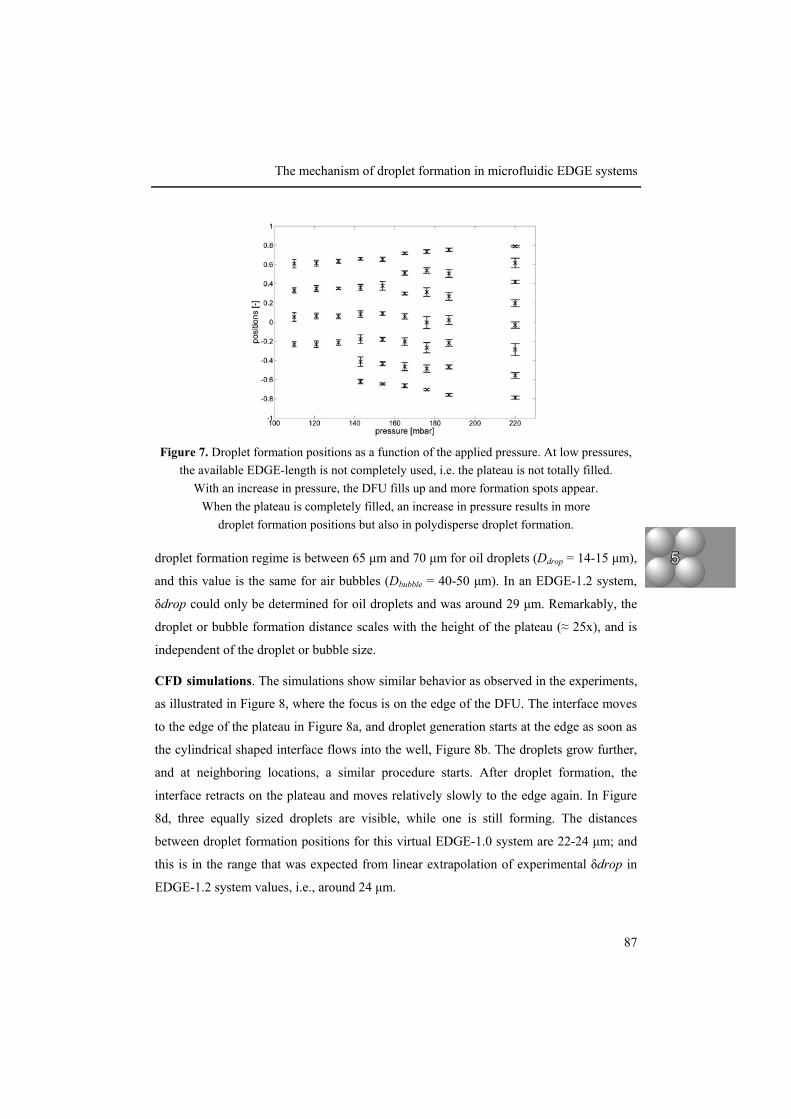
The mechanism of droplet formation in microfluidic EDGE systems
87
droplet formation regime is between 65 µm and 70 µm for oil droplets (Ddrop = 14-15 µm),
and this value is the same for air bubbles (Dbubble = 40-50 µm). In an EDGE-1.2 system,
δdrop could only be determined for oil droplets and was around 29 µm. Remarkably, the
droplet or bubble formation distance scales with the height of the plateau (≈ 25x), and is
independent of the droplet or bubble size.
CFD simulations. The simulations show similar behavior as observed in the experiments,
as illustrated in Figure 8, where the focus is on the edge of the DFU. The interface moves
to the edge of the plateau in Figure 8a, and droplet generation starts at the edge as soon as
the cylindrical shaped interface flows into the well, Figure 8b. The droplets grow further,
and at neighboring locations, a similar procedure starts. After droplet formation, the
interface retracts on the plateau and moves relatively slowly to the edge again. In Figure
8d, three equally sized droplets are visible, while one is still forming. The distances
between droplet formation positions for this virtual EDGE-1.0 system are 22-24 µm; and
this is in the range that was expected from linear extrapolation of experimental δdrop in
EDGE-1.2 system values, i.e., around 24 µm.
Figure 7. Droplet formation positions as a function of the applied pressure. At low pressures, the available EDGE-length is not completely used, i.e. the plateau is not totally filled.
With an increase in pressure, the DFU fills up and more formation spots appear. When the plateau is completely filled, an increase in pressure results in more
droplet formation positions but also in polydisperse droplet formation.

Emulsification with microstructures
88
Pressure field during droplet generation. The pressure fields on part of the plateau were
extracted from the CFD data and are shown in Figure 9. Far away from the edge, a
gradual and parallel pressure drop is present. In the proximity of the forming droplets,
relatively steep pressure gradients in radial direction are observed. This typical pressure
distribution can explain the robustness of the system to some extent; pressure fluctuations
only act locally, near the edge, but do not disturb the flow over the plateau. Vice versa, a
change in the overall (modest) pressure distribution over the terrace (e.g. by a speck of
Figure 8. Four stages of droplet formation in an EDGE system, extracted from a typical simulation result. Generated droplets stay in front of the plateau as no cross-flowing
continuous phase is present.

The mechanism of droplet formation in microfluidic EDGE systems
89
dust) will not influence the much steeper local pressure gradients near a forming droplet.
Given the pressure profile, it is unlikely that droplet formation is linked along the whole
width of the DFU. Although it can not be excluded that droplet formation is delayed until
a neighboring droplet is formed, we did observe simultaneous droplet formation at two
neighboring locations, and this would point to autonomous behavior (i.e. droplet
formation independent of any neighboring location).
Viscosity ratio. In Chapter 3, in a study on spontaneous droplet formation in
microchannels, we found both experimentally and computationally, that the ratio of the
viscosities of the dispersed and continuous phases has a pronounced effect on the droplet
size. It was found that there is a range of viscosity ratios (disperse / continuous) in which
the droplet size is not affected, while at low viscosity ratios the droplet size increases.
Figure 9. Pressure gradients during droplet formation in an EDGE system. In (a), the plateau is filled with liquid and the pressure gradient is flat, across the entire plateau, except for the front of the liquid (Laplace pressure). Once the liquid reaches the end of the plateau (b), the liquid starts forming droplets at some locations. At these positions, the pressure gradients become
steeper, and become more pronounced when the droplets become bigger (c). When the droplets detach, the interface retreats on the plateau, after which the oil supply
pushes the interface towards the EDGE again.
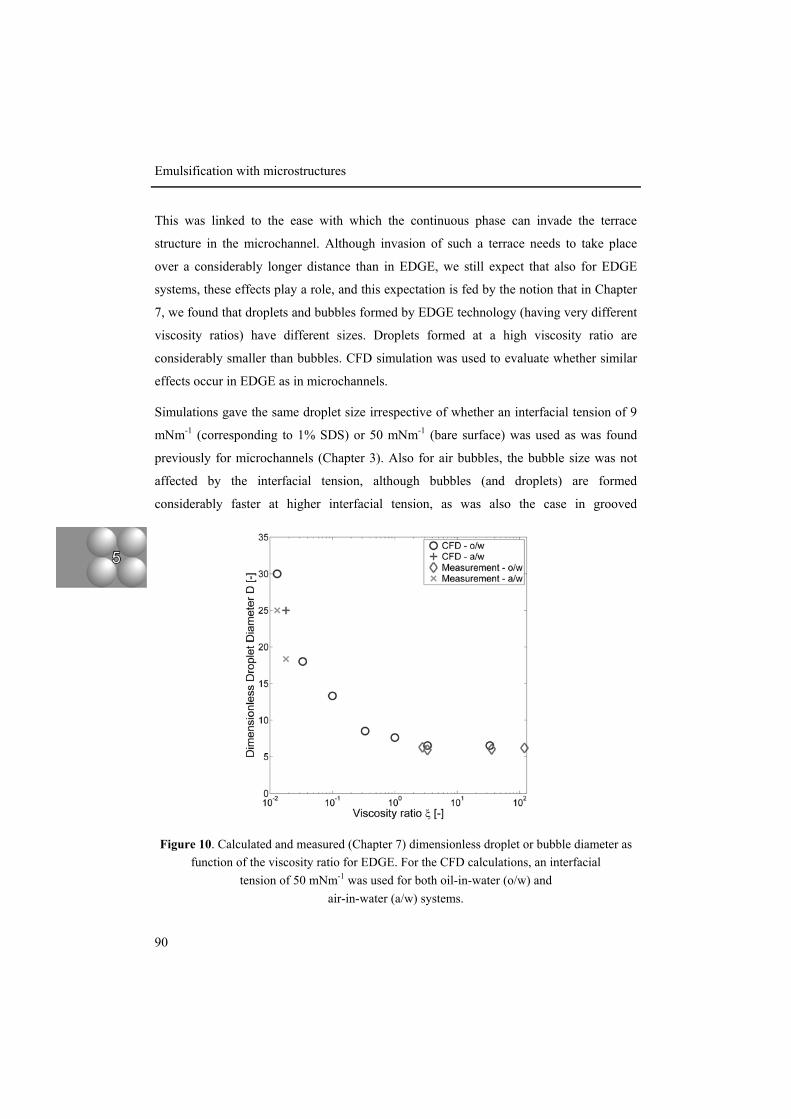
Emulsification with microstructures
90
This was linked to the ease with which the continuous phase can invade the terrace
structure in the microchannel. Although invasion of such a terrace needs to take place
over a considerably longer distance than in EDGE, we still expect that also for EDGE
systems, these effects play a role, and this expectation is fed by the notion that in Chapter
7, we found that droplets and bubbles formed by EDGE technology (having very different
viscosity ratios) have different sizes. Droplets formed at a high viscosity ratio are
considerably smaller than bubbles. CFD simulation was used to evaluate whether similar
effects occur in EDGE as in microchannels.
Simulations gave the same droplet size irrespective of whether an interfacial tension of 9
mNm-1 (corresponding to 1% SDS) or 50 mNm-1 (bare surface) was used as was found
previously for microchannels (Chapter 3). Also for air bubbles, the bubble size was not
affected by the interfacial tension, although bubbles (and droplets) are formed
considerably faster at higher interfacial tension, as was also the case in grooved
Figure 10. Calculated and measured (Chapter 7) dimensionless droplet or bubble diameter as function of the viscosity ratio for EDGE. For the CFD calculations, an interfacial
tension of 50 mNm-1 was used for both oil-in-water (o/w) and air-in-water (a/w) systems.

The mechanism of droplet formation in microfluidic EDGE systems
91
microchannel systems. The size of the bubbles was considerably bigger than of the
droplets, and this may well be caused by the difference in viscosity ratio, which is
discussed further in the next section. In Figure 10, the droplet and bubble diameter
calculated by CFD simulation is shown for various viscosity ratios, together with
experimental data.
The calculated droplet sizes are found in good agreement with the measurements. As
could be expected, for bubble size, some difference is noted, but this is reasonable given
the experimental challenges that did not allow close-up observation of the bubble size. A
similar effect of the viscosity ratio on droplet size is found as for grooved microchannels;
at high ratios, the droplet size is constant, and we can define this size as the minimal
droplet diameter for EDGE. Its value scales with the height of the plateau: we
systematically found a factor 5.5-6.5 between droplet size and plateau height. At lower
ratios, the droplet or bubble size increases, and this is in accordance with the larger
bubbles found at ξ = 0.018 (air-water viscosity ratio).
Interesting is further that there is no indication of a critical minimum viscosity ratio for
EDGE, as was found in chapter 3 with oil-in-water systems in grooved microchannels. At
smaller viscosity ratios, these systems have no monodisperse droplet regime, but
immediately show blow-up with increasing pressure, directly after becoming active. This
behavior is not observed for EDGE.
In the next section, we focus on the minimal droplet diameter, through geometric analysis,
which also allows us to investigate contact angle effects.
Minimal droplet volume model at high viscosity ratio. Through the geometric analysis
described in the materials and methods section, we investigated the droplet formation
process. The diameter of the droplet is determined as function of the contact angle for Hp
= 2.6 µm, and Hp = 1.2 µm (see Figure 11a), and it was found that the droplet size
decreases with increasing contact angle.
The horizontal lines in Figure 11a indicate the experimentally determined droplet sizes (it
was not possible to reliably obtain direct experimental values for the contact angle).

Emulsification with microstructures
92
Assuming that this diameter is equal to the principal diameter of curvature just before
detachment, the contact angle during droplet formation can be estimated from Figure 11.
For both microstructures, EDGE-1.2 and EDGE-2.6 microstructures, a contact angle of
about 155° is obtained for hexadecane droplets, which is in line with earlier experimental
results with the same materials (van der Graaf et al., 2006). The relationship between Rd
and θ also implies that the radius of the droplets will be lower in very hydrophilic
microdevices, which may be within reach through surface modification. However, we
earlier concluded that with very hydrophilic systems, the complete filling of the plateaus
is more critical (see Figure 5), especially if the oil supply to the plateau is narrow,
therefore a good balance between both effects needs to be established.
In Figure 11b, the droplet diameter was made dimensionless by dividing the droplet size
by the plateau height. As the data for the different EDGE microstructures then collapse
into a single master curve, the diameter of the generated droplets is linearly dependent on
Figure 11 (a) The predicted diameter of the obtained droplet as function of the contact angle for (circle) Hp = 2.6 µm, (cross) Hp = 1.2 µm. The straight lines represent the experimentally obtained values for the hexadecane droplets (14.6 µm and 7.1 µm, for EDGE-2.6, EDGE-1.2
microstructures, respectively). (b) The data collapse if the diameter of the obtained droplet is divided by the height of the plateau. The gray area defines the minimal
droplet sizes found for all EDGE systems.

The mechanism of droplet formation in microfluidic EDGE systems
93
the plateau height. This dependency was also observed during the experiments, and
provides a relatively easy way to control the size of the generated droplets. Because
process dynamics such as slow invasion of the plateau by the continuous phase at low
viscosity ratio, are not covered, the geometric analysis is only valid at high viscosity ratio
when EDGE is operated in the monodisperse droplet formation regime. In that case, the
outcome of the geometric analysis indicates the best case scenario; i.e. the smallest
possible droplet.
Typically, the ratios between plateau height and droplet size are 5.5 – 6.5 for EDGE,
where for terrace-based or straight-through microchannel emulsification, these values are
2.5-4 (Sugiura et al., 2002a, Kobayashi et al., 2004). As described in Chapter 2, the
droplet size in terrace-based microchannels in the monodisperse droplet generation regime
is determined by the volume that is present on the terrace structure. In EDGE-systems,
only a minimal amount of dispersed phase flows into the well during droplet formation,
therewith making the system intrinsically more stable, and tunable.
Conclusion
In this paper we studied the fluid dynamics in an EDGE system in detail. The results of
this research are summarized here:
• The even filling of the wide and shallow plateaus, allowing multiple droplet
formation, can be explained through the difference in invasion and minimal droplet
formation pressure at the edge. The highest hydrodynamic resistance of the system
is located in the droplet formation unit which ensures a steady oil supply to the
plateau, which was confirmed by CFD.
• Both experiments and CFD simulations show that the droplet formation locations
are quite regular and organized. The distance between droplet formation spots is
determined by the height of the plateau and the applied pressure, but is independent
of the droplet or bubble size in the monodisperse droplet generation regime.
Emulsification with microstructures
94
• The droplet size is primarily determined by the plateau height, and further a scaling
relation with the viscosity ratio was found. The droplet size is constant at high
viscosity ratios, which can be described with an analytical model, while at lower
ratios an increase in droplet (or bubble size) is observed.
The here presented mechanistic considerations of the EDGE emulsification process seem
to us a sound basis for the next steps toward larger scale implementation of this process.
Acknowledgement The authors thank Albert van der Padt for useful suggestions and Pieter Kroon for
technical assistance with the simulations.


Chapter 6 Parallelized Edge-based Droplet
Generation Devices
Abstract
We here report on three parallelized designs of the new Edge-based Droplet GEneration
mechanism, which, unlike existing mechanisms, produces many equally sized droplets
simultaneously at a single droplet formation unit. Operation of the scaled-out systems is
straight forward; only the oil inlet pressure has to be controlled to let all the units produce
oil droplets, given certain basic design constraints. For systems with a typical nozzle
depth of 1.2 µm, the mean droplet diameter is 7.5 µm and the coefficient of variation is
below 10%. The number of droplets that is formed per unit can easily be increased by
increasing the length of the unit. The stable pressure range in which monodisperse
droplets are formed can be extended by small adjustments to the design. Overall, the
EDGE devices are simple in design and robust in use, making them suitable for massive
outscaling.
This chapter has been published as: van Dijke, K.C.; Veldhuis, G.; Schroën, K.; Boom, R.M. Parallelized Edge-based Droplet Generation Devices Lab Chip 2009 9, 2824 - 2830. Supplementary material is available on the journal’s website.

Emulsification with microstructures
98
Introduction
For numerous complex fluids used in food, pharmaceutics, and cosmetics, a simple and
mostly single emulsion is used as the basic structure. These emulsions, in which one
phase is dispersed as droplets in the other phase, are normally produced by methods which
use brute forces to disrupt larger droplets into smaller ones, and as a result also heat up the
product leading to thermal damage (Walstra, 2003). Because of this, there are severe
limitations to the process conditions that can be used in the production of emulsions, and
therewith in the products that can be realized. In addition, in spite of the large amount of
energy used, the produced emulsions have a broad droplet size distribution with a typical
coefficient of variation (CV) of around 40 % (Saito et al., 2006). In recent years, several
alternative techniques were proposed based on micro-engineered devices which are
known to be more energy efficient and allow better control over the droplet size. In Figure
1, examples of such microsystems are shown. For all of them it is claimed that they
produce monodisperse emulsions (CV < 10%) at relatively low energy consumption.
The basis for droplet formation in these systems can be diverse. In T- and Y-junctions,
droplet formation is induced by the shear forces exerted by the cross flowing continuous
phase. In flow-focusing both liquids flow in the same direction, but the continuous phase
does so at much higher speed, therewith inducing droplet formation. In all shear driven
systems, the flow of the continuous and to-be-dispersed phase have to be controlled
precisely to obtain monodisperse emulsions, and in parallelized systems, this may turn out
to be an extra challenge.
In microchannels, spontaneous droplet formation is a result of interfacial area
minimization, and contrary to shear-based systems, the droplet size is only dependent on
the geometry of the microchannel, as long as the oil phase flow rate is kept within a
certain range. Therewith, these systems promise simpler operation than shear-based
systems (also concerning scale-up which will be discussed later).
In all aforementioned systems, droplets are formed sequentially from one droplet
formation unit (DFU). The productivity of a single microfluidic droplet generator is

Parallelized Edge-based Droplet Generation Devices
99
therefore rather low and up-scaling (or out-scaling) is important. In theory, massive
parallelization of the units is possible, and therewith, higher throughputs should be within
reach. Unfortunately, parallelization is not straightforward. Ideally, all units should be
operated at the same conditions, but this is hard to realize. Flow control and fabrication
complexity are the main difficulties here. Shear-based systems with parallelized units
have been reported by Li et al. (2008), Barbier et al. (2006), Hashimoto et al. (2008) and
Nisisako and Torii (2008). Li et al. (2008) report the use of a quadra-droplet generator
Figure 1. Several examples of microfluidic devices which all are able to produce monodis-perse droplets: (a) T-junction (van der Graaf et al., 2005) (b) Flow-focusing (Anna et al.,
2003) (c) Co-flowing system (Umbanhowar et al., 2000) (d) Y-junction (Kawai et al., 2002) (e) Microchannels (Sugiura et al., 2000) (f) Microcapillary device (Utada et al., 2007)
(g) Straight-through microchannels (Kobayashi et al., 2002a) (h) Parallelized cross-flow junctions (Nisisako and Torii, 2008).

Emulsification with microstructures
100
(QDG), which comprises of four parallel microfluidic flow-focusing devices. They report
a slight increase in polydispersity of the droplets due to a weak coupling between the
parallel units. Still, a monodisperse emulsion with mean droplet diameter of 100-200 µm
can be produced, with sizes strongly depending on flow-rate ratios. Barbier et al. (2006)
have studied two T-junctions in parallel and found complex dynamic behavior. Only in
the synchronization regime, a well-defined monodisperse emulsion is formed. Hashimoto
and co-workers (2008) found little variation in formation of droplets in coupled flow-
focusing generators. In contrast, bubble formation showed a variety of complex dynamics.
The authors concluded that the difference in dynamics originated from the compressibility
of the dispersed fluids. Nisisako and Torii (2008) designed a complex large-scale
parallelized droplet generator with 16-256 shear-based DFU’s and produced droplets of
around 100 µm (Figure 1h); the droplets were very monodisperse with a coefficient of
variation of around 1%.
For all the parallelized systems mentioned here, the microchannel geometry and droplet
sizes are relatively large, and control over the liquid flows is therefore relatively easy
given the size of the channels (i.e. the Laplace pressure is low compared to the applied
pressure), albeit far from straightforward as indicated earlier. For most practical
applications of emulsions, the droplets need to be considerably smaller, and given the
underlying mechanisms, this implies that the channels need to become smaller, flow
control needs to be more accurate, and consequently, will have more influence on the
emulsification efficiency. For spontaneous droplet formation, this was nicely illustrated in
the work of Kobayashi et al. (2002a) with straight-through microchannels. For this
technology, only the to-be-dispersed phase flow has to be controlled; the single purpose of
the continuous phase is to move the droplets downstream. When producing monodisperse
soybean oil droplets of around 30 µm with straight-through microchannels (Figure 1g) at
an oil flow rate of several tens of milliliters per hour, the results looked very promising
(Kobayashi et al., 2005c). However, when downsized straight-through microchannels
were used to produce droplets below 10 micron, the maximum oil flow was only 50 µl per
hour (Kobayashi et al., 2008). The bottleneck in the downsized systems seems to be the
very low percentage of active channels. For the smallest straight-through microchannels
Parallelized Edge-based Droplet Generation Devices
101
presented by Kobayashi and coworkers, the droplets had an average droplet diameter of
4.4 µm, but the percentage of active channels was below 1 %. This means that 1% of
92,575 channels produced monodisperse droplets just before the first blow-up (generation
of anomalously large droplets) occurs somewhere in the system, and the system becomes
unstable. For slightly larger channels producing droplets of 6.7 µm, this percentage was
5.2%. The percentage increased further, and for the largest fabricated channels (which
produce droplets of 9.8 µm), a value of 12.3% was found.
The low percentage of active channels is probably caused by pressure gradients just below
the straight-through plate as was reported by Gijsbertsen-Abrahamse et al. (2004) for
microsieve systems and by Van Dijke et al. (2009) for terrace-based microchannels.
These pressure gradients only allow a pore to become active if it is at a certain distance
from a pore that forms droplets. Besides, narrow straight-through channels are difficult to
fabricate due to the aspect ratio between etching depth and channel depth, which is as high
as the state of the art production techniques allow. If fabrication inaccuracies occur, this is
immediately reflected in the monodispersity of the emulsion, and in the number of active
channels.
The percentage of active channels is not an issue in droplet formation with a submicron-
channel array (Kobayashi et al., 2007). However, there are some points that have to be
taken into account when considering this system for scale-up. The terraces in the array
need to be very shallow, and silicon seems to be the only material that allows this shallow
etching. An interesting material from a practical point of view is stainless steel, but this
material cannot be fabricated precisely below a 10-µm scale (Tong et al., 2001). Further,
packing of arrays to form a bigger unit for up-scaled processes may turn out to be a big
challenge, therefore, straight through microchannels seem to be a more obvious choice for
up-scaling, in spite of the low number of active channels.
It is thus obvious that there is a challenge in the design of systems which produce droplets
below 10 micrometer, with all droplet forming units working, given the current technical
options. In a previous chapter we proposed Edge-based Droplet Generation (EDGE)
where simultaneous formation of many oil droplets in a single DFU occurs. Unlike the

Emulsification with microstructures
102
system presented by Tan and Lee (2005) where parent and satellite droplets are formed
simultaneously, which need to be separated in order to obtain monodisperse emulsions,
with EDGE technology equally sized droplets are formed, which makes EDGE less
elaborate. The DFU consists here of a shallow, very wide slit through which the to-be-
dispersed phase flows (see Figure 2). The dispersed phase forms a string of droplets
simultaneously at the exit of the slit. Multiple equally sized droplets per DFU have the
advantage that less DFU’s are needed, and control over the oil phase is expected to be less
cumbersome than in single droplet DFU’s. Besides, the design of the units is rather
simple, and does not challenge the current state-of-the-art etching technology that is used
to produce them. In principle, the EDGE units can even be fabricated without etching
complex structures in the substrate. For example, we tested a prototype that consisted of
stacked glass plates with adequate spacers, and with this unit, we could demonstrate the
EDGE emulsification mechanism. Next to that, the units themselves are self-regulating
because the droplet formation position is not forced to a specific position but can take
place anywhere along the edge simultaneously.
Figure 2. Three-dimensional drawing of a single EDGE-unit, which is etched in a silicon wa-fer together with the oil supply channel and the water phase or emulsion channel.
The dimensions are not to scale, but underline the depth differences.

Parallelized Edge-based Droplet Generation Devices
103
Whether these positive points are an advantage in parallel EDGE systems is investigated
in this Chapter. We study the ‘upscalability’ of the EDGE-system, and investigate the
percentage of active DFU’s through high speed imaging. The droplet sizes are related to
the performance of a single unit, as described in Chapter 4 and 5. In the discussion,
scalability of EDGE technology amongst others is compared to that of other
microtechnological emulsification systems.
Experimental
Microchip designs. The microchips were produced with a Deep Reactive Ion Etching
(DRIE) technique in a silicon wafer (Micronit Microfluidics, The Netherlands). The chips
were closed by a glass plate on top. The silicon and glass surfaces were hydrophilized by
oxidation, which makes them suitable for oil-in-water emulsification. From the contact
angles that were observed during experimentation, it was obvious that the microchips
were hydrophilic, and remained hydrophilic, therefore, no further surface treatment was
necessary.
In this work, we studied the behavior of three different structures with similar depth of 1.2
µm (see Table 1). The first basic structure is a rectangular plateau, which will be further
referred to as EDGE-R. In EDGE-R we have 196 DFU’s with dimensions 200 x 500 x 1.2
µm (length x width x depth; see Figure 2) with 200 µm of bonding area between two
plateaus. This structure is a parallelized version of the single DFU systems presented in
Chapter 4 of this thesis. The second basic structure is a plateau between two channels
without any bonding area, which gives a very wide plateau. The dimensions of the DFU in
these EDGE-W devices are 200 x 9500 x 1.2 µm. This plateau was designed to maximize
droplet formation length and thus increase productivity. The third basic structure has the
DFU designs depth [µm] length [µm] width [µm] Number of plateaus
EDGE-R 1.2 200 500 196
EDGE-W 1.2 200 9500 14
EDGE-T 1.2 200 200 → 1200 112
Table 1. Dimensions of EDGE systems.
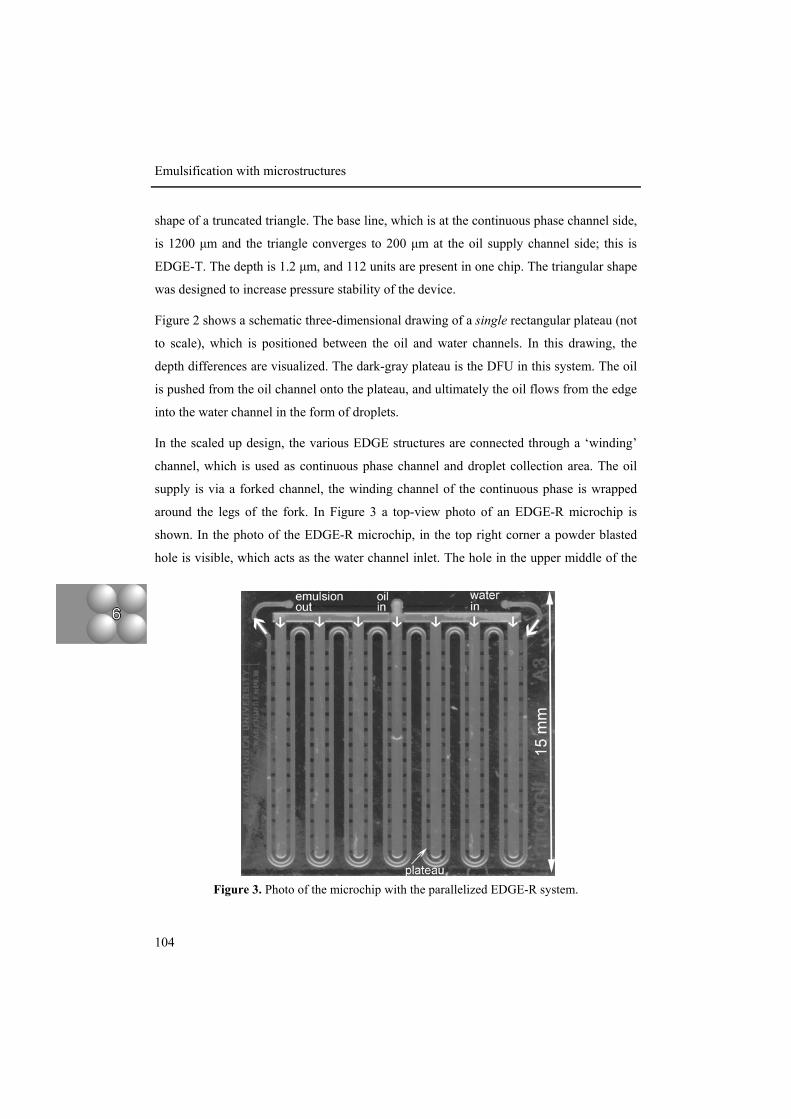
Emulsification with microstructures
104
shape of a truncated triangle. The base line, which is at the continuous phase channel side,
is 1200 µm and the triangle converges to 200 µm at the oil supply channel side; this is
EDGE-T. The depth is 1.2 µm, and 112 units are present in one chip. The triangular shape
was designed to increase pressure stability of the device.
Figure 2 shows a schematic three-dimensional drawing of a single rectangular plateau (not
to scale), which is positioned between the oil and water channels. In this drawing, the
depth differences are visualized. The dark-gray plateau is the DFU in this system. The oil
is pushed from the oil channel onto the plateau, and ultimately the oil flows from the edge
into the water channel in the form of droplets.
In the scaled up design, the various EDGE structures are connected through a ‘winding’
channel, which is used as continuous phase channel and droplet collection area. The oil
supply is via a forked channel, the winding channel of the continuous phase is wrapped
around the legs of the fork. In Figure 3 a top-view photo of an EDGE-R microchip is
shown. In the photo of the EDGE-R microchip, in the top right corner a powder blasted
hole is visible, which acts as the water channel inlet. The hole in the upper middle of the
Figure 3. Photo of the microchip with the parallelized EDGE-R system.

Parallelized Edge-based Droplet Generation Devices
105
chip is the oil phase inlet and in the left-hand corner, the produced emulsion flows out of
the chip. In between the parallel parts of both channels, the plateaus are etched. The
support pillars between the plateaus, for bonding and spacing, are visible as darker areas.
Essential in the design of the parallelized EDGE-devices is ensuring a comparable
pressure drop over all the plateaus throughout the device. This is done by minimizing the
pressure drop in the to-be-dispersed phase channels as well as the continuous phase and/or
product channel. The channels should be designed such that they only allow a pressure
drop of a few millibar over the length of the channel. The oil channels should therefore be
relatively wide in order to have steady oil supply. The continuous phase channel should
also be wide; in spite of the low viscosity of the continuous phase, the increasing amount
of oil droplets will increase the viscosity of the fluid in this channel considerably, and thus
increase the related pressure drop.
Peripherals. The microchip is placed in a module (Micronit Microfluidics, The
Netherlands) and connected via flat-bottom ferrules with nuts from Upchurch Scientific to
1/16” PEEKTM tubing with an inner diameter of 0.75 mm. The applied pressure on the oil
phase is controlled with a digital pressure controller (Bronkhorst, The Netherlands). The
typical pressure range that was investigated is 150 to 350 mbar. For the continuous phase,
we use hydrostatic pressure, or a syringe pump, as we only need a pressure difference in
the order of several millibar; as the continuous phase does not shear the droplets off, but
only removes the droplets. Typical continuous phase flow rates in the microchip were
between 0.4 and 1 mL/hr. The emulsions that were produced contained up to 30% of oil,
depending on the set flow rate of the water phase and oil pressure.
To visualize droplet formation in the EDGE-system we used a high-speed camera
(Redlake MASD Inc., USA) connected to a microscope (Carl Zeiss B.V., The
Netherlands). The module with the microchip was placed on the microscope table and
illuminated via the objectives with a halogen cold light source (Schott, Germany). To start
the experiment, the vessel with the continuous phase was lifted to increase the pressure to
around 7 mbar. Subsequently, the applied pressure on the oil phase was increased

Emulsification with microstructures
106
stepwise via the controller until the oil flowed onto the plateau. The droplet sizes were
determined with image analysis software.
Chemicals. As the to-be-dispersed phase, n-hexadecane (C16H34, 99%), synthesis grade,
from Merck KGaA (Darmstadt, Germany) is used. As the continuous phase, MilliQ ultra-
pure water with 1 wt% sodium dodecyl sulphate (SDS) is used. The viscosity of both
phases is 3.34 and 1.00 mPas, respectively. The static interfacial tension of this system is
8 mN/m, but the actual interfacial tension during droplet formation may be higher.
Depending on the time scales at which various effects take place, the actual value of the
interfacial tension may be anything between this value and the measured interfacial
tension of a ‘clean’ surface (44 mN/m).
Results and Discussion
Given the goal that we have set for this work, we will systematically check various
aspects that are of essence for up-scaling of the EDGE design. The number of active units
is investigated first, followed by the stability of the process, and finally a general
comparison of available techniques in literature and EDGE will be made.
Active units. The chips are filled as described in the materials and methods section. After
that, the applied pressure on the oil phase is increased gradually. Once the minimum
required Laplace pressure (∆PLaplace) is reached, the oil intrudes onto the plateaus. This
pressure can be estimated with Laplace’s law: ∆PLaplace = σ(R1+R2)-1, where σ is the
interfacial tension between both phases and R1 and R2 are the primary radii of curvature of
the interface. The smallest curvature (R1) is found between the plateau and the glass plate,
and because of its value, it dominates the Laplace pressure here.
It is observed that all DFU’s filled completely with oil around this pressure, and once the
oil reaches the edge, regular-sized oil droplets are produced (see Figure 4). The
percentage of active units was 100% in each system tested. Typical droplet formation
frequencies from the individual plateaus (EDGE-R and EDGE-T) can be as high as 1500
s-1, depending on the size of the droplet and the applied pressure. For EDGE-W, it is
impossible to determine the frequency because the entire plateau can not be visualized at
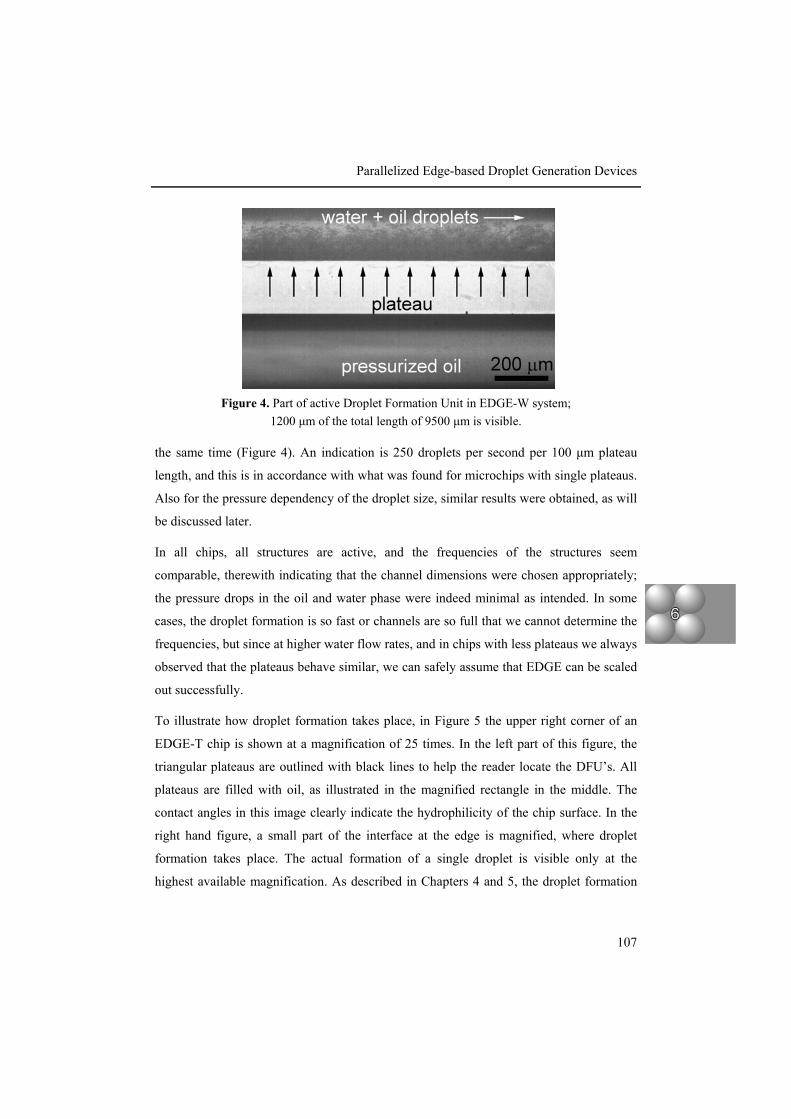
Parallelized Edge-based Droplet Generation Devices
107
the same time (Figure 4). An indication is 250 droplets per second per 100 µm plateau
length, and this is in accordance with what was found for microchips with single plateaus.
Also for the pressure dependency of the droplet size, similar results were obtained, as will
be discussed later.
In all chips, all structures are active, and the frequencies of the structures seem
comparable, therewith indicating that the channel dimensions were chosen appropriately;
the pressure drops in the oil and water phase were indeed minimal as intended. In some
cases, the droplet formation is so fast or channels are so full that we cannot determine the
frequencies, but since at higher water flow rates, and in chips with less plateaus we always
observed that the plateaus behave similar, we can safely assume that EDGE can be scaled
out successfully.
To illustrate how droplet formation takes place, in Figure 5 the upper right corner of an
EDGE-T chip is shown at a magnification of 25 times. In the left part of this figure, the
triangular plateaus are outlined with black lines to help the reader locate the DFU’s. All
plateaus are filled with oil, as illustrated in the magnified rectangle in the middle. The
contact angles in this image clearly indicate the hydrophilicity of the chip surface. In the
right hand figure, a small part of the interface at the edge is magnified, where droplet
formation takes place. The actual formation of a single droplet is visible only at the
highest available magnification. As described in Chapters 4 and 5, the droplet formation
Figure 4. Part of active Droplet Formation Unit in EDGE-W system; 1200 µm of the total length of 9500 µm is visible.

Emulsification with microstructures
108
takes place at the edge of the plateau and is not forced to occur on a specific position. The
process seems thereby less sensitive to disturbances (see also disturbances section). As
expected, the oil does not fill the far corners of the structures. This effect is larger for the
triangular plateaus than for the rectangular plateaus which fill virtually completely. The
available area is best used in the EDGE-W design as there are fewer corners on these wide
plateaus.
Stability of the process
Pressure. Since all units fill with oil, and show appreciable frequencies, the next step was
to investigate the pressure dependency of the droplet size, and its coefficient of variation.
Both parameters were determined using image analysis on 100 droplets produced at the
beginning of the continuous phase channel (this was found to be a good indicator for the
rest of the units since visibility is optimal and we did not observe other droplet sizes
further down the structure in spite of less visibility). The result is shown in Figure 6; a
constant oil droplet size is observed starting from the minimal Laplace pressure needed to
push the oil onto the plateau until a critical value is reached. Above this value, an increase
in diameter is observed The coefficient of variation seems somewhat more pressure
sensitive than the droplet size, but its absolute value is still small, indicating rather
monodisperse emulsions.
Figure 5. Screenshots of a part of an EDGE-T device at different magnifications.
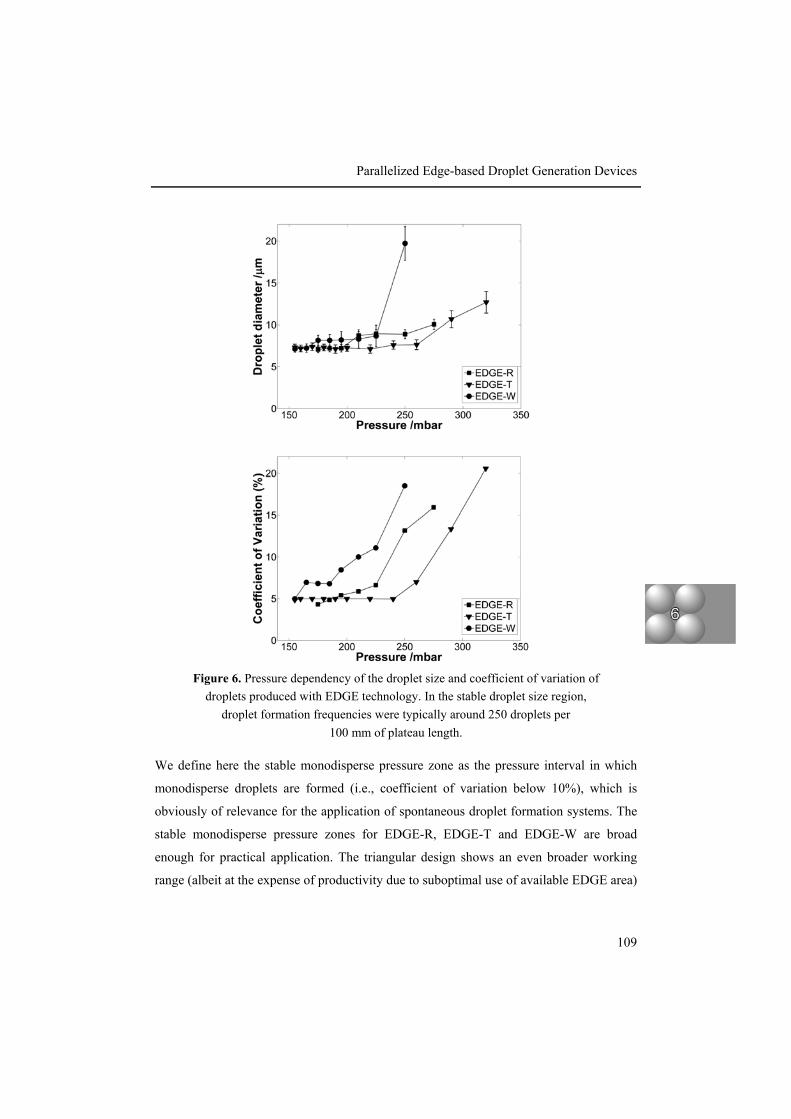
Parallelized Edge-based Droplet Generation Devices
109
We define here the stable monodisperse pressure zone as the pressure interval in which
monodisperse droplets are formed (i.e., coefficient of variation below 10%), which is
obviously of relevance for the application of spontaneous droplet formation systems. The
stable monodisperse pressure zones for EDGE-R, EDGE-T and EDGE-W are broad
enough for practical application. The triangular design shows an even broader working
range (albeit at the expense of productivity due to suboptimal use of available EDGE area)
Figure 6. Pressure dependency of the droplet size and coefficient of variation of droplets produced with EDGE technology. In the stable droplet size region,
droplet formation frequencies were typically around 250 droplets per 100 mm of plateau length.
Emulsification with microstructures
110
as it squeezes the oil supply, which has the same effect as increasing channel length in
microchannel emulsification (Sugiura et al., 2002b and Chapter 2 of this thesis). A longer
microchannel results in a higher flow resistance in the channel, as discussed in Chapter 2,
and the smaller cross-section in a triangular plateau also aims at creating such an increase
in resistance. In spite of the decrease in EDGE-length, the resulting wider operation range
for constant droplet size and coefficient of variation in EDGE-T systems may turn out to
be advantageous. Especially with low viscous, and thus pressure sensitive, oils it can be
important to have a more stable process as the droplet formation frequency will be high
anyway.
Disturbances and robustness. An added benefit of the wide plateaus is that even if there
is an obstruction on the plateau (sometimes dust particles are stuck on the plateau) the oil
simply fills the area around the obstruction and continues with droplet formation at the
edge of the structure as further explained in Chapter 5, Figure 4. The droplets that are
formed still have the same size, which makes the process robust. When comparing
mechanical robustness of the designs, we did notice that the widest plateaus seemed more
fragile, and were thus more susceptible to breakage.
Long-term operation. The EDGE system was subjected to long-term operation, implying
constant usage for 3 consecutive days. During the entire experiment, the process was
stable. Visual inspection of the process showed that the droplet size did not change as a
function of time. The stability, and activity, of the EDGE process can be explained by the
droplet formation taking place only at the edge of a DFU. Since the plateau is large
compared to the droplets, the droplet detachment is not accompanied with large pressure
fluctuations, which could induce coupling effects. The relatively large plateau thus acts as
a buffer and pressure gradients around a forming droplet only affect the fluid flow very
locally. EDGE units seem to be self-regulating droplet generators.
Comparison to other microfluidic emulsification techniques
In Table 2, microfluidic droplet generation techniques from literature are qualitatively
evaluated on system characteristics such as monodispersity of the emulsion, the size of the
droplets, productivity per droplet forming unit, complexity of fabrication, and scalability.
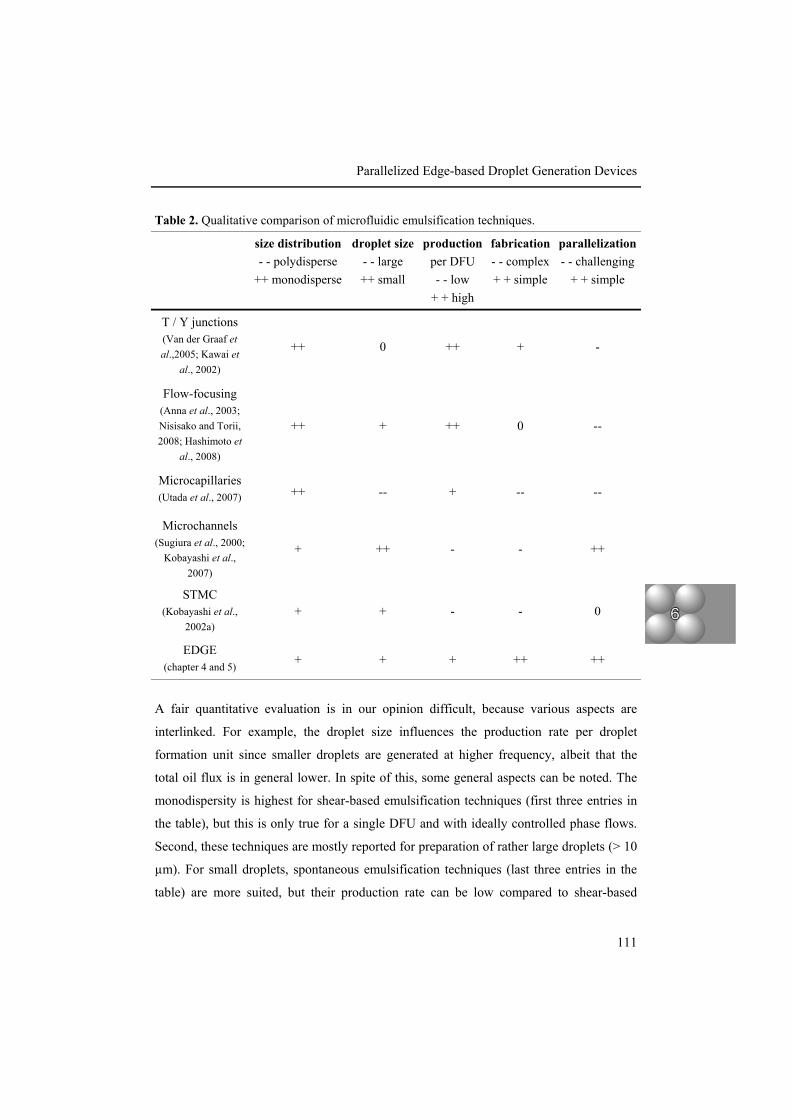
Parallelized Edge-based Droplet Generation Devices
111
A fair quantitative evaluation is in our opinion difficult, because various aspects are
interlinked. For example, the droplet size influences the production rate per droplet
formation unit since smaller droplets are generated at higher frequency, albeit that the
total oil flux is in general lower. In spite of this, some general aspects can be noted. The
monodispersity is highest for shear-based emulsification techniques (first three entries in
the table), but this is only true for a single DFU and with ideally controlled phase flows.
Second, these techniques are mostly reported for preparation of rather large droplets (> 10
µm). For small droplets, spontaneous emulsification techniques (last three entries in the
table) are more suited, but their production rate can be low compared to shear-based
size distribution - - polydisperse
++ monodisperse
droplet size - - large ++ small
production per DFU - - low
+ + high
fabrication - - complex + + simple
parallelization - - challenging
+ + simple
T / Y junctions (Van der Graaf et al.,2005; Kawai et
al., 2002)
++ 0 ++ + -
Flow-focusing (Anna et al., 2003; Nisisako and Torii, 2008; Hashimoto et
al., 2008)
++ + ++ 0 --
Microcapillaries (Utada et al., 2007) ++ -- + -- --
Microchannels (Sugiura et al., 2000;
Kobayashi et al., 2007)
+ ++ - - ++
STMC (Kobayashi et al.,
2002a) + + - - 0
EDGE (chapter 4 and 5) + + + ++ ++
Table 2. Qualitative comparison of microfluidic emulsification techniques.
Emulsification with microstructures
112
techniques. When considering the various techniques for up-scaling, other aspects become
important such as the fabrication of the devices and the ease of parallelization. For both
aspects, EDGE technology seems to have an edge over the other techniques due to its
simple design, and the scalability shown in this paper.
Conclusion
The recently proposed EDGE technique for production of narrowly dispersed emulsions
with average droplet sizes below 10 µm was successfully parallelized. The scaled-out
EDGE technology is robust, easy to implement, giving narrow droplet size distributions,
and this makes EDGE a promising technique for the production of emulsions with small
droplets.
Acknowledgements The authors thank Abid Maan for performing the measurements.


Chapter 7 EDGE emulsification for food-grade dispersions
Abstract
In this paper, we use the Edge based Droplet GEneration (EDGE) emulsification method
to produce food grade emulsions (including double emulsions) and foams. This newly
developed mild technology proved to be very stable and robust in the production of all
these products. The products are made with food grade components in an up-scaled micro
device, which does not show any changes in time in wettability and fouling, and the size
of the droplets and bubbles is as needed for food stuffs. Air bubbles generated with EDGE
were much larger than emulsion droplets, which could be explained through the viscosity
ratio of the phases and changes in interfacial free energy caused by dynamic interfacial
tension effects. In the outlook section of this paper, the obtained results are related to the
dimensions of upscaled devices, which are in a practically feasible range, also due to the
simplicity of the EDGE structure and its operation. Preliminary estimations show that a
300L system can produce 1 m³/hr of 4 % (v/v) emulsion.
This chapter has been submitted as: Van Dijke, K.C.; Schroën, K.; Van der Padt, A.; Boom, R.M. EDGE emulsification for food-grade dispersions.

Emulsification with microstructures
116
Introduction
Food grade dispersions, e.g. emulsions and foams, are generally produced via established
technologies such as high pressure homogenizers, colloid mills, in spite of their inefficient
energy usage and wide span of droplet sizes. Typically, 1-5 % of the applied energy is
used to make the emulsion droplets, and the rest is dissipated as heat, which may lead to
heat damage of the product and its ingredients (McClements, 2005). For this reason,
repeated passage at less extreme conditions is generally needed to give the product the
desired properties. In addition, repeated passage is applied to allow extra time for the
surfactants to do their stabilizing work after new interface has been created; the
surfactants cannot be supplied sufficiently fast to timely stabilize all the area that is
created during a single passage.
Emulsification processes based on micro-engineered emulsification devices consume
considerably less energy and are therefore an interesting alternative emulsification
technology; however, this technology still needs further maturation. Although many
different concepts have been proposed, important steps have to be made to make
emulsification by microtechnology practically relevant. These steps should be taken with
respect to the size of the droplets, the ingredients that can be used, and the scalability of
the devices.
Many microtechnological devices do not generate droplets in the same size category as
those generated by conventional technology; and since the product properties are co-
determined by the droplet size, there is little room for compromise. Further, many
different emulsifiers are used in high concentrations in microtechnological research, but
most of these tend to be non-food grade (Hashimoto et al., 2008; Kobayashi et al., 2002a;
Vladisavljevic et al., 2008; all other chapters in this thesis). Often the same is valid for the
tested oils. Exceptions are the work of Kobayashi and Nakajima (2002b) and Saito and
co-workers (2005), who worked on straight-through microchannel emulsification, using
various food components; however the droplets generated were typically around 40 µm,
which is an order of magnitude larger than desired for food products. Further, many
EDGE emulsification for food-grade dispersions
117
results have been published for single devices, while only in a few examples devices have
been scaled up (e.g. the microchannel device by Kobayashi and co-workers, and the
microsieve invented by Van Rijn and Elwenspoek (2005) and applied within Nanomi
technology as stated on their website (www.nanomi.com).
Wetting and fouling of microdevices is often neglected (except in Saito’s work); and this
is unjustified since these aspects are crucial for robust prolonged operation and
cleanability. Together with the three points that were mentioned in the previous section,
this should determine whether microtechnology may become a true alternative for
emulsion and foam production.
The recently proposed Edge based Droplet GEeneration (EDGE) emulsification technique
has been successfully used to produce small, narrowly dispersed hexadecane droplets in
pure water with SDS as a surfactant (Chapter 4). The droplet formation units are simple in
design, being shallow plateaus between two channels, and this configuration has been
shown to be suitable for scale-up through parallelization (Chapter 6). We here extend the
use of EDGE technology to products with food-grade ingredients (e.g. whey protein
concentrate, skim milk, and sunflower oil), ranging from single emulsions, to double
emulsions and to foams.
Vulnerable products, such as double emulsions, can hardly be produced by classic
technology; a broadly dispersed double emulsion with large droplets can be made,
however this leads to unstable products with unsatisfactory properties (Garti and
Bisperink, 1998). Here, a more gentle technique such as membrane and microchannel
emulsification could prove to be of even greater benefit (Lambrich et al., 2004;
Kawakatsu et al., 2001; Mine et al., 1996), and we expect that this also holds for EDGE
technology.
In foams, (as was the case for emulsions) evenly distributed and well defined small
bubbles are desired for reasons of sensory perception and product stability. The
conventional technologies such as steam injection, turbulent mixing (Saint-Jalmes et al.,
1999), and rotor-stator equipment (Bals and Kulozik, 2003), are rather energy inefficient,
and give wide size distributions. In literature, it is reported that with static membranes,
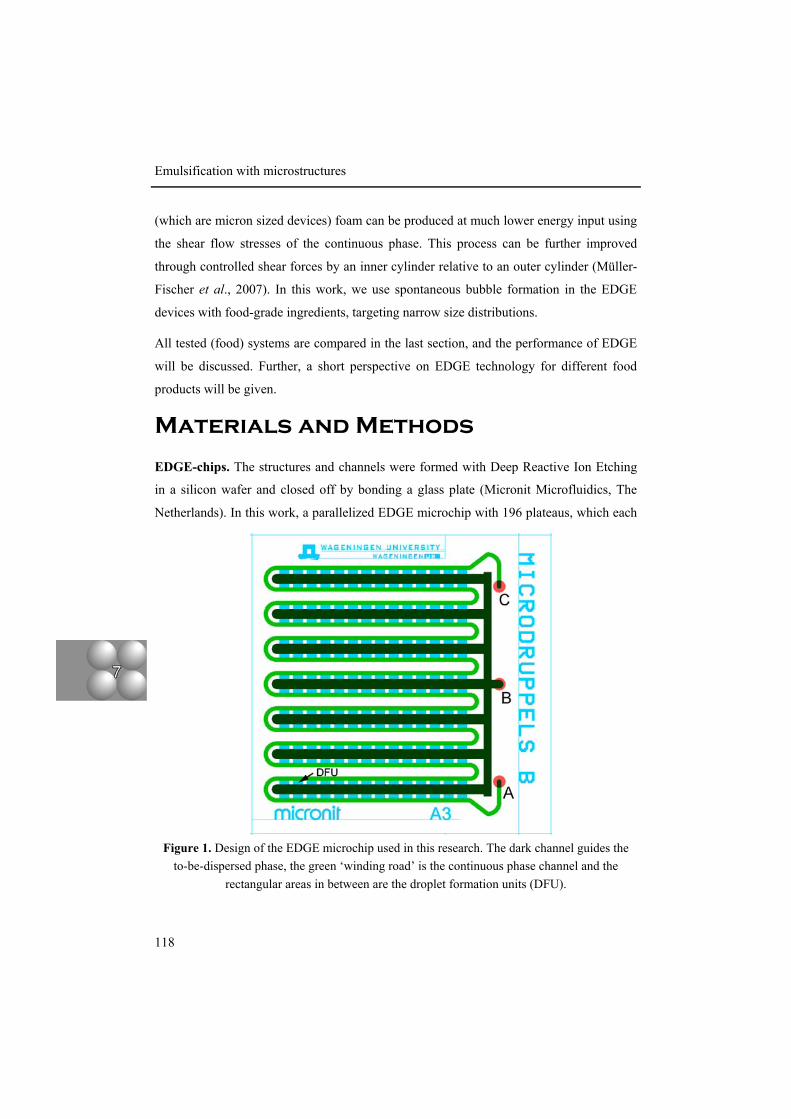
Emulsification with microstructures
118
(which are micron sized devices) foam can be produced at much lower energy input using
the shear flow stresses of the continuous phase. This process can be further improved
through controlled shear forces by an inner cylinder relative to an outer cylinder (Müller-
Fischer et al., 2007). In this work, we use spontaneous bubble formation in the EDGE
devices with food-grade ingredients, targeting narrow size distributions.
All tested (food) systems are compared in the last section, and the performance of EDGE
will be discussed. Further, a short perspective on EDGE technology for different food
products will be given.
Materials and Methods
EDGE-chips. The structures and channels were formed with Deep Reactive Ion Etching
in a silicon wafer and closed off by bonding a glass plate (Micronit Microfluidics, The
Netherlands). In this work, a parallelized EDGE microchip with 196 plateaus, which each
Figure 1. Design of the EDGE microchip used in this research. The dark channel guides the to-be-dispersed phase, the green ‘winding road’ is the continuous phase channel and the
rectangular areas in between are the droplet formation units (DFU).

EDGE emulsification for food-grade dispersions
119
have a length of 200 µm, a width of 500 µm, and a depth of 1.2 µm was used for all
experiments. The EDGE droplet formation unit and the parallelization are described in
detail in chapters 4 and 5 of this thesis. In Figure 1 a schematic drawing of the microchip
is shown.
The winding green line, that starts at A and continuous all the way to C, is the continuous
phase channel which is shaped around the darker oil channel, which starts at B and forms
a fork-shaped lay-out. Where the two channels run parallel to each other, the rectangular
droplet formation units (blue) are placed. The three holes A, B, and C (red) at the backside
of the chip act as inlets for continuous phase, dispersed phase, and outlet for product
respectively. The chips were used without further treatment.
Chemicals
O/W emulsification. Whey protein concentrate was kindly provided by
FrieslandCampina (Deventer, The Netherlands). A 6% (w/v) WPC solution was prepared
on a magnetic stirrer by dissolving the powder in water at slightly elevated temperature
(40 ºC which is below the denaturation temperature). The protein solutions were kept in
the fridge overnight before use; the viscosity is 1.2 mPa s according to Walstra et al.
(2006). Friesche Vlag Langlekker skim milk (FrieslandCampina, The Netherlands) from a
local supermarket was also stored in the fridge prior to use (η = 1.65 mPa s). Sunflower
oil of viscosity η = 50 mPa s was also purchased at the local supermarket and used
without any pre-treatment. Hexadecane was from Merck KGaA (Darmstadt, Germany).
W/O/W emulsification. The droplets in the water-in-oil emulsion were prepared in such a
way that they were small enough to enter the 1.2 µm deep plateaus of the EDGE devices
so they can be incorporated in the double emulsion. To sunflower oil with 10% (w/w)
PGPR (Givaudan, Vernier, Switzerland ), 30 % (w/w) water was gradually added during
20 minutes, and the emulsion was mixed with an Ultra-Turrax homogenizer (T18 basic,
IKA-Werke, Staufen, Germany) at 11000 rpm. The resulting average water droplet size
was 0.4 µm (Mastersizer 2000, Malvern Instruments Ltd., UK), which is small enough to
flow unhindered through the droplet formation unit (DFU). The viscosity of this W/O
emulsion was measured in a rheometer (MCR 301, Anton Paar, Graz, Austria) with a

Emulsification with microstructures
120
Couette geometry (DG 26.7). Rate sweeps were performed with shear rates from 1 s-1 to
900 s-1. For each viscosity measurement, a forward and a backward rate sweep was
performed in duplicate at a controlled temperature of 23 °C; the value was found to be
170 mPa s. For the production of the double emulsion, 6 % (w/w) Whey Protein
Concentrate and skim milk were used as the continuous (outer) phase.
Foam. We used air at room temperature in the foaming experiments. Next to skim milk
and WPC solution, we also investigated 1% (w/w) SDS in MilliQ Ultrapure water as
reference continuous phase.
Procedure and peripherals. The microchip was placed in a standard microfluidic chip
module (Micronit Microfluidics, Enschede, The Netherlands) and connected to the chip
holes via 1/16“ PEEK tubing with inner diameter of 0.75 mm with the use of Super
Flangeless fittings from Upchurch Scientific. The to-be-dispersed phase flow was
controlled accurately through a digital pressure controller (Bronkhorst, Veenendaal, The
Netherlands) which could be connected to either a valve for liquids (O/W and W/O/W) or
a valve for gases (Air/W). The pressure system was operated via software on a personal
computer. A syringe pump was used to generate a flow in the continuous phase channel to
transport the formed droplets or bubbles in such a way that they did not cause channel
obstruction. Typically, applied flows were 100 – 1000 µl/hr, which corresponds to a
pressure difference of only a few millibar over this channel.
After the chip was connected, the continuous phase flow was initiated and after some
minutes a steady flow was developed. Subsequently, the pressure on the to-be-dispersed
phase was gradually increased until the minimum required pressure for entering the
plateau was reached. This pressure is a function of interfacial tension (σ), contact angle (θ)
and relevant curvatures R1, and R2; according to Laplace’s law, this minimum pressure is:
(1)
θσ cos11
21min ⎟⎟
⎠
⎞⎜⎜⎝
⎛+=∆
RRP
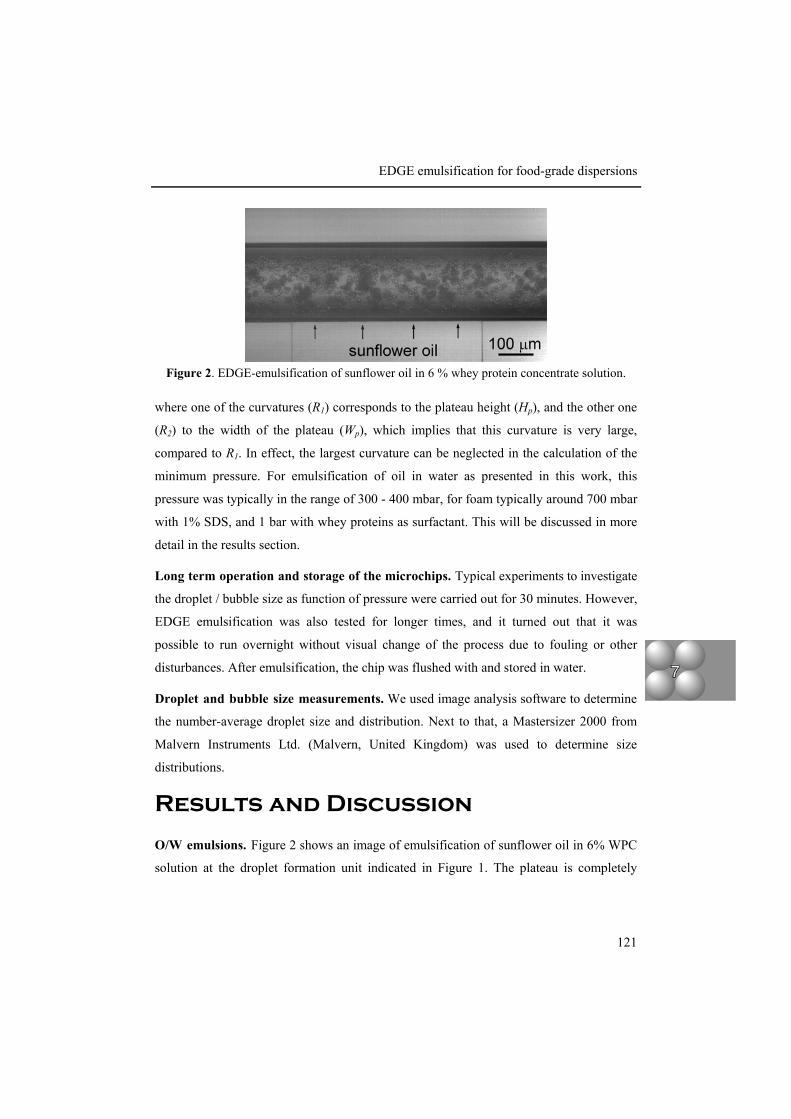
EDGE emulsification for food-grade dispersions
121
where one of the curvatures (R1) corresponds to the plateau height (Hp), and the other one
(R2) to the width of the plateau (Wp), which implies that this curvature is very large,
compared to R1. In effect, the largest curvature can be neglected in the calculation of the
minimum pressure. For emulsification of oil in water as presented in this work, this
pressure was typically in the range of 300 - 400 mbar, for foam typically around 700 mbar
with 1% SDS, and 1 bar with whey proteins as surfactant. This will be discussed in more
detail in the results section.
Long term operation and storage of the microchips. Typical experiments to investigate
the droplet / bubble size as function of pressure were carried out for 30 minutes. However,
EDGE emulsification was also tested for longer times, and it turned out that it was
possible to run overnight without visual change of the process due to fouling or other
disturbances. After emulsification, the chip was flushed with and stored in water.
Droplet and bubble size measurements. We used image analysis software to determine
the number-average droplet size and distribution. Next to that, a Mastersizer 2000 from
Malvern Instruments Ltd. (Malvern, United Kingdom) was used to determine size
distributions.
Results and Discussion
O/W emulsions. Figure 2 shows an image of emulsification of sunflower oil in 6% WPC
solution at the droplet formation unit indicated in Figure 1. The plateau is completely
Figure 2. EDGE-emulsification of sunflower oil in 6 % whey protein concentrate solution.
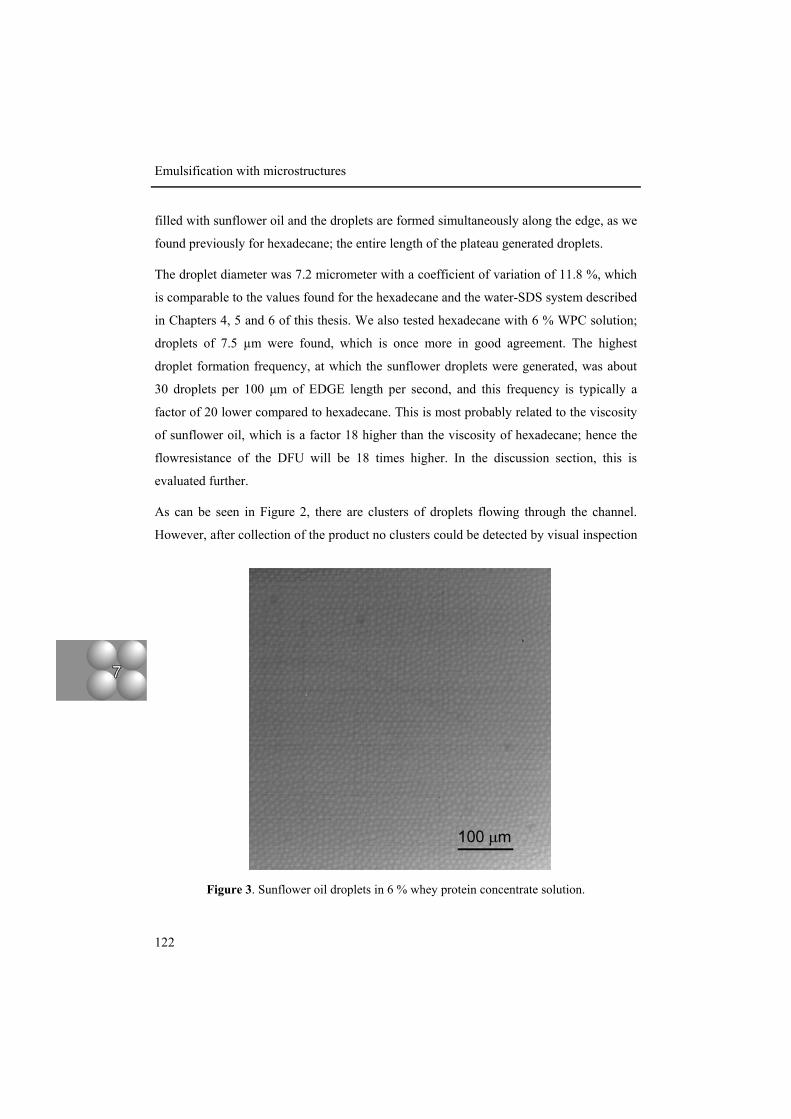
Emulsification with microstructures
122
filled with sunflower oil and the droplets are formed simultaneously along the edge, as we
found previously for hexadecane; the entire length of the plateau generated droplets.
The droplet diameter was 7.2 micrometer with a coefficient of variation of 11.8 %, which
is comparable to the values found for the hexadecane and the water-SDS system described
in Chapters 4, 5 and 6 of this thesis. We also tested hexadecane with 6 % WPC solution;
droplets of 7.5 µm were found, which is once more in good agreement. The highest
droplet formation frequency, at which the sunflower droplets were generated, was about
30 droplets per 100 µm of EDGE length per second, and this frequency is typically a
factor of 20 lower compared to hexadecane. This is most probably related to the viscosity
of sunflower oil, which is a factor 18 higher than the viscosity of hexadecane; hence the
flowresistance of the DFU will be 18 times higher. In the discussion section, this is
evaluated further.
As can be seen in Figure 2, there are clusters of droplets flowing through the channel.
However, after collection of the product no clusters could be detected by visual inspection
Figure 3. Sunflower oil droplets in 6 % whey protein concentrate solution.

EDGE emulsification for food-grade dispersions
123
(see Figure 3, for the emulsion at 250x magnification) nor in the Mastersizer 2000
spectrum, which detected only droplet sizes equal to the single droplets observed in the
channel. We assume that initially the amount of protein is sufficient to prevent
coalescence, but not sufficient to cover all droplets completely, enabling some bridging
flocculation. When allowed sufficient time, the proteins rearrange on the oil-water
interfaces, and/or more protein adsorbs resulting in the stable emulsions that were
detected at the outlet of the microchip.
We obtained similar results for the experiments in which skim milk was used as the
continuous phase, albeit that visual inspection is harder due to the lower transparency of
milk. The sunflower oil droplets in milk are in the same range as with 6 % WPC; their
size is 7.4 µm with CV = 12.1 %. The frequency at which the droplets are formed is also
the same as for WPC.
W/O/W emulsions. Double emulsions are visually different from single emulsions since
they carry small water droplets dispersed in the sunflower oil, which are visible (although
not easily) as black dots. In Figure 4, a double emulsion is formed in 6% WPC solution.
It is only possible to determine the size of the water-filled droplets by image analysis,
because the internal water droplets disturb the laser scattering measurement in the
Mastersizer. The sizes that were determined by image analysis are in the same size range
Figure 4. Production of double emulsion droplets in 6 % whey protein concentrate solution via EDGE emulsification of a single water-in-sunflower oil emulsion.
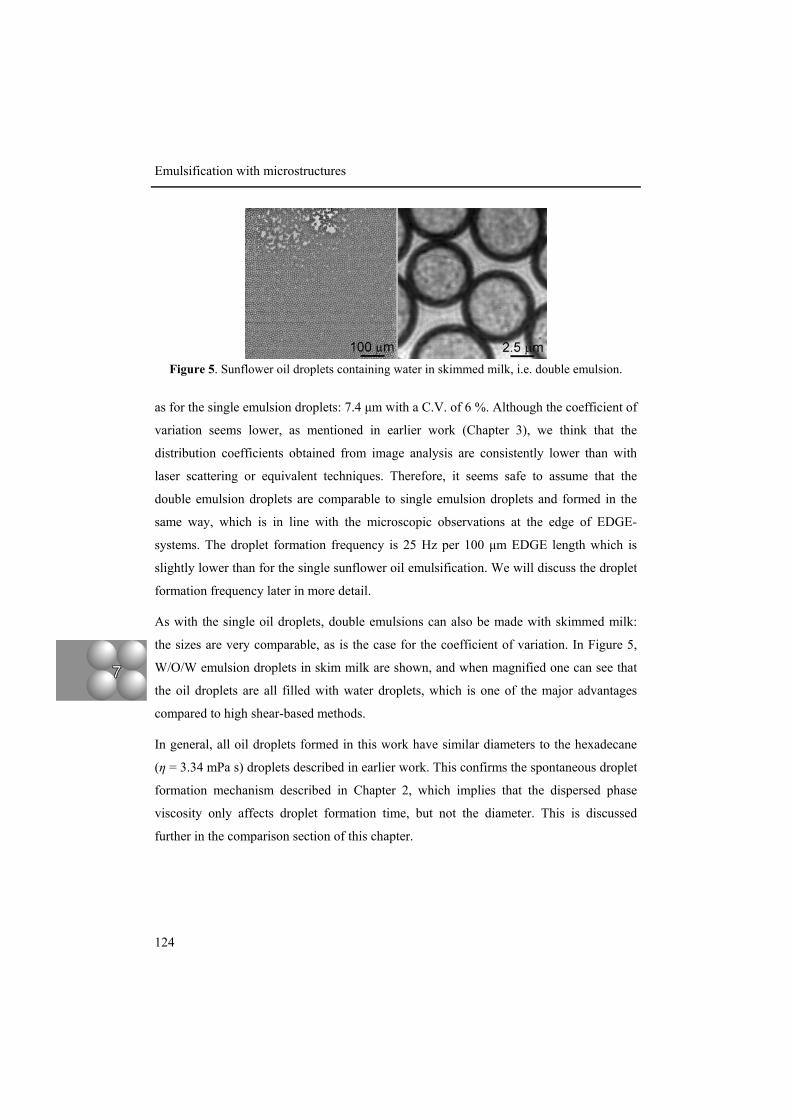
Emulsification with microstructures
124
as for the single emulsion droplets: 7.4 µm with a C.V. of 6 %. Although the coefficient of
variation seems lower, as mentioned in earlier work (Chapter 3), we think that the
distribution coefficients obtained from image analysis are consistently lower than with
laser scattering or equivalent techniques. Therefore, it seems safe to assume that the
double emulsion droplets are comparable to single emulsion droplets and formed in the
same way, which is in line with the microscopic observations at the edge of EDGE-
systems. The droplet formation frequency is 25 Hz per 100 µm EDGE length which is
slightly lower than for the single sunflower oil emulsification. We will discuss the droplet
formation frequency later in more detail.
As with the single oil droplets, double emulsions can also be made with skimmed milk:
the sizes are very comparable, as is the case for the coefficient of variation. In Figure 5,
W/O/W emulsion droplets in skim milk are shown, and when magnified one can see that
the oil droplets are all filled with water droplets, which is one of the major advantages
compared to high shear-based methods.
In general, all oil droplets formed in this work have similar diameters to the hexadecane
(η = 3.34 mPa s) droplets described in earlier work. This confirms the spontaneous droplet
formation mechanism described in Chapter 2, which implies that the dispersed phase
viscosity only affects droplet formation time, but not the diameter. This is discussed
further in the comparison section of this chapter.
Figure 5. Sunflower oil droplets containing water in skimmed milk, i.e. double emulsion.

EDGE emulsification for food-grade dispersions
125
Foam. The formation of bubbles with EDGE is in principle the same as with oil droplets;
however, because EDGE was not previously tested for bubble formation, first a simple
surfactant is tested, to show a proof of principle.
In Figure 6, the formation of air bubbles in a 1 % SDS solution at the DFU indicated in
Figure 1 is illustrated. The droplets are shown at some distance from the right side of the
droplet formation unit as only there the separate bubbles can be recognized. In front of the
plateau, the channel is completely filled with bubbles, which cannot be distinguished from
each other.
For bubbles, only an indication can be given for the diameter because we have to use
image analysis for bubbles that move very rapidly, and therefore cannot always be
recorded sharply. Nevertheless, it is clear that the bubbles formed in the 1% SDS-solution
(app. 20 µm) are considerably larger than oil droplets. The bubble formation frequency
could be estimated from the number of necking processes visible on the plateau. The
frequency is very high: approximately 1000 bubbles per 100 µm EDGE-length. Therefore,
it can be concluded that EDGE can be used effectively for foam formation.
The next step is to test with food grade ingredients. In Figure 7 the produced bubbles in
6% WPC-solution are shown in the channel of the microchip. Their size (approximately
30 µm) is considerably larger than found for SDS. For skimmed milk, the bubbles have
the same size as for WPC; apparently the type of emulsifier does influence the size of
Figure 6. Formation of air bubbles in 1 % SDS solution. Left: a whole droplet formation unit filled with air and the completely filled channel in front of the DFU. Right: separately
visible air bubbles approximately 150 µm to the right of the DFU.

Emulsification with microstructures
126
bubbles, where this was not the case for the emulsions. In spite of this, the process of
bubble production is robust and steady, and we did not observe any changes in bubble
diameter in time, nor any fouling of the chips that would disturb operation. The frequency
was around 400 Hz per 100 µm, which is lower compared to 1% SDS, but since the SDS-
bubbles are considerably smaller, this is logical.
Comparison and discussion of different systems
The behavior of the various systems is compared and discussed in this section. In Table 1,
Figure 7. Air bubbles in 6 % WPC solution flowing through the channel.
System ∆Pmin [mbar]
η [mPas]
ξ [-]
Ddroplet or Dbubble [µm]
Max. frequency / 100 µm [Hz]
Hexadecane in 1% SDS
132 3.34 3.34 7.1 550
Hexadecane in 6% WPC
293 3.34 2.78 7.5 440
Sunflower oil in 6% WPC or skim milk
310 50 35.7 7.2 30
W/O emulsion in 6% WPC or skim
milk
400 170 120 7.4 25
Air in 1% SDS 700 18 ·10-3 18 ·10-3 20 1000
Air in 6% WPC or skim milk
1000 18 ·10-3 13 ·10-3 30 400
Table 1. Characteristic values of several tested EDGE-systems.

EDGE emulsification for food-grade dispersions
127
some characteristic (measured) values are shown, such as the minimal pressure needed to
have the dispersed phase invade the plateau, and the diameter and frequencies of the
generated droplets and bubbles.
The minimum required pressure is primarily related to the dimensions of the DFU, the
interfacial tension and the contact angle (Equation 1). In the case that the contact angle
remains unchanged (i.e., surface properties of the device remain unchanged), any
difference in minimum pressure has to be caused by differences in interfacial tension. For
gas bubble production, the value of ∆Pmin was higher compared to the oil droplet systems
due to higher surface tension between air and the continuous phase. Indeed, SDS was
expected to lower the interfacial tension more (and faster) than WPC, and this is observed
in the ∆Pmin values.
The droplet size is strongly dependent on the geometry of the DFU (Chapter 4, 5) and the
viscosity ratio of both phases (Chapter 5). As the geometry is the same in all experiments
in this work, the ratio ξ of the viscosities of the dispersed phase (ηd) and the continuous
phase (ηc), defined as:
(2)
can be used to explain the difference in droplet and bubble sizes. As found in chapter 3 for
a grooved terrace-based microchannel system, the relative rate of the continuous phase
flow onto the terrace affects the resulting droplet size significantly, and this is also the
case for EDGE technology (Chapter 5). In other words, if the viscosity ratio ξ is high
enough, similarly sized droplets will be generated. Near a critical value ξcrit, which is
dependent on the geometry (chapter 3, 5), the droplet size increases. The ξcrit for EDGE is
much lower compared to the grooved terrace system studied in chapter 3 as the inflow
length is considerably shorter and the plateau length, which can be compared to channel
length, is much longer.
c
d
ηη
ξ =
Emulsification with microstructures
128
The viscosities of the continuous phases used here (water-SDS, water-WPC and skim
milk) are all in the same order of magnitude, so the to-be-dispersed phases will determine
the viscosity ratio differences, shown in Table 1. The liquid/liquid systems studied in this
work all have ξ >> ξcrit; consequently the droplet sizes are comparable. In case of air as
dispersed phase for which ξ is very low (0.01-0.02), ξ is below ξcrit and consequently the
bubble size increases significantly as described in Chapter 5..
Even though the viscosity ratio explains the trend, the difference in bubble size between
air in SDS solution and air in WPC solution remains remarkable, and this was also
previously reported by Yasuno et al. (2004) for terrace systems. To explain this, dynamic
interfacial tension effects have to be taken into account, especially, for very high
interfacial area expansion rates (Chapter 3). In general, the surface free energy of the
system becomes lower when going from the ‘constricted cylindrical shape’ on the plateau,
to the droplet shape in the deeper continuous phase channel. A measure for the interfacial
free energy can be calculated from the product of interfacial tension and surface area
(∫σdA). If the surface tension of the quickly growing bubble is not equal to the surface
tension on the plateau, the surface increase has to be higher than minimally required in
order to decrease the interfacial free energy sufficiently, resulting in larger droplets. This
qualitative description can explain the emulsification results of Sugiura et al. (2004b) for
various surfactant concentrations, and the aeration results of Yasuno et al. (2004).
The viscosity of the to-be-dispersed phase itself is expected to only affect the formation
frequency. This is indeed the case for most of our investigated dispersed phases, and a
linear relation with the viscosity holds (e.g. for hexadecane and sunflower oil). A
remarkably small difference in droplet formation frequency was observed between
sunflower oil and a water-in-sunflower oil emulsion, which was not expected based on the
measured viscosity difference in the rheometer. Most probably, the macroscopic viscosity
as determined in the rheometer, does not correspond to the situation on the plateau where
the droplets are next to each other (as can be seen in Figure 4), and the emulsion droplets
are constrained in two dimensions. Due to their size, the droplets are in the middle of the
terrace, where the shear rate is lowest. Near the terrace wall, where most of the shear takes

EDGE emulsification for food-grade dispersions
129
place, the liquid is depleted in droplets. In the rheometer, droplets can interact with others
in three dimensions, and this is not the case on the plateau. Therefore, it is logical that the
actual viscosity in the EDGE device is determined by the continuous phase (sunflower
oil), and that the frequency is similar to that for sunflower oil only. This is of importance
for the production of these shear sensitive emulsions, for which in EDGE devices
production rates can be established that are comparable to those of single emulsions,
which is impossible when using classic technology.
Conclusion and outlook
Edge-based Droplet GEneration (EDGE) systems were used for emulsification and
foaming in food grade systems, based on whey protein concentrate, skim milk and
sunflower oil. The system was found to be very robust in operation over longer time. The
droplet size was found to be 6 times the terrace depth for emulsions, and at least 17 times
the terrace depth for foams. This could be explained based on the viscosity ratio and the
recently introduced critical viscosity ratio.
The rate of emulsification is linearly dependent on the viscosity of the dispersed phase.
Double emulsion generation was found to be much faster than expected; probably the
Ingredients Possible product
required EDGE length
[km]
EDGE ‘chip-system’
volume [liter]
EDGE sieve system
volume [liter]
oil in skim milk (4 % (v/v) single emulsion)
recombined milk
170 270 30-40
water in oil in skim milk (4 % (v/v) double emulsion)
‘tasty’ low-fat milk
200 320 30-40
air in skim milk (50% (v/v) foam)
milk foam for e.g. deserts
19 30 3-4
Table 2. Required EDGE length and volumes to produce 1 m3/hr of sample products.

Emulsification with microstructures
130
macroscopic viscosity of the dispersed emulsion is lower when constrained into the
shallow terrace.
To obtain an indication for the feasibility of the EDGE principle in the food industry we
calculated the required total EDGE lengths to produce 1 m3/hr of product based on the
experiments we investigated. Table 2 shows the required lengths and virtual system
volumes.
Although these lengths, especially for the liquid-liquid systems, seem enormous, the
volume of the systems would typically be around 250-300 liter for emulsions and 30 liter
for foams, when assuming a thickness of 1 mm for the EDGE microchips, stacked EDGE
plates and neglecting the space needed for connections to the outer world. Furthermore,
the parallelization of the chips used in this work is still not very efficient, while the
microchip design constraint for visual inspection is of course not required for massive
scale-up. One may consider a straight-through variant in which EDGE nozzles are
constructed vertically like a microsieve to generate a massively parallelized EDGE
system, which can decrease the system volume significantly. Although it is not trivial to
produce an apparatus as suggested, the important advantages of EDGE technology are the
simplicity of the design, the ease of scale-up, robustness of operation and its insensitivity
towards fouling. These aspects may turn out to be drivers for further development of this
technology.
Acknowledgements The authors thank Riëlle de Ruiter and Peiheng He for performing several measurements
and for contributing to stimulating discussions.


Chapter 8 Discussion and outlook
Abstract
This discussion chapter starts by describing shortly how emulsification with
microstructured systems is investigated in literature. After this, the strategy used in this
work is summarized, which may be instrumental in faster development of (new)
emulsification devices. The strategy is illustrated by examples from the chapters in the
thesis, and other literature sources. It is aimed at developing insight on the mechanisms of
droplet formation captured in scaling relations, which ultimately also leads to generalized
rules for scale-up, and suggestions for large-scale emulsification devices, which are
presented in the last part of this chapter.
Emulsification with microstructures
134
Current emulsification research with microstructured devices
In literature, various emulsification systems have been discussed, and in the last decade,
many systems based on microstructured devices have been presented. Much experimental
work has been done on all these devices, be it for shear based systems like T- and Y-
shaped junctions (De Menech et al., 2008; Steegmans et al., 2009; Van der Graaf et al.,
2005), co-flowing or flow-focusing devices (Anna et al., 2003; Umbanhowar et al., 2000;
Nisisako and Torii, 2008), or cross-flow membrane emulsification (Abrahamse et al.,
2002; Nakashima et al., 1991), or for spontaneous emulsification systems such as
microchannels (Kawakatsu et al., 1997; Kobayashi et al., 2002a; Chapter 2 and 3), and
EDGE systems (Chapters 4-7). The results are essential for understanding of
emulsification, and in general give a good indication of the possibilities and
impossibilities of a specific design. However, it is not straightforward to translate the
knowledge gained from one particular design to another or to extract the precise effect of
system parameters on the process. For this, detailed insight in the emulsification
mechanism is needed. Aside from experimental work, a logical instrument in this is
through computer simulations.
Abrahamse and coworkers (2001) reported CFD results, and showed that the interfacial
tension and the surface properties, as reflected in the contact angle, are major
determinants of the droplet size in cross-flow microsieve emulsification. Rayner and
coworkers (2004) used the Surface Evolver (a package calculating the interfacial shape
under static conditions) for spontaneous microchannel emulsification, and they could
predict the droplet size within 8%. Kobayashi and colleagues (2004; 2006) used the
volume of fluid (VOF) method which generated insight in the velocities and pressures
during droplet formation. Lattice Boltzmann simulations were used by Van der Graaf et
al. (2006), to describe droplet formation in T-shaped junctions, and they found good
agreement with their experimental observations, as was the case in very recent research by
Van der Zwan and co-workers (2009a) who applied the same technique to microchannel
emulsification.
The simulations do not directly yield insight; it merely shows the consequences of a

Discussion and outlook
135
limited set of assumptions. When the assumptions in the simulation indeed lead to the
correct behavior, a causal relation may be present. However, it is essential that the
findings are translated into a framework of understanding, which shows the direct
relations between groups of parameters, and the system behavior.
Secondly, even though the VOF and lattice Boltzmann methods are powerful instruments
for obtaining insight, the simulations are time-consuming and thus can only be carried out
for a limited set of systems and configurations. This has to do with the fact that
incorporating interfacial tension effects in any simulation is far from standard procedure.
Because of this, considerable time is needed to set-up and validate the computer code, and
besides, computing the results takes a lot of time.
For both reasons, it is important that the CFD simulations are interpreted with simpler
models that e.g. use geometrical analysis as presented by van der Zwan and co-workers
(2009b), to compile and integrate the total understanding of the systems, and to speed-up
the design of microdevices for emulsification.
For this, we refer to the schedule in Figure 1 that Allen and Tildersley (1987) presented,
giving the relation between experiments, simulations, and theory formation.
In this thesis, we combined experimental work, simulations and analytical models, in a
similar way as proposed by Allen and Tildesley, but with some adaptations and
extensions. The ultimate goal is developing design rules for practically and economically
feasible emulsification devices. If a process is understood in detail, design rules are within
reach, as is described in the next section on our design strategy.
Design strategy
Experimental
In order to investigate droplet formation mechanisms in detail, the microchannel
emulsification devices were reduced to systems with only one microchannel and equipped
with a glass top plate to allow visual observation (Chapter 2). The choice for one channel
was also made because it is known that in some microchannel devices communication
between channels takes place, which complicates parameter studies on droplet formation.
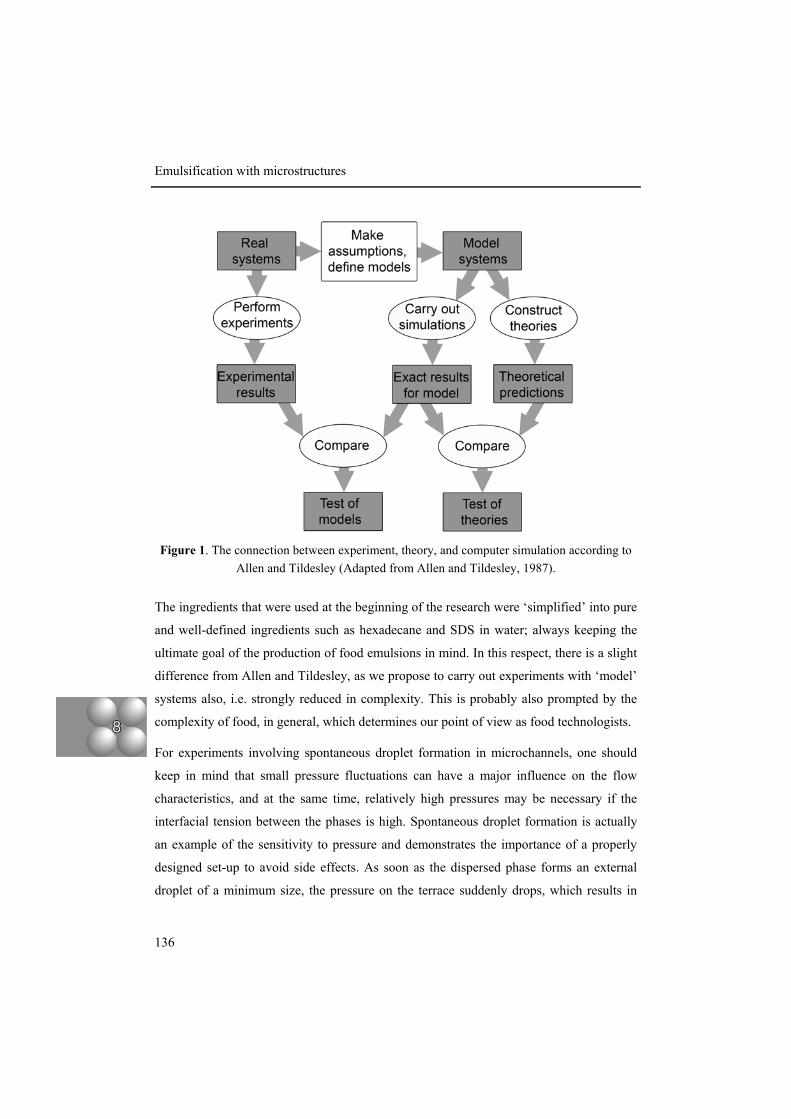
Emulsification with microstructures
136
The ingredients that were used at the beginning of the research were ‘simplified’ into pure
and well-defined ingredients such as hexadecane and SDS in water; always keeping the
ultimate goal of the production of food emulsions in mind. In this respect, there is a slight
difference from Allen and Tildesley, as we propose to carry out experiments with ‘model’
systems also, i.e. strongly reduced in complexity. This is probably also prompted by the
complexity of food, in general, which determines our point of view as food technologists.
For experiments involving spontaneous droplet formation in microchannels, one should
keep in mind that small pressure fluctuations can have a major influence on the flow
characteristics, and at the same time, relatively high pressures may be necessary if the
interfacial tension between the phases is high. Spontaneous droplet formation is actually
an example of the sensitivity to pressure and demonstrates the importance of a properly
designed set-up to avoid side effects. As soon as the dispersed phase forms an external
droplet of a minimum size, the pressure on the terrace suddenly drops, which results in
Figure 1. The connection between experiment, theory, and computer simulation according to Allen and Tildesley (Adapted from Allen and Tildesley, 1987).

Discussion and outlook
137
outflow of the dispersed phase into the external droplet. This should be fast compared to
the inflow from the supply channel: a precise balance between pressure drop between
terrace and droplet, and overall pressure drop is needed. This illustrates that a good
pressure controlled system is necessary. The applied pressure drives the droplet formation
as is indicated in various Chapters in this thesis, and not the applied fluxes or velocities,
which may be very different from what one would assume based on the value given by the
pump. For example in shear-based Y-junctions, the fluxes can be orders of magnitude
different because of the local pressures inside the microchips (Steegmans et al., 2009).
Computational
In Chapter 2 of this thesis, experiments with single grooved microchannels were
performed in which a clear effect of the terrace structure was observed. Extraction of
understanding of the process was not straightforward however; therefore, a Volume-of-
Fluid model incorporated in CD-Adapco’s STAR-CD was used to simulate spontaneous
droplet formation. The main advantages of this method are that changes in topology are
taken into account in detail, that the mass of each flow component is conserved exactly,
and the interface shape is not constrained, as is the case in some other methods (James et
al., 2004). The interface location is captured as it moves through the grid by tracking the
local volume fraction. This should be done with a high resolution reconstruction scheme
as the interface curvature determines the Laplace pressure over the interface, and it is
therefore important to calculate the curvatures as precisely as possible (see also analytical
section). An important limitation of the used method is the impossibility to model
dynamic interfacial tension. Incorporating such dynamics, which is far from trivial and
also not available in other packages, is still in development and could probably be
incorporated within a few years (James et al., 2004). On the other hand, parallelization of
the simulation over several computers is relatively easy with this software which is a great
advantage to keep the computation time within practical limits.
Although it is impossible to simulate reality completely, the CFD simulations performed
in this research, based on a set of assumptions which simplify the system, were in
reasonable agreement with experimental observations as shown in Chapters 2, 3, and 5,
Emulsification with microstructures
138
but more importantly gave useful information about the dynamics of spontaneous droplet
formation. Since these calculations are very time consuming in the set-up of the models,
and in the calculations themselves, it is not an option to evaluate the design of a
microstructure in this way in all its details. Still they are, especially in combination with
experiments, a very valuable tool to separately and systematically study the influence of
several process parameters that are not easily accessible experimentally. From these
findings, the essence of the droplet formation mechanism could be derived, and we found
this the biggest benefit of the CFD simulations, since this leads to much better analytical
models (the right column in Allen and Tildesley’s scheme), which are discussed in the
next section. Moreover, we think the CFD models are in this respect essential, and
therefore propose to place the right column of the scheme after the simulation steps, not
parallel to it, as can be seen in Figure 2.
Analytical
The insights derived from CFD simulations focussed on the local pressures in the system,
which have lead to the flux criterion for microchannel systems in Chapter 2 (and a
geometrical analysis that describes the minimum size of the droplets for the EDGE system
in Chapter 5). Using the flux criterion, a wide range of process conditions and design
criteria for microchannels could be evaluated in a matter of hours, using a simple
MATLAB script as illustrated in Chapter 2. These simple models are essential in
capturing the understanding following from the CFD simulations, are practically useful,
and give more insight in the total system behaviour. Developing such models from scratch
would have been extremely hard without the CFD results to guide us in choosing the most
relevant parameters for microchannel emulsification, which ultimately also lead to the
design of the new EDGE system that is presented in this thesis. These models can
therefore be seen as the theory formation as indicated by Allen and Tildesley.
Edge-based Droplet GEneration is introduced in Chapter 4 of this dissertation. It consists
of a wide but shallow nozzle in between properly designed oil and water channels (one at
each side). It makes use of the insights in Laplace pressures and the terrace-structure
function found for the microchannel systems presented in Chapters 2 and 3. In principle,

Discussion and outlook
139
the biggest resistance in the EDGE emulsification system should be on the plateau in
order to fill it up completely and to allow multiple droplet formation that can be controlled
easily. Narrowly dispersed emulsion droplets are formed along the edge in a broad
pressure range and the system seems to be self-regulating even if there is a disturbance in
the flow pattern on the plateau or in the channels. Fundamental questions were raised
(Chapter 5), of which we found some of the answers to be similar to those for
microchannel emulsification (Chapter 2 and 3). Besides, scale-up (Chapter 6) and the use
of food grade ingredients (Chapter 7), were investigated for EDGE, which are both
essential for whether the technology can indeed be applied in the practice of food
production. For all these questions, we found that EDGE shows genuine promise (as
illustrated in the results shown in the various Chapters of this thesis).
We first summarize the strategy that we followed; it is in essence based on the scheme of
Allen and Tildesley (1987) with some changes in routes and some extensions to the real
application and upscaling. We found that it helped us to evaluate more process conditions
then any of the individual techniques (experimental, computational, and analytical) would
have allowed us to do.
In Figure 2, our strategy for fundamental understanding leading to design rules and
innovation is schematically summarized and illustrated with figures from several Chapters
of this thesis. Its steps are:
I Identification of process of interest, and in this case this was microchannel
emulsification.
II Drastic reduction of complexity of the system, in this case to a single droplet
formation unit suitable for inspection.
IIIa Relatively uncomplicated experiments with simple or well-defined materials
under controlled conditions (applied pressure in our case).
IIIb Extensive simulations of the reduced system allowing some margins for limitations
and errors.

Emulsification with microstructures
140
Figure 2. Schematic summary of design strategy followed in this thesis.
Discussion and outlook
141
IV Extract essential information (parameters) from simulations, and recognize
consistencies and inconsistencies in behaviour.
V Use the results for defining the fundamental mechanisms, based on well-known
physics laws and simple mathematics and use this as a steppingstone for further
understanding of more complex behaviour.
VI Perform parameter variation with the mechanistic description of the process
obtained in step V, and compare with experiments and simulations. Ideally, extend
the steppingstone towards more complex behaviour, and derive basic scaling rules.
VII (Re-)evaluate system options, including new designs and up-scaled systems.
VIII Test the system with non-ideal materials.
IX Derive scaling relations for parameters which are beyond the basic model (e.g.
estimation of dynamic interfacial tension effects based on a series of simulation at
different static interfacial tension). With the knowledge of the process gained until
now, one can set up experiments simply and solely focussed on the scaling
relation. The scaling relations will be part of the design guidelines in step X.
X Set-up a larger scale system using insights obtained in previous steps,
operationalized according to design guidelines.
Steps IIIb, IV and V were the most time-consuming research activities, while the actual
evaluation based on analytical models hardly took any time. It is expected that our
strategy can also be applied to other (emulsification) systems, therewith facilitating faster
and better design. Experimental, iterative optimization can lead to a local optimum, while
optimization based on fundamental knowledge is expected to lead to the global optimum,
therewith directly rewarding the effort put into deriving fundamental mechanistic insights.
In order to make this work, a good combination of experimental, computational, and
analytical work is needed, and this should become standard procedure in food related
research. Various relatively user-friendly computer codes are now available which are
able to perform useful simulations of complex multiphase processes, which brings an
important step to more detailed understanding of various processes and products within

Emulsification with microstructures
142
reach of a larger group or researchers. It is essential to realize that simulations do not have
to describe reality exactly, but should cover a limited set of properties and assumptions,
and should be used to evaluate whether this set gives rise to the phenomena under study.
If so, then a causal relation between the set of properties and the phenomena is likely.
Comparison, scale-up, and outlook
A fair comparison between different microfluidic emulsification systems is not trivial, but
we attempted to do so in Chapters 6 and 7; in general, it is known that microchannel and
membrane emulsification are closer to EDGE than to the classic techniques. We here
compare the EDGE-technology with devices that are more traditional, such as high-
pressure homogenisation, colloid milling, or other high-shear devices. We start with
general aspects such as droplet size and droplet size distribution, and then discuss more
complex matters, such as the layout of a scaled-up EDGE device. Table 1 summarizes this
comparison.
The EDGE devices reported in this thesis are all capable of producing emulsions with
much narrower droplet size distributions than the traditional devices. As for any
microtechnological emulsification technique, the process conditions are much gentler, and
Traditional techniques EDGE Size distribution - +
Droplet size 0 0
Throughput + -
Energy efficiency - +
Gentle processing - +
Costs + -
Process control - +
Fouling 0 *
+ good, 0 reasonable, - poor *no problems with the systems tested until now
Table 1. Comparison traditional emulsification and EDGE.
Discussion and outlook
143
this also allows production of e.g. double emulsions, that otherwise cannot be produced
without disrupting the internal phase. Besides, process control is much easier for EDGE,
as the height of the droplet formation unit mainly determines the droplet size, and the
resistance on the plateau needs to be high compared to other resistances in the system, in
order to control the system completely. For classic emulsification technology, process
control is not straightforward, only some empirical relations between energy input and
droplet size are available.
Although microfluidic devices become more common practice in the research
environment, there is still a big challenge in producing sub-micron droplets, as is also the
case for traditional techniques. The biggest challenge for EDGE is however the
throughput which is low in one microdevice but will obviously be larger in a scaled-up
version. The conventional emulsification devices already operate on large scale and
therefore have a big advantage in this respect. In a scaled-up EDGE, also the surface
properties of the device should be properly maintained since this is of direct influence on
emulsification, as is also lined out in Chapter 5. Until now however, no problems with
fouling were observed over several days of continuous operation, and in between runs.
The strong interest of various industries and academic groups in producing equally sized
small droplets in a gentle way, leads us to believe that a scaled-up process is relevant. If
we focus on EDGE, droplet sizes are in the size range which is suitable for many
applications, and it can be expected that the size can be reduced further, given the
straightforward scaling relation between droplet size and plateau height. A first step in
parallelization was made in Chapter 6 of this thesis. Unlike the microchannel systems and
cross-flow membrane emulsification, the EDGE droplet formation units are all active at
the same time, without pressure dependent channel activation as observed in straight
through microchannel systems. Besides, we expect that given the simplicity of the EDGE
design, manufacturing is easier compared to that of more complex structures.
In Chapter 7 some basic calculations for the device volumes of a system producing 1 m3/
hr of product are given. These volumes are well within reach, especially for foam
production as the system volume indication is as low as 4 litres. Although it is not trivial

Emulsification with microstructures
144
to fabricate such systems (and it is expected to be expensive), it shows good prospect for
further maturation of the EDGE technology. For the food industry, the devices need to be
big given typical high throughputs, but for the pharmaceutical industry, the volumes are
considerably less because the focus is more on monodispersity than on bulk production,
and application could be easier to realise. Alternatively, small-scale production in on-
demand machines, with which consumers can choose their specific products demands at
home or in the supermarket, and the product is made instantaneously, could be an
interesting way to go.
EDGE is in theory not restricted to emulsions and foams; also, aerosols or sprays are
expected to be possible products, and this could lead to an interesting spin-off in e.g.
spray-drying processes (Wu et al., 2007) in various industries. The high-pressure nozzles
in conventional spray towers give a wide size distribution, and therewith, a difference in
drying behaviour in the various droplets, resulting in product quality differences, which
makes it difficult to optimize the process. If the drying process could be started with
similarly sized droplets, the process conditions are better controlled for each particle and
thus less variety is expected, which enables better overall product quality and probably
higher process efficiency as well.
Away from large-scale applications, in medical applications a benefit can be expected if
droplets generated by e.g. an inhaler are of a specific size. In that case, it would be
possible to direct the droplets to a position in the patient where the medicine is most
effective, and therewith, reduce side effects (Higashi et al., 1995). Although one inhaler is
not big in size, the total market for inhalers could still make EDGE an interesting new
concept.
Fabrication of EDGE structures is quite simple; there is only one dimension that needs to
be very precisely defined and maintained and that is the height of the plateau. For viscous
dispersed phases, it is important to have droplet formation units which are not too long,
because the resistance will be unnecessarily high, but still this dimension can be hundreds
of times the height of the plateau, and should not be an issue in the production of EDGE-
devices. In addition, the systems that have been developed in this thesis are not yet fully
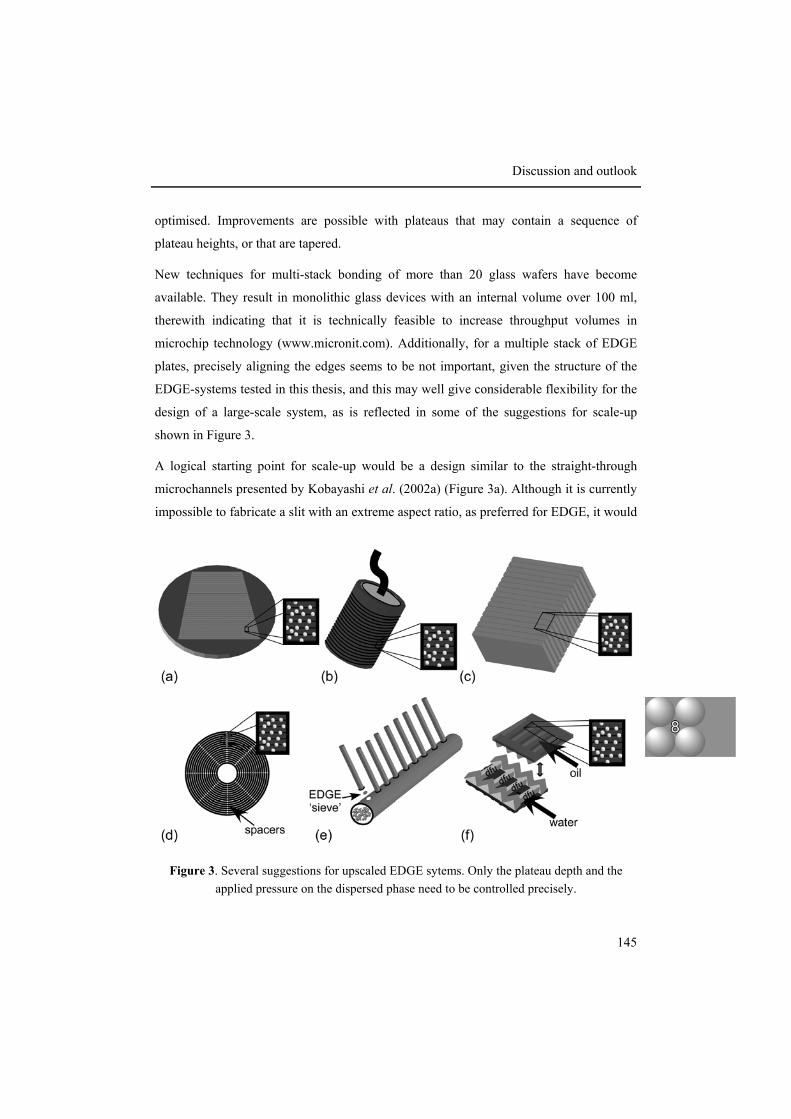
Discussion and outlook
145
optimised. Improvements are possible with plateaus that may contain a sequence of
plateau heights, or that are tapered.
New techniques for multi-stack bonding of more than 20 glass wafers have become
available. They result in monolithic glass devices with an internal volume over 100 ml,
therewith indicating that it is technically feasible to increase throughput volumes in
microchip technology (www.micronit.com). Additionally, for a multiple stack of EDGE
plates, precisely aligning the edges seems to be not important, given the structure of the
EDGE-systems tested in this thesis, and this may well give considerable flexibility for the
design of a large-scale system, as is reflected in some of the suggestions for scale-up
shown in Figure 3.
A logical starting point for scale-up would be a design similar to the straight-through
microchannels presented by Kobayashi et al. (2002a) (Figure 3a). Although it is currently
impossible to fabricate a slit with an extreme aspect ratio, as preferred for EDGE, it would
Figure 3. Several suggestions for upscaled EDGE sytems. Only the plateau depth and the applied pressure on the dispersed phase need to be controlled precisely.
Emulsification with microstructures
146
be a very efficient way to parallelize the EDGE system. The micro- or even nano-
technological mechanical engineering techniques are developing quickly and it is
expected that this will become a viable concept in the near future.
For cleaning purposes, a system that can be disassembled and reassembled easily is
preferable. One can think of stacked flat plates or rings of any well-defined and rigid
material (Figure 3b and c) kept apart by appropriate spacers. In Liquid Crystal Displays,
silica or polymeric spacers are used to maintain the cell gap (the distance) between the
front and rear pieces of glass used to make the display and this cell gap has comparable
dimensions as needed for the EDGE systems presented in this thesis. Kim et al. (2007)
prepared spacers which can be used for flexible LCD applications, and these may be
applied in EDGE systems as well, therewith tackling mechanical fragility and brittleness
issues (Figure 3d, showing a flexible layer wound into a spiral, while spacers keep the
distance fixed). Alternatively, accurate spraying or printing techniques could be used to
produce thin layers that can act as spacer. All these new developments could lead to a
structure comparable to a microsieve, with high DFU density, better cleanability, and
robustness.
Recently, Unnikrishnan and co-workers (2009) developed a ‘plug-and-play’ platform
which is compatible with standard Swagelok connectors. Depending on the desired
droplet size, a suitable connector with the correct EDGE device (like in Figure 3a and 2d)
can be plugged onto the large channel, and if multiple connections to a relatively large
continuous phase channel can be realized as shown schematically in Figure 3e, a
convenient apparatus can be developed, which can be applied in a flexible way. The
‘zipper’ construction in Figure 3f is another initial idea which could facilitate easier
cleaning. Ideally, by pressing the two parts in each other, two channels with slits in
between are formed. To clean the DFU, the two parts can be separated resulting in easy
access to the plateaus. The idea is to fit precisely defined ‘large’ structures into or onto
each other therewith defining the small structures, i.e. plateaus and oil and water channels,
automatically.
Discussion and outlook
147
Regarding the choice of material, it is desirable to choose a material that is not wetted by
the to-be-dispersed phase (Chapter 5). However, this may not always be compatible with
the other requirements that need to be met for the production of the structure. Therefore,
surface modification is an interesting tool to influence or stabilize the surface properties,
and possibly, prevent fouling, although fouling has not been an issue in EDGE systems
tested so far.
Naturally, the design of an up-scaled system is not limited to the options and ideas
mentioned here; and several challenges remain for the (food) engineers and technologists
working on improved emulsification procedures. Production and design of new devices is
far from done, but it is our expectation that ultimately it will result in a commercially
attractive alternative for the traditional devices.
Final remarks
Emulsification with microstructures has been an important research topic for the last
twenty years, and given the recent developments, it is expected that this technology will
become available for larger scale production of monodisperse single and double
emulsions. For this, the advances in process understanding and design, as described in this
thesis, in fabrication methods of microfluidic systems, and in surface modification
research, need to come together in a large-scale production apparatus. Given the current
speed at which developments are taking place, it should only be a matter of time before
emulsions can be produced in a much more controlled and efficient way by
microtechnological devices, even at the large throughputs required in food industry.

References
149
References
• Abrahamse, A. J.; van der Padt, A.; Boom, R. M.; de Heij, W. B. C. AIChE J.
2001, 47, 1285.
• Abrahamse, A. J.; van der Padt, A.; Boom, R. M. J. Membr. Sci. 2002, 204, 125.
• Allen, M. P. and Tildesley, D. J. Computer Simulation of Liquids 1987 Oxford
University Press, Oxford, United Kingdom.
• Anna, S. L.; Bontoux, N.; Stone, H. A. Appl. Phys. Lett. 2003, 82, 364.
• Bals, A. and Kulozik, U. J. Membr. Sci. 2003, 220, 5.
• Brackbill, J. U.; Kothe, D. B.; Zemach, C. J. Comput. Phys. 1992, 100, 335.
• De Menech, M.; Garstecki, P.; Jousse, F.; Stone, H. A. J. of Fluid Mechanics 2008,
595, 141.
• Garstecki, P.; Gitlin, I.; DiLuzio, W.; Whitesides, G. M.; Kumacheva, E.; Stone, H.
A. Applied Physics Letters 2004, 85, 2649.
• Garstecki, P.; Fuerstman, M. J.; Stone, H. A.; Whitesides, G. M. Lab Chip 2006, 6,
437.
• Garti, N. and Bisperink, C. Current Opinion in Colloid & Interface Science 1998,
3, 657.
• Gijsbertsen-Abrahamse, A. J.; van der Padt, A.; Boom, R. M. AIChE J. 2004, 50,
1364.
• Hashimoto, M.; Shevkoplyas, S. S.; Zasonska, B.; Szymborski, T.; Garstecki, P.;
Whitesides, G. M. Small 2008, 4, 1795.
• Higashi, S.; Shimizu, M.; Nakashima, T.; Iwata, K.; Uchiyama, F.; Tateno, S.; Ta-
mura, S.; Setoguchi, T. Cancer 1995, 75, 1245.
• James, A. J. and Lowengrub, J. J. of Computational Physics 2004, 201, 685.
References
150
• Kawakatsu, T.; Kikuchi, Y.; Nakajima, M. J. Am. Oil Chem. Soc. 1997, 74, 317.
• Kawakatsu, T.; Trägårdh, G.; Kikuchi, Y.; Nakajima, M.; Komori, H.; Yonemoto,
T. J. Surfactants Deterg. 2000, 3, 295.
• Kawakatsu, T.; Trägårdh, G.; Trägårdh, C. Colloids and Surfaces A - Physicoche-
mical and Engineering Aspects, 2001, 189, 257.
• Kim, E. H.; Kim, S. Y.; Kim, S. S. Molecular Crystals and Liquid Crystals 2007,
464, 799.
• Kobayashi, I.; Nakajima, M.; Nabetani, H.; Kikuchi, Y.; Shohno, A.; Satoh, K. J.
Am. Oil Chem. Soc. 2001, 78, 797.
• Kobayashi, I.; Nakajima, M.; Chun, K.; Kikuchi, Y; Fujita, H. AIChE J. 2002a, 48,
1639.
• Kobayashi, I.; Nakajima, M.; Eur. J. Lipid Sci. Technol. 2002b, 104, 720.
• Kobayashi, I.; Mukataka, S.; Nakajima, M. Langmuir 2004, 20, 9868.
• Kobayashi, I.; Mukataka, S.; Nakajima, M. Langmuir 2005a, 21, 5722.
• Kobayashi, I.; Mukataka, S.; Nakajima, M. Langmuir 2005b, 21, 7629.
• Kobayashi, I.; Mukataka, S.; Nakajima, M. Ind. Eng. Chem. Res. 2005c, 44, 5852.
• Kobayashi, I.; Lou, X., Mukataka, S.; Nakajima, M. JAOCS 2005d, 82, 65.
• Kobayashi, I.; Uemura, K.; Nakajima, M. J. Chem. Eng. Jpn. 2006, 39, 855.
• Kobayashi, I.; Uemura, K.; Nakajima, M. Colloids Surf. A 2007, 296, 285.
• Kobayashi, I.; Takayuki, T.; Meada, R.; Yoshihiro, W.; Uemura, K.; Nakajima, M.
Microfluid Nanofluid 2008, 4, 167.
• Lago, M., Araujo, M. Physica A 2003, 319, 175.
• Lambrich, U.; Van der Graaf, S.; Dekkers, K. S.; Boom, R. M.; Schubert, H. In
Proceedings ICEF 9, 2004, Montpellier, France.

References
151
• Link, D. R.; Anna, S. L.; Weitz, D. A.; Stone, H. A. Phys. Rev. Lett. 2004, 92.
• Lucassen-Reynders, E. H.; Kuijpers, K. A. Colloids and Surfaces 1992, 65, 175.
• McClements, D. J. Food Emulsions: Principles, Practice, and Techniques 1999
CRC Press: Boca Raton, United States.
• Mine, Y.; Shimizu, M.; Nakashima, T. Colloids and Surfaces B-Biointerfaces
1996, 6, 261.
• Muller-Fischer, N.; Bleuler, H.; Windhab, E. J. Chemical Engineering Science
2007 62, 4409.
• Nakahara, H.; Shibata, O.; Rusdi, M.; Moroi, Y. Journal of Physical Chemistry C
2008, 112, 6398.
• Nakaya, K., Kohata, T., Doisaki, N., Ushio, H., Ohshima, T. Journal Fisheries
Science 2006, 72, 877.
• Nakashima, T.; Shimizu, M.; Kukizaki, M. Key Eng. Mater. 1991, 61/62, 513.
• Nisisako, T.; Torii, T.;Higuchi, T. Lab on a Chip 2002, 2. 24.
• Nisisako, T. and Torii, T. Lab on a Chip 2008, 8, 287.
• Rayner, M.; Trägårdh, G.; Trägårdh, C.; Dejmek, P. J. Colloid Interface Sci. 2004,
279, 175.
• Sagis, L. M. C.; de Ruiter, R.; Miranda, F. J. R.; de Ruiter, J.; Schroën, K.; van
Aelst, A. C.; Kieft, H.; Boom, R.; van der Linden, E. Langmuir 2008, 24; 1608.
• Saint-Jalmes, A.; Vera, M. U.; Durian, D. J. European Physical Journal B 1999,
12, 67.
• Saito, M.; Yin, L.-J.; Kobayashi, I.; Nakajima, M. Food Hydrocolloids 2005, 19,
745.
• Saito, M.; Yin, L.J.; Kobayashi, I.; Nakajima, M. Food Hydrocolloids 2006, 20,
1020.

References
152
• Sasaki, M.; Yasunaga, T.; Tatsumoto, N. Bull. Chem. Soc. Jpn. 1977, 50, 858.
• Schröder, V. and Schubert, H. Colloids Surf. A 1999, 152, 103.
• Steegmans, M. L. J.; Schroën, K.; Boom, R. M. Langmuir 2009, 25, 3396.
• Sugiura, S.; Nakajima, M.; Tong, J.; Nabetani, H.; Seki, M. J. Colloid Interface
Sci. 2000, 227, 95.
• Sugiura, S.; Nakajima, M.; Iwamoto, S.; Seki, M. Langmuir 2001 17, 5562.
• Sugiura, S.; Nakajima, M.; Kumazawa, N.; Iwamoto, S.; Seki, M. J. Phys. Chem. B
2002a, 106, 9405.
• Sugiura, S.; Nakajima, M.; Seki, M. Langmuir 2002b, 18, 5708.
• Sugiura, S.; Nakajima, M.; Seki, M. Langmuir 2002c, 18, 3854.
• Sugiura, S.; Nakajima, M.; Seki, M. Ind. Eng. Chem. Res. 2004a, 43, 8233.
• Sugiura, S.; Nakajima, M.; Oda, T.; Satake, M.; Seki, M. J. Colloid Interface Sci.
2004b, 269, 178.
• Tan, Y.-C. and Lee, A. P. Lab on a Chip 2005, 5, 1178.
• Tan, Y.-C.; Cristini, V.; Lee, A. P. Sensors and Actuators B – Chemical 2006, 114,
350.
• This, H. EMBO reports 2006, 7, 1062.
• Tong, J.; Nakajima, M.; Nabetani, H.; Kikuchi, Y.; Maruta, Y. J. Colloid Interface
Sci. 2001, 237, 239.
• Umbanhowar, P. B.; Prasad, V.; Weitz, D. A. Langmuir 2000, 16, 347.
• Unnikrishnan, S.; Jansen, H.; Berenschot, E.; Mogulkoc, B.; Elwenspoek, M. Lab
Chip 2009, 9, 1966.
• Utada, A. S.; Chu, L.-Y.; Fernandez-Nieves, A.; Link, D. R.; Holtze, C.; Weitz, D.
A. MRS Bulletin 2007, 32, 702.

References
153
• van der Graaf, S.; Steegmans, M. L. J.; van der Sman, R. G. M.; Schroën, C. G. P.
H.; Boom, R.M. Colloids Surf. A 2005, 266, 106.
• van der Graaf, S.; Nisisako, T.; Schroën, C. G. P. H.; van der Sman, R. G. M.;
Boom, R. M. Langmuir 2006, 22, 4144.
• van der Zwan, E.; van der Sman, R.; Schroën, K.; Boom, R.M. J. Colloid Interface
Sci. 2009a, 335, 112.
• van der Zwan, E.; Schroën, K.; Boom, R. M. Langmuir 2009b, 25, 7320.
• van Dijke, K. C.; Schroën, K.; Boom, R. M. In: Proceedings of the 8th World Con-
gress of Chemical Engineering 2009 Montréal, in press
• Van Rijn, C. J. M. and Elwenspoek, M. C. In Technical Proceedings of the Inter-
national Conference on Micro Electro Mechanical Systems (MEMS) 1995, Am-
sterdam, The Netherlands.
• Vladisavljević, G. T.; Kobayashi, I.; Nakajima, M. Powder Techn. 2008, 183, 37.
• Vlahovska, P. M.; Danov, K. D.; Mehreteab, A.; Broze, G. J. Colloid Interface Sci.
1997, 192, 194.
• Walstra, P. Physical Chemistry of Foods. 2003, Marcel Dekker Inc., New York,
United States.
• Walstra, P.; Geurts, T. J.; Wouters, J. T. M. Dairy Science and Technology (2nd
edition). 2006 CRC Press, Boca Raton, United States.
• Wooster, T. J., Golding, M., Sanguansri, P. Langmuir 2008, 24, 12758.
• Wrangham, R. Catching Fire How cooking made us human. 2009 Basic Books,
New York, United States.
• Wu, W. D.; Patel, K. C.; Rogers, S.; Chen, X. D. Drying Technology 2007, 25,
1907.
• Xu, Q. and Nakajima, M. Appl. Phys. Lett. 2004, 85, 3726.
References
154
• Yasuno, M.; Suguira, S.; Iwamoto, S.; Nakajima, M.; Shono, A.; Satoh, K. AIChE
J. 2004, 50, 3227.
Internet:
• www.elbulli.com
• www.nanomi.com
• www.micronit.com


Summary
157
Summary
A dispersion is a multiphase product in which at least one phase is dispersed into another
phase. In emulsions, those phases are immiscible liquids, for example oil and water. Many
products which we use in everyday life are emulsions. One can think of ointments, paints,
or sun protection cream, but the largest variety of emulsion-based products can be found
in food: butter, mayonnaise, cream, milk, salad dressings (like vinaigrettes), soups, sauces,
ice cream, and margarine are some examples. Emulsions are generally thermodynamically
unstable and they tend to separate into the original phases in due time. The droplet size
and the droplet size distribution are two important properties of an emulsion that have
influence on the stability, but also the taste and appearance.
Traditional emulsification techniques are based on disrupting larger droplets in coarse pre-
mix emulsions into smaller ones using intense force fields. A lot of energy is put into the
product; almost all energy dissipates into heat and only a very small fraction is used to
form the emulsion. In addition, the resulting emulsions have a wide droplet size
distribution. New microtechnological emulsification techniques hold a large advantage
over conventional techniques as they can produce narrowly dispersed emulsions, while
using the energy much more efficiently for the formation of droplets. This implies that the
process is much milder, therewith allowing production of shear and temperature sensitive
products such as multiple emulsions, which have great potential for reduced calorie
products or encapsulation of (healthy) components but cannot be produced with
traditional methods.
With these microtechnological techniques, droplets of the desired size are directly
generated with a device that is structured on the same scale as the droplets itself. In
general, one can divide these emulsification techniques into two categories based on the
driving force: shear-induced and spontaneous droplet generation. In the first category,
cross- or co-flow of the continuous phase is used to snap off droplets. In the second
category, interfacial tension forces cause droplet snap off without the need of a flow field.
These latter devices show the highest potential for the production of monodisperse
Summary
158
emulsions. Given the potential of these emulsions for a variety of purposes, this thesis
focuses on these microtechnological emulsification systems. The goal of this thesis was to
gain a thorough understanding of the principles and dynamics of spontaneous droplet
generation, and to use this understanding to design better devices, for improved product
properties at reasonable throughput.
In Chapter 2, experimental observations and extensive Computational Fluid Dynamics
simulations of a so-called terrace system are combined into an analytical predictive
model, based the analysis of local pressures in the device. This model was shown to have
good predictive value and to give direct insight in the relevant process parameters. Based
on that, the terrace structure itself could be evaluated, and various design rules could be
derived. The analytical model was also used as a steppingstone to gain insight in complex
phenomena such as dynamic interfacial tension effects and contact angle (surface
properties) of the used microdevices.
In Chapter 3, the ratio of the viscosities of the dispersed and the continuous phases was
found to be an important parameter for droplet formation in terrace-based systems. At
high viscosity ratios, the droplet size is constant, but below a critical value droplet size
increases, and below a minimum value no droplet formation is possible. These
characteristic ratios were found to be dependent on the device geometry, both
experimentally and through CFD simulation. The inflow of continuous phase is relatively
difficult at low viscosity ratios, resulting in steep pressure gradients on the terrace
structure which result in more oil supply during droplet formation, which in turn results in
larger droplets.
Detailed understanding of the existing spontaneous droplet formation in microchannel
systems resulted in a new design: Edge-based Droplet GEneration (EDGE), which is
described in Chapter 4. In EDGE, droplets are formed simultaneously along the edge of a
wide but shallow nozzle, in contrast to the terrace systems discussed in Chapters 2 and 3
where only one droplet is formed at a time. With EDGE, narrowly dispersed emulsion
droplets were formed in a broad pressure range. The system seems self-regulating: a
Summary
159
disturbance in the flow pattern does not influence the droplet formation. The droplet size
scales with the height of the droplet formation unit by a factor 5.5 – 6.5.
Fundamental aspects related to EDGE are discussed in Chapter 5; especially the filling of
the plateau was found to be essential for multiple droplet formation. Crucial for this is the
difference in pressure needed for the dispersed phase to invade the plateau and the
pressure needed to flow over the edge at the other end. In addition, the nozzle needs to
have a relatively high hydrodynamic resistance compared to the whole system, which
ensures even oil supply to the plateau and complete filling. The droplet formation
locations along the nozzle were found to be regularly distributed along the length of the
nozzle, and to be dependent on plateau depth. The EDGE process was simulated with
CFD, which revealed that the pressure distribution on the plateau is influenced only very
locally by droplet formation, therewith explaining the robust behavior of EDGE systems.
Also for EDGE, viscosity ratio was found to be an important parameter. Behavior similar
to that described for terrace structures (Chapter 3) was found, therewith also explaining
the differences in size between liquid droplets in emulsification and gas bubbles in
foaming. The minimum droplet size that can be obtained with EDGE could be derived
from a geometric model that includes contact angle effects.
EDGE has an advantage over microchannel systems mainly due to its simple structure,
robustness, and parallelization possibilities as discussed in Chapter 6. An important design
criterion when parallelizing droplet formation units is designing both oil supply and
emulsion drainage channels properly, i.e. minimizing the pressure drops in these channels
to obtain similar pressure conditions for each nozzle. The shape of the plateau may further
be tuned to the properties of the phases (especially viscosity is important), to obtain a
more stable process.
Many microfluidic droplet generation devices can generate equally sized droplets, but
emulsions with droplets below 10 micrometer are not common. Similarly, many devices
have limitations in the types of ingredients that can be used, due to their small dimensions.
Unfortunately, food-grade ingredients often pose problems. We found in Chapter 7 that
EDGE is rather tolerant in the type of ingredients used. Some examples of food-grade

Summary
160
dispersions are shown; for example, sunflower oil in whey protein concentrate gave an
emulsion with an average droplet size of about 7 micron and very stable process
operation. Furthermore, food-grade double emulsions (again 7 micron droplet size) were
produced, and foams of whey protein (with a bubble size of 30 micron). This indicates the
suitability of EDGE for products that otherwise cannot be made, and together with the
sizes of scaled-up versions, this shows that EDGE could be a truly interesting new
technology for the food industry.
The last chapter in this thesis discusses the research strategy followed in this project. The
combination of experiments with computational modeling of fluid dynamics, and
relatively simple analytical or geometric models is shown to be a very effective method
for investigating complex systems, to obtain fast process understanding and for further
development of the devices. EDGE has several possibilities to increase production
capacity, and this together with the advances in precision engineering is expected to make
large-scale application of emulsification with EDGE microstructures a possibility in the
near future.


Samenvatting
163
Samenvatting
Een dispersie is een product waarin minstens één fase is gedispergeerd in een andere fase.
In emulsies zijn deze fasen niet mengbare vloeistoffen, bijvoorbeeld olie en water. Een
heleboel producten die we dagelijks gebruiken zijn emulsies. Zalf, verf, zonnebrandcrème
zijn bekende voorbeelden, maar de meeste emulsies vindt men terug in levensmiddelen:
boter, mayonaise, room, melk, salade dressings (zoals vinaigrettes), soepen, sauzen,
roomijs en margarine zijn enkele voorbeelden. Emulsies zijn over het algemeen
thermodynamisch instabiel en hebben de neiging om na verloop van tijd te scheiden in de
verschillende fasen waaruit de emulsie is gemaakt. De druppelgrootte en de
druppelgrootteverdeling van emulsies zijn twee belangrijke eigenschappen die de
stabiliteit beïnvloeden, evenals het uiterlijk en de smaak.
Traditionele technieken om emulsies te maken zijn gebaseerd op het gebruik van brute
kracht waarmee een ruwe (zogenaamde premix) emulsie wordt verfijnd. Hierbij wordt erg
veel energie gebruikt, die bijna allemaal wordt omgezet in (ongewenste) warmte en
daarom is het erg lastig om druppels van gelijke grootte te verkrijgen; het produceren van
emulsies verloopt zeker verre van optimaal. Nieuwe emulgeertechnieken met behulp van
microstructuren hebben een belangrijk voordeel ten opzichte van de traditionele
methoden. Hiermee kunnen namelijk wel op een energie-efficiënte manier nagenoeg
gelijke druppels worden gemaakt. Bij deze technieken wordt weinig kracht op de druppels
uitgeoefend waardoor het zelfs mogelijk wordt om producten die gevoelig zijn voor deze
krachten en temperatuurseffecten, zoals dubbele emulsies, te maken terwijl dat met
traditionele methoden niet mogelijk is. Dubbele emulsies hebben een enorme potentie
omdat ze kunnen dienen als basis voor calorie arme producten of voor incapsulatie van
(gezonde) ingrediënten.
Door moderne microtechnologische apparaatjes, is het mogelijk om druppels te fabriceren
in dezelfde orde van grootte als de kleinste dimensie van de structuren. De
emulgeerprocessen die zich afspelen in deze apparaatjes kunnen grofweg worden
ingedeeld in twee categorieën, gebaseerd op de drijvende kracht: afschuiving gerelateerde

Samenvatting
164
en spontane druppelvorming. Bij de eerstgenoemde categorie snoert een snel stromende
continue fase druppels af van de andere fase die uit een kanaaltje stroomt. Bij spontane
druppelvorming worden druppels gevormd door grensvlakspanningskrachten zonder dat
daarbij stroming van de continue fase is vereist. De laatste categorie lijkt de meeste
potentie voor het maken van gelijkgrote druppels te hebben en gezien het grote potentieel
voor dit type emulsies focussen we in dit onderzoek op die systemen. Het doel van dit
onderzoek was om grondige kennis te verzamelen over de principes van spontane
druppelvorming, en deze kennis toe te passen om zo te komen tot betere processen voor
verbeterde producten die op redelijke schaal geproduceerd kunnen worden.
In hoofdstuk 2 zijn experimentele waarnemingen en resultaten van uitgebreide
vloeistofdynamica modellen van zogenaamde terras-systemen gecombineerd tot een
analytisch voorspellend model op basis van lokale drukken. Het model heeft goede
voorspellende waarde en geeft direct inzicht in procesparameters waardoor ontwerpregels
kunnen worden afgeleid, ook voor de terrasstructuur. Deze relatief simpele beschrijving is
gebruikt als springplank om inzicht te verkrijgen in complexer gedrag zoals dynamische
grensvlakspanningseffecten en contacthoeken van de fasen met de gebruikte
microstructuren.
In hoofdstuk 3 is gevonden dat de viscositeitratio van beide fasen een belangrijke
parameter is voor het druppelvormingsproces in de terrassystemen. Bij een hoge
viscositeitratio is de druppelgrootte constant, onder een kritische waarde worden echter
grotere druppels gevormd en beneden de minimale ratio is er geen druppelvorming meer
mogelijk. Uit zowel de experimenten als uit de computersimulaties bleek dat deze
karakteristieke waarden afhankelijk zijn van het systeemontwerp. De instroom van
continue fase in de microstructuur (terras) is relatief lastig bij lage ratio, waardoor steile
drukgradiënten op het terras ontstaan die resulteren in grotere olie toevoer, en dus grotere
druppels.
Gedetailleerde kennis over spontane druppelvorming in de eerder genoemde
microkanaalsystemen resulteerde in een nieuw ontwerp: Edge-based Droplet GEneration
(EDGE), welke in hoofdstuk 4 wordt geïntroduceerd. In EDGE worden meerdere druppels

Samenvatting
165
tegelijkertijd aan de rand van een brede, ondiepe sleuf gevormd, dit in tegenstelling tot de
terrassystemen uit hoofdstuk 2 en 3 waar altijd één druppel gelijktijdig gevormd wordt.
Met EDGE, worden druppels van nagenoeg gelijke grootte over een breed drukgebied
stabiel gegenereerd en het systeem lijkt zelfregulerend als er een verstoring van het
stromingsprofiel optreedt. De druppelgrootte schaalt met een factor 5.5-6.5 met de hoogte
van de druppelgenerator.
Fundamentele aspecten van het EDGE principe worden in hoofdstuk 5 beschreven; vooral
het opvullen van de plateaus is essentieel in om deze systemen tot meerdere druppels
tegelijkertijd te komen. Hiervoor is een voldoende groot verschil nodig tussen de druk die
nodig is om over het plateau te stromen (spreiden) en om druppels te maken. Daarnaast
dient de microstructuur de hoogste stromingsweerstand in het systeem te hebben om
voldoende olietoevoer en volledig vullen van het plateau te garanderen. De locaties aan de
rand waar druppels gevormd worden bleken regelmatig te zijn verdeeld over de
beschikbare lengte en afhankelijk te zijn van de plateaudiepte. Het EDGE proces is met
CFD software gesimuleerd, en daaruit volgde dat de drukgradiënten op het plateau
beperkt zijn tot een klein gebied, wat ook de stabiliteit van het gehele systeem verklaart.
Daarnaast bleek ook hier de viscositeitratio een belangrijke procesparameter en het
verschil in grootte tussen oliedruppel en luchtbel kon hiermee worden opgehelderd. Een
minimale druppelgrootte die met EDGE kan worden verkregen kan worden afgeleid met
een puur geometrisch model dat ook de invloed van de contacthoek meeneemt.
In hoofdstuk 6 is beschreven dat EDGE systemen een groot voordeel hebben ten opzichte
van andere microtechnologische systemen doordat het relatief simpele structuren zijn, het
een robuust proces is en het goed op te schalen is. Belangrijk is wel dat de toevoer- en
afvoerkanalen goed worden ontworpen zodat grote drukgradiënten worden voorkomen en
vergelijkbare condities bij elk plateau in het systeem opgelegd kunnen worden. De vorm
van de plateaus kan worden aangepast aan de eigenschappen van de fasen (vooral
viscositeit is van belang) om een stabieler proces te krijgen.
Veel micro druppelgenerators kunnen druppels van gelijke grootte produceren, maar
slechts enkele systemen kunnen dit als het om druppels kleiner dan 10 micrometer gaat.
Samenvatting
166
Daarbij is de keuze aan ingrediënten beperkt als gevolg van de schaal van de structuur;
helaas geven ‘food-grade’ ingrediënten vaak problemen. In hoofdstuk 7 laten we zien dat
EDGE weinig beperkingen kent wat betreft ingrediënten en stabiele procesvoering. Als
voorbeeld is zonnebloemolie in een wei-eiwit oplossing geëmulgeerd, waarbij druppels
van 7 micron werden verkregen. Verder is een ‘food-grade’ dubbele emulsie in magere
melk gemaakt (ook hier waren de druppels 7 micrometer) en zijn schuimen gemaakt met
melkeiwit (met een belgrootte van ongeveer 30 micron). Deze testen geven aan dat EDGE
geschikt is om producten te maken die anders niet gemaakt kunnen worden. Samen met de
dimensies van de opgeschaalde EDGE apparaten, geeft dit aan dat EDGE een waarlijk
interessante nieuwe technologie is voor de levensmiddelenindustrie.
Het laatste hoofdstuk in dit proefschrift beschrijft de onderzoeksstrategie die gebruikt is
tijdens dit project. De combinatie van experimenten, uitgebreide computersimulaties en
analytische modellen bleek erg effectief om complexe systemen te onderzoeken en snel
tot procesbegrip en ontwikkeling te komen. Voor EDGE bestaan verschillende opties voor
opschaling om tot een hogere productiviteit te komen. Door deze opschalingstap, samen
met de vooruitgang in de fijnmechanische productie mag worden verwacht dat emulgeren
met EDGE microstructuren mogelijk wordt in de nabije toekomst.


Dankwoord
169
Dankwoord
Druppels maken, bekijken, berekenen, meten, beschrijven en wat je al niet meer met
druppels kunt doen. Viereneenhalf jaar lang en er ook nog, naar mijn bescheiden mening,
een mooi proefschrift over schrijven. Nu zit het promotietraject er voor mij op en kijk ik
er met een tevreden gevoel op terug. Eindelijk mag ik dan ook het meest gelezen stuk van
een proefschrift schrijven en is het tijd om de voor mij belangrijke personen te bedanken.
Karin, als directe begeleider wil ik graag jou als eerste bedanken. Ik denk dat we van het
begin af aan op een lijn hebben gezeten qua manier van denken en doen. Je flexibiliteit,
geduld en relativeringsvermogen maken jou de ideale begeleider voor mij en ik ben dan
ook erg blij dat ik toentertijd besloten heb om het voorgestelde promotieproject onder
jouw supervisie te gaan doen. Jouw enorme kennis en ervaring op veel gebieden waar ik
weinig tot niets van wist (of weet) hebben me vaak in de juiste richting gewezen.
Uiteraard mag ik je gesleutel aan mijn manuscripten niet vergeten, ondanks dat je er vaak
hele stukken uitsloopte. Ze zijn daardoor wel een stuk sterker en beter leesbaar geworden.
Ik hoop ook dat we in de toekomst af en toe kunnen blijven ‘buurten’. Ik zie dit
proefschrift als een bekroning op onze samenwerking en ik ben je erg dankbaar hiervoor.
Remko, ik vind het een eer om bij jou te mogen promoveren. Tijdens de meetings die we
hadden, maar ook daarbuiten, wist je altijd met nieuwe mogelijkheden op de proppen te
komen. Niet alleen voor de aanpak van een bestaand probleem, maar ook voor de daarop
volgende opties. Soms zoveel stappen vooruit dat het onmogelijk binnen een
promotietraject uitgevoerd zou kunnen worden. Maar juist díe ver vooruitziende blikken
zijn volgens mij erg belangrijk om het enthousiasme in het huidige werk te behouden.
Normaal kom je niet zoveel op het lab, maar bij mijn houtje-touwtje ‘druppel-device met
objectglaasjes, aluminiumfolie en Praxis-lijm’ heb je ruim anderhalf uur naar de
gevormde druppels staan kijken, met de mooiste speculaties over de mogelijkheden. Dat
heeft me toen nog even een extra zetje gegeven! Ik heb erg veel van je geleerd, ook tijdens
de gesprekken die we in Chili hadden onder het genot van een Pisco Sour. Bedankt.
Dankwoord
170
Technische en administratieve ondersteuning is onmisbaar bij onderzoek. Gelukkig
hebben Jos, Maurice, Joyce, Hedy, Miranda, Martin, Boudewijn (microscopiecentrum) en
Hans (werkplaats) me hierbij altijd erg goed geholpen. Gerrit, dank voor hulp met mijn
PC en het omzeilen van allerlei ICT restricties die vanwege mijn simulatiewerk
simpelweg niet konden en voor het plunderen van het paaseibakje. Pieter, jou ben ik
enorm veel dank verschuldigd. Ik was intensief computercluster gebruiker, had geen
enkele sjoege van een Linux omgeving en wilde altijd meer nodes, een uitgebreidere
licentie en snellere machines. Daarbij pikte ik ook eigenlijk altijd wel een stuk boterkoek
mee als je die bij je had. Je ijzersterke analyses van de man-vrouw relatie zal ik overigens
ook zeer gaan missen! Jan, als mede CFD-er bedankt voor je hulp bij diverse STAR-CD
fratsen, je flexibiliteit met licentie verdeling of gewoon het slap ouwehoeren.
Het project was een samenwerking met verschillende industriële partners. Regelmatig zijn
we dan ook naar het oosten afgereisd voor overleg. Gert, Albert, Ramona en Dennis, met
jullie heb ik het meeste te maken gehad. Gert, in het begin had ik moeite met je directe
manier van communiceren, ondanks dat ik het wel vaak met je eens was. Ik heb
waardering voor de manier waarop je Nanomi leidt en ik hoop dat je met zowel de
originele als de nieuwe EDGE technologie succesvol zult blijven. Albert, Ramona en
Dennis, ik vind het erg leuk dat mijn onderzoek zo gewaardeerd wordt door jullie. Ik ben
blij dat ik uiteindelijk ook echt met food-grade ingrediënten heb gewerkt, iets wat jullie
logischerwijze erg gestimuleerd hebben. Ik ben benieuwd naar de vervolgstappen met
EDGE; ik hoop dat het octrooi erg waardevol zal blijken.
During my PhD project I was lucky enough to supervise 8 students with their BSc. or
MSc. thesis: Linda, Siyu, Wei, Sophie, Peiheng, Jannes, Abid and Riëlle. With great
pleasure I am looking back to the time we have worked together. I hope you did not
develop a phobia about droplets and enjoyed your time in the process engineering group.
You all contributed to this thesis in one way or another, thank you very much.
In the last stage of my PhD I had the opportunity to go to the ‘founding fathers’ of the
microchannel emulsification in Japan. I would like to thank Nakajima-sensei, Kobayashi-
san and Uemura-san very much for giving me this chance and for the wonderful time I
Dankwoord
171
had during those two months. All the members of the Food Engineering division
immediately did me feel comfortable and I have enjoyed the several parties and activities,
domo arigato gozaimasu! I am very proud that chapter 3 in this thesis resulted in a joint
publication of the National Food Research Institute, University of Tsukuba and
Wageningen University. Kobayashi-san, it is an honour that you agreed to undertake the
long trip from Japan to be a member of the thesis committee. Of course, I would like to
thank Prof. Norde, Prof. Mugele and Prof. Van Straten for taking place in the committee
as well and I hope you have enjoyed reading this thesis.
Kamergenoten, ik richt mij tot u. Mede 619-iconen, Marieke en Daniël, we hebben ruim 4
jaar bij elkaar op de kamer gezeten. Vreemd dat we nooit een enzymatische druppelspons
hebben geconstrueerd, had vast en zeker een publicatie opgeleverd! Marieke, beide als
Zeeuw geboren dus konne me mekaore verstae zelfs at d’r naer uus hebeld wier omda je
nog blommen most bestelle. Dank voor het introduceren van de onderwaterwereld, ook al
was het zicht soms slecht, het water koud en schijnen de Snorkels niet te bestaan. We
liepen parallel met ons onderzoek en dus konden we nogal eens sparren over waarom,
hoe, wie en wat. Je bent een week eerder begonnen maar promoveert ruim een maand
eerder, gefeliciteerd met je overwinning. Gelukkig won ik meestal met tennis. Daniël, uit
het zeer hoge noorden, toch te verstaan en ook nog een Bourgondische instelling (ik ben
stoofpotjes zeker meer gaan waarderen). De gedachte aan de legendarische BBQ waar jij
het vlees had besteld (en ik je van deskundig advies had voorzien) tovert altijd een
glimlach op m’n gezicht: Er was niet teveel vlees, er werd gewoon te weinig gegeten. The
Wall of Science bevat ook enkele toppers. En ik dacht dat ik me niet snel druk maakte,
maar volgens mij span jij hier de kroon. In het begin hield Martijn ons gezelschap, toen
een tijdje Marzia, maar toen toch weer een meer bekende naam: Martijntje. Het was, om
in kneuterige termen te blijven, altijd gezellig en vertrouwd. Allen erg bedankt daarvoor.
Martijntje, de zorg voor de planten en de BBQ-folders wil ik graag aan jou overdragen.
Dorinde, Anja en Wouter, ik heb het erg leuk gevonden om met jullie de AIO-reis naar
Japan te organiseren. Ik heb altijd geprobeerd om me regelmatig met nog iets totaal anders
dan m’n druppels bezig te houden bij Proceskunde. De AIO-reis was daarvan het grootste
Dankwoord
172
project. Ik denk dat het een zeer geslaagde reis was, zowel op educatief als sociaal vlak.
Wij vulden elkaar als commissie goed aan op punten of momenten als er om wat voor
reden dan ook (ja Anja, ik weet het…) even iemand wat minder bij de les was. Ik stel voor
om regelmatig een yakitori-sessie of een sushi-boot bij de Japanner te blijven doen.
Dorinde, jou heb ik het beste leren kennen. Bij de bergen werk die jij verzet is de Fuji-san
een heuveltje en stiekem ben ik nu ook meer bekend met de kuren van je algjes. Ik ben
blij dat jij m’n paranimf wilt zijn.
Het is een komen en gaan van mensen op de vakgroep, ik wil iedereen bedanken voor de
vele gezellige koffiepauzes, borrels, labuitjes, lunches en andere activiteiten. Klaske, Sina
en Dorinde: Keep the borrelcie alive! (en plan eens een oud-AIO borrel)
Pa en ma, een goede basis is het begin van alles, dus dit proefschrift is ook van jullie. As
stugge Zeeuw heboore kan je toch een ‘wereldreiziger’ oare, maar op Flupland kom ik
oaltied tuus. Mark (ik hoop dat je me geen Drirkoen gaat noemen in navolging van
Droetker) en Saskia, Anja en Wim, Dennis en Chelly, vrienden uit Zeeland, Wageningen
of waar dan ook, bedankt voor jullie interesse en gezelligheid. Jaap, ik zal je binnenkort
overhoren met betrekking tot de inhoud van dit boekje. Bert (Brutus), als Zeeuwse vriend
uit Wageningen vind ik het erg leuk dat je beide ‘clubs’ kan vertegenwoordigen als
paranimf. Ook wil ik graag Hans apart bedanken voor de wekelijkse squashstrijd en voor
het bewijzen dat barbecueën niet seizoensgebonden is.
Eén iemand zit nog met smart te wachten. Het is al een heel verhaal geworden, maar je
schrijft ook maar één proefschrift-dankwoord in je leven. Een leven dat ik graag wil delen
met mijn meisje, Bianca. Samen zijn we heel sterk en genieten we van de dingen die we
leuk vinden. Ik ben ervan overtuigd dat we nog een fantastische tijd tegemoet gaan!


Publications
175
Publications
Peer reviewed journals
van Dijke, K. C.; Schroën, K.; Boom, R. M. Microchannel Emulsification: From Computational Fluid Dynamics to Predictive Analytical Model. Langmuir 2008 24, 18, 10107-10115.
van Dijke, K. C.; Veldhuis, G.; Schroën, K.; Boom, R. M. Simultaneous formation of many droplets in a single microfluidic droplet formation unit. AIChE J. 2009 DOI: 10.1002/aic.11990.
van Dijke, K. C.; Veldhuis, G.; Schroën, K.; Boom, R. M. Parallelized Edge-based Droplet GEneration (EDGE) Devices. Lab on a Chip 2009 9, 2824-2830.
van Dijke, K. C.; Schroën, K.; van der Padt, A.; Boom, R. M. EDGE emulsification for food-grade dispersions. Submitted.
van Dijke, K. C.; Kobayashi, I.; Schroën, K.; Uemura, K.; Nakajima, M.; Boom, R. M. Effect of viscosities of dispersed and continuous phases in microchannel oil-in-water emulsification. Accepted for publication in Microfluidics and Nanofluidics 2009 DOI: 10.1007/s10404-009-0521-7.
van Dijke, K. C.; de Ruiter, R.; Schroën, K.; Boom, R. M. The mechanism of droplet formation in microfluidic EDGE systems. Accepted for publication in Soft Matter 2009 DOI: 10.1039/b916141d.
van der Zwan, E.; Schroën, K., van Dijke, K. C.; Boom, R. M. Visualization of droplet break-up in pre-mix membrane emulsification using microfluidic devices. Colloids and Surfaces A 2006, 277, 223.
Patent
van Dijke, K. C.; Schroën, K.; Boom, R. M.; Veldhuis, G.; van der Padt, A. Microfluidic method and apparatus for generating a dispersion 2009 NL2002862
Conference proceedings
van Dijke, K. C. ; Schroën, K; Boom R. M. Pressure gradient criterion for microchannel emulsification processes. In tenth international congress on engineering and food (ICEF) 2008 20-24 April, Viña del Mar, Chile.
van Dijke, K. C.; Schroën, K.; Boom, R. M. Microstructures for emulsification. In fourteenth World Congress of Food Science and Technology (IUFOST) 2008, 19-23 October, Shanghai, China.
van Dijke, K. C.; Schroën, K.; Boom, R. M. In: Proceedings of the 8th World Congress of Chemical Engineering 2009 23-27 August, Montréal, Canada
Publications
176
Oral presentations
Department of Food Technology at Lund University, PhD-trip 2006 Lund, Sweden.
Netherlands Process Technology Symposium. 2007, Veldhoven, The Netherlands.
10th International Congress on Engineering and Food. 2008, Viña del Mar, Chile
Lecture at National Food Research Institute. 2009, Tsukuba, Japan.
8th World Congress of Chemical Engineering 2009 Montréal, Canada.
Poster presentations
Netherlands Process Technology Symposium. 2005, Veldhoven, The Netherlands.
4th World Congress on Emulsions 2006, Lyon, France
Netherlands Process Technology Symposium. 2007, Veldhoven, The Netherlands.
10th International Congress on Engineering and Food. 2008, Viña del Mar, Chile
Award
Best Poster during Netherlands Process Technology Symposium. 2007
Documentary
Dijke, K.C. van, van der Zalm, E.; Boom, R.M.; amongst others De Toekomst van ons Voedsel. VPRO Tegenlicht (on DVD) 2008
http://www.vpro.nl/programma/tegenlicht/afleveringen/38243331/


Curriculum Vitae
179
Curriculum Vitae
Koen Cornelis van Dijke was born in Sint Philipsland, The
Netherlands, on September 16th, 1980. He went to primary
school in this small village in the province of Zeeland and
continued education at the Regionale Scholengemeenschap
‘t Rijks in Bergen op Zoom. After graduation in 1998, Koen
started to study Mechanical Engineering at the Technical
University in Eindhoven, but after the first year he switched to
Food Technology at Wageningen University. During his study
he performed a minor thesis project at the Systems and Control group of Prof. Van Straten
about the “Optimization of cooling processes of pig carcasses.” His major thesis project
was about “Pre-mix membrane emulsification” in the Food Process Engineering group of
Prof. Boom. Koen finalized his study with an internship about “Intelligent decision
systems in food industry” at the Kaunas University of Technology in Lithuania and
“Modelling and optimizing the scalding process of chickens” at Stork PMT in Boxmeer,
The Netherlands. In February 2005 Koen started his PhD-project under supervision of
Prof. Boom and Dr. Schroën at the Food Process Engineering group. This so-called
“Microdruppels” project focused on emulsification with microstructures, in which the
goal was to gain thorough understanding of spontaneous droplet formation processes that
can occur in specially designed structures with very small characteristic dimensions. In
the final stage of the PhD trajectory (April and May 2009) Koen joined the Advanced
Food Technology Lab at the National Food Research Institute in Tsukuba, Japan for a
collaborative project with Prof. Nakajima, Dr. Kobayashi and Dr. Uemura. The results of
the research performed in the last 4 and a half years are described in this thesis, including
a new and promising emulsification process. On October 5th 2009, Koen started working
as Scientist Process Technology Powders at Danone Research in Wageningen.
Email: [email protected]

Training activities
181
Training activities
Discipline specific activities Courses:
Unified Approach to Mass Transfer (OSPT, 2005, Enschede, The Netherlands) Star-CD Basic Training Course (CD-Adapco, 2005, Nürnberg, Germany) Numerical Methods in Chemical Engineering (OSPT, 2006, Eindhoven, The Netherlands) Hochschulkurs Emulgiertechnik (TH Karlsruhe, 2006, Karlsruhe, Germany) Modelling and Computation of Multiphase Flow (ETH, 2007, Zurich, Switzerland)
Congresses, symposia:
Netherlands Process Technology Symposium (2005 / 2007, Veldhoven, The Netherlands) World Congress on Emulsions (2006, Lyon, France) Euromech: Numerical Simulation of Multiphase flow (2006, Scheveningen, The Netherlands) 10th International Congress on Engineering and Food (2008, Viña del Mar, Chile) Internship at National Food Research Institute (2009, Tsukuba, Japan) 8th World Congress on Chemical Engineering (2009, Montreal, Canada) General courses Supervising and Guiding BSc./MSc. Thesis Students (OWU, 2005, Wageningen, The Netherlands) PhD Competence Assessment (WGS, 2005, Wageningen, The Netherlands) Scientific Writing (Centa, 2006, Wageningen, The Netherlands) Career Perspectives (WGS, 2008, Wageningen, The Netherlands) Effective Behaviour in Professional Surroundings (WGS, 2008, Wageningen, The Netherlands) Business Course Strategic & Innovation Management (Arthur. D. Little, 2008, Rotterdam, The Netherlands) Entrepreneurial Bootcamp (DAFNE, 2008, Wageningen, The Netherlands) Advanced Course: Guide to Scientific Artwork (WU Library, 2009, Wageningen, The Netherlands) Optionals Brainstorm Week Process Engineering 2005 PhD-trip Process Engineering 2006 (Denmark and Sweden) PhD-trip Process Engineering 2008 (Japan) Organization of PhD-trip to Japan (2007/2008) Brain & Game Day Process Engineering 2008 Network Young Membrains (2005, Enschede, The Netherlands; 2007, Thessaloniki, Greece; 2008, Berlin, Germany)

The research described in this thesis was part of the Microdruppels project, a collaboration
between Wageningen University, Nanomi, FrieslandCampina, and Demcon amongst
others. The project was financially supported by the Dutch Ministry of Economic Affairs
and the Dutch provinces of Gelderland and Overijssel.
Printed by Ipskamp, Nijmegen. Cover design: Koen van Dijke and Roy van Eck.
Copyright © 2022 FDOKUMEN