Nutritious ponds - WUR eDepot
184
Nutritious Ponds Valorising waste using natural production Devi Hermsen
-
Upload
khangminh22 -
Category
Documents
-
view
1 -
download
0
Transcript of Nutritious ponds - WUR eDepot
Nutritious Ponds Valorising waste using natural production
Devi Hermsen
Nutritious Ponds Valorising waste using natural production
Devi Hermsen
Hermsen, Devi 11052 Cover def v3.indd Alle pagina'sHermsen, Devi 11052 Cover def v3.indd Alle pagina's 17-3-2020 16:51:3717-3-2020 16:51:37

Nutritious Ponds. Valorising waste using natural production.
Devi Hermsen

Thesis committee
PromotorsDr. M.C.J. VerdegemAssociate professor Aquaculture and Fisheries GroupWageningen University & Research
Prof. Dr J.A.J. VerrethEmeritus professor of Aquaculture and Fisheries Wageningen University & Research
Other membersProf. Dr. K.J. Keesman, Wageningen University & ResearchProf. Dr. G. van Stappen, Ghent University, BEDr. W.F. Pellikaan, Wageningen University & ResearchDr T. Policar, University of South Bohemia, CZ
This research was conducted under the auspices of the Graduate School Wageningen Institute of Animal Sciences

Nutritious Ponds. Valorising waste using natural production.
Devi Hermsen
Thesis
submitted in fulfilment of the requirements for the degree of doctorat Wageningen University
by the authority of the Rector Magnificus, Prof. Dr A.P.J. Mol,
in the presence of the Thesis Committee appointed by the Academic Board
to be defended in publicon Tuesday 21 April 2020
at 11 a.m. in the Aula.

D. HermsenNutritious Ponds. Valorising waste using natural production., 180 pages.
PhD thesis, Wageningen University, Wageningen, The Netherlands, (2020)With references, with summary in English
ISBN 978-94-6395-297-2DOI https://doi.org/10.18174/512943

Dedicated to
Gerrit J. Jansen
in memoriam
a man of true wisdom and challenging philosophy

Content
Chapter 1 General Introduction 09
Chapter 2 In situ fatty acid production supports shrimp yields in diets 21 lacking fish oil and fishmeal.
Chapter 3 Essential fatty acid dynamics in intensive mesocosm shrimp ponds 43 (Litopenaeus vannamei).
Chapter 4 Nutrient distribution and utilization under declining feed input 67 and increasing fertilizer input in shrimp mesocosms fed a HUFA poor diet.
Chapter 5 Feeding shrimp carbon and nitrogen through the feed or 89 through the system?
Chapter 6 General Discussion 107
References 131Summary 155Acknowledgements 161About the author 169List of publications 173WIAS training and supervision plan 177


General Introduction
Chapter 1

10 CHAPTER 1
GENERAL INTRODUCTION 11
1
1.1. Background
1.1.1. Eutrophication and trophic transfer in aquatic ecosystemsToday, a key issue in ecology is to understand and predict the impact of anthropogenic climate change caused by greenhouse gas emissions (rising temperatures and acidification of oceans), and exploitation of natural resources (overexploitation and waste production) on ecosystem dynamics. Impacts are found on both terrestrial systems and marine systems and include decreased productivity and shifted species distributions (Hoegh-Guldberg and Bruno, 2010). As a result of intensified industrialization and agribusiness, eutrophication increases in coastal and estuarine waters, causing changes in organism communities and food web distributions (Parry et al., 2006). In hypereutrophic lakes it can often be observed that algae standing stock build up in the system with limited transfer to the next trophic level. As a consequence, the potential contribution of algae into higher trophic levels in the aquatic food web is not fully realized. It has been suggested that the plant-animal trophic link is the most unpredictable in the food web. Biomass and energy transfer are regularly inhibited at the phytoplankton-zooplankton link (Brett and Goldman, 1996, Brett and Goldman, 1997, McQueen et al., 1989, Müller-Navarra et al., 2000, Müller-Navarra et al., 2004, Micheli, 1999). The empirical relation between high nutrient loading, limited trophic transfer and low productivity has been studied for decades but is still not fully understood (Vollenweider, 1976, Carpenter and Kitchell, 1984, McQueen et al., 1986, McQueen et al., 1989, Sommer et al., 1986, Schindler, 1987). Today, there is a broad consensus that the nutritional quality of food is a key factor determining trophic transfer (DeMott and Tessier, 2002, Müller-Navarra and Lampert, 1996, Elser et al., 1998). In general, the high nutritional quality of microalgae, providing protein, energy, vitamins and minerals, are vital to the food web. In addition, some algae species store large quantities of fat or are a source of long-chain polyunsaturated fatty acids. The latter are conserved by higher organisms in algae-based food webs (Dalsgaard et al., 2003).
1.1.2 The HUFA bottom-up hypothesis in aquatic ecosystemsLong-chain polyunsaturated fatty acids (PUFA) are biochemical compounds affecting the physiology, development and health status of animals. Although only alpha-linolenic acid (18:3n-3, ALA) cannot be synthesized de novo by animals and is therefore essential within the ω-3 group, the health and growth performance stimulating role of the highly unsaturated fatty acids (HUFA; polyunsaturated fatty acids with more than 20 carbon length and more than 4 double bounds) eicosapentaenoic acid (20:5n-3, EPA) and docosahexaenoic acid (22:6n-3, DHA) became well recognised. Animals can convert ALA into EPA and DHA, but with an efficiency of only 5% (Stark 2008, Wall 2010, Davis 2003). Therefore, direct access to EPA or DHA through the diet is beneficial and by some researchers considered conditionally essential. Already at the base of the aquatic food web, the stimulating role of EPA and DHA can be observed. Studies show that a high content of EPA and DHA in algae is a strong

12 CHAPTER 1
predictor of zooplankton growth and reproducti on, and may therefore be important for the development of the enti re food web (Müller-Navarra et al., 2000, Müller-Navarra, 1995, Jonasdotti r et al., 1995, Brett and Goldman, 1997, Gladyshev et al., 2011). Brett et al., (1997) compared Eltonian biomass pyramids between a hypereutrophic fresh water lake and the marine Peruvian upwelling zone and stated that in effi cient systems like marine upwelling zones, a given amount of phytoplankton biomass can support a 25 ti mes larger zooplankton biomass and 50 ti mes larger fi sh biomass compared to ineffi cient systems like many hypereutrophic fresh water lakes (Figure 1) (Brett and Müller-Navarra, 1997). They relate this effi ciency directly to the content of HUFA in the phytoplankton biomass, since marine upwelling zones are known for a constant high abundance of diatoms and cryptophytes, phytoplankton with high EPA content. This is in contrast with hypereutrophic lakes which are characterized by growth of HUFA-poor cyanophytes and green algae with a poor nutriti onal quality resistant to grazing. Trophic transfer driven by HUFA content is known as the HUFA bott om-up hypothesis, and proposed to be a bott leneck in eutrophic aquati c ecosystems (Müller-Navarra et al., 2000, Müller-Navarra et al., 2004).
Figure 1. Fig ure adopted from Brett and Müller-Navarra, 1997. In effi cient systems like marine upwelling zones (in this example the Peruvian Upwelling), a given amount of phytoplankton relati ve biomass results is 25x more zooplankton and 50x more fi sh relati ve biomass than in hypereutrophic lakes (Clear Lake). It shows that food web structures depend on trophic transfer effi ciency, supported by food quality of primary producers.
This proposed bott leneck is supported by Gladyshev et al., (2011), emphasizing the role of ω-3 HUFA in shaping the aquati c food web pyramid (Gladyshev et al., 2011). They found that trophic transfer between phytoplankton and zooplankton of ω-3 PUFA and HUFA in eutrophic fresh water systems was about twice as high as bulk carbon transfer, pinpointi ng high rates of bioaccumulati on of HUFA by zooplankton. These fi ndings agree with the suggesti on of Brett et al., (2006) stati ng that zooplankton preferenti ally catabolizes other fatt y acids in order to store ALA, EPA and DHA (Brett et al., 2006). However, when studying the HUFA-bott om-up hypothesis in lakes under eutrophic conditi ons characterized by cyanophyte blooms, there could also be other factors than low HUFA content inhibiti ng trophic transfer, making low HUFA concentrati ons a consequence rather than a cause. Other factors include ingesti on

GENERAL INTRODUCTION 13
1
or digesti on problems related to the uptake of specifi c phytoplankton species (Rohrlack et al., 1999, Lance et al., 2006), or a disparity in elemental rati os between prey and consumer, known as stoichiometry mismatch (Schoo et al., 2013).
1.1.3 Stoichiometry aff ecti ng trophic transfer in aquati c ecosystemsBesides energy content and biochemical compositi on aff ecti ng nutriti onal quality and thus trophic transfer, also elemental (nitrogen and phosphorous) rati o diff erences between producers and consumers are important since such diff erences may correspond with diff erences in physiological functi ons. For example, organisms relati vely high in carbohydrates or lipids show higher carbon:nitrogen (C:N) or carbon:phosphourous (C:P) rati os than organisms relati vely high in proteins or nucleic acids (Waal & Boersma unpublished). The fi eld of stoichiometry describes the relati onship between organisms and their environment by looking at the elemental balance of energy (carbon) and nutrients (nitrogen or phosphorous). Heterotrophic organisms show a narrow range in elemental compositi on due to homeostasis. They take up carbon and nutrients at the same ti me, and their uptake therefore refl ects the biochemical compositi on of their food. Food quality for heterotrophic organisms depends on how closely the food’s elemental rati os match the species own elemental rati o. Primary producers however refl ect the stoichiometry of their environment. Primary producers, being autotrophic organisms, standing at the base of the food web transforming inorganic nutrients into organic compounds, take up carbon and nutrients separately. This results in an elemental compositi on refl ecti ng the elemental availability of their surroundings, which may vary largely. Although primary consumers possess several mechanisms to cope with diff erences in food quality such as selecti ve feeding or increased turnover rates, there is a point where a mismatch with the stoichiometry of their prey hinders trophic transfer, aff ecti ng the whole food web (van de Waal et al., 2009) (Figure 2). Monitoring the stoichiometry of producers and primary and secondary consumers should therefore allow to predict food quality and transfer effi ciency of energy and nutrients through the food web. Müller-Navarra et al., (2004) showed that phytoplankton HUFA content, was negati vely correlated to the total exogenous phosphorous concentrati on in fresh water lakes. They explained their fi ndings by the fact that a high phosphorous concentrati on in the water column is in favour of fast growth of cyanobacteria, which contain some ALA, can store large amounts of phosphorous, but hardly contain HUFA and are therefore minimally consumed, decreasing trophic transfer effi ciency. Unfortunately, since the HUFA bott leneck was proposed by Müller-Navarra et al., (2000, 2004), litt le experimental work has followed, but some modelling work has been done on biochemical food quality, stoichiometry, and yield distributi ons over the food web. Perhar et al.,(2012) incorporated the HUFA bott om-up hypothesis in a limiti ng nutrient mathemati cal model to investi gate the ecological implicati on of aquati c food web dynamics (Perhar et al., 2012). They showed that in oligotrophic water bodies, biomass distributi on had a strong reliance on exogenous phosphorous, oft en resulti ng in inverted food web distributi ons (relati vely

14 CHAPTER 1
high consumer biomass supported by comparati vely low primary producer biomass). But in eutrophic systems, the consumers relied mostly on HUFA availability, and oft en HUFA limitati on resulted in algal blooms. The study showed that opti mal levels of both HUFA as well as phosphorous (stoichiometry) at the plant-animal interface are crucial for shaping the food web pyramid and HUFA conservati on through the food web.
Figure 2. Picture f rom van de Waal et al., (2009). Primary producers show a wide range of C:P rati os. Consumer animals like zooplankton or fi sh show a narrow-fi xed range due to homeostasis. According to the stoichiometry hypothesis, a possible mismatch and trophic decoupling might be expected when C:N:P rati os become too far apart between food and consumer.
1.2. Formulati on of the problem
1.2.1 Challenges in aquaculture World aquaculture producti on conti nues to be the fastest growing animal-food producing sector with an immense increase from 32.4 to 66.6 million MT in the period 2000-2012. Aquaculture products are an important source of animal protein and HUFA, which are crucial for human health. The producti on from capture fi sheries reached its maximum potenti al in most main fi shing areas and further increases in seafood supply need to come from aquaculture. To meet the growing demand for fi sh-food products with an increasing world populati on to 10.5 billion people in 2050 (an increase of 36 % compared to 2019 and constant birth rates), aquaculture producti on needs to grow to 150 million ton by 2050. To do so, the aquaculture sector needs to intensify, bringing along serious challenges regarding sustainable growth. In aquaculture, more than 80% of fi sh and 98% of shrimp are produced in ponds (FAO 2014). Over the last decades, pond producti on intensifi ed. This

GENERAL INTRODUCTION 15
1
was done by changing traditi onal “grassland ponds” that relied on in situ produced natural foods, into “holding tank ponds” relying on externally produced complete feeds. The use of complete feeds increased producti on and feeding effi ciency, but also increased metabolic waste producti on. These metabolic wastes outstrip the carrying capacity of stagnant ponds and demand water replacement, waste removal or in situ mineralisati on to maintain water quality. With high water exchange rates, microbial communiti es are diluted before reaching full equilibrium, and it is proposed this makes the pond more vulnerable for diseases (Figure 3). Insuffi cient control on metabolic wastes in aquaculture is a major factor aff ecti ng environmental sustainability (FAO 2014; Verdegem 2013). In holding tank ponds, half of the costs for shrimp producti on are made up by feeding costs (NRC 2011). Unfortunately, some raw feed ingredients such as fi shmeal and fi sh oil, major sources of HUFA for shrimp and fi sh, are becoming scarce and this may inhibit further aquaculture expansion in the near future (Boyd et al., 2007, FAO 2014). A promising approach is to develop a more ecological “nutriti ous pond” farming system, targeti ng to reduce waste producti on and enhance the contributi on of in situ produced natural foods through alterati ons in diet formulati on, while maintaining current shrimp harvest rates.
Figure 3. Problems r elated to the increase of intensifi cati on and development from traditi onal grassland ponds to holding tank ponds, and the miti gati on towards developing the nutriti ous-pond system concept. a) Verdegem et al., 2006, b) Mischke, 2012, c) Nhan et al., 2008, d) Stenti ford et al., 2012,, e) Bondad-Reantaso et al., 2005, f) Tacon and Meti an, 2008, g) Tacon and Meti an, 2013, h) Crawford and Broadhurst, 2012, i) Mráz et al., 2012 j) Watt ers et al., 2013.
16 CHAPTER 1
1.2.2 Increase contributi on high quality natural foods in pondNumerous studies have shown that natural food producti on can contribute to shrimp nutriti on in producti on ponds, ranging from extensive to hyper-intensive producti on systems (Jory, 1995, Anderson et al., 1987, Sangha et al., 2000, Lavens and Sorgeloos, 2000, McIntosh et al., 2000, Bojórquez-Mascareño and Soto-Jiménez, 2013, Marti nez‐Cordova et al., 2003, Soares et al., 2004, Decamp et al., 2002, Browdy and Moss, 2005, Wasielesky et al., 2006). High quality natural foods such as copepods or diatoms contain signifi cant amounts of EPA and DHA, and are known to sti mulate shrimp producti on. In shrimp feed formulati ons, a grading order was found in growth promoti ng eff ect of dietary PUFA and HUFA, where EPA was found to be the most performance enhancing: EPA>DHA>ALA>18:2n-6 (Glencross and Smith, 1999, Glencross and Smith, 2001a, Glencross and Smith, 2001b, Glencross et al., 2002b, Glencross et al., 2002a). Based on stable isotope measurements it has been suggested that in shrimp ponds the contributi on of natural foods can reach up to 50% of the total diet selecti on (Burford and Williams, 2001). This shows that part of the complete formulated feed administrated to ponds acts as expensive ferti lizer sti mulati ng natural producti on. The resulti ng natural foods are only parti ally eaten by culture organisms, depending on species specifi c foraging behaviour. For example, with increasing age, P. vannamei switches from phytoplankton and zooplankton eater to mainly benthic bott om feeder. Meaning that during the shrimp grow-out phase, energy in form of phytoplankton biomass in the water column is to a lesser extent accessible to the animal, and therefore only a minor percentage of this potenti al energy and nutrient source ends up in the shrimp. In aquaculture, this ineffi ciency in nutrient transfer into the culture species is partly addressed by making use of polycultures (canalizing nutrients in an additi onal species with complementary foraging habits) or biofl oc systems (canalizing nutrients in fl occulati ng bacterial biomass as additi onal accessible food source for the culture species) (Lombardi et al., 2006, Rahman et al., 2008, Rahman et al., 2006, Roos et al., 2007, Avnimelech, 2009). The ferti lizing properti es of uneaten feed and metabolic wastes can be infl uenced through alterati ons in diet formulati on targeti ng a faster nutrient turnover and more complete mineralisati on through the enti re pond’s food web. For example, Hari et al., (2006) showed that protein retenti on from feed into harvested shrimp biomass signifi cantly increased when carbohydrates where added to the pond water as ferti lizer sti mulati ng in situ produced heterotrophic microbial biomass. As a result, less protein needed to be added to the diet, waste output was reduced and water quality parameters improved (Hari et al., 2006). Looking at the high availability of nutrients, aquaculture ponds can be considered hypereutrophic lakes with a primary producti on exceeding 4 g C m-2 d-1. As described above, aquati c ecology studies proposed that insuffi cient HUFA content and insuffi cient stoichiometry at the plant-animal interface are bott lenecks for trophic transfer of energy and nutrients in eutrophic waterbodies. It is unknown if these bott lenecks are also applicable to crustacean biology, which rely on the benthic based food web instead of the phytoplankton-based food web (see Figure 4). Nevertheless, several studies have shown that benthic diatoms are a high-quality food

GENERAL INTRODUCTION 17
1
source for aquati c invertebrates due to high HUFA content, and herbivorous fi sh grazing on periphyton showed strong accumulati on of HUFA derived from diatoms, while diatoms only made up for a small proporti on of the periphyton (Johnson and Wiederholm, 1992, Delong et al., 1993, Napolitano et al., 1996). Flows of energy and nutrients, including HUFA through food webs in aquaculture producti on ponds are very unpredictable and presently not well understood. To develop the shrimp nutriti ous pond system, our understanding of the fl ow and fate of energy from sunlight and external feed into biomass must increase, as well as our knowledge on diet selecti on of shrimp in outdoor ponds. Defi ning bott lenecks of energy and nutrient transfer in ponds may contribute to increasing turnover rates and therefore may increase contributi on of natural food in shrimp nutriti ous pond systems.
F igure 4. Schemati c drawing of the aquati c food web in outdoor shrimp ponds (P. vannamei) fed with formulated feed at low/zero-water exchange rates, and primary producti on sti mulated by sunlight. Additi onally added is the transfer of essenti al omega-3 fatt y acids (PUFA & HUFA) through this food web. With increasing age, shrimp natural diet selecti on relocates to mainly the benthic food web.
1.3. Scope and objecti ves of this thesisThis thesis aimed to provide insight in the actual contributi on of HUFA and protein by primary producti on to whiteleg shrimp (Litopenaeus vannamei) producti on in mesocosms. Mesocosms were used in all experiments to mimic semi-intensive outdoor shrimp ponds.

18 CHAPTER 1
By studying nutrient compartmentalization as a result of alterations in diet formulation, the role of external fish meal and fish oil, and external organic and inorganic fertilization (carbon, nitrogen and phosphorous) was quantified. Each chapter of this thesis describes a specific aspect of nutrient compartmentalization in shrimp mesocosms. Since HUFA, nitrogen, carbon and phosphorus all co-influence nutrient dynamics, a multi-nutrient approach was considered throughout all thesis chapters.
In chapter 2 the focus lies on HUFA-sourcing by shrimp. The role of dietary fishmeal and fish oil on shrimp production and meat quality is assessed. By comparing the difference between a standard commercial diet and a HUFA-deficient diet lacking both fishmeal and fish oil, the contribution of HUFA derived from natural production into shrimp biomass has been quantified. This was something poorly understood nor quantified in the past (Izquierdo et al., 2006, Bojórquez-Mascareño and Soto-Jiménez, 2013, Neori, 2011). The focus in chapter 3 is on the quantification of in situ produced and accumulated HUFA in the mesocosm compartments. By leaving out both fishmeal and fish oil from the formulated diet, it was attempted to increase the contribution of in situ produced natural food by encouraging shrimp to forage more on natural resources. Where in chapter 2 and 3 the role of HUFA from natural production is the main topic, in chapter 4 the role of protein (nitrogen) from natural food in shrimp biomass production is described. By replacing the nitrogen input through feeding with inorganic nitrogen, effects on nitrogen cycling and nitrogen utilization in the mesocosm are described. Additionally, the effect of inorganic fertilization on algae HUFA-content is assessed. Chapter 5 provides insight in the nutrient distribution over time in the mesocosm and C:N:P ratios of mesocosm compartments as a results of replacing 50 % of the formulated diet with carbohydrate and inorganic-N. Chapters 2-5 describe specific aspects concerning nutrient flows, accumulation and utilization in shrimp mesocosms. In the final chapter of this thesis, the general discussion, results of present studies were placed into broader context. The wins and flaws of this thesis are discussed, resulting in future recommendations. Also, the role of shrimp as HUFA-source for human consumption is criticised, as well as the sustainability of aquaculture and possible future effects of climate change on pond culture. Furthermore, a reflection on shrimp diet formulations in the light of the findings of this thesis are presented, and a link between ecological research versus aquaculture research is made.

GENERAL INTRODUCTION 19
1

This chapter has been submitted for publication to “Aquaculture Nutrition” as:
Hermsen, D., Van de Waal, D.B., Declerck, S.A.J., Verreth, J.A.J., Verdegem, M.C.J. In-situ fatty acid production supports shrimp yields in diets lacking fish oil and fishmeal.
In situ fatty acid production supports shrimp yields in diets lacking fish oil and fishmeal
Chapter 2
Abstract The use of capture fisheries derived fish oil and fishmeal in aquaculture diets is highly unsustainable. This study assessed HUFA contribution by dietary fish oil and fishmeal on whiteleg shrimp (Litopenaeus vannamei) production and meat quality. Mesocosms were used to mimic a semi-intensive pond production system, including primary producers. Fatty acid mass balances were computed to distinguish between diet-based and primary production-based contributions to shrimp production. Performance and body fatty acid composition were evaluated of shrimp fed a commercial shrimp diet rich in omega-3 fatty acids and containing fish oil and fishmeal (control) with a fishmeal and fish oil free diet low in omega-3 fatty acids (low HUFA diet: Lw-HUFA). Six mesocosms were each stocked with 60 juvenile shrimp and randomly assigned to the two diets. After an 8-week grow-out period, shrimp growth, total biomass production, survival and proximate body composition were similar between diets. Absence of fish oil and fishmeal in the formulated diet did not reduce growth performance in the mesocosms. However, shrimp fed the control diet contained twice as much HUFA and omega-3 fatty acids than Lw-HUFA shrimp. Shrimp arachidonic acid (ARA) content was not affected by diet, while linoleic acid (LA) and alpha-linolenic acid (ALA) were higher in shrimp fed the Lw-HUFA diet. Eicosapentaenoic acid (EPA) and docosahexaenoic acid (DHA) were significantly higher in shrimp fed the control diet. Fatty acid mass balances showed large quantitative losses in both treatments of the precursors ALA and LA that were being used as energy source by the shrimp instead for HUFA synthesis. Whereas losses were also observed for EPA and DHA in the control group, there was a remarkable gain for these components in the Lw-HUFA tanks. Lw-HUFA shrimp sourced 32 % of their total EPA-gain and 6 % of their total DHA-gain from the algal-based food web. This quantitative analysis of the fate of major dietary fatty acids strongly suggests that the pond’s primary production can provide shrimp additional HUFA. Nevertheless, when fully excluding fishmeal and fish oil from formulated feed, the HUFA content is lower than normally observed in cultured or wild caught shrimp. Finding a balance between HUFA contribution through formulated feed and natural production seems possible but deserves further research. There is need of a better understanding of the flow and fate of energy and essential fatty acids from primary producers and external feed into consumer biomass to make shrimp production more sustainable.
Keywords: EPA, DHA, omega-3 fatty acids, fishmeal, fish oil, mesocosm, Litopenaeus vannamei

IN SITU FATTY ACID PRODUCTION SUPPORTS SHRIMP YIELDS 23
2
2.1 Introduction
2.1.1 Dependency on fisheries hinders sustainable aquacultureAquaculture production needs to grow with 12 % following the estimated population growth from 7.7 billion in 2019 to 8.6 billion in 2030 (U.N. 2019). Maintaining current per capita seafood consumption, would mean an additional 13.2 million ton seafood is needed to fulfil the growing demand for protein. In aquaculture, more than 98 % of shrimp are produced in brackish water ponds. In semi-intensive and intensive ponds, the feed is the most expensive input, accounting for half of the production costs (Hardy, Gatlin-III et al., 2011). Unfortunately, some raw feed ingredients such as fishmeal and fish oil -major sources of highly unsaturated fatty acids (HUFA) for shrimp and fish- are becoming scarce and this may inhibit further aquaculture expansion (Boyd, Tucker et al., 2007, FAO 2018). Some aquaculture practices are actual net consumers of fish than producers (IFFO 2018). Estimates for 2006 indicate that the aquaculture sector used an equivalent of 16.6 million MT small pelagic forage fish with an overall fish-in fish-out ratio of 0.7 (Tacon and Metian 2008). This highlights our inefficient and unsustainable use of natural resources, adding substantial pressure to natural ecosystems. Marine fisheries expanded rapidly since the 80’s, and global fishing effort together with the related environmental impact continues to increase. Capture fisheries result in the decline of fish standing stocks and the alteration of life history traits. Effects are not limited to fish but extend often to the entire aquatic food web, including groups such as mammals, turtles, seabirds and the benthic community (Dayton, Thrush et al., 1995, Clark and Tilman 2017, Ortuño Crespo and Dunn 2017). As a result, the overall biodiversity and resilience of natural systems is reducing. Avoiding use of capture fisheries derived products in animal feeds is thus desired. This leads to an urgent need for alternative lipid sources other than fish oil in aquaculture diets, that can meet the dietary requirements for omega-3 (n-3) fatty acids, in particular eicosapentaenoic acid (EPA) and docosahexaenoic acid (DHA) (NRC 2011).
2.1.2 Alternative fatty acid sourcesLots of research has been done to find alternative ingredients to substitute fishmeal or fish oil in aquaculture diets without compromising on current production rates. Studies on replacing both fishmeal and fish oil without EPA or DHA supplementation are rare. Outcomes suggest that nutritionally balanced diets can partially replace fishmeal or fish oil without negatively affecting shrimp survival and growth. These diets contained soybean meal, animal by-product meal, vegetables oils and insect derived ingredients (Turchini, Torstensen et al., 2009, Xu, Wang et al., 2016, Cummins, Rawles et al., 2017). Furthermore, biotechnology made great progress in producing EPA and DHA from algae, fungi, bacteria or thraustochytrids (Boelen, van Dijk et al., 2013, Amiri-Jami, LaPointe et al., 2014, Wang, Li et al., 2017), which are frequently used in human diet supplements or baby milk
24 CHAPTER 2
powder. Unfortunately, these ingredients are still too expensive to be used as ingredient in aquaculture feed. A potential alternative to lipids from fishmeal and fish oil are plant oils, although also expensive and containing higher amounts of n-6 oils instead of n-3 oils. Within the n-3 oils, plants mainly contain poly unsaturated fatty acids with up to three double bonds (PUFA), such as alpha-linolenic acid (ALA), compared to HUFA such as EPA and DHA, containing 5 and 6 double bonds, respectively. In the search for fishmeal and fish oil replacements, the emphasis has been predominantly on n-3 fatty acids due to the important physiological functions of n-3 HUFA and its limited availability. The importance of n-6 fatty acids, for instance arachidonic acid (ARA) and its precursor linoleic acid (LA), has been largely overlooked but is now gaining more attention due to their role in fish and shrimp health performance (Bell and Sargent 2003).
2.1.3 Enzymatic conversionAnimals can enzymatically convert ALA into EPA and DHA (n-3 pathway), and LA into ARA (n-6 pathway), though efficiencies are low, ranging between 1 and 5 % (Figure 1). Therefore, EPA, DHA and ARA are considered conditionally essential for animals since enzymatic conversion can hardly provide sufficient EPA and DHA levels from ALA (Stark 2008, Wall 2010, Davis 2003) or ARA from LA. Direct access to EPA, DHA and ARA through the diet is beneficial, and required for optimal animal health and performance.
In shrimp feed formulations, the growth promoting effect of dietary PUFA and HUFA can be ranked. EPA enhances growth best, followed, in this order, by DHA, ALA and LA (Glencross and Smith 1999, Glencross and Smith 2001, Glencross and Smith 2001a, Glencross, Smith et al., 2002, Glencross, Smith et al., 2002). The desaturase enzymes involved in biosynthesis of HUFA from PUFA are driven by competitive substrate inhibition showing a preference for longer and more saturated molecules, leading to a hierarchy with DHA as most preferred substrate, followed by, in this order, EPA, ARA, ALA and LA (Sargent, Bell et al., 1993, Glencross 2009). Both n-6 and n-3 are desaturated by these enzymes. Consequently, when the balance between n-6 and n-3 fatty acids is altered, for example by replacing n-3 HUFA rich fish oil by n-6 rich plant oils, thus replacing DHA and EPA by ARA and LA, this may negatively affect the animal’s capacity to desaturate n-3 HUFA from their precursor ALA since n-6 oils will occupy the majority of the enzymes.

IN SITU FATTY ACID PRODUCTION SUPPORTS SHRIMP YIELDS 25
2
Figure 1. Conversion pathway of omega-3 (n-3) and omega-6 (n-6) fatty acids. Abbreviations: Alpha-linolenic acid (ALA), eicosapentaenoic acid (EPA), docosahexaenoic acid (DHA), linoleic acid (LA), arachidonic acid (ARA), poly unsaturated fatty acids (PUFA), highly unsaturated fatty acids (HUFA). PUFA: 2 or 3 double bonds. HUFA: minimum 4 double bonds.
2.1.4 Fatty acid requirements versus meat qualityIn feed formulation for L. vannamei diets, a minimum HUFA requirement of 0.3-0.5 % (diet weight basis) is commonly used, including 0.2 % EPA and 0.1 - 0.3 % DHA (González‐Félix, Gatlin III et al., 2003). Nowadays partial fishmeal and fish oil replacement by soybean meal and vegetable oils has become customary practice. Although replacement of fishmeal and fish oil by vegetable products in shrimp diets has no effect on growth or survival, it produces shrimp low in HUFA content. Indeed, in the period 2006-2015 the n-3 HUFA content of aquaculture seafood decreased drastically, e.g. 50 % in Atlantic salmon and 52 – 68 % in shrimp (Izquierdo, Forster et al., 2006, NRC 2011, Sprague, Dick et al., 2016). Thus, although it is possible to make aquaculture less dependent on capture fisheries, it concurs with a decrease in nutritional quality. Such a reduction in quality can have far reaching consequences for human health, since seafood products are a major source of EPA and DHA for humans (Yashodhara, Umakanth et al., 2009).
2.1.5 Pond natural food as additional fatty acid sourceStudies evaluating alternative lipid ingredients are often conducted in clear water systems, where growth of natural food is prevented and food supply is fully controlled by external inputs. This approach however neglects the potential contribution of natural food present to shrimp production in fed outdoor production ponds and may lead to the overestimation of the utilization efficiency of supplemented feed. For example, shrimp reared in outdoor mesocosm systems incorporated higher levels of EPA and DHA when fed fish oil-poor diets

26 CHAPTER 2
than shrimp reared in clear water systems (Izquierdo, Forster et al., 2006). High quality natural foods, such as copepods or diatoms contain significant amounts of EPA and DHA, and are known to stimulate shrimp production (Johnson and Wiederholm 1992, Delong, Summers et al., 1993, Napolitano, Shantha et al., 1996). Numerous studies have shown that natural food production can contribute to shrimp nutrition in production ponds, ranging from extensive to hyper-intensive production systems (Anderson, Parker et al., 1987, Jory 1995, Lavens and Sorgeloos 2000, McIntosh, Samocha et al., 2000, Sangha, Cruz et al., 2000, Decamp, Conquest et al., 2002, Martinez‐Cordova, Campana Torres et al., 2003, Soares, Peixoto et al., 2004, Browdy and Moss 2005, Wasielesky, Atwood et al., 2006, Bojórquez-Mascareño and Soto-Jiménez 2013). More specifically, stable isotope measurements suggest that in shrimp ponds the contribution of natural foods can reach up to 50 % of the total diet selection (Burford and Williams 2001).
2.1.6 Study aimIn semi-intensive coastal brackish water ponds, the primary production often exceeds 4 g C m-2 d-1. The dry mass of algae produced in these ponds is similar to the amount of feed administrated. Some marine or brackish water algae are good sources of HUFA and might contribute to the shrimp diet. Yet, the actual contribution of primary production derived fatty acids to the shrimp diet is poorly understood nor quantified (Izquierdo, Forster et al., 2006, Neori 2011, Bojórquez-Mascareño and Soto-Jiménez 2013). The first aim of this study was to assess the HUFA contribution by dietary fish oil and fishmeal on whiteleg shrimp (Litopenaeus vannamei) production and meat quality. Mesocosms were used to mimic a semi-intensive outdoor pond production system, including primary producers. The second aim was to compute PUFA and HUFA mass balances considering formulated feed input and shrimp production. The goal was to distinguish between formulated diet-based and primary production-based contributions to shrimp production. Finally, the feasibility and sustainability to rely in semi-intensive production systems on in situ naturally produced PUFA and HUFA for shrimp production was evaluated.
2.2 Material and methods
2.2.1 Experimental set-upThe experiment was conducted indoor under controlled temperature conditions at the aquaculture research institute “Carus” of Wageningen University in The Netherlands. Six experimental mesocosm tanks with a working volume of 700 L (1.25 m diameter, 90 cm depth) were used as a model for outdoor commercial shrimp ponds. Seven agricultural lights (Gavita; three LEP 270-01 SUP EU, and four Digistar 400W e-serie) were suspended above the tanks. Each individual tank received an incident irradiance of 300 µmol photons/m2/s under a 12h/12h day/night regime to enable autotrophic natural food production in the tanks. The light system (Gavita; Master Controller EL1) controlled sunrise and sunset time
IN SITU FATTY ACID PRODUCTION SUPPORTS SHRIMP YIELDS 27
2
and room temperature was maintained at 27-29 °C. Tank water was continuously mixed and aerated by a looped aeration pipe, 7 cm above the sediment and perforated at 10 cm intervals. Water temperature was 25–27 oC. All mesocosm tanks were filled with artificial seawater with a salinity of 25 ppt (Reef Crystals) and a 7 cm sediment layer consisting of homogenously sterilized pure sand. To inoculate the mesocosm ecosystem, 500 g of ‘live rock’ (NMFS 1995) was added to the sediment of each tank (collected from tropical sea aquarium Burger’s Zoo Arnhem, The Netherlands). The mesocosms were left to maturate for 1 year. Three days prior to the start of the experiment, all tank walls were scrubbed clean, and sediment and water were collected in a large basin and thoroughly mixed and redistributed to ensure a similar start situation for the experiment. One day before the start of the experiment (day 0), 60 1.5-g juvenile shrimp were stocked in each mesocosm (approximately 50 ind/m2) (Florida Shrimp International Shrimp Harvesters USA, SPF-line, imported by Crevetec Belgium), intending to mimic a farming system of intensive shrimp farmers in the Vietnamese Mekong Delta with a potential shrimp production of more than 2000 – 3000 kg ha-1 (Joffre 2010).
2.2.2 Dietary treatments and feeding regimeTreatments were a control diet or a diet low in n-3 HUFA, randomly distributed over 6 mesocosms (3 replicates per treatment). The control diet was formulated according to common commercial practice containing 1 % fish oil, 16 % fishmeal and 10 % soybean meal (standard HUFA dietary group: control). In the low-HUFA treatment diet, fishmeal and fish oil were fully substituted by casein and coconut oil, respectively (low-HUFA treatment group: Lw-HUFA). Both diets contained the same amount of crude protein, essential amino acids and vitamins, crude fat and energy (Table 1). Feeding regime was set initially to 4.9 % body weight per day and gradually decreased reaching 3.4 % body weight per day at the end of the experiment. Each tank received 433.5 g feed during the entire experiment. Feed was continuously and uniformly added during day and night with an automatic 24h belt feeder. The shrimp were not fed 24 hours before and after stocking, and 12 hours before and after sampling. The fatty acid composition of the experimental diets is presented in Table 2. The control diet contained sufficient amounts of HUFA, EPA and DHA, while the Lw-HUFA diet was deficient. In general, the control diet contained 9.7 times more HUFA than the Lw-HUFA diet, particularly EPA and DHA. ALA content was comparable between both diets while ARA content was 7.5 times higher in the control diet. Both diets contained deficient ARA levels. The n-6/n-3 ratio was 4.2 times higher in the Lw-HUFA diet.
28 CHAPTER 2
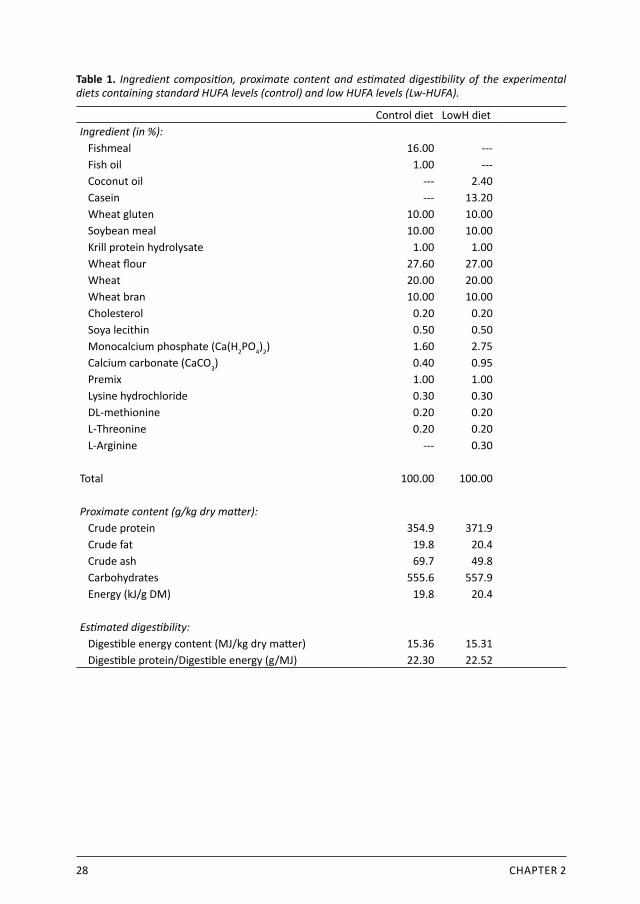
Table 1. Ingredient composition, proximate content and estimated digestibility of the experimental diets containing standard HUFA levels (control) and low HUFA levels (Lw-HUFA).
Control diet LowH dietIngredient (in %): Fishmeal 16.00 --- Fish oil 1.00 --- Coconut oil --- 2.40 Casein --- 13.20 Wheat gluten 10.00 10.00 Soybean meal 10.00 10.00 Krill protein hydrolysate 1.00 1.00 Wheat flour 27.60 27.00 Wheat 20.00 20.00 Wheat bran 10.00 10.00 Cholesterol 0.20 0.20 Soya lecithin 0.50 0.50 Monocalcium phosphate (Ca(H2PO4)2) 1.60 2.75 Calcium carbonate (CaCO3) 0.40 0.95 Premix 1.00 1.00 Lysine hydrochloride 0.30 0.30 DL-methionine 0.20 0.20 L-Threonine 0.20 0.20 L-Arginine --- 0.30
Total 100.00 100.00
Proximate content (g/kg dry matter): Crude protein 354.9 371.9 Crude fat 19.8 20.4 Crude ash 69.7 49.8 Carbohydrates 555.6 557.9 Energy (kJ/g DM) 19.8 20.4
Estimated digestibility: Digestible energy content (MJ/kg dry matter) 15.36 15.31 Digestible protein/Digestible energy (g/MJ) 22.30 22.52
IN SITU FATTY ACID PRODUCTION SUPPORTS SHRIMP YIELDS 29
2
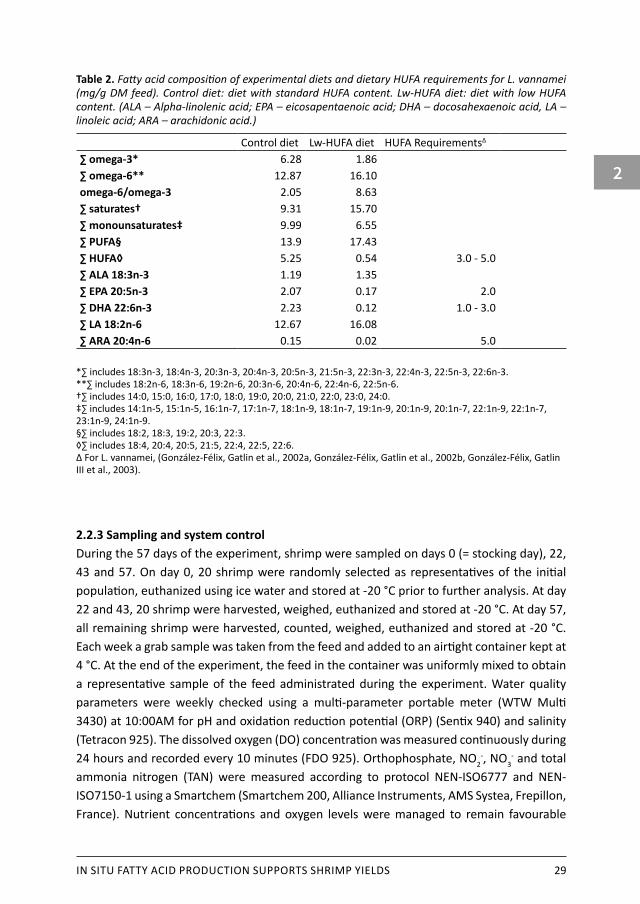
Table 2. Fatty acid composition of experimental diets and dietary HUFA requirements for L. vannamei (mg/g DM feed). Control diet: diet with standard HUFA content. Lw-HUFA diet: diet with low HUFA content. (ALA – Alpha-linolenic acid; EPA – eicosapentaenoic acid; DHA – docosahexaenoic acid, LA – linoleic acid; ARA – arachidonic acid.)
Control diet Lw-HUFA diet HUFA Requirements∆ ∑ omega-3* 6.28 1.86∑ omega-6** 12.87 16.10omega-6/omega-3 2.05 8.63∑ saturates† 9.31 15.70∑ monounsaturates‡ 9.99 6.55∑ PUFA§ 13.9 17.43∑ HUFA◊ 5.25 0.54 3.0 - 5.0∑ ALA 18:3n-3 1.19 1.35∑ EPA 20:5n-3 2.07 0.17 2.0∑ DHA 22:6n-3 2.23 0.12 1.0 - 3.0∑ LA 18:2n-6 12.67 16.08∑ ARA 20:4n-6 0.15 0.02 5.0
*∑ includes 18:3n-3, 18:4n-3, 20:3n-3, 20:4n-3, 20:5n-3, 21:5n-3, 22:3n-3, 22:4n-3, 22:5n-3, 22:6n-3. **∑ includes 18:2n-6, 18:3n-6, 19:2n-6, 20:3n-6, 20:4n-6, 22:4n-6, 22:5n-6. †∑ includes 14:0, 15:0, 16:0, 17:0, 18:0, 19:0, 20:0, 21:0, 22:0, 23:0, 24:0. ‡∑ includes 14:1n-5, 15:1n-5, 16:1n-7, 17:1n-7, 18:1n-9, 18:1n-7, 19:1n-9, 20:1n-9, 20:1n-7, 22:1n-9, 22:1n-7, 23:1n-9, 24:1n-9. §∑ includes 18:2, 18:3, 19:2, 20:3, 22:3. ◊∑ includes 18:4, 20:4, 20:5, 21:5, 22:4, 22:5, 22:6. ∆ For L. vannamei, (González-Félix, Gatlin et al., 2002a, González-Félix, Gatlin et al., 2002b, González-Félix, Gatlin III et al., 2003).
2.2.3 Sampling and system controlDuring the 57 days of the experiment, shrimp were sampled on days 0 (= stocking day), 22, 43 and 57. On day 0, 20 shrimp were randomly selected as representatives of the initial population, euthanized using ice water and stored at -20 °C prior to further analysis. At day 22 and 43, 20 shrimp were harvested, weighed, euthanized and stored at -20 °C. At day 57, all remaining shrimp were harvested, counted, weighed, euthanized and stored at -20 °C. Each week a grab sample was taken from the feed and added to an airtight container kept at 4 °C. At the end of the experiment, the feed in the container was uniformly mixed to obtain a representative sample of the feed administrated during the experiment. Water quality parameters were weekly checked using a multi-parameter portable meter (WTW Multi 3430) at 10:00AM for pH and oxidation reduction potential (ORP) (Sentix 940) and salinity (Tetracon 925). The dissolved oxygen (DO) concentration was measured continuously during 24 hours and recorded every 10 minutes (FDO 925). Orthophosphate, NO2
-, NO3- and total
ammonia nitrogen (TAN) were measured according to protocol NEN-ISO6777 and NEN-ISO7150-1 using a Smartchem (Smartchem 200, Alliance Instruments, AMS Systea, Frepillon, France). Nutrient concentrations and oxygen levels were managed to remain favourable
30 CHAPTER 2
for growth at <2 mg NO2-/L, <50 mg NO3
- /L, <3 mg TAN/L, 7.0-8.8 pH and >6 mg DO/L. Salinity was kept constant by adding fresh tap water of 22 °C twice weekly to compensate for evaporation losses. When multiple samples for measuring a parameter were taken, they were pooled within day and within mesocosm.
2.2.4 Chemical analysesFirst, the gastrointestinal tract of sampled shrimp was removed, and shrimp were subsequently freeze-dried (ZIRBUS technology, Sublimator 3X4X5, Zirbus technology GmBH, Bad Grund, Germany). Shrimp and feed samples were ground using a centrifugal grinding mill operated at 60 % amplitude for 3 minutes at 12,000 RPM (Retsch 200 ZM 1mm sieve). Chemical analysis of shrimp and feed included determination of dry matter (DM) (protocol ISO6496), ash (ISO5985), crude protein (CP) (ISO5983), crude fat (CF) (ISO6492) and gross energy (E) (ISO9831). Organic matter (OM) and carbohydrate (CH) content were calculated based on dry matter content minus ash content, and organic matter content minus crude protein and fat content respectively. Productive protein value was calculated as protein gain divided by dietary protein intake. Feed conversion ratio was calculated as feed input divided by shrimp biomass gain. Fatty acid profiles of shrimp and feed were analysed following direct transesterification of fatty acid methyl esters (Lepage and Roy 1984).
2.2.5 Data analysisThe data analysis was carried out using IBM SPSS software package version 23 (IBM Corp. Released 2013. IBM SPSS Statistics for Windows, Version 23.0. Armonk, NY: IBM Corp). Mesocosm tanks were the experimental units. Comparison of means was performed by independent t-tests. Outcomes are presented as treatment means (± standard deviation, n=3).
2.3 Results
2.3.1 Shrimp general performanceShrimp growth, total biomass production and survival at the end of the experiment were similar between both diets. Final individual body weight and total produced biomass were not different between treatments, but the means of control shrimp were higher (Table 3). The intended production performance was reached with an equivalent of 3047 kg/ha and 2244 kg/ha (control and Lw-HUFA groups respectively) produced in 8 weeks. Survival of 96 ±1.9 % (n=6) was high in all tanks, and mortality was mainly caused by shrimp jumping out of the tanks. Moulting seemed to occur simultaneously and exoskeletons were left in the mesocosm to be re-eaten by the animals.
IN SITU FATTY ACID PRODUCTION SUPPORTS SHRIMP YIELDS 31
2
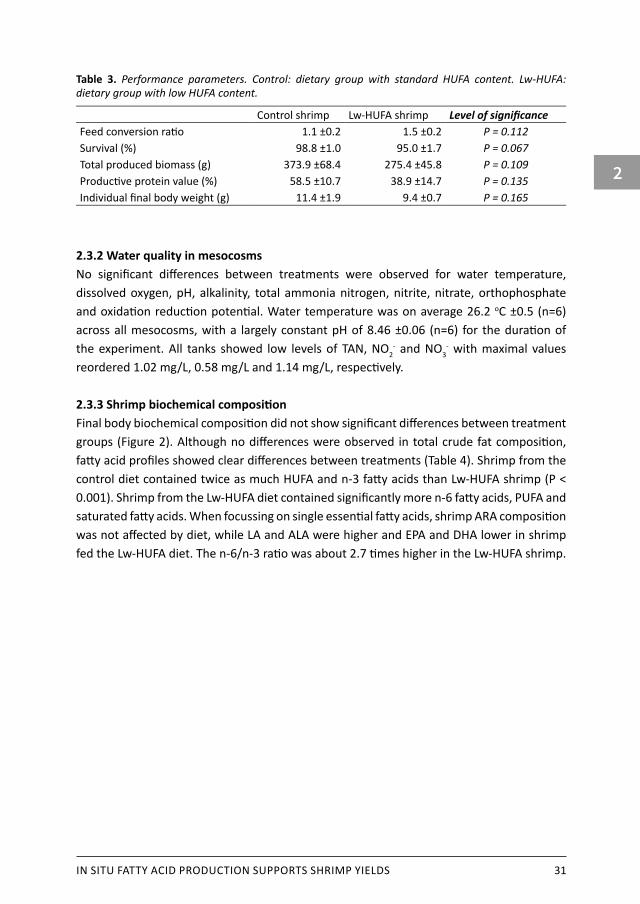
Table 3. Performance parameters. Control: dietary group with standard HUFA content. Lw-HUFA: dietary group with low HUFA content.
Control shrimp Lw-HUFA shrimp Level of significanceFeed conversion ratio 1.1 ±0.2 1.5 ±0.2 P = 0.112Survival (%) 98.8 ±1.0 95.0 ±1.7 P = 0.067Total produced biomass (g) 373.9 ±68.4 275.4 ±45.8 P = 0.109Productive protein value (%) 58.5 ±10.7 38.9 ±14.7 P = 0.135Individual final body weight (g) 11.4 ±1.9 9.4 ±0.7 P = 0.165
2.3.2 Water quality in mesocosms No significant differences between treatments were observed for water temperature, dissolved oxygen, pH, alkalinity, total ammonia nitrogen, nitrite, nitrate, orthophosphate and oxidation reduction potential. Water temperature was on average 26.2 oC ±0.5 (n=6) across all mesocosms, with a largely constant pH of 8.46 ±0.06 (n=6) for the duration of the experiment. All tanks showed low levels of TAN, NO2
- and NO3- with maximal values
reordered 1.02 mg/L, 0.58 mg/L and 1.14 mg/L, respectively.
2.3.3 Shrimp biochemical compositionFinal body biochemical composition did not show significant differences between treatment groups (Figure 2). Although no differences were observed in total crude fat composition, fatty acid profiles showed clear differences between treatments (Table 4). Shrimp from the control diet contained twice as much HUFA and n-3 fatty acids than Lw-HUFA shrimp (P < 0.001). Shrimp from the Lw-HUFA diet contained significantly more n-6 fatty acids, PUFA and saturated fatty acids. When focussing on single essential fatty acids, shrimp ARA composition was not affected by diet, while LA and ALA were higher and EPA and DHA lower in shrimp fed the Lw-HUFA diet. The n-6/n-3 ratio was about 2.7 times higher in the Lw-HUFA shrimp.
32 CHAPTER 2
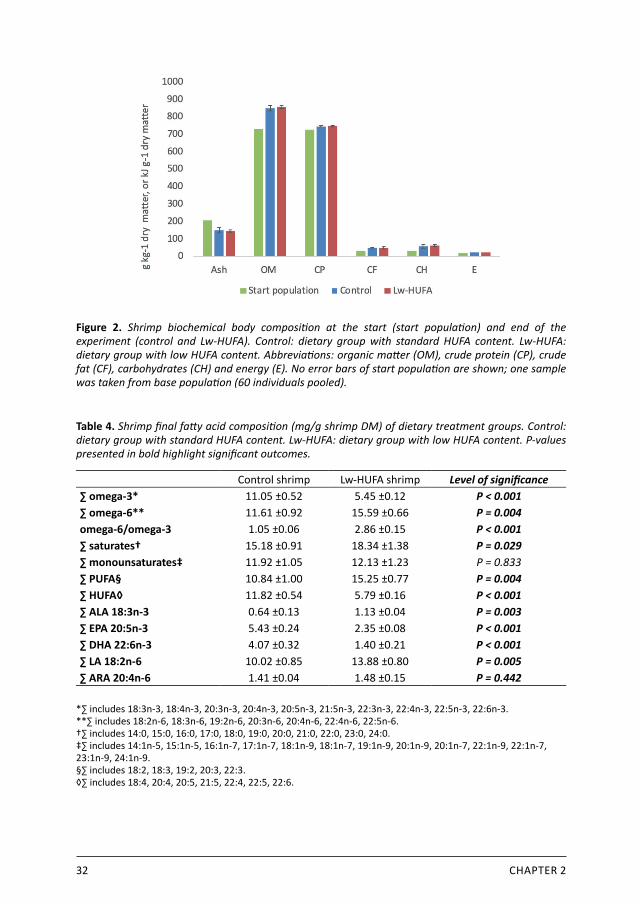
Figure 2. Shrimp biochemical body composition at the start (start population) and end of the experiment (control and Lw-HUFA). Control: dietary group with standard HUFA content. Lw-HUFA: dietary group with low HUFA content. Abbreviations: organic matter (OM), crude protein (CP), crude fat (CF), carbohydrates (CH) and energy (E). No error bars of start population are shown; one sample was taken from base population (60 individuals pooled).
Table 4. Shrimp final fatty acid composition (mg/g shrimp DM) of dietary treatment groups. Control: dietary group with standard HUFA content. Lw-HUFA: dietary group with low HUFA content. P-values presented in bold highlight significant outcomes.
Control shrimp Lw-HUFA shrimp Level of significance∑ omega-3* 11.05 ±0.52 5.45 ±0.12 P < 0.001∑ omega-6** 11.61 ±0.92 15.59 ±0.66 P = 0.004omega-6/omega-3 1.05 ±0.06 2.86 ±0.15 P < 0.001∑ saturates† 15.18 ±0.91 18.34 ±1.38 P = 0.029∑ monounsaturates‡ 11.92 ±1.05 12.13 ±1.23 P = 0.833∑ PUFA§ 10.84 ±1.00 15.25 ±0.77 P = 0.004∑ HUFA◊ 11.82 ±0.54 5.79 ±0.16 P < 0.001∑ ALA 18:3n-3 0.64 ±0.13 1.13 ±0.04 P = 0.003∑ EPA 20:5n-3 5.43 ±0.24 2.35 ±0.08 P < 0.001∑ DHA 22:6n-3 4.07 ±0.32 1.40 ±0.21 P < 0.001∑ LA 18:2n-6 10.02 ±0.85 13.88 ±0.80 P = 0.005∑ ARA 20:4n-6 1.41 ±0.04 1.48 ±0.15 P = 0.442
*∑ includes 18:3n-3, 18:4n-3, 20:3n-3, 20:4n-3, 20:5n-3, 21:5n-3, 22:3n-3, 22:4n-3, 22:5n-3, 22:6n-3. **∑ includes 18:2n-6, 18:3n-6, 19:2n-6, 20:3n-6, 20:4n-6, 22:4n-6, 22:5n-6. †∑ includes 14:0, 15:0, 16:0, 17:0, 18:0, 19:0, 20:0, 21:0, 22:0, 23:0, 24:0. ‡∑ includes 14:1n-5, 15:1n-5, 16:1n-7, 17:1n-7, 18:1n-9, 18:1n-7, 19:1n-9, 20:1n-9, 20:1n-7, 22:1n-9, 22:1n-7, 23:1n-9, 24:1n-9. §∑ includes 18:2, 18:3, 19:2, 20:3, 22:3. ◊∑ includes 18:4, 20:4, 20:5, 21:5, 22:4, 22:5, 22:6.
IN SITU FATTY ACID PRODUCTION SUPPORTS SHRIMP YIELDS 33
2
2.3.4 Fatty acid retention
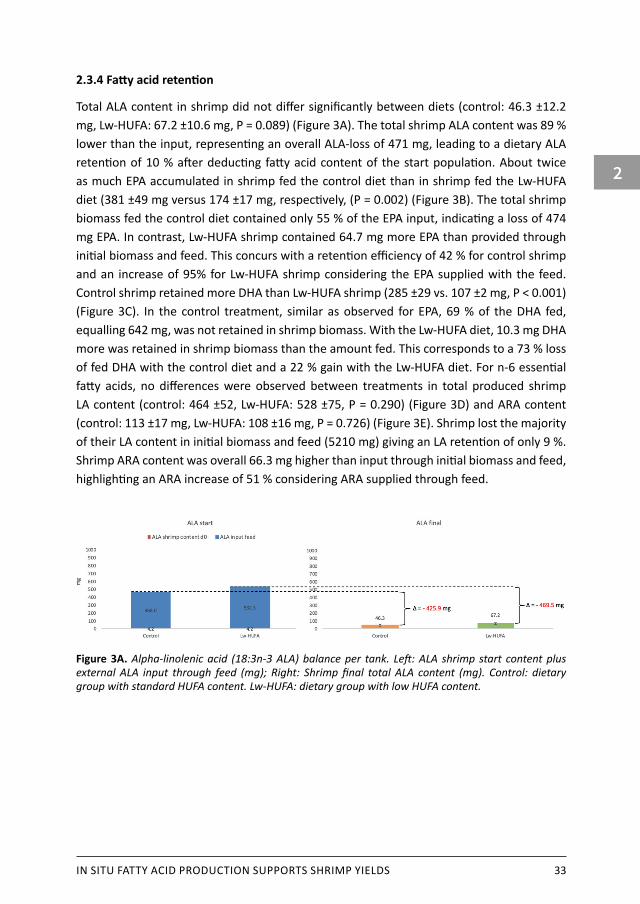
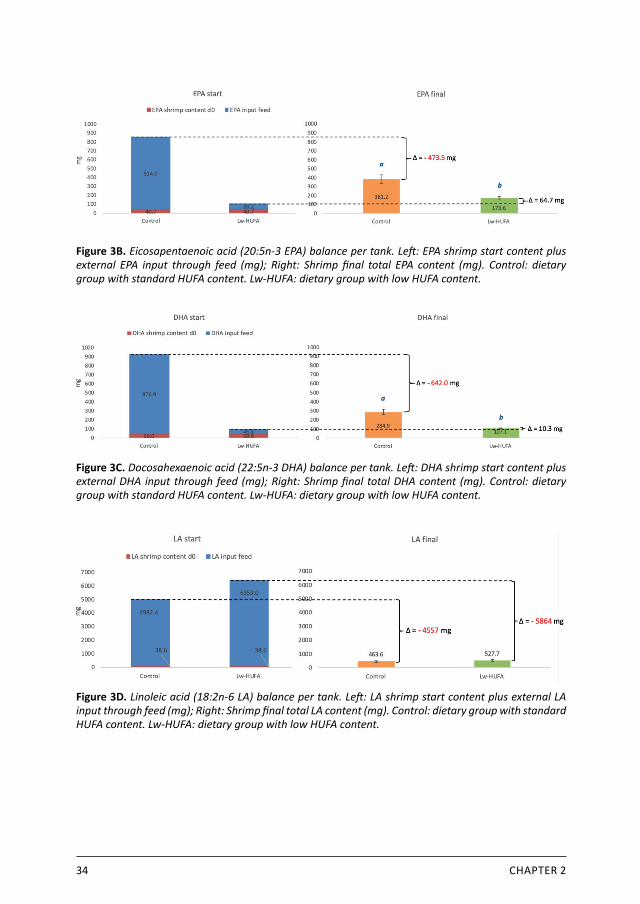
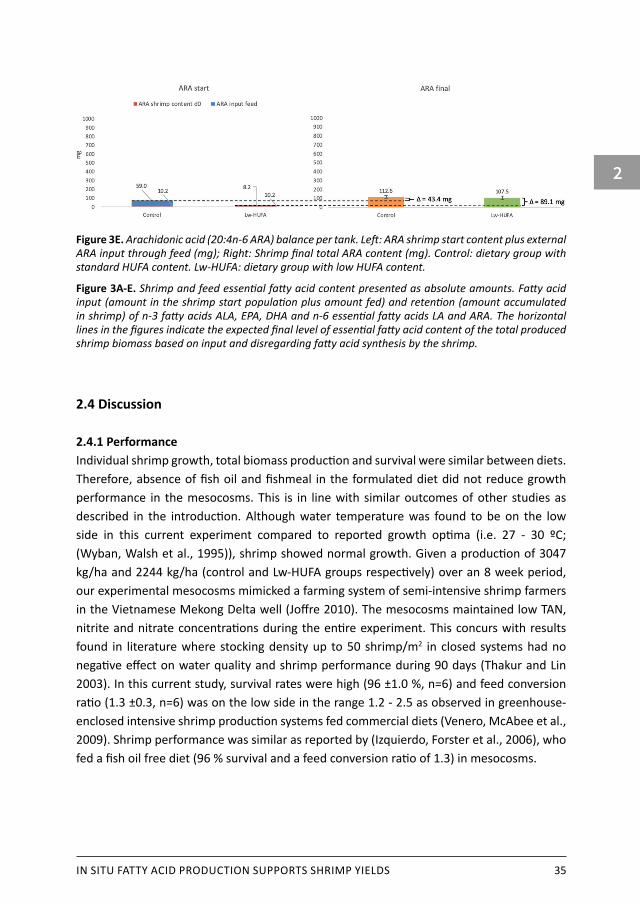
Total ALA content in shrimp did not differ significantly between diets (control: 46.3 ±12.2 mg, Lw-HUFA: 67.2 ±10.6 mg, P = 0.089) (Figure 3A). The total shrimp ALA content was 89 % lower than the input, representing an overall ALA-loss of 471 mg, leading to a dietary ALA retention of 10 % after deducting fatty acid content of the start population. About twice as much EPA accumulated in shrimp fed the control diet than in shrimp fed the Lw-HUFA diet (381 ±49 mg versus 174 ±17 mg, respectively, (P = 0.002) (Figure 3B). The total shrimp biomass fed the control diet contained only 55 % of the EPA input, indicating a loss of 474 mg EPA. In contrast, Lw-HUFA shrimp contained 64.7 mg more EPA than provided through initial biomass and feed. This concurs with a retention efficiency of 42 % for control shrimp and an increase of 95% for Lw-HUFA shrimp considering the EPA supplied with the feed. Control shrimp retained more DHA than Lw-HUFA shrimp (285 ±29 vs. 107 ±2 mg, P < 0.001) (Figure 3C). In the control treatment, similar as observed for EPA, 69 % of the DHA fed, equalling 642 mg, was not retained in shrimp biomass. With the Lw-HUFA diet, 10.3 mg DHA more was retained in shrimp biomass than the amount fed. This corresponds to a 73 % loss of fed DHA with the control diet and a 22 % gain with the Lw-HUFA diet. For n-6 essential fatty acids, no differences were observed between treatments in total produced shrimp LA content (control: 464 ±52, Lw-HUFA: 528 ±75, P = 0.290) (Figure 3D) and ARA content (control: 113 ±17 mg, Lw-HUFA: 108 ±16 mg, P = 0.726) (Figure 3E). Shrimp lost the majority of their LA content in initial biomass and feed (5210 mg) giving an LA retention of only 9 %. Shrimp ARA content was overall 66.3 mg higher than input through initial biomass and feed, highlighting an ARA increase of 51 % considering ARA supplied through feed.
Figure 3A. Alpha-linolenic acid (18:3n-3 ALA) balance per tank. Left: ALA shrimp start content plus external ALA input through feed (mg); Right: Shrimp final total ALA content (mg). Control: dietary group with standard HUFA content. Lw-HUFA: dietary group with low HUFA content.
34 CHAPTER 2
Figure 3B. Eicosapentaenoic acid (20:5n-3 EPA) balance per tank. Left: EPA shrimp start content plus external EPA input through feed (mg); Right: Shrimp final total EPA content (mg). Control: dietary group with standard HUFA content. Lw-HUFA: dietary group with low HUFA content.
Figure 3C. Docosahexaenoic acid (22:5n-3 DHA) balance per tank. Left: DHA shrimp start content plus external DHA input through feed (mg); Right: Shrimp final total DHA content (mg). Control: dietary group with standard HUFA content. Lw-HUFA: dietary group with low HUFA content.
Figure 3D. Linoleic acid (18:2n-6 LA) balance per tank. Left: LA shrimp start content plus external LA input through feed (mg); Right: Shrimp final total LA content (mg). Control: dietary group with standard HUFA content. Lw-HUFA: dietary group with low HUFA content.
IN SITU FATTY ACID PRODUCTION SUPPORTS SHRIMP YIELDS 35
2
Figure 3E. Arachidonic acid (20:4n-6 ARA) balance per tank. Left: ARA shrimp start content plus external ARA input through feed (mg); Right: Shrimp final total ARA content (mg). Control: dietary group with standard HUFA content. Lw-HUFA: dietary group with low HUFA content.
Figure 3A-E. Shrimp and feed essential fatty acid content presented as absolute amounts. Fatty acid input (amount in the shrimp start population plus amount fed) and retention (amount accumulated in shrimp) of n-3 fatty acids ALA, EPA, DHA and n-6 essential fatty acids LA and ARA. The horizontal lines in the figures indicate the expected final level of essential fatty acid content of the total produced shrimp biomass based on input and disregarding fatty acid synthesis by the shrimp.
2.4 Discussion
2.4.1 PerformanceIndividual shrimp growth, total biomass production and survival were similar between diets. Therefore, absence of fish oil and fishmeal in the formulated diet did not reduce growth performance in the mesocosms. This is in line with similar outcomes of other studies as described in the introduction. Although water temperature was found to be on the low side in this current experiment compared to reported growth optima (i.e. 27 - 30 ºC; (Wyban, Walsh et al., 1995)), shrimp showed normal growth. Given a production of 3047 kg/ha and 2244 kg/ha (control and Lw-HUFA groups respectively) over an 8 week period, our experimental mesocosms mimicked a farming system of semi-intensive shrimp farmers in the Vietnamese Mekong Delta well (Joffre 2010). The mesocosms maintained low TAN, nitrite and nitrate concentrations during the entire experiment. This concurs with results found in literature where stocking density up to 50 shrimp/m2 in closed systems had no negative effect on water quality and shrimp performance during 90 days (Thakur and Lin 2003). In this current study, survival rates were high (96 ±1.0 %, n=6) and feed conversion ratio (1.3 ±0.3, n=6) was on the low side in the range 1.2 - 2.5 as observed in greenhouse-enclosed intensive shrimp production systems fed commercial diets (Venero, McAbee et al., 2009). Shrimp performance was similar as reported by (Izquierdo, Forster et al., 2006), who fed a fish oil free diet (96 % survival and a feed conversion ratio of 1.3) in mesocosms.
36 CHAPTER 2
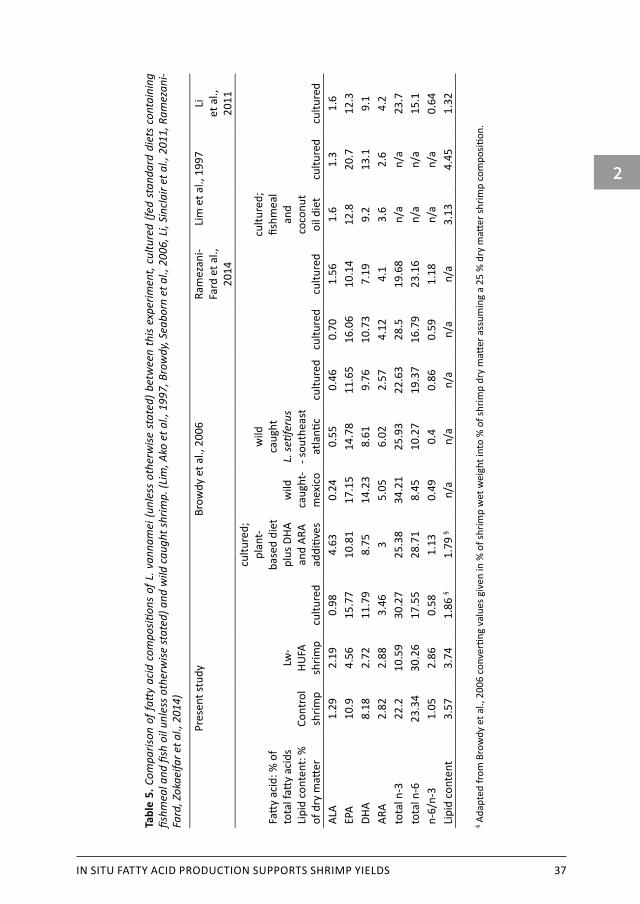
2.4.2 Shrimp biochemical compositionAlthough the composition of shrimp of both treatments was similar in terms of fat, carbohydrates, ash and organic matter, there were pronounced differences in fatty acid composition. Shrimp fed the fish oil and fishmeal free diet had significant lower HUFA content, mainly due to a lower EPA and DHA content, and a higher n-6/n-3 ratio. A comparison between fatty acid contents in this current study (presented as % of total fatty acid content) to cultured shrimp and wild caught shrimp is presented in Table 5. Captured wild shrimp stand out to cultured shrimp in higher n-3 fatty acid content, especially EPA, and consequently a low n-6/n-3 ratio. Compared to cultured shrimp fed other plant based diets (Browdy, Seaborn et al., 2006, Ramezani-Fard, Zokaeifar et al., 2014), control shrimp in this experiment show comparable n-6/n-3 ratios and similar essential fatty acid composition. Lw-HUFA shrimp contained far less HUFA and n-3 fatty acids than cultured and wild shrimp.
IN SITU FATTY ACID PRODUCTION SUPPORTS SHRIMP YIELDS 37
2Ta
ble
5. C
ompa
rison
of f
atty
acid
com
positi
ons
of L
. van
nam
ei (u
nles
s ot
herw
ise s
tate
d) b
etw
een
this
expe
rimen
t, cu
lture
d (fe
d st
anda
rd d
iets
con
tain
ing
fishm
eal a
nd fi
sh o
il un
less
oth
erw
ise st
ated
) and
wild
cau
ght s
hrim
p. (L
im, A
ko e
t al.,
199
7, B
row
dy, S
eabo
rn e
t al.,
200
6, L
i, Si
ncla
ir et
al.,
201
1, R
amez
ani-
Fard
, Zok
aeifa
r et a
l., 2
014)
Pres
ent s
tudy
Brow
dy e
t al.,
200
6Ra
mez
ani-
Fard
et a
l.,
2014
Lim
et a
l., 1
997
Li
et a
l.,
2011
Fatt
y ac
id: %
of
tota
l fatt
y ac
ids
Lipi
d co
nten
t: %
of
dry
matt
erCo
ntro
l sh
rimp
Lw-
HUFA
sh
rimp
cultu
red
cultu
red;
pl
ant-
base
d di
et
plus
DHA
an
d AR
A ad
ditiv
es
wild
ca
ught
-m
exic
o
wild
ca
ught
L.
setif
erus
- s
outh
east
at
lanti
ccu
lture
dcu
lture
dcu
lture
d
cultu
red;
fis
hmea
l an
d
coco
nut
oil d
iet
cultu
red
cultu
red
ALA
1.29
2.19
0.98
4.63
0.24
0.55
0.46
0.70
1.56
1.6
1.3
1.6
EPA
10.9
4.56
15.7
710
.81
17.1
514
.78
11.6
516
.06
10.1
412
.820
.712
.3DH
A8.
182.
7211
.79
8.75
14.2
38.
619.
7610
.73
7.19
9.2
13.1
9.1
ARA
2.82
2.88
3.46
35.
056.
022.
574.
124.
13.
62.
64.
2to
tal n
-322
.210
.59
30.2
725
.38
34.2
125
.93
22.6
328
.519
.68
n/a
n/a
23.7
tota
l n-6
23.3
430
.26
17.5
528
.71
8.45
10.2
719
.37
16.7
923
.16
n/a
n/a
15.1
n-6/
n-3
1.05
2.86
0.58
1.13
0.49
0.4
0.86
0.59
1.18
n/a
n/a
0.64
Lipi
d co
nten
t3.
573.
741.
86 §
1.79
§n/
an/
an/
an/
an/
a3.
134.
451.
32
§ Ada
pted
from
Bro
wdy
et a
l., 2
006
conv
ertin
g va
lues
giv
en in
% o
f shr
imp
wet
wei
ght i
nto
% o
f shr
imp
dry
matt
er a
ssum
ing
a 25
% d
ry m
atter
shrim
p co
mpo
sition
.

38 CHAPTER 2
2.4.3 Shrimp meat qualityWhile leaving out fishmeal and fish oil from formulated shrimp feed has no effect on protein production, meat quality is deteriorated due to decreased n-3 HUFA levels and increased n-6/n-3 ratios. Unfortunately, one cannot escape the consequence of increasing n-6/n-3 ratios when replacing fish oil and fishmeal by plant products without making use of n-3 supplements. On top of low n-3 HUFA dietary input, the high n-6/n-3 ratio might have further reduced the n-3 synthesis pathway inside the shrimp body due to enzyme substrate competition. As seafood is the main source of HUFA to humans and is therefore essential for health, fully leaving out fish oil and fishmeal from shrimp diet formulations may therefore be undesired. However, the total lipid content of shrimp is low compared to fish. Therefore, if one is aiming for seafood high in n-3 HUFA content, the choice for fish is easily made over shrimp regardless of shrimp diet, even though also the fish n-3 HUFA contents depend on diet formulation. Further, lipid and EPA and DHA composition of shrimp fed plant based diets is still of better quality compared to beef, pork and chicken meat. In addition, meat products contain higher fat and lower EPA and DHA levels (Browdy, Seaborn et al., 2006, Sprague, Dick et al., 2016). Therefore, shrimp fed vegetable diets remain a healthy diet choice for human consumption regarding protein and lipid composition.
2.4.4 Fatty acid quantitative losses and gainsIn both treatments, there were large quantitative losses in total amounts of the precursors ALA and LA. Whereas this was also observed for EPA and DHA in the control group, there was a gain for these components in the tanks fed a diet without fish oil and fishmeal. The observed balance losses can be partially explained by fatty acid synthesis from precursors into HUFA, and by a poor lipid and fatty acid digestive capacity in crustaceans due to a lack of gastric fat emulsifiers such as bile salt (Brockerhoff and Hoyle 1967, Glencross, Smith et al., 1998). Although selective retention and bioaccumulation of essential fatty acids are observed in a wide variety of animals at different trophic levels (Gladyshev, Sushchik et al., 2013), this capacity is species dependent and influenced by diet composition and the nutritive status of the animal. Starvation and malnutrition in different fish species showed that fish have a retention preference of n-3 HUFA over n-6 HUFA and DHA over EPA. Nevertheless, high catabolism of n-3 HUFA can also be observed in fish, and this increases further during malnutrition (Glencross, Hawkins et al., 2003b, Oxley, Tocher et al., 2005, Stubhaug, Lie et al., 2007, Glencross 2009). Shrimp have been reported to catabolize over a third of their dietary EPA by ß-oxidation for ATP production (Dall, Chandumpai et al., 1993). Similar large losses of n-3 HUFA are also observed in this current study in the control group.
In contrast to the quantitative n-3 HUFA losses in the control group, shrimp without dietary fish oil and fishmeal showed a remarkable gain in EPA and DHA. These gains cannot be fully explained by enzymatic conversion of ALA into EPA and DHA. Shrimp are poor fatty acid synthesizers due to low enzyme substrate affinity with a conversion rate of between 1

IN SITU FATTY ACID PRODUCTION SUPPORTS SHRIMP YIELDS 39
2
and 5 % (Kanazawa, Teshima et al., 1979). But even when calculating with a high 5 % ALA to EPA conversion and subtracting standard deviation of total biomass EPA content, Lw-HUFA shrimp acquired 41.9 mg EPA de novo (Figure 1). Since it is unlikely shrimp converted body and dietary DHA to EPA under sub-optimal nutritional condition caused by absence of dietary fishmeal and fish oil, it is most likely this additional EPA gain originates from primary production in the mesocosm, suggesting that the shrimp were able to exploit these alternative sources. This means that Lw-HUFA shrimp sourced at least 32 % of their total EPA-gain from the algal-based food web. Similarly, 3.6 mg de novo DHA must have been sourced from primary producers directly, or indirectly via EPA derived from the primary production in the mesocosm. This means that Lw-HUFA shrimp sourced at least 6 % of their total DHA-gain from the algal-based food web. Due to the large balance losses in control shrimp for EPA and DHA, it cannot be calculated if and to what extend control shrimp sourced EPA and DHA from the mesocosm, but it is clear that they were much less efficient in their use of these valuable fatty acids compared to the control shrimp with a diet deficient in these components (control shrimp: 42 % EPA and 27 % DHA retention from feed, versus Lw-HUFA shrimp: 195 % EPA and 122 % DHA retention from feed). The n-6 fatty acid ARA showed gains in both treatments, but these observed gains can entirely be explained by enzymatic synthesis from the precursor LA. LA is usually widely abundant in plant-based diets, as well as in both experimental diets in this current experiment. Calculating with 5 % enzyme efficiency converting LA into ARA, the LA content of the initial biomass plus input through the feed of total 5706 mg can potentially have led to 285 mg ARA, covering the observed shrimp ARA gain of 99.9 mg.
2.4.5 Mesocosm contribution allows changes in diet formulationOur quantitative analysis of the fate of major dietary fatty acids strongly suggests that the pond’s primary production can provide shrimp additional dietary EPA and DHA. Nevertheless, when fully excluding fishmeal and fish oil from formulated feed, the HUFA content is lower than normally observed in cultured or wild caught shrimp (Table 5). Overall, the EPA and DHA contents were 2.4 to 3.0 times too low in Lw-HUFA shrimp compared to the control. Since EPA and DHA production by primary producers is surface area dependent, based on this current setup it is expected that when feeding a fishmeal and fish oil free diet, the pond might be able to fulfil the HUFA demand at a shrimp biomass production of 2.4 to 3.0 times smaller than in this experiment. The latter statement is highly speculative. Quantifying the HUFA accumulation in the whole mesocosm will be needed for confirmation, because it could be possible that less HUFA will be produced at a lower culture intensity in the mesocosm. In the same time, an inclusion level of 16 % fishmeal and 1 % fish oil as used in the standard diet treatment of this experiment, seems too high regarding the relatively large ALA, EPA, DHA, LA and ARA balance losses. From a diet formulating perspective, the large balance losses of ALA in both dietary groups suggests that it might be possible to replace a part of the ALA-containing diet ingredients, such as plant oils, by cheaper fat sources since
40 CHAPTER 2
the major part of ALA seems to have been used as energy source instead of acting as EPA and DHA precursor. However, this is only possible when the overall dietary n-6/n-3 ratio will not further increase to prevent stronger preference of the desaturase enzyme towards n-6 HUFA synthesis leading to reduced activity in the n-3 HUFA synthesis pathway. Therefore, when replacing ALA with alternative energy sources, dietary n-6 fatty acid containing ingredients should be lowered in same or higher amounts. This is possible since LA balance loss was found to be of relatively similar level as ALA balance loss, both around 90 %. Considering diet formulation, finding a balance between HUFA contribution through formulated feed and natural production seems possible but deserves attention for further research. Flows of energy, nutrients and HUFA through food webs in aquaculture production ponds are very unpredictable and presently not well understood. While the results show that algae provide HUFA, it is not known how and where HUFA accumulates in the system. This should be explored first before speculating on how to incorporate possible contributions through the food web into a feeding strategy for semi-intensive shrimp ponds. There is need of a better understanding of the flow and fate of energy and essential fatty acids from primary producers and external feed into consumer biomass. In this study the focus was on feed and shrimp, whereas no assessment was made of the biochemical composition of the other food web components in the mesocosm. Therefore, the next step will be a follow-up research with focus on specific HUFA content and quantified contribution of different food web compartments of the mesocosms to shrimp production. Understanding underlying metabolic processes in the natural food web of shrimp ponds may aid in moving towards more sustainable aquaculture.

IN SITU FATTY ACID PRODUCTION SUPPORTS SHRIMP YIELDS 41
2


This chapter has been submitted for publication to “Aquatic Ecology” as:
Hermsen, D., Declerck, S.A.J., Van de Waal, D.B., Verdegem, M.C.J. Essential fatty acid dynamics in intensive mesocosm shrimp ponds (Litopenaeus vannamei).
Essential fatty acid dynamics in intensive mesocosm shrimp ponds (Litopenaeus vannamei).
Chapter 3

Abstract A promising approach to reduce aquaculture’s dependency on fishmeal and fish oil, is to enhance the contribution of natural food into shrimp production. Pond food web compartments in form of biofloc, seston, periphyton and detritus are potential additional nutrient sources, but not all are accessible to the shrimp. Most of the studies on increasing natural food contribution focus on protein content by managing heterotrophic microbial biomass production. In contrast, the potential contribution of highly unsaturated fatty acids (HUFA) by autotrophic production to shrimp biomass is poorly explored. Previous study of current authors showed shrimp fed non-fishmeal and non-fish oil diets, source 32 % of their total EPA-gain and 6 % of their total DHA-gain from the algal-based food web (Hermsen et al., 2019a). It is currently unclear which parts of pond’s food web compartments contain the highest HUFA, and if these parts are accessible to shrimp. This study follows previous study by exploring into food web compartments. The aim was to increase the contribution of in situ produced natural food into shrimp production, and secondly to localise and quantify the de novo produced HUFA accumulation and distribution over the following food web compartments in semi-intensive shrimp mesocosms: water column (sub-divided into seston and biofloc), periphyton, detritus, external feed and shrimp. Shrimp were fed a HUFA-deficient diet (LowH treatment) in order to I) encourage higher natural food uptake, and II) Identify in which compartments in situ produced HUFA accumulates most in the food web. This was done by replacing dietary fish oil and fishmeal by vegetable non-HUFA substitutes. The two dietary treatments (control versus LowH treatment) were randomly allocated over six mesocosm tanks of 700 L working volume artificial seawater. At start and end of the 57-days experiment, all mesocosm compartments were sampled in order to make mass balances of phosphorous, organic matter, and HUFA. Shrimp biomass production was not affected by diet. Both treatments showed a large build-up of organic matter in the system distributed over all food web compartments, but total accumulated build-up was less in the LowH treatment, likely caused by increased consumption by shrimp in this group. Where biofloc dominated in terms of biomass, seston dominated in terms of HUFA accumulation. This total HUFA production was a more than 600% increase compared to the minimal HUFA-input in the tanks receiving HUFA-deficient diets. Shrimp of both treatments showed active PUFA to HUFA synthesis inside their body. This activity was twice as high in the control group. Of the total feed input expressed in organic matter, 12% got incorporated into shrimp organic matter biomass. The majority of all nutrients present in the system, including de novo produced HUFA, remains in the food web compartments other than shrimp and get lost after shrimp harvest. Future study should focus on finding ways to reclaim those nutrients from the system in a more efficient way.
Keywords: natural food, HUFA, fishmeal, fish oil, Litopenaeus vannamei, mesocosm

3
ESSENTIAL FATTY ACID DYNAMICS IN INTENSIVE MESOCOSM SHRIMP PONDS 45
3.1. Introduction
3.1.1 Challenges of pond intensificationPond shrimp production has intensified over the last decades. This was done by changing traditional extensive pond systems that relied partially on in situ produced natural food, into holding tank ponds relying fully on externally produced formulated feeds. The use of complete feeds increased production and feeding efficiency, but also increased metabolic waste production. These metabolic wastes outstrip the carrying capacity of stagnant ponds and demand water replacement and waste removal to maintain favourable culture conditions (Kautsky et al., 2000, Brune et al., 2003, Bondad-Reantaso et al., 2005, Verdegem et al., 2006, Mischke 2012, Stentiford et al., 2012). Insufficient control of metabolic wastes in aquaculture leads to environmental pollution and is a major issue affecting the sector’s sustainability (Verdegem 2013, FAO 2017). The use of high amounts of formulated feeds in intensive systems involves wasteful use of limited resources such as protein and highly unsaturated fatty acids (HUFA) which are commonly derived from fish meal and fish oil. This makes aquaculture production dependent on capture fisheries, which should be avoided (Boyd et al., 2007, FAO 2017).
3.1.2 The potential of natural food contributionA possible way to reduce aquaculture’s dependency on fishmeal and fish oil as nutrient resources, is to enhance the contribution of natural food into shrimp production. A positive side effect of such an approach is that a healthy culture environment can be maintained without the necessity of waste discharge and its associated environmental pollution. When organic waste is kept in the system, such as in mesocosms (zero-water exchange), tiny aggregates of microorganisms are being formed in the water column as long as enough oxygen is available. These aggregates are known as biofloc and can contain bacteria, zooplankton and algae. Bacteria and algae in the water column that are not yet aggregated are defined as seston. Biofloc and seston together with other types of natural food as detritus (settled material on the bottom) and periphyton (biofilm on substrates), are a potential additional nutrient source to shrimp although each compartment brings along challenges concerning accessibility (Table 1). In natural systems without external feed input, autotrophic primary production reaches an average of 4 g carbon (C) m-2 d-1 (Brune 1991, Verdegem et al., 1999, Brune et al., 2003), an equivalent of 7-8 g organic matter (OM) m-2 day-1. These extensive systems can produce approximately 300 kg shrimp ha-1 per 120 days, an equivalent of 30 g wet weight shrimp m-2, or 7 g OM shrimp m-2 in 120 days (Joffre, 2010). In such systems, less than 1 % of the pond’s primary production contributes to shrimp biomass production. In contrast, in (semi)intensive systems, by adding formulated feed into the pond, primary production can reach an equivalent of 8 g m-2 d-1, while shrimp production can exceed 3000 kg shrimp ha-1 per 120 days. This means that in (semi)intensive systems, around 3 - 4 % of primary production contributes to shrimp biomass production. In such ponds, 50% of the
46 CHAPTER 3
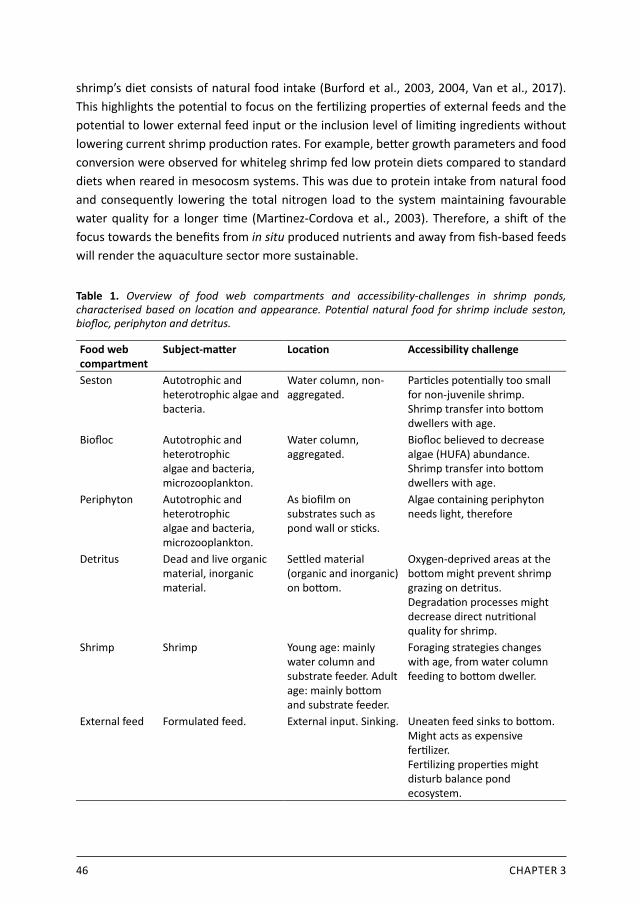
shrimp’s diet consists of natural food intake (Burford et al., 2003, 2004, Van et al., 2017). This highlights the potential to focus on the fertilizing properties of external feeds and the potential to lower external feed input or the inclusion level of limiting ingredients without lowering current shrimp production rates. For example, better growth parameters and food conversion were observed for whiteleg shrimp fed low protein diets compared to standard diets when reared in mesocosm systems. This was due to protein intake from natural food and consequently lowering the total nitrogen load to the system maintaining favourable water quality for a longer time (Martinez-Cordova et al., 2003). Therefore, a shift of the focus towards the benefits from in situ produced nutrients and away from fish-based feeds will render the aquaculture sector more sustainable.
Table 1. Overview of food web compartments and accessibility-challenges in shrimp ponds, characterised based on location and appearance. Potential natural food for shrimp include seston, biofloc, periphyton and detritus.
Food web compartment
Subject-matter Location Accessibility challenge
Seston Autotrophic and heterotrophic algae and bacteria.
Water column, non-aggregated.
Particles potentially too small for non-juvenile shrimp. Shrimp transfer into bottom dwellers with age.
Biofloc Autotrophic and heterotrophic algae and bacteria, microzooplankton.
Water column, aggregated.
Biofloc believed to decrease algae (HUFA) abundance. Shrimp transfer into bottom dwellers with age.
Periphyton Autotrophic and heterotrophic algae and bacteria, microzooplankton.
As biofilm on substrates such as pond wall or sticks.
Algae containing periphyton needs light, therefore
Detritus Dead and live organic material, inorganic material.
Settled material (organic and inorganic) on bottom.
Oxygen-deprived areas at the bottom might prevent shrimp grazing on detritus. Degradation processes might decrease direct nutritional quality for shrimp.
Shrimp Shrimp Young age: mainly water column and substrate feeder. Adult age: mainly bottom and substrate feeder.
Foraging strategies changes with age, from water column feeding to bottom dweller.
External feed Formulated feed. External input. Sinking. Uneaten feed sinks to bottom. Might acts as expensive fertilizer. Fertilizing properties might disturb balance pond ecosystem.
3
ESSENTIAL FATTY ACID DYNAMICS IN INTENSIVE MESOCOSM SHRIMP PONDS 47
3.1.3 Access to abundant natural food The production of natural food in aquaculture ponds indicates that part of the formulated feed is currently acting as expensive organic fertilizer to the pond’s ecosystem. For an efficient system, the formulated feed must meet the nutritional requirement of the shrimp, while the metabolic waste and uneaten feed must meet the fertilisation requirements for heterotrophic and autotrophic food web production. By adjusting feed formulation, natural food production and its contribution to shrimp production could be improved.
With increasing shrimp biomass, the pressure on natural food increases. Unfortunately, not all of the produced natural food is food for the shrimp due to specific foraging behaviour (Table 1). With increasing age, L. vannamei switches from water column feeder targeting small particles, to mainly bottom feeder (Briggs 2006). Also, as the production cycle progresses and feed input increases, sedimentation of organic material to the bottom increases. This might result in anaerobic conditions and formation of potentially toxic materials. Shrimp, by avoiding anaerobic sediment, loses forage area reducing production (Avnimelech and Ritvo, 2003). In aquaculture, this inefficiency in nutrient transfer into shrimp biomass is partly addressed by making use of different production strategies. For example, polycultures aim on canalising nutrients in an additional species with complementing foraging behaviour (Lombardi et al., 2006, Fitzsimmons and Shahkar 2017). Biofloc systems canalise nutrients into heterotrophic bacterial biomass (Avnimelech 2009), while periphyton systems canalise nutrients into biofilm attached to substrates (like pond-walls or periphyton-sticks) and include bacterial and algal biomass (Azim et al., 2005, Suryakumar and Avnimelech 2017). These strategies stimulate the abundance of natural food in specific compartments with the aim to enhance the contribution of natural food to pond production. Identification of the nutritional value of each compartment might aid in better understanding the potential of changing current production systems into systems with optimised contribution of in situ nutrient production. Unfortunately, insight in the accumulation and partitioning over compartments in aquaulture ponds is limited.
3.1.4 HUFA content natural foodMost of the studies on increasing the contribution of natural food to production, focus on protein or amino acid content by managing heterotrophic microbial biomass production (Hari et al., 2006, Façanha et al., 2016). In contrast, the potential increase of contribution of essential HUFA by photoautotrophic production to shrimp biomass is poorly explored (Neori 2011, Bojórquez-Mascareño and Soto-Jiménez 2013). Since shrimp, as fish and mammals, are incapable of producing sufficient amounts of HUFA including 20:5n-3 (EPA), 22:6n-3 (DHA) and 20:4n-6 (ARA) from the precursors 18:3n-3 (ALA) and 18:2n-6 (LA), respectively (Figure 1), it is recommended to include 0.3% n-3 HUFA in formulated diets (González‐Félix et al., 2003). Algae are a well-recognized source of HUFA for aquaculture purposes. The HUFA content between algae species varies and it is therefore recommended to have a
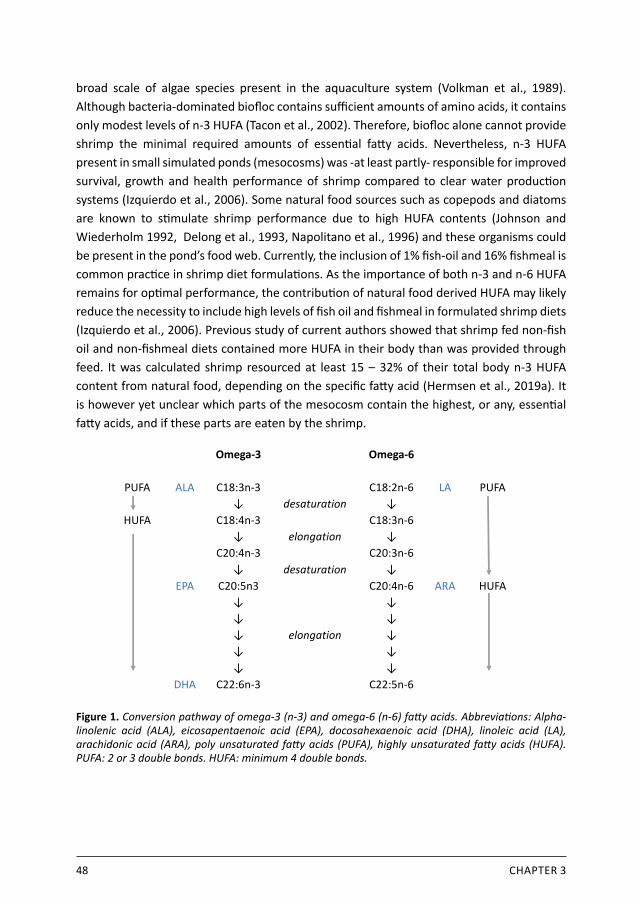
48 CHAPTER 3
broad scale of algae species present in the aquaculture system (Volkman et al., 1989). Although bacteria-dominated biofloc contains sufficient amounts of amino acids, it contains only modest levels of n-3 HUFA (Tacon et al., 2002). Therefore, biofloc alone cannot provide shrimp the minimal required amounts of essential fatty acids. Nevertheless, n-3 HUFA present in small simulated ponds (mesocosms) was -at least partly- responsible for improved survival, growth and health performance of shrimp compared to clear water production systems (Izquierdo et al., 2006). Some natural food sources such as copepods and diatoms are known to stimulate shrimp performance due to high HUFA contents (Johnson and Wiederholm 1992, Delong et al., 1993, Napolitano et al., 1996) and these organisms could be present in the pond’s food web. Currently, the inclusion of 1% fish-oil and 16% fishmeal is common practice in shrimp diet formulations. As the importance of both n-3 and n-6 HUFA remains for optimal performance, the contribution of natural food derived HUFA may likely reduce the necessity to include high levels of fish oil and fishmeal in formulated shrimp diets (Izquierdo et al., 2006). Previous study of current authors showed that shrimp fed non-fish oil and non-fishmeal diets contained more HUFA in their body than was provided through feed. It was calculated shrimp resourced at least 15 – 32% of their total body n-3 HUFA content from natural food, depending on the specific fatty acid (Hermsen et al., 2019a). It is however yet unclear which parts of the mesocosm contain the highest, or any, essential fatty acids, and if these parts are eaten by the shrimp.
Omega-3 Omega-6
PUFA ALA C18:3n-3 C18:2n-6 LA PUFA↓ desaturation ↓
HUFA C18:4n-3 C18:3n-6↓ elongation ↓
C20:4n-3 C20:3n-6↓ desaturation ↓
EPA C20:5n3 C20:4n-6 ARA HUFA↓ ↓↓ ↓↓ elongation ↓↓ ↓↓ ↓
DHA C22:6n-3 C22:5n-6
Figure 1. Conversion pathway of omega-3 (n-3) and omega-6 (n-6) fatty acids. Abbreviations: Alpha-linolenic acid (ALA), eicosapentaenoic acid (EPA), docosahexaenoic acid (DHA), linoleic acid (LA), arachidonic acid (ARA), poly unsaturated fatty acids (PUFA), highly unsaturated fatty acids (HUFA). PUFA: 2 or 3 double bonds. HUFA: minimum 4 double bonds.
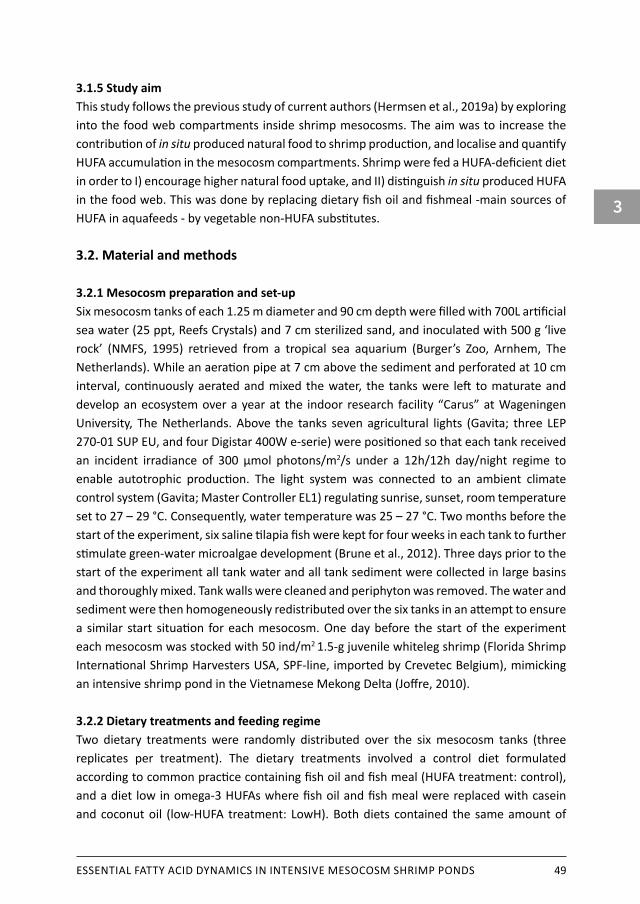
3
ESSENTIAL FATTY ACID DYNAMICS IN INTENSIVE MESOCOSM SHRIMP PONDS 49
3.1.5 Study aimThis study follows the previous study of current authors (Hermsen et al., 2019a) by exploring into the food web compartments inside shrimp mesocosms. The aim was to increase the contribution of in situ produced natural food to shrimp production, and localise and quantify HUFA accumulation in the mesocosm compartments. Shrimp were fed a HUFA-deficient diet in order to I) encourage higher natural food uptake, and II) distinguish in situ produced HUFA in the food web. This was done by replacing dietary fish oil and fishmeal -main sources of HUFA in aquafeeds - by vegetable non-HUFA substitutes.
3.2. Material and methods
3.2.1 Mesocosm preparation and set-upSix mesocosm tanks of each 1.25 m diameter and 90 cm depth were filled with 700L artificial sea water (25 ppt, Reefs Crystals) and 7 cm sterilized sand, and inoculated with 500 g ‘live rock’ (NMFS, 1995) retrieved from a tropical sea aquarium (Burger’s Zoo, Arnhem, The Netherlands). While an aeration pipe at 7 cm above the sediment and perforated at 10 cm interval, continuously aerated and mixed the water, the tanks were left to maturate and develop an ecosystem over a year at the indoor research facility “Carus” at Wageningen University, The Netherlands. Above the tanks seven agricultural lights (Gavita; three LEP 270-01 SUP EU, and four Digistar 400W e-serie) were positioned so that each tank received an incident irradiance of 300 µmol photons/m2/s under a 12h/12h day/night regime to enable autotrophic production. The light system was connected to an ambient climate control system (Gavita; Master Controller EL1) regulating sunrise, sunset, room temperature set to 27 – 29 °C. Consequently, water temperature was 25 – 27 °C. Two months before the start of the experiment, six saline tilapia fish were kept for four weeks in each tank to further stimulate green-water microalgae development (Brune et al., 2012). Three days prior to the start of the experiment all tank water and all tank sediment were collected in large basins and thoroughly mixed. Tank walls were cleaned and periphyton was removed. The water and sediment were then homogeneously redistributed over the six tanks in an attempt to ensure a similar start situation for each mesocosm. One day before the start of the experiment each mesocosm was stocked with 50 ind/m2 1.5-g juvenile whiteleg shrimp (Florida Shrimp International Shrimp Harvesters USA, SPF-line, imported by Crevetec Belgium), mimicking an intensive shrimp pond in the Vietnamese Mekong Delta (Joffre, 2010).
3.2.2 Dietary treatments and feeding regimeTwo dietary treatments were randomly distributed over the six mesocosm tanks (three replicates per treatment). The dietary treatments involved a control diet formulated according to common practice containing fish oil and fish meal (HUFA treatment: control), and a diet low in omega-3 HUFAs where fish oil and fish meal were replaced with casein and coconut oil (low-HUFA treatment: LowH). Both diets contained the same amount of

50 CHAPTER 3
crude protein, essential amino acids and vitamins, crude fat and energy. Regarding shrimp feeding requirements, the control diet contained sufficient amounts of HUFA, EPA and DHA, while the LowH diet was n-3 HUFA deficient (González‐Félix et al., 2003) (feeding table in supplementary information). An automatic 24h belt feeder was connected to each tank to evenly distribute feed during the day and night. Each tank received 434 g feed (wet weight) during the entire experiment, starting at 4.9 % shrimp body weight per day and daily decreasing reaching 3.4 % body weight per day at the end.
3.2.3 Food web compartment samplingAll six food web compartments were sampled on days 0 and 57 (harvest) of the eight weeks experiment. For shrimp, 20 individuals were selected at stocking as representatives of the start population, euthanized using ice water and stored at -20 °C prior to further analysis. At day 57 shrimp were harvested from each mesocosm, counted, weighed, euthanized and stored at -20 °C prior to further analysis. At each sampling day, a representative 2L water column sample was taken and passed through a 30 μm mesh filter. A mesh size of 30 μm was chosen to separate flocculating matter and zooplankton from single cell algae and bacteria. Most bacteria range from 0.2 – 2.0 μm, whereas marine algae range from 2 – 6 μm. Some zooplankton species range from 2 – 20 μm (nano- and micro-zooplankton), but zooplankton species of interest to shrimp production such as copepods and rotifers, exceed 30 μm. The filter residue containing biofloc (>30 μm) was washed-out with fresh water and equally distributed over six glass microfiber filters (Whatman, GF/F, diameter 55mm) using a high-pressure pump (Vacuubrand GMBH, MZ 2C NT, Germany). The water filtrate containing seston (<30 μm) was continuously stirred while taking six subsamples of know volume, approximately 300 ml per sample, and distributed over glass microfiber filters using a high-pressure pump while being washed-out with fresh water. All glass microfiber filters containing seston and biofloc samples were immediately stored at -20 °C prior to further analysis. To check water column food web compartments (seston and biofloc) for algae abundance, three samples of the water column at 20 cm depth were measured weekly for chlorophyll-a fluorescence based on Pulse Amplitude Modulation technique (Walz GmbH, Germany). Periphyton samples were taken by scraping the tank wall from bottom to top on three different spots with a 10 cm wide spatula, covering a total tank wall surface of 900 cm2 per sampling. The periphyton was stored in aluminium containers at -20 ºC prior to further analysis. With a sediment sampler (Technical Development Studio, Wageningen University, The Netherlands) 100 cm2 was taken from the bottom in triplo, 300 cm2 in total per sampling, and the sand containing the detritus was stored in aluminium trays and stored at -20 ºC prior to further analysis. Feed grab samples were taken weekly and stored airtight at 4 °C to obtain representative samples of both dietary diets used during the experiment.

3
ESSENTIAL FATTY ACID DYNAMICS IN INTENSIVE MESOCOSM SHRIMP PONDS 51
3.2.4 Methodical check system samplingWhen there is no water refreshment and waste removal, phosphorous remains in the system. Therefore, comparing phosphorous mass balances between treatments to determine phosphorous-retention (the percentage of phosphorous-input kept in the system) forms a tool to check if representative samples of food web compartments were taken. If total phosphorous-retention is close to 100 %, then this partially supports the assumption that samples were representative of the nutrient distribution in the system. Phosphorous content of all compartments including feed were determined at start and end of the experiment by determining P-composition, multiplied by abundant organic matter biomass.
3.2.5 Water quality control Water quality parameters were measured weekly and checked for values favourable for growth at <2 mg NO2
-/L, < 50 mg NO3- /L, < 4 mg TAN/L, and 7.0 - 8.8 pH. Salinity was
maintained by adding fresh water of 22 °C twice weekly to compensate for evaporation losses. Measurements were taken using a multi-parameter portable meter (WTW Multi 3430) at 10:00AM for pH and oxidation reduction potential (ORP) (Sentix 940) and salinity (Tetracon 925). Orthophosphate, NO2
-, NO3- and total ammonia nitrogen (TAN) were
measured using a Smartchem (Smartchem 200, Alliance Instruments, AMS Systea, Frepillon, France) following protocol NEN-ISO6777 and NEN-ISO7150-1.
3.2.6 AnalysesMicrofiber filters containing seston and biofloc samples, detritus samples and periphyton samples were freeze-dried (ZIRBUS technology, Sublimator 3X4X5, Zirbus technology GmBH, Bad Grund, Germany). Gastrointestinal tracts of sampled shrimp were removed and shrimp were subsequently freeze-dried. Next, shrimp and feed samples were ground using a centrifugal grinding mill operated at 60 % amplitude for 3 minutes at 12,000 RPM (Retsch 200 ZM 1mm sieve). Chemical analysis of shrimp, feed, seston, biofloc, periphyton and detritus included determination of dry matter (DM) (protocol ISO6496), ash (ISO5985) and phosphorous (P) content (Murphy and Riley, 1962). For shrimp and feed additionally crude protein (CP) (ISO5983), crude fat (CF) (ISO6492) and gross energy (E) (ISO9831) was determined. Organic matter (OM) and carbohydrate (CH) content were calculated based on dry matter content minus ash content, and organic matter content minus crude protein and fat content respectively. Feed conversion ratio was calculated as feed input divided by shrimp biomass gain. Fatty acid profiles of all food web compartments were analysed following direct transesterification of fatty acid methyl esters (Lepage and Roy, 1984).
3.2.7 Data analysisThe data analysis was carried out using IBM SPSS software package version 23 (IBM Corp. Released 2013. IBM SPSS Statistics for Windows, Version 23.0. Armonk, NY: IBM Corp). Mesocosm tanks were the experimental units. Comparison of means was performed by

52 CHAPTER 3
independent t-tests. Outcomes are presented as treatment means (± standard deviati on, n=3).
3.3. Results
3.3.1 Water quality and methodical check system samplingNo diff erences in recorded water parameters were observed between treatments. All water parameters stayed below set limits without correcti on needed. The pH of 8.2 was constant over ti me. Measured phosphorous retenti on was 90% in both treatments (n = 6, P = 0.895). Also phosphorous distributi on (measured in absolute values) over food web compartments including orthophosphate (Pi) was similar between treatments (for all compartments P > 0.110) (Figure 2)).
Figure 2. Phosphorous mass balance. Left : Phosphorous distributi on in absolute values (g) of food web compartments and orthophosphate (Pi) at the start, plus total phosphorous input through feed over the enti re experiment. Right: Phosphorous retenti on (%) at the end of the experiment.
3.3.2 Biomass accumulati onIn the water column, algae abundance increased over ti me (control P = 0.017, LowH P = 0.049) (Figure 3). No signifi cant diff erences were observed between treatments. Algae abundance showed large variati on between treatments as well as within treatment.
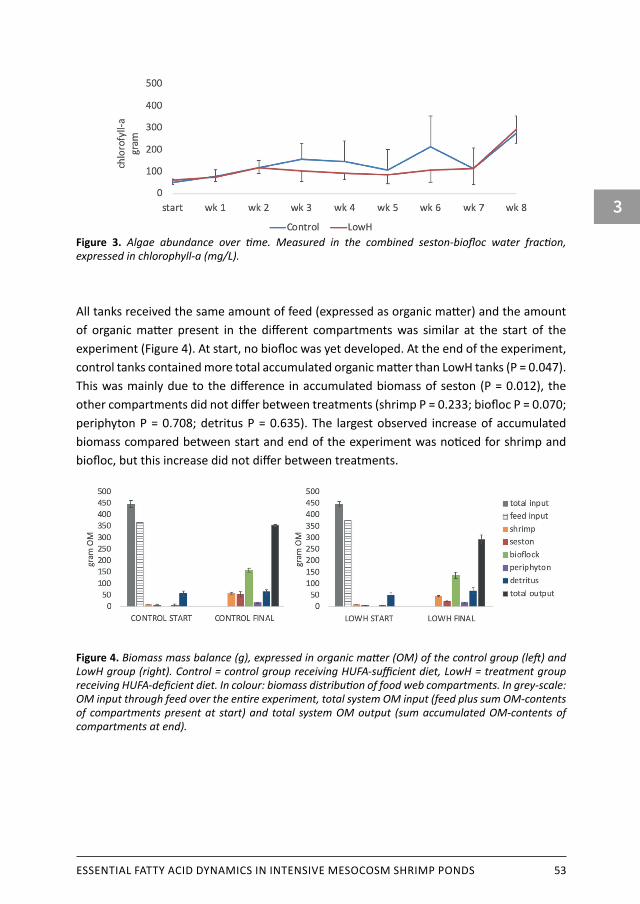
3
ESSENTIAL FATTY ACID DYNAMICS IN INTENSIVE MESOCOSM SHRIMP PONDS 53
Figure 3. Algae abundance over ti me. Measured in the combined seston-biofl oc water fracti on, expressed in chlorophyll-a (mg/L).
All tanks received the same amount of feed (expressed as organic matt er) and the amount of organic matt er present in the diff erent compartments was similar at the start of the experiment (Figure 4). At start, no biofl oc was yet developed. At the end of the experiment, control tanks contained more total accumulated organic matt er than LowH tanks (P = 0.047). This was mainly due to the diff erence in accumulated biomass of seston (P = 0.012), the other compartments did not diff er between treatments (shrimp P = 0.233; biofl oc P = 0.070; periphyton P = 0.708; detritus P = 0.635). The largest observed increase of accumulated biomass compared between start and end of the experiment was noti ced for shrimp and biofl oc, but this increase did not diff er between treatments.
Figure 4. Biomass mass balance (g), expressed in organic matt er (OM) of the control group (left ) and LowH group (right). Control = control group receiving HUFA-suffi cient diet, LowH = treatment group receiving HUFA-defi cient diet. In colour: biomass distributi on of food web compartments. In grey-scale: OM input through feed over the enti re experiment, total system OM input (feed plus sum OM-contents of compartments present at start) and total system OM output (sum accumulated OM-contents of compartments at end).
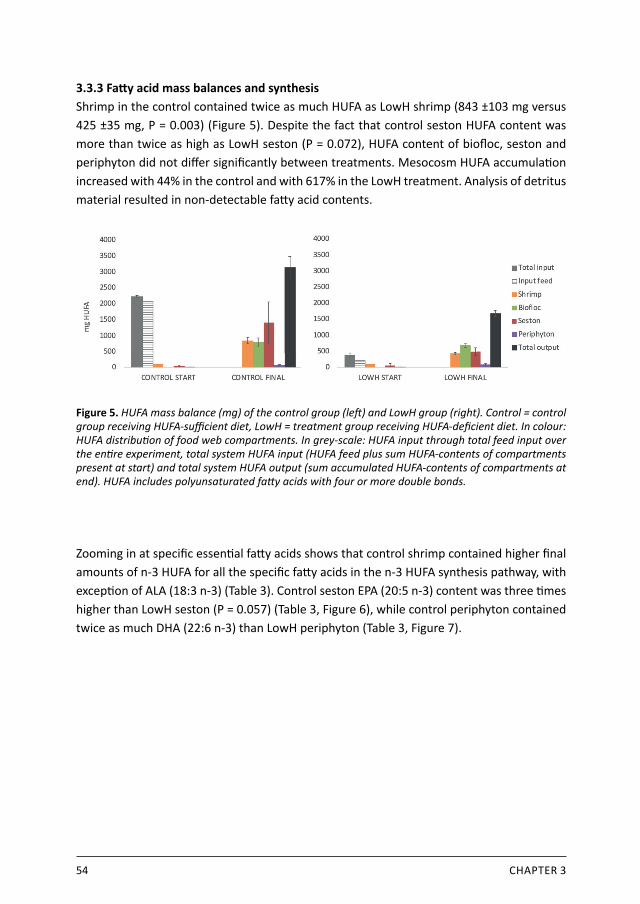
54 CHAPTER 3
3.3.3 Fatt y acid mass balances and synthesisShrimp in the control contained twice as much HUFA as LowH shrimp (843 ±103 mg versus 425 ±35 mg, P = 0.003) (Figure 5). Despite the fact that control seston HUFA content was more than twice as high as LowH seston (P = 0.072), HUFA content of biofl oc, seston and periphyton did not diff er signifi cantly between treatments. Mesocosm HUFA accumulati on increased with 44% in the control and with 617% in the LowH treatment. Analysis of detritus material resulted in non-detectable fatt y acid contents.
Figure 5. HUFA mass balance (mg) of the control group (left ) and LowH group (right). Control = control group receiving HUFA-suffi cient diet, LowH = treatment group receiving HUFA-defi cient diet. In colour: HUFA distributi on of food web compartments. In grey-scale: HUFA input through total feed input over the enti re experiment, total system HUFA input (HUFA feed plus sum HUFA-contents of compartments present at start) and total system HUFA output (sum accumulated HUFA-contents of compartments at end). HUFA includes polyunsaturated fatt y acids with four or more double bonds.
Zooming in at specifi c essenti al fatt y acids shows that control shrimp contained higher fi nal amounts of n-3 HUFA for all the specifi c fatt y acids in the n-3 HUFA synthesis pathway, with excepti on of ALA (18:3 n-3) (Table 3). Control seston EPA (20:5 n-3) content was three ti mes higher than LowH seston (P = 0.057) (Table 3, Figure 6), while control periphyton contained twice as much DHA (22:6 n-3) than LowH periphyton (Table 3, Figure 7).

3
ESSENTIAL FATTY ACID DYNAMICS IN INTENSIVE MESOCOSM SHRIMP PONDS 55
Tabl
e 3.
Fin
al c
onte
nts
of e
ssen
tial o
meg
a-3
and
omeg
a-6
fatt
y ac
ids
and
thei
r rel
ated
bio
logi
cal s
ynth
esis
prod
ucts
(mg)
. Val
ues
high
light
ed in
bol
d di
ffer
signi
fican
tly w
ithin
food
web
com
part
men
t bet
wee
n tr
eatm
ents
(P <
0.0
5).
Shrim
pSe
ston
Biofl
ocPe
riphy
ton
Co
ntro
lLo
wH
Cont
rol
Low
HCo
ntro
l Lo
wH
Cont
rol
Low
HO
meg
a-3
18:3
n-3
(ALA
)46
.3 ±
12.2
*67
.2 ±
10.6
713
±264
**22
2 ±5
4.0
356
±22.
8**
242
±39.
858
.0 ±
32.7
37.3
±18
.618
:4 n
-3
17.2
±3.
28**
9.55
±1.
070.
01 ±
0.02
0.00
0.02
±0.
020.
06 ±
0.03
9.23
±2.
396.
71 ±
3.35
20:4
n-3
6.90
±1.
80**
2.48
±1.
424.
51 ±
4.76
3.34
±3.
127.
69 ±
3.49
7.68
±2.
671.
76 ±
1.97
0.73
±0.
4120
:5 n
-3 (E
PA)
381
±48.
9**
174
±17.
479
5 ±3
38*
264
±76.
044
0 ±4
7.8
383
±46.
048
.1 ±
2.09
46.8
±20
.422
:5 n
-325
.2 ±
3.36
**12
.4 ±
2.36
2.67
±4.
630.
000.
04 ±
0.04
3.64
±3.
252.
76 ±
2.33
0.99
±1.
2722
:6 n
-3 (D
HA)
285
±28.
8**
107
±1.9
310
9 ±6
857
.0 ±
12.8
36.6
±16
.120
.0 ±
3.34
4.50
±1.
09**
2.11
±0.
51
Om
ega-
618
:2 n
-6 (L
A)68
3 ±1
2777
9 ±8
7.8
840
±367
*33
1 ±3
320
6 ±2
0238
5 ±5
3.3
35.5
±9.
8733
.2 ±
14.7
18:3
n-6
3.78
±1.
213.
64 ±
0.93
62.2
±56
.331
.0 ±
53.2
31.1
±0.
7630
.9 ±
6.11
8.39
±2.
195.
88 ±
1.64
20:3
n-6
2.72
±0.
912.
59 ±
0.51
59.9
±35
.6*
13.4
±2.
4915
.9 ±
1.64
18.7
±2.
053.
49 ±
2.32
2.23
±0.
6720
:4 n
-6 (A
RA)
112
±17.
110
8 ±1
6.3
485
±225
*16
2 ±3
1.6
317
±34.
827
1 ±3
1.3
22.5
±3.
0120
.3 ±
10.0
22:4
n-6
0.
000.
21±0
.36
0.00
0.00
0.00
0.00
1.16
±2.
010.
0022
:5 n
-610
.9 ±
1.64
12.1
±0.
877.
62 ±
13.2
5.50
±9.
530.
08 ±
0.01
**0.
18 ±
0.05
1.60
±1.
830.
14 ±
0.17
* Le
vel o
f sig
nific
ance
P <
0.1
0. S
esto
n EP
A P
= 0.
057
** L
evel
of s
igni
fican
ce P
< 0
.05.
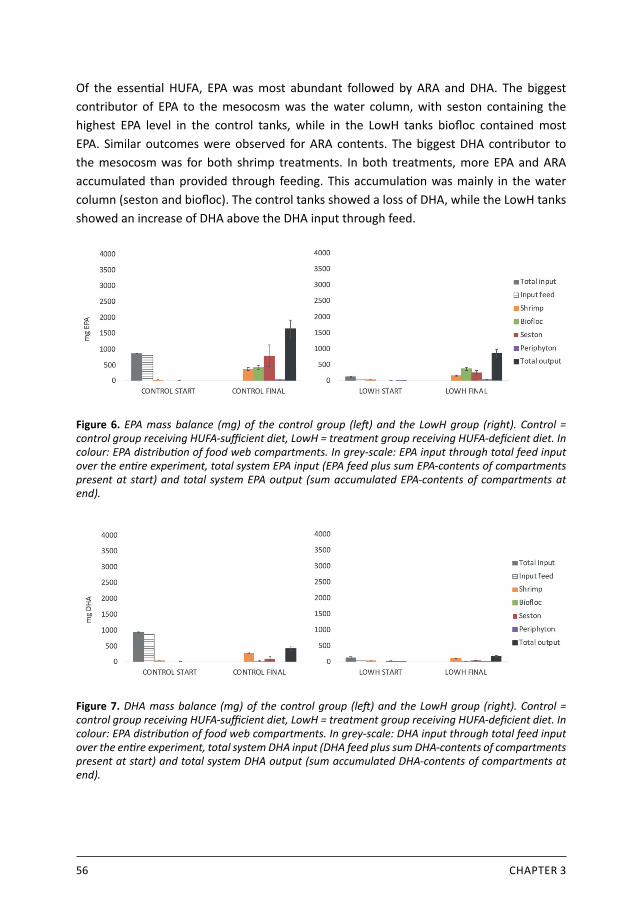
56 CHAPTER 3
Of the essenti al HUFA, EPA was most abundant followed by ARA and DHA. The biggest contributor of EPA to the mesocosm was the water column, with seston containing the highest EPA level in the control tanks, while in the LowH tanks biofl oc contained most EPA. Similar outcomes were observed for ARA contents. The biggest DHA contributor to the mesocosm was for both shrimp treatments. In both treatments, more EPA and ARA accumulated than provided through feeding. This accumulati on was mainly in the water column (seston and biofl oc). The control tanks showed a loss of DHA, while the LowH tanks showed an increase of DHA above the DHA input through feed.
Figure 6. EPA mass balance (mg) of the control group (left ) and the LowH group (right). Control = control group receiving HUFA-suffi cient diet, LowH = treatment group receiving HUFA-defi cient diet. In colour: EPA distributi on of food web compartments. In grey-scale: EPA input through total feed input over the enti re experiment, total system EPA input (EPA feed plus sum EPA-contents of compartments present at start) and total system EPA output (sum accumulated EPA-contents of compartments at end).
Figure 7. DHA mass balance (mg) of the control group (left ) and the LowH group (right). Control = control group receiving HUFA-suffi cient diet, LowH = treatment group receiving HUFA-defi cient diet. In colour: EPA distributi on of food web compartments. In grey-scale: DHA input through total feed input over the enti re experiment, total system DHA input (DHA feed plus sum DHA-contents of compartments present at start) and total system DHA output (sum accumulated DHA-contents of compartments at end).
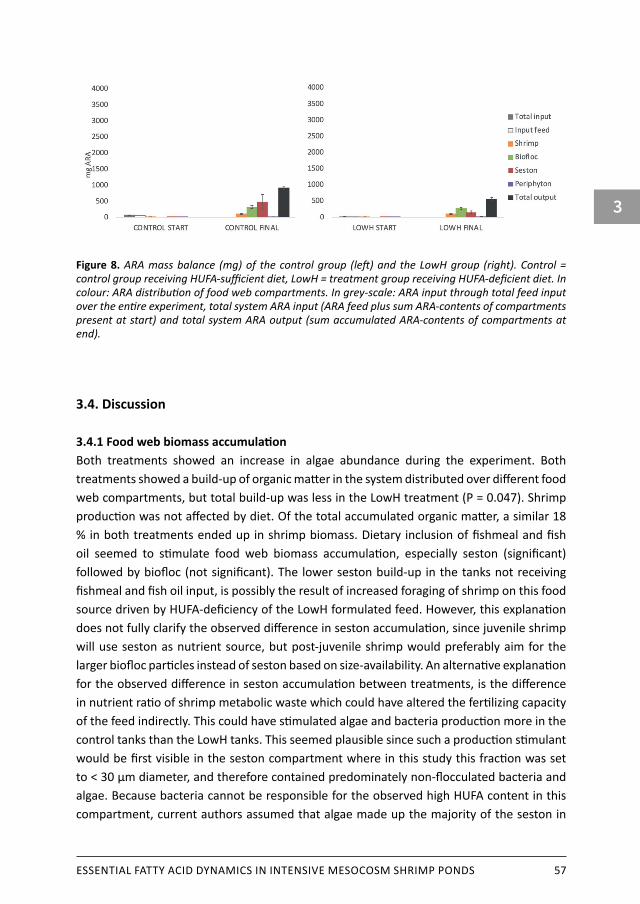
3
ESSENTIAL FATTY ACID DYNAMICS IN INTENSIVE MESOCOSM SHRIMP PONDS 57
Figure 8. ARA mass balance (mg) of the control group (left ) and the LowH group (right). Control = control group receiving HUFA-suffi cient diet, LowH = treatment group receiving HUFA-defi cient diet. In colour: ARA distributi on of food web compartments. In grey-scale: ARA input through total feed input over the enti re experiment, total system ARA input (ARA feed plus sum ARA-contents of compartments present at start) and total system ARA output (sum accumulated ARA-contents of compartments at end).
3.4. Discussion
3.4.1 Food web biomass accumulati onBoth treatments showed an increase in algae abundance during the experiment. Both treatments showed a build-up of organic matt er in the system distributed over diff erent food web compartments, but total build-up was less in the LowH treatment (P = 0.047). Shrimp producti on was not aff ected by diet. Of the total accumulated organic matt er, a similar 18 % in both treatments ended up in shrimp biomass. Dietary inclusion of fi shmeal and fi sh oil seemed to sti mulate food web biomass accumulati on, especially seston (signifi cant) followed by biofl oc (not signifi cant). The lower seston build-up in the tanks not receiving fi shmeal and fi sh oil input, is possibly the result of increased foraging of shrimp on this food source driven by HUFA-defi ciency of the LowH formulated feed. However, this explanati on does not fully clarify the observed diff erence in seston accumulati on, since juvenile shrimp will use seston as nutrient source, but post-juvenile shrimp would preferably aim for the larger biofl oc parti cles instead of seston based on size-availability. An alternati ve explanati on for the observed diff erence in seston accumulati on between treatments, is the diff erence in nutrient rati o of shrimp metabolic waste which could have altered the ferti lizing capacity of the feed indirectly. This could have sti mulated algae and bacteria producti on more in the control tanks than the LowH tanks. This seemed plausible since such a producti on sti mulant would be fi rst visible in the seston compartment where in this study this fracti on was set to < 30 μm diameter, and therefore contained predominately non-fl occulated bacteria and algae. Because bacteria cannot be responsible for the observed high HUFA content in this compartment, current authors assumed that algae made up the majority of the seston in
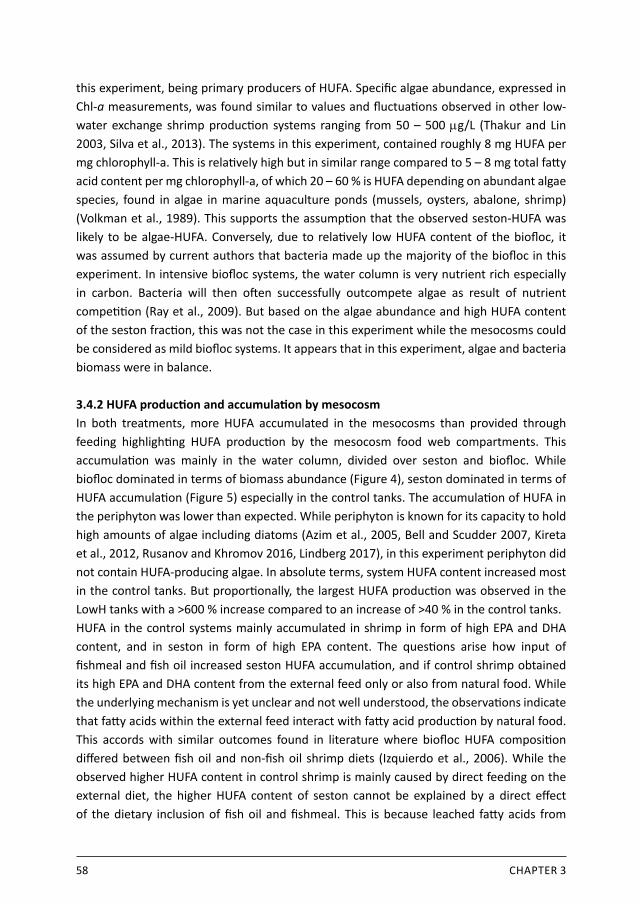
58 CHAPTER 3
this experiment, being primary producers of HUFA. Specific algae abundance, expressed in Chl-a measurements, was found similar to values and fluctuations observed in other low-water exchange shrimp production systems ranging from 50 – 500 mg/L (Thakur and Lin 2003, Silva et al., 2013). The systems in this experiment, contained roughly 8 mg HUFA per mg chlorophyll-a. This is relatively high but in similar range compared to 5 – 8 mg total fatty acid content per mg chlorophyll-a, of which 20 – 60 % is HUFA depending on abundant algae species, found in algae in marine aquaculture ponds (mussels, oysters, abalone, shrimp) (Volkman et al., 1989). This supports the assumption that the observed seston-HUFA was likely to be algae-HUFA. Conversely, due to relatively low HUFA content of the biofloc, it was assumed by current authors that bacteria made up the majority of the biofloc in this experiment. In intensive biofloc systems, the water column is very nutrient rich especially in carbon. Bacteria will then often successfully outcompete algae as result of nutrient competition (Ray et al., 2009). But based on the algae abundance and high HUFA content of the seston fraction, this was not the case in this experiment while the mesocosms could be considered as mild biofloc systems. It appears that in this experiment, algae and bacteria biomass were in balance.
3.4.2 HUFA production and accumulation by mesocosmIn both treatments, more HUFA accumulated in the mesocosms than provided through feeding highlighting HUFA production by the mesocosm food web compartments. This accumulation was mainly in the water column, divided over seston and biofloc. While biofloc dominated in terms of biomass abundance (Figure 4), seston dominated in terms of HUFA accumulation (Figure 5) especially in the control tanks. The accumulation of HUFA in the periphyton was lower than expected. While periphyton is known for its capacity to hold high amounts of algae including diatoms (Azim et al., 2005, Bell and Scudder 2007, Kireta et al., 2012, Rusanov and Khromov 2016, Lindberg 2017), in this experiment periphyton did not contain HUFA-producing algae. In absolute terms, system HUFA content increased most in the control tanks. But proportionally, the largest HUFA production was observed in the LowH tanks with a >600 % increase compared to an increase of >40 % in the control tanks.HUFA in the control systems mainly accumulated in shrimp in form of high EPA and DHA content, and in seston in form of high EPA content. The questions arise how input of fishmeal and fish oil increased seston HUFA accumulation, and if control shrimp obtained its high EPA and DHA content from the external feed only or also from natural food. While the underlying mechanism is yet unclear and not well understood, the observations indicate that fatty acids within the external feed interact with fatty acid production by natural food. This accords with similar outcomes found in literature where biofloc HUFA composition differed between fish oil and non-fish oil shrimp diets (Izquierdo et al., 2006). While the observed higher HUFA content in control shrimp is mainly caused by direct feeding on the external diet, the higher HUFA content of seston cannot be explained by a direct effect of the dietary inclusion of fish oil and fishmeal. This is because leached fatty acids from
3
ESSENTIAL FATTY ACID DYNAMICS IN INTENSIVE MESOCOSM SHRIMP PONDS 59
external feed are unlikely to be incorporated into algae biomass or bacterial biomass. A possible explanation for the observed higher seston HUFA content in the control group, and in specific EPA, can be partly explained by a higher seston grazing by the shrimp in the LowH tanks driven by nutrient deficiency of the formulated diet. When more seston is consumed by the shrimp in the LowH tanks, total accumulated seston HUFA will appear to be lower. While indeed LowH seston biomass was lower than control seston biomass, this explanation cannot fully explain the difference in seston HUFA accumulation between treatments. In addition to higher absolute seston abundance in the control tanks, control seston also contained a higher percentage of HUFA than LowH seston. HUFA composition (% of total fatty acid content) was 8.7 % in control seston and 6.8 % in LowH seston. This was mainly due to the difference in EPA composition being 4.7% in the control seston and 3.7% in the LowH seston. Although different algae species can be responsible for different HUFA contents, the underlying mechanisms determining the interaction between feed input and natural food fatty acid production is not understood and was not observed in biofloc.
In both treatments, the whole system –thus all compartments including shrimp- accumulated more total HUFA than provided through feeding. This pinpoints to in situ de novo HUFA production by primary producers. Mainly EPA production was responsible for the observed de novo HUFA accumulation. In both treatments, system EPA output was higher than EPA content at the start plus the total EPA input through external feed. In both treatments, much more EPA was present in the system at harvest than the amount of EPA initially present combined with the amount of EPA fed. The control treatment the EPA-increase was 1.9-fold, while in the LowH treatment the increase was 12-fold (Figure 6). Applying the same reasoning to DHA, in the control treatment 57 % of the dietary DHA input was lost during the experiment, while in the LowH treatment the DHA content in the pond increased with 4-fold compared to input (Figure 7). Similarly, ARA content in the pond increased 15-fold in the control treatment and 69-fold in the LowH treatment during the experiment (Figure 8). These results clearly show that a zero-water exchange system, being a mild biofloc system, produces large amounts of essential HUFA de novo, and in special high amounts of EPA. Nevertheless, this in situ produced HUFA predominantly remains locked in the system rather than being transferred into shrimp biomass. With harvesting shrimp, only 25 – 27 % (LowH treatment and control) of the total mesocosm HUFA content is removed from the system. The challenge is to find ways to make the remaining 75 % fatty acids better accessible to the shrimp.
3.4.3 Shrimp HUFA synthesisShrimp biomass production was not affected by diet in this experiment. However, in terms of HUFA content, the LowH dietary treatment resulted in shrimp containing only half the HUFA as observed in control shrimp. Compared to wild caught L. vannamei (Browdy et al., 2006), LowH shrimp contained only one third of the EPA content and this might indicate that the food web

60 CHAPTER 3
compartments in the mesocosm were not able to fulfil the shrimp HUFA requirements. On the other hand, since biomass production was not affected, it might be stated that LowH shrimp received sufficient HUFA originating from natural food in the mesocosm. However, when focussing on the specific n-3 fatty acids of the n-3 PUFA to HUFA synthesis pathway (Figure 1) in shrimp tissue (Table 3), control shrimp contained roughly twice as much intermediate synthesis products, showing control shrimp synthesized HUFA more actively than LowH shrimp. The shrimp’s ability to synthesize HUFA from PUFA has been, and still is, under debate. But recent study shows that L. vannamei expresses all elongation and desaturase enzymes involved in the synthesis process. The expression of these enzymes and thus the capacity to elongate PUFA into HUFA, increases with higher PUFA precursor availability and decreased salinity (Chen et al., 2017). Shrimp show changes in gene expression related to fat metabolism when changing from fish oil diet to soybean oil diets (Xu et al., 2016). This demonstrates that shrimp may increase or adjust their synthesis activity when environmental conditions are more challenging. For example, shrimp in described study (Chen et al., 2017) showed higher gene enzyme expression when fed linseed diets high in ALA than when fed fishmeal diets high in EPA and DHA. This is opposite to the observations in this current experiment, where shrimp showed higher synthesis activity when provided with sufficient HUFA than shrimp provided a HUFA-deficient diet. This does not reject the possibility that LowH shrimp increased their gene expression related to fatty acid metabolism compared to control shrimp. It does however show that shrimp provided with sufficient dietary HUFA, will actively synthesize these HUFA in desired fatty acid contents. It remains unclear if LowH shrimp were experiencing a dietary environment lacking access to sufficient HUFA sources.
3.4.4 Methodical check for system sampling No differences between treatments were found for P-retention and food web sample were presumed to be reliable. A 10% of the phosphorous balance is not accounted for while all food web compartments and ortho-phosphate were analysed. This underestimation is likely caused by sampling error of detritus. It is assumed that more phosphorous was present in the detritus than found during analysis. Nutrient contents of detritus material were therefore considered incomplete.
3.4.5 Increase natural food accessibility3.4.5.1 Water re-useWhen making a mass balance for OM and neglecting contribution of autotrophic primary production, this study showed that of the total OM-input in form of feed, on average, for both treatments combined, 12% ended up in shrimp biomass production (n = 6) (Figure 4). Of the total produced system OM biomass, 18 % consisted of shrimp OM biomass. These figures were similar for both treatments. The remaining 88% of feed OM-input was partly lost by respiration as results of metabolic processes in the pond (control treatment 25%, LowH treatment 41%), but further captured in accumulated food web compartment increase: 40%
3
ESSENTIAL FATTY ACID DYNAMICS IN INTENSIVE MESOCOSM SHRIMP PONDS 61
of the feed OM-input ended in biofloc (average of both treatments), 3% in periphyton, 4% in detritus, 5% in seston in the control treatment compared to 13% in the LowH treatment. However, primary production was not determined in this study and contribution of primary production is now being attributed to external feed input. Therefore, it would be of more value to future research, to conduct mass balances of specific nutrients, such as nitrogen, and determine dissolved nutrients in the water before the start of the experiment (i.e. total ammonia nitrogen, CO2, ortho-phosphate). In this case, a more realistic representation can be given of the influence of external feed input and primary production on the food web development and shrimp production inside ponds. Determining primary production, for example by measuring variations in oxygen concentration of a water sample within a sealed bottle, can additionally make a distinction possible between the contribution of feed and primary production to shrimp growth. While an OM-mass balance shows that the system as a whole is quite efficient in converting feed input into development of all mesocosm compartments including shrimp (OM-retention from feed input to mesocosm compartments OM accumulation of 75% in the control treatments and 59% in the LowH treatment, average of 67%), shrimp production alone is very inefficient (retention of 12%). The nutrients captured in food web get lost when pond water is washed out after shrimp harvest. In terms of HUFA, this loss can be considered major since the system produced high amounts of EPA, DHA and ARA de novo under both dietary treatments. Findings ways to use the nutrients captured in accumulated food web biomass will increase aquaculture sustainability. Many studies emphasize the negative effects of post-harvest pond water effluents on ecosystem eutrophication and environmental pollution (Primavera 2006, Cao et al., 2007, Pillay 2008, Anh et al., 2010, FAO 2017). Also the high volumes of water needed in pond culture affect the environment (Verdegem et al., 2006, Verdegem and Bosma 2009). To diminish these negative environmental impacts, development and application of water re-use systems should be stimulated. An example are zero-water exchange systems. In these systems water quality is longer maintained by fixation of toxic nitrogen metabolites by a high abundance of microbial and algae biomass (Browdy et al., 2006, Mishra et al., 2008, Neal et al., 2010). This allows pond water to be re-used during multiple production cycles (Krummenauer et al., 2014). In this way, the developed food web including HUFA and protein can be reclaimed by newly stocked shrimp.
3.4.5.2 Canalizing nutrientsUnfortunately, re-using pond water does not allow full reclaim of all nutrients accumulated in food web compartments other than shrimp during culture. This because not all food web compartments are accessible to shrimp as mentioned in the introduction. This study shows that the highest HUFA fraction is found in seston, but this is not directly accessible to the shrimp. Although not the food web compartment with the largest OM biomass, seston showed the largest total HUFA accumulation in the system. The future challenge is on finding ways to canalize HUFA-containing sestonic algae into better accessible food web compartments.
62 CHAPTER 3
Juvenile shrimp are filter-feeders and select small planktonic particles such as algae in the seston (Gelabert and Pacheco 2011). But adult L. vannamei changes feeding strategy and feeds on larger particles such as flocculated matter (biofloc) and prefer benthic organisms like zooplankton, worms and oysters (Ogle and Beaugez 1991, Briggs 2006). Seston is therefore of good value to juvenile shrimp, but relatively inaccessible to growing or adult shrimp. A potential approach to make seston more accessible to shrimp, is by raising the carbon input to the system, for example by adding more carbohydrates to the diet or to add molasses directly to the pond. As a result, the balance of carbon in relation to nitrogen and phosphorous is increased, stimulating heterotrophic (bacterial) production and in situ waste mineralisation (Bossier and Ekasari 2017). When organic matter concentrations increase in the water column, aggregation and biofilm surface attachment increases along. In this way, water column nutrients –and thus seston- can be canalized into biofloc and periphyton, that are better accessible to shrimp.
Unfortunately, the abundance and thus potential contribution of periphyton was low in this study. But other studies show that when extra carbon is added to the system (increases carbon to nitrogen ratio), the formation of periphyton is enhanced. Also, the algae fraction inside the periphyton increased under higher carbon to nitrogen ratio. This resulted in a net shrimp yield increase of 40 % (Asaduzzaman et al., 2008). Increased periphyton formation as result of increased carbon input also lead to nutrient enrichment to the benthic community, as periphyton particles fell of the substrate to the sediment. As a result, biomass of macrobenthos increased and shrimp actively grazed on these organisms (Asaduzzaman et al., 2010).
When aiming on canalizing inaccessible algae (seston) into better accessible food web compartments, it is important to realize that the scope of algae production is fully depending on light availability and thus on pond surface area combined with water mixing rate. Pond management can increase primary production in extensive and semi-intensive ponds. For example, where in extensive ponds algae production reaches 4 g carbon (C) m-2 d-1, this can be increased up to 8 g C m-2 d-1 in semi-intensive ponds as a result of increased nutrient input (Brune 1991). However, when the limit of primary production is reached in terms of light availability, further increasing the carbon to nitrogen and phosphorous balance will from that point on mostly stimulate microbial growth, shifting the food web composition from algae abundance to bacteria dominance and therefore quality decreases. Since hyper-eutrophic systems contain high nutrient levels and high biomass levels, light (together with oxygen) becomes more limiting. This is why in intensive production systems bacterial communities often outcompete algae communities.
This current research emphasised that especially the algae content of natural food has underused potential, as also observed in other studies. In ponds where both biofloc and
3
ESSENTIAL FATTY ACID DYNAMICS IN INTENSIVE MESOCOSM SHRIMP PONDS 63
periphyton are present, shrimp show significant higher HUFA content, in specific EPA and DHA (Banjerjee 2010). Periphytic microalgae present in these systems were found to be responsible for higher shrimp growth rates, stimulated by the higher nutritional value of the available periphyton, as well as improved water quality. Periphyton HUFA contribution is linked to periphyton biomass availability and depends on the state of waste decomposition in the water column. The nutritive value of periphyton can therefore be influenced in both brackish and fresh water systems (Gatune 2012). Growth of periphyton biomass is easily further stimulated by adding more attachment surface, for example by placing wooden sticks in the pond (Azim et al., 2005, Suryakumar and Avnimelech 2017). Algae in the water column settle in the biofilm forming on the sticks, canalising seston into periphyton biomass. Under experimental indoor conditions, it is possible to form species-controlled periphyton covered substrate. Under these conditions, periphyton consisting of solely cyanobacteria were shown to act better in controlling water quality (reducing total ammonia nitrogen and nitrate-nitrogen) than periphyton consisting of solely mixed diatoms. But shrimp reared in tanks with mixed diatom-periphyton showed better growth rate than shrimp reared in cyanobacteria-periphyton or periphyton-free tanks (Khatoon et al., 2007). The proximate composition of shrimp reared in mixed diatom-periphyton was better, yielding more protein, lipids and carbohydrates than shrimp reared in cyanobacteria-periphyton or periphyton-free tanks. Mixed-diatom periphyton contains higher protein (49 %), total fat (26 %) and higher HUFA content (27 %) than cyanobacteria-periphyton (42 %, 20 % and 4 % respectively) (Khatoon 2006). This demonstrates that isolated (marine) periphytic diatoms have a high nutritional profile and can increase HUFA content of shrimp feeding on this periphyton. Surprisingly, periphyton containing a mix of diatoms plus the marine bacterium Bacillus pumilus, resulted in shrimp with higher n-3 HUFA than shrimp reared on mixed diatom-periphyton or Bacillus-periphyton alone (Banerjee et al., 2010). While Bacillus hardly contains HUFA, there must be a synergistic effect between HUFA-containing diatoms and this bacterium, resulting in shrimp with higher body HUFA contents. It has been suggested this could be caused by the excretion of digestion enzymes by Bacillus inside the gastrointestinal tract, aiding the shrimp with lipid digestion (Lovett and Felder 1990, Moriarty 1998, Devaraja 2002, Banerjee et al., 2010). While many studies find high HUFA contents in periphyton, this current study unfortunately observed only low periphytic HUFA levels. It is not known if this was caused by low periphytic algae biomass, or that the algae species in the periphyton were low in HUFA composition. It would be worthwhile for future research to investigate possibilities of inoculating the pond with periphyton-forming algae species known for high HUFA-contents and the development during a full production cycle.
Other ways to reclaim nutrients captured in seston, is to add zooplankton as Artemia spp. or rotifers to the pond. Artemia feed on seston and are known to bioaccumulate HUFA (Dhont and Sorgeloos 2002, Anh et al., 2009, Rayner et al., 2017). Artemia and rotifers are a well acknowledged high quality natural foods for shrimp. Addition of rotifers to biofloc shrimp

64 CHAPTER 3
ponds enhanced shrimp growth, performance and nutritional quality (Brito et al., 2016). While zooplankton HUFA-enrichment for shrimp live-feeding is being used in practice using external HUFA resources (Barclay and Zeller 1996, Li and Olsen 2015), zooplankton is also able to enrich itself with HUFA from microalgae. For example, the copepod P. annandalei is capable to enhance its HUFA profile even in nutrient poor environments, and shows high bioaccumulation levels of DHA (Rayner et al., 2017). In this way, the presence of this species zooplankton can provide HUFA to the shrimp obtained from algae in the seston.
Furthermore, post-harvest pond water could be used for shrimp hatchery farming systems, since juvenile post-larvae shrimp (PL 0-15) mainly feed on small size aggregates, small zooplankton and seston (Briggs 2006). Additional options would include biotechnological applications, for example seston isolation from the water column after which HUFA could be extracted to be used as animal feed or human food additive, or seston could be pelletized for external feed applications.
3.5 ConclusionIn addition to previous analyses of current experiment where evidence was delivered showing shrimp obtained in situ de novo produced HUFA from natural food (Hermsen et al, under review), this study confirms these finding and localised the in situ HUFA accumulation in the system. The in situ produced HUFA mainly hold up in the biofloc and seston compartments. Where biofloc dominated in terms of biomass, seston dominated in terms of HUFA accumulation. This total HUFA production was a >600% increase compared to the HUFA-input in the tanks receiving HUFA-deficient diets. Unfortunately, of the total accumulated biomass increase in the pond, only 18% consisted of shrimp in both treatments. This means that the majority of all captured nutrients, including de novo produced HUFA, remains in the food web and gets lost after shrimp harvest. Future study should emphasize on finding ways to reclaim those nutrients from the system in a more efficient way. From a formulating perspective, the focus should relocate from feeding the shrimp, to feeding the whole pond food web considering the fertilizing properties of the formulated feed.

3
ESSENTIAL FATTY ACID DYNAMICS IN INTENSIVE MESOCOSM SHRIMP PONDS 65
3.6 Supplementary informationTable 1. Ingredient composition, proximate content, estimated digestibility and fatty acid profile of the experimental diets containing standard HUFA levels (control) and low HUFA levels (LowH). Same diets as used in previous experiment of current authors (Hermsen et al., 2019a).
Control diet LowH dietIngredient (in %): Fishmeal 16.0 --- Fish oil 1.00 --- Coconut oil --- 2.40 Casein --- 13.2 Wheat gluten 10.0 10.0 Soybean meal 10.0 10.0 Krill protein hydrolysate 1.00 1.00 Wheat flour 27.6 27.0 Wheat 20.0 20.0 Wheat bran 10.0 10.0 Cholesterol 0.20 0.20 Soya lecithin 0.50 0.50 Monocalcium phosphate (Ca(H2PO4)2) 1.60 2.75 Calcium carbonate (CaCO3) 0.40 0.95 Premix 1.00 1.00 Lysine hydrochloride 0.30 0.30 DL-methionine 0.20 0.20 L-Threonine 0.20 0.20 L-Arginine --- 0.30
Total 100 100
Proximate content (g/kg dry matter): Crude protein 355 372 Crude fat 19.8 20.4 Crude ash 69.7 49.8 Carbohydrates 556 558 Energy (kJ/g DM) 19.8 20.4
Estimated digestibility: Digestible energy content (MJ/kg dry matter) 15.4 15.3 Digestible protein/Digestible energy (g/MJ) 22.3 22.5
Essential fatty acid profile (mg/g dry matter):∑ omega-3* 6.28 1.86∑ omega-6** 12.9 16.1∑ PUFA§ 13.9 17.4∑ HUFA◊ 5.25 0.54ALA 18:3n-3 1.19 1.35EPA 20:5n-3 2.07 0.17DHA 22:6n-3 2.23 0.12LA 18:2n-6 12.7 16.1ARA 20:4n-6 0.15 0.02
ALA – Alpha-linolenic acid; EPA – eicosapentaenoic acid; DHA – docosahexaenoic acid, LA – linoleic acid; ARA – arachidonic acid *∑ includes 18:3n-3, 18:4n-3, 20:3n-3, 20:4n-3, 20:5n-3, 21:5n-3, 22:3n-3, 22:4n-3, 22:5n-3, 22:6n-3. **∑ includes 18:2n-6, 18:3n-6, 19:2n-6, 20:3n-6, 20:4n-6, 22:4n-6, 22:5n-6. §∑ includes 18:2, 18:3, 19:2, 20:3, 22:3. ◊∑ includes 18:4, 20:4, 20:5, 21:5, 22:4, 22:5, 22:6.
Abstract

This chapter has been submitted for publication to “Aquaculture Research” as:
Hermsen, D., Van Loo, J., Van Noord, L., Verdegem, M.C.J. Nutrient distribution and utilization under declining feed input and increasing fertilizer input in shrimp mesocosms fed a HUFA poor diet.
Nutrient distribution and utilization under declining feed input and increasing fertilizer input in shrimp mesocosms fed a HUFA poor diet.
Chapter 4

Algal and bacterial biomass form an ideal replacement for fishmeal-protein in aquafeeds. This highlights the potential of stimulating primary production inside shrimp ponds, allowing in situ protein and highly unsaturated fatty acid (HUFA) production. Finding ways to decrease dietary crude protein inclusion and increase natural food contribution, may lead to a more sustainable and cheaper shrimp production. This study aimed to increase the contribution of protein (nitrogen, N), phosphorous (P) and HUFA from natural food into shrimp biomass. Shrimp (50 ind. m-2) were raised in six indoor mesocosms while allowing natural food production. Shrimp were fed HUFA-deficient diets in decreasing feeding rate in regression set-up (from 100 % to 50 %), where loss of N and carbon (C) were substituted by N and C fertilizers. All food web compartments (shrimp, feed, biofloc, seston, periphyton, detritus) of the tanks were sampled at day 0 and day 43 (final) of the experiment and analysed for nutrient content. Treatment had no effect on shrimp biomass production. The N-to-protein ratio of flocculated matter in the water column was 7.31. Lowering feeding level by 50 % in addition to increasing pond C and N fertilization, led to a 48 % increase of food web protein contribution to the shrimp protein contents. Total natural food protein contribution was estimated at 74 %. Lowering P-input to the mesocosm by 50%, had no effect on total HUFA-accumulation in food web compartments and increased shrimp P-retention from 16 % to 34 %. After shrimp harvesting, a nearly similar equivalent in crude protein was retained in the mesocosm in the form of biofloc and periphyton. Future study should focus on ways to reclaiming this protein from the food web. This study showed that developing a “nutritious pond diet” pays off in terms of increased incorporation of nutrients from natural food.
Key words: shrimp, protein, HUFA, phosphorous (P), nitrogen (N), mesocosm, natural food.
4
NUTRIENT DISTRIBUTION AND UTILIZATION UNDER INCREASING FERTILIZER INPUT 69
4.1. Introduction
4.1.1 Alternative dietary protein resourcesIn an attempt to reduce use of limited and unsustainable marine protein resources, fishmeal in aquafeeds is increasingly being replaced by alternative protein sources. These alternatives include vegetable proteins like soybean meal or pea meal, and animal protein products like casein or meat rendering by-products (Kanazawa, 1992, Deshimaru, 1983, Mente et al., 2002, Davis and Arnold, 2000, Martínez‐Rocha et al., 2013, Hanel et al., 2007, Ye et al., 2012). These alternatives often bring along new challenges concerning costs, palatability, amino acid composition or digestibility (Nunes et al., 2006, Gatlin III et al., 2007). Algae meal and seaweed meal are also being investigated as novel protein source for shrimp diets (Hanel et al., 2007, da Silva and Barbosa, 2009, Kiron et al., 2012). Marine vegetal products are rich in vitamins, fatty acids, protein and minerals. Algal protein is of good quality and often possesses ideal amino acid profiles for aquatic animals. This, together with increasing availability in the near future as by-product of biodiesel (fatty acid) production, makes algae-protein an ideal replacement for fishmeal-protein in aquafeeds including shrimp diets (Kiron et al., 2012, Becker, 2007, Brennan and Owende, 2010).
4.1.2 Protein contribution natural food Where dried or processed algae-compounds can be a fitting substitute for dietary fishmeal and can further enhance shrimp performance, it also highlights the potential benefits of allowing natural phytoplankton production inside shrimp ponds (Ju et al., 2009). Natural food is believed to contribute significantly to shrimp production by acting as additional nutrient source (Burford and Williams, 2001, Burford et al., 2004). Given that formulated feed makes up 50 % of the production costs and that standard commercial shrimp diets consist of 30-50 % crude protein (NRC, 2011), as protein is the costliest component in shrimp feed, replacement of dietary fed crude protein by naturally growing food may potentially provide substantial economic benefits. Also, excessive protein input to the shrimp ponds often leads to an overload of nitrogen (N) metabolites in the water column with detrimental effects on water quality and production. Furthermore, the replacement of dietary crude protein by natural pond foods may also allow reducing the use of high-quality protein resources (such as fishmeal) and its associated negative impacts on environment and sustainability (Martinez‐Cordova et al., 2003). Lowering organic N input (protein) in relation to organic carbon (C) input (i.e. increased C:N ratio) leads to stimulation of heterotrophic bacterial biomass (Avnimelech, 2009). When keeping high density organic matter suspended in the water column through turbulence or aeration, organic matter flocs together and form biofloc. When organic matter settles, biofilm forms in form of periphyton.
Biofloc and periphyton are accessible to shrimp, are rich in bacteria and phytoplankton and can produce 60 kg protein per hectare per day in intensive production systems (Avnimelech,

70 CHAPTER 4
2009, Burford et al., 2004, Asaduzzaman et al., 2010). Understanding flows of N through the system provides insight in nutrient distribution over food web compartments in the pond, and may support a more effective and sustainable shrimp production.
4.1.2 Fertilization and algal HUFA contributionA beneficial side effect of focusing on increasing the incorporation of natural food as alternative protein source, is the potential contribution of highly unsaturated fatty acids (HUFA) by algae (JU 2009). It has been shown that naturally produced HUFA may largely replace fish oil while maintaining similar shrimp production (Hermsen et al., 2019a, Hermsen et al., 2019b). Natural food such as algae (phytoplankton), zooplankton and benthic organisms are known to potentially contain high levels of HUFA. The HUFA content of natural food determines the nutritional quality and thereby determines if the natural food is being eating by consumers like shrimp (Gladyshev et al., 2011, Brett and Goldman, 1997). It is proposed that low HUFA content of primary producers is a key-bottleneck in inhibited nutrient and energy transfer through the food web in eutrophic systems (Müller-Navarra et al., 2000, Müller-Navarra et al., 2004). These low HUFA contents in eutrophic systems are believed to be caused by a high total phosphorous (P) concentration in the water column in relation to a relative lower N availability, favouring growth of cyanobacteria that are typically low in HUFA content. Cyanobacteria can cope with low N to P ratios in the water column, because they can capture N2 from the atmosphere and in that way provide in their own N:P balance. Shrimp ponds are considered hypereutrophic water systems with high nutrient loading, especially P. Since bacterial biomass dominates over algal biomass in the water column at high C:N ratio (Tacon et al., 2002, Ray et al., 2009, Avnimelech, 2009), N-input to the system should be high enough to allow algae growth and thus HUFA production. As long as enough oxygen is available, N-losses as result of bacterial denitrification are low in shrimp ponds as N2 (product of bacterial denitrification) is being used for algae production. Accordingly, in shrimp ponds, lowering the total P input may balance optimal N:P for algae production containing HUFA, potentially increasing natural food contribution to shrimp biomass production.
4.1.3 Study aim This study aimed to find the optimal balance between feed and fertilizer input (feed:fertilizer) for optimal flow of protein (nitrogen), phosphorous (P) and highly unsaturated fatty acids (HUFA) from natural food into shrimp biomass. Shrimp were raised in mesocosms and fed HUFA-deficient diets under decreasing feed:fertilizer system inputs. The feed:fertilizer ratio was decreased over treatments by decreasing total feed input and substituting the loss of nitrogen (N) and carbon (C) -as result of decreased total feed input- by equivalent increasing amounts of N and C in form of fertilizer. By using this approach, it was attempted to: I) Produce shrimp using up to 50% lower dietary crude protein input; II) stimulate shrimp to eat more natural food while keeping total system N-load the
4
NUTRIENT DISTRIBUTION AND UTILIZATION UNDER INCREASING FERTILIZER INPUT 71
same allowing algae abundance; III) distinguish feed-protein from natural-food protein in produced shrimp biomass; IV) test the hypothesis of higher algae HUFA accumulation as a result of lower system P-input. It was hypothesized that optimal nutrient flow from natural food into shrimp biomass would be observed in the treatment where one-third of the formulated feed was replaced by pond fertilizers. This was based on observations of previous study (Hermsen et al., 2019a), showing 6 - 32 % of the shrimp’s HUFA content is derived from natural food, indicating one-third of the nutrients in the formulated diet could be replaced by pond fertilizers aiming for indirect feeding versus direct feeding.
4.2. Material and methods
4.2.1 Classification of food web compartmentsSix mesocosm food web compartments were defined in this experiment: 1) shrimp; 2) external formulated shrimp feed in form of sinking pellets; 2) periphyton (biofilm on the tank wall); 3) detritus (debris settled at the tank bottom); 4) biofloc (suspended solids including zooplankton >30 μm mesh size); 5) and seston (suspended solids <30 μm mesh size). Biofloc and seston together form the water column compartment. Inorganic C, N and P were additionally measured.
4.2.2 Mesocosm preparation and set-upThe experiment took place at the research facility “Carus” at Wageningen University, The Netherlands. Six shrimp indoor mesocosm tanks were used of 1.25 m diameter and 90 cm depth, filled with 700L artificial sea water (25 ppt, Reefs Crystals) and 7 cm sand. Aeration pipes were placed at 7 cm above the sediment and perforated at 10 cm interval to continuously aerate and mix the water. Each tank received an incident irradiance of 300 µmol photons/m2/s from a total of seven agricultural lights positioned above the experimental area (Gavita; three LEP 270-01 SUP EU, and four Digistar 400W e-series). The lights were connected to an ambient climate control system (Gavita; Master Controller EL1), imposing a 12h/12h day/night regime that enables autotrophic production. The system also mimicked a gradual sunrise and sunset, and guaranteed a room temperature between 27 fand 29 °C. Due to constant and high ambient temperature, water temperature ranged between 25 – 27 °C.
The used shrimp mesocosms were already two years old and maturated over time while keeping non-experimental shrimp (average individual size at stocking 1.0 g) on a commercial diet. Prior to the experiment, all adult shrimp were removed and mesocosm water was diluted by replacing half of the mesocosm water by fresh artificial sea water. In order to ensure comparable conditions for each tank at the start of the experiment, three days before the start of the experiment all tank water and all tank sediment were collected in large basins and thoroughly mixed, and mesocosm tank walls were cleaned and periphyton
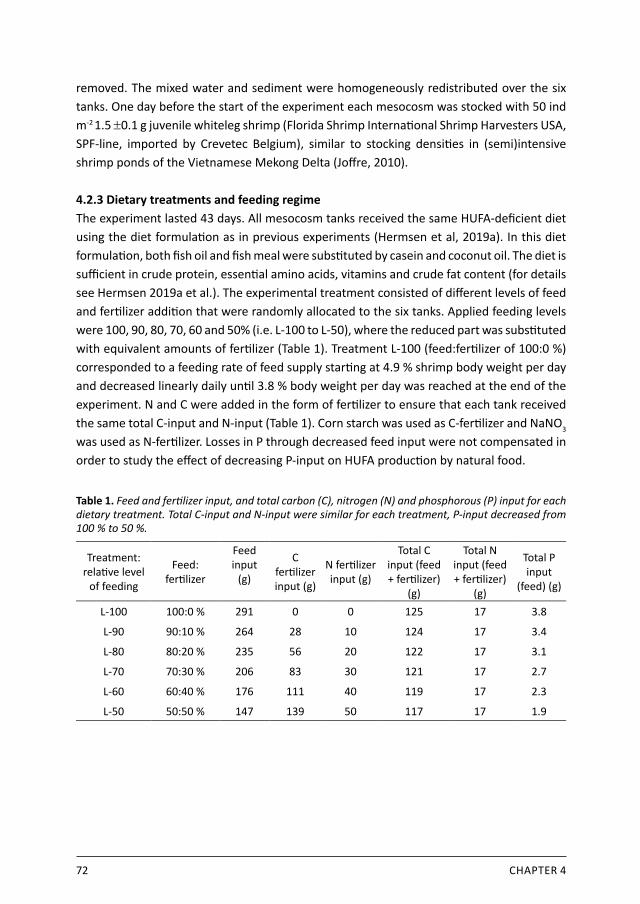
72 CHAPTER 4
removed. The mixed water and sediment were homogeneously redistributed over the six tanks. One day before the start of the experiment each mesocosm was stocked with 50 ind m-2 1.5 ±0.1 g juvenile whiteleg shrimp (Florida Shrimp International Shrimp Harvesters USA, SPF-line, imported by Crevetec Belgium), similar to stocking densities in (semi)intensive shrimp ponds of the Vietnamese Mekong Delta (Joffre, 2010).
4.2.3 Dietary treatments and feeding regimeThe experiment lasted 43 days. All mesocosm tanks received the same HUFA-deficient diet using the diet formulation as in previous experiments (Hermsen et al, 2019a). In this diet formulation, both fish oil and fish meal were substituted by casein and coconut oil. The diet is sufficient in crude protein, essential amino acids, vitamins and crude fat content (for details see Hermsen 2019a et al.). The experimental treatment consisted of different levels of feed and fertilizer addition that were randomly allocated to the six tanks. Applied feeding levels were 100, 90, 80, 70, 60 and 50% (i.e. L-100 to L-50), where the reduced part was substituted with equivalent amounts of fertilizer (Table 1). Treatment L-100 (feed:fertilizer of 100:0 %) corresponded to a feeding rate of feed supply starting at 4.9 % shrimp body weight per day and decreased linearly daily until 3.8 % body weight per day was reached at the end of the experiment. N and C were added in the form of fertilizer to ensure that each tank received the same total C-input and N-input (Table 1). Corn starch was used as C-fertilizer and NaNO3 was used as N-fertilizer. Losses in P through decreased feed input were not compensated in order to study the effect of decreasing P-input on HUFA production by natural food.
Table 1. Feed and fertilizer input, and total carbon (C), nitrogen (N) and phosphorous (P) input for each dietary treatment. Total C-input and N-input were similar for each treatment, P-input decreased from 100 % to 50 %.
Treatment: relative level
of feeding
Feed:fertilizer
Feed input
(g)
C fertilizer input (g)
N fertilizer input (g)
Total C input (feed + fertilizer)
(g)
Total N input (feed + fertilizer)
(g)
Total P input
(feed) (g)
L-100 100:0 % 291 0 0 125 17 3.8
L-90 90:10 % 264 28 10 124 17 3.4
L-80 80:20 % 235 56 20 122 17 3.1
L-70 70:30 % 206 83 30 121 17 2.7
L-60 60:40 % 176 111 40 119 17 2.3
L-50 50:50 % 147 139 50 117 17 1.9

4
NUTRIENT DISTRIBUTION AND UTILIZATION UNDER INCREASING FERTILIZER INPUT 73
4.2.4 Food web compartment samplingAll food web compartments of all six tanks were sampled at day 0 and day 43 of the experiment. To get a representative sample of feed provided throughout the entire experiment, weekly feed grab-samples were taken, homogenously mixed and stored airtight at 4 °C. At time of stocking (day -1), 20 individual shrimp were randomly selected to represent the start population. They were euthanized using ice water and stored at -20 °C prior to further analysis. At the final day of the experiment, all remaining shrimp were harvested per tank, counted, weighted, euthanized and stored at -20 °C prior to further analysis. The water fraction was sampled by taking a representative 2 L water column sample by opening and closing a 2 L container at 30 cm depth in the middle of the tank, followed by separating the large biofloc fraction from the smaller seston fraction. This was done by letting the water pass through a 30 μm mesh filter to separate single cell algae and bacteria (seston) from the flocculated organic matter (biofloc). The filter residue containing the biofloc (>30 μm) was washed with fresh water and equally distributed over six glass microfiber filters (Whatman, GF/F, diameter 55mm) using a high-pressure pump (Vacuubrand GMBH, MZ 2C NT, Germany). The water filtrate containing seston (<30 μm) was continuously stirred while taking subsamples of know volume, approximately 300 ml per sample, and were distributed over six glass microfiber filters using a high-pressure pump while being washed with fresh water. All glass microfiber filters containing seston (six per tank per sampling) and biofloc (six per tank per sampling) samples were immediately stored at -20 °C prior to further analysis. Periphyton samples were taken by scraping the tank wall from bottom to top. This was done in triplicate per tank, using a 10 cm wide spatula covering 900 cm2 wall surface per tank sampling. Periphyton was stored in aluminium containers at -20 ºC prior to further analysis. Detritus samples were taken by a sediment sampler (Technical Development Studio, Wageningen University, The Netherlands), grabbing 100 cm2 sand sediment from the bottom in triplo, covering 300 cm2 per tank per sampling. The sand containing the detritus was stored in aluminium trays and stored at -20 ºC prior to further analysis.
4.2.5 Water quality control Tank management aimed to maintain water quality favourable for shrimp growth and was checked weekly to remain <2 mg NO2
-/L, < 50 mg NO3- /L, < 4 mg TAN/L, and a pH of 7.0
- 8.8. Orthophosphate (Pi), NO2-, NO3
- and total ammonia nitrogen (TAN) were measured using a Smartchem (Smartchem 200, Alliance Instruments, AMS Systea, Frepillon, France) following protocol NEN-ISO6777 and NEN-ISO7150-1. Twice weekly evaporation losses were compensated by adding fresh tap water of 22 °C to keep salinity on 25 ppt. Salinity, pH and oxidation reduction potential were measured using a multi-parameter portable meter at 10:00 AM using a multi-parameter portable meter (WTW Multi 3430; Tetracon 925, Sentix 940).
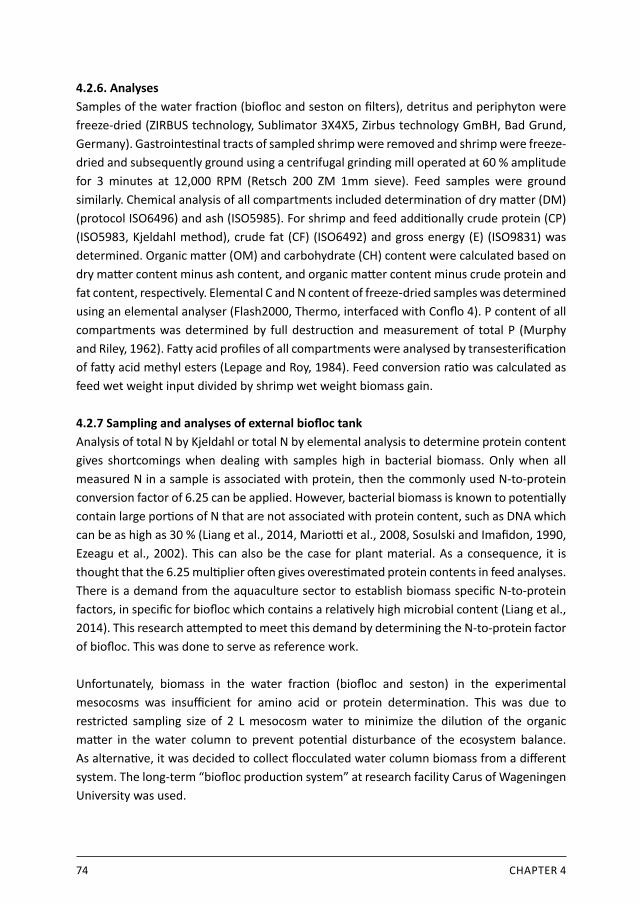
74 CHAPTER 4
4.2.6. AnalysesSamples of the water fraction (biofloc and seston on filters), detritus and periphyton were freeze-dried (ZIRBUS technology, Sublimator 3X4X5, Zirbus technology GmBH, Bad Grund, Germany). Gastrointestinal tracts of sampled shrimp were removed and shrimp were freeze-dried and subsequently ground using a centrifugal grinding mill operated at 60 % amplitude for 3 minutes at 12,000 RPM (Retsch 200 ZM 1mm sieve). Feed samples were ground similarly. Chemical analysis of all compartments included determination of dry matter (DM) (protocol ISO6496) and ash (ISO5985). For shrimp and feed additionally crude protein (CP) (ISO5983, Kjeldahl method), crude fat (CF) (ISO6492) and gross energy (E) (ISO9831) was determined. Organic matter (OM) and carbohydrate (CH) content were calculated based on dry matter content minus ash content, and organic matter content minus crude protein and fat content, respectively. Elemental C and N content of freeze‐dried samples was determined using an elemental analyser (Flash2000, Thermo, interfaced with Conflo 4). P content of all compartments was determined by full destruction and measurement of total P (Murphy and Riley, 1962). Fatty acid profiles of all compartments were analysed by transesterification of fatty acid methyl esters (Lepage and Roy, 1984). Feed conversion ratio was calculated as feed wet weight input divided by shrimp wet weight biomass gain.
4.2.7 Sampling and analyses of external biofloc tankAnalysis of total N by Kjeldahl or total N by elemental analysis to determine protein content gives shortcomings when dealing with samples high in bacterial biomass. Only when all measured N in a sample is associated with protein, then the commonly used N-to-protein conversion factor of 6.25 can be applied. However, bacterial biomass is known to potentially contain large portions of N that are not associated with protein content, such as DNA which can be as high as 30 % (Liang et al., 2014, Mariotti et al., 2008, Sosulski and Imafidon, 1990, Ezeagu et al., 2002). This can also be the case for plant material. As a consequence, it is thought that the 6.25 multiplier often gives overestimated protein contents in feed analyses. There is a demand from the aquaculture sector to establish biomass specific N-to-protein factors, in specific for biofloc which contains a relatively high microbial content (Liang et al., 2014). This research attempted to meet this demand by determining the N-to-protein factor of biofloc. This was done to serve as reference work.
Unfortunately, biomass in the water fraction (biofloc and seston) in the experimental mesocosms was insufficient for amino acid or protein determination. This was due to restricted sampling size of 2 L mesocosm water to minimize the dilution of the organic matter in the water column to prevent potential disturbance of the ecosystem balance. As alternative, it was decided to collect flocculated water column biomass from a different system. The long-term “biofloc production system” at research facility Carus of Wageningen University was used.
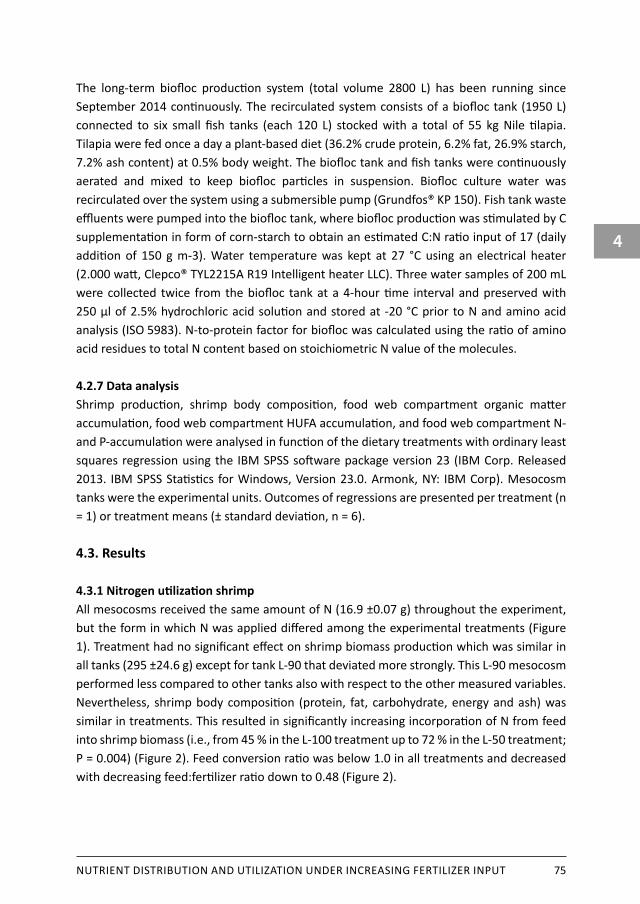
4
NUTRIENT DISTRIBUTION AND UTILIZATION UNDER INCREASING FERTILIZER INPUT 75
The long-term biofloc production system (total volume 2800 L) has been running since September 2014 continuously. The recirculated system consists of a biofloc tank (1950 L) connected to six small fish tanks (each 120 L) stocked with a total of 55 kg Nile tilapia. Tilapia were fed once a day a plant-based diet (36.2% crude protein, 6.2% fat, 26.9% starch, 7.2% ash content) at 0.5% body weight. The biofloc tank and fish tanks were continuously aerated and mixed to keep biofloc particles in suspension. Biofloc culture water was recirculated over the system using a submersible pump (Grundfos® KP 150). Fish tank waste effluents were pumped into the biofloc tank, where biofloc production was stimulated by C supplementation in form of corn-starch to obtain an estimated C:N ratio input of 17 (daily addition of 150 g m-3). Water temperature was kept at 27 °C using an electrical heater (2.000 watt, Clepco® TYL2215A R19 Intelligent heater LLC). Three water samples of 200 mL were collected twice from the biofloc tank at a 4-hour time interval and preserved with 250 µl of 2.5% hydrochloric acid solution and stored at -20 °C prior to N and amino acid analysis (ISO 5983). N-to-protein factor for biofloc was calculated using the ratio of amino acid residues to total N content based on stoichiometric N value of the molecules.
4.2.7 Data analysisShrimp production, shrimp body composition, food web compartment organic matter accumulation, food web compartment HUFA accumulation, and food web compartment N- and P-accumulation were analysed in function of the dietary treatments with ordinary least squares regression using the IBM SPSS software package version 23 (IBM Corp. Released 2013. IBM SPSS Statistics for Windows, Version 23.0. Armonk, NY: IBM Corp). Mesocosm tanks were the experimental units. Outcomes of regressions are presented per treatment (n = 1) or treatment means (± standard deviation, n = 6).
4.3. Results
4.3.1 Nitrogen utilization shrimpAll mesocosms received the same amount of N (16.9 ±0.07 g) throughout the experiment, but the form in which N was applied differed among the experimental treatments (Figure 1). Treatment had no significant effect on shrimp biomass production which was similar in all tanks (295 ±24.6 g) except for tank L-90 that deviated more strongly. This L-90 mesocosm performed less compared to other tanks also with respect to the other measured variables. Nevertheless, shrimp body composition (protein, fat, carbohydrate, energy and ash) was similar in treatments. This resulted in significantly increasing incorporation of N from feed into shrimp biomass (i.e., from 45 % in the L-100 treatment up to 72 % in the L-50 treatment; P = 0.004) (Figure 2). Feed conversion ratio was below 1.0 in all treatments and decreased with decreasing feed:fertilizer ratio down to 0.48 (Figure 2).
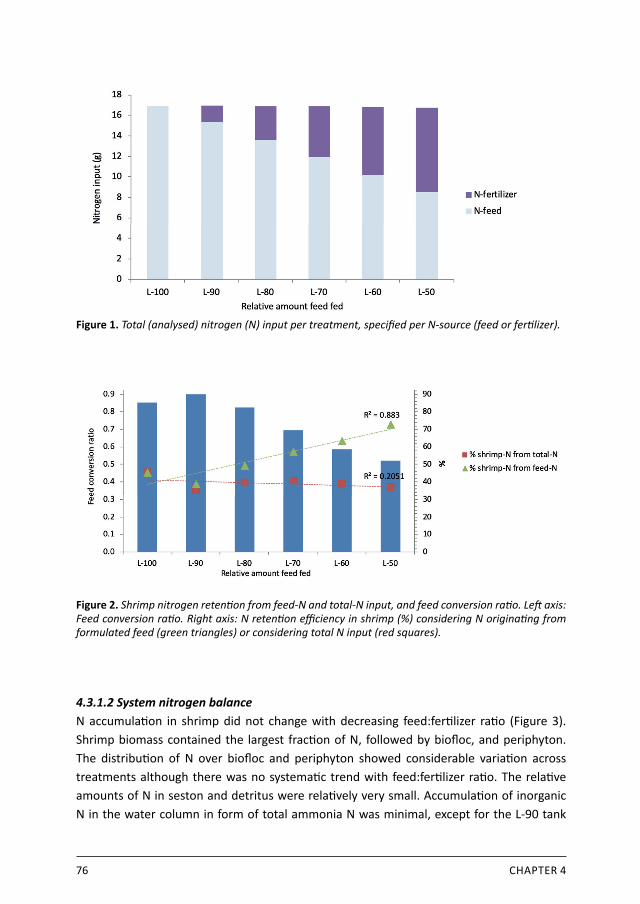
76 CHAPTER 4
Figure 1. Total (analysed) nitrogen (N) input per treatment, specifi ed per N-source (feed or ferti lizer).
Figure 2. Shrimp nitrogen retenti on from feed-N and total-N input, and feed conversion rati o. Left axis: Feed conversion rati o. Right axis: N retenti on effi ciency in shrimp (%) considering N originati ng from formulated feed (green triangles) or considering total N input (red squares).
4.3.1.2 System nitrogen balance N accumulati on in shrimp did not change with decreasing feed:ferti lizer rati o (Figure 3). Shrimp biomass contained the largest fracti on of N, followed by biofl oc, and periphyton. The distributi on of N over biofl oc and periphyton showed considerable variati on across treatments although there was no systemati c trend with feed:ferti lizer rati o. The relati ve amounts of N in seston and detritus were relati vely very small. Accumulati on of inorganic N in the water column in form of total ammonia N was minimal, except for the L-90 tank
4
NUTRIENT DISTRIBUTION AND UTILIZATION UNDER INCREASING FERTILIZER INPUT 77
where inorganic N-accumulati on was larger and biofl oc N-accumulati on was smaller than in other tanks.
Figure 3. Distributi on of accumulated nitrogen (N) across food web compartments and dissolved inorganic N per treatment, expressed in percentage of total N input.
4.3.1.3 N-to-protein factor of water column fracti on of long-term biofl oc systemTo gain inside in the protein content of natural food inside aquaculture ponds, the N-to-protein rati o of fl occulated organic matt er in the water fracti on (biofl oc and seston combined) was determined of a diff erent fl occulati on system than the experimental mesocosms. Deviati ng from the standard 6.25, N-to-protein factor of fl occulati ng matt er the water fracti on was found to be 7.31 ±0.03 (n = 6) (Table 2).
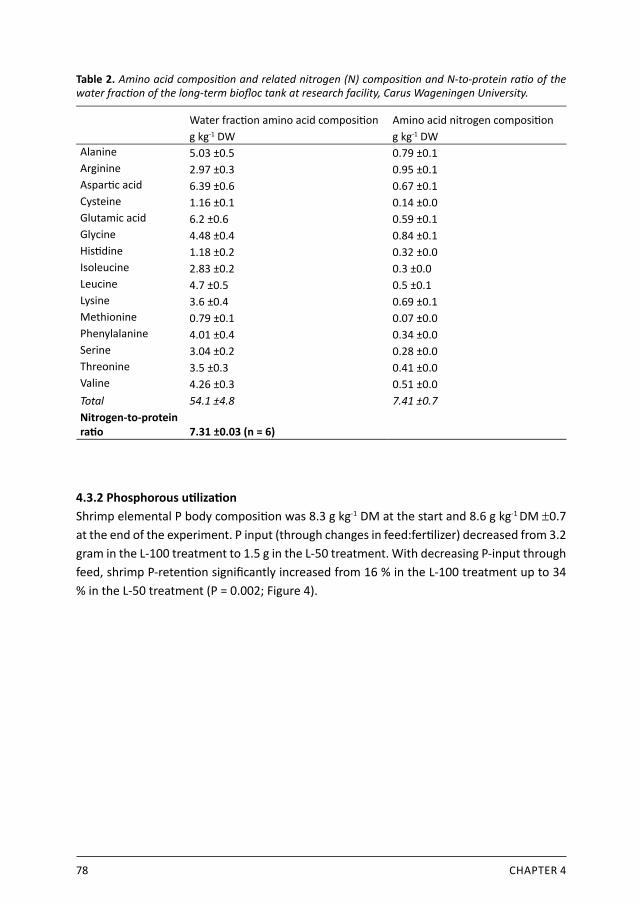
78 CHAPTER 4
Table 2. Amino acid compo siti on and related nitrogen (N) compositi on and N-to-protein rati o of the water fracti on of the long-term biofl oc tank at research facility, Carus Wageningen University.
Water fracti on amino acid compositi on Amino acid nitrogen compositi ong kg-1 DW g kg-1 DW
Alanine 5.03 ±0.5 0.79 ±0.1Arginine 2.97 ±0.3 0.95 ±0.1Asparti c acid 6.39 ±0.6 0.67 ±0.1Cysteine 1.16 ±0.1 0.14 ±0.0Glutamic acid 6.2 ±0.6 0.59 ±0.1Glycine 4.48 ±0.4 0.84 ±0.1Histi dine 1.18 ±0.2 0.32 ±0.0Isoleucine 2.83 ±0.2 0.3 ±0.0Leucine 4.7 ±0.5 0.5 ±0.1Lysine 3.6 ±0.4 0.69 ±0.1Methionine 0.79 ±0.1 0.07 ±0.0Phenylalanine 4.01 ±0.4 0.34 ±0.0Serine 3.04 ±0.2 0.28 ±0.0Threonine 3.5 ±0.3 0.41 ±0.0Valine 4.26 ±0.3 0.51 ±0.0Total 54.1 ±4.8 7.41 ±0.7Nitrogen-to-protein rati o 7.31 ±0.03 (n = 6)
4.3.2 Phosphorous uti lizati onShrimp elemental P body compositi on was 8.3 g kg-1 DM at the start and 8.6 g kg-1 DM ±0.7 at the end of the experiment. P input (through changes in feed:ferti lizer) decreased from 3.2 gram in the L-100 treatment to 1.5 g in the L-50 treatment. With decreasing P-input through feed, shrimp P-retenti on signifi cantly increased from 16 % in the L-100 treatment up to 34 % in the L-50 treatment (P = 0.002; Figure 4).
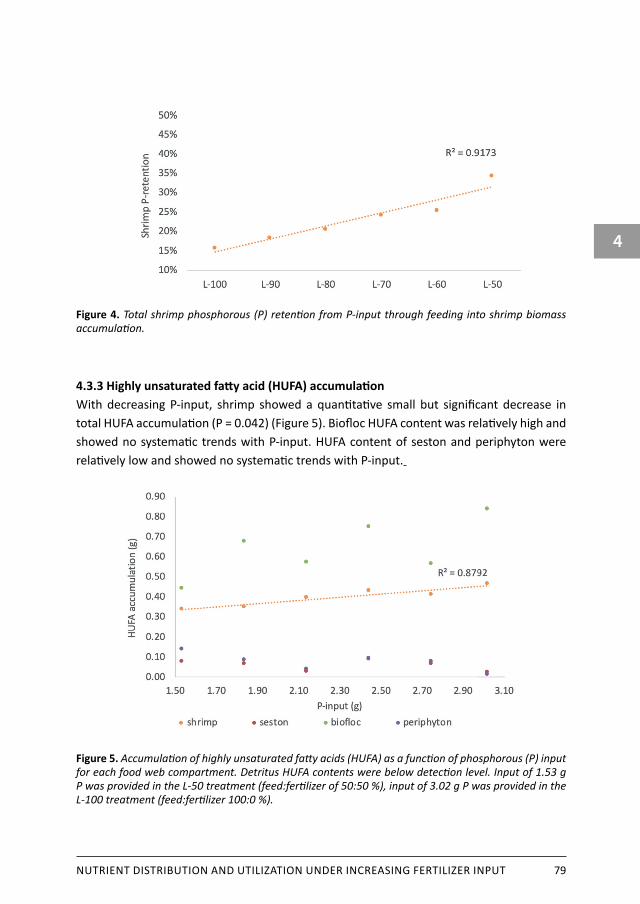
4
NUTRIENT DISTRIBUTION AND UTILIZATION UNDER INCREASING FERTILIZER INPUT 79
Figure 4. Total shrimp phosphorous (P) retenti on from P-input through feeding into shrimp biomass accumulati on.
4.3.3 Highly unsaturated fatt y acid (HUFA) accumulati onWith decreasing P-input, shrimp showed a quanti tati ve small but signifi cant decrease in total HUFA accumulati on (P = 0.042) (Figure 5). Biofl oc HUFA content was relati vely high and showed no systemati c trends with P-input. HUFA content of seston and periphyton were relati vely low and showed no systemati c trends with P-input.
Figure 5. Accumulati on of highly unsaturated fatt y acids (HUFA) as a functi on of phosphorous (P) input for each food web compartment. Detritus HUFA contents were below detecti on level. Input of 1.53 g P was provided in the L-50 treatment (feed:ferti lizer of 50:50 %), input of 3.02 g P was provided in the L-100 treatment (feed:ferti lizer 100:0 %).
80 CHAPTER 4
4.4. Discussion
4.4.1 Protein utilizationApparent crude protein digestibility of non-fishmeal plant-based shrimp diets is 83 % (de Carvalho et al., 2016). Assuming all provided external feed was eaten by the shrimp (turbidity in the tank did not allow to observe feed intake), protein retention varied from 45 % in the L-100 treatment to 73 % in the L-50 treatment (Table 3). Gradually lowering dietary crude protein input to the system, led to a gradual increase in crude protein obtained from natural food (Figure 2, Table 3). The 45 % protein retention as found in the L-100 treatment, is comparable to protein retention efficiencies found in literature where shrimp were raised in outdoor ponds. For example, N (protein) retention of shrimp was found to be 45 % in biofloc ponds (Hari et al., 2004). This is twice as high than the average 20 % protein retention found in recirculation or clear water tanks without natural food present (Hari et al., 2004, Cuzon et al., 2004). This concurs with stable isotope studies in semi-intensive shrimp ponds suggesting half of total diet selection consists of natural food (Burford and Williams, 2001). This highlights that natural food protein contribution can be substantial. Specifically; assuming protein retention of the L-100 tank would be the result of exclusively feeding on external diet and zero additional feeding on natural food, the minimal shrimp crude protein content obtained from natural food is as high as 48 % in the L-50 treatment (Table 3) if shrimp had similar 45 % protein retention from feed in all tanks as found in L-100. But, more realistically assuming protein contribution from natural food in the L-100 treatment was 50 % instead of zero, then shrimp acquired 74 % crude protein from natural resources in the L-50 treatment (Table 3) if shrimp had similar 45 % protein retention from feed in all tanks as found in L-100.

4
NUTRIENT DISTRIBUTION AND UTILIZATION UNDER INCREASING FERTILIZER INPUT 81
Tabl
e 3.
Cal
cula
tion
of c
rude
pro
tein
(CP)
rete
ntion
of f
eed
CP a
nd n
atur
al fo
od C
P in
to sh
rimp
over
the
43-d
ay e
xper
imen
t. Th
e “l
ow e
stim
ated
cont
ributi
on”
assu
med
0 %
of s
hrim
p CP
acc
umul
ation
was
obt
aine
d fr
om n
atur
al fo
od in
the
L-10
0 ta
nk, w
hile
the
“hig
h es
timat
ed c
ontr
ibuti
on”
assu
med
50
% o
f shr
imp
CP a
ccum
ulati
on w
as o
btai
ned
from
nat
ural
food
(Bur
ford
and
Will
iam
s, 2
001)
in th
e L-
100
tank
. Bot
h es
timat
ed c
alcu
latio
ns w
ere
base
d on
sim
ilar p
rote
in
rete
ntion
from
form
ulat
ed fe
ed in
all
tank
s, se
t to
45 %
as o
bser
ved
in L
-100
.
Trea
tmen
t (r
elati
ve a
mou
nt
feed
fed)
CP in
put v
ia
feed
(g)
Dige
stibl
e CP
in
put v
ia fe
ed (g
)CP
acc
umul
ation
sh
rimp
(g)
Prot
ein
rete
ntion
from
fe
ed C
P in
put i
nto
shrim
p (%
)
Low
esti
mat
ed
cont
ributi
on; %
of s
hrim
p pr
otei
n ga
in b
ased
on
natu
ral f
ood
High
esti
mat
ed
cont
ributi
on; %
of
shrim
p pr
otei
n ga
in
base
d on
nat
ural
food
L-10
010
587
.547
.445
%As
sum
ed 0
%
Assu
med
50
%
L-90
95.8
79.5
37.0
39 %
3 %
51 %
L-80
85.2
70.7
41.7
49 %
23 %
62 %
L-70
74.5
61.9
42.5
57 %
34 %
67 %
L-60
63.9
53.0
40.5
63 %
41 %
70 %
L-50
53.2
44.2
38.6
73 %
48 %
74 %
82 CHAPTER 4
4.4.2 Reconstructed crude protein content food web compartmentsThe crude protein content in food and feedstuff is estimated by multiplying the N content by a default factor of 6.25, assuming protein contains 16 % N. This assumption originates from the 19th century, but is still being used nowadays despite several reports of inadequacy during the last decades (Mariotti et al., 2008). Although adaptations were made for substrate specific N-to-protein factors for animal products and plant products (Jones, 1941, Adler-Nissen, 1986), where plant protein conversions factors were adjusted downwards, the factor of 6.25 remains the default for all substrates in food composition tables (Kirchhoff, 2002, Saxholt et al., 2008, Favier et al., 1995). However, for most substrates a conversion factor of 6.25 results in an overestimation of calculated protein content, since many substrates contain non-protein N such as nucleic acids, pigments and inorganic nitrogen. This is especially the case for bacteria and plants (including algae), as non-protein N is usually higher in plants and bacteria than in animal products. For example, N-to-protein ratio for green and red macro algae is found to be 4.59 and 5.12 (Kazir et al., 2019, Liang et al., 2014). In aquaculture, biofloc production in the water column is actively stimulated in order to provide an additional protein source for shrimp and fish (called Biofloc Technology) (Avnimelech, 2009). However, the real protein content of biofloc is not known since the N-to-protein factor has not been determined for biofloc, which typically contains high amounts of bacterial biomass. There is a demand from the aquaculture sector to determine the substrate specific N-to-protein conversion factor for biofloc and other natural food, so as to determine the protein contribution from natural food into shrimp or fish production more accurately (Liang et al., 2014).
In order to avoid the predicted overestimation of crude protein content in food web compartments other than shrimp, it was decided in this study to determine the substrate specific N-to-protein conversion factor of flocculated matter in the water column. Surprisingly, instead of finding the hypothesized lower conversion factor of around 5 (Liang et al., 2014, Kazir et al., 2019), a relative high N-to-protein factor of 7.31 was found. This factor was determined by analysing the content of individual amino acids, believed to be the most nutritionally relevant and accurate estimation of protein content in food-stuffs (Mariotti et al., 2008). Searching literature for specific N-to-protein factor for shrimp was unsuccessful, but factors found for fish meat varied between 5.43 and 5.71 (Sosulski and Imafidon, 1990, Mariotti et al., 2008). Despite these lower conversion factors for fish, it was chosen to estimate crude protein content of shrimp by analysing the organic N content by Kjeldahl’s method including multiplying by Klejdahl’s N-to-protein conversion factor of 6.25 for meat, in order to make protein content of shrimp in this study comparable to other studies.
Using the conversion ratios of 6.25 for shrimp and 7.31 for flocculated matter in the water column (biofloc and seston), periphyton and detritus, the protein content of each food web
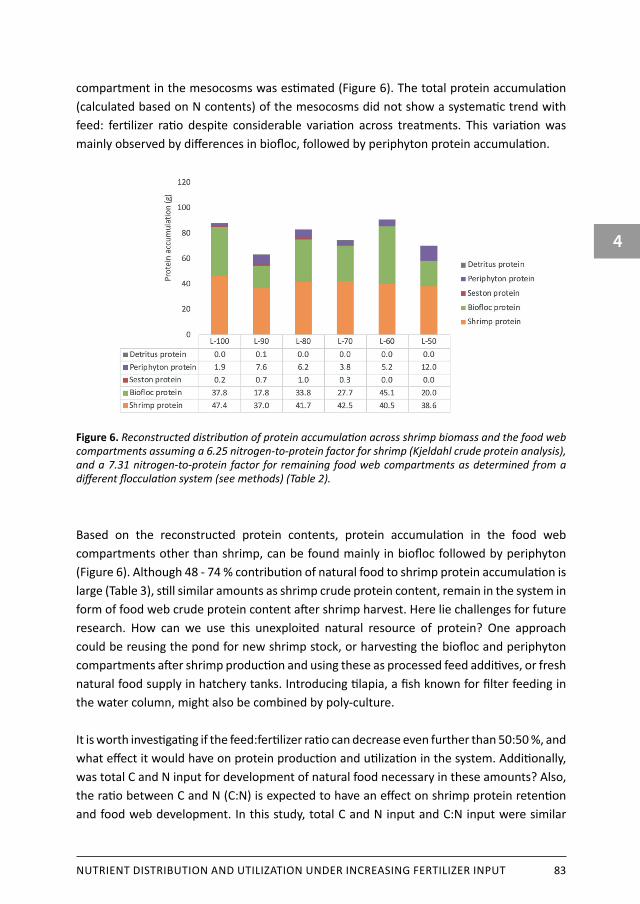
4
NUTRIENT DISTRIBUTION AND UTILIZATION UNDER INCREASING FERTILIZER INPUT 83
compartment in the mesocosms was esti mated (Figure 6). The total protein accumulati on (calculated based on N contents) of the mesocosms did not show a systemati c trend with feed: ferti lizer rati o despite considerable variati on across treatments. This variati on was mainly observed by diff erences in biofl oc, followed by periphyton protein accumulati on.
Figure 6. Reconstructed distributi on of protein accumulati on across shrimp biomass and the food web compartments assuming a 6.25 nitrogen-to-protein factor for shrimp (Kjeldahl crude protein analysis), and a 7.31 nitrogen-to-protein factor for remaining food web compartments as determined from a diff erent fl occulati on system (see methods) (Table 2).
Based on the reconstructed protein contents, protein accumulati on in the food web compartments other than shrimp, can be found mainly in biofl oc followed by periphyton (Figure 6). Although 48 - 74 % contributi on of natural food to shrimp protein accumulati on is large (Table 3), sti ll similar amounts as shrimp crude protein content, remain in the system in form of food web crude protein content aft er shrimp harvest. Here lie challenges for future research. How can we use this unexploited natural resource of protein? One approach could be reusing the pond for new shrimp stock, or harvesti ng the biofl oc and periphyton compartments aft er shrimp producti on and using these as processed feed additi ves, or fresh natural food supply in hatchery tanks. Introducing ti lapia, a fi sh known for fi lter feeding in the water column, might also be combined by poly-culture.
It is worth investi gati ng if the feed:ferti lizer rati o can decrease even further than 50:50 %, and what eff ect it would have on protein producti on and uti lizati on in the system. Additi onally, was total C and N input for development of natural food necessary in these amounts? Also, the rati o between C and N (C:N) is expected to have an eff ect on shrimp protein retenti on and food web development. In this study, total C and N input and C:N input were similar
84 CHAPTER 4
in all tanks. But other studies show more water column flocculated matter develops at increasing total C input and increasing C:N system input up to 20, while shrimp protein retention shows an optimum at C:N system input of 15 (Panigrahi et al., 2019). The C:N input in this experiment was 10 for all tanks, which is not high. But when changing the C:N input to a shrimp production system, care should be given to preventing bacterial biomass outcompeting algae biomass in the water column, which is often observed at C:N input of 15 and higher (Xu et al., 2016). Algae contribute essential fatty acids to shrimp and produce HUFA de novo (Hermsen et al., 2019a). Systems where both algae and bacteria are present in the water column result in healthier and better performing shrimp (Xu et al., 2016).
The N-to-protein conversion factor of 7.31 of flocculated matter as determined in this study, is much higher than expected. It must therefore be concluded that flocculated matter in the water column contains relatively low non-protein N and high amounts of amino acids. The conversion factor was determined using samples from another flocculated system than the experimental mesocosms, in order to avoid disturbing the ecosystem in the mesocosms by taking too much sample material. The systems were however not the same, mainly differing in a C:N input of 10 (shrimp mesocosms) versus a C:N input of 16 (other flocculating system). It is therefore plausible to assume that the flocculated matter of the shrimp mesocosms consistsed of both bacteria and alage, while in the other system the flocculated matter mainly consisted of heterotrophic bacteria being dominant species. Both planktonic algae and bacteria can contain varying amounts of protein (Zubkov et al., 1999, Becker, 2007) and it is unknown what the difference in protein content could have been between the systems. In the shrimp mesocosms, flocculated matter developed as result of a relative higher N input to the system than the other flocculating system, which could potentially have led to a higher protein content of the flocculated matter in the water column. Despite these differences, it can be argued that the 7.31 conversion factor as determined in this study, provides a better estimation on the accurate protein contents of food web compartments in shrimp mesocosms, than the default factor of 6.25 which is based on other substrates. It is hereby strongly advised to do future research, to determine substrate specific N-to-protein factors for shrimp, biofloc, seston, periphyton and detritus specifically, produced under different system C:N inputs. When using the correct conversion factors, estimations of accurate protein contributions originating from natural food sources can be made.
4.4.3 Phosphorous utilizationP dynamics in aquatic systems are known to be complex (Havens et al., 2001). Generally, increasing P-input leads to increased primary production, thereby promoting production in food webs (Bureau and Hua, 2010). Intensification of shrimp aquaculture, resulted in increased dietary P contents, since P is crucial for formation of DNA, phospholipids and exoskeleton (NRC, 2011). However, use of P is also controversial, since it is a limited resource (Dawson and Hilton, 2011) and because aquatic animals are inefficient P-retainers. For
4
NUTRIENT DISTRIBUTION AND UTILIZATION UNDER INCREASING FERTILIZER INPUT 85
example, P-retention in fish is just 25 - 40 % (Sugiura, 2018, NRC, 2011, Boyd and Tucker, 2012). On average, P retention efficiency from formulated feed is higher in fish than in shrimp, because fish have bones containing calcium and phosphate and therefore have much higher P contents and requirements than shrimp (Boyd et al., 2007). L-50 shrimp showed a P-retention of 34 % (Figure 4). This is considered high since shrimp P retention is usually low, varying between 6 and 20 %, but usually around 10 % (Páez-Osuna et al., 1997, Casillas-Hernández et al., 2006, Muangkeow et al., 2007, Boyd et al., 2007). In shrimp ponds at least 80 - 90 % of the dietary P input is discarded as waste, where semi-intensive production systems perform slightly better (3 %) than intensive production systems (Boyd et al., 2007), where less natural food is available to the shrimp. The diet in this experiment contained 12.5 g P kg-1 DM, of which 3.6 g kg-1 DM was inositol bound P in form of phytate. Therefore only 71 % of total P-input was accessible by the shrimp and would have been the maximum achievable P-retention based on formulated feed intake. But bacteria in biofloc are able to make phytate bound P available from organic matter in tilapia production systems (Verdegem et al., 2018), increasing the total P availability. It would be interesting for further research to look into total non-phytate bound P availability in semi-intensive shrimp ponds. Comparisons of P retention efficiencies between ponds and clear water control tanks will provide inside in the scope of bacteria unlocking phytate bound P into available P.
Insufficient control on wastes in aquaculture is a major factor increasing environmental eutrophication and affecting sustainability (Verdegem, 2013, Sugiura, 2018; FAO 2014). An achieved reduction from 84 to 66 % P-discard in this study, emphasizes the shrimp production sector can improve its efficiency by focusing on feeding the pond instead of focusing only on shrimp nutrient requirements when formulating diets. This achieved scope might have been larger, since the diet in this experiment was formulated with a P-composition of 1%. P-requirement for whiteleg shrimp can be decreased to 0.5%, when fed casein-protein based diets with a Ca-inclusion of 1%, as in this experiment (Davis et al., 1993). The shrimp in this experiment were therefore double provided in terms of dietary P. It is therefore not surprising that lowering relative feeding rate and thus P-input with 50 %, had no effect on shrimp growth and performance since P content in the experimental diet was twice the minimal requirement. Further research to determine P-retention of shrimp with lower dietary P-inclusion level, combined with lower feeding rate, might greatly support a more sustainable shrimp production.
4.4.4 HUFA accumulation and phosphorous-inputShrimp HUFA content significantly increased with higher P-input (Figure 5). However, P-input was a function of total feeding rate, and lowest in L-50 and highest in L-100. No fishmeal or fish oil was included in the diet, so at first sight it is likely to presume shrimp must have obtained more HUFA from the food web under influence of high feeding rate or high P-input. But this was not the case. Even without any fish oil or fishmeal in the diet, cell membranes

86 CHAPTER 4
of organic matter always contain fatty acids including HUFA. These are functioning as cell membrane structure responsible for membrane fluidity. Dietary HUFA content was 0.54 g kg DM in this experiment. Consequently, formulated feed input resulted in small dietary HUFA input, being lowest in the L-50 and highest in the L-100 tanks. This difference in dietary HUFA input between treatments is visible in shrimp HUFA content, where L-100 shrimp accumulated 0.47 g HUFA compared to 0.34 g HUFA in L-50 shrimp. When the HUFA input via feeding was subtracted from shrimp HUFA accumulation, the observed significant increase in shrimp HUFA content disappeared, resulting in a similar HUFA accumulation in shrimp of 0.28 ±0.02 g in all mesocosms. This accumulation was higher than total dietary HUFA input, suggesting that shrimp HUFA incorporation obtained from the natural food was similar for all treatments, but that the addition through natural food was limited.
Since P-input is positively linked to increased primary productivity (Bureau and Hua, 2010), alterations in P-input could influence HUFA accumulation in food web compartments containing algae. However, aquatic ecology studies found a negative correlation between total water column P-content, and water column HUFA accumulation (Müller-Navarra et al., 2004, Müller-Navarra et al., 2000). This was not observed in our study. No conclusions could be drawn with respect to a relation between total system P load and food web HUFA content. It could still be possible that such a relation is present, but the range of P-input provided in this experiment could be too narrow to expose this effect. Furthermore, these aquatic ecology studies explain observed findings by the development of cyanobacteria at high total water column P-content, which may have the advantage of sourcing N2 from the atmosphere (as some species are diazotrophic), in contrast to HUFA producing algae which are limited to use dissolved N in the water column for production. In that case, cyanobacteria, which contain no HUFA, would become increasingly dominant at decreasing N:P ratios (Smith 1983; Harris et al., 2016 Inland Waters), leading to a decreased production of HUFA in the phytoplankton community. Cyanobacteria are highly abundant in shrimp farms and are often the most abundant species in semi-intensive and intensive shrimp ponds (Alonso-Rodrıguez and Páez-Osuna, 2003). This does however not always lead to problems, such as cyanobacteria blooms or toxin production. In this current study, N-input was high and similar in all tanks, and assumingly not limited in relation to P. Therefore, it is assumed no cyanobacteria increase has occurred leading to exclusion of HUFA containing algae from the food web compartments. It would be interesting to repeat this experiment under lower total N input and varying N:P ratios to gain better insight in the nutrient dynamics inside shrimp mesocosms. Care should be taken to keep these systems well aerated, because loss of N2 (from organic matter mineralisation by denitrifying bacteria) increases under anaerobic conditions. Under anaerobic situation, increasing P and thereby increasing organic matter formation in the water column, could further amplify the effect of lower N:P inputs by a relative higher loss of N2 from the water into the atmosphere. In this current study all tanks received similar total N-input, all tanks were well aerated, and total dissolved inorganic
4
NUTRIENT DISTRIBUTION AND UTILIZATION UNDER INCREASING FERTILIZER INPUT 87
N in the water column remained constant. Losses of N2 were therefore assumed low and observed outcomes solely linked to decreased P-input.
4.5 ConclusionThis study showed that developing a “nutritious pond diet” pays off in terms of increased incorporation of protein and P from natural food. This nutritious pond diet lacking both fishmeal and fish oil, allows substituting 50 % of feed with C and N fertilizer, resulting in decreased crude protein use and decreased nutrient load in the mesocosm water. After harvest this water still contained very high protein contents in the biofloc and periphyton. Future study should focus on ways for reclaiming this protein from the food web. A next step could be testing this nutritious pond diet with half of the dietary P, and using less N fertilizer and investigate the effect on protein retention and HUFA accumulation in food web compartments.

This chapter has been submitted for publication to “Journal of Applied Aquaculture” as:
Hermsen, D., Verdegem, M.C.J. Feeding shrimp carbon and nitrogen through the feed or through the system?
Feeding shrimp carbon and nitrogen through the feed or through the system?
Chapter 5
AbstractReducing use of high-quality limited ingredients in formulated aquafeeds and reducing waste outputs will contribute to making aquaculture more sustainable. Instead of formulating feeds in function of the culture animal, one could develop dual-purpose feeds, aiming at feeding both the culture animal, as well as the microbiota in the pond. Understanding nutrient dynamics in shrimp ponds, requires the pond to be studied as a whole by getting insight on how nutrients are spread through the pond. This study aimed to provide insight in the food web of shrimp ponds using 6 indoor controlled mesocosms as model, focusing on nutrient distribution and nutrient ratios as result of altering the nutrient input. The first tank received 100% formulated feed and is referred to as L-100. In the other tanks the feed input was reduced in steps of 10%, tank-2 receiving 90% feed up to tank-6 receiving 50% of the feed (L-90 to L-50). The reduction in dietary energy (carbon) and protein (nitrogen) was compensated by adding carbohydrate (corn starch) and inorganic nitrogen (NaNO3), respectively. The total inputs of C and N were similar in all tanks; the input of phosphorous was not compensated in tanks receiving less feed than L-100. The experiment lasted 57 days. Shrimp, biofloc, seston, periphyton and detritus in the mesocosms were sampled and analysed for organic matter, nitrogen and phosphorous at day 0, 22, 43 and 57. Regression analyses did not show differences over treatment in nutrient distribution and C:N:P ratios on day 0, 22, 43, and 57. Regression analyses showed a reduction over time in the system’s efficiency to mineralize organic matter input. The contribution of natural food to production increased significantly from L-100 to L-50. The phosphorous mass balance revealed that when the P input was reduced more than 30 % less than in L-100, phosphorous from detritus flowed into periphyton at such rate that detritus phosphorous depletion would have occurred within one full shrimp production cycle. Developing a dual-purpose feed is promising, as shrimp production was not affected while feeding level was reduced by half. Future studies should focus on gaining better insight in the carrying capacity of pond systems. Key words: shrimp, natural food, organic matter (OM), C:N:P, mesocosm.

FEEDING SHRIMP CARBON AND NITROGEN THROUGH THE FEED OR THROUGH THE SYSTEM? 91
5
5.1 Introduction Following the intensification of shrimp farming during the last decades, the use of water and formulated feed increased, as did waste production. Formulated feed consists of 40 - 60 % of the total costs of shrimp production, mainly due to the high price of protein components (Tan et al., 2005, NRC, 2011, Bender et al., 2004). Reducing use of high-quality limited ingredients in formulated aquafeeds and reducing waste outputs will therefore contribute to making aquaculture more environmentally and socio-economically sustainable (Kabir et al., 2016).
Instead of formulating feeds in function of the culture animal, one could develop dual-purpose feeds, aiming at feeding both the culture animal, as well as the microbiota in the pond. In this approach the focus shifts to the nutrient requirements of the microorganisms responsible for metabolising wastes resulting from feeding the shrimp, in such a way that no nutrients are present in excess. In consequence, a well-balanced food web will develop, delivering natural food to the culture animal. Developing such a lower-cost and more ecological-based production system has been given more and more attention in research (Joffre and Verdegem, 2019, Hari et al., 2004, Panigrahi et al., 2019, Anand et al., 2015, Panigrahi et al., 2018). Natural food, such as biofloc and periphyton, are known to contribute additional energy and protein to the diet of shrimp in ponds (Chapter 4, De Schryver et al., 2008, Avnimelech, 2009, Wasielesky Jr et al., 2006, Asaduzzaman et al., 2010). For example, dietary protein levels can be reduced by 25% without affecting shrimp growth in the presence of biofloc (Xu et al., 2012). Additionally, biofloc, periphyton and seston are known to contain high amounts of highly unsaturated fatty acids, that contribute to shrimp production (Chapter 3, Banerjee et al., 2010, Gatune et al., 2012).
Dietary protein is an expensive ingredient (Bender et al., 2004). Making use of protein produced by natural food is therefore of interest. However, little attention is given to supplementing the diet indirectly by stimulating natural food production through fertilization while here lies potential. For example, pond fertilization with nitrate will stimulate the production of single cell protein, feeding the food web and ultimately the culture organisms (Boyd, 2015). Another example is adding carbohydrate, e.g. corn starch, to raise the C-concentration in the pond water, providing the food web with sufficient energy to be able to utilize available nitrogen and phosphorous (Suryakumar and Avnimelech, 2017).
Understanding nutrient dynamics in shrimp ponds, requires the pond to be studied as a whole by getting insight on how nutrients are spread through the pond. The efficiency by which nutrients pass through the food web depends on the ratios between the main nutrients carbon (C), nitrogen (N) and phosphorous (P) in the system. Formulation of a dual purpose feed, aims to contribute to an optimal C:N:P ratio. C:N:P ratios vary between different organisms and the availability of these nutrients influences species composition

92 CHAPTER 5
in the food web (Welti et al., 2017, van de Waal et al., 2009, Xu et al., 2016, Ebeling et al., 2006, Hargreaves, 2006). For example, a C:N input of around 20 is in favor of heterotrophic bacteria yielding high amounts of bacteria-dominated biofloc while a C:N input below 10 yields biofloc containing both bacteria and algae. As biofloc containing both algae and bacteria results in higher shrimp yields and a more efficient feed conversion (Xu et al., 2016), altering C:N input can affect shrimp production. Similar observations are found in tilapia ponds, where diets with a C:N ratio of 12 resulted in higher fish production due to an enhanced contribution of natural food compared to a diet with a C:N ratio of 9 (Kabir et al., 2019).
Inorganic nutrients are readily available to the algal and microbial communities, whereas organic nutrients must be mineralized before they can be converted into natural food. For example, ammonia-N was faster immobilized by bacteria than dissolved organic-N. In the latter case, more organic matter accumulated while less bacterial biomass was produced resulting in a smaller contribution of natural food production to shrimp production (Burford and Williams, 2001). Replacing part of the feed input by nutrients that are faster accessible to the food web, might result in a higher natural food production which will compensate for the smaller feed input. This approach shifts feeding management from direct to partially indirect feeding, by also relying on natural food to maintain both shrimp production and water quality.
Formulated feed is metabolised by the shrimp first, in the process releasing ammonia and CO2, the latter no longer available as energy source to heterotrophic bacteria. In contrast, corn starch might be directly and easily degraded by bacteria, and inorganic-N might be directly taken up by photo-autotrophic algae and chemo-autotrophic bacteria. Monitoring C:N:P ratios in shrimp, biofloc, seston, periphyton and detritus, would allow for a more holistic understanding of the ecosystem in the pond (Welti et al., 2017). This knowledge can be used in making aquaculture feeding more sustainable by potentially using fewer external resources.
5.1.1 Study aim In outdoor shrimp ponds, natural food contributes up to 50 % to shrimp production (Burford et al., 2004). It was therefore hypothesised that replacing up to 50 % of the energy and protein in formulated feed by carbohydrate as C-source (corn starch) and inorganic N, would have no effect on the distribution of OM, N and P between shrimp, biofloc, seston, periphyton and detritus.
This study aimed to provide insight in the food web of shrimp ponds, focusing on nutrient distribution and nutrient ratios. The loss of dietary C and N input when reducing the feed input was compensated by adding a carbohydrate (corn starch) and inorganic N (NaNO3)
FEEDING SHRIMP CARBON AND NITROGEN THROUGH THE FEED OR THROUGH THE SYSTEM? 93
5
source, respectively. The total input of C and N were similar in all treatments. P input decreased as a result of decreasing feeding level. The effect of dietary treatments on organic matter (OM) distribution and C:N:P ratios in shrimp mesocosms was investigated.
5.2 Material and methodsDetailed information on mesocosm preparation, set-up and sampling techniques are provided in previous paper of current authors (Chapter 4). The following information is a summary.
5.2.1 Classification of mesocosm compartmentsFive food web compartments are defined in this experiment: 1) shrimp; 2) feed input in form of formulated pellets, corn starch and NaNO3; 3) periphyton (biofilm on the tanks wall); 4) detritus (debris settled at the tank bottom); and 5) water column, including a) biofloc (organic residue from water column retained on a 30 μm mesh size filter) and b) seston (water column filtrate that passed through a 30 μm mesh size filter).
5.2.2 Mesocosm set-up and maintenanceFor the 57-day experiment, six shrimp mesocosms were filled with 700 L artificial seawater (25 ppt, Reefs Crystals) and 7 cm sediment. All tanks were continuously aerated. Ambient temperature was 27 – 29 °C and water temperature was 25 – 27 °C. Each tank received an incident irradiance of 300 µmol photons/m2/s (Gavita; three LEP 270-01 SUP EU, and four Digistar 400W e-serie) to allow autotrophic production. Each tank was stocked with 50 ind/m2 of 1.5-g juvenile whiteleg shrimp (Florida Shrimp International Shrimp Harvesters USA, SPF-line, imported by Crevetec Belgium), mimicking a (semi)intensive shrimp pond in the Vietnamese Mekong Delta (Joffre, 2010). Before the start of the experiment, tank walls were cleaned and water and sediment to fill all tanks was thoroughly mixed to ensure similar start situations. During the experiment water quality parameters were checked weekly. Salinity, pH and oxidation reduction potential were measured using a multi-parameter portable meter (WTW Multi 3430; Tetracon 925, Sentix 940). Orthophosphate (Pi), NO2
-, NO3- and
total ammonia nitrogen (TAN) were measured using a Smartchem (Smartchem 200, Alliance Instruments, AMS Systea, Frepillon, France) (protocol NEN-ISO6777 and NEN-ISO7150-1). Twice weekly evaporation losses were compensated by adding fresh tap water of 22 °C to maintain the water volume and salinity constant.
5.2.3 Dietary treatments and feeding regimeAll mesocosm tanks were fed the same plant-based diet free of both fishmeal and fish oil (Chapter 2). The diet was sufficient in crude protein, essential amino acids, vitamins and crude fat. Feeding levels ranged from 100 % (L-100) down to 50 % (L-50) with successive steps of 10 % (L-100, L-90, L-80, L-70, L-60, L-50). The consequential shortage in nitrogen and carbon, compared to the L-100 tank, in the L-90 to L-50 tanks was compensated by
94 CHAPTER 5
adding adjusted amounts of corn starch as C-source and NaNO3 as inorganic N-source. Accordingly, all tanks received the same C and N input. Treatments were allocated randomly over the six treatment tanks.
5.2.4 Mesocosm compartment samplingAll mesocosm compartments were sampled to determine abundant biomass at day 0 (start), day 22, day 43 and day 57 of the experiment. A homogenous feed sample was obtained by weekly grab-sampling. At time of stocking, 20 shrimp were kept apart to represent the start population, euthanized by ice-water and stored at -20 °C. At day 57, remaining shrimp were harvested by tank, euthanized and stored at -20 °C. Biofloc and seston samples were obtained by pouring 2 L mesocosm water over a 30 μm mesh filter. Biofloc (>30 μm) and seston (<30 μm) were washed out with fresh water and equally distributed over glass microfiber filters using a high-pressure pump (filters: Whatman, GF/F, diameter 55mm; pump: Vacuubrand GMBH, MZ 2C NT, Germany). Filters were stored at -20 °C prior to further analysis. Periphyton samples were taken by scraping the tank wall in triplo from bottom to top using a spatula and stored at -20 °C. Detritus samples were taken by a sediment sampler (Technical Development Studio, Wageningen University, The Netherlands), taking 100 cm2 sand sediment from the bottom in triplo per tank. The sediment samples were stored in aluminium trays at -20 ºC until analysis.
5.2.5 AnalysesSamples of the water column (biofloc and seston), detritus and periphyton were freeze-dried (ZIRBUS technology, Sublimator 3X4X5, Zirbus technology GmBH, Bad Grund, Germany). Gastrointestinal tracts of sampled shrimp were removed and shrimp were freeze-dried and subsequently ground (Retsch 200 ZM 1mm sieve). Feed samples were ground similarly. Of all compartments dry matter content (DM) (protocol ISO6496) and ash (ISO5985) was determined. Organic matter (OM) content was calculated based on dry matter content minus ash content. Elemental phosphorous, carbon and nitrogen contents were determined of all food web compartments sampled at day 43. Phosphorous content was determined by full destruction and measurement of total phosphorous (Murphy and Riley, 1962). The elemental C and N content of freeze‐dried samples were determined using an elemental analyzer (Flash2000, Thermo, interfaced with Conflo 4). Accumulated values were calculated by subtracting start values and adding intermediate removed subsamples contents to the content of subsequent samples.
5.2.7 Data analysisRegression and repeated measures ANOVA analyses were carried out using IBM SPSS software package version 23 (IBM Corp. Released 2013. IBM SPSS Statistics for Windows, Version 23.0. Armonk, NY: IBM Corp). Mesocosm tanks were the experimental units. Outcomes of regression analyses are presented per treatment, and outcomes of repeated
FEEDING SHRIMP CARBON AND NITROGEN THROUGH THE FEED OR THROUGH THE SYSTEM? 95
5
measures ANOVA are presented per treatment over time (n = 3), unless otherwise stated. Measurements of the six treatment tanks over time were taken as factor for repeated measures ANOVA analyses followed by least significant difference (LSD) range test and a Bonferroni test.
5.3 ResultsShrimp in all tanks performed well and had an average survival of 92 % (n = 6). Shrimp biomass production over time was not affected by treatment and final total biomass was 295 ±24.6 g (n = 6) per treatment tank. The specific growth rate was also not different between treatments (P = 0.932) with an average growth of 3.8 % body weight per day. All water parameters stayed within set limits favourable for shrimp growth at <2 mg NO2
--N/L, < 50 mg NO3--N /L, < 4 mg TAN/L, and 7.0 - 8.8 pH.
5.3.1 Organic matter Total OM increased over time (Figure 1). The repeated measures ANOVAs did not show differences in OM accumulation between dietary treatments (P > 0.05). Therefore, treatments were pooled. On average, combining all treatments of day 0, 22, 43 and 57, shrimp contained 14 %, biofloc 46 % and detritus 27 % of the total OM in the tanks. At day 57, on average over treatment, shrimp, biofloc, seston, periphyton and detritus made up respectively 20 %, 9 %, 40 %, 6 % and 25 % of the total tank OM. With passing time, the efficiency of the systems to convert the input to the system into new OM biomass decreased (Table 1). Regressions over treatments were not significantly different, and treatments were pooled. During the first period (day 0 to day 22), in all tanks more OM accumulated than was added through feeding, on average 5 %. From day 0 to day 43, all tanks showed an average loss of -17 %. Between day 0 and 57, the loss was largest and on average -37 %.

96 CHAPTER 5
Figure 1. Organic matt er (OM) distributi on (gram) on day 0 (including input over enti re experiment), day 22, day 43 and day 57.
The decrease of retenti on of OM in culture tanks was also refl ected in diff erences in protein uti lizati on (expressed as protein effi ciency rati o; PER) by the shrimp. The PER decreased over ti me and regression analyses showed signifi cant diff erences over treatments in the periods day 0 to day 22, and day 22 to day 34 (p < 0.05; Table 2). Aft er 22 days of culture, PER increased from 3.4 in the L-100 treatment to 5.6 in the L-50 treatment (P = 0.009). In the period day 22 to day 43, PER increased from 3.1 in the L-100 to 5.0 in the L-50 treatment (P = 0.047). In the last period from day 43 to day 57, PER did not diff er signifi cantly over treatments with an average of 0.6. This PER was extra low due to two negati ve PER values caused by mortality in tanks L-90 and L-50. When removing the negati ve PER values of tank L-90 and L-50, again no signifi cant diff erences over treatment were observed.

FEEDING SHRIMP CARBON AND NITROGEN THROUGH THE FEED OR THROUGH THE SYSTEM? 97
5
Table 1. Organic matt er accumulati on over ti me per treatment. Loss calculated as start content plus feed and corn starch input minus fi nal content.
Treatment d0 - d22 d0 - d43 d0 - d57
L-100 1% -6% -29%
L-90 15% -25% -42%
L-80 8% -17% -34%
L-70 3% -18% -35%
L-60 1% -24% -35%
L-50 0% -10% -45%
Average 5% -17% -37% P = 0.338 P = 0.809 P = 0.257
Table 2. Protein effi ciency rati o (PER) of shrimp for each ti me period.
Treatment d0 - d22 d22 - d43 d43 - d57
L-100 3.4 3.1 0.8
L-90 4.0 2.0 -2.8
L-80 4.7 2.4 0.5
L-70 4.9 3.3 2.8
L-60 4.7 4.7 3.0
L-50 5.6 5.0 -0.4
Average 4.5 3.4 0.6 P = 0.009 P = 0.047 P = 0.509
Table 3. Standard growth rate (SGR) of shrimp for each ti me period (% body weight).
Treatment d0 - d22 d22 - d43 d43 - d57
L-100 5.1 4.0 1.6
L-90 5.3 2.7 2.5
L-80 5.4 2.7 3.1
L-70 5.1 3.3 2.9
L-60 4.5 4.2 2.3
L-50 4.5 3.9 2.3
Average 5.0 3.5 2.4 P = 0.085 P = 0.506 P = 0.592
98 CHAPTER 5
5.3.2 C:N:P ratiosAs for experimental setup, C:N ratios of input were similar for all treatments, while C:P input increased due to decreasing feeding level as no P-fertilizer was added. Regression analyses of C:N, C:P and N:P ratios in the mesocosms for shrimp, biofloc, seston, periphyton and detritus were not significantly different over treatments on day 22, 43, or 57 (Figure 2). The same was true for the ratios of the total amount of OM present in each mesocosm. Regression analyses of pooled treatments, showed a significant difference in C:N over time for shrimp and seston. For these two compartments, N-content (assumed protein) increased over time. Detritus N:P increased significantly over time as P-content decreased (P < 0.05). All other C:N ratios did not change over time (P > 0.05).
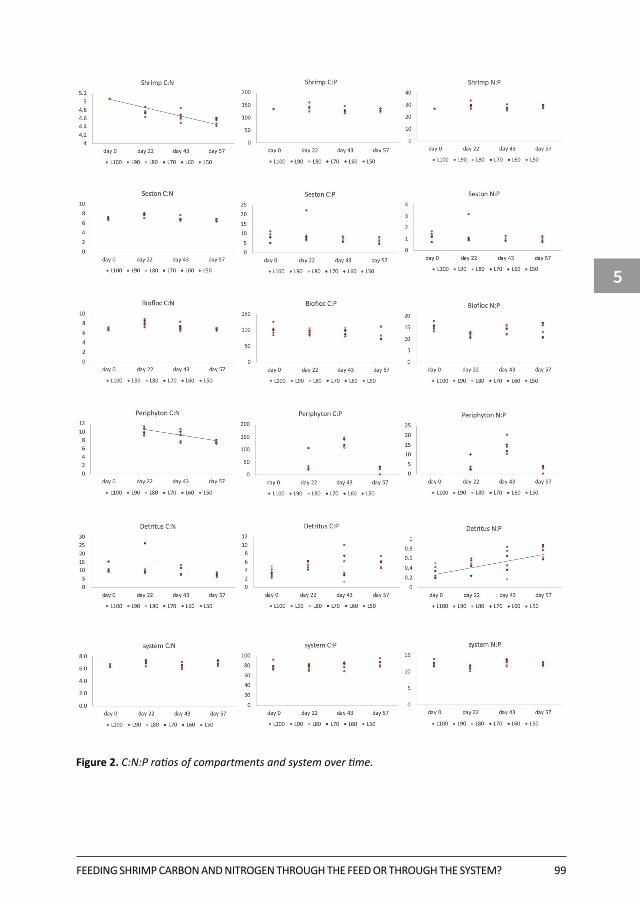
FEEDING SHRIMP CARBON AND NITROGEN THROUGH THE FEED OR THROUGH THE SYSTEM? 99
5
Figure 2. C:N:P rati os of compartments and system over ti me.
100 CHAPTER 5
5.4. Discussion
5.4.1 Organic matterAll tanks received similar input of C and N, but different in form: through formulated feed including high-quality protein and energy, or a combination of feed plus 50 % replacement by fertilization in form of carbohydrates (corn starch) as C-source and inorganic N (NaNO3) as N-source. Agreeing with the hypothesis, replacing up to 50 % of the feed with carbohydrates and inorganic N, both being directly accessible to the pond’s microbiota, did not result in differences over treatment in OM distribution and accumulation in the mesocosms, including shrimp biomass.
On average shrimp made up 14 % of the total OM in the mesocosms. This was highest at the end of the experiment where shrimp made up 20 % of the total OM. Apparently, the other 80 % OM in form of seston, biofloc, periphyton and detritus was needed to support shrimp growth and maintain favourable rearing conditions. This emphasises the idea that when feeding shrimp in a pond, the supporting food web should not be forgotten during feed formulation, as the mesocosm processes a large fraction of the OM input.
Over time, total OM abundance increased as result of nutrient input, but the efficiency in which the system used the supplied nutrients decreased with time. OM accumulation increased during the first 22 days of the experiment where more OM accumulated than was added to the system (Table 1), most likely contributed by primary production. In contrast, from day 22 to the end of the experiment on day 57, OM accumulation showed increasing losses. Total OM abundance was higher on day 43 than on day 57, while more total OM was added to the system on day 57. One thought is that this OM loss could have been caused by shrimp harvesting more natural food from the mesocosm during the later stages of the experiment. However, shrimp specific growth rate also declined from 5.0 % body weight per day during day 0 to day 22, to 3.5 % body weight per day during day 22 to day 43, down to 2.4 % body weight per day during day 43 to day 57. Therefore, a more apparent explanation for the decreasing system efficiency over time, it that the system was approaching the maximum carrying capacity. Hepher (1988) showed that the first signs of reaching the carrying capacity of an aquaculture pond are reduced growth and increasing feed conversion ratio, and this is usually accompanied by deteriorating water quality (Isyagi et al., 2009). In this experiment however, water quality was still good on day 57, but is it expected that this would have deteriorated if the experiment would have lasted 1 or 2 weeks longer.
The declining protein utilisation of shrimp over time (Table 2) also supports the idea that the system was approaching the maximum carrying capacity at the end of the experiment. Whereas improved protein utilisation due to carbohydrate and inorganic-N supplementation

FEEDING SHRIMP CARBON AND NITROGEN THROUGH THE FEED OR THROUGH THE SYSTEM? 101
5
was already shown for the entire 57 days of the experiment (Chapter 4), further analysis showed that protein utilization changed over time. The PER declined from an average of 4.5 to 0.6 over 57 days. During the first period (day 0 to day 22) and second period (day 22 to day 43), the more formulated feed was replaced by corn starch and inorganic-N, the better the protein utilisation of the shrimp. Unfortunately, during the third period (day 43 to day 57) tank L-90 and L-50 experienced shrimp mortality, resulting in negative PER values. But even when reanalysing the data of the third period without tanks L-90 and L-50, resulting in a recalculated PER average of 1.8, no significant treatment effect was found. These results show that the contribution of natural food is biggest when the system is further away from the maximum carrying capacity, and that the contribution of natural food increases when the whole system is fed by replacing part of the formulated feed with fertilizers that are easily accessible to the pond’s microbiota. This benefit disappears when approaching the carrying capacity of the system. The mortality in tanks L-90 and L-50 are not well understood. When clearing the tanks after the experiment, uneaten feed was found on the bottom of tank L-90 while all water quality parameters were still in favour of shrimp production.
Reaching the carrying capacity of an aquaculture pond, is directly linked to the oxygen budget. In the pond’s food web, oxygen is consumed and CO2 and ammonia are released. In the aquatic food web, both heterotrophic and autotrophic bacteria and autotrophic algae co-exist interdependently (Ebeling et al., 2006). Algae consume CO2, produce oxygen, take up (harmful) inorganic-N and produce OM. Heterotrophic bacteria mineralize OM, consume oxygen, and produce CO2 and ammonia-N. This dependent interaction between algae and heterotrophic bacteria regulates nutrient mineralization, involving OM breakdown and buildup, steering nutrient cycling in the food web (Beristain, 2005). In ponds, OM is mineralized by a combination of aerobic, anoxic and anaerobic heterotrophic bacteria (Ebeling et al., 2006). Under aerobic mineralization, new bacterial biomass is formed by oxidizing OM. During this process, 40 – 60 % of the OM is converted into new bacterial biomass (Gaudy and Gaudy, 1980, Eriksson et al., 2002, Lee et al., 2002, Henze et al., 2002), and the CO2 released can be used for primary production. This novel bacterial and algal biomass can serve as natural food for shrimp. However, the mineralization rate under anaerobic conditions is much lower than under aerobic conditions (Reddy et al., 1986). For example, where OM in form of fish feed pellets show a mineralization rate of 26 % per day under aerobic conditions, this is as low as 6 % under anaerobic conditions (Beristain, 2005).
During culture, the daily nutrient input increases over time. But the higher the OM concentration, the higher the oxygen demand for decomposition and natural food production. In the same time, a higher OM load to the system results in a higher amount of OM settling at the sediment. Unfortunately, sediment in aquaculture ponds often show anaerobic areas which enlarge under increasing OM settlement. Once OM reaches the pond bottom, the mineralization rate can be as low as 40 % per year due to these anaerobic patches, while

102 CHAPTER 5
being detrimental for shrimp health (Avnimelech and Ritvo, 2003, Avnimelech, 1995). Large anaerobic sediment areas cause OM to accumulate more, increasing the oxygen demand of the pond even further, causing the natural food production to decline, and creating a bad living environment for the shrimp. This is also observed in this current experiment. The uneaten feed at the bottom of the L-90 tank might be a symptom of decreased mineralization due to OM settlement at the bottom leading to anaerobic areas, depleting the oxygen budget of the system even more, possibly causing the sudden shrimp mortality. An interesting approach for further developing the dual-purpose feed, is to reduce the total OM input to the system as this might increase the period with a more efficient mineralization rate, supporting natural food production, including shrimp, for a longer time. Another option is to mechanically increase the oxygen concentration in the water.
An additional suggestion for further developing a dual-purpose feed, is to carefully balance the C:N ratio of the feed input as this could influence the oxygen budget in the system too. In a (semi)intensive zero-water exchange pond, the oxygen budget of the system is determined by water exchange and gas exchange at the surface, and the abundance of primary producers (algae) producing oxygen. A system input with a too high C:N ratio (> 20) where the algae fraction is outcompeted by bacteria (Ray et al., 2009, Tacon et al., 2002, Avnimelech, 2009) is therefore unwanted, unless oxygen is added to the system mechanically.
5.4.2 C:N:P ratios Regression analyses showed that treatments did not differ in C:N, C:P and N:P ratios on day 0, 22, 43 and 57. Concerning C:N, this is not surprising, since C:N input was similar in every treatment. Apparently, it does not matter for the system if N is added through protein or via inorganic-N. Substituting protein (N) and energy (C) in formulated diets with carbohydrate and inorganic-N in form of fertilizer seems therefore possible without affecting shrimp production.
Each tank received nutrient inputs with a distinctive C:P ratio as result of lowering the feed input, and thus the P-load. The C:P ratio of the combined feed and corn starch input in the tanks varied between 107 (L-100) to 197 (L-50). As expected, no differences between treatments in C:P ratio of shrimp were found, likely caused by the homeostasis of the animal (van de Waal et al., 2009, NRC, 2011). Depending on consumer species, for example fish or shrimp or zooplankton, C:P can be found within the range 30-300. In this experiment C:P of shrimp was in the range of 115-143 (Figure 2), corresponding with C:P of 127 found in outdoor shrimp ponds (Sahu et al., 2013). It is believed that algae and bacteria show a non-homeostatic and flexible C:P ratio (with exception of a few bacteria strains such a E. coli), depending on the nutrient availability of the surroundings (van de Waal et al., 2009, Godwin and Cotner, 2014). This C:P range can vary between 100 and 2000. The reason behind the flexibility is caused by the ability of single cell organisms to store large amounts of nutrients,
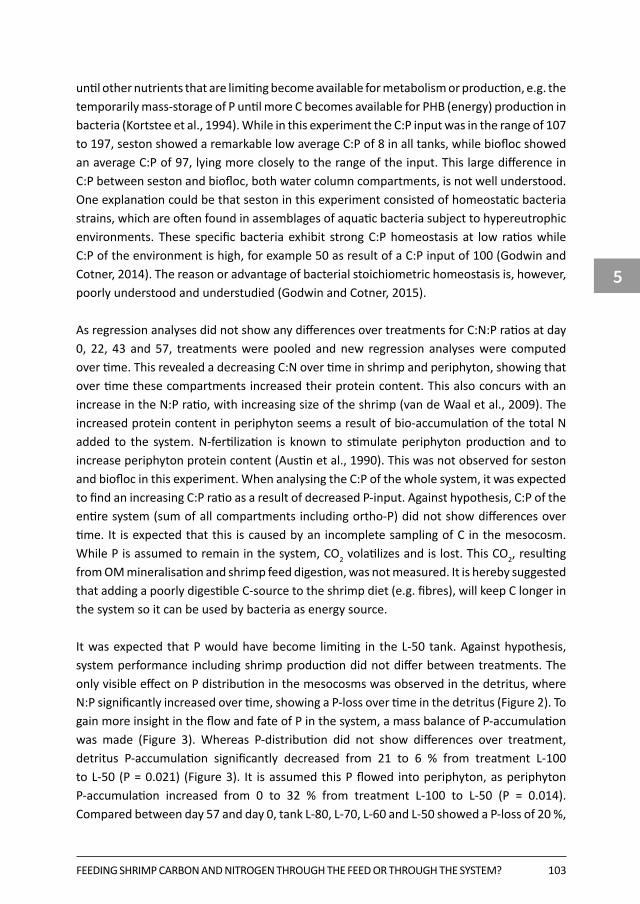
FEEDING SHRIMP CARBON AND NITROGEN THROUGH THE FEED OR THROUGH THE SYSTEM? 103
5
until other nutrients that are limiting become available for metabolism or production, e.g. the temporarily mass-storage of P until more C becomes available for PHB (energy) production in bacteria (Kortstee et al., 1994). While in this experiment the C:P input was in the range of 107 to 197, seston showed a remarkable low average C:P of 8 in all tanks, while biofloc showed an average C:P of 97, lying more closely to the range of the input. This large difference in C:P between seston and biofloc, both water column compartments, is not well understood. One explanation could be that seston in this experiment consisted of homeostatic bacteria strains, which are often found in assemblages of aquatic bacteria subject to hypereutrophic environments. These specific bacteria exhibit strong C:P homeostasis at low ratios while C:P of the environment is high, for example 50 as result of a C:P input of 100 (Godwin and Cotner, 2014). The reason or advantage of bacterial stoichiometric homeostasis is, however, poorly understood and understudied (Godwin and Cotner, 2015).
As regression analyses did not show any differences over treatments for C:N:P ratios at day 0, 22, 43 and 57, treatments were pooled and new regression analyses were computed over time. This revealed a decreasing C:N over time in shrimp and periphyton, showing that over time these compartments increased their protein content. This also concurs with an increase in the N:P ratio, with increasing size of the shrimp (van de Waal et al., 2009). The increased protein content in periphyton seems a result of bio-accumulation of the total N added to the system. N-fertilization is known to stimulate periphyton production and to increase periphyton protein content (Austin et al., 1990). This was not observed for seston and biofloc in this experiment. When analysing the C:P of the whole system, it was expected to find an increasing C:P ratio as a result of decreased P-input. Against hypothesis, C:P of the entire system (sum of all compartments including ortho-P) did not show differences over time. It is expected that this is caused by an incomplete sampling of C in the mesocosm. While P is assumed to remain in the system, CO2 volatilizes and is lost. This CO2, resulting from OM mineralisation and shrimp feed digestion, was not measured. It is hereby suggested that adding a poorly digestible C-source to the shrimp diet (e.g. fibres), will keep C longer in the system so it can be used by bacteria as energy source.
It was expected that P would have become limiting in the L-50 tank. Against hypothesis, system performance including shrimp production did not differ between treatments. The only visible effect on P distribution in the mesocosms was observed in the detritus, where N:P significantly increased over time, showing a P-loss over time in the detritus (Figure 2). To gain more insight in the flow and fate of P in the system, a mass balance of P-accumulation was made (Figure 3). Whereas P-distribution did not show differences over treatment, detritus P-accumulation significantly decreased from 21 to 6 % from treatment L-100 to L-50 (P = 0.021) (Figure 3). It is assumed this P flowed into periphyton, as periphyton P-accumulation increased from 0 to 32 % from treatment L-100 to L-50 (P = 0.014). Compared between day 57 and day 0, tank L-80, L-70, L-60 and L-50 showed a P-loss of 20 %,
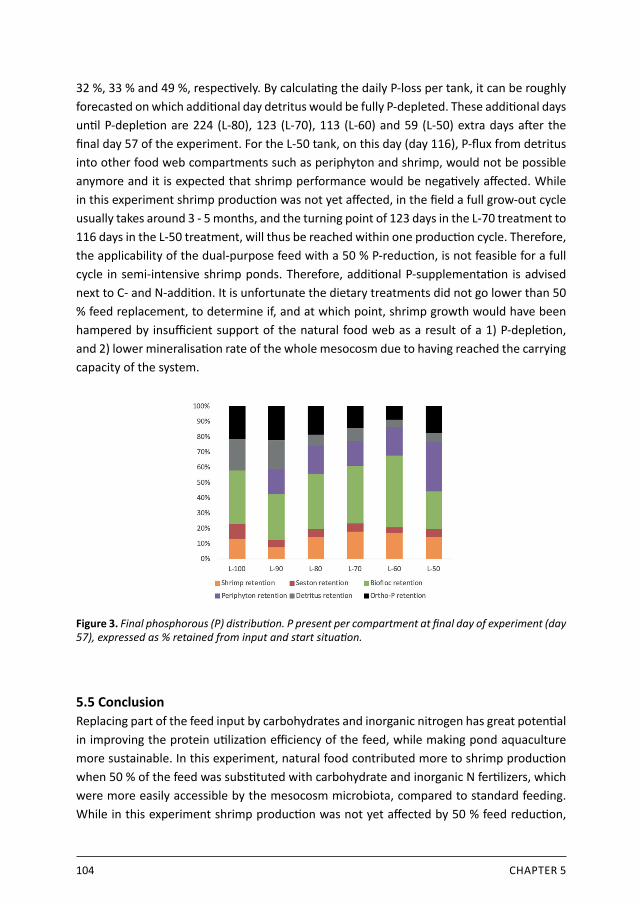
104 CHAPTER 5
32 %, 33 % and 49 %, respecti vely. By calculati ng the daily P-loss per tank, it can be roughly forecasted on which additi onal day detritus would be fully P-depleted. These additi onal days unti l P-depleti on are 224 (L-80), 123 (L-70), 113 (L-60) and 59 (L-50) extra days aft er the fi nal day 57 of the experiment. For the L-50 tank, on this day (day 116), P-fl ux from detritus into other food web compartments such as periphyton and shrimp, would not be possible anymore and it is expected that shrimp performance would be negati vely aff ected. While in this experiment shrimp producti on was not yet aff ected, in the fi eld a full grow-out cycle usually takes around 3 - 5 months, and the turning point of 123 days in the L-70 treatment to 116 days in the L-50 treatment, will thus be reached within one producti on cycle. Therefore, the applicability of the dual-purpose feed with a 50 % P-reducti on, is not feasible for a full cycle in semi-intensive shrimp ponds. Therefore, additi onal P-supplementati on is advised next to C- and N-additi on. It is unfortunate the dietary treatments did not go lower than 50 % feed replacement, to determine if, and at which point, shrimp growth would have been hampered by insuffi cient support of the natural food web as a result of a 1) P-depleti on, and 2) lower mineralisati on rate of the whole mesocosm due to having reached the carrying capacity of the system.
Figure 3. Final phosphorous (P) distributi on. P present per compartment at fi nal day of experiment (day 57), expressed as % retained from input and start situati on.
5.5 Conclusion Replacing part of the feed input by carbohydrates and inorganic nitrogen has great potenti al in improving the protein uti lizati on effi ciency of the feed, while making pond aquaculture more sustainable. In this experiment, natural food contributed more to shrimp producti on when 50 % of the feed was substi tuted with carbohydrate and inorganic N ferti lizers, which were more easily accessible by the mesocosm microbiota, compared to standard feeding. While in this experiment shrimp producti on was not yet aff ected by 50 % feed reducti on,

FEEDING SHRIMP CARBON AND NITROGEN THROUGH THE FEED OR THROUGH THE SYSTEM? 105
5
probably P-supplementation would be needed when reducing the feed load > 30% (L-70) during a full production cycle. Also, while replacing 50 % of the feed with C- and N-fertilizer enhances system efficiency in the first periods of production, it is advised to provide a high-quality diet at 100 % feeding level combined with water-refreshing when approaching the carrying capacity of the system. To develop a dual-purpose feed more research on the carrying capacity of different pond systems is needed.


General Discussion
Chapter 6

108 CHAPTER 6
GENERAL DISCUSSION 109
6
6.1 Main findings of this thesisThis thesis explored the possibility of stimulating highly unsaturated fatty acids (HUFA) and protein production by natural food in shrimp ponds. Natural food in shrimp ponds includes among others, algae, bacteria, protista, zooplankton, fungi, benthic organisms and related organic matter. In this thesis species present were not identified, instead, it was chosen to classify natural food based on form, location and accessibility in the pond. Nutrient accumulation and flows were followed of each food web compartment.
Quantitative analysis of the fate of major fatty acids including HUFA strongly suggested that the pond’s primary production can provide shrimp additional HUFA. At least 32 % and 6 % of the accumulated EPA and DHA in shrimp respectively, must have been obtained from the food web. Fully excluding fish oil and fishmeal from the formulated feed did not affect biomass production, nevertheless it resulted in shrimp HUFA contents lower than normally observed in cultured (one-half) or wild caught (one-third) shrimp (Chapter 2). Mass balances of organic matter and HUFA for each food web compartment, showed that biofloc dominated in terms of organic matter accumulation, and seston dominated in terms of HUFA accumulation. Total HUFA accumulation of the mesocosms increased with > 600 % in the tanks fed fishmeal-free and fish oil-free diets, pinpointing de novo in situ production. Most of the feed input resulted in organic matter biomass accumulation other than shrimp, as shrimp only retained 12 % of the organic matter input. The majority of the nutrients in the food web, including the de novo produced HUFA, remained in food web compartments other than shrimp and got lost after harvest. With harvesting shrimp, only 25 – 27 % of the total HUFA is removed from the system (Chapter 3). Lowering the feed:fertilizer ratio of the mesocosm input by replacing 50 % of the feed with fertilizer, lead to a 48 % increase of food web protein contribution to shrimp protein content. Total natural food protein contribution was estimated at 74 %. The nitrogen-to-protein conversion factor of flocculated matter in the water column was determined and found to be 7.31 which was higher than expected. Estimating food web protein contents using this factor, showed that a similar equivalent of protein as in shrimp was accumulated in biofloc and periphyton combined. Lowering phosphorous (P) input to the systems by 50 % had no effect on HUFA accumulation in the food web and increased shrimp P-retention from 16 to 34 % (Chapter 4). However, mass balances of P showed that following a > 30 % reduced P-input, the flows of P in the mesocosm changed and P moved from detritus into periphyton in such amounts that P-depletion would have occurred within one full shrimp production cycle (3 – 5 months). As long as the system is within carrying capacity, the contribution of natural food is larger when a larger part of the feed is replaced by carbohydrate and inorganic nitrogen, due to an efficient mineralisation rate in the system. This system efficiency decreases over time. Substituting 50 % the protein and energy in formulated feed with carbohydrate and inorganic nitrogen fertilizers, did not change nutrient distribution and C:N:P ratios in the food web, including shrimp production (Chapter 5).
110 CHAPTER 6
The knowledge gained in this thesis aids in developing the nutritious pond concept, the application of which could reduce the use of limited resources, thus decreasing cost of production and contribute to both economic and ecological sustainability (Joffre and Verdegem, 2019).
6.2 Shortcomings and recommendations study set-upAs is the case for experimental studies, some shortcomings in this research should be considered. During the setup of this study, the experiments were designed to include stable isotope analyses to draw conclusions on the percentage of shrimp growth derived from natural food versus added feeds. Theoretically, it is possible to do this with this method, however, to reach statistical robust conclusions, a high number of replications is needed where the performance of the model used increases with the number of isotope profiles measured (Parnell et al., 2010, Kempke, 2012). In this study, only triplicates were included; a number far too low for the use of the Bayesian model (Rubin, 1981). This oversight led to both a loss of time and funds, with no gain of proper insights into the percentage of growth derived from natural feeds. Similar conclusions were drawn in other aquaculture pond studies where it was argued that stable isotope profiling does not allow to separate contribution from external feed, from contribution from natural food in green water fish ponds (Kabir et al., 2019, Kabir, 2019). Despite this limitation, comparing stable isotope profiling between start and end situation of pond feeding trials, provides a good indication of shrimp and fish diet selection (Chapter 5; Kabir et al., 2019). It also discloses steering factors on isotope profiles of food web compartments, where it shows that external nutrient input determines isotope profiles of shrimp and periphyton, while the profile of biofloc, seston and detritus are not altered by external nutrient input. Isotope profiling also showed that food web compartments as chosen in this thesis (seston, biofloc, detritus, shrimp, periphyton, external feed) display clear distinct stable isotope profiles, indicating that the food web compartment classification was well chosen and represented indeed distinct parts of the mesocosm food web each with harbouring different dominant communities (Chapter 3 and 5).
A negative control group was lacking due to resource constraints (restricted number of experimental units due to limited space). In addition, replication in time was judged impractical, due to previous experiences in priming the mesocosms. If more experimental units could have been included, this negative control nonetheless could have potentially led to a better distinction between external feed and natural food contribution to shrimp production.
The findings of this study will require further testing in the field, to verify the here described findings. The parameters used – stoichiometric ratios of C:N:P and fatty acid profiles– all deliver valuable information concerning the nutritional quality of the mesocosm
GENERAL DISCUSSION 111
6
compartments, and should therefore be considered in future studies. Special care should be given to analysing the level of organic matter content in the food web compartments; due to the setup being a saltwater system, the dry matter content would be skewed and a risk would exist of overestimating the ash content through inclusion of salt in the measurements. Rinsing fresh samples with plenty of fresh water reduces the inclusion of salt in the samples to minimize this potential miscalculation.
Two sampling moments were scheduled in addition to the sampling at the start and finish of the experiment in this study; these turned out to be unnecessary, having little impact on the conclusions reached. Considering nutrient content of food web compartments including shrimp, the measured parameters changed linearly over time. Regardless variation between tanks, within tank measurements over time showed no deviating fluxes between compartments that would have changed the conclusions drawn based on the final measurements. This was also the case for stable isotope profiles, where the profiles moved linear over time towards the measured final profiles (Chapter 5). The measurements of ratios between C, N and P however, showed a static development over time where ratios measured at the second week remained stable towards the end of the experiment. For future research, sampling moments at the start and finish of the experiments would suffice, saving resources and cutting costs. Stoichiometric ratios can already be measured after two weeks, while stable isotope profiles and nutrient contents show more enlarged outcomes comparing start and end of the experiment.
Another consideration is for the sampling of the sediment in outdoor ponds. In current study, the aeration in the tanks was sufficient, and oxygen poor areas near the sediment were prevented. In outdoor ponds, however, anaerobic zones are often found at the bottom, due to inefficient aeration of the pond. In these areas, degeneration rates can differ significantly from aerobic zones, additionally shrimp avoid these areas, leading to lower grazing pressures, causing accumulation of more organic matter than in aerobic areas. Samples taken from such zones in outdoor ponds are not representative of the entirety of the pond bottom, and provide a skewed view of nutrient mass balances.
Follow-up studies should consider using or incorporating outdoor experiments. The benefit of such experiments is that it would facilitate Weende analysis (also: proximate analysis) for nutrient composition determination. This is not possible when a small mesocosm is used, since too much material would be removed by sampling, causing the system to become imbalanced. An outdoor pond setup would not have this limitation. Weende analyses would provide extra information concerning nutritional quality of the natural food. An obvious disadvantage of outdoor experiments is the fact that it would not represent a closed system, as were the indoor mesocosms. There would be no control over the input into the system by, for example, rainfall or seepage. Indoor (closed system) experiments, therefore, always
112 CHAPTER 6
provide for a more precise nutrient mass balance than experiments performed in outdoor systems.
Mesocosms are a powerful tool in the scientific community. Mesocosms (indoor and outdoor) “bridge the gap between laboratory and field studies by creating a contained test apparatus that allows for greater control over test organisms while still exposing them to natural environmental variations” (Briant et al., 2017). Mesocosms develop realistic environmental conditions with high ecological representativity (Briant et al., 2017, Caquet et al., 1996). However, some researchers doubt the scope of extrapolation from mesocosm to outdoor systems, since comparisons across mesocosm studies, and between mesocosm and outdoor studies, can be challenging due to varying set-ups, dimensions, etcetera. Despite these concerns, system studies showed that results from mesocosm can indeed be scaled up and ‘moved up’ to be applied across broad spatial scales and natural aquatic systems (Spivak et al., 2011). Mesocosms are especially of great use to study and predict eutrophication processes. The response of algae development to nutrient enrichment shows great variation between (mesocosm) systems, but scale had no effect. However, time was found to be a strong influencer to algae response and development in mesocosms. This pinpoints the importance of choosing and considering appropriate time scales relevant to the goal of the experiment (the biological or ecological process of interest) (Spivak et al., 2011). Therefore, repeating the experiments as performed in thesis but over a longer time period, covering an entire shrimp grow-out cycle (3 – 4 months), is recommended.
In this mesocosm study, it was deliberately chosen not to focus on ecosystem species abundance or specific species development, but classify ecosystem compartments based on form and location in the mesocosm. Zooming out a bit and focussing on organic matter accumulation of each compartment, also provides valuable information about the functioning of the system. It is true though, that information of abundant species in each compartment would have provided additional information, although limited. This because managing or even predicting the abundance of a specific algae, bacteria or zooplankton species in an (artificial or natural) ecosystem over time is very difficult (Wang et al., 2017, Josué et al., 2019), and would therefore not offer much hold. It is however still very interesting to see if we could inoculate the mesocosm with for example an algae species known for high HUFA content, such as Nannochloropsis. If we could find ways to keep this algae species in the mesocosm over a longer period in time, this might help to produce shrimp with potentially high (or higher) HUFA contents on a diet low in HUFA.
In these experiments, n-3 HUFA was removed from shrimp feed to force the shrimp to forage for natural foods to replenish their HUFA deficiency. Future research will be needed to investigate the effects of decreasing protein and/or nitrogen as well, as this could potentially further stimulate the shrimp to forage for natural food. However, it should be taken into
GENERAL DISCUSSION 113
6
account this may lead to heightened C:N ratio input, which in turn often leads to stimulation of the pond’s microbial community, to the detriment of the pond’s algal fraction (Ray et al., 2009, Tacon et al., 2002) and with that losing HUFA production in the pond. Besides delivering nutrients to the food web, autotrophic algae and heterotrophic bacteria form a dependent relation concerning the carrying capacity of the system. When algae produce oxygen and consume CO2, more OM is added to the system besides formulated feed. This requires sufficient abundance of heterotrophic bacteria, which consume the oxygen and produce CO2 while mineralising the OM. Both algae and bacteria have denitrifying capacities (Risgaard-Petersen et al., 2004, Liu et al., 2017) to maintain water quality favourable for shrimp growth. The challenge for future research is therefore finding the optimal balance in nutrients to allow both algae and bacteria in the pond, stimulating the nutrient transfer, including HUFA, through the food web into shrimp or fish biomass.
6.3 Diet formulation recommendationsFollowing the outcomes of this PhD-thesis, based on indoor mesocosm experiments, the following recommendations can be given to shrimp feed formulators and shrimp producers:
1. Raising shrimp in well-aerated, zero water-exchange ponds allows for development of a balanced ecosystem in the pond maintaining water quality. This ecosystem consists of several compartments (biofloc, seston, detritus, periphyton) which can contribute natural food and raise overall shrimp production. 2. Total feeding level in ‘nutritious ponds’ can be reduced down to 80 % if the losses in elemental C and N are replaced by pond fertilizers. Total feeding level can be further reduced down to 50 % only when total P is reduced by a maximum of 20 %. Keep in mind that the 100 % feeding level in this study was based on feeding recommendations advised for green water systems and biofloc technology ponds, which is 20 % lower than traditional semi-intensive shrimp ponds with high water replacement. 3. Fish oil and fishmeal can be fully left out of whiteleg shrimp formulated feed. When replaced with alternative ingredients (in this study coconut oil and casein) ensuring all required amino acids and microelements, this will result in normal shrimp protein production. If the public accepts that farmed shrimp contain lower HUFA content (one-half) than shrimp raised on standard diets, then producing shrimp with fishmeal-free and fish oil-free diets is possible. The HUFA in the shrimp are derived from the natural food web and are produced de novo in the pond, making this a sustainable source of fatty acids independent of capture fisheries. 4. When replacing fish oil with vegetable substitutes, oils high in ALA and LA can be included sparsely. This because this thesis showed that 90 % of the dietary ALA (n- 3) and LA (n-6) is used as energy source instead of being used as HUFA precursor by the shrimp. It would be better to substitute a part of the high-quality plant oils, rich
114 CHAPTER 6
in ALA and LA, with a cheaper energy source. Care should be given to reduce at least the same amount of n-6 oils as n-3 oils to prevent further increasing the n-6/n-3 balance of the input. This is also observed in humans where 60 % of the dietary ALA is catabolised by beta-oxidation (energy usage), compared to only 5 % of dietary DHA (Plourde and Cunnane, 2007). 5. During this thesis, carbon (C) and nitrogen (N) fertilizers were added simultaneously to, but independently from, the feed in order to stimulate nutrient production in the pond. It would probably be of interest to aquafeed producers – and by extent farmers – to develop feeds consisting of pellets providing nutrients directly available to the shrimp, while also fertilizing nutrient production in the pond itself, indirectly providing nutrients to the shrimp as well. This novel feed, being direct shrimp feed and pond fertilizer in one product, should be of balanced C:N:P allowing effective and complete mineralisation of waste and OM in the pond, so lowering the environmental impact from shrimp farming.
The outcomes and recommendations following this thesis may contribute to the way we look at aquaculture in relation to sustainability and limited resources, climate change, nutrient flows, nutritional value of aquaculture products, and aquaculture ecology.
6.4 Sustainability and limited resources
6.4.1 Intensification versus the need for more foodThe global human population is predicted to continually increase during the next decades, and with capture fisheries stabilizing over recent years – with no prospects of increasing in the near future –, aquaculture is expected to expand its outputs further to help feed the growing population (FAO, 2012, FAO, 2018b). According to an estimation by the UN, based on the prospected population growth of 12 % from 7.7 billion in 2019 to 8.6 billion in 2030 (U.N., 2019) and maintaining current per capita fish consumption, would mean an additional 13.2 million tons of aquatic food on top of the current 110 million tons production (FAO, 2018b) will be required by 2030. Due to the scarcity of land area available to expand aquaculture, this increase in production will have to be achieved through intensification (Beveridge et al., 1997, Folke and Kautsky, 1992) or expansion to sea cages.
This estimated “needed growth of aquaculture production to feed the growing world population” is linked to the common believe that animal protein intake per capita, including seafood (marine and freshwater wild catch or cultured species), remains similar in the future. But this is highly debatable. Advised dietary protein intake is 0.8 – 2.0 g protein per kg BW-1 d-1, depending on age, health status and lifestyle (Bauer et al., 2013, EFSA Panel on Dietetic Products and Allergies, 2011, Lonnie et al., 2018). Protein can be found in animal products, plant products and novel alternative sources such as algae, bacteria, fungi or lab grown

GENERAL DISCUSSION 115
6
meat. Plant based proteins are the main daily human dietary source globally, leading with 57 %, followed by meat protein 18 %, dairy protein 10 %, and protein from fish and shellfish 6 % (FAO 2010). In contrast, daily protein intake in western diets consist of almost 60 % animal protein. On top of that, total daily protein intake largely exceeds the daily advised amount. In some countries, like the US, protein intake is twice the advised amount (England., 2016, Moshfegh et al., 2005). Balancing total daily protein intake, preventing the predicted income-dependent shift towards a meat-based diet in economic upcoming countries, and making conscious choices concerning protein source in western countries, will aid in feeding the world in a more sustainable way. When following this approach, aquaculture does not need to increase by the calculated 12 % in the coming ten years. In this way, many problems associated with production intensification can be minimized.
Following the need for more food, agriculture intensified rapidly over the last decades including both crop and animal production. Crop yields for example, multiplied with factor 2 – 5 for maize, rice, wheat and soybean concerning total ton per hectare (Ray et al., 2013). As result of production intensification, output of anthropogenic greenhouse gasses increased with aquaculture contributing an estimated 0.5 – 5.7 % to this (Ray et al., 2013, Hu et al., 2013). Aquaculture intensification has brought some serious problems along with it in relation to social and environmental sustainability over recent decades: pollution of the environment with chemicals and nutrient wastes, antibiotics-overuse and development of resistance in bacteria, depletion and salinization of potable water, salinization of agricultural land, spread of disease into the environment, and abuse of human rights within the industry (Ahmed et al., 2019, Clark et al., 2019, Verdegem et al., 2006, Mischke, 2012, Nhan et al., 2008, Stentiford et al., 2012, Bondad-Reantaso et al., 2005, Tacon and Metian, 2008, Tacon and Metian, 2013, Crawford and Broadhurst, 2012, Mráz et al., 2012, Watters et al., 2013). Expansion to open sea cages as practiced today is not preferred due to the risk of escapes of non-native species, uncontrolled direct waste outputs to the environment and disease spread (Beveridge, 2008, Castellanos-Galindo et al., 2018, Fredheim and Reve, 2018).
6.4.2 Reliance on capture fisheriesOne problem affecting aquaculture more than land-based animal production is the use of fishmeal and fish oil derived mainly from capture fisheries in feed. The majority of this fishmeal and fish oil is used to cultivate commercially valuable, higher trophic level fish species and shrimp (Merino et al., 2010). This dependency on capture fisheries is not desirable, and arguably almost defeats the purpose of aquaculture intensification for meeting the global food demand. This because in traditional formulated diets of especially oily fish species, more fish oil and fishmeal from capture fisheries is used as aquaculture feed input, than results in aquaculture fish output. In other words, for specific aquaculture species including shrimp and salmon, more feed-fish are used in formulated diets, than is being produced as output (Byelashov and Griffin, 2014, Jackson, 2009a, Gladyshev et al., 2018). Many of
116 CHAPTER 6
the world’s marine fisheries struggle with overexploitation; according to the FAO, in 2015, 33.1 % of world fisheries were overexploited and therefore producing yields below their ecological potential (FAO, 2018). Contrarily to what was commonly held true previously, stocks of some short-lived forage fish species that are often used in aqua feeds undergo stock collapses just as often as large commercially valuable species (Pinsky et al., 2011). Collapses of forage fish, or even exploitation close to the Maximum Sustainable Yield (MSY), can have large, ecosystem-wide impacts (Pinsky et al., 2011; Smith et al., 2011). Clearly, there is an imperative to relieve the reliance on capture fisheries as feed for aquaculture, and for these stocks to be managed for long-term sustainability and ecosystem integrity. This because pressure on fish oil and fishmeal relates to animal farming as a whole, not only aquaculture. When the share of aquaculture in total fish oil and fishmeal consumption grows as result of increasing production whereas global fisheries exploitation is quite stable, more pressure on fish stocks is expected. For example, fish oil is an important dietary ingredient in piglets and pregnant sows, increasing survival and performance (Rooke et al., 2001). Finding sustainable fishmeal and fish oil alternatives such as vegetable products, is also an issue in pig nutrition research, sometimes with promising results (Knauer and van Heugten, 2018).
So-called “trash” fisheries on low-value forage fish for aquafeeds, are primarily sourced from two types of fisheries: those that intentionally target mixed species deemed unsuitable for human consumption (due to palatability or size), and this fisheries targeting food species using indiscriminate fishing gears, resulting in a large (by)catch of, in particular, juvenile fish (Leadbitter 2010). Global landings of low value fish are substantial, estimated to be well over 5 million tons per year (these often concern unregulated fisheries, however, with a lack of collected data) (Leadbitter 2010). Additional critique exists surrounding the use of such a large percentage of the global catch for reduction purposes. Many of the species are actually edible and nutritious; malnutrition is the number one killer of humans in the world, with a lack of protein-rich food of animal origin considered as its cause (Tacon and Metian 2009). This certainly is a considerable concern when taking the expected rising demand for fish products into account (FAO, 2010, 2018). Most captured fish destined for fishmeal production for animal feeds (approximately 20 million tons per year) are actually human food-grade fish (Cashion et al., 2017). Suppose 50 % of this fishmeal becomes available to human consumption, in terms of protein, aquaculture would need to grow only 3.2 million ton instead of 13.2 million ton by 2030.
6.4.3 Efficient use of fish oil and fishmeal from capture fisheriesFurthermore, some aquaculture practices are actually net consumers of fish, rather than producers (Tacon and Metian 2008, IFFO 2018). This can be reflected in the fish in-fish out (FIFO) ratio; the unit of fish consumed per unit of fish produced (Torrissen et al., 2011), i.e. the efficiency of converting a weight equivalent unit of wild fish into a unit of cultivated fish (Merino et al., 2010). Some research claims aquaculture will have to reduce its FIFO
GENERAL DISCUSSION 117
6
ratio by at least 50 % in order to meet the growing demand from the human population in a sustainable manner (Merino et al., 2010). Caution should be taken, however, with using FIFO as indicator of sustainability. Firstly, where sustainability requirements by for example retailers, request aquaculture products actively moving towards FIFO values of 1 or lower, actually wild fish can never meet such requirements. FIFO of wild piscivorous fish are often > 10 times higher than FIFO values of aquaculture species, due to the several trophic levels involved in the food web of predator species (Wexler et al., 2003, Bibus, 2015). Secondly, expressing FIFO per species, gives a skewed impression of the aquaculture sector. For example, for shrimp relatively more fishmeal but less fish oil is present in the diet then can be derived from one unit of forage fish (and being the opposite for salmon). On the surface this seems like inefficient use of fisheries resources as the oversupply seems wasted. However, fish oil and fishmeal do not go to waste and are merely used for other practices like diet formulations for other species. Therefore, FIFO ratios should not be calculated per species, but should be combined. As example, FIFO for salmon and shrimp separately are 4.9 and 1.4, respectively, but combined show an average of 1.7 (Bibus, 2015, Jackson, 2009b). The global FIFO ratio lies between 0.22 and 0.7, depending on the method of calculation (Kaushik 2010; Smith et al., 2011; IFFO 2018). FIFO ratios are particularly high for cultivation of (commercially valuable) higher trophic level species (Tacon and Metian 2008, IFFO 2018). Due to inclusions of vegetable-based substitutions for fishmeal and fish oil in aqua feeds, FIFO ratios have declined in recent years (Tacon and Metian 2008)(Liland et al., 2013). FIFO ratio for crustaceans declines from 0.91 to 0.46 in the period 2000 – 2010, for marine fish from 1.48 to 0.53, and for tilapia from 0.27 to 0.15 (IFFO, 2018). There is imperative to keep striving to replace the capture fish products in feeds. It is of paramount importance to lessen the reliance on capture fisheries (Stergiou, Tsikliras, and Pauly 2009). The successful substitution of fishmeal and fish oil from capture fisheries with more sustainable alternatives would allow for an overall increase in production, without threatening wild forage fish stocks. This is indeed reflected in the fact that fishmeal and fish oil consumption in aquafeeds are static, while aquaculture production continues to grow (IFFO, 2018, FAO, 2018b). Fishmeal and fish oil are however difficult to substitute without affecting fish performance and fillet quality, due to their many nutritional advantages, including good fatty acid profiles. In experimental setting, replacing fish oil and fishmeal by 70 – 80 % in salmon had no effect on growth and performance and resulted in a FIFO ratio of < 1, but also resulted in fish products with reduced levels of n-3 highly unsaturated fatty acid (HUFA) (Liland et al., 2013). This concurs with the observed general trend; in the period 2006 – 2015 HUFA content of aquaculture seafood decreased 50 % in salmon and 52 – 68 % in shrimp (Izquierdo et al., 2006, NRC, 2011, Sprague et al., 2016). This is also found in this thesis, where shrimp with no dietary inclusion of fishmeal and fish oil showed lower total body HUFA contents than the control group (Chapter 2). Although this did not result in lower shrimp performance, it might be an issue if shrimp are selected for human diets because of their HUFA contribution to a healthy lifestyle. Modern shrimp diets contain low amounts
118 CHAPTER 6
of fish oil and fishmeal, around 1 and 16 %, respectively. But being able to substitute this with de novo HUFA and protein from in situ produced nutrients in the pond, may lead to economic benefits nonetheless and is an important step towards a more sustainable sector being independent of capture fisheries.
6.5 Climate change Our understanding of how anthropogenic climate change affects aquatic ecosystems is more difficult to estimate than for terrestrial systems, due to a relative difficulty in taking marine measurements (Hoegh-Guldberg and Bruno, 2010). Since the intensification of industrial and agricultural businesses, atmospheric greenhouse gasses including CO2, rapidly increased leading to global temperature increases. Both CO2 and heat are being absorbed by water. More than half of the atmospheric heat- and CO2-increase since industrialization have been absorbed by oceans (Sabine et al., 2004, Pachauri, 2007). As a consequence, the upper layer of oceans increased with 0.6 °C over the last 100 years (Levitus et al., 2009, Pachauri, 2007), resulting in an average global decrease of 0.1 units pH of ocean water, substantially lowering the carbonate concentration and thereby lowering the resilience of the entire aquatic ecosystem (Doney et al., 2009, Riebesell et al., 2007). Many shrimp ponds are located in coastal areas where natural surrounding water, including ocean water, is used to fill the pond. Higher pH and lower carbonate levels of in-led water should be considered during fish or shrimp production to maintain water quality favourable for production.
Increased ocean temperatures and melting polar ice change direction and strengths of wind and water currents leading to more organic material sinking to deeper waters. As a result, increased occurrence of anaerobic areas can be found in deeper ocean layers increasing the risk of mass mortalities of benthic organisms (Chan et al., 2008), being an important link in the natural food web of marine life. On top of that, as result of strong varying temperatures, acidification and stratification of the water, primary production is declining and global yearly primary production has been reduced with at least 6 % since 1980 (Gregg et al., 2003, Polovina et al., 2008, Hoegh-Guldberg and Bruno, 2010). Mesocosm experiments studying the effect of temperature on food web structure, ranging from 21 to 27 °C, showed a stronger control of primary producers by consumers with increasing temperature. With increasing temperature, the concentration of primary producers in the water column decreased, and the abundance of zooplankton increased. Both a lower plant-to-consumer ratio was found, as well as an overall reduction of total biomass of the entire mesocosm food web (O’Connor et al., 2009). At the same time, bacterial biomass in the mesocosm water column increased with increasing temperature. For pond aquaculture production, this has implications for the entire food web structure and natural food availability. If primary production decreases as result of higher water temperatures while microbial biomass increases, the system will develop more towards a biofloc-technology system (Avnimelech, 2009). In terms of water quality and protein addition to the diet a biofloc system is a good functioning system.

GENERAL DISCUSSION 119
6
However, algae are also needed for fatty acid production and HUFA contribution to shrimp / fish diets (Chapter 2 and 3). This implies that climate change might pressure the development of a well-balanced nutritious pond system allowing primary production and in situ HUFA production. On a larger scale, reduced ocean primary production and increased benthic mortality will have impacts on the total productivity of oceans including on fish standing stock. This, combined with anthropogenic eutrophication and overfishing, will pressure global fish populations available for capture fisheries even more. This would mean capture fisheries management has to be adapted, possibly leading to lower availability of fish for human consumption and lower availability of fish oil and fishmeal for aquaculture diets. This pinpoints the need to develop nutritious pond systems with in situ HUFA production to make aquaculture eventually independent from capture fisheries. Increasing temperatures will in the same time challenge this.
Increased water temperatures as result of climate change, are believed to increase the prevalence and severity of disease outbreaks in aquatic environments (Harvell et al., 2009, Maynard et al., 2015, Harvell et al., 2002, Lafferty, 2009, Burge et al., 2014). Due to higher temperature, bacterial growth is enhanced (O’Connor et al., 2009), the habitat range of pathogenic bacteria expanded (extra enlarged by increased global ship traffic and widespread transboundary trading of living animals) and hosts become more susceptibility as result of environmental stress. Climate related disease outbreaks are mainly reported in corals, shellfish, finfish and in humans (Burge et al., 2014). But it is believed this will reach species of the entire food web including benthic organisms like shrimp. Shrimp have suffered greatly the last decade of several diseases including Early Mortality Syndrome, Acute Hepatopancreas Necrosis Syndrome, Whitespot Syndrome Virus, and other Vibrio-bacteria related diseases (Sanguanrut et al., 2018). While pathogenic bacteria pressure increases as result of climate change, rearing shrimp in zero water exchange ponds, such as nutritious ponds or Biofloc Technology ponds, will aid in resistance and robustness of the pond’s ecosystem and the cultured shrimp to disease outbreak. Reducing the water exchange between farm and surroundings reduced the spread of diseases and the chance for infection. Biofloc is found to actively stimulate the immune system of shrimp yielding in better growth and survival in disease challenge studies (Ekasari et al., 2014). The pond ecosystem also aids in protection against pathogenic bacteria outbreak by competitive exclusion, bioremediation, providing enzymatic contribution to digestion and quorum sensing blocking (Ekasari et al., 2014, Crab et al., 2010).
Altered wind and water currents also change local climates, often showing extremer weather situations such as extended dry periods, prolonged wet seasons, or a higher frequency of nature phenomena like El Niño or increased hurricane occurrence (Woodward and Samet, 2018). Prolonged rainfall is known to be detrimental to shrimp production as ponds may crash due to rain induced changes in pond water temperature, pH, oxygen, alkalinity, salinity

120 CHAPTER 6
or sound and movement disturbance. Also the inflow of too many nutrients or pollutants into pond water may harm shrimp. Where periods of drought my not directly affect shrimp production, aquaculture could become more sustainable by optimizing its water use. Agriculture is the major consumer of water accounting for 80 % global total water use. Other water uses relate to domestic and industrial activities. Agriculture uses 30 % of the global accessible renewable fresh water supply (Lucas et al., 2019). Consumptive fresh water use, excluding rainwater, by aquaculture is estimated to be 122 km3 yr-1, being 3.7 % as much as agriculture (Verdegem and Bosma, 2009). This includes the water use for production of aquafeeds making up 1 km3 yr-1. Even in areas where water normally occurs in high volume, water shortage can develop in periods of drought. In the light of climate change and increased occurrence of periods of droughts, water use should be handled wisely by aquaculturists to make the sector more sustainable. Decreasing water use can be done in several ways, for example by production intensification, minimizing seepage loss, maximizing capture and storage of rainwater, reuse of pond water after harvest, maintaining pond water quality for a longer period of time, and reducing external dietary resources. The latter three are directly linked to the nutritious pond concept and highlights that developing nutritious ponds will make the aquaculture sector more sustainable and more robust for the future.
6.6 Nutrient flows One of the most remarkable outcomes of this thesis, is the vast amount of n-3 HUFA produced de novo by the mesocosm. In shrimp fed fish oil- and fishmeal-free diets, an increase of >600 % total mesocosm HUFA content was observed between input and output in 58 days (Chapter 3). Unfortunately, of all that HUFA in the mesocosm, only 25 % accumulated in shrimp biomass. The remaining 75 % was accumulated in other food web compartments. Finding ways to increase trophic transfer from these compartments into shrimp, might increase the observed low HUFA contents of cultured shrimp lacking dietary fish oil and fishmeal (Chapter 2 and 3), coming closer to the level observed in shrimp fed fish oil- and fishmeal-rich diets or even closer to the level of wild shrimp. In order to optimize the nutritious pond system, it is crucial to find out which organisms in the mesocosm were responsible for the transfer of the 25 % HUFA that did reach the shrimp. A better understanding of natural diet selection by shrimp in nature could yield insight in how to canalize more de Novo-HUFA towards the shrimp. Understanding the origin and route of HUFA through the natural food web, enables the attempt to mimic and stimulate this pathway in production ponds. The diets of different shrimp species differ, and thus the nutrient route from natural production into wild shrimp biomass differs per species. But considering that only a few species are commonly cultured, e.g. P. monodon and L. vannamei making up > 90 % (FAO 2017), the workload is not too large and deserves attention in further research. A relatively high intake of diatoms by wild shrimp could explain the high n3-contents found in wild shrimp: diatoms thrive in salt water and contain very high concentrations of n3-HUFA (Brett and Müller-Navarra, 1997, Guo et al., 2016, Gladyshev et al., 2013). Copepods
GENERAL DISCUSSION 121
6
and diatoms have been found to have a stimulating effect on shrimp performance due to specifically their high HUFA content (Napolitano et al., 1996, Delong et al., 1993, Johnson and Wiederholm, 1992). Moreover, wild shrimp likely feed more on benthic organisms, such as bivalves, gastropods, crustaceans, and polychaetes; especially polychaetes have been shown to contain high concentrations of n-3 HUFA (Würzberg et al., 2011). In Chapter 4, it was shown that of the total biomass increase in the experimental mesocosms in this study, only 18 % was contained in shrimp, the remaining majority of the system biomass resided in the water column. Despite manipulating the shrimp to cause them to switch to natural food, the majority of total nutrients present in the mesocosm remained in the system after shrimp harvest including HUFA and protein. The duration of the experiment was quite short compared to a 4 – 6 months grow-out production cycle in outdoor ponds. If the experiment would have lasted longer, perhaps the nutrient flow could have been higher if shrimp had longer time to graze on the natural food web compartments. This is something to look into for further research. Hypothetically, the remaining nutrients including HUFA could be consumed and fixed by benthic organisms by developing a partitioned aquaculture pond system and integrating organisms such as polychaetes, gastropods, bivalves and crustaceans. Such benthic organisms are known to accumulate essential fatty acids (Table 1). The benthic organisms would consume the seston and biofloc, thus fixating and accumulating HUFA. After a set rearing period, the partitioning would be removed, leaving the shrimp free to predate on the integrated benthic organisms, thus creating a pathway for the shrimp to access large concentrations of HUFA to incorporate in their body composition. If this access is given during the last weeks of culture, then this could function as a type of shrimp fattening diet or meat-quality upgrading diet. Future research will be necessary to explore this potential solution for not using the de novo produced n3-HUFA in the remaining food web compartments after shrimp harvest.
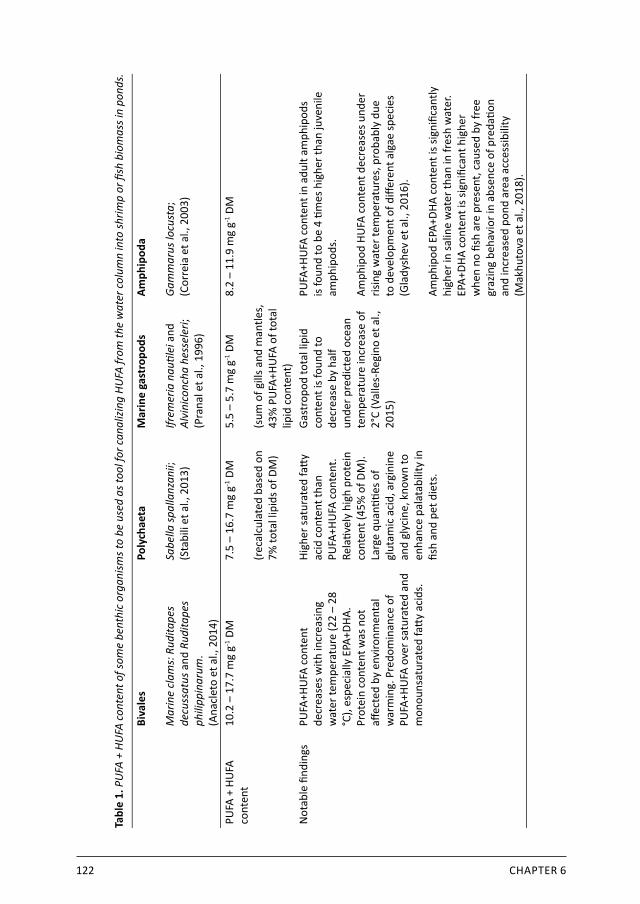
122 CHAPTER 6
Tabl
e 1.
PU
FA +
HU
FA co
nten
t of s
ome
bent
hic
orga
nism
s to
be u
sed
as to
ol fo
r can
alizi
ng H
UFA
from
the
wat
er co
lum
n in
to sh
rimp
or fi
sh b
iom
ass i
n po
nds.
Biva
les
Mar
ine
clam
s: R
udita
pes
decu
ssat
us a
nd R
udita
pes
phili
ppin
arum
.(A
nacl
eto
et a
l., 2
014)
Poly
chae
ta
Sabe
lla sp
alla
nzan
ii;
(Sta
bili
et a
l., 2
013)
Mar
ine
gast
ropo
ds
Ifrem
eria
nau
tilei
and
Al
vini
conc
ha h
esse
leri;
(P
rana
l et a
l., 1
996)
Amph
ipod
a
Gam
mar
us lo
cust
a;(C
orre
ia e
t al.,
200
3)
PUFA
+ H
UFA
co
nten
t10
.2 –
17.
7 m
g g-1
DM
7.5
– 16
.7 m
g g-1
DM
(r
ecal
cula
ted
base
d on
7%
tota
l lip
ids o
f DM
)
5.5
– 5.
7 m
g g-1
DM
(s
um o
f gill
s and
man
tles,
43
% P
UFA
+HU
FA o
f tot
al
lipid
con
tent
)
8.2
– 11
.9 m
g g-1
DM
Not
able
find
ings
PUFA
+HU
FA c
onte
nt
decr
ease
s with
incr
easin
g w
ater
tem
pera
ture
(22
– 28
°C
), es
peci
ally
EPA
+DHA
. Pr
otei
n co
nten
t was
not
aff
ecte
d by
env
ironm
enta
l w
arm
ing.
Pre
dom
inan
ce o
f PU
FA+H
UFA
ove
r sat
urat
ed a
nd
mon
ouns
atur
ated
fatt
y ac
ids.
High
er sa
tura
ted
fatt
y ac
id c
onte
nt th
an
PUFA
+HU
FA c
onte
nt.
Rela
tivel
y hi
gh p
rote
in
cont
ent (
45%
of D
M).
Larg
e qu
antiti
es o
f gl
utam
ic a
cid,
arg
inin
e an
d gl
ycin
e, k
now
n to
en
hanc
e pa
lata
bilit
y in
fis
h an
d pe
t die
ts.
Gast
ropo
d to
tal l
ipid
co
nten
t is f
ound
to
decr
ease
by
half
unde
r pre
dict
ed o
cean
te
mpe
ratu
re in
crea
se o
f 2°
C (V
alle
s-Re
gino
et a
l.,
2015
)
PUFA
+HU
FA c
onte
nt in
adu
lt am
phip
ods
is fo
und
to b
e 4
times
hig
her t
han
juve
nile
am
phip
ods.
Amph
ipod
HU
FA c
onte
nt d
ecre
ases
und
er
risin
g w
ater
tem
pera
ture
s, p
roba
bly
due
to d
evel
opm
ent o
f diff
eren
t alg
ae sp
ecie
s (G
lady
shev
et a
l., 2
016)
.
Amph
ipod
EPA
+DHA
con
tent
is si
gnifi
cant
ly
high
er in
salin
e w
ater
than
in fr
esh
wat
er.
EPA+
DHA
cont
ent i
s sig
nific
ant h
ighe
r w
hen
no fi
sh a
re p
rese
nt, c
ause
d by
free
gr
azin
g be
havi
or in
abs
ence
of p
reda
tion
and
incr
ease
d po
nd a
rea
acce
ssib
ility
(M
akhu
tova
et a
l., 2
018)
.
GENERAL DISCUSSION 123
6
Where the nutritious pond concept shows promising results on de novo HUFA and protein production by natural food (Chapters 2 – 4), it also contributes to improving P-retention in shrimp biomass (Chapters 4 and 5). This is a positive outcome in view of making the sector more sustainable. There are pressing justifications to decrease the use of P in agriculture practices including the use of P in aquafeeds (Withers et al., 2015). These justifications include economic and environmental aspects since worldwide P-reserves are declining and society is using these reserves in a highly inefficient way to produce fertilizers, feed supplements, food additives and detergents. The inefficient use of P has led to serious environmental eutrophication of mainly aquatic systems, and is expected to become worse as result of the growing world population (Edixhoven et al., 2013, Ulrich et al., 2013, Smith and Schindler, 2009, Elser and Bennett, 2011). Fish and shrimp are relatively inefficient in their P uptake from formulated diets, causing P to be released into the environment (Piedrahita, 2003). Therefore, limiting the use of P would aid in improvement of ecological sustainability by decreasing eutrophication of the surrounding environment. Chapter 4 and 5 showed shrimp production was not affected by a decreased P-input down to 70 % feeding a diet with 1 % P-inclusion. But a P-input of 60% or lower resulted in P-fluxes from orthophosphate and detritus into biofloc and shrimp. This meant that (when calculating with abundant P levels in the mesocosm) within one production cycle the system would have been P-depleted (Chapter 5), expectedly leading to misfunctioning of food web compartments. It can be expected that shrimp growth will be affected by this system P-depletion. Shrimp graze on natural food and use P for own biomass production, which is reflected in the observed high P-retentions ranging from 29 - 63 % (Chapter 4). Usually P-retention in shrimp raised in semi-intensive ponds is found to be lower, between 15 – 21 % (Casillas-Hernández et al., 2006, Qiu and Davis, 2017). The high P-retention efficiencies observed in this thesis are even higher than found for fish fed high quality diets in ponds (25 – 35 %) (Boyd and Tucker 2012). Future research has to show if, just like with N, well-adjusted P-fertilisation can keep the pond system in balance. Reducing P inclusion levels is, apart from sustainability arguments, also of particular interest to European feed manufacturers, as Europe has hardly any P-reserves and is almost fully dependent on import. This makes Europe (financially) vulnerable for future P-scarcities. For this reason the European Commission put P on the list of critical raw materials (Withers et al., 2015, Cordell and Neset, 2014, EC, 2014).
6.7 Nutritional value of aquaculture products N-3 HUFA (EPA and DHA) are crucial for the well-being and optimal functioning of many animals, invertebrates and vertebrates, including humans. EPA is precursor of certain endo-hormones (eicosanoids), thereby regulating blood pressure, reducing fever, inflammatory and allergic symptoms, and plays a role in pregnancy and childbirth. DHA is an important membrane component in nerve, retina and brain cells, it regulates synthesis of eicosanoids and is thought to play a role in determining the speed of cell metabolism (Lauritzen, 2001, SanGiovanni and Chew, 2005, Wall et al., 2010, Makhutova et al., 2018, Norris and Dennis, 2012, Turner et al.,
124 CHAPTER 6
2005, Hulbert, 2007). The World Health Organisation advises a daily consumption of 0.3 g HUFA, of which 0.2 g DHA in case of pregnancy (WHO/FAO, 2008), but some other research advices higher daily intakes up to 0.5 – 1.0 g in order to prevent cardiovascular disease (Nagasaka et al., 2014). N-3 HUFA is mainly produced by algae and protist Thraustochytrids (Ugalde et al., 2018, Leyland et al., 2017), whereas higher terrestrial plants produce short chain n-3 fatty acids (ALA) instead (Ruiz-López et al., 2012). Through algae consumption and selective bioaccumulation and a limited efficiency of maximal 5 % ALA to n-3 HUFA synthesis in the body (Plourde and Cunnane, 2007, Wall et al., 2010), n-3 HUFA bioaccumulates, reaching the highest levels in organisms occupying high trophic niches (Gladyshev et al., 2013). Several studies suggest humans evolved on a diet rich in HUFA, with a ratio of n-6/n-3 of around 1. Both n-6 (plant oils) and n-3 HUFA are needed for optimal health, but since n-6 and n-3 fatty acids have counteracting effects in the body in relation to (among others) blood pressure, inflammatory and autoimmune processes, an optimal balance in dietary intake is required. Unfortunately, in Western diets n-6/n-3 ratios are often exceeding 15, while 5 or lower is advised to reduce disease development (Simopoulos, 2002). Seafood products therefore remain the main source of n-3 HUFA for human consumption and increased consumption is advised to balance out a healthy n-6/n-3 intake.
Research has shown wild caught shrimp to contain a higher concentration of n-3 HUFA than cultured shrimp (Chanmugam et al., 1986, Li et al., 2011, Browdy et al., 2006, Ramezani-Fard et al., 2014). In wild shrimp n-6/n-3 ratios as low as 0.4 have been found, due to relatively high concentrations of EPA and DHA (n-3) (Browdy et al., 2006). Through inclusion of fishmeal and fish oil in aquafeeds, cultivated shrimp and fish can be reared with HUFA contents and ratios approximating those of their wild counterparts (Chapter 2, Table 5)(Li et al., 2011, Browdy et al., 2006). The opposite is also observed, where aquaculture fish often contains more HUFA than their wild counterparts (Gladyshev et al., 2018). This is positive in terms of food quality for humans, but challenging in terms of the high contents of high fish oil and fishmeal used in the formulated diets.
When fishmeal and oil are replaced by vegetable products for the sake of sustainability, however, shrimp and fish lose their high n-3 fatty acid concentrations. For example, replacing 80 % of the fish oil and 70 % of the fish meal in salmon diets with vegetable products, results in fish with high n-6/n-3 ratios, net production of protein but no n-3 HUFA despite high inclusion of ALA, precursor of n-3 HUFA (Liland et al., 2013). This was also reflected in this thesis (Chapter 2 and 3) in the treatment without both fishmeal and fish oil, where n-3 HUFA content of the experimental shrimp was only one-third of wild shrimp and one-half of cultured shrimp fed fish oil and fishmeal diets, whereas the n-6/n-3 showed remarkably high values caused by increased plant oil content of the diet. Although low total n-3 content, it was shown that the experimental shrimps contained quantifiable amounts of n-3 HUFA which could only have been sourced from the natural food web in the mesocosm into their body composition.

GENERAL DISCUSSION 125
6
Apparently, in natural systems (wild shrimp or shrimp in extensive systems), shrimp get nearly all their HUFA from the natural diet. Which types of natural food contribute most to the HUFA intake is not known. It would be interesting to investigate the HUFA content in natural food items found in the wild and preferred diet choice of those items by shrimp.
In order to improve both environmental and economic sustainability, fishmeal and fish oil need to be replaced by sustainable alternatives, yet avoiding production of shrimp that are low in n-3 fatty acids. Perhaps the most practical way to deal with this issue, is to just accept the losses in n-3 fatty acids. N-3 HUFA contents of shrimp (0.24 g EPA + DHA per cooked serving of 85 g, cultured fed traditional diets) cannot compete with those found in fatty fish, such as salmon or trout (1.83 g EPA + DHA per cooked serving of 85 g, cultured fed traditional diets) (DHHS, 2019, Sprague et al., 2016, Li et al., 2011), which therefore make for a better nutritional option for n-3 requirements in human diets (Gebauer et al., 2006). Shrimp contain high protein and low fat contents, but the fat is of very high quality. When accepting this premise, focus can be shifted to shrimp as a source of protein instead, similarly to the meat industry, since cultivated shrimp was shown a source of high-quality protein (Moreno‐Arias et al., 2017). In this way, fish oil and fishmeal can be solely reserved for dietary inclusion in aquaculture species know and purchased specifically for their high HUFA content, such as salmon and trout, in order to meet customers’ expectations and maintaining product quality.
Much is expected from biotechnology developments, where HUFA is being produced using bioreactors growing microalgae or Thraustochytrids. Although this is already common practice, production costs are still too high to be used in animal feed. For now, these high quality HUFA oils are being used in supplemental capsules and infant milk formulas (Finco et al., 2017). Special care towards product stability should be given, since HUFA in form of supplements are often subject to oxidation and do not contain the amount of HUFA as stated on the package (Albert et al., 2015). Also, evidence exists that HUFA from supplements are not absorbed by the body in the same rate as HUFA in form of real food such as fish filet. For example, twice as much fish oil (3.0 g) needs to be taken in form of capsules in order to reach similar levels of blood plasma HUFA compared fish oil obtained by eating fish filet (1.2 g) (Elvevoll et al., 2006). Despite these challenges, biotechnology developments should be further encouraged in order to produce more n-3 HUFA oils that can become available for animal feed and in special aquafeed in the near future.
6.8 Aquaculture ecologyThe initial hypothesis of this thesis was that by alterations in stoichiometry with special focus on increasing the C:P ratio by lowering the total P-input, an increase in n-3 HUFA by algae could be realised. Following the HUFA bottom-up hypothesis as described in the general introduction, this would stimulate shrimp to eat more natural food. Unfortunately,
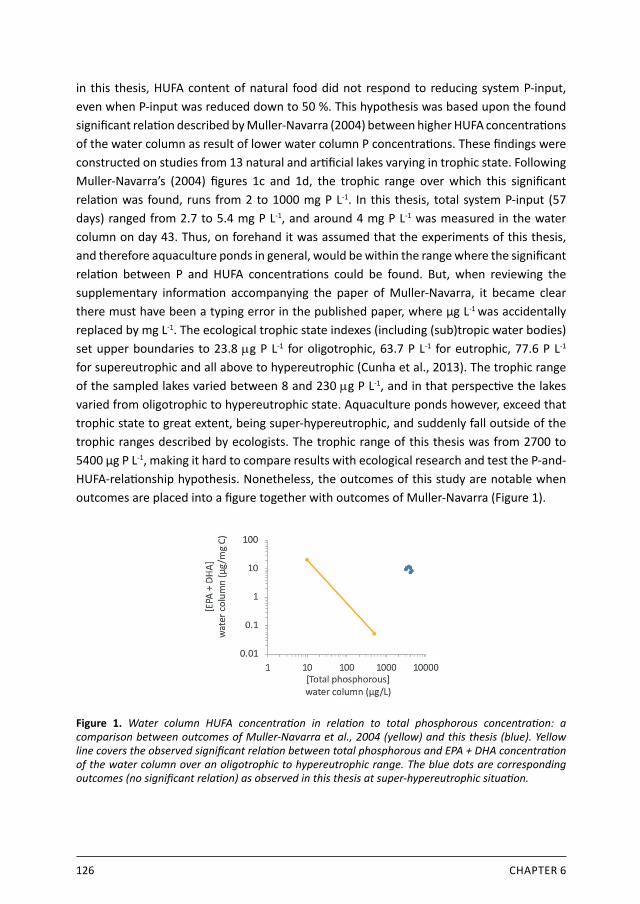
126 CHAPTER 6
in this thesis, HUFA content of natural food did not respond to reducing system P-input, even when P-input was reduced down to 50 %. This hypothesis was based upon the found signifi cant relati on described by Muller-Navarra (2004) between higher HUFA concentrati ons of the water column as result of lower water column P concentrati ons. These fi ndings were constructed on studies from 13 natural and arti fi cial lakes varying in trophic state. Following Muller-Navarra’s (2004) fi gures 1c and 1d, the trophic range over which this signifi cant relati on was found, runs from 2 to 1000 mg P L-1. In this thesis, total system P-input (57 days) ranged from 2.7 to 5.4 mg P L-1, and around 4 mg P L-1 was measured in the water column on day 43. Thus, on forehand it was assumed that the experiments of this thesis, and therefore aquaculture ponds in general, would be within the range where the signifi cant relati on between P and HUFA concentrati ons could be found. But, when reviewing the supplementary informati on accompanying the paper of Muller-Navarra, it became clear there must have been a typing error in the published paper, where µg L-1 was accidentally replaced by mg L-1. The ecological trophic state indexes (including (sub)tropic water bodies) set upper boundaries to 23.8 mg P L-1 for oligotrophic, 63.7 P L-1 for eutrophic, 77.6 P L-1
for supereutrophic and all above to hypereutrophic (Cunha et al., 2013). The trophic range of the sampled lakes varied between 8 and 230 mg P L-1, and in that perspecti ve the lakes varied from oligotrophic to hypereutrophic state. Aquaculture ponds however, exceed that trophic state to great extent, being super-hypereutrophic, and suddenly fall outside of the trophic ranges described by ecologists. The trophic range of this thesis was from 2700 to 5400 µg P L-1, making it hard to compare results with ecological research and test the P-and-HUFA-relati onship hypothesis. Nonetheless, the outcomes of this study are notable when outcomes are placed into a fi gure together with outcomes of Muller-Navarra (Figure 1).
Figure 1. Water column HUFA concentrati on in relati on to total phosphorous concentrati on: a comparison between outcomes of Muller-Navarra et al., 2004 (yellow) and this thesis (blue). Yellow line covers the observed signifi cant relati on between total phosphorous and EPA + DHA concentrati on of the water column over an oligotrophic to hypereutrophic range. The blue dots are corresponding outcomes (no signifi cant relati on) as observed in this thesis at super-hypereutrophic situati on.
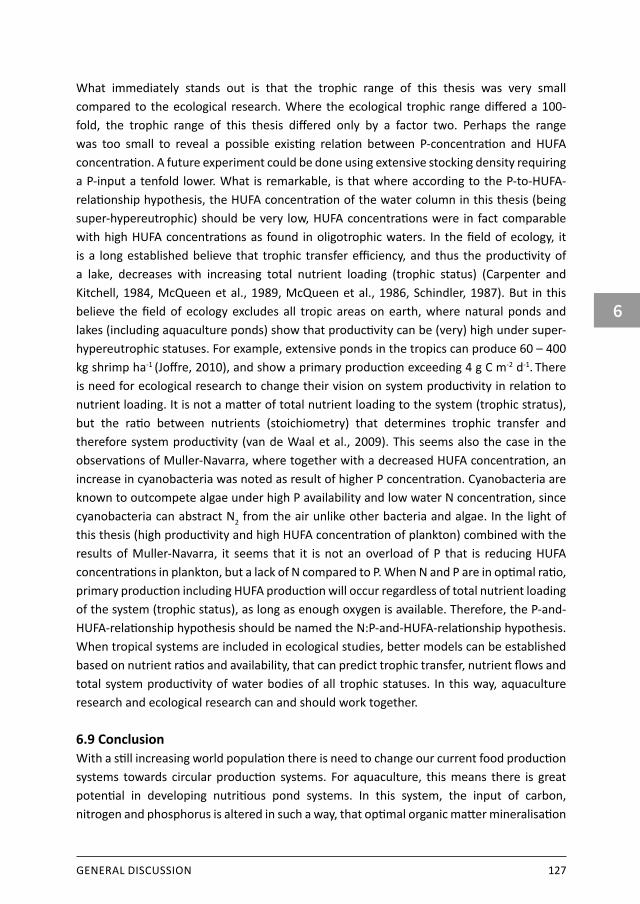
GENERAL DISCUSSION 127
6
What immediately stands out is that the trophic range of this thesis was very small compared to the ecological research. Where the ecological trophic range diff ered a 100-fold, the trophic range of this thesis diff ered only by a factor two. Perhaps the range was too small to reveal a possible existi ng relati on between P-concentrati on and HUFA concentrati on. A future experiment could be done using extensive stocking density requiring a P-input a tenfold lower. What is remarkable, is that where according to the P-to-HUFA-relati onship hypothesis, the HUFA concentrati on of the water column in this thesis (being super-hypereutrophic) should be very low, HUFA concentrati ons were in fact comparable with high HUFA concentrati ons as found in oligotrophic waters. In the fi eld of ecology, it is a long established believe that trophic transfer effi ciency, and thus the producti vity of a lake, decreases with increasing total nutrient loading (trophic status) (Carpenter and Kitchell, 1984, McQueen et al., 1989, McQueen et al., 1986, Schindler, 1987). But in this believe the fi eld of ecology excludes all tropic areas on earth, where natural ponds and lakes (including aquaculture ponds) show that producti vity can be (very) high under super-hypereutrophic statuses. For example, extensive ponds in the tropics can produce 60 – 400 kg shrimp ha-1 (Joff re, 2010), and show a primary producti on exceeding 4 g C m-2 d-1. There is need for ecological research to change their vision on system producti vity in relati on to nutrient loading. It is not a matt er of total nutrient loading to the system (trophic stratus), but the rati o between nutrients (stoichiometry) that determines trophic transfer and therefore system producti vity (van de Waal et al., 2009). This seems also the case in the observati ons of Muller-Navarra, where together with a decreased HUFA concentrati on, an increase in cyanobacteria was noted as result of higher P concentrati on. Cyanobacteria are known to outcompete algae under high P availability and low water N concentrati on, since cyanobacteria can abstract N2 from the air unlike other bacteria and algae. In the light of this thesis (high producti vity and high HUFA concentrati on of plankton) combined with the results of Muller-Navarra, it seems that it is not an overload of P that is reducing HUFA concentrati ons in plankton, but a lack of N compared to P. When N and P are in opti mal rati o, primary producti on including HUFA producti on will occur regardless of total nutrient loading of the system (trophic status), as long as enough oxygen is available. Therefore, the P-and-HUFA-relati onship hypothesis should be named the N:P-and-HUFA-relati onship hypothesis. When tropical systems are included in ecological studies, bett er models can be established based on nutrient rati os and availability, that can predict trophic transfer, nutrient fl ows and total system producti vity of water bodies of all trophic statuses. In this way, aquaculture research and ecological research can and should work together.
6.9 ConclusionWith a sti ll increasing world populati on there is need to change our current food producti on systems towards circular producti on systems. For aquaculture, this means there is great potenti al in developing nutriti ous pond systems. In this system, the input of carbon, nitrogen and phosphorus is altered in such a way, that opti mal organic matt er mineralisati on

128 CHAPTER 6
is realised in the pond so that water quality is naturally maintained and waste and losses are quickly turned over into natural food for the shrimp or fish. This thesis showed it is possible to replace limited resources and nutrients with simple fertilizers and still realize good shrimp production. This is achieved by stimulating natural food production, containing protein and de novo produced HUFA. Unfortunately, the great majority of these nutrients remain in the food web without being eaten by the shrimp. Finding ways to lead these nutrients, specifically HUFA, through the food web into the shrimp is the next step, of which partitioned aquaculture systems is a promising possibility to explore. Climate change is going to affect aquaculture production and can be an extra challenge in order to further develop the nutritious pond concept, especially concerning de novo HUFA production in de pond. Nevertheless, the nutritious pond concept forms a crucial step towards a more sustainable aquaculture, independent of capture fisheries.

GENERAL DISCUSSION 129
6


References

132 REFERENCES
ReferencesADLER-NISSEN, J. 1986. Enzymic hydrolysis of food proteins, Elsevier applied science publishers.AHMED, N., THOMPSON, S. & GLASER, M. 2019. Global aquaculture productivity, environmental sustainability, and climate change adaptability. Environmental management, 63, 159-172.ALBERT, B. B., DERRAIK, J. G., CAMERON-SMITH, D., HOFMAN, P. L., TUMANOV, S., VILLAS-BOAS, S. G., GARG, M. L. & CUTFIELD, W. S. 2015. Fish oil supplements in New Zealand are highly oxidised and do not meet label content of n-3 PUFA. Scientific reports, 5, 7928.ALONSO-RODRıGUEZ, R. & PÁEZ-OSUNA, F. 2003. Nutrients, phytoplankton and harmful algal blooms in shrimp ponds: a review with special reference to the situation in the Gulf of California. Aquaculture, 219, 317-336.AMIRI-JAMI, M., LAPOINTE, G. & GRIFFITHS, M. W. 2014. Engineering of EPA/DHA omega-3 fatty acid production by Lactococcus lactis subsp. cremoris MG1363. Applied microbiology and biotechnology, 98, 3071-3080.ANACLETO, P., MAULVAULT, A. L., BANDARRA, N. M., REPOLHO, T., NUNES, M. L., ROSA, R. & MARQUES, A. 2014. Effect of warming on protein, glycogen and fatty acid content of native and invasive clams. Food research international, 64, 439-445.ANAND, P., PANIGRAHI, A., RAVICHANDRAN, P., KUMAR, S., DAYAL, J. S., DEO, A., PONNIAH, A. & PILLAI, S. 2015. Growth performance of black tiger shrimp (Penaeus monodon) in substrate based zerowater exchange system.ANDERSON, R. K., PARKER, P. L. & LAWRENCE, A. 1987. A 13C/12C Tracer Study of the Utilization of Presented Feed by a Commercially Important Shrimp Penaeus vannamei in a Pond Growout System1. Journal of the World Aquaculture Society, 18, 148-155.ANH, N. T. N., VAN HOA, N., VAN STAPPEN, G. & SORGELOOS, P. 2009. Effect of different supplemental feeds on proximate composition and Artemia biomass production in salt ponds. Aquaculture, 286, 217-225.ANH, P. T., KROEZE, C., BUSH, S. R. & MOL, A. P. 2010. Water pollution by intensive brackish shrimp farming in south-east Vietnam: Causes and options for control. Agricultural Water Management, 97, 872-882.ASADUZZAMAN, M., RAHMAN, M. M., AZIM, M. E., ISLAM, M. A., WAHAB, M., VERDEGEM, M. & VERRETH, J. 2010. Effects of C/N ratio and substrate addition on natural food communities in freshwater prawn monoculture ponds. Aquaculture, 306, 127-136.ASADUZZAMAN, M., WAHAB, M., VERDEGEM, M., HUQUE, S., SALAM, M. & AZIM, M. 2008. C/N ratio control and substrate addition for periphyton development jointly enhance freshwater prawn Macrobrachium rosenbergii production in ponds. Aquaculture, 280, 117-123.AUSTIN, A., RIDLEY-THOMAS, C., LUCEY, W. & AUSTIN, D. 1990. Effects of nutrient enrichment on marine periphyton: implications for abalone culture. Botanica marina, 33, 235-240.AVNIMELECH, Y. 1995. Sludge accumulation in the shrimp pond bottom: significance and management. Asian Shrimp News, 2, 2.AVNIMELECH, Y. 2009. Biofloc technology. A practical guide book. The World Aquaculture Society, Baton Rouge.
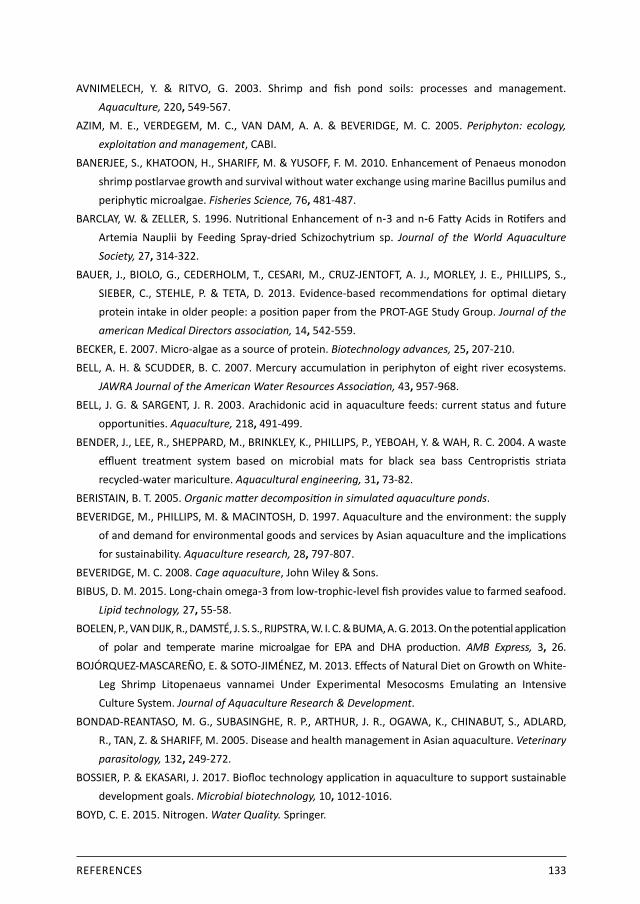
REFERENCES 133
AVNIMELECH, Y. & RITVO, G. 2003. Shrimp and fish pond soils: processes and management. Aquaculture, 220, 549-567.AZIM, M. E., VERDEGEM, M. C., VAN DAM, A. A. & BEVERIDGE, M. C. 2005. Periphyton: ecology, exploitation and management, CABI.BANERJEE, S., KHATOON, H., SHARIFF, M. & YUSOFF, F. M. 2010. Enhancement of Penaeus monodon shrimp postlarvae growth and survival without water exchange using marine Bacillus pumilus and periphytic microalgae. Fisheries Science, 76, 481-487.BARCLAY, W. & ZELLER, S. 1996. Nutritional Enhancement of n‐3 and n‐6 Fatty Acids in Rotifers and Artemia Nauplii by Feeding Spray‐dried Schizochytrium sp. Journal of the World Aquaculture Society, 27, 314-322.BAUER, J., BIOLO, G., CEDERHOLM, T., CESARI, M., CRUZ-JENTOFT, A. J., MORLEY, J. E., PHILLIPS, S., SIEBER, C., STEHLE, P. & TETA, D. 2013. Evidence-based recommendations for optimal dietary protein intake in older people: a position paper from the PROT-AGE Study Group. Journal of the american Medical Directors association, 14, 542-559.BECKER, E. 2007. Micro-algae as a source of protein. Biotechnology advances, 25, 207-210.BELL, A. H. & SCUDDER, B. C. 2007. Mercury accumulation in periphyton of eight river ecosystems. JAWRA Journal of the American Water Resources Association, 43, 957-968.BELL, J. G. & SARGENT, J. R. 2003. Arachidonic acid in aquaculture feeds: current status and future opportunities. Aquaculture, 218, 491-499.BENDER, J., LEE, R., SHEPPARD, M., BRINKLEY, K., PHILLIPS, P., YEBOAH, Y. & WAH, R. C. 2004. A waste effluent treatment system based on microbial mats for black sea bass Centropristis striata recycled-water mariculture. Aquacultural engineering, 31, 73-82.BERISTAIN, B. T. 2005. Organic matter decomposition in simulated aquaculture ponds.BEVERIDGE, M., PHILLIPS, M. & MACINTOSH, D. 1997. Aquaculture and the environment: the supply of and demand for environmental goods and services by Asian aquaculture and the implications for sustainability. Aquaculture research, 28, 797-807.BEVERIDGE, M. C. 2008. Cage aquaculture, John Wiley & Sons.BIBUS, D. M. 2015. Long‐chain omega‐3 from low‐trophic‐level fish provides value to farmed seafood. Lipid technology, 27, 55-58.BOELEN, P., VAN DIJK, R., DAMSTÉ, J. S. S., RIJPSTRA, W. I. C. & BUMA, A. G. 2013. On the potential application of polar and temperate marine microalgae for EPA and DHA production. AMB Express, 3, 26.BOJÓRQUEZ-MASCAREÑO, E. & SOTO-JIMÉNEZ, M. 2013. Effects of Natural Diet on Growth on White- Leg Shrimp Litopenaeus vannamei Under Experimental Mesocosms Emulating an Intensive Culture System. Journal of Aquaculture Research & Development.BONDAD-REANTASO, M. G., SUBASINGHE, R. P., ARTHUR, J. R., OGAWA, K., CHINABUT, S., ADLARD, R., TAN, Z. & SHARIFF, M. 2005. Disease and health management in Asian aquaculture. Veterinary parasitology, 132, 249-272.BOSSIER, P. & EKASARI, J. 2017. Biofloc technology application in aquaculture to support sustainable development goals. Microbial biotechnology, 10, 1012-1016.BOYD, C. E. 2015. Nitrogen. Water Quality. Springer.
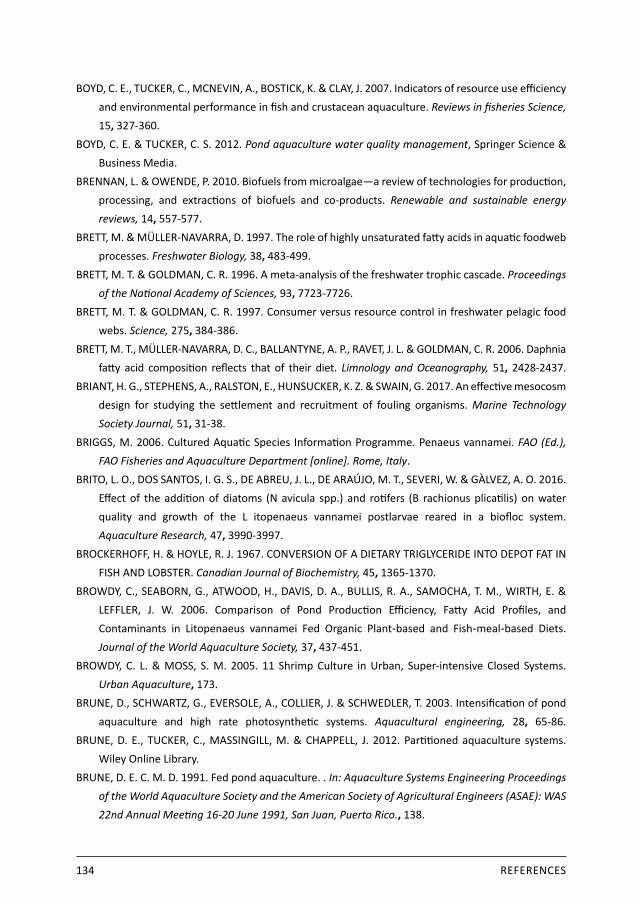
134 REFERENCES
BOYD, C. E., TUCKER, C., MCNEVIN, A., BOSTICK, K. & CLAY, J. 2007. Indicators of resource use efficiency and environmental performance in fish and crustacean aquaculture. Reviews in fisheries Science, 15, 327-360.BOYD, C. E. & TUCKER, C. S. 2012. Pond aquaculture water quality management, Springer Science & Business Media.BRENNAN, L. & OWENDE, P. 2010. Biofuels from microalgae—a review of technologies for production, processing, and extractions of biofuels and co-products. Renewable and sustainable energy reviews, 14, 557-577.BRETT, M. & MÜLLER-NAVARRA, D. 1997. The role of highly unsaturated fatty acids in aquatic foodweb processes. Freshwater Biology, 38, 483-499.BRETT, M. T. & GOLDMAN, C. R. 1996. A meta-analysis of the freshwater trophic cascade. Proceedings of the National Academy of Sciences, 93, 7723-7726.BRETT, M. T. & GOLDMAN, C. R. 1997. Consumer versus resource control in freshwater pelagic food webs. Science, 275, 384-386.BRETT, M. T., MÜLLER-NAVARRA, D. C., BALLANTYNE, A. P., RAVET, J. L. & GOLDMAN, C. R. 2006. Daphnia fatty acid composition reflects that of their diet. Limnology and Oceanography, 51, 2428-2437.BRIANT, H. G., STEPHENS, A., RALSTON, E., HUNSUCKER, K. Z. & SWAIN, G. 2017. An effective mesocosm design for studying the settlement and recruitment of fouling organisms. Marine Technology Society Journal, 51, 31-38.BRIGGS, M. 2006. Cultured Aquatic Species Information Programme. Penaeus vannamei. FAO (Ed.), FAO Fisheries and Aquaculture Department [online]. Rome, Italy.BRITO, L. O., DOS SANTOS, I. G. S., DE ABREU, J. L., DE ARAÚJO, M. T., SEVERI, W. & GÀLVEZ, A. O. 2016. Effect of the addition of diatoms (N avicula spp.) and rotifers (B rachionus plicatilis) on water quality and growth of the L itopenaeus vannamei postlarvae reared in a biofloc system. Aquaculture Research, 47, 3990-3997.BROCKERHOFF, H. & HOYLE, R. J. 1967. CONVERSION OF A DIETARY TRIGLYCERIDE INTO DEPOT FAT IN FISH AND LOBSTER. Canadian Journal of Biochemistry, 45, 1365-1370.BROWDY, C., SEABORN, G., ATWOOD, H., DAVIS, D. A., BULLIS, R. A., SAMOCHA, T. M., WIRTH, E. & LEFFLER, J. W. 2006. Comparison of Pond Production Efficiency, Fatty Acid Profiles, and Contaminants in Litopenaeus vannamei Fed Organic Plant‐based and Fish‐meal‐based Diets. Journal of the World Aquaculture Society, 37, 437-451.BROWDY, C. L. & MOSS, S. M. 2005. 11 Shrimp Culture in Urban, Super-intensive Closed Systems. Urban Aquaculture, 173.BRUNE, D., SCHWARTZ, G., EVERSOLE, A., COLLIER, J. & SCHWEDLER, T. 2003. Intensification of pond aquaculture and high rate photosynthetic systems. Aquacultural engineering, 28, 65-86.BRUNE, D. E., TUCKER, C., MASSINGILL, M. & CHAPPELL, J. 2012. Partitioned aquaculture systems. Wiley Online Library.BRUNE, D. E. C. M. D. 1991. Fed pond aquaculture. . In: Aquaculture Systems Engineering Proceedings of the World Aquaculture Society and the American Society of Agricultural Engineers (ASAE): WAS 22nd Annual Meeting 16-20 June 1991, San Juan, Puerto Rico., 138.
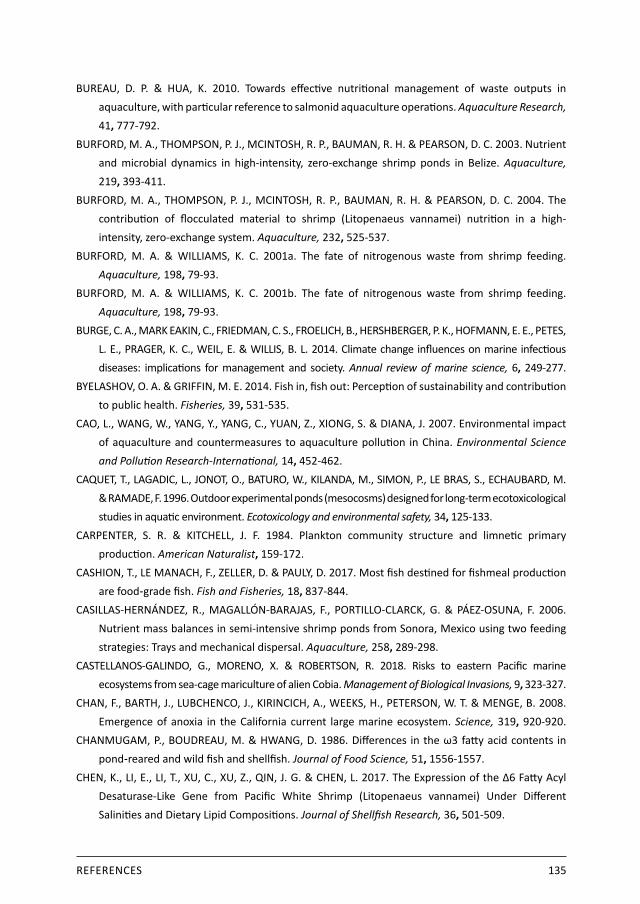
REFERENCES 135
BUREAU, D. P. & HUA, K. 2010. Towards effective nutritional management of waste outputs in aquaculture, with particular reference to salmonid aquaculture operations. Aquaculture Research, 41, 777-792.BURFORD, M. A., THOMPSON, P. J., MCINTOSH, R. P., BAUMAN, R. H. & PEARSON, D. C. 2003. Nutrient and microbial dynamics in high-intensity, zero-exchange shrimp ponds in Belize. Aquaculture, 219, 393-411.BURFORD, M. A., THOMPSON, P. J., MCINTOSH, R. P., BAUMAN, R. H. & PEARSON, D. C. 2004. The contribution of flocculated material to shrimp (Litopenaeus vannamei) nutrition in a high- intensity, zero-exchange system. Aquaculture, 232, 525-537.BURFORD, M. A. & WILLIAMS, K. C. 2001a. The fate of nitrogenous waste from shrimp feeding. Aquaculture, 198, 79-93.BURFORD, M. A. & WILLIAMS, K. C. 2001b. The fate of nitrogenous waste from shrimp feeding. Aquaculture, 198, 79-93.BURGE, C. A., MARK EAKIN, C., FRIEDMAN, C. S., FROELICH, B., HERSHBERGER, P. K., HOFMANN, E. E., PETES, L. E., PRAGER, K. C., WEIL, E. & WILLIS, B. L. 2014. Climate change influences on marine infectious diseases: implications for management and society. Annual review of marine science, 6, 249-277.BYELASHOV, O. A. & GRIFFIN, M. E. 2014. Fish in, fish out: Perception of sustainability and contribution to public health. Fisheries, 39, 531-535.CAO, L., WANG, W., YANG, Y., YANG, C., YUAN, Z., XIONG, S. & DIANA, J. 2007. Environmental impact of aquaculture and countermeasures to aquaculture pollution in China. Environmental Science and Pollution Research-International, 14, 452-462.CAQUET, T., LAGADIC, L., JONOT, O., BATURO, W., KILANDA, M., SIMON, P., LE BRAS, S., ECHAUBARD, M. & RAMADE, F. 1996. Outdoor experimental ponds (mesocosms) designed for long-term ecotoxicological studies in aquatic environment. Ecotoxicology and environmental safety, 34, 125-133.CARPENTER, S. R. & KITCHELL, J. F. 1984. Plankton community structure and limnetic primary production. American Naturalist, 159-172.CASHION, T., LE MANACH, F., ZELLER, D. & PAULY, D. 2017. Most fish destined for fishmeal production are food‐grade fish. Fish and Fisheries, 18, 837-844.CASILLAS-HERNÁNDEZ, R., MAGALLÓN-BARAJAS, F., PORTILLO-CLARCK, G. & PÁEZ-OSUNA, F. 2006. Nutrient mass balances in semi-intensive shrimp ponds from Sonora, Mexico using two feeding strategies: Trays and mechanical dispersal. Aquaculture, 258, 289-298.CASTELLANOS-GALINDO, G., MORENO, X. & ROBERTSON, R. 2018. Risks to eastern Pacific marine ecosystems from sea-cage mariculture of alien Cobia. Management of Biological Invasions, 9, 323-327.CHAN, F., BARTH, J., LUBCHENCO, J., KIRINCICH, A., WEEKS, H., PETERSON, W. T. & MENGE, B. 2008. Emergence of anoxia in the California current large marine ecosystem. Science, 319, 920-920.CHANMUGAM, P., BOUDREAU, M. & HWANG, D. 1986. Differences in the ω3 fatty acid contents in pond‐reared and wild fish and shellfish. Journal of Food Science, 51, 1556-1557.CHEN, K., LI, E., LI, T., XU, C., XU, Z., QIN, J. G. & CHEN, L. 2017. The Expression of the Δ6 Fatty Acyl Desaturase-Like Gene from Pacific White Shrimp (Litopenaeus vannamei) Under Different Salinities and Dietary Lipid Compositions. Journal of Shellfish Research, 36, 501-509.
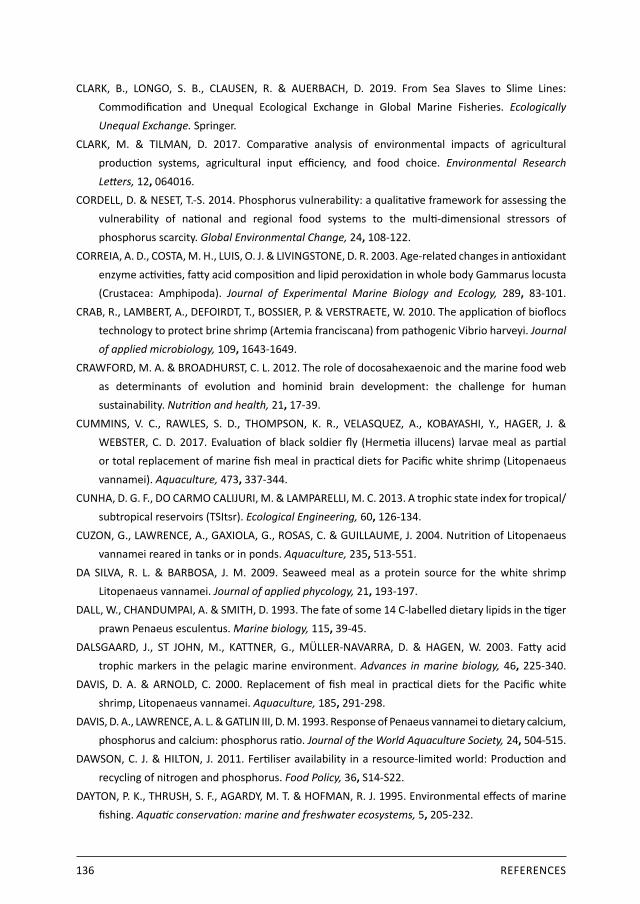
136 REFERENCES
CLARK, B., LONGO, S. B., CLAUSEN, R. & AUERBACH, D. 2019. From Sea Slaves to Slime Lines: Commodification and Unequal Ecological Exchange in Global Marine Fisheries. Ecologically Unequal Exchange. Springer.CLARK, M. & TILMAN, D. 2017. Comparative analysis of environmental impacts of agricultural production systems, agricultural input efficiency, and food choice. Environmental Research Letters, 12, 064016.CORDELL, D. & NESET, T.-S. 2014. Phosphorus vulnerability: a qualitative framework for assessing the vulnerability of national and regional food systems to the multi-dimensional stressors of phosphorus scarcity. Global Environmental Change, 24, 108-122.CORREIA, A. D., COSTA, M. H., LUIS, O. J. & LIVINGSTONE, D. R. 2003. Age-related changes in antioxidant enzyme activities, fatty acid composition and lipid peroxidation in whole body Gammarus locusta (Crustacea: Amphipoda). Journal of Experimental Marine Biology and Ecology, 289, 83-101.CRAB, R., LAMBERT, A., DEFOIRDT, T., BOSSIER, P. & VERSTRAETE, W. 2010. The application of bioflocs technology to protect brine shrimp (Artemia franciscana) from pathogenic Vibrio harveyi. Journal of applied microbiology, 109, 1643-1649.CRAWFORD, M. A. & BROADHURST, C. L. 2012. The role of docosahexaenoic and the marine food web as determinants of evolution and hominid brain development: the challenge for human sustainability. Nutrition and health, 21, 17-39.CUMMINS, V. C., RAWLES, S. D., THOMPSON, K. R., VELASQUEZ, A., KOBAYASHI, Y., HAGER, J. & WEBSTER, C. D. 2017. Evaluation of black soldier fly (Hermetia illucens) larvae meal as partial or total replacement of marine fish meal in practical diets for Pacific white shrimp (Litopenaeus vannamei). Aquaculture, 473, 337-344.CUNHA, D. G. F., DO CARMO CALIJURI, M. & LAMPARELLI, M. C. 2013. A trophic state index for tropical/ subtropical reservoirs (TSItsr). Ecological Engineering, 60, 126-134.CUZON, G., LAWRENCE, A., GAXIOLA, G., ROSAS, C. & GUILLAUME, J. 2004. Nutrition of Litopenaeus vannamei reared in tanks or in ponds. Aquaculture, 235, 513-551.DA SILVA, R. L. & BARBOSA, J. M. 2009. Seaweed meal as a protein source for the white shrimp Litopenaeus vannamei. Journal of applied phycology, 21, 193-197.DALL, W., CHANDUMPAI, A. & SMITH, D. 1993. The fate of some 14 C-labelled dietary lipids in the tiger prawn Penaeus esculentus. Marine biology, 115, 39-45.DALSGAARD, J., ST JOHN, M., KATTNER, G., MÜLLER-NAVARRA, D. & HAGEN, W. 2003. Fatty acid trophic markers in the pelagic marine environment. Advances in marine biology, 46, 225-340.DAVIS, D. A. & ARNOLD, C. 2000. Replacement of fish meal in practical diets for the Pacific white shrimp, Litopenaeus vannamei. Aquaculture, 185, 291-298.DAVIS, D. A., LAWRENCE, A. L. & GATLIN III, D. M. 1993. Response of Penaeus vannamei to dietary calcium, phosphorus and calcium: phosphorus ratio. Journal of the World Aquaculture Society, 24, 504-515.DAWSON, C. J. & HILTON, J. 2011. Fertiliser availability in a resource-limited world: Production and recycling of nitrogen and phosphorus. Food Policy, 36, S14-S22.DAYTON, P. K., THRUSH, S. F., AGARDY, M. T. & HOFMAN, R. J. 1995. Environmental effects of marine fishing. Aquatic conservation: marine and freshwater ecosystems, 5, 205-232.
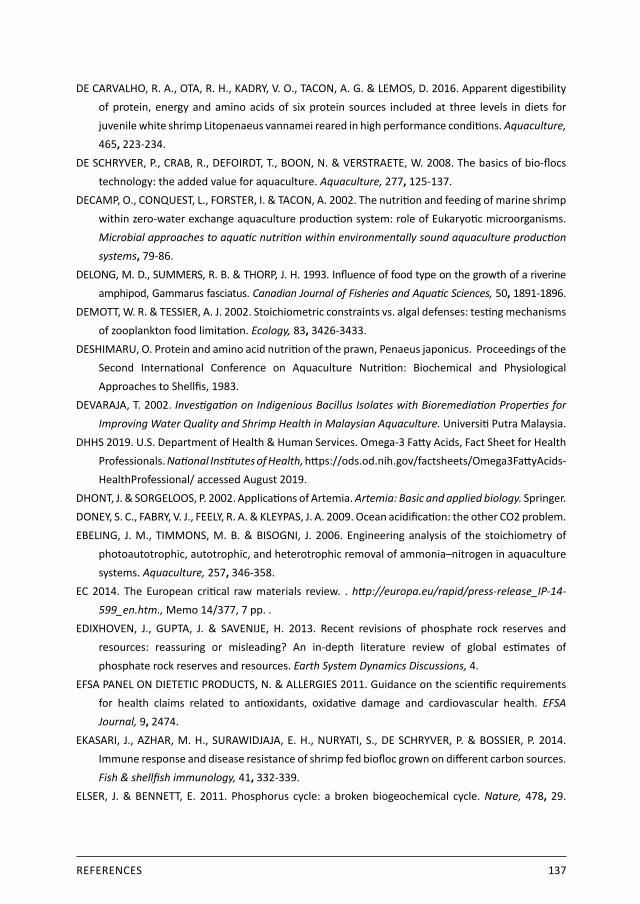
REFERENCES 137
DE CARVALHO, R. A., OTA, R. H., KADRY, V. O., TACON, A. G. & LEMOS, D. 2016. Apparent digestibility of protein, energy and amino acids of six protein sources included at three levels in diets for juvenile white shrimp Litopenaeus vannamei reared in high performance conditions. Aquaculture, 465, 223-234.DE SCHRYVER, P., CRAB, R., DEFOIRDT, T., BOON, N. & VERSTRAETE, W. 2008. The basics of bio-flocs technology: the added value for aquaculture. Aquaculture, 277, 125-137.DECAMP, O., CONQUEST, L., FORSTER, I. & TACON, A. 2002. The nutrition and feeding of marine shrimp within zero-water exchange aquaculture production system: role of Eukaryotic microorganisms. Microbial approaches to aquatic nutrition within environmentally sound aquaculture production systems, 79-86.DELONG, M. D., SUMMERS, R. B. & THORP, J. H. 1993. Influence of food type on the growth of a riverine amphipod, Gammarus fasciatus. Canadian Journal of Fisheries and Aquatic Sciences, 50, 1891-1896.DEMOTT, W. R. & TESSIER, A. J. 2002. Stoichiometric constraints vs. algal defenses: testing mechanisms of zooplankton food limitation. Ecology, 83, 3426-3433.DESHIMARU, O. Protein and amino acid nutrition of the prawn, Penaeus japonicus. Proceedings of the Second International Conference on Aquaculture Nutrition: Biochemical and Physiological Approaches to Shellfis, 1983.DEVARAJA, T. 2002. Investigation on Indigenious Bacillus Isolates with Bioremediation Properties for Improving Water Quality and Shrimp Health in Malaysian Aquaculture. Universiti Putra Malaysia.DHHS 2019. U.S. Department of Health & Human Services. Omega-3 Fatty Acids, Fact Sheet for Health Professionals. National Institutes of Health, https://ods.od.nih.gov/factsheets/Omega3FattyAcids- HealthProfessional/ accessed August 2019.DHONT, J. & SORGELOOS, P. 2002. Applications of Artemia. Artemia: Basic and applied biology. Springer.DONEY, S. C., FABRY, V. J., FEELY, R. A. & KLEYPAS, J. A. 2009. Ocean acidification: the other CO2 problem.EBELING, J. M., TIMMONS, M. B. & BISOGNI, J. 2006. Engineering analysis of the stoichiometry of photoautotrophic, autotrophic, and heterotrophic removal of ammonia–nitrogen in aquaculture systems. Aquaculture, 257, 346-358.EC 2014. The European critical raw materials review. . http://europa.eu/rapid/press-release_IP-14- 599_en.htm., Memo 14/377, 7 pp. .EDIXHOVEN, J., GUPTA, J. & SAVENIJE, H. 2013. Recent revisions of phosphate rock reserves and resources: reassuring or misleading? An in-depth literature review of global estimates of phosphate rock reserves and resources. Earth System Dynamics Discussions, 4.EFSA PANEL ON DIETETIC PRODUCTS, N. & ALLERGIES 2011. Guidance on the scientific requirements for health claims related to antioxidants, oxidative damage and cardiovascular health. EFSA Journal, 9, 2474.EKASARI, J., AZHAR, M. H., SURAWIDJAJA, E. H., NURYATI, S., DE SCHRYVER, P. & BOSSIER, P. 2014. Immune response and disease resistance of shrimp fed biofloc grown on different carbon sources. Fish & shellfish immunology, 41, 332-339.ELSER, J. & BENNETT, E. 2011. Phosphorus cycle: a broken biogeochemical cycle. Nature, 478, 29.
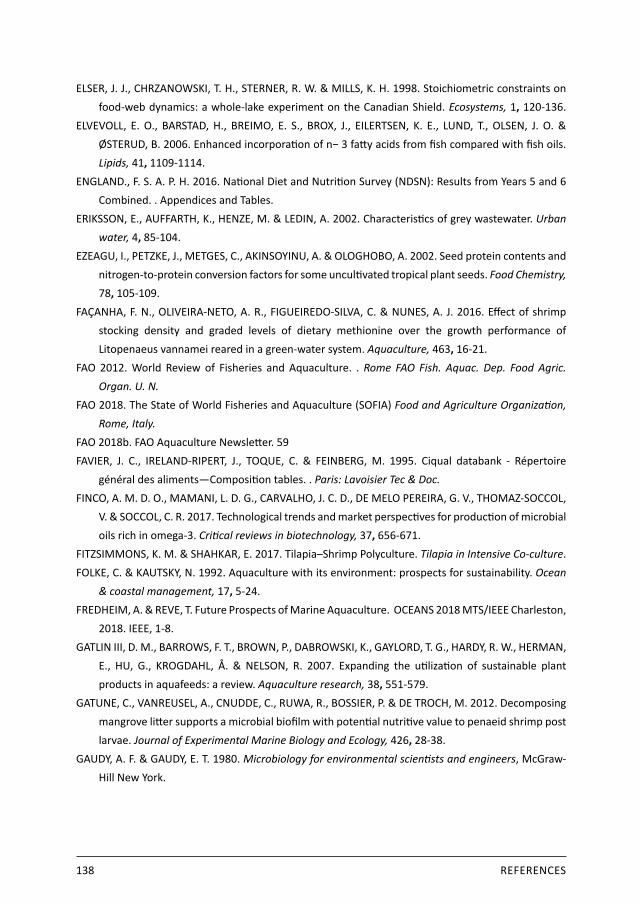
138 REFERENCES
ELSER, J. J., CHRZANOWSKI, T. H., STERNER, R. W. & MILLS, K. H. 1998. Stoichiometric constraints on food-web dynamics: a whole-lake experiment on the Canadian Shield. Ecosystems, 1, 120-136.ELVEVOLL, E. O., BARSTAD, H., BREIMO, E. S., BROX, J., EILERTSEN, K. E., LUND, T., OLSEN, J. O. & ØSTERUD, B. 2006. Enhanced incorporation of n− 3 fatty acids from fish compared with fish oils. Lipids, 41, 1109-1114.ENGLAND., F. S. A. P. H. 2016. National Diet and Nutrition Survey (NDSN): Results from Years 5 and 6 Combined. . Appendices and Tables.ERIKSSON, E., AUFFARTH, K., HENZE, M. & LEDIN, A. 2002. Characteristics of grey wastewater. Urban water, 4, 85-104.EZEAGU, I., PETZKE, J., METGES, C., AKINSOYINU, A. & OLOGHOBO, A. 2002. Seed protein contents and nitrogen-to-protein conversion factors for some uncultivated tropical plant seeds. Food Chemistry, 78, 105-109.FAÇANHA, F. N., OLIVEIRA-NETO, A. R., FIGUEIREDO-SILVA, C. & NUNES, A. J. 2016. Effect of shrimp stocking density and graded levels of dietary methionine over the growth performance of Litopenaeus vannamei reared in a green-water system. Aquaculture, 463, 16-21.FAO 2012. World Review of Fisheries and Aquaculture. . Rome FAO Fish. Aquac. Dep. Food Agric. Organ. U. N.FAO 2018. The State of World Fisheries and Aquaculture (SOFIA) Food and Agriculture Organization, Rome, Italy.FAO 2018b. FAO Aquaculture Newsletter. 59 FAVIER, J. C., IRELAND-RIPERT, J., TOQUE, C. & FEINBERG, M. 1995. Ciqual databank - Répertoire général des aliments—Composition tables. . Paris: Lavoisier Tec & Doc.FINCO, A. M. D. O., MAMANI, L. D. G., CARVALHO, J. C. D., DE MELO PEREIRA, G. V., THOMAZ-SOCCOL, V. & SOCCOL, C. R. 2017. Technological trends and market perspectives for production of microbial oils rich in omega-3. Critical reviews in biotechnology, 37, 656-671.FITZSIMMONS, K. M. & SHAHKAR, E. 2017. Tilapia–Shrimp Polyculture. Tilapia in Intensive Co-culture.FOLKE, C. & KAUTSKY, N. 1992. Aquaculture with its environment: prospects for sustainability. Ocean & coastal management, 17, 5-24.FREDHEIM, A. & REVE, T. Future Prospects of Marine Aquaculture. OCEANS 2018 MTS/IEEE Charleston, 2018. IEEE, 1-8.GATLIN III, D. M., BARROWS, F. T., BROWN, P., DABROWSKI, K., GAYLORD, T. G., HARDY, R. W., HERMAN, E., HU, G., KROGDAHL, Å. & NELSON, R. 2007. Expanding the utilization of sustainable plant products in aquafeeds: a review. Aquaculture research, 38, 551-579.GATUNE, C., VANREUSEL, A., CNUDDE, C., RUWA, R., BOSSIER, P. & DE TROCH, M. 2012. Decomposing mangrove litter supports a microbial biofilm with potential nutritive value to penaeid shrimp post larvae. Journal of Experimental Marine Biology and Ecology, 426, 28-38.GAUDY, A. F. & GAUDY, E. T. 1980. Microbiology for environmental scientists and engineers, McGraw- Hill New York.

REFERENCES 139
GEBAUER, S. K., PSOTA, T. L., HARRIS, W. S. & KRIS-ETHERTON, P. M. 2006. n− 3 fatty acid dietary recommendations and food sources to achieve essentiality and cardiovascular benefits. The American journal of clinical nutrition, 83, 1526S-1535S.GELABERT, R. & PACHECO, A. 2011. Selectivity of particle size by the shrimp Litopenaeus vannamei (Boone, 1931) larvae. Aquaculture nutrition, 17, 244-247.GLADYSHEV, M., GLUSHCHENKO, L., MAKHUTOVA, O., RUDCHENKO, A., SHULEPINA, S., DUBOVSKAYA, O., ZUEV, I., KOLMAKOV, V. & SUSHCHIK, N. 2018. Comparative Analysis of Content of Omega-3 Polyunsaturated Fatty Acids in Food and Muscle Tissue of Fish from Aquaculture and Natural Habitats. Contemporary problems of ecology, 11, 297-308.GLADYSHEV, M., SUSHCHIK, N., SHULEPINA, S., AGEEV, A., DUBOVSKAYA, O., KOLMAKOVA, A. & KALACHOVA, G. 2016. Secondary production of highly unsaturated fatty acids by zoobenthos across rivers contrasting in temperature. River research and applications, 32, 1252-1263.GLADYSHEV, M. I., SUSHCHIK, N. N., ANISHCHENKO, O. V., MAKHUTOVA, O. N., KOLMAKOV, V. I., KALACHOVA, G. S., KOLMAKOVA, A. A. & DUBOVSKAYA, O. P. 2011. Efficiency of transfer of essential polyunsaturated fatty acids versus organic carbon from producers to consumers in a eutrophic reservoir. Oecologia, 165, 521-531.GLADYSHEV, M. I., SUSHCHIK, N. N. & MAKHUTOVA, O. N. 2013. Production of EPA and DHA in aquatic ecosystems and their transfer to the land. Prostaglandins & Other Lipid Mediators, 107, 117-126.GLENCROSS, B., HAWKINS, W. & CURNOW, J. 2003b. Restoration of the fatty acid composition of red seabream (Pagrus auratus) using a fish oil finishing diet after grow‐out on plant oil based diets. Aquaculture Nutrition, 9, 409-418.GLENCROSS, B. & SMITH, D. 1999. The dietary linoleic and linolenic fatty acids requirements of the prawn Penaeus monodon. Aquaculture Nutrition, 5, 53-64.GLENCROSS, B. & SMITH, D. 2001. A study of the arachidonic acid requirements of the giant tiger prawn, Penaues monodon. Aquaculture Nutrition, 7, 59-69.GLENCROSS, B. & SMITH, D. 2001a. Optimizing the essential fatty acids, eicosapentaenoic and docosahexaenoic acid, in the diet of the prawn, Penaeus monodon. Aquaculture Nutrition, 7, 101-112.GLENCROSS, B., SMITH, D., THOMAS, M. & WILLIAMS, K. 2002a. The effect of dietary n‐3 and n‐6 fatty acid balance on the growth of the prawn Penaeus monodon. Aquaculture Nutrition, 8, 43-51.GLENCROSS, B., SMITH, D., THOMAS, M. & WILLIAMS, K. 2002b. Optimising the essential fatty acids in the diet for weight gain of the prawn, Penaeus monodon. Aquaculture, 204, 85-99.GLENCROSS, B. D. 2009. Exploring the nutritional demand for essential fatty acids by aquaculture species. Reviews in Aquaculture, 1, 71-124.GLENCROSS, B. D., SMITH, D. M. & WILLIAMS, K. C. 1998. Effect of Dietary Phospholipids on Digestion of Neutral Lipid by the Prawn Penaeus monodon. Journal of the World Aquaculture Society, 29, 365-369.GODWIN, C. M. & COTNER, J. B. 2014. Carbon: phosphorus homeostasis of aquatic bacterial assemblages is mediated by shifts in assemblage composition. Aquatic Microbial Ecology, 73, 245-258.GODWIN, C. M. & COTNER, J. B. 2015. Stoichiometric flexibility in diverse aquatic heterotrophic bacteria is coupled to differences in cellular phosphorus quotas. Frontiers in microbiology, 6, 159.
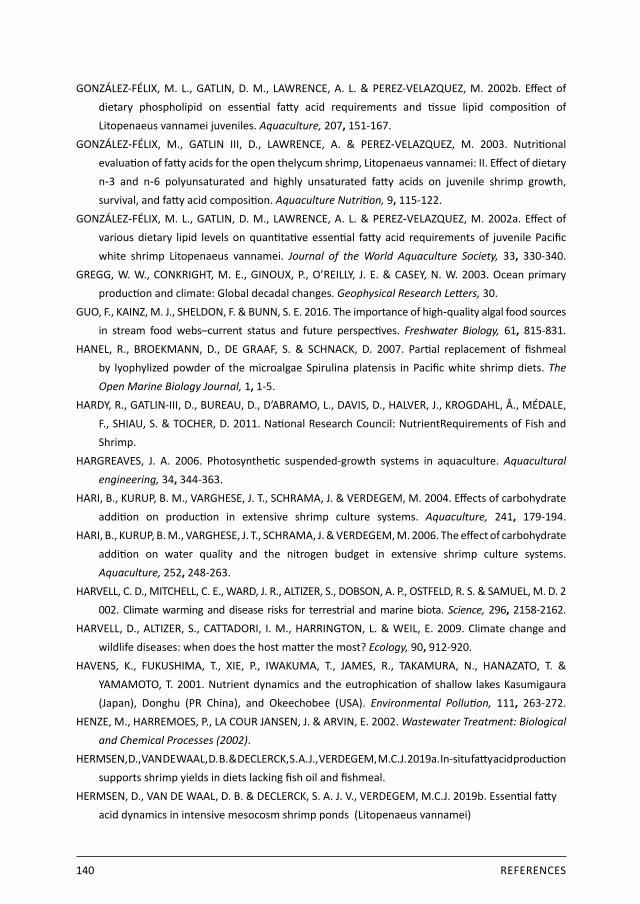
140 REFERENCES
GONZÁLEZ-FÉLIX, M. L., GATLIN, D. M., LAWRENCE, A. L. & PEREZ-VELAZQUEZ, M. 2002b. Effect of dietary phospholipid on essential fatty acid requirements and tissue lipid composition of Litopenaeus vannamei juveniles. Aquaculture, 207, 151-167.GONZÁLEZ‐FÉLIX, M., GATLIN III, D., LAWRENCE, A. & PEREZ‐VELAZQUEZ, M. 2003. Nutritional evaluation of fatty acids for the open thelycum shrimp, Litopenaeus vannamei: II. Effect of dietary n‐3 and n‐6 polyunsaturated and highly unsaturated fatty acids on juvenile shrimp growth, survival, and fatty acid composition. Aquaculture Nutrition, 9, 115-122.GONZÁLEZ‐FÉLIX, M. L., GATLIN, D. M., LAWRENCE, A. L. & PEREZ‐VELAZQUEZ, M. 2002a. Effect of various dietary lipid levels on quantitative essential fatty acid requirements of juvenile Pacific white shrimp Litopenaeus vannamei. Journal of the World Aquaculture Society, 33, 330-340.GREGG, W. W., CONKRIGHT, M. E., GINOUX, P., O’REILLY, J. E. & CASEY, N. W. 2003. Ocean primary production and climate: Global decadal changes. Geophysical Research Letters, 30.GUO, F., KAINZ, M. J., SHELDON, F. & BUNN, S. E. 2016. The importance of high‐quality algal food sources in stream food webs–current status and future perspectives. Freshwater Biology, 61, 815-831.HANEL, R., BROEKMANN, D., DE GRAAF, S. & SCHNACK, D. 2007. Partial replacement of fishmeal by lyophylized powder of the microalgae Spirulina platensis in Pacific white shrimp diets. The Open Marine Biology Journal, 1, 1-5.HARDY, R., GATLIN-III, D., BUREAU, D., D’ABRAMO, L., DAVIS, D., HALVER, J., KROGDAHL, Å., MÉDALE, F., SHIAU, S. & TOCHER, D. 2011. National Research Council: NutrientRequirements of Fish and Shrimp.HARGREAVES, J. A. 2006. Photosynthetic suspended-growth systems in aquaculture. Aquacultural engineering, 34, 344-363.HARI, B., KURUP, B. M., VARGHESE, J. T., SCHRAMA, J. & VERDEGEM, M. 2004. Effects of carbohydrate addition on production in extensive shrimp culture systems. Aquaculture, 241, 179-194.HARI, B., KURUP, B. M., VARGHESE, J. T., SCHRAMA, J. & VERDEGEM, M. 2006. The effect of carbohydrate addition on water quality and the nitrogen budget in extensive shrimp culture systems. Aquaculture, 252, 248-263.HARVELL, C. D., MITCHELL, C. E., WARD, J. R., ALTIZER, S., DOBSON, A. P., OSTFELD, R. S. & SAMUEL, M. D. 2 002. Climate warming and disease risks for terrestrial and marine biota. Science, 296, 2158-2162.HARVELL, D., ALTIZER, S., CATTADORI, I. M., HARRINGTON, L. & WEIL, E. 2009. Climate change and wildlife diseases: when does the host matter the most? Ecology, 90, 912-920.HAVENS, K., FUKUSHIMA, T., XIE, P., IWAKUMA, T., JAMES, R., TAKAMURA, N., HANAZATO, T. & YAMAMOTO, T. 2001. Nutrient dynamics and the eutrophication of shallow lakes Kasumigaura (Japan), Donghu (PR China), and Okeechobee (USA). Environmental Pollution, 111, 263-272.HENZE, M., HARREMOES, P., LA COUR JANSEN, J. & ARVIN, E. 2002. Wastewater Treatment: Biological and Chemical Processes (2002).HERMSEN, D., VAN DE WAAL, D. B. & DECLERCK, S. A. J., VERDEGEM, M.C.J. 2019a. In-situ fatty acid production supports shrimp yields in diets lacking fish oil and fishmeal. HERMSEN, D., VAN DE WAAL, D. B. & DECLERCK, S. A. J. V., VERDEGEM, M.C.J. 2019b. Essential fatty acid dynamics in intensive mesocosm shrimp ponds (Litopenaeus vannamei)
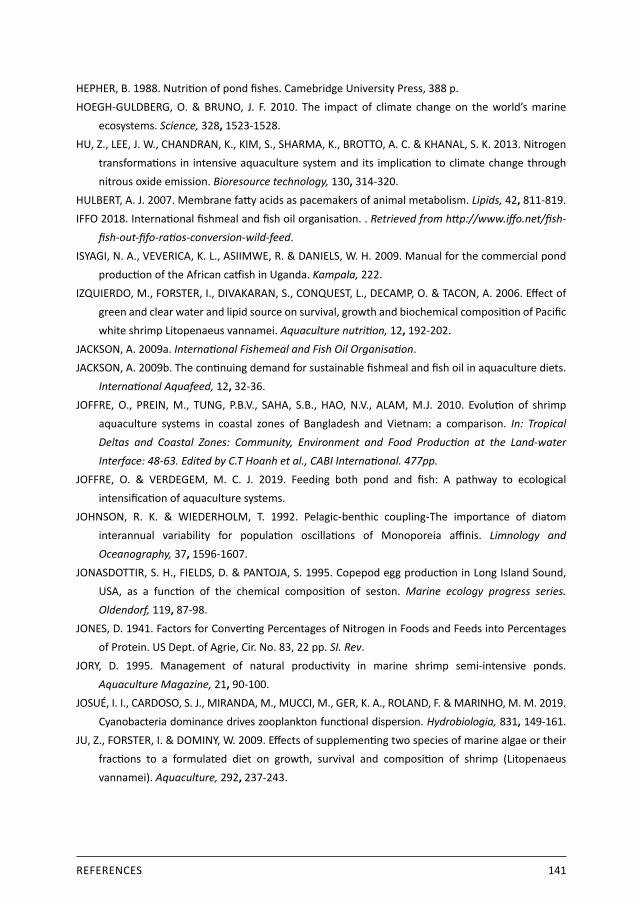
REFERENCES 141
HEPHER, B. 1988. Nutrition of pond fishes. Camebridge University Press, 388 p.HOEGH-GULDBERG, O. & BRUNO, J. F. 2010. The impact of climate change on the world’s marine ecosystems. Science, 328, 1523-1528.HU, Z., LEE, J. W., CHANDRAN, K., KIM, S., SHARMA, K., BROTTO, A. C. & KHANAL, S. K. 2013. Nitrogen transformations in intensive aquaculture system and its implication to climate change through nitrous oxide emission. Bioresource technology, 130, 314-320.HULBERT, A. J. 2007. Membrane fatty acids as pacemakers of animal metabolism. Lipids, 42, 811-819.IFFO 2018. International fishmeal and fish oil organisation. . Retrieved from http://www.iffo.net/fish- fish-out-fifo-ratios-conversion-wild-feed.ISYAGI, N. A., VEVERICA, K. L., ASIIMWE, R. & DANIELS, W. H. 2009. Manual for the commercial pond production of the African catfish in Uganda. Kampala, 222.IZQUIERDO, M., FORSTER, I., DIVAKARAN, S., CONQUEST, L., DECAMP, O. & TACON, A. 2006. Effect of green and clear water and lipid source on survival, growth and biochemical composition of Pacific white shrimp Litopenaeus vannamei. Aquaculture nutrition, 12, 192-202.JACKSON, A. 2009a. International Fishemeal and Fish Oil Organisation.JACKSON, A. 2009b. The continuing demand for sustainable fishmeal and fish oil in aquaculture diets. International Aquafeed, 12, 32-36.JOFFRE, O., PREIN, M., TUNG, P.B.V., SAHA, S.B., HAO, N.V., ALAM, M.J. 2010. Evolution of shrimp aquaculture systems in coastal zones of Bangladesh and Vietnam: a comparison. In: Tropical Deltas and Coastal Zones: Community, Environment and Food Production at the Land-water Interface: 48-63. Edited by C.T Hoanh et al., CABI International. 477pp.JOFFRE, O. & VERDEGEM, M. C. J. 2019. Feeding both pond and fish: A pathway to ecological intensification of aquaculture systems.JOHNSON, R. K. & WIEDERHOLM, T. 1992. Pelagic‐benthic coupling‐The importance of diatom interannual variability for population oscillations of Monoporeia affinis. Limnology and Oceanography, 37, 1596-1607.JONASDOTTIR, S. H., FIELDS, D. & PANTOJA, S. 1995. Copepod egg production in Long Island Sound, USA, as a function of the chemical composition of seston. Marine ecology progress series. Oldendorf, 119, 87-98.JONES, D. 1941. Factors for Converting Percentages of Nitrogen in Foods and Feeds into Percentages of Protein. US Dept. of Agrie, Cir. No. 83, 22 pp. SI. Rev.JORY, D. 1995. Management of natural productivity in marine shrimp semi-intensive ponds. Aquaculture Magazine, 21, 90-100.JOSUÉ, I. I., CARDOSO, S. J., MIRANDA, M., MUCCI, M., GER, K. A., ROLAND, F. & MARINHO, M. M. 2019. Cyanobacteria dominance drives zooplankton functional dispersion. Hydrobiologia, 831, 149-161.JU, Z., FORSTER, I. & DOMINY, W. 2009. Effects of supplementing two species of marine algae or their fractions to a formulated diet on growth, survival and composition of shrimp (Litopenaeus vannamei). Aquaculture, 292, 237-243.

142 REFERENCES
KABIR, K., SCHRAMA, J., VERRETH, J., PHILLIPS, M. & VERDEGEM, M. 2019. Effect of dietary protein to energy ratio on performance of nile tilapia and food web enhancement in semi-intensive pond aquaculture. Aquaculture, 499, 235-242.KABIR, K., VERDEGEM, M., SCHRAMA, J., KARIM, M., PHILIPS, M. & VERRETH, J. 2016. Understanding the role of feed in shrimp ponds and matching natural and supplemental feeds for sustainable shrimp production.KABIR, K. A. 2019. Feeding fish or pond...? , Wageningen University.KANAZAWA, A. Utilisation of soybean meal and other non-marine protein sources in diets for penaeid shrimps. Proceedings of the Aquaculture Nutrition Workshop, Salamander Bay (ed. G. L Allan, and W. Dall), 1992. 122-124.KANAZAWA, A., TESHIMA, S.-I. & ONO, K. 1979. Relationship between essential fatty acid requirements of aquatic animals and the capacity for bioconversion of linolenic acid to highly unsaturated fatty acids. Comparative Biochemistry and Physiology Part B: Comparative Biochemistry, 63, 295-298.KAUTSKY, N., RÖNNBÄCK, P., TEDENGREN, M. & TROELL, M. 2000. Ecosystem perspectives on management of disease in shrimp pond farming. Aquaculture, 191, 145-161.KAZIR, M., ABUHASSIRA, Y., ROBIN, A., NAHOR, O., LUO, J., ISRAEL, A., GOLBERG, A. & LIVNEY, Y. D. 2019. Extraction of proteins from two marine macroalgae, Ulva sp. and Gracilaria sp., for food application, and evaluating digestibility, amino acid composition and antioxidant properties of the protein concentrates. Food hydrocolloids, 87, 194-203.KEMPKE, S. 2012. An Assessment of the Ecological Impacts from Low Intensity Shrimp Farm Wastewater in the Bang Pakong River Region of Thailand Using Stable Isotope Analysis.KHATOON, H. 2006. Use of Selected Periphyton Species to Improve Water Quality and Shri, P Postlarval Production. Universiti Putra Malaysia.KHATOON, H., YUSOFF, F. M., BANERJEE, S., SHARIFF, M. & MOHAMED, S. 2007. Use of periphytic cyanobacterium and mixed diatoms coated substrate for improving water quality, survival and growth of Penaeus monodon Fabricius postlarvae. Aquaculture, 271, 196-205.KIRCHHOFF, E. 2002. Online-Publication of the German Food Composition Table “Souci–Fachmann– Kraut “on the Internet. Journal of Food Composition and Analysis, 15, 465-472.KIRETA, A. R., REAVIE, E. D., SGRO, G. V., ANGRADI, T. R., BOLGRIEN, D. W., HILL, B. H. & JICHA, T. M. 2012. Planktonic and periphytic diatoms as indicators of stress on great rivers of the United States: Testing water quality and disturbance models. Ecological Indicators, 13, 222-231.KIRON, V., PHROMKUNTHONG, W., HUNTLEY, M., ARCHIBALD, I. & DE SCHEEMAKER, G. 2012. Marine microalgae from biorefinery as a potential feed protein source for Atlantic salmon, common carp and whiteleg shrimp. Aquaculture Nutrition, 18, 521-531.KNAUER, M. & VAN HEUGTEN, E. 2018. Effect of soybean meal supplementation during gestation on piglet quality. Journal of Animal Science, 96, 180-181.KORTSTEE, G. J., APPELDOORN, K. J., BONTING, C. F., VAN NIEL, E. W. & VAN VEEN, H. W. 1994. Biology of polyphosphate-accumulating bacteria involved in enhanced biological phosphorus removal. FEMS microbiology reviews, 15, 137-153.
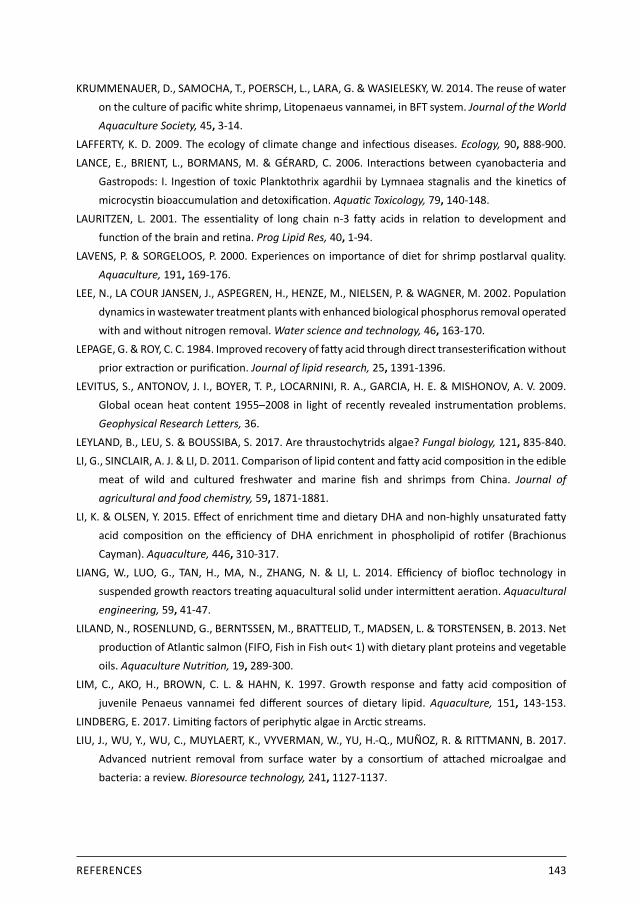
REFERENCES 143
KRUMMENAUER, D., SAMOCHA, T., POERSCH, L., LARA, G. & WASIELESKY, W. 2014. The reuse of water on the culture of pacific white shrimp, Litopenaeus vannamei, in BFT system. Journal of the World Aquaculture Society, 45, 3-14.LAFFERTY, K. D. 2009. The ecology of climate change and infectious diseases. Ecology, 90, 888-900.LANCE, E., BRIENT, L., BORMANS, M. & GÉRARD, C. 2006. Interactions between cyanobacteria and Gastropods: I. Ingestion of toxic Planktothrix agardhii by Lymnaea stagnalis and the kinetics of microcystin bioaccumulation and detoxification. Aquatic Toxicology, 79, 140-148.LAURITZEN, L. 2001. The essentiality of long chain n-3 fatty acids in relation to development and function of the brain and retina. Prog Lipid Res, 40, 1-94.LAVENS, P. & SORGELOOS, P. 2000. Experiences on importance of diet for shrimp postlarval quality. Aquaculture, 191, 169-176.LEE, N., LA COUR JANSEN, J., ASPEGREN, H., HENZE, M., NIELSEN, P. & WAGNER, M. 2002. Population dynamics in wastewater treatment plants with enhanced biological phosphorus removal operated with and without nitrogen removal. Water science and technology, 46, 163-170.LEPAGE, G. & ROY, C. C. 1984. Improved recovery of fatty acid through direct transesterification without prior extraction or purification. Journal of lipid research, 25, 1391-1396.LEVITUS, S., ANTONOV, J. I., BOYER, T. P., LOCARNINI, R. A., GARCIA, H. E. & MISHONOV, A. V. 2009. Global ocean heat content 1955–2008 in light of recently revealed instrumentation problems. Geophysical Research Letters, 36.LEYLAND, B., LEU, S. & BOUSSIBA, S. 2017. Are thraustochytrids algae? Fungal biology, 121, 835-840.LI, G., SINCLAIR, A. J. & LI, D. 2011. Comparison of lipid content and fatty acid composition in the edible meat of wild and cultured freshwater and marine fish and shrimps from China. Journal of agricultural and food chemistry, 59, 1871-1881.LI, K. & OLSEN, Y. 2015. Effect of enrichment time and dietary DHA and non-highly unsaturated fatty acid composition on the efficiency of DHA enrichment in phospholipid of rotifer (Brachionus Cayman). Aquaculture, 446, 310-317.LIANG, W., LUO, G., TAN, H., MA, N., ZHANG, N. & LI, L. 2014. Efficiency of biofloc technology in suspended growth reactors treating aquacultural solid under intermittent aeration. Aquacultural engineering, 59, 41-47.LILAND, N., ROSENLUND, G., BERNTSSEN, M., BRATTELID, T., MADSEN, L. & TORSTENSEN, B. 2013. Net production of Atlantic salmon (FIFO, Fish in Fish out< 1) with dietary plant proteins and vegetable oils. Aquaculture Nutrition, 19, 289-300.LIM, C., AKO, H., BROWN, C. L. & HAHN, K. 1997. Growth response and fatty acid composition of juvenile Penaeus vannamei fed different sources of dietary lipid. Aquaculture, 151, 143-153.LINDBERG, E. 2017. Limiting factors of periphytic algae in Arctic streams.LIU, J., WU, Y., WU, C., MUYLAERT, K., VYVERMAN, W., YU, H.-Q., MUÑOZ, R. & RITTMANN, B. 2017. Advanced nutrient removal from surface water by a consortium of attached microalgae and bacteria: a review. Bioresource technology, 241, 1127-1137.

144 REFERENCES
LOMBARDI, J. V., DE ALMEIDA MARQUES, H. L., PEREIRA, R. T. L., BARRETO, O. J. S. & DE PAULA, E. J. 2006. Cage polyculture of the Pacific white shrimp Litopenaeus vannamei and the Philippines seaweed Kappaphycus alvarezii. Aquaculture, 258, 412-415.LONNIE, M., HOOKER, E., BRUNSTROM, J., CORFE, B., GREEN, M., WATSON, A., WILLIAMS, E., STEVENSON, E., PENSON, S. & JOHNSTONE, A. 2018. Protein for life: Review of optimal protein intake, sustainable dietary sources and the effect on appetite in ageing adults. Nutrients, 10, 360.LOVETT, D. L. & FELDER, D. L. 1990. Ontogenetic change in digestive enzyme activity of larval and postlarval white shrimp Penaeus setiferus (Crustacea, Decapoda, Penaeidae). The Biological Bulletin, 178, 144-159.LUCAS, J. S., SOUTHGATE, P. C. & TUCKER, C. S. 2019. Aquaculture: Farming aquatic animals and plants, Wiley-Blackwell.MAKHUTOVA, O. N., SHULEPINA, S. P., SHARAPOVA, T. A., KOLMAKOVA, A. A., GLUSHCHENKO, L. A., KRAVCHUK, E. S. & GLADYSHEV, M. I. 2018. Intraspecies variability of fatty acid content and composition of a cosmopolitan benthic invertebrate, Gammarus lacustris. Inland Waters, 8, 356-367.MARIOTTI, F., TOMÉ, D. & MIRAND, P. P. 2008. Converting nitrogen into protein—beyond 6.25 and Jones’ factors. Critical reviews in food science and nutrition, 48, 177-184.MARTINEZ‐CORDOVA, L., CAMPANA TORRES, A. & PORCHAS‐CORNEJO, M. 2003. Dietary protein level and natural food management in the culture of blue (Litopenaeus stylirostris) and white shrimp (Litopenaeus vannamei) in microcosms. Aquaculture Nutrition, 9, 155-160.MARTÍNEZ‐ROCHA, L., GAMBOA‐DELGADO, J., NIETO‐LÓPEZ, M., RICQUE‐MARIE, D. & CRUZ‐SUÁREZ, L. E. 2013. Incorporation of dietary nitrogen from fish meal and pea meal (Pisum sativum) in muscle tissue of Pacific white shrimp (Litopenaeus vannamei) fed low protein compound diets. Aquaculture Research, 44, 847-859.MAYNARD, J., VAN HOOIDONK, R., EAKIN, C. M., PUOTINEN, M., GARREN, M., WILLIAMS, G., HERON, S. F., LAMB, J., WEIL, E. & WILLIS, B. 2015. Projections of climate conditions that increase coral disease susceptibility and pathogen abundance and virulence. Nature Climate Change, 5, 688.MCINTOSH, D., SAMOCHA, T., JONES, E., LAWRENCE, A., MCKEE, D., HOROWITZ, S. & HOROWITZ, A. 2000. The effect of a commercial bacterial supplement on the high-density culturing of Litopenaeusvannamei with a low-protein diet in an outdoor tank system and no water exchange. Aquacultural Engineering, 21, 215-227.MCQUEEN, D. J., JOHANNES, M. R., POST, J. R., STEWART, T. J. & LEAN, D. R. 1989. Bottom-up and top- down impacts on freshwater pelagic community structure. Ecological Monographs, 59, 289-309.MCQUEEN, D. J., POST, J. R. & MILLS, E. L. 1986. Trophic relationships in freshwater pelagic ecosystems. Canadian Journal of Fisheries and Aquatic Sciences, 43, 1571-1581.MENTE, E., COUTTEAU, P., HOULIHAN, D., DAVIDSON, I. & SORGELOOS, P. 2002. Protein turnover, amino acid profile and amino acid flux in juvenile shrimp Litopenaeus vannamei: effects of dietary protein source. Journal of Experimental Biology, 205, 3107-3122.MICHELI, F. 1999. Eutrophication, fisheries, and consumer-resource dynamics in marine pelagic ecosystems. Science, 285, 1396-1398.

REFERENCES 145
MISCHKE, C. C. 2012. Aquaculture Pond Fertilization: Impacts of Nutrient Input on Production, John Wiley & Sons.MISHRA, J. K., SAMOCHA, T. M., PATNAIK, S., SPEED, M., GANDY, R. L. & ALI, A.-M. 2008. Performance of an intensive nursery system for the Pacific white shrimp, Litopenaeus vannamei, under limited discharge condition. Aquacultural engineering, 38, 2-15.MORENO‐ARIAS, A., LÓPEZ‐ELÍAS, J., MIRANDA‐BAEZA, A., RIVAS‐VEGA, M., MARTÍNEZ‐CÓRDOVA, L. & RAMÍREZ‐SUÁREZ, J. 2017. Replacement of fishmeal by vegetable meal mix in the diets of Litopenaeus vannamei reared in low‐salinity biofloc system: effect on digestive enzymatic activity. Aquaculture nutrition, 23, 236-245.MORIARTY, D. 1998. Control of luminous Vibrio species in penaeid aquaculture ponds. Aquaculture, 164, 351-358.MOSHFEGH, A., GOLDMAN, J. & CLEVELAND, L. 2005. What we eat in America, NHANES 2001-2002: usual nutrient intakes from food compared to dietary reference intakes. US Department of Agriculture, Agricultural Research Service, 9.MRÁZ, J., ZAJÍC, T. & PICKOVA, J. 2012. Culture of common carp (Cyprinus carpio) with defined flesh quality for prevention of cardiovascular diseases using finishing feeding strategy. Neuroendocrinology Letters, 33, 60-67.MUANGKEOW, B., IKEJIMA, K., POWTONGSOOK, S. & YI, Y. 2007. Effects of white shrimp, Litopenaeus vannamei (Boone), and Nile tilapia, Oreochromis niloticus L., stocking density on growth, nutrient conversion rate and economic return in integrated closed recirculation system. Aquaculture, 269, 363-376.MÜLLER-NAVARRA, D. 1995. Evidence that a highly unsaturated fatty acid limits Daphnia growth in nature. Archiv für Hydrobiologie, 132, 297-307.MÜLLER-NAVARRA, D. & LAMPERT, W. 1996. Seasonal patterns of food limitation in Daphnia galeata: separating food quantity and food quality effects. Journal of Plankton Research, 18, 1137-1157.MÜLLER-NAVARRA, D. C., BRETT, M. T., LISTON, A. M. & GOLDMAN, C. R. 2000. A highly unsaturated fatty acid predicts carbon transfer between primary producers and consumers. Nature, 403, 74-77.MÜLLER-NAVARRA, D. C., BRETT, M. T., PARK, S., CHANDRA, S., BALLANTYNE, A. P., ZORITA, E. & GOLDMAN, C. R. 2004. Unsaturated fatty acid content in seston and tropho-dynamic coupling in lakes. Nature, 427, 69-72.MURPHY, J. & RILEY, J. P. 1962. A modified single solution method for the determination of phosphate in natural waters. Analytica chimica acta, 27, 31-36.NAGASAKA, R., GAGNON, C., SWIST, E., RONDEAU, I., MASSARELLI, I., CHEUNG, W. & RATNAYAKE, W. M. 2014. EPA and DHA status of South Asian and white Canadians living in the National Capital Region of Canada. Lipids, 49, 1057-1069.NAPOLITANO, G., SHANTHA, N., HILL, W. & LUTTRELL, A. 1996. Lipid and fatty acid compositions of stream periphyton and stoneroller minnows (Campostoma anomalum): trophic and environmental implications. Archiv für Hydrobiologie, 137, 211-225.
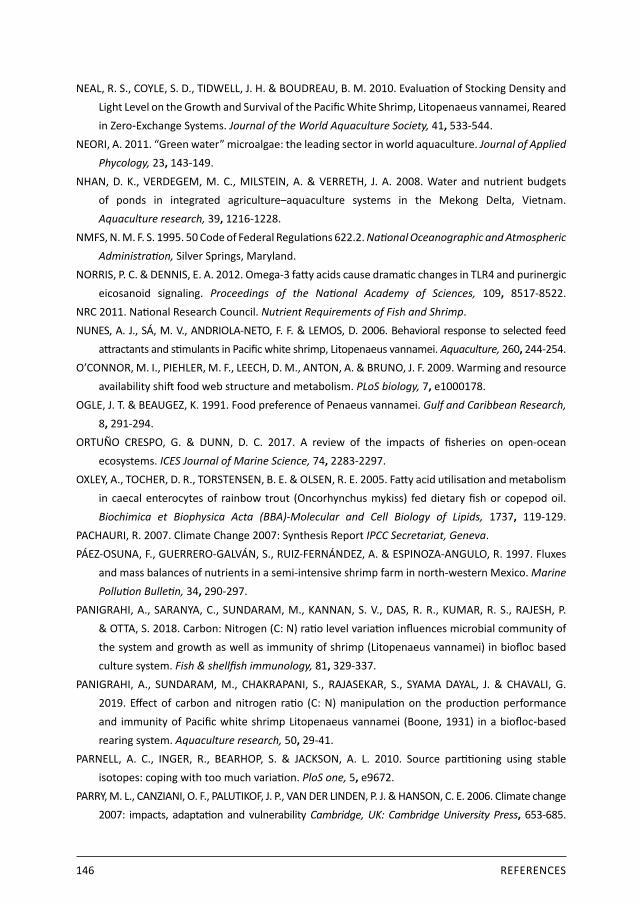
146 REFERENCES
NEAL, R. S., COYLE, S. D., TIDWELL, J. H. & BOUDREAU, B. M. 2010. Evaluation of Stocking Density and Light Level on the Growth and Survival of the Pacific White Shrimp, Litopenaeus vannamei, Reared in Zero‐Exchange Systems. Journal of the World Aquaculture Society, 41, 533-544.NEORI, A. 2011. “Green water” microalgae: the leading sector in world aquaculture. Journal of Applied Phycology, 23, 143-149.NHAN, D. K., VERDEGEM, M. C., MILSTEIN, A. & VERRETH, J. A. 2008. Water and nutrient budgets of ponds in integrated agriculture–aquaculture systems in the Mekong Delta, Vietnam. Aquaculture research, 39, 1216-1228.NMFS, N. M. F. S. 1995. 50 Code of Federal Regulations 622.2. National Oceanographic and Atmospheric Administration, Silver Springs, Maryland.NORRIS, P. C. & DENNIS, E. A. 2012. Omega-3 fatty acids cause dramatic changes in TLR4 and purinergic eicosanoid signaling. Proceedings of the National Academy of Sciences, 109, 8517-8522.NRC 2011. National Research Council. Nutrient Requirements of Fish and Shrimp.NUNES, A. J., SÁ, M. V., ANDRIOLA-NETO, F. F. & LEMOS, D. 2006. Behavioral response to selected feed attractants and stimulants in Pacific white shrimp, Litopenaeus vannamei. Aquaculture, 260, 244-254.O’CONNOR, M. I., PIEHLER, M. F., LEECH, D. M., ANTON, A. & BRUNO, J. F. 2009. Warming and resource availability shift food web structure and metabolism. PLoS biology, 7, e1000178.OGLE, J. T. & BEAUGEZ, K. 1991. Food preference of Penaeus vannamei. Gulf and Caribbean Research, 8, 291-294.ORTUÑO CRESPO, G. & DUNN, D. C. 2017. A review of the impacts of fisheries on open-ocean ecosystems. ICES Journal of Marine Science, 74, 2283-2297.OXLEY, A., TOCHER, D. R., TORSTENSEN, B. E. & OLSEN, R. E. 2005. Fatty acid utilisation and metabolism in caecal enterocytes of rainbow trout (Oncorhynchus mykiss) fed dietary fish or copepod oil. Biochimica et Biophysica Acta (BBA)-Molecular and Cell Biology of Lipids, 1737, 119-129.PACHAURI, R. 2007. Climate Change 2007: Synthesis Report IPCC Secretariat, Geneva.PÁEZ-OSUNA, F., GUERRERO-GALVÁN, S., RUIZ-FERNÁNDEZ, A. & ESPINOZA-ANGULO, R. 1997. Fluxes and mass balances of nutrients in a semi-intensive shrimp farm in north-western Mexico. Marine Pollution Bulletin, 34, 290-297.PANIGRAHI, A., SARANYA, C., SUNDARAM, M., KANNAN, S. V., DAS, R. R., KUMAR, R. S., RAJESH, P. & OTTA, S. 2018. Carbon: Nitrogen (C: N) ratio level variation influences microbial community of the system and growth as well as immunity of shrimp (Litopenaeus vannamei) in biofloc based culture system. Fish & shellfish immunology, 81, 329-337.PANIGRAHI, A., SUNDARAM, M., CHAKRAPANI, S., RAJASEKAR, S., SYAMA DAYAL, J. & CHAVALI, G. 2019. Effect of carbon and nitrogen ratio (C: N) manipulation on the production performance and immunity of Pacific white shrimp Litopenaeus vannamei (Boone, 1931) in a biofloc‐based rearing system. Aquaculture research, 50, 29-41.PARNELL, A. C., INGER, R., BEARHOP, S. & JACKSON, A. L. 2010. Source partitioning using stable isotopes: coping with too much variation. PloS one, 5, e9672.PARRY, M. L., CANZIANI, O. F., PALUTIKOF, J. P., VAN DER LINDEN, P. J. & HANSON, C. E. 2006. Climate change 2007: impacts, adaptation and vulnerability Cambridge, UK: Cambridge University Press, 653-685.
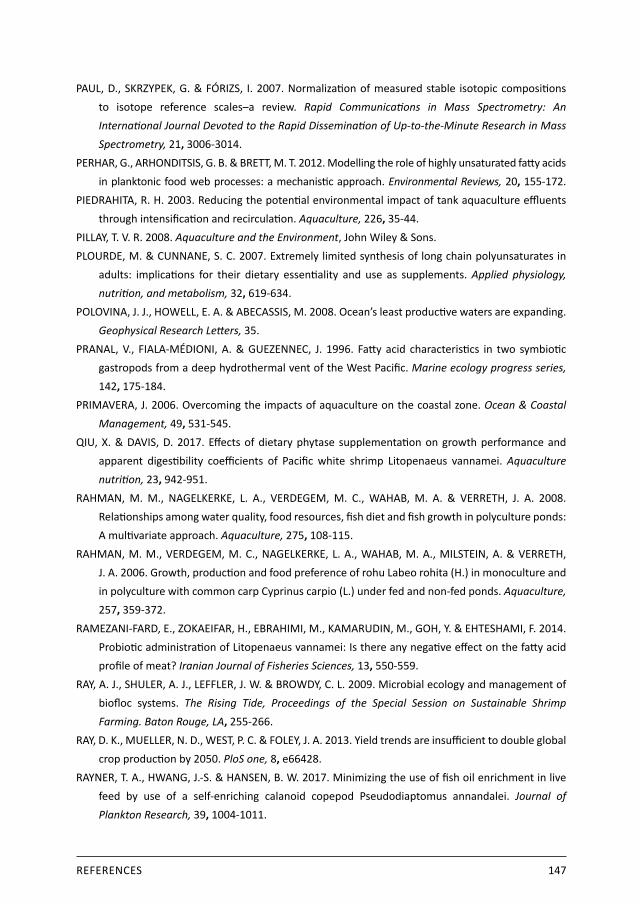
REFERENCES 147
PAUL, D., SKRZYPEK, G. & FÓRIZS, I. 2007. Normalization of measured stable isotopic compositions to isotope reference scales–a review. Rapid Communications in Mass Spectrometry: An International Journal Devoted to the Rapid Dissemination of Up-to-the-Minute Research in Mass Spectrometry, 21, 3006-3014.PERHAR, G., ARHONDITSIS, G. B. & BRETT, M. T. 2012. Modelling the role of highly unsaturated fatty acids in planktonic food web processes: a mechanistic approach. Environmental Reviews, 20, 155-172.PIEDRAHITA, R. H. 2003. Reducing the potential environmental impact of tank aquaculture effluents through intensification and recirculation. Aquaculture, 226, 35-44.PILLAY, T. V. R. 2008. Aquaculture and the Environment, John Wiley & Sons.PLOURDE, M. & CUNNANE, S. C. 2007. Extremely limited synthesis of long chain polyunsaturates in adults: implications for their dietary essentiality and use as supplements. Applied physiology, nutrition, and metabolism, 32, 619-634.POLOVINA, J. J., HOWELL, E. A. & ABECASSIS, M. 2008. Ocean’s least productive waters are expanding. Geophysical Research Letters, 35.PRANAL, V., FIALA-MÉDIONI, A. & GUEZENNEC, J. 1996. Fatty acid characteristics in two symbiotic gastropods from a deep hydrothermal vent of the West Pacific. Marine ecology progress series, 142, 175-184.PRIMAVERA, J. 2006. Overcoming the impacts of aquaculture on the coastal zone. Ocean & Coastal Management, 49, 531-545.QIU, X. & DAVIS, D. 2017. Effects of dietary phytase supplementation on growth performance and apparent digestibility coefficients of Pacific white shrimp Litopenaeus vannamei. Aquaculture nutrition, 23, 942-951.RAHMAN, M. M., NAGELKERKE, L. A., VERDEGEM, M. C., WAHAB, M. A. & VERRETH, J. A. 2008. Relationships among water quality, food resources, fish diet and fish growth in polyculture ponds: A multivariate approach. Aquaculture, 275, 108-115.RAHMAN, M. M., VERDEGEM, M. C., NAGELKERKE, L. A., WAHAB, M. A., MILSTEIN, A. & VERRETH, J. A. 2006. Growth, production and food preference of rohu Labeo rohita (H.) in monoculture and in polyculture with common carp Cyprinus carpio (L.) under fed and non-fed ponds. Aquaculture, 257, 359-372.RAMEZANI-FARD, E., ZOKAEIFAR, H., EBRAHIMI, M., KAMARUDIN, M., GOH, Y. & EHTESHAMI, F. 2014. Probiotic administration of Litopenaeus vannamei: Is there any negative effect on the fatty acid profile of meat? Iranian Journal of Fisheries Sciences, 13, 550-559.RAY, A. J., SHULER, A. J., LEFFLER, J. W. & BROWDY, C. L. 2009. Microbial ecology and management of biofloc systems. The Rising Tide, Proceedings of the Special Session on Sustainable Shrimp Farming. Baton Rouge, LA, 255-266.RAY, D. K., MUELLER, N. D., WEST, P. C. & FOLEY, J. A. 2013. Yield trends are insufficient to double global crop production by 2050. PloS one, 8, e66428.RAYNER, T. A., HWANG, J.-S. & HANSEN, B. W. 2017. Minimizing the use of fish oil enrichment in live feed by use of a self-enriching calanoid copepod Pseudodiaptomus annandalei. Journal of Plankton Research, 39, 1004-1011.

148 REFERENCES
RIEBESELL, U., SCHULZ, K. G., BELLERBY, R., BOTROS, M., FRITSCHE, P., MEYERHÖFER, M., NEILL, C., NONDAL, G., OSCHLIES, A. & WOHLERS, J. 2007. Enhanced biological carbon consumption in a high CO 2 ocean. Nature, 450, 545.RISGAARD-PETERSEN, N., NICOLAISEN, M. H., REVSBECH, N. P. & LOMSTEIN, B. A. 2004. Competition between ammonia-oxidizing bacteria and benthic microalgae. Appl. Environ. Microbiol., 70, 5528- 5537.ROHRLACK, T., DITTMANN, E., HENNING, M., BÖRNER, T. & KOHL, J.-G. 1999. Role of microcystins in poisoning and food ingestion inhibition of Daphnia galeata caused by the cyanobacterium Microcystis aeruginosa. Applied and environmental microbiology, 65, 737-739.ROOKE, J., SINCLAIR, A., EDWARDS, S., CORDOBA, R., PKIYACH, S., PENNY, P., PENNY, P., FINCH, A. & HORGAN, G. 2001. The effect of feeding salmon oil to sows throughout pregnancy on pre-weaning mortality of piglets. Animal Science, 73, 489-500.ROOS, N., WAHAB, M., HOSSAIN, M. A. R. & THILSTED, S. H. 2007. Linking human nutrition and fisheries: incorporating micronutrient-dense, small indigenous fish species in carp polyculture production in Bangladesh. Food & Nutrition Bulletin, 28, 280S-293S.RUBIN, D. B. 1981. The bayesian bootstrap. The annals of statistics, 130-134.RUIZ-LÓPEZ, N., SAYANOVA, O., NAPIER, J. A. & HASLAM, R. P. 2012. Metabolic engineering of the omega-3 long chain polyunsaturated fatty acid biosynthetic pathway into transgenic plants. Journal of experimental botany, 63, 2397-2410.RUSANOV, A. & KHROMOV, V. 2016. Longitudinal distribution of periphyton algae in the Moskva river under eutrophication. Water resources, 43, 513-521.SABINE, C. L., FEELY, R. A., GRUBER, N., KEY, R. M., LEE, K., BULLISTER, J. L., WANNINKHOF, R., WONG, C., WALLACE, D. W. & TILBROOK, B. 2004. The oceanic sink for anthropogenic CO2. science, 305, 367-371.SAHU, B. C., ADHIKARI, S. & DEY, L. 2013. Carbon, nitrogen and phosphorus budget in shrimp (Penaeus monodon) culture ponds in eastern India. Aquaculture international, 21, 453-466.SANGHA, R., CRUZ, A., CHAVEZ‐SANCHEZ, M. & JONES, D. 2000. Survival and growth of Litopenaeus vannamei (Boone) larvae fed a single dose of live algae and artificial diets with supplements. Aquaculture Research, 31, 683-689.SANGIOVANNI, J. P. & CHEW, E. Y. 2005. The role of omega-3 long-chain polyunsaturated fatty acids in health and disease of the retina. Progress in retinal and eye research, 24, 87-138.SANGUANRUT, P., MUNKONGWONGSIRI, N., KONGKUMNERD, J., THAWONSUWAN, J., THITAMADEE, S., BOONYAWIWAT, V., TANASOMWANG, V., FLEGEL, T. W. & SRITUNYALUCKSANA, K. 2018. A cohort study of 196 Thai shrimp ponds reveals a complex etiology for early mortality syndrome (EMS). Aquaculture, 493, 26-36.SARGENT, J., BELL, J., BELL, M., HENDERSON, R. & TOCHER, D. 1993. The metabolism of phospholipids and polyunsaturated fatty acids in fish. Aquaculture: Fundamental and Applied Research, 103-124.SAXHOLT, E., CHRISTENSEN, A., MØLLER, A., HARTKOPP, H., HESS YGIL, K. & HELS, O. 2008. Danish food composition databank, revision 7. Department of Nutrition, National Food Institute, Technical University of Denmark, 2008.
REFERENCES 149
SCHINDLER, D. W. 1987. Detecting ecosystem responses to anthropogenic stress. Canadian Journal of Fisheries and Aquatic Sciences, 44, s6-s25.SCHOO, K. L., MALZAHN, A. M., KRAUSE, E. & BOERSMA, M. 2013. Increased carbon dioxide availability alters phytoplankton stoichiometry and affects carbon cycling and growth of a marine planktonic herbivore. Marine biology, 160, 2145-2155.SILVA, K. R., WASIELESKY, W. & ABREU, P. C. 2013. Nitrogen and phosphorus dynamics in the biofloc production of the pacific white shrimp, Litopenaeus vannamei. Journal of the World Aquaculture Society, 44, 30-41.SIMOPOULOS, A. P. 2002. The importance of the ratio of omega-6/omega-3 essential fatty acids. Biomedicine & pharmacotherapy, 56, 365-379.SMITH, V. H. & SCHINDLER, D. W. 2009. Eutrophication science: where do we go from here? Trends in ecology & evolution, 24, 201-207.SOARES, R., PEIXOTO, S., BEMVENUTI, C., WASIELESKY, W., D’INCÃO, F., MURCIA, N. & SUITA, S. 2004. Composition and abundance of invertebrate benthic fauna in Farfantepenaeus paulensis culture pens (Patos Lagoon estuary, Southern Brazil). Aquaculture, 239, 199-215.SOMMER, U., GLIWICZ, Z. M., LAMPERT, W. & DUNCAN, A. 1986. The PEG-model of seasonal succession of planktonic events in fresh waters. Arch. Hydrobiol, 106, 433-471.SOSULSKI, F. W. & IMAFIDON, G. I. 1990. Amino acid composition and nitrogen-to-protein conversion factors for animal and plant foods. Journal of Agricultural and Food Chemistry, 38, 1351-1356.SPIVAK, A. C., VANNI, M. J. & METTE, E. M. 2011. Moving on up: can results from simple aquatic mesocosm experiments be applied across broad spatial scales? Freshwater Biology, 56, 279-291.SPRAGUE, M., DICK, J. R. & TOCHER, D. R. 2016. Impact of sustainable feeds on omega-3 long-chain fatty acid levels in farmed Atlantic salmon, 2006–2015. 6, 21892.STABILI, L., SICURO, B., DAPRA, F., GAI, F., ABETE, C., DIBENEDETTO, A., PASTORE, C., SCHIROSI, R. & GIANGRANDE, A. 2013. The Biochemistry of Sabella spallanzanii (Annelida: Polychaeta): a potential resource for the fish feed industry. Journal of the World Aquaculture Society, 44, 384-395.STENTIFORD, G., NEIL, D., PEELER, E., SHIELDS, J., SMALL, H., FLEGEL, T., VLAK, J., JONES, B., MORADO, F. & MOSS, S. 2012. Disease will limit future food supply from the global crustacean fishery and aquaculture sectors. Journal of invertebrate pathology, 110, 141-157.STUBHAUG, I., LIE, Ø. & TORSTENSEN, B. 2007. Fatty acid productive value and β‐oxidation capacity in Atlantic salmon (Salmo salar L.) fed on different lipid sources along the whole growth period. Aquaculture Nutrition, 13, 145-155.SUGIURA, S. H. 2018. Phosphorus, Aquaculture, and the Environment. Reviews in Fisheries Science & Aquaculture, 26, 515-521.SURYAKUMAR, B. & AVNIMELECH, Y. 2017. Adapting Biofloc Technology for Use in Small-scale Ponds with Vertical Substrate. WORLD AQUACULTURE, 55.TACON, A., CODY, J., CONQUEST, L., DIVAKARAN, S., FORSTER, I. & DECAMP, O. 2002. Effect of culture system on the nutrition and growth performance of Pacific white shrimp Litopenaeus vannamei (Boone) fed different diets. Aquaculture nutrition, 8, 121-137.
150 REFERENCES
TACON, A. G. & METIAN, M. 2008a. Global overview on the use of fish meal and fish oil in industrially compounded aquafeeds: trends and future prospects. Aquaculture, 285, 146-158.TACON, A. G. & METIAN, M. 2013. Fish matters: Importance of aquatic foods in human nutrition and global food supply. Reviews in Fisheries Science, 21, 22-38.TACON, A. G. J. & METIAN, M. 2008b. Global overview on the use of fish meal and fish oil in industrially compounded aquafeeds: Trends and future prospects. Aquaculture, 285, 146-158.TAN, B., MAI, K., ZHENG, S., ZHOU, Q., LIU, L. & YU, Y. 2005. Replacement of fish meal by meat and bone meal in practical diets for the white shrimp Litopenaeus vannamai (Boone). Aquaculture Research, 36, 439-444.THAKUR, D. P. & LIN, C. K. 2003. Water quality and nutrient budget in closed shrimp (Penaeus monodon) culture systems. Aquacultural engineering, 27, 159-176.TURCHINI, G. M., TORSTENSEN, B. E. & NG, W.-K. 2009. Fish oil replacement in finfish nutrition. Reviews in Aquaculture, 1, 10-57.TURNER, N., ELSE, P. L. & HULBERT, A. 2005. An allometric comparison of microsomal membrane lipid composition and sodium pump molecular activity in the brain of mammals and birds. Journal of experimental biology, 208, 371-381.U.N. 2019. United Nations World Population Prospects 2019. Department of Economic and Social Affairs, Population Division, Online Edition.UGALDE, V., ARMENTA, R. E., KERMANSHAHI-POUR, A., SUN, Z., BERRYMAN, K. T. & BROOKS, M. S. 2018. Improvement of culture conditions for cell biomass and fatty acid production by marine thraustochytrid F24-2. Journal of applied phycology, 30, 329-339.ULRICH, A. E., STAUFFACHER, M., KRÜTLI, P., SCHNUG, E. & FROSSARD, E. 2013. Tackling the phosphorus challenge: Time for reflection on three key limitations. Environmental Development, 8, 137-144.VALLES-REGINO, R., TATE, R., KELAHER, B., SAVINS, D., DOWELL, A. & BENKENDORFF, K. 2015. Ocean warming and CO2-induced acidification impact the lipid content of a marine predatory gastropod. Marine drugs, 13, 6019-6037.VAN DE WAAL, D. B., VERSCHOOR, A. M., VERSPAGEN, J. M. H., VAN DONK, E. & HUISMAN, J. 2009. Climate-driven changes in the ecological stoichiometry of aquatic ecosystems. Frontiers in Ecology and the Environment, 8, 145-152.VAN, T. P. T. H., RHODES, M. A., ZHOU, Y. & DAVIS, D. A. 2017. Feed management for Pacific white shrimp Litopenaeus vannamei under semi‐intensive conditions in tanks and ponds. Aquaculture Research, 48, 5346-5355.VENERO, J., MCABEE, B., LAWSON, A., LEWIS, B., STOKES, A., LEFFLER, J. & BROWDY, C. 2009. Greenhouse-enclosed superintensive shrimp production: Alternative to traditional ponds in US. Global Aquaculture Advocate, 12, 61-64.VERDEGEM, M. & BOSMA, R. 2009. Water withdrawal for brackish and inland aquaculture, and options to produce more fish in ponds with present water use. Water Policy, 11, 52-68.VERDEGEM, M., BOSMA, R. & VERRETH, J. 2006a. Reducing water use for animal production through aquaculture. Water Resources Development, 22, 101-113.
REFERENCES 151
VERDEGEM, M., EDING, E., VAN ROOIJ, J. & VERRETH, J. 1999. Comparison of effluents from pond and recirculating production systems receiving formulated diets. World Aquaculture Baton Rouge 30, 28-33.VERDEGEM, M., HUTTING, S., VAN LOO, J., SCHRAMA, J. & VERRETH, J. 2018. Microorganisms in bioflocs make unavailable phosphate, fixed in dietary phytate, available for Nile tilapia.VERDEGEM, M. C. 2013. Nutrient discharge from aquaculture operations in function of system design and production environment. Reviews in Aquaculture, 5, 158-171.VERDEGEM, M. C., BOSMA, R. & VERRETH, J. 2006b. Reducing water use for animal production through aquaculture. International Journal of Water Resources Development, 22, 101-113.VOLKMAN, J. K., JEFFREY, S. W., NICHOLS, P. D., ROGERS, G. I. & GARLAND, C. D. 1989. Fatty acid and lipid composition of 10 species of microalgae used in mariculture. Journal of Experimental Marine Biology and Ecology, 128, 219-240.VOLLENWEIDER, R. A. 1976. Advances in defining critical loading levels for phosphorus in lake eutrophication. Memorie dell’Istituto Italiano di Idrobiologia, Dott. Marco de Marchi Verbania Pallanza.WALL, R., ROSS, R. P., FITZGERALD, G. F. & STANTON, C. 2010. Fatty acids from fish: the anti-inflammatory potential of long-chain omega-3 fatty acids. Nutrition reviews, 68, 280-289.WANG, Y., LI, M., FILER, K., XUE, Y., AI, Q. & MAI, K. 2017. Replacement of fish oil with a DHA-rich Schizochytrium meal on growth performance, activities of digestive enzyme and fatty acid profile of Pacific white shrimp (Litopenaeus vannamei) larvae. Aquaculture Nutrition, 23, 1113-1120.WASIELESKY JR, W., ATWOOD, H., STOKES, A. & BROWDY, C. L. 2006. Effect of natural production in a zero exchange suspended microbial floc based super-intensive culture system for white shrimp Litopenaeus vannamei. Aquaculture, 258, 396-403.WASIELESKY, W., ATWOOD, H., STOKES, A. & BROWDY, C. L. 2006. Effect of natural production in a zero exchange suspended microbial floc based super-intensive culture system for white shrimp Litopenaeus vannamei. Aquaculture, 258, 396-403.WATTERS, C. A., ROSNER, L. S., FRANKE, A. A., DOMINY, W. G., KLINGER-BOWEN, R. & TAMARU, C. S. 2013. Nutritional enhancement of long-chain omega-3 fatty acids in tilapia (Oreochromis honorum). Isr. J. Aquacult, 65, 1-7.WELTI, N., STRIEBEL, M., ULSETH, A. J., CROSS, W. F., DEVILBISS, S., GLIBERT, P. M., GUO, L., HIRST, A. G., HOOD, J. & KOMINOSKI, J. S. 2017. Bridging food webs, ecosystem metabolism, and biogeochemistry using ecological stoichiometry theory. Frontiers in microbiology, 8, 1298.WEXLER, J. B., SCHOLEY, V. P., OLSON, R. J., MARGULIES, D., NAKAZAWA, A. & SUTER, J. M. 2003. Tank culture of yellowfin tuna, Thunnus albacares: developing a spawning population for research purposes. Aquaculture, 220, 327-353.WHO/FAO 2008. Interim Summary of Conclusions and Dietary Recommendations on Total Fat & Fatty Acids. Joint FAO/WHO Expert Consultation on Fats and Fatty Acids in Human Nutrition., https:// www.who.int/nutrition/topics/FFA_summary_rec_conclusion.pdf.WITHERS, P. J., VAN DIJK, K. C., NESET, T.-S. S., NESME, T., OENEMA, O., RUBÆK, G. H., SCHOUMANS, O. F., SMIT, B. & PELLERIN, S. 2015. Stewardship to tackle global phosphorus inefficiency: The case of Europe. Ambio, 44, 193-206.

152 REFERENCES
WOODWARD, A. J. & SAMET, J. M. 2018. Climate change, hurricanes, and health. American Public Health Association.WÜRZBERG, L., PETERS, J., SCHÜLLER, M. & BRANDT, A. 2011. Diet insights of deep-sea polychaetes derived from fatty acid analyses. Deep Sea Research Part II: Topical Studies in Oceanography, 58, 153-162.WYBAN, J., WALSH, W. A. & GODIN, D. M. 1995. Temperature effects on growth, feeding rate and feed conversion of the Pacific white shrimp (Penaeus vannamei). Aquaculture, 138, 267-279.XU, W.-J., MORRIS, T. C. & SAMOCHA, T. M. 2016a. Effects of C/N ratio on biofloc development, water quality, and performance of Litopenaeus vannamei juveniles in a biofloc-based, high-density, zero-exchange, outdoor tank system. Aquaculture, 453, 169-175.XU, W.-J., PAN, L.-Q., ZHAO, D.-H. & HUANG, J. 2012. Preliminary investigation into the contribution of bioflocs on protein nutrition of Litopenaeus vannamei fed with different dietary protein levels in zero-water exchange culture tanks. Aquaculture, 350, 147-153.XU, Z., WANG, A., WANG, H. & ZHANG, H. 2016b. The Effect of Replacement of Fish Oil by Soybean Oil in Practical Diets, on Tissue Fatty Acid and Expression of Related Genes in Pacific White Shrimp Litopenaeus vannamei. The Israeli Journal of Aquaculture-Bamidgeh.YASHODHARA, B., UMAKANTH, S., PAPPACHAN, J., BHAT, S., KAMATH, R. & CHOO, B. 2009. Omega-3 fatty acids: a comprehensive review of their role in health and disease. Postgraduate medical journal, 85, 84-90.YE, J. D., LIU, X. H., KONG, J. H., WANG, K., SUN, Y. Z., ZHANG, C. X., ZHAI, S. W. & SONG, K. 2012. The evaluation of practical diets on a basis of digestible crude protein, lysine and methionine for Litopenaeus vannamei. Aquaculture Nutrition, 18, 651-661.ZUBKOV, M. V., FUCHS, B. M., EILERS, H., BURKILL, P. H. & AMANN, R. 1999. Determination of total protein content of bacterial cells by SYPRO staining and flow cytometry. Appl. Environ. Microbiol., 65, 3251-3257.

REFERENCES 153


Summary

156 SUMMARY
SUMMARY 157
These days understanding and predicting the impact of anthropogenic climate change caused by greenhouse gas emissions (rising temperatures and acidification of oceans), and exploitation of natural resources (overexploitation and waste production) on ecosystem dynamics is a major issue. With the world population still increasing, there is a demand to produce more food, which impinges with the wish to reduce waste output and carbon footprint and lower the use of limited resources. Aquaculture has the potential to increase production by intensification, but to do so, the sector is facing major sustainability challenges. Two major issues hindering sustainable intensification are waste residues in pond culture water, and the use of capture fisheries derived fishmeal and fish oil in aquaculture diets as source of highly unsaturated omega-3 fatty acids (HUFA).
This thesis explored the potential of developing the “nutritious pond concept”. In such a production system, shrimp (or fish) production is made more ecological while maintaining current high production levels. In nutritious ponds, the focus should shift from feeding the shrimp, to feeding the whole pond. Using this approach, a well-balanced food web develops that provides additional natural food containing energy, protein and HUFA to be used by the culture species. This food web is stimulated by carefully formulated pond feed. The food web will provide supplementary nutrients produced de novo in the pond, and in the same time acts as a natural biofilter making nutrient turnover rates, from waste into natural food, more efficient while reducing waste output.
This thesis aimed to provide insight in the actual contribution of HUFA and protein by primary production to whiteleg shrimp (Litopenaeus vannamei) production in mesocosms. It was hypothesized that shrimp feed could be partly replaced by cheaper fertilizers without compromising on production levels, shifting from direct to indirect shrimp feeding while keeping the input ratio between carbon and nitrogen (C:N) similar. It was hypothesized that shrimp acquire HUFA and protein directly from the food web, enabling to lower dietary inclusion levels of fishmeal and fish oil. Following ecology literature, it was hypothesized that by lowering the total phosphorous input to the pond, natural food would contain more HUFA. It was thought that as a result of the altered stoichiometry of the input (increased C:P), the food web structure and nutritional content could be altered, possibly leading to shrimp eating more natural food. All experiments were carried out in mesocosms, mimicking tropical semi-intensive shrimp ponds allowing primary production.
In chapter 2, the contribution of HUFA from dietary fish oil and fishmeal, and the natural food web on shrimp production was determined. Fatty acid mass balances were computed to distinguish between formulated diet-based and primary production-based HUFA contribution. Absence of both fish oil and fishmeal in the formulated diet did not reduce shrimp production in mesocosms. However, shrimp fed diets lacking fish oil and fishmeal contained only half of the HUFA compared to control shrimp. In both dietary treatment
158 SUMMARY
groups, large dietary quantitative losses of the precursors ALA and LA were observed that were being used as energy source instead of HUFA synthesis. Whereas losses were also observed for EPA and DHA in the control group, there was a remarkable gain for these components in shrimp fed diets free of fish oil and fishmeal. Shrimp acquired at least 32 % of their EPA and 6 % of their DHA content from the algal-based food web. These findings strongly suggested that the pond’s natural food web (primary production) produced HUFA that can support shrimp production, but this required further research.
In chapter 3, the in situ produced HUFA was quantified per food web compartment. Seston was found to contain the highest HUFA content in the mesocosm, while biofloc dominated in terms of biomass. The total HUFA production in the mesocosms was a more than 600 % increase compared to the minimal HUFA-input in the tanks receiving HUFA-deficient diets, pinpointing de novo in situ production. Most of the formulated feed input resulted in organic matter biomass accumulation other than shrimp, as shrimp only retained 12 % of the organic matter input. This showed that the system as a whole is quite efficient in converting nutrient input into different food web compartment, but shrimp production alone is quite inefficient. With shrimp harvesting, only 25 – 27 % of the total mesocosm HUFA content is removed from the system. The majority of the nutrients, including de novo produced HUFA, remained in the food web. This exposed a major challenge on finding ways to reclaim those nutrients from the system in a more efficient way.
This challenge was reinforced by the outcomes in chapter 4, focussing on nitrogen (protein), showing large amounts of the total mesocosm N content could be found in food web compartments other than shrimp. Lowering the feed:fertilizer ratio of the mesocosm input by replacing 50 % of the formulated feed with carbon and nitrogen fertilizers, thus meaning reducing crude protein input by half, lead to a 48 % increase of food web protein contribution to shrimp protein content. Total natural food protein contribution was estimated at 74 %. Feed conversion ratio was below 1.0 in all treatments and decreased with decreasing feed:fertilizer ratio down to 0.48. The nitrogen-to-protein conversion factor of flocculated matter in the water column was determined and found to be 7.31, higher than expected. Estimating food web protein contents using this factor, showed that a similar equivalent of protein as in shrimp, was accumulated in biofloc and periphyton combined, that remained unused in the system after shrimp harvest. Finding ways to better use this protein (nitrogen) in the food web, would allow for reducing crude protein content in the formulated diet. Lowering phosphorous input to the system with 50 %, had no effect on HUFA content of the food web and increased shrimp phosphorous retention from 16 to 34 %.
Replacing up to 50 % of the feed input with carbohydrate and inorganic nitrogen that was directly accessible to the pond’s microbiota, did not result in differences in nutrient distribution and C:N:P ratios in food web compartments including shrimp in chapter 5.
SUMMARY 159
Natural food contribution to shrimp production increased significantly with reducing feeding level and increasing carbohydrate and inorganic nitrogen supplementation, but only if the system was within maximum carrying capacity. Computing mass balances of phosphorous revealed that following a > 30 % reduced system phosphorous input, flows of phosphorous in the food web changed. As a result, phosphorous from detritus flowed into periphyton in such rate that phosphorous depletion would have occurred within one shrimp production cycle. This meant that when developing a nutritious pond diet where part of the feed is replaced with carbon and nitrogen fertilizer, phosphorous should be added too to prevent depletion, but reducing total phosphorous input up to 20 % is possible.
Finally, chapter 6 synthesized the outcomes from this thesis by placing results into a broader context. The outcomes and recommendations following this thesis may contribute to the way we look at aquaculture in relation to sustainability and limited resources, climate change, nutrient flows, nutritional value of aquaculture products, and aquaculture ecology. With a still increasing world population there is need to change our current food production systems towards circular production systems. Climate change is going to affect aquaculture production and can be an extra challenge in order to further develop the nutritious pond concept, especially concerning de novo HUFA production in de pond. Nevertheless, the nutritious pond concept forms a crucial step towards a more sustainable aquaculture, independent of capture fisheries.

Acknowledgements

162 ACKNOWLEDGEMENTS
ACKNOWLEDGEMENTS 163
I want to express my appreciation to all involved supporting my work. Firstly, I want to thank NWO and the consortium of Nutritious Pond Project for supporting this research. Thank you to those critically reviewing my papers and those supporting the research in the experimental facility Carus, and chemical laboratories of Wageningen University and the Netherlands Institute of Ecology (NIOO-KWAW).
Special acknowledgements go to my promotors, Marc Verdegem and Johan Verreth, for giving me the opportunity to pursue a PhD and develop myself as a scientist. It all started with accidentally bumping in to each other in Bangkok, after all the years past my MSc-graduation. It resulted in an opportunity and great challenge to do a PhD within AFI. Coming back to Wageningen University was like coming home again. Johan, being the former AFI-patriarch, thank you for really sharpening my research focus in the first year of my project and for your fond care. Marc, it has been a true pleasure working with you on daily basis. You were always there to listen, always open-minded and ever so kind. It took me a bit of time to get onto the same wavelength (you are a Thinker, me a “Flap-uit”), but once I managed to tune-in, I have been feeling lucky to have you as daily supervisor. I learned a lot from your play with words, both in writing and in speech, and from your ability to always see possibilities. I liked the moments when we found ourselves somewhere “in between” (during breaks, travelling in Asia, or on the phone) and talked about matters of life such as sports or philosophy. Although the road has been bumpy now and then, I now feel more confident in my work, thanks to you.
While unfortunately not officially being my co-promotors, Dedmer van de Waal and Steven Declerck, you were a very important part of the team. Our contact started with me paying an impulsive visit to NIOO in an attempt to get grip on fatty acids and pond ecology. This however, quickly turned into a collaboration. Your help in experimental design, data approach and multiple rounds of detailed feedback on my work were priceless. I enjoyed talking about each other’s fields and I appreciate the possibility you gave me to analyse large part of my samples in the beautiful NIOO-building and laboratories. I am sad our collaboration ends now and hope our paths will meet again in the future, as ecology is of great interest to me.
I want to thank all members of the Nutritious Pond project I got to work with during the years, in Wageningen and Vietnam: Marc, Roel, Dr. Hai, Ms. Trang, Olivier, Tihn, Kabir, Khoa, Matthew, Jonas, Marc and Michael. Especially the visits to Can Tho were real highlights to me. Thank you all for making it happen. I have closed my heart around Vietnam.
Menno ter Veld, Wian Nusselder and Ronald Booms, you were of huge (!) assistance during developing and building the mesocosms in Carus from scratch. Day or night, weekday or holiday, you were always there to back me up. Your practical and assertive approach and assistance, speeded-up the process in creating “little Vietnam” in experimental room B 007.

164 ACKNOWLEDGEMENTS
Constructing and designing the framework, tanks, electricity network and room ambient control systems were challenging, yet a lot of fun. Menno and Wian, I very much liked your Christmas BBQs and also the time we hung out during our motorbike-day. The whole Carus-team was of great value in taking care of the mesocosms between experiments; thank you so much for your supervision Emily Roux. Ronald Booms, you have been essential. Because there was no internal knowledge or experience concerning tropical mesocosms and salt water analyses, we had to come up with completely new protocols. You put in so much energy, even showing up during the late hours of christmas eve to help me finish on time. You helped me so much in forming the concept into a workable practical approach. Thank you for your commitment. Nico Helmsing, under your supervision and care I was able to analyse my samples at NIOO in a very efficient way. Thank you very much for your energetic spirit.
Lisette van Noord, you were a great contributor to one of the experiments and, with help of Sem, you showed real dedication and hard work. With you around taking care of the mesocosms, I found it very easy to let things go because I knew under your strict eyes, everything was under control. It was very nice to work with you and I wish you all the best in your future career.
Arjen Roem, it was -and always is- a great pleasure catching up with you. Unfortunately, your presence in the project got less over time as the activities around the Nutritious Pond project shifted over colleagues within Skretting. Nevertheless, it has been great having you around during the years through other contact moments. You always have done your very best for me, including helping me with my career. I also feel lucky to have been involved around some of your activities within Skretting Africa, the absolute highlight was helping out in the booth at the conference in Cape Town. Although by now you moved abroad again, I wish we will still see each other spontaneously now and then somewhere in the world.
When my family and close friends had already given me the idea to go for a PhD and were actively supporting that idea, I was still hesitating for some months. But finally, it was you Matthew Owen, who gave the final push to go for it. When we spoke about this matter, we only had a (distant) business connection, but how fun it turned out that after your “Go For That PhD Push”, we were - to our surprise - ending up in the same projects: during the Nutritious Pond project, and now again in my new job. Thank you for your support.
A huge thank you to all my colleagues from AFI: both staff and fellow PhD-students! I truly enjoyed hanging out together in the AFI-corner, or enjoying more thrilling activities like sports-days and travelling different countries through various trips, visiting international conferences or courses. The international mix in our group was absolutely great where I got to know many more cultures, foods and customs. Special thanks go to all my PhD-
ACKNOWLEDGEMENTS 165
colleagues, but I like to highlight Marit Nederlof and Kim Tran: my PhD-Girl-Squat. We laughed, cried, cried with laughter, danced, cooked and went rogue. But most important of all: we supported each other in work and life, I miss you both. Joost van Loo, thank you for your humor and stirring boldness: you are a wonderful person. Additionally, thanks for your contribution to my paper. Also, Mahmood Haidar: you might be one of the most positive persons I know. Talking to you is always inspiring and great fun. Thanks for helping me clinging-on in the PhD-madness, especially in the time being close to the finish. Geert Wiegertjes, I hold great respect for you. I highly appreciate the way you inspire others around you (including me), the way you deal with different people during all their different flows of energy, your discreteness and your ability to be very direct in an honest yet constructive way. AFI is lucky to have you. Big thanks to the ladies of the secretary; Eugenia Halman, Gera Dikken and Annet Hage-Willink for all your help, support and kind words over the years. In special I like to acknowledge Marjon Hinssen: your messages, kind questions and attention during moments I was struggling (and you always noticed!) were warming and encouraging. All your little moments of special attention and gestures had the biggest effect. Thank you Marjon. You. Rock. I often re-believed in myself, thanks to you. I am wearing the T-shirt al lot! Henk van Roosendaal and Yvonne Bos, whilst taking care of Zodiac, you took care of me too. The many talks we had along the way were a true delight. Thank you for those nice (coffee) moments in between.
Sharing an office means sharing both the burden and the fun. Seremaia Turqiri, your spirit made a big impression on me. Your life experience, wisdom, soft view on the world and your intrinsic calmness, are intriguing. I will try to keep that Fiji- & Tonga-spirit with me. Olivier Joffre, in the beginning of my PhD, you and me had the office to ourselves where you helped me becoming a PhD-student whilst keeping a healthy and sane brain. The best bit about you, is that you spread laughter around you with your (somewhat dark) humour and your funny French-ness. I very much liked visiting you back home in Cambodia, where I could have a look into your world. I wish we will stay in touch! Thomas Staessen, Folasade Elesho and Yale Deng, the last two years of my PhD we shared the office with the four of us. A very weird bunch if you ask me. But... I like weird. I could not have done it without you! Thank you Thomas the Grumpy, Princes Sade, and Yale the Wise. I will really miss you. Oh, and Thomas and Sade, please stop hitting each other.
Friends make good times better and hard times easier. I want to thank my friends from all parts of life. In special I want to mention Anne Baars - Zeddeman and Anne Ammerdorffer (a.k.a. Lula and Annelief). Although you two got me into this – a decision I doubtfully re-evaluated so many times along the road - I can now say to you I am happy you convinced me to jump in as well. Being in this together with the three of us, made the difficult parts lighter and way more fun. I truly enjoyed our frolicsome joint-complaining and boisterous suffering. Having you two beside me at my defence as paranymphs is like closing the circle:

166 ACKNOWLEDGEMENTS
samen uit samen thuis. I am deeply grateful having the very best of friends: my dear Lula, Annelief and Lieneke Pickup, you enrich my life. Thanks for being there and being you. You are my wonder-women. Family is everything. Their love, feedback and encouragement are my lifelines. I could not have started, lived and completed this PhD without them. I like to convey my deepest respect and gratitude to my amazing mom Ina, my awesome sister Enya, and bonus-dad Hans, for being my solid ground. To my love Philip, for offering me happiness, laughter and stability. To Tineke & Martin, for contributing in my progress using their Bijl-Bonus-Method. And to my dearest Freek, for being the joy of my life. Thank you all. Knowing “you got my back” has been vital during this PhD-process.

ACKNOWLEDGEMENTS 167


About the author

170 ABOUT THE AUTHOR

ABOUT THE AUTHOR 171
Devi Hermsen was born on 19th December 1985 in Dodewaard, The Netherlands. Her broad interests lie within life sciences and include evoluti onary biology, top-predator behaviour, sustainability challenges, and the role of nutriti on and environment on health and performance. She completed pre-university educati on in 2004 with a Nature & Health profi le at Stedelijk Gymnasium Nijmegen. She conti nued with a BSc and MSc Biology at Wageningen University, focussing on Zoology. A second MSc in Animal Nutrition followed. During her studies, she was involved in research projects on scent in relation to human partner selection, the effect of different fibre types on satiation, welfare and behaviour in the sleddog-husbandry, the role of the dingo in the Australian ecosystem, and forest conservation in Kenya. Until the opportunity came up to start a PhD, Devi acquired some years work experience in developing teaching-methods, functioning as event organiser, and gained more knowledge on animal nutrition by working as Global Product Manager Aquaculture in the feed additive industry. Her enrolment as PhD-candidate in September 2014, provided her a new opportunity and challenge to actively contribute to making the feed-to-food sector more sustainable. Devi’s PhD-project was carried out in The Netherlands and Vietnam, within the joint research program “Nutritious Pond Systems” between Wageningen University (The Netherlands), Can Tho University (Vietnam), Skre tting Nutreco (The Netherlands) and WorldFish (Malaysia), with great contribution of the Netherlands Institute of Ecology (NIOO). This current thesis is a result of this joint research project. After her PhD, Devi will continue her career focussing on innovation and sustainability.

List of publications

174 LIST OF PUBLICATIONS
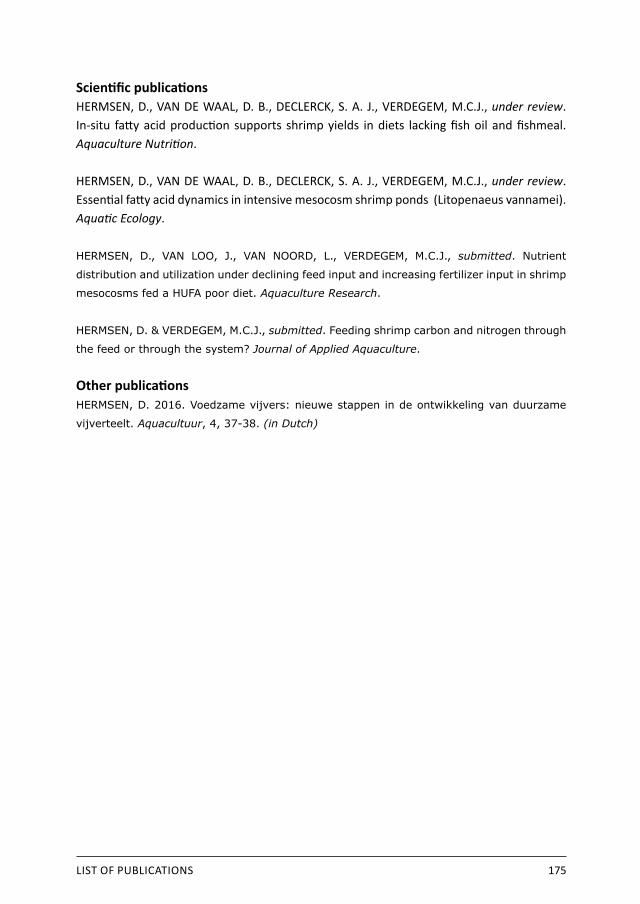
LIST OF PUBLICATIONS 175
Scientific publicationsHERMSEN, D., VAN DE WAAL, D. B., DECLERCK, S. A. J., VERDEGEM, M.C.J., under review. In-situ fatty acid production supports shrimp yields in diets lacking fish oil and fishmeal. Aquaculture Nutrition.
HERMSEN, D., VAN DE WAAL, D. B., DECLERCK, S. A. J., VERDEGEM, M.C.J., under review. Essential fatty acid dynamics in intensive mesocosm shrimp ponds (Litopenaeus vannamei). Aquatic Ecology.
HERMSEN, D., VAN LOO, J., VAN NOORD, L., VERDEGEM, M.C.J., submitted. Nutrient
distribution and utilization under declining feed input and increasing fertilizer input in shrimp
mesocosms fed a HUFA poor diet. Aquaculture Research.
HERMSEN, D. & VERDEGEM, M.C.J., submitted. Feeding shrimp carbon and nitrogen through
the feed or through the system? Journal of Applied Aquaculture.
Other publicationsHERMSEN, D. 2016. Voedzame vijvers: nieuwe stappen in de ontwikkeling van duurzame
vijverteelt. Aquacultuur, 4, 37-38. (in Dutch)


WIAS Training and supervision plan

178 WIAS TRAINING AND SUPERVISION PLAN
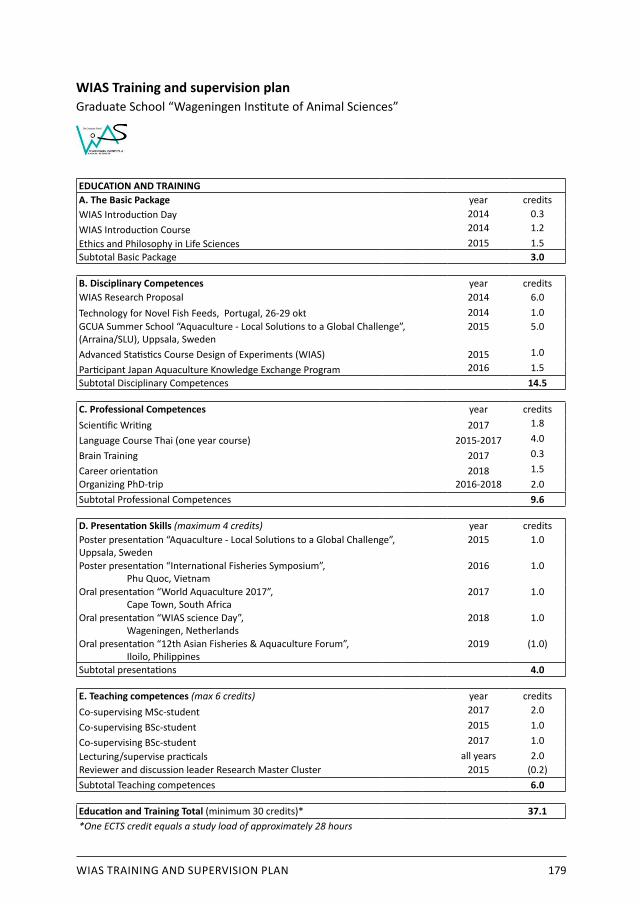
WIAS TRAINING AND SUPERVISION PLAN 179
WIAS Training and supervision plan Graduate School “Wageningen Institute of Animal Sciences”
EDUCATION AND TRAININGA. The Basic Package year creditsWIAS Introduction Day 2014 0.3WIAS Introduction Course 2014 1.2Ethics and Philosophy in Life Sciences 2015 1.5Subtotal Basic Package 3.0
B. Disciplinary Competences year creditsWIAS Research Proposal 2014 6.0Technology for Novel Fish Feeds, Portugal, 26-29 okt 2014 1.0GCUA Summer School “Aquaculture - Local Solutions to a Global Challenge”, (Arraina/SLU), Uppsala, Sweden
2015 5.0
Advanced Statistics Course Design of Experiments (WIAS) 2015 1.0
Participant Japan Aquaculture Knowledge Exchange Program 2016 1.5Subtotal Disciplinary Competences 14.5
C. Professional Competences year creditsScientific Writing 2017 1.8
Language Course Thai (one year course) 2015-2017 4.0
Brain Training 2017 0.3
Career orientation 2018 1.5Organizing PhD-trip 2016-2018 2.0Subtotal Professional Competences 9.6
D. Presentation Skills (maximum 4 credits) year creditsPoster presentation “Aquaculture - Local Solutions to a Global Challenge”, Uppsala, Sweden
2015 1.0
Poster presentation “International Fisheries Symposium”, Phu Quoc, Vietnam
2016 1.0
Oral presentation “World Aquaculture 2017”, Cape Town, South Africa
2017 1.0
Oral presentation “WIAS science Day”, Wageningen, Netherlands
2018 1.0
Oral presentation “12th Asian Fisheries & Aquaculture Forum”, Iloilo, Philippines
2019 (1.0)
Subtotal presentations 4.0
E. Teaching competences (max 6 credits) year credits Co-supervising MSc-student 2017 2.0
Co-supervising BSc-student 2015 1.0
Co-supervising BSc-student 2017 1.0Lecturing/supervise practicals all years 2.0Reviewer and discussion leader Research Master Cluster 2015 (0.2)Subtotal Teaching competences 6.0 Education and Training Total (minimum 30 credits)* 37.1*One ECTS credit equals a study load of approximately 28 hours

Colophon
FundingThis research was financially supported by NWO, Nederlandse Organisatie voor Wetenschappelijk Onderzoek (Den Haag, The Netherlands), through the project grant “Nutritious Pond Farming in Vietnam” (W 08.250.101), a partnership between Wageningen University, Cantho University, Skretting Nutreco (The Netherlands and Vietnam) and WorldFish. The printing of this thesis was financially supported by Wageningen University.
Cover imageThe cover holds a photo taken by one of NASA’s satellites, and it shows primary production in the ocean. Credits: NASA/U.S. Geological Survey/ Feldman, G. C., Ocean Color Web, Eds. Kuring, N., Bailey, S. W., Scott, A. M., Page access 9th July 2019. NASA Goddard Space Flight Center. 18th June 2018, https://oceancolor.gsfc.nasa.gov/gallery/#&gid=1&pid=1
Design, layout and printProefschriftmaken.nl
Figures thesisDevi Hermsen

Nutritious Ponds Valorising waste using natural production
Devi Hermsen
Nutritious Ponds Valorising waste using natural production
Devi Hermsen
Hermsen, Devi 11052 Cover def v3.indd Alle pagina'sHermsen, Devi 11052 Cover def v3.indd Alle pagina's 17-3-2020 16:51:3717-3-2020 16:51:37