fjM cPzo/ - WUR eDepot
162
fjM cPzo/ s7st& 99/ FOLIAR DIAGNOSIS, NUTRITION AND YIELD STABILITY OF BLACK PEPPER (PIPER NIGRUM L.) IN SARAWAK P. W.F. DE WAARD IISLIOTHEEK DE.S NN08201,441 T™?? 10 *
-
Upload
khangminh22 -
Category
Documents
-
view
0 -
download
0
Transcript of fjM cPzo/ - WUR eDepot

fjM cPzo/ s7st& 99/
FOLIAR DIAGNOSIS, NUTRITION
AND YIELD STABILITY OF BLACK PEPPER
(PIPER NIGRUM L.) IN SARAWAK
P. W. F. DE WAARD
IISLIOTHEEK DE.S
NN08201,441 T ™ ? ? 1 0 *

FOLIAR DIAGNOSIS, NUTRITION
AND YIELD STABILITY OF BLACK PEPPER
(PIPER NIGR UM L.) IN SARAWAK
Proefschrift ter verkrijging van de graad van
doctor in de landbouwwetenschappen
op gezag van de Rector Magnijicus, Dr. Ir. F. Hellinga,
hoogleraar in de cultuurtechniek,
te verdedigen tegen de bedenkingen van een commissie uit de
Senaat van de Landbouwhogeschool te Wageningen
op vrijdag 7 tnaart 1969 te 16 uur
door
P. W. R DE WAARD
KONINKLIJK INSTITUUT VOOR DE TROPEN 1969

STELLINGEN
I De sterke vermindering van de opbrengst van de peperplant na de eerste oogst moet worden toegeschreven aan de uitputting van de plant in het eerste oogstjaar.
Dit proefschrift.
II Indien kunstmest niet breedwerpig wordt gegeven, is de bladdiagnose de meest betrouwbare routinemethode voor het vaststellen van de voedings-behoefte van overjarige gewassen.
Dit proefschrift.
m Het onderzoek naar de handhaving en verhoging van de bodemvrucht-baarheid van tropische gronden moet veel sterker worden gestimuleerd en gecoordineerd.
IV De nadelige gevolgen verbonden aan het introduceren van de teelt van nieuwe, hoog producerende rijst-, tarwe-, en malsrassen in ontwikkelings-landen worden te weinig belicht.
M. N. HARRISON: Int. Development 10, 3,1968: p. 9-13. SAM-CHUNG HSIEH: Int. Development to, 3,1968: p. 6-9.
V In het kader van de noodzaak tot kostprijsreductie is de cultuur van peper (Piper nigrum L.) in 2 m hoge hagen te prefereren boven de traditionele me-thode van teelt tegen 4 m hoge palen.
Annual Report of the Research Branch, Department of Agriculture, Sarawak 1965.

VI Afwezigheid van responsie van de plattelandsbevolking in ontwikkelings-landen op economische prikkels is slechts schijnbaar; in dit verband is in-schakeling van sociologisch veldonderzoek voor uitvoering van effectieve ontwikkelingshulp onmisbaar en nog te weinig doorgevoerd.
G. VERHAEGEN: Cahiers Econ. et Sociaux 6, i, 1968: p. 100-27.
VII Opslag van informatie in passend gecodeerde vorm, welke bewerkt kan worden met behulp van moderne computertechnieken, opent aantrekke-lijke vooruitzichten voor een verantwoorde beoordeling en een geinte-greerde planning van ontwikkelingsprojecten.
J-G. ABREU: Ceres, FAO Review 1, 3,1968: p. 25-8. G. DUBOIS: Paper presented at the conference on agricultural research priorities for economic development in Africa-Abidjan, Ivory Coast 5-12 April 1968. FAO 1968.
vni In de strijd tegen de infectie door Phytophthora palmivora van de wortels van Piper nigrum L. cultivar Kuching verdient toepassing van resistente onder-stammen de voorkeur boven het inkruisen van resistentiefactoren met behulp van de methode der herhaalde terugkruisingen.
Pepper section: Annual Report of the Research Branch of the Department of Agriculture, Sarawak 1966.
IX Hoewel bij de opleiding van voorlichters in ontwikkelingslanden veel aan-dacht wordt besteed aan landbouwvoorlichtingstechnieken, heeft in dit kader de tussenmenselijke relatie van voorlichter en boer zeer onvoldoende de aandacht; aan dit ernstige gebrek zijn waarschijnlijk de povere resul-taten van het voorlichtingswerk in die landen toe te schrijven.
X
Effectieve landbouwvoorlichters worden gekenmerkt door hun natuur-lijke aanleg voor dit werk; met deze karakteristieke eigenschap wordt in de praktijk in de ontwikkelingslanden onvoldoende rekening gehouden.
Proefschrift van P. W. F. de Waard Wageningen, 14 januari 1969

ERRATA
p. 34, Table 2 : 65 C is 70 C
p. 52, line 1 below table 9 : 4 is 2
p. 55, par. 6.2., line 5 : 3 is 6.1.
p. 56, table 11, Mean % dr. m. for Mg is 0.017
Standard deviation for K is 0.02
p. 59, line 7
p. 61, line 4 and 5
p. 75, line 2 read
fig. 5
p. 86, par. 7.6.1.5., line 15
p. 89, par. 8 .1. , line 8
p. 106, Ch. 9, line 13
p. 102, 112, 118, 132
p. 118, line 30
p. 139, line 5
p. 141, line 10
p. 143, line 28
read 0.17
read 0.18
9 1 % is 66%
transpose 28 and 26
deficient stages compared with full treatment
® in upper left corner is O
for veinal read visual
1.1.1 is 3.1.1
2.1.6.2 is 2.1.7.2
antagonism should be within quotation marks
1.00 is 1.10
16 is 6
16 is 6
16 is 6
Thesis of P. W. F. de Waard „Foliar diagnosis, nutrition and yield stability of black pepper (Piper nigrum L.) in Sarawak."

CONTENTS
Chapter 1. Introduction 1 1.1 The country 2 1.2 The climate 3 1.3 Land under shifting cultivation 4 1.4 The soils 6 1.5 Brief history of pepper growing 7
Chapter 2. The cultivation of pepper 8
2.1 Crop details 8 2.1.1 The root system 8 2.1.2 The vegetative growth 9 2.1.3 The generative phase 9 2.1.4 Soil data 10 2.1.5 Cultivation data 10 2.1.6 Traditional use of fertilizer materials 10 2.1.7 Difficulties with the use of new land and manufactured
fertilizers 11 2.1.7.1 Types of fertilizer 11 2.1.7.2 Fertilizing, flowering and yielding 12 2.1.7.3 Physiological aspects of crop production 12 2.2 Experimental results in pepper 13 2.3 Conclusion 13
Chapter 3. Foliar diagnosis in humid tropical regions 14
3.1 Efficiency of crop nutrition 14 3.1.1 The influence of soil moisture 14 3.1.2 The nutrient supply mechanism 15 3.1.3 The role of the roots 16 3.1.4 Efficient supply of nutrients to the soil/root interface 17 3.2 Methods of fertilizer applications 17
vii

3.2.1 Broadcasting of fertilizer 18 3.2.2 Placement of fertilizer 18 3.2.3 Tropical soils 19 3.2.4 Concentrated placement in pepper 19 3.3 Diagnosis of nutrient requirements 19 3.3.1 Soil analysis 20 3.3.2 Fertilizer experiments 20 3.3.3 Visual symptoms 21 3.3.4 Foliar diagnosis 21 3.4 Foliar diagnosis versus soil analysis or field trials 21
Chapter 4. Review of literature 23
4.1 Nutrition of black pepper 23 4.2 Foliar diagnosis 23 4.2.1 Plant specific factors influencing the chemical concentration 24 4.2.1.1 The organ to be sampled 24 4.2.1.2 The effect of age and position of the leaf 25 4.2.1.3 Effect of size and thickness of the leaf 25 4.2.2 Seasonal effect affecting the chemical concentration 25 4.2.2.1 Rainfall 25 4.2.2.2 Sunshine and light 26 4.2.3 The effect of the planting medium 26 4.3 Sources of error introduction 27 4.3.1 Sampling phase 27 4.3.2 Preparative phase 27 4.3.3 Analytical phase 28 4.4 Interpretation 28 4.5 Expression of results 31
Chapter 5. Analytical methods 31
5.1 Leaf analysis 31 5.2 Variation introduced by leaf preparation 32 5.2.1 Cleaning of the leaves 33 5.2.2 Removal of the midrib 33 5.2.3 Drying temperature 33 5.2.4 Losses upon storage 35 5.3 Soil analysis jg
Chapter 6. The sampling procedure y,
6.1 Variation of concentrations due to position, age, petiole etc 37 6.1.1 Preliminary survey of N.P.K.Ca and Mg ' 37 6.1.2 Principal work 40 6.1.2.1 The sampling population 40 6.1.2.2 Methods of examination 4c
viii

6.1.2.3 The effect of leaf size 46 6.1.2.4 The effect of leaf thickness 46 6.1.2.5 The effect of the time of the day 46 6.1.2.6 The effect of sunshine and shade 46 6.1.2.7 The effect of leaf age 47 6.1.2.8 The effect of different stems 48 6.1.3 The analytical error 49 6.1.4 The sampling error / 50 6.1.4.1 The error of bulk sampling 50 6.1.4.2 Reduction of error 51 6.2 Sampling techniques 55 6.2.1 Adequate representation 56 6.2.2 Sampling intensity in areas of different physiological con
dition 56 6.3 Seasonal variation 57 6.4 Proposed sampling procedure 64
Chapter 7. Nutritional deficiencies and foliar diagnosis 65
7.1 Preliminary considerations 65 7.2 Pot experiment 66 7.2.1 Details of the experiment 66 7.2.2 Symptoms of deficiency in pepper leaves 69 7.3 Deficiency symptoms under field conditions 71 7.4 Chemical concentrations in the leaves 72 7.4.1 Treatment effects 73 7.4.2 Vegetative health and foliar concentrations 76 7.5 Criteria for chemical concentrations in leaves 81 7.6 The chemical leaf composition of mature vines 81 7.6.1 Treatment of data 83 7.6.1.1 Nitrogen and phosphate 83 7.6.1.2 Potassium 84 7.6.1.3 Calcium 85 7.6.1.4 Magnesium 85 7.6.1.5 Triangular diagrams 86 7.6.1.6 Malnutrition and foliar composition 86 7.7 Conclusion 88
Chapter 8. The injluenze of applications of fertilizer on foliar concentrations of 5 major nutrients 88
8.1 Soil characteristics 89 8.2 Field experiment 89 8.2.1 Details of the experiment 89 8.2.2 The treatments 90 8.2.3 Rating of visual symptoms 92
ix

8.2.4 Leaf sampling 95 8.3 The effect on visual deficiencies 95 8.4 The effect on leaf concentrations 97 8.5 The effect on leaf ratios 102 8.6 Discussion 105 8.7 Conclusion 106
Chapter 9. Physiological exhaustion and yield stability 106
9.1 Experimental details 107 9.2 Role of the 5 major nutrients 110 9.3 Leaf composition and yield 114 9.3.1 Leaf N, leaf P and log N/P 114 9.3.2 K, Ca and Mg 118 9.3.3 Deficiencies 121 9.4 Nutrition, vine deterioration and yield development 122 9.5 Conclusion 126
Chapter 10. Agricultural aspects of pepper nutrition 127
10.1 Patterns of traditional fertilizing 127 10.2 Early postwar nutrition 128 10.3 Present crop nutrition 130 10.4 Evaluation of a new fertilizer policy 132 10.5 Conclusion 136
Summary (Eng.) 138
Summary (Ned.) 140
Summary (Malay) 142
Literature 145
VOORWOORD / PREFACE
Na de voltooiing van dit proefschrift wil ik gaarne mijn dank betuigen aan alien, die hieraan hun onmisbare medewerking hebben verleend.
In de eerste plaats U, Hooggeleerde Schuffelen, Hooggeachte Promotor. Uw interessante colleges hebben een bijzondere belangstelling bij mij ge-wekt met betrekking tot de bladanalyse als criterium voor de minerale voeding van gewassen. Ik beschouw het dan ook als een voorrecht Uw colleges te hebben kunnen volgen gedurende mijn studietijd. Enkele jaren later hebt U mijn voorstel, een onderwerp te bewerken betreffende bladanalyse en de minerale voeding van peper, zeer aangemoedigd. Uw aan-wijzingen en kritische opmerkingen zijn van bijzonder veel belang geweest voor een voorspoedig verloop van het werk. Ik ben U buitengewoon erken-telijk voor de steun, welke ik van U mocht ontvangen.
Ada Hoogendijk en Marry van de Bospoort, jullie toewijding en accura-tesse is van onschatbaar belang geweest voor de uitvoering van de vele analyses.
Veel dank ben ik verschuldigd aan Ir. J. Th. van Schouwenburg voor de gastvrijheid, welke ik heb genoten in zijn laboratorium. De Heer Walinga ben ik zeer erkentelijk voor zijn hulp en praktische wenken tijdens het analysewerk.
De kundige computerprogrammering van de statistische bewerkingen door de Heer M. Keuls is van essentieel belang geweest. Ik ben U buitengewoon erkentelijk ervoor, dat U hiervoor tijd ter beschikking hebt willen stellen. Dr. Ir. M. A. J. van Montfort dank ik voor zijn hulp met betrekking tot de statistische verwerking van de gegevens.
Beste Rosanow, gaarne dank ik U voor de hulp en aanmoediging, welke ik van U ontving, zowel hier als in Serawak.
De voormalige directeur van de Afdeling Agrarisch Onderzoek van het Koninklijk Instituut voor de Tropen, Dr. R. Brink, en de huidige directeur, Ir. H. Ph. Huffnagel, ben ik zeer erkentelijk voor de tijd en de faciliteiten, die mij ter beschikking zijn gesteld voor de bewerking en de uitgave van dit proefschrift. Gaarne wil ik mijn dank uitspreken aan het bestuur van de Stichting GresshofPs Rumphius Fonds voor de verleende subsidie.
xi

Mej. A. B. Marschall en Mevr. Efthymiou-Marschall ben ik zeer erkente-lijk voor de verzorging van het typewerk, evenals Mej. J. M. van der Horst voor de verzorging van de grafieken en Mevr. G. Duvert voor het persklaar maken van het manuscript.
Voorts dank ik alien, die op enigerlei wijze hebben bijgedragen aan het totstandkomen van dit werk.
Many people in Sarawak have been involved in the work for this thesis. In the first place I wish to extend my gratitude to the former Director of Agriculture Mr. J. Cook for permission to publish the results of this work. I am much indebted for his support.
Messrs. Philip Ong Boon Teck, Christopher Liew Chung Heng, Soo Tan Kui and other assistants, your continuous dedication to this work was absolutely magnificent. I am very indebted to each of you. You taught me the essence of co-operation.
Gardeners of Sarawak, to you my thanks for showing your faith in me by making available your gardens for experimentation; your co-operation under trying conditions has been highly appreciated.
Beste Ko Andriesse, mijn dank voor de veldbodemkundige opnamen van de proefvelden en niet in het minst voor je altijd kritische opmerkingen.
John Dunsmore, I am very grateful for your quiet background support and for the co-operation which I have received from you.
John Bailey, I greatly appreciated your assistance. Zeer veel dank ben ik verschuldigd aan mijn vader en moeder, die mij in
staat hebben gesteld de studie in Wageningen te volgen en te voltooien. Tenslotte, ik ben jou, Marianne, bijzonder dankbaar voor je essentiele
steun in het buitenwetenschappelijke vlak, waardoor dit proefschrift een bijzondere dimensie heeft gekregen.
xu

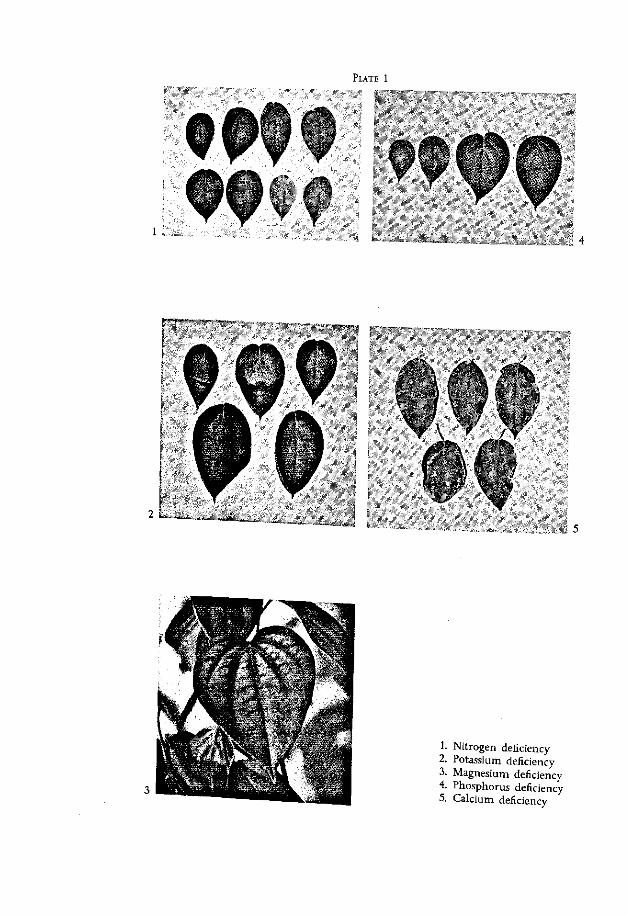
PLATE 1
1 .
. * * ' • ' .
w
1. Nitrogen deficiency 2. Potassium deficiency 3. Magnesium deficiency 4. Phosphorus deficiency 5. Calcium deficiency

i. INTRODUCTION
The State of Sarawak in East Malaysia is one of the major pepper producing countries of the world. Its black and white pepper of commerce is 2 differently prepared forms of the fruit of the climbing vine Piper nigrum L. cv. Kuching. Both types are produced for export, which amounts to some 17 000 metric tons per year, equivalent to 20-25% of the world production. Smallholders cultivate pepper as a cash crop. Under optimal conditions the commonly planted cultivar Kuching has a considerable yield potential. Whereas prior to 1942 mature vines remained healthy and readily productive for 20 or more years, after 1947 regular bearing decreased ever more rapidly. Eventually, only in the first year of production of this perennial crop a satisfactory yield was obtained. This reduction of the economic life cycle, the high cost of bringing a garden to maturity and the loss of yield gave rise to much concern.
A preliminary survey disclosed that a continuous healthy plant condition can be maintained during the initial 2 years of vegetative development, when local methods of cultivation are employed. In the subsequent third year when usually an abundant first production is obtained, a rapid vine deterioration is observed during fruit development. This phenomenon coincides with months of heavy rainfall. Mild foliar symptoms suggesting incipient deficiencies in earlier stages, gradually increase in severity and are frequently followed by acute leaf fall. Abscission of fruit spikes takes seldom place under these conditions. Die-back of fruiting branches may develop to an extreme degree. The occurrence of the adverse phenomena entails an abrupt fall of productivity in the fourth and subsequent years, depending on the severity of the decline. In remarkable contrast, a comparable abundance of production in prewar years was rarely, if ever, followed by this pattern of decline.
The preceding observations seem to recognize the primary importance of improving methods of crop nutrition. Therefore, research was initiated with the main emphasis on the nutritional aspect. As a first step a thorough appraisal was made of the origine of the characteristic pattern of decline. In view of the relative obscurity, hitherto existing as regards factors con-

trolling nutrition and physiology of pepper, indispensable basic information is presented somewhat comprehensively. In chapters i and 2 a detailed description is presented of the major aspects of pepper cultivation. In chapter 3 consideration is given to the choice of the methods of nutritional diagnosis. In chapter 4 and following the selected method has been further evaluated to serve as an instrument for the determination and control of the nutritional condition of the crop.
I.I THE COUNTRY
Sarawak is situated along the northern coast of the Island of Borneo between 2° and 50 latitude north and no" and 115° longitude east. Approximately 80% of this country of 125.000 km* is covered by primary forests and mangrove vegetation, secundary forests and extensive areas of sheet lalang (Imperata cylmdrica). The remaining 20% of the land is occupied by rivers! beaches and land under permanent cultivation. Large rivers meander from the mountains and hills in the south and east on the border with Indonesian Kalimantan, across the country towards the South China Sea. With their tributaries these rivers provide a natural drainage system to carry off the excess amount of water which is precipitated by the abundant rainfall. Approximately 60% of it falls within the period of the monsoon from early l o w e T n ^ V ^ P ^ d i s t r i b u t i o n "gul-rly causes floods in the w T X , ' T u T P a r t k u l a r l y w h e * these border on rivers, or when they are enclosed by hills or mountainous terrain
T S Z 7 ^ 7 N ' T d e l t a ,S ' a n d m a n g r O T es , alternating with forests l a n Z n e a r i ^ ^ T ^ ^ ^ T h e r e a f t e r a fla< to undulating e a c S a S h T fm e m e t 0 ^ " ^ t e " a i n a n d r a ^ s of hills§
5££ iJSn?up to 7 m-The land is l a r g e l y c o v e r e d -ith den-E l f 1 7 , U u g l £ ° r W i t h m e n s i v e s t r e t c h e * of sheet lalang. Nearer to and on the southern border the hills are approximately 660-Jo
calt S t W rtherin.g ge0l0gkal f ° r m a t i o n s in ** — t r y S ^ ^ & L J U r M S , C , C f e t a C e 0 U S ' a n d T e r t i a rX- Erosive forces! p o s r i v S o T s ^ S m ° V e m e n t S f d fluctuati0- of the sealevel ex-
« ^ 2 S £ S J i T t M r o i r d , - t a a'prevaiiing iandscaPe that
with nu,deLety^^^ * S i l T ^ 1 *"*&** ^ ^ developed on the parent ™Tf u Extensive t r a C t S ° f l a n d h a v e b e e n
mainl/red-ye ^ T f S ' ^ r e fU a l S o i l s c a n b e classified in with the worid S c a t " n n£T ^ ^ ^ ^ i n a C C O r d a n c e
of Sarawak ^ ^ & ^ £ Z £ ^ £ &

river banks alluvial deposits prevail; they are of varying composition, depending on the material in the catchment area of the river concerned.
There is a large potential of suitable agricultural land present in Sarawak (LEE). Extensive areas under communal ownership are still under shifting cultivation. This method of land use is traditional with the native Dayak tribes. Their farming, which is concerned predominantly with the cultivation of upland rice, is undertaken on slopes of hills and mountains. Adequate measures to prevent soil erosion are usually omitted.
Chinese farmers have settled on relatively small areas varying from 4-8 ha in size; their land is usually partly cultivated and partly left under natural vegetation. The majority of these farms are grouped in rather isolated, small communities, scattered over the countryside in places wherever the Government has issued land titles. These growers mainly cultivate cash crops, such as rubber, pepper, oranges and vegetables for local markets or for export.
In these much more intensive systems of Chinese crop cultivation clean-weeding is normal practice, and effective methods of soil protection are rarely applied. Sheet erosion is commonly observed. Normally soil depth may vary from 5 to 7.5 cm on the upper slopes of hills with unprotected soils, whereas in the valleys or on the river banks the soil may be 2.5 to 3 m deep or more. Outside jungle areas and on land under permanent cultivation subsoil is usually exposed.
1.2 THE CIIMATE
Characteristic for the climate in this country are the high rainfall, a uniform temperature and a high relative humidity, which is typical for the hot and humid tropical regions. There is little significant variation in day-length and humidity throughout the year. According to KOPPEN the climate can be classified as an Af climate. This climate may be considered as near-optimal for black pepper (COBIEY, MAISTRE, RUTGERS).
The records discussed in the following paragraphs have been collected by the meteorological station at Kuching Airport (SEAL).
Rainfall
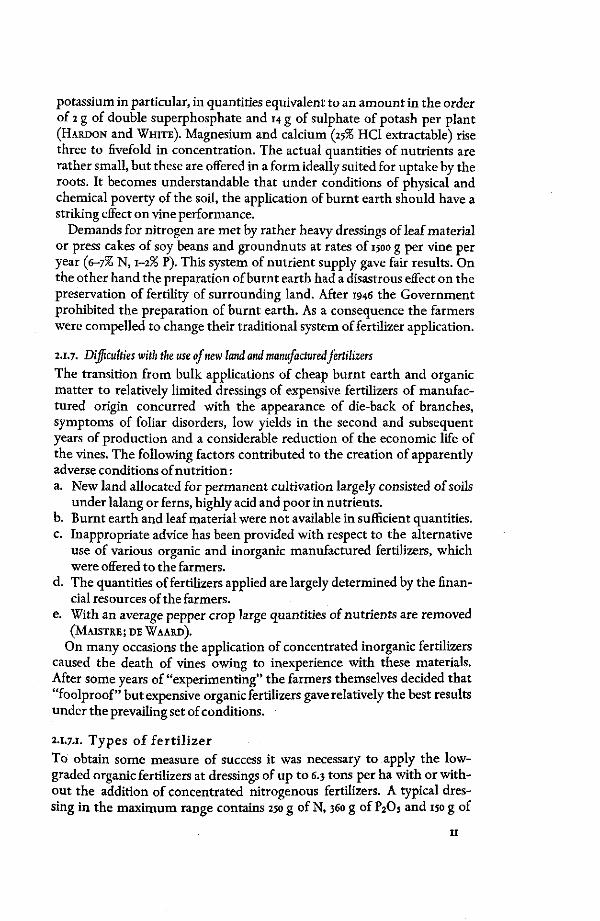
The average annual rainfall (fig. 1) over a period of 71 years equals 3950 mm. Most of the rain is precipitated in the months from October to March, during the north-east monsoon. A peak in the rainfall is attained in January or February, when occasionally 1000-1500 mm/month may be recorded. In the south-west monsoon from April to August less rain falls, but in no month does the average fall below 175 mm/month. An average of less than 250 mm/month is recorded in only 4 months. Occasionally monthly precipitations below 75 mm are recorded between June and September in very dry years. The country falls well within the continuous wet belt with an average rainfall of at least 100 mm in any one month ac-
cording to MOHR'S classification. However, the division into a drier and a more humid season seems permissible.
The monthly totals may fluctuate considerably from year to year, but within definite limits, as their extreme values maintain the division into 2 apparent seasons. Sharp periods of drought are largely confined to the months of April to August. Continuous dry spells of 7-21 days or more have been recorded in these months.
Sunshine
The daily mean tends to reflect the pattern of the annual rainfall distribution. The records show this mean to rise from 2.8 hours in December to a peak of 7.0 hours in May with an annual mean of 4.9 hours. This seems in fair agreement with records from elsewhere in this area; 5-year means show a maximum of 6-8 hours within the period from May to August. Between September to December the value remains steady at 5.3 to 5.5 hours per day. In January the daily mean drops sharply to a minimum of 3.3 hours, followed by an appreciable rise in March reaching 4.2 hours and 5.5 hours in April.
Temperature
Air temperature shows little variation throughout the year. At 0800 hours the general range is 2i-27°C; at 1400 hours 24-32°C and at 1800 hours 24-30°C. Temperatures in the north-east monsoon tend to be slightly lower than in the drier part of the year, as indicated by maximum/minimum ranges; these are roughly 21-32'C in the north-east monsoon as against 2i-34°C in the drier season. Day-to-day variations tend to mask this trend.
Soil temperature in a well-drained soil does not fall below 28°C, whereas in a moisture-retaining clay soil this value may be in the range from *5-25.5°C at 30 cm below the surface.
Humidity
taZT V a l r n t H e ruk t iVe h U m i dy a t I4°° h o u r s ™y rise from 63.5% whSuced m C e m b e r > D U l i n g d r y S P d l S P e r C e n t ^ S ™ y b e —
v e l r ^ E T T Y c l i m a t o l o 8 i c a l s u m ™ r y of a single, representative but on o v e f l ? ~ a t i ° n * %• > shows the average rainfall distribution over 71 years, including average and extreme values
1.3. LAND UNDER SHIFTING CULTIVATION
I t n f o n ^ d T f " t " " ^ CU l t iVa t i°n f° r Centuries> which culti" InZ rtemtdi ? nC£ P k n t i ng/ l o ng bush-fallow rotation (LEE). ^LlrZr^T iynen?* o f t h e S<*1 fertility requires at least veg^tat on ^ ^ t ^ T ^ ^ ^ o n t h e ™ u r e of the dSZ^S^T VTUtiVe ^ and ° n l0SSes sustained unng the period of cultivation. Post-cropping weed growth poses a con-

n
Sr> a. w o
3 o
o
tVl
2.
re 3 *o w r * C
re £. p a %$
° 3 o a
& ^ fa O 3 .
to c a >i
f t " a
5'
c o 2. S-3 s &.&, CT* H-. ^ . p 1
" H O P
0..3 3 •*£ w» q
1 3 *t n> n
3 w. - -c- PJ i-t n 3. a. *
3 < = -3 § U °
o o '
n g
£3 bo o \
Ol C*> 00 --4
t o * - ON >*. i - ' *U
o \ * * ( J Q I1
t o N>
00 «=
O J t o
o P° © 00
ON <*»
& o ^ NO w
to I — *
ON ON Co rf-
ON
to
- J
B
B
00 00
«!
y
Ol
0 0
ON
D3
ON
1—» ON to
O
•O
to
ON ON
ON ON Oi 4k
* 0 0 * v )
O 4k to to i j W O --4
V NO o o
~4 NO ~4 to
ON NO 00 00
t o NO 00 h—
> 13
s •3
c era
•3
voo
8 to W N> W t-k W (O H-I— to to 01
to N NO S ^ ON t o NO t o w
• ° £N 00 ?> to «=
00 to - J bo en to Ol
b! i— O l t o 00 ON - J
0 0 fctN. NO b* o
$
to t o NO 0 0
- J 0 ON
• h . NO
NO * • O P—
ON NO 00 O0
8 s

siderable problem. Cause and effect of the establishment of a weed association can rarely be traced, although the immigration of grasses in particular may be caused by the presence of natural fertility levels which are too low to support the development of shrubs and trees. The species I. cylindrica may be considered as the greatest menace. Once this grass has settled itself in a clearing it suppresses the development of other plants. Natural regeneration of soils covered with sheets of lalang is practically impossible, mainly owing to the relatively low production of green matter. Reclaimed lalang areas are likely to contain little of the common plant nutrients.
1500
1250
1000
E750 E
=500 a
2 •win
0
i t {
••» I i t -5
...
1 L.
*""L.
—_r-
= AV. s MAX. = MIN.
,™f I :•»
" • " L -r T . . .
*
I
p 1
{ !
1 i
• T F M A M J J A S O N D
Figure i Average and exterme monthly rainfall at Kuching over 71 years (after SEAL, 1958)
Considering the Sarawak soils with respect to the presence of any degree of natural fertility the following relevant points should be taken into account: a. The majority of soils have developed on a dissected peneplain. b. The system of shifting cultivation, the high rainfall and the cultivation
of unprotected, sometimes excessively steep slopes renders the soils subject to extremely strong erosive influences.
c. A reduction in the fallow period from a previous, desirable interval of 25 years to a current period of 6 years only, owing to a pressing shortage of suitable land for shifting cultivation as a result of Government restrictive measures.
The collective influence of these factors discourages the natural process of soil regeneration. Tracts of this degenerated land usually covered with sheet lalang are issued for the purpose of permanent cultivation to Chinese farmers.
1.4. THE s o n s
Three major types of soil can be distinguished, which have developed on shale, sand stone and on areas of alluvial origin. Each of these is repre-

sentative for extensive tracts of land under both permanent and shifting cultivation. Although their parent materials and, to a certain extent, their physical characteristics are different in several respect's, they share one common feature: their chemical nutritional status is inherently low. Analyses of representative samples (SCOTT and BAUEY) have indicated that the quantities of nutrients easily available to the plant are negligeable. Nutrient reserves are present in relatively higher amounts.
In areas under shifting cultivation the humus content depends largely on the length of rotation and the type of fallow cover. After some years of permanent agriculture the soil contains little humic components; in the sub-surface strata organic compounds are practically absent. The almost exclusive presence of clay minerals of the kaolinitic type and the near-absence of an adsorption complex of organic origin result in a low adsorption capacity and a poor buffering capacity. The pH-HaO value shows a range between 4.0-4.5.
The internal drainage characteristics of the three soils are distinctly different. The shale-derived heavy clay is classified as imperfectly to moderately well drained, whereas the profile, developed on the sandstone parent material reflects a good to very good drainage pattern. In alluvial soils the rate of drainage is largely dependent on the origin and stratification of the deposits. The strata below a depth of 60-90 cm of the shale and sandstone-derived soils tend to be dense and relatively hard to penetrate. Few roots are found in this solid mass of soil. Penetration up to a depth of 3 m or more has only been observed in alluvial deposits (Annual Reports Dept. of Agr. Sar await).
1.5. BRIEF HISTORY OF PEPPER GROWING
Organized pepper growing was firmly established as early as 1876 (DE WAARD). The cultivar of pepper, which was cultivated entered the country probably from Bangka Island in Indonesia; it is now named Piper nigrum cv. Kuching. The data obtained from a variety trial tend to confirm this origine (Annual Reports Dept. ofAgr. Sarawak). Sole vegetative multiplication from the early beginning of the cultivation has rendered practically all commercial pepper holdings planted monoclonal to the Kuching cv.
The cultivated area slowly expanded until 1942. After 1945 world demands for pepper increased rapidly. The price rose to such high levels that extensive planting of new areas was undertaken, mainly by Chinese planters. In 1956, the planted area was estimated at 3200-4000 ha and a production of 20,000 metric tons was attained in that year. However, the price offered in the world market declined sharply, owing partially to increasing supplies from elsewhere. This development discouraged the cultivation of the crop. Moreover, the concurrent outbreak of a very contagious root disease in monoclonal plantings rapidly decimated the number of vines. Planting and production decreased until early i960, when speculative buying in the pepper marketing centre of Singapore again raised the price appreciably.

As in the early fifties, this stimulated the onset of another price rise/ planting/production cycle. From 1964 to 1966 the planted acreage rose from 1900 ha to 2300 ha; the price increased by 25 to 33% over the same period, while the export reached again 19,000 metric tons of dry produce in 1967.
2. THE CULTIVATION OF PEPPER
L hnn1? P e rT n , d U S t r y iS m a i n I y i n t h e h a n d s o f t h e C h i n e s e Part of the population. The growers tend their gardens with their families. The neces-
u s u a n v T T ™ ^ P r 0 V l d e d b y m i d d l e n ™ or directly by exporters, usually as an advance against the expected crop r e £ £ o c c u P a t i o n ™ datively unrestricted and gardens were
to m ^ t th. A» " v « ° n . A total of 1.6 ha of primary jungle was required
X o n a H e X f **"* ?* W ° ° d f u d f ° r t h e P-Paration of the S S r S S ^ 5 ^ ' rnh-7,he am°Unt °f uncommon, but feSTsaa&Zv^^1 tamed from this area was an essential factor
^S^SS^^^T^ M ha of pepper over a
renlantina «f *i, 7 ^ WAARD). Over the past 2 decades, periodical ^or7SL:ltZme Fmi V ^ h a S b e e n P r a c t i s e d in-easingly land use % ' g C ° m P u l s 0 I 7 ' restrictive measures on unlimited
2.1. CROP DETAILS
climbfng ^ in he C t If" ( M W A A R D ) " P e P P e r i s a P e r e ™ i a 1 '
^^dt^o^^ST8- ?s fm shows co*spicuous
short petiole. Abscission of t h t , , n ° d e S b e a r S ° n e o v a t e l e a f« o n a
from le cm to x cm X g t h O I e a V e S * g radua>- The internodes vary branch may d e v Z W S ?unCe m e a c h
fl e a f ^ a lateral, fruit bearing
^ t l y r e t ^ t y ^ ^ S l P 0 ^ ° f S * m f e n e r a t i on is perma" wood supports by mJans of*aH ^ m ^Ched t 0 s t a k e s ° f **& hard nodes. In Sarawak S i nrn H T P r ° ° t S ' " ^ P r o f u s e l y ^ the B y m e a n s o f s t e m c u S 2-i.r. The root system
p r o f u P s e T o ^ r ° ° * normally develop into a

growth is permitted. The greater portion of the system does not enter into the subsoil any deeper than 0.6-0.9 m. The major part of it is confined to an area within a radius of 1.2-1.8 m, which is approximately equal to the diameter of the canopy of the average mature vine (Annual Reports Dept. ofAgr. Sarawak). These roots are relatively weak and appear very sensitive to both excess and shortage of water. A mass of rootlets usually develops in the topsoil layers, particularly near locations of fertilizer concentration. Under Sarawak conditions the vines have a relatively small rootsystem and a high shoot/root ratio.
2.1.2. The vegetative growth
Traditionally, 3 terminal shoots are usually guided up the post. Each individual node of these stem shoots possesses an axillary bud, which may only develop into a lateral branch in the early phases of stem elongation. Frequently it remains dormant throughout the vine's life, particularly when 3 or 4 preceding laterals have developed on consecutive nodes. To obtain a vine with a maximum number of fruiting branches, abortive nodes are systematically removed by means of an appropriate stem pruning technique. This practice also stimulates growth and branching of the canopy.
Shortly before the vine is allowed to flower for the first time, approximately 22-24 months after planting, leaf pruning is carried out. This treatment further promotes the development of laterals on existing nodes, stimulating the emergence of flower spikes and leaves.
A well-maintained, mature vine with a maximum production potential appears as a cylindrical shrub, almost 3.60 m high and 1.5-1.8 m in diameter, with a bushy well-branched frame and a close and dense canopy of leaves.
2.1.3. The generative phase
Potential flowering capacity is fundamentally determined by the length of the lateral fruit bearing branches, whereas actual flowering depends on the number of newly developing leaves and the abortion rate of the immature flower spikes, present within each unfolding leaf. This implies that productivity is a function of the number of leaves. When cultivated commercially, flowering is usually induced within the period from September, at the onset of the rains, to January. After this period, little flower development is observed. From January to July a variable proportion of the 50-150 flowers per spike develop into berries. When red, the fruit is harvested for the preparation of white pepper; when the berries are still green, just prior to ripeness, black pepper may be prepared. The practice of the timing of yield is essential in order to harvest, prepare and sun-dry the crop in the period of minimum rainfall.
Leaf development and flowering, beginning 4 to 6 weeks after the preceding harvest has been completed, demands an adequate supply of nutrients, water and reserves of carbohydrates.

2.i.4. Soil data
Pepper will grow satisfactorily on a wide variety of soil types provided these meet 2 major conditions:
a. The soil should be well-drained; the excessive amounts of water precipitated during the peak period of the northeast monsoon in Sarawak tend to saturate the soil and impeded drainage may do considerable damage to the root system.
b. The soil should retain sufficient moisture to meet water demands during prolonged, sharp intervals of drought which in Sarawak occasionally occur in June or July.
2.1.5. Cultivation data
After working the soil, mounds 0.6-0.9 m in diameter, elliptical in shape, are prepared from topsoil and subsoil. The supports which are spaced at
mounds*0 2"4 X 2 '4 m a r C l 0 C a t e d ^ ° n C ° f t h C f ° C a l P ° i n t S ° f t h e e l l i P t i c a l
n e l l T ^ C U t t i n § S ^ F 5 e r a b l y P k n t e d i n t h e m o n t h s Preceding the mother ^ 7™°? ' f ^ ^ " ^ ° b t a i n e d from h ^ h y > selected s ^ S TuPrd a S h a l l ° W a n § l e i n t h e m o u nd s . Fernshade is momhs a t ™ ? >' ' u S k m ° n t h S ° f e s t a b l -hment . Over a period of 24
ST^1S l75, the ,nodes are regularly tied to the P°S t to stimukte w f t h T n t t i s ^ iF t h e
1a d ,V e n t i t i o u s r o o t s t o ensure lasting attachment.
framework X T " ^ t e ™ S t e m s a r e P r u n e d *-form a dense framework of branches. The mounds and the interrows are clean-weeded.
2.1.6. Traditional use of fertilizer materials
^ZsT^^Zf^°uand W H I T E > after « & * a p- t i o n °f
coverapneoTwood^ . ^ " " o c cup i e d land. This soil is used to thoroughm°xil of ihe s T e ' r ^ * ? * P e r i o d ° f ' t 0 5 w e e k s ' ^ ^ e d by
Additions of 18 kg of this burn?! I P e r c e n t*ge of CaO is 0.3%. effect on the soil en l i ronme n t ^ ^ * " ^ r e S U l t e d i n a ^
c It supplies nutrients.
of nutrients. tS- l h l s l s followed by increased uptake
M , r t h ' A<™'°ns of» supply phosphate and
potassium in particular, in quantities equivalent to an amount in the order of 2 g of double superphosphate and 14 g of sulphate of potash per plant (HARDON and WHITE). Magnesium and calcium (25% HC1 extractable) rise three to fivefold in concentration. The actual quantities of nutrients are rather small, but these are offered in a form ideally suited for uptake by the roots. It becomes understandable that under conditions of physical and chemical poverty of the soil, the application of burnt earth should have a striking effect on vine performance.
Demands for nitrogen are met by rather heavy dressings of leaf material or press cakes of soy beans and groundnuts at rates of 1500 g per vine per year (6-7% N, 1-2% P). This system of nutrient supply gave fair results. On the other hand the preparation of burnt earth had a disastrous effect on the preservation of fertility of surrounding land. After 1946 the Government prohibited the preparation of burnt earth. As a consequence the farmers were compelled to change their traditional system of fertilizer application.
2.1.7. Difficulties with the use of new land and manufactured fertilizers The transition from bulk applications of cheap burnt earth and organic matter to relatively limited dressings of expensive fertilizers of manufactured origin concurred with the appearance of die-back of branches, symptoms of foliar disorders, low yields in the second and subsequent years of production and a considerable reduction of the economic life of the vines. The following factors contributed to the creation of apparently adverse conditions of nutrition:
a. New land allocated for permanent cultivation largely consisted of soils under lalang or ferns, highly acid and poor in nutrients.
b. Burnt earth and leaf material were not available in sufficient quantities. c. Inappropriate advice has been provided with respect to the alternative
use of various organic and inorganic manufactured fertilizers, which were offered to the farmers.
d. The quantities of fertilizers applied are largely determined by the financial resources of the farmers.
e. With an average pepper crop large quantities of nutrients are removed (MAISTRE; DE WAARD).
On many occasions the application of concentrated inorganic fertilizers caused the death of vines owing to inexperience with these materials. After some years of "experimenting" the farmers themselves decided that "foolproof" but expensive organic fertilizers gave relatively the best results under the prevailing set of conditions.
2.1.7.1. Types of fe r t i l izer
To obtain some measure of success it was necessary to apply the low-graded organic fertilizers at dressings of up to 6.3 tons per ha with or without the addition of concentrated nitrogenous fertilizers. A typical dressing in the maximum range contains 250 g of N, 360 g of P2O5 and 150 g of
11

K20 per plant per year in organic or enriched organic form. Sometimes small quantities of N or K fertilizers in inorganic form are given as an extra dressing, if the farmer can afford the expense.
As an example of widely used fertilizers one may point out a very popular proprietary brand of enriched organic fertilizer based on bonemeal, of the following composition: -,% watersoluble N, io56 P205 and 4% K20, with 8.6% CaO arid traces of magnesium and minor elements. Groundnut and soy bean cakes, prawn refuse and similar compounds are also used on an extensive scale, either alone or in combination with each other. The high cost per unit of nutrient constitutes a major disadvantage by adversely attecting the cost of production, pushing it to the marginal limit of returns. As an morganic fertilizer limited quantities of sulphate of ammonia have been used occasionally.
2.1.7.2. Fertilizing, flowering and yielding
ll7!eZ£ " ^ ^ drCfngS' typeS a n d S c h e d u l e s of application may TrmlTnH g T tmdiVidUal e X p e r i e n C e ° f e a c h f a r m e r o r g - up of eXertSr V ^ ^ ^c^ T h e y0UnS v i n e s ^ e L their
A ^ a n d U ^ " f t X T ^ i m e r V a l S ° f 2~3 m ° n t h s ' i n accordance with ZrZlet^Fl fmmt °f t h G P k n t s ; i n t h e first and second S Tv7nef P Tl2T?ieS ^ fr0m'/'t0 ^ o f A « e applied
-Svl^ of longer J L n
Asarulethefirstdressingoffertilizer to mature vines is given earlv in the
ztzz7:z^ ie Td,year after piant^ i 8 31 ; 1 , 2 or ^pSdTa riSTf I?* tyS-In t h e S u b s e ( l u e n t y™s the fertilizers the ffi^STifashl0n-APF™ately I0 days after each dressing
cou^of r 0 r ? m o ^ w t S and flTr SpikeS a p P e a r (DE WAARD). In t h l ^ " A S ^ T d e V d 0 p a d e - < W Banding of either side 0 f t e ^ ^ practice; contact b e t w ^ n l gC ° f t h e c a noPy i s common
».«.!. Physiological aspects of crop production
and branches, to suonort a T p I ° y e d f o r t h e buildmg of a frame of stems
« l y < n « £ l S t f w £ ? '""' ^ * -ually abundant; but ".pid deterioration 0 f l 7 v f n
e ; t r e M a,S,liung l n d '"™»"gly -ore
-- * «**. £ s i r c t inis;—£

lowed by a progressively more severe leaf abscission during fruit ripening. Still later, at the time of harvesting, mild to severe signs of die-back of the lateral branches are frequently observed. The fruitbearing spikes are rarely shed. After harvesting has been completed the vine may exhibit severe defoliation, signs of extreme exhaustion, and partial or complete death of lateral branches. This implies a reduced potential for future berry production. Moreover, the effect of fertilizer dressings and the resulting abundance of foliage and flower spikes seems to depend in part on the general physiological condition of the vine at the end of the preceding season.
The yield expressed in units of white pepper varies from 0.75 to 3.25 metric tons of dry produce per ha. Under good conditions the production may exceed 10 tons per ha. The quoted yield figure suggests the presence of a high production potential in the Kuching variety under satisfactory conditions. The maximum potential of a vine is normally obtained in the third year of production, some 5 years after planting.
2.2. EXPERIMENTAL RESULTS IN PEPPER
The agronomic research programme is concerned primarily with research into improved methods of nutrition by using concentrated, inorganic fertilizers of manufactured origin. Field experiments have established beyond doubt that inorganic fertilizers applied at quantities equivalent to those of manufactured organic fertilizers and expressed in terms of pure nutrients, were at least equal but in the majority of cases superior in their effects on yield. Calculations showed that the cost price per unit of pure nutrient of inorganic compounds was half that of the organic fertilizer.
Trials (Annual Reports Dept. ofAgr. Sarawak) demonstrated a high response to potassium in each season, a response to nitrogen in some years and one to phosphorus in the first year of production. Although the appearance of the vines deteriorated somewhat with the advance of the season, die-back of the laterals was absent. The appearance of mildly chlorotic and necrotic foliar symptoms on most of the experimental plants indicates the presence of (incipient) deficiencies of the nutrient concentrations, sometimes even at the highest levels of application. This implies still subnormal nutrition.
The results of these trials demonstrated that, although fertilizer applications exert a favourable effect on the productivity of the vines, the possible development of physiological starvation demands a careful control of the leaf tissues.
2.3. CONCLUSION Rehabilation of this important crop to its former standard of performance appears to be principally a matter of rationalization of the current, apparently inefficient modes of fertilizing, the cost of which demands some 40-50% or more of the annual recurrent budget. The preceding survey indicates that problems associated with efficient nutrition of pepper in this country should receive high priority.
13

The present work is essentially concerned with the evaluation of a practical solution to the problem of recovery of vine performance and control of yield stability at a high level of production on shale soils by the application of foliar diagnosis.
3. FOLIAR DIAGNOSIS IN HUMID TROPICAL REGIONS
w o u W 7 ! 8 ^ 1 6 v r t U i Z e r S l n a c c o r d a n < * with accurate diagnostic data n u t r L T T n 5 m m a t e l l m i t i n S e f f e c t s o n cn>I« exerted by specific but k t e r f 5 r * ? P U r P°Su SOil a n a l y S i s r e c d v e d m u c h attention initially, crop^ o c a t f ^ " T ^ f ™ m 0 r e P°Pular> Particularly in orchard w o T k i ^ S h e r ' o f T C H - ^ S U b t r ° p i C a l ^ i 0 n s - No previous systematic 2 n e 1 J " ^ T ^ fidds h a S b e e n r e P ° ^ d for pepper. The S i t T ? H i a g n ° S t i C ^ l n t h e ^ t r i t i o n of this crop S context the a , T thboatio* ° f ™ e f f i d e n t m e t h o d of diagnosis. In h Z^lte^fT * " t h £ m e t h 0 d o f f e r t i l i ^ application to
d t n o s t k method VS *mdanfn t a l f ° r t h e u l t i m a t e selection of a rapid demTd i n " r t s SU° ,UfSeduaS * ^ t e r m i n a t i o n of nutrient paragraphs ? P P " f ° r t h i S **" w i U b e advanced in the following
3.1. EFFICIENCY OF CROP NUTRITION
<^^^Zl!To^ effidei7 of Utilizer applications depend
root interface « t E ^ ^ f f ^ *»?' * °^ntS t 0 ^ ^
3.I . I . The influence of soil moisture
SALTER and GOODE have nresem^ the moisture regime on the Ze C O mP r e n ensive review of the effects of tropicalandternperatecrops C ° f SCVe r a l a n n u a l a n d perennial,
unrestrictedsoUmoismreconH?668 * " t H e m a i n t e n a n c e of favourable, and to maintain unchecked c W i t 0 S a t i s f y t ranspiration requirements is essential for satisfactory K ^ T ? * 1°^™the l i f e o f t h e P l a n t
matric suction between p p S j ^ n f p r o d u c t i o n - h P«t experiments a Smce nutrients i n the sou can o2 u * *j V ^™ b e e n r e c o r d e d as desirable.
„ % b e U k e n UP by * e plant in a dissolved

state, the mineral nutrition seems to be necessarily interrelated with variations in the soil moisture status. The evidence seems to indicate that the beneficial effect of an adequate supply of water is in part due to the effect of increased or sustained availability of nutrients to the plant and vice versa. When moisture stress develops, emptying capillaries and pores, the mobility of nutrients is affected adversely. In this respect it is of interest to examine in which manner dissolved nutrients reach the root surface.
3.1.2. The nutrient supply mechanism
The pathways along which the ions are likely to move from the soil towards the sorbing roots have been studied by BARBER et alii; BRAY; JENNY;
LEWIS and QUIRCK (1967a). Recently FRIED and BROESHART have presented a comprehensive review on the subject. Three principal mechanisms may be recognized.
Contact between plant roots and dissolved nutrients
The root system of a plant is able to come into direct contact with approximately 3% of the available nutrients. Calculations show that for crops cultivated in a fertile soil, this contact ratio appears sufficient to satisfy the requirements for calcium and magnesium only. Under these conditions the demand for nitrogen, phosphorus and potassium could be met for 6-10% only. Moreover, in soil with a low exchange capacity root contact with base elements would be reduced. Similarly, a poor soil structure interferes with profuse development of the roots and reduces the contact volume.
Movement by water flow
This passive mode of transport would supply most of the calcium, magnesium and anions, such as nitrate, sulphate and chloride. Accumulation and back diffusion of the base elements and of sulphate takes place at the root surface. Calculations based on data obtained from analysis of a saturated soil extract suggested that only a small portion of the demands for phosphate and potassium can be supplied to the soil/root interface in this manner, even in soils which are apparently fertile.
Soil tortuosity which retards the flow of water also adversely affects the speed of movement of nutrients. Similarly, if the concentration of the soil solution is highly dilute, water flow may be considered less important as a factor in the overall provision of nutrients. On these occasions supply by contact may gain in relative importance QENNY).
Supply by diffusion
Apparently neither phosphorus nor potassium are supplied in sufficient quantities by the two preceding mechanisms to meet the plant requirements. BRAY suggested that these less mobile ions are removed only from the immediate vicinity of the root surface; the effective removal decreases
15

rapidly with time. Due to depletion at the root surface a concentration gradient is established providing a driving force for ionic diffusion. Patterns supporting the existence of depletion phenomena have been observed (BARBER et alii; LEWIS and QUIRCK, 1967 a and b); autoradiographs showed a rather wide area for the relatively fast moving rubidium ion, used as a substitute for potassium, and a much narrower zone of depletion for the slowly moving phosphate ion.
The velocity of these ions is directly related to their respective coefficients of diffusion, and is dependent on the concentration gradients between medium and root sink and on the moisture status of the soil (BARBER et alii; NYE). The phase geometry and the fixation power of the soil influence the magnitude of the diffusion rate. LEWIS and QUIRCK (1967 a and b) found in their work that soils with a high fixation capacity for P displayed a narrow zone of depletion not beyond the length of a root hair. Uptake per unit length of root increased considerably with rising P concentrations and with decreasing root volume (WIERSUM, 1967).
Replenishment radial to the root cylinder may be retarded. In soils where fixation is mild, mobility of added phosphate is likely to be higher and replenishment would extend from beyond the volume explored by the root hairs. NYE suggested that ion uptake increased directly with the concentration of the nutrients in the soil solution, with a rise in the soil moisture content and with the root sorbing power until diffusion itself becomes limiting. With respect to the last two aspects the soil structure seems to hold a key-position; VAN DIEST points out that the physical characteristics of the soil might be considered as more significant In plant nutrition than inherent presence of chemical fertility.
3.1.3. The role of the roots
S J T r f S f 1 7 ^ T a k C ° f n U t r i e n t S i s considerably affected by prolifer-
onrolatr018 , K ^ ^ ** r°0 t hairS' Present °™ ngth of 1 9 T Z S i r , ^ ? e aCtivdy « " " * * root tiF (^NDECARDH, m^H?S? y Tlarge the so/bing surface-These hairs are a c t i v e l y P e l d t h ^ o W o T P rr e S ;u f° r a r d a t i v e ly short time- ^thin this S ^ r i ^ ? T T V thCm " P r ° g ™ l y exhausted (LEWIS s^2sr^^rth5S htake p lrtby a / y 4 r i c a l VAN DIEST). P h a i r s u n t l 1 t h e i r d e c a y ( N Y E i
o^TZ^lZtT 'T f r CV i eW ° f **>« - r k that a mantle of a m a t e r o o ^ r T ? ^ ^ ^ a r a d i u S e l u a l t o the ^ g t h root™rface ^ u ^ ^ m a j ° r S ° U r C e °f nutrient supply to L
: S S s J ; 0 r n s wef,e made for p hy LE- W U n u d ^ ^ ^ S S f 7 appear:d to be less than 5% of the
sodformingplants r ° 0 t r a m i f i c a t i °n in the case of non-16

3.I.4. Efficient supply of nutrients to the soil /root interface
The preceding considerations imply that adequate supply of nutrients to plants would be stimulated by each of the following factors:
a. A relatively high concentration of nutrients in the soil (water flow).
b. A relatively steep gradient between nutrient concentration in the soil solution and the soil/root interface (diffusion).
c. A high moisture content associated with a favourable arrangement of soil particles (diffusion, water flow).
d. Root proliferation near the source of nutrients (contact, diffusion, water flow).
e. A low rate of fixation (diffusion).
Taking into consideration the views of WIERSUM and BRAY, it appears that a satisfactory flux of nutrients would be sustained by the presence of a sufficiently concentrated solution in relatively close proximity to a dense and actively proliferating root system, under soil moisture conditions near field capacity. The magnitude of the fixation power and of the adsorption complex of the soil, however, exert also an influence of considerable magnitude on the mobility of particular ions to the absorbing root surface.
3.2. METHODS OF FERTILIZER APPLICATION
It may be observed that at least four of the above preconditions (sub a to d in section 3.1.4.) may be present or can be influenced by the application of appropriate agricultural techniques, for the formation of an integrated set of apparently satisfactory nutritional conditions.
In humid tropical regions an even distribution of the total annual rainfall or alternatively, supplementary irrigation measures or appropriate mulching techniques would ensure the presence of sufficient moisture and potentially uninterrupted fluxes of mobile nutrients, as required under 3.1.4. Profuse root ramification is directly related to both favourable physical characteristics and the presence of adequate nutrients and water (sub d). The nutrient concentrations can be manipulated by the addition of suitable quantities of fertilizer and by applying appropriate techniques of fertilizer concentration (sub a and b).
The fixation power (sub e) is a characteristic, inherent to the soil medium. In this respect band application of fertilizer is considered of essential importance, particularly with regard to the effective concentration of nutrients in the soil, and also for its stimulation of root growth within a restricted volume of soil (sub d). This latter aspect is particularly important for compensation of loss of effective root length under adverse circumstances in terms of poor soil structure. .
In the following paragraphs two essentially different methods of application of fertilizer and their respective effects on the nutritional condition in the root environment will be discussed.
17

3.2.1. Broadcasting of fertilizer
Even distribution of fertilizer on soil and subsequent downward leaching of the dissolved nutrients, as has been reported for potassium (MUNSON and NELSON), results in the creation of a relatively dilute nutrient solution in the surface and subsurface layers of the medium. Hence, severe competition for scarce nutrients between a large adsorption/fixation complex of the soil and a relatively small volume of roots (usually less than 5%) may mean, at least temporarily, that the majority of the added nutrients does not reach the plant, to the advantage of the soil (VAN DIEST). Thus, the concurring concentration gradient between roots and solution would be very gradual.
The adverse effect of nutrient dilution should be negligable if the root density in the upper layers is relatively low. An example would illustrate this: sod formation in grass land usually involves a root density of 100% in the upper 5 cm (WIERSUM, 1961). In this case uptake after broadcasting may therefore be effective, whereas little response is observed, as a rule, in the case of deep rooting tree crops.
Generally, it may be said that a small root system considerably reduces adequate nutrient absorption when fertilizers are broadcast, amongst other things because depletion in the vicinity of few roots is much more intensive than would be the case with a well-developed root system.
3.2.2. Placement of fertilizer
J n H ^ r ' 6 1 ? - d iSCrePanCy b e t w e e n Orient distribution by broadcasting lot ! ° ; r reqULred t 0 CnSUre a n a d e 1 u a t e ^PPly of nutrients at ferXr, HTT " ^ b £ ° V e r C ° m e i n P M t ^ ******* P ^ m e n t of [heores^rf T ^ ™ ^ * * " r°° t le tS- T h i s t e c h n i<A apP^d in
" dcStXro^^^S?^ " S a "* "*"» b ' LlZlm2lIOOfn W ° U l d P r ° l i f e r a t e P -f-ential ly around this
a p p T m Z Z "S? r ° G G E ) : t h £ P r e s e n c e o f s u f f i < ^ nitrogen c ^ K S S ^ - P^nomenon (MIUER and OHIROGGE). §
coX^thiselT1;,: t1 T ^ ^ W O U l d b e datively Imall; re-S e e ^
d" S S S f L 4 6 fl0T*i water' and diffusion to the n e w l y d e " ^Jz^z^:2::fihQ T J1erabiy enhanced' ° w i n s » t h e
velopment of steen S f ^ " ^ t h e c o n c u r r ^ t de-alsoLimproved P * § r a d i e n t S : " " ^ ^ r o o t i n t a c t would
e" o S mtraueLhterv?rof nutrients and *•** «***»*»

In contrast to broadcasting the efficiency of nutrient supply by localized placement seems consistent with recent views in the field. In this context it may be mentioned that root hairs possess a considerable latitude in their degree of sensitivity to injury at high salt concentrations (LUNDEGARDH
1951).
3.2.3. Tropical soils
VAN DIEST advances that in principle effective fertilizing would be much simpler when starting with a medium without nutrients than when ill-balanced concentrations of nutrients are present in the soil. In this concept the inherent chemical potential of the nutrients of the soil appears to be only of secondary importance. Manipulations to provide these nutrients demanded by plants growing in a "nutrient free" soil medium would be more simple than to supplement an existing potential. This approach implies the application of the principle of "feeding the plant". In the humid tropical regions the chemically poor and acid soils seem to fit well into the proposed concept to supply all nutrients.
In this system one should not attempt to equilibrate ratios of cations in the soil to those present in the plant. Instead, natural powers of selectivity inherent to the plant should be taken into consideration (VAN DIEST). A similar view was advocated by FERRAND, PREVOT and OIXAGNIER (1956) and others.
3.2.4. Concentrated placement inpepper
The conditions of pepper cultivation include the following aspects:
a. The rootsystem is shallow and the majority of feeder roots are located at the edge of the mound up to a depth of 20-30 cm (HUITEMA; DE
WAARD).
b. The heavy-textured soil is poor in structure, poor in nutrients with a high moisture holding capacity and with an intermediate to high rate ofP-fixation.
c. The rainfall of 3750 mm is fairly evenly distributed over the year. Integration of these aspects with the recent views on nutrient transpor
tation, with the magnitude of the nutrient removal and with the concept of "feeding the plant" implies a definite preference for concentrated placement of fertilizers (3.2.2.).
3.3. DIAGNOSIS OF NUTRIENT REQUIREMENTS
Ideally, a method of diagnosis should be simple to apply and its data should reflect the nutritional condition of the crop accurately at any time, before signs of deficiency begin to develop. Simultaneously, the method should enable the interpreter to formulate a suitable fertilizer policy to ensure sustained supply of the required nutrients to the plant.
Historically, four major methods of diagnosis have been advocated for
19

use under field conditions, either alone or in combination. The relative merits of each of those methods will be briefly reviewed.
3-3.1. Soil analysis
In this section special emphasis will be put on those aspects which render diagnosis by soil analysis by nature unsuitable as a reliable indicator for the nutritional status of tropical soils in the humid regions.
These soils under natural conditions may require more than 250 samples per ha for routine determinations to obtain a reasonably good estimate of the potential soil nutrient status. The number of samples depends on the magnitude of the existing fertility gradients and nutrient distribution patterns (LEO; SCOTT and BAILEY). Consequently, an accurate and reliable picture of the nutrient status can only be obtained by intensive sampling at great expense of time, money and effort. This situation is aggravated by irregular distribution patterns of nutrients involved in concentrated placement of fertilizers in cropped soils. In addition the nutrient concentration in the immediate vicinity of plant roots within the zone of depletion may be radically different from that in the volume of soil where no roots have penetrated yet. This implies that the collection of representative samples under these circumstances is practically impossible (MCKEN-
The preceding considerations stress the inefficiency of soil sampling. On
^ S n l n S a t a t 1 * ^ * " * " * * * * « * ta ^ ^
3.3.2. Fertilizer experiments
r l f e ^ ^ t r ? ^ ^ 1 " *"«"** " ^ Se™nS « a P < ™ n t ^ m Z ^ n T TV t S r C r ° P P e r f o r m ^ e demand proper ac-foTdi^^ r 1 1 0 " 1 r e S ° U r C e S a n d SUiUbly rained personnel X t S d T S T 1 H ' ? m a m t e n a n C e - T h e - su i t s are, strictly speaking,
S ^ 0 ^ d S t ^ T , ^ P a i a U e t 0 t h ° S e ° f t h e - P ^ i m e n t . Ettrf-
^ofl2^itS^irT,afconditions carries
^ ^ ^ t ^ ^ ^ Z * ™ ^ f ciers be-measures for the current s e a s o n T i mP l e menta t ion of corrective essential for the c a Z a t o n of ,*• 7 T ' C X P e r i m e n t s o f this kind are ^~*£^1^J^«< **"*« -d as the o f ^ m e X ^ which are non-C^T'T ^f™ m a J 0 r d i f f i c u l t i e s n e a r v a l u e s
the root d e n s L T S ^ T *"" ^ d i f f u s i o n - Simultaneously, regularly ^ ^ ^ ^ ^ M d n U t r i - t solution which is
provide condition^^noTunltlT f ^ J * r ° ° t e d V o l u m e - T h * w ™ l d not unhke those found to surround a band of fertilizer

in the field. It would appear therefore, that reference values obtained in pot experiments may be extrapolated to field conditions, provided the circumstances in the soil medium are conducive to unretarded movement of nutrients to the absorbing root surface.
3.3.3. Visual symptoms
Extreme deficiency or excess of the essential elements usually results in well-defined, characteristic patterns of symptoms on the foliage or other parts of the plant. Frequently, the concurrent concentrations of the nutrients in the affected leaves have been determined and compared with those of healthy leaves of comparable order. From the data it appeared in most instances that the presence of characteristic leaf symptoms could be correlated with high or low levels of specific elements, as the case maybe. It was observed (FERWERDA) that partner elements in the nutrient complex of such leaves may also deviate from their "normal" levels. Thus, consideration of individual, apparently sub-optimal nutrient concentrations in the leaves would not necessarily provide a correct guide to indicate the presence of the corresponding nutritional disorders. On these occasions, additional evidence such as the presence of subnormal growth performance may be valuable.
The preceding discussion suggests that considered interpretation of data on the chemical composition of deficient leaves is essential. In combination with detailed information on deficiencies or toxicities, these nutrient levels may become of value for the determination of minimum levels of nutrients in leaves.
3.3.4. Foliar diagnosis
The plant itself may be considered as an extracting agent of nutrients from the soil complex. Its tissues contain those elements which have actually been taken up by the roots and which have been distributed within the plant. Hence, the resulting composition is the integrated effect of all internal and external influences affecting uptake and distribution. Thus, the plant itself serves as an indicator of the current nutrient demands. Usually not the entire plant, but a suitable and representative part of it is selected for sampling.
Over the last 2-3 decades in particular, foliar diagnosis has evolved as a practical and routine application of leaf analysis. As a rule, the results were successful (BOULD). This was particularly true for perennial tropical and subtropical crops. Since the plant is used as the extractant/indicator it seems obvious that the interpretation by visual symptoms is only a special case of foliar diagnosis carried out in the regions of extreme shortage or excess of one or several nutrients.
3.4. FOLIAR DIAGNOSIS VERSUS SOIL ANALYSIS OR FIELD TRIALS
Foliar analysis as a method to predict fertilizer requirements of crops has a
21

number of pronounced advantages over other methods of diagnosis. The most important of these are briefly re-iterated. a. A number of important sources of external and internal variability,
which may have a significant influence on the chemical concentrations in the leaves, can be traced in a relatively simple manner and each of them can be controlled by appropriate definition and the application of suitable techniques of stratification.
b. The result of foliar analysis may be extrapolated from one set of environmental conditions to another.
c. Results obtained in pot experiments may be simple to interpret by means of leaf analysis in terms applicable to field conditions of comparable order.
d. Leaf analysis registers the overall effect of uptake and supply mechanisms in the soil/root complex.
e. The evaluation of the nutrient status can be followed throughout the life of the plant; results are available at short notice for the timely correction of possible nutritional imbalances.
f. The development of deficiencies may be prevented as concentration depressions of nutrients may be detected in an early stage.
g. Within the zone of "hidden hunger" when deficiency symptoms are absent, foliar diagnosis is the only reliable method to diagnose incipient deficiencies (BOUID).
h. Foliar diagnosis avoids the problem of root distribution and excludes rthe difficulty of representative soil sampling in orchard crops; it pre-
p deludes the difficult interpretation of the influence of selective uptake | fmechanisms and of the composition of the nutrient complex in the soil
(EMMERT).
i. From a practical point of view foliar diagnosis meets the majority of conditions which are considered essential for the evaluation of a system of routine analysis in most developing countries, such as rapidity, reliability, a relatively simple analytical procedure, transportation of light-weight samples, relatively simple sampling procedures suitable for frequent application.
Extensive basic studies on the factors affecting chemical leaf composition and the establishment of the necessary empirical relationships are essential prerequisities if the system is to have any practical value. After collection of the necessary experimental data, and in the absence of non-nutritional limiting factors, fertilizer programs may be adjusted; alternatively, diagnosis may indicate that no possible response can be expected and that other causes of adverse performance should be examined.
22

4. REVIEW OF LITERATURE
4.1. NUTRITION OF BLACK PEPPER
Little or no concrete results are available on the nutrition of pepper. Some incidental investigations have been carried out in Indonesia before 1942 (HARDON and NEUTEBOOM; HARDON and WHITE; HUITEMA). These mainly concerned the effects of burnt earth on the production of pepper on the Island of Banka, some aspects of soil fertility, application of fertilizers of mineral origin and the effect of physical soil conditions on the development of yellowing disease. A comprehensive publication of BREGMAN discusses the traditional methods of fertilizing, amongst other aspects of cultivation. Other publications (MAISTRE; MARINET) report on local methods of cultivation and nutrition in several countries. Usually, organic fertilizers are applied with or without small amounts of inorganic compounds. No records of systematic research into the various aspects and problems of the nutrition have been found. In India, data of trials involving nitrogen, phosphorus, potassium and calcium have been reported by MARINET. These results suggested that pepper requires applications of lime if the soils are acid, but no definite pH limits have been stated. Until recently, the farmers in Sarawak employed mainly organic manures with little inorganic nutrient added (DE WAARD).
Early in 1959 systematic research has been initiated in Sarawak (Annual Reports of the Dept. of Agr. Sarawak). Results of field trials showed a need for major as well as trace elements. Tentative commercial recommendations include the application of 360 g N, 360 g P205, 500 g K20, 60 g Mg and a full range of trace elements per plant per year as a basic dressing applied in inorganic form; 4,5 kg dolomite (15% MgO, •#% CaO) per vine was recommended as a single blanket dressing 3 weeks prior to the first application. In subsequent years dolomite was applied as a soil ameliorant to maintain the pH-H20 at a value of 5.5 approximately.
4.2. FOIIAR DIAGNOSIS
The first incidental information on this subject with regard to pepper is provided by results from work conducted in Sarawak (DE WAARD). A
23

tentative average composition of the major elements in healthy, mature leaves located on fruiting branches has been reported. The apparent scarcity of published data on foliar diagnostic work in pepper demands an alternative source of basic information on essential aspects of this method; therefore relevant literature pertaining to selected perennial crops is reviewed.
LAGATU and MAUME (1926) in France, by their concept of foliar diagnosis in grape vines, and LUNDEGARDH (1951) in Sweden, by his triple analysis and later by the exclusive use of leaf analysis, were among the first to work out a practical and apparently successful method for tissue analysis to predict fertilizer requirements for a perennial and an annual crop respectively. Since then, much work has been done, particularly for crops in the tropical regions of the world. Comprehensive information has been provided by GOODALL and GREGORY. Their work covers nearly each of the fundamental aspects related to the application of this diagnostic method. Other investigators applied leaf analysis to rubber (SHORROCKS 1961, 1962 a and b, 1964; SHORROCKS and RATNASINGAN), oil palm (BROESHART 1955 and 1956), coffee (LOUE 1953,1957 and 1962; MALAVOLTA et alii; MUELLER; ROBINSON; ROBINSON
and FREEMAN), banana (HEWITT; MURRAY i960 and 1961); citrus (STEYN 1959 and 1961) and to many other crops. FERRAND, LUNDEGARDH, PREVOT, REU-
THER.et alii, REUTHER and SMITH, SMITH and others reviewed the concepts and backgrounds of foliar diagnosis. It would appear from this and other literature (BOULD) that leaf analysis may be applied with particular success when nutrient deficiencies are present in the incipient stage. This situation may be expected to develop frequently in crops cultivated on poor tropical soils under high-rainfall conditions.
4.2.1. Plant specific factors influencing the chemical concentration
Leaf analysis demands an empirical approach as there is insufficient infor-r T r o ^ i r ^ r , i n terrelat ionshiPS of physiological and biological SteST^ ^W™' t 0 >'UStify a ^ a m e n t a ! approach. Icto sThVeh flr0P ShlUldube e X a m i n e d a n d ^estigated separately for o C S f ^ C O mP° s i t i o n o f ^ Plant part under
4.2.M. The organ to be sampled
^ r a S a r a t e T ^ this u W have L S d e C t e d f07 fC PUrP°se o f a n a 1 ^ - Various aspect of £ ^ w £ £ S 3 S £ ? °TL rd
TGREGORY-
More r"cent* THER and SMITH 3 ? g , 0 l1 p d m - LuNDE^RDH ( I95I), REU-^ T ^ ^ T ^ 0 C°nSlder ^ t 0 be the ™S t Suitable
the or^^^Tul^ t h a t for a11 P r a c t i c a l P^poses senting t h e o v e r U I T ™ * ^ ^ a p p e a r S t 0 b e s u i t a b l e ^ 4 -«iung me overall nutrient status of the nlant ( 'Qm^ B -C • vestigations other parts of the „ l , „7 V {l ^ F ° r s P e c i f i c i n " parts ot the plant may be preferred. There are indi-
cations that sodium and heavy metals are more concentrated in the rootlets than in other parts, if these elements are present in the soil in excess amounts (SMITH). If such conditions prevail, rootlets instead of leaves should be sampled for these elements. In grape vine, petioles are frequently employed for the determination of the potassium status (BESSIS;
SHAULIS), whereas SHORROCKS (1962 b) found this portion of the leaves an unsuitable indicator in the case of rubber.
4.2.1.2. The effect of age and pos i t ion of t h e leaf Physiological age is considered to be a source of variation. This is shown by BROESHART (1955) and by PREVOT and OIXAGNIER (1956) for oil palm, by LOUE
(1953) and ROBINSON (1961) for coffee and by TWYFORD and COULTER (1964) for bananas. The variation may be attributed, amongst other things, to translocation and accumulation phenomena which take place in the aging plant. Considering these internal sources of variation LOUE preferred the 4th pair of leaves in coffee to represent the nutritional status, whereas MUELLER reported that the 5th or 6th pair was more sensitive when the plants suffered from incipient deficiencies. In Trinidad WEIR demonstrated that at any time citrus leaves which are more than four months old do not vary appreciably in their composition. Studies by BOUAT et alii (1953) in olive indicated that leaves of the same physiological age possessed a similar mineral composition, when sampled at the same time of the year.
The effect of the morphological position is demonstrated by SHORROCKS
(1961) in rubber. In this crop, leaves develop at different heights of the tree and on different parts of the shoots, viz. terminal and sidewhorl leaves. A detailed examination revealed that considerable variability existed between leaves located on different positions of the tree, but simultaneously the composition of terminal and sidewhorl leaves did not differ. BOUAT et alii (1951,1953, 1954) also found in olive that leaves of different morphological positions varied in their chemical composition.
4.2.1.3. Effect of size and t h i ckness of t h e leaves STEYN (1959) found in citrus that there was no appreciable effect of leaf size on the nutrient concentration in the tissue; TWYFORD and COULTER reported a substantial gradient over the length of the banana leaf. There appears to be no record in the relevant literature of studies concerning the influence of the leaf thickness on the chemical concentration.
4.2.2. Seasonal effect affecting the chemical concentration The seasonal variations reflect the integrated effect of individual contributions of influences such as rainfall and sunshine on the chemical concentration of the leaves.
4.2.2.1. Rainfa l l LOUE (1953,1957) a n ( j ROBINSON (1961) studied the effect of rainfall and season on the chemical composition of coffee leaves. The overall results indicated
25

a fairly close interrelationship between rainfall, growth and flowering cycles, and nutrient concentrations in the leaves. Reasonably consistent trends could be established for coffee by incorporating rainfall, growth and yield factors (LOUE) or by partially eliminating these factors by introducing ratios between nutrients (ROBINSON).
4.2.2.2. Sunshine and l ight The influence of these factors was studied by SHORROCKS (1961, 1962 a) in rubber and by MURRAY (1961) in bananas. These investigators found a definite diminishing effect of increasing light intensity on the nutrient concentrations in general. In oil palm RUER found a significant and direct relationship between the potassium concentration in the leaves and the number of sunhours two years earlier.
4.2.3. The effect ofthepbnting medium
The pathways of the ions from the medium to the roots, and the factors which are likely to impose restrictions on the nutrients flux would suggest that for characteristic ecological conditions and for a specific crop variety two fundamentally different values may be recognized for each individual nutrient or combination of nutrients. These two values may be considered as an 'absolute optimum" and a "field optimum". The "absolute optimum" is approached under near-ideal conditions of unrestricted nutrient supply to the roots, viz. in pot experiments. This upper limit is universally
Between this "absolute optimum" and values under deficiency con-ditoons a range of "field optima" depends on the complex of restrictions imposed on the nutrient supply by the environmental conditions. In addition to this it is interesting to consider the concept of LEVY. He proposes he establishment of an "experimental optimum" which is the concen
tration associated with yields obtainable under controlled, experimental Condons . His economic optimum" depends on the influence of the soil
^ r j r f " °? °ther m e r n a l factors- T h i s "economic optimum-concurs W1th the production of profitable yields
t r a ^ h T ^ °f A e *£ °f t h £ Pkn t i n8 m e d i u m o n ^ e leaf concen-S S L ^ l F?v n t e d
f b y ,B°U A T et alii ft* «*. **)• They found a
three e l ™ ^ of-dividual concentrations in irrigated olive for ^ i Z ^ T ^ r * ^ interCStinS t o o b s e r v e that there was S ^ S ? / < ^ , a l , C a l f aC t° rS U n d e r th£Se Condit ions" ™s suggested S L ^ S r ^ ^ ^ thr°UShout t h e ^ason exerts a stabflizing
8 1 h ^ e d t ° ~ ^ of irri-
othaTjS^resneecnt?Prr T**" W* h t h e ™ o f B ^ E R et alii and suppScTadeauat 1 ° t h e m * u e M e o f ^obstructed conditions for the
pply adequate amounts of water and nutrients to the soil/root inter-

face. It may also partly explain the relative success of foliar diagnosis in humid, tropical regions.
4-3. SOURCES OF ERROR INTRODUCTION
Within the stages from leaf sampling to the presentation of the analytical results large or small errors may be introduced. This uncontrolled variability may mask the true influence of nutritional treatments on the chemical concentrations of the leaves; its effects should therefore be eliminated as much as possible. Work on this subject is briefly reviewed in the following sections.
4.3.1. Sampling phase
Most of the variability is being introduced during field sampling procedures. Information on the nature of the variability of individual factors would enable the investigator to eliminate sources of variation and to develop a procedure for the collection of homogeneous leaf samples of relatively low variability. Results of work by STEYN (1959), GOUNY, SHOR-
ROCKS (1964), by TWYFORD and COULTER and others on this subject stress that for this purpose a predetermined number of leaves should be collected from well-defined locations on the plant.
Unaccountable variation may be substantially reduced by increasing the sampling intensity of the area under investigation. STEYN studied this problem for citrus and pine-apple, SHORROCKS for rubber and BROESHART
and WARD for oil palm. Each approached this problem of estimating the optimum number of sampling units from a different angle: a. By determining the standard deviation of the individual nutrient values
of an arbitrary number of plants and by calculating the standard error (BROESHART 1955).
b. By using the concept of "permissible error" and a predetermined level of precision between the population mean and the sample mean (SHORROCKS 1964).
c By stating a desired level of precision of the difference between the sample mean and the "true" mean (STEYN 1959)-
d. By determining the critical number of palms in a uniformity trial (WARD).
From their results Steyn and also Ward concluded that the sampling area should be divided into more homogeneous sub-sampling units, if there exists an apparent large variation in fertility from place to place; each of these individual sub-units should be sampled at random. WIIXSON studied the effect of samplers on the coefficient of variation; he found this effect negligible if sufficient plants were sampled.
4.3.2. Preparative phase
In the pre-analytical phase error variation may be introduced by incorrect storage of fresh material, omission of specific portions of the leaves,
27

washing, drying, grinding and storage of the dried and crushed or powdered leaf material. A comprehensive review on the majority of these aspects has been presented by GOODAIX and GREGORY. With respect to leaf portions in oil palm BROESHART (1956) showed that the composition of the leaflets varied from the proximal to the distal end of the frond. In bananas TWYFORD and COULTER were able to demonstrate considerable differences of the chemical concentrations of the various portions of the laminae. Petioles and/or midribs are sometimes removed from smaller types of leaves to obtain more homogeneous material. BOULD et alii investigated the effect of sub-sampling. He pointed out that the analysis of hand-crushed material with intact petiole introduces a large measure of variability. This portion of the leaf should therefore be discarded, if the material is not subjected to grinding before analysis.
The effect of storage before drying was studied by SHORROCKS and RATNA-
SINGAN for rubber leaves and by STEYN in citrus leaves (1959). The authors concluded that fresh samples should preferably be stored at a temperature below -5°C; alternatively the leaves must be dried within 48 hours after collection. Cleaning and washing may be an additional source of error (GOODALL and GREGORY). The consensus of opinion suggests that individual treatments may substantially affect the chemical composition. Careful examination and standardization appears essential to prevent the introduction of undesirable error variation. As a consequence, in each separate crop individual procedures should be evaluated.
4.3.3. Analytical phase
Error variability may be introduced by analytical procedures and techniques. Tests have shown that this type of variation is usually small as compared to the total sampling error. A coefficient of variation of 0,6-5,0^ was recorded by STEYN for his methods of analysis. BROESHART (1955) found 4-13% satisfactory in his work.
4.4. INTERPRETATION
Finally, correct interpretation of data obtained by the analysis of leaves is J * Z T ' T « « « « » n p l « stage of this diagnostic method. Many for n H S 1C n m ' 1° f ? r m u k t e aPP roP™te systems of interpretation from v^T t C r ° P ^ W h i ( * w o u l d a l l°w consistent and reliable results
i Xnsone of these appeared to be comPletel? s^«°*y limiting n S f lS ^ d ° n t h C - ^ P t i o n that the application of a 2 S ; T * ^ ^ a n l n C r e a S e ° f i t s concentration in a c S m S d S ? ' C ° n C u r r e n t r e s P ° - e ™ growth and/or yield. r e * e T o n l w T I T , ™ ^ ° t h e r S W e P r e s e n t e d comprehensive o l l T i n t e ™ I S J w " T ^ ° f ° P i m ° n S t r e s s e s ** Complexity tot r a c S c £ T ^ ^ " S * " 1 data, owing to the multitude of interacting factors. The successful results obtained by application of leaf
28

analysis in the control of crop nutrition, particularly that of sub-tropical and tropical crops, show, that a practicable and workable method can well be evaluated.
A brief review of the essential lines of thought of several of the current methods of interpretation will be presented. Fundamentally, one can distinguish univariate, bivariate, trivariate and multivariate approaches (HOLLAND).
Univariate approach
The chemical concentrations of limiting elements considered individually, and the nutrient levels associated with maximum growth or yield are determined. These threshold values are employed as reference levels. This approach is based on the law of the minimum factors; it appeared particularly suitable in those cases where marked nutrient deficits were present. Results were less definite at those ranges, where fertilizer responses are less pronounced.
PREVOT and OLLAGNIER (1954,1956,1961) applied this method successfully to nutritional problems in oil palms, coconuts and groundnuts in West Africa. They found later that a critical balance existed between N and P, and between Ca, Mg, K and Na, as a result of antagonistic and synergistic phenomena. These aspects should also be incorporated for a correct and precise interpretation. Variants on the univariate approach are frequently employed. Several different systems of nomenclature exist to describe the status of the chemical composition in the leaves. MACY introduced the concept of poverty adjustment. KENWORTHY delimited zones of deficiency, hidden hunger, normal, approaching excess and excess. Other workers preferred a simple division into deficient, low, medium, high and excess, respectively (REUTHER and SMITH).
BESSIS and FRIIS-NIELSEN discussed the use of STEENBJERG'S curve as a foundation for the establishment of threshold values. Its range is divided into four distinct intervals, viz: deficiency section, minimum levels, interval of accumulation and a section of maximum values. NIELSEN, working with grass, stresses that in actual fact only the chemical concentrations within the deficiency interval and that of the minimum levels possess Practical importance. In the subsequent interval no appreciable response in dry matter production could be observed in relation to leaf concentrations, provided other growth factors were maintained at their optimum. BESSIS pointed out that visual symptoms of deficiency may still occur in this interval until eliminated by accumulation. This implies that nutrient concentrations should be maintained within the interval of accumulation, above minimum values associated with absence of visual symptoms.
NIELSEN stresses that the nutrient levels must necessarily be considered in conjunction with growth and development of the crop. Slight changes in leaf concentrations during short intervals due to application of growth factors or dilution and translocation effects are only of minor importance.
29

Steeply decreasing values, associated with specific elements, concurring impaired growth and rising levels of other nutrients indicate the imminence of incipient and finally of visual symptoms of disorders.
Bivariate approach
Essentially, the bivariate approach acknowledges the need to consider definite nutrient equilibria between 2 nutriens within the plant as a measure to predict nutritional requirements. Introduction of these ratios has an advantage in that it partly reduces the effect of environment on the chemical concentrations.
A definite close relationship has been established between nitrogen and phosphorus (PREVOT and OIXAGNIER 1956) in a large number of crops. BEAUFILS applied ratios in his concept of "diagnostic foliaire" in rubber in Vietnam. FERWERDA suggested the use of ratios in oil palm, as some of these seem to be reasonably constant, irrespective of time. However, in Malaysia SHORROCKS (1964) favoured the concept of critical concentrations, in spite of the complex interrelationships which are known to exist in the latter (HOLLAND).
Trivariate methods
LAGATU and MAUME were the first to introduce the concept of intensity and balance of nutrition between 3 elements, notably for calcium, potassium and magnesium. Later investigators stressed the balance concept and did not pay much attention to the intensity aspect with the exception ofLoui (1953,1957) working in coffee. The concept of the balance of the bases Ca, K and Mg found general application in those crops where the sum of the percentages of individual concentrations remained reasonably constant. PREVOT and OLLAGNIER (1954,1956) worked this out for oilpalm and coconut. The tnvanate method is used by French workers in particular, by LAGATU
and MAUME (1926, m7,1933) and LEVY for grape vine, by BOUAT for olive, by LOUE (I953,1957) for coffee, and in combination with the univariate approach tor oilpalm and coconuts. Several minor variations exist on this general theme. The concurrent use of the univariate and trivariate approach has beenfound to gwe satisfactory results in a considerable numbei-of crops. Multivariate methods
m^teT?1 C°nC™i(? o f a nutrient in a leaf may provide a sensitive
W r n e r f X P KTh a n d / ° r y i d d ' * t h a t n u t r i e n t is the sole factor e r S ™ T - ^ C ° n C e p t USUa11? d ° e S n o t »PPly * °ther nutri-Un/rsuchZd V y m T t e r a C t " WhCn non-nutrient factors are limiting, s i n c h n t u e f E Y T ° N SUggeS tS t h e a P P l k a t i o n of multiple regres-aHe to evaluate "i T 7 " ^ f a C t 0 r S ES P O S s i b l e - T h i s a u t h o r w a s
stm*^oTcent-r P tTfl0n ^ r d a t i ng n i t r ^ n and potas-
30

HOLLAND suggested the application of a fundamentally different multivariate method. This "principal component analysis" may include the concentrations of all elements. Such a method of analysis would be attractive, considering the large number of variables which influence the performance of a crop; The variates are usually confined to the chemical concentrations of the leaves on the one hand and the application of nutrients on the other hand. The "principal components" themselves include the principal axes of an ellipsoid which defines the space, occupied by the scatter diagram of the original variates. The axes are expressed as linear functions of the original variates.
4.5. EXPRESSION OF RESULTS
This subject has been comprehensively discussed by GOODALL and GREGORY.
Research workers may apply different methods. Expression on ash and on dry matter is commonly used; the latter is most widespread. The simple wet-ashing method of analysis may be in part responsible for the preference of dry-matter expression. Sometimes units of leaf area of fresh weight may be desirable as a basis for the expression of results. The use of oxides of nutritional elements has been largely abandoned.
5. ANALYTICAL METHODS
5.1. LEAF ANALYSIS
The numerous methods developed for the chemical analysis of plant tissues can be broadly divided into two groups. Those employed for fresh tissues are less appropriate in tropical countries in view of rapid changes in readily soluble fractions under these conditions. The alternative method prevents tissue deterioration by a suitable drying process prior to analysis.
Except for Mg the determinations of N, P, K, Ca in dried leaf material, employed in this investigation have been refined and adapted by VAN SCHOUWENBURG from established methods, particularly in view of rapid routine determinations and the use of simple instruments. These methods are characterized by speed and simplicity; 6 major elements can be determined accurately in a single wet-digested sample.
Large-scale testing in a routine laboratory, applying advanced instruments and semi-automatic, electrically operated pipetting machines showed that the methods were suitable and satisfactory for foliar analysis m a variety of crops. The results demonstrated that a good compromise between accuracy and speed could be obtained.
31

For this investigation, only the major elements N, P, K, Ca and Mg have been determined. Preliminary tests indicated that the concentration of Na appeared to be in the order of 0.03%, which is of little importance. Calculations of contents of elements were carried out by computer IBM 1620.
Essential points of the analytical methods are briefly summarized below.
Preparation of extracts
A finely powdered sub-sample is digested according to Lindner-Harley. In the digest N, P, K, Ca, Mg are determined.
Nitrogen determination
An aliquot of the digest is subjected to micro-destillation according to Kjeldahl. NH4 is collected into a mixture containing boric acid and 6 drops of methyl-red, and titrated with KH(I03)2.
Phosphate determination
To an aliquot of the digest NH4-molybdate is added for the formation of yellow hetero-poly-molybdenic acid, which in turn is reduced to a phos-phomolybdenum blue complex. KSbOC4H406 and ascorbic acid are added to stabilize the rapidly developing colour for at least six hours. Colour intensity is measured by means of a Beckman spectrophotometer (900 mji).
Potassium and calcium determination
An aliquot of the digest is prepared for measurement in an Eppendorf flame photometer against an appropriate standard series of solutions. Propane is used as fuel for the determination of K, whereas acetylene is employed for Ca. Measurement may be completed in the same solution tor both elements, taking suitable precautions against possible contamination. As a rule K is measured separately, as addition of LiCl2 is required to obtain a straight reference curve for calculation by computer. This reagent tends to interfere with the determination of Ca.
Magnesium determination
An aliquot of the digest is diluted 1 : M with a mixture of 2 parts of iso-propyhc alcohol and 5 parts of water. After shaking, the magnesium content is measured against a standard series by means of an atomic-absorption apparatus.
5.2 VARIATION INTRODUCED BY LEAF PREPARATION
after tbe??n f^?°n * ^ ^ t 0 V a r i a t i o n s w h i c h m a 7 b e introduced suLested 2 C ° U e C t l 0 n
f °f leaVCS- W o r k i n o t h e r Perennial crops has
c E 2 I t P 7 e n C e °f SCVe r a l f a C t ° r S i n t h i s s t a § e ^ i c h affect the iveTrmZ r TT Tth rCgard t0 th6Se " P * * t h e «&« °f-"es-sive treatments applied to the leaves was examined.
32

5.2.1. Cleaning of the leaves Within 4-6 hours after collection the leaves arrived in the laboratory. Cleaning of extraneous matter was considered essential as the upper leaf surface in particular tends to collect dust during dry spells, whereas both the upper and lower surface are exposed to splashing mud during periods of frequent rainstorms. Two separate sets of 10 batches of homogeneous leaves of each of 10 vines have been collected. Each batch was split at random into two equal subsamples. In one set of batches wiping of the leaves with moist cotton wool dipped in a solution of 0.2% Teepol was compared with cleaning by a clean dry cloth. In the parallel set washing by fingers in a 0.2% Teepol solution was compared with simple wiping with moist cotton wool as before. Excess Teepol was removed by means of clean cotton wool which had been moistened with distilled water, followed by dabbing with a clean dry soft towel to remove excess water. Leaves were subsequently packed in muslin cloth of appropriate size and dried at a constant temperature of 7o°C ± 1° in a force-draught oven for 48 hours, followed by analysis. The results are presented in table 2.
The data show that none of the treatment effects attains significance for any of the elements. With regard to this result, cleaning of the leaves with moist cotton wool (0.2% Teepol) has been adopted for routine cleaning procedures.
5.2.2. Removal of the midrib Regular and continuous translocation phenomena in this conducting tissue suggest a large potential source of variation.
Appropriate homogeneous leaf samples containing 2 X 32 leaves were collected from each of 10 healthy vines and divided at random into two sub-samples of equal size. The results are presented in table 2.
There is a significant difference apparent in the content of calcium (P = 0.01). Leaves including the midrib contain 10.5% more of this element. (All the percentages related to differences in concentrations should be considered as relative.) A reversed effect was observed for nitrogen; this was significant at P = 0.05. There was no difference in concentrations of phosphorus, potassium and magnesium. The results indicate either the presence or absence of the midrib in leaf samples. For convenience the midribs have been included.
5.2.3. Drying temperature When dried leaves show a black or dark brown edge or surface roasting and concurrent loss of nitrogen is very likely to have occurred. A proper drying temperature should strike a balance between drying speed an prevention of N loss. , , .fnrm
A set of io appropriate leaf samples was collected from healthy, uniiorm vines. Each sample was separated at random into 2 sub-samples containing an equivalent number of leaves. One sample of each pair was dnea
33

TABIE 2
The effect of preparation of leaves on the chemical concentration of the major nutrients (% dr. m.)
Effect of:
leaf cleaning Dry cloth Moist cottonwool Mean
o hit C.V. Significance
leaf cleaning Washing with fingers Moist cottonwool Mean
o fstr C. V. Significance
leaf veins Removed Not removed Mean
o fatr C.V. Significance
Drying at 65°C Drying at no°C Mean
h* a
C.V. Significance
Storage Immediate analysis Analysis i year later Mean
C.V. Significance
Nitrogen Phosphorus
3.23 3.22 3.225 0.09 0.08 2.8% NS
3.14 3.15 3.14 0.12 0.14 3.7% NS
2.51 2.44 2.48 0.05 8.63 2.0% *
2.74 2.63 2.68 6.44 0.14 5.2% *
2.51 2.51 2.51 0.25
10.0% NS
0.18 0.18 0.18 0.006 1.50 3.3% NS
0.15 0.15 0.15 0.005 0.40 3.4% NS
0.24 0.23 0.235 0.016 0.32 7.0% NS
Potassium
1.04 1.08 1.06 0.05 3.88 4.7% NS
1.66 1.67 1.665 0.07 0.13 4.4% NS
1.76 1.80 1.78 0.07 1.50 3.8% NS
Calcium
1.70 1.75 1.73 0.09 2.15 5.2% NS
1.69 1.66 1.67 0.15 0.44 9.2% NS
2.08 2.28 2.16 0.14
14.77 6.5%
Magnesium
0.30 0.31 0.305 0.011 4.24 3.7% NS
0.34 0.34 0.34 0.08 0.00
23.6% NS
0.18 0.18 0.18 0.039 0.09
21.5% NS
h o u r t T ^ ^ r r " ^ ^ " II0°C±I°C for 2 >< * consecutive A s e c a n t SfT ^ "* P r e s e n t e d in >•
t h e i S r WaSu0Und T h e h i S h e r temperature depressed this latter case the l e a v S l e l ' f ? C ° m p a r e d W* h **&* a t 7°°C * retauied a dark green colour and were crisp when

TABLE 2a
Errors due to analytical methods
Effect of:
Analytical error Standard sample 1 Mean 0
C.V.
Analytical error Standard sample 2 Mean c C.V.
Nitrogen
3.62 0.05 1.555
2.58 0.02 1.125
Phosphorus
0.33 0.010 3.025
0.17 0.008 4.7%
Potassium
3.33 0.09 2.7%
1.71 0.04 2.3%
Calcium
0.93 0.01 1.3%
1.76 0.02 1.3%
Magnesium
0.27 0.020 7.4%
0.28 0.015 5.4%
Analytical error Standard sample 3 Mean
c C.V.
1.19+ 0.02 1.8%
0.13 0.002 1.5%
0.61 0.001 1.6%
0.18+ 0.01 7.2%
0.05+ 0.006
12.0%
Presence of characteristic symptoms.
fstr = F value for stratification C V. = Coefficient of variation
NS = Not significant * = Significance at P = 0.05
** = Significance at P = 0.01
drying was completed; in contrast, leaves dried at no°C displayed a brown discolouration frequently accompanied by coal-black margins.
5.2.4. Losses upon storage
Hygroscopic absorption by dried leaf material may initiate break-down processes, resulting in loss of N. Information on the effect of storage under conditions of excessive humidity and relatively high temperatures in tropical low-land, with respect to the concentrations of N was therefore considered important.
A study was carried out on 16 leaf samples which were randomly selected, dried at 7o°C and finely powdered. Each of these samples was analyzed immediately after grinding. The remainder of the powdered material was transferred to glass specimen bottles with ordinary tight-fitting corks. These units were stored for 1 year under adverse conditions of humidity and temperature, on a shelf in a laboratory cupboard. At the end of this period, a second sample of each of the units was analyzed, employing the same analytical methods as before. The results are presented in table 2.
The data showed that there is no significant difference between the content of nitrogen immediately after drying and that found one year later. Apparently, closed specimen bottles were sufficient to prevent deterioration of leaf material and loss of N.
35

The space occupied by these glass specimen bottles with the risk of breakage, particularly when shipped over long distances constitutes major disadvantages. Instead, polyethylene bags 8 x 12 cm in size and 0.07 mm thick were employed successfully. After transferring hand-crushed leaves from the muslin drying bags to the polyethylene bags the ends were sealed air-tight. Packed and stored in darkness the material retained its original dry colour for a considerable period.
It appears that retention of the main vein, wiping with moist cotton wool in Teepol, drying in muslin bags at 7o°C and storage in polyethylene bags provides a suitable procedure for the preparation of leaf samples.
5.3. SOU ANALYSIS
The soil in the investigation was subjected to chemical and mechanical analysis. Potential nutrient supplies were examined for their immediately available contents of nutrients as well as for their reserves to obtain an estimate of their chemical potential. In addition other standard characteristics have been determined to describe the natural fertility status of the soil.
Mechanical analysis
A sub-sample of soil was pretreated with sodium-pyro-phosphate to segregate the aggregates into single particles. Subsequently individual particles of a size > 50 p. are separated from the silt and clay fraction < 50 (JL. The coarser fraction is subdivided into a portion containing particles > 200 [X and one ranging from 50 p to 200 [/,, by means of a set of appropriate standard sieves. The fraction < 50 JA is separated by applying a pipet analysis.
Chemical analysis
An extraction procedure using boiling 25% cone. HC1 for a period of 3 hours has been employed for the determination of nutrient reserves. Available nutrients have been determined by a standard extraction with Morgan-Venema solution (Na-acetate aceticacid pH 4.8; suspension 1:2.5). Bases and phosphate have also been determined in saturated soil extract.
Other soU characteristics included the determination of the pH in water and in KC1 organic matter content by the method of Kurmies, using chromic acid, the cation exchange capacity by slow percolation with 0.5 N ammonium acetate solution, P retention, K retention under dry and moist conditions, lime-requirement, and the pF curve.
36

6. THE SAMPLING PROCEDURE
To obtain a leaf sample which adequately represents the nutritional condition of a crop a standardized sampling procedure should be worked out. A representative sample contains well-defined leaves which are present at the appropriate time in sufficient quantities. Ideally, these leaves should be particularly sensitive to changes in soil nutrient conditions and reflect these accurately in their chemical composition. Concurrently, the various effects of other factors on nutrient concentrations should be small or negligible. Part of the influence of these latter types of variation may be eliminated by suitable stratification, sampling of a physiologically uniform population and employing standardized methods of preparation and a-nalysis of satisfactory accuracy and precision.
The first 2 of these aspects have been investigated by examining the following sources of variability: a. Variation due to position, age, size, presence of petiole and thickness of
leaves and changes due to daily variations and weather effects.
b. Error introduction during sampling. c Variation introduced by seasonal influences throughout the year.
d. Variation related to the number of leaves, number of plants, representation of the sample, etc.
In addition, comparable leaves from plants with a different age may differ in their composition; in the current work, the results are limited to those of mature producing vines in which the variable "age" is eliminated.
All statistical procedures in this work have been carried out with reference to SNEDECOR.
6-1. VARIATION OF CONCENTRATIONS DUE TO POSITION, AGE, PETIOLE,
ETC.
6-". Preliminary survey ofN,P,K,Ca and Mg The effect of leaf age, type of branch, portion of the vine, presence of fruit and of the petiole on the contents of nitrogen, phosphorus, potassium, calcium and magnesium was examined. The following comparisons were
37
arranged in a split-plot design with a total of 240 observations for each contrast. A. Branches of higher order versus the main branches directly emerging
from the stem nodes, and secundary branches. B. Presence versus absence of fruit spikes on the branches. C. The youngest mature leaf versus the next mature leaf (the latter is
defined as the 1st older mature leaf). D. Presence versus absence of petiole. E. The upper 4 ft of the vine versus the middle section of 4 ft versus the
lower portion of 4 ft (Ti, T2) T3). The experimental vines were apparently healthy, vigorous and uniform
in appearance with fruit, and located within the same soil type in close proximity to each other. The canopy supported abundant foliage so that the ratio leaves removed/leaves retained is low, as is the case in all subsequent work presented in this chapter. Separate plants received the same treatment prior to the experiment. There were 5 replications. Each sample was collected between 7 a.m. and 12 noon on the same day and consisted of 32 leaves collected equally frequently from the north, east, south and west quarter aspect of the plant. Before the sampling took place, the wheather was dry and overcast and there had been no rain within 24 hours. In this context it may be mentioned that in all subsequent work vines were not sampled whenever rain was falling, within 24 hours after rainfall or when the foliage was not dry. As often as possible samplings were carried out under similar weather conditions.
After sampling individual leaves were prepared according to the established procedure.
The analysis of variance is presented in table 3. The results of individual treatment comparisons are given in table 4. The data show that there is no significant difference for any of the 5 elements with respect to the top, middle and bottom portion of the vine. Other salient points of the results are discussed in the following paragraphs.
A small significant difference for N was found for the treatments B, C and D, but not for treatment A. The main branch and removal of the petiole depressed leaf N. The content of this element in leaves located on fruiting branches and the N concentration in the youngest mature leaf I T f t y h l g h e , r t h a n i n t h o s e f r o m non-fruiting branches and in middled I" m £ \ r C . Caf ' r e sP e c t i v e ly- Only a single interaction in the middle section (T2), "with fruit x section of the vine" attained signifi-
t h t T o u n L l f ^ h i g , h ec W h C n t h e r C 1S n ° f r u i t o n t h e branch. Similarly, pa r tT h e
Sp I T " " 1 ^ T**" m M e ° f t h i s d e m e n t t h a n i t s c o u n t e " ' Sfpedoles a i m ^ l 0 C a t e d ° n S i d e b r a n c h e s > a n d ^ the case when of h ^ I n o n T 6 1 " ' ^ ^ a k ° t 0 b C " ^ h i § h e r t h a » * the leaves or tne corresponding contrasting positions.
Positional d f e n c e s appear again to be small for potassium. Absence or 38

y o 3 n n H W H 3 4 ' o
^ H M N > H C n n i K M w O \ l - » S ) M W I O w 0 0 S )
V> , I O O I P , ' • - ' " h - V i " t j "(o b i • - i » *
. C\ C i - J - j w w i O O O N) W - J o © o
N)
I w o
• 0 0 0 0 \ W C T I O O U I O ! S O O I O O C » W O O Ul
Sfll w 3
«3 -^ ^ i ^ f o i-* j ^ H .J-" .P^ -*• P -
i o w w u l « b \ M b u b o b \ i o 2 9 S * , H t t 2 o S o o o i o \ o i i N > o o a > O i © c ^ h - o \ © H ^ " - J < - n ^ © o w
b "io p\ H^ H^ ^^ ^^ *»o H ^ o^ c i ir*- ^S\ I N v© >it i ^^ w ^^ ^^
U J O U 1 0 H v J O O O > U ^ K i ^ M * p i < l ^ u y w u M b i b i b u l i b i U b ' * ( » N g g
Vi "to
o
H» t 0 t o
b b Jj b\ oo
S 5 o, vo S S S S K fe eg § § £ I o S o i o f t S o i o a ^ O f o o o
ft ^ H H* h» h * © ^ . t ^ O t J l * M O l U M U t O O l M K I I O M l j i N j M w ^ i o w *
o 3* bo t—*
ft 8
£ Is
re era
CL ft
2 8
2 oi
H 3
CO OT
v 3 3 o
£ J <i G M O I K - & © K . « f * j j N W CO M u M I n H (O K " H - N M d 9> tfe K £ j 00 S J o s i N i j S o M i - ' B S a N ^ o p a i ^ S P ^
' - ^ ' ^ W L n O O H U O f J l O O W » ( ? v O O » > - ' fc o © ©
o\ N M M M M » t o _ _
e - J o\ o\ 00
^ o o o o i w ^ j o o t o o o o o u i w e ^ w o
ft to
to S _ W 2 N ~ * . B S.2.B.« o, 3 *. fe vo K b3 "8 "ft § "§ g g $ g g S fc»
u i O i u i K W w O i O i C n o c n > f c ^ * ^ w w K o w w
ife w to to S M .*• J° r ;
N > O O w " p O l O i K ^ O P , ? 5
j i g o. oo j , S vo S! 3! « & 3 S S H S £ J5 S •""* V I (Jl t-» h-» t—» »0
^ ^ j ^ b - i b a ' t o b o ; - ] © _ bo bo In y i •u o\ ^ © °
3
CO CO
S 2,
O
cr o CO
^
ir l-s
n
5
s E 3
39

presence of petioles has no apparent effect on leaf K. Leaves obtained from branches which are bearing fruit, and the mature leaves appear to contain more K than their respective contrasts. On the other hand, leaves collected from the main branch have apparently a lower K level than those obtained from side branches.
In contrast to the 3 preceding elements the differences in concentrations of Ca are relatively large. The contents are at their highest in the mature leaves, in leaves on the main branch, in the absence of petioles and in leaves obtained from non-fruit bearing branches. Presence of fruit apparently reduces the Ca concentration by approximately 8%; this value is 6% in the case of main and side branches, and 5% for leaves and petioles.
Fruit depresses leaf Mg by approximately 7%, whereas the concentration of this element is higher by 10% in leaves located on the main branch. Both differences are highly significant. None of the other 2 comparisons showed any appreciable effect.
Significant differences which have been observed for the 5 individual elements occur at least twice within each of the comparisons. This indicates the need for stratification to prevent the introduction of undue error. Thus intact leaves of a particular physiological age group should be collected from strictly defined positions on the lateral branches whenever representative leaves are required as indicators of the chemical composition ol the plant. The absence of differences between the top, middle and lower section of the vine suggests that for all practical purposes and for convenience the lower 2/3 of the canopy may be sampled without introducing undue error. Petioles should either be absent or present.
The apparently high power of discrimination of differences between contrasts may be attributed to the considerable number of observations (table 2) m C ° m p u t a t i o n s ' a n d t o t h e Precision of analytical methods
6.1.2. Principal work
hZfZ t 0 i h C P ru
d i m i nfa ry r e s u l t s ^ e influence of a number of variables
TZu ,CCt ? f m ° r e d e t a i l e d examination. A system of replicated S e l T T o u°f 2'3 ° r 4 S d e C t e d a l t e™tives of the same variate has not be ™ , T A0
kther
LVariates w e ^ kept constant. Interactions could
£ w^shown in tb 'f ^ " ^ C ° n S i d e r e d a m a J ° r ^ v a n t a g e „ a c Z s a t Z e d P r e h m i n a r y t r i a l t h a t o n l y 1 out of 50 possible inter-S a t i o ? ^ ^ f " T ; ° n e a c h o c c a s i °n the same predefined leaf
zsgzzss^**sampiin*- **«•*» «*«»**— «.IAI. The sampling popu l a t i on
pearance but n J l t , ? ™ ^ s a m P l e units were uniform in ap-P ance but not necessarily healthy; the vines were of the same age. A

W <«
S n
5 re
ft 3
£ co •S da'
l a
« 01
*T3 h J
l
00
Co co o a era' in "
g to rc eg' in p o • 0 5 ? & B
W
co co n Q
f f f t '
co d3' B. en n
175
hi
r*
ft
0 Q
•< g n> p
<! P
co co f j a
s I B f
3 ft p
2 o •-• © o g o r O N S b i o n i o u i b g i o * CO © © *"* Co
" ' U M N N
to 2 o o o o co g 5° 2 >°,
- J ' N) «3
o to
CO O Ov o o co p to © jo o N * b * w oi * . vo co &q © ©
co © © o ~ c o p o v p o Z p y P £ • O 1 > H U * O ( 0 O I — C 0 O H - ; I - J S
£ o
CO O •<! p © CO © f
8
.- - . o !° * § aq K w
C O O ^ I O H - c o o p p p c o p h U P f
o to
8
2 p co o o to o to o jo
Cn
w o W O N co * to sq cn £
© cn o ~ c o o w p p co © co P £> O O I O H » J O - J K S p & Q ^ y ? r: &<a ° I ^ S b i *gSQg$ -gaa
o t o Co
o t o
s
Z P N O P c o p o , p s > Z P cn p j - < 2 £ £ g g ^ 2 £ § " S o a p w J b to U lo Co © cn © co J g w o g g f t S i H -
o
n R
&4 5. a
6. o
8 2
ft o
5?
w
n
41

TABLE 5
The influence of a number of major variables on the chemical concentration of nutrients in the pepper leaves (% dr. m.)
Effect of:
Insolation Sunshine Shade Mean a Fsu C.V. Significance
Leafage Youngest mature leaf Second mature leaf Third mature leaf Mean a fstr C.V. Significance
Leafsize Normal size Small size Mean a htt C.V. Significance
Number of leaves A leaves 3J leaves 128 leaves Mean 0
Fstr C.V. Significance
Time of sampling 7.00 a.m.
10.00 a.m. 1.00 p.m. 4.00 p.m.
Mean (J
^BtP
C.V. Significance
Nitrogen
3.32 3.32 3.32 0.12 0.00 3.6% NS
2.80 2.88 2.81 2.83 0.055 7.30 1.956 **
3.24 3.09 3.16 0.06 32.40 1.956 **
2.80 2.84 2.80 2.82 0.07 0.92 2.5% NS
2.96 2.86 2.88 2.79 2.87 0.11 3.96 3.856 *
Phosphorus
0.18 0.20 0.19 0.009 9.94 4.756 *
, 0.23 0.21 0.19 0.21 0.008
59.80 3.8% **
0.19 0.19 0.19 0.006 0.53 3.2% NS
0.14 0.14 0.14 0.14 0.010 0.18 7.1% NS
0.16 0.18 0.17 0.17 0.17 0.020 1.23 11.8% NS
Potassium
1.09 1.38 1.23 0.15
19.63 12.2% **
0.80 0.71 0.72 0.74 0.13 1.65
17.5% NS
1.26 1.22 1.24 0.04 5.30 3.2% *
1.79 1.82 1.83 1.81 0.06 0.89 3.3% NS
0.61 0.53 0.67 1.16 0.74 0.19
22.72 25.7% **
Calcium
1.93 1.74 1.83 0.22 3.76
12.0% NS
1.99 1.93 1.85 1.92 0.10 5.56 5.2% *
1.85 1.95 1.90 0.13 3.02 6.8% NS
1.72 1.68 1.74 1.71 0.11 0.68 6.4% NS
1.94 2.01 1.95 1.99 1.97 0.16 0.46 8.1% NS
Magnesium
0.29 0.29 0.29 0.019 0.00 6.6% NS
0.24 0.22 0.19 0.22 0.014
23.80 6.4% **
0.20 0.20 0.20 0.008 3.09 4.0% NS
0.35 0.35 0.35 0.35 0.027 0.10 7.7% NS
0.26 0.27 0.28 0.29 0.27 0.030 1.55
11.1% NS
42
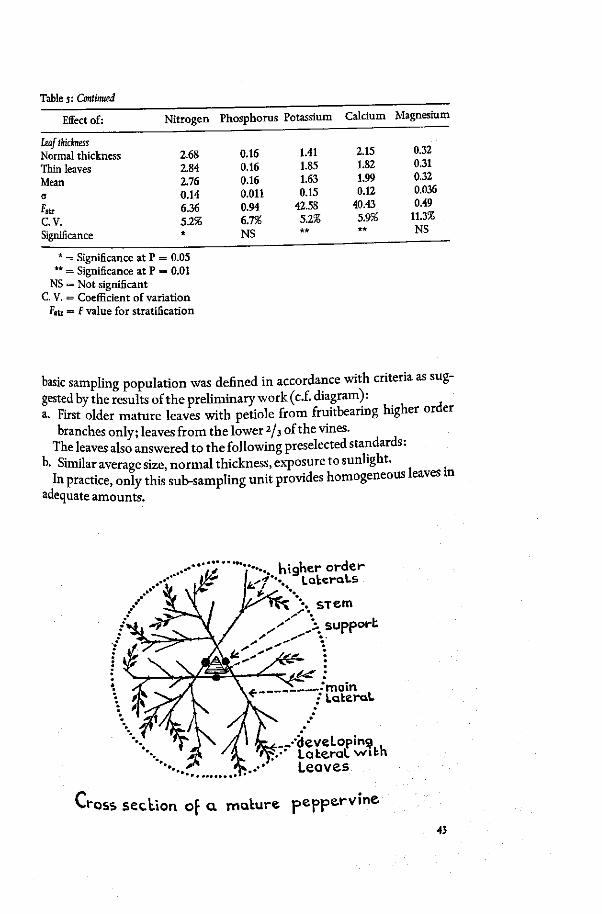
Table 5: Continued
Effect of:
hafthidness Normal thickness Thin leaves Mean 0
C.V. Significance
Nitrogen
2.68 2.84 2.76 0.14 6.36 5.2% *
Phosphorus
0.16 0.16 0.16 0.011 0.94 6.7% NS
Potassium
1.41 1.85 1.63 0.15
42.58 5.2% **
Calcium
2.15 1.82 1.99 0.12
40.43 5.9% **
Magnesium
0.32 0.31 0.32 0.036 0.49
11.3% NS
* = Significance at P = 0.05 ** = Significance at P = 0.01
NS = Not significant C. V. = Coefficient of variation
Fsti = F value for stratification
basic sampling population was defined in accordance with criteria as suggested by the results of the preliminary work (c.f . diagram): a. First older mature leaves with petiole from fruitbearing higher order
branches only; leaves from the lower 2/3 of the vines. The leaves also answered to the following preselected standards:
b. Similar average size, normal thickness, exposure to sunlight. In practice, only this sub-sampling unit provides homogeneous leaves in
adequate amounts.
, ... higher order L'f':. Laterals
^ ' j.% support s t e m
t. _ — - m a i n , * • Lateral
(JeveLoping Lateral wibh Leaves
Cross section of a mature peppervine
4}

TABLE 6
The influence of the stem on the chemical composition of nutrients in pepper leaves
Effect of:
Treatment 1. Stem 1
2 3
Mean a fstr C.V. Significance
Treatment 2. Stem 1
2 3
Mean a Fstr C.V. Significance
Treatment 3. Steml
2 3
Mean 0
Fstr
C.V. Significance
Treatment 4. Steml
2 3
Mean 0
Fstr C. V. Significance
Nitrogen
2.91 2.67 2.64 2.78 0.63 0.26
22.7% NS
2.89 2.86 2.98 2.91 0.13 1.75 4.5% NS
2.80 2.90 2.87 2.85 0.15 0.69 5.3% NS
2.79 2.81 2.75 2.78 0.15 0.29 5.1% NS
Phosphorus
0.21 0.17 0.17 0.18
, 0.060 0.89
33.3% NS
0.18 0.19 0.18 0.18 0.014 0.72 7.8% NS
0.22 0.19 0.20 0.21 0.026 2.06
12.4% NS
0.21 0.21 0.20 0.21 0.025 0.38
11.9% NS
Potassium
2.11 1.88 1.88 1.96 0.68 0.26
34.7% NS
2.18 2.08 2.21 2.16 0.09 3.52 4.2% NS
2.01 2.05 1.94 2.00 0.16 0.81 8.0% NS
1.94 1.85 1.96 1.92 0.16 0.93 8.3% NS
Calcium
1.50 1.37 1.25 1.37 0.49 0.48
35.8% NS
2.30 2.64 2.64 2.52 0.35 2.12
13.9% NS
1.57 1.43 1.48 1.49 0.11 3.33 7.4% NS
1.65 1.58 1.53 1.58 0.14 1.23 8.9% NS
Magnesium
0.13 0.09 0.10 0.11 0.043 1.25
39.1% NS
0.13 0.13 0.12 0.13 0.012 1.78 9.2% NS
0.13 0.13 0.13 0.13 0.024 0.23
18.5% NS
0.15 0.14 0.16 0.15 0.027 1.29
18.0% NS
F«r = F value for stratification C. V. = Coefficient of variation
NS = Not significant * = Significance at P = 0.05
** = Significance at P = 0.01
•44

Table 6: Continued
Treatment 5. Stem 1
2 3
Mean 0
c.v. Significance
1
2.72 2.69 2.85 2.75 0.14 2.80 5.1% NS
0.22 0.21 0.18 0.21 0.030 3.27
14.3% NS
1.92 1.85 1.91 1.89 0.23 0.15
12.2% NS
1.64 1.49 1.49 1.54 0.21 1.23
13.6% NS
0.15 0.15 0.15 0.15 0.036 0.01
24.0% NS
f8tr = F value for stratification C. V. = Coefficient of variation
NS = Not significant * = Significance at P = 0.05
** = Significance at P = 0.01
6.1.2.2. Methods of examination The influence of thickness and size of leaves, shade, physiological age, time of sampling and of 3 different stems, on chemical compositions was examined separately. The following contrasts were compared: a. Small leaves versus leaves of average size. b. Thin leaves versus leaves of normal thickness, c Sunshine versus shade. d. The youngest mature leaf versus the 1st older mature leaf versus the
2nd older mature leaf. e. Stem 1 versus stem 2 versus stem 3-f- Sampling at 7 a.m., 10 a.m., 1 p.m. and 4 p.m.
To study the effect of each component of a contrast, 32 standard leaves were obtained from the basic sampling population on each individual vine. This was followed by collection of an equal number of leaves of a parallel population on the same vine in which only the relevant component was substituted by its contrasts). There were 10 replicates in all.
Leaves for treatments a, b, c, d and e were collected between 7 and 10 a.m. and in all cases a - f equally frequently from the north, east, soutti ana west quarter aspects of the vine. Collection was carried out at least 3 wee after fertilizer application when probable effects of increased nutrient uptake on variability of the chemical concentrations may be consld£fe
have largely subsided. Suitable leaves were abundantly present each am °f sampling to allow random collection within the defined population. The results of analyses are presented in tables 5 and 6.
45
6.1.2.3. The effect of leaf size Differences in leaf size may affect the nutrient concentrations in the tissue. Markedly small leaves and leaves of normal average size were collected.
The data demonstrate, that the concentrations of nitrogen and potassium are significantly higher in normal leaves. In contrast, leaf Ca and leaf Mg show a tendency to be higher in small leaves, but this effect did not attain significance. There was no effect of size on leaf P.
6.1.2.4. The effect of leaf th ickness This aspect was studied by comparing leaves of normal, average thickness with markedly thin leaves present in the same vine canopy. The results are presented in table 5.
Significant differences were observed for nitrogen (P = 0.05) and for potassium and calcium at P = 0.01. There was no appreciable effect of thickness of the leaf on the concentrations of magnesium and phosphorus. Increasing thickness depressed N and K concentrations by 6% and 24% respectively, but that of Ca rose by 19%.
6.1.2.5. The effect of t ime of t h e day
Physiological and metabolical processes in plants are subject to a daily change. Consequently, this source of variation is likely to influence the nutrient composition of the leaves. For this study leaves have been collected at 7 a.m., 10 a.m., 1 p.m. and 4 p.m. respectively. Analytical results are presented in table 5.
The data show the presence of a difference in concentration only for N and K in leaves collected at 7 a.m. compared with those collected at 4 p.m. This is significant at P = 0.05 and 0.01 respectively. The concentration of K remains unchanged from 7 a.m. to 1 p.m., but it shows a sharp rise of 72% from 1 p.m. to 4 p.m. In contrast, the results of nitrogen reflect a gradual decrease from early morning to late afternoon, which is just not significant from 7 a.m. to 10 a.m. The daily change in concentrations of P and Ca appears negligeable. There appears to be a tendency for a systematic rise of the Mg level towards late afternoon, but it does not attain significance.
6.1.2.6. The effect of sunsh ine and shade
Plant metabolism, growth and production depend for a major part on the efficient interception of sunlight by the leaf surface. The period of exposure may affect the chemical concentration of nutrients in the leaf tissue. Leaves have been collected, which had been normally exposed to sunlight
46

throughout the day. Similarly, samples were collected from the same vines, containing leaves from deep-shade positions inside the canopy. The results of analyses are presented in table 5.
The data show a significant reduction of the P concentration when leaves are exposed to sunlight. A similar, but more pronounced effect can be observed for the K concentration in exposed leaves. Leaf K is lower by 21% compared with leaves obtained from deep shade. There appears to be no effect on the concentration of N and Mg. Leaf Ca displays a tendency to a rising level in exposed leaves without reaching significance.
6.I.2.7. The effect of leaf age The preliminary study showed a significant to highly significant differ
ence between the arbitrarily selected youngest mature leaf and the 1st successive older leaf for nitrogen, phosphorus, potassium, calcium, but not for magnesium. A second study was initiated to establish possible differences between the youngest mature, the 1st successive mature and the 2nd successive mature leaf on the same branch. Particular attention was paid to the significance of the difference between the "older" mature leaves, in view of pooled sampling. The 3 appropriate leaf samples were collected from a single branch at the same sampling time. The analytical results are presented in table 5.
The data indicate a relatively mild, depressive effect of aging on the concentrations of N, P, Ca and Mg. Leaf N appears to be significantly higher in the second leaf. There was no apparent influence of age on leaf K. Generally speaking, differences did not exceed 10%.
Except for Ca these results do not essentially contradict those of the same variates in the preliminary study, particularly when taking into consideration that leaf sampling for the two studies was carried out in May and December respectively, during fundamentally different physiological Periods of the crop, in two different years and using producing vines of ditterent vegetative health located on basically different soil types. The Ca anomaly maybe attributed to an "antagonism".
_The data suggest that all 3 types of leaves have already attained the zone 0 relative stability of concentrations (WEIR, PREVOT) coinciding with the onset of senescence (BESSIS). The development of early senescence is not surprising if o n e considers the actual conditions of crop nutrition and the concomitant nutrient demands.
ca Presence of only small differences does not imply in this or in other C0
S6S l n t h i s work that as a consequence the different types of the leaves ^ncerned may be pooled for sampling purposes. It will be shown in par. part"2 1 t h e aCtUal d e S r e e o f significance is decisive for application of betwe S t r a t i f i c a t i o n s r"her than the magnitude of the difference
47

6.1.2.8. The effect of different stems Observations on the foliage behaviour following partial destruction of the root system suggested the presence of apparent obstruction of water supply and nutrients to that one of the 3 stems which maintains vascular connection with the affected roots. Hence, variable fertilizer concentrations near the roots may result in an irregular nutrient distribution pattern over the leaves.
To study the effect of nutrient location on distribution a twofold approach was made:
a. Each of the 3 leaders of each of 7 homogeneous healthy vines was sampled.
b. In each of 5 blocks accommodating 7 vines an ample standard dose of fertilizer was placed in 5 different positions as follows: In 2 bands, approximately 1 m in length, 10 cm wide, and 10 cm deep, which are located in a tangential fashion at the edge of the mound, somewhat parallel to the direction of the underground stem.
In a 3/4 circle, 10 cm wide and 10 cm deep, located tangentially at the edge of the mound, beginning and ending at a distance of 25 cm from the underground stem.
( I ) '
(
)
3. As for (i), but left side only, when facing the underground stem.
4. As for (3), but fertilizer and furrow at the opposite side.
As for (3), but the furrow is shifted 900 in a clockwise direction.
In this fashion the effect of nutrient location of leaf concentrations could be comprehensively studied. It is of practical importance to be able to distmgmsh between the influence of the 5 most common methods of iertilizer placement on the nutrient distribution in the vine, as the system
48

of placement may vary from location to location in commercial pepper gardens.
Appropriate samples were collected from 7 replicates in all. In this study the sample standardization could not be strictly adhered to, for example with respect to the aspect of the vine. The results are presented in table 6.
According to the data, the expected presence of asymmetrical distribution of nutrients in the foliage is not substantiated. The supply of nutrients to the extremities of the canopy appears to be well-balanced, irrespective of the location of the fertilizer around the vine.
6.1.3. The analytical error The preceding tables show that the relative standard error per observation varies from 2 to 25%. A part of this is due to errors introduced by analyses, and in order to obtain information as to their magnitude 29 and 30 sub-samples were drawn at random from 2 different leaf samples. The samples were analyzed for N, P, K, Ca and Mg according to the adopted procedures. The results are presented in table 2a.
The data indicate that variability due to analyses may increase considerably when leaf concentrations decrease toward lower levels in the case of N, Ca and Mg. This implies that analyses on leaves with concentrations near deficiency levels may have a somewhat reduced precision.
The magnitude of the analytical error expressed as the coefficient of variation varies from 1.5-2.5% for K and from 1.5-5.0% for P, irrespective of tissue concentrations of these elements. In contrast, that of Ca shows approximately a sixfold increase when the concentration of this element is reduced 5 to 10 times; the error for Mg tends to double at a fivefold decrease of tissue concentration, whereas at twofold increase of leaf N, the error is reduced by half.
Bearing in mind the range of concentrations in tables 2,4 and 5 it may be seen that the mean analytical error of table 7 applies to the estimation o the proportion from the total variance which is due to analytical errors. It
Range of
TABLE 7
Analytical error and unaccountable variation
Calcium Magnesium concent" N i t r o 8 e n Phosphorus Potassium Calcium » « * -. ^ ™ ° n s 2.52-3.1l!dr. m. 0.16-0.23%dr. m. 0.78-1.95% dr. m. 1 . 5 6 - 2 . 4 0 % d r - n U M ^ f * ^ *
0.014-0.036 l e i a ( c ) d a r d °-055-°-15 0.008-0.03
ggggy *» ~^ ^^"oun tak i l 7 • •
0.09-0.25
0.04
4-20%
96-S0%

appears that this type of error accounts for 2.5-77% of the total variance. For phosphate the entire variation may occasionally be equal to the analytical error. These data show that generally the analytical techniques may be considered to be of sufficient precision. The complementary fraction within the total variance, the sampling error, amounting to some 97.5-23% of the total variation may be attributed to unaccountable influences due to differences between vines, between leaves, differences in soil environment, micro-climate, sample preparation etc. The order of importance agrees with that found for coffee (ROBINSON and FREEMAN) and oilpalm (BROES-
HART, 1955).
6.1.4. The sampling error
6.1.4.1. The e r ro r of bu lk s ampl ing In foliar diagnosis sampling of individual plants is usually considered impracticable. Instead, bulk sampling of a smaller or larger proportion of a crop area is preferred. In this procedure the sample error of the composite samples appears to be of major concern. The error of the concentration of an element in a single bulk sample is related to the standard deviation of the mean of concentrations of the individual sample units. In statistical terms, this relationship may be formulated by a2 = ax/\/n.
a% = standard error of bulk sample, ax = sample standard deviation for participating units, n = number of units involved. ors in the formula may be read as the "bulk sampling error", which is
defined as the apparent difference between the population mean and the sample mean. Thus, "bulk sampling error" = sx/\/n. (sx = best estimate of ax). If a safety margin is required with respect to the reliability of the results, a specified level of confidence may be selected, and the appropriate value for Student's "t" may be introduced into the formula. Thus the permitted bulk sampling error finally becomes:( x sx/-\/n.
When values of sx can be estimated from appropriate sources, and suitable limits of accuracy are prescribed, acceptable estimates can be calculated of the number of sampling units that should be included in a bulk sample, under the prevailing conditions, to represent the chemical composition of the plant population within the range of required accuracy.
To obtain information on the bulk sampling of pepper vines, the standard deviations have been computed for the concentrations of N, P, K, Ca and Mg of 80 randomly selected plants from a visually homogeneous group of 400 individual vines. Each sample was collected from a single vine, and included 32 leaves, which were picked at random from the predefined population on the canopy. The results of analyses are presented in table 8; the bulk sampling error is given, expressed in terms of a and as a percentage of the mean.
The data show that the errors of bulk sampling for P, Ca and Mg are of the same order, irrespective of elements. For N this error is smaller by 50%
50
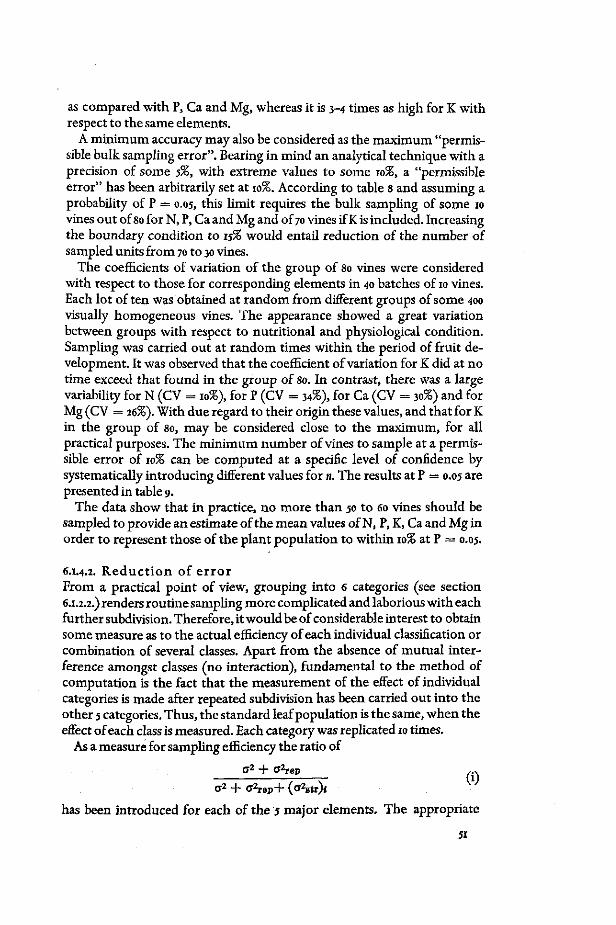
as compared with P, Ca and Mg, whereas it is 3-4 times as high for K with respect to the same elements.
A minimum accuracy may also be considered as the maximum "permissible bulk sampling error". Bearing in mind an analytical technique with a precision of some 5%, with extreme values to some 10%, a "permissible error" has been arbitrarily set at 10%. According to table 8 and assuming a probability of P = 0.05, this limit requires the bulk sampling of some 10 vines out of 80 for N, P, Ca and Mg and of 70 vines if K is included. Increasing the boundary condition to 15% would entail reduction of the number of sampled units from 70 to 30 vines.
The coefficients of variation of the group of 80 vines were considered with respect to those for corresponding elements in 40 batches of 10 vines. Each lot of ten was obtained at random from different groups of some 400 visually homogeneous vines. The appearance showed a great variation between groups with respect to nutritional and physiological condition. Sampling was carried out at random times within the period of fruit development. It was observed that the coefficient of variation for K did at no time exceed that found in the group of 80. In contrast, there was a large variability for N (CV = 10%), for P (CV = 34%), for Ca (CV = 30%) and for Mg (CV = 26%). With due regard to their origin these values, and that for K in the group of 80, may be considered close to the maximum, for all practical purposes. The minimum number of vines to sample at a permissible error of 10% can be computed at a specific level of confidence by systematically introducing different values for n. The results at P = 0.05 are presented in table 9.
The data show that in practice, no more than 50 to 60 vines should be sampled to provide an estimate of the mean values of N, P, K, Ca and Mg in order to represent those of the plant population to within 10% at P = 0.05.
6.1.4.2. R educ t i on of e r r o r From a practical point of view, grouping into 6 categories (see section 6.1.2.2.) renders routine sampling more complicated and laborious with each further subdivision. Therefore, it would be of considerable interest to obtain some measure as to the actual efficiency of each individual classification or combination of several classes. Apart from the absence of mutual interference amongst classes (no interaction), fundamental to the method of computation is the fact that the measurement of the effect of individual categories is made after repeated subdivision has been carried out into the other 5 categories. Thus, the standard leaf population is the same, when the effect of each class is measured. Each category was replicated 10 times.
As a measure for sampling efficiency the ratio of
g2 + Q2rep •.>.
a 2 + ff2rep+ (a28tr)j
has been introduced for each of the 5 major elements. The appropriate
51

TABIE 8
The variability ofN, P, Ca and Mg of So apparently healthy vines within one type of soil
Elements
Nitrogen Phosphorus Potassium Calcium Magnesium
Number of vines (n)
80 80 80 80 80
Standard deviation
(«)
0.17 0.020 0.52 0.21 0.034
Standard error of
the mean
0.02 0.002 0.06 0.02 0.003
Coefficient of variation
5.5% 11.2% 39.9% 11.7% 11.8%
Error of bulk
sampling
0.6% 1.3% 4.5% 1.3% 1.3%
TABLE <
The influence of the number of vines, included in a bulk sample on the magnitude of the sample error at a probability level of 0.05
Number of vines
10 20 30 40 50 60 70 80 90
100 Coefficient of variation observed in 80 vines
Number of vines 10 20 30 40 50
Maximum coefficient of variation observed
Nitrogen Phospho 4.5 2.6 2.0 1.8 1.5 1.4 1.3 1.2 1.2 1.1
5.5%
7.2
5.0 4.1 3.6 3.2
9.9%
8.9 5.0 4.0 3.4 3.0 2.8 2.6 2.4 2.3 2.1
11.2%
24.6 17.2 14.1 12.2 10.9
34.2%
Sample error rus Potassium
33.1 18.7 14.7 12.7 11.2 10.3 9.6 8.7 8.4 8.0
39.9%
33.1 18.7 14.7 12.7 11.2
39.9%
(%) Calcium
9.7 5.5 4.3 3.7 3.3 3.0 2.8 2.6 2.4 2.3
11.7%
21.3 15.0 12.3 10.6 9.5
29.6%
Magnesium 9.7 5.6 4.3 3.7 3.3 3.0 2.8 2.6 2.4 2.3
11.8%
18.8 13.2 10.8 9.4 8.4
26.2%
I t ' o f va!iaS 4 " ^ 5 W b £ e n e m p l 0 y e d I n f ° r m u l a ®> representing the . . too of vanance,of a sampling, *> is t he error mean square! o ^ is t he mean square of replications (r = m) and (<* \ I sonars nf I-K„ «• r K }' \ a **)i represents t he mean
square of the effect of a s t ra tum which is omitted (i = , 6) Ap
propriate rearrangement of (i) yields: }' P
52
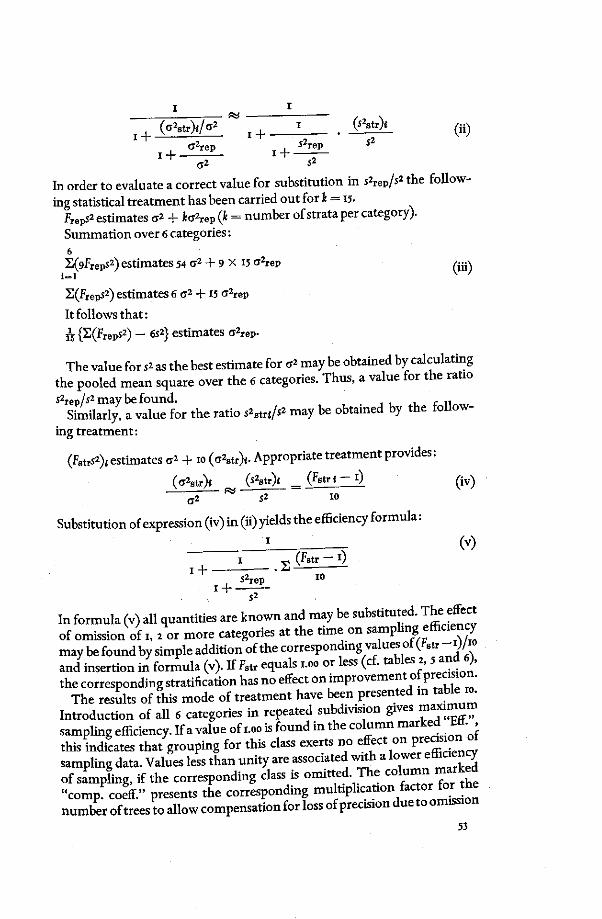
, (azstT)i/a2 ~ T , i . fr2^)* (ii)
i + — — i H —; ., v ' CT2rep , s rep *
a2 &
In order to evaluate a correct value for substitution in s^ep/*2 the following statistical treatment has been carried out for I = 15.
Preps2 estimates a2 + ka2rep (t = number of strata per category). Summation over 6 categories: 6
St reps 2 ) estimates 54 cr2 + 9 x 15 c2rep /^\
2(FrepS2) estimates 6 <r2 + 15 <r2rep
It follows that:
^ {S(FrepS2) - 6s2} estimates o2rep-
The value for s2 as the best estimate for a2 may be obtained by calculating the pooled mean square over the 6 categories. Thus, a value for the ratio s2repA2 may be found. , c „
Similarly, a value for the ratio 5 W * 2 m a 7 b e o b t a i n e d b y t h e f ° U ° W " ing treatment:
(Fstr52)4 estimates c2 + 10 («r2
str)i. Appropriate treatment provides:
02str)l 02str)f ( F s t r i - i ) ( iv) pa
a2 s2 I 0
Substitution of expression (iv) in (ii) yields the efficiency formula:
! (FBtr - 1) (v)
10
In formula (v) all quantities are known and may be substituted. The effect of omission of 1, 2 or more categories at the time on sampling efficiency may be found by simple addition of the corresponding values of (Fstr - i j / io and insertion in formula (v). If Fs t r equals LOO or less (cf. tables 2, 5 and 6), the corresponding stratification has no effect on improvement of precision.
The results of this mode of treatment have been presented m table10. Introduction of all 6 categories in repeated subdivision gives maximum sampling efficiency. If a value of 1.00 is found in the column marked _ fctt. , this indicates that grouping for this class exerts no effect on precisionor sampling data. Values less than unity are associated with a lower efficiency of sampling, if the corresponding class is omitted The column marked "compcoeff." presents the corresponding mu tiplication^factor f o h e number of trees to allow compensation for loss of precision due to omission
53

of classes. I tem 7 represents the extreme case when all classes are omitted and it is consequently associated with m i n imum efficiency of sampling.
From the data in table 10 it may be observed tha t in t h e case of P and Mg 4 ou t of 6 classes appear to have no effect on sampling efficiency; for Ca and N only 1 class has n o influence, whereas in t he case of K all classes exert a considerable effect. Sampling efficiency following omission of a particular class or combination of all classes varies considerably f rom e lement to e lement; it follows tha t for max imum efficiency all classes should be incorporated in the sampling procedure, if 5 major e lements are of interest. Th1S is demonstrated by omission of 6 classes for t he e lement K, when 5.5 times more trees should be sampled as compensat ion for loss of precision. tor N and Ca omission of 5 classes would require bu lk sampling of 4 and 6 times the number of trees tha t is necessary for completely effective classification. Compensation coefficients of 4.0 and 2.3 have been recorded tor the elements P and Mg, respectively, bu t in this case t he reduct ion of sampling efficiency is largely due to contributions of leaf age and exposure tor V, and to leaf age and leaf size for Mg. It is interesting to no t e t ha t only omission of classification for leafage already exerts a considerable effect on efficiency of sampling for all e lements. This agrees with results obtained in o ther crops. Those results imply tha t it is n o t so m u c h t he magni tude of
Elements
TABLE 10
The efficiency of stratification
Nitrogen Phosphorus Potassium Calcium Subdivision Eff.
omitted of Comp. sam- Coeff. pling
Eff. of Comp.
sam- Coeff. pling
1. Leafage 0.74 2. Leaf size 0.37 3. Daily variation 0.86 4. Veins 0.70 5. Leaf thickness 0.77 6. Insolation 1.00 7. All omitted 0.25
Eff. of Comp.
sam- Coeff. pling
1.3 2.6 1.2 1.4 1.3 1.0 4.0
0.27 1.00 0.98 1.00 1.00 0.71 0.25
3.7 1.0 1.0 1.0 1.0 1.4 4.0
0.95 0.70 0.40 0.95 0.25 0.41 0.18
Efficiency of sampling =
1.1 1.4 2.5 1.1 4.0 2.5 5.5
1 +
1_ firepl — 1
1 +
where tfgtr => F value for stratification « = number of replicaties
aJstr = mean square of replicates a2 = error variance
g 2repi
a*
Comp. "1 = Compensation coefficient for number of plants J by omission of m r m m ™ * ' •• *• Coeff.
54
*** u i UUU1UIX OI J by omission of corresponding subdivision.
Magnesium
Eff. of Comp.
sam- Coeff. pling
0.72 0.85 1.00 0.47 0.23 0.81 0.16
1.4 1.2 1.0 2.2 4.1 1.2 6.1
Eff. of Comp.
sam- Coeff. pling
0.47 0.90 0.95 1.00 1.00 1.00 0.43
2.2 1.1 1.1 1.0 1.0 1.0 2.3

the difference between strata that should be considered as the decisive criterium for pooling of classes (par. 6.1.2.), but the degree of significance
involved. 1 1 . . c As, according to prior data, obtained following complete subdivision ot
the leaf population, some 60 plants are required for bulk sampling to represent the results to within 10% of the population mean (P = 0.05), the data in table 10 show that without this complete repeated subdivision by employing 6 classes 5.5 x 50 = 275 plants should have been sampled to obtain the same degree of precision for K. It is self-evident that interest in a particular element only alters the number of vines to be sampled in accordance with the influence of the subdivision on the sampling precision for that element. Similarly, by appropriate application of formula (v), variations of sampling efficiency due to combination of 2 to 5 or more omitted classes may be computed. The data of table 6 imply that in traditional fertilizing (treatment 1) sampling of 1 stem has no effect on the number of sample trees. If methods are changed (treatments 2 to 5) sampling of a single stem entails reduced sampling intensity. As a rule this subdivision is impracticable under field conditions.
The data presented in this chapter so far, allow the following con-
elusions. a. Division into main and side branches, normal and small leaves, and
presence or absence of petioles resulted in significant differences between means of strata, but differences were 6% or less.
b. Classification for time of day, exposure to sunlight, leafage, leaf thickness, vein removal and presence of fruit appears to entail a significant effect for 1, 2 or 3 elements at the same time and on each occasion; concurrent differences between strata vary from 10% to 90%.
c. Despite sometimes small differences between means of strata the proposed grouping is essential in order to reduce the number of vines required for bulk sampling to a reasonable proportion of the vine population.
d. Calculations on data of categories presented show that, within an appropriately grouped population of leaves, bulk sampling of *-*rvmes Fs adequate to represent the nutrient concentrations in leaves to within io£ of the population in a pepper field.
6.2. SAMPLING TECHNIQUES . Precision of reproduction of chemical concentration in leaves ^ n > fact on the number of units included to represent the mean c « of specific homogeneous areas. The minimum number of leaves per t ee a sample should contain to make up a representative composite sample also of major importance. In paragraph 3 it was found that collecttonof leaves per vine and bulk sampling of 60 to 70 vines ^ ^ ^ adequate to represent homogeneous groups of apparently healthy vines.
55

However, inclusion of 1600 leaves in each sample would be impracticable and prohibitive for routine work. In order to obtain information on these aspects of the sampling technique both factors have been studied.
6.2.1. Adequate representation
Leaf-to-leaf variation, even within appropriately stratified and well-defined leaf groups, may occur to a greater or lesser extent. Thus, the practical demand to limit the number of leaves, sampled per vine in each bulk sample, may conflict with the need to collect representative samples of low variability.
Samples of 4,32 and 128 leaves have been collected from each of 10 homogeneous vines. The results are presented in table 5. The data show that there is no significant influence of the number of leaves collected from a single vine on the chemical concentration, if leaves are collected from the same stratified population on the canopy. As (Fstr — I)/IO = 0 for each of 5 elements, sampling efficiency is 1.00 for omission of this classification (formula v applies). Therefore, sampling of only 4 leaves has no effect on precision of data.
6.2.2. Sampling intensity in areas of different physiological condition The question arises as to the importance of variation in the physiological condition on the number of sample vines. To study this aspect more systematically 3 separate blocks of some 700 vines were selected, located within a single soil type. Areas were apparently homogeneous and included vines of the same age, but differed with respect to physiological condition. Block 1 included healthy and vigorous vines; block 2 contained vines of intermediate health, and the vines of block 3 were poor and irregular.
Blocks were subdivided in 35 units of 20 vines each; within each sub-unit a single vine was sampled at random. This system ensures that each part of
TABLE 11
The number of trees to sample within a homogeneous healthy, intermediate and poor garden
Healthy garden Intermediate garden Poor garden
" " K Ca Mg N P K Ca Mg N P K Ca Mg
stndard^111- ^ ^ ^ l * 1 " * ^ ^
S S S n t o f °-150-013( ,-0920-» 0.013 0,0 0.013 0.13 0.H 0.020 0.14 0.020 0.02 0.28 0.030
pVearS,e " ^ * * * « * « U* 7.3, 9,% 7MJ^ ^ lu% ^ ^ m% s a m P l e 10 vines . error 10% 10 vines 20 vines (P = 0.05)
56

the total area has got an equal chance to be represented in the bulk sample. The results are presented in table n. As expected, error in the chemical
concentrations due to vine-to-vine variation varies with physiological condition of the area. With increasingly poor appearance the coefficient of variation rises apparently for all elements except for N. Moreover, in healthy areas this coefficient for the 5 elements ranges from 5-7.5%, whereas in the intermediate and poor areas this is 3.5-12% and 5-20% respectively.
A desired accuracy of some 10% at a confidence level of 0.05 demands sampling of 20 vines within the poorer areas, as compared with 10 in intermediate and healthy vines. For this calculation, standard deviations have been used of those elements which are associated with the largest coefficient of variation (underlined). Their values appear not to exceed the maxima observed for other random vine areas (c.f. table 9).
The data presented in this section give rise to the following conclusions.
a. Collection of 4 leaves per vine represents each contributing vine in a bulk sample sufficiently.
b. The sampling of uniform groups of vines in poor physiological condition may entail doubling of the number of vines to be included in a bulk sample, however, these data give no rise to reconsideration of the previous estimate of 60-70 plants.
c Sampling areas should at least be homogeneous with respect to soil type and appearance.
6.3. SEASONAL VARIATION
Variation of rainfall and soil temperature as well as characteristics such as soil compaction and water-holding capacity are interrelated with chemical, microbiological, transportation processes and loss of nutrients in the soil environment. This affects the availability of nutrients and consequently their uptake by the roots. Similarly, air temperature, humidity and light intensity influence metabolic processes and ionic uptake. Hence, the effect of meteorological factors and soil properties can be expected to be reflected in the chemical composition of the leaf. Closely interacting with this effect is the changing demand for nutrients due to the physiological phases of the plant with the season. Information on each separate effect is difficult to obtain, but the integrated effect of all influences may be estimated. Understanding of this net seasonal variation is essential for the choice of sampling time and for a correct interpretation.
To study this complex of variables, groups of 10 uniform healthy vines were selected in January. Sampling of individual vines followed at monthly intervals over 7 consecutive months. This period coincided with the important time from full flowering to the end of the harvest, when severe plant deterioration usually occurs.
Each vine was sampled within 3 days of the beginning of the month; this was carried out for the first time 30 days after the last application of fertili-
57

zer. Subsequent yields were fairly abundant. The results of chemical analyses are presented in table n and in fig. 2.
From January onwards there appears to be a regular and gradually diminishing N content until May or June, followed by a slight rise from June to July. The regression calculated on means of 10 vines is highly significant.
^ 0.4
I 03
\ <"
e 1.8
I '•' 0 1.6 o i£l.5
1.4
2.1
e 2.0
I 1 9
* 1.8
* , . 7
16
~ 04
5 0.3 ^ 0 . 2 a.
2.9
2.8
E 27
g» z 25 (£
2*
23
22
2.1
2.0
n
.—-
— • 0
>
-.—.
LINEAR REGRESSION CUBIC REGRESSION
O
LINEAR REGRESSION
O
-C^vp
.• LINEAR REGRESSION : CUBIC REGRESSION
** #*
0
° —" """ '
X *
* *
1 LINEAR REGRESSION * *
# * *
.• LINEAR REGRESSION # * •• QUADRATIC REGRESSION *
: SIGNIFICANT AT P = 0 0 5 < SIGNIFICANT AT Ps 0.01
month
Figure 2 The relationship of N, P, K, Ca and Mg with time (means of each month)
58

Over t he period from January to May the N concentration falls by 17%, whereas in the m o n t h of May t he content remains approximately constant, followed by a small rise f rom June to July. The amoun t of leaf N did
not fall below 2.4%. - C U P The mean results for P suggest a gradual and significant rise ot t he F
content from January to July. Subsequent computations showed a mear increase to be present. The table shows a rise of 91% from January to July.
The K concentrat ion significantly decreases with t ime after an initial rise in January. Of interest appears to be the max imum reached in February followed by a sharp fall t o a m i n imum in June. Over this period of only 4 mon ths t he K content decreases by some io%, bu t t he m in imum value does no t d rop below 1.70%. . ,
Similarly to P, t he Ca concentration increases proportionally with tune .
This rise is significant, and over the entire period of 7 mon ths t he Ca
content increases by some 20% from 1.5% to 1.8%. _
The magnesium content falls by 9% f rom 0.33% in January to 0.30% in
July. As for K, apparently there is a max imum value in February and a
m i n imum in June Over this period the Mg concentration drops by some
19%, which is of similar order as for K.
Variability of monthly sampling The data in table 12 indicate tha t t he relative vine-to-vine variation tends to
increase with t ime. For N, K, and Ca the coefficient of variation m e r g e s
twofold, whereas t ha t for P and Mg rises by some 50-60%. Thisi e fect is
particularly p ronounced from April to July in the case of N, P and K.
However, oVno occasion t he value of t he coefficient of variation exceeds a
value of zo%, t hus remaining within the max imum value presented m
table 9.
TABLE 12
Results of month-to-month analysis of leaves of individually sampled vines (means of 10 vines')
Nitrogen Phosphorus Potassium
Mean Mean Mean
Month: % S.D. C.V. dr.m. %
% S.D. C.V. % S.D. C.V. dr.m. % dr.m. %
January February March April May June July
2.90 2.67 2.60 2.51 2.40 2.40 2.49
0.10 0.05 0.08 0.09 0.07 0.11 0.14
3.5 1.9 3.1 3.6 2.9 4.6 5.6
0.18 0.22 0.22 0.31 0.32 0.28 0.30
0.018 0.020 0.023 0.056 0.050 0.054 0.048
10.0 9.1
10.5 18.1 15.6 19.3 16.0
2.03 1.99 2.12 1.97 1.81 1.70 1.74
0.11 0.10 0.09 0.13 0.22 0.16 0.22
S.D. = Standard deviation C.V. = Coefficient of variation
5.4 5.0 4.2 6.6
12.2 9.4
12.6
Calcium
Mean
% S.D. dr.m.
C.V.
1.42 1.52 1.59 1.75 1.75 1.70 1.86
0.08 0.16 0.18 0.20 0.28 0.22 0.24
5.6 10.5 11.3 11.4 16.0 12.9 12.9
Magnesium
Mean
S.D. C.V. dr.m.
0.33 0.37 0.34 0.35 0.30 0.30 0.31
0.035 0.038 0.041 0.046 0.032 0.046 0.035
10.6 10.3 12.1 13.1 10.7 15.3 11.3
59
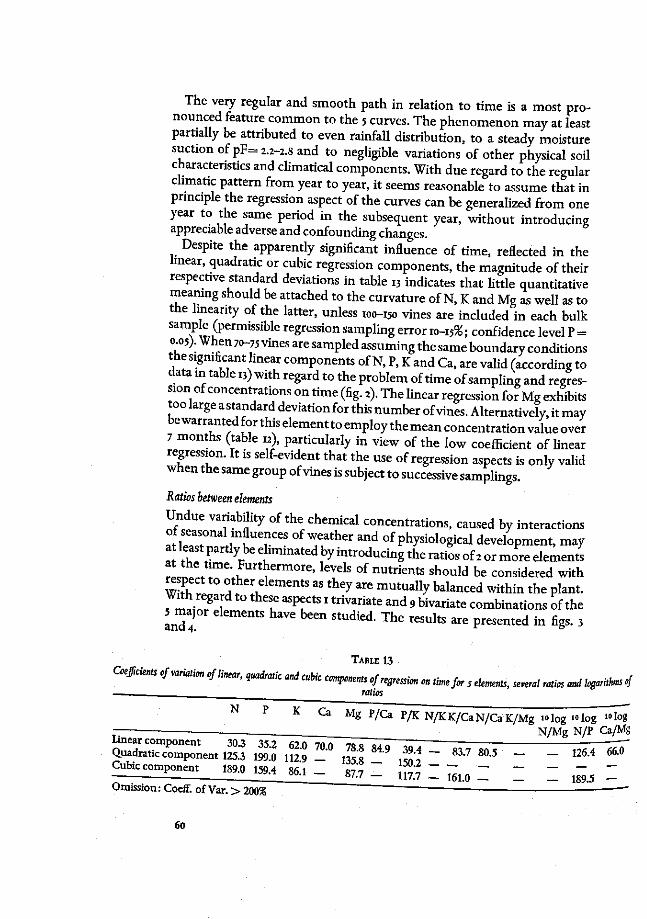
The very regular and smooth path in relation to time is a most pronounced feature common to the 5 curves. The phenomenon may at least partially be attributed to even rainfall distribution, to a steady moisture suction of pF= 2.2-2.8 and to negligible variations of other physical soil characteristics and climatical components. With due regard to the regular climatic pattern from year to year, it seems reasonable to assume that in principle the regression aspect of the curves can be generalized from one year to the same period in the subsequent year, without introducing appreciable adverse and confounding changes.
Despite the apparently significant influence of time, reflected in the linear, quadratic or cubic regression components, the magnitude of their respective standard deviations in table 13 indicates that little quantitative meaning should be attached to the curvature of N, K and Mg as well as to the linearity of the latter, unless 100-150 vines are included in each bulk sample (permissible regression sampling error 10-15%; confidence level P = 0.05). When 70-75 vines are sampled assuming the same boundary conditions the significant linear components of N, P, K and Ca, are valid (according to data in table IJ) with regard to the problem of time of sampling and regression of concentrations on time (fig. 2). The linear regression for Mg exhibits too large astandard deviation for this number of vines. Alternatively, it may bewarrantedforthiselementtoemploythemeanconcentrationvalueover 7 months (table 12), particularly in view of the low coefficient of linear regression. It is self-evident that the use of regression aspects is only valid when the same group of vines is subject to successive samplings.
Ratios between elements
Undue variability of the chemical concentrations, caused by interactions of seasonal influences of weather and of physiological development, may a least partly be eliminated by introducing the ratios of 2 or more elements
r i n ^ T e ; , f U r t ^ ^ m 0 r e , k V e l S ° f n U t r i e n t s s h o u l d b e considered with respect to other elements as they are mutually balanced within the plant.
7 ™ , ^ T a S p T S X t r i V a r k t e a n d 9 b i v a r i a t e combinations of the 5 major elements have been studied. The results are presented in figs. 3
TABLE 13
Coefficients of variation of linear, auadratic and cubic components of regression on time for s elements, several ratios and logarithm of
ratios
N * K Ca Mg P/Ca P/K N /KK/CaN/CaK/Mg >»log >°log >°log
• — — — — — _ _ _ _ _ _ _ N / M 8 N / P C a / M g
Cubic . . „ p o n . n , m . 0 [ 3 9 < „ , , _ ^ _ ™ 2 - _ ^ _ _ _ _^_ _
Omission: Coeff. ofVar.>2005g " " "
60

The data show that the ratios P/Ca, P/K and the value of "log Ca/Mg rise with time, whereas those of N/Ca and K/Ca decrease over the same period. P/Ca and P/K increase by 29% and 94X respectively from January to July; log Ca/Mg rises by 22%. The values of K/Ca and N/Ca fall by 28% and 26% respectively. Only these relationships are linear and significant.
The path of the ratio P/Mg with time may be divided into 3 distinct sections. A part at a constant value of 0.60 approximately from January to early March. A second part from March to early May with a steeply increasing ratio value. There is a third part from early May to early July at a constant value of 0.95, some 40% higher than the value of the stable section earlier in the season.
The value of lolog N/Mg remains constant at 0.87 from February to July; there is a slight fall from January to February. The graph of lolog
6.5 O)
^ 6.0
5.5
1,5
0.5
O
Z 1.5
O X 1.0
0.5
020
.0.15
o a.
0.10
LINEAR REGRESSION * *
LINEAR REGRESSION * 51-
month
Figure 3 The relationship of bivariate nutrient ratios with time
61

N/P with time may be subdivided into 3 separate sections: the first portion, covering the period from January to early March, shows a slight, almost negligeable fall from 1.15 to 1.06, whereas the third portion from early April to July shows an almost constant value of 0.93- There is a relatively abrupt fall of some \i% in the ratio value during the month of March.
The ratio K/Mg, when calculated on observed values shows an appreciable variability around a value of 6 from January onwards; this variability gradually diminishes and from April to July a ratio value of approximately 6 is maintained.
A trivariate ratio was calculated for monovalent K and the divalents Ca + Mg. The sum of concentrations of these 3 ions can be considered to remain fairly constant between 3.69 and 4.07, throughout the period of observation. When values of this ratio are plotted against time, the curve in fig. 4 is obtained.
According to the data in table 13 only the regressions of P/K and 10log Ca/Mg have quantitative meaning as they are highly significant, while simultaneously the bulk sampling error for 70-75 vines appears sufficiently low to fall within the previously stipulated boundary conditions (a precision of 10-15% for the regression components; confidence level P = 0.05).
When considering the ratio values from month to month it appears that N/K, K/Mg and "log N/Mg each may conform to a constant value, since neither linear nor quadratic nor cubic regression components attain signifi-
2 , a o
1.2
1.1
1.0
0.9
0.8
1.25
JJ1JO 0
•S;0.75
z g0.5 0
"125
al.OO U
O075 o 2 0.50
0:25
O LOG N / P • LOG N / M g
LINEAR REGRESSION # X
j month A
Figure 4 The relationship of a trivariate ratio, and of several logarithmic values for bivariate
ratios with time
6a

cance. The"average standard deviation" of these ratios taken over 7 months expressed as a percentage of the "overall mean" varies from 34-36% and is of the same order as that found in earlier samplings. Thus, apparently, each of the 3 ratios maintains its own specific value, irrespective of time of sampling, if bulk samples are obtained consistently from the same defined group of some 70 vines between January and July. The regression of iolog N/P and P/Mg behaves slightly differently in that the periods from January to March, and April respectively May to July each maintain constant values. Major aspects of month-to-month variation have been summarized in table 14.
The preceding data allow the following conclusions:
TABLE 14
Summary of the major aspects of the month-to-month variation of the concentrations of leaf N , P , K, Ca and Mg, of several ratios and of logarithms of ratios
Element/ ratio
Nitrogen Phosphorus Potassium Calcium Magnesium P/K i» log Ca/Mg P/Mg
10 log N/P
N/K
K/Mg
10 log N/Mg
Regression
linear** linear** linear** linear** linear* linear** linear** constant at 0.60
constant at 0.95
constant at 1.11
constant at 0.92
constant at 1.33
constant at 5.8
constant at 0.88
Period of sampling
January-July January-July January-July January-July January-July January-July January-July January-March
May-July
January-March
April-July
January-July
January-July
January-July
Standard deviation as a % of the coefficient regression
30.0% 35.2% 62.0% 70.0% 78.8% 39.4% 66.0% 40.8%
20.9%
15.6%
9.7%
33.9%
35.0%
33.9%
Maximum coefficient of variation observed in anyone month. Maximum coefficient of variation observed in anyone month. Maximum coefficient of variation observed in anyone month. Maximum coefficient of variation observed in anyone month. Mean coefficient of variation over 7 months. Mean coefficient of variation over 7 months. Mean coefficient of variation over 7 months.
** = Significant at P = 0.05 * = Significant at P = 0.01
63

a. Bulk sampling of some 70 vines allows a precision of 10-15% to be obtained with respect to both the population mean value and regression aspects of selected elements and ratios.
b. The high significance (P = 0.01) of the linear regression of N, P, K, Ca and of P/K and "log Ca/Mg, in combination with the appropriate levels for Mg, P/Mg, N/K, K/Mg, "log N/P and "log N/Mg should facilitate the interpretation of foliar diagnosis; relating performance data to regression aspects of the above-mentioned relationships, allows a multiple and semi-quantitative control of the chemical concentrations of major elements from January to July.
c. Regular and frequent sampling for timely adjustment of leaf concentrations and ratios seems essential.
6.4. PROPOSED SAMPLING PROCEDURE
With regard to the findings in this chapter the following basic procedure may now be laid down.
6.4.1. Apparently homogeneous blocks are selected with respect to environment and physiological condition of vines.
6.4.2. Each sample area is subdivided into compact sub-blocks, equivalent to 70 sample vines in order to ensure even contribution of each portion of the area.
6.4.3. Within each sub-block the sample unit is selected at random.
6.4.4. Vines are first sampled in January and subsequently as frequently as necessary.
6.4.5. From each plant 4 leaves are collected from a sampling population meeting the following standards:
6.4.5.1. The 1st older mature leaf from fruit bearing sidebranches, exposed to sunlight and located on the lower 2/3 of the canopy.
6.4.5.2. Leaves should be of average size and thickness and should retain their petiole.
6.4.5.3. Leaves should be collected equally frequently from the north, east, south and west quarter aspects of the vine.
6.4.5.4. Sampling should be carried out between 7 a.m. and noon.
6.4.6. Leaves are mixed to form a single composite sample.
64

6.4.7. Preparation for analysis follows within 12 hours from sampling according to the following procedure:
6.4.8. Wiping of the raw leaves with moist cotton wool, dipped in 0.2% Teepol solution.
6.4.9. Wiping with a clean cloth moistened in destilled water.
6.4.10. Dabbing with a clean dry towel.
6.4.11. Loose packing in muslin cloth.
6.4.12. Drying at 7o°C ± 1° for 48 hours in a force-draught oven.
6.4.13. Upon completion of drying the leaf material is hand-crushed inside the muslin, packed in polyethylene bags and stored in a dark, dry and cool place awaiting chemical analysis.
6.4.14. Prior to analysis the crushed leaves are dried appr. at 7o°C and ground in a Wiley-mill to a fineness of 40 mesh.
7. NUTRITIONAL DEFICIENCIES AND FOLIAR DIAGNOSIS
The general appearance of the vines becomes usually very poor towards the end of the harvest. Since the phenomenon considerably and tunda-mentally influences productivity in subsequent seasons, the study_ ot the internal and external aspects of deficiency concentrations in the foliage as affected by nutritional variation constitutes the essential part ot this chapter.
7.1. PRELIMINARY CONSIDERATIONS The presence of excessive and well distributed rainfall, and the coinciding poverty of soil environment, prevailing in Sarawak, entail a mode « supply of applied nutrients, unlikely to warrant the application ot the classical concept of "critical level" associated with maximum crop yield (SMITH). Preliminary observations strongly suggested that attention mu be directed towards the problem of maintaining or raising nutrient levels within the "zone of accumulation" of the Steenbjerg curve. ,
The ensuing need for appropriate chemical concentrations «.standard, of reference associated v4th a healthy vegetative condition within the
65

critical period of physiological development involves the examination of the following aspects:
i. Information on deficiency symptoms. 2. Concentrations of nutrients associated with actual and incipient defi
ciencies. 3. The establishment of suitable levels of nutrients and/or ratios between
the major elements, associated with a healthy and vigorous vegetative appearance.
4. The influence of applications of nutrients on the chemical concentrations in the leaves.
To obtain information on these aspects several studies have been conducted, which are presented in the following paragraphs.
7.2. POT EXPERIMENT
Specific patterns of disorders associated with the deficiency of one or more elements usually develop when nutrient levels drop below certain threshold concentrations in the leaves. Severe growth retardation and cropping disorders, frequently observed under these conditions, stress the point that visual symptoms must be prevented rather than cured.
No information concerning nutritional deficiencies in pepper could be traced and a separate investigation in this respect was initiated. Data have been collected by two different approaches:
a. A pot experiment using sand as a medium was carried out under controlled green house conditions to study the symptoms associated with the five major elements.
b. The symptoms and the concurrent nutrient levels of the sand experiment have been compared with those of leaves collected from commercial vines, showing apparently corresponding symptoms.
7.2.1. Details of the experiment
Techniques
Cleaned polyethylene bags of appropriate strength were perforated at the bottom. These perforations were covered with a layer of lead-free glass-wool, prior to filling with acid-washed, coarse quartz-sand. The filled bags were subsequently transferred to porous earthenware pots with a diameter ot 18 cm at the top, tapering to 7.5 at the bottom. The pot was provided with a drainage hole. Prior to planting the sand was leached with destilled water until the pH remained stable at a value of 5.3.
After leaching, selected prerooted, single-node cuttings, of clonal origins, of equal age and stage of development, and obtained from a selected specimen off. nigrum cv Kuching, were planted in the sand. Each cutting possessed a mass of healthy roots approximately x c m in length and a well-
w l 7 i w , T l ^ ? ^ aX i l ° f t h e S i n § l e S r e e n l e a f- One cutting was planted per bag and the pot/bag combinations were placed in an en-
66

vironment with a constant relative humidity of 95% until the adventitious bud had resumed growth.
When the buds had reached a length of 1.5 cm the plants were hardened-off and subsequently transferred to a concrete bench inside a well-ventilated green house. Sunlight was allowed to enter at 50% of its natural intensity. Air-temperature and humidity were non-limiting. The pots were placed on the bench at a spacing of 50 cm square, allowing adequate space for unrestricted development of the plants for the duration of the experiment. The surface of the sand was covered with finely perforated black-coloured polyethylene discs to prevent the growth of algae and to reduce excessive evaporation. This mode of control appeared effective. The large number of tiny holes permitted adequate ventilation.
Throughout the preparative phase the plants were watered with destilled water to prevent undesirable contamination. Care was exercised throughout the experiment that the surface did not dry out, to ensure a non-limiting moisture regime. One terminal shoot per pot was allowed to grow up and was regularly tied to an uncontaminated string, which served as support.
Treatments
The following treatments were included in the experiment: Plants were watered every other day with 0.51 of a nutrient solution.
a. Complete nutrient solution
b. Complete nutrient solution minus nitrogen.
c. Complete nutrient solution minus phosphorus.
d. Complete nutrient solution minus potassium.
e. Complete nutrient solution minus calcium.
f. Complete nutrient solution minus magnesium.
A single set of the treatments tabulated above was accommodated in a randomized block; there was one plant per treatment within a block and 6 replicates in all.
The solutions
A preliminary test had shown that the original Hewitt solution somewhat retarded the growth of pepper cuttings. After minor modifications and
67

adjustments a solution of the following composition gave satisfactory results.
Elements Meq./i mg pure element/1. N°3 12 168.00 P04 3 31.00 S04 6 96.00 ^ * i ^ J .Lj.lJ60.00 ^ g 3-5 ifcj^iid _-.t v/ ^-eo J . . , , 2 " ^ w. H ^ ^ 78.00 Fe (tnvalent) 1.3 y ^ . 3 , 24.21 Mn (bivalent) ^ I ^ L ^ i l a J . T 7 j 0.55 SU ™°2 l ^ l i . ^ Li 0.06
* 2PPm Autil±*^^„ 2-00
M o 0.03 ppm 0.03
In each treatment where a cation was omitted, Na was introduced as a substitute; in the case of the anions S04 was used as the replacing ion. The following analytical pure chemicals were used to prepare the solutions: CaN03; KN03; NaH2P04.2H20; MgS04.7H20; MgCl2; NaN03; K2S04; Na2S04.ioH20; CaS04; FeC6H507; MnS04 .4H20; CuS04 .5H20; ZnS04.7H20; H3BO3; and (NH4)2Mo04.
Every other day fresh nutrient solutions were prepared by diluting aliquots of appropriate stock solutions to the desired concentration. The pH of these final solutions was adjusted to 5.0 by addition of concentrated NaOH or HC1. After growth had resumed, treatments were initiated.
Stages of 'the experiments
Diagnosis of incipient levels of nutrient deficiency is considered desirable. To study this aspect, the pot trial consisted of 2 major stages coupled by a transitional stage as follows:
Stage 1:
The pots are watered with a solution containing 25% of the relevant deficient nutrient. Six months after treatments were initiated, a sufficient number of leaves of suitable age and position was present. Ten appropriate leaves were sampled per plant to form a single sample. The leaves which remained on the plant were marked.
Stage 2:
A gradual transition from stage 1 to the actual full deficiency treatments was introduced. This intermediate stage at 10% of the full level was applied tor 1 week only. No leaves were collected within this time.
Stage 3:
e S S ^ S U 7 i n g S t a g £ 2 C ° m P l e t e d e f i c i e n c y conditions were estabhshedforthedurationoftheexperiment. Clear patterns of symptoms
68

readily appeared on both the marked leaves and on those developing anew. The plants developed an adequate number of leaves to allow collection
of sufficient leaf material at random from each plant. No fruit was allowed to develop during the period of experimentation.
The characteristic patterns from each visual nutrient deficiency were photographed in colour. Subsequently appropriate leaf samples were collected for analyses whenever a representative number of suitable leaves was present.
7.2.2. Symptoms of deficiency inpepper leaves (Plate 1) Nitrogen deficiency
No approaching of nitrogen shortage was observed in the first stage. The leaves exhibited the uniform, healthy green colour of leaves on full nutrient treatments. There was no visual evidence to indicate the presence of nitrogen deficiency.
Approximately three weeks after the beginning of the third stage a clear uniform yellowing of the leaves developed varying via an initial light green to yellow, deep yellow or orange yellow. There was not much difference in age nor in position of the leaves with respect to colour intensity. In more advanced stages the extreme end of the leaf tip became black and necrotic; occasionally abscission of a leaf took place. Concurrent with the development of the symptoms, growth retardation and reduction in leaf size were observed. Persisting deficiency leads to a condition when the entire plant is bare except for tufts of immature leaves on the extreme ends of the branches.
Phosphorus deficiency
In the first stage no marked symptoms could be distinguished. Mature leaves displayed a healthy, although slightly unusual shade of dark green, but the average tinge was not obviously different from healthy leaves on plants receiving full nutrient solution.
Four weeks after the beginning of the third stage mature leaves exhibited a very dark bluish-green to purple discolouration on the upper surface. There was a striking contrast with immature leaves in the upper portion of the plants and on the lateral branches. These leaves were comparatively pale. Growth was retarded. This pattern appears consistent with that found in other crops.
Potassium deficiency
Indications pointing to insufficiency were not observed in the first stage. Growth was vigorous; the leaves displayed a healthy green colour.
Similarly, visual evidence of potassium deficiency was not observed after treating the plants with a solution deficient in this element. In another pot trial typical symptoms appeared to be a black necrosis beginning at the extreme distal end of the, otherwise healthy, green mature leaf blade. This
69

necrosis progresses initially along the leaf margins. In the advanced stages the mesophyll in between the affected marginal areas turns progressively more necrotic until approximately 1/3 to 1/4 of the distal portion of the leaf blade becomes dead and brittle exhibiting a coal-black colour. The proximal portion remains healthy and dark green in colour. Leaves show no tendency for immediate abscission.
Calcium deficiency
In the first stage the leaves tend to a lighter shade of green than those receiving full nutrients. Typical symptoms on the upper surface of mature and immature leaves appeared to be initially a multitude of tiny, brown necrotic spots, each spot surrounded by a yellow halo.
In the third stage the appearance becomes of a general light yellow with chlorotic areas. These chlorotic areas tend towards the distal end of the leaf, usually involving at least half of the leaf surface. Frequently the chlorosis starts from the leaf edges. In more advanced stages acute black necrotic strips develop on the leaf margins, particularly of the distal half or occasionally at the tip. These marginal necrotic areas did not expand towards the centre of the leaf blade. The proximal portion exhibited a pale green colour with occasional scattered necrotic pin-head spotting. The undersurface of the leaf displayed brown necrotic spots between the main veins. The petioles of the affected leaves snapped at a gentle touch. Finally only the immature leaves remain attached to the plant. Retarded development accompanied the presence of these symptoms.
Magnesium deficiency
Both in stage 1 and 3 oval-shaped interveinal yellow discolourations were observed, particularly in the older leaves.
These ovals expanded towards the leaf margin. After reaching the edge the yellowing areas eventually coalesced around the extreme ends of the 5 major veins. Narrow bands of green tissue alongside the veinal bundles contrast sharply against the yellow areas. These bands taper gradually towards a sharp junction at the extreme end of the veins. The width of the green stripes varies with the degree of deficiency. The major veins remain green, while the higher order veins turn yellow. The green tissue coalesces at the proximal end near the place where the major veins join to form the midrib. With increasing severity of the disorder the chlorosis expands gradually to the petiole, but before this final stage is reached abscission of the leaf has usually taken place. Typical for this deficiency is that the branches of affected plants are almost bare in extreme cases, with only a small number of immature leaves showing symptoms, present at the tip of the branch.
Full nutrient solutions
The plants which received full nutrient treatment throughout the 3 stages
70

exhibited a vigorous growth and healthy development throughout. Leaves retained a green colour. No symptoms of imminent deficiency could be observed.
7.3. DEFICIENCY SYMPTOMS UNDER FIELD CONDITIONS
Nitrogen deficiency Mature and immature leaves on the canopy show a characteristic, uniform yellow to orange-yellow discolouration. This pattern shows a close similarity to that observed in the leaves of potplants, receiving a solution deficient in nitrogen. In severe cases a dark yellow to orange colour developed. The patterns usually appear during the monsoon and become progressively more severe with the advancing season.
Phosphorus deficiency
No patterns of symptoms associated with this element have been observed under field conditions.
Potassium deficiency
The distal end of affected mature leaf blades was necrotic, brittle and light gray in colour. The proximal portion beyond the slightly concave curving boundary, separating necrotic and live tissue, displayed a uniform light-green to yellow colour. This pattern deviates from that in the pot experiment, where potassium was the sole limiting factor. The symptoms have also been observed in plots showing N chlorosis and which received low K dressings. The grey aspect may be attributed to the light green colour of the leaves prior to the development of symptoms of K deficiency.
Calcium deficiency
Necrotic patterns and marginal scorch, found to be associated with calcium deficiency, have occasionally been observed in commercial gardens.
Magnesium deficiency
In the course of the flowering only mild symptoms may occasionally develop on the older leaves, particularly towards the end of this period. Thereafter, symptoms identical to those found in the pot experiment develop on the leaves. Severe and mildly affected leaves may be observed on a single branch.
Acute stages of severe deficiency are recognized by abrupt leaf abscission in the latter stages of fruit development. Winds rapidly defoliate the vines. The blades of the leaves exhibit clear-cut symptoms of magnesium deficiency. Usually a fluff of 3 or 4 leaves is retained on the extreme end of the branch. The fruit spikes remain attached to the vines.
Possible multiple deficiency
A frequently recurring pattern of discolouration did not conform to any of the hitherto observed symptoms or to the reference patterns of nutritional
71

disorders. The distal portion to half-way the blade showed a fairly uniform yellow colour; the proximal end retained a light shade of green. An abrupt transition between these two areas was marked by a curved, concave line with its hollow side facing the petiole. With time the greener portion retreated centripetally.
7.4. CHEMICAL CONCENTRATIONS IN THE LEAVES
Complete deficiency
Recognition of visual symptoms of deficiencies allows a rough appraisal of the initial status of the crop nutrient supply. Corresponding chemical concentrations provide confirmatory evidence and permit evaluation of lower limits as reference values.
Partial deficiency
The chemical concentrations in the leaves of plants in the first stage of the pot experiments would reflect the influence of a partial deficiency on leaf composition, without the presence of accompanying symptoms. Data are likely to represent nutrient levels, corresponding with the stage of transition from non-visual to visual symptoms (par. 7.2.). This largely coincides with the lower portion of the zone of incipient nutrient deficiencies (hidden hunger) of the Steenbjerg curve (BESSIS). Hence, the values essentially subdivide the "zone of accumulation" into portions associated with presence and absence of external symptoms.
TABLE 15: The effect of intermediate and comply
Treatments Full Nitrogen omitted Phosphorus omitted Potassium omitted Calcium omitted Magnesium omitted Standard deviation Least significant difference P = 0.05 Least significant difference P = 0.01 Coefficient of Variation
Nitrogen
ID
% dr. m. ±
3.41 2.99** —12.3% 3.44 3.55 3.53 3.52
0.21
0.25
0.33 6.2%
CD
% dr. m. ±
3.10 2.32** —25.2% 3.35 3.14 3.31 3.34
0.27
0.33
0.45 8.8%
]
% dr. m.
0.18 0.22** 0.11** 0.18 0.18 0.17
0.023
0.027
0.036 13.0%
Phosphorus
[D
±
+22.2% —38.8%
CD
% dr. m. ±
0.16 0.23** +43-92
0,09** —43.1$ 0.17 0.17 0.18
0.025
0.031
0.042 15.0%
k = Significant at P = 0.05 with respect to "full nutrients" "* = Significant at P = 0.01
ID = intermediate level of deficiency CD = Complete deficiency
72

Complete nutrition
Chemical concentrations associated with this particular stage would provide an estimate of the nutrient levels for unretarded development of plants.
Sampling details
From each of the individual pot plants in the 6 replicates standardized leaf samples have been collected in stage i and 3. Each of these samples was analyzed for the appropriate elements. The results were subjected to analyses of variance and are presented in table 15.
Similarly, individual samples have been collected containing standardized leaves from 9 or 10 vines in the field which displayed symptoms of N, K, Ca, Mg and 3 unidentified deficiencies. Appropriate samples of comparable healthy vines were obtained at the same time. These data are presented in table 19.
7.4.1. Treatment effects
On a full nutrient regime the chemical concentrations of N, P, Ca and Mg are closely similar in both stages; the K content, particularly of the full treatment and of the N treatment in stage 3, appears somewhat below that observed in the first stage.
Omission of N is associated with a decrease in the leaf concentration of
deficiency of one element on the foliar composition
% dr. m
4.31 4.68 4.06 2.62" 4.16 4.50
0.55
0.66
0.89 13.6%
[D
Potassium
±
' —39.2%
CD
% dr. m.
3.38 3.65 3.52 1.99** 3.46 3.98
0.64
0.76
1.03 19.3%
±
—41.1%
Calcium
ID
% dr. m .
1.68 1.56 1.66 2.29** 1.12** 1.97**
0.16
0.19
0.25 9.3%
±
+36.3% —33.3% + 17.2%
CD
% dr. m .
1.66 1.37 1.66 1.87 0.86** 2.22**
0.25
0.31
0.42 15.7%
±
—48.2% +31.7%
Magnesium
ID
% dr. m .
0.44 0.33* 0.42 0.56** 0.69** 0.14**
0.068
0.080
0.108 15.8%
±
+27.2% +56.8% —68.2%
CD
% dr. m. ±
0.45 0.38 0.47 0.63** +40.0% 0.73** +62.2% 0.18**—60.0%
0.070
0.082
0.112 14.8%
73

this element by some n% in stage i and by 25% in stage 3 as compared with full treatment. This fall is significant at P = 0.01 on both occasions. Concurrently, the concentration of P appears to rise by 22% and 44% in the respective phases. The contrast suggests some antagonistic mechanism for these 2 elements as found in other crops (BESSIS). Neither the K nor the Ca concentration reflects any significant influence in the absence of N. A possible exception may be made for Mg in stage 1. When P is omitted, this is reflected by a significant reduction of the P content in the leaf only, amounting to 39% and 43% in stage 1 and 3, respectively.
Absence of the bases K, Ca or Mg in the solution is associated with a highly significant depression of the concentration of the respective elements. A fall in leaf K of some 40% in stages 1 and 3 concurs with a rise of the concentration of Ca by 36%, and of Mg by 27% and 4o%, respectively. Deficiency of Ca depresses the leaf concentration of this element by 33% in stage 1 and by 48% in stage 3. This considerable reduction is compensated for by a rise of some 60% for leaf Mg only. The reverse is observed when Mg is omitted from the solution. A depression of leaf Mg by some 60-68% is accompanied by a rise in leaf Ca of some 17-33%. The observed antagonistic mechanism of Ca and Mg m the leaves does not influence the concentration of N, P or K as compared with complete nutrient solutions. There appears to be a Ca-Mg antagonism" present at high leaf K.
When considering bivariate and trivariate ratios (table 16), the data suggest that those associated with specific deficiencies tend to deviate appreciably from ratios related to full nutrient solutions. Of general interest appears to be the fact that the bivariate ratios of elements in leaves of plants receiving full nutrients and those of solutions deficient in a base element not represented in a ratio, are usually maintained at approximately the same value. An exception appears to be the K/Mg ratio, which falls by 33%, if the plant receives - C a treatment. This may be attributed to antagonistic effects. The values of ratios of 2 or 3 elements, of which 1 is deficient in the nutrient solution show that a reduction of 40% or more
„ A )l °l " n S C ° f I 0 ° % ° r m ° r e ( « " « " " 0 may be expected, as compared with the same ratio in plants receiving full nutrients, irrespective of
S J J P k n t S r e C d V e d a ~ N ° r ~ P s o l u t i o n > 0 % the value of ^gN/Pissub)ecttoappreciablevariation.Itsvaluefallsbyonlyio-2o%when
c o r n e r ^ F V l f c V i S e S b y S ° m e 20% w i t h P ***** ^ "olution, compared with that of full treatment.
P an/f r i 5 and 6 th£ rektive con t r ibution of K, Ca and Mg, and of N, d W , T V I reSpeCtiVfSUm t O U l s i n l e a v e s a r e P r e s e n * d in a triangular s I Z T f r C T m f ^ d t 0 N ' P a n d K s h o w s t h a t t h e Native compor t I f J f V S f u U n U t r i C n t P k n t S i s r a t h e r s i m i l « irrespective of
contriWi e xPenment. It is interesting to note that the relative P
? n T K T m S S U b l e a t ' V d u e ° f 2' W h e r e a s simultaneously the N and K contributions are mutually affected.
74

Deficiency of N, P and K concurs with an appreciably low contribution of each of these elements in intermediate and deficient stages with full treatment. Concomitantly, changes of, usually, both other elements are observed with respect to full treatment and intermediate deficiency. Thus, absence of P is characterized by a change of N, P and K contributions from full to intermediate treatment, whereas from stage 2 to stage 3 an increase in N contribution is observed at the expense of K at practically constant P. For N deficiency a regular reduction of the N contribution from full treatment to the intermediate and deficiency stages concurs initially with a gradual increase of P and K contributions; in stage 3 the P contribution shows an increase. Absence of K is associated with an initial sharp rise of N from full to intermediate and a smaller increase when passing to stage 3; this coincides with a reverse response of K. The P contribution rises somewhat. Generally speaking, when moving from the intermediate to the deficient stage one of the 3 elements tends to maintain a constant relative contribution, whereas "false" antagonistic action occurs between the other 2 elements. The minor contribution of P to N+P+K in general is interesting to note.
The relative contribution of individual bases to their sum total does not appear to be fundamentally different from that found for N, P, K. The base composition of leaves of plants receiving full nutrients, N deficient and P deficient solutions seems rather constant, irrespective of stage; there tends to be some variation with respect to Mg. In contrast, K, Ca and Mg at full treatment, intermediate and deficient levels, respectively, is associated with a decreasing proportion of the respective contributions of these elements to their total. As for N, P, K, when changing from full nutrients to intermediate deficiency of one specific element, the 3 elements tend to change their contributions. In the next step to complete deficiency, the K and Mg contributions are altered in the case of K deficiency, and that of Ca and Mg when Ca is deficient. The absence of Mg has a somewhat different
TABLE 16
The effect of intermediate and complete deficiency of one element on 8 ratios between the major elements
Full Nitrogen omitted Phosphorus omitted Potassium omitted Calcium omitted Magnesium omitted
K Ca+Mg
ID CD
2.0. 2.4 1.9 09 2.3 2.1
1.6 2.1 1.6 08 2.2 1.6
N/K
ID
0.8 0.6 0.8 14 0.8 0.8
CD
0.9 0.6 0.9 16 1.0 0.8
P/K
ID CD
0.04 0.05 0.05 0.06 0.03 0.03 0.07 0.09 0.04 0.05 0.04 0.05
P/Mg
ID CD
0.4 0.7 0.3 0.3 0.3 1.2
0.4 0.6 0.2 0.3 0.2 1.0
K/Mg
ID
9.8 14.1 9.6 4.7 6.0
32.1
CD
7.5 9.6 7.6 3.1 4.7
22.1
logCa/Mg logN/Mg
ID
0.58 0.67 0.60 0.61 0.20 1.15
CD
0.57 0.56 0.54 0.48 0.08 1.09
ID
0.89 0.89 0.91 0.81 0.71 1.40
CD
0.85 0.84 0.85 0.70 0.65 1.27
logN/P
ID
1.28 1.13 1.50 1.29 1.29 1.32
CD
1.28 1.00 1.57 1.27 1.29 1.27
ID = intermediate level of deficiency CD = complete deficiency
75

effect, as from full nu t r ien t t o t he intermediate deficiency i t is largely K that acts in an antagonistic fashion when Mg reduces its contr ibution un usually abruptly. Over t he next step Mg remains practically constant whereas Ca increases with a concur ren t decrease in t h e contr ibut ion of K. This anomalus behaviour may be attributed to the fact t ha t intermediate deficiency of Mg is associated with a sharp fall t o a low leaf level.
The visual presentation largely reflects t h e behaviour of t h e concentration of t he major e lements as observed f rom the tabulated data. As expected, t he composition of plants receiving deficient solut ion moves in the triangle towards levels of relative deficiency for t h e respective elements, taking in to account mu tua l compensation effects. The pa t tern of movemen t under influence of deficiencies appears to be relatively uncompl i cated.
7.4.2. Vegetative health and foliar concentrations
The data from the po t experiments suggest tha t vegetative heal th of pepper with respect to each of t h e 5 major e lements may be characterized by specific values for the absolute levels of N , P, K, Ca and Mg, for several ratios between elements, and by specific locations in t r iangular diagrams for N, P, K and K, Ca, Mg. This stresses t h e po in t t ha t leaf concentrations of elements are mutua l ly interrelated and no t dependent on the supply of a single e lement only. In table 17 characteristics for full, —N, — P, —K, — Ca, and — Mg t reatments have been presented. The b lank spaces
TABLE 17
Summary of leaf characteristics associated with full nutrients and individual deficiencies
Treatment: Full - Nitrogen - Phosphorus - Potassium • Calcium
Element/ratio ID CD ID CD ID CD ID CD ID CD
Nitrogen Phosphorus Potassium Calcium Magnesium
K
3.41 0.18 4.31 1.68 0.44
3.10 0.16 3.38 1.66 0.45
2.99( )2.32 0.22(4-4-)0.23 0.11( )0.04
Ca+Mg N/K P/K P/Mg K/Mg log Ca/Mg log N/Mg logN/P
2.0 1.6
0.8 0.04 0.4 9.8 0.58 0.89 1.28
0.9 0.05 0.4 7.5 0.57 0.85 1.28
2.62( )1.99 2.29(++)1.87 0.56(4-4-)0.63
0.9 ( )0.8
1.4 (++)1.6 0.07(4-4-)0.09
4.7 (—)3.1
1.12( )0.86 0.69(4-4-)0.63
0.20( )0.08
1-13C )1-00 1.50(++)1.57
( — ) deficient with respect to "full t reatment"; difference > 40% ( + + ) above normal with respect to "full t reatment"; difference > 100% ID = intermediate level of deficiency
CD = complete^deficiency
- Magnesium
CD ID
1.97(++)2-22
0.14(—) 0-18
1.2 ( ++ ) I." 32.1 (++)22-l 1.15(4-4-) 1-0 1.40(++) I-27
76

indicate that the respective values do not appreciably vary from those of the full nutrient treatment (see tables 15 and 16).
From the data in table 17 it may be observed that with respect to vegetative condition a deficiency of N may be described by values for N and P, and by a value for log N/P, different from those associated with full nutrient treatment. The severity of the deficiency may be visually estimated from the location in the respective triangular diagrams. Similarly, deficiencies of P, K, Ca and Mg may be described by a number of sub-normal values.
"Normal" values of concentrations and ratios associated with a healthy canopy may be represented by those of full nutrient solutions. In a similar way, a lower limit for leaf nutrients may be related to values of incipient deficiency, whereas values below these would indicate definite deficiency conditions. The latter are usually associated with visual, foliar symptoms. Thus, under the controlled conditions of the pot experiment 2 principal ranges of values of nutrient concentrations may be distinguished: one includes values between "normal" conditions and intermediate deficiency (zone of accumulation), a second zone covers values below intermediate deficiencies (zone of visual deficiency).
TABLE 18
Reference values for elements and ratios with respect to the vegetative condition of the vines
Classification
Elements/ratios:
N(%dr.m.) log N/P P(%dr.m.) log N/P K(5gdr.m.) N/K K/Mg
K Ca+Mg Ca (% dr. m.) log Ca/Mg Mg(%dr.m.) P/Mg K/Mg log Ca/Mg log N/Mg
Normal +
3.40-3.10 1.28
0.18-0.16 1.28
4.30-3.40 0.8 -0.9 9.8 -7.5
2.0 -1.6
1.68-1.66 0.58-0.57 0.45-0.44
~0.4 7.5 -9.8 0.57-0.58 0.85-0.89
Critical+ +
2.80-2.70 1.22-1.14 0.14-0.10 1.34-1.49 2.62-2.00 1.0 -1.3 6.5 -4.8
1.4 -1.0
1.20-1.00 0.52-0.21
0.30-0.20 0.6 -0.9
11.0 -21.0 0.64-1.09 0.98-1.26
Deficient+ + +
<2.70 < 1.13 <0.10 >1.49 <2.00 >1 .3 <4.8
<1.0
< 1.00 <0.21 <0.20 >0.9 >21.0 > 1.09 >1.26
Indicating
N deficiency N deficiency P deficiency P deficiency K deficiency K deficiency K deficiency
K deficiency
Ca deficiency Ca deficiency Mg deficiency Mg deficiency Mg deficiency Mg deficiency Mg deficiency
+ Values exceeding the upper limit of the normal value are classified as "above normal" or "below normal" depending on diminishing or rising values respectively in the critical range.
+ + Between the "normal" and the "critical" range at least 10-15% difference has been established; values are to be associated with fair values.
+ + + Deficient values follow immediately the lower limit of the "critical" range of values.
77

The relative contributions of N, P, K, Ca and Mg in healthy vines should coincide with the appropriate locations in the respective triangular diagrams. The place of observed relative concentrations within the respective diagrams appears to provide, by itself, an indication of the presence and of the degree of deficiency of the 5 major elements. This mode of visual
TABLE 19
Foliar concentrations and ratios of 5 major elements in apparently healthy and deficient mature vines
Symptoms: N56 P% K% Ca% Mg% K N/KP/MgK/Mg log log log Time: dr. m. dr. m. dr. m. dr. m. dr. m. Ca+Mg Ca/Mg N/Mg N/P
Healthy 1 2.34 0.27 2.08 1.44 0.22 1.3 1.1 1.2 9.5 0.81 1.03 0.94 May Visual N deficiency 1.31 0.08 1.53 1.04 0.30 1.2 0.9 0.3 5.1 0.54 0.64 1.21 Visual K deficiency 2.27 0.14 0.27 2.01 0.25 0.1 8.4 0.6 1.0 0.90 0.95 1.21 Visual Ca deficiency 4.00 0.44 5.48 0.24 0.16 13.7 0.7 2.7 34.2 0.18 1.40 0.95 Visual Mg deficiency 2.37 0.25 1.82 2.39 0.09 0.7 1.2 2.8 20.0 1.42 1.42 0.98 Visual Mg deficiency
(mild) 2.85 Visual Mg deficiency
(intermediate) 2.60 Visual Mg deficiency
(severe) 2.54 0.45 3.00 1.08 0.05 2.6 0.8 9.0 60.0 1.33 1.71 0.75 Necrosis of vines 2.61 0.19 1.33 1.86 0.14 0.7 2.0 1.4 9.5 1.12 1.27 1.14 Dual symptoms 1.97 0.14 1.47 1.73 0.08 0.8 1.3 1.8 18.4 1.33 1.39 1.15
0.36 2.85 1.08 0.08 2.5 1.0 4.5 35.6 1.13 1.55 0.90
0.35 2.94 1.12 0.06 2.5 0.9 6.0 49.0 1.27 1.64 0.87
Healthy 2 2.17 0.29 1.73 1.06 0.26 1.3 1.2 1.1 6.6 0.61 0.92 0.86 April
Visual Ca deficiency 3.70 0.33 3.89 0.32 0.09 9.5 0.9 3.7 43.2 0.56 1.61 1.08
Healthe 3 2.40 0.21 2.11 1.12 0.21 1.6 1.1 1.0 10.0 0.72 1.06 1.06 April
Visual Mg deficiency (mild) 2.48 0.33 2.57 1.29 0.06
Visual Mg deficiency (severe) 2.78 0.34 3.24 0.97 0.05
Necrosis of vines 2.11 0.23 1.97 0.89 0.09
1.9 1.0 5.5 42.8 1.33 1.61 0.88
3.2 1.9
0.9 7.0 1.1 1.4
64.8 11.6
1.29 1.75 0.91 0.72 1.08 0.96
Healthy 4 2.40 0.31 1.82 1.73 0.30 . 0.9 1.3 1.0 6.0 0.76 0.90 0.89 May
dual symptoms 2.58 0.13 0.48 1.15 0.25 0.3 5.4 0.5 1.9 0.66 1.01 1.30
Scattered mottling 1 Mild mottling Severe mottling
Healthy Healthy Healthy Healthy Healthy Healthy Healthy
2.64 2.44 2.17
0.13 0.13 0.13
1.21 2.77 0.14 1.32 2.41 0.18 1.79 2.45 0.10
0.4 0.5 0.7
2.2 1.8 1.2
1.0 0.7 1.3
8.6 7.3
17.9
1.12 1.28 1.31 1.19 1.13 1.27 1.30 1.34 1.22
2.90 2.67 2.60 2.51 2.40 2.40 2.49
0.18 0.22 0.22 0.31 0.32 0.28 0.30
2.03 1.99 2.12 1.97 1.81 1.70 1.74
1.42 1.52 1.59 1.75 1.75 1.70 1.86
0.33 0.37 0.34 0.35 0.30 0.30 0.31
1.2 1.1 1.1 0.9 0.9 0.9 0.8
1.4 1.3 1.2 1.3 1.3 1.4 1.4
0.5 0.6 0.6 0.9 1.1 0.9 1.8
6.2 5.4 6.2 5.6 6.0 5.7 5.6
0.63 0.61 0.67 0.70 0.76 0.76 0.75
0.94 0.86 0.88 0.86 0.90 0.90 0.90
1.21 January 1.08 February 1.07 March 0.91 April 0.88 May 0.93 June 0.92 July
• No apparently healthy vines present at comparable age.
78

reference represents an independent check on the results of individual leaf concentrations, bivariate and trivariate ratios.
In the practice of pepper growing, when working in more tortuous media, and when seasons and fruit development exert their influence levels, these "normal", more or less "ideal" concentrations, for the vegetative part of vines may only be approached. Therefore, "normal" values should only be considered as a guide. As a matter of principle, nutrient concentrations in leaves, associated with intermediate levels should be accepted as the best estimate of lower limits, since beyond these concentrations visual symptoms of deficiency are likely to appear.
F I E L D V I N E S P O T P L A N T S
+ c o • X A A 8
* a m a
HEALTHY N I T R O G E N POTASSIUM CALCIUM MAGNESIUM NECROSIS NECROSIS SCATTERED M I L D SEVERE DUAL DUAL
D E F I C I E N C Y DEF DEF DEF 1 2 LEAF LEAF LEAF
MOTTLING MOTTLING MOTTLING
D E F I C I E N C Y 1 D E F I C I E N C Y 2
<B C e 0 • X
• c
FULL N U T R I E N T S N I T R O G E N DEF P H O S P H O R U S DEF P O T A S S I U M DEF C A L C I U M DFF MAGNESIUM DEF
INTERMEDIATE DEF C O M P L E T E DEF
^ N ioo% ^ Nioo%
Pioo%
F I E L D V I N E S (means of I O )
Kioo%> Kioo% Figure 5
Portion of the triangular diagrams of N, P and K for potplants and fieldvines
79

The data in the preceding section lead to the following conclusions:
Symptoms occurring on plants grown in a solution deficient in N, P, K, Ca or Mg, are characteristic for the element in question and correspond with significantly low leaf concentrations for each of the respective nutrients; K deficiency manifested itself by very low levels only; typical necrotic symptoms begin to develop at K concentrations in the leaf of less than 1%.
. The significance of differences between the chemical concentrations of N, P, K, Ca and Mg in the leaves, separate or in multiples, of plants grown in deficient and full nutrient solutions allow the establishment of tentative reference intervals.
+ c o • X A
& • K O
• D
F I E L D V I N E S
HEALTHY N I T R O G E N POTASSIUM CALCIU M
D E F I C I E N C Y DEF DEF
M A G N E S I U M DEF N E C R O S I S N E C R O S I S SCATTERED M l LD SEVERE D U A L D U A L
1 2 LEAF LEAF LE AF
MOTTL ING MOTTL ING M O T T L I N G
D E F I C I E N C Y 1 D E F I C I E N C Y 2
m O
e o • X
1 c
P O T P L A N T S
FULL NUTRIENTS NITROGEN DEF PHOSPHORUS DEF P O T A S S I U M DEF C A L C I U M DEF MAGNESIUM DEF
INTERMEDIATE DEF C O M P L E T E DEF
,Ktoo% \ioo%
10 20
Caioo% 10 20
Caioo% Figure 6
> Mgioo%
Portion of the triangular diagrams of K, Ca and Mg for potplants and fieldvines
80
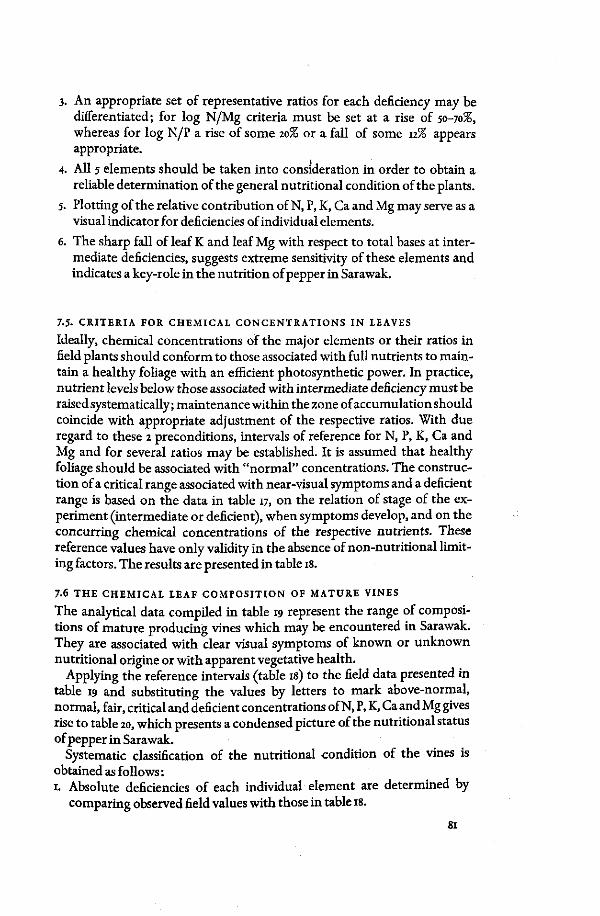
3. An appropriate set of representative ratios for each deficiency may be differentiated; for log N/Mg criteria must be set at a rise of 50-70%, whereas for log N/P a rise of some 20% or a fall of some 12% appears appropriate.
4. All 5 elements should be taken into consideration in order to obtain a reliable determination of the general nutritional condition of the plants.
5. Plotting of the relative contribution of N, P, K, Ca and Mg may serve as a visual indicator for deficiencies of individual elements.
6. The sharp fall of leaf K and leaf Mg with respect to total bases at intermediate deficiencies, suggests extreme sensitivity of these elements and indicates a key-role in the nutrition of pepper in Sarawak.
7.5. CRITERIA FOR CHEMICAL CONCENTRATIONS IN LEAVES
Ideally, chemical concentrations of the major elements or their ratios in field plants should conform to those associated with full nutrients to maintain a healthy foliage with an efficient photosynthetic power. In practice, nutrient levels below those associated with intermediate deficiency must be raised systematically; maintenance within the zone of accumulation should coincide with appropriate adjustment of the respective ratios. With due regard to these 2 preconditions, intervals of reference for N, P, K, Ca and Mg and for several ratios may be established. It is assumed that healthy foliage should be associated with "normal" concentrations. The construction of a critical range associated with near-visual symptoms and a deficient range is based on the data in table 17, on the relation of stage of the experiment (intermediate or deficient), when symptoms develop, and on the concurring chemical concentrations of the respective nutrients. These reference values have only validity in the absence of non-nutritional limiting factors. The results are presented in table 18.
7.6 THE CHEMICAL LEAF COMPOSITION OF MATURE VINES
The analytical data compiled in table 19 represent the range of compositions of mature producing vines which may be encountered in Sarawak. They are associated with clear visual symptoms of known or unknown nutritional origine or with apparent vegetative health.
Applying the reference intervals (table 18) to the field data presented in table 19 and substituting the values by letters to mark above-normal, normal, fair, critical and deficient concentrations of N, P, K, Ca and Mg gives rise to table 20, which presents a condensed picture of the nutritional status of pepper in Sarawak.
Systematic classification of the nutritional condition of the vines is obtained as follows: 1. Absolute deficiencies of each individual element are determined by
comparing observed field values with those in table 18.
81

2. Relative deficiencies between 2 or more elements are determined in a similar fashion, using the appropriate reference values for ratios.
In this work "normal" and "fair" are considered to be satisfactory values. For determinations of deficiency for 1 element the criteria in table 17
TABLE 20
The results of applying the reference values to the leaf data of table 19 (rearranged)
Classification
Field condition:
1. Healthy 2. Healthy 3. Healthy 4. Healthy 5. Healthy January 6. Healthy February 7. Healthy March 8. Healthy April 9. Healthy May
10. Healthy June 11. Healthy July
12. Visual N deficiency 13. Visual K deficiency 14. Visual Ca deficiency 15. Viasul Ca deficiency 16. Visual Mg deficiency 17. Visual Mg deficiency 18. Visual Mg deficiency 19. Visual Mg deficiency 20. Visual Mg deficiency 21. Visual Mg deficiency
22. Visual necrosis 23. Visual necrosis 24. Scattered mottling 25. Mild mottling 26. Severe mottling 27. Dual symptoms 28. Dual symptoms
above normal: + n below normal: —n
N;
1
N
• • • • 0
• • • • • •
• •
+ n + n
• X
• • • X
• • X
• • • •
shortage P short-
2
P
+n + n + n + n
n + n + n + n + n + n + n
• X
+n +n + n + n +n + n + n + n
+ n + n
X
+n +n + n + n
3
age*
4
log log N/P N/P
• • • • X
• • • • • •
X
X
• • • • • • • •
• X
+ n 0
X
+ n X
—n —n —n —n —n —n —n —n —n —n —n
—n —n —n —n —n —n —n —n —n —n
—n —n
0
—n —n
0
—n
normal: n fair:o
* Concentrations for leaf P, leaf Ca and leaf Mg
5
K
X
• X
• X
• X
• • • •
• •
+ n n • 0
0
0
X
n
• • • • • • •
K shortage
6 7
Ca Mg
O X
X X
X X
+n x 0 0 0 0 0 0
+ n 0 + n x + n x + n 0
X X
+ n x • • • •
+ n * x • x • x • x * • •
• * + n * + n * + n * + n * + n x + n *
; in columns 2,
8
K
9
N Ca+Mg K
x x n • X
X
X
• • • •
X
• + n + n
• + n + n + n
n + n
n • • • • • •
6 and 7,
X
X
X
X
• X
X
X
X
• •
n • 0
n X
X
n n 0
n
X
• • • X
• X
Ca short age*
10 11
K log Mg C a
Mg
n + n 0 + n x + n x + n x + n x + n x + n x + n x + n x + n x + n
x 0 • + n
+ n • + n 0 + n + n + n + n + n + n + n + n + n + n + n + n
+ n + n n + n n + n 0 + n
+ n + n n + n
+ n + n
critical: x deficient: -jc
:- Mg shortage*
12
P Mg
• * • • 0
X
X
X
• X
•
—n X
• • • • • • • •
• • • X
• 0
•
respectively, apply.
13
K
Mg
0
—n 0
—n —n —n —n —n —n —n —n
—n —n
• • • • • • • •
X
n n 0
X
—n X
14
log Ca
Mg
X
0
X
X
0
0
X
X
X
X
X
—n X
—n —n
• • • • • • X
• • • • X
•
15
log N
Mg
X
0
X
0
0
n n n 0
0
0
—n 0
* * X
* * * * * X
* * X
* X
*
82

should be satisfied, otherwise multiple deficiencies are involved. Incipient deficiencies are considered to be related to the presence of "critical levels". Deviations from the appropriate ratio value indicate relative deficiencies between the respective elements. The term "above normal" relates to situations when reference values decrease with increasing deficiency, whereas "below normal" is associated with the opposite situation (table 18).
7.6.1. Treatment of data
7.6.1.1. N i t rogen and p ho spha t e Inspection of the data in table 20 indicates that in 25 out of 28 cases the concentration of N has fallen to critical or deficient levels. Leaf P is critical or deficient in 3 cases only. The nature of this deficiency is revealed by the concurring values for the concentration of P and for that of log N/P. If critical or deficiency levels concur with above-normal values for P and deficient values for log N/P the element nitrogen is deficient. Its leaf concentration requires adjustment until the corresponding ratio value has attained its normal value.
Scrutiny of the various combinations of N, P and log N/P indicates that complications may be expected with regard to the relations of these two elements.
Case 12 shows an example of the.deficiency of both leaf N and leaf P; log N/P appears as just critical, indicating a relatively low N concentration. When the data for P deficiency are compared the value of log N/P is below normal, confirming a relative P excess despite P deficient levels. The data for N deficiency also indicate the need for a more rapid rise of the N content to normal levels as compared with that of leaf P.
If N and P concentrations are both above normal, N may still be relatively deficient, as in cases 14 and 15. Although this situation is probably due to decreased production of dry matter, adjustment towards normal levels should coincide with a more rapid fall in P concentrations with probably a concurrent increase in leaf N to maintain a proper ratio.
When P concentrations are normal (case 5) the log values for N and P deficiencies indicate that adjustment of N levels should coincide with careful observation of the P concentration to prevent the development of deficiencies of this latter element.
Interpretation using N, P and log N/P criteria agrees well with field observations. The "healthy" vines of the cases 1-4 exhibited a light green tinge on their foliage, which some months later developed into visual symptoms of N deficiency. Similar observations were made on the cases 5-11. In January leaf N and P were not alarming, but log N/P indicated impending deficiency of N. Visual symptoms developed some time in March, increasing in intensity with time. Typical symptoms of N deficiency of different intensity were also observed on all other vines, with the exception of those displaying symptoms of Ca deficiency. In several cases interactions occurred with symptoms of K deficiency, which tended to
83

obscure clarity of individual N symptoms. Discolouration due to P deficiency has not been observed.
7.6.1.2. Po tass ium A similar, somewhat more involved, procedure as for the elements N and P may be applied to the data related to K deficiency in the leaves. The situation indicates the need for simultaneous correction of concentrations of 3 base elements in the great majority of cases. When considering the "healthy" vines in the table, it is interesting to note that on all occasions the concentration of leaf K is either at critical levels, or associated with K deficiency. The concurring concentrations of leaf Ca are at the expected above-normal level in some 45% of the cases, whereas it is fair in 35%; critical levels occur in the cases 2 and 3, when concomitantly leaf K is critical. The corresponding concentrations of leaf Mg appear to be critical or fair-to-critical.
Some complications with regard to relative deficiencies may be expected amongst bases. The data in column 5 indicate the need for an appreciable rise in leaf K, but from columns 7, 8 and 10 follows the need for a less rapid rise of leaf Mg with or without a concurrent rise or fall of leaf Ca.
Relative deficiency of K with respect to N may be observed from column 9. The value associated with the critical and deficient interval of the N/K ratio indicates the appropriate priority of adjustment.
Case 13 may be considered representative for K deficiency. The sample contained only leaves with typical symptoms, but the simultaneous presence of a critical concentration of leaf Mg indicates a potential dual deficiency of bases. This duality is even more pronounced in the cases 23-28, where leaf Mg is deficient. The relative importance of K deficiency is reflected by deficient values for K/Mg in case 13, and by fair, normal or above-normal ratios of K/Mg in case 23-28. The ratio for N/K confirms relative deficiencies of K with respect to deficient leaf N.
Finally, case 22 shows triple deficiency of K, Mg and Ca as reflected by absolute levels, and by the normal and above-normal ratios of K/Ca+Mg, and of K/Mg. On these occasions the value for N/K is critical, indicating the need for some fall in this ratio by a rise of leaf K, and simultaneous adjustment of the observed deficiency of leaf N.
In all of the cases analyzed K deficiency could be diagnosed, frequently in combination with apparent shortage of" Ca or of Mg. These results agree largely with field observations. These showed the presence of visual symptoms of K deficiency at sampling, or their development later in the season in the healthy vines, as well as symptoms of Mg deficiency (leaf fall) in the cases 23-28. Necrosis by Ca deficiency was not observed in case 22, probably due to its development in approximately the same distal region of the leaf blade, as the symptoms associated with K deficiency. No necrotic foliar symptoms of K deficiency were observed in cases where K was present at critical levels or above. Symptoms of N deficiency developed simultaneous-
84

ly where levels were classified as deficient, but their clarity tended frequently to be masked by the presence of other symptoms.
7.6.1.3. Ca lc ium From data in column 6 (table 20) it may be observed that in some 55% of the cases leaf Ca is above normal, indicating relative excess of this element and/or some base disorder. In 4 cases concentrations of Ca have fallen below deficiency levels. The data in column n show that in 25 out of 28 cases the ratio log Ca/Mg has risen to above-normal values, irrespective of the concentrations of leaf Ca. Consequently, leaf Mg is more deficient in these cases. In the cases 14 and 15 there is a visual deficiency of Ca, but, in accordance with table 18, only in case 14 it appears to be a "true" deficiency with respect to Mg. In the cases 21 and 22 Ca is in relative excess, despite necrotic margins.
When incorporating leaf Mg data in the respective cases, the nature of the disorder is revealed, and the mode of adjustment may be deduced. For example, the Ca concentration in case 5 should increase to normal levels; the ratio suggests complications with respect to Mg. If the leaf Mg concentration is taken into consideration, it is self-evident that its level should also be increased, but more rapidly than that of leaf Ca, in order to reduce the ratio. The reverse may be observed in case 14, as shown by the deficiency value for the ratio. In cases of above-normal levels of Ca the corresponding ratio indicate the need for an increase of Mg.
When similar analyses are carried out for other data, it appears for the cases 12-28 that the majority represents combinations of relative Ca excess, associated with absolute and relative deficiencies of leaf Mg, whereas in 4 cases, deficiency of Ca was present. The healthy vines in the cases 1-4 tend towards deficiency of Mg and in 2 cases also towards Ca shortage, whereas in the cases 5-11 mostly fair or above-normal levels are found.
Field observations generally support the results of this diagnosis. In the cases 14 and 15 a clear necrosis was observed, characteristic for Ca deficiency, accompanied by superimposed leaf patterns associated with Mg deficiency. In other cases, which are more associated with the Mg deficient levels, abrupt leaf fall had occurred or was observed at some later date. Characteristic spotting in case 22 indicated early stages of Ca deficiency.
7.6.1.4. Magnes ium The concentrations of leaf Mg and its relation with respect to Ca have already been discussed in paragraph 7.6.1.3. The data in column 14 (table 20) merely confirm these results. The ratios of Mg to N, P and K are presented in the columns 12-15.
In the majority of the cases 12-28 leaf Mg is present at critical or deficient levels. In accordance with the ratio indices of table 18, Mg is under these conditions the most important deficient element with regard to N, P, K and Ca. In contrast, deviations from the appropriate classification for
85

single Mg deficiency would suggest the presence of potential complications amongst elements. Case 14 and 15 show leaf Ca to be relatively most deficient, whereas in cases 21 and 22 this is leaf Mg. For similar reasons, in case 27 leaf K is most deficient. The fair or critical values of Mg concentrations in the cases i-n are associated with concomitant ratio values amongst elements varying from beyond normal to deficient. This suggests the possible development of complicated multiple disorders following small concentration changes at this level of nutrition.
The relative position of Mg with respect to the different elements indicates the mode of supply adjustment. In the cases 5-n a relative excess of P and Ca, and a relative deficiency of K may be observed with respect to Mg, whereas the value of log N/Mg seems fair to normal. This suggests that leaf Mg should rise in proportion to N, but much more rapidly with respect to P and Ca, and slowly with regard to leaf K. A similar analysis can be made tor each individual case.
Symptom patterns largely agree with respect to deficiency of leaf Mg. Faint symptoms were present at critical levels, whereas definite characteristic discolourations were present when levels dropped below deficiency concentrations. Multiple symptoms of deficiency of leaf Mg, and/or leaf K and of leaf N were present in some cases, i n agreement with the occurrence of the respective deficient levels of these elements.
7.6.1.5. Triangular diagrams The relative contribution of N, P and K to their sum total is shown in fig. 5. r the healthy range for the sand experiment is assumed as a reference near
ly all cases of deficiency of N, Ca and Mg display a normal relative contribution of N and K, whereas that of P is approximately twice that of the reference vines. The cases i-n (shaded area) show, on a similar basis, relative N and P excess and.a concurring shortage of K. Extreme deficiency of K and one case of "dual leaf colour" show both a very low K contribution with concomitant P and N excess.
The relative contributions of the 3 base elements to their sum total have
a^r^ r Ji-t fu SUg§eSt ,?*, C h a n g e S 0 f t h e r e l a t i v e ba se contributions are were o t , y 'J^f6 " " * f r o m t h e i r Previous location. Similar results 7ZltT d a U ° f t h C S a n d exPeriment. The apparently normal d e f i S n T ^ V 1 1 6 T' ° f V d n a l n e C r o s i s m a ? b e attributed to triple oftaE g'Th£ r£SUltS are'in S e n e r a 1 ' a ™ u a l i l l u s t r a t i o n
7.6.1.6. Malnutrition and foliar composition
w T m o ^ n r t a b l e 2° ^ s u b d i v i d e d ^ t o 3 groups receiving relatively S ^ T ^ f e
f T d i a t C (l"4)> a n d l o W d r e s s i n S s o f Utilizer (n-*> The state of health of the canopy tends to coincide with these respec-
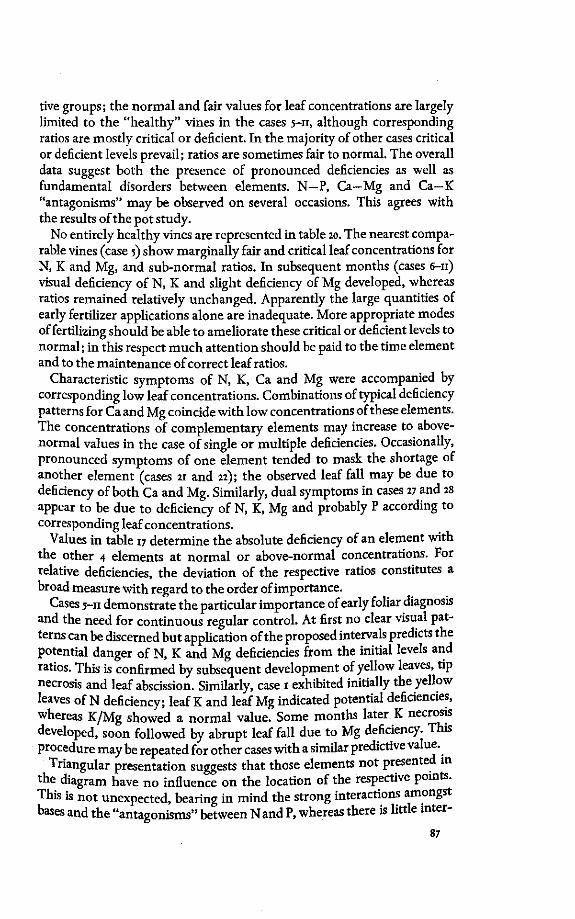
tive groups; the normal and fair values for leaf concentrations are largely limited to the "healthy" vines in the cases 5-11, although corresponding ratios are mostly critical or deficient. In the majority of other cases critical or deficient levels prevail; ratios are sometimes fair to normal. The overall data suggest both the presence of pronounced deficiencies as well as fundamental disorders between elements. N—P, Ca—Mg and Ca—K "antagonisms" may be observed on several occasions. This agrees with the results of the pot study.
No entirely healthy vines are represented in table 20. The nearest comparable vines (case 5) show marginally fair and critical leaf concentrations for N, K and Mg, and sub-normal ratios. In subsequent months (cases 6-11) visual deficiency of N, K and slight deficiency of Mg developed, whereas ratios remained relatively unchanged. Apparently the large quantities of early fertilizer applications alone are inadequate. More appropriate modes of fertilizing should be able to ameliorate these critical or deficient levels to normal; in this respect much attention should be paid to the time element and to the maintenance of correct leaf ratios.
Characteristic symptoms of N, K, Ca and Mg were accompanied by corresponding low leaf concentrations. Combinations of typical deficiency patterns for Ca and Mg coincide with low concentrations of these elements. The concentrations of complementary elements may increase to above-normal values in the case of single or multiple deficiencies. Occasionally, pronounced symptoms of one element tended to mask the shortage of another element (cases 21 and 22); the observed leaf fall may be due to deficiency of both Ca and Mg. Similarly, dual symptoms in cases 27 and 28 appear to be due to deficiency of N, K, Mg and probably P according to corresponding leaf concentrations.
Values in table 17 determine the absolute deficiency of an element with the other 4 elements at normal or above-normal concentrations. For relative deficiencies, the deviation of the respective ratios constitutes a broad measure with regard to the order of importance.
Cases 5-11 demonstrate the particular importance of early foliar diagnosis and the need for continuous regular control. At first no clear visual patterns can be discerned but application of the proposed intervals predicts the potential danger of N, K and Mg deficiencies from the initial levels and ratios. This is confirmed by subsequent development of yellow leaves, tip necrosis and leaf abscission. Similarly, case 1 exhibited initially the yellow leaves of N deficiency; leaf K and leaf Mg indicated potential deficiencies, whereas K/Mg showed a normal value. Some months later K necrosis developed, soon followed by abrupt leaf fall due to Mg deficiency. This procedure may be repeated for other cases with a similar predictive value.
Triangular presentation suggests that those elements not presented in the diagram have no influence on the location of the respective points. This is not unexpected, bearing in mind the strong interactions amongst bases and the "antagonisms" between Nand P, whereas there is little mter-
87

action between these groups. The overall results indicate that diagrams may be employed to provide a visual control for changes towards normal regions when extreme deficiencies of single elements are adjusted and vice versa.
The results imply that consideration of both absolute concentrations and ratios between elements is essential for correct interpretation.
7.7 CONCLUSION
The different groups of vines in this study appear to suffer from visual single and multiple disorders as determined by comparison with the results from the pot experiment. The nature of these symptoms, suggestive for interaction of several deficiencies at the time, could be established without much difficulty by consideration of the leaf data and application of the proposed intervals of individual leaf concentrations and appropriate ratios obtained from the pot experiment. In a much similar fashion the presence of incipient or masked disorders could be established. The treatment also allows a comprehensive diagnosis of the expected development of deficiencies in the future. An appropriate mode of fertilizer adjustment may be deduced from the respective foliar concentrations and corresponding ratios.
From the data it may be concluded that foliar diagnosis for pepper offers good possibilities with regard to early prediction of disorders between major elements; in addition it appears to be a suitable guide to maintain or to restore vegetative health. To prevent symptoms of deficiency, the concentration of leaf N, P, K, Ca and Mg must be maintained at least above the proposed critical indices; for optimal vegetative condition of the canopy leal concentrations and ratios should be kept at normal levels.
n £ J n TE
T ! o F i U E N C E ° F A P P L I C A T I O N S OF FERTILIZER ON FOLIAR CONCENTRATIONS OF 5 MAJOR NUTRIENTS
Data analyses revealed the general need to raise the leaf concentration of
In dZTT < ? ' W h i l e s i m u l t aneously the ratios should be adjusted.
nutSr 7 WaS n t h a t d r e S S i nSS °f fertilizers initially improved the tendTdtnC°r nn? t T m 0 n" f t h e W s ' w h e r e a s k * r N, K and Mg still levels of r i C r i t u a l ( M g ) ° r d e f i d e n t l e v e l s ( N •** * )• Concurring ence v!l J ^ g e n e
f lr a l I y *"*t0 b e a t V a r i a n c e w i t h t h e appropriate refer-
s k i o n S h ^ T ° f t h G a PP l i c a t i °* of fertilizers on foliar compo-
88

8.1. SOIL CHARACTERISTICS
The experimental area was located on the same type of soil mentioned elsewhere in this work. This shale-derived soil belongs to the red-yellow podsolic group of soils (ANDRIESSE, SCOTT and BAIIEY). According to the texture data in table 21 the soil may be classified as a clay to clay loam. Tensiometer readings over a period of five years have indicated that the pF value of undisturbed soil measured at a depth of 20 cm tends to vary between 2.3 in the peak of the north-east monsoon to 2.9 in the relatively drier part of the year (cf. rainfall, table 1 and par. 1.1.1.).
The soil moisture-retention characteristic (fig. 7) indicates that some 5% of loosely bound moisture is nearly permanently available for the plant throughout the year.
The majority of active roots is located in the upper 60 cm of the soil; below this depth appreciable penetration is impeded, due to the presence of compact subsoil conditions.
After non-burning removal of lalang cover and scattered thin trees, representative soil samples were taken and analyzed. The chemical composition of the upper 15 cm is presented in table 21. The results demonstrate the inherent chemical poverty of the soil, a high P fixation, extreme acidity and a low C.E.C. value. As may be expected immediately after a fallow period, the organic-matter content is relatively high. Soon after cultivation the organic material becomes much reduced, largely owing to heavy rainfall and subsequent erosion. Horizons below 15 cm possess a low organic-matter content and only slight variations occur at greater depth with respect to the other chemical aspects (SCOTT and BAILEY).
8.2. FIELD EXPERIMENT
Field observations had indicated the development of serious deficiency of Mg, shortage of Ca and necrotic symptoms associated with trace element deficiencies. To exclude these nutrients as factors limiting production, a blanket dressing of 2800 kg/ha of dolomite (16% MgO, 38% CaO) has been applied 3 weeks before planting. Dolomite raised the pH to a value of 6, at which level it has been maintained throughout the experimental period. Glass fritted trace elements were supplied at a rate of 60 g/vine. The frit (standard mixture 253A, Ferro Enamels) contained 19.64% Fe, 2.75% Cu, 5.47% Zn, 8.69% Mn, 7.09% B and 0.22% Mo. The application was repeated annually. No harmful effects were observed from the dolomite or the trace elements during 7 consecutive years of the trial.
8.2.1. Details of the experiment A 33 factorial experiment was accommodated in 3 blocks on a level area, 2 degrees of freedom for the N P K interaction were confounded with blocks. The trial was planted with a selected clone of P. nigrum cv. Kuching early in i960. Each of the plots supported 4 vines. Around blocks a single guardrow was maintained.
89
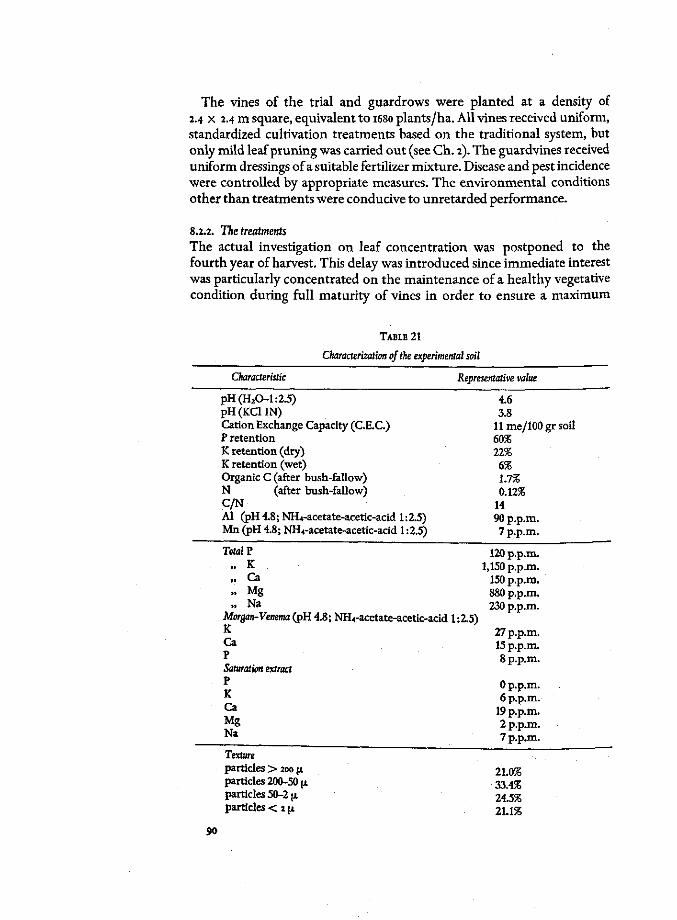
The vines of the trial and guardrows were planted at a density of 2.4 x 2.4 m square, equivalent to 1680 plants/ha. All vines received uniform, standardized cultivation treatments based on the traditional system, but only mild leaf pruning was carried out (see Ch. 2). The guardvines received uniform dressings of a suitable fertilizer mixture. Disease and pest incidence were controlled by appropriate measures. The environmental conditions other than treatments were conducive to unretarded performance.
8.2.2. The treatments The actual investigation on leaf concentration was postponed to the fourth year of harvest. This delay was introduced since immediate interest was particularly concentrated on the maintenance of a healthy vegetative condition during full maturity of vines in order to ensure a maximum
TABLE 21
Characterization of the experimental soil
Characteristic
pH(H20-l:2.5) pH(KCHN) Cation Exchange Capacity (C.E.C.) P retention K retention (dry) K retention (wet) Organic C (after bush-fallow) N (after bush-fallow) C/N Al (pH 4.8; NH4-acetate-acetic-acid 1:2 Mn (pH 4.8; NH4-acetate-acetic-acid 1:2
Total P „ K » Ca .. Mg „ Na
.5) .5)
Representative value
Morgan-Venema(pH4.8; NH4-acetate-acetic-acid 1:2.5) K Ca P Saturation extract P K Ca Mg Na
Texture particles > 200 [i particles 200-50 [x particles 50-2 ;x particles < 2 [x
4.6 3.8
11 me/100 gr soil 60% 22% 6% 1.7% 0.12%
14 90 p.p.m. 7 p.p.m.
120 p.p.m. 1,150 p.p.m.
150 p.p.m. 880 p.p.m. 230 p.p.m.
27 p.p.m. 15 p.p.m. 8 p.p.m.
0 p.p.m. 6 p.p.m.
19 p.p.m. 2 p.p.m. 7 p.p.m.
21.0% 33.4% 24.5% 21.1%
90

fruiting potential; within the period of unproductiveness vines are usually healthy and vigorous when they receive relatively heavy fertilizer dressings. Nil treatment was not included since it was convincingly demonstrated in preliminary observations that cuttings which received dolomite and trace elements only exhibited retarded growth and complete die-back soon after planting. This stresses the natural soil poverty with respect to 3 major nutrients and it implies in fact that initial conditions were somewhat similar to those stated as desirable by VAN DIEST for the regulation of crop nutrition.
60
50
40
30
20
3
O s £10
Figure 7 The relationship of matric suction and soil moisture
Over the entire period from planting to the year of leaf investigation the vines received the following amounts of fertilizer (total oz*/vine):
* We have kept here the English ounce (= 28 g), as the experiments had been made wth this measure.
91
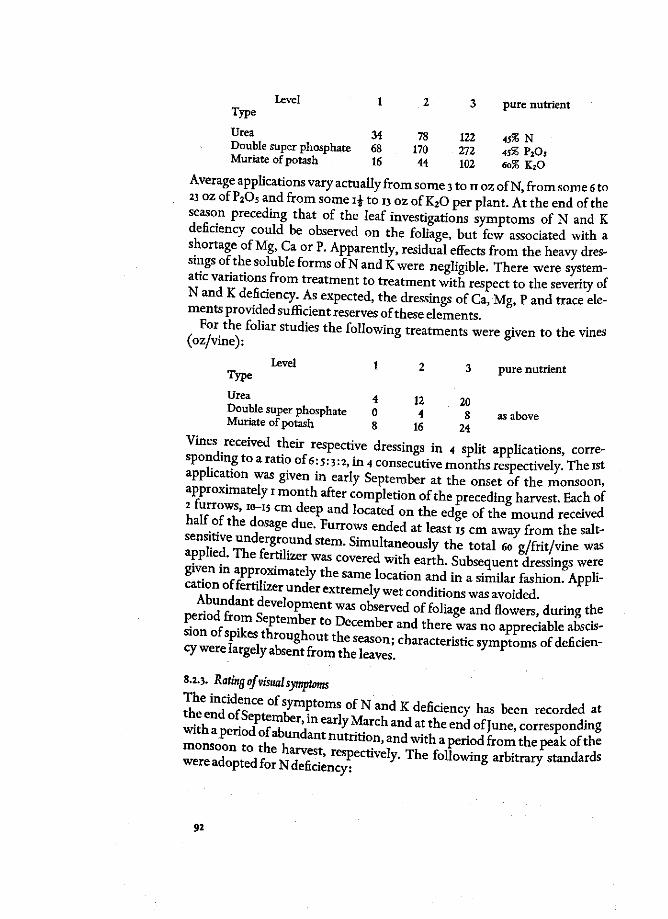
Level 1 Type
pure nutrient
Urea 34 78 122 45% N Double super phosphate 68 170 272 45% P2C>5 Muriate of potash 16 44 102 60% K20
Average applications vary actually f rom some 3 to 11 oz of N , from some 6 to 23 oz of P 2 0 5 and f rom some i£ to 13 oz of K 2 0 per p lant . At the end of the season preceding tha t of t he leaf investigations symptoms of N and K deficiency could be observed on t he foliage, bu t few associated with a shortage of Mg, Ca or P. Apparently, residual effects f rom the heavy dressings of t he soluble forms of N and K were negligible. There were systematic variations from t rea tment to t r ea tment wi th respect t o the severity of N and K deficiency. As expected, t he dressings of Ca, Mg, P and trace elements provided sufficient reserves of these e lements.
For the foliar studies the following t rea tments were given to the vines (oz/vme): 6
Level Type
Urea
pure nutrient
4 12 20 Double super phosphate 0 4 8 as above Muriate of potash 8 16 24
Vines received their respective dressings in 4 split applications, corresponding to a ratio of 6:5:3:2, in 4 consecutive months respectively. The xst application was given in early September at the onset of the monsoon, approximately 1 month after completion of the preceding harvest. Each of
L T T S * V5 C mJ e C P a n d l 0 C a t e d o n t h e e d g e o f * e mound received
halt of the dosage due. Furrows ended at least 15 cm away from the salt-
IT^TTU d e
frS r? u n d s t e m -Simul taneously the total 60 g/frit/vine was
S n t £ 1 i W ? C ° V e r e d W i t h e a r t h - Subsequent dressing were S t S , of f P ? T m a t ^ y t h C S a m C l 0 C a t i 0 n a n d i n a s i ™ i k r fashion Application of fertilizer under extremely wet conditions was avoided.
nerind fro ^ P " " * ' w a s S e r v e d of foliage and flowers, during the sTon of n 7 T ^ u 1 1 0 D C C e m b e r a n d t h e r e ™» ^ appreciable abscise d w e r e S f i t h r
K ° U g h ° U t t h e S e a s o n= characteristic symptoms of deficiency were largely absent from the leaves.
8.2.3. Rating of visual symptoms
lhcendaf?Z0{7m^°mS0^mdKde6d^^ h a s been recorded at wth fpeSf ^ r 7 MarCH ^ a t t hC Cnd ° f J u n e ' ^responding mons? o n to t t u ™ ^ ^ ™d ^ a P e r i o d * o m ** P e* k o f * * ^^t^s^r***-The foUowing ^^ds
92

Colour
Even dark yellow! Necrotic tip J Dark yellow Even light yellow Even light green Even dark green
Score
1
2 3 4 5
Grade
very poor
poor medium mild healthy
Reference
complete N def. pot experiment
full nutrients pot experiment
Each vine was independently scored by different, trained recorders on the same day.
100i
60
50
100
>-x 80 j
'60
50
100N
80
60 X SIGNIFICANT AT P: 0.05 H X SIGNIFICANT AT P: 0.01
50U Sept
Figure 8 The relationship of t ime and incidence leaf discolouration due to N deficiency, as
affected by application of N, P and K fertilizers
93

K deficiency The percentage of necrotic leaves was taken as an indicator of the severity of the disorder. The following standards were adopted:
Grade Reference preliminary pot experiment
% Healthy leaves 0-2555
25-50% 50-75% 75-100% 100%
Score 1 2 3 4 5
very poor poor medium mild healthy full treatment pot experiment
The data of 4 individual recorders were pooled and the mean score per vine was considered a reliable estimate of the N and K deficiency condition. The values per plot for N and K were expressed as a percentage of the maximum score for healthy vines, to provide a measure for the state of health of the foliage.
XX
too
so
60
50
100
>-180 <-< lu *60 "? ov 50
100
80
60
50
X X X XX
X SIGNIFICANT AT P: 0.05 X X SIGNIFICANT AT P: 0.01
Sept T Figure 9
The relationship of time and incidence of necrosis due to K deficiency as affected by dressings of N, P and K fertilizers
94

8.2.4. Leaf sampling
From each plot a total number of 7 bulk samples have been collected; the first sample approximately 3 weeks after the last application of fertilizers, and subsequently at 6 monthly intervals. The sampling procedure developed in chapter 6 has been applied. Samplers were allocated to the plots at random to prevent the introduction of systematic errors.
8.3. THE EFFECT ON VISUAL DEFICIENCIES
The data are presented in the figures 8 and 9. During the period indicated by the broken lines no recordings were made, but their path seems to be justified, as observations indicated only mild symptoms of N deficiency until January, and near-absence of K necrosis from September to March.
N discolouration
Initially the new foliage which develops in September under the influence of dressings of fertilizers tends to be healthy until January, with the exception of that at the lower N level. With advancing time the graphs show that the intensity of the symptoms increases apparently on all occasions. P and K applications do not seem to influence the observed intensity of the discolouration at any time during the period of observation, irrespective of levels.
It may be observed that at the lowest level of N application the discolouration becomes very close to its maximum intensity as early as in March; little further increase of the yellowing is seen towards July. The influence of the high and intermediate N applications on the intensity of discolouration is maintained until March at the same relative difference with respect to low N. This effect is reduced by half in May and it is eliminated in July. At this time, the severity of the disorder appears to be approximately of medium intensity, irrespective of the level of application of N.PorK.
K deficiency
The trial vines seem to remain almost free of symptoms of K deficiency until March, irrespective of N, P or the upper and intermediate levels of K. The lowest dressing of K coincides with only mild incidence of necrosis over the same period. From March onwards a different situation seems to develop.
When considering the development of necrosis, in relation to increasing dosage of K fertilizer, it may be observed that from March to July a high dose of K fertilizer tends to delay the development of necrotic symptoms to May. In contrast, over this same period severity of incidence increases sharply at intermediate and low levels of K fertilizer. As may be expected, the incidence is dependent on the level of application and is proportionally more severe with the lower K supply. ,
h July the intermediate and low dressings of K are associated with
95

maximum presence of necrosis (28%), whereas plants which received the highest dose displayed only an incidence of 14%. There is no effect of differential levels of N and P on the incidence of necrosis.
For mature, producing vines the demand for N is high throughout the
<<a
IN THIS AND SUBSEQUENT FIGURES X SIGNIFICANT AT P: 0.05 X X SIGNIFICANT AT P: 0.01 , " ' CRITICAL ZONE
Kl K2 K3
X X XX
P2 P3
U.
*v
3.0
2.8
Z
a2-6
<
... N2 N3
K.I.. K2 K3
Figure 10 The month-to-month variation of the concentration of ieaf N and leaf P at differential
applications of N, P and K fertilizers (% dr.m.)
96

entire season. Initially, this requirement is associated with leaf and flower development until January, when the monthly dressings of N are able to meet demands. Thereafter, fruit development and simultaneous maintenance of healthy foliage requires considerable quantities of this element. Since berries and healthy leaves contain some 2.3% (table 22) and 2.8-3.4% N (table 18), respectively, severe competition and intensive redistribution phenomena amongst fruit and leaves may be anticipated for this element. This is aggravated by discontinuation of N applications.
N fertilizers are supplied in water-soluble form, prior to the period of fruit development. Appreciable loss of N may be sustained during the monsoon rains which coincide with the large demands made by the crop. Thus, under the current system of nutrition, it is not surprising to observe symptoms of N deficiency from January onwards. This occurs even at the highest level of N dressings (some 10 oz of N per plant) and the intensity of the discolouration ultimately reaches the same level as the one associated with the lower applications of N. A problem of a similar nature seems to exist for K. Fresh berries contain some 1.5% of K and this element is particularly required during fruit development from February to July.
According to the data, in March leaf K becomes deficient. In this month the berry begins to expand rapidly to its final size. Similar competition as for N may be expected to occur between leaf and fruit; the appearance of necrotic leaftips at the lower 2 levels is not unexpected, when bearing in mind the heavy rains in the preceding month. At the highest level of application (some 14 J oz of K20 per plant) this adverse development is delayed for some 2 months, but mild symptoms still develop from May to July.
The results imply that the timing of heavy applications of fertilizers containing N and K and the actual demands of nutrients in the traditional system of fertilizing are in disharmony, involving appreciable loss of nutrients due to rainfall. Considering these aspects a further increase of early applications does not seem to be an appropriate remedy.
M . THE EFFECT ON LEAF CONCENTRATIONS
Data on leaf concentrations of N, P, K, Ca and Mg are presented in graphical form in the figures 10 and 11.
Nitrogen
The path of 8 out of 9 curves (fig. 10), irrespective of type or level of fertilizer is in good agreement with the corresponding curve for seasonal variation (chapter 6). On all occasions a minimum value of some 2.40% is reached in May, followed by a small rise towards July. During the entire period of observation levels remain continuously within the deficiency zone (eh table is). Early in January levels may occasionally be present in the critical area. The lowest level of K seems to increase leaf N significantly in January but this is not continued in subsequent months. Only in January, just prior
97

0.5|
£0.4|
<
KX XX XX xx XX
K l K2
'" 0.2
0.5 KK
J 0.3
0 >"0.2
P i P2 P 3
Nl N2 N3
°1.7| u.
<
°-l3| Kl K2 K3
<
P1 _ .„ P2 P3

to the peak of the monsoon, an increase of leaf N is observed with increasing levels of fertilizer; within the zone of deficiency at the highest level a fair concentration may just be attained. At low N applications leaf N remains within the zone of deficiency throughout. In February and following months this divergence is eliminated, and leaf N attains similar values, irrespective of levels of application; its value falls to a minimum in May.
It is interesting to note the common tendency for increasing dressings of P and K to depress leaf N.
Phosphorus
The regression of P on time seems to be of the same order as the one observed for seasonal variations (chapter 6), irrespective of types of fertilizers. Differential dressings of K appear to have no significant influence on leaf P, although it is interesting to observe that there is a consistent tendency for low K to be associated with high leaf P. At low dressings of N leaf P is significantly higher in January and February as compared with intermediate and high N, and vice versa; this effect tends to be continued in subsequent months; this agrees with the data of the pot trial.
When considering the influences of differential dressings of P fertilizer on leaf P the graphs show that the maximum application of P results in a much higher concentration as compared with intermediate and low dressings of P; in July this difference becomes non-significant. It is most interesting to note that in January leaf P, according to table 18 is i£ to 2 times that of the normal level associated with healthy vegetative condition. With the advance of time these limits tend to rise to 2.5-3 times in July.
Potassium
In general the regression of most graphs is basically similar to that observed for seasonal variation (chapter 6). It may be observed that the lowest dressing of N fertilizer is associated with the highest concentrations of leaf K and vice versa. This order is maintained through the season until June. The effect is significant only in January and February, when leaf K is critical at low N. The K concentrations are depressed with time and the deficiency level is reached in March.
Somewhat different paths may be observed for the effect of P applications on leaf K. On these occasions intermediate amounts of P tend to be associated with relatively high leaf K concentrations in the critical zone. At this level of P dressings, deficiency of K develops in April.
When considering the influence of the early K applications on leaf K it may be seen that intermediate and high levels are able to maintain the leal concentration within the critical zone (shaded area) until March and April, -<-
The month-to-month variation of the concentrations of leaf K, leaf Ca and leaf Mg at differential applications of N, P and K fertilizers (% dr m)
99

respectively. The low level of application is consistently associated with the region of deficiency. Differences remain significant until May.
It is noteworthy that leaf K remains at, or close to, deficiency levels; high K and low N, and intermediate P seem to have a similar favourable effect on leaf K. On all occasions a sharp decrease of leaf K may be observed, beginning in the first half of March and ending in June, irrespective of levels of N,P or K fertilizers.
~ , Figure» ine month-to-month variation of K/Mg and N/K as affected by applications of N, P
and K fertilizers ioo
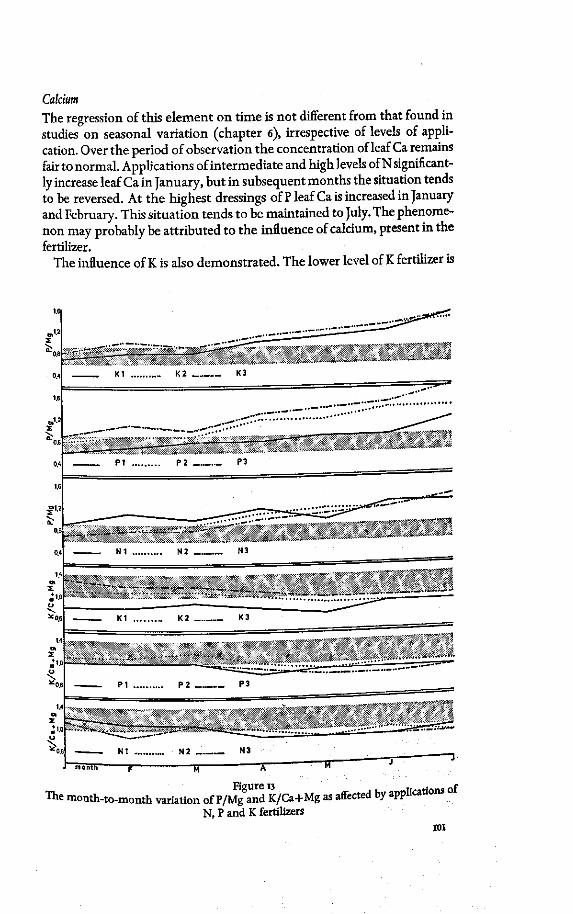
Calcium The regression of this element on time is not different from that found in studies on seasonal variation (chapter 6), irrespective of levels of application. Over the period of observation the concentration of leaf Ca remains fair to normal. Applications of intermediate and high levels of N significantly increase leaf Ca in January, but in subsequent months the situation tends to be reversed. At the highest dressings of P leaf Ca is increased in January and February. This situation tends to be maintained to July. The phenomenon may probably be attributed to the influence of calcium, present in the fertilizer.
The influence of K is also demonstrated. The lower level of K fertilizer is
TTie month-to-month variation of P/Mg^nd K/Ca+Mg as affected by applications of N, P and K fertilizers
101

associated with high leaf Ca. This situation is maintained throughout the period of observation, but without significance. This effect of K is not unexpected because K and Ca are antagonistic ions. In this context it is also interesting to observe that a sharp rise of leaf Ca from March to above-normal levels in April coincides with the simultaneous depression of leaf K.
Magnesium
For this element the regression from January to April/May generally coincides with that found for seasonal variation. From May to July leaf Mg tends to fall near the critical level. In general, leaf Mg does not attain normal levels, but varies within the region associated with fair concentrations.
The highest application of N fertilizer coincides with an increased level of leal Mg m the fair region. This is significant only in January. The situation remains stabilized until May. From this month to July leaf Mg falls gradually to reach the critical level.
The effect of P and K fertilizers on leaf Mg concentration is rather similar. Low dressings of P entail significantly higher levels of Mg throughout the season as compared with intermediate and high P. As for Ca this may be attributed to the antagonistic effect of Ca in the P fertilizer. Similarly, the lowest K level ,s associated with a much higher, almost "normal" concen-rationofleafMg The effect of K -Mg "antagonism" may be observed in
mis case. At both other levels of K, the concentrations of leaf Mg are ot the same magnitude.
Most interesting appears to be the development of leaf Mg concentrations from April to July. Whereas for high and intermediate applications ZeriM TCUTg ! ? W e r c o n c e n t ™tion of leaf Mg does not vary ap-K d W t h r ° U g h 0 U t ] h e e n t i r e Period of observation, the lowest level of Me Z ? 7 S S C T e
Ld T t h a r e l a t i v e l y s h a ' P ^11 over this period of leaf
-oird^t^t1??to cT n t r a t i o n s — p - b i e - t h r natb, nfUrlr f dressings. It is interesting to observe that the aPnd Ca M . ' ? ^ M g ^ time * fi& " SW* domination of K-Mg
^S^SSSS"over that of Ca~K at values of leaf Ca between
8.5. THE EFFECT ON IEAF RATIOS
mav be caTrnW 7< ** S " * ° f t h e 5 m a>' o r e I e m e ^ appropriate ratios S ^ n n S S C •• ^ ^ I8)- T h C r C S u l t S a r e Presented graphically in ^ ^ ^ ^ T f Tif M S 0 d a t e d " * * t h e r a t i o s h a v e been included ment S on ^ * * n 0 t o d t h a t t h e P r e s e n c e o r a b s e n c e o f t r e a t ' r a t h e r Z i n d S * T T * T" V a l u e S h a s n o s i g n i f i c a i * meaning, but is d r e S ^ X ^
It ma v J I I ? C v a n a t l o n of ratio values. or a S n t concTnf * **?*>ValueS t e n d t o b e " " ^ t e d with critical
deficient concentrations. Generally, the graphs seem to move towards

values associated with more severe deficiencies with advancing time. An exception appears to exist for the ratio K/Mg; it falls to a minimum in May and rises again to reach critical levels in July, irrespective of application.
The values for log N/P indicate a consistent relative deficiency of N and an excess of leaf P. The heaviest dressing of N appears to be associated with its highest value. Heavy P applications tend to depress the value, whereas the nil treatment ameliorates the situation. Over the entire period, the adverse influence of increasing levels of P seems to remain present; in contrast, the influence of differential N levels apparently becomes neglige-able with time.
K dressings seem to have no appreciable effect on log N/P. When the ratios N/K, K/Mg, and K/Ca+Mg are considered in association
with K deficiency, the results suggest that high N tends to push the value of these ratios beyond deficiency limits. The reverse tends to be true for low and intermediate N.
Applications of the intermediate P treatment seem to have some favourable effect on the value for K/Mg. A similar influence may also be present for K/Ca+Mg and for N/K.
As can be expected in cases of K deficiency, the heaviest dressing of K should entail the most favourable effect on the 3 ratios. The effect of intermediate and high K is largest in the case of K/Mg; ratio values at these levels of application tend to fall somewhat from April to May, but they do not seem to attain the zone of deficiency; in fact, at all levels a tendency to rise towards fair levels may be observed as from May. This appears in its most pronounced form for low K.
In contrast, values for N/K and K/Ca+Mg seem to be associated with a different trend. Heavy and intermediate K applications appear to be associated with a shift from fair to deficiency levels for N/K in July. Similarly, the higher 2 levels of K fertilizer may be related to K/Ca+Mg values which are deficient by April. These aspects indicate inadequate supply of K with respect to N and Ca+Mg during fruit development.
In the case of Mg the intermediate and high treatments of N tend to have a relatively more favourable effect on the value of log Ca/Mg than light dressings of N. For P/Mg there may be a similar effect of N, but in April and at high N dressings the ratio value tends to pass abruptly into the zone or deficiency. There appears to be no appreciable influence of differential JN applications on the value oflogN/Mg, except in June. ,
The low P treatment tends to show the most favourable effect on log Ca/Mg. For this value each P treatment seems associated with a lamy regular path towards July. At the lowest application of P the value tor P/Mg appears to be maintained with the critical zone, whereas a deviation into the zone of deficiency is observed in April at the intermediate and high P levels. , ,.ff r
The influence of dressings of K on P/Mg does not appreciably differ from that of the upper two levels of P; a sharp deviation into the zone ot ae-
103

06
I*
V a.
o -J 08
0^
• P i
"7, j - * . .
N l
month p —
••••• P2 P 3
—
•••• N2 Z T ~ N T ~
' * • • • . . . . _ . . - •
" , *
"•**~ :s*»'»«-. . .^ l , ,
'' A „ j - - - j

ficiency appears to be present, irrespective of K levels, although low K tends to have a more favourable effect. This may be explained by K-Mg "antagonism". Low K seems also associated with fair values for log Ca/Mg, whereas high K tends to shift this value into the critical zone. The intermediate and heaviest dressings of K tend to be associated with a shift of log N/Mg from fair towards critical levels. As may be expected low K tends to suppress the development of ratio values associated with Mg deficiency. When the ratio K/Mg is considered with respect to Mg deficiency it appears that high K, intermediate P and low N seem to push the value from below normal to normal levels.
It is interesting to note that log N/Mg tends to be maintained at normal values irrespective of levels or fertilizer, bearing in mind the apparent N deficiency and fair levels of Mg concentration.
Log N/P indicates a large excess of P with respect to N. The value for log Ca/Mg with respect to leaf Ca seems to indicate normal leaf Ca at low supply of K.
8.6. DISCUSSION
The results of application of the reference values in table 18 to N, K and Mg data of the field trial fairly accurately coincided with the results of visual deficiencies of these elements. The graphs indicate the time when N, K and Mg supplies should be present in sufficient amounts to meet the physiological requirements for fruit development and for the foliage. The N demand remains at a high level throughout the season, whereas that for K becomes most pronounced as from March and that for Mg from April onwards. Under the prevailing mode of timing of the nutrition the relatively high levels of N and K fertilizer and the dressing of dolomite were unable to meet the nutrient demand associated with the yield and with the maintenance of healthy vegetation.
Generally, the data show that the application of i, 2,3 or more nutrients in fertilizers entails the onset of a dynamic process in which upward and downward adjustment is possible. In accordance with the data, different levels of application may produce conflicting effects on concentrations and ratios associated with one deficiency. This implies that the rise of leaf concentrations depends on the net results of the interaction of direct, antagonistic, synergistic and dilution effects brought about by the supply of all elements.
Consequently indiscriminate application of nutrients may disrupt the sensitive balance of nutrients within the plant. This may appear to be ot particular importance in the region of accumulation, where small changes
• « -
Figure 14 , ,. The month-to-month variation of some logarithmic values of ratios ^tween^'iar concentrations of major elements, as affected by application of N, P and K lernuzers
105

in concentration are likely to coincide with relatively large changes in the balance of elements.
8.7. CONCLUSION
From the data in this chapter the following conclusions may be drawn:
a. The selected sampling leaves are sufficiently sensitive to reflect changes in the supply of mineral nutrients caused by direct or interaction effects ofN,P,K,Ca and Mg.
b. Leaf concentrations of N, P, K, Ca and Mg may be satisfactorily adjusted by considered applications of selected fertilizers, containing the respective nutrients.
c The delicate nutritional balance within the leaf may be satisfactorily controlled by systematic consideration of leaf concentrations and ratios.
d. The timing of nutrient applications in the present system of fertilizing does seem inconsistent with respect to the actual demands for specific nutrients, and promotes a completely unbalanced leaf composition.
9. PHYSIOLOGICAL EXHAUSTION AND YIELD STABILITY
It was mentioned earlier in this work (chapter 2) that maintenance of an adequate production potential of the vines constitutes the major cropping
Sv . 1 f / , P r C f f - 7 h e o c c u r r e n c e of ^vere deficiency symptoms, mas-«ve leaf fall and die-back of branches of mature vines, grown under com-
s T a e l C ° m ° n \ U S U a U y d u r i n § t h e first s e a s o n of abundant cropping, n a ™ T T 1 V e P hy s i o l°g i c a l exhaustion of the plants. These phenome-Z Z e T u K T T l r e d u C t i ° n ° f t h e c r°PP i ng Potential. Thus, yield nresenY ? § ^ ° f P r o d u c t i o n does not seem quite possible under cause I v T T ' L C ° n d i t i o n s - Observations indicated that the prime
f e r t i l e ™ ! . ' , ) ; t h e ° v e r a 1 1 d a t a suggested poor timing of n u t i n tM T k t i 0 n t 0 t h e a c t u a l c r °P demandsand loss of soil nutrient (cr. par. 2.1.6.2A mode o S , -Ce ° . ^ ^ ^ n U t r i e n t application in traditional S ^ T ^ SUuPPly ° f n U t r i e n t W i l 1 b e u n a b l e to support a high c a n l v Th ! n§ ?*"* b e r r i e s /vine/year, simultaneously with a healthy lossT/nutrient i t C S l t U a t i ° n * f u r t h e r ^ v a t e d by appreciable marimum d emand 1° " w ^ " ^ * * * t 0 a n d d u r i n g ^ period of maximum demand when the fruit develops and ripens.

In order to examine the interrelationship of annual high productivity of some 18 kg of green produce/vine, concurring physiological condition and accompanying foliar composition, some simple studies have been made. The principle underlying the approach concerned the relation of nutrient concentrations in the leaves, the vegetative condition of the vines in the physiologically important months of January, April and July, and the crop yields in July and those in the following year. With regard to its morphological buildup and fruiting habit the production capacity of a pepper vine may only be maintained, if the number and the length of the fruit-bearing branches are not appreciably reduced.
9.1. EXPERIMENTAL DETAILS
Six groups of vines were selected in January and April. Each group included io mature, producing vines of uniform age and external appearance. Five January groups were selected in a single garden and yielded 4-10 kg of green produce/vine, whereas 1 group was selected in a nearby garden, yielding an average of 15 kg of berries/vine. All vines, irrespective of gardens, exhibited a healthy full canopy of leaves; symptoms of nutrient deficiency were absent.
All vines selected in April were located in a single garden. The foliage showed mild symptoms of N, K and Mg deficiency, but seemed otherwise healthy. The crop-yields of the April groups ranged from 5-16 kg of green berries/vine. In July, only 3 different types of vines were selected; each type was represented by groups of 20 vines. Types differed by their rate of leaf abscission and general appearance; all 3 groups displayed N deficiency, but die-back of branches was almost absent. The vines of these groups were selected in the garden adjacent to that of the April group.
At the time of selection all 15 groups possessed a maximum number of main branches; the frame-work of secondary and higher order branches was similar for all vines.
The vines selected in January have been sampled in January, April, July and the following January. These groups shall be referred to as "the series 1". Vines selected in April were sampled in that month, in July and in January and are referred to as "the series 2". Groups selected in Juty were sampled in July and January and shall be referred to as "the series 3 . Yields were recorded in the 1st year and in the following year. Commercial fertilizers containing N, P, K, Mg and lime were supplied to 5 groups in the series 1 in the traditional fashion at comparable rates; to a single group ot this series N, P and K were supplied only. All other groups of April ana July received N, P and K only. The values of table 18 have been used tor classification of leaf concentration.
The results of analyses have been plotted against time of sampling and are present in figures 15 and 16. In addition for each series the yields, ana estimated leaf fall and die-back in July have been presented.
107

Jan Jan April July
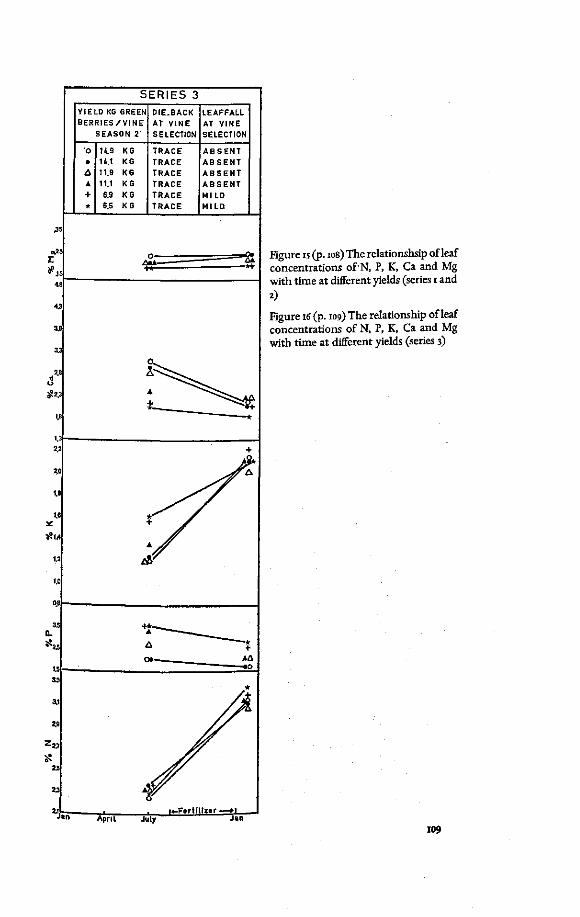
Figure 15 (p. 108) The relationshsip of leaf concentrations of N, P, K, Ca and Mg with time at different yields (series 1 and
Figure 16 (p. 109) The relationship of leaf concentrations of N, P, K, Ca and Mg with time at different yields (series 3)
109

9.2. BEHAVIOUR OF THE 5 MAJOR NUTRIENTS
Generally speaking, the foliar concentrations of N, K and Mg tend to be critical to deficient except in January shortly after fertilizing. In contrast, the concentrations of leaf P and leaf Ca tend to rise to excessive levels in July; they fall again to more normal concentrations from July to January following N, P and K applications of fertilizer.
Variations of leaf N with time
In January a normal level of N in the leaf (3.14%) seems related to a yield of 14 kg of green berries/vine in July. At this latter time leaf N is low and the tissue exhibits visual symptoms of N deficiency. After fertilizing, leaf N rises to normal again in the following January.
Intermediate and low levels of yield in July are associated with critical N levels in the preceding January, but also with a relatively less severe deficiency in July. Concentrations are restored to fair in the following January, but appear somewhat lower than those related to the highest production in the preceding July. A similar path may be observed for the N curve in the series 2, and values are of the same order, irrespective of time and location.
Variations of leaf P with time
Leaf P in the series 1 seems to have a fundamentally different relation to time from that of the series 2, at a production of more than 13 kg of green pepper/vine. Whereas in the series 1 leaf P rises steeply from normal in January to 0.32% in July and falls to 0.24% in the following January, in the series 2 leaf P falls slightly with time from 0.23% in April to 0.21% in July, and to 0.17% in January. When comparing data for series 2 and 3 it seems that the depression of leaf P to levels below 0.20% is an important phenomenon associated with production of substantial yields in consecutive years.
Intermediate and low levels of production seem associated with a leaf P concentration of 0.20-0.25% in January, 0.27-0.35% in April, 0.30-0.36% in July, generally falling to values above 0.20% in the subsequent January.
Generally speaking, it seems that normal leaf P in July and the following January entails a high yield in the subsequent season; conversely, rising concentrations to above-normal leaf P in April and July result in a low yield in the following season. Sometimes this relationship is not clearly differentiated, as may be expected, since P levels remain generally at above-normal levels.
Variations of leaf K with time
What is most striking is the difference in leaf K in July and the accompanying rate of restoration of this level in January for series 1 and 2 at a similar production of 14 kg of green berries/vine.
In both series leaf K appears to be too low in April; towards July leaf K tails to 0.82% in senes 1 and rises to 1.30% in the following January, similar to
no

the value found at the initial sampling. In the series 2 leaf K is depleted to a level of 1.03% in July, while the level is restored to 2.03%; this is considerably higher than in the preceding April, and some 50% more than in the series 1. In series 3 a similar restoration may be observed. The difference in K depletion for the series 1 and 2 may be attributed to the different original K concentrations in the leaves.
Generally speaking, the graphs show that higher yields are associated with lower leaf K, suggesting a non-compensated drain of this element from the leaves. It is interesting to note that in the majority of cases in the series 1,2 and 3 leaf K for both high and low yields in July is associated with a rather restricted variation of levels of leaf K at the fourth sampling, irrespective of the preceding yield, if leaf K in July is above 1.00%.
Variations of leaf Ca with time
In the series 1 the highest yield relates to a concentration of leaf Ca of 1.30% in January. This rises to a maximum of 3.00% in July. After application of K
0.81— 1.3 15 17 19 2.1 23 2.5 2J 23 3.1 3.3 35 3.7 39 A} A3 AS A7
% Ca Figure 17
Leaf K in relation to leaf Ca
in

fertilizer leaf Ca is depressed to 1.70%, irrespective of preceding yields. Prior to harvesting the lower yields in this series are related to relatively low concentrations of leaf Ca. These concentrations are nevertheless well above-normal.
In the series 2 leaf Ca in July and the depression to January are similar to those of series 1, at a yield of 14 kg/vine. The peak in April of leaf Ca may be attributed to a fresh application of lime in the preceding January. In the series 3 leaf Ca in July is similar to that of the series 2. The concentration reaches a level of 2.00-2.25% in January in most cases; this is of the same order as in series 1 and 2.
The data of fig. 17 show the presence of K—Ca antagonism, but the effect diminishes considerably at leaf K values of 2.00-2.30% and at leaf Ca levels of 1.65-1.75%. Fig. 18 demonstrates antagonism of Ca-Mg, which becomes operative particularly at a leaf Ca concentration below 1.75% and values above 0.25% for leaf Mg. Apparently, antagonism of Ca—K and Ca—Mg only functions when leaf K and leaf Ca, respectively, decrease in concentration, subject to critical threshold values. Increased Ca uptake does not necessarily actively depresses leaf K, if Ca fertilizer is applied. This indicates that low leaf K generates compensation by Ca uptake.
Variations of leaf Mg with time
High and low yields in the 3 series may be associated with leaf Mg concentrations varying from 0.15-0.35%. Leaf abscission is associated with critical
0.75
70
.65
.60
.55
.50
s.45
^.40
.35
30
25
20
.15
0.10
RECEIVED Ca DRESSING
< 0
0 7 °9 " U « " » 2< " 2.5 27 2'.9 31 3.3 3.5 3.7 39 41 43 45 47 4* To Ca
Figure is The relationship of Ca and Mg in leaves
112

levels of Mg in the leaves. This phenomenon tends to increase with lower levels of Mg and may become appreciable at levels of leaf Mg below 0.20%.
Leaf Mg concentrations show a general decrease from April to July, if preceding levels are fair. This tends to agree with earlier observations (chapter 6 and 8). If the Mg concentration is in the low-critical region throughout, little appreciable variation in time is observed.
The observed decrease is relatively mild if the Mg supply maintains leaf concentrations above 0.25%; in this case restoration after harvesting to the original levels may be seen (series 1). The fall is pronounced and only minor signs of the subsequent restoration may be observed, if leaf Mg decreases below 0.25% (series 2 and 3).
The data of figure 19 suggest that a "synergistic" mechanism operates between K and Mg in the leaf at values below K = appr. 1.90% and irrespective of time and location. This phenomenon is apparently reversed to "antagonism" of the 2 elements above that level. At liberal supply of Mg and
4.8
4.6
4.4
42
4.0
as 3.6
3.4
3.2
3,0
2.8
X 2.6
2.4
22
2.0]
1-8
1.6
1.4
1.2
1.0
OS 0.15 .20 '.25 30 .35 .40 .45 .50 .55 £0 .65 .70 J5 .80
%Mg
The relationship of leaf K and leaf Mg foftaifting and non-limiting supplies of these elements (% dr.m.)
m

K to the plant, the antagonistic relation is maintained, at higher levels of leaf Mg and leaf K. Under these conditions the same critical level of leaf K is associated with 0.66% leaf Mg as compared with 0.35% when Mg is in relatively short supply.
9.3. IEAF COMPOSITION AND YIELD
9.3.1. LeafN,leafPandlogN/P
In the figs. 20 and 21 the concentrations of N and P have been plotted against the July yield in the season 1 and 2. This presents a more direct impression of their interrelationship with time.
The path for leaf N in January appears to be positively related with the subsequent yield (fig. 20). This effect is absent in April and is negative in July. In the following January the leaf N relation may or may not be clearly related to the effect of the fertilizer applications. It demonstrates that recovered leaf N in January may be considered as largely independent of prior yield.
_ 3.1 E
23
^ 3 j D
E
s? 2fl
a.
SERIES 1
JAN 1 JAN 2
SERIES 2
APRIL JULY
V
r\ •••-.. / *•»/
YIELD KG GREEN BERRIES VINE
Figure JO The relationship of yield size and leaf N, leaf P and log N/P in season i
114

oa' C
3
o B •3' OOH
< 2
a Cfl
N' fD S» a a
fr B, Z
n
H —
o OR
^ ^ 0
B « n> 8 o s
:* o (Q<
O -no" m m - ., Z ~
S* 33 _^ 3) U '
m
<3r
m O).
«*!•
CO-
tO-
o' M - *
LOG N / P % P (%dr.m.) P P .— r* .— N W
% N ( % dr.m.)
£f a B e a a
'••..
s
H5

The relationship of leaf N in January and the yield in the second season are somewhat at variance with those observed in the first season (fig. 21); in this case N values show a non-systematic variation between 3.1 and 3.3%.
Leaf P shows a negative relation with the size of the first season's yield, irrespective of time of sampling. In April and July P levels increase up to 50% of their original value. In series 1 and 2, at a yield of some 14 kg of green berries/vine, a marked difference may be noted: in the series 1 leaf P shows an abrupt rise to approximately twice the value for lower yields, whereas in the series 2 this effect is absent. In contrast to that of leaf N, January relation of leaf P to preceding yield is much similar to that of the previous July. This effect is independent of application of P fertilizers, as may be observed by comparing series 1 and 2 in fig. 20. The severe yield reduction from the highest yield in season 1 to the lowest in season 2 (fig. 15) is associated with
0.45
.35 a
X
$ 2 5
0.15
<.8
O
3.81 «3.3 u
*2>\
2.3
1.8
1.3
23
2.1
1.9
1.7
1.5
*1.3
1.1
0.9
0.7
SERIES 1
X/'"~
SERIES 2
YIELD IN KG GRE^N B E R R I E S / V / N E ' '
Figure 22 The concentrations of K, Ca and Mg^n"leaves in relation to yield in season 1
116
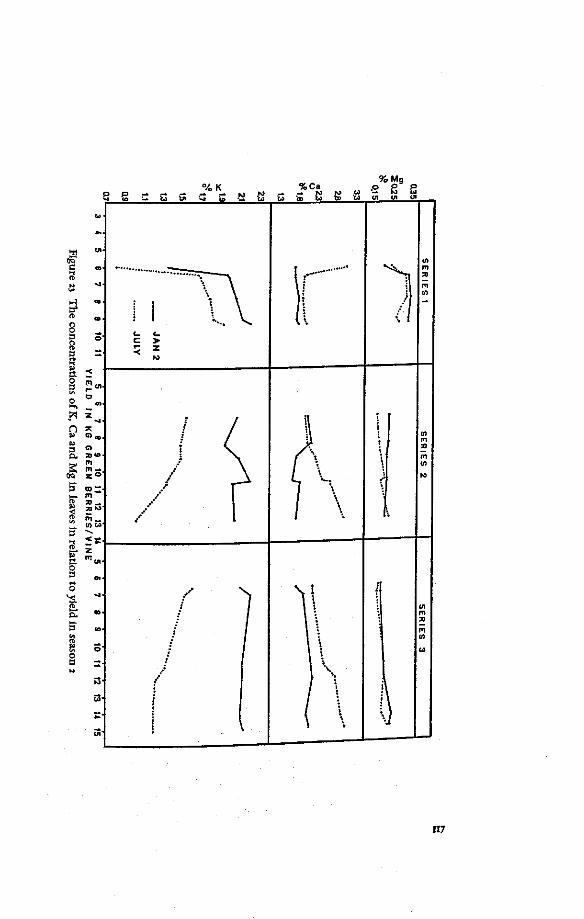
o
%K 6= r* rt fit •- •-
%Ca _» _» IO W 00 to
D P
51 90 c
3
ni —
0 a 0
„«
n v &> a a K
4Q
B' 1—1
> ' 0
ov Z
«J<
X 0 a .
a 5] 10 m z=> < " — •
m
z
o 3 - •
c r--<
117

the concentration to leaf P (figs. 20 and 21). It implies that foliar P may largely influence potential yield formation.
Negative relations may also be observed for leaf P during July and January, when plotted against yield in season 2 (fig. 21), indicating consistency of relationships irrespective of seasons. As according to the data, leaf N concentrations are generally not consistently related to yield, this relation is not suitable for yield prediction. With reference to N - P antagonism (Ch. 7) it seems appropriate to examine log N/P in relation to yield.
The value of log N/P and the first yield show most interesting, positive and smooth relationships (fig. 20), irrespective of month of sampling, vine location, season or of current fertilizer practices. Exceptions appear to exist for the values of log N/P at the higher yields in series 1. It may be observed that in July and the following January the ratio value associated with 10-15 kg/vine tends to be appreciably lower when compared with the values at yields less than 10 kg/vine. At a similar yield in the series 2 this effect is not found.
Plotting of log N/P, associated with the July and consecutive January sampling, against the yield of the following season (fig. 21) shows the same consistent effect as observed before. It may also be noted that the deviating value of log N/P in July (at the highest yield) is now associated with the lowest yield m the approaching season and appropriately fits the relation-
Reviewing all data it seems that log N/P reflects yield expectation much more consistently than N and/or P concentrations, both in qualitative and quantitative respect. Thus, January values should be maintained at 1.26 for crop yields of 14 kg of green berries/vine in that year and should not fall below a value of 1.0 in July to maintain a similar yield in the following season. * the va ue falls below 1.0 in July, the approaching yield will be much reduced A production of only 7i kg of green berries/vine may be induced when January values for log N/P equal r.oo; in this case July values tend to decrease to a value of 0.85. This is associated with a value much below normal in the subsequent January and with a similar low yield as in the preceding year, under the given conditions of traditional crop nu-n r l r ; E*S e ,n t i a l ; \ e e m s t o b e maintenance of log N/P above 1.00 in July to S o s e l . f y ^ m u t h e f ° U 0 W i n g S e a s o n - C r ° P Production between
£^SS£££3£*by ****** « * * ~ < <*** N/p
9.3.2. K, Ca andMg
I n X o f f1 tht %Uref * a n d 23 i n d i c a t e t h a t ***** the yield range from Stions IZTv TV™'the h iSher J*"- are related to lower concen-es/vrnet , ^ 7 ^ - ' " t h e S e r i e s * *Y^ * *4 kg of green ber-
2s~2a l e i f K r c ™ of °-82 inWThis is a a similarly I^? 7 " ^ m the preceding April. In the series 2 at
similar yield the April value is appreciably higher than that of series 1; this n8

difference is continued towards July, when leaf K attains a minimum of 1.20%. There is a tendency for an increasing relative depressive effect of higher yields on leaf K from January to July.
Yields below 9 kg/vine show a positive relation with leaf K. Increasing yields within this range are associated with higher K concentrations. According to data for leaf K in fig. 22 (series 2) this effect may probably be reversed if April levels of leaf K are 1.50% or below. Concentrations also tend to fall towards lower levels in July relatively more rapidly with higher production.
Restoration of K levels after fertilizer application to only critical concentrations in the following January seems similarly related to the preceding yield as the levels of the earlier samplings to the current year's yield (series 1 fig. 22). It is interesting to note that leaf K in the series 1 and 2, and under traditional modes of fertilizing, is restored to a value of 2.00% at a yield of 4* kg/vine, and to 2.10-2.20% at a yield of 4fr-rt kg/vine, if the K concentration in July was above 1.00%; when leaf K falls below 1.00% in that month, restorations fail to reach the critical value. The yield/leaf K relations in the second year of study (fig. 23) seem largely consistent with those in the first year. Up to appr. 9 kg/vine higher leaf K concentrations in July are related to higher yields, in the approaching season (series 1). Moreover, m ^ n t e -nance of leaf K above 1.7% seems to appreciably shift the lower yields ot season 1 to higher levels of production in season 2. The severely reducf-d
yield in season 2 due to extreme K deficiency in season 1 seems to fit the general trend (figs. 22 and 23, series 1).
When considering the series 2 and 3 (fig- 23) it may be somewhat s u rP r i s*ng' at first sight, to observe an inverse relationship of leaf K in July and the yield in season 2. Below 1.5% leafK concentration yields of over 9 kg/vine appear to be related to decreasing levels of leaf K. After application of K fertilizer, levels are restored to above 2.0%. It may be observed that the ensuing relationship is similar to that in fig. 22 series 2. There is however, also a reduction of some 25% of the highest yield in season 1; this may be attributed to die-back, which seems to be related particularly to low leat K. This effect is much more severe in series 1 when extreme K «haurtion reduces yield from i4 to s i kg/vine, when initial restoration ot leat * is inadequate. It may therefore be concluded: 1. that the inverse relation of leaf K and yield in series 2 and 3 is R e a d i n g
when one observes that adequate restoration of K c o n c e n i r ,
towards January may essentially re-establish the situation of leat K an
yield as given in fig. 22;
=. that more severe reduction of leaf K owing to abundant yields to the preceding season tends ,„ ^ . P ~ J £ £ j * 2 £ S £ £ t » spite considerable relative restoration of leat K to concerns rable to the preceding January;
ri9

3. that a concentration of 1.7 leaf K or more in July of season 1 tends to increase the yields of season 2, particularly at lower levels of production. The evidence presented suggests a close positive interrelation of yield
and leaf K. This seems to have no unfavourable consequences for an annual production level of less than 9 kg of green berries/vine and at relatively high concentrations of leaf K. This effect may be attributed to relatively mild processes of translocation.
The situation may become more serious at yields increasing beyond 9 kg/vine, or at initial low concentrations of leaf K, or both owing to a severe net drain of K from the leaves to the fruit. Despite a considerable previous withdrawal of leaf K, its concentration is generally restored to values above 2.0% in the subsequent January, which may be higher than at the beginning of the preceding season; but values do not generally show a shift into the fair zone.
The general situation may be very serious indeed if leaf K in July falls below 1.00% since according to the data, leaf K cannot be simply restored to critical levels or higher. Under conditions of a pronounced translocation of leaf K to values > 1.00%, concentrations of this element in the leaf in the subsequent January are related to the following relatively abundant yield, whereas exhaustion of leaf K to values < 1.00% appears to be associated with low yields in season 2.
In the series 1 leaf Mg remains within the limits of 0.30-0.35%. Increasing yields up to some 4i-7 kg of green berries seem to be associated with a higher concentration of leaf Mg. In contrast, beyond this limit it may be observed that the values for leaf Mg are, generally speaking, somewhat ower and relatively less affected by the size of the yield. The abrupt fall of
ieat Mg to 0.20-0.25% in series 1 may be attributed to neglected Mg supply rather than to an effect due to high yields. In this case, low leaf Mg is associated with the highest yield and with concurrent leaf abscission followed by a considerable yield depression in the subsequent season (figs. 22 and 23, series 1). ^ v
In series 2 a higher concentration of leaf Mg is related to a higher yield under conditions of critical or deficient levels of this element. When pro-auction data of the consecutive season are plotted against the leaf Mg concentrations 0f the preceding season (fig. 23, series r, 2 and 3), a similar trendmaybeobservedasinfig.22.FromJulytothefollowingJanuarysome restoration of Mg levels in the foliage may be observed in most graphs of
U 3 i , r ^ speaking, recovered concentrations remain below original levels in January.
leSAr^617 PrCSent Wi th r C S P e c t t o K a t t h e higher production atWer e ld r e n t r a t i ° n ^ ^ ^ ^ n ° r m a l a nd abo n o r m a l ValuCS
i n r i r wl C t i ° / e g e t a t i V e C° n d i t i o n the ratios of K> Ca and Mg seem to eriesnIt n 5 a nd eXCeSS ° f base e l e m e n* <*He 22). In the
series 1 deficiency of leaf K with respect to leaf Mg is indicated at all levels of 120

production, whereas ex t reme deficiency is indicated by the July value of the
highest yield.
9.3.3- Deficiencies
In this investigation values of concentrations of elements or ratios are seldom associated wi th classified no rma l or fair levels. Leaf N appears to be at fair levels in January only, bu t its concentrat ion falls rapidly towards deficient levels, t he mo r e so for t he highest yield. Leaf P is frequently in excess and log N /P indicates relative N deficiency. At any t ime between January and July leaf N is highly deficient, presumably because of t ranslocation to the developing fruit. Characteristic symptoms of N deficiency are observed to develop.
Similarly leaf K seems to be present at critical levels irrespective of t ime or yield. In t he majority of cases visual deficiency symptoms develod,
TABLE 22
K/Mg, log Ca/Mg and - in relation to crop yields in 2 successive seasons (the yield in kg green Ca+Mg
berries/vine)
Quantity K/Mg log Ca/Mg K/Ca+Mg
Month: Jan. April July Jan. Jan. April July Jan. Jan. April July Jan.
Identity of Object: Series 1:
Season 1 Season2 „ . „ n o n s no 3.5 kg 6.6 kg 5.5 5.0 5.8 6.8 0.70 0.69 0.82 0.79 0.9 0.9 0.8 0.9 4.8 kg 6.4 kg 5.1 5.1 5.3 6.0 0.62 0.70 0.79 0.73 1.0 0.8 0.7 .0 5.4 kg 7.8 kg 5.2 5.1 5.3 6.0 0.66 0.71 0.76 0.7 0.9 0.8 0.8 .0 7.8 kg 9.2 k l 6.5 6.8 6.8 6.8 0.71 0.80 0.86 0.73 1.1 0.9 0.8 .1
10.1kg 9.0 kg 5.3 6.0 5.6 6.1 0.68 0.78 0.88 0.97 0.9 0.8 0.7 1.0 14.4kg 5.9kg 5.8 5.9 3.5 6.3 0JBO_lMJMjM_J±Ji^JiL
Series 2: Season 1 Season 2 , „, „ n , n 7 0 7 0.9
5.6 kg 7.8 kg 6.8 8.8 9.3 0.92 . 0.96 • J7 0.9 8.3 kg 9.1kg 4.9 7.6 9.6 1-01 •« 0.91 fl8
8.8 kg 8.3 kg 5.4 8.4 8.6 0.92 .07 0.98 ^ 10.0 kg 10.6 kg 5.4 7.0 9.3 0.93 .14 0.92 H.6kg 10.4kg 4.6 6.4 10.6 ^ n o M 0.3 0.3 1.1 16.6 kg 12.7 kg 4.5 4.6 9.6 1-20 u 2 a 9 3 .
Series 3: Season 1 Season 2 , no 1 nn 0.7 1.1
6.5 kg 8.9 11.5 •» J-~ 0.7 L0 6.9 kg 9.1 11.8 \f Yoi 0.5 0.9
11.1kg 6.3 9.8 ° j • » 0.4 0.9 11.9 kg 5.8 10.0 -2 VU o 3 M 14.1kg 5.8 8.6 - 5 0.91 ^ Qg
14.9 kg 5.3 8.8 U 3 VJn
ia

particularly from April onwards. High yields are associated with excessively low concentrations of K in the leaves, if the original level in the preceding January is already low. Developing fruits demand much K for their growth and tend to drain all reserves, if an insufficient amount of this element is available.
In all cases except in series i at high Mg levels leaf fall is observed, relatively more severe with lower leaf Mg. Characteristic symptoms appeared on the oldest leaves first; the element is probably also translocated from these leaves to the first. In severe cases abrupt and uniform leaf fall may leave the vines standing with fruit only.
The nutritional situation in all 3 series indicates the presence of serious nutritional imbalances amongst major elements, particularly during the period of fruit development.
9.4. NUTRITION, VINE DETERIORATION AND YIELD DEVELOPMENT
The evidence presented suggests a remarkable potential power of recovery of pepper vines. This is demonstrated by recurrence of yields of some n j -16 kg of green berries/vine in consecutive years. The yields in table 23 suggest that under the present, adverse conditions of cropping and an upper limit of 9-ir kg of green berries/vine, yields of a similar or increasing size may be obtained in consecutive years. This low range is comparable to that of yield prior to 1940, with this notion that at present this yield is brought about at the annual expense of the vegetative appearance of the vine. In contrast, more abundant yields and assuming the same environmental conditions appear associated with mild to dramatic reduction of production in the subsequent year and much more pronounced and sometimes fatally severe plant deterioration.
The data indicate that physiological exhaustion develops due to a conflicting situation arising with respect to the mineral demand of the crop yield and of the canopy on the one hand and, on the other hand, by prevailing fertilizer practices under the influence of the monsoon rainfall. A particular need for N seems to exist from January to some time in July in all stages of berry development, according to the data in fig. 15 and chapter 6. Leaf concentrations rapidly fall to deficiency levels. Potassium, and to some extent Mg are in great demand, particularly from April to July, when berries rapidly increase in size and when they finally turn ripe. The fruit has relatively low requirements for Ca and P. Only small quantities of
TABLE 23
Average composition of ripe berries (cv. Kuching). (% dry mailer)
N p K Ca Mg
2-27 0.096 1.58 0.45 0.13
122
these elements are stored in the berries (table 23). This may partially account for the appreciable quantities which are accumulated in the leaves with progressing time. On the other hand, a proportion of this rise of leaf P and leaf Ca is likely to be due to antagonistic effects with respect to N and K, respectively. Storage of Mg in the berries, although limited, tends to depress the leaf concentration of this element over the period April to July, it leafMg is critical (fig. 11, Ch. 8). ^
As expanding fruit generally competes successfully with other plant organs to satisfy their demands for nutrients and carbohydrates deficiencies are likely to develop in approximate proportion to the level of shortage of nutrition, if the supply of adequate nutrients to the leaves is obstructed in some way. It has been shown in this study that increasing yields progressively drain away the reserves of N and K, frequently to levels ot extreme deficiency. This is reflected by the respective leaf concentrations. When yields are relatively low, this drain was found to be markedly less, in particular for leaf K. For the range of yields of 2J-7 kg green berries/vine higher levels of leaf K in January, April and July were associated with higher yields in that year. This result indicates that current yields can be influenced by the K supply to the plant. This effect is less consistent tor N
and yields in that range. , , iA-VP(!
Characteristic symptoms of N and K deficiency did develop on the leaves of the vines under study. The leaves rapidly turn yellow, early « February, indicating the development of acute deficiency. Dual symptoms have been seen when tip necrosis of K deficiency also develops. The leaves weakened and as a result of this their photosynthetic capacity is conaderaWy 1• duced. In this situation carbohydrate reserves in the plant are, to b tapped and whatever amounts are available to meet crop demands^aret^ ^ located to the growing berries. This translocation may entau branches, but at limiting supplies of reserve carbohydrates, the size berries would also be adversely affected. u„„ rhes without
Leaves of the above description may be retained on the b r*n c nf f i fa
pronounced leaf abscission, although their P h o t o s>?™ e ' a r e c r i t j c a l generally low. In those cases where concentrations ot ear g or below, light to dramatic leaf fall may be induced ^ j £ « W by the time in April. This phenomenon may or may not _ F ^ ^ ^ ^ development of characteristic symptoms ot Mg aeni. j l i e d
Mg shortage may be of a chronic or of an acute nature, if no Mg PP
to the plant. nnsidered the observed Whentheinterrelationshipsofbaseelementsareconj ^ ^ „ ^ _
"synergism" of K -Mg below a particular concentr for o t h e r base ele-gonism" above this concentration, is not uncom ^ 0f the effect ap-ments (PREVOT and OUAGNIER, 1956). For pepper, ^ ^ coincides with pears to occur at a K concentration of i - ^ - 0 0 * ; , fflay probably be the deficiency value found from the pot trial. 1 nev independent of K and Mg supply conditions Cpar. 9- ;• ^

The relation of K and Ca seems to be of an antagonistic nature at K values below 2.00-2.30%. At higher levels of leaf K, concentrations of leaf Ca seem to approach a fixed value of 1.50-1.70% if Ca is not deficient. The range compares appropriately with the normal value.
At leaf Ca below this rangeMg-Ca "antagonism" becomes operative. In brief the following scheme applies for K - C a - M g interrelationships,
it no visual symptoms are present.
1. Potassium
Concentration of leaf K < 2.00% K - C a "antagonism"
~ . „ K—Mg "synergism" Concentration of leaf K > 2.00% Ca constant
2. Calcium K -Mg "antagonism-
Concentration of leaf Ca < w.1% C a - M g "antagonism-Concentration of leaf Ca > w.7% C a -Mg "antagonism" de
creases; shortage of K and ofMg
Tconc!n^lly a g r e 7 ^ t h C ^ ° f c h a P t e r s ' a n d 8- Considering Mg S X T T T 1 t 0 / a S t a n d a P P r o a c h i n g Yield, increasing vllJs vdue a t l t . f u ° W °-3°^ r e k t e t 0 h i § h e r y i e l d i n - a son 1 and ,. This S s l e S a T T f " t 6 f r ° m t h £ P Q t t r i a L Extrapolation suggests leaf Mg at a normal value of o.45% for a yield of :5 kg/vine of catkin* Z t
g : f S U g g e S t t h a t l e a f K h a s n o d i r e c t e f f e c t ona c t u a l numbe r ^ s o c k t e d w ^ , C ° n C e n t r a t i o n W a r s to be in some way positively &refflTon rtUCUV ? S£aSOnS X and 2- P r o b ably K in the plant has a s u e l t ™ ,S1ZC- P r ° d U C t i 0 n " P ° S i t i v d y r e l a t e d to carbohydrates, c a r bohvd r aS7T , T T ! f 0 ™ ^ ' t h e flow o f < * » % produced ^ ^ ^ ^ d e V t p i n g f r U i t a n d o t h e r reserve organs with I p ^ n e s L T S ; UAu ° ( I 9 6 8 °> f ° U n d t h e P° s i t ive effect for K in S l a m n s ^ r S S e S ^ r p o r t a n c e * » high concentration of K in
Plant K ref la ted Z f T ^ m e n t i o n e d by P ^ V O T . He observed that piant * regulated the water relations and yield in oil nalm
p e p ^ e T n ^ d X i o l o f t h ^ T ^ I e S U P p I y ° f t h i s e l e m e n t > * * evident that causing a X ^ C T T * * " p k n t b r i n g i n t o a c t i o n a m e c h a n i s m
produaionK8' l6?^011- U n d e r n o r m a l c r o P c o » d * i ° n s the Lits £££?hydaS°° h S u f f i c i e n t * supply both developing
high c o n c e i l t f k T K 2 £ ^ ' ^ ^ ^ * " damaging effect On th J iu u dVasads for S U S a r s c a n b e m e t ™thont
t h e s a L o r W r ? o n r f ' ^ i n d u C t i o n °f abundant flowering at
this e l e m e n f S ^ t S " ^ bKKa8ed w h i c h e n t a i l s ^ g levels of entwithoutadequateresupply.Photosyntheticefficiencyismuch

reduced and consequently, production of fresh carbohydrates is severely limited. This implies that reserves must be tapped for minimum fruit growth. At severe withdrawal this may lead to the pronounced die-back of laterals. This evaluation suggests that, under these conditions, berries should be smaller. This had indeed been observed on many independent occasions. Apparently, maintenance of appropriate concentrations of leaf K in pepper plays a key-role in productivity. It is also evident that deficient and subnormal concentrations of N and Mg in the leaves would aggravate the situation.
Extrapolation of yield-K relations to more extreme yields indicates that for a yield of some 18 kg/vine, January concentrations of leaf K should be in the range of 3.10-3.30% corresponding with the normal value for leaf K. Translocation would reduce the level to approximately 2.30% in July. Substantial recovery for season 2 following application of fertilizer may be anticipated. A serious depression to deficiency levels should be expected (series 2, fig. 22) if the preceding concentration of leaf K cannot be appropriately restored to values corresponding with current or expected production. This implies that storage of leaf K early in the season may be worth considering.
Since K, Ca and Mg in the leaves act antagonistically or synergistically, difficulties may arise when severe fluctuations to values below 2% leaf K occur and when these elements are provided. In accordance with figs. 18 and i9, 3.30% leaf K in January coincides with a leaf Mg to OM%. Following diminishing leaf K during translocation processes and a sufficient plant-available supply of Mg the concentration of this element in the leaves may rise to 0.60%. Conversely, low supply of this element may lead to a level of leaf Mg of 0.35% or below. These phenomena may initiate antagonistic action of leaf Ca (fig. 17). The collected evidence on base relationships in chapters 7 and 8 and in this chapter with respect to leaf K and leaf Mg at K concentrations < 2.00% suggests that maintenance of a careful balance ot K - C a - M g is essential to prevent internal nutritional and physiological aberrations in particular at a low level of nutrition.
As a consequence of the preceding discussion it seems essential to maintain the crop plant carefully in a healthy vegetative condition; in case 01 high production, leaf concentrations of the major elements should be maintained at normal levels with concurrent control ot ratios Derween
elements. , . .__ Itmaybenotedthatyieldwasnotadverselyaffectedbysteeplyincre^ng
levels of Ca. The high capacity for buffering of this element may be related to the inherent high value for leaf Ca. A similar capacity for bufferingJias been found for other elements in different crops (PREVOT and OUAGNIER
' ^ ' s e cond important aspect of crop production is ^ ^ ^ ^ relation of leaf N and leaf P. According to the data of all s e n * ^ j f * « log N/P determines the magnitude of the yield in the first instance. A nigh
125

yield is systematically associated with a value of 1.26 for log N/P in January, which corresponds with the normal value obtained in the pot experiment (Ch. 7). For a high yield in the following season this value should not fall below 1.00 in July. In contrast, the lowest yield appears to be associated with a value of some 1.10 in January and of 0.85 in July.
At high log N/P and assuming a vine with a maximum capacity, a high yield may be present on the vine. Under adverse conditions of mineral nutrition this situation results in a dangerous depression of leaf N, leaf K and possibly Mg, whereas leaf Ca and leaf P show a concurrent, large increase. This development is usually accompanied by leaf fall in case of Mg shortage. Log N/Pmayfall to low values in July, owing to N-P "antagonism". This general physiological exhaustion may entail an appreciable degree of die-back of branches. A case of this type has been found in series 1 (low K, low Mg); log N/P reaches a level associated with a low yield in the following season; leaf N, leaf K and leaf Mg attained deficient concentrations. Concurrently, leaf fall and die-back could be observed. At lower yield this effect was not observed. In these cases leaf N and leaf P interacted towards induction of low yields, which did not drain leaf K concentrations.
The series 2 presented the opposite case. At a similarly high yield as that in the series 1 log N/P was maintained above 1.00 in July and rose, after fertilizing, to 1.26 in the subsequent January. During the first season the vines suffered from relatively mild die-back of branches, which accounts tor a fall m yield from 16 kg in the first season to 12* kg in the second season, owing to a decreased production capacity of the vines. Generally speaking, it leaf nutrient levels are allowed to fall below the accepted critical values, complicated nutritional abberations may soon be expected to develop with concurring adverse influence on present and future production.
9.5. CONCIUSION
Poor performance of vines was found to be associated with elevated leaf concentrations of Ca and P, whereas those of N, K and Mg were generally depressed to deficiency regions. Threshold values for N, P, K, Ca and Mg with respect to vegetative performance found in the field studies largely confirmed those of comparable denomination obtained independently trom the pot trial. This result corroborates the reference values proposed m table 18; it also supports direct extrapolation of reference values from pot trials to field conditions. Moreover, it seems that non-nutritional conditions in the field were not limiting the performance.
foliar diagnosis can be employed as a suitable guide for early detection of nutritional abberations in pepper. The leaf data indicate that throughout the season the balance of base nutrients should be carefully controlled; in tnis respect concentrations and ratios must be maintained in appropriate v S n ,1° yiC, f\The l e v d ° f P rod«ctivity can be manipulated by I n d t l ^ T, f l 0 g N / P ' b u t s i m ^aneou s l y leaf K concentrations and related Mg and Ca must be adjusted in relation to induced yield.
126

Bearing this in mind, it appears that in principle appropriate control largely amounts to maintenance of foliar concentrations and ratios within the range of fair to normal concentrations. Considering the severe drain of nutrients from the leaves and the serious consequences of it on vine life and cropping, there seem to be reasons to advocate the maintenance of leaf nutrients at probably above-normal levels by promotion of temporary luxury consumption prior to fruit development. In this fashion the vegetative portion of the plant itself is being used for temporary storage of a buffer stock.
From the evidence presented it may be concluded that physiological exhaustion and instability of yield may be prevented by adequate quantitative and qualitative nutrition.
io. AGRICULTURAL ASPECTS OF PEPPER NUTRITION
The development of serious physiological exhaustion of pepper vines, discussed in Ch. 9 is not surprising, if one considers the interaction of certain aspects of the mode of cultivation, of the conventional applications of fertilizers and of the environment. In this final chapter an analysis will be presented with regard to the agricultural aspects of crop nutrition, which are, since 1946, in actual fact based on a paradoxical combination of traditional views and the use of modern processed or semiprocessed fertilizers (Ch. 2).
The results of this examination serve as the points of departure for an attempt to synthesize an alternative mode of crop nutrition with the primary object to maintain a healthy vine condition, a high P ° t e n t i a l
productivity throughout the years of production, and to regulate the yield size. Finally, some basic recommendations will be presented in order to be able to formulate a suitable fertilizer policy.
IO.I. PATTERNS OF TRADITIONAL FERTILIZING
The method of traditional pepper cropping using burnt earth gave satisfactory results at a low, steady level of production, if there was sufficient land available to prepare liberal quantities of burnt earth and it adequate amounts of organic matter were present. The yields rose from some Ai*-*t kg of green berries/vine in the first year to some 9-n kg in the third year o Production. Within these two years the vine also supports vegetative growth to the top of the post which is reached in the third year of production.
127

The level of production in the third year is usually maintained for some 12 consecutive years without much variation. From the fifteenth year onwards the vines show a gradual fall in productivity. In the twentieth year the garden was usually abandoned. This final decline can probably be attributed to the fact that the surrounding, cleared land was stripped of its topsoil, to shortage of woodfuel and to lack of most of the essential organic material. In those days the farmer moved to a fresh portion of land for clearing and planting in a type of long-term shifting cultivation. An interesting aspect of this purely traditional method of cultivation constitutes the fact, that mild leaf removal was practised; hereby inner leaves were removed only to promote adequate ventilation to prevent diseases of fungal origine.
The pattern of regular intermediate yields is probably caused by the interaction of a medium value for log N/P and the absence of systematic, radical leaf removal at flowering time. An intermediate value of log N/P is most likely due to regular application of relatively little N with organic material on the one hand, whereas on the other hand extra P is applied in the burnt earth in easily available form, in addition to the substantial amount present in the traditional cakes (Ch. 2).
The canopy retained a healthy appearance throughout. This indicates that in the traditional system of applications an apparently adequate supply of the nutrients N, K and Mg is available for uptake by a proliferated rootsystem within a restricted space; however, it is unlikely that vines were able to maintain leaf concentrations at elevated levels.
Under these traditional prewar conditions the vines appeared able to strike a natural balance to meet nutritional demands of reasonable yields and concurring vegetative health, without apparent disruption of nutrient and carbohydrate metabolism. This assumption is supported by data in figure 22. The relative success of traditional cultivation may be attributed in part to the fact, that in a somewhat artificial fashion a suitable rooting medium was established. The rootsystem within this medium encounters good physical properties and moisture conditions. This promotes root proliferation enabling the roots to explore and utilize the nutrients in a most efficient way. This soil medium contains limited quantities of nitrogen, bases, phosphate and trace elements, but these nutrients are offered in a form ideally suitable for efficient uptake. Additions of N and P in leaf-mould or cakes stimulate active root development, while regular applications of this organic material and burnt earth ensure continuation of nutrient replenishment and of a desirable soil structure.
10.2. EARLY POSTWAR NUTRITION
In the period after 1945 the important transition from immaturity to the stage ot productivity is marked by 4 interacting conditions with a profound effect on the course of the life of the vine:
128

i. The drastic removal of healthy active leaves as an introduction to production.
2. The fact that abundant yielding and further vegetative development coincide.
3. The fact that usually the same type of manufactured organic fertilizers is used as during immaturity, although in much larger quantities amounting to some 9 kg/vine/year or more of a 7/10/5 fertilizer.
4. The fact that all the fertilizers are applied in 2, 3 or 4 split dressings at monthly intervals during 4 consecutive months of flowering out of a total of 9 months production season; the dosage decreases with each dressing.
Vines respond to 1, 3 and 4 by forcing out a flush of 3 or 4 new leaves, branches and flower spikes for each leaf removed. This particular technique entails a deliberate induction of abundant flower spikes to ensure a first bumper crop. When emerging, these immature spikes may or may not abort (Ch. 2). As evidence shows that a relatively high ratio of log N/P is related to abundant yielding, it appears that the value of this ratio determines which of the two alternatives is to be realized. In general, it may be stated that in any one year there are two interacting mechanisms viz the number of developing leaves and the value of log N/P which controls the ratio "actual abundance of flowering" to "potential abundance".
The following general picture of postwar nutrition of pepper in relation to cropping behaviour may now be evaluated. Leaf removal prior to tost flowering is followed by applications of usually excessive amounts 01 nign N/low P/low K fertilizer from September to December. This is frequently accompanied by additional dressings of inorganic N. These excessive a-mounts of largely N-containing fertilizers were placed in bands on eitner side of the vine. This intentional stimulation of a portion ot the root system under adverse physical soil conditions creates a well-defined eoec-tive rooting zone" and increases the "effective soil volume relative root concentration (FRIED and BROESHART). , . . t .
This technique results in an efficient utilization of whatever nutoents are available in the bands. Moreover, the band placement ^ u c e s l o * o t nutrients by rainfall and soil fixation, which is of particular importance low-graded fertilizers, when soil poverty prevails. l v a l u e
Besides the band effect on root development, N uptake ? f ^ ™ £ of log N/P to levels associated with maximum spike d™lo?™"*~{
results in near-maximum flowering when considering ^ * ^ * g leaves. Vines maintained a healthy appearance during the period ot spl
abundant amounts of N and K are required little^o,: no » » ™ ^ £ plied, as a rule, and rising demands are faced with f T ^ L ^ g ^ This implies that metabolism of the vine is entirely dependent
129

mineral nutrition on annual applications of fertilizer early in the season and, in the first year, on considerable plant reserves, built up during immaturity. Further aggravated by the additional effect of sub (2) this disharmonious situation entails an imbalance of supply and demand of nutrients.
The plant reserves of N, K and probably Mg become reduced to critical or deficient levels. This implies that translocation from the leaves to satisfy demands of the abundance of developing fruit can only be partly compensated by uptake from nutrients still present in the early dressings of the fertilizer. This entails vegetative vine deterioration. The large volumes of fertilizer, the relatively slow availability of nutrients and the efficiency of uptake from the band-placed fertilizers may probably be held responsible for the relatively limited degree of decline, without die-back of laterals, in the period from 1945-1954.
Under these conditions the growing of a bumper crop is realized at the expense of plant reserves; indeed, vegetative deterioration of the vine is invariably observed, whereas the fruit spikes and berries remain usually firmly attached.
The bumper crop in the first year is followed by a light crop in the second year, instead of the customary rise experienced in prewar cultivation. The observed yield decrease may be associated with the threatening deficiency of leaf N m July of the preceding season and the accompanying increase of leaf P with consequently a low value for log N/P in that month.
The yield in the third year usually showed a small increase due to limited vegetative recovery during the second year, of low yield, and to a terminal increase in size of the vine. Within this second year a relatively high level of N is probably maintained owing to a relatively low yield and similar fertilizer dressings as in the initial year of production, resulting in a high value for log N/P in July. For the third year of production this value for log N/P in combination with some leaf fall entailed a higher crop compared with the preceding year, but at any time lower than the bumper crop. Vine deterioration during fruit development in this year is more severe m relation to production than in previous years, and die-back may be observed due to a further decrease of net reserves of N and K and carbohydrates. As a consequence the production in the fourth year is again low. Thus the customary rise of production in early pepper growing was replaced by a systematic alternate bearing and gradual fall in yield. Apparent-nd,,hr
C , C ° ™ t l o n a l m ° d e of nutrition considered in relation to man-T^rZjf P a t t e ™ i n t r o d u « d the phenomenon of biennial bearing to a perennial crop, which normally bears annually.
10.3. PRESENT CROP NUTRITION
i t r i b e e H r n e 7 i 0 r a t i 0 n ° f t h e i m b a l a n « ofnutrientsintheleavesfromthat described under 10.2 must necessarily have even more serious repercussions
130
on crop performance. In the first productive year lower dressings of the customary high N/low P/low K fertilizers in the order of 2 kg/vine/year from 1954 onwards, instead of 9 kg in preceding years, in combination with considerable reserves in the plant, still induced an initial high yield, all other things being equal.
Apparently, the value for log N/P became still adequately high to promote abundant spike development in association with the mass of emerging leaves. Vine appearance in early stages is comparable with that of immature vines.
However, bearing in mind the heavy rainfall and soil poverty, soon after substantial fruit development was observed, at some time in February a rapid and severe deterioration begins to develop.
N, K and Mg are progressively drained from the leaves and probably other storage organs, when fruit development demands their translocation. In turn this leads to nutrient exhaustion. Considering that the vines are solely dependent on the limited nutrients supplied in the season, this implies that during nutrient competition, owing to development of the fruit, the vines cannot tap sufficient resources for adequate nutrient replenishment to the leaves. The concurring reduction of photosynthesis during this essential period results in a critical decrease of carbohydrate reserves. The net result of the overall process of translocation and replenishment amounts to severe physiological exhaustion in the first productive years as revealed by die-back of branches.
The deficiency of N over the season of fruit development usually concurs with a rise of leaf P; in consequence of log N/P decreases in July, which entails a low yield in the subsequent season. This one effect is further aggravated by the serious reduction of basic flowering potential.
It is evident that numerous transitional cases of deterioration must east depending on amount and type of fertilizer and on degree of J*" «movaL Under less extreme conditions it is not unusual that the final state or physiological exhaustion is delayed to the second or third year or pro tion. Under certain conditions leaf fall in May without die-back may^be effective as a natural form of leaf pruning, and, if subsequent conditions are suitable, a second good yield may be obtained. „j„,-rtnnof
Thus,development\fteri945islargelycharacterizedbytheprod^ abundant flowers followed by a bumper crop at the expense F reserves. The applied pattern of crop nutrition P f ^ ? * ^ ^ limiting factors and results in a complete and injurious disruption nutrient and carbohydrate metabolism in the plant. m,„lv>
The overall stiuation implies that the premature d e c l i n e ^ J ^ attributed to the fundamentally incorrect policy to induce initial ov cropping without appropriate adjustment of the ^ ^ ^ L d the prevailing conditions of soil poverty and climate. In consequence, y stability was seriously disrupted.

10.4. EVALUATION OF A NEW FERTILIZER POLICY
As a first step the agronomic implications arising from the experimental results and the field observations presented in this work are discussed below.
Manipulation of the value for log N/P prior to and during a period of flowering in conjunction with an adjusted removal of leaves from the lateral branches provides a suitable instrument to control the abundance of flowerspikes and the approximate size of the yield in the subsequent season. If an abundant yield is desired by the farmer, a value for log N/P of at least i.oo (table 24) in July should be aimed at by suitable modes of fertilizing; this should be followed by a relatively heavy removal of leaves (80-90% of the leaves). In the period from September to January, the application of fertilizer should be manipulated in such a way as to increase log N/P to a final value of 1.26 in January. In contrast, if a low yield is wanted, log N/P may be allowed to fall as low as 0.85; leaf removal should be relatively light or entirely omitted. The concentrations of leaf N and leaf P itself should be preferably maintained at normal levels although in practice values are more likely to vary within the fair range (table 18). Intermediate yields may be obtained by appropriate interpolation of values for log N/P (table 24) and by adjusting the degree of leaf removal.
In principle, control of log N/P may be assured by judicious manipulation of application of both nitrogen and phosphate fertilizers to the plant. The implications of soil poverty, high mobility of soil N, dependence of the crop on applied nutrients and considerable translocation of leaf N during fruit development suggest as the most appropriate policy to attempt to maintain leaf N at the highest possible concentration, whereas leaf P concentrations may be varied by suitable dressings of water-soluble P fertilizers, when required. The tendency for N—P antagonism to develop with net N depletion should be taken into due consideration.
Bearing in mind the origin of the present undesirable cyclical production and the inelasticity of pepper demands, the possibility of an a priori control of the abundance of flowerspike development by log N/P offers the important advantage for the grower to produce a crop consistent with expected economic demands and to maintain simultaneously the vines in a healthy condition.
TABLE 24
Reference values for l og N / P and yield expectation
Abundant yield Intermediate yield Low yield > * kg of green 5-14 kg of green < 5 kg of green
berries/vine berries/vine berries/vine
July Jan. July Jan. July Jan.
log N/P >1,0Q i.26 Q.85-1.00 1.26-1.10 < 0.85 1.10
132

It seems apparent from numerous field observations that the customary, frequent applications of high N/low P/low K fertilizers during immaturity of the vines ensures the development of a vegetatively healthy, vigorous vine. However, the time-consuming practice of intensive removal of flower spikes has to be carried out at frequent intervals. Appropriate regulation of the value of log N/P seems to offer an advanced method to control spike emergence. If this value should be maintained at approximately 0.85 it is most likely that very young inflorenscences abort. As leaf N should be maintained at normal levels for adequate vegetative growth, this implies that variation of leaf P by suitable fertilizers seems to be here also the more desirable practice.
When the aspect of the translocation of mineral nutrients under the influence of developing fruit is considered, it is evident that the problem of the nutrition of abundantly bearing vines seems essentially solved by the permanent maintenance of appropriately balanced concentrations of N, P, K, Ca and Mg in the leaves to ensure both adequate nutrient reserves and sufficient production of carbohydrates to meet substantial translocation from the leaves, and other organs, to the growing fruit. Net n u t r i e n t
withdrawal implies that the concurrent uptake of N, K and Mg should be proportional to the intensive drain from the leaves as an alternative to relative deterioration of the vines with, as eventual consequence, the development of physiological exhaustion, and at best, the induction or biennial bearing.
When attempting to maintain an adequate supply of mineral nutrients to the plant with due regard to the changing requirements of the crop an initial assessment with respect to the different components essentially affecting this supply seems pertinent to the problem. In this context the general views outlined in Ch. 3 are being integrated with the prevailing environmental and climatological conditions, which are used as the point of departure for discussion. , , . . . „„__i.
In the acid, largely kaolinitic latosol referred to elsewhere m thi work the adsorption complex is of low capacity and generally occupie1 by adsorbed Al and Fe, whereas the base saturation is usually low lhe^absorption capacity provided by organic compounds in the mounds ot clean weeded gardens is usually of negligeable importance.
The dilution of the soil solution in the periods of heavy rainfall ends to promote the release of whatever little amount of m 0 ^ ^ t u " present on the adsorption complex in favour * * ™ £ r * £ £ Z £ In turn, bivalent ions are replaced by the trivalent type. ^ ^ ^ the acid soils the monovalent ions, and to a 1 ™ extent thehvalent 0 * * have little prospect, if any, of being adsorbed in suffic ^ J ™ ^ ™ d the p a v i n g L d i t i o Z they may be • * £ £ £ * ^ S l S d o n effective rooting volume, since during most ol the seasong+ ^ +
exceeds evapotranspiration. Rapid leaching loss o t ^ 4 W e
therefore be anticipated under non-adapted conditions. This un 133

effect may be partially counterbalanced by appropriate techniques of fertilizer application.
In practice, the downward leaching of nutrients may be less than might be inferred from the rainfall data. This may be attributed to the relatively limited net infiltration due to poor physical soil conditions. Instead, most rainwater is subject to surface drainage and destructive erosion powers may carry directly away both soil and applied fertilizers, bearing in mind the traditional practice of clean-weeding. Protective measures to control the effect of the excessive rainfall seem therefore of great importance.
The inherent properties of the soil type suggest, that applied water-soluble P may largely be fixed. Moreover, loss of P due to net infiltration is of little significance (FRIED and BROESHART). This implies a gradual increase of soil P. There is evidence from field trials (Annual Reports of the Dept. of Agr. Sarawak) that there may exist a substantial residual effect of P applied to the soil. This indicates that under the prevailing conditions the fixed phosphate tends to be slowly released for uptake by the plant. No characteristic symptoms of P deficiency have been observed on this soil type and this suggests that the release of residual P is generally adequate to maintain leaf P concentrations above 0.10%. On the other hand, the situation also indicates the danger that regular indiscriminate application of P containing fertilizers may lead to excess supply to the leaf, thus disrupting N—P relations.
A second aspect concerns the influence of the poor physical soil conditions and of the presence of possibly toxic amounts of aluminium. The roots of pepper are somewhat restricted in their development, which is probably due to a dense soil structure and to retardation by toxic amounts of Al. (ROSANOW). The ensuing limited system of roots compared to the above-ground portion of the vine must supply all nutrients for growth and production. Despite the presence of water under low matric suction in soil channels, the mass flow and diffusion of nutrients from some distance to this limited root system is physically hampered; the poor phase geometry offers only tortuous pathways for the movement of water and ions towards the root system. The effect of this physical restriction on nutrient supply is augmented by dilution of the concentration of the soil nutrients. In turn, diffusion gradients are reduced and consequently less nutrient transport takes place.
Judicious liming and measures to increase the organic-matter content of the soil are likely to eliminate toxic concentrations of Al and to improve physical conditions of the soil. This, in turn, stimulates root growth and the formation of less obstructive pathways for the movement of nutrient ions towards the soil/root interface. Sudan grass grown on this soil in a pot trial without lime showed a strongly retarded root system, whereas additions of lime restored root and shoot growth to almost normal. (ROSANOW). Similar observations have been made of lime stimulating root development in pepper
134

The supply of mineral nutrients from the soil to the roots may also be indirectly restricted by climatological factors. The prevailing conditions of high rainfall and an almost permanent high humidity are conducive to reducing the rate of transpiration. This tends to diminish the rate of consumption of water by the plant, and, as a consequence, the mass flow of soil water and its dissolved nutrients to the root system is reduced.
The evidently unfavourable nutritional situation with respect to restricted supply from soil reserves in relation to crop demand may be counterbalanced by following the principles of "feeding the crop" for N, K and probably Mg, whereas P and probably Ca may be applied, if necessary, to increase soil reserves. This involves an increase of the active root volume, minimization of the physical distance over which solutes have to travel to the soil/root interface, judicial timing of supplemental applications of fertilizers, establishment of relatively high soil concentrations of nutrients and prevention of excessive leaching.
Appropriate reconciliation of the information presented in preceding chapters, and the implications of recent information from the literature on soil-root-plant interrelationships considered with respect to the prevailing conditions of soil and climate entails the formulation of the following basic conception for improved nutrition of pepper, i- The chemical concentrations of the 5 major elements in the leaves
should be checked by leaf sampling at frequent intervals, selected in agreement with the development of the physiological demand, particularly when approaching and during the stage of fruit maturation, and in accordance with the procedure worked out in Ch. 6. The number of samplings may be reduced, if it appears from experience that a new mode of fertilizing sustains adequate nutrient supply to tne leaves to meet massive translocation.
*• For sustained vegetative vigour, maintenance of fair to normal values ot N, P, K, Ca and Mg in accordance with the reference values; 0 a b k £ should be used as a general guide for adjustment manipula ions^ Wgn production requires normal levels of N, K and Mg early » ^seas^n, whereas towards the harvest, concentrations may beallowe but not below critical values. This implies the ^ N ^ " * " " "
of deviating concentrations and ratios and their timely correction.
3- Manipulation of leaf P in relation to leaf N may be ^ f " ° ^ h t c
value for log N/P either to suppress spike development or & crop size in conjunction with judicious leaf removal. ^ ^ ^
4- Unless Ca supply is inhibited, its concentration at leaf K.a ove ^ ^ . ^ not present difficulties. Appropriate hlfket.^Le s l o W i y available limestone should stimulate root growth and pro , y
n o t h a r m % simultaneously, whereas the increased uptake
Performance. «5

5. Introduction of large scale mulching practices of the mound to increase its organic-matter content, to retain soil N and to protect the soil and applied fertilizers from the impact of rain and from the effect of erosion forces.
6. The actual rates of application of fertilizers may be estimated by closely following the evolution of the value of the relevant foliar concentrations and ratios with respect to those of tables 18 and 24. In view of the appreciable loss of nutrients which may be sustained owing to prevailing conditions and extreme soil poverty, relatively high total rates of application are recommended. It seems of essential importance that dressings are given at frequent, preferably monthly intervals in relatively small dosages, and in time with actual requirements as indicated by the results of leaf analysis. In this respect the accumulation of nutrients in the leaves by promotion of "luxury consumption" should be considered as an alternative to frequent applications.
7. As a rule high-grade, inorganic fertilizers should be employed. Their nutrients should preferably be released at a slow rate to a dense and compact root system to reduce the possibility of nutrient escape from the sphere of root absorption. If rapid adjustment of foliar concentrations is required, quick-acting fertilizers may be employed.
8. Consideration of conditions of climate, soil and crop growth imply that fertilizers should be judiciously placed in bands at a depth of some 10-15 cm in close proximity to the roots and should be covered with soil.
Provided non-nutritional limiting factors are absent, the basic approach to adequate nutrition offers the possibility of manipulated control of crop size, suppression of undesirable emergence of flower spikes during immaturity, the maintance of a continuously healthy condition, a sustained high productivity and early correction of the disrupted balance of nutrition.
10.5. CONCLUSION
From the results in this work it has become evident that the physiological exhaustion and the ensuing phenomenon of biennial bearing or even rapid total deterioration of the vine in the initial year of maturity may be attributed to the poor nutrition in relation to abundant production. The development of this situation can be prevented by introduction of the proposed policy of sustained supply of nutrients guided by control of the foliar concentrations.
The new procedure entails a fundamental and radical change from the hitherto followed "policy" to one based on actual demands and modern principles of crop nutrition. The necessary transition is likely to require quite some adjustment of the largely illiterate farmers. In order to offer the individual growers early benefits from the compilation of data in this work
136

the following modification of the basic concept is suggested as a practical fertilizer policy. i. The farmers should be advised as to economic crop control by judicious
removal of leaves and control of log N/P. 2. Fertilizer should be applied at regular monthly intervals in relatively
small quantities, or abundant dressings prior to fruiting to promote accumulation of nutrient reserves, or both.
3. The introduction of mulching and liming is essential. 4. The farmers should be advised as to the recognition of characteristic
symptoms of deficiency of N, K and Mg; they should be informed of the need to prevent the appearance of these symptoms of malnutrition.
5. For greater simplicity a basic fertilizer mixture should be prepared in advance; this should contain relatively high amounts of N, low P2O5, low K20 and intermediate MgO, e.g. 12% N, 5% P2O5,17% K20, A% MgO. When necessary, individual adjustments may be made by the use ol single fertilizers, as indicated by the results of foliar analysis.
6. Farmers should be advised with regard to the time of major demands for leaf N, leaf K and leaf Mg and to the need of timely application ot these elements.
7. Advice is essential with respect to the relation between bumper crops and need for concurring heavy applications of fertilizer to prevent plant deterioration, and vice versa.
8. Leaf samples should be taken to check the vine condition and the expected evolution of the various concentrations under the applied regime of nutrition; sampling is suggested, once or twice a year during immaturity; then just before flowering and subsequently during; matur-ty at the end of the period of flowering, again three months later, and finally within the period of harvesting.
These field recommendations tend in essence towards appropriate re
storation of the quality of nutrition before 1940. , 1 1 ( i n m i m t e r
Introduction of this new policy of fertilizing may initially f ^ ^ practical difficulties. In Sarawak, thereis at P ^ e n t ^ t t l e SC°PC ^ f ^ n e S and treatment to each individual smallholding of P ^ ^ g £ £ level of agriculture is still low and implementation ^ f ^ V ^ ^ measures is therefore usually undertaken and ^ ^ J ™ * ™ ^ official departmental activities. This implies that within this framework individual approach is rather impracticable. transitional
In order to meet this major difficulty, it is suggested to us^a transmon period of some length within which the rather ^ ^ ^ 7 ^ one single type of soil are reallocated to « ' ^ ™ ! & ^ £ f re size, emSploy?ng appropriate standards of ^ ^ ^ ^ a n d
then treated as a single unit and ^ * ^ J Z £ l gardens within the ensuing recommendations may be generalized tor a g
137

the sample area. It is advisable to maintain a sample density of 175 vines/ hectare.
Alternatively, one or more demonstration gardens of a convenient size may be established. These should be representative in most respects for the various nutritional conditions for the commercial gardens within the particular pepper growing area. These gardens are then treated in the ap-propiate way by trained personnel and serve as a standard of reference for the measures to be taken in the adjacent commercial gardens.
Although in this fashion the recommendations for individual gardens are somewhat less accurate, the standard of agriculture is such that from this transitional approach, an appreciable impulse towards continuous bearing may be expected. Eventually, the final stage involving individual sampling of gardens and interpretation of foliar diagnostic results by trained gardeners should be the ultimate aim.
SUMMARY
.Until 1942 cultivation of pepper P. nigrum L. in Sarawak produced relatively small but regular yields. High demands after 1945 and restricted use of burnt earth" compelled farmers to abandon the application of this tra
ditional fertilizer. Instead, "fool proof" manufactured fertilizers of mainly organic ongin were successfully applied in massive volumes and large yields were obtained. In 1954 and following years a sharp fall in price induced a decline in production, in part owing to much reduced applications or fertilizer. As a result the economic crop cycle of some 16 years was limited to some 1-3 years; the bulk of the total yield was obtained in the first year of production.
An initial survey on leaf symptoms and die-back indicated unbalanced and inadequate mineral nutrition of the crop. The current system induced severe deterioration of plant appearance in the period of monsoon rains, which coincide with berry expansion. During this time no fertilizers are applied as a rule.
A method has been worked out to diagnose the nutritional demands of 2 7 M . \ g V c h e m i c a l f o I i a r ^alysis. Major aspects involved in the estabhshment of a sampling procedure were systematically studied. th7J*r!fc0n C h e m i C a l
fcroncentrations was investigated of the portion of
of t b ™ 1 P w n C e ffmit 'the b r a n c h > t h e ag e o f ** leaf, the presence locat,n of £ ' f S1Zf'kaf t h i c k n e S S ' s u n ^ ine , different stems on a plant, v S s T J l / f r r fSSingS and t h e n u m b e r of leave* be sampled per vine. Similarly, the influence of the mode of cleaning of the leaves, of the

drying temperature on loss of N and the effect of length of storage on the content of N were studied.
Studies on the error of bulk sampling and the effect of appropriate stratification of the different leaves in the canopy on the reduction of this error showed that suitable division into strata reduced the number of vines to be included in a bulk sample up to 16 times as compared with random sampling, assuming the same degree of precision. Furthermore the inclusion of 4 appropriately stratified leaves from each of 60-70 vines in each bulk sample obtained from homogeneous areas, would represent chemical concentrations with a precision of 10% of the population mean (P = 0.05) irrespective of physiological condition.
Data on seasonal variation indicated declining levels of N and K within the monsoon; this was accompanied by gradually rising levels of leaf P and leaf Ca. Leaf Mg tended towards constancy. Bivariate ratios showed, on most occasions, a regular relationship with time, but constant values were observed only occasionally.
A sand experiment on deficiencies of nutrients showed characteristic discolourations due to nutrient shortage. Concurring foliar concentrations and ratios associated with full nutrients, partial or complete deficiency of a single element allowed tentative registration of normal, fair, critical and deficient threshold values in the leaves for each element (table a). Single and multiple deficiencies could be recognized by using an appropriate grouping of concentrations and their ratios. Application of these values to random field data showed a satisfactory power of discrimination, me ratio values gave a good indication of the order of importance in the case ot multiple deficiencies. , r
The influence was studied of dressings of NPK fertilizers on leaf concentrations and ratios. It was observed that increasing dressingsot N,,r, ana*. weredirectlyreflectedinrisisingconcentrationsofleafN.lealPandiew-
spectively.Simultaneously,N-P"antagonism"and''antagon^m between bases was also operative. Apparently, considered balancing ofaPPf£°°f of different fertilizers is essential. The ratios between e l<;men* £ * S ° ™ indication of priorities of different dressings. It was also <***™***^ the influence of the very heavy, early applications leaf concentration ot w, K and Mg fall to deficiency levels. This indicates that the distribution
inadequate net supply of N. K and Mg to the leaves duringtranslocaum processes of nutrients in the period of fruit d * * * ^ * ^ ^ at a high level of production can be maintained by P J ^ L r f o w r f ment of nutrient shortages and ensuring fair " ^ ^ S X , , N, P, K, Ca and Mg in the leaves throughout f ^ ^ ^ Z ^ independently obtained from field vines ^ r r o b o ^ h e ten^a* for the normal levels found in the pot ^ ^ i J d inter-fore be considered as fundamentally correct. Rather comp
139

actions of "antagonisms" and "synergisms" may become operative if foliar levels fall below these normal levels. The data have also shown convincingly that the values for log N/P can be used as a satisfactory control for abundance of flowers at a specific potential for flowering.
Finally, the agricultural implications of these findings are discussed in Ch. 10. The data allowed a plausible interpretation of crop behaviour and crop performance under the traditional system of cultivation before 1942 and that in the period after 1945. By integrating the leaf data of this work with information concerning factors affecting the supply of nutrients to the plant, it was shown that foliar diagnosis furnished a suitable foundation to devise an appropriate fertilizer policy for pepper.
SAMENVATTING
Tot aan het jaar 1942 werden relatief kleine, maar regelmatige opbrengsten verkregen in de cultuur van peper (Piper nigrum L) in Serawak. De sterk ge-stegen vraag na 1945 enerzijds en de beperking van het gebruik van "ge-brande aarde" anderzijds dwong de boeren om de traditionele methoden van bemesting op te geven. In plaats daarvan werden grote hoeveelheden relatief dure "fool proof" meststoffen op voornamelijk organische basis met redelijk succes toegepast. Relatief grote opbrengsten werden verkregen, hoewel symptomen met betrekking tot dreigende physiologische uit-putting werden waargenomen. In 1954 en volgende jaren had een scherpe prijsdaling een sterke afname van de produktie tot gevolg; dit had veel lagere bemestingsgiften tot gevolg. Hierdoor verminderde het normale aantal van 16 produktieve jaren tot 1 a 3 jaar.
Een voorlopig onderzoek op bladsymptomen en "die-back" wees in de richting van onevenwichtige en onvoldoende minerale voeding van het gewas. Het toegepaste cultuursysteem bleek de algemene toestand van de planten ernstig te verslechteren in de periode van de moessonregens, welke samenvallen met de hoofdperiode in de ontwikkeling van de bessen. Ge-durende deze tijd wordt gewoonlijk 00k niet bemest.
Een methode is ontwikkeld voor de diagnose van de behoefte aan N, P, K, Ca en Mg van het gewas door middel van bladanalyse. Een aantal factoren die invloed kunnen uitoefenen op het vaststellen van een bemonsterings-procedure zijn systematisch bestudeerd. De invloed werd nagegaan op de chemische samenstelling in het blad van gedeelten van de plant, van de aanwezigheid van vruchten, van de orde van de takken, van de leeftijd van het blad, van de aanwezigheid van de bladsteel, van de grootte en dikte van het blad, van het zonlicht, van verschillende stammen op een plant, van de
140

plaatsing van de mestgift en van het aantal bladeren per plant dat bemon-sterd moet worden. Daarnaast werd ook de invloed onderzocht van de wijze van reiniging van het blad, van de droogtemperatuur op N-verliezen, en van de bewaring van droog materiaal op het N-gehalte.
Onderzoekingen betreffende de variabiliteit van de gehalten van de 5 ele-menten in samengestelde monsters, en het effect van geschikte stratificatie van de bladeren op de reductie van deze variabiliteit toonden aan dat, bij gelijkblijvende nauwkeurigheid, een geschikte verdeling in strata het aantal planten, vertegenwoordigd in een samengesteld monster, kon doen verminderen met een factor 16, vergeleken met een willekeurig gekozen blad. Er is ook gebleken, dat het bemonsteren van 4, op geschikte wijze ge-stratificeerde bladeren van elk van 60-70 planten, voor het verkrijgen van een samengesteld monster representatief is voor chemische bladconcen-traties met een nauwkeurigheid van 10% van het gemiddelde van de populate (P = 0.05), ongeacht de physiologische conditie. De volledige bemon-steringsprocedure is gegeven in paragraaf 6.4.
Resultaten met betrekking tot seizoensvariaties toonden afnemende concentraties van N en K in de moessonperiode. Dit gaat gepaard met langzaam stijgende gehalten P en Ca in het blad. De Mg-concentraties blijven vrijwel constant. In het algemeen gesproken bleken de verhoudin-gen tussen 2 elementen een regelmatig verloop te hebben met de tijd, maar constante waarden werden zelden waargenomen.
Een potexperiment voor de studie van gebrekssymptomen toonde ka-rakteristieke verkleuringen, samenhangend met voedingstekorten (Plate 1). De concentraties en verhoudingen van elementen in het blad met betrekking tot een aanbod van alle voedingselementen, of van een gedeelte-lijk, of van een volledig gebrek aan een enkel element, opende de moge-lijkheid tot het vastleggen van voorlopige waarden voor normale, acceptable, critische en gebreksniveaus (tabel 18). Enkelvoudige en multipele gebrekstoestanden konden worden herkend door een geschikte groepenng van concentraties en verhoudingen te gebruiken. Het toepassen van deze waarden op willekeurige veldgegevens resulteerde in een goede onder-scheiding van verschillende voedingsgebreken. De verhoudingswaarden gaven een goede indicatie van relatief gewicht in gevallen van meervoudige 2cbrcKSsitii3.tiGs
De invloed werd nagegaan van opklimmende giften van N-, P- en K-meststoffen op concentraties en verhoudingen in het blad. Toenemenae hoeveelheden N, P of K als mest werden weerspiegeld door hogere con-centratie van N, P en K respectievelijk in het blad. Tegelijkertijd was echter N-P-«antagonisme", en "antagonisme" en "synergisme tussen b « n waarneembaar. Blijkbaar is een evenwichtige toediening van de. verscm 1-lende meststoffen van essentieel belang. De variatie van de verhoud ngs-waarden van de elementen in het blad gaven enige indicatie met betreK-king tot de prioriteit van verschillende mestgiften, en met betrekking tot wederzijdse beinvloeding van verschillende soorten kunstmest. Ook werd
141

waargenomen, dat met de zware, vroege giften de concentraties van N, K en Mg in het blad dalen tot onder de gebreksniveaus. Dit wijst erop, dat de distribute van de mestgiften in de tijd aanpassing behoeft.
De ontwikkeling van physiologische uitputting kan worden toegeschre-ven aan een onvoldoende netto toevoer van N, K en Mg naar de bladeren gedurende translocatie-processen van voedingselementen in de periode van vruchtontwikkeling. Oogst-stabiliteit bij hoge produkties in opeenvol-gende jaren kan worden bereikt door tekorten aan minerale voeding te voorkomen en door normale concentraties van N, P, K, Ca en Mg in het blad te handhaven over het gehele jaar. De drempelwaarden, welke onaf-hankelijk zijn verkregen van veldplanten, bevestigen de voorlopige waar-den voor normale concentraties verkregen in het potexperiment. Deze laatste kunnen daarom worden beschouwd als fundamenteel juist. Tame-lijk gecompliceerde interacties van "antagonismen" en "synergismen" kunnen gaan optreden, indien de bladniveaus beneden de normale waarden dalen. De resultaten hebben ook aangetoond dat variatie van de waarde van log N/P kan worden gebruikt voor de regulatie van de bloeirijkdom bij een gegeven bloeipotentieel.
Tenslotte worden de landbouwkundige implicaties van de resultaten besproken in Hoofdstuk 10. De gegevens laten een plausibele interpretatie toe van de gedragingen van het gewas onder het traditionele cultuur-systeem, en dat in de periode na 1945. Integratie van de gegevens van blad-concentraties en informatie samenhangende met factoren welke de toevoer van voedingsmineralen naar de plant beinvloeden, toonden aan dat bladanalyse een geschikte basis verschafte om een flexibel en aangepast bemestingsbeleid te voeren.
RINGKASAN
Sampai penghabisan tahun 1942 keadaan hasil perkebunan lada (Piper nigrum) di Serawak dipandang setjara relatif ketjil, akan tetapi djalannja dengan tertib. Kenaikan permintaan jang besar setelah tahun 1945 di satu fihak dan di lain fihak pembatasan dalam hal mempergunakan "tanah jang dibakar" menjebabkan para petani tak bisa lagi memupuk setjara jang biasa dilakukan. Sebagai penggantinja jang agak memuaskan dipergunakan setjara besar-besaran bahan^-pupuk "fool proof" jang terutama berdasar-kan organis dan harganja relatif mahal. Relatif diperoleh hasil jang besar, walaupun terasa adanja gedjala berkenaan dengan antjaman keletihan fisiologis. Dalam tahun 1954 dan tahun* jang menjusul, karena turunnja
142

harga jang terlampau maka hal ini menjebabkan sangat merosotnja produksi. Sebagian besar perosotan ini mengakibatkan pamberiam obat-pemupuk terlampau sedikit. Dan oleh karena itu maka turunlah djumlah tahun jang produktif jang biasanja 16 mendjadi i a 3 tahun.
Penjelidikan sementara jang dilakukan pada simton-daun dan "die-back" menjatakan bahwa tanaman* itu kurang diberikan pupuk-mineral dan djuga perbandingannja tidak benar. Sistimperkebunan jang dilakukan ternjata sangat merusak keadaan tanaman seumumnja selama musim hudjan, jang djatuhnja bersamaan dengang periode-utama berkenaan dengan pertumbuhan buah-buahnja. Diwaktu ini biasanja orang tidak memupukpun. Telah dimadjukan suatu metode jang dilakukan dengang perantara analisa-daun, untuk menentukan diagnosa kebutuhan zat N, P, K, Ca dan Mg bagi tanam-tanaman. Pun telah dipeladjari dengan tertib dan saksama beberapa faktor jang mungkin dapat mempengaruhi peneta-pan hasil prosedur pemeriksaan (prosedur mengambil-tjontoh). Dipenksa setjara tertib pengaruhnja pada keadaan-daun setjara khnia dan bagian* tanaman itu, dari adanja buah*, dari tumbuhnja tjabang*. dari usia daun, dari adanja tangkai-daun, dari besar dan tebalnja daun, dan tjahaja mata-hari, dari berbagaitjabangpadasatu tanaman, dari penempatan obat-pupuk dan dari djumlahnja daun setanaman jang harus dipenksa. Selain dan pada itu diperiksa djuga hasil pengaruh dari tjara membersihkan daun, dan hilangnja N dalam daradjat panas untuk mengeringkan dan dan penjim-panan bahan* kering atas kadar-N. Penjelidikan berkenaan dengan vana-bilitas kadar dari 5 unsur dalam tjontoh* jang bersusun dan dajaguna stratifikasi jang tepat dari daun* atas reduksi dari variabiles 1111 menund-jukkan bahwa, pada presisi jang keadaannja tetap sama pembagian ang chas dalam strata sedjumlah tetumbuhan, jang berada dalam ^ a t u tjon toh-bersusun, bisa mengurangkan dengan faktor 16, djika d.perbandmgkan dengan sebarans daun jang dipilih. .
Telah ternjata djuga bahwa pemeriksaan dari 4 daun dari^t p « • £ tanaman jang distratffisir setjara jang tepat untuk ^ ^ f ^ ^ n -bersusun adalah representatif untuk ^ ^ ^ T A S I ^ O ^
gan kesaksamaan 1% dari populasi rata* (P=o 05) ^ ^ J u T Lologinja. Djalan pemeriksaan jang lengkap tertjantum da arcfasal 6^.
H ^ b U e L n L g a n v a r i a — sentrasi N dan K dalam periode-musim. Hal mi « J M naiknja kadar P dan Ca didalam daun. Keadaan konsentrasi Mg
antara 2 uniur ita tertib dengan waktu, akan tetap mlai p n g j P * ^ * terdapat, Suatu pertjobaan didalam pot untuk ^ t n i " dengan kekurangan menundjukan kelunturan ,ang chas berhubungan g kekurangannjaperbenihan (Plate 1). berhubungan den-
Konsentrasi dan p e r b a n d m g a - u n , u ' ^ ^ ^ ^ s e b a g i a n atau gan memberi semua unsur-bemh, auat aan a* , 6 143

dari kekurangan jang lengkap dari suatu unsur, maka membawa kemung-kinan akan menetapkan suatu nilai sementara bagi tingkatan jang biasa, jang bisa diterima, jang genting dan jang kekurangan (table 18). Keadaan kekurangan tunggal dan jang berdjibah-djibah bisa dilihat dengan mem-pergunakan penggolongan konsentrasi dan perbandingan jang tepat. Dengan mempergunakan nilai2 ini disebarang pendapatan-ladang meng-hasilkan dengan djelas pembadaan dari berbagai kekurangan pupuk. Nilai2
perbandingan itu memberi petundjuk jang baik dari kepentingan jang relatip dalam hal keadaan kekurangan madjemuk.
Diperiksa pula pengaruhnja pemberian bertambah-tambah obatpupuk N, P dan K atas konsentrasi2 dan perbandingan2 didalam daun itu. Pertam-bahan obat-pupuk N, P atau K ternjata djuga pada pertambahan konsentrasi N, P dan K didalam daun. Berbarangan dengan itu nampak pula perlawanan N - P serta "perlawanan" dan "synergisme" jang berada dian-tara basa2. Agaknja pemupukan dengan bergagai matjam bahan-pupuk jang seimbang merupakan kepentingan jang asasi. Variasi nilai2 perbandingan dari unsur2 didalam daun memberikan bebe-rapa petundjuk berkenaan dengan prioritas dari berbagai pemberian pupuk dan berkenaan dengan mempengaruhi satu sama lain dari berbagai mat-jam pupuk-buatan. Nampak pula bahwa pada pemberian jang amat banjak dan sebelum waktunja, konsentrasi2 N, K dan Mg didalam daun merosot sampai dibawa deradjat-kekurangan. Hal ini menundjuk bahwa lambat laun pembagian pemberian pupuk harus ditjotjokkan.
Timbulnja kelemahan fisiologis dapat disebabkan oleh pemberian bersih N, K dan Mg jang tak tjukup kedalam daun dalam waktu proses trans-lokasi dari unsur2-benih dalam waktu pertumbuhan buah. Stabilitas-hasil pada produksi jang tinggi bertahun-tahun berturut dapat ditjapai dengan djalan mendjaga supaja tak ada kekurangan bahan2 mineral dan dengan mempertahankan konsentrasi N, P, K, Ca dan Mg jang biasa didalam daun, sepandjang tahun. Kadar2-batas jang diperoleh dari tanaman ladang set-jara sendiri-sendiri membenarkan kadar2 sementara untuj konsentrasi normal jang diperoleh pada pertjobaan didalam pot. Maka keterangan kadar2 sementara ini dapat dianggapi keterangan jang benar asasi. In-teraksi jang agak kusut dari "antagonismen" dan "synergismen" bisa timbul djika deradjat-daun merosot sampai dibawah kadar jang normal (biasa). Hasil2 telah menundjukkan djuga bahwa variasi Log N/P bisa digunakan untuk mengatur kekajaanberbunga pada suatu potensi akan berbunga jang tertentu. Achirnja implikasi berkenaan dengang perkebunan dari semua hasil diuraikan difasal 10. Pendjelasan2 jang diuraikan memberikan keluasan untuk interpretasi jang dapat diterima baik mengenai kelakuan tanam-tanaman dalam sistim perkebunan jang tradisionil dan sistim itu dalam periode sesudah tahun 1945.
144

BIBLIOGRAPHY
ANDREAE.B.: Die Bodenfruchtbarkeit in den Tropen. Hamburg and Berlin (1965) ANDRIESSE, J. P.: Field classification of Sarawak soils (1st approximation). Techn. Rep. Dep.
Agr., Sarawak 1(19(2) Annual Reports 1961,'62,'63,'64,'65 Dep. Agr., Sarawak BACHY, A.: DiagnosticFoliaire: relationsentre cations. Oliagineux 18,6,pp. ^(f3/ BARBER, S. A., J WALKER and E. H. VASEY: Mechanisms for the movement of nutrients
from the soil and fertilizer to the plant root. J . Agr. Soil Chem. 11,3,* ^ O g ) BEAUPILS, E. R.: Recherche d 'une exploitation rationnelle de l'hevea dapr is un diag
nostic physiologique reposant sur l'analyse minerale des d.verses parties de la plante.
Plant analysis and fertilizer problems I.R.H.O. Paris pp. 360-76(1956) BESSIS, R.: Possibility et limites du diagnostic foliaire J . Agr. Trop. Bot. Appl. 14, 6-7, pp. 253-
B o ^ r l HASAN-ILJAS: Beberapa tjatatan tentang biologi bunga lada (Piper nigrum L.).
PemberitaanBalaiBesarPenjelidikanPertamanBogornoi57 j.-^nnstie foliaire Plant BOUAT, A.: La fumure de l'olivier. La solution apportee par le diagnostic foliaire. Plan
analysis and fertlizer problems I.R.H.O. Paris pp. 311-21 (1956) rttf d e VoWer. Arm. BOUAT, A. et R. REINAUD: Etude sur la physiologie de la nutrition
Agron. 2pp. 828-48 (1951) . nutrition de l'olivier. Arm. Agron. 4 BOUAT, A., P. REINAUD et J. DUIAC: Physiologie de la nutrition ae
pp. 599-628 (1953) „T,vdoloeie de la nutrition de l'olivier. BOUAT, A., P. REINAUD et J. DULAC: Etude sur la physiologie ae
Ann. Agron. 5pp. 459-89 (1954) , , . iA to c r o p nutrition. £xp. BOULD, C.: Leaf analysis as a diagnostic method and advisory a,
Agr. 4,1, pp. 17-27 (1968) T^fanalvsis as a guide to the nutrition of BOULD, C , E. G. BRADEIELDand G. M. CLARKE: L e a f a n a l y s ^ * 8 & .
fruit crops, i General principles, sampling techniques and analytic*
Food Agr. 11,5,pp. 229-42 (i960) relationships. Soil Set. 78, pp. 9-22 BRAY, R. H. A nutr ient mobility concept of soil plant
fJ95^ 1. A 1 „„ Kanaka landbouw 16, pp. 139-256 (l94o) BREGMAN, A.: De pepercultuur en -handel op Bang • ^ ^ Wageniw„ (1955) BROESHART.H.: neapplicationoffoliaramlysistomlpalmcuim ^ ^ c o m p o s i t i o n 0 f BROESHART, H.: Some aspects °f mineral deficiencies an
the oil palm. Plant analysis and fertilizer problems I.RMM. r w b i o c h emical character-BROUARD, J.: Influence of manuring on some m ° r P n o I ° | ,, subject 29, sth suite, pp. 1-10
istics of canes of Vitis vinifera L. variety Ugni-Blanc. m (May 1968 a) . . . t p a n d n u t r i e n t element content of the
BROUARD, J.: The influence of the carbohydrate and n u ^ %^e,pp. w fMay canes of the vines on the production of grapes. Potash Rev. °J
1968 b) 145

CAIN, J. C.: Some problems of foliar diagnosis for orchard fertilizer recommendation. Plant analysis and fertilizer problems I.R.H.O. Paris,pp. 23-31 (1956)
CHAPMAN, H. D. : Diagnostic criteria for plants. Div. Agr. Sci. Univ. of California (1966) COBLEY, L. S.: An introduction to the botany of tropical crops; Pepper Piper n ig rum" pp. 198-200,
London (1956) DEMOLON, A.: Croissance des vigetaux cultives, 2iime id. Paris (1950) DIEST, A. VAN: Bemest men degrondof deplant?Public lecture, Wageningen(1967) DUNCAN, W. G. and A. J. OHLROGGE: Principles of nutrient uptake from fertilizer bands.
ii Root development in the band. Agron.J. so, pp. 605-8 (1958) EMMERT, F. H.: The bearing of ion interactions on tissue analysis results. Plant analysis and
fertilizer problems I.R.H.O. Parispp. 231-43 (1961) ENZMANN, J.: Mineral fertilization in the tropics today. Beitr. Trap. Subtrop. Landwirtsch.
Tropenveter.-med. i,pp. 73-83 (1966) FERRAND, M.: L'analyse des plantes et la pratique agricole. Plant analysis and fertilizer problems
I.R.H.O. Parispp. 31-S (1954) FERWERDA, J. D.: Growth, production and leaf composition of the African oil palms
affected by nutritional deficiencies. Plant analysis and fertilizer problems I.R.H.O. Paris pp. 148-58 (1961)
FINCK, A.: Tropische Boden, Hamburg and Berlin (1963) FRIED, M. and H. BROESHART: The soil-plant system in relation to inorganic nutrition.
Monograph. Amer. Inst. Biol. Sci. and US Atomic Energy Comm. p. 358, New York and London (1967) FRIIS-NIEISEN, B.: An approach towards interpreting and controlling the nutrient
status of growing plants by means of chemical plant analysis. Plant and Soil 24, 1, pp. 63-80 (1966)
GOODALL, D. W. and F. G. GREGORY: Chemical composition of plants as an index of their nutritional status. Imp. Bur. Horticult. Plant. Crops Techn. Comm. n (1947)
GOUNY, P.: Observations sur les relations entre la composition minerale de la plante et le rendement. Plant analysis and fertilizer problems I.R.H.O. Paris,pp. 87-103 (1956)
GOURIEY, J. H. and J. W. WONDER: Potassium distribution in soils. Agron.J. 31, VP- ^0-7 (1939)
GRABLE, A.: Soil aeration and plant growth. Adv. Agron. 18, pp. 57-106 (1966) HARDON, H. J. en J. D. NEUTEBOOM : Resultaten van een gedetailleerd physisch onderzoek
van pepergrond op Bangka. Landbouw 12, pp. 246-66 (1936) HARDON, H. J. en J. T H . WHITE : Gebrande aarde (tanah bakar). Landbouw 10, pp. 49-75 (1934) HEWITT, C. W.: Leaf analysis as a guide to the nutrition of bananas. Emp.J. Exp. Agr. 23,
89, pp. 11-16 (1955)
HOIIAND, D. A.: The interpretation of leaf analysis. J . Horticult. Sci. 41, pp. 311-29 (1966) HUERTAS, A.: Leaf composition, manuring and production of coffee. Fertiliti 23, pp. 42-51
(1964s)
HUITEMA, W. K.: Pepercultuur en bodemvruchtbaarheid der Bangka-gronden. Landbouw 17, pp. 748-73 (l94l)
JAKOBSON, S. T. and F. STEENBJERG: The concentrations of various plant nutrients in oats as influenced by potassium and magnesium nutrition. Plant analysis and fertilizer problems I.R.H.O. Paris, pp. 174-88 (1964)
JENNY, H.: Pathways of ions from soil into roots according to diffusion models. Plant and Soil 25,2, pp. 265-89 (1966)
KENWORTHY, A. L.: Interpreting the balance of nutrient elements in the leaves of fruit trees. Plant analysis and fertilizer problems I.R.H.O. Paris, pp. 3-15 (1961)
KOPPEN, W.: Grundriss der Klimaiunde, zweite Herausgabe, Berlin and Leipzig (1931) LAGATU, H. et L. MAUME: Diagnostic de l 'alimentation d 'un vegetal par Involution
chimique d 'une feuille convenablement choisie. C.R. Acad. Sci. Paris 182, pp. 653-5
(1926)
LAGATU, H. et L. MAUME: Examen critique des conditions et des r&ultats du contr61e alimentaire de la vigne. C.R. Acad. Agr. Fr. 13, pp. 548-57 (1927)
LAGATU, H. et L. MAUME: Evolution remarquablement reguliere de certains rapports
146

physiologiques (chaux, magnesie, potasse) dans les feuilles de la vigne bien alimentee. C.R. Acad. Sci. Paris 179, pp. 782-85(1933)
LEE, Y. L.: Agriculture in Sarawak./. Trop. Geogr. 21, pp. 21-30 (1965) LEO, M. W. M.: Heterogeneity of soil of agricultural land in relation to soil sampling.
J. Agr. Food Chem. 11,5, pp. 432-1 (1963) LEVY, J. F.: Resultats obtenus grace au diagnostic foliaire. Flant analysis and fertilizer problems
I.R.H. 0. Paris, pp. 384-94 (1956) LEWIS, D. G. and J. P. QUIRCK: Phosphate diffusion in soil and uptake by plants, iii P31
movement and uptake by plants as indicated by P32 auto radiography. Plant and Soil 26 3, pp. 445-53 (1967 a)
LEWIS, D. G. and J. P. QUIRCK: Phosphate diffusion in soils and uptake by plants, iv Computed uptake by model roots as a result of diffusion flow. Plant and Soil 26, 3, PP-454-68 (1967 b)
LEYTON, L.: Needle composition in relation to growth and nutrition of Japanese larch. Plant analysis and fertilizer problems I.R.H.O. Paris.pp. 143-9 (m6)
LOUE, A.: Etude de la nutrition du cafeier par la methode du diagnostic foliaire. Bull. Centr. Rech. Agron. de Bingerville 8 (1953)
LOUE", A.: Etude de la nutrition du cafeier par la methode du diagnostic foliaire. Bull. Centre Rech. Agron. de Bingerville (1957)
Loui, A.: Etude de carences et deficiences du potassium, calcium et magnesium chez le cafeier robuste. Bull. Inst. Francais Cafe Cacao 4 (1962)
LUNDEGARDH, H.: leaf analysis, 2nd ed., London (1951) LUNDEGARDH, H.: Physiological aspects on tissue analysis as a guide to soil fertility. Plant
analysis andfertilizer problems I.R.H.O. Paris, pp. 1-6 (1954) MACY, P.: The quantitative mineral nutrient requirements of plants. Plant Physiol. 11, 4,
pp. 749-64 (1936) MAISTRE, J.:Lesplantesaepices. Strie Techn. Agr. Prod. Trop. Pans MALAVOITA, E., F. PIMENTAI GOMEZ and T. COUZY: Study of the coffee plants mineral
nutrition. Fertility 5, pp-15-25 (1955) . , MARINET, J.: La culture du poivre dans l'Inde. Agron. Trap. 8,pp. 482-505 (1953J Mc KENZIE, R. M.: Sampling variations in the concentrations of elements in the sou.
Aust.J. Agr. Res. 6,5, pp. 699-706 (1955) . ^ . , - _, fu-HliVer MIIIER, M H. and A J. OHLROGGE: Principles of the ^ ' " ^ " P ^ l X e a nhos
bands. 1. Effect of placement of nitrogen fertilizer on the uptake of band placed phos phorus at different soil phosphorus levels. Agron. J. so, pp. 95-7 (msj
MOHR, E. C. J.: The soils of equatorial regions, Ann Arbor (1944) MUEIIER, L.: La aplicactfn del diagn6stico foliar en el cafeto (Coffea arakca I.) para una
mejor fertilization. Turrialba 9,pp-110-22(1959) » ,„:„„, in the soils. L Agr. MUNSON, R. D. and W. L. NELSON: Movement of applied potassium in the soils. J . Ag
Food Chem. 11,3, pp. 193-201 (1963) nutrients on growth and leaf MURRAY, D. B.: The effect of deficiencies of the major nutrients o K
analysis ofthebanana. Trop. Agr. 37.PP-97-106(1960) MURRAY, D. B.: Shade and fertilizer relations in the banana. Trop. Ag 3»,
(,m) * ••,, „nH hufferine power of a soil and the NYE, P. H.: The effect o f the nutrient intensity and bufl«ing p d i f f u s i o n .
absorbing power, size and root hairs of a root on nutnent absorption y
Plant andSoil25, i,pp. 81-105(1966) foliaire et de l'analyse des sols OUAGKIER, M. etP. PREVOX: ^ ^ ^ ^ ^ S m ^ ^ ( ^ )
pour la determination des besoms en engrais ae 1 W L POIVRIER, LE. Cah. Agr. Prat. Pays Chauds 4.PP- '85-8 (1966J ( } PREVOT, P.: Base du diagnostic foliaire. Bull. Agr. ^ e ¥ ^ - f ^ d eVarachide. Plant PREVOT, P. et M. OUAGNIER: Diagnostic foliaire du p a t o e r a nuue
analysis and fertilizer problems I.R.H.O. Paris pp. 239-60 {19S4J f u ^ 0l(agineiix it, 11, PREVOT, P. et M. OUAGNIER: Methode d'utilisation du diagnostic
pp. '695-703 (1956) w

PREVOT, P. and M. OLLAGNIER: Law of the minimum and balanced mineral nutrition. Plant analysis and fertilizer problems I.R.H.O. Paris, pp. 257-77 (1961) Rapport Annuel 1952 de l'I.R.H.O.Paris,pp.34-6
RENNIE, D. A. and E. D. SPRATT: The influence of fertilizer placement on "A" values. Transact, jth Int. Congr. Soil Sci., Madison (i960)
REUTHER, W., T. W. EMBLETON and W. W. JONES : Mineral nutrition of tree crops. Ann. Rev. Plant Physiol. 9, pp. 175-200 (195s)
REUTHER, W. and P. SMITH: Leaf analysis as a guide to the nutritional status of orchard trees. Plant analysis and fertilizer problems I.R.H.O. Paris.pp. 166-80 (1954)
ROBINSON, J. B. D.: Mineral nutrition of coffee. Preliminary results with the leaf analysis technique. E. Afr. Agr. Forestry J. 27,1, pp. 1-9 (1961)
ROBINSON, }. B. D. and G. H. FREEMAN: Sources of variation in leaf analysis in East Africa. E. Afr. Agr. Forestry J. 33, pp. 8-13 (1967)
ROSANOW, M.: Unpublished results. Laboratory of Soils and Fertilizers, Agricultural University Wageningen.
RUER, P.: Relations entre facteurs climatiques et nutrition minerale chez le palmier a huile. Oliagineux 21, 3 pp. 143-8 (1966)
RUTGERS, A. A. L.: Peper. De landbouw in de Indische Archipel lib,pp. 620-54 (1949) SAITER, P. J. and J. E. GOODE: Crop responses to water at different stages of growth. Res.
Rev. Comm. Bur. Horticult. Plant. Crops 2 Sarawak Annual Report 1962 SATO, K.: The effects of growth and fruiting on leaf composition of citrus trees. Plant
analysis and fertilizer problems I.R.H.O. Paris, pp. 400-8, (1961) SCHOUWENBURG, J. CH. : Voorschriften voor de analyse vangewssen. Wageningen SCOTT, I. and J. M. BAILEY: A detailed survey of Semongok Agricultural Station and
proposed extensions. Rep. Soil Surv. Div. Dep. Agr. Sarawak (1964) SEAI, J.: Rainfall and sunshine in Sarawak. Sarawak Museum J. 8,11, pp. 500-44 (1958) SHAULIS, N.: Associations between symptoms of potassium deficiency, plant analysis,
growth and yield of concord grapes. Plant analysis and fertilizer problems I.R.H. 0. Paris, pp. 44-57(1961)
SHORROCKS, V. M.: Leaf analysis as a guide to the nutrition of Hevea brasiliensis. i Sampling technique with mature trees. J. Rubber Res. Inst. Malaya 17,1, pp. 1-13 (1961)
SHORROCKS, V. M.: Leaf analysis as a guide to the nutrition of Hevea brasiliensis. ii Sampling technique with mature trees. J. Rubber Res. Inst. Malaya 17,3, pp. 91-101 (1962 a)
SHORROCKS, V. M.: Leaf analysis as a guide to the nutrition of Hevea brasiliensis. iv Studies on the nutrient composition of leaves analysed with and without midrib and possible use of petiole analysis. J. Rubber Res. Inst. Malaya n, 3, pp. 113-22 (1962 b)
SHORROCKS, V. M.: Some problems related to the choice of a leaf sampling technique for mature Hevea brasiliensis. Plant analysis and fertilizer problems I.R.H.O. Paris, pp. 306-31 (1964)
SHORROCKS, V. M. and K. RATNASINGAN: Leaf analysis as guide to the nutrition of Hevea brasiliensis. iii Effect of storage before ovendrying on leaf dry weight and leaf nutritional concentrations. J. Rubber Res. Inst. Malaya 17,3, pp. 102-12 (1962)
SMITH, P. F.: Mineral analysis of plant tissue. Ann. Rev. Plant Physiol. 13, pp. 81-107 (1962) SNEDECOR, G. W.: Statistical methods applied to experiments in agriculture and biology. Iowa U.S.A.
(1961) Statistical Report. World Agr. Prod. Trade, pp. 21-3(1965) STEENBJERG, F.: Manuring and plant production. Plant analysis and fertilizer problems I.R.H.O.
Paris, pp. 31-5 (1954) STEYN, W. J. A.: Leaf analysis. Errors involved in the preparative phase. J. Agr. Food Chem.
7,5, pp. 344-9 (1959) STEYN, W. J. A.: The errors involved in the sampling of citrus and pineapple plant for
leaf analysis purposes. Plant analysis and fertilizer problems I.R.H.O. Paris, pp. 409-30 (1961) TWYFORD, I. T. and J. K. COULTER: Foliar diagnosis in banana fertilizer trials. Plant analysis
and fertilizer problems I.R.H.O. Paris,pp. 357-70 (1964) WAARD, P. W. F. DE : Pepper cultivation in Sarawak. World Crops 16,3, pp. 24-30 (1964)
148

WARD, J. B.: Sampling oil palms for foliar diagnosis. Oleagineux 21, $,pp. 277-0 (1966) WEIR, C. C.: Leaf sampling for foliar diagnosis of citrus in Trinidad. Trap. Agr. 43, 2, pp.
153-4 (1966) WELCH, L. F., D. L. MULVANEY and L. V. BOONE et alii: Relative efficiency of broadcast
versus banded phosphorus for corn. Agron.J. 58, pp. 283-7 (1966) WIERSUM, L. K.: Utilization of soil by the plant root system. Plant and Soil is, 2, pp. 189-92
(1961) WIERSUM, L. K.: Potential subsoil utilization of roots. Plant and Soil 27,3, pp. 383-400 (1967) WILKINSON, S. R. and A. J. OHLROGGE: Fertilizer nutrient uptake as related to root devel
opment in the fertilizer band: influence of nitrogen and phosphorus fertilizer on endogenous auxin content of soy bean roots. Transact. 7th Congr. Soil Sci., Madison, pp. 234-42 (mo)
WILLSON, A. E.: Leaf analysis and fertility control in commercial citrus production. Plant analysis and fertilizer problems I.R.H.O. Paris, pp. 120-9 (1961)
WIT, C. I. DE : Placement of fertilizers, thesis Wageningen (1952)
149