Seals in motion - WUR eDepot
89
SEALS IN MOTION How movements drive population development of harbour seals and grey seals in the North Sea SOPHIE MARIE JACQUELINE MICHELLE BRASSEUR
-
Upload
khangminh22 -
Category
Documents
-
view
1 -
download
0
Transcript of Seals in motion - WUR eDepot
SEALS IN MOTIONHow movements drive population development of harbour seals and grey seals in the North Sea
Sophie Marie Jacqueline Michelle BraSSeur
2 3
TheSiS coMMiTTee
proMoTor Prof. Dr. P.J.H. Reijnders, Professor of Ecology and Management of Marine Mammals, Wageningen University and Research.
co-proMoTor Dr. G.M. Aarts, Researcher Marine Ecology, Wageningen University & Research.
oTher MeMBerS Prof. Dr. A. D. Rijnsdorp, Wageningen University & Research. Prof. Dr. T. Härkönen, Swedish Museum of Natural History, Stockholm, Sweden. Dr. D. Thompson, University of St Andrews, Scotland. Prof.dr. P.J. Palsbøll, University of Groningen, the Netherlands.
This research was conducted under the auspices of the Netherlands Research School for the Socio-Economic and Natural Sciences of the Environment (SENSE).
SEALS IN MOTION
How movements drive population development of harbour seals and grey seals in the North Sea
Sophie Marie Jacqueline Michelle BraSSeur
Thesissubmitted in fulfilment of the requirements for the degree of doctor
at Wageningen Universityby the authority of the Rector Magnificus,
Prof. Dr A.P.J. Mol,in the presence of the
Thesis Committee appointed by the Academic Boardto be defended in public
on Wednesday 30 August 2017at 1:30 p.m. in the Aula.
4
hoofdstuk
Sophie Marie Jacqueline Michelle Brasseur Seals in Motion - how movements drive population development of harbour seals and grey seals in the north Sea 176 pages.
phD thesis, Wageningen university, Wageningen, the netherlands (2017).With references, with summaries in english and Dutch.
iSBn: 978-94-6343-612-0 Doi: https://doi.org/10.18174/418009
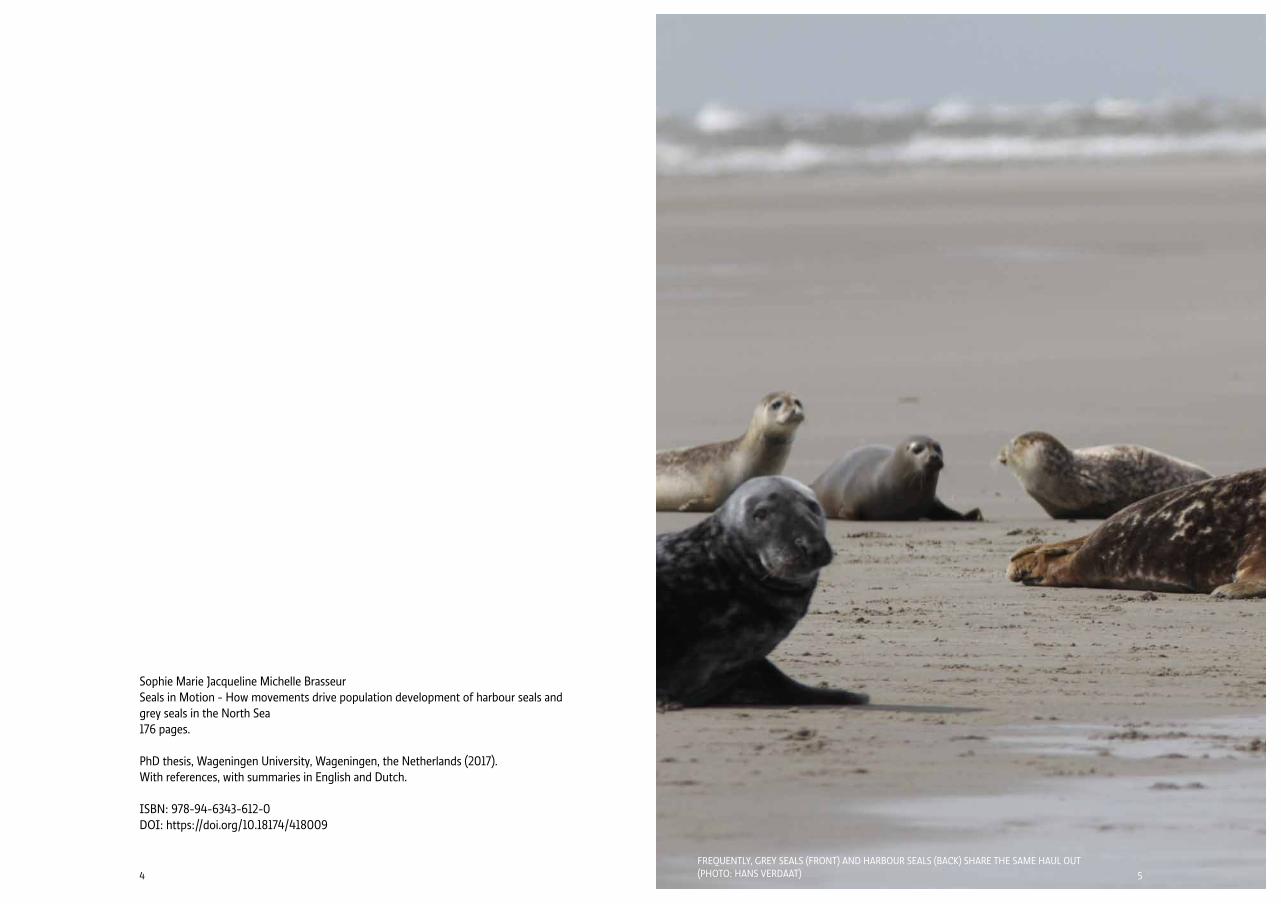
FrequenTly, grey SealS (FronT) anD harBour SealS (Back) Share The SaMe haul ouT (phoTo: hanS VerDaaT) 5

Seals in motion hoofdstuk
76all Seal TranSMiTTerS Where DeployeD WiTh The help oF The “WaDDen uniT” oF The
MiniSTry oF econoMic aFFairS (phoTo: J. BraSSeur)

Seals in motion hoofdstuk
98FroM The air, The DiFFerence BeTWeen The TWo SpecieS iS noT alWayS oBViouS
(phoTo: Sophie BraSSeur)
1. Introduction and outline of thesis ........................................................................ 122. Echoes from the past: regional variations in recovery within a harbour seal population ......................................................................................... 20 3. Earlier pupping in harbour seals, Phoca vitulina ................................................ 444. Directional breeding migration of harbour seals in the Wadden Sea .............. 545. Rapid recovery of Dutch grey seal colonies fuelled by immigration ............... 766. Resident and transient grey seals in the North Sea ............................................ 987. Synthesis ................................................................................................................. 112 Addenda: Summary ................................................................................................................ 122 Nederlandse samenvatting ................................................................................... 126 References .............................................................................................................. 132 Contributing authors ............................................................................................. 150 Publications ........................................................................................................... 152 Acknowledgements ............................................................................................... 166
TAbLE Of cONTENTS
Seals in motion hoofdstuk
1110
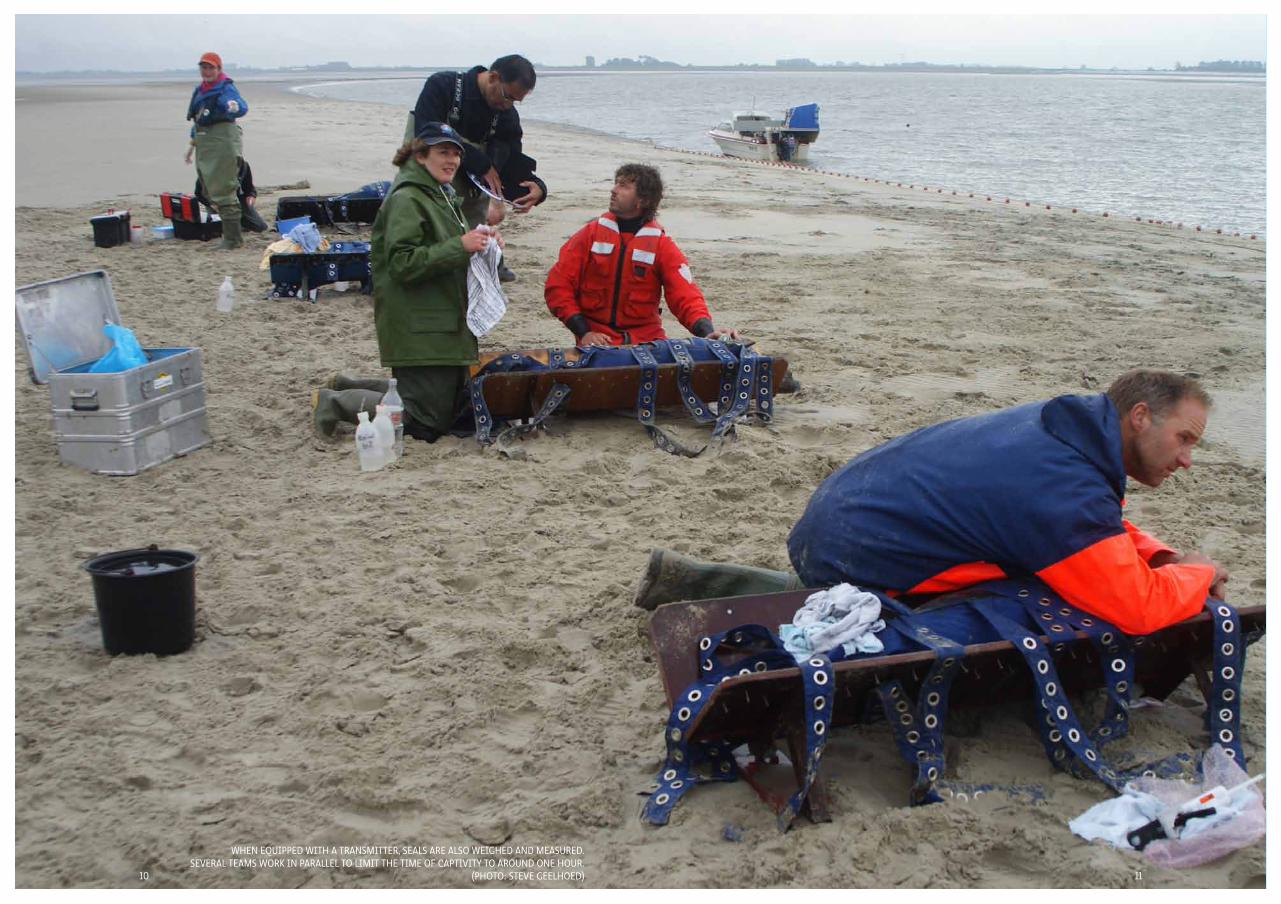
When equippeD WiTh a TranSMiTTer, SealS are alSo WeigheD anD MeaSureD. SeVeral TeaMS Work in parallel To liMiT The TiMe oF capTiViTy To arounD one hour.
(phoTo: STeVe geelhoeD)
13
Seals in motion 1. Introduction and outline of the thesis
12
The Netherlands is one of the most densely populated countries of the world, with approximately 25% of now inhabited land reclaimed from the sea. Despite this, in the waters bordering this country wild populations of two large mammal species have been able to recover from complete extinction in the case of the grey seals (Halichoerus grypus ), or near extinction in the case of the harbour seals (Phoca vitulina) in the course past century. In this thesis, I describe the recoveries through analysis of long-term monitoring of both species and tracking data collected in the framework of recent environmental impact assessment studies.The harbour seal and the grey seal are currently conspicuous members of the ma-rine mammal fauna in the North Sea. The harbour seal has a circumpolar distribu-tion on the Northern Hemisphere with four sub-species distributed on either side of the great oceans: the eastern North Atlantic P. vitulina vitulina, the western North Atlantic P. vitulina concolor, the eastern North Pacific P. vitulina richardii, and the western North Pacific P. vitulina stejnegeri. The grey seal is only found in the North Atlantic, and three distinct populations are recognized: the Northeast Atlantic the Northwest Atlantic, and the Baltic Sea grey seal (Reijnders et al. 1993, Hall et al. 2009, Burns et al. 2009). The nomenclature has been subject to some recent debate and the most recent suggestion is to name the Atlantic grey seal Halichoerus grypus atlantica while changing the name of the Baltic sub-species to Halichoerus grypus grypus instead of H. grypus macrorhynchus or H. grypus Balticus (Olsen et al. 2016). This thesis concentrates on the subspecies of harbour and grey seals occurring in the Netherlands, thus the North Sea, only using the species name.
1. INTRODUcTION AND OUTLINE Of THE THESIS
12
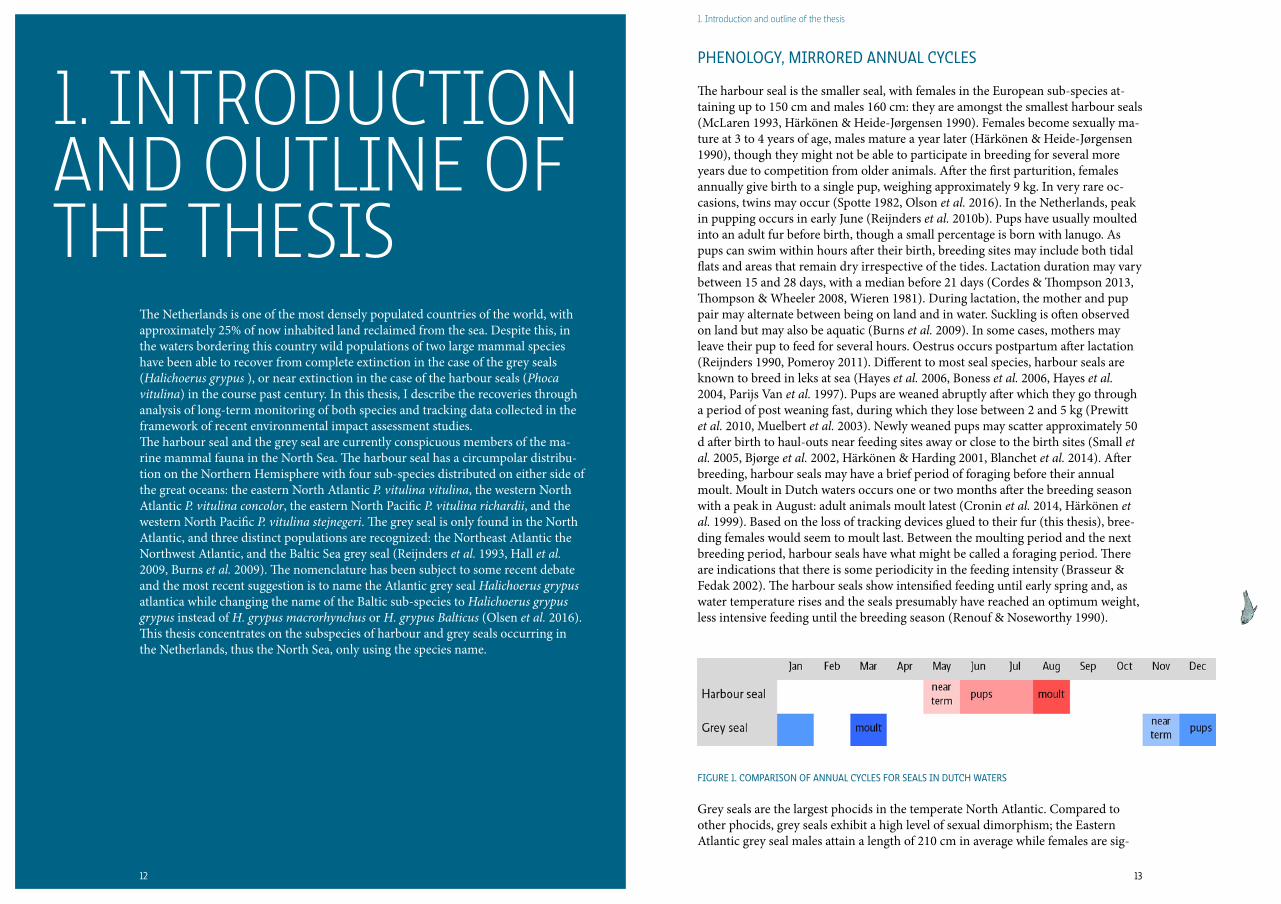
phenology, MirroreD annual cycleS
The harbour seal is the smaller seal, with females in the European sub-species at-taining up to 150 cm and males 160 cm: they are amongst the smallest harbour seals (McLaren 1993, Härkönen & Heide-Jørgensen 1990). Females become sexually ma-ture at 3 to 4 years of age, males mature a year later (Härkönen & Heide-Jørgensen 1990), though they might not be able to participate in breeding for several more years due to competition from older animals. After the first parturition, females annually give birth to a single pup, weighing approximately 9 kg. In very rare oc-casions, twins may occur (Spotte 1982, Olson et al. 2016). In the Netherlands, peak in pupping occurs in early June (Reijnders et al. 2010b). Pups have usually moulted into an adult fur before birth, though a small percentage is born with lanugo. As pups can swim within hours after their birth, breeding sites may include both tidal flats and areas that remain dry irrespective of the tides. Lactation duration may vary between 15 and 28 days, with a median before 21 days (Cordes & Thompson 2013, Thompson & Wheeler 2008, Wieren 1981). During lactation, the mother and pup pair may alternate between being on land and in water. Suckling is often observed on land but may also be aquatic (Burns et al. 2009). In some cases, mothers may leave their pup to feed for several hours. Oestrus occurs postpartum after lactation (Reijnders 1990, Pomeroy 2011). Different to most seal species, harbour seals are known to breed in leks at sea (Hayes et al. 2006, Boness et al. 2006, Hayes et al. 2004, Parijs Van et al. 1997). Pups are weaned abruptly after which they go through a period of post weaning fast, during which they lose between 2 and 5 kg (Prewitt et al. 2010, Muelbert et al. 2003). Newly weaned pups may scatter approximately 50 d after birth to haul-outs near feeding sites away or close to the birth sites (Small et al. 2005, Bjørge et al. 2002, Härkönen & Harding 2001, Blanchet et al. 2014). After breeding, harbour seals may have a brief period of foraging before their annual moult. Moult in Dutch waters occurs one or two months after the breeding season with a peak in August: adult animals moult latest (Cronin et al. 2014, Härkönen et al. 1999). Based on the loss of tracking devices glued to their fur (this thesis), bree-ding females would seem to moult last. Between the moulting period and the next breeding period, harbour seals have what might be called a foraging period. There are indications that there is some periodicity in the feeding intensity (Brasseur & Fedak 2002). The harbour seals show intensified feeding until early spring and, as water temperature rises and the seals presumably have reached an optimum weight, less intensive feeding until the breeding season (Renouf & Noseworthy 1990).
Grey seals are the largest phocids in the temperate North Atlantic. Compared to other phocids, grey seals exhibit a high level of sexual dimorphism; the Eastern Atlantic grey seal males attain a length of 210 cm in average while females are sig-
Figure 1. coMpariSon oF annual cycleS For SealS in DuTch WaTerS
14 15
Seals in motion 1. Introduction and outline of the thesis
nificantly smaller and reach in average to 185 cm (McLaren 1993). Adult males can be up to 300 kg, adult females up to 200 kg. A function of the larger size attained by males is thought to be to dominate reproductive opportunities within breeding colonies (Anderson & Fedak 1987). Male grey seals are sexually mature at 5-6 years, though they may not be socially mature until the age of 8 or older. Females are sexually mature at 3-5 years of age and then pup annually. In the Netherlands, peak in pupping occurs in December (Figure 1). The time of year when grey seals give birth varies between regions, and there is a clockwise cline in the mean birth date around the UK from August and September in South-West Britain to early November to December in eastern England (SCOS 2016). Breeding occurs usually in large colonies, where males defend small groups of females against intrusion of sub-dominant males until the females are sired and leave to sea. Breeding and suck-ling takes place on sandbars that usually do not submerge during high tide, though storm surges may occur, flushing the breeding animals in the water (Brasseur et al. 2015a, Brasseur et al. 2015b). Grey seals have a short suckling period (16-21 days), after which the mother–pup bond is broken. Grey seal pups weigh approximately 15 kg at birth and 40 kg (20-60 kg) at weaning (Hall et al. 2008). Oestrus occurs postpartum during lactation (Pomeroy 2011). Weaned grey seal pups fast and may stay on land without feeding for up to another month as they undergo several changes - such as completing their moult and converting fat into muscle (Boyd & Campbell 1971). Like harbour seals, young grey seals may scatter after leaving the breeding site, learning to forage individually. The post-breeding period for grey seals has been marked as a period of intensive feeding especially for the females (Beck et al. 2007, Breed et al. 2006a). Grey seals in the Netherlands moult in March and April, though there may be considerable annual differences in the peak number of moulting animals (Schop et al. 2017). After the annual moult, grey seal females (especially) show a significantly higher level of foraging effort and use different feeding areas than males (Beck et al. 2003a, Breed et al. 2006b). This is also the case shortly prior to breeding.
hiSTory anD populaTion DeVelopMenT
Both the harbour and grey seal populations in the North Sea have undergone severe fluctuations in the past, mainly as consequences of human interactions. Harbour seals have inhabited the Wadden Sea since prehistoric times, evidenced by subfossil remains dating back to the Mesolithic around 5,000 BC (Requate 1957, Reijnders & Brasseur 2016). Seals were subject to hunt as humans slowly colonised the coastal areas. For harbour seals, initial subsistence hunting was replaced or superimposed by bounty hunts in the Netherlands dating back as early as 1591, which were re-gularly called for as the seals were seen as competitors for fish (Vooys et al. 2012). Even in periods without bounty, seals were a welcome addition to the local income, yielding hides and blubber, used as fuel. However, the species did not disappear, albeit surviving in greatly reduced numbers. Around 1900, the population in the entire Wadden Sea is estimated to have been at least 40,000 animals, despite centu-ries of hunting (Reijnders 1992). Intensified hunting in the 20th century, as firearms became more readily available, together with high pollution levels caused by the developing industries, caused a serious drop in numbers and in 1960 the total po-pulation was estimated to be approximately 8,000 seals (Reijnders 1992).
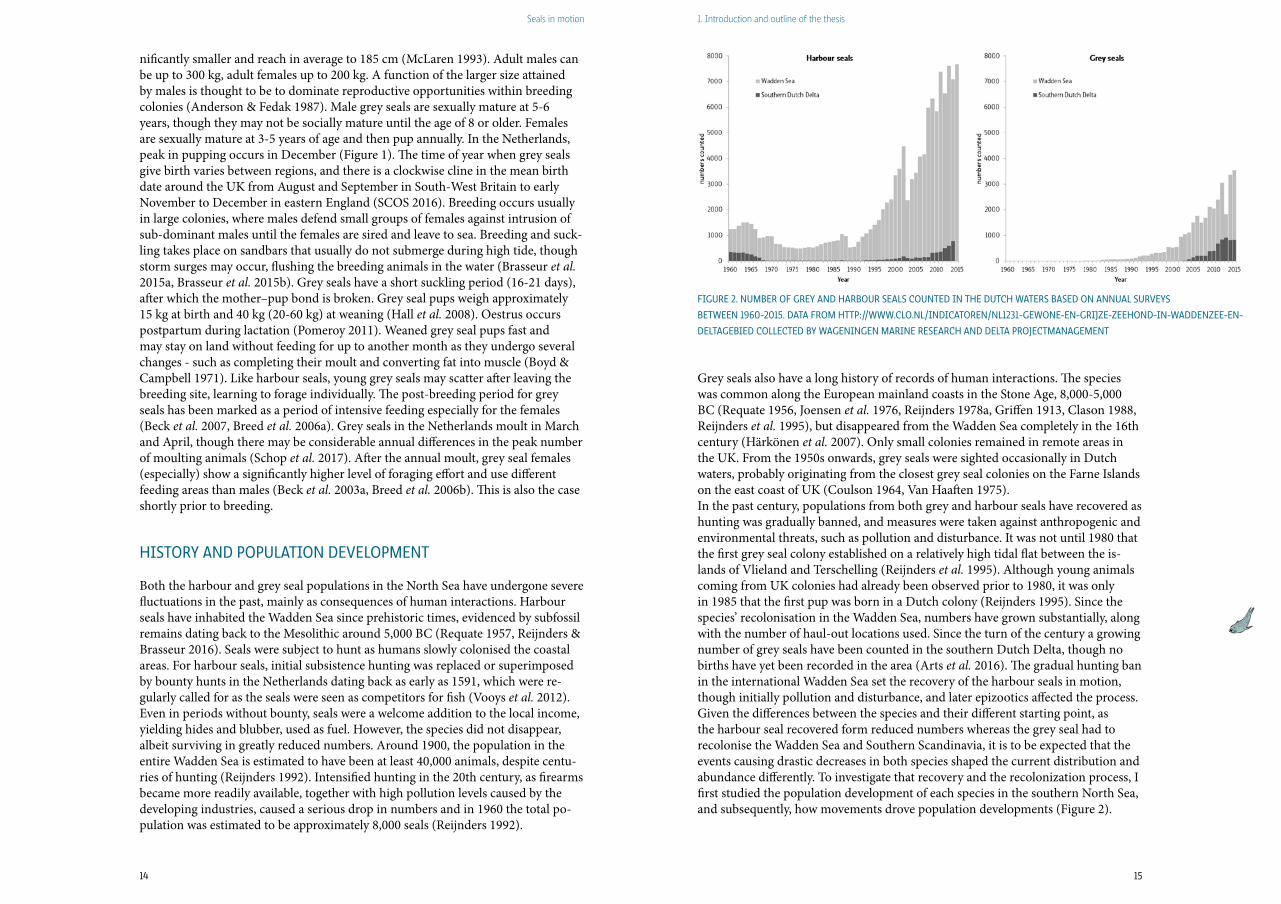
Grey seals also have a long history of records of human interactions. The species was common along the European mainland coasts in the Stone Age, 8,000-5,000 BC (Requate 1956, Joensen et al. 1976, Reijnders 1978a, Griffen 1913, Clason 1988, Reijnders et al. 1995), but disappeared from the Wadden Sea completely in the 16th century (Härkönen et al. 2007). Only small colonies remained in remote areas in the UK. From the 1950s onwards, grey seals were sighted occasionally in Dutch waters, probably originating from the closest grey seal colonies on the Farne Islands on the east coast of UK (Coulson 1964, Van Haaften 1975). In the past century, populations from both grey and harbour seals have recovered as hunting was gradually banned, and measures were taken against anthropogenic and environmental threats, such as pollution and disturbance. It was not until 1980 that the first grey seal colony established on a relatively high tidal flat between the is-lands of Vlieland and Terschelling (Reijnders et al. 1995). Although young animals coming from UK colonies had already been observed prior to 1980, it was only in 1985 that the first pup was born in a Dutch colony (Reijnders 1995). Since the species’ recolonisation in the Wadden Sea, numbers have grown substantially, along with the number of haul-out locations used. Since the turn of the century a growing number of grey seals have been counted in the southern Dutch Delta, though no births have yet been recorded in the area (Arts et al. 2016). The gradual hunting ban in the international Wadden Sea set the recovery of the harbour seals in motion, though initially pollution and disturbance, and later epizootics affected the process.Given the differences between the species and their different starting point, as the harbour seal recovered form reduced numbers whereas the grey seal had to recolonise the Wadden Sea and Southern Scandinavia, it is to be expected that the events causing drastic decreases in both species shaped the current distribution and abundance differently. To investigate that recovery and the recolonization process, I first studied the population development of each species in the southern North Sea, and subsequently, how movements drove population developments (Figure 2).
Figure 2. nuMBer oF grey anD harBour SealS counTeD in The DuTch WaTerS BaSeD on annual SurVeyS
BeTWeen 1960-2015. DaTa FroM hTTp://WWW.clo.nl/inDicaToren/nl1231-geWone-en-griJze-zeehonD-in-WaDDenzee-en-
DelTageBieD collecTeD By Wageningen Marine reSearch anD DelTa proJecTManageMenT
16
Seals in motion
17
1. Introduction and outline of the thesis
harBour Seal populaTion DeVelopMenT in The WaDDen Sea(chapter 2 of this thesis: echoes from the past: regional variations in recovery within a harbour seal population)
In response to the diminished population, hunting was gradually prohibited in the management regions in the Wadden Sea, starting in the Netherlands in 1962, Lower Saxony (Germany)in 1971, Schleswig-Holstein (Germany) in 1973, and in Den-mark in 1976. Despite this ban, the population decreased further to a low of less than 4,000 animals in 1974. Impact of pollution by PCBs, especially in the Nether-lands (Reijnders 1986), exacerbated by disturbance through increased recreational and professional traffic use, and hindered the recovery. Nevertheless, the population slowly increased in the 1980s but was struck by a Phocine Distemper Virus (PDV) in 1988, killing more than 50% of the population. After a prosperous recovery the population was hit again by another PDV outbreak in 2002, killing about the same proportion of the population (Härkönen et al. 2006).The close co-operation between the four management regions in the Wadden Sea in monitoring the entire Wadden Sea population, provides a unique dataset to study not only the development of the whole population but also enables to compare the four regions. The co-ordinated and synchronized monitoring started in 1974, and is continued since then.For this chapter, I analysed the series of annual counts up to 2014, with the aim to describe the overall population trend, the regional differences in population trends and pup production. Those differences are compared with past and present ma-nagement (related to e.g. hunting, pollution, disturbance, and protection), differen-ces in effects of epizootics and differences in available habitat.
ShiFT in pupping phenology oF harBour SealS(chapter 3 of this thesis: earlier pupping in harbour seals, phoca vitulina)
The tight synchrony of births in harbour seals, ensures pups to be born at the optimal time of year (Boyd 1991a). Timing of birth in most seal species shows little inter-annual variation (Atkinson 1997). Remarkably, the mean of the annual maxi-mum number of pups counted in an area in the Dutch Wadden Sea (Eems-Dollard estuary), was found to have shifted some weeks earlier after the first PDV epizootic in 1988 (Ries & Reijnders 1999). At the time, it was unclear whether this shift in the peak in pupping might have been caused by a changed in age-structure of the po-pulation, as a result of the epizootic, or by other environmental conditions. Chan-ges in age- and sex-structure can lead to biased estimates of population biological parameters through age and sex specific haul-out behaviour (Härkönen et al. 1999, Härkönen et al. 2002). Potentially, such a shift could lead to for example a trophic mismatch between the seals and their prey affecting the survival of the population, or on the other hand it could be a consequence of a shift in prey. Moreover, such a shift could affect survey results. Population estimates of harbour seals based on counts are usually carried out during the breeding period to count pups or during annual moult, when a predictably large proportion of the popula-tion is on land (Meesters et al. 2007, Reijnders et al. 2010a, Teilmann et al. 2010, Cunningham et al. 2010, Bailey et al. 2014, Brown et al. 2005, Thompson et al. 2010, Thompson & Harwood 1990). Both pup and moult counts are expected to reflect the population size and developments. Since it is of utmost importance that counts
of animals for monitoring purposes provide a reliable population index, timing of the annual surveys is critical.As a shift in pupping and/or moult has a bearing on the accuracy and comparabi-lity of the annual survey dataset I used in this thesis, my promotor involved me in a study on a possible shift in reproductive phenology. The working hypothesis was that the observed shift in part of the Wadden Sea was a phenomenon occurring in all the four regions in the Wadden Sea.
MigraTion in a SuppoSeD non-MigraTory SpecieS(chapter 4 of this thesis: Directional breeding migration of harbour seals in the Wadden Sea)
The general perception is that harbour seals are a short ranged, non-migratory species (Bjørge et al. 2002, Härkönen et al. 2006). Being central place foragers they display movements from haul-outs to feeding grounds at sea and vice-versa (Bailey et al. 2014, Russell et al. 2015). Recently long distance movements of individual harbour seals have been recorded, of which some did eventually return (Bajzak et al. 2013, Womble & Gende 2013, Blanchet et al. 2016), however migration as such has yet not been described for this species. Prompted by the observation that a misbalance existed in the pup production throughout the Wadden Sea – a relative surplus of pups in the two German regions compared to the Dutch and Danish region – the hypothesis was put forward that annual migration to and from breeding areas in specific regions in the Wadden Sea would occur (Chapter 2 in this thesis). I followed up on this hypothesis and studied the movements of individual harbour seals using a dataset of 255 harbour seals fit-ted with tracking devices between 2007 and 2016 in the Netherlands. The working hypothesis for this study was that a proportion of females would breed in Germany, and spend other periods either in the Netherlands or elsewhere. Natal philopatry and fidelity of those females to breeding areas would be the underlying reason.
iMMigraTion Fuelling rapiD recoloniSaTion oF The WaDDen Sea By grey SealS(chapter 5 of this thesis: rapid recovery of Dutch grey seal colonies fuelled by immigration)
As grey seals had disappeared from the Wadden Sea area since the Middle Ages and were virtually absent from Dutch waters prior to the 1980’s (Requate 1957, Griffen 1913), it was evident that the area was repopulated from outside the area (Reijn-ders et al. 1995). The establishment of a new breeding population must have been initiated by immigrants from most likely the nearest large colonies located along the North Sea coasts of the UK (Hewer 1974). The UK North Sea population had ten folded (SCOS 2014) and as the colonies in the UK grew, the influx of animals into Dutch waters possibly increased as well. The relative importance of these immi-grants, and the effect on the local breeding population was not well understood. My motivation to start this study was to describe the changes in numbers of grey seals and their geographical expansion in the Dutch Wadden Sea. In particular, we sought to understand the population parameters such as reproduction, fecundity and mortality of this open population like this, and how these changes have been
19
Seals in motion
18
1. Introduction and outline of the thesis
influenced by temporary or permanent immigration. This was based on analysis of three series of annual counts carried out from 1985-2013, during the breeding season, the moult, and summer. Population modelling was also used to determine relative importance of the immigration into the Dutch waters.
grey Seal colonieS in DuTch WaTerS encoMpaSS TranSienT anD reSiDenT SealS (chapter 6 of this thesis: resident and transient grey seals in the north Sea)
Based on boat and aerial surveys it became clear that a constant influx of new breeding seals was needed to fuel the local growth – on average 19% annually – of the Dutch grey seal colonies (Brasseur et al. 2015b). It is also clear that outside the breeding season, during the moult and in the summer, when seals are foraging more intensively, the seals counted on haul-outs in Dutch waters, are a mixture of animals that bred locally and animals breeding elsewhere. This indicates that the number of seals using Dutch waters may differ significantly from those contributing to the breeding population. Moreover, as depending on the age and sex class of the animals, feeding requirements might differ (Beck et al. 2003a, Breed et al. 2006b), these movements might affect the structure of the population. The aerial surveys are mere snapshots of the animals hauling out, and do not provide information on the composition of the colonies. Based on telemetry data from 89 grey seals from 2006-2015 we studied the movements and behaviour especially of those seals that were tracked up to the breeding period. The aim of this paper was to quantify the relative importance of the residents and transient grey seals in Dutch waters. In particular, I intended to investigate whether or not grey seals breeding in Dutch waters would stay as residents to forage, and whether these movements would result in a change in the age and gender structure of the population.
SynTheSiS
This chapter brings together the results and insights gained in previous chapters and put those in perspective of other published studies on how harbour and grey seal population developments are driven by movements. I elaborate on the tension between the fidelity to known areas and the drive to leave for example to find better grounds. Here I discussed when and why seals are most likely to leave an area. This was done to put in perspective our findings that for the two species movement of individual seals fuelled the recovery of the colonies in Dutch waters.
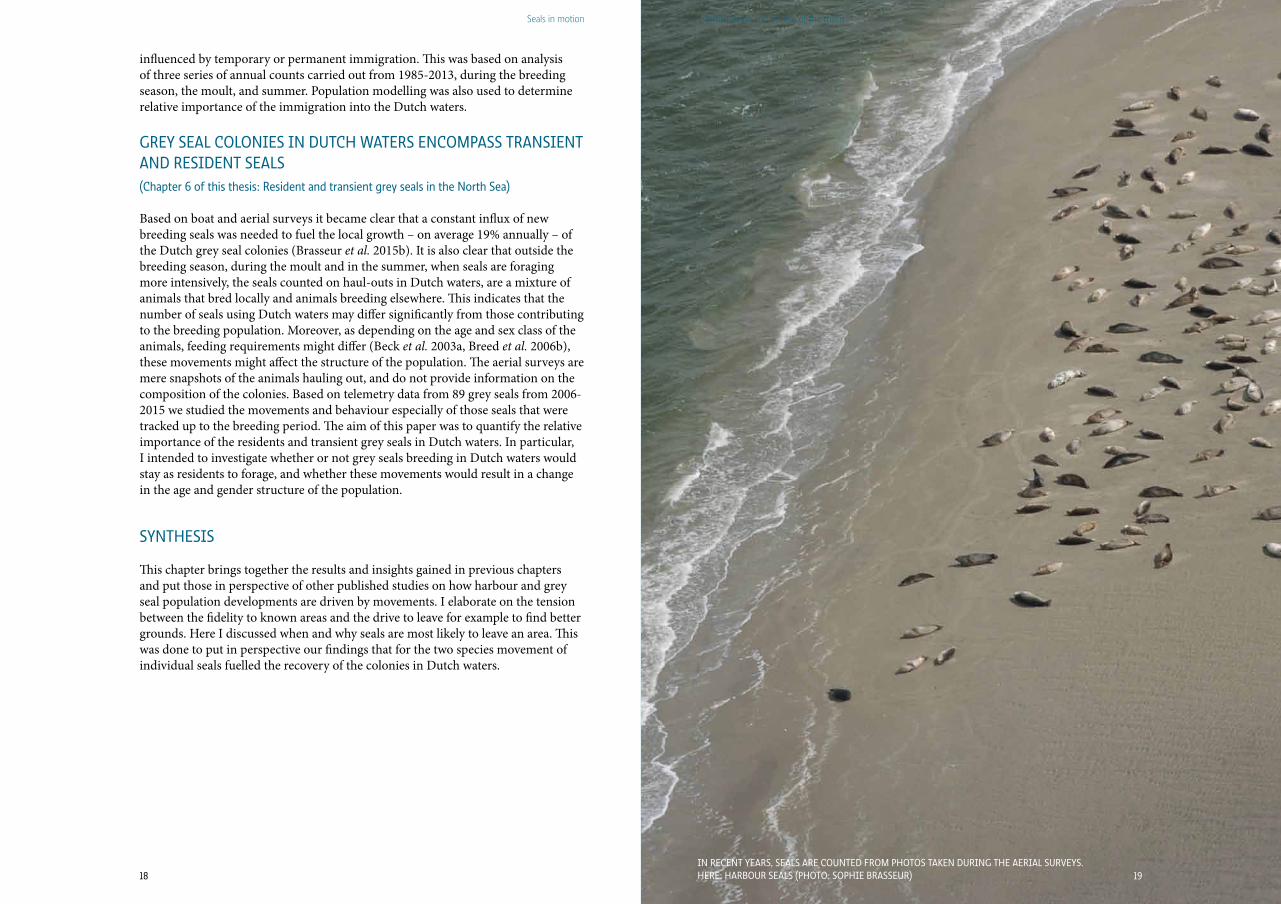
19in recenT yearS, SealS are counTeD FroM phoToS Taken During The aerial SurVeyS. here: harBour SealS (phoTo: Sophie BraSSeur)
21
Seals in motion 2. Echoes from the past: regional variations in recovery within a harbour seal population
Submitted as: Sophie M. J. M. Brasseur, Peter J.H. Reijnders, Jenny Cremer, Erik Meesters, Roger Kirkwood, Lasse Fast Jensen, Armin Jeβ, Anders Galatius, Jonas Teilmann, & Geert Aarts. Echoes from the past: regional variations in recovery within a harbour seal population. Plos one
2. EcHOES fROM THE pAST: REgIONAL vARIATIONS IN REcOvERy wITHIN A HARbOUR SEAL pOpULATION
SuMMary
Terrestrial and marine wildlife populations have been severely reduced by hunting, fishing and habitat destruction, especially in the last centuries. Although manage-ment regulations have led to the recovery of some populations, the underlying processes are not always well understood. This study uses a 40-year time series of counts of harbour seals (Phoca vitulina) in the Wadden Sea to study these processes, and demonstrates the influence of historical regional differences in management regimes on the recovery of this population.While the Wadden Sea is considered one ecologically coupled zone, with a distinct harbour seal population, the area is divided into four geo-political regions i.e. the Netherlands, Lower Saxony including Hamburg, Schleswig-Holstein and Denmark. Gradually, seal hunting was banned between 1962 and 1977 in the different regions. Counts of moulting harbour seals and pup counts, obtained during aerial surveys between 1974 and 2014, show a population growth from approximately 4500 to 39,000 individuals. Population growth models were developed to assess if population growth differed between regions, taking into account two Phocine Distemper Virus (PDV) epizoo-tics, in 1988 and 2002 which seriously affected the population. After a slow start prior to the first epizootic, the overall population grew exponentially at rates close to assumed maximum rates of increase in a harbour seal population. Recently, growth slowed down, potentially indicative of approaching carrying capacity. Regional differences in growth rates were demonstrated, with the highest recovery in Netherlands after the first PDV epizootic (i.e. 17.9%), suggesting that growth was fuelled by migration from the other regions, where growth remained at or below the intrinsic growth rate (13%). The seals’ distribution changed, and although the proportion of seals counted in the German regions declined, they remained by far the most important pupping region, with approximately 70% of all pups being born there.It is hypothesised that differences in hunting regime, preceding the protection in the 1960’s and 1970’s, created unbalance in the distribution of breeding females throughout the Wadden Sea, which prevailed for decades. Breeding site fidelity promoted the growth in pup numbers at less affected breeding sites, while recolo-nisation of new breeding areas would be suppressed by the philopatry displayed by the animals born there. This study shows that for long-lived species, variable management regimes in this case hunting regulations, across a species’ range can drive population dynamics for several generations.
Keywords: conservation, density-dependence, Eastern Atlantic Harbour seals, Phoca vitulina vitulina, hunt, rate of increase, natal philopatry, site fidelity, manage-ment regime, population dynamics, abundance, distribution.
inTroDucTion
Throughout history, humans have impacted wildlife populations. Initially, main impacts resulted from hunting and fishing for food and resources. Later, culling was also carried out to protect livestock, crops, game, or fish stocks. As the human population grew, so did the intensity of hunting, habitat destruction, pollution and effects on global climate, leading to fundamental changes in animal populations
20

22 23
Seals in motion 2. Echoes from the past: regional variations in recovery within a harbour seal population
(Burchard 1998, Pauly et al. 1998, Reijnders 1981, Woodroffe 2005). The combined and often synergistic effects of these threats render it complicated to identify the particular drivers for an observed change. Also, the compromising physiologi-cal stress exerted by these changes could make the populations susceptible to e.g. emerging infectious diseases both in terrestrial and marine ecosystems (Daszak et al. 2000). It is therefore not always clear why efforts to protect species and biodiver-sity (Wolff & Zijlstra 1980, Caughley & Sinclair 1994, Reijnders 1981, Halpern et al. 2008, Reijnders et al. 1993), succeed or fail (Burkey 1989, Clapham et al. 2008). Hunting, both for subsistence and commerce or as a result of local bounties, was the main threat to seal populations until the second half of the 20th century, resulting in a gradual ban throughout most of Europe (Andersen & Olsen 2010, Kokko et al. 1999, Härkönen et al. 2005, Harding & Härkönen 1999, Brasseur et al. 2015b, Patterson et al. 2016, Joensen et al. 1976, Reijnders 1992, Vooys et al. 2012). For harbour seals, pollution and disturbance as a result of industrialisation and urba-nisation, as well as virus epizootic events, further affected population development (Drescher et al. 1977, Reijnders 1981, Brouwer et al. 1989, Reijnders 1985, Reijnders 1986). Recently, British harbour seal populations have suffered new decreases for which the causes are uncertain (Lonergan et al. 2007, SCOS 2010, SCOS 2015), while in Southern Scandinavia and the Wadden Sea, harbour seal populations have shown recovery (Reijnders et al. 2010a, Olsen et al. 2010). Harbour seals in the international Wadden Sea, between Den Helder in the Ne-therlands and Skallingen north of Esbjerg in Denmark, are considered a distinct
population based on their genetic difference from seals in neighbouring regions in the North Sea area (Goodman 1998, Stanley et al. 1996). There are four ma-nagement regions for the Wadden Sea: the Netherlands (NL), Lower Saxony and Hamburg (Germany; LS), Schleswig-Holstein (Germany; SH), and Denmark (DK) (Fig. 1). Despite challenges caused by virus epizootics and growing anthropogenic use of their habitat in the past 50 years, the Wadden Sea harbour seal population has shown exceptional recovery after being severely depleted by hunting. The close cooperation between these regions to monitor the development of this population since 1974 provides a unique dataset to study the population as a whole, but also to study regional differences in the population development and the factors control-ling them. Around 1900, the harbour seal population size in the Wadden Sea might have been at least 40,000 animals (Reijnders 1992), despite enduring centuries of hunting (Re-ijnders 1992, Joensen et al. 1976, de Vooys et al. 2012). Hunting pressure increased in the early 20th century due to the more intensive use of fire arms, and seal num-bers dropped dramatically to approximately 8,000 harbour seals in 1960 (Reijnders 1992). As a response to the low numbers, seal hunting was gradually prohibited: first in the Dutch Wadden Sea in 1962, followed by Lower Saxony in 1971, Schles-wig-Holstein in 1973, and finally the Danish Wadden Sea in 1976 (Reijnders 1981, Reijnders 1983). Despite the ban, numbers continued to drop and by 1974, counts in the international Wadden Sea were down to less than 4,000 animals (Reijnders 1981). Up to the 1980’s, recovery was hindered by the low reproduction especially in the Netherlands, as a result of pollution by polychlorinated biphenyls (PCBs) (Reijnders 1986). Still, a slow recovery could be observed throughout the Wadden Sea. Then in 1988, an outbreak of Phocine Distemper Virus (PDV) killed over 50% of the Wadden Sea population (Reijnders et al. 1997a) and, as the population had recovered, a second outbreak of PDV struck in 2002, killing approximately the same proportion of the population (Harding et al. 2002, Härkönen et al. 2006a). Even with these set-backs, the population continued to grow, and in 2015 the population size in the international Wadden Sea was estimated at 39,000 animals (Galatius et al. 2015), approximately the same amount that were thought to be present in 1900 (Reijnders 1992). The very low numbers after the first PDV epizootic in 1988, gave rise to the pro-tection of harbour seals in Europe under the Habitat and Bird Directive of the EU (II), and since 1991 the Wadden Sea harbour seals have been protected by a Seal Agreement under the Convention on the Conservation of Migratory Species of Wild Animals (Anonymous 1983, Reijnders et al. 1997b) concluded between the Wadden Sea countries (Denmark, Germany and the Netherlands). This agreement is enforced by means of a Trilateral Seal Management Plan. A basis for management is the close cooperation between the countries in the Trilateral Seal Expert Group (TSEG), which strives, for example, to maintain the annual synchronised monito-ring of the whole population by aerial surveys used to fine-tune trilateral or local management decisions. This study represents one of the few long-term (40-year) animal population stu-dies where management differed regionally, providing insight in factors affecting population trends and pup production in the processes of recovery from severe overexploitation. Results potentially have implications for successful conservation of long-lived, broad-ranging, species and the ecosystems in which they live.Figure 1. Map oF The inTernaTional WaDDen Sea (grey area) DoTTeD Black lineS inDicaTe The
BorDerS BeTWeen regionS. inlay: The norTh Sea SiTuaTing The STuDy area

24 25
Seals in motion 2. Echoes from the past: regional variations in recovery within a harbour seal population
MaTerial anD MeThoDS
DaTa collecTionHarbour seals in the Wadden Sea were counted by aerial survey techniques an-nually over a 40-year period (1974-2014; Table S1 and S2). Aerial surveys were carried out from fixed-wing aircraft, flying at elevations of 500-1000 ft. (150-300 m) and speeds of 160 to 220 km/h. Surveys were conducted within a 4-h window between 2 h before and 2 h after low tide, on days when low tides occurred between 12:00 and 16:00 local time (Reijnders et al. 2003a). Surveys were performed on days with no or little rainfall (<10 mm precipitation, measured between 08:00 UTC the preceding day and 08:00 UTC of the flight day), and winds generally were below 25 knots. Prior to the mid 1990s, seals were counted directly by the observers during the flight in all regions, but from then onwards in Denmark, Schleswig-Holstein and the Netherlands seals were photographed using a camera with slide film (until 2000) or digital camera (from 2000 onwards). The animals were counted by the regional monitoring groups, from the pictures. In Lower Saxony, observers con-tinued to count directly during the flight. The objective was to survey each geo political region (Denmark, Schleswig-Holstein, Lower Saxony including Hamburg and the Netherlands: Fig. 1) completely at least five times per year: at least three times during the pupping period (June/July) and at least twice during the moult period (August). The international teams aimed to survey on the same dates, but local circumstances sometimes led to changes or cancellation of flight dates. While data of the individual surveys were available for most years, only the maximum pup and maximum moult counts were available for Germany and Denmark in the first period (1974-1987). During the pupping season, harbour seal pups can be discerned from older animals based on their coloration, size and often proximity to a larger seal (a mother). During the annual moult, shortly after the breeding period, however, pups cannot be discerned from yearlings and, hence, only total seal numbers were recorded. Because of the lack of dimorphism in the species, it was not possible to distinguish males from females during surveys. Grey seals recolonised the Wadden Sea in the late 1980s (Reijnders et al. 1995, Brasseur et al. 2015a, Abt & Engler 2009) and were distinguished from harbour seals based on their habit to lie in clusters, generally larger size, shape (elongated head, often broader thorax), and colouration (e.g. larger spots), and depending on the season, their moult status, as the two species moult at different times of the year. Single young grey seals lying amongst large groups of harbour seals might not have been recognised, but it is unlikely that these individuals compromised the accuracy of estimates of number of either species.
DaTa proceSSingCount data were used to obtain population growth rates for the four Wadden Sea regions and to estimate proportion of pups. All data, including flight conditions and additional notes, were combined into a database for further analysis. Records were allocated to a period, based on the occurrence of the two PDV epizootics: 1974-1987 (I); 1989-2001 (II); and 2003-2014 (III). Data collected in the years of the virus outbreaks (i.e. 1988 and 2002) were excluded from our analysis as the outbreaks occurred during the monitoring period and biased the counts. For Lower Saxony in 1996 and 2008, no counts were available, so instead, numbers were estimated based on the trend in the counts (Brasseur et al. 2008). Assuming that in most years the peak in the number of pups was captured at least
once during the three to five surveys, the response variable for the pups was defined as the annual maximum number of pups counted in each region (Table S2). The numbers recorded during the peak in pup numbers represent approximately 70% of the total annual pup production (Reijnders 1978b, Reijnders et al. 1997a, Fransz & Reijnders 1978, Thompson & Wheeler 2008).The moult counts (including animals of all age classes) are often used as an index of the total population size (Thompson & Harwood 1990). During the moult, numbers of animals hauled out on the sandbanks show a less clear peak than the pupping peak. This is because they represent the sum of different age classes that haul-out in different proportions in relation to timing of their moult (Härkönen et al. 1999). For the German and Danish regions during period I (1974-1987), only maximum moult counts were available. Therefore maximum count during moult was used as response variable (Table S2).
populaTion groWTh raTe MoDelSExponential and density-dependent growth models were fitted to both the pup and moult data. To estimate the exponential growth, generalized linear models (GLM) were fitted, assuming a negative binomial error distribution for the annual pup and moult estimates. The exponential growth model was defined as:
Nt = exp (β0 + rt) eq. 1
where N is either the estimated annual pup or moult count, t is the year (t0=1974), exp(β0) is the initial estimated count at t=0, and r is the instantaneous rate of increase. The initial analysis was performed on the total Wadden Sea population (the sum of all regions). The simplest model included an intercept and year t as an explanatory variable, i.e. assuming a continuous exponential growth between 1974 and 2014. This model was subsequently expanded by allowing the height (defined by the GLM intercept β0) and growth rate (defined by the GLM slope parameter r) to vary between the periods (I, II, and III). Subsequently, new models were fitted to the regional count data, allowing the height and growth rate to also vary between the four regions (NL, LS, SH & DK) and periods, and with interactions between these. The density-dependent model was defined as:
Nt = K eq. 2 1 + exp(a–rt)
where K is the carrying capacity parameter, a is the height and r the growth rate. As for the exponential models, the density-dependent models were first fitted to the total Wadden Sea counts. The simplest model included single estimates for K, a and r. Next, similar to the exponential model fitting, the models were extended by allowing a and/or r to vary by period. Finally, density-dependent models were fitted to the survey data by region, and a separate K for each region was estimated. These density-dependent models were fitted using generalized non-linear models (R-package “gnm”), producing estimates for the parameters K, a and r . The response variable (i.e. counts) was assumed to follow a negative binomial distribution, hence allowing for over-dispersion.The Akaike Information Criteria, AIC (Burnham & Anderson 2002) was used to se-lect the best model. All analysis were carried out in the software R (R Development Core Team 2009). Finally, we estimated the proportion of pups (Härkönen et al. 2002) for each region.

26 27
Seals in motion 2. Echoes from the past: regional variations in recovery within a harbour seal population
We defined the proportion of pups as the maximum number of pups observed each year divided by the number of seals observed during the moult surveys (Reijnders et al. 1997a).
reSulTS
populaTion DeVelopMenTSDespite the occurrence of the two PDV-epizootics in 1988 and 2002, the number of seals during the moult counts for the whole Wadden Sea grew considerably during the study period (Fig. 1 and Table 1). In the pre-epizootics period (period I), they increased from 3,571 in 1974 to 8,670 in 1987, equivalent to an annual rate of 7.2% (95% CI: 6.4%-8.1%; Table 2). The density-dependent model estimated that the number of moulting animals in the counts in 1988 declined from 8,200 to 3,600, a drop of 56%, while the exponential model estimated a drop of 54%. After this first PDV, the seals recovered during period II and counts reached pre-epizootic levels by 1995, and then grew to 16,738 animals in 2001. The annual rate of increase in period II was 12.7% (95% CI 11.7%-13.8%). Again in 2002 the PDV epizootic deci-mated the population and counts were down to 10,285 in 2003, equivalent to 50% and 47% for the density-dependent and exponential models, respectively. The po-pulation recovered and reached pre-epizootic levels by 2007, then grew to a count of 23,722 in 2014. The annual rate of increase of the total population in period III was 8.7%. Using a correction factor of 68% (Ries et al. 1998), based on the average proportion of the seals hauled out in august, the estimated total harbour seal po-pulation size grew during the whole study period (1974-2014) from approximately 4,500 animals to 39,000 animals. The maximum pup numbers counted in the Wadden Sea grew from 687 in 1974 to 8,561 in 2014 and trended in a similar pattern to the moult counts (Fig. 2, Table 2).
The estimated drop in pup numbers as a result of the PDV epidemics seemed lower than the moult counts. In 1988, modelled pup numbers dropped 53% or 51%, res-pectively for the density-dependent model and the exponential model, and in 2002, modelled pup numbers dropped 39% and 37%, for the respective models.For the moult data of the total population, the exponential population model (i.e. GLMs) that fitted best (i.e. lowest AIC) was one where both the height and growth rate differed between periods (i.e. model year * period, Table 1). Adding this inter-action led to a substantial improvement in the model fit (i.e. higher log-likelihood). For the same data the density-dependent model led to a drop in the AIC from 619 (i.e. exponential model) to 609, suggesting that the growth rate in the total popu-
Figure 2. oBSerVeD (poinTS) anD MoDelleD (lineS) counTS For The ToTal WaDDen Sea populaTion During The yearS
1974-2014. DaSheD lineS repreSenT The BeST FiTTing eXponenTial MoDelS (i.e. inTeracTion BeTWeen year anD perioD),
anD SoliD lineS repreSenT DenSiTy-DepenDenT MoDelS (alSo inTeracTion BeTWeen year anD perioD). The horizonTal
DaSheD reD line inDicaTeS The eSTiMaTeD carrying capaciTy For The MoulT counTS.
TaBle 1. SuMMary oF The eXponenTial anD DenSiTy-DepenDenT MoDelS FiTTeD To The MoulT counT (Top) For
all regionS coMBineD anD pup counTS (BoTToM). VariaBleS ShoWn are The DegreeS oF FreeDoM (DF),
log-likelihooD (loglik) anD aic.
TaBle 2. eSTiMaTeD aVerage groWTh raTeS ((λ-1)x 100) in The MoulT counTS (Top) anD pup counTS (BoTToM) For The
DiFFerenT regionS oF The WaDDen Sea anD perioDS oF The STuDy, BaSeD on The BeST FiTTing eXponenTial MoDel
(year * perioD * region). regionS: The neTherlanDS (nl), loWer SaXony (lS), SchleSWig-holSTein (Sh) anD DenMark
(Dk). perioDS: 1974-1987 (i), 1989-2001 (ii), 2003-2014 (iii).

28 29
Seals in motion 2. Echoes from the past: regional variations in recovery within a harbour seal population
lation could have levelled off. For the pup data, the density-dependent model only led to a minor improvement (AIC declines from 531 to 529), and hence there was limited support for a slowing down of the growth rate in pup production.
regional DiFFerenceS In many ways, the developments in the pup counts were similar to the moult counts (Fig. 3). For both counts, a model where both the number of seals and growth rate differed between periods and regions (i.e. model year * period* region; Table 3) was the best model. All regions showed a general recovery, interrupted in 1988 and 2002 by the PDV-epizootic events. However, the speed of recovery varied between the regions (Fig. 3). Throughout the years, the highest moult and pup counts occurred in
Schleswig-Holstein. The only exception was in the years just after the 1988-epizoo-tic, where the PDV caused a drop of 69% in pup numbers of Schleswig-Holstein, while in Lower Saxony and the Netherlands, the pup production was only reduced by 27% and 31%, respectively (Table 4). Interestingly, during period II, the pup numbers in Schleswig-Holstein recovered, and the area was re-affirmed as the stronghold for pup production by the population. In the 1970’s, just after hunting ceased, Denmark and the Netherlands were the regions with the lowest numbers, but after the first epizootic, the number of animals observed in the Netherlands grew most, while the growth in Denmark seemed to level off, especially following the second, 2002-epizootic event.
As pup numbers in the Netherlands grew faster than the Wadden Sea average, numbers in this area outgrew Denmark and, in the course of the study period, ap-proached the numbers in Lower Saxony. Compared to other regions, the numbers in Denmark grew less and were more affected by the second PDV epizootic. At the end of period II, fewer pups were born in the Danish Wadden Sea, compared to the Netherlands and, by 2014, pup numbers in Denmark represented less than 10% of the total pup production.Estimated average growth rates are summarised in Table 2 and shown in Fig. 3 and 4. The better fit of the density-dependent models indicated a possible slowing down in growth during the study period. This was most obvious in Denmark where, in the period after the first epidemic in 1989-2002, the growth remained lower than in the other regions, while the total Wadden Sea population was growing close to its assumed intrinsic rate of increase (13%) (Härkönen et al. 2002). In the last period, growth rates in all regions had dropped. In the first period (I) from 1974 up to the PDV epidemic of 1988, the growth rate in both the moult and pup counts in Denmark was by far the largest (Table 2 and Fig. 4). After the first epidemic in 1988 (period II), the highest growth rate was observed in the Netherlands, while growth in the German regions approximated the intrinsic growth rate estimated for this species, and growth in Denmark slowed down. For all regions, the density-dependent model showed an initial high rate after the epizoo-tic, which slowed down gradually.
Figure 3. reSulTS For The BeST FiTTing eXponenTial (Top) anD DenSiTy DepenDenT MoDelS (BoTToM) For The harBour
SealS in The Four regionS (The neTherlanDS (nl), loWer SaXony (lS), SchleSWig-holSTein (Sh) anD DenMark (Dk)) oF
The WaDDen Sea. The lineS repreSenT The eSTiMaTeS For The MoulT counTS (leFT) anD pup counTS (righT), anD DoTS The
oBSerVeD MaXiMuM counTS.
TaBle 3. SuMMary oF BoTh The eXponenTial anD DenSiTy-DepenDenT MoDel FiTTeD To The MoulT counT (Top)
anD pup counTS (BoTToM). VariaBleS ShoWn are The DegreeS oF FreeDoM (DF), log-likelihooD (loglik) anD aic.
30 31
Seals in motion 2. Echoes from the past: regional variations in recovery within a harbour seal population
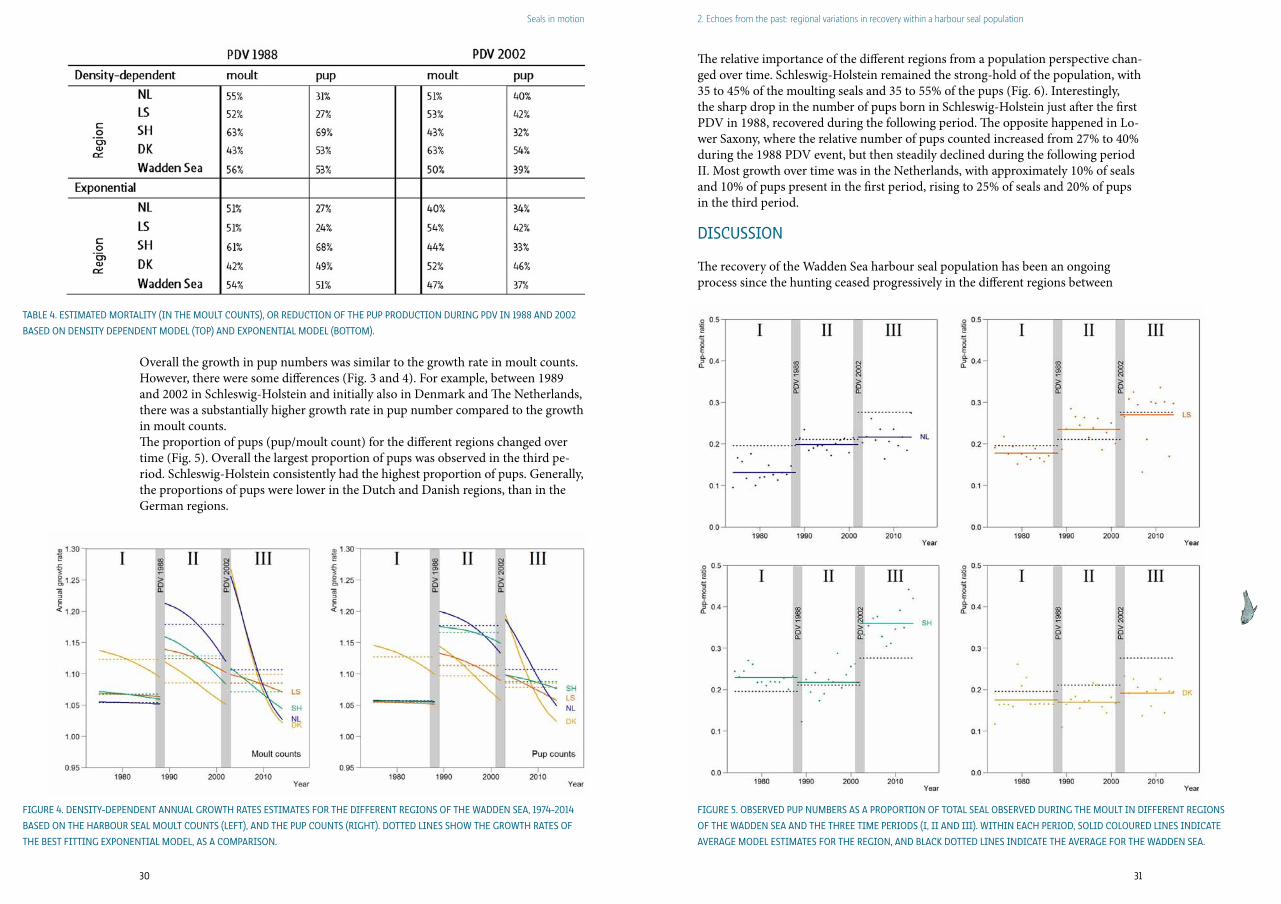
Overall the growth in pup numbers was similar to the growth rate in moult counts. However, there were some differences (Fig. 3 and 4). For example, between 1989 and 2002 in Schleswig-Holstein and initially also in Denmark and The Netherlands, there was a substantially higher growth rate in pup number compared to the growth in moult counts. The proportion of pups (pup/moult count) for the different regions changed over time (Fig. 5). Overall the largest proportion of pups was observed in the third pe-riod. Schleswig-Holstein consistently had the highest proportion of pups. Generally, the proportions of pups were lower in the Dutch and Danish regions, than in the German regions.
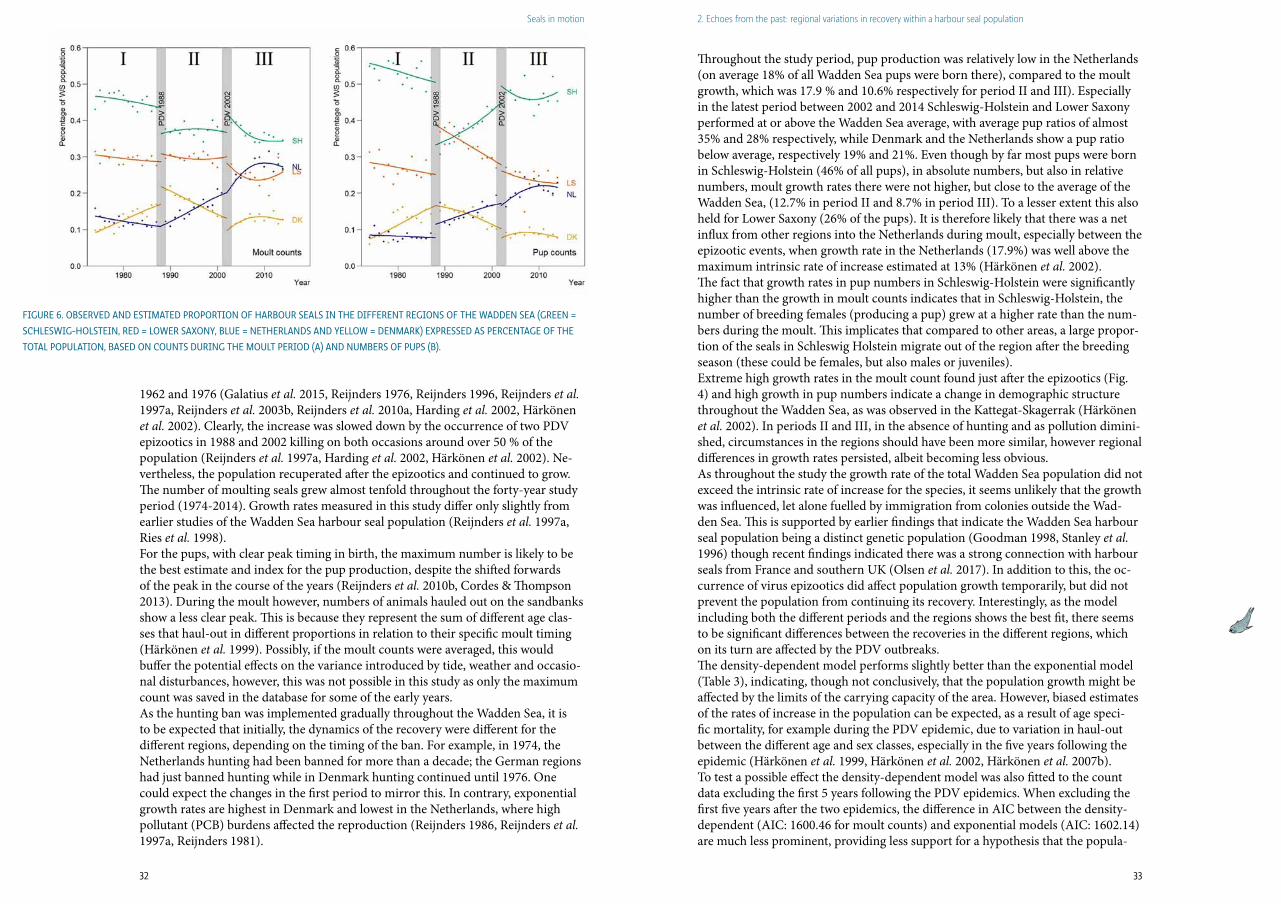
The relative importance of the different regions from a population perspective chan-ged over time. Schleswig-Holstein remained the strong-hold of the population, with 35 to 45% of the moulting seals and 35 to 55% of the pups (Fig. 6). Interestingly, the sharp drop in the number of pups born in Schleswig-Holstein just after the first PDV in 1988, recovered during the following period. The opposite happened in Lo-wer Saxony, where the relative number of pups counted increased from 27% to 40% during the 1988 PDV event, but then steadily declined during the following period II. Most growth over time was in the Netherlands, with approximately 10% of seals and 10% of pups present in the first period, rising to 25% of seals and 20% of pups in the third period.
DiScuSSion
The recovery of the Wadden Sea harbour seal population has been an ongoing process since the hunting ceased progressively in the different regions between
Figure 4. DenSiTy-DepenDenT annual groWTh raTeS eSTiMaTeS For The DiFFerenT regionS oF The WaDDen Sea, 1974-2014
BaSeD on The harBour Seal MoulT counTS (leFT), anD The pup counTS (righT). DoTTeD lineS ShoW The groWTh raTeS oF
The BeST FiTTing eXponenTial MoDel, aS a coMpariSon.
Figure 5. oBSerVeD pup nuMBerS aS a proporTion oF ToTal Seal oBSerVeD During The MoulT in DiFFerenT regionS
oF The WaDDen Sea anD The Three TiMe perioDS (i, ii anD iii). WiThin each perioD, SoliD coloureD lineS inDicaTe
aVerage MoDel eSTiMaTeS For The region, anD Black DoTTeD lineS inDicaTe The aVerage For The WaDDen Sea.
TaBle 4. eSTiMaTeD MorTaliTy (in The MoulT counTS), or reDucTion oF The pup proDucTion During pDV in 1988 anD 2002
BaSeD on DenSiTy DepenDenT MoDel (Top) anD eXponenTial MoDel (BoTToM).
32 33
Seals in motion 2. Echoes from the past: regional variations in recovery within a harbour seal population
1962 and 1976 (Galatius et al. 2015, Reijnders 1976, Reijnders 1996, Reijnders et al. 1997a, Reijnders et al. 2003b, Reijnders et al. 2010a, Harding et al. 2002, Härkönen et al. 2002). Clearly, the increase was slowed down by the occurrence of two PDV epizootics in 1988 and 2002 killing on both occasions around over 50 % of the population (Reijnders et al. 1997a, Harding et al. 2002, Härkönen et al. 2002). Ne-vertheless, the population recuperated after the epizootics and continued to grow. The number of moulting seals grew almost tenfold throughout the forty-year study period (1974-2014). Growth rates measured in this study differ only slightly from earlier studies of the Wadden Sea harbour seal population (Reijnders et al. 1997a, Ries et al. 1998).For the pups, with clear peak timing in birth, the maximum number is likely to be the best estimate and index for the pup production, despite the shifted forwards of the peak in the course of the years (Reijnders et al. 2010b, Cordes & Thompson 2013). During the moult however, numbers of animals hauled out on the sandbanks show a less clear peak. This is because they represent the sum of different age clas-ses that haul-out in different proportions in relation to their specific moult timing (Härkönen et al. 1999). Possibly, if the moult counts were averaged, this would buffer the potential effects on the variance introduced by tide, weather and occasio-nal disturbances, however, this was not possible in this study as only the maximum count was saved in the database for some of the early years.As the hunting ban was implemented gradually throughout the Wadden Sea, it is to be expected that initially, the dynamics of the recovery were different for the different regions, depending on the timing of the ban. For example, in 1974, the Netherlands hunting had been banned for more than a decade; the German regions had just banned hunting while in Denmark hunting continued until 1976. One could expect the changes in the first period to mirror this. In contrary, exponential growth rates are highest in Denmark and lowest in the Netherlands, where high pollutant (PCB) burdens affected the reproduction (Reijnders 1986, Reijnders et al. 1997a, Reijnders 1981).
Throughout the study period, pup production was relatively low in the Netherlands (on average 18% of all Wadden Sea pups were born there), compared to the moult growth, which was 17.9 % and 10.6% respectively for period II and III). Especially in the latest period between 2002 and 2014 Schleswig-Holstein and Lower Saxony performed at or above the Wadden Sea average, with average pup ratios of almost 35% and 28% respectively, while Denmark and the Netherlands show a pup ratio below average, respectively 19% and 21%. Even though by far most pups were born in Schleswig-Holstein (46% of all pups), in absolute numbers, but also in relative numbers, moult growth rates there were not higher, but close to the average of the Wadden Sea, (12.7% in period II and 8.7% in period III). To a lesser extent this also held for Lower Saxony (26% of the pups). It is therefore likely that there was a net influx from other regions into the Netherlands during moult, especially between the epizootic events, when growth rate in the Netherlands (17.9%) was well above the maximum intrinsic rate of increase estimated at 13% (Härkönen et al. 2002). The fact that growth rates in pup numbers in Schleswig-Holstein were significantly higher than the growth in moult counts indicates that in Schleswig-Holstein, the number of breeding females (producing a pup) grew at a higher rate than the num-bers during the moult. This implicates that compared to other areas, a large propor-tion of the seals in Schleswig Holstein migrate out of the region after the breeding season (these could be females, but also males or juveniles). Extreme high growth rates in the moult count found just after the epizootics (Fig. 4) and high growth in pup numbers indicate a change in demographic structure throughout the Wadden Sea, as was observed in the Kattegat-Skagerrak (Härkönen et al. 2002). In periods II and III, in the absence of hunting and as pollution dimini-shed, circumstances in the regions should have been more similar, however regional differences in growth rates persisted, albeit becoming less obvious. As throughout the study the growth rate of the total Wadden Sea population did not exceed the intrinsic rate of increase for the species, it seems unlikely that the growth was influenced, let alone fuelled by immigration from colonies outside the Wad-den Sea. This is supported by earlier findings that indicate the Wadden Sea harbour seal population being a distinct genetic population (Goodman 1998, Stanley et al. 1996) though recent findings indicated there was a strong connection with harbour seals from France and southern UK (Olsen et al. 2017). In addition to this, the oc-currence of virus epizootics did affect population growth temporarily, but did not prevent the population from continuing its recovery. Interestingly, as the model including both the different periods and the regions shows the best fit, there seems to be significant differences between the recoveries in the different regions, which on its turn are affected by the PDV outbreaks. The density-dependent model performs slightly better than the exponential model (Table 3), indicating, though not conclusively, that the population growth might be affected by the limits of the carrying capacity of the area. However, biased estimates of the rates of increase in the population can be expected, as a result of age speci-fic mortality, for example during the PDV epidemic, due to variation in haul-out between the different age and sex classes, especially in the five years following the epidemic (Härkönen et al. 1999, Härkönen et al. 2002, Härkönen et al. 2007b). To test a possible effect the density-dependent model was also fitted to the count data excluding the first 5 years following the PDV epidemics. When excluding the first five years after the two epidemics, the difference in AIC between the density-dependent (AIC: 1600.46 for moult counts) and exponential models (AIC: 1602.14) are much less prominent, providing less support for a hypothesis that the popula-
Figure 6. oBSerVeD anD eSTiMaTeD proporTion oF harBour SealS in The DiFFerenT regionS oF The WaDDen Sea (green =
SchleSWig-holSTein, reD = loWer SaXony, Blue = neTherlanDS anD yelloW = DenMark) eXpreSSeD aS percenTage oF The
ToTal populaTion, BaSeD on counTS During The MoulT perioD (a) anD nuMBerS oF pupS (B).
34 35
Seals in motion 2. Echoes from the past: regional variations in recovery within a harbour seal population
tion is approaching its carrying capacity. However for this latter exercise, much less points were available, and therefore the ability to detect a density dependent effect is reduced.In the third period after the 2002 epizootics, average growth rate was positive in the total Wadden Sea (8.7% pa), but was below the intrinsic rate across the regions. Based on the AIC, the density dependent model performs slightly better than an exponential model, again indicating a possible start of density dependence. The density-dependent model indicates that the estimated carrying capacity K would currently be at a population size of 50,000 (95% CI 37,000-63,000) animals when correcting for animals not seen during the counts (correction factor 1.47 (Ries et al. 1998)). The population estimate for 2014, using the same factor is almost 35,000 animals. In future years it should become clear whether the population is reaching the carrying capacity for the current Wadden Sea ecosystem.
regional DiFFerenceS in populaTion DeVelopMenT
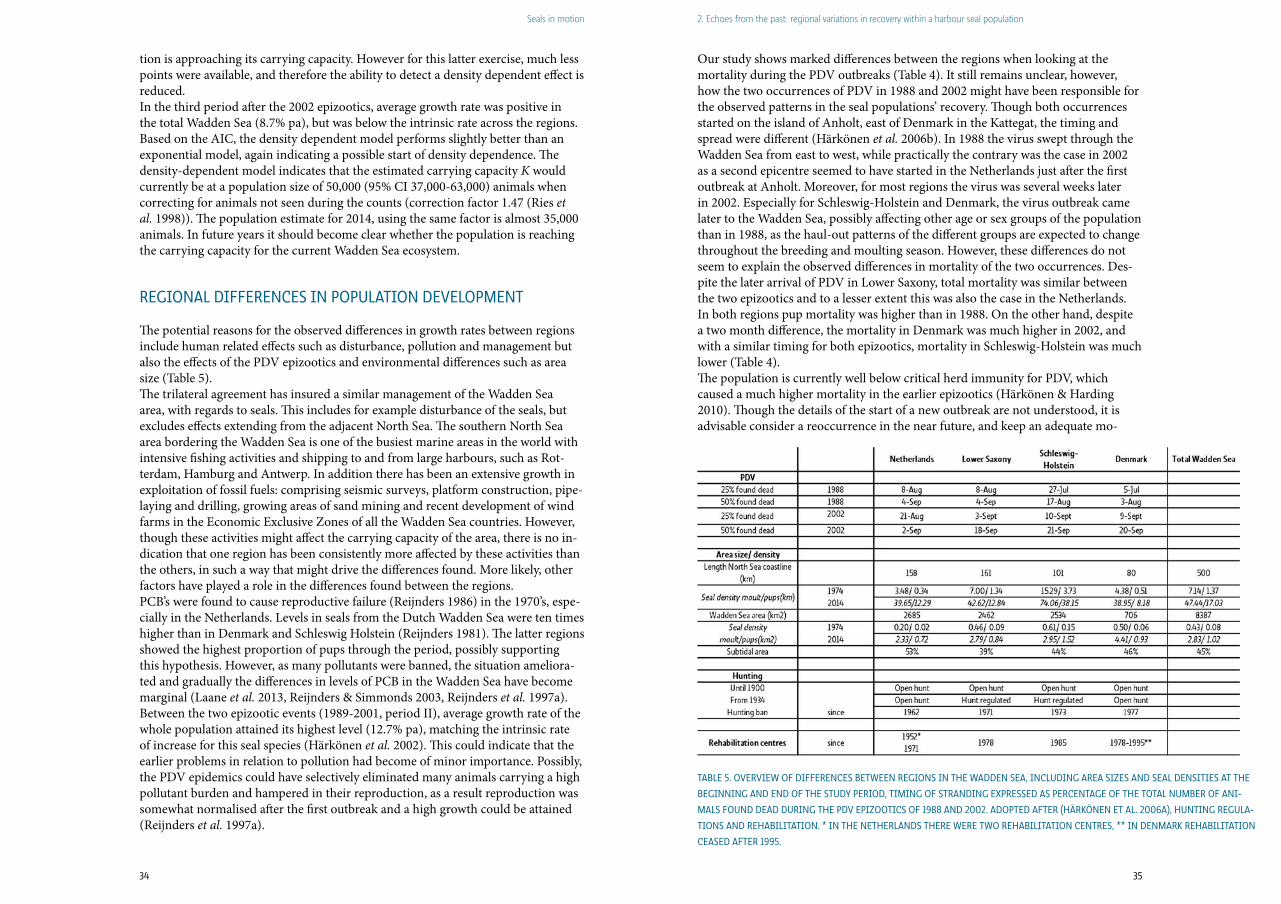
The potential reasons for the observed differences in growth rates between regions include human related effects such as disturbance, pollution and management but also the effects of the PDV epizootics and environmental differences such as area size (Table 5). The trilateral agreement has insured a similar management of the Wadden Sea area, with regards to seals. This includes for example disturbance of the seals, but excludes effects extending from the adjacent North Sea. The southern North Sea area bordering the Wadden Sea is one of the busiest marine areas in the world with intensive fishing activities and shipping to and from large harbours, such as Rot-terdam, Hamburg and Antwerp. In addition there has been an extensive growth in exploitation of fossil fuels: comprising seismic surveys, platform construction, pipe-laying and drilling, growing areas of sand mining and recent development of wind farms in the Economic Exclusive Zones of all the Wadden Sea countries. However, though these activities might affect the carrying capacity of the area, there is no in-dication that one region has been consistently more affected by these activities than the others, in such a way that might drive the differences found. More likely, other factors have played a role in the differences found between the regions.PCB’s were found to cause reproductive failure (Reijnders 1986) in the 1970’s, espe-cially in the Netherlands. Levels in seals from the Dutch Wadden Sea were ten times higher than in Denmark and Schleswig Holstein (Reijnders 1981). The latter regions showed the highest proportion of pups through the period, possibly supporting this hypothesis. However, as many pollutants were banned, the situation ameliora-ted and gradually the differences in levels of PCB in the Wadden Sea have become marginal (Laane et al. 2013, Reijnders & Simmonds 2003, Reijnders et al. 1997a).Between the two epizootic events (1989-2001, period II), average growth rate of the whole population attained its highest level (12.7% pa), matching the intrinsic rate of increase for this seal species (Härkönen et al. 2002). This could indicate that the earlier problems in relation to pollution had become of minor importance. Possibly, the PDV epidemics could have selectively eliminated many animals carrying a high pollutant burden and hampered in their reproduction, as a result reproduction was somewhat normalised after the first outbreak and a high growth could be attained (Reijnders et al. 1997a).
Our study shows marked differences between the regions when looking at the mortality during the PDV outbreaks (Table 4). It still remains unclear, however, how the two occurrences of PDV in 1988 and 2002 might have been responsible for the observed patterns in the seal populations’ recovery. Though both occurrences started on the island of Anholt, east of Denmark in the Kattegat, the timing and spread were different (Härkönen et al. 2006b). In 1988 the virus swept through the Wadden Sea from east to west, while practically the contrary was the case in 2002 as a second epicentre seemed to have started in the Netherlands just after the first outbreak at Anholt. Moreover, for most regions the virus was several weeks later in 2002. Especially for Schleswig-Holstein and Denmark, the virus outbreak came later to the Wadden Sea, possibly affecting other age or sex groups of the population than in 1988, as the haul-out patterns of the different groups are expected to change throughout the breeding and moulting season. However, these differences do not seem to explain the observed differences in mortality of the two occurrences. Des-pite the later arrival of PDV in Lower Saxony, total mortality was similar between the two epizootics and to a lesser extent this was also the case in the Netherlands. In both regions pup mortality was higher than in 1988. On the other hand, despite a two month difference, the mortality in Denmark was much higher in 2002, and with a similar timing for both epizootics, mortality in Schleswig-Holstein was much lower (Table 4). The population is currently well below critical herd immunity for PDV, which caused a much higher mortality in the earlier epizootics (Härkönen & Harding 2010). Though the details of the start of a new outbreak are not understood, it is advisable consider a reoccurrence in the near future, and keep an adequate mo-
TaBle 5. oVerVieW oF DiFFerenceS BeTWeen regionS in The WaDDen Sea, incluDing area SizeS anD Seal DenSiTieS aT The
Beginning anD enD oF The STuDy perioD, TiMing oF STranDing eXpreSSeD aS percenTage oF The ToTal nuMBer oF ani-
MalS FounD DeaD During The pDV epizooTicS oF 1988 anD 2002. aDopTeD aFTer (hÄrkÖnen eT al. 2006a), hunTing regula-
TionS anD rehaBiliTaTion. * in The neTherlanDS There Were TWo rehaBiliTaTion cenTreS, ** in DenMark rehaBiliTaTion
ceaSeD aFTer 1995.

36 37
Seals in motion 2. Echoes from the past: regional variations in recovery within a harbour seal population
nitoring operable. This is also the case for other diseases. In the autumn of 2014 an avian flu epidemic caused elevated mortality in the eastern Wadden Sea area (Denmark and Schleswig-Holstein) and practically no effect in the west (Lower Saxony and the Netherlands) (Bodewes et al. 2015). This event occurred after our study period. The carrying capacity for the number of animals hauled out within regions may be influenced by size or quality of the habitats available. This could be either feeding habitats or habitats for resting and breeding. Telemetry data show that, even though they haul-out in the Wadden Sea, the majority of the seals forage in the adjacent North Sea (Brasseur et al. 2010a, Brasseur et al. 2011b, Kirkwood et al. 2015, Bras-seur & Kirkwood 2016, Tougaard et al. 2006). Within the Wadden sea area the regions vary considerably in size (Table 5). Of the four Wadden Sea regions, Den-mark is the smallest both in coastline (a proxy for accessibility to feeding grounds) and area (possible haul-out), and is therefore expected to have the lowest carrying capacity. Possibly, the higher seal density per km2, as a result, might explain the slower growth observed in the later periods, although the area does not hold the highest density of pups, nor the most animals per km coastline. However the rela-tion between seal density and surface area or coast length is not always clear when observing the densities in both the numbers of seals and pups born. For example, based on coastline, Schleswig-Holstein clearly is more densely used than are the other regions and especially for pup production, which in Schleswig-Holstein is 2-4 times the density of other regions. Interestingly, the Netherlands is the largest both in coastline and area, while numbers were initially lowest, the highest growth has been observed in this region. Though there are differences in growth rates that are possibly related to the carrying capacity, it is unlikely that the available land habitat would be the sole driver of the differences in growth between the regions, especially in the earlier periods, when numbers were still relatively low. We conclude therefore that there must have been other factors that contributed to these differences. Since 1952, seals have been captured, rehabilitated and released in the Wadden Sea. While in Denmark seals which are found orphaned or injured have not been taken in for rehabilitation since 1995, in the Netherlands and Germany, rehabilitation has been common practice throughout the study period. Two rescue centres have been active during the study period in the Netherlands. In Germany, there are also two rescue centres; one in Lower Saxony, and one in Schleswig-Holstein. Though total numbers of seals (adults and pups) released into the wild were relatively low, amounting to approximately two hundred seals in average and tree hundred in ex-treme years (Trilateral Seal Expert Group, unpublished data; 2000-2010) this might also have somewhat affected the observed changes in the population, especially when the total number of seals were low. In order to study the exact magnitude of the effect and differences between regions, more information is needed.Historical findings show that seals throughout the Wadden Sea have been hunted by man for centuries, ever since man colonised the area around 3500 BC (Water-bolk 1976). In addition to hunting for subsistence or profit, seals became persecuted because of their perceived or actual impacts on fish catches and damage to fishing gear. In the Netherlands, for example, one of the first bounty hunts was proclaimed in the late 1500s (de Vooys et al. 2012, Hart 2007). Generally, pressure increased as better hunting techniques developed – especially through modernisations in firearms which made hunting much more effective (de Vooys et al. 2012). However, during the 19th and 20th centuries, regional differences developed as the different
countries applied different management strategies. The situation in the Netherlands was very similar to Denmark, where more or less any citizen could hunt for seals. Bounty systems effectively reduced the seal population significantly (Joensen et al. 1976). Especially after the 2nd World War in the Netherlands, annual hunting mortality was estimated to be 55% of the total counts (Bemmel 1956). In contrast, hunting mortality in Germany was estimated to be much lower, 7%. Moreover, hunting during the pupping season was forbidden from 1938 onwards (Hoffmeyer 1962). Following the hunting law, only specially appointed game keepers, “Jagdauf-seher”, were entitled to capture and kill seals. Seals were completely protected from hunting in the Netherlands in 1962, in Germany 1971-73 and in Denmark in 1976. We hypothesise that the differences in hunting regulations and pressure in the first half of the 1900s, which led to local dissolution of seal breeding grounds in the Da-nish and Dutch regions, could be one of the most important causes for the observed differences in seal densities during the breeding period. The mechanism for sustaining the different pup densities could be the high degree of site fidelity and natal philopatry shown by harbour seals (Härkönen & Harding 2001, Dietz et al. 2012, Womble & Gende 2013, Sharples et al. 2012). The assump-tion is that relatively many females and their pups survived in the more sustainably hunted German breeding area, as less seals were killed and mothers and pups were not hunted during breeding. During other periods seals could redistribute, only to come back to breed. As 70% of the pups are born in the German regions, there must be an unequal post-breeding dispersal of reproductive females throughout the area. As such, more pups could be born in the preferred breeding areas than can be expected from the seal distribution outside the breeding season. This breeding migration towards the German Wadden Sea has been confirmed from the Nether-lands on several occasions (Brasseur et al. 2011b, Kirkwood et al. 2015, Brasseur & Kirkwood 2016). Some indication for this behaviour can also be found in the recovery of Schleswig-Holstein after the first PDV epidemic. Then pup counts dropped below those of Lower Saxony indicating that breeding animals had been killed disproportionally in that region. However within period II pup numbers grew and Schleswig-Holstein attained higher pup numbers compared to the other areas. Possibly this recovery was fuelled by animals returning to their natal sites as they reached reproductive age. Possibly this effect was magnified in the Netherlands by the suppression of the reproduction by PCB’s, especially in period I and beginning of II (Reijnders 1986, Reijnders et al. 1997a). For the Wadden Sea, the German regions could be considered to be sources and Denmark and the Netherlands sinks (Pulliam 1988). However pupping habitat quality, in terms of available sandbanks, access channels, protection from distur-bance, seems to be relatively uniform throughout the region. Therefore, the regional developments are more likely driven by breeding and natal site-fidelity. A form of “hidden source sink dynamics” (Contasti et al. 2013, Gundersen et al. 2001), may more accurately describe the situation. Here, animals migrate from areas where more pups are born to areas where fewer pups are born, prompting growth throug-hout the range. Migration between sites could also help to explain the very high growth rates at-tained in the Netherlands (Reijnders 1981, Reijnders 1983). Previously, an unba-lanced age structure has been proposed as an explanation for this growth, where a relatively higher proportion of adult females could produce a high pup rate for

38 39
Seals in motion 2. Echoes from the past: regional variations in recovery within a harbour seal population
a number of years (Härkönen & Harding 2001, Härkönen et al. 2007b). Howe-ver, such an imbalance is unlikely to prevail for decades. In the years between the epizootic events, numbers in the Dutch Wadden Sea grew at an average of 17.9% pa, while for the total Wadden Sea; growth remained below 13% pa. The latter is close to the intrinsic rate of increase for harbour seals (Härkönen et al. 2002). So more likely, high levels of migration explained the higher growth rate in the Netherlands at that time.
concluSion
Although the international Wadden Sea could be regarded as a single connected ecological system, where seals are capable of migrating between the geo-political regions, large regional differences within the harbour seal population growth rate and pupping success are apparent. Though there seems to be some factors differing between the regions, differences in hunting pressure and in regulations enforced in the past seem to be a dominant factor in the observed patterns. These findings reveal that different management regimes operating 40 years ago still influence the current population structure, distribution and demography. This long-term effect is a consequence of the longevity of the animals and their site faithful-
ness during breeding. It is important to realise that, management decisions regar-ding seals, could affect the distribution and development of populations even long after their implementation. The same could hold for many other species though few populations have been studied or monitored as long as the Wadden Sea harbour seals. These effects could also occur under much less drastic management regimes, such as closure or opening of areas for the public, or for (industrial) development, affecting the carrying capacity of the area, but might also affect certain groups in the population more than others. Though the disturbances might be less crucial for the survival of individual animals than hunting, they could cause displacement which in-turn might have long term effects.
Figure 7. eXaMpleS oF TrackS oF SiX aDulT FeMaleS TaggeD in The neTherlanDS (Black circleS), MigraTing ToWarDS gerMany During The pupping SeaSon (pink circleS)(BraSSeur eT al. 2011B, kirkWooD eT al. 2015, BraSSeur & kirkWooD 2016) .

40 41
Seals in motion 2. Echoes from the past: regional variations in recovery within a harbour seal population
Si TaBle 1. oVerVieW oF nuMBer oF SurVeyS per year. M = MoulT, p = pupping SeaSon.
Si TaBle 2. annual MaXiMuM counTS For ToTal nuMBerS (During MoulT) anD pupS. leFT coluMn inDicaTeS The perioDS.

Seals in motion hoofdstuk
43iniTially, The SMall harBour Seal pupS are eaSily iDenTiFieD By Their Size anD
colour, laTer in The SeaSon, DiFFerenceS are leSS clear (phoTo: Sophie BraSSeur) 42

45
Seals in motion 3. Earlier pupping in Harbour seals, phoca vitulina
Published as: Peter J.H. Reijnders, Sophie M. J. M. Brasseur, Erik Meesters (2010) Earlier pupping in harbour seals, Phoca vitulina. Biol. Lett. (2010) 6, 854–857
SuMMary
The annual reproductive cycle of most seal species is characterized by a tight syn-chrony of births. Typically, timing of birth shows little inter-annual variation. Here, however we show that harbour seals Phoca vitulina from the Wadden Sea (southeast North Sea) have shortened their yearly cycle, moving parturition to earlier dates since the early 1970s. Between 1974 and 2009, the birth date of harbour seals shifted on average by -0.71 d yr-1 , three and a half weeks (25 days) earlier, in the Dutch part of the Wadden Sea. Pup counts available for other parts of the Wadden Sea were analysed, showing a similar shift. To elucidate potential mechanism(s) for this shift in pupping phenology, possible changes in population demography, changes in ma-ternal life-history traits and variations in environmental conditions were examined. It was deduced that the most likely mechanism was a shortening of embryonic dia-pause. We hypothesize that this could have been facilitated by an improved forage base, e.g. increase of small fishes, attributable to overfishing of large predator fishes and size-selective fisheries.Keywords: pupping phenology; seals; forage base; fisheries impact.
3. EARLIER pUppINg IN HARbOUR SEALS, pHOcA vITULINA
inTroDucTion
Harbour seals are seasonal breeders. The female reproductive cycle after parturition consists of lactation followed by oestrus and mating. Placental gestation starts after an obligate period of delayed implantation (Reijnders 1986, Boyd 1991b).The annual reproductive cycle of most seal species is characterized by a tight synchrony of births, ensuring that pups are born at the optimal time of year (Boyd 1991b). Typically, timing of birth in most seal species shows little inter-annual variation (Atkinson 1997). Here, we report that harbour seals Phoca vitulina from the Wadden Sea (southeast North Sea) have shortened their yearly cycle, resulting in a birth peak 25 days earlier than in the 1970s. We investigated in which phase of the reproductive cycle these changes might have occurred, and possible underlying mechanisms generating the observed changes.
MaTerial anD MeThoDS
The harbour seal population in the Wadden Sea (southeast North Sea), regarded as a discrete population, is monitored through a series of annual aerial surveys (Reijn-ders et al. 1997a). From 1974 to 2009, the total number of seals and number of pups are counted throughout the whelping period. Data for harbour seals in the Dutch Wadden Sea were used to investigate the timing of pupping. Given the distribu-tion of births over the whelping period (Reijnders et al. 1997a), the date where the maximum number of pups is counted each year was chosen as a proxy for the peak timing of birth.We fitted a model to the pup count data using generalized additive models (Wood 2006a). Data collected in years 1988, 1989, 2002 and 2003 were excluded as two virus outbreaks in 1988 and 2002 caused increased variation in the counts. The following model was found to best describe the data:
E[PUPSi] = ƒ (yeari, julian_dayi)
where PUPSi negative binomial, ƒ is a smooth function combining year and julian_day and i indicates the observation.The fitted model (M1) was used to generate predictions for the number of pups that would have been counted daily in the pupping seasons between 1974 and 2009 and to estimate the date of the maximum pup count each year. To limit the influence of estimated smoothing parameters of M1, we first generated a bootstrap sampling distribution (20 bootstraps) of the parameters to approximate the true function (Wood 2006a). Each bootstrap was then used to simulate 50 replicate parameter sets from the posterior distribution of the estimated parameters producing 1000 simulations. The median Julian day at which the maximum number of pups occur-red and confidence limits were calculated from the simulations. Note that for these predictions, the years around the virus epizootics were included. All computations were calculated within the R environment (R Development Core Team 2009) v. 2.10.0, 2009, using package mgcv (Wood 2006a).
44

46 47
Seals in motion 3. Earlier pupping in Harbour seals, phoca vitulina
reSulTS The model outcome is shown in figure 1. The observed annual pup counts enabled the estimation of the most likely date at which the number of pups reached its maximum value. The median Julian day at which maximum number of pups occurred, and the 95% confidence interval, are given in figure 2. (For count dates and variance associated with model fit, see supplement) Between 1974 and 2009, the pupping time of harbour seals in the Dutch part of the Wadden Sea shifted by -0.71 d yr-1 (95% confidence limits (CL): 0.57, 0.83), which equates to a mean pup-ping date three and a half weeks earlier (25 days, CL 20, 29 days) by 2009. This shift was continual but not constant over the period studied (figure 2), and strongest between 1986 and 1990 (see also supplement figure 1, lower panel). The persistent shift since 1974 indicates that the changed phenology in pupping may have started prior to survey start. However, there are no pup counts to investigate that.Pup counts available for other parts of the Wadden Sea (Schleswig Holstein and Niedersachsen) for the same period were analysed and similar shifts (-0.68 d yr-1, CL 0.56, 0.82, respectively, -0.59 d yr-1, CL 0.35, 1.0) were found (supplement figure 2 & 3).
Figure 1. eSTiMaTeD pup counT (logariThMically TranSForMeD) VerSuS Julian Day anD year. ViSualizaTion oF The gene-
ralizeD aDDiTiVe MoDel (gaM), Which uSeD a TWo-DiMenSional SMooTher coMBining Julian Day anD year To eSTiMaTe
pup counT. The MoDel eXplaineD 94.6% oF The ToTal DeViance. noTe hoW The yearly peak MoVeS FroM righT To leFT oVer
The yearS, While pup nuMBerS increaSe SiMulTaneouSly. inSeTS: TWo-DiMenSional panelS For FirST anD laST year oF
TiMe SerieS.
Figure 2. DaTeS on Which MaXiMuM nuMBer oF pupS iS eSTiMaTeD To haVe occurreD. eSTiMaTeS Were oBTaineD By uSing
a coMBinaTion oF BooTSTrapping anD SaMpling FroM The poSTerior DiSTriBuTion oF The gaM coeFFicienTS To geT 1000
SiMulaTionS. FroM each SiMulaTion, The yearly DaTe WiTh MaXiMuM nuMBer oF pupS WaS calculaTeD, uSing a pre-
conSTrucTeD preDicTion DaTaSeT, proViDing 1000 DaTeS For each year. horizonTal DaSheS ShoW MeDian DaTe, BarS: 95%
cl BaSeD on The 2.5 anD 97.5 quanTileS; open circleS, Day nuMBerS When counTS Were carrieD ouT; Black SquareS, When
MaXiMuM WaS counTeD.
DiScuSSion
Here, we report on a continual shift in birth date of harbour seals in the Dutch Wadden Sea over decades. Given the similar results found for harbour seals in other parts of the Wadden Sea, we conclude that the factor causing this shift has acted on the entire harbour seal population.A possible mechanism for this shift in pupping could be a shortening of one or se-veral stages in the reproductive cycle, including lactation, delayed implantation and placental gestation. Most pinnipeds have highly synchronized annual reproduction, however, variation in the mean date of parturition may occur. Photoperiod at the time of implantation is an important factor in the timing of reproduction in seals (Temte 1994). However, there has been no change in day length in the Wadden Sea over the period of study (KNMI Database).Body condition at the time of implantation may cause changes in the timing of births (Boyd 1984). For instance, reduced prey availability may lead to later birth and implantation, and increase the time from conception to birth (Bowen et al. 2003, Jemison & Kelly 2001). Finally, changes in age structure may also influence pupping phenology, as older females tend to give birth earlier than younger females (Boyd 1996, Reiter et al. 1981).As a possible explanation for the shift, we examined changes in population age-structure. The two virus epizootics (1988 and 2002), killing about 50 per cent of the population, are considered to have temporarily (5–6 years) affected age structure (Härkönen et al. 1999). Given the episodic character of these events compared with the smoothness of the trend (figure 2), it appears unlikely that changes in age struc-

48 49
Seals in motion 3. Earlier pupping in Harbour seals, phoca vitulina
ture would explain our observations. Except for the epizootics, the relative growth rate remained constant, supporting our conclusion that the change in pupping time is not driven by internal age-structure.We then investigated changes in maternal nutritional condition and related life-history traits as possible explanatory factors, starting with placental gestation. Birth mass is positively correlated with maternal mass in seals, but the duration of active gestation is only marginally influenced by maternal condition (Boyd 1991b, Mellish et al. 1999). Apparently heavier mothers produce heavier pups, but in the same time span as lighter mothers. It seems unlikely that a shortened placental gestation would cause the observed shift, as the duration of placental gestation hardly varies among species (Boyd 1991b). Consequently, only a shortening of either lactation period and/or period of delayed implantation could explain our observations. Duration of lactation in harbour seals was not affected during the years of reduced prey availability Bowen et al. (2003) and furthermore, in grey seals (Halichoerus grypus) lactation duration was unrelated to postpartum maternal mass (Kovacs & Lavigne 1986). Maternal mass apparently influences weaning mass but not the duration of lactation.Implantation date in harp seals (Pagophilus groenlandicus) was, however, affected by maternal condition (Stewart et al. 1989). We therefore suggest earlier timing of implantation as the most likely mechanism explaining the observed shift. Possibly, nutritional condition of the mother after lactation and during embryonic diapause is of importance. Females undergo rapid weight loss during lactation and mating, and may need to acquire a fatness threshold prior to implantation (Stewart et al. 1989). However, during the early part of embryonic diapause, animals haul-out fre-quently for moulting and time for feeding is limited. In other words, the better the food acquisition during and after lactation, the earlier they regain the mass needed for implantation. Improved prey availability, may therefore accelerate the replenish-ment of used fat reserves, and thus facilitate a shortening of embryonic diapause.Harbour seals consume a variety of small, generally demersal (bottom dwelling) fish species, and forage in both the Wadden Sea and North Sea (Brasseur et al. 2004). Long-term trawl surveys (1977–2001) in the North Sea revealed that abundance of small fishes including demersal species have increased steadily and significantly from 1977 till 1987 (Daan et al. 2005). Intense fishing of larger fishes in the North Sea has caused both a shift to smaller species and a decrease of large predator fishes, and hence predation on small fishes has decreased (Jennings et al. 2002). In parallel, total biomass in Dutch estuarine and coastal fishes increased from 1970 to mid-1980s (Tulp et al. 2008). It is therefore plausible that over the last three to four decades, as a result of fisheries, the prey available to seals has increased in our study area. This is supported by the increase of avian predators specializing on similar small prey (e.g. red throated divers Gavia stellata) in our study area since 1972 (Camphuysen 2009). There is a strong correlation (Spearman’s rho 20.79) between the shift in pupping and increase in small fishes (less than or equal to 20 cm) in the southeast North Sea (see also supplement figure 1). We hypothesize that the ob-served shift in pupping phenology has been facilitated by an improved forage base as a result of overfishing predator fishes and size-selective fisheries. That improved the condition of females in the pre-implantation period and triggered a shortening of embryonic diapause. It is interesting to see whether this shift might be reversed when this exponentially growing population (Reijnders et al. 2009) approaches car-rying capacity of the area.
SuppleMenT
We first examined whether a seasonal shift in food availability could be related to the observed earlier pupping time. Many studies have examined biological changes in relation to climatic change by analysing systematic trends across diverse taxa and regions (Parmesan & Yohe 2003, Root et al. 2003). Of interest and related to our study are data on phenological changes in relation to changes in temperature. Data on mammals were so scarce, however, that no estimated means of phenological shifts could be examined (Parmesan & Yohe 2003, Root et al. 2003). As a proxy for a temporal shift in food availability we used data on peak spring/summer abundance of brown shrimp (Crangon crangon) in the Wadden Sea, collected by the Royal NIOZ. Brown or common shrimp represents an abundant and well documented species in the region, and due to its high abundance forms a key component of the trophic web. It is an extensive food source for several predators including fish, crustaceans and shorebirds (del Norte-Campos & Temming 1994, Pihl 1985, Walter & Becker 1997). We tested the months at which shrimp abundance peaked, versus year. Regression analysis showed that the regression coefficient was far from signi-ficant (F1,31 = 0.142, p = 0.71). We concluded that it was therefore unlikely that the earlier pupping could be attributed to a seasonal shift in food availability.
Fish community changesWe used data on changes in abundance of small fish (from the Demersal Young Fish Survey) to examine the relative abundance of small fish in the south eastern North Sea (Fig.7c in Daan et al. (2005)). These are the main foraging grounds for harbour seals from the Wadden Sea (Brasseur et al. 2004). Intense fishing has caused both a
SuppleMenT Figure 1. upper panel: The raTio BeTWeen nuMBer oF SMall FiSh (ln(cpue)) FroM (Daan eT al. 2005)anD ToTal
nuMBer oF harBour SealS (MaXiMuM nuMBer counTeD) For each year aS a MeaSure oF SMall FiSh aVailaBiliTy To SealS;
loWer panel: The yearly ShiFT in pupping TiMe aS eSTiMaTeD By linear regreSSion BeTWeen The preViouS anD The neXT
year. BecauSe The preDicTionS only incluDe Whole DayS, TheSe ValueS can only Be MulTipleS oF 0.5.
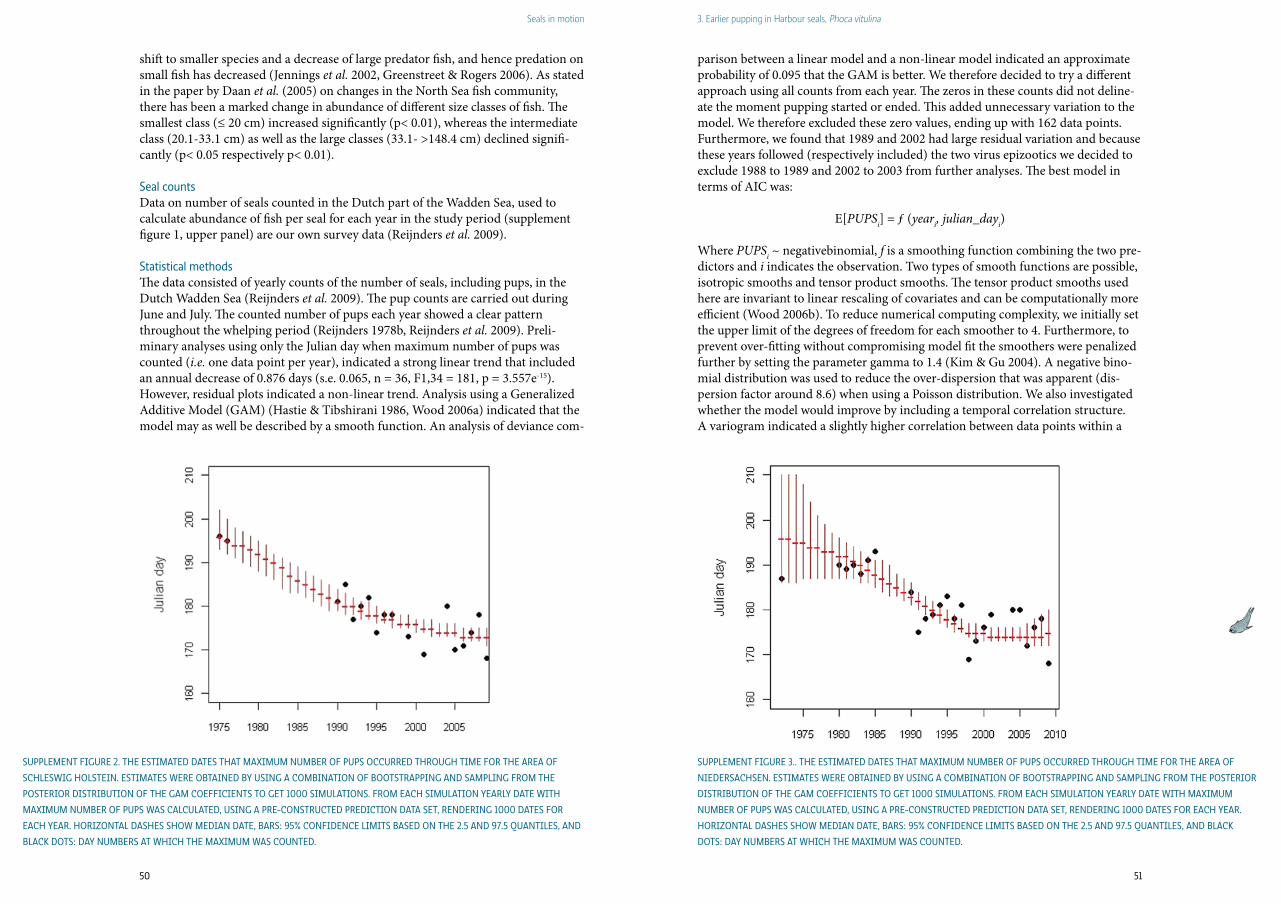
50 51
Seals in motion 3. Earlier pupping in Harbour seals, phoca vitulina
shift to smaller species and a decrease of large predator fish, and hence predation on small fish has decreased (Jennings et al. 2002, Greenstreet & Rogers 2006). As stated in the paper by Daan et al. (2005) on changes in the North Sea fish community, there has been a marked change in abundance of different size classes of fish. The smallest class (≤ 20 cm) increased significantly (p< 0.01), whereas the intermediate class (20.1-33.1 cm) as well as the large classes (33.1- >148.4 cm) declined signifi-cantly (p< 0.05 respectively p< 0.01).
Seal countsData on number of seals counted in the Dutch part of the Wadden Sea, used to calculate abundance of fish per seal for each year in the study period (supplement figure 1, upper panel) are our own survey data (Reijnders et al. 2009). Statistical methodsThe data consisted of yearly counts of the number of seals, including pups, in the Dutch Wadden Sea (Reijnders et al. 2009). The pup counts are carried out during June and July. The counted number of pups each year showed a clear pattern throughout the whelping period (Reijnders 1978b, Reijnders et al. 2009). Preli-minary analyses using only the Julian day when maximum number of pups was counted (i.e. one data point per year), indicated a strong linear trend that included an annual decrease of 0.876 days (s.e. 0.065, n = 36, F1,34 = 181, p = 3.557e-15). However, residual plots indicated a non-linear trend. Analysis using a Generalized Additive Model (GAM) (Hastie & Tibshirani 1986, Wood 2006a) indicated that the model may as well be described by a smooth function. An analysis of deviance com-
parison between a linear model and a non-linear model indicated an approximate probability of 0.095 that the GAM is better. We therefore decided to try a different approach using all counts from each year. The zeros in these counts did not deline-ate the moment pupping started or ended. This added unnecessary variation to the model. We therefore excluded these zero values, ending up with 162 data points. Furthermore, we found that 1989 and 2002 had large residual variation and because these years followed (respectively included) the two virus epizootics we decided to exclude 1988 to 1989 and 2002 to 2003 from further analyses. The best model in terms of AIC was:
E[PUPSi] = ƒ (yeari, julian_dayi)
Where PUPSi ~ negativebinomial, f is a smoothing function combining the two pre-dictors and i indicates the observation. Two types of smooth functions are possible, isotropic smooths and tensor product smooths. The tensor product smooths used here are invariant to linear rescaling of covariates and can be computationally more efficient (Wood 2006b). To reduce numerical computing complexity, we initially set the upper limit of the degrees of freedom for each smoother to 4. Furthermore, to prevent over-fitting without compromising model fit the smoothers were penalized further by setting the parameter gamma to 1.4 (Kim & Gu 2004). A negative bino-mial distribution was used to reduce the over-dispersion that was apparent (dis-persion factor around 8.6) when using a Poisson distribution. We also investigated whether the model would improve by including a temporal correlation structure. A variogram indicated a slightly higher correlation between data points within a
SuppleMenT Figure 3.. The eSTiMaTeD DaTeS ThaT MaXiMuM nuMBer oF pupS occurreD Through TiMe For The area oF
nieDerSachSen. eSTiMaTeS Were oBTaineD By uSing a coMBinaTion oF BooTSTrapping anD SaMpling FroM The poSTerior
DiSTriBuTion oF The gaM coeFFicienTS To geT 1000 SiMulaTionS. FroM each SiMulaTion yearly DaTe WiTh MaXiMuM
nuMBer oF pupS WaS calculaTeD, uSing a pre-conSTrucTeD preDicTion DaTa SeT, renDering 1000 DaTeS For each year.
horizonTal DaSheS ShoW MeDian DaTe, BarS: 95% conFiDence liMiTS BaSeD on The 2.5 anD 97.5 quanTileS, anD Black
DoTS: Day nuMBerS aT Which The MaXiMuM WaS counTeD.
SuppleMenT Figure 2. The eSTiMaTeD DaTeS ThaT MaXiMuM nuMBer oF pupS occurreD Through TiMe For The area oF
SchleSWig holSTein. eSTiMaTeS Were oBTaineD By uSing a coMBinaTion oF BooTSTrapping anD SaMpling FroM The
poSTerior DiSTriBuTion oF The gaM coeFFicienTS To geT 1000 SiMulaTionS. FroM each SiMulaTion yearly DaTe WiTh
MaXiMuM nuMBer oF pupS WaS calculaTeD, uSing a pre-conSTrucTeD preDicTion DaTa SeT, renDering 1000 DaTeS For
each year. horizonTal DaSheS ShoW MeDian DaTe, BarS: 95% conFiDence liMiTS BaSeD on The 2.5 anD 97.5 quanTileS, anD
Black DoTS: Day nuMBerS aT Which The MaXiMuM WaS counTeD.
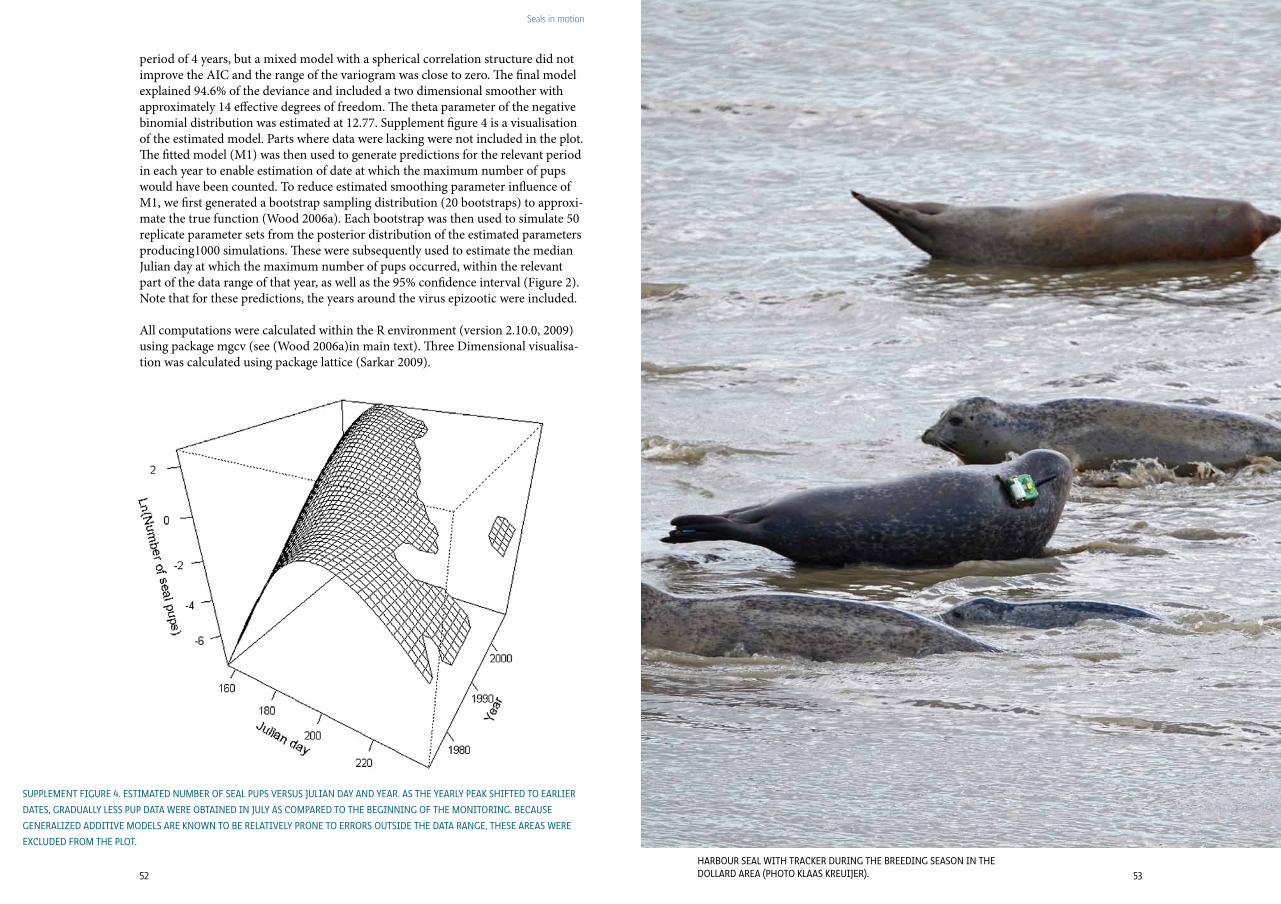
52
Seals in motion
53
period of 4 years, but a mixed model with a spherical correlation structure did not improve the AIC and the range of the variogram was close to zero. The final model explained 94.6% of the deviance and included a two dimensional smoother with approximately 14 effective degrees of freedom. The theta parameter of the negative binomial distribution was estimated at 12.77. Supplement figure 4 is a visualisation of the estimated model. Parts where data were lacking were not included in the plot. The fitted model (M1) was then used to generate predictions for the relevant period in each year to enable estimation of date at which the maximum number of pups would have been counted. To reduce estimated smoothing parameter influence of M1, we first generated a bootstrap sampling distribution (20 bootstraps) to approxi-mate the true function (Wood 2006a). Each bootstrap was then used to simulate 50 replicate parameter sets from the posterior distribution of the estimated parameters producing1000 simulations. These were subsequently used to estimate the median Julian day at which the maximum number of pups occurred, within the relevant part of the data range of that year, as well as the 95% confidence interval (Figure 2). Note that for these predictions, the years around the virus epizootic were included.
All computations were calculated within the R environment (version 2.10.0, 2009) using package mgcv (see (Wood 2006a)in main text). Three Dimensional visualisa-tion was calculated using package lattice (Sarkar 2009).
SuppleMenT Figure 4. eSTiMaTeD nuMBer oF Seal pupS VerSuS Julian Day anD year. aS The yearly peak ShiFTeD To earlier
DaTeS, graDually leSS pup DaTa Were oBTaineD in July aS coMpareD To The Beginning oF The MoniToring. BecauSe
generalizeD aDDiTiVe MoDelS are knoWn To Be relaTiVely prone To errorS ouTSiDe The DaTa range, TheSe areaS Were
eXcluDeD FroM The ploT.
harBour Seal WiTh Tracker During The BreeDing SeaSon in The DollarD area (phoTo klaaS kreuiJer).
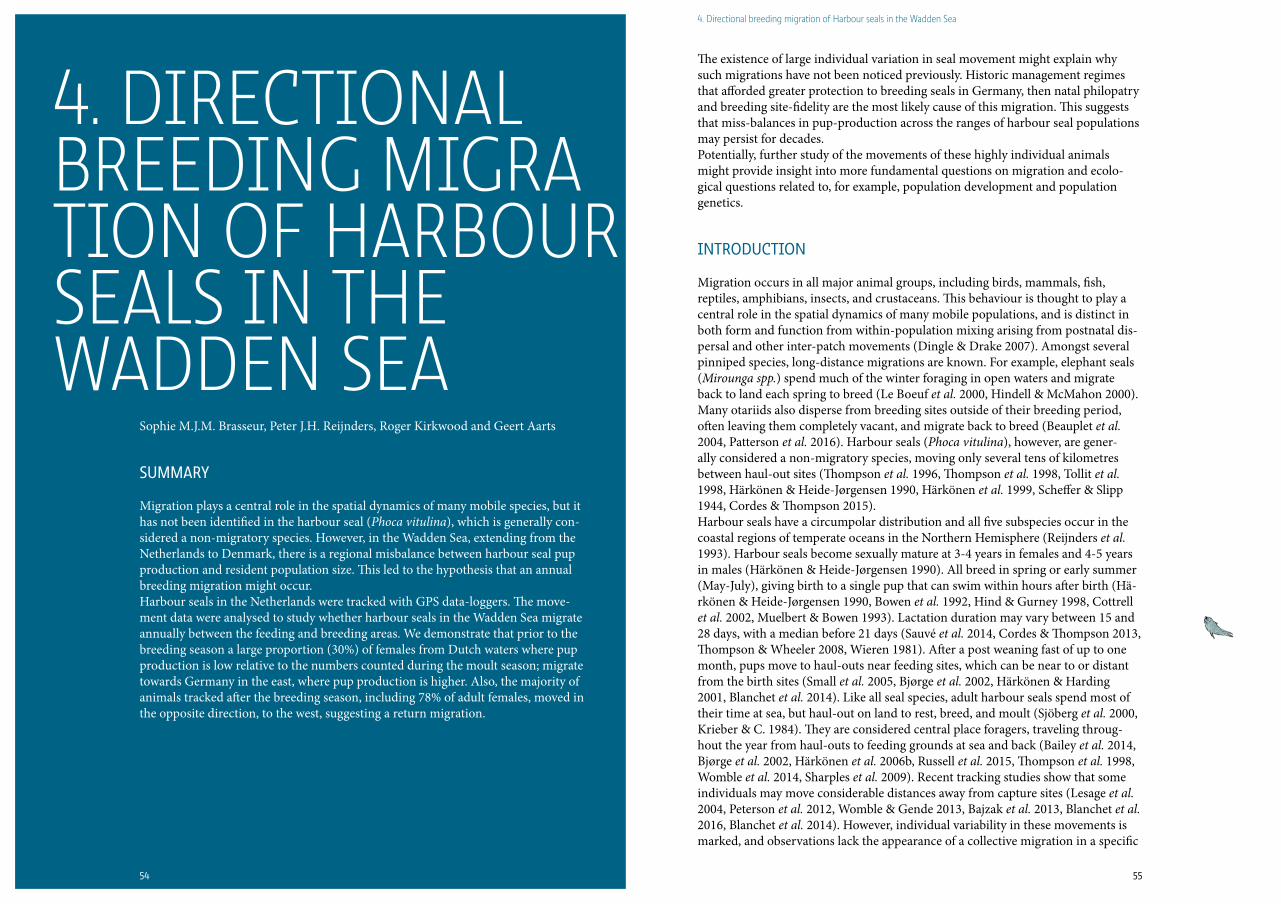
54 55
Seals in motion 4. Directional breeding migration of Harbour seals in the wadden Sea
Sophie M.J.M. Brasseur, Peter J.H. Reijnders, Roger Kirkwood and Geert Aarts
SuMMary
Migration plays a central role in the spatial dynamics of many mobile species, but it has not been identified in the harbour seal (Phoca vitulina), which is generally con-sidered a non-migratory species. However, in the Wadden Sea, extending from the Netherlands to Denmark, there is a regional misbalance between harbour seal pup production and resident population size. This led to the hypothesis that an annual breeding migration might occur.Harbour seals in the Netherlands were tracked with GPS data-loggers. The move-ment data were analysed to study whether harbour seals in the Wadden Sea migrate annually between the feeding and breeding areas. We demonstrate that prior to the breeding season a large proportion (30%) of females from Dutch waters where pup production is low relative to the numbers counted during the moult season; migrate towards Germany in the east, where pup production is higher. Also, the majority of animals tracked after the breeding season, including 78% of adult females, moved in the opposite direction, to the west, suggesting a return migration.
4. DIREcTIONAL bREEDINg MIgRATION Of HARbOUR SEALS IN THE wADDEN SEA
54
The existence of large individual variation in seal movement might explain why such migrations have not been noticed previously. Historic management regimes that afforded greater protection to breeding seals in Germany, then natal philopatry and breeding site-fidelity are the most likely cause of this migration. This suggests that miss-balances in pup-production across the ranges of harbour seal populations may persist for decades.Potentially, further study of the movements of these highly individual animals might provide insight into more fundamental questions on migration and ecolo-gical questions related to, for example, population development and population genetics.
inTroDucTion
Migration occurs in all major animal groups, including birds, mammals, fish, reptiles, amphibians, insects, and crustaceans. This behaviour is thought to play a central role in the spatial dynamics of many mobile populations, and is distinct in both form and function from within-population mixing arising from postnatal dis-persal and other inter-patch movements (Dingle & Drake 2007). Amongst several pinniped species, long-distance migrations are known. For example, elephant seals (Mirounga spp.) spend much of the winter foraging in open waters and migrate back to land each spring to breed (Le Boeuf et al. 2000, Hindell & McMahon 2000). Many otariids also disperse from breeding sites outside of their breeding period, often leaving them completely vacant, and migrate back to breed (Beauplet et al. 2004, Patterson et al. 2016). Harbour seals (Phoca vitulina), however, are gener-ally considered a non-migratory species, moving only several tens of kilometres between haul-out sites (Thompson et al. 1996, Thompson et al. 1998, Tollit et al. 1998, Härkönen & Heide-Jørgensen 1990, Härkönen et al. 1999, Scheffer & Slipp 1944, Cordes & Thompson 2015). Harbour seals have a circumpolar distribution and all five subspecies occur in the coastal regions of temperate oceans in the Northern Hemisphere (Reijnders et al. 1993). Harbour seals become sexually mature at 3-4 years in females and 4-5 years in males (Härkönen & Heide-Jørgensen 1990). All breed in spring or early summer (May-July), giving birth to a single pup that can swim within hours after birth (Hä-rkönen & Heide-Jørgensen 1990, Bowen et al. 1992, Hind & Gurney 1998, Cottrell et al. 2002, Muelbert & Bowen 1993). Lactation duration may vary between 15 and 28 days, with a median before 21 days (Sauvé et al. 2014, Cordes & Thompson 2013, Thompson & Wheeler 2008, Wieren 1981). After a post weaning fast of up to one month, pups move to haul-outs near feeding sites, which can be near to or distant from the birth sites (Small et al. 2005, Bjørge et al. 2002, Härkönen & Harding 2001, Blanchet et al. 2014). Like all seal species, adult harbour seals spend most of their time at sea, but haul-out on land to rest, breed, and moult (Sjöberg et al. 2000, Krieber & C. 1984). They are considered central place foragers, traveling throug-hout the year from haul-outs to feeding grounds at sea and back (Bailey et al. 2014, Bjørge et al. 2002, Härkönen et al. 2006b, Russell et al. 2015, Thompson et al. 1998, Womble et al. 2014, Sharples et al. 2009). Recent tracking studies show that some individuals may move considerable distances away from capture sites (Lesage et al. 2004, Peterson et al. 2012, Womble & Gende 2013, Bajzak et al. 2013, Blanchet et al. 2016, Blanchet et al. 2014). However, individual variability in these movements is marked, and observations lack the appearance of a collective migration in a specific

56 57
Seals in motion 4. Directional breeding migration of Harbour seals in the wadden Sea
direction. So, despite some long-distance movements, observations of migration as such has not been described for this species. In the Wadden Sea, however, analysis of aerial surveys revealed a regional misbalance in the pup production compared with resident population sizes, leading to the hypothesis that an annual migration to and from specific breeding areas in the Wadden Sea could occur (Brasseur et al. submitted 2017). Population estimates of harbour seals are usually based on counts of pups during the breeding period and population counts during annual moult, when a predic-tably large proportion of the seals is on land (Brasseur et al. 2015, Teilmann et al. 2010, Cunningham et al. 2010, Bailey et al. 2014, Reijnders et al. 2010a, Thompson et al. 2010, Meesters et al. 2007, Brown et al. 2005, Thompson & Harwood 1990). In the Wadden Sea, which comprises four geo-political regions (Denmark, two Ger-man states and the Netherlands), harbour seal pup production in the two German regions showed a relative surplus throughout 40 years of monitoring, between 1974 and 2014 (Brasseur et al. submitted 2017). As there are no evident environmen-tal differences between the four regions, it was hypothesised that a proportion of females that bred in Germany, spent other periods of the year in either the Nether-lands or Denmark. The situation potentially arose as a carry-over effect of variations in historical management. Hunting potentially caused a more serious decimation of the breeding grounds in the Netherland and Denmark, than in the German areas (Reijnders 1992, Reijnders 1983, Joensen et al. 1976, Hoffmeyer 1962). Natal philopatry and fidelity of the seals to breeding areas in Germany could fuel seasonal
migrations to and from these areas, and consequently the observed longstanding regional differences in the ratio of pup production versus number of seals observed during the moult might persist for decades. The aim of this paper is to test the hypothesis of directional breeding migration by harbour seals in the Wadden Sea by analysing individual tracking records obtained from harbour seals caught in Dutch waters.
MaTerial & MeThoDS
Seal TrackingBetween 2007 and 2016, 225 harbour seals were captured and fitted with tracking devices in the framework of different telemetry projects in the Netherlands (Bras-seur et al. 2011a, Kirkwood et al. 2015, Brasseur et al. 2011b, Brasseur & Kirkwood 2016). Catch sites were spread across the Dutch coastal zone, in four areas: the Ems River Estuary in the eastern Wadden Sea, near the island of Ameland in the central Wadden Sea, near the island of Texel in the western Wadden Sea and in the Delta region, in the south-west of the Netherlands (Figure 1; Table 1). Deployment periods were either in early spring (March; n=123), preceding the harbour seals’ breeding period, which is in May-July, or in autumn, after the seals’ moult (Septem-ber; n=78, or November; n=24). All seals were captured by deploying a specifically designed seine-net of approxima-tely 100 m adjacent to a group of seals lying on a haul-out site, typically an interti-dal sandbar. Seals fled into the water and became entangled in the net, which was rapidly hauled onto the sandbar. Seals were selected for tracking, aiming for equal numbers of adult females, adult males and sub-adult animals of either sex (Table 1). Unselected seals were immediately released. The selected seals were restrained in specifically-designed cradles for 30–90 min. They were sexed, measured (standard length, nose to tail, in cm) and weighed (±0.5 kg), and assigned to an age-group based on standard length; females >125 cm and males >130 cm were considered to be adult (Härkönen & Heide-Jørgensen 1990).Each seal was equipped with a GPS-GSM tracking device (Sea Mammal Research Unit, University of St Andrews) with Fastloc GPS hardware (developed by Wild-track Telemetry Systems Ltd, Leeds, United Kingdom). These devices collect and store location, dive, and haul-out data which are relayed via the GSM mobile phone system (Cronin et al. 2010). They were glued to the seal’s fur, at the mid-dorsal point immediately above the shoulder blades, using epoxy resin (Permacol). Trackers could stop functioning or fall off any time after deployment, but certainly were lost during the moult in summer (June-August). A total of 10 trackers stopped functioning within 20 days and, were disregarded in this analysis (Table 1).
DaTa analySiSClassification of pregnant femalesWe interpreted whether female seals pupped based on the data recorded by their trackers. Contrary to most phocid species that remain on land to breed and suckle, harbour seal pups may swim directly after birth so their mothers continue to dive throughout the lactation period (Muelbert & Bowen 1993), albeit being limited by the young pup’s swimming ability. As the pup develops it’s diving capacity during lactation, the mother may venture deeper with her pup or feed alone for short
TaBle 1. SuMMary oF harBour SealS equippeD WiTh SaTelliTe or gpS/gSM TranSMiTTerS in The neTherlanDS. TrackerS
ThaT FuncTioneD 20 DayS or leSS (n=10) are inDicaTeD in SuperScripT (SeX: F= FeMale, M=Male; age eSTiMaTeD BaSeD on
lengTh: a= aDulT, Sa= SuB-aDulT).
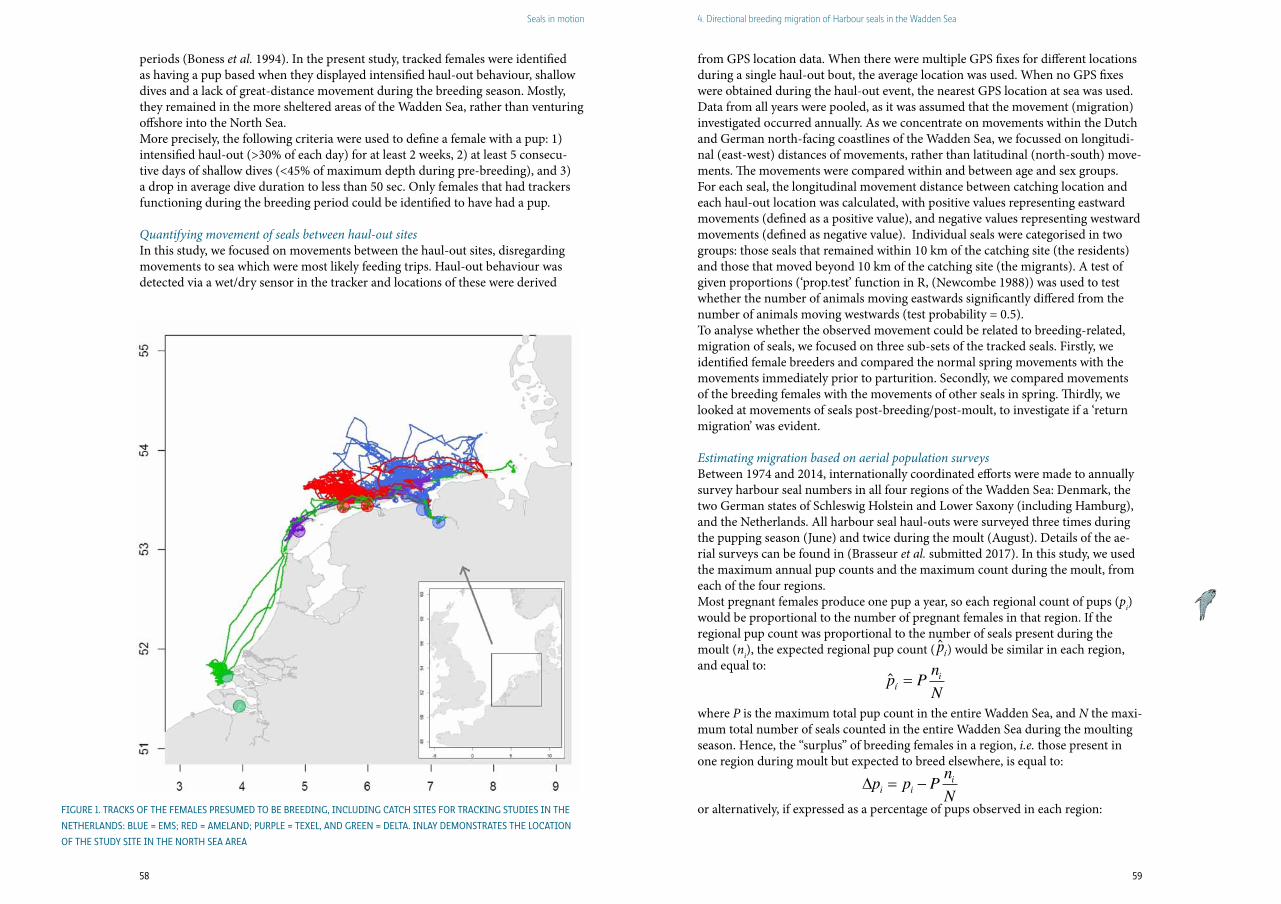
58 59
Seals in motion 4. Directional breeding migration of Harbour seals in the wadden Sea
periods (Boness et al. 1994). In the present study, tracked females were identified as having a pup based when they displayed intensified haul-out behaviour, shallow dives and a lack of great-distance movement during the breeding season. Mostly, they remained in the more sheltered areas of the Wadden Sea, rather than venturing offshore into the North Sea.More precisely, the following criteria were used to define a female with a pup: 1) intensified haul-out (>30% of each day) for at least 2 weeks, 2) at least 5 consecu-tive days of shallow dives (<45% of maximum depth during pre-breeding), and 3) a drop in average dive duration to less than 50 sec. Only females that had trackers functioning during the breeding period could be identified to have had a pup.
Quantifying movement of seals between haul-out sitesIn this study, we focused on movements between the haul-out sites, disregarding movements to sea which were most likely feeding trips. Haul-out behaviour was detected via a wet/dry sensor in the tracker and locations of these were derived
from GPS location data. When there were multiple GPS fixes for different locations during a single haul-out bout, the average location was used. When no GPS fixes were obtained during the haul-out event, the nearest GPS location at sea was used.Data from all years were pooled, as it was assumed that the movement (migration) investigated occurred annually. As we concentrate on movements within the Dutch and German north-facing coastlines of the Wadden Sea, we focussed on longitudi-nal (east-west) distances of movements, rather than latitudinal (north-south) move-ments. The movements were compared within and between age and sex groups. For each seal, the longitudinal movement distance between catching location and each haul-out location was calculated, with positive values representing eastward movements (defined as a positive value), and negative values representing westward movements (defined as negative value). Individual seals were categorised in two groups: those seals that remained within 10 km of the catching site (the residents) and those that moved beyond 10 km of the catching site (the migrants). A test of given proportions (‘prop.test’ function in R, (Newcombe 1988)) was used to test whether the number of animals moving eastwards significantly differed from the number of animals moving westwards (test probability = 0.5). To analyse whether the observed movement could be related to breeding-related, migration of seals, we focused on three sub-sets of the tracked seals. Firstly, we identified female breeders and compared the normal spring movements with the movements immediately prior to parturition. Secondly, we compared movements of the breeding females with the movements of other seals in spring. Thirdly, we looked at movements of seals post-breeding/post-moult, to investigate if a ‘return migration’ was evident.
Estimating migration based on aerial population surveysBetween 1974 and 2014, internationally coordinated efforts were made to annually survey harbour seal numbers in all four regions of the Wadden Sea: Denmark, the two German states of Schleswig Holstein and Lower Saxony (including Hamburg), and the Netherlands. All harbour seal haul-outs were surveyed three times during the pupping season (June) and twice during the moult (August). Details of the ae-rial surveys can be found in (Brasseur et al. submitted 2017). In this study, we used the maximum annual pup counts and the maximum count during the moult, from each of the four regions.Most pregnant females produce one pup a year, so each regional count of pups (pi) would be proportional to the number of pregnant females in that region. If the regional pup count was proportional to the number of seals present during the moult (ni), the expected regional pup count ( ) would be similar in each region, and equal to:
where P is the maximum total pup count in the entire Wadden Sea, and N the maxi-mum total number of seals counted in the entire Wadden Sea during the moulting season. Hence, the “surplus” of breeding females in a region, i.e. those present in one region during moult but expected to breed elsewhere, is equal to:
or alternatively, if expressed as a percentage of pups observed in each region:
ˆ ií
np PN
=
ii i
np p PN
D = -
ˆ íp
Figure 1. TrackS oF The FeMaleS preSuMeD To Be BreeDing, incluDing caTch SiTeS For Tracking STuDieS in The
neTherlanDS: Blue = eMS; reD = aMelanD; purple = TeXel, anD green = DelTa. inlay DeMonSTraTeS The locaTion
oF The STuDy SiTe in The norTh Sea area
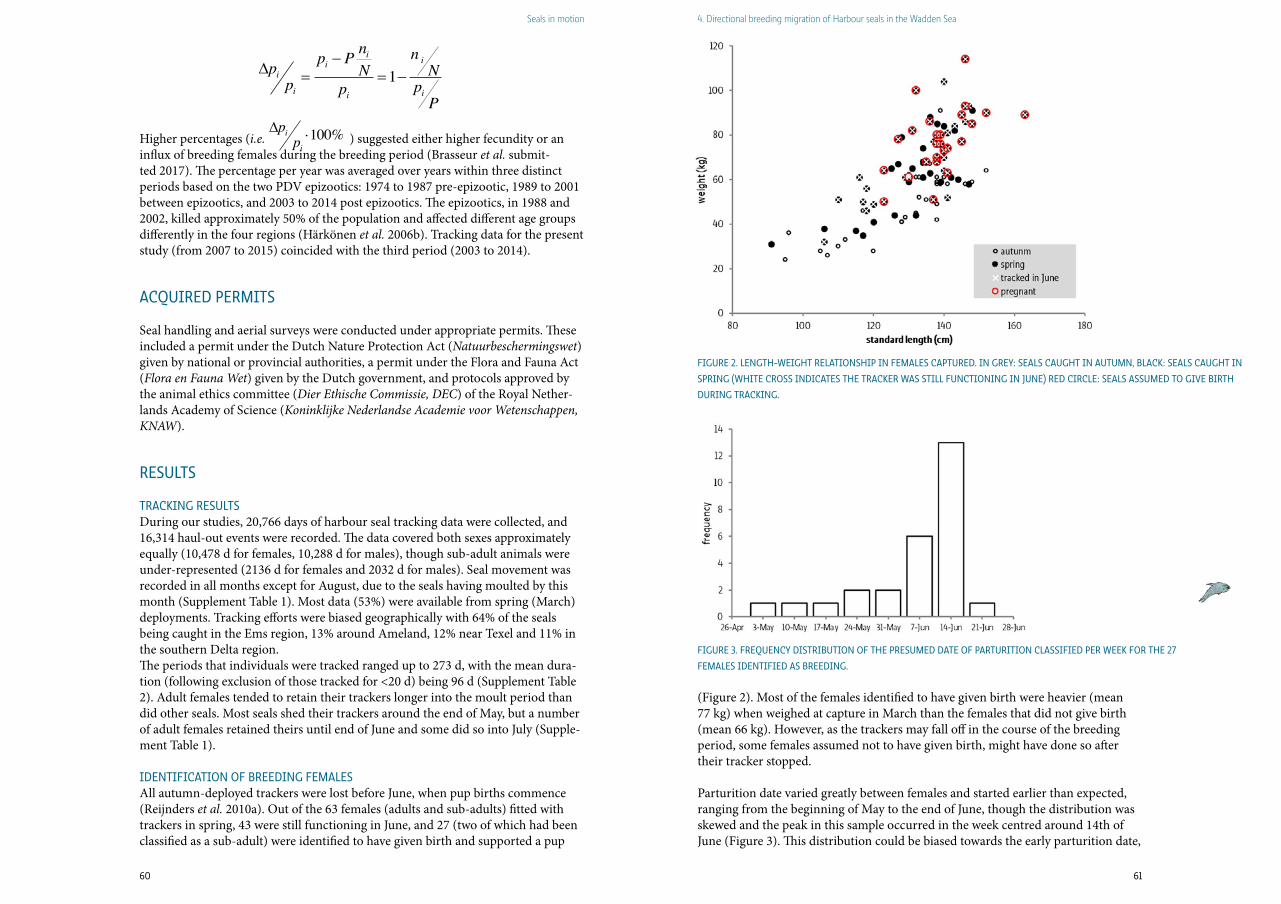
60 61
Seals in motion 4. Directional breeding migration of Harbour seals in the wadden Sea
Higher percentages (i.e. ) suggested either higher fecundity or an influx of breeding females during the breeding period (Brasseur et al. submit-ted 2017). The percentage per year was averaged over years within three distinct periods based on the two PDV epizootics: 1974 to 1987 pre-epizootic, 1989 to 2001 between epizootics, and 2003 to 2014 post epizootics. The epizootics, in 1988 and 2002, killed approximately 50% of the population and affected different age groups differently in the four regions (Härkönen et al. 2006b). Tracking data for the present study (from 2007 to 2015) coincided with the third period (2003 to 2014).
acquireD perMiTS
Seal handling and aerial surveys were conducted under appropriate permits. These included a permit under the Dutch Nature Protection Act (Natuurbeschermingswet) given by national or provincial authorities, a permit under the Flora and Fauna Act (Flora en Fauna Wet) given by the Dutch government, and protocols approved by the animal ethics committee (Dier Ethische Commissie, DEC) of the Royal Nether-lands Academy of Science (Koninklijke Nederlandse Academie voor Wetenschappen, KNAW).
reSulTS
Tracking reSulTS During our studies, 20,766 days of harbour seal tracking data were collected, and 16,314 haul-out events were recorded. The data covered both sexes approximately equally (10,478 d for females, 10,288 d for males), though sub-adult animals were under-represented (2136 d for females and 2032 d for males). Seal movement was recorded in all months except for August, due to the seals having moulted by this month (Supplement Table 1). Most data (53%) were available from spring (March) deployments. Tracking efforts were biased geographically with 64% of the seals being caught in the Ems region, 13% around Ameland, 12% near Texel and 11% in the southern Delta region.The periods that individuals were tracked ranged up to 273 d, with the mean dura-tion (following exclusion of those tracked for <20 d) being 96 d (Supplement Table 2). Adult females tended to retain their trackers longer into the moult period than did other seals. Most seals shed their trackers around the end of May, but a number of adult females retained theirs until end of June and some did so into July (Supple-ment Table 1).
iDenTiFicaTion oF BreeDing FeMaleSAll autumn-deployed trackers were lost before June, when pup births commence (Reijnders et al. 2010a). Out of the 63 females (adults and sub-adults) fitted with trackers in spring, 43 were still functioning in June, and 27 (two of which had been classified as a sub-adult) were identified to have given birth and supported a pup
Figure 2. lengTh-WeighT relaTionShip in FeMaleS capTureD. in grey: SealS caughT in auTuMn, Black: SealS caughT in
Spring (WhiTe croSS inDicaTeS The Tracker WaS STill FuncTioning in June) reD circle: SealS aSSuMeD To giVe BirTh
During Tracking.
Figure 3. Frequency DiSTriBuTion oF The preSuMeD DaTe oF parTuriTion claSSiFieD per Week For The 27
FeMaleS iDenTiFieD aS BreeDing.
1i ii
i
i ii
n np Pp N Np pp
P
-D = = -
100%i
i
pp
D ×
(Figure 2). Most of the females identified to have given birth were heavier (mean 77 kg) when weighed at capture in March than the females that did not give birth (mean 66 kg). However, as the trackers may fall off in the course of the breeding period, some females assumed not to have given birth, might have done so after their tracker stopped.
Parturition date varied greatly between females and started earlier than expected, ranging from the beginning of May to the end of June, though the distribution was skewed and the peak in this sample occurred in the week centred around 14th of June (Figure 3). This distribution could be biased towards the early parturition date,
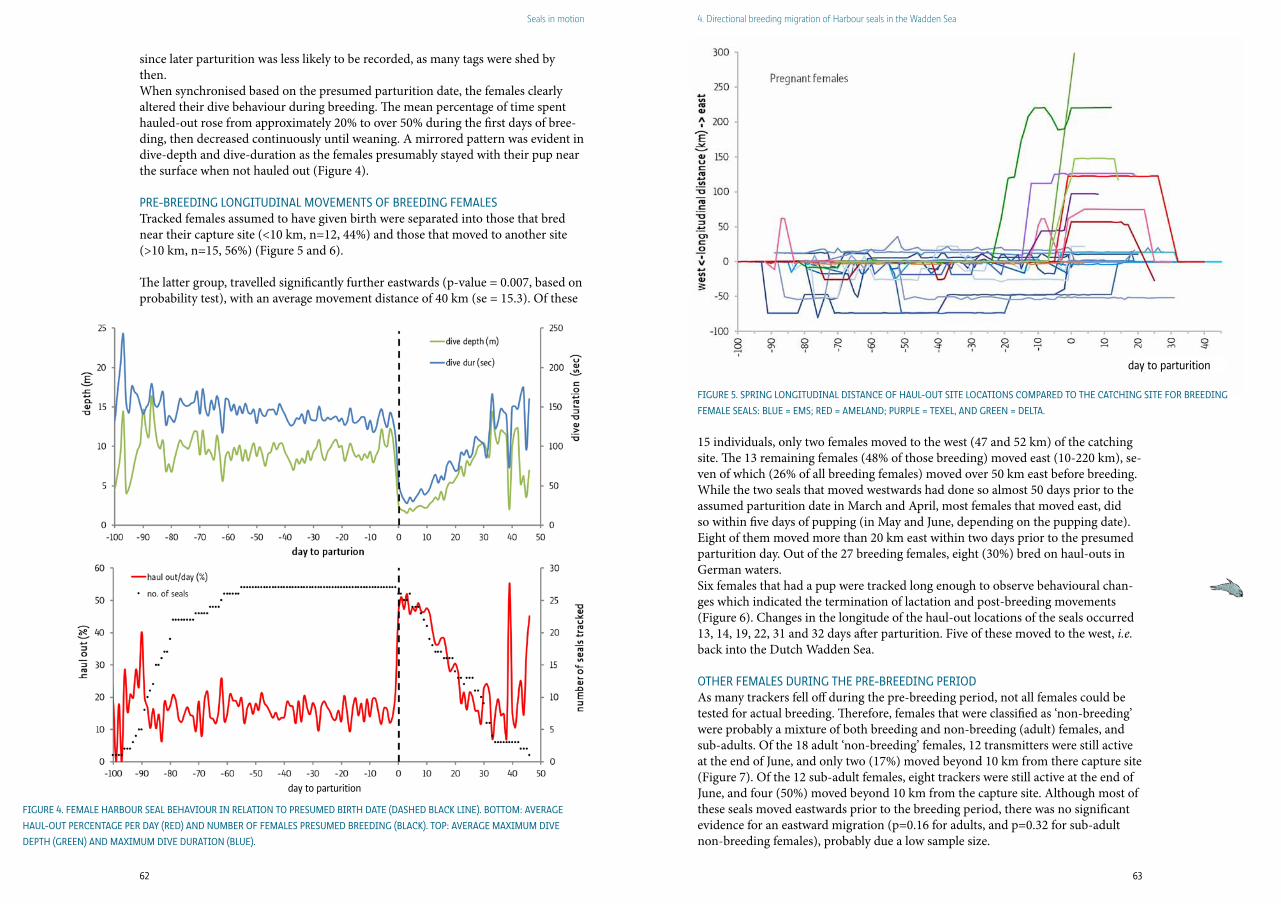
62 63
Seals in motion 4. Directional breeding migration of Harbour seals in the wadden Sea
since later parturition was less likely to be recorded, as many tags were shed by then.When synchronised based on the presumed parturition date, the females clearly altered their dive behaviour during breeding. The mean percentage of time spent hauled-out rose from approximately 20% to over 50% during the first days of bree-ding, then decreased continuously until weaning. A mirrored pattern was evident in dive-depth and dive-duration as the females presumably stayed with their pup near the surface when not hauled out (Figure 4). pre-BreeDing longiTuDinal MoVeMenTS oF BreeDing FeMaleSTracked females assumed to have given birth were separated into those that bred near their capture site (<10 km, n=12, 44%) and those that moved to another site (>10 km, n=15, 56%) (Figure 5 and 6).
The latter group, travelled significantly further eastwards (p-value = 0.007, based on probability test), with an average movement distance of 40 km (se = 15.3). Of these
15 individuals, only two females moved to the west (47 and 52 km) of the catching site. The 13 remaining females (48% of those breeding) moved east (10-220 km), se-ven of which (26% of all breeding females) moved over 50 km east before breeding. While the two seals that moved westwards had done so almost 50 days prior to the assumed parturition date in March and April, most females that moved east, did so within five days of pupping (in May and June, depending on the pupping date). Eight of them moved more than 20 km east within two days prior to the presumed parturition day. Out of the 27 breeding females, eight (30%) bred on haul-outs in German waters.Six females that had a pup were tracked long enough to observe behavioural chan-ges which indicated the termination of lactation and post-breeding movements (Figure 6). Changes in the longitude of the haul-out locations of the seals occurred 13, 14, 19, 22, 31 and 32 days after parturition. Five of these moved to the west, i.e. back into the Dutch Wadden Sea. oTher FeMaleS During The pre-BreeDing perioDAs many trackers fell off during the pre-breeding period, not all females could be tested for actual breeding. Therefore, females that were classified as ‘non-breeding’ were probably a mixture of both breeding and non-breeding (adult) females, and sub-adults. Of the 18 adult ‘non-breeding’ females, 12 transmitters were still active at the end of June, and only two (17%) moved beyond 10 km from there capture site (Figure 7). Of the 12 sub-adult females, eight trackers were still active at the end of June, and four (50%) moved beyond 10 km from the capture site. Although most of these seals moved eastwards prior to the breeding period, there was no significant evidence for an eastward migration (p=0.16 for adults, and p=0.32 for sub-adult non-breeding females), probably due a low sample size.
Figure 4. FeMale harBour Seal BehaViour in relaTion To preSuMeD BirTh DaTe (DaSheD Black line). BoTToM: aVerage
haul-ouT percenTage per Day (reD) anD nuMBer oF FeMaleS preSuMeD BreeDing (Black). Top: aVerage MaXiMuM DiVe
DepTh (green) anD MaXiMuM DiVe DuraTion (Blue).
Figure 5. Spring longiTuDinal DiSTance oF haul-ouT SiTe locaTionS coMpareD To The caTching SiTe For BreeDing
FeMale SealS: Blue = eMS; reD = aMelanD; purple = TeXel, anD green = DelTa.
day to parturition
day to parturition
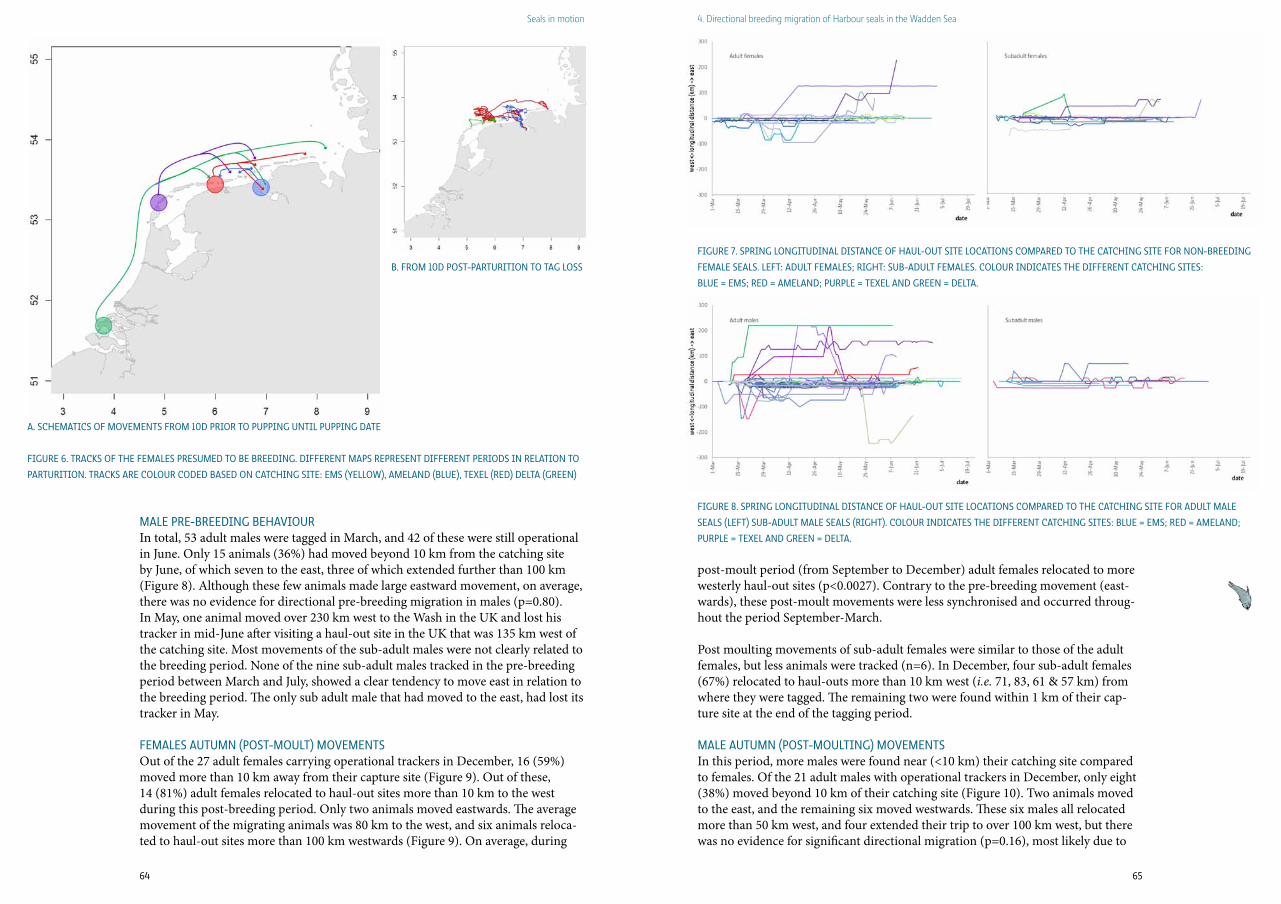
64 65
Seals in motion 4. Directional breeding migration of Harbour seals in the wadden Sea
Male pre-BreeDing BehaViourIn total, 53 adult males were tagged in March, and 42 of these were still operational in June. Only 15 animals (36%) had moved beyond 10 km from the catching site by June, of which seven to the east, three of which extended further than 100 km (Figure 8). Although these few animals made large eastward movement, on average, there was no evidence for directional pre-breeding migration in males (p=0.80). In May, one animal moved over 230 km west to the Wash in the UK and lost his tracker in mid-June after visiting a haul-out site in the UK that was 135 km west of the catching site. Most movements of the sub-adult males were not clearly related to the breeding period. None of the nine sub-adult males tracked in the pre-breeding period between March and July, showed a clear tendency to move east in relation to the breeding period. The only sub adult male that had moved to the east, had lost its tracker in May.
FeMaleS auTuMn (poST-MoulT) MoVeMenTSOut of the 27 adult females carrying operational trackers in December, 16 (59%) moved more than 10 km away from their capture site (Figure 9). Out of these, 14 (81%) adult females relocated to haul-out sites more than 10 km to the west during this post-breeding period. Only two animals moved eastwards. The average movement of the migrating animals was 80 km to the west, and six animals reloca-ted to haul-out sites more than 100 km westwards (Figure 9). On average, during
post-moult period (from September to December) adult females relocated to more westerly haul-out sites (p<0.0027). Contrary to the pre-breeding movement (east-wards), these post-moult movements were less synchronised and occurred throug-hout the period September-March. Post moulting movements of sub-adult females were similar to those of the adult females, but less animals were tracked (n=6). In December, four sub-adult females (67%) relocated to haul-outs more than 10 km west (i.e. 71, 83, 61 & 57 km) from where they were tagged. The remaining two were found within 1 km of their cap-ture site at the end of the tagging period.
Male auTuMn (poST-MoulTing) MoVeMenTS In this period, more males were found near (<10 km) their catching site compared to females. Of the 21 adult males with operational trackers in December, only eight (38%) moved beyond 10 km of their catching site (Figure 10). Two animals moved to the east, and the remaining six moved westwards. These six males all relocated more than 50 km west, and four extended their trip to over 100 km west, but there was no evidence for significant directional migration (p=0.16), most likely due to
Figure 6. TrackS oF The FeMaleS preSuMeD To Be BreeDing. DiFFerenT MapS repreSenT DiFFerenT perioDS in relaTion To
parTuriTion. TrackS are colour coDeD BaSeD on caTching SiTe: eMS (yelloW), aMelanD (Blue), TeXel (reD) DelTa (green)
a. ScheMaTicS oF MoVeMenTS FroM 10D prior To pupping unTil pupping DaTe
B. FroM 10D poST-parTuriTion To Tag loSS
Figure 7. Spring longiTuDinal DiSTance oF haul-ouT SiTe locaTionS coMpareD To The caTching SiTe For non-BreeDing
FeMale SealS. leFT: aDulT FeMaleS; righT: SuB-aDulT FeMaleS. colour inDicaTeS The DiFFerenT caTching SiTeS:
Blue = eMS; reD = aMelanD; purple = TeXel anD green = DelTa.
Figure 8. Spring longiTuDinal DiSTance oF haul-ouT SiTe locaTionS coMpareD To The caTching SiTe For aDulT Male
SealS (leFT) SuB-aDulT Male SealS (righT). colour inDicaTeS The DiFFerenT caTching SiTeS: Blue = eMS; reD = aMelanD;
purple = TeXel anD green = DelTa.

66 67
Seals in motion 4. Directional breeding migration of Harbour seals in the wadden Sea
the small sample of migrating animals. The average longitudinal distance of the migrating animals based on their location in December, was 66 km. In March, only nine adult males caught in September, had trackers that were still functioning. The 6 moving beyond 10 km of their catching site, all had moved eastwards, which does suggest directional movement (p-value = 0.014).For sub-adults, four out of the seven functioning trackers (57%) were found near (<10 km) their catching site, of the remaining 3, one (14%) had gone east.
eSTiMaTeD annual MoVeMenT BeTWeen WaDDen Sea regi-onS BaSeD on populaTion counT DaTa
Based on the percentage of pups born in a region relative to total seals recorded there during the moult, the annual net movement of pregnant females
(i.e. ) between regions of the Wadden Sea was estimated (Table 2; negative results imply a net out-flux of females). The extent of the estimated move-ment between regions varied substantially over time. During post-epizootic years
(2003-2014), coinciding with the movement study, approximately 21.6% of the adult females in the Netherlands during moult, likely had their pups elsewhere. On the other hand, 30.4% of the females breeding in the Schleswig-Holstein region are likely to come from other regions in the Wadden Sea (i.e. a negative value).
DiScuSSion
In many species, migrations are perceived as a mass event, with large groups of animals moving in one (general) direction or towards one goal. Good examples are autumn and winter breeding migrations of large whales (e.g. grey and humpback whales, (Claphamp 1996, Nerini 1984)), autumn bird migrations from the Northern Hemisphere to southern wintering grounds, or crab and even frog migration to or from breeding ponds (Adamczewska & Morris 2001, Hahn et al. 2009, Fahrig et al. 1995). Clearly, this is not the case in harbour seals. The results of this study demonstrate, however, a strong tendency of a large proportion of female harbour seals that are assumed to be breeding, to migrate from Dutch waters eastwards prior to their breeding season. Out of 27 apparently breeding females that were tracked through to pupping, 13 (44%) pupped east of where they were caught. Seven (26%) had moved more than 50 km east only days prior to parturition. Moreover, eight females (30%) pupped in Germany, where pup production relative to numbers of seals present during the moult is higher than in other Wadden Sea areas. Also, the majority of adult females and, though to a lesser extent, other seals tracked post-breeding, moved to the west, possibly indicating a return migration, presumably to the haul-outs from which they spend much of the year prior to commuting to their feeding areas.
Figure 9. longiTuDinal MoVeMenTS BeTWeen SepTeMBer anD March oF aDulT FeMaleS (leFT) anD SuB-aDulT FeMaleS
(righT). colour inDicaTeS The DiFFerenT caTching SiTeS: Blue = eMS; reD = aMelanD.
Figure 10. longiTuDinal MoVeMenTS BeTWeen SepTeMBer anD March oF aDulT MaleS (leFT) anD SuB-aDulT MaleS (righT).
colour inDicaTeS The DiFFerenT caTching SiTeS: Blue = eMS; reD = aMelanD.
TaBle 2. oVerVieW oF The aVerage pup VS MoulT counT raTioS For The DiFFerenT regionS oF The WaDDen Sea (BraSSeur
eT al. SuBMiTTeD 2017) anD eSTiMaTeD neT MoVeMenT oF nuMBer oF pregnanT FeMaleS per region i.e. FeMaleS preSenT
During MoulT ThaT Were noT in ThaT region During The BreeDing perioD (negaTiVe reSulTS iMply More FeMaleS pre-
SenT During MoulT Than inDicaTeD By pupS Born).
100%i
i
pp
D ×
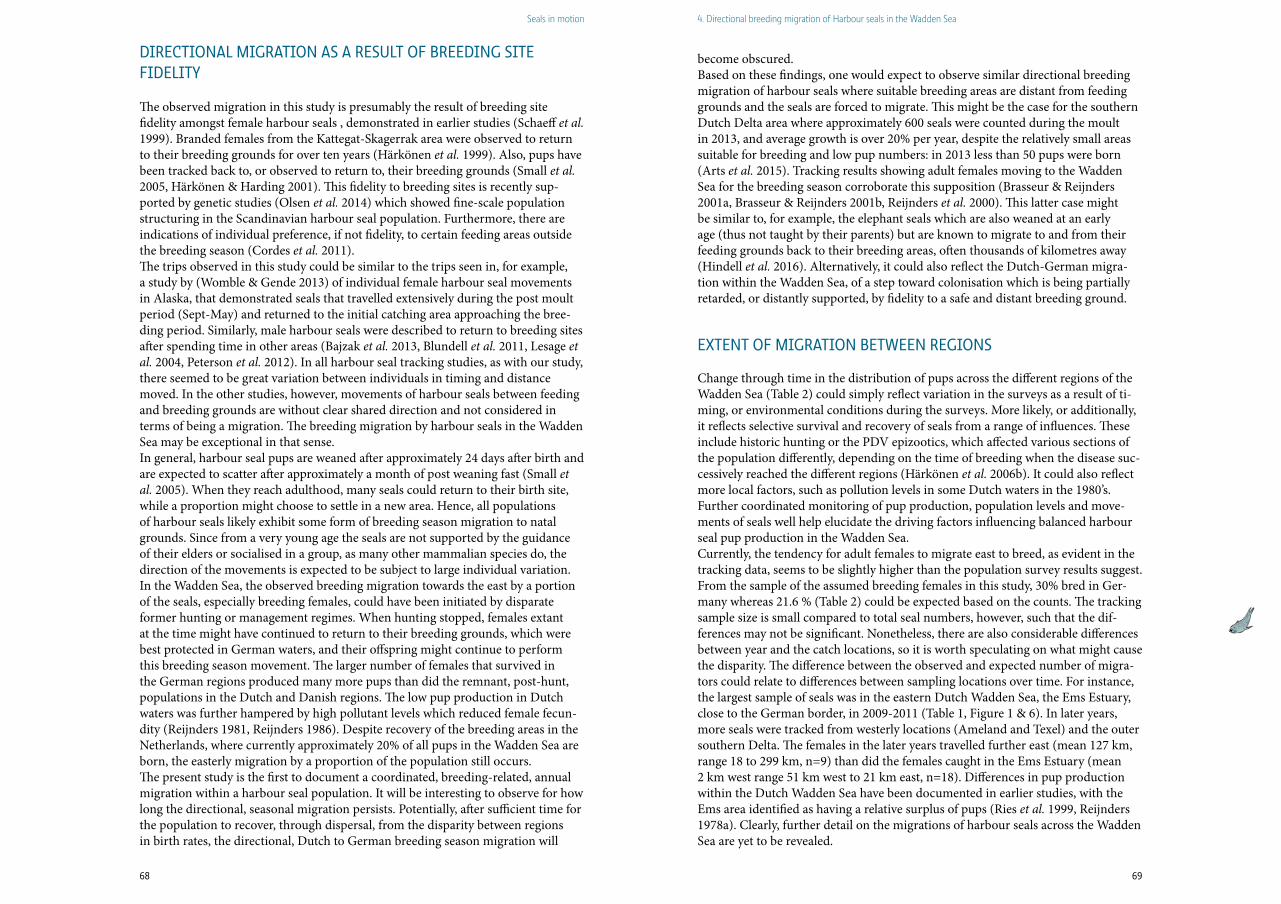
68 69
Seals in motion 4. Directional breeding migration of Harbour seals in the wadden Sea
DirecTional MigraTion aS a reSulT oF BreeDing SiTe FiDeliTy
The observed migration in this study is presumably the result of breeding site fidelity amongst female harbour seals , demonstrated in earlier studies (Schaeff et al. 1999). Branded females from the Kattegat-Skagerrak area were observed to return to their breeding grounds for over ten years (Härkönen et al. 1999). Also, pups have been tracked back to, or observed to return to, their breeding grounds (Small et al. 2005, Härkönen & Harding 2001). This fidelity to breeding sites is recently sup-ported by genetic studies (Olsen et al. 2014) which showed fine-scale population structuring in the Scandinavian harbour seal population. Furthermore, there are indications of individual preference, if not fidelity, to certain feeding areas outside the breeding season (Cordes et al. 2011). The trips observed in this study could be similar to the trips seen in, for example, a study by (Womble & Gende 2013) of individual female harbour seal movements in Alaska, that demonstrated seals that travelled extensively during the post moult period (Sept-May) and returned to the initial catching area approaching the bree-ding period. Similarly, male harbour seals were described to return to breeding sites after spending time in other areas (Bajzak et al. 2013, Blundell et al. 2011, Lesage et al. 2004, Peterson et al. 2012). In all harbour seal tracking studies, as with our study, there seemed to be great variation between individuals in timing and distance moved. In the other studies, however, movements of harbour seals between feeding and breeding grounds are without clear shared direction and not considered in terms of being a migration. The breeding migration by harbour seals in the Wadden Sea may be exceptional in that sense. In general, harbour seal pups are weaned after approximately 24 days after birth and are expected to scatter after approximately a month of post weaning fast (Small et al. 2005). When they reach adulthood, many seals could return to their birth site, while a proportion might choose to settle in a new area. Hence, all populations of harbour seals likely exhibit some form of breeding season migration to natal grounds. Since from a very young age the seals are not supported by the guidance of their elders or socialised in a group, as many other mammalian species do, the direction of the movements is expected to be subject to large individual variation.In the Wadden Sea, the observed breeding migration towards the east by a portion of the seals, especially breeding females, could have been initiated by disparate former hunting or management regimes. When hunting stopped, females extant at the time might have continued to return to their breeding grounds, which were best protected in German waters, and their offspring might continue to perform this breeding season movement. The larger number of females that survived in the German regions produced many more pups than did the remnant, post-hunt, populations in the Dutch and Danish regions. The low pup production in Dutch waters was further hampered by high pollutant levels which reduced female fecun-dity (Reijnders 1981, Reijnders 1986). Despite recovery of the breeding areas in the Netherlands, where currently approximately 20% of all pups in the Wadden Sea are born, the easterly migration by a proportion of the population still occurs. The present study is the first to document a coordinated, breeding-related, annual migration within a harbour seal population. It will be interesting to observe for how long the directional, seasonal migration persists. Potentially, after sufficient time for the population to recover, through dispersal, from the disparity between regions in birth rates, the directional, Dutch to German breeding season migration will
become obscured. Based on these findings, one would expect to observe similar directional breeding migration of harbour seals where suitable breeding areas are distant from feeding grounds and the seals are forced to migrate. This might be the case for the southern Dutch Delta area where approximately 600 seals were counted during the moult in 2013, and average growth is over 20% per year, despite the relatively small areas suitable for breeding and low pup numbers: in 2013 less than 50 pups were born (Arts et al. 2015). Tracking results showing adult females moving to the Wadden Sea for the breeding season corroborate this supposition (Brasseur & Reijnders 2001a, Brasseur & Reijnders 2001b, Reijnders et al. 2000). This latter case might be similar to, for example, the elephant seals which are also weaned at an early age (thus not taught by their parents) but are known to migrate to and from their feeding grounds back to their breeding areas, often thousands of kilometres away (Hindell et al. 2016). Alternatively, it could also reflect the Dutch-German migra-tion within the Wadden Sea, of a step toward colonisation which is being partially retarded, or distantly supported, by fidelity to a safe and distant breeding ground.
eXTenT oF MigraTion BeTWeen regionS
Change through time in the distribution of pups across the different regions of the Wadden Sea (Table 2) could simply reflect variation in the surveys as a result of ti-ming, or environmental conditions during the surveys. More likely, or additionally, it reflects selective survival and recovery of seals from a range of influences. These include historic hunting or the PDV epizootics, which affected various sections of the population differently, depending on the time of breeding when the disease suc-cessively reached the different regions (Härkönen et al. 2006b). It could also reflect more local factors, such as pollution levels in some Dutch waters in the 1980’s. Further coordinated monitoring of pup production, population levels and move-ments of seals well help elucidate the driving factors influencing balanced harbour seal pup production in the Wadden Sea.Currently, the tendency for adult females to migrate east to breed, as evident in the tracking data, seems to be slightly higher than the population survey results suggest. From the sample of the assumed breeding females in this study, 30% bred in Ger-many whereas 21.6 % (Table 2) could be expected based on the counts. The tracking sample size is small compared to total seal numbers, however, such that the dif-ferences may not be significant. Nonetheless, there are also considerable differences between year and the catch locations, so it is worth speculating on what might cause the disparity. The difference between the observed and expected number of migra-tors could relate to differences between sampling locations over time. For instance, the largest sample of seals was in the eastern Dutch Wadden Sea, the Ems Estuary, close to the German border, in 2009-2011 (Table 1, Figure 1 & 6). In later years, more seals were tracked from westerly locations (Ameland and Texel) and the outer southern Delta. The females in the later years travelled further east (mean 127 km, range 18 to 299 km, n=9) than did the females caught in the Ems Estuary (mean 2 km west range 51 km west to 21 km east, n=18). Differences in pup production within the Dutch Wadden Sea have been documented in earlier studies, with the Ems area identified as having a relative surplus of pups (Ries et al. 1999, Reijnders 1978a). Clearly, further detail on the migrations of harbour seals across the Wadden Sea are yet to be revealed.
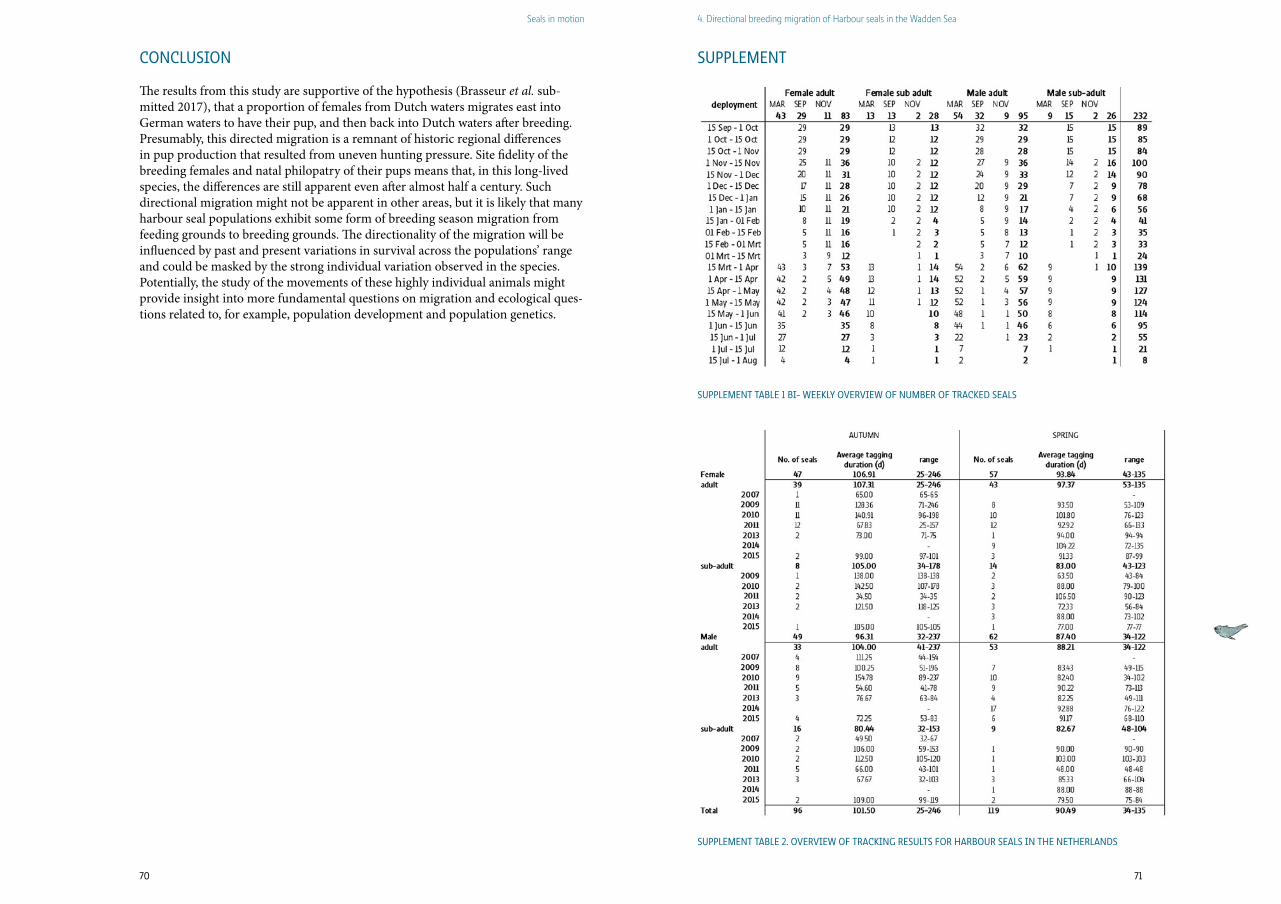
70 71
Seals in motion 4. Directional breeding migration of Harbour seals in the wadden Sea
concluSion
The results from this study are supportive of the hypothesis (Brasseur et al. sub-mitted 2017), that a proportion of females from Dutch waters migrates east into German waters to have their pup, and then back into Dutch waters after breeding. Presumably, this directed migration is a remnant of historic regional differences in pup production that resulted from uneven hunting pressure. Site fidelity of the breeding females and natal philopatry of their pups means that, in this long-lived species, the differences are still apparent even after almost half a century. Such directional migration might not be apparent in other areas, but it is likely that many harbour seal populations exhibit some form of breeding season migration from feeding grounds to breeding grounds. The directionality of the migration will be influenced by past and present variations in survival across the populations’ range and could be masked by the strong individual variation observed in the species. Potentially, the study of the movements of these highly individual animals might provide insight into more fundamental questions on migration and ecological ques-tions related to, for example, population development and population genetics.
SuppleMenT
SuppleMenT TaBle 1 Bi- Weekly oVerVieW oF nuMBer oF TrackeD SealS
SuppleMenT TaBle 2. oVerVieW oF Tracking reSulTS For harBour SealS in The neTherlanDS
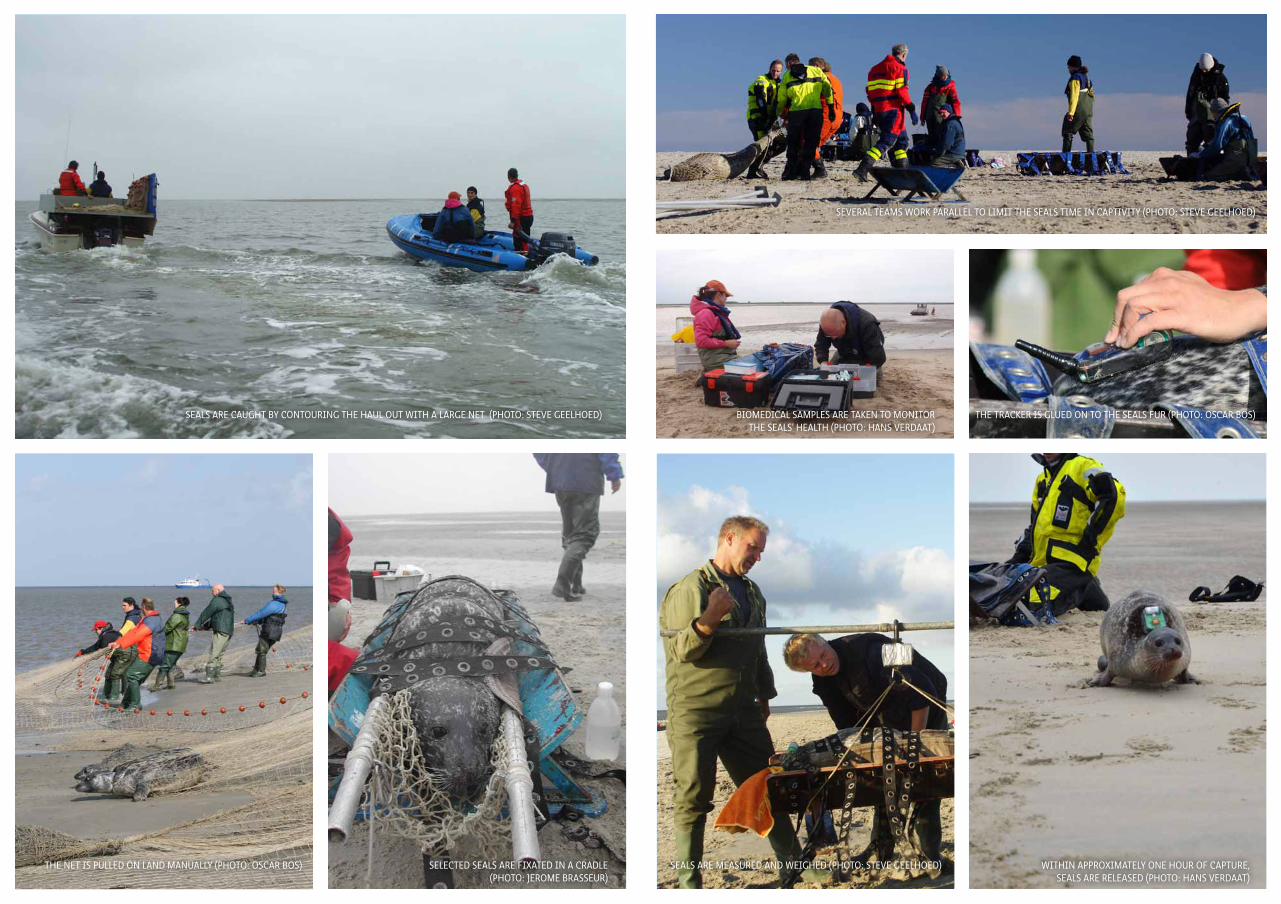
Seals in motion hoofdstuk
WiThin approXiMaTely one hour oF capTure, SealS are releaSeD (phoTo: hanS VerDaaT)
SealS are caughT By conTouring The haul ouT WiTh a large neT (phoTo: STeVe geelhoeD)
The neT iS pulleD on lanD Manually (phoTo: oScar BoS) SelecTeD SealS are FiXaTeD in a craDle (phoTo: JeroMe BraSSeur)
SeVeral TeaMS Work parallel To liMiT The SealS TiMe in capTiViTy (phoTo: STeVe geelhoeD)
BioMeDical SaMpleS are Taken To MoniTor The SealS’ healTh (phoTo: hanS VerDaaT)
The Tracker iS glueD on To The SealS Fur (phoTo: oScar BoS)
SealS are MeaSureD anD WeigheD (phoTo: STeVe geelhoeD)

Seals in motion
7574grey SealS During The MoulT perioD, STarTing To loSe Their olD
BroWn Fur (phoTo henk Van WiJk)
76 77
Seals in motion 5. Rapid recovery of Dutch gray seal colonies fuelled by immigration
Published as: Sophie M. J. M. Brasseur, Tamara D. van Polanen Petel, Tim Gerrodette, Erik H.W.G. Meesters, Peter J. H. Reijnders and Geert Aarts (2015) Rapid recovery of Dutch gray seal colonies fueled by immigration. Marine Mammal Science 31:405-426
5. RApID REcOvE Ry Of DUTcH gRAy SEAL cOLONIES fUELLED by IMMIgRATION
76
SuMMary
Gray seals were first observed breeding in the Dutch Wadden Sea in 1985, after centuries of absence. The breeding colony there is now the largest on the European continent. We describe the changes in gray seal numbers and their geographical expansion, and estimate how these processes were influenced by immigration from other colonies. Counts of hauled out animals were carried out between 1985 and 2013, monitoring three different periods of the seals’ annual cycle. Using priors de-termined for the UK population, a Bayesian demographic model was fitted to pup numbers to estimate the population parameters driving the growth. This included immigration of sub-adults into the breeding population, which contributed to an average growth rate in the pup counts of 19%/y, much higher than expected in a closed population. This immigration may account for approximately 35% of the total annual growth. In addition, at least 200 grey seals from the UK visit the area temporarily. Recovery of the population in the Netherlands occurred more than 50 yr after gray seals were protected in the UK. These time scales should be taken into account when studying long living marine mammals, e.g. in impact and conserva-tion studies.
Keywords: gray seal, grey seal, Halichoerus grypus, population development, Baye-sian demographic model, North Sea, Dutch Wadden Sea, aerial survey, moult, pups, migration
inTroDucTion
Local extinction has occurred in many mammalian species, often as a result of a changing environment or human activities (Hoffmann et al. 2011, Schipper et al. 2008). However, in some cases recovery may occur through immigration from populations nearby, if conditions are favorable. Gray seals (Halichoerus grypus, Fa-bricius, 1791) in the Netherlands are such a case. After centuries of virtual absence, they have recolonized Dutch waters and shown rapid population growth in recent decades.The Wadden Sea, enclosed by a row of islands, forms the border between the eastern part of the southern North Sea and the Netherlands, Germany, and Den-mark. Subfossil remains, some of which date back to 10,000 BC (Joensen et al. 1976, Reijnders 1978a, Bree van et al. 1992), show that gray seals were present in all Wadden Sea regions prior to the 6th century. As gray seal pups remain ashore during the nursing and the postweaning period, they are an easy target for hunters (Hewer 1974). It is likely that in the late Middle Ages intensified hunting pressure in the area, related to human settlement, was the cause for the virtual disappearance of gray seals (Reijnders et al. 1995). Hunting also affected gray seals in other areas around the North Sea, but small populations persisted in the relatively remote areas of the United Kingdom (UK). Hunting restrictions introduced in the UK in 1914 under the Gray Seals Protection Act (Lambert 2002) allowed the species there to recover and subsequently colonize the Wadden Sea and adjacent areas once again (Reijnders et al. 1995). The numbers in continental Europe have grown and the species is now afforded protection under several conventions and treaties in Europe (Härkönen et al. 2007a, Brasseur et al. 2011c).Recovery of gray seal stocks has been reported in much of its range including in the
78 79
Seals in motion 5. Rapid recovery of Dutch gray seal colonies fuelled by immigration
Western Atlantic, in Canada and coast of the USA (Bowen et al. 2003b, Wood et al. 2011), in the Baltic Sea (Harding and Härkönen 1999) and in the Eastern Atlantic (Abt and Engler 2009, Duck and Thompson 2007, Härkönen et al. 2007a). Reijnders et al. (1995) described the initial colonization of gray seals in Dutch waters. Gray seals were sporadically reported from the mid-1950s onwards (van Haaften 1975), but it was not until 1980 that the first colony was established on a relatively high sandbar between the islands of Vlieland and Terschelling. The first pup born at this Dutch colony was only observed in 1985 (Reijnders et al. 1995), although prior to this pups were occasionally found along the Dutch coast. These early pups mainly originated from the east coast of the UK as deduced from tagged animals (Bonner 1972). Currently, the colony in the Dutch Wadden Sea is the largest on the Euro-pean continent (Härkönen et al. 2007a, Brasseur et al. 2013). Since gray seals were virtually absent from Dutch waters prior to the 1980’s, the establishment of a breeding population must have been initiated by immigrants from most likely the nearest large colonies located along the North Sea coasts of the UK (Hewer 1974). For example, pup production in the UK grew between 1980 and 2010 from 1,617 (SCOS 2006) to 10,107 (SCOS 2013). As the colonies in the UK grew, the influx of animals into Dutch waters possibly increased as well. Some of these started to breed in the Netherlands, while others may have visited the Dutch waters only on a temporary basis. If so, more animals would be present in Dutch waters than could be expected based on the yearly pup production, especially out-side the breeding season.
Understanding population demography and how it is shaped by local reproduction, mortality, and immigration, based on counts alone is challenging, because pinni-peds spend a large proportion of time in the water, out of sight. In many areas, the number of seal pups born is used to infer the total number of animals in the area (Bowen et al. 2007, Duck and Thompson 2007). However, the maximum number of pups counted during a survey is always an underestimate of the total annual pup production. At the time of a survey, some pups are yet to be born, while others are not counted, as they may have already left the colony, or died (Boveng et al. 1988). Moreover, changes in population demography (Härkönen and Harding 2001) and exchanges with other populations nearby (this study) might affect the number of animals present in a way which is not deducible from pup counts alone. The main objective of this study is to describe the changes in the number of gray seals and their geographical expansion in the Dutch Wadden Sea. In particular, we seek to understand if and how these changes have been influenced by temporary or permanent immigration.
MaTerialS anD MeThoDS
DaTa collecTionFrom 1985 to 2013, surveys were carried out during three periods in the gray seals’ annual cycle: the molting season (March-April), the summer season, which is their most intensive foraging period (June-September, Beck et al. 2003a), and the pupping season (November-February). Prior to 2001, hauled out gray seals were counted from marine conservation vessels during the pupping and molting seasons. In the period 1997-2001, the animals spread to different haul out sites during the
molting season and the boat surveys covered only part of the seals’ distribution. Therefore, from December 2001 onwards, aerial surveys dedicated to gray seal counts replaced the boat surveys. As the range of gray seals grew, aerial surveys ex-panded to the western Wadden Sea in 2002 and to the entire Dutch Wadden Sea in 2007. Since 1959, annual harbor seal, Phoca vitulina, aerial surveys in the summer months provided for fortuitous, data on gray seal occurrence in summer.
Aerial surveys were conducted from a fixed wing, single engine aircraft, flying at approximately 500 ft (~150 m) at 160-200 km/h. Surveys were conducted between 2 h before and 2 h after low tide and were aimed at low tides between 1000 and 1600 local time (Reijnders et al. 2003a). Surveys were performed on good weather days, with rainfall <8.5 mm daily precipitation (measured over the period 0800 UTC preceding day - 0800 UTC present day), and winds generally below 25 kn (up to 6 Beaufort). In the early years, we scored seal numbers directly during the flight and recorded additional comments on tape. From 1997 to 1999, seals we photographed areas with seals using an analog camera with slide film. From 2000 onwards, we used a digital camera, and a GPS unit to record the location of the photographs taken. At least two experienced observers counted animals from the projected pictures.
For this study, only data from 1985 onwards was used. For the pup counts, data from November, December, and January were included. Pup counts after extremely high tides (>2.0 m relative to Amsterdam Ordnance Datum (NAP) at Vlieland) were excluded from the analysis, because such tides may wash many pups away, and others were rescued and taken to rehabilitation centers, causing an underestimate in the counts. As at the beginning of the breeding season, consecutive counts prior to the first birth were zero, only the last zero count before the first non-zero count was used. Counts from March, April, and May were considered molting counts. Molting data from the years 1997-2000 were excluded from the analysis as they were incomplete. In 2013 molting counts were impeded by the weather (Brasseur et al. 2013), and therefore were not included in the study. All counts carried out from June through September were included as summer counts.
coMpariSon oF populaTion groWTh raTeSTo describe the changes in gray seal numbers in the Netherlands, the growth rates observed in the counts during the different seasons were determined. These reflect the speed at which the recolonization took place, allowing for comparison with other areas, but also the ability to examine differences between seasons. The latter could help for example, to recognize the underlying processes for the growth in numbers during the different seasons.
A generalized linear model (McCullagh and Nelder 1989) was used to estimate ini-tial population size and population growth rate for each of the three time series of seasonal counts. We used a quasi-Poisson error distribution and log link function. All data from the pupping and summer time series were used to estimate populati-on growth rates in these periods. For the molting season, only the annual maximum count was used. For each seasonal time series (pupping, molting, and summer), the expected count (C) was modeled as:

80 81
Seals in motion 5. Rapid recovery of Dutch gray seal colonies fuelled by immigration
Ct = e β0+β1t eq. 1
where t was the number of years after 1985, β1 the exponential population growth rate, and e β0 the initial population size. Season was included in the model as a factor, and interaction between season and year was included to investigate whether there were differences in growth rates among the three time series. Parameter esti-mates and confidence limits were calculated using bootstrapping (Canty and Ripley 2010, Davison and Hinkley 1997). Models were fitted using the ‘glm’ function in R3.0.2 (R Core Team 2013).
BreeDing populaTion DeMographic MoDelNext, a Bayesian demographic model was fitted to the pup counts to estimate total numbers of animals involved in breeding, i.e., the breeding population size and the demographic parameters that shape the observed changes in the breeding popu-lation (Matthiopoulos et al., 2014). This allowed us to estimate for example, the immigration of UK born juveniles into the Dutch breeding population.
The Bayesian demographic model fitted to pup data consisted of two components. The first component modelled the probability of a pup being present as a function of the timing of birth, mortality, and postweaning departure of pups. Departure was defined as the moment the pup was no longer identifiable as such (due to postwe-aning molt) or when the pup had left the breeding colony. The second component was a demographic model dictating the height of the curve, which was a function of the total reproductive output of the mature population. The shape of the curve defining the pup presence probability was defined as
γ(t) = pb(t) – pd(t) – m(t) eq. 2
where t was the number of days after 1 November, pb(t) was the birth probability, pd(t) was the departure probability and m(t) was the mortality. On Sable Island, Ca-nada (Bowen et al. 2003b, Bowen et al. 2007) and in the UK (Duck and Thompson 2007, Lonergan et al. 2011), independent data on mortality and the developmental stages of pups were collected. Such ground-based data were not available for this study. Boveng et al. (1998) and Reijnders et al. (1997a) estimated mortality in An-tarctic fur seals, Arctocephalus gazella and harbor seals Phoca vitulina, respectively, by recording the decline in pup counts after the peak in pup numbers. However, in gray seals the duration of lactation is relatively short (17-20 d, Boness and James 1979, Pomeroy et al. 1999), and next to mortality, the decline in pup numbers was largely driven by a departure of pups after a variable postweaning molting period (9-31 d, Hall 1998, Noren et al. 2008) or storms flushing the animals off the bree-ding grounds. It was not possible to discern between departure of pups and morta-lity based on the survey data, and therefore in this part of the model, m(t) could not be estimated as a separate parameter.
The cumulative distribution function for the birth of pups pb(t) was described using a logistic probability density function. Field observations suggested a forward shift in the pupping date, which was captured by allowing the mean birth date to vary as a linear function of year.
pb(t) = logit-1 (β1(ti – μbirth – β2Y)) eq. 3
where logit-1 () = exp ()
, μbirth was the mean birth date when Y=0,
1+exp()
β2Y describes the annual linear change in birth date, and β1 was the slope of the lo-gistic function and is a measure of the between-individual variability in birth date. Similarly, the pup departure probability was described as
pd(t) = logit-1 (β1(ti – μbirth – μduration – β2Y)) eq. 4
where μduration was the mean pup presence duration.
The demographic part of the model (Fig. 1) was defined by the vital processes of immigration, survival, and fecundity (Caswell 2001). We defined initial population size in the model by a parameter estimating the number of mature individuals, N6+, in 1985. To capture the subsequent immigration, the model included a parameter αpup, which estimated the influx of 1 yr old seals as a proportion of the number of pups born on the UK east coast the preceding year (Fig. 1). Thus, the number of 1 yr old seals in Dutch waters was modeled as
N1,t = ϕpup N0,t-1 + αpup NUK
0,t-1 eq. 5
where ϕpup was the survival of pups and Nx,t was the number of seals of age x at time t. The numbers of pups born along the UK east coast NUK
0 were obtained from SCOS (2010, Table 3 of SCOS-BP 10/1) for 1985-2004 and from SCOS (2013, Table 2 of SCOS-BP 13/01) for 2005-2012. The expected number of pups during a survey was the product of the total annual pup production (N0) and the pup presence probability (γ). The actual pup counts during the i’th survey (Pi) were assumed to
Figure 1. populaTion DeMographic changeS inFluenceD By SurViVal oF pupS (ϕpup) anD aDulTS (ϕad), aDulT FecunDiTy
(The proDucT oF FeMale FecunDiTy (f6+) anD The proporTion oF FeMaleS (F)), anD iMMigraTion, Which iS a FuncTion oF
The nuMBer oF pupS Born on The uk-eaST coaSTS (ϕpup). TeMporary iMporT FroM The uk oBSerVeD During MolTing Sea-
Son anD SuMMer Were eXpreSSeD aS αmolt anD αsummer. The nuMBer in each circle repreSenTS The age-claSS. reproDuc-
Tion in a parTicular age claSS occurS prior To SurViVal inTo The FolloWing age claSS.

82 83
Seals in motion 5. Rapid recovery of Dutch gray seal colonies fuelled by immigration
follow a Poisson distribution:
Pi ~ Poisson (N0i γi) eq. 6
Survival was estimated separately for pups (ϕ pup) and (sub)adults (ϕ adult). Esti-mates of survival and fecundity (f6+) were not available for the Dutch population, so informative priors from the UK (SCOS 2012) were used (Table 1 of SCOS-BP 12/02). The gray seals occur in adjacent waters and these parameters were likely to be similar. For juvenile survival, a new, less informative prior was suggested in SCOS (2012). Although this change in prior was not accepted for the UK, we felt the less informative prior would be appropriate for the Dutch situation because ex-tensive rescue efforts for pups in the Netherlands may affect pup survival. The ratio between the number of females and males (F) was defined as beta-distribution with an upper limit of 2:1, corresponding to a mean female-male ratio of 0.55 (Table 1). This parameter was fixed and not estimated by the model. No useful prior informa-tion was available for the parameters μbirth, β2Y, β1, α and N6+, and hence these were defined as uniform distributions with boundaries as specified in Table 1. The relaTiVe conTriBuTion oF SeaSonal inFluX oF gray SealS in DuTch WaTerS
Studies from the UK suggest that female gray seals show high site fidelity during the breeding season (Pomeroy et al. 2005), and hence it seemed safe to assume that the pup counts depended only on the local breeding population. However, molting and summer counts may be affected by adults and sub-adults using Dutch waters
temporarily. Such possible temporary immigration was estimated by comparing the estimated size of the breeding population with the size of the population present during the summer and molting counts.
The size of the summer population was estimated based on tagging data, which could be used to correct for the proportion of animals at sea. In 2006-2008, 12 sub-adult and adult gray seals (seven females ranging in total length from 132-212 cm and five males ranging from 140-196 cm) were equipped with GSM-relayed data loggers (GPS-Phone Tags, SMRU). The tags were glued to the hair on the back of the head of the animals (Fedak et al. 1983). The loggers contained sensors to measure geographic position (FastlocTM), depth (pressure sensor) and whether the unit was dry or wet (conductivity sensor). When the data logger was dry for at least 10 min, the seal was recorded as being hauled out. Haul out events were summari-zed into 2 h blocks, in which the percentage of time hauled out was recorded. Haul out summary data from 2 h before and after low tide between 1000 and 1600 UTC were used to estimate the percentage of time individuals spent hauled out. The total population size could then be estimated by dividing the seal count by the mean haul out fraction (Ries et al. 1998, Matthiopoulos et al. 2004, Hayward et al. 2005, Lonergan et al. 2011).
An intercept-only generalized mixed model (GLMM) was fitted to the 2 h haul out fractions from these months. The intercept was treated as a mixed effect term, where the random component was allowed to vary by individual (Pinheiro and Bates 2000). The fixed effect estimate and corresponding uncertainty were used to estimate haul out fractions at a population level. Models were fitted using the ‘glmmPQL’ function of the ‘MASS’ package in R (R Development Core 2013).
The contribution of temporary immigrants to the summer population was estima-ted with the demographic model by including a parameter αsummer; the proportion of UK gray seals in addition to the Dutch seals from the local breeding population. The proportion of summer immigrants, as a fraction of the UK east coast gray seal population, was assumed to be the same each year. Thus, the summer counts S were modeled as S ~ Poisson (ν (N0–6+ αsummer N
UK0–6+)) eq. 7
where ν was the haul out fraction during the summer months. The logit-1 of ν had a prior distribution of Gaussian(η, σ), and η and σ were respectively the mean and corresponding standard error estimate of the intercept (reflecting haul out pro-babilities) estimated from the tagging data with the GLMM described above. The temporary visitors in summer were assumed to be a fraction (αsummer) of the estima-ted total number of gray seals residing along the UK east coast prior to breeding (Appendix SCOS-BP 13/02, p. 109 in SCOS 2013). No UK estimate was available for 2013. Instead, this was obtained by projecting the 2012 estimate (i.e., 20,300) using the mean UK east coast population growth from 2003-2012 (i.e., 1.027). This resulted in an estimate of 20,858 individuals for 2013. Similarly, the contribution of temporary immigrants to the molting population was estimated by including a parameter αmolt as the proportion of nonpup UK gray seals in addition to the Dutch seals from the local breeding population. Due to frequent foraging trips, pups of the year were assumed to have the same haul out fraction TaBle 1. priorS uSeD in The populaTion MoDel.
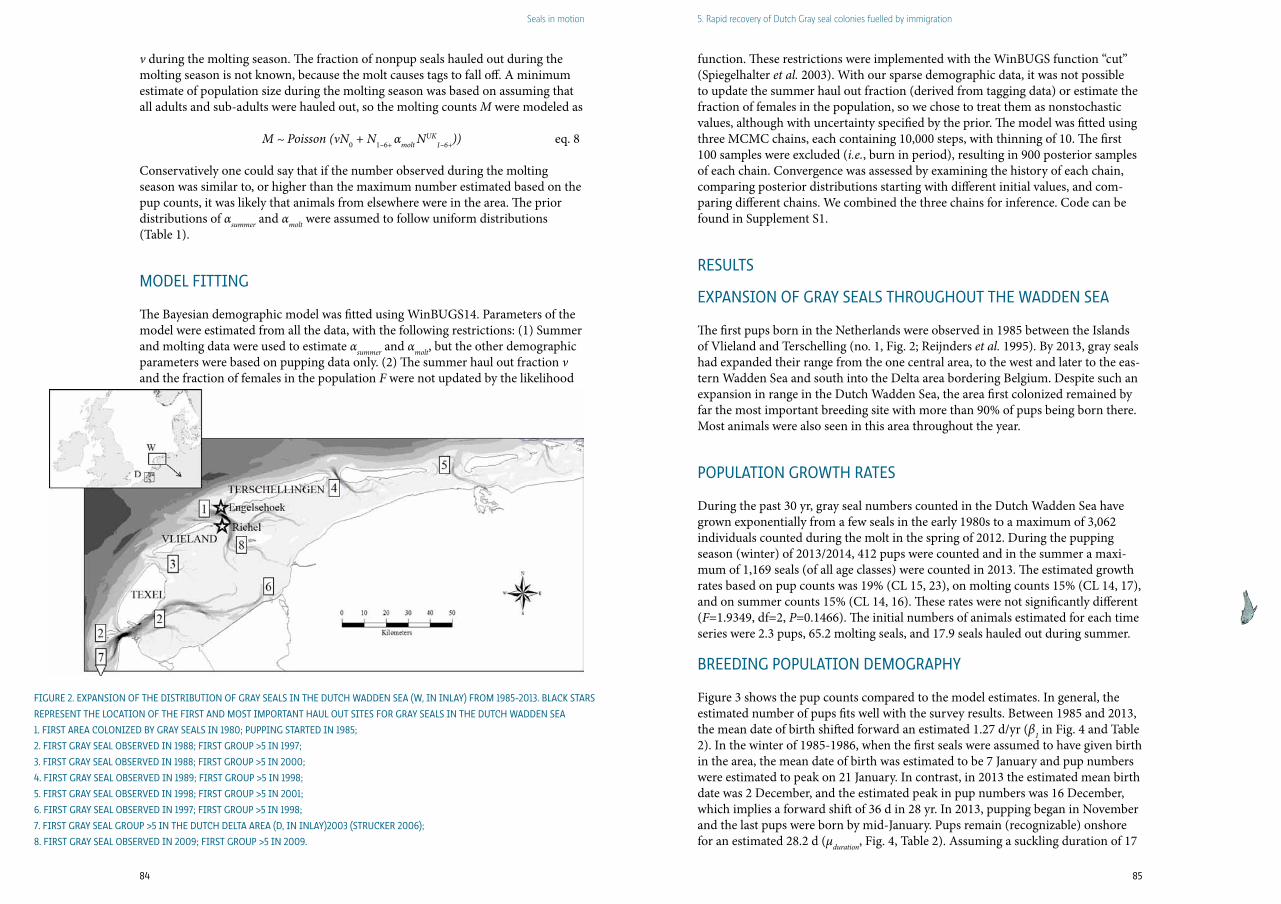
84 85
Seals in motion 5. Rapid recovery of Dutch gray seal colonies fuelled by immigration
ν during the molting season. The fraction of nonpup seals hauled out during the molting season is not known, because the molt causes tags to fall off. A minimum estimate of population size during the molting season was based on assuming that all adults and sub-adults were hauled out, so the molting counts M were modeled as
M ~ Poisson (νN0 + N1–6+ αmolt NUK
1–6+)) eq. 8
Conservatively one could say that if the number observed during the molting season was similar to, or higher than the maximum number estimated based on the pup counts, it was likely that animals from elsewhere were in the area. The prior distributions of αsummer and αmolt were assumed to follow uniform distributions (Table 1).
MoDel FiTTing
The Bayesian demographic model was fitted using WinBUGS14. Parameters of the model were estimated from all the data, with the following restrictions: (1) Summer and molting data were used to estimate αsummer and αmolt, but the other demographic parameters were based on pupping data only. (2) The summer haul out fraction ν and the fraction of females in the population F were not updated by the likelihood
function. These restrictions were implemented with the WinBUGS function “cut” (Spiegelhalter et al. 2003). With our sparse demographic data, it was not possible to update the summer haul out fraction (derived from tagging data) or estimate the fraction of females in the population, so we chose to treat them as nonstochastic values, although with uncertainty specified by the prior. The model was fitted using three MCMC chains, each containing 10,000 steps, with thinning of 10. The first 100 samples were excluded (i.e., burn in period), resulting in 900 posterior samples of each chain. Convergence was assessed by examining the history of each chain, comparing posterior distributions starting with different initial values, and com-paring different chains. We combined the three chains for inference. Code can be found in Supplement S1.
reSulTS
eXpanSion oF gray SealS ThroughouT The WaDDen Sea
The first pups born in the Netherlands were observed in 1985 between the Islands of Vlieland and Terschelling (no. 1, Fig. 2; Reijnders et al. 1995). By 2013, gray seals had expanded their range from the one central area, to the west and later to the eas-tern Wadden Sea and south into the Delta area bordering Belgium. Despite such an expansion in range in the Dutch Wadden Sea, the area first colonized remained by far the most important breeding site with more than 90% of pups being born there. Most animals were also seen in this area throughout the year.
populaTion groWTh raTeS
During the past 30 yr, gray seal numbers counted in the Dutch Wadden Sea have grown exponentially from a few seals in the early 1980s to a maximum of 3,062 individuals counted during the molt in the spring of 2012. During the pupping season (winter) of 2013/2014, 412 pups were counted and in the summer a maxi-mum of 1,169 seals (of all age classes) were counted in 2013. The estimated growth rates based on pup counts was 19% (CL 15, 23), on molting counts 15% (CL 14, 17), and on summer counts 15% (CL 14, 16). These rates were not significantly different (F=1.9349, df=2, P=0.1466). The initial numbers of animals estimated for each time series were 2.3 pups, 65.2 molting seals, and 17.9 seals hauled out during summer.
BreeDing populaTion DeMography
Figure 3 shows the pup counts compared to the model estimates. In general, the estimated number of pups fits well with the survey results. Between 1985 and 2013, the mean date of birth shifted forward an estimated 1.27 d/yr (β1 in Fig. 4 and Table 2). In the winter of 1985-1986, when the first seals were assumed to have given birth in the area, the mean date of birth was estimated to be 7 January and pup numbers were estimated to peak on 21 January. In contrast, in 2013 the estimated mean birth date was 2 December, and the estimated peak in pup numbers was 16 December, which implies a forward shift of 36 d in 28 yr. In 2013, pupping began in November and the last pups were born by mid-January. Pups remain (recognizable) onshore for an estimated 28.2 d (µduration, Fig. 4, Table 2). Assuming a suckling duration of 17
Figure 2. eXpanSion oF The DiSTriBuTion oF gray SealS in The DuTch WaDDen Sea (W, in inlay) FroM 1985-2013. Black STarS
repreSenT The locaTion oF The FirST anD MoST iMporTanT haul ouT SiTeS For gray SealS in The DuTch WaDDen Sea
1. FirST area colonizeD By gray SealS in 1980; pupping STarTeD in 1985;
2. FirST gray Seal oBSerVeD in 1988; FirST group >5 in 1997;
3. FirST gray Seal oBSerVeD in 1988; FirST group >5 in 2000;
4. FirST gray Seal oBSerVeD in 1989; FirST group >5 in 1998;
5. FirST gray Seal oBSerVeD in 1998; FirST group >5 in 2001;
6. FirST gray Seal oBSerVeD in 1997; FirST group >5 in 1998;
7. FirST gray Seal group >5 in The DuTch DelTa area (D, in inlay)2003 (STrucker 2006);
8. FirST gray Seal oBSerVeD in 2009; FirST group >5 in 2009.
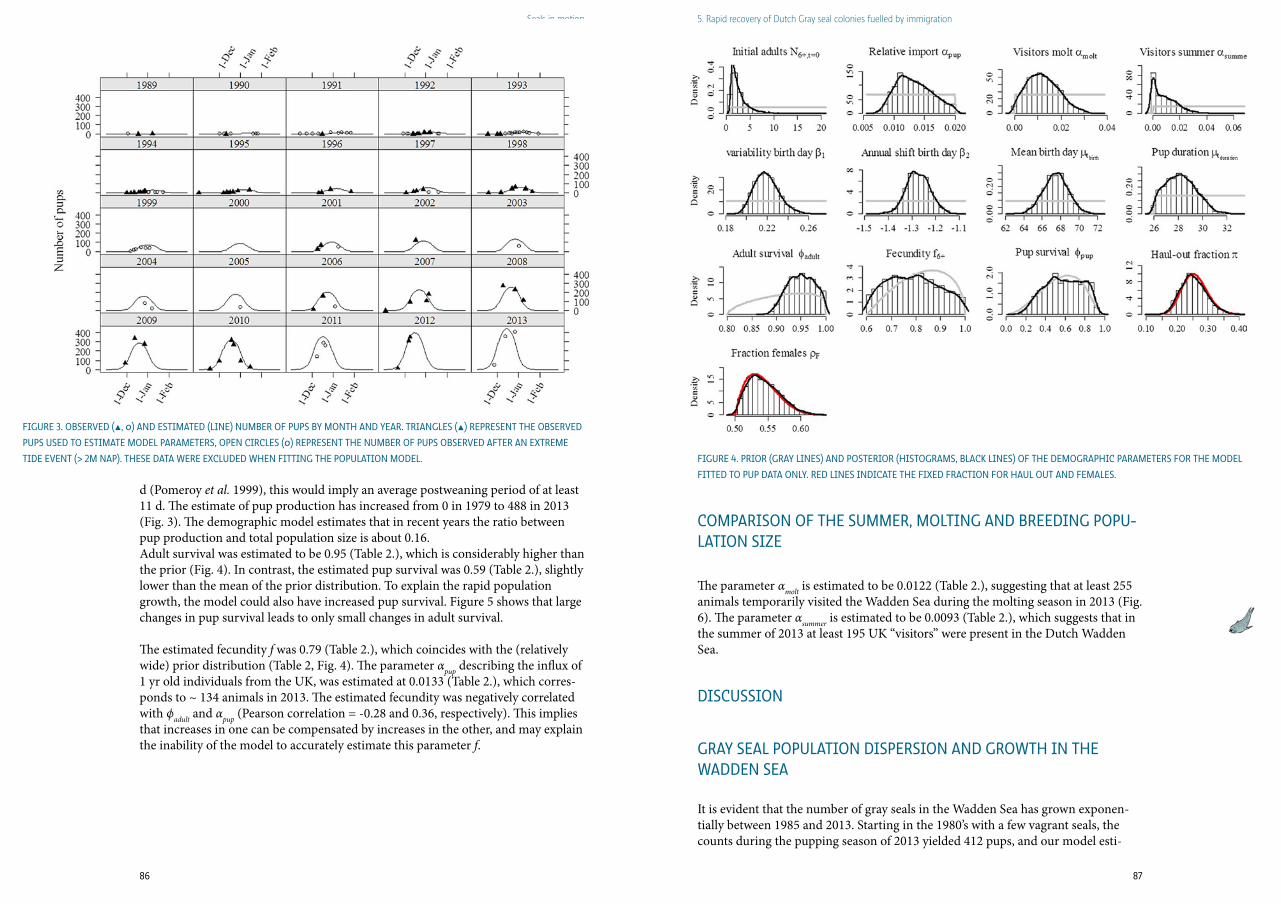
86 87
Seals in motion 5. Rapid recovery of Dutch gray seal colonies fuelled by immigration
d (Pomeroy et al. 1999), this would imply an average postweaning period of at least 11 d. The estimate of pup production has increased from 0 in 1979 to 488 in 2013 (Fig. 3). The demographic model estimates that in recent years the ratio between pup production and total population size is about 0.16. Adult survival was estimated to be 0.95 (Table 2.), which is considerably higher than the prior (Fig. 4). In contrast, the estimated pup survival was 0.59 (Table 2.), slightly lower than the mean of the prior distribution. To explain the rapid population growth, the model could also have increased pup survival. Figure 5 shows that large changes in pup survival leads to only small changes in adult survival.
The estimated fecundity f was 0.79 (Table 2.), which coincides with the (relatively wide) prior distribution (Table 2, Fig. 4). The parameter αpup describing the influx of 1 yr old individuals from the UK, was estimated at 0.0133 (Table 2.), which corres-ponds to ~ 134 animals in 2013. The estimated fecundity was negatively correlated with ϕadult and αpup (Pearson correlation = -0.28 and 0.36, respectively). This implies that increases in one can be compensated by increases in the other, and may explain the inability of the model to accurately estimate this parameter f.
coMpariSon oF The SuMMer, MolTing anD BreeDing popu-laTion Size
The parameter αmolt is estimated to be 0.0122 (Table 2.), suggesting that at least 255 animals temporarily visited the Wadden Sea during the molting season in 2013 (Fig. 6). The parameter αsummer is estimated to be 0.0093 (Table 2.), which suggests that in the summer of 2013 at least 195 UK “visitors” were present in the Dutch Wadden Sea.
DiScuSSion
gray Seal populaTion DiSperSion anD groWTh in The WaDDen Sea
It is evident that the number of gray seals in the Wadden Sea has grown exponen-tially between 1985 and 2013. Starting in the 1980’s with a few vagrant seals, the counts during the pupping season of 2013 yielded 412 pups, and our model esti-
Figure 3. oBSerVeD (\, o) anD eSTiMaTeD (line) nuMBer oF pupS By MonTh anD year. TriangleS (\) repreSenT The oBSerVeD
pupS uSeD To eSTiMaTe MoDel paraMeTerS, open circleS (o) repreSenT The nuMBer oF pupS oBSerVeD aFTer an eXTreMe
TiDe eVenT (> 2M nap). TheSe DaTa Were eXcluDeD When FiTTing The populaTion MoDel. Figure 4. prior (gray lineS) anD poSTerior (hiSTograMS, Black lineS) oF The DeMographic paraMeTerS For The MoDel
FiTTeD To pup DaTa only. reD lineS inDicaTe The FiXeD FracTion For haul ouT anD FeMaleS.
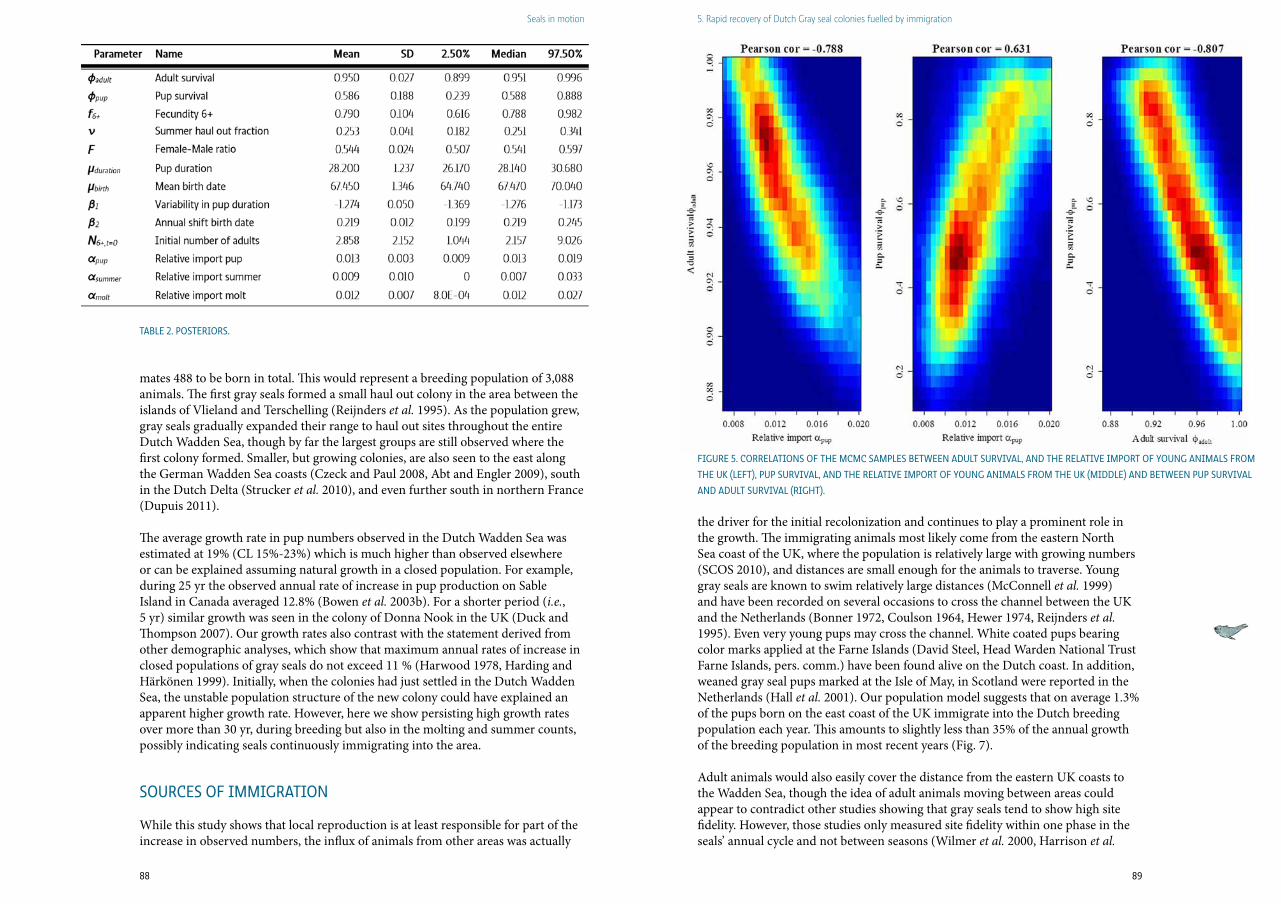
88 89
Seals in motion 5. Rapid recovery of Dutch gray seal colonies fuelled by immigration
mates 488 to be born in total. This would represent a breeding population of 3,088 animals. The first gray seals formed a small haul out colony in the area between the islands of Vlieland and Terschelling (Reijnders et al. 1995). As the population grew, gray seals gradually expanded their range to haul out sites throughout the entire Dutch Wadden Sea, though by far the largest groups are still observed where the first colony formed. Smaller, but growing colonies, are also seen to the east along the German Wadden Sea coasts (Czeck and Paul 2008, Abt and Engler 2009), south in the Dutch Delta (Strucker et al. 2010), and even further south in northern France (Dupuis 2011).
The average growth rate in pup numbers observed in the Dutch Wadden Sea was estimated at 19% (CL 15%-23%) which is much higher than observed elsewhere or can be explained assuming natural growth in a closed population. For example, during 25 yr the observed annual rate of increase in pup production on Sable Island in Canada averaged 12.8% (Bowen et al. 2003b). For a shorter period (i.e., 5 yr) similar growth was seen in the colony of Donna Nook in the UK (Duck and Thompson 2007). Our growth rates also contrast with the statement derived from other demographic analyses, which show that maximum annual rates of increase in closed populations of gray seals do not exceed 11 % (Harwood 1978, Harding and Härkönen 1999). Initially, when the colonies had just settled in the Dutch Wadden Sea, the unstable population structure of the new colony could have explained an apparent higher growth rate. However, here we show persisting high growth rates over more than 30 yr, during breeding but also in the molting and summer counts, possibly indicating seals continuously immigrating into the area.
SourceS oF iMMigraTion
While this study shows that local reproduction is at least responsible for part of the increase in observed numbers, the influx of animals from other areas was actually
Figure 5. correlaTionS oF The McMc SaMpleS BeTWeen aDulT SurViVal, anD The relaTiVe iMporT oF young aniMalS FroM
The uk (leFT), pup SurViVal, anD The relaTiVe iMporT oF young aniMalS FroM The uk (MiDDle) anD BeTWeen pup SurViVal
anD aDulT SurViVal (righT).
the driver for the initial recolonization and continues to play a prominent role in the growth. The immigrating animals most likely come from the eastern North Sea coast of the UK, where the population is relatively large with growing numbers (SCOS 2010), and distances are small enough for the animals to traverse. Young gray seals are known to swim relatively large distances (McConnell et al. 1999) and have been recorded on several occasions to cross the channel between the UK and the Netherlands (Bonner 1972, Coulson 1964, Hewer 1974, Reijnders et al. 1995). Even very young pups may cross the channel. White coated pups bearing color marks applied at the Farne Islands (David Steel, Head Warden National Trust Farne Islands, pers. comm.) have been found alive on the Dutch coast. In addition, weaned gray seal pups marked at the Isle of May, in Scotland were reported in the Netherlands (Hall et al. 2001). Our population model suggests that on average 1.3% of the pups born on the east coast of the UK immigrate into the Dutch breeding population each year. This amounts to slightly less than 35% of the annual growth of the breeding population in most recent years (Fig. 7).
Adult animals would also easily cover the distance from the eastern UK coasts to the Wadden Sea, though the idea of adult animals moving between areas could appear to contradict other studies showing that gray seals tend to show high site fidelity. However, those studies only measured site fidelity within one phase in the seals’ annual cycle and not between seasons (Wilmer et al. 2000, Harrison et al.
TaBle 2. poSTeriorS.
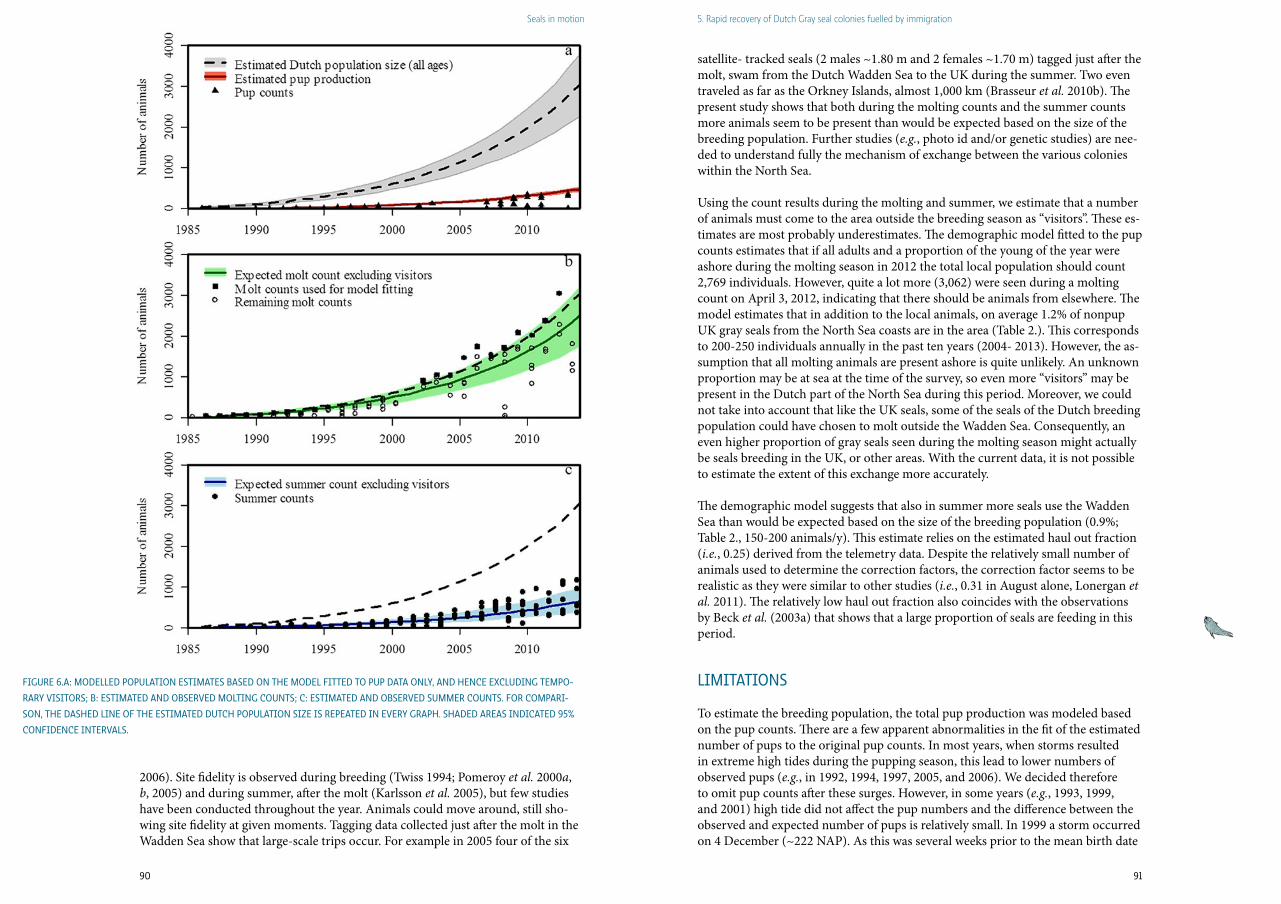
90 91
Seals in motion 5. Rapid recovery of Dutch gray seal colonies fuelled by immigration
satellite- tracked seals (2 males ~1.80 m and 2 females ~1.70 m) tagged just after the molt, swam from the Dutch Wadden Sea to the UK during the summer. Two even traveled as far as the Orkney Islands, almost 1,000 km (Brasseur et al. 2010b). The present study shows that both during the molting counts and the summer counts more animals seem to be present than would be expected based on the size of the breeding population. Further studies (e.g., photo id and/or genetic studies) are nee-ded to understand fully the mechanism of exchange between the various colonies within the North Sea.
Using the count results during the molting and summer, we estimate that a number of animals must come to the area outside the breeding season as “visitors”. These es-timates are most probably underestimates. The demographic model fitted to the pup counts estimates that if all adults and a proportion of the young of the year were ashore during the molting season in 2012 the total local population should count 2,769 individuals. However, quite a lot more (3,062) were seen during a molting count on April 3, 2012, indicating that there should be animals from elsewhere. The model estimates that in addition to the local animals, on average 1.2% of nonpup UK gray seals from the North Sea coasts are in the area (Table 2.). This corresponds to 200-250 individuals annually in the past ten years (2004- 2013). However, the as-sumption that all molting animals are present ashore is quite unlikely. An unknown proportion may be at sea at the time of the survey, so even more “visitors” may be present in the Dutch part of the North Sea during this period. Moreover, we could not take into account that like the UK seals, some of the seals of the Dutch breeding population could have chosen to molt outside the Wadden Sea. Consequently, an even higher proportion of gray seals seen during the molting season might actually be seals breeding in the UK, or other areas. With the current data, it is not possible to estimate the extent of this exchange more accurately.
The demographic model suggests that also in summer more seals use the Wadden Sea than would be expected based on the size of the breeding population (0.9%; Table 2., 150-200 animals/y). This estimate relies on the estimated haul out fraction (i.e., 0.25) derived from the telemetry data. Despite the relatively small number of animals used to determine the correction factors, the correction factor seems to be realistic as they were similar to other studies (i.e., 0.31 in August alone, Lonergan et al. 2011). The relatively low haul out fraction also coincides with the observations by Beck et al. (2003a) that shows that a large proportion of seals are feeding in this period.
liMiTaTionS
To estimate the breeding population, the total pup production was modeled based on the pup counts. There are a few apparent abnormalities in the fit of the estimated number of pups to the original pup counts. In most years, when storms resulted in extreme high tides during the pupping season, this lead to lower numbers of observed pups (e.g., in 1992, 1994, 1997, 2005, and 2006). We decided therefore to omit pup counts after these surges. However, in some years (e.g., 1993, 1999, and 2001) high tide did not affect the pup numbers and the difference between the observed and expected number of pups is relatively small. In 1999 a storm occurred on 4 December (~222 NAP). As this was several weeks prior to the mean birth date
Figure 6.a: MoDelleD populaTion eSTiMaTeS BaSeD on The MoDel FiTTeD To pup DaTa only, anD hence eXcluDing TeMpo-
rary ViSiTorS; B: eSTiMaTeD anD oBSerVeD MolTing counTS; c: eSTiMaTeD anD oBSerVeD SuMMer counTS. For coMpari-
Son, The DaSheD line oF The eSTiMaTeD DuTch populaTion Size iS repeaTeD in eVery graph. ShaDeD areaS inDicaTeD 95%
conFiDence inTerValS.
2006). Site fidelity is observed during breeding (Twiss 1994; Pomeroy et al. 2000a, b, 2005) and during summer, after the molt (Karlsson et al. 2005), but few studies have been conducted throughout the year. Animals could move around, still sho-wing site fidelity at given moments. Tagging data collected just after the molt in the Wadden Sea show that large-scale trips occur. For example in 2005 four of the six
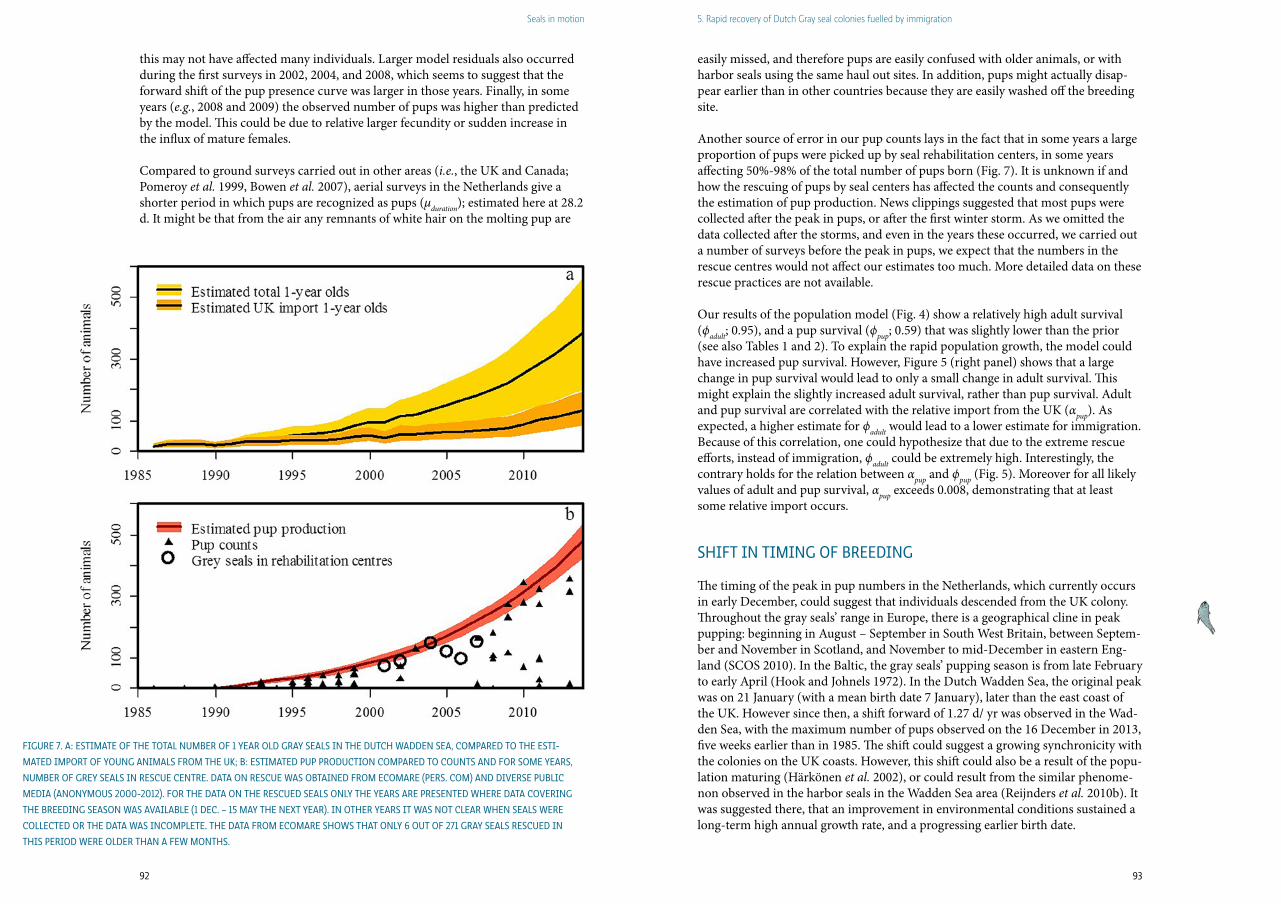
92 93
Seals in motion 5. Rapid recovery of Dutch gray seal colonies fuelled by immigration
this may not have affected many individuals. Larger model residuals also occurred during the first surveys in 2002, 2004, and 2008, which seems to suggest that the forward shift of the pup presence curve was larger in those years. Finally, in some years (e.g., 2008 and 2009) the observed number of pups was higher than predicted by the model. This could be due to relative larger fecundity or sudden increase in the influx of mature females.
Compared to ground surveys carried out in other areas (i.e., the UK and Canada; Pomeroy et al. 1999, Bowen et al. 2007), aerial surveys in the Netherlands give a shorter period in which pups are recognized as pups (µduration); estimated here at 28.2 d. It might be that from the air any remnants of white hair on the molting pup are
easily missed, and therefore pups are easily confused with older animals, or with harbor seals using the same haul out sites. In addition, pups might actually disap-pear earlier than in other countries because they are easily washed off the breeding site.
Another source of error in our pup counts lays in the fact that in some years a large proportion of pups were picked up by seal rehabilitation centers, in some years affecting 50%-98% of the total number of pups born (Fig. 7). It is unknown if and how the rescuing of pups by seal centers has affected the counts and consequently the estimation of pup production. News clippings suggested that most pups were collected after the peak in pups, or after the first winter storm. As we omitted the data collected after the storms, and even in the years these occurred, we carried out a number of surveys before the peak in pups, we expect that the numbers in the rescue centres would not affect our estimates too much. More detailed data on these rescue practices are not available.
Our results of the population model (Fig. 4) show a relatively high adult survival (ϕadult; 0.95), and a pup survival (ϕpup; 0.59) that was slightly lower than the prior (see also Tables 1 and 2). To explain the rapid population growth, the model could have increased pup survival. However, Figure 5 (right panel) shows that a large change in pup survival would lead to only a small change in adult survival. This might explain the slightly increased adult survival, rather than pup survival. Adult and pup survival are correlated with the relative import from the UK (αpup). As expected, a higher estimate for ϕadult would lead to a lower estimate for immigration. Because of this correlation, one could hypothesize that due to the extreme rescue efforts, instead of immigration, ϕadult could be extremely high. Interestingly, the contrary holds for the relation between αpup and ϕpup (Fig. 5). Moreover for all likely values of adult and pup survival, αpup exceeds 0.008, demonstrating that at least some relative import occurs.
ShiFT in TiMing oF BreeDing
The timing of the peak in pup numbers in the Netherlands, which currently occurs in early December, could suggest that individuals descended from the UK colony. Throughout the gray seals’ range in Europe, there is a geographical cline in peak pupping: beginning in August – September in South West Britain, between Septem-ber and November in Scotland, and November to mid-December in eastern Eng-land (SCOS 2010). In the Baltic, the gray seals’ pupping season is from late February to early April (Hook and Johnels 1972). In the Dutch Wadden Sea, the original peak was on 21 January (with a mean birth date 7 January), later than the east coast of the UK. However since then, a shift forward of 1.27 d/ yr was observed in the Wad-den Sea, with the maximum number of pups observed on the 16 December in 2013, five weeks earlier than in 1985. The shift could suggest a growing synchronicity with the colonies on the UK coasts. However, this shift could also be a result of the popu-lation maturing (Härkönen et al. 2002), or could result from the similar phenome-non observed in the harbor seals in the Wadden Sea area (Reijnders et al. 2010b). It was suggested there, that an improvement in environmental conditions sustained a long-term high annual growth rate, and a progressing earlier birth date.
Figure 7. a: eSTiMaTe oF The ToTal nuMBer oF 1 year olD gray SealS in The DuTch WaDDen Sea, coMpareD To The eSTi-
MaTeD iMporT oF young aniMalS FroM The uk; B: eSTiMaTeD pup proDucTion coMpareD To counTS anD For SoMe yearS,
nuMBer oF grey SealS in reScue cenTre. DaTa on reScue WaS oBTaineD FroM ecoMare (perS. coM) anD DiVerSe puBlic
MeDia (anonyMouS 2000-2012). For The DaTa on The reScueD SealS only The yearS are preSenTeD Where DaTa coVering
The BreeDing SeaSon WaS aVailaBle (1 Dec. – 15 May The neXT year). in oTher yearS iT WaS noT clear When SealS Were
collecTeD or The DaTa WaS incoMpleTe. The DaTa FroM ecoMare ShoWS ThaT only 6 ouT oF 271 gray SealS reScueD in
ThiS perioD Were olDer Than a FeW MonThS.
94 95
Seals in motion 5. Rapid recovery of Dutch gray seal colonies fuelled by immigration
Why DiD gray Seal recolonize The WaDDen Sea?
There could be a number of reasons why gray seals have recolonized the area after being absent for so many years. As gray seal numbers increased in the UK, a gro-wing number of seals would have moved to the southeastern North Sea in a search for new feeding grounds and reached the Wadden Sea. The growth of the seal numbers coincides well with the growth rates observed in the different colonies al-ong the English east coasts where the recent average change in pup production lies between 3.5% and 15.8% (SCOS 2010). Possibly, similar processes, throughout the larger area of the southern North Sea drive the increase in gray seals in our study area. Likewise, other marine top predators in the region, such as the harbor seal and the harbor porpoise, Phocoena phocoena, have also shown a large increase in num-bers over the same period (Camphuysen 2004, Reijnders et al. 2009). This indicates a favorable environment to sustain larger numbers of different marine mammal species. Despite the regular loss of pups due to bad weather during the pupping season, the continuous and relatively high growth rates in gray seal numbers in the Netherlands, but also in the colonies in the southern UK, suggests that the popula-tion is not close to its carrying capacity. Presently resources, such as food and haul out sites are apparently not limiting the population. Although adults may come to the area outside of the pupping season, high site fidelity during pupping season would make it unlikely for them to stay. Therefore, immigrants into the breeding population were presumed to have arrived as pups and sub-adults.
This case, where immigrants continuously arrive into the population, seems clearly different from the southern elephant seal (Mirounga leonina) colony on Peninsula Valdez (Ferrari et al., 2013). There apparently, immigration from other areas occur-red only for a short time and the population developed further in relative isolation, probably within one century.
Additionally, favorable conditions in the Wadden Sea area could have enhanced the seals to move into the area. Many sand bars in the Wadden Sea are protected either by law or by the fact that they are not easily accessible from land. The question is whether this might change in the future as increasing development of human activities in the southern North Sea, such as offshore wind farming, sand mining, tourism, fisheries, and aquaculture, could negatively affect the carrying capacity of the area for these apex predators, and influence the exchange of gray seals between colonies.
Finally, though this is, to our knowledge, not supported by any existing study in gray seals, the growing number of seals hauled out could have been an incentive for new seals to haul out as well, creating (perceived) safety in numbers. Increased density may have a positive effect on individual fitness, known as the Allee effect (Drago et al. 2011). This could explain the persisting concentration of seals in the area initially colonized. Possibly the presence of growing numbers of harbor seals could also instigate the colonization of new areas.
concluSion
This study shows that large mammals, after hundreds of years of virtual extinc-tion, may ultimately recolonize an area and undergo rapid exponential population growth. What are needed are favorable environmental conditions, large source meta populations, and the mobility of individuals.
In this specific case, growth of the population in the UK and subsequent recovery in the Netherlands, occurred more than 50 yr after gray seals were protected in the UK. In current impact assessments and conservation plans for long-lived marine mammals, these time scales are rarely taken into account. Changes in the human use of the southern North Sea (e.g., the recent development of wind farms) could influence the population development, but remain unobserved during the relatively short duration of most monitoring and impact assessment studies.
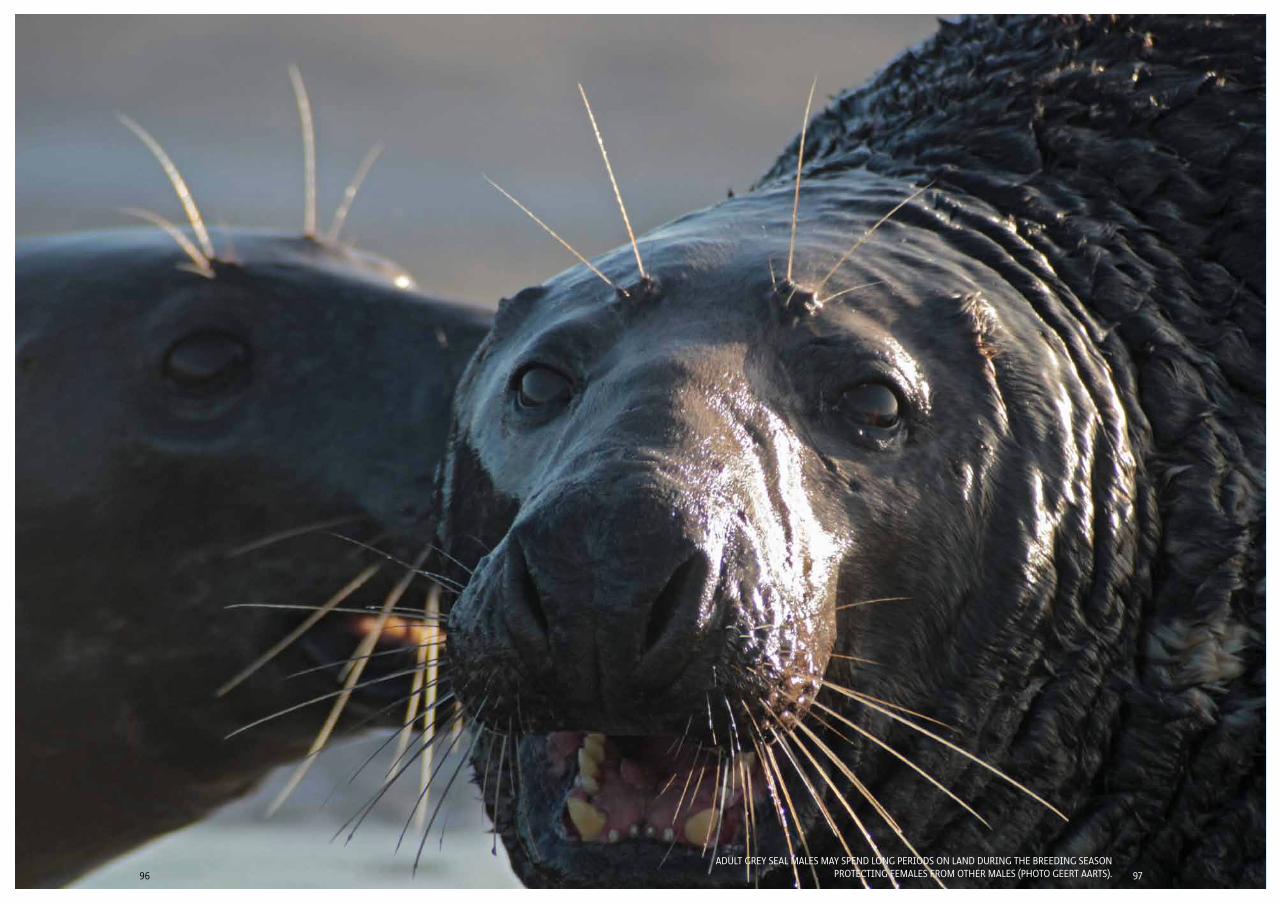
9796aDulT grey Seal MaleS May SpenD long perioDS on lanD During The BreeDing SeaSon
proTecTing FeMaleS FroM oTher MaleS (phoTo geerT aarTS).
98 99
Seals in motion 6. gray seal tracking reveals different behaviours of resident and transient population components
Sophie M.J.M. Brasseur, Geert Aarts, Peter J.H. Reijnders, and Roger Kirkwood
6. gREy SEAL TRAcKINg REvEALS DIffERENT bEHAvIOURS Of RESIDENT AND TRANSIENT pOpULATION cOMpONENTS
98
SuMMary
Grey seals recently recolonised the Dutch coasts. The exponential population growth is fuelled by immigrating grey seals from the UK, who subsequently breed in the Netherlands. In addition, population survey data suggested that a number of grey seals use the Dutch area to forage, but return to the UK to breed. Although such population surveys can provide insight into discrepancies and regional imba-lances in the number of seals observed on land, the data are insufficient to measure the actual underlying migration processes. Using an extensive data set on indivi-dually tracked grey seals, we study the movement of grey seals in relation to where they forage and breed. The tracked seals of different age and sex classes were recognised to be either resi-dent or transient based on where they went during and outside the breeding season. The grey seals breeding in the Netherlands also only haul-out in the Netherlands throughout the period between the moult and next breeding season. Only animals that bred elsewhere (respectively 50% of the adult females and 67% of the adult males tracked in this study) visited regions other than Dutch waters during the rest of the year. Some however, remained in Dutch waters continuously between the breeding trips to other countries. The tracking data suggest a higher number of grey seals might be visiting the Dutch waters than was estimated in a population analysis based on aerial surveys. These results might also have consequences for the popula-tion modelling used to estimate the grey seal population size in the UK.As eastern Atlantic grey seals in the North Sea are a mixed meta-population, coor-dinated, international collaborations are needed to assess their status and trends. Since transient seals might be driven by intraspecific competition, ecological studies on for example, the role of grey seals as a top predator, need to consider the entire North Sea grey seal population.
inTroDucTion
From the 11th century onwards the grey seals of the eastern Atlantic were confined to the northern United Kingdom but, since the mid-1900s, have greatly expanded their range and population size (Brasseur et al. 2015, Svensson et al. 2011, Lonergan et al. 2011, Abt & Engler 2009, Bowen et al. 2007). Though many individuals appear to remain in local areas, the expansion in range is potentially stimulated by the long-distance movements of some individuals (Austin et al. 2004). In the Nether-lands, the range expansion by grey seals saw the first pup born in 1985 (Reijnders et al. 1995). By 2015, there were 657 pups born and, in March-April 2016, a total of 3,696 grey seals were counted on Dutch sandbanks (Brasseur et al. 2016). The population counts suggested that the local breeding population appeared to be boosted each year by young seals, but also by temporary visitors that were present only for part of the year, outside the breeding season (Brasseur et al. 2015). When and where seals allocate their foraging and breeding time, is largely unknown, but has relevance to managing the grey seal population (Russell et al. 2013), as well as relevance for understanding how any pinniped species colonises new areas (Gag-giotti et al. 2002).
Grey seals are the largest pinnipeds in the temperate waters of the North Atlantic Ocean. Based on distribution, size, behavioural and genetic differences, they are
100 101
Seals in motion 6. gray seal tracking reveals different behaviours of resident and transient population components
divided into three distinct populations: the Baltic, the western Atlantic, and the eastern Atlantic (Klimova et al. 2014, Bonner 1972). North Sea grey seals are part of the eastern Atlantic population (Reijnders et al. 1993). Though most populations are presently thriving (Brasseur et al. 2015, Svensson et al. 2011, Lonergan et al. 2011, Abt & Engler 2009, Bowen et al. 2007), the general perception that grey seals were rare persisted until the second half of the 20th century (Bonner 1989). From the Middle Ages through to the 1900s, the eastern Atlantic population was subjec-ted to ongoing hunting, causing severe restrictions in their range (Härkönen et al. 2007a). Grey seal remains were common in early findings along the Dutch coast, but disappeared in the late Middle Ages, with only occasional vagrants recorded through to the mid-1900s (Reijnders et al. 1995). After protection of the grey seals in the UK during the mid-1900s (Lambert 2002), the species slowly recolonised the British North Sea coasts, which eventually facilitated the emigration of animals towards mainland Europe (Abt et al. 2002, Hall et al. 2001, Reijnders et al. 1995, Brasseur et al. 2015, Härkönen et al. 2007a, Dupuis 2011).
In the Netherlands, grey seals breed between the end of November and early Janua-ry, with the peak in the first weeks of December; they moult in March-April (Schop et al. 2017, Brasseur et al. 2015). Aerial surveys conducted between 1985 and 2014, were used to demonstrate the local breeding population grew at an average rate of 19% annually (Brasseur et al. 2015). This was beyond the intrinsic growth rate and, therefore, was likely fuelled by a constant influx of new animals. Also, there was a surplus of seals observed in surveys during the moult and the feeding season not participating in the local breeding population. Based on the numbers in the neighbouring countries, immigrating animals most likely came from the eastern North Sea coast of the UK, where the population was much larger and also growing in numbers (SCOS 2010). Potentially, grey seals that are dependent on resources in Dutch waters (i.e. resting sites and prey) comprise both those breeding locally and those breeding elsewhere, most likely the UK. Though the aerial surveys do provide a strong suggestion for these permanent and temporary visitors, they are not ade-quate to determine the actual movements.
The movements of seals are expected to vary between age and sex classes. Female grey seals show a high fidelity to the pupping sites where they return to after the feeding season between the moult and breeding (Pomeroy et al. 2000b, Pomeroy et al. 2001, Pomeroy et al. 2005). However, a variable proportion of females may use different regions for feeding and breeding (Russell et al. 2013, Vincent et al. 2005, Gerondeau et al. 2007). Females used different feeding areas than males, especi-ally immediately following moult and in the months before parturition (Beck et al. 2003b, Breed et al. 2006). Young seals near Sable Island (Nova Scotia) tend to avoid feeding areas of the adult females, which is most likely driven by intraspeci-fic competition in this densely populated area (Breed et al. 2013). As the breeding colonies on the UK coasts in the southern North Sea have grown explosively in recent decades (SCOS 2016) there is a high probability of young grey seals, possibly also adult animals traversing towards haul-out sites in the Netherlands and foraging from them. The use of the Dutch waters and haul-outs by transient seals of different age and sex classes likely results in a seasonal change in representation of the dif-ferent age and sex classes.To better understand relationships and differences between the resident and the temporary visiting individuals in the Netherlands, grey seals were tracked during
non-breeding and breeding periods of the year. Tracked seals were recognised to be either resident or transient based on where individuals went during the foraging and breeding season.
MaTerialS & MeThoDS
grey Seal Tracking
Between 2007 and 2015, 84 grey seals were captured and fitted with tracking devices in the framework of different telemetry projects in the Netherlands (Brasseur & Kirkwood 2016, Kirkwood et al. 2015, Brasseur & Kirkwood 2015, Kirkwood et al. 2014, Brasseur et al. 2010). Catch sites were spread across the Dutch coastal zone: Ameland in the central Wadden Sea, Texel in the western Wadden Sea and coastal sandbars in the southern Delta region (Figure 1). Deployment periods were either in late winter/ early spring (March-May; n=58), following the grey seals’ moul-ting period, or in late summer/ autumn (September; n=26), preceding the seals’ breeding season (Nov-Jan). All seals were captured by rapidly setting a specifically designed seine-net of approximately 100 m length in front of a group of seals ly-ing on a haul-out site, typically an intertidal sandbar. Seals fled into the water and became ensnared in the net, which was hauled onto the sandbar. Seals for tracking were selected, aiming for equal numbers of adult females, adult males and sub-adult animals of either sex. Unselected seals were immediately released. The selected seals were restrained in specifically-designed cradles to be processed. They were sexed, measured (standard -nose to tail- and total length in cm) and weighed (±0.5 kg). All seals were released within 90 min after the net had been set. Females were defined as adult when they were larger than 135 cm, males when they were larger than 150 cm.
Each seal was equipped with a GPS-GSM tracking device (Sea Mammal Research Unit, University of St Andrews) with Fastloc GPS hardware (developed by Wild-track Telemetry Systems Ltd, Leeds, United Kingdom). These devices collect and store location, dive, and haul-out timing data, which were relayed via the GSM mobile phone system to data storage facilities (Cronin et al. 2010). The trackers were glued to the seal’s fur, at the mid-dorsal point immediately above the shoulder blades, using epoxy resin (Permacol). Trackers could stop functioning or fall off any time after deployment, but certainly were lost during the moult in spring (March-April).
DaTa proceSSing
For this study summary data were used, summarising the seals behaviour, at either 2- or 4-hour interval. These summaries included the percentage of time spent di-ving, hauled out and surfing but also maximum and average dive depth. Summary data were linked to the GPS location nearest in time. Each summary record with at least 80% haul-out was subsequently linked to the closest known haul-out site along the North Sea coast. Each summary record was allocated to one of the three periods: the foraging period prior to breeding (March to November), breeding (November to December) and post-breeding (December-February). As the aim was
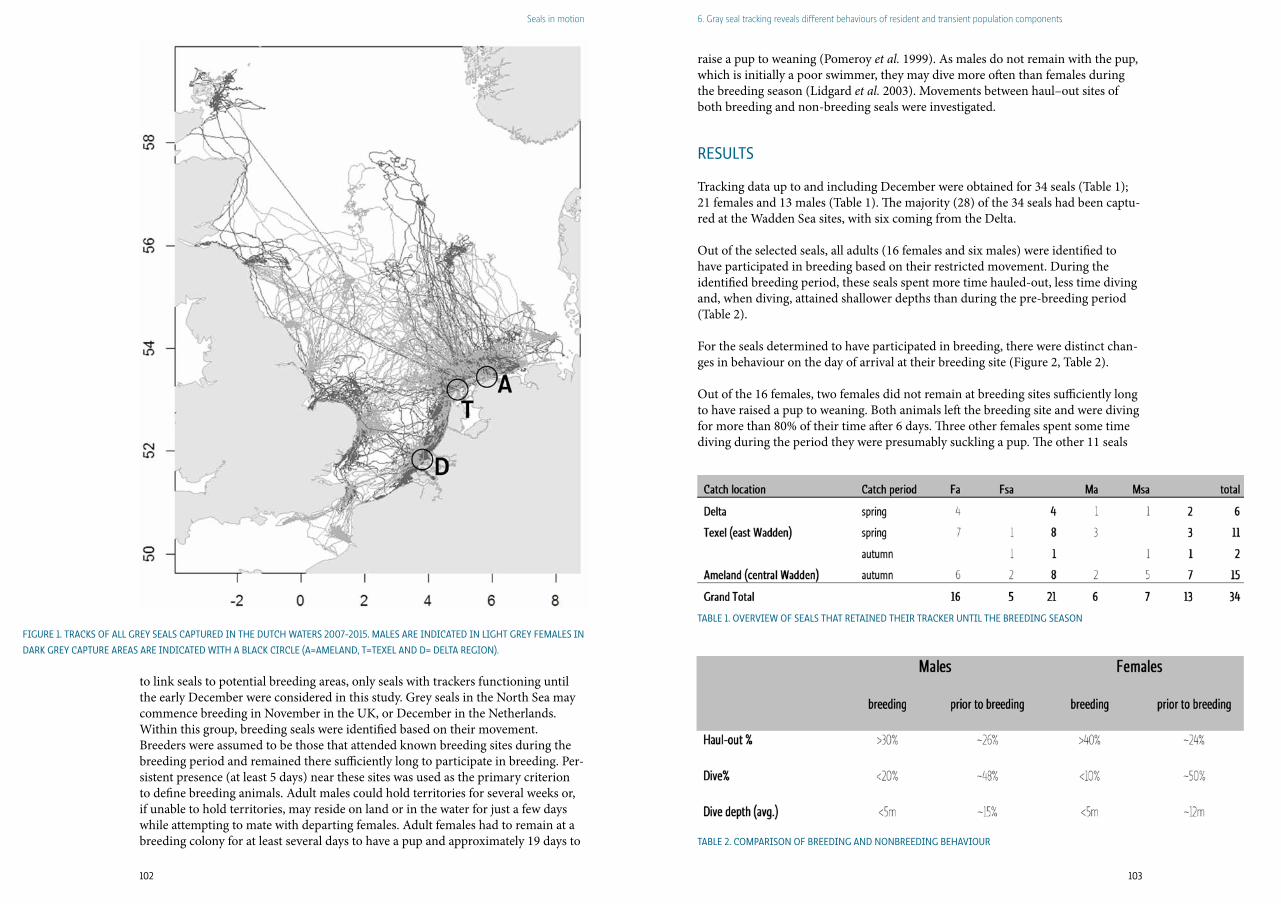
102 103
Seals in motion 6. gray seal tracking reveals different behaviours of resident and transient population components
to link seals to potential breeding areas, only seals with trackers functioning until the early December were considered in this study. Grey seals in the North Sea may commence breeding in November in the UK, or December in the Netherlands. Within this group, breeding seals were identified based on their movement. Breeders were assumed to be those that attended known breeding sites during the breeding period and remained there sufficiently long to participate in breeding. Per-sistent presence (at least 5 days) near these sites was used as the primary criterion to define breeding animals. Adult males could hold territories for several weeks or, if unable to hold territories, may reside on land or in the water for just a few days while attempting to mate with departing females. Adult females had to remain at a breeding colony for at least several days to have a pup and approximately 19 days to
raise a pup to weaning (Pomeroy et al. 1999). As males do not remain with the pup, which is initially a poor swimmer, they may dive more often than females during the breeding season (Lidgard et al. 2003). Movements between haul–out sites of both breeding and non-breeding seals were investigated.
reSulTS
Tracking data up to and including December were obtained for 34 seals (Table 1); 21 females and 13 males (Table 1). The majority (28) of the 34 seals had been captu-red at the Wadden Sea sites, with six coming from the Delta.
Out of the selected seals, all adults (16 females and six males) were identified to have participated in breeding based on their restricted movement. During the identified breeding period, these seals spent more time hauled-out, less time diving and, when diving, attained shallower depths than during the pre-breeding period (Table 2).
For the seals determined to have participated in breeding, there were distinct chan-ges in behaviour on the day of arrival at their breeding site (Figure 2, Table 2).
Out of the 16 females, two females did not remain at breeding sites sufficiently long to have raised a pup to weaning. Both animals left the breeding site and were diving for more than 80% of their time after 6 days. Three other females spent some time diving during the period they were presumably suckling a pup. The other 11 seals
Figure 1. TrackS oF all grey SealS capTureD in The DuTch WaTerS 2007-2015. MaleS are inDicaTeD in lighT grey FeMaleS in
Dark grey capTure areaS are inDicaTeD WiTh a Black circle (a=aMelanD, T=TeXel anD D= DelTa region).
TaBle 2. coMpariSon oF BreeDing anD nonBreeDing BehaViour
TaBle 1. oVerVieW oF SealS ThaT reTaineD Their Tracker unTil The BreeDing SeaSon
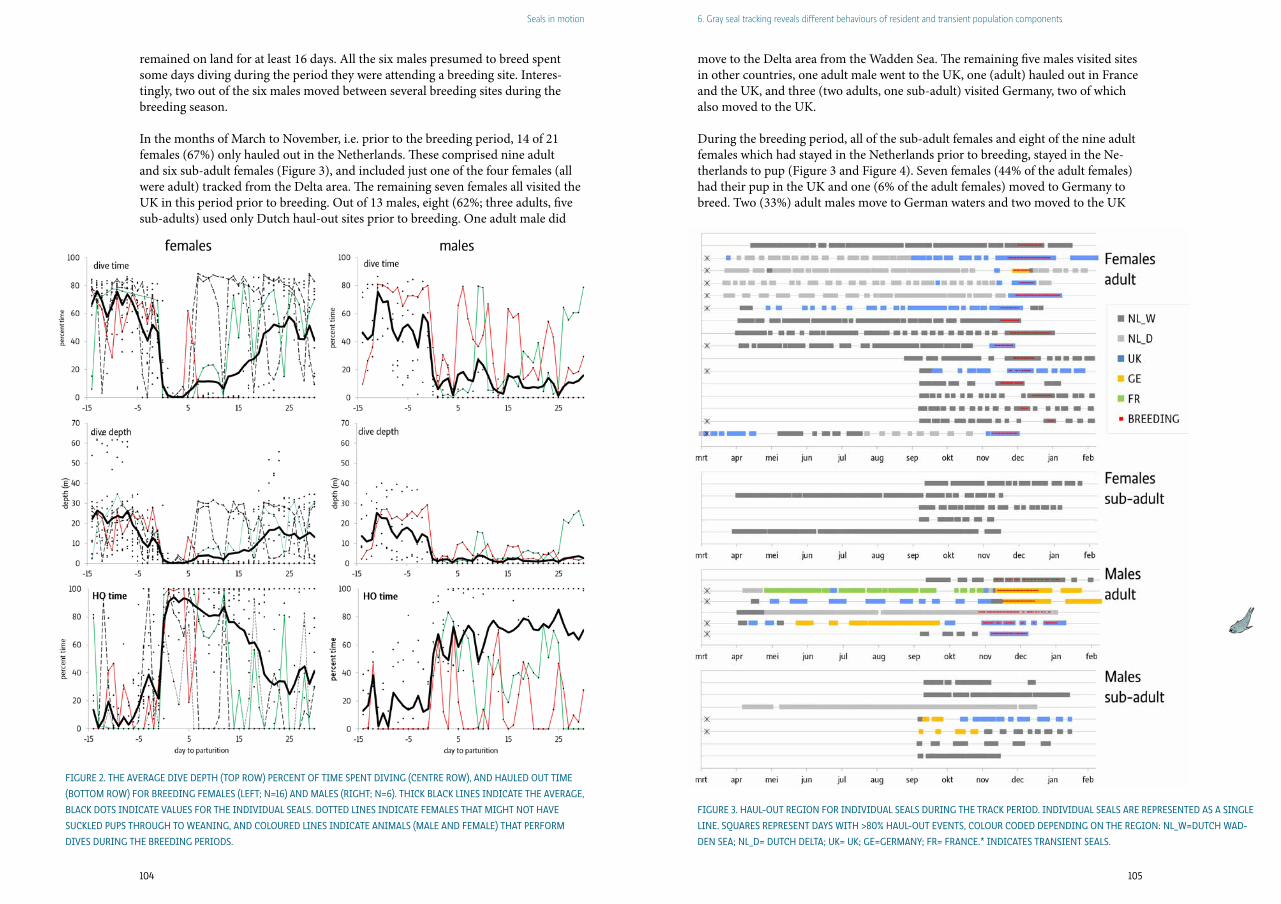
104 105
Seals in motion 6. gray seal tracking reveals different behaviours of resident and transient population components
remained on land for at least 16 days. All the six males presumed to breed spent some days diving during the period they were attending a breeding site. Interes-tingly, two out of the six males moved between several breeding sites during the breeding season.
In the months of March to November, i.e. prior to the breeding period, 14 of 21 females (67%) only hauled out in the Netherlands. These comprised nine adult and six sub-adult females (Figure 3), and included just one of the four females (all were adult) tracked from the Delta area. The remaining seven females all visited the UK in this period prior to breeding. Out of 13 males, eight (62%; three adults, five sub-adults) used only Dutch haul-out sites prior to breeding. One adult male did
move to the Delta area from the Wadden Sea. The remaining five males visited sites in other countries, one adult male went to the UK, one (adult) hauled out in France and the UK, and three (two adults, one sub-adult) visited Germany, two of which also moved to the UK.
During the breeding period, all of the sub-adult females and eight of the nine adult females which had stayed in the Netherlands prior to breeding, stayed in the Ne-therlands to pup (Figure 3 and Figure 4). Seven females (44% of the adult females) had their pup in the UK and one (6% of the adult females) moved to Germany to breed. Two (33%) adult males move to German waters and two moved to the UK
Figure 2. The aVerage DiVe DepTh (Top roW) percenT oF TiMe SpenT DiVing (cenTre roW), anD hauleD ouT TiMe
(BoTToM roW) For BreeDing FeMaleS (leFT; n=16) anD MaleS (righT; n=6). Thick Black lineS inDicaTe The aVerage,
Black DoTS inDicaTe ValueS For The inDiViDual SealS. DoTTeD lineS inDicaTe FeMaleS ThaT MighT noT haVe
SuckleD pupS Through To Weaning, anD coloureD lineS inDicaTe aniMalS (Male anD FeMale) ThaT perForM
DiVeS During The BreeDing perioDS.
Figure 3. haul-ouT region For inDiViDual SealS During The Track perioD. inDiViDual SealS are repreSenTeD aS a Single
line. SquareS repreSenT DayS WiTh >80% haul-ouT eVenTS, colour coDeD DepenDing on The region: nl_W=DuTch WaD-
Den Sea; nl_D= DuTch DelTa; uk= uk; ge=gerMany; Fr= France.* inDicaTeS TranSienT SealS.

106 107
Seals in motion 6. gray seal tracking reveals different behaviours of resident and transient population components
during the breeding period. One sub-adult male also went to the UK. Eight males (six sub-adults, two adults) remained in Dutch waters during breeding. The two remaining sub-adult males spend most of the breeding period in the Netherlands, and then one moved to the UK and the other to Germany. In the post-breeding period for adults, or after December 31st for sub adults, most seals remained in their breeding region, although three females that pupped else-where (two in UK and one in Germany) were tracked back to the Netherlands.
DiScuSSion
This study demonstrates the grey seals’ flexibility in choice of haul-out sites during foraging and breeding, which likely assisted their rapid recolonization of North Sea coastlines since protection from hunting in the mid-1900s. Two important results of the study are singled out for discussion here. Firstly, those grey seals breeding in the Netherlands only haul-out in the Netherlands throughout the tagging period between the moult and breeding season (the ‘residents’). Only animals that bred elsewhere visited regions other than Dutch waters during the rest of the year (the ‘transients’). Some of these, however, remained in Dutch waters continuously until the breeding season elsewhere. Secondly, the tagging data suggests that the number of animals visiting the Dutch waters might be even higher than was estimated in a population analysis that was based on aerial surveys (Brasseur et al. 2015).
Also, in other areas of their geographical range, grey seals were observed with similar transient and resident behaviour: In the UK, 42 to 79% of adult female grey
seals used the same regions for breeding and foraging (Russell et al. 2013). The pro-portion of residents and transient grey seals differed substantially between the UK regions. Along the East and South-East coast of the UK, where grey seal numbers have increased exponentially in recent decades (SCOS 2016), both the population survey data and tracking data (n=5), suggested that the majority of grey seals bree-ding there, also foraged in those same regions (residents). In contrast, the majority of animals foraging near the East and South-East coast, reproduced elsewhere (tran-sients), mostly in Northern Scotland or Hebrides (Russell et al. 2013) . Also at Sable Island, which is the most important breeding site for western Atlantic grey seals, 29% of adults, comprising three of 25 males (12%) and 12 of 27 (44%) females, stay-ed in the vicinity of the their breeding site to forage (Austin et al. 2003). In the Ne-therlands, all the seals breeding locally continued to use Dutch waters throughout the year to forage. This might be a consequence of the still relatively low numbers of grey seals, as such that the carrying capacity of the region has yet to be reached. Particularly in the Dutch Delta, where despite numbers growing annually (826 grey seals were counted in 2015), records of breeding are still to be made (Brasseur et al. 2015, Arts et al. 2016). Apparently haul-outs in this region are used as a resting site from which to feed or moult. When breeding, seals move to other areas. This might change in the near future as one of the males recorded in this study remained in this area and tracking data suggests breeding behaviour.The majority of animals tracked from the Netherlands that reproduce in the UK, do so in the South-East of the UK. This suggests that this region acts as an important source for grey seals in Netherlands. Despite the growing numbers of seals in this UK North Sea region, presumably fuelled by the breeding populations of Northern Scotland (Russell et al. 2013, SCOS 2016), a proportion of animals breeding there move to the Dutch region to feed. This suggests that feeding conditions in the South-East of the UK might be more profitable compared to North Scotland, but feeding conditions in the Netherlands might be even better. This could be yet another indication that populations of grey seals in the more northern waters of the North Sea have reached the carrying capacity of the area, causing a southward shift, a process also observed in other top-predators (Hammond et al. 2013). A previous population analysis of the aerial survey data in the Wadden Sea (Bras-seur et al. 2015) demonstrated that a proportion of grey seals counted in the Netherlands during the moult or post moult (i.e. summer) could be visitors, poten-tially from the UK. It was estimated a minimum of 150-250 animals were visitors, representing 5 to 8.5% of the total animals observed in the Netherlands, or 1,2% and 0,9% of the UK- North Sea population, excluding pups of the year (Brasseur et al. 2015). In the present study, however, 50% of adult females and 67% of adult ma-les tracked from sites in the Netherlands depart from the Netherlands to breed in other regions, most in the UK. Only two sub-adult males, or 17% of all sub-adults, visited other areas. The majority of the seals had spent a considerable amount of time in the Netherlands. Taking into account the estimated age-structure in the po-pulation (based on the demographic model presented in Brasseur et al. (2015), the proportion of visitors through the year would be more than 30% of the total counts during the post moult and pre breeding season (Table 3).
Recently, estimates of the UK grey seal population size were scaled downwards, because the counts during the summer months suggested that there were much fewer animals than the model based on the pup counts suggested (SCOS 2016). The present study shows that a large proportion of animals observed in the Dutch
Figure 4. MapS oF The TrackS oF The BreeDing SealS (leFT=FeMaleS; righT=MaleS) colour coDeD DepenDing on Their
BreeDing region: reD = The neTherlanDS; Blue =uk; yelloW=gerMany. Black circleS inDicaTe The areaS Where SealS
DiSplayeD BreeDing BehaViour.
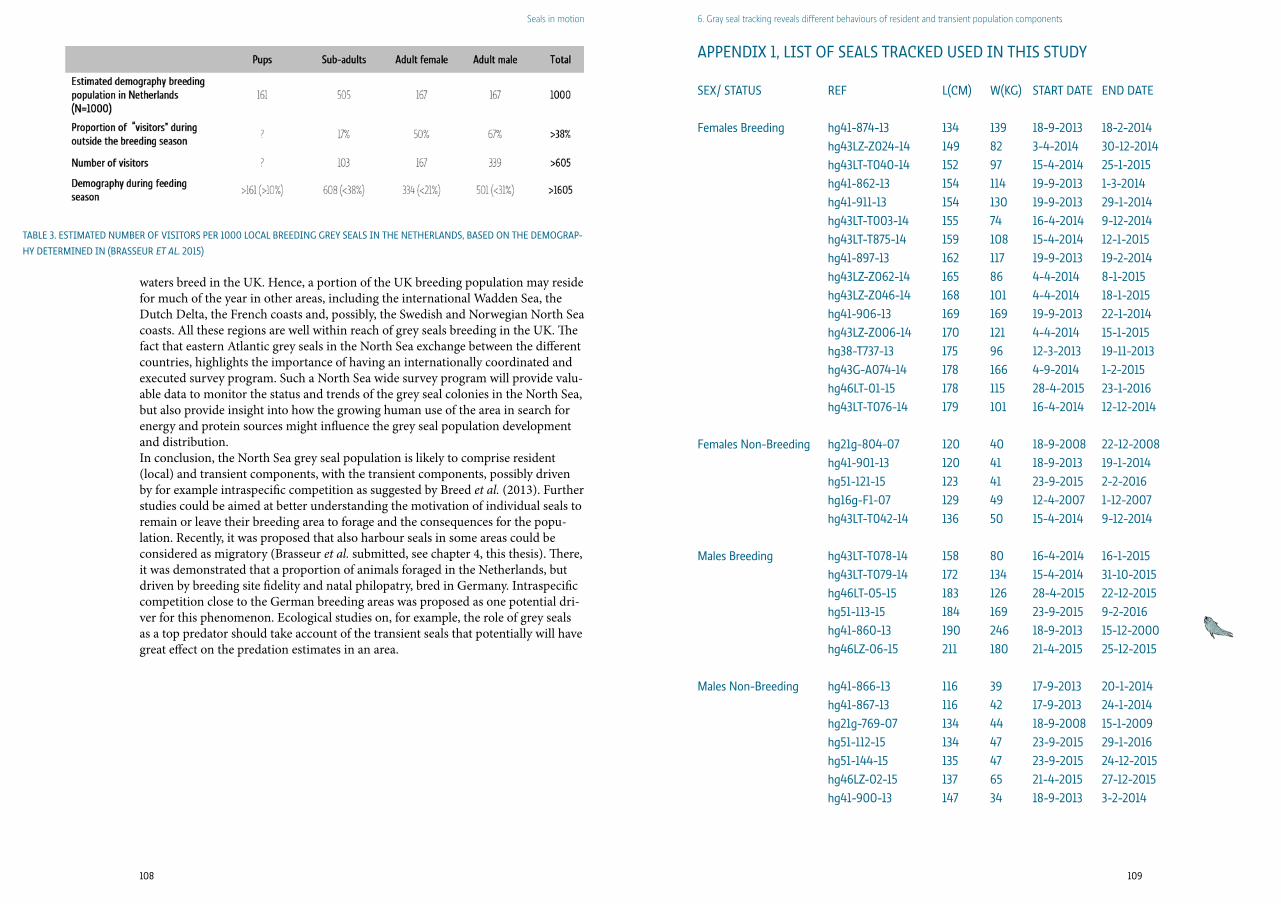
108 109
Seals in motion 6. gray seal tracking reveals different behaviours of resident and transient population components
waters breed in the UK. Hence, a portion of the UK breeding population may reside for much of the year in other areas, including the international Wadden Sea, the Dutch Delta, the French coasts and, possibly, the Swedish and Norwegian North Sea coasts. All these regions are well within reach of grey seals breeding in the UK. The fact that eastern Atlantic grey seals in the North Sea exchange between the different countries, highlights the importance of having an internationally coordinated and executed survey program. Such a North Sea wide survey program will provide valu-able data to monitor the status and trends of the grey seal colonies in the North Sea, but also provide insight into how the growing human use of the area in search for energy and protein sources might influence the grey seal population development and distribution.In conclusion, the North Sea grey seal population is likely to comprise resident (local) and transient components, with the transient components, possibly driven by for example intraspecific competition as suggested by Breed et al. (2013). Further studies could be aimed at better understanding the motivation of individual seals to remain or leave their breeding area to forage and the consequences for the popu-lation. Recently, it was proposed that also harbour seals in some areas could be considered as migratory (Brasseur et al. submitted, see chapter 4, this thesis). There, it was demonstrated that a proportion of animals foraged in the Netherlands, but driven by breeding site fidelity and natal philopatry, bred in Germany. Intraspecific competition close to the German breeding areas was proposed as one potential dri-ver for this phenomenon. Ecological studies on, for example, the role of grey seals as a top predator should take account of the transient seals that potentially will have great effect on the predation estimates in an area.
appenDiX 1, liST oF SealS TrackeD uSeD in ThiS STuDy
SeX/ STaTuS reF l(cM) W(kg) STarT DaTe enD DaTe
Females Breeding hg41-874-13 134 139 18-9-2013 18-2-2014 hg43lz-z024-14 149 82 3-4-2014 30-12-2014 hg43lT-T040-14 152 97 15-4-2014 25-1-2015 hg41-862-13 154 114 19-9-2013 1-3-2014 hg41-911-13 154 130 19-9-2013 29-1-2014 hg43lT-T003-14 155 74 16-4-2014 9-12-2014 hg43lT-T875-14 159 108 15-4-2014 12-1-2015 hg41-897-13 162 117 19-9-2013 19-2-2014 hg43lz-z062-14 165 86 4-4-2014 8-1-2015 hg43lz-z046-14 168 101 4-4-2014 18-1-2015 hg41-906-13 169 169 19-9-2013 22-1-2014 hg43lz-z006-14 170 121 4-4-2014 15-1-2015 hg38-T737-13 175 96 12-3-2013 19-11-2013 hg43g-a074-14 178 166 4-9-2014 1-2-2015 hg46lT-01-15 178 115 28-4-2015 23-1-2016 hg43lT-T076-14 179 101 16-4-2014 12-12-2014 Females non-Breeding hg21g-804-07 120 40 18-9-2008 22-12-2008 hg41-901-13 120 41 18-9-2013 19-1-2014 hg51-121-15 123 41 23-9-2015 2-2-2016 hg16g-F1-07 129 49 12-4-2007 1-12-2007 hg43lT-T042-14 136 50 15-4-2014 9-12-2014 Males Breeding hg43lT-T078-14 158 80 16-4-2014 16-1-2015 hg43lT-T079-14 172 134 15-4-2014 31-10-2015 hg46lT-05-15 183 126 28-4-2015 22-12-2015 hg51-113-15 184 169 23-9-2015 9-2-2016 hg41-860-13 190 246 18-9-2013 15-12-2000 hg46lz-06-15 211 180 21-4-2015 25-12-2015 Males non-Breeding hg41-866-13 116 39 17-9-2013 20-1-2014 hg41-867-13 116 42 17-9-2013 24-1-2014 hg21g-769-07 134 44 18-9-2008 15-1-2009 hg51-112-15 134 47 23-9-2015 29-1-2016 hg51-144-15 135 47 23-9-2015 24-12-2015 hg46lz-02-15 137 65 21-4-2015 27-12-2015 hg41-900-13 147 34 18-9-2013 3-2-2014
TaBle 3. eSTiMaTeD nuMBer oF ViSiTorS per 1000 local BreeDing grey SealS in The neTherlanDS, BaSeD on The DeMograp-
hy DeTerMineD in (BraSSeur eT al. 2015)

Seals in motion hoofdstuk
111110
BreeDing colony oF grey SealS. For BoTh harBour anD grey SealS Suckling perioD iS ShorT (in aVerage reSpecTiVely 24 anD 19 DayS), BeFore The pup iS leFT To SurViVe on iTS oWn (phoTo: roger kirkWooD)

112 113
Seals in motion 7. Synthesis
The understanding of movements of animals within their natural habitat, and especially understanding the individual variation that occurs in movement is an essential basis to answering questions regarding population development but also ecological questions, and questions regarding the conservation or management of populations (Härkönen & Harding 2001, Matthiopoulos 2003, Matthiopoulos et al. 2004, Hayward et al. 2005). In this thesis, I have demonstrated how movement between (sub-) populations have played an essential role in the recent population development of both harbour seals and grey seals in the Wadden Sea area of the Ne-therlands. For the harbour seal, movement supported the recovery in the Dutch wa-ters, despite the annual return of a proportion of females to Germany (Chapters 2 & 4). For grey seals, movement enabled the recolonisation of an area that had been vacated for centuries, creating a now growing local breeding population (Chapters 5 & 6). For both species, surveys of seals on land and finding periodic surpluses or deficits provided the first indications of these movements. Clearly, the population changes were the result of individuals discovering and colonising new areas. Throughout the seals’ lifetime, motivation to move to other areas might vary, re-sulting in a growing or diminished possibility of exploring or colonising new areas. On one hand, the seals’ fidelity to areas, breeding, foraging, moulting or resting, might restrict the expansion of a population, on the other hand, the lack of parental guidance from an early age, changes in the environment and competition for food or space, could fuel the expansion. In this synthesis, I would like to elaborate on this “conflict” and look for answers to the questions: When are the seals most likely to switch to new areas? Why would they do so?All pinnipeds are compelled to balance time between their aquatic foraging, where they can gain energy, and their obligation to periodically come on land to rest, moult or breed, and mostly lose energy (Figure 1). Harbour and grey seals do haul out periodically year-round. Depending on the motivation to come on land, there are different requirements to the haul-outs used; resting during the foraging season (a & c) might necessitate less specific requirements for haul-out sites than during the breeding (b) and maybe the moulting season (d), possibly driving animals to change haul-out sites between the seasons.
7. SyNTHESIS
112
SelecTion oF haul-ouT SiTeS
SelecTion oF BreeDing SiTeSFor breeding, the preferred haul-out would need to stay dry, at least for most of the time. Seals come on land and remain on, or near haul-out sites during breeding as the pups are less capable of swimming and might lose valuable energy in the water (Harding et al. 2005). Circumventing part of these constraints, harbour seals are born with “adult” fur enabling the pup to follow the mother in the water within hours after birth. In chapter 3 of this thesis, I demonstrate how the breeding females initially change their behaviour drastically, hauling out more and diving less, and gradually increasing their diving effort as their pup presumably grows. This partially aquatic breeding facilitates the choice of birth site, as a tidal haul-out area suffices. Moreover, this allows the female to feed during the breeding period (Austin et al. 2006, Boness et al. 1994). Grey seals are much more limited, as they generally stay on land throughout the lactation period, and although pups might be able to swim (Caudron 1997, Brasseur et al. 2015b), in areas where storm surges may flush the breeding site, drowning may be an important source of mortality (Brasseur et al. 2015a) Figure 2. The seals would also require specific haul-outs where pups are sheltered from dis-turbance from, for example, land predators (or currently humans). Harbour seals that can swim with their pup are able to avoid land predators more easily than the grey seals. Possibly, this is one of the reasons for the extinction of the grey seals on most of the European mainland, including the Wadden Sea, in the Middle-Ages (Härkönen et al. 2007a, Reijnders et al. 1995). These more specific requirements for adequate breeding grounds might be one of the reasons for breeding site fidelity and natal philopatry in seals: breeding in an area where breeding has proven to be suc-cessful, guarantees better survival of the pups during the breeding period. Also, the
Figure 1. ScheMaTic oVerVieW oF The
annual cycle oF harBour anD grey
SealS. Blue areaS inDicaTe perioDS oF
WeighT gain, reD areaS perioDS oF
WeighT loSS. Thick lineS repreSenT The
cycle For The aDulTS, WiTh a DaSheD
line BeTWeen Foraging anD BreeDing
For ThoSe ThaT May FeeD During
BreeDing. Thin Black lineS repreSenT
The cycle For The SuB- aDulTS, Skip-
ping The BreeDing perioD. Thin reD
lineS The cycle For The pupS. noTe The
DiFFerence BeTWeen grey Seal pupS
(DaSheD reD line) ThaT MoulT aFTer
Weaning anD The harBour Seal pupS
(SoliD reD line) Which MoulT in uTero.
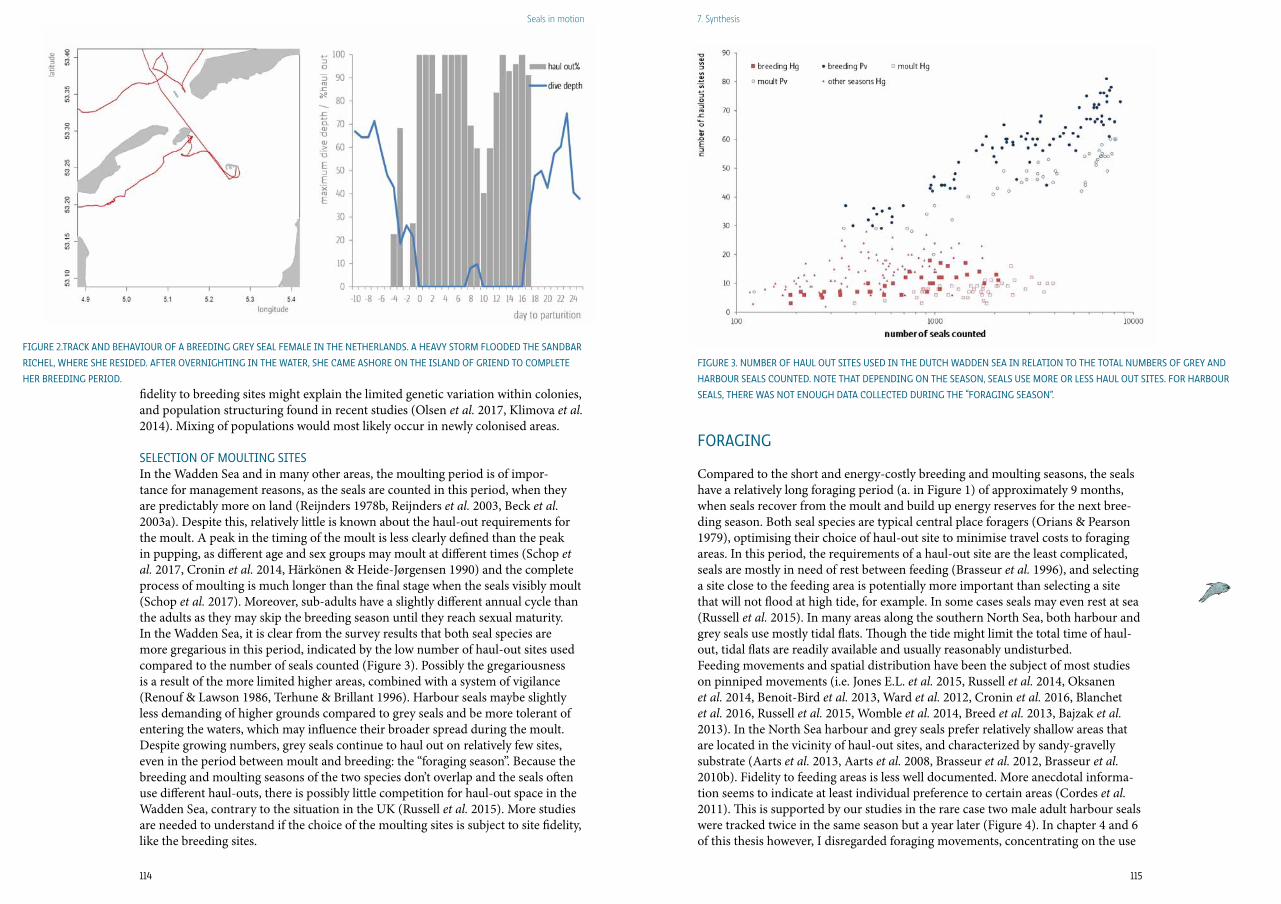
Seals in motion 7. Synthesis
veensteeg | 5 juni 2006 19:55u | guy Ackermans114 115
fidelity to breeding sites might explain the limited genetic variation within colonies, and population structuring found in recent studies (Olsen et al. 2017, Klimova et al. 2014). Mixing of populations would most likely occur in newly colonised areas.
SelecTion oF MoulTing SiTeSIn the Wadden Sea and in many other areas, the moulting period is of impor-tance for management reasons, as the seals are counted in this period, when they are predictably more on land (Reijnders 1978b, Reijnders et al. 2003, Beck et al. 2003a). Despite this, relatively little is known about the haul-out requirements for the moult. A peak in the timing of the moult is less clearly defined than the peak in pupping, as different age and sex groups may moult at different times (Schop et al. 2017, Cronin et al. 2014, Härkönen & Heide-Jørgensen 1990) and the complete process of moulting is much longer than the final stage when the seals visibly moult (Schop et al. 2017). Moreover, sub-adults have a slightly different annual cycle than the adults as they may skip the breeding season until they reach sexual maturity. In the Wadden Sea, it is clear from the survey results that both seal species are more gregarious in this period, indicated by the low number of haul-out sites used compared to the number of seals counted (Figure 3). Possibly the gregariousness is a result of the more limited higher areas, combined with a system of vigilance (Renouf & Lawson 1986, Terhune & Brillant 1996). Harbour seals maybe slightly less demanding of higher grounds compared to grey seals and be more tolerant of entering the waters, which may influence their broader spread during the moult. Despite growing numbers, grey seals continue to haul out on relatively few sites, even in the period between moult and breeding: the “foraging season”. Because the breeding and moulting seasons of the two species don’t overlap and the seals often use different haul-outs, there is possibly little competition for haul-out space in the Wadden Sea, contrary to the situation in the UK (Russell et al. 2015). More studies are needed to understand if the choice of the moulting sites is subject to site fidelity, like the breeding sites.
Figure 2.Track anD BehaViour oF a BreeDing grey Seal FeMale in The neTherlanDS. a heaVy STorM FlooDeD The SanDBar
richel, Where She reSiDeD. aFTer oVernighTing in The WaTer, She caMe aShore on The iSlanD oF grienD To coMpleTe
her BreeDing perioD.
Figure 3. nuMBer oF haul ouT SiTeS uSeD in The DuTch WaDDen Sea in relaTion To The ToTal nuMBerS oF grey anD
harBour SealS counTeD. noTe ThaT DepenDing on The SeaSon, SealS uSe More or leSS haul ouT SiTeS. For harBour
SealS, There WaS noT enough DaTa collecTeD During The “Foraging SeaSon”.
Foraging
Compared to the short and energy-costly breeding and moulting seasons, the seals have a relatively long foraging period (a. in Figure 1) of approximately 9 months, when seals recover from the moult and build up energy reserves for the next bree-ding season. Both seal species are typical central place foragers (Orians & Pearson 1979), optimising their choice of haul-out site to minimise travel costs to foraging areas. In this period, the requirements of a haul-out site are the least complicated, seals are mostly in need of rest between feeding (Brasseur et al. 1996), and selecting a site close to the feeding area is potentially more important than selecting a site that will not flood at high tide, for example. In some cases seals may even rest at sea (Russell et al. 2015). In many areas along the southern North Sea, both harbour and grey seals use mostly tidal flats. Though the tide might limit the total time of haul-out, tidal flats are readily available and usually reasonably undisturbed. Feeding movements and spatial distribution have been the subject of most studies on pinniped movements (i.e. Jones E.L. et al. 2015, Russell et al. 2014, Oksanen et al. 2014, Benoit-Bird et al. 2013, Ward et al. 2012, Cronin et al. 2016, Blanchet et al. 2016, Russell et al. 2015, Womble et al. 2014, Breed et al. 2013, Bajzak et al. 2013). In the North Sea harbour and grey seals prefer relatively shallow areas that are located in the vicinity of haul-out sites, and characterized by sandy-gravelly substrate (Aarts et al. 2013, Aarts et al. 2008, Brasseur et al. 2012, Brasseur et al. 2010b). Fidelity to feeding areas is less well documented. More anecdotal informa-tion seems to indicate at least individual preference to certain areas (Cordes et al. 2011). This is supported by our studies in the rare case two male adult harbour seals were tracked twice in the same season but a year later (Figure 4). In chapter 4 and 6 of this thesis however, I disregarded foraging movements, concentrating on the use
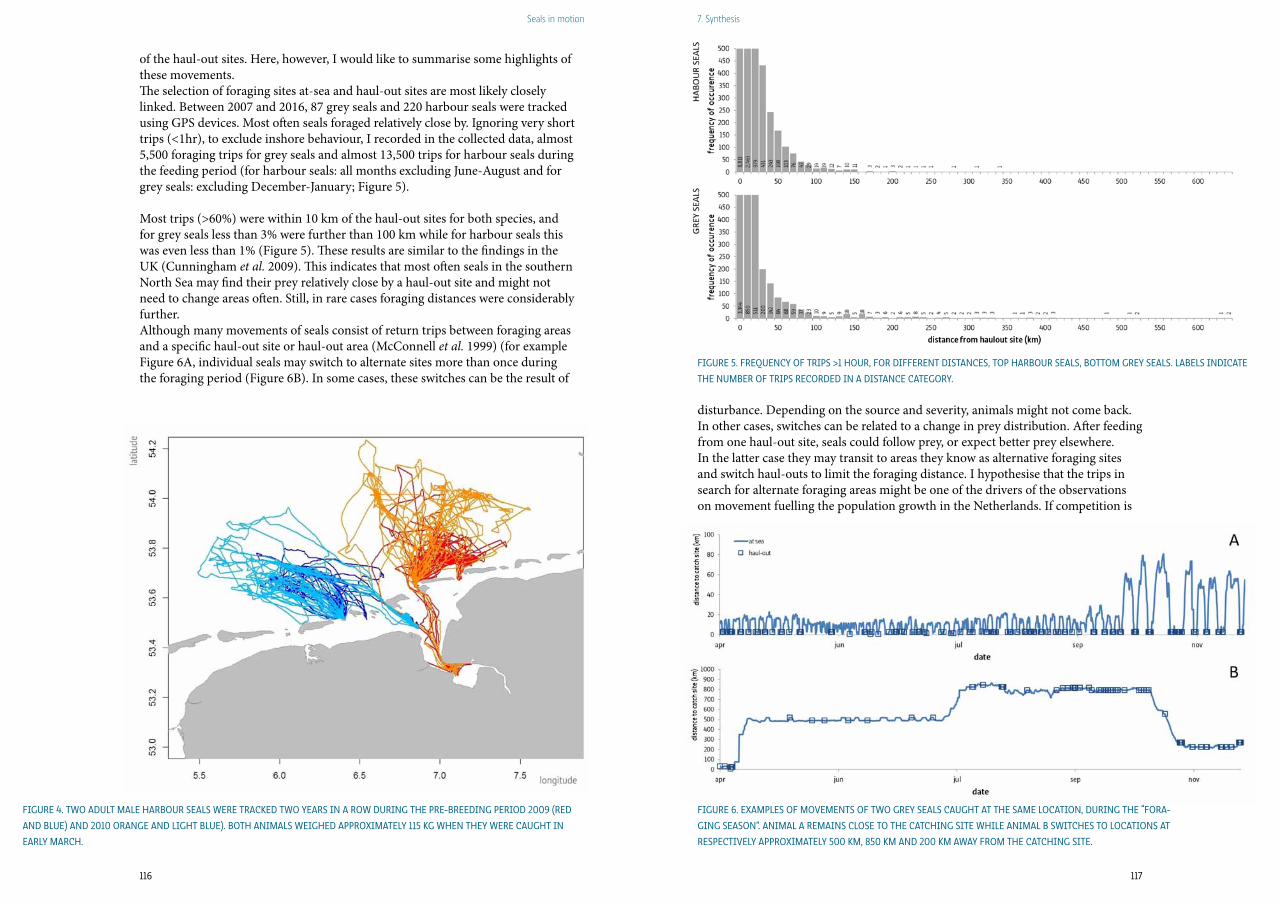
Seals in motion 7. Synthesis
117116 Nieuwe Kanaal | 31 januari 2010 13:42u | Roel ter Horst
of the haul-out sites. Here, however, I would like to summarise some highlights of these movements. The selection of foraging sites at-sea and haul-out sites are most likely closely linked. Between 2007 and 2016, 87 grey seals and 220 harbour seals were tracked using GPS devices. Most often seals foraged relatively close by. Ignoring very short trips (<1hr), to exclude inshore behaviour, I recorded in the collected data, almost 5,500 foraging trips for grey seals and almost 13,500 trips for harbour seals during the feeding period (for harbour seals: all months excluding June-August and for grey seals: excluding December-January; Figure 5). Most trips (>60%) were within 10 km of the haul-out sites for both species, and for grey seals less than 3% were further than 100 km while for harbour seals this was even less than 1% (Figure 5). These results are similar to the findings in the UK (Cunningham et al. 2009). This indicates that most often seals in the southern North Sea may find their prey relatively close by a haul-out site and might not need to change areas often. Still, in rare cases foraging distances were considerably further. Although many movements of seals consist of return trips between foraging areas and a specific haul-out site or haul-out area (McConnell et al. 1999) (for example Figure 6A, individual seals may switch to alternate sites more than once during the foraging period (Figure 6B). In some cases, these switches can be the result of
Figure 4. TWo aDulT Male harBour SealS Were TrackeD TWo yearS in a roW During The pre-BreeDing perioD 2009 (reD
anD Blue) anD 2010 orange anD lighT Blue). BoTh aniMalS WeigheD approXiMaTely 115 kg When They Were caughT in
early March.
Figure 5. Frequency oF TripS >1 hour, For DiFFerenT DiSTanceS, Top harBour SealS, BoTToM grey SealS. laBelS inDicaTe
The nuMBer oF TripS recorDeD in a DiSTance caTegory.
Figure 6. eXaMpleS oF MoVeMenTS oF TWo grey SealS caughT aT The SaMe locaTion, During The “Fora-
ging SeaSon”. aniMal a reMainS cloSe To The caTching SiTe While aniMal B SWiTcheS To locaTionS aT
reSpecTiVely approXiMaTely 500 kM, 850 kM anD 200 kM aWay FroM The caTching SiTe.
disturbance. Depending on the source and severity, animals might not come back. In other cases, switches can be related to a change in prey distribution. After feeding from one haul-out site, seals could follow prey, or expect better prey elsewhere. In the latter case they may transit to areas they know as alternative foraging sites and switch haul-outs to limit the foraging distance. I hypothesise that the trips in search for alternate foraging areas might be one of the drivers of the observations on movement fuelling the population growth in the Netherlands. If competition is
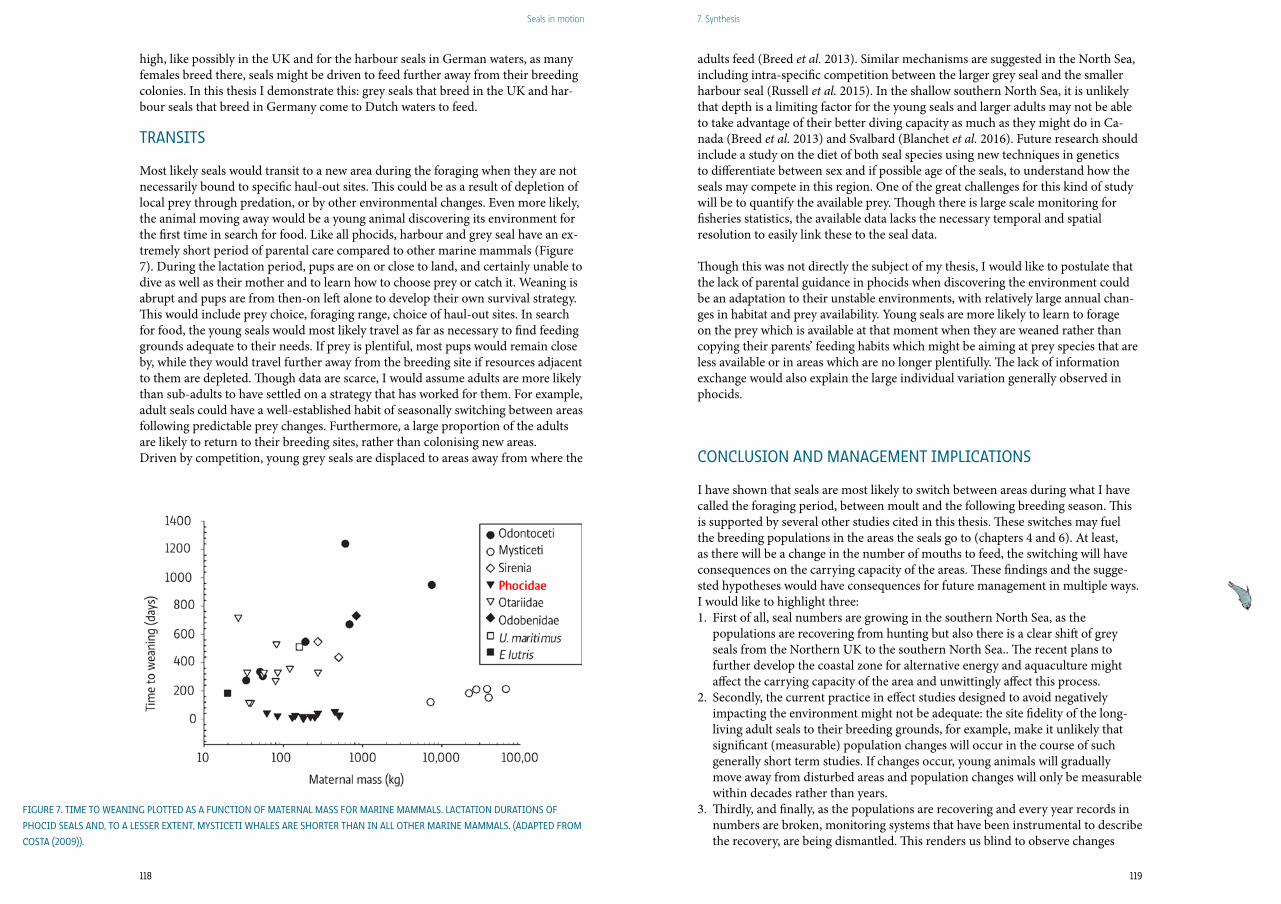
Seals in motion 7. Synthesis
119118
high, like possibly in the UK and for the harbour seals in German waters, as many females breed there, seals might be driven to feed further away from their breeding colonies. In this thesis I demonstrate this: grey seals that breed in the UK and har-bour seals that breed in Germany come to Dutch waters to feed.
TranSiTS
Most likely seals would transit to a new area during the foraging when they are not necessarily bound to specific haul-out sites. This could be as a result of depletion of local prey through predation, or by other environmental changes. Even more likely, the animal moving away would be a young animal discovering its environment for the first time in search for food. Like all phocids, harbour and grey seal have an ex-tremely short period of parental care compared to other marine mammals (Figure 7). During the lactation period, pups are on or close to land, and certainly unable to dive as well as their mother and to learn how to choose prey or catch it. Weaning is abrupt and pups are from then-on left alone to develop their own survival strategy. This would include prey choice, foraging range, choice of haul-out sites. In search for food, the young seals would most likely travel as far as necessary to find feeding grounds adequate to their needs. If prey is plentiful, most pups would remain close by, while they would travel further away from the breeding site if resources adjacent to them are depleted. Though data are scarce, I would assume adults are more likely than sub-adults to have settled on a strategy that has worked for them. For example, adult seals could have a well-established habit of seasonally switching between areas following predictable prey changes. Furthermore, a large proportion of the adults are likely to return to their breeding sites, rather than colonising new areas.Driven by competition, young grey seals are displaced to areas away from where the
Figure 7. TiMe To Weaning ploTTeD aS a FuncTion oF MaTernal MaSS For Marine MaMMalS. lacTaTion DuraTionS oF
phociD SealS anD, To a leSSer eXTenT, MySTiceTi WhaleS are ShorTer Than in all oTher Marine MaMMalS. (aDapTeD FroM
coSTa (2009)).
adults feed (Breed et al. 2013). Similar mechanisms are suggested in the North Sea, including intra-specific competition between the larger grey seal and the smaller harbour seal (Russell et al. 2015). In the shallow southern North Sea, it is unlikely that depth is a limiting factor for the young seals and larger adults may not be able to take advantage of their better diving capacity as much as they might do in Ca-nada (Breed et al. 2013) and Svalbard (Blanchet et al. 2016). Future research should include a study on the diet of both seal species using new techniques in genetics to differentiate between sex and if possible age of the seals, to understand how the seals may compete in this region. One of the great challenges for this kind of study will be to quantify the available prey. Though there is large scale monitoring for fisheries statistics, the available data lacks the necessary temporal and spatial resolution to easily link these to the seal data.
Though this was not directly the subject of my thesis, I would like to postulate that the lack of parental guidance in phocids when discovering the environment could be an adaptation to their unstable environments, with relatively large annual chan-ges in habitat and prey availability. Young seals are more likely to learn to forage on the prey which is available at that moment when they are weaned rather than copying their parents’ feeding habits which might be aiming at prey species that are less available or in areas which are no longer plentifully. The lack of information exchange would also explain the large individual variation generally observed in phocids.
concluSion anD ManageMenT iMplicaTionS
I have shown that seals are most likely to switch between areas during what I have called the foraging period, between moult and the following breeding season. This is supported by several other studies cited in this thesis. These switches may fuel the breeding populations in the areas the seals go to (chapters 4 and 6). At least, as there will be a change in the number of mouths to feed, the switching will have consequences on the carrying capacity of the areas. These findings and the sugge-sted hypotheses would have consequences for future management in multiple ways. I would like to highlight three: 1. First of all, seal numbers are growing in the southern North Sea, as the populations are recovering from hunting but also there is a clear shift of grey seals from the Northern UK to the southern North Sea.. The recent plans to further develop the coastal zone for alternative energy and aquaculture might affect the carrying capacity of the area and unwittingly affect this process. 2. Secondly, the current practice in effect studies designed to avoid negatively impacting the environment might not be adequate: the site fidelity of the long- living adult seals to their breeding grounds, for example, make it unlikely that significant (measurable) population changes will occur in the course of such generally short term studies. If changes occur, young animals will gradually move away from disturbed areas and population changes will only be measurable within decades rather than years. 3. Thirdly, and finally, as the populations are recovering and every year records in numbers are broken, monitoring systems that have been instrumental to describe the recovery, are being dismantled. This renders us blind to observe changes
120
Seals in motion
121© herculeS & ValkeMa WWW.elSJe.nl
such as the ones mentioned above. Moreover, the harbour and grey seal populations in the southern North Sea are some of the best studied and monitored (marine) species in the world. Knowledge and insights gained here will prove valuable in less studied, maybe more sensitive areas such as the Arctic.

122 123
Seals in motion Summary
122
SUMMARy
122
chapTer 1
In chapter 1 the subjects of this thesis are introduced: the harbour seal and the grey seal. Specifically their reproductive phenology, history and population development are described, and an outline of the thesis is provided.
chapTer 2
In Chapter 2, Echoes from the past, a 40-year time series of regional variations in recovery within a harbour seal population in the Wadden Sea is analysed. The Wad-den Sea harbour seal population is considered one ecological entity, and distributed over four geo-political regions: the Netherlands, Niedersachsen (including Ham-burg), Schleswig-Holstein and Denmark. The emphasis of this study lies on the populations developments in each of those four regions, where historically different management regimes were operational. In particular the impact of the regionally different hunting regulations and hunting gradually being banned between 1962 and 1976, on the recovery of the population is investigated. Population growth models were developed to assess if growth differed between regions, taking into account two Phocine Distemper Virus (PDV) epizootics, in 1988 and 2002, which seriously affected the population. After a slow start prior to the first epizootic, the overall population grew exponentially at rates close to assumed maximum rates of increase in a harbour seal population. Recently, growth slowed down, potentially indicative of an approach towards carrying capacity. Regional differences in growth rates were demonstrated, with the highest recovery in Netherlands after the first PDV epizootic (i.e. 17.9%), suggesting that growth was fuelled by migration from the other regions, where growth remained at or below the intrinsic growth rate (13%). The seals’ distribution changed, and although the relative proportion of all seals in the German regions declined, they remained by far the most important pupping region, with approximately 70% of all pups being born here.It is hypothesised that differences in hunting regime in the beginning of the 20th century, created unbalance in the distribution of breeding females throughout the Wadden Sea, which prevailed for decades. Breeding site fidelity promoted the growth in pup numbers at less affected breeding sites, while recolonisation of new breeding areas would be suppressed by the philopatry displayed by the pups as they reach adulthood. This study shows that for long-lived species, variable management regimes in this case hunting regulations, across a species’ range can drive population dynamics for several generations.
chapTer 3
Earlier pupping in harbour seals, Phoca vitulina, describes a progressive earlier pup-ping season of the harbour seal in the Wadden Sea. Pupping phenology in harbour seals is characterized by a tight synchrony of births and little inter-annual variation is observed in timing of births. However, in this study we show that harbour seals shortened their yearly reproductive cycle, moving parturition on average by 0.71 day per year, amounting to three and a half weeks (25 days) earlier, in the Dutch Wadden Sea between 1974 and 2009. Pup counts for other parts of the Wadden Sea showed a similar shift. To elucidate underlying potential mechanisms for this shift, we examined possible changes in population demography, in maternal life-history
The harbour seal Phoca vitulina and the grey seal Halichoerus grypus have been inhabitants of the Wadden Sea since millennia. Prehistoric findings indicate the presence of both species around 5000 BC. This changed dramatically in the mid Middle-Ages as around 1500 AC, the grey seal disappeared from the Wadden Sea as a consequence of persecution. With growing hunting pressure, especially in the 20th century and concurrent habitat destruction and pollution, the harbour seals reached all time low numbers in the 1970’s. Banning the hunt in countries around the southern North Sea, limiting pollution and protection from disturbance allowed the harbour seals to slowly recover and the grey seals to return to the Wadden Sea.In this thesis the population trends and inherent dynamics of the recovery for both species is described. Also the movements of individual animals are studied to explain possible mechanisms.

124 125
Seals in motion Summary
traits and in environmental conditions. It was deduced that a shortening of the embryonic diapause was the most likely mechanism. This lead to the hypothesis that an improved forage base, e.g. increase of small fishes and size selective fisheries, could have facilitated this shift in pupping phenology.
chapTer 4
Directional breeding migration of harbour seals in the Wadden Sea, described our analyses of the movements of harbour seals tracked in the Netherlands. The aim of this study was to investigate the hypothesis put forward in chapter 3 of this thesis that annual breeding migration within the Wadden Sea should occur by this spe-cies. This was based on the finding that a regional misbalance existed in the harbour seal pup production compared to the resident population sizes. Such a breeding migration contradicts the general opinion that harbour seals are considered a short distance non-migratory species. We demonstrate that a large proportion (30%) of females tracked from Dutch wa-ters, where pup production is low relative to seal numbers, migrate for the breeding season to Germany, where more pups are counted. Also, the majority of animals tracked after the breeding season, including 78% of the adult females, moved in the opposite direction, to the west, suggesting a return migration. Presumably, this di-rected migration is a remnant of the historic regional differences in pup production that resulted from uneven hunting pressure. Site fidelity of the breeding females and natal philopatry of their pups make means that, in this long- lived species, these dif-ferences are still apparent, even after almost half a century.Harbour seal pups are weaned at a young age and show very large individual variation, which may mask the breeding migration fuelled by natal philopatry and fidelity of the seals to specific breeding sites. Potentially, the study of the movements of these highly individual animals might provide insight into more fundamental questions on migration and ecological questions related to, for example, population development and population genetics.
chapTer 5
Rapid recovery of Dutch grey seal colonies fuelled by immigration reflects an ana-lysis of a series of counts of hauled out grey seals Halichoerus grypus, carried out between 1985 and 2013. Those counts were part of a grey seal monitoring pro-ject, to assess numbers hauled out in three periods of their annual cycle: pupping (November-February), moulting (March-April), and summer (June-September).After being absent for centuries in the Dutch Wadden Sea, grey seals started to recolonize the area in the early 1980s and first breeding was observed in 1985. At present, the breeding colony is the largest on the European continent, and the bree-ding population is estimated at 3,088 animals in 2013. In this paper we describe the changes in numbers and their geographical expan-sion, and estimate how these processes were influenced by immigration form other colonies. Using priors determined for the UK population, a Bayesian demographic model was fitted to pup numbers to estimate the population parameters driving the growth. This included immigration of sub-adults into the breeding population, which contributed to an average growth rate in the pup counts of 19% per year, much higher than expected in a closed population. This immigration may account for approximately 35% of the total annual growth. In addition, at least 200 grey seals
from the UK visit the area temporarily. As the population grew, grey seals gradually expanded their range to haul-out sites throughout the entire DutchWadden Sea, though by far the largest groups are still observed where the first colony formed. Smaller, but growing colonies, are also seen to the east along the German Wadden Sea coasts, south in the Dutch Delta, and even further south in northern France.Recovery of the population in the Netherlands occurred more than 50 year after grey seals were protected in the UK. These time scales should be taken into ac-count when studying long living marine mammals, e.g., in impact and conservation studies.
chapTer 6
Grey seal tracking reveals different behaviours of resident and transient population components. Although such population surveys can provide insight into discrepan-cies and regional imbalances in the number of seals observed on land, the data are insufficient to measure the actual underlying migration processes. Using an exten-sive data set on individually tracked grey seals, we study the movement of grey seals in relation to where they forage and breed. The tracked seals of different age and sex classes were recognised to be either resi-dent or transient based on where they went during and outside the breeding season. The grey seals breeding in the Netherlands also only haul-out in the Netherlands throughout the period between the moult and next breeding season. Only animals that bred elsewhere (respectively 50% of the adult females and 67% of the adult males tracked in this study) visited regions other than Dutch waters during the rest of the year. Some however, remained in Dutch waters continuously between the breeding trips to other countries. The tracking data suggest a higher number of grey seals might be visiting the Dutch waters than was estimated in a population analysis based on aerial surveys. These results might also have consequences for the popula-tion modelling used to estimate the grey seal population size in the UK.As eastern Atlantic grey seals in the North Sea are a mixed meta-population, coor-dinated, international collaborations are needed to assess their status and trends. Since transient seals might be driven by intraspecific competition, ecological studies on for example, the role of grey seals as a top predator, need to consider the entire North Sea grey seal population.
chapTer 7
Synthesis. This thesis demonstrates how movement between (sub-) populations have played an essential role in the recent population development of both harbour seals and grey seals in the Wadden Sea area of the Netherlands. In the synthesis mechanisms that may aid or that may hinder these movements are discussed. Both seal species show strong site fidelity to breeding areas and assumingly also to moulting and foraging sites. Still, environmental pressure like changes in local food availability or haul out possibilities might cause animals to transit to other areas. As harbour and grey seals have an extremely short lactation and parental care period, it is unlikely that they would acquire knowledge from their elders as many other spe-cies would. Young animals might therefore be the likeliest candidates to recolonise new areas, especially during the period after the moult and before the next breeding season, when seals feed intensively to have enough reserves for the next breeding and moulting season.

126 127
Seals in motion Nederlandse samenvatting
126
NEDERLANDSE SAMENvATTINg
126
SaMenVaTTing
De gewone zeehond Phoca vitulina en de grijze zeehond Halichoerus grypus bewo-nen al duizenden jaren de Waddenzee. Prehistorische vondsten tonen aan dat beide soorten al rond 5000 vóór Christus hier voorkwamen. Dit veranderde dramatisch in de Middeleeuwen, doordat rond 1500 AC onder druk van de jacht, de grijze zee-hond uit de Waddenzee verdween. In de 20ste eeuw bereikten de aantallen gewone zeehonden een dieptepunt als gevolg van de nog verder toegenomen jachtdruk, in combinatie met waterverontreiniging en habitatvernietiging. Het jachtverbod in de landen rond de zuidelijke Noordzee, het beperken van de watervervuiling en de be-scherming tegen verstoring, maakten het mogelijk dat de gewone zeehondenpopu-latie langzaam herstelde en dat de grijze zeehonden terugkeerden in de Waddenzee. In dit proefschrift worden de populatietrends en de inherente dynamiek van het herstel van beide soorten beschreven. Ook zijn de trekbewegingen van individuele dieren bestudeerd om de mogelijke onderliggende mechanismen te verklaren.
hooFDSTuk 2
In hoofdstuk 2, Echoes from the past, wordt aan de hand van een tijdreeks van 40 jaar gewone zeehonden tellingen, regionale variaties in het herstel binnen de gehele populatie zeehonden in de Waddenzee geanalyseerd. De gewone zeehondenpopu-latie in de Waddenzee wordt beschouwd als één ecologische entiteit, verdeeld over vier geopolitieke gebieden: Nederland, Nedersaksen (inclusief Hamburg), Sleeswijk-Holstein en Denemarken. De nadruk van deze studie ligt op de populatieontwikke-ling in elk van deze vier regio’s, waar in het verleden verschillende beheersregimes werden toegepast. In het bijzonder worden de gevolgen van de regionaal verschil-lende jachtregels en het geleidelijk sluiten van de jacht tussen 1962 en 1976, op het herstel van de populatie onderzocht.Er werden populatie-groeimodellen ontwikkeld om te beoordelen of de groei tussen regio’s verschillen, rekening houdend met twee Phocine Distemper Virus (PDV) epizoötieën, in 1988 en 2002, die de populatie sterk decimeerde. Na een langzame start, voorafgaand aan de eerste virusuitbraak, groeide de populatie exponentieel met een snelheid die de maximum groeisnelheid voor een gewone zeehondenpopu-latie benaderde. Recentelijk is de groei vertraagd, hetgeen mogelijk een aanwijzing is dat de populatie de draagkracht van het gebied benadert. Regionale verschillen in groeisnelheid werden aangetoond, met het grootste herstel in Nederland na de eerste PDV epizoötie (en wel 17,9%). Dit suggereert dat de groei werd gevoed door migratie uit de andere regio’s, waar de groei op of onder
de maximale snelheid van 13% per jaar bleef. De verspreiding van de zeehonden veranderde, en hoewel het relatieve aandeel zeehonden in de Duitse regio’s zakte, bleven zij verreweg de belangrijkste gebieden voor de jongen, ongeveer 70% van alle pups worden er geboren.Wij postuleren dat de verschillen in jachtregime in het begin van de 20ste eeuw voor een onbalans heeft gezorgd in de verspreiding van drachtige vrouwtjes in de Waddenzee. Deze verschillen bleven decennia lang gehandhaafd. De plaatstrouw-heid voor voorplantingsgebieden bevorderde de groei van het aantal pups in de minder getroffen gebieden, terwijl rekolonisatie van nieuwe voortplantingsgebieden belemmerd wordt door de philopatrie van de pups. Uit deze studie blijkt dat voor langlevende soorten, verschillen in beheersregimes (in dit geval jachtbepalingen) over hun hele verspreidingsgebied de populatiedynamiek van meerdere generaties kan beïnvloeden.
hooFDSTuk 3
Earlier pupping in harbour seals, Phoca vitulina, beschrijft een voortgaande vervroe-ging van het voortplantingsseizoen bij de gewone zeehond in de Waddenzee. Voort-plantingsfenologie bij zeehonden wordt gekenmerkt door een strakke synchronisa-tie van de geboorten met weinig jaar op jaar variatie in het moment van geboorten. In deze studie tonen we echter aan dat de gewone zeehonden hun jaarlijkse voort-plantingscyclus hebben verkort, waarbij een verschuiving heeft plaatsgevonden van gemiddeld 0,71 dagen per jaar. Dat heeft in de Nederlandse Waddenzee geleid tot een vervroeging van het geboorteseizoen van drie en een half week (25 dagen) tussen 1974 en 2009. Pup tellingen in andere regio’s van de Waddenzee lieten een soortgelijke verschuiving zien. Om de onderliggende mogelijke mechanismen voor deze verschuiving op te helderen, onderzochten we mogelijke veranderingen in de populatiedemografie, stadia in de vrouwelijk voortplanting (w.o. duur van de zwangerschap, zoogduur, uitstel van implantatie van bevruchte eicel) en milieuom-standigheden. Dit leidde ertoe dat een verkorting van de embryonale diapause het meest waarschijnlijke mechanisme voor dit fenomeen was. Daarop baseerden we de hypothese dat een verbeterd prooiaanbod, feitelijk een toename van kleine vissen en de grootte-selectieve visserij, deze verschuiving in pup-fenologie heeft gefaciliteerd
hooFDSTuk 4
Directional breeding migration of harbour seals in the Wadden Sea, beschrijft de analyses van de bewegingen van gezenderde gewone zeehonden in Nederland. Doel van deze studie was om de hypothese uit hoofdstuk 3 van dit proefschrift, dat jaarlijkse voortplantingsmigratie binnen de Waddenzee door deze soort zou moeten optreden, te onderzoeken. Die was gebaseerd op de bevinding dat er in de pup pro-ductie van gewone zeehonden een regionale onbalans bestond in vergelijking tot de lokale populatiegroottes. Een dergelijke voortplantingsmigratie is contrasteert met de algemene opvatting dat de gewone zeehond slechts over korte afstanden trekt, en een niet-migrerende soort zou zijn.We tonen aan dat een groot deel (30%) van de gezenderde vrouwtjes uit de Neder-landse wateren, waar de pup productie laag is ten opzichte van de zeehondenaan-tallen, migreert voor het voortplantingsseizoen naar Duitsland, waar meer pups worden geteld. De overgrote meerderheid van de dieren, inclusief 78% van de volwassen vrouwtjes, verplaatst zich na het voortplantingsseizoen ook in de tegen-
128 129
Seals in motion Nederlandse samenvatting
overgestelde richting naar het westen, wat als een terugkeermigratie beschouwd kan worden. Vermoedelijk is deze gerichte migratie een overblijfsel van de historische regionale verschillen in pup productie die voortvloeide uit ongelijke jachtdruk. Plaatstrouwheid van de zich voortplantende vrouwtjes en de geboorteplek philopa-trie van hun pups heeft tot gevolg gehad dat in deze langlevende soort de verschil-len in geboorte aantallen na bijna een halve eeuw nog steeds duidelijk zijn.Pups van gewone zeehonden worden op jonge leeftijd gespeend en vertonen een zeer grote individuele variatie. Mogelijk verhult dit de jaarlijkse migratie tijdens het voortplantingsseizoen, die veroorzaakt door geboorteplek philopatrie en de trouwheid die de dieren hebben voor specifieke voortplantingsgebieden. In potentie kan het onderzoek naar de bewegingen van deze hoogst individuele dieren inzicht verschaffen in meer fundamentele vragen over migratie en ecologische vraagstuk-ken in relatie tot bijvoorbeeld populatieontwikkeling en populatiegenetica.
hooFDSTuk 5
Rapid recovery of Dutch grey seal colonies fuelled by immigration geeft een analyse weer van een serie tellingen van grijze zeehonden, uitgevoerd tussen 1985 en 2013. Deze data maakten deel uit van een grijze zeehonden monitoringsproject om de aantallen dieren op de ligplaatsen te bepalen in drie periodes van hun jaarcyclus: de voortplanting (november-februari), de verharing (maart-april) en de zomer (juni-september).Na eeuwen afwezig te zijn geweest in de Nederlandse Waddenzee, begonnen de grijze zeehonden in de vroege jaren tachtig van de afgelopen eeuw het gebied te rekoloniseren, en in 1985 werd het eerste hier geboren jong waargenomen. Te-genwoordig is de voortplantingskolonie de grootste op het Europese continent en wordt deze geschat op 3088 dieren in 2013.In dit artikel beschrijven we de veranderingen in aantallen, hun geografische verspreiding en schatten hoe deze processen werden beïnvloed door immigratie uit andere kolonies.Om de populatieparameters te schatten die voor de groei verantwoordelijk zijn, werd met behulp van priors die bepaald werden voor de Britse populatie, een Bayesiaans demografisch model toegepast op de aantallen pups. Die parameters omvatten onder meer een schatting voor de immigratie van sub-adulten naar de voortplantingskolonie. De immigratie droeg bij aan een gemiddeld groeipercen-tage in de puptellingen van 19% per jaar, veel meer dan verwacht zou worden in een gesloten populatie. Deze immigratie zou ongeveer 35% van de totale jaarlijkse groei kunnen bepalen. Naast immigratie bezoeken tenminste 200 grijze zeehonden uit het Verenigd Koninkrijk tijdelijk het gebied. Naarmate de zeehondenbevolking daar groeide, breidden de grijze zeehonden hun verspreidingsgebied geleidelijk uit met ligplaatsen in de gehele Nederlands Waddenzee, alhoewel de grootste groepen nog steeds waargenomen worden waar de eerste kolonie zich vormde. Kleinere, maar groeiende kolonies, worden ook oostelijker gezien langs de Duitse Wadden-zeekusten, ten zuiden van de Nederlandse Delta, en nog verder naar het zuiden, in Noord-Frankrijk.Het herstel van de populatie in Nederland gebeurde meer dan 50 jaar nadat grijze zeehonden in het Verenigd Koninkrijk werden beschermd. Bij het bestuderen van langlevende mariene zoogdieren, bijvoorbeeld in het kader van impact- en beheer-studies, zou men met deze tijdschalen rekening moeten houden.
hooFDSTuk 6
Grey seal tracking reveals different behaviours of resident and transient population components. Hoewel dergelijke populatie analyses inzicht kunnen verschaffen in discrepanties en regionale onbalans in het aantal zeehonden waargenomen op hun ligplaatsen, zijn de gegevens onvoldoende om de werkelijke onderliggende migra-tieprocessen te meten. Met behulp van een uitgebreide dataset van resultaten van gezenderde grijze zeehonden, bestuderen we de beweging van grijze zeehonden in relatie tot waar ze foerageren en waar ze zich voortplanten.Gezenderde zeehonden van verschillende leeftijds- en geslachtsklassen werden onderscheiden als lokaal of transitoir dier, gebaseerd op waar ze zich tijdens en buiten het voortplantingsseizoen ophielden. De grijze zeehonden die in Nederland waren voor de voortplanting, werden alleen op ligplaatsen in Nederland gezien gedurende de periode tussen het verharen en het daaropvolgende voortplantings-seizoen. Alleen die dieren die elders aan de voortplanting meededen (respectievelijk 50% van de volwassen vrouwtjes en 67% van de volwassen mannen die in deze studie zijn gevolgd) bezochten ook gedurende de rest van het jaar ligplaatsen buiten Nederland. Echter sommige van deze dieren bleven continu in Nederland tot het voortplantingsseizoen. De zenderdata suggereren dat er grotere aantallen grijze zeehonden de Nederlandse wateren bezoeken dan uit de populatieanalyse werd geschat (hoofdstuk 5). Deze resultaten kunnen gevolgen hebben voor de populatie-modellering die gebruikt wordt om de populatiegrootte van grijze zeehonden in het Verenigd Koninkrijk te schatten.Aangezien de grijze zeehonden in het Oost-Atlantische gebied één gemengde meta-populatie vormen, is gecoördineerde internationale samenwerkingen nodig om hun status en trends te bepalen. In ecologische studies over bijvoorbeeld de rol van grijze zeehonden als top predator zou de hele Noordzee-brede grijze zeehonden-populatie betrokken moeten worden, aangezien het aantal migrerende zeehonden mogelijk beïnvloed wordt door intraspecifieke concurrentie.
hooFDSTuk 7
Synthesis. Dit proefschrift toont aan hoe bewegingen tussen (sub)populaties een es-sentiële rol hebben gespeeld in de recente populatieontwikkeling van zowel gewone zeehonden als grijze zeehonden in de Nederlandse Waddenzee. In de synthese worden mogelijke mechanismen die de uitwisseling kunnen bevorderen of juist be-lemmeren, besproken. Beide zeehondensoorten vertonen een sterke trouwheid aan voortplantingsgebiden en mogelijk ook aan verharings- en foerageergebieden. Toch kunnen omgevingsfactoren, zoals verandering in de beschikbaarheid van voedsel of de mogelijkheid om aan de kant te komen, ervoor zorgen dat dieren naar andere ge-bieden trekken. Omdat gewone en grijze zeehonden een extreem korte lactatie- en ouderlijke zorgperiode hebben, is het onwaarschijnlijk dat er veel kennisoverdracht plaatsvindt, zoals dit bij vele andere soorten het geval is. Het zullen daarom vooral jonge dieren zijn die nieuwe gebieden koloniseren, meest waarschijnlijk in de pe-riode tussen het verharen en voor het volgende voortplantingsseizoen, wanneer de zeehonden intensief foerageren om reserves op te bouwen.
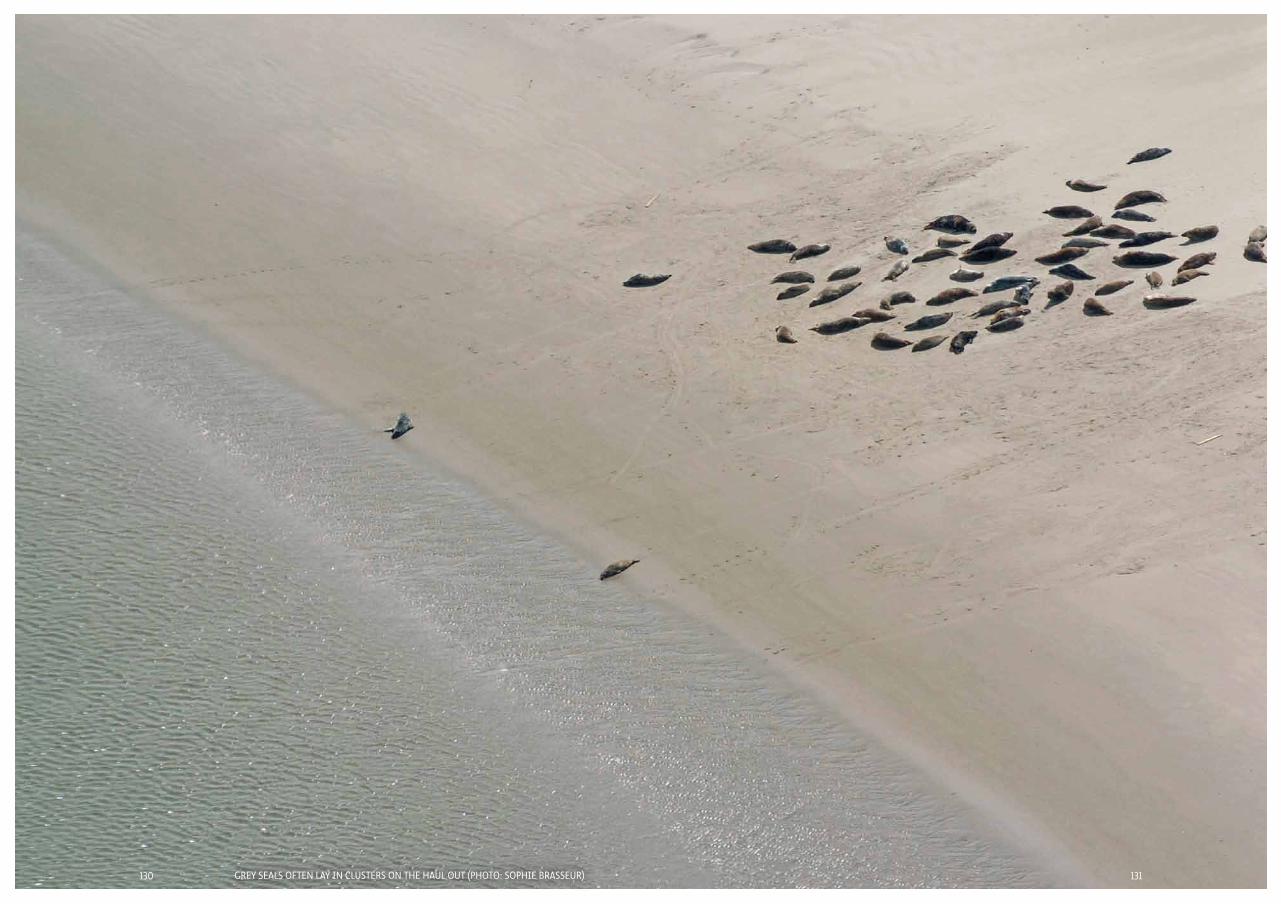
130 131
Seals in motion Nederlandse samenvatting
131130 grey SealS oFTen lay in cluSTerS on The haul ouT (phoTo: Sophie BraSSeur)
Seals in motion References
133132
REfERENcES
132
Bajzak, C. E., W. Bernhardt, A. Mosnier, M. O. Hammill and I. Stirling. 2013. Habitat use by harbour seals (Phoca vitulina) in a seasonally ice-covered region, the western Hudson Bay. Polar Biology 36:477-491.Beauplet, G., L. Dubroca, C. Guinet, Y. Cherel, W. Dabin, C. Gagne and M. Hindell. 2004. Foraging ecology of subantarctic fur seals Arctocephalus tropicalis breeding on Amsterdam Island: seasonal changes in relation to maternal characteristics and pup growth. Marine Ecology Progress Series 273:211-225.Beck, C., A., D. R. Lorrie, J. I. Sara, M. K. John, W. P. Kenneth and S. F. Brian. 2007. Blubber fatty acid profiles reveal regional, seasonal, age-class and sex differences in the diet of young Steller sea lions in Alaska. Marine Ecology Progress Series 338:269-280.Beck, C. A., W. D. Bowen and S. J. Iverson. 2003a. Sex differences in the seasonal patterns of energy storage and expenditure in a phocid seal. Journal of Animal Ecology 72:280-291.Beck, C. A., W. D. Bowen, J. I. Mcmillan and S. J. Iverson. 2003b. Sex differences in the diving behaviour of a size-dimorphic capital breeder: the grey seal. Animal Behaviour 66:777-789.Bemmel, A. C. V. van 1956. Planning a census of the harbour seal (Phoca vitulina L.) on the coasts of the Netherlands. Beaufortia 5: 121-132.Benoit-Bird, K. J., B. C. Battaile, S. A. Heppell, B. Hoover, D. Irons, N. Jones, K. J. Kuletz, C. A. Nordstrom, R. Paredes, R. M. Suryan, C. M. Waluk and A. W. Trites. 2013. Prey Patch Patterns Predict Habitat Use by Top Marine Predators with Diverse Foraging Strategies. PLoS ONE 8:e53348.Bjørge, A., T. Bekkby and E. B. Bryant. 2002. Summer home range and habitat selection of harbor seal (Phoca vitulina) pups. Marine Mammal Science 18:438-454.Blanchet, M.-A., C. Lydersen, R. A. Ims and K. M. Kovacs. 2016. Making it through the first year: Ontogeny of movement and diving behavior in harbor seals from Svalbard, Norway. Marine Mammal Science 32:1340-1369.Blanchet, M.-A., C. Lydersen, R. A. Ims, A. D. Lowther and K. M. Kovacs. 2014. Harbour seal Phoca vitulina movement patterns in the high-Arctic archipelago of Svalbard, Norway. Aquatic Biology 21:167-181.Blundell, G. M., J. N. Womble, G. W. Pendleton, S. A. Karpovich, S. M. Gende and J. K. Herreman. 2011. Use of glacial and terrestrial habitats by harbor seals in Glacier Bay, Alaska: costs and benefits. Marine Ecology Progress Series 429:277-290.Bodewes, R., A. Rubio García, S. M. Brasseur, G. J. Sanchez Conteras, M. W. G. Van De Bildt, M. P. G. Koopmans, A. D. M. E. Osterhaus and T. Kuiken. 2015. Seroprevalence of antibodies against Seal Influenza A(H10N7) virus in harbor seals and gray seals from the Netherlands. PLoS ONE 10:e0144899.Boehme, L., D. Thompson, M. Fedak, D. Bowen, M. O. Hammill and G. B. Stenson. 2012. How many seals were there? The global shelf loss during the Last Glacial Maximum and its effect on the size and distribution of grey seal populations. PLoS ONE 7:e53000.Boness, D. J., W. D. Bowen, B. M. Buhleier and G. J. Marshall. 2006. Mating tactics and mating system of an aquatic-mating pinniped: the harbor seal, Phoca vitulina. Behavioral Ecology and Sociobiology 61:119-130.Boness, D. J., W. D. Bowen and O. T. Oftedal. 1994. Evidence of a Maternal Foraging Cycle Resembling That of Otariid Seals in a Small Phocid, the Harbor Seal. Behavioral Ecology and Sociobiology 34:95-104.
Aarts, G., S. Brasseur, S. Geelhoed, R. Van Bemmelen and M. Leopold. 2013. Grey and harbour seal spatiotemporal distribution along the Dutch West coast. C103/13 IMARES Wageningen UR. 63 pp.Aarts, G., M. Mackenzie, B. Mcconnell, M. Fedak and J. Matthiopoulos. 2008. Estimating space-use and habitat preference from wildlife telemetry data. Ecography 31:140-160.Abt, K. and J. Engler. 2009. Rapid increase of the grey seal (Halichoerus grypus) breeding stock at Helgoland. Helgoland Marine Research 63:177-180.Abt, K. F., N. Hoyer, L. Koch and D. Adelung. 2002. The dynamics of grey seals (Halichoerus grypus) off Amrum in the south-eastern North Sea - evidence of an open population. Journal of Sea Research 47:55-67.Adamczewska, A. M. and S. Morris. 2001. Ecology and Behavior of Gecarcoidea natalis, the Christmas Island Red Crab, During the Annual Breeding Migration. The Biological Bulletin 200:305-320.Andersen, L. and M. T. Olsen. 2010. Distribution and population structure of North Atlantic harbour seals (Phoca vitulina). Pages 15-35, NAMMCO Scientific Publications, 8.Anderson, S. S. and M. A. Fedak. 1987. Grey seal, Halichoerus grypus, energetics: females invest more in male offspring. Journal of Zoology 211:667-679.Anonymous. 1983. Convention on the Conservation of Migratory Species of Wild Animals. http://www.cms.int/sites/.Anonymous. 2000-2010. Robbenbulletin. http://www.zeehondencreche.nl.Arts, F. A., S. Lilipaly and R. C. W. Strucker. 2015. Watervogels en zeezoogdieren in de Zoute Delta 2013/2014. RWS Waterdienst BM 94 pp.Arts, F. A., S. Lilipaly and R. C. W. Strucker. 2016. Watervogels en zeezoogdieren in de Zoute Delta 2014/2015. RWS Centrale Informatievoorziening BM 97 pp.Atkinson, S. 1997. Reproductive biology of seals. Reviews of Reproduction 2: 175-194.Austin, D., W. D. Bowen and J. I. Mcmillan. 2004. Intraspecific variation in movement patterns: modeling individual behaviour in a large marine predator. Oikos 105:15-30.Austin, D., W. D. Bowen, J. I. Mcmillan and D. J. Boness. 2006. Stomach temperature telemetry reveals temporal patterns of foraging success in a free-ranging marine mammal. Journal of Animal Ecology 75:408-420.Austin, D., J. I. Mcmillan and W. D. Bowen. 2003. A three-stage algorithm for filtering erroneous Argos satellite locations. Marine Mammal Science 19:371-383.Bailey, H., P. S. Hammond and P. M. Thompson. 2014. Modelling harbour seal habitat by combining data from multiple tracking systems. Journal of Experimental Marine Biology and Ecology 450:30-39.
134 135
Seals in motion References
Boness, D. J. and H. James. 1979. Reproductive behaviour of the Grey seal (Halichoerus grypus) on Sable Island, Nova Scotia. Journal of Zoology 188:477-500.Bonner, W. N. 1972. The Grey Seal and Common Seal in European waters Oceanography and Marine Biology: Annual Review 10:461-507.Boveng, P. L., L. M. Hiruki, M. K. Schwarz and J. L. Bengtson. 1998. Population growth of Antarctic fur seals: limitation by a top predator, the leopard seal? Ecology 79:2863-2877.Bowen, W. D. 2005. Blubber fatty acids of gray seals reveal sex differences in the diet of a size-dimorphic marine carnivore. Canadian Journal of Zoology 83:377-388.Bowen, W. D., S. L. Ellis, S. J. Iverson and D. J. Boness. 2003a. Maternal and newborn life-history traits during periods of contrasting population trends: implications for explaining the decline of harbour seals (Phoca vitulina), on Sable Island. Journal of Zoology 261:155-163.Bowen, W. D., J. Mcmillan and R. Mohn. 2003b. Sustained exponential population growth of grey seals at Sable Island, nova Scotia. ICES Journal of Marine Science 60:1265-1274.Bowen, W. D., J. I. Mcmillan and W. Blanchard. 2007. Reduced population growth of gray seals at Sable Island: Evidence from pup production and age of primiparity. Marine Mammal Science 23:48-64.Bowen, W. D., O. T. Oftedal and D. J. Boness. 1992. Mass and Energy-Transfer during Lactation in a Small Phocid, the Harbor Seal (Phoca vitulina). Physiological Zoology 65:844-866.Boyd, I. L. 1984. The relationship between body condition and the timing of implantation in pregnant Grey seals (Halichoerus grypus). Journal of Zoology 203:113-123.Boyd, I. L. 1991a. Changes in plasma progesterone and prolactin concentrations during the annual cycle and the role of prolactin in the maintenance of lactation and luteal development in the Antarctic fur seal (Arctocephalus gazella). Journal of Reproduction and Fertility 91:637-647.Boyd, I. L. 1991b. Environmental and physiological factors controlling the reproductive cycles of pinnipeds. Can. J. Zool. 69:1135–1148.Boyd, I. L. 1996. Individual variation in the duration of pregnancy and birth date in Antarctic fur seals: the role of environment, age, and sex of fetus. Journal of Mammalogy 77:124–133.Boyd, J. M. and R. N. Campbell. 1971. Grey seal (Halichoerus grypus) at North Rona, 1959 to 1968. Journal of Zoology 164:469-512.Brasseur, S., G. Aarts, E. Meesters, T. V. Polanen Petel, E. Dijkman, J. Cremer and P. Reijnders. 2012. Habitat preferences of harbour seals in the Dutch coastal area: analysis and estimate of effects of offshore wind farms. pp.Brasseur, S., J. Creuwels, B. Van Der Werf and P. Reijnders. 1996. Deprivation indicates necessity for haul-out in harbor seals. Marine Mammal Science 12:619-624.Brasseur, S., R. Czeck, A. Galatius, L. F. Jensen, J. Armin, P. Körber, R. Pund, U. Siebert, J. Teilmann and S. Klöpper. 2016. Trilateral Seal Expert Group (TSEG). Grey Seal surveys in the Wadden Sea and Helgoland in 2015-2016. First year of almost complete monitoring by aerial surveys. CWSS. pp.Brasseur, S., A. De Groot, G. Aarts, E. Dijkman and R. Kirkwood. 2015a. Pupping habitat of grey seals in the Dutch Wadden Sea. . IMARES Wageningen UR, 104 pp.
Brasseur, S. and M. Fedak. 2002. Habitat use of harbour seals in relation to recreation, fisheries, and large infra-structural works. Pages 27-31, Proceedings of the International Symposium at EcoMare, 29–30 November 2002; Texel, The Netherlands. CWSS: Management of North Sea Harbour and Grey Seal Populations.Brasseur, S., M. J. M. , P. Reijnders, J.H., J. Cremer, E. Meesters, R. Kirkwood, L. F. Jensen, A. Jeβ, A. Galatius, J. Teilmann and Aarts Geert. submitted 2017. Echoes from the past: regional variations in recovery within a harbour seal population. PlosOne.Brasseur, S., P. Reijnders, E. Meesters, G. Aarts and J. Cremer. 2011a. Harbour seals, Phoca vitulina, in relation to the wind farm site OWEZ, in the Netherlands. IMARES for Noordzeewind. OWEZ R 252 T1 20120130 C043-10, 58 pp.Brasseur, S. M., I. Tulp, P. Reijnders, C. Smit, E. Dijkman, J. Cremer, M. Kotterman and H. Meesters. 2004. Voedselecologie van de gewone en grijze zeehond in de Nederlandse kustwateren; I onderzoek naar de voedselecologie van de gewone zeehond; II literatuurstudie naar het dieet van de grijze zeehond. Alterra. 116 pp.Brasseur, S. M. J. M., G. M. Aarts, E. Bravo Rebolledo, J. S. M. Cremer, F. E. Fey-Hofstede, S. C. V. Geelhoed, H. J. Lindeboom, K. Lucke, M. a. M. Machiels, H. W. G. Meesters, M. M. Scholl, L. R. Teal and R. H. Witte. 2011b. Zeezoogdieren in de Eems: studie naar de effecten van bouwactiviteiten van GSP, RWE en NUON in de Eemshaven in 2010. IMARES. 212 pp.Brasseur, S. M. J. M., G. M. Aarts, H. W. G. Meesters, T. V. Polanen-Petel, E. M. Dijkman, J. S. M. Cremer and P. J. H. Reijnders. 2010a. Habitat preferences of harbour seals in the Dutch coastal area: analysis and estimate of effects of offshore wind farms. IMARES, Texel, 55 pp.Brasseur, S. M. J. M., B. Diederichs, R. Czeck, L. F. Jensen, A. Galatius, S. Ramdohr, U. Siebert and J. Teilman. 2013. Trilateral Seal Expert Group (TSEG). Aerial surveys of grey seals in the Wadden Sea in 2012-2013: Mixed messages. Common Wadden Sea Secretariat (CWSS). http://www.waddensea-secretariat. org/sites/default/files/downloads/TMAP_downloads/Seals/aerial_surveys_of_ grey_seals_in_the_wadden_sea_in_the_season_of_2012-13.pdf.Brasseur, S. M. J. M. and R. J. Kirkwood. 2015. Seal monitoring and evaluation for the Gemini offshore windpark: Pre-construction, T0 - 2014 report. IMARES, Den Burg, 52 pp.Brasseur, S. M. J. M. and R. J. Kirkwood. 2016. Seal monitoring and evaluation for the Gemini offshore windpark: T-construction - 2015 report. IMARES, Den Burg, 52 pp.Brasseur, S. M. J. M., T. V. Polanen Petel, G. M. Aarts, H. W. G. Meesters, E. M. Dijkman and P. J. H. Reijnders. 2010b. Grey seals (Halichoerus grypus) in the Dutch North sea: population ecology and effects of wind farms. IMARES. 72 pp.Brasseur, S. M. J. M. and P. J. H. Reijnders. 2001a. Satellite tracking breeding harbour seal (Phoca vitulina) females in Dutch waters, diving, haulout and movement. In: 14th biennial conference on the biology of marine mammals; abstracts; November 28 - December 3, 2001, Vancouver B.C. Canada, p. 32.Brasseur, S. M. J. M. and P. J. H. Reijnders. 2001b. Zeehonden in de Oosterschelde, fase 2; effecten van extra doorvaart door de Oliegeul. Alterra. 56 pp.Brasseur, S. M. J. M., P. J. H. Reijnders, T. Borchardt, U. Siebert, M. Stede, S. Ramdohr, L. F. Jensen, J. Teilman and J. Tougaard. 2008. Aerial surveys of
136 137
Seals in motion References
harbour seals in the Wadden Sea in 2008: Back to pre-epizootic level, and still Growing: Wadden Sea harbour seal population in 2008. Annual reports http://www.waddensea-secretariat.org/news/news/Seals/Annual-reports/ seals2008.html.Brasseur, S. M. J. M., P. J. H. Reijnders, T. Borchardt, U. Siebert, M. Stede, S. Ramdohr, L. F. Jensen, J. Teilman and J. Tougaard. 2011c. Trilateral Seal Expert Group (TSEG). Aerial surveys of grey seals in the Wadden Sea in 2010-2011: Continued growth, through birth and immigration. Common Wadden Sea Secretariat (CWSS) http://www.waddensea-secretariat.org/news/news/Seals/ Annual-reports/Grey Seals/greyseals2011.html.Brasseur, S. M. J. M., T. D. Van Polanen Petel, T. Gerrodette, E. H. W. G. Meesters, P. J. H. Reijnders and G. Aarts. 2015b. Rapid recovery of Dutch gray seal colonies fueled by immigration. Marine Mammal Science 31:405-426.Bree Van, P., L. Vedder and T. L. Hart. 1992. De grijze zeehond in Nederland - terug van weggeweest .(The return of the grey seal in the Netherlands). Zoogdier 3(4): 3:11-15.Breed, G. A., W. D. Bowen, J. I. Mcmillan and M. L. Leonard. 2006. Sexual segregation of seasonal foraging habitats in a non-migratory marine mammal. Proceedings of the Royal Society B-Biological Sciences 273:2319-2326.Breed, G. A., W. Don Bowen and M. L. Leonard. 2013. Behavioral signature of intraspecific competition and density dependence in colony-breeding marine predators. Ecology and Evolution 3:3838-3854.Brouwer, A., P. J. H. Reijnders and J. H. Koeman. 1989. Polychlorinated Biphenyl (PCB)-contaminated fish induces vitamin-a and thyroid-hormone deficiency in the common seal (Phoca vitulina). Aquatic Toxicology 15:99-105.Brown, R. F., B. E. Wright, S. D. Riemer and J. Laake. 2005. Trends in abundance and current status of harbor seals in oregon: 1977-2003. Marine Mammal Science 21:657-670.Burchard, I. 1998. Anthropogenic impact on the climate since man began to hunt. Palaeogeography, Palaeoclimatology, Palaeoecology 139:1-14.Burkey, T. V. 1989. Extinction in nature reserves: The effect of fragmentation and the importance of migration between reserve fragments. Oikos 55:75-81.Burnham, K. P. and D. R. Anderson. 2002. Model selection and multimodel inference: a practical information-theoretic approach. Springer-Verlag, New York.Burns, J. J., B. Würsig and J. G. M. Thewissen. 2009. Harbor Seal and Spotted Seal: Phoca vitulina and P. largha A2 - Perrin, William F. Pages 533-542 Encyclopedia of Marine Mammals (Second Edition). Academic Press, London.Camphuysen, C. J. 2004. The return of the harbour porpoise (Phocoena phocoena) in Dutch coastal waters. Lutra 47:113-122.Camphuysen, C. J. 2009. The use of seawatching data to monitor population fluctuations in divers (Gaviidae) in nearshore waters (in Dutch with English summary). Sula 22.Canty, A. and B. Ripley. 2010. boot: Bootstrap R (S-Plus) Functions. R package version 1.2-42.Caswell, H. 2001. Matrix population models: construction, analysis, and interpretation. Sinauer Associates.Caudron, A. K. 1997. The structure and behavior of the grey seal Halichoerus grypus breeding group of the Dutch Wadden Sea. Ambio 26:404-404.Caughley, G. and A. R. E. Sinclair. 1994. Wildlife Ecology and Management.
Blackwell Science, Cambridge UK.Clapham, P. J., A. Aguilar and L. T. Hatch. 2008. Determining spatial and temporal scales for management: lessons from whaling. Marine Mammal Science 24:183-201.Claphamp, J. 1996. The social and reproductive biology of humpback whales: An ecological perspective. Mammal Review 26:27-49.Clason, A. T. 1988. De grijze Zeehond Halichoerus grypus (Fabricius 1971) (The grey seal Halichoerus grypus (Fabricius 1971)). Pages 234-240 in Bierma M., Clason A. T., Kramer E. and D. L. G. J. eds. Terpen en wierden in het Fries- Groningse kustgebied (Dwelling mounts in the Friesian-Groningen coastal area.). Wolters-Noordhoff/Forsten, Groningen.Contasti, A. L., F. M. Van Beest, E. Vander Wal and P. D. Mcloughlin. 2013. Identifying hidden sinks in growing populations from individual fates and movements: The feral horses of Sable Island. The Journal of Wildlife Management 77:1545-1552.Cordes, L. and P. Thompson. 2015. Mark-resight estimates of seasonal variation in harbor seal abundance and site fidelity. Population Ecology:1-6.Cordes, L. S., C. D. Duck, B. L. Mackey, A. J. Hall and P. M. Thompson. 2011. Long-term patterns in harbour seal site-use and the consequences for managing protected areas. Animal Conservation 14:430-438.Cordes, L. S. and P. M. Thompson. 2013. Variation in breeding phenology provides insights into drivers of long-term population change in harbour seals. Proceedings of the Royal Society B: Biological Sciences 280:20130847.Cottrell, P. E., S. Jeffries, B. Beck and P. S. Ross. 2002. Growth and development in free-ranging harbor seal (Phoca vitulina) pups from southern British Columbia, Canada. Marine Mammal Science 18:721-733.Coulson, J. C. 1964. The Breeding Biology of the Grey Seal, Halichoerus grypus (Fab), on the Farne Islands, Northumberland. Journal of Animal Ecology 33:485-512.Cronin, M., H. Gerritsen, D. Reid and M. Jessopp. 2016. Spatial Overlap of Grey Seals and Fisheries in Irish Waters, Some New Insights Using Telemetry Technology and VMS. PLoS ONE 11:e0160564.Cronin, M., S. Gregory and E. Rogan. 2014. Moulting phenology of the harbour seal in south-west Ireland. Journal of the Marine Biological Association of the United Kingdom 94:1079-1086.Cunningham, L., J. M. Baxter and I. L. Boyd. 2010. Variation in harbour seal counts obtained using aerial surveys. Journal Marine Biological association 90: 1659-1666.Cunningham, L., J. M. Baxter, I. L. Boyd, C. D. Duck, M. Lonergan, S. E. Moss and B. Mcconnell. 2009. Harbour seal movements and haul-out patterns: implications for monitoring and management. Aquatic Conservation: Marine and Freshwater Ecosystems 19:398-407.Czeck, R. and M. Paul. 2008. Grey seals — a homecoming species in the Wadden Sea. Marine Biodiversity 38:143-146.Daan, N., H. Gislason, J. G. Pope and J. C. Rice. 2005. Changes in the North Sea fish community: evidence of indirect effects of fishing? ICES Journal of Marine Science: 62, 177-188.Daszak, P., A. A. Cunningham and A. D. Hyatt. 2000. Emerging Infectious Diseases of Wildlife - Threats to Biodiversity and Human Health. Science 287:443-449.Davison, A. C. and D. V. Hinkley. 1997. Bootstrap Methods and Their Applications.

138 139
Seals in motion References
Cambridge University Press Cambridge.Del Norte-Campos, A. G. C. and A. Temming. 1994. Daily activity, feeding and rations in gobies and brown shrimp in the northern Wadden Sea. Marine Ecology Progress Series 115:41-53.Dietz, R., J. Teilmann, S. M. Andersen, F. Rigét and M. T. Olsen. 2012. Movements and site fidelity of harbour seals (Phoca vitulina) in Kattegat, Denmark, with implications for the epidemiology of the phocine distemper virus. ICES Journal of Marine Science 70:186-195.Dingle, H. and V. A. Drake. 2007. What Is Migration? BioScience 57:113-121.Drago, M., L. Cardona, N. García, S. Ameghino and A. Aguilar. 2011. Influence of colony size on pup fitness and survival in South American sea lions. Marine Mammal Science 27:167-181.Drescher, H. E., U. Harms and E. Huschenbeth. 1977. Organochlorines and heavy metals in the harbour seal Phoca vitulina from the German North Sea Coast. Marine Biology 41:99-106.Duck, C. and D. Thompson. 2007. The status of grey seals in Britain Pages 69-78 in M. H. D. O. E. T Haug ed. Grey seals in the North Atlantic and the Baltic NAMMCO scientific publications, North Atlantic Marine Mammal Commission.Dupuis, L. 2011. Bilan 2010 Etude et protection des phoques http://www.picardie- nature.org/IMG/pdf/Bilan_2010_Etude_et_protection_des_phoques.pdf. Picar die Nature.Fahrig, L., J. H. Pedlar, S. E. Pope, P. D. Taylor and J. F. Wegner. 1995. Effect of road traffic on amphibian density. Biological Conservation 73:177-182.Fedak, M. A., S. S. Anderson and M. G. Curry. 1983. Attachment of a Radio Tag to the Fur of Seals. Journal of Zoology 200:298-300.Ferrari, M. A., C. Campagna, R. Condit and M. N. Lewis. 2013. The founding of a southern elephant seal colony. Marine Mammal Science 29:407-423.Fransz, H. and P. Reijnders. 1978. Estimation of birth rate and juvenile mortality from observed numbers of juveniles in a seal population with normally dispersed reproduction. I.C.E.S. C.M. 1978/N:7. International Council for the Exploration of the Sea.Gaggiotti, O. E., F. Jones, W. M. Lee, W. Amos, J. Harwood and R. A. Nichols. 2002. Patterns of colonization in a metapopulation of grey seals. Nature 416:424-427.Galatius, A., S. M. J. M. Brasseur, R. Czeck, L. F. Jensen, J. Armin, P. Körber, P. Ralf, U. Siebert, J. Teilman and S. Klöpper. 2015. Trilateral Seal Expert Group (TSEG). Aerial surveys of Harbour Seals in the Wadden Sea in 2015. Moderate impact of the 2014 influenza epidemic. Common Wadden Sea Secretariate (CWSS).Gerondeau, M., C. Barbraud, V. Ridoux and C. Vincent. 2007. Abundance estimate and seasonal patterns of grey seal (Halichoerus grypus) occurrence in Brittany, France, as assessed by photo-identification and capture-mark-recapture. Journal of the Marine Biological Association of the United Kingdom 87:365-372.Goodman, S. J. 1998. Patterns of extensive genetic differentiation and variation among European harbor seals (Phoca vitulina vitulina) revealed using microsatellite DNA polymorphisms. Molecular Biology and Evolution 15:104-118.Greenstreet, S. P. R. and S. I. Rogers. 2006. Indicators of the health of the North Sea fish community: identifying reference levels for an ecosystem approach to management. ICES J. Journal of Marine Science 63.Griffen, A. E. V. 1913. Die Fauna der Wurten (The fauna of the ‘Wurten’). E.J.Brill,
Leiden.Gundersen, G., E. Johannesen, H. P. Andreassen and R. A. Ims. 2001. Source–sink dynamics: how sinks affect demography of sources. Ecology Letters 4:14-21.Haaften, J. L. V. 1974. Zeehonden langs de Nederlands kust (Seals along the Dutch coast). Wetenschappelijke Mededelingen Koningklijke Nederlandse Natuur- historische Vereniging, Hoogwoud 101:1-36.Hahn, S., S. Bauer and F. Liechti. 2009. The natural link between Europe and Africa – 2.1 billion birds on migration. Oikos 118:624-626.Hall, A., D. Thompson, B. Würsig and J. G. M. Thewissen. 2009. Gray Seal: Halichoerus grypus A2 - Perrin, William F. Pages 500-503 Encyclopedia of Marine Mammals (Second Edition). Academic Press, London.Hall, A. J. 1998. Blood Chemistry and Hematology of Gray Seal (Halichoerus grypus) Pups from Birth to Postweaning Journal of Zoo and Wildlife Medicine 29:401-407.Hall, A. J., B. J. Mcconnell and R. J. Barker. 2001. Factors affecting first-year survival in grey seals and their implications for life history strategy. Journal of Animal Ecology 70:138-149.Hall, A. J., B. J. Mcconnell and R. J. Barker. 2008. Factors affecting first-year survival in grey seals and their implications for life history strategy. Journal of Animal Ecology 70:138-149.Halpern, B. S., S. Walbridge, K. A. Selkoe, C. V. Kappel, F. Micheli, C. D’agrosa, J. F. Bruno, K. S. Casey, C. Ebert, H. E. Fox, R. Fujita, D. Heinemann, H. S. Lenihan, E. M. P. Madin, M. T. Perry, E. R. Selig, M. Spalding, R. Steneck and R. Watson. 2008. A global map of human impact on marine ecosystems. Science 319:948-952.Hammond, P. S., K. Macleod, P. Berggren, D. L. Borchers, L. Burt, A. Cañadas, G. Desportes, G. P. Donovan, A. Gilles, D. Gillespie, J. Gordon, L. Hiby, I. Kuklik, R. Leaper, K. Lehnert, M. Leopold, P. Lovell, N. Øien, C. G. M. Paxton, V. Ridoux, E. Rogan, F. Samarra, M. Scheidat, M. Sequeira, U. Siebert, H. Skov, R. Swift, M. L. Tasker, J. Teilmann, O. Van Canneyt and J. A. Vázquez. 2013. Cetacean abundance and distribution in European Atlantic shelf waters to inform conservation and management. Biological Conservation 164:107-122.Harding, K. C., M. Fujiwara, Y. Axberg and T. Härkönen. 2005. Mass-Dependent Energetics and Survival in Harbour Seal Pups. Functional Ecology 19:129-135.Harding, K. C., T. Härkönen and H. Caswell. 2002. The 2002 European seal plague: epidemiology and population consequences. Ecology Letters 5:727-732.Harding, K. C. and T. J. Härkönen. 1999. Development in the Baltic grey seal (Halichoerus grypus) and ringed seal (Phoca hispida) populations during the 20th century. Ambio 28:619-627.Härkönen, L., R. Dietz, P. J. H. Reijnders, J. Teilmann, K. Harding, A. Hall, S. M. J. M. Brasseur, U. Siebert, S. J. Goodman, P. D. Jepson, T. D. Rasmussen and P. Thompson. 2006a. A review of the 1988 and 2002 phocine distemper virus epidemics in European harbour seals. Diseases of Aquatic Organisms 68:115-130.Härkönen, T., S. Brasseur, J. Teilmann, C. Vincent, D. Dietz, K. Abt and P. Reijnders. 2007a. Status of grey seals along mainland Europe from the southwestern Baltic to France. Pages 57-68 NAMMCO Sci. Publ.Härkönen, T., S. M. J. M. Brasseur, J. Teilmann, C. Vincent, R. Dietz, K. Abt and P. J. H. Reijnders. 2007b. Status of grey seals along mainland Europe from the Southwestern Baltic to France. Pages 57-68 Grey Seals in the North Atlantic and
140 141
Seals in motion References
the Baltic. NAMMCO Scientific Publication Series : Volume 6. NAMMCO, Polar Environmental Centre, Tromso, Norway.Härkönen, T., K. C. Harding and M. P. Heide-Jørgensen. 2002. Rates of increase in age-structured populations: a lesson from the European harbour seals. Canadian Journal of Zoology-Revue Canadienne De Zoologie Härkönen, T., R. Dietz, P. Reijnders, J. Teilmann, K. Harding, A. Hall, S. Brasseur, U. Siebert, S. J. Goodman, P. D. Jepson, T. D. Rasmussen and P. Thompson. 2006b. The 1988 and 2002 phocine distemper virus epidemics in European harbour seals. Diseases of Aquatic Organisms 68:115-130.Härkönen, T., K. Harding, T. D. Rasmussen, J. Teilmann and R. Dietz. 2007c. Age- and sex-specific mortality patterns in an emerging wildlife epidemic: the phocine distemper in European harbour seals. PLoS ONE 2:e887.Härkönen, T. and K. C. Harding. 2001. Spatial structure of harbour seal populations and the implications thereof. Canadian Journal of Zoology-Revue Canadienne De Zoologie 79:2115-2127.Härkönen, T. and K. C. Harding. 2010. Predicting recurrent PDV epizootics in European harbour seals (Phoca vitulina). NAMMCO Scientific Publications 8:275-284.Härkönen, T., K. C. Harding, S. J. Goodman and K. Johannesson. 2005. Colonization history of the baltic harbor seals: Integrating archaeological, behavioral, and genetic data. Marine Mammal Science 21:695-716.Härkönen, T., K. C. Harding and S. G. Lunneryd. 1999. Age- and sex-specific behaviour in harbour seals Phoca vitulina leads to biased estimates of vital population parameters. Journal of Applied Ecology 36:825-841.Härkönen, T. and M. P. Heide-Jørgensen. 1990. Comparative Life Histories of East Atlantic and Other Harbor Seal Populations. Ophelia 32:211-235.Harrison, P. J., S. T. Buckland, L. E. N. Thomas, R. O. B. Harris, P. P. Pomeroy and J. Harwood. 2006. Incorporating movement into models of grey seal population dynamics. Journal of Animal Ecology 75:634-645.Hart, T. P. 2007. Zeehondenjacht in Nederland 1591-1962 (Seal hunting in the Netherlands, 1591-1962). . PhD, Free University Amsterdam, Amsterdam 351 pp.Harwood, J. and J. H. Prime. 1978. Some Factors Affecting the Size of British Grey Seal Populations. Journal of Applied Ecology 15:401-411.Hastie, T. and R. Tibshirani. 1986. Generalized additive models (with discussion). . Statist. Sci.:297-318.Hayes, S., A. , P. C. Daniel, T. H. James and B. J. Boeuf. 2004. Aquatic mating strategies of the male pacific harbor seal (Phoca vitulina richardii): Are males defending the hotspot? Marine Mammal Science 20:639-656.Hayes, S. A., D. E. Pearse, D. P. Costa, J. T. Harvey, B. J. Le Boeuf and J. C. Garza. 2006. Mating system and reproductive success in eastern Pacific harbour seals. Molecular Ecology 15:3023-3034.Hayward, J. L., S. M. Henson, C. J. Logan, C. R. Parris, M. W. Meyer and B. Dennis. 2005. Predicting numbers of hauled-out harbour seals: a mathematical model. Journal of Applied Ecology 42:108-117.Hewer, H. R. 1974. British Seals. . The New Naturalist. Collins, London.Hind, A. T. and W. S. C. Gurney. 1998. Are there thermoregulatory constraints on the timing of pupping for harbour seals? Canadian Journal of Zoology 76: 2245-2254.Hindell, M. A. and C. R. Mcmahon. 2000. Long distance movement of a southern
elephant seal (Mirounga leonina) from Macquarie Island to Peter 1 Øy. Marine Mammal Science 16:504-507.Hindell, M. A., C. R. Mcmahon, M. N. Bester, L. Boehme, D. Costa, M. A. Fedak, C. Guinet, L. Herraiz-Borreguero, R. G. Harcourt, L. Huckstadt, K. M. Kovacs, C. Lydersen, T. Mcintyre, M. Muelbert, T. Patterson, F. Roquet, G. Williams and J.-B. Charrassin. 2016. Circumpolar habitat use in the southern elephant seal: implications for foraging success and population trajectories. Ecosphere 7:e01213-n/a.Hoffmann, M., J. L. Belant, J. S. Chanson, N. A. Cox, J. Lamoreux, A. S. L. Rodrigues, J. Schipper and S. N. Stuart. 2011. The changing fates of the world’s mammals. Philosophical Transactions of the Royal Society B: Biological Sciences 366:2598-2610.Hoffmeyer, H. 1962. Seehunde und Seehundsjagd an der deutschen Nordseeküste. Zeitschrift für Jagdwissenschaft 8:1-13.Hook, O. and A. G. Johnels. 1972. Breeding and Distribution of Grey Seal (Halichoerus grypus Fab) in Baltic Sea, with Observations on Other Seals of Area. Proceedings of the Royal Society of London Series B-Biological Sciences 182:37-&.Jemison, L. A. and B. P. Kelly. 2001. Pupping phenology and demography of harbour seals (Phoca vitulina richardsi) on Tugidak Island, Alaska. Marine Mammal Science 17:585-600.Jennings, S., S. P. R. Greenstreet, L. Hill, G. J. Piet, J. K. Pinnegar and K. J. Warr. 2002. Long-term trends in the trophic structure of the North Sea fish community: evidence from stable-isotope analysis, size-spectra and community metrics. Marine Biology 141:1085-1097.Joensen, A. H., N. O. Søndergaard and E. B. Hansen. 1976. Occurrence of seals and seal hunting in Denmark. . Dan. Rev. Game Biol. 10:1-20.Jones E.L., Mcconnell B.J., Smout S., Hammond P.S., Duck C.D., Morris C.D., Thompson D., Russell D.J.F., Vincent C., Cronin M., Sharples R.J. and Mattiopoulos J. 2015. Patterns of space use in sympatric marine colonial predators reveal scales of spatial partitioning. Marine Ecology Progress Series 534:235-249.Karlsson, O., L. Hiby, T. Lundberg, M. Jüssi, I. Jüssi and B. Helander. 2005. Photo- identification, site fidelity, and movement of female gray seals (Halichoerus grypus) between haul-outs in the Baltic Sea. AMBIO 34:628-634.Kim, Y. J. and C. Gu. 2004. Smoothing spline gaussian regression: more scalable computation via efficient approximation. Journal of the Royal Statistical Society Series B. 66:337-356.Kirkwood, R. J., G. M. Aarts and S. M. J. M. Brasseur. 2015. Seal monitoring and evaluation for the Luchterduinen offshore wind farm: 2. T-construction - 2014 report. IMARES, Den Helder, 65 pp.Kirkwood, R. J., O. G. Bos and S. M. J. M. Brasseur. 2014. Seal monitoring and evaluation for the Luchterduinen offshore wind farm 1. T0 - 2013 report. IMARES, Den Helder, 47 pp.Klimova, A., C. D. Phillips, K. Fietz, M. T. Olsen, J. Harwood, W. Amos and J. I. Hoffman. 2014. Global population structure and demographic history of the grey seal. Molecular Ecology 23:3999-4017.Kokko, H., E. Helle, J. Lindstrom, E. Ranta, T. Sipila and F. Courchamp. 1999. Backcasting population sizes of ringed and grey seals in the Baltic and Lake Saimaa during the 20th century. Annales Zoologici Fennici 36:65-73.

142 143
Seals in motion References
Kovacs, K. M. and D. M. Lavigne. 1986. Maternal Investment and Neonatal Growth in Phocid Seals. Journal of Animal Ecology 55:1035-1051.Krieber, M. and Barrette C. 1984. Aggregation behaviour of harbour seals at Forillon National Park. . Canadian Journal of Animal Ecology 53:913-928.Laane, R. W. P. M., A. D. Vethaak, J. Gandrass, K. Vorkamp, A. Köhler, M. M. Larsen and J. Strand. 2013. Chemical contaminants in the Wadden Sea: Sources, transport, fate and effects. Journal of Sea Research 82:10-53.Lambert, R. A. 2002. The Grey Seal in Britain: A Twentieth Century History of a Nature Conservation Success. Environment and History 8:449-474.Le Boeuf, B. J., D. E. Crocker, D. P. Costa, S. B. Blackwell, P. M. Webb and D. S. Houser. 2000. Foraging ecology of northern elephant seals. Ecological Monographs 70:353-382.Lesage, W., M. O. Harnmill and K. M. Kovacs. 2004. Long-distance movements of harbour seals (Phoca vitulina) from a seasonally ice-covered area, the St. Lawrence River estuary, Canada. Canadian Journal of Zoology 82:1070-1081.Lidgard, D. C., D. J. Boness, W. D. Bowen and J. I. Mcmillan. 2003. Diving behaviour during the breeding season in the terrestrially breeding male grey seal: implications for alternative mating tactics. Canadian Journal of Zoology 81: 1025-1033.Lonergan, M., C. D. Duck, D. Thompson, B. L. Mackey, L. Cunningham and I. L. Boyd. 2007. Using sparse survey data to investigate the declining abundance of British harbour seals. Journal of Zoology 271:261-269.Lonergan, M., C. D. Duck, D. Thompson, S. Moss and B. Mcconnell. 2011. British grey seal (Halichoerus grypus) abundance in 2008: an assessment based on aerial counts and satellite telemetry. ICES Journal of Marine Science 68:2201-2209.Matthiopoulos, J. 2003. Model-supervised kernel smoothing for the estimation of spatial usage. Oikos 102:367-377.Matthiopoulos, J., L. Cordes, B. Mackey, D. Thompson, C. Duck, S. Smout, M. Caillat and P. Thompson. 2014. State-space modelling reveals proximate causes of harbour seal population declines. Oecologia 174:151-162.Matthiopoulos, J., B. Mcconnell, C. Duck and M. Fedak. 2004. Using satellite telemetry and aerial counts to estimate space use by grey seals around the British Isles. Journal of Applied Ecology 41:476-491.Mcconnell, B. J., M. A. Fedak, P. Lovell and P. S. Hammond. 1999. Movements and foraging areas of grey seals in the North Sea. Journal of Applied Ecology 36:573-590.Mccullagh, P. and J. A. Nelder. 1989. Generalized Linear Models. Chapman and Hall, London.Mclaren, I. A. 1993. Growth in Pinnipeds. Biological Reviews 68:1-79.Meesters, H. W. G., P. J. H. Reijnders, S. M. J. M. Brasseur, S. Tougaard, M. Stede, U. Siebert and T. Härkönen. 2007. An effective survey design for harbour seals in the Wadden Sea: tuning Trilateral Seal Agreement and EU-Habitat Directive requirement. Pages 82 The meeting of the Trilateral Working Group TWG 07/1, Delfzijl, The Netherlands, 18 - 19 April, The Netherlands. Trilateral Working Group, Wilhelmshaven.Mellish J.A.E., Iverson S.J., Bowen W.D. 1999. Variation in milk production and lactation performance in grey seals and consequences for pup growth and weaning characteristics. Physiological and Biochemical Zoology 72:677-690.Muelbert, M. M. C. and W. D. Bowen. 1993. Duration of lactation and postweaning changes in mass and body composition of harbour seal, Phoca vitulina, pups.
Canadian Journal of Zoology 71:1405-1414.Muelbert, M. M. C., W. D. Bowen and S. J. Iverson. 2003. Weaning mass affects changes in body composition and food intake in harbour seal pups during the first month of independence. Physiological and Biochemical Zoology 76:418-427.Nerini, M. K. 1984. A review of gray whale feeding ecology. Pages 423-450 in M. L. Jones, S. S. L. and S. Leatherwood eds. The gray whale. Academic Press, Orlando, FL.Newcombe, R. G. 1988. Two-Sided Confidence Intervals for the Single Proportion: Comparison of Seven Methods. . Statistics in Medicine 17:857-872.Noren, S. R., D. J. Boness, S. J. Iverson, J. I. Mcmillan and W. D. Bowen. 2008. Body Condition at Weaning Affects the Duration of the Postweaning Fast in Gray Seal Pups (Halichoerus grypus). Physiological and Biochemical Zoology 81:269-277.Oksanen, S. M., M. P. Ahola, E. Lehtonen and M. Kunnasranta. 2014. Using movement data of Baltic grey seals to examine foraging-site fidelity: implications for seal-fishery conflict mitigation. Marine Ecology Progress Series 507:297-308.Olsen, M. T., L. W. Andersen, R. Dietz, J. Teilmann, T. Härkönen and H. R. Siegismund. 2014. Integrating genetic data and population viability analyses for the identification of harbour seal (Phoca vitulina) populations and management units. Molecular Ecology 23:815-831.Olsen, M. T., S. M. Andersen, J. Teilmann, R. Dietz, S. M. C. Edrén, A. Linnet and T. Härkönen. 2010. Status of the harbour seal (Phoca vitulina) in Southern Scandinavia. in A. B. Geneviève Desportes, Aqqalu Rosing-Asvid and Gordon T Waring ed. Harbour seals in the North Atlantic and the Baltic NAMMCO Scientific Publications.Olsen, M. T., A. Galatius, V. Biard, K. Gregersen and C. C. Kinze. 2016. The forgotten type specimen of the grey seal [Halichoerus grypus (Fabricius, 1791)] from the island of Amager, Denmark. Zoological Journal of the Linnean Society 178:713-720.Olsen, M. T., V. Islas, J. A. Graves, A. Onoufriou, C. Vincent, S. Brasseur, A. K. Frie and A. J. Hall. 2017. Genetic population structure of harbour seals in the United Kingdom and neighbouring waters. Aquatic Conservation: Marine and Freshwater Ecosystems:n/a-n/a.Olson, J. K., J. K. Gaydos, T. Mcklveen, R. Poppenga, K. Wicinas, E. Anderson and S. Raverty. 2016. Conjoined Fetal Twins in a Harbor Seal (Phoca vitulina). Journal of wildlife diseases 52:173-176.Orians, G. H. and N. E. Pearson. 1979. On the theory of central place foraging. Analysis of ecological systems. Ohio State University Press, Columbus:155-177.Parijs Van, S. M., P. M. Thompson, D. J. Tollit and A. Mackay. 1997. Distribution and activity of male harbour seals during the mating season. Animal Behaviour 54:35-43.Parmesan, C. and G. Yohe. 2003. A globally coherent fingerprint of climate change impacts across natural systems. Nature 421:37-42.Patterson, T. A., R. J. Sharples, B. Raymond, D. C. Welsford, V. Andrews-Goff, M. A. Lea, S. D. Goldsworthy, N. J. Gales and M. Hindell. 2016. Foraging distribution overlap and marine reserve usage amongst sub-Antarctic predators inferred from a multi-species satellite tagging experiment. Ecological Indicators 70:531-544.Pauly, D., V. Christensen, J. Dalsgaard, R. Froese and F. Torres, Jr. 1998. Fishing down marine food webs. Science 279:860-863.Peterson, S. H., M. M. Lance, S. J. Jeffries and A. Acevedo-Gutiérrez. 2012. Long
144 145
Seals in motion References
Distance Movements and Disjunct Spatial Use of Harbor Seals (Phoca vitulina) in the Inland Waters of the Pacific Northwest. PLoS ONE 7:e39046.Pihl, L. 1985. Food selection and consumption of mobile epibenthic fauna in shallow marine areas. . Marine Ecology Progress Series 22:169-179.Pinheiro, J. C. and D. M. Bates. 2000. Mixed-effects Models in S and S-PLUS. Springer-Verlag, New York.Pomeroy, P. 2011. Reproductive cycles of marine mammals. Animal Reproduction Science 124:184-193.Pomeroy, P. P., M. A. Fedak, P. Rothery and S. Anderson. 1999. Consequences of maternal size for reproductive expenditure and pupping success of grey seals at North Rona, Scotland. Journal of Animal Ecology 68:235-253.Pomeroy, P. P., P. R. Redman, S. J. S. Ruddell, C. D. Duck and S. D. Twiss. 2005. Breeding site choice fails to explain interannual associations of female grey seals. Behavioral Ecology and Sociobiology 57:546-556.Pomeroy, P. P., S. D. Twiss and C. D. Duck. 2000a. Expansion of a grey seal (Halichoerus grypus) breeding colony: changes in pupping site use at the Isle of May, Scotland. Journal of Zoology 250:1-12.Pomeroy, P. P., S. D. Twiss and P. Redman. 2000b. Philopatry, site fidelity and local kin associations within grey seal breeding colonies. Ethology 106:899-919.Pomeroy, P. P., J. W. Wilmar, W. Amos and S. D. Twiss. 2001. Reproductive performance links to fine-scale spatial patterns of female grey seal relatedness. Proceedings of the Royal Society of London Series B-Biological Sciences 268:711-717.Prewitt, J. S., D. V. Freistroffer, J. F. Schreer, M. O. Hammill and J. M. Burns. 2010. Postnatal development of muscle biochemistry in nursing harbor seal (Phoca vitulina) pups: limitations to diving behavior? Journal of Comparative Physiology B 180:757-766.R Development Core Team. 2009. R: A language and environment for statistical computing. R Foundation for Statistical Computing, Vienna, Austria. .Reed, J. Z., C. Chambers, M. A. Fedak and P. J. Butler. 1994. Gas-Exchange of Captive Freely Diving Grey Seals (Halichoerus grypus). Journal of Experimental Biology 191:1-18.Reijnders, P., K. Abt, S. Brasseur, S. Tougaard, U. Siebert and E. Vareschi. 2003a. Sense and sensibility in evaluating aerial counts of harbour seals in the Wadden Sea. Wadden Sea Newsletter 28:9-12.Reijnders, P., S. M. J. M. Brasseur, J. Van Der Toorn, P. Van Der Wolf, I. Boyd, J. Harwood, D. Lavigne and L. Lowry. 1993. Seals, Fur Seals, Sea Lions and Walrus, Status survey and conservation action plan. USA: Kelvyn Press.Reijnders, P. J., S. Brasseur, K. Abt, U. Siebert, M. Stede and S. Tougaard. 2003b. The harbour seal population in the Wadden Sea as revealed by the aerial surveys in 2003. Wadden Sea Newsletter 2:11-12.Reijnders, P. J., S. M. Brasseur, S. Tougaard, U. Seibert, T. Borchardt and M. Stede. 2010a. Population development and status of harbour seals (Phoca vitulina) in the Wadden Sea. Pages 95-105 NAMMCO Scientific Publications.Reijnders, P. J. and M. P. Simmonds. 2003. Global temporal trends of organo- chlorines and heavy metals in pinnipeds. Pages 491–506 in G. D. B. J.G. Vos, M. Fournier, T.J. O’shea ed. Toxicology of marine mammals. Taylor and Francis, London.Reijnders, P. J. H. 1976. The harbour seal (Phoca vitulina) population in the Dutch Wadden Sea: Size and composition. Netherlands Journal of Sea Research
10:223-235.Reijnders, P. J. H. 1978a. De grijze zeehond in de Waddenzeegebied (The Grey seal in the Wadden Sea area). . Waddenbulletin 13:500-502.Reijnders, P. J. H. 1978b. Recruitment in the harbour seal (Phoca vitulina) population in the Dutch Wadden Sea. Netherlands Journal of Sea Research 12:164-179.Reijnders, P. J. H. 1981. Management and conservation of the harbour seal, Phoca vitulina, Population in the International Wadden Sea Area. Biological Conservation 19:213-221.Reijnders, P. J. H. 1983. The effect of seal hunting in Germany on the further existence of a harbour seal population in the dutch Wadden Sea. Zeitschrift für Säugetierkunde 48:50-54.Reijnders, P. J. H. 1985. On the extinction of the Southern Dutch harbour seal population. Biological Conservation 31:75-84.Reijnders, P. J. H. 1986. Reproductive failure in common seals feeding on fish from polluted coastal waters. Nature 324:456-457.Reijnders, P. J. H. 1992. Retrospective population analysis and related future management perspectives for the harbour seal Phoca vitulina in the Wadden Sea. Netherlands Institute for Sea Research, Publication Series 20:193-197.Reijnders, P. J. H. and S. M. J. M. Brasseur. 2016. Gewone zeehond Phoca vitulina. . Pages 281-285 in S. .In: Broekhuizen, Spoelstra K, Thissen J.B.M, Canters K.J. (Eds), ed. Atlas van de Nederlandse zoogdieren (in Dutch with captions and summary in English). . Naturalis, Leiden, The Netherlands.Reijnders, P. J. H., S. M. J. M. Brasseur, T. Borchardt, C. Camphuysen, R. Czeck, A. Gilles, L. F. Jensen, M. Leopold, K. Lucke, S. Ramdohr, M. Scheidat, U. Siebert and J. Teilmann. 2009. Marine mammals. in H. Marencic; and J. de Vlas (eds.) Quality Status Report 2009, Thematic Report No. 20, Wadden Sea Ecosystems No. 25. (www.waddensea-secretariat.org/management/QSR-2009/index.htm).Reijnders, P. J. H., S. M. J. M. Brasseur and A. G. Brinkman. 2000. Habitatgebruik en aantalsontwikkelingen van gewone zeehonden in de Oosterschelde en het overige Deltagebied. Alterra, Research Instituut voor de Groene Ruimte, 078. 56 pp.Reijnders, P. J. H., S. M. J. M. Brasseur and E. H. W. G. Meesters. 2010b. Earlier pupping in harbour seals, Phoca vitulina. Biology letters 6:854–857.Reijnders, P. J. H., Ries E.H, Brasseur S.M.J.M 1996. On the status of harbour seals in the Wadden Sea in 1995. Wadden Sea News 1996 1:31-32.Reijnders, P. J. H., E. H. Ries, S. Tougaard, N. Nørgaard, G. Heidemann, J. Schwarz, E. Vareschi and I. M. Traut. 1997a. Population development of harbour seals Phoca vitulina in the Wadden Sea after the 1988 virus epizootic. Journal of Sea Research 38:161-168.Reijnders, P. J. H., J. Van Dijk and D. Kuiper. 1995. Recolonization of the dutch Wadden Sea by the grey seal Halichoerus grypus. Biological Conservation 71:231-235.Reijnders, P. J. H., G. Verriopoulos and S. M. J. M. Brasseur. 1997b. Status of pinnipeds relevant to the European Union. IBN Scientific Contributions 8, 195 pp.Reiter, J., K. J. Panken and B. J. Leboeuf. 1981. Female competition and reproductive success in northern elephant seals. . Animal Behaviour 29:670–687. .Renouf, D. and J. W. Lawson. 1986. Harbor Seal Vigilance - Watching for Predators or Mates. Biology of Behaviour 11:44-49.
146 147
Seals in motion References
Renouf, D. and E. Noseworthy. 1990. Feeding cycles in captive harbour seals (Phoca vitulina): Weight gain in spite of reduced food intake and increased thermal demands,. Marine Behaviour and Physiology 17:203-212.Requate, H. 1956. Die Jagdtiere in den Nahrungsresten einiger frühgeschicht- licher Siedlungen in Schleswig-Holstein. (Hunted animals in foodremains of some prehistoric settlements in Schleswig-Holstein). . Schriftenreihe des Natur wissenschaftlicher Verein. Schleswig-Holstein. 28:21-41.Requate, H. 1957. Zur nacheiszeitlichen Geschichte der Säugetiere Schleswig- Holsteins. . Bonn. zool. Beitr. 8:207-229.Ries, E. H., L. R. Hiby and P. J. H. Reijnders. 1998. Maximum likelihood population size estimation of harbour seals in the Dutch Wadden Sea based on a mark- recapture experiment. Journal of Applied Ecology 35:332-339.Ries, E. H. and P. J. H. Reijnders. 1999. Characteristics of a core breeding area for the Wadden Sea harbour seal population: the Eems-Dollard estuary. . Instituut Bos- en Natuuronderzoek, Wageningen. 13 pp.Ries, E. H., I. M. Traut, A. G. Brinkman and P. J. H. Reijnders. 1999. Net dispersal of harbour seals within the Wadden Sea before and after the 1988 epizootic. Journal of Sea Research 41:233-244.Root, T. L., J. T. Price, K. R. Hall, S. H. Schneider, C. Rosenzweig and J. A. Pounds. 2003. Fingerprints of global warming on wild animals and plants. Nature 421:57-60.Russell, D. J. F., S. M. J. M. Brasseur, D. Thompson, G. D. Hastie, V. M. Janik, G. Aarts, B. T. Mcclintock, J. Matthiopoulos, S. E. W. Moss and B. Mcconnell. 2014. Marine mammals trace anthropogenic structures at sea. Current Biology 24:R638-R639.Russell, D. J. F., B. T. Mcclintock, J. Matthiopoulos, P. M. Thompson, D. Thompson, P. S. Hammond, E. L. Jones, M. L. Mackenzie, S. Moss and B. J. Mcconnell. 2015. Intrinsic and extrinsic drivers of activity budgets in sympatric grey and harbour seals. Oikos:n/a-n/a.Russell, D. J. F., B. Mcconnell, D. Thompson, C. Duck, C. Morris, J. Harwood and J. Matthiopoulos. 2013. Uncovering the links between foraging and breeding regions in a highly mobile mammal. Journal of Applied Ecology 50:499-509.Sarkar, D. 2009. lattice: Lattice Graphics. R package version 0.17-26.Sauvé, C. C., J. Van De Walle, M. O. Hammill, J. P. Y. Arnould and G. Beauplet. 2014. Stomach Temperature Records Reveal Nursing Behaviour and Transition to Solid Food Consumption in an Unweaned Mammal, the Harbour Seal Pup (Phoca vitulina). PLoS ONE 9:e90329.Schaeff, C. M., D. J. Boness and W. D. Bowen. 1999. Female distribution, genetic relatedness, and fostering behaviour in harbour seals, Phoca vitulina. Animal Behaviour 57:427-434.Scheffer, V. B. and J. W. Slipp. 1944. The harbor seal in Washington State. The American Midland Naturalist 32:373-416.Schipper, J., J. S. Chanson, F. Chiozza, N. A. Cox, M. Hoffmann, V. Katariya, J. Lamoreux, A. S. L. Rodrigues, S. N. Stuart, H. J. Temple, J. Baillie, L. Boitani, T. E. Lacher, R. A. Mittermeier, A. T. Smith, D. Absolon, J. M. Aguiar, G. Amori, N. Bakkour, R. Baldi, R. J. Berridge, J. Bielby, P. A. Black, J. J. Blanc, T. M. Brooks, J. A. Burton, T. M. Butynski, G. Catullo, R. Chapman, Z. Cokeliss, B. Collen, J. Conroy, J. G. Cooke, G. a. B. Da Fonseca, A. E. Derocher, H. T. Dublin, J. W. Duckworth, L. Emmons, R. H. Emslie, M. Festa-Bianchet, M. Foster, S. Foster, D. L. Garshelis, C. Gates, M. Gimenez-Dixon, S. Gonzalez,
J. F. Gonzalez-Maya, T. C. Good, G. Hammerson, P. S. Hammond, D. Happold, M. Happold, J. Hare, R. B. Harris, C. E. Hawkins, M. Haywood, L. R. Heaney, S. Hedges, K. M. Helgen, C. Hilton-Taylor, S. A. Hussain, N. Ishii, T. A. Jefferson, R. K. B. Jenkins, C. H. Johnston, M. Keith, J. Kingdon, D. H. Knox, K. M. Kovacs, P. Langhammer, K. Leus, R. Lewison, G. Lichtenstein, L. F. Lowry, Z. Macavoy, G. M. Mace, D. P. Mallon, M. Masi, M. W. Mcknight, R. A. Medellín, P. Medici, G. Mills, P. D. Moehlman, S. Molur, A. Mora, K. Nowell, J. F. Oates, W. Olech, W. R. L. Oliver, M. Oprea, B. D. Patterson, W. F. Perrin, B. A. Polidoro, C. Pollock, A. Powel, Y. Protas, P. Racey, J. Ragle, P. Ramani, G. Rathbun, et al. 2008. The Status of the World’s Land and Marine Mammals: Diversity, Threat, and Knowledge. Science 322:225-230.Schop, J., G. Aarts, R. Kirkwood, J. S. M. Cremer and S. M. J. M. Brasseur. 2017. Onset and duration of gray seal (Halichoerus grypus) molt in the Wadden Sea, and the role of environmental conditions. Marine Mammal Science:n/a-n/a.SCOS, M. A. 2006. Scientific Advice on Matters Related to the Management of Seal Populations: 2006 Reports of the UK Special Committee on Seals, http://smub.st-andrews.ac.uk.SCOS, M. A. 2010. Scientific advice on matters related to the management of seal populations: 2010 Reports of the UK Special Committee on Seals, http://smub.st-andrews.ac.uk.SCOS, M. A. 2012. Scientific Advice on Matters Related to the Management of Seal Populations: 2012 Reports of the UK Special Committee on Seals, http://smub.st-andrews.ac.uk.SCOS, M. A. 2013. Scientific Advice on Matters Related to the Management of Seal Populations: 2013 Reports of the UK Special Committee on Seals, http://smub.st-andrews.ac.uk.SCOS, M. A. 2014. Scientific Advice on Matters Related to the Management of Seal Populations: 2014 Reports of the UK Special Committee on Seals, http://smub.st-andrews.ac.uk.SCOS, M. A. 2015. Scientific advice on matters related to the management of seal populations: 2015 Reports of the UK Special Committee on Seals, http://smub.st-andrews.ac.uk.SCOS, M. A. 2016. Scientific advice on matters related to the management of seal populations: 2016. Reports of the UK Special Committee on Seals, http://smub.st-andrews.ac.uk.Sharples, R. J., M. L. Mackenzie and P. S. Hammond. 2009. Estimating seasonal abundance of a central place forager using counts and telemetry data. Marine Ecology Progress Series 378:289-298.Sharples, R. J., S. E. Moss, T. A. Patterson and P. S. Hammond. 2012. Spatial variation in foraging behaviour of a marine top predator (Phoca vitulina) determined by a large-scale satellite tagging program. PLoS ONE 7:e37216.Sjöberg, M., B. Albrectsen and J. Hjältén. 2000. Truncated power laws: a tool for understanding aggregation patterns in animals? Ecology Letters 3:90-94.Small, R. J., L. F. Lowry, J. M. V. Hoef, K. J. Frost, R. A. Delong and M. J. Rehberg. 2005. Differential movements by harbor seal pups in contrasting Alaska environments. Marine Mammal Science 21:671-694.Spiegelhalter D. J., A. Thomas, N. G. Best and D. Lunn. 2004. WinBUGS Version 2.0 Users Manual. MRC Biostatistics Unit, Cambridge.Spotte, S. 1982. The incidence of twins in pinnipeds. Canadian Journal of Zoology 60:2226-2233.
148 149
Seals in motion References
Stanley, H. F., S. Casey, J. M. Carnahan, S. Goodman, J. Harwood and R. K. Wayne. 1996. Worldwide patterns of mitochondrial DNA differentiation in the harbor seal (Phoca vitulina). Mol Biol Evol 13:368-382.Stewart, R. E. A., B. E. Stewart, D. M. Lavigne and G. W. Miller. 1989. Fetal growth of Northwest Atlantic harp seals, Phoca groenlandica. Canadian Journal of Zoology 67: 2147–2157.Strucker, R. C. W., F. A. Arts and S. Lilipaly. 2010. Watervogels en zeezoogdieren in de Zoute Delta 2008/2009 RWS Waterdienst BM pp.Strucker, R. C. W., F.A. Arts, S. Lilipaly, C.M. Berrevoets & P.L. Meininger. 2006. Watervogels en zeezoogdieren in de Zoute Delta 2004/2005. . RIKZ, Rijk- sinstituut voor Kust en Zee pp.Svensson, J. C., A. Eriksson, T. Härkönen and K. C. Harding. 2011. Detecting density dependence in recovering seal populations. Ambio 40:52-59.Teilmann, J., F. Rigét and T. Härkönen. 2010. Optimizing survey design for Scandinavian harbour seals: Population trend as an ecological quality element. ICES Journal of Marine Science 67:952-958.Temte, J. L. 1994. Photoperiod Control of Birth Timing in the Harbor Seal (Phoca vitulina). Journal of Zoology 233:369-384.Terhune, J. M. and S. W. Brillant. 1996. Harbour seal vigilance decreases over time since haul out. Animal Behaviour 51:757-763.Thompson, D., C. Duck and L. M. E. 2010. The status of harbour seals (Phoca vitulina) in the United Kingdom. NAMMCO Scientific Publications 8:117-128.Thompson, P. M. and J. Harwood. 1990. Methods for estimating the population Size of common seals, Phoca vitulina. Journal of Applied Ecology 27:924-938.Thompson, P. M., A. Mackay, D. J. Tollit, S. Enderby and P. S. Hammond. 1998. The influence of body size and sex on the characteristics of harbour seal foraging trips. Canadian Journal of Zoology 76:1044-1053.Thompson, P. M., B. J. Mcconnell, D. J. Tollit, A. Mackay, C. Hunter and P. A. Racey. 1996. Comparative distribution, movements and diet of harbour and grey seals from the Moray Firth, NE Scotland. Journal of Applied Ecology 33:1572-1584.Thompson, P. M. and H. Wheeler. 2008. Photo-ID-based estimates of reproductive patterns in female harbor seals. Marine Mammal Science 24:138-146.Tollit, D. J., A. D. Black, P. M. Thompson, A. Mackay, H. M. Corpe, B. Wilson, S. M. Van Parijs, K. Grellier and S. Parlane. 1998. Variations in harbour seal Phoca vitulina diet and dive-depths in relation to foraging habitat. Journal of Zoology 244:209-222.Tougaard, J., S. Tougaard, R. C. Jensen, T. Jensen, J. Teilmann, D. Adelung, N. Liebsch and G. Müller. 2006. Harbour seals on Horns Reef before, during and after construction of Horns Rev Wind Farm. 1-22 pp. Biological Papers from the Fisheries and Maritime Museum No.5, Esbjerg, Denmark.Tulp, I., L. J. Bolle and A. D. Rijnsdorp. 2008. Signals from the shallows: In search of common patterns in long-term trends in Dutch estuarine and coastal fish. Journal of Sea Research 60:54-73.Twiss, S. D., P. P. Pomeroy and S. S. Anderson. 1994. Dispersion and site fidelity of breeding male grey seals (Halichoerus grypus) on North Rona, Scotland. Journal of Zoology 233:683-693.Van Haaften, J. L. 1975. Zeehonden langs de Nederlandse Kust. Wetenschappelijke mededelingen Koninklijke Nederlandse Natuurhistorische Vereniging 101:1-36.Vincent, C., M. A. Fedak, J. B. Mcconnell, L. Meynier, C. Saint-Jean and V. Ridoux. 2005. Status and conservation of the grey seal, Halichoerus grypus, in France.
Biological Conservation 126:62-73.Vooys, C. G. N. D., S. M. J. M. Brasseur, J. V. D. Meer and P. J. H. Reijnders. 2012. Analyses of four centuries of bounty hunting on seals in Zeeland, SW-Netherlands. Lutra 55:55-65.Walter, U. and P. H. Becker. 1997. Occurence and consumption of seabirds scavenging on shrimp trawler discards in the Wadden Sea. ICES Journal of Marine Science 54: 684-694.Ward, E. J., P. S. Levin, M. M. Lance, S. J. Jeffries and A. Acevedo-Gutiérrez. 2012. Integrating diet and movement data to identify hot spots of predation risk and areas of conservation concern for endangered species. Conservation Letters 5:37-47.Waterbolk, H. T. 1976. Oude bewoning in het Waddengebied. Pages 211-221. in W. J. J. Abrahamse, N. Van Leeuwen-Seelt ed. Waddenzee. Landelijke Vereniging tot Behoud van de Waddenzee Natuurmonumenten, Harlingen Amsterdam.Wieren, S. E. V. 1981. Broedbiologie van de gewone zeehond Phoca vitulina, in het Nederlandse Waddengebied. . 63 pp, Rijksinstituut voor Natuurbeheer, Texel, the Netherlands.Wilmer, J. W., A. J. Overall, P. P. Pomeroy, D. Twiss and W. Amos. 2000. Patterns of paternal relatedness in British grey seal colonies. Molecular Ecology 9:283-292.Wolff, W. J. and J. J. Zijlstra. 1980. Management of the Wadden Sea. Helgolander Meeresuntersuchungen 33:596-613.Womble, J., G. Blundell, S. Gende, M. Horning, M. Sigler and D. Csepp. 2014. Linking marine predator diving behavior to local prey fields in contrasting habitats in a subarctic glacial fjord. Marine Biology 161:1361-1374.Womble, J. N. and S. M. Gende. 2013. Post-breeding season migrations of a top predator, the harbor seal (Phoca vitulina richardii), from a marine protected area in Alaska. PLoS ONE 8:e55386.Wood, S. A., T. R. Frasier, B. A. Mcleod, J. R. Gilbert, B. N. White, W. D. Bowen, M. O. Hammill, G. T. Waring and S. Brault. 2011. The genetics of recolonization: An analysis of the stock structure of grey seals (Halichoerus grypus) in the Northwest Atlantic. Canadian Journal of Zoology 89:490-497.Wood, S. N. 2006a. Generalized Additive Models: An introduction with R. Chapman & Hall/CRC, Boca Raton, London, New York.Wood, S. N. 2006b. Low-Rank Scale-Invariant Tensor Product Smooths for Generalized Additive Mixed Models. . Biometrics 62:1025-1036.Woodroffe, R. T., Simon; Rabinowitz, Alan. 2005. The impact of human-wildlife conflict on natural systems in R.T. Woodroffe, T. Simon and A. Rabinowitz (eds.), People and wildlife: Conflict or coexistence? Conservation Biology Series-Cambridge 9:1.

Seals in motion
150 151
Peter J.H. Reijnders - Wageningen Marine Research, Wageningen University & Re-search, Den Helder, the Netherlands; Aquatic Ecology and Water Quality Manage-ment, Wageningen University, Wageningen, the Netherlands.
Geert Aarts - Wageningen Marine Research, Wageningen University & Research, Den Helder, the Netherlands;
Tamara D. van Polanen Petel - Wageningen Marine Research, Wageningen University & Research, Den Helder, the Netherlands;
Roger Kirkwood - Wageningen Marine Research, Wageningen University & Research, Den Helder, the Netherlands
Jenny Cremer - Wageningen Marine Research, Wageningen University & Research, Den Helder, the Netherlands;
Erik H. Meesters - Wageningen Marine Research, Wageningen University & Research, Den Helder, the Netherlands;
Lasse Fast Jensen - Fisheries and Maritime Museum, Esbjerg, Denmark,
Armin Jeβ - Landesbetrieb für Küstenschutz, Nationalpark und Meeresschutz Schleswig-Holstein, Tönning, Germany
Anders Galatius - Department of Bioscience, Aarhus University, Roskilde, Denmark
Jonas Teilmann - Department of Bioscience, Aarhus University, Roskilde, Denmark
Tim Gerrodette - Southwest Fisheries Science Center, NOAA National Marine Fisheries Service
cONTRIbUTINgAUTHORS
© HERcULES & vALKEMA www.ELSjE.NL
152 153
Seals in motion publications
152
pUbLIcATIONS
152
2002a. Adrenocortical responsiveness in southern elephant seal mothers and pup during lactation and the effect of scientific handling. J. comp. Physiol. B 172:315-328.Engelhard, G. H., A. J. Hall, S. M. J. M. Brasseur and P. J. H. Reijnders. 2002b. Blood chemistry in southern elephant seal mothers and pups during lactation reveals no effect of handling. Comparative Biochemistry and Physiology - A Molecular and Integrative Physiology 133:367-378.Hall, A. J., G. H. Engelhard, S. M. J. M. Brasseur, A. Vecchione, H. R. Burton and P. J. H. Reijnders. 2003. The immunocompetence handicap hypothesis in two sexually dimorphic pinniped species - there a sex difference in immunity during early development? Developmental and Comparative Immunology 27:629-637.Härkönen, T., R. Dietz, P. Reijnders, J. Teilmann, K. Harding, A. Hall, S. Brasseur, U. Siebert, S. J. Goodman, P. D. Jepson, T. D. Rasmussen and P. Thompson. 2006. The 1988 and 2002 phocine distemper virus epidemics in European harbour seals. Diseases of Aquatic Organisms 68:115-130.Hoekendijk, J. P. A., J. De Vries, K. Van Der Bolt, J. Greinert, S. Brasseur, K. C. J. Camphuysen and G. Aarts. 2015. Estimating the spatial position of marine mammals based on digital camera recordings. Ecology and Evolution 5:578-589.Kreutzer, M., R. Kreutzer, U. Siebert, G. Muller, P. J. H. Reijnders, S. M. J. M. Brasseur, T. Harkonen, R. Dietz, C. Sonne, E. W. Born and W. Baumgartner. 2008. In search of virus carriers of the 1988 and 2002 phocine distemper virus outbreaks in European harbour seals. Archives of Virology 153:187-192.Lindeboom, H. J., H. J. Kouwenhoven, M. J. N. Bergman, S. Bouma, S. M. J. M. Brasseur, R. Daan, R. V. Hal, R. Hille Ris Lambers, R. T. Hofstede, M. F. Leopold, M. Scheidat and D. D. Haan. 2011. Short-term ecological effects of an offshore wind farm in the Dutch coastal zone; a compilation. Environmental Research Letters 6:13.Mccarthy, A. J., M. Shaw, P. D. Jepson, S. M. J. M. Brasseur, P. J. H. Reijnders and S. J. Goodman. 2011. Variation in European harbour seal immune response genes and susceptibility to phocine distemper virus (PDV). Infection, Genetics and Evolution 11:1616-1623.Olsen, M. T., V. Islas, J. A. Graves, A. Onoufriou, C. Vincent, S. Brasseur, A. K. Frie and A. J. Hall. 2017. Genetic population structure of harbour seals in the United Kingdom and neighbouring waters. Aquatic Conservation: Marine and Freshwater Ecosystems.Özkan Sertlek, H., G. Aarts, S. Brasseur, H. Slabbekoorn, C. Ten Cate, A. M. Von Benda-Beckmann and M. A. Ainslie. 2016. Mapping underwater sound in the dutch part of the North Sea. Advances in Experimental Medicine and Biology 875:1001-1006.Reijnders, P., K. Abt, S. Brasseur, S. Tougaard, U. Siebert and E. Vareschi. 2003a. Sense and sensibility in evaluating aerial counts of harbour seals in the Wadden Sea. Wadden Sea Newsletter 28:9-12.Reijnders, P. J., S. Brasseur, K. Abt, U. Siebert, M. Stede and S. Tougaard. 2003b. The harbour seal population in the Wadden Sea as revealed by the aerial surveys in 2003. Wadden Sea Newsletter 2:11-12.Reijnders, P. J. H. and S. M. J. M. Brasseur. 1997. Xenobiotic induced hormonal and associated developmental disorders in marine organisms and related effects in humans; an overview. Journal of Clean Technology, Environmental Toxicology
Journals
Aarts, G., V. Benda-Beckmann, K. Lucke, H. Sertlek, R. Van Bemmelen, S. Geelhoed, S. Brasseur, M. Scheidat, F. Lam and H. Slabbekoorn. 2016. Harbour porpoise movement strategy affects cumulative number of animals acoustically exposed to underwater explosions. Marine Ecology Progress Series 557:261-275.Aarts, G., J. Fieberg, S. Brasseur and J. Matthiopoulos. 2013. Quantifying the effect of habitat availability on species distributions. Journal of Animal Ecology 82:1135-1145.Akineden, O., J. Alber, C. Laemmler, R. Weiss, U. Siebert, G. Foster, S. Tougaard, S. M. J. M. Brasseur and P. J. H. Reijnders. 2007. Relatedness of Streptococcus equi subsp. zooepidemicus strains isolated from harbour seals (Phoca vitulina) and grey seals (Halichoerus grypus) of various origins of the North Sea during 1988 - 2005. Veterinary Microbiology 121:158-162.Bodewes, R., A. Rubio García, S. M. Brasseur, G. J. Sanchez Conteras, M. W. G. Van De Bildt, M. P. G. Koopmans, A. D. M. E. Osterhaus and T. Kuiken. 2015. Seroprevalence of antibodies against Seal Influenza A(H10N7) virus in harbor seals and gray seals from the Netherlands. PLoS ONE 10:e0144899.Brasseur, S., J. Creuwels, B. Van Der Werf and P. Reijnders. 1996. Deprivation indicates necessity for haul-out in harbor seals. Marine Mammal Science 12:619-624.Brasseur, S., M. J. M. , P. Reijnders, J.H., J. Cremer, E. Meesters, R. Kirkwood, L. F. Jensen, A. Jeβ, A. Galatius, J. Teilmann and Aarts Geert. submitted 2017. Echoes from the past: regional variations in recovery within a harbour seal population. PlosOne.Brasseur, S. M. J. M., I. Y. M. Tulp and P. J. H. Reijnders. 2006. Verspreiding en voedselkeus van zeehonden uit de Waddenzee, fase 1. De Levende Natuur 107:157-161.Brasseur, S. M. J. M., T. D. Van Polanen Petel, T. Gerrodette, E. H. W. G. Meesters, P. J. H. Reijnders and G. Aarts. 2015. Rapid recovery of Dutch gray seal colonies fueled by immigration. Marine Mammal Science 31:405-426.Bravo Rebolledo, E. L., J. A. Van Franeker, O. E. Jansen and S. M. J. M. Brasseur. 2013. Plastic ingestion by harbour seals (Phoca vitulina) in The Netherlands. Marine Pollution Bulletin 67:200-202.Das, K., W. De Coen, E. Esmans, R. Blust, K. I. Van De Vijver, P. Hoff, S. Brasseur, W. Van Dongen and P. Reijnders. 2005. Tissue Distribution of Perfluorinated Chemicals in Harbor Seals (Phoca vitulina) from the Dutch Wadden Sea. Environmental Science & Technology:6978-6984.De Groot, A. V., S. M. J. Brasseur, G. Aarts, E. M. Dijkman and R. Kirkwood. 2016. Zandplaten voor jonge Grijze zeehonden. . De Levende Natuur 117:102-107.Engelhard, G. H., S. M. J. M. Brasseur, A. J. Hall, H. R. Burton and P. J. H. Reijnders.
154 155
Seals in motion publications
and Occupational Medicine 6:367-380.Reijnders, P. J. H. and S. M. J. M. Brasseur. 2003. Vreemde snuiten aan de Nederlandse kust. Zoogdier 14:5-10.Reijnders, P. J. H., S. M. J. M. Brasseur, K. F. Abt, U. Siebert, M. Stede and S. Tougaard. 2006. Aerial surveys of harbour and grey seals in the Wadden Sea in 2006. Wadden Sea Newsletter 32:9-11.Reijnders, P. J. H., S. M. J. M. Brasseur and E. H. W. G. Meesters. 2010. Earlier pupping in harbour seals, Phoca vitulina. Biology letters 6:854-857.Reijnders, P. J. H., B. Reineking, K. F. Abt, S. M. J. M. Brasseur, C. J. Camphuysen, M. Scheidat, U. Siebert, M. Stede, M. Tougaard, J. Tougaard and S. Tougaard. 2005. Marine Mammals. Wadden Sea Ecosystem No 19:129-142.Reijnders, P. J. H., Ries E.H, Brasseur S.M.J.M 1996. On the status of harbour seals in the Wadden Sea in 1995. Wadden Sea News 1996 1:31-32.Russell, D. J. F., S. M. J. M. Brasseur, D. Thompson, G. D. Hastie, V. M. Janik, G. Aarts, B. T. Mcclintock, J. Matthiopoulos, S. E. W. Moss and B. Mcconnell. 2014. Marine mammals trace anthropogenic structures at sea. Current Biology 24:R638-R639.Scheidat, M., J. Tougaard, S. Brasseur, J. Carstensen, T. Van Polanen Petel, J. Teilmann and P. Reijnders. 2011. Harbour porpoises (Phocoena phocoena) and wind farms: A case study in the Dutch North Sea. Environmental Research Letters 6.Schop, J., G. Aarts, R. Kirkwood, J. S. M. Cremer and S. M. J. M. Brasseur. 2017. Onset and duration of gray seal (Halichoerus grypus) molt in the Wadden Sea, and the role of environmental conditions. Marine Mammal Science.Van Bleijswijk, J. D. L., L. Begeman, H. J. Witte, L. L. Ijsseldijk, S. M. J. M. Brasseur, A. Gröne and M. F. Leopold. 2014. Detection of grey seal Halichoerus grypus DNA in attack wounds on stranded harbour porpoises Phocoena phocoena. Marine Ecology Progress Series 513:277-281.Van De Vijver, K., P. Hoff, K. Das, O. Drouguet, S. Brasseur, P. Reijnders, R. Blust and W. De Coen. 2005a. New insights in distribution and accumulation patterns between various perfluorochemicals. VLIZ Special Publication 20.Van De Vijver, K. I., P. Hoff, K. Das, S. Brasseur, W. Van Dongen, E. Esmans, P. Reijnders, R. Blust and W. De Coent. 2005b. Tissue distribution of perfluorinated chemicals in harbor seals (Phoca vitulina) from the Dutch Wadden Sea. Environmental Science & Technology 39:6978-6984.Verheyen, D. a. M., J. P. Verdaat, J. IJzer, S. M. J. M. Brasseur and M. F. Leopold. 2012. Harbour seals (Phoca vitulina) in Dutch inland waters: an overview of reported sightings and some first data on diet. Lutra 55:89-99.Vooys, C. G. N. D., S. M. J. M. Brasseur, J. V. D. Meer and P. J. H. Reijnders. 2012. Analyses of four centuries of bounty hunting on seals in Zeeland, SW-Netherlands. Lutra 55:55-65.Vooys De, C. G. N., S. M. J. M. Brasseur and P. J. H. Reijnders. 1999. Visserij en zeehonden in de vorige eeuw (Fishery and seals in the last century). . Waddenbulletin 34 40-41.Werner, M., S. Brasseur and E. Ries. 1995. Rode lijst van bedreigde en kwetsbare zoogdieren in Nederland Netherlands Journal of Aquatic Ecology 29:197.
BookS anD Book chapTerS
Brasseur, S. 2014. Van ongedierte tot knuffeldieren: zeehonden. Pages 123-129 in
J. D. R. Nico Groen, Laura Immy Kooistra ed. Texel is anders: landschap, (cultuur)historie en natuur. Natuurmonumenten.Brasseur, S., P. Reijnders and G. Verriopoulos. 1997. Mediterranean monk seal, Monachus monachus. Pages 12-26 IBN scientific contributions.Brasseur, S. M. J. M. and M. Fedak. 2003. Habitat Use of Harbour Seals in Relation to Recreation, Fisheries, and Large Infra-structural Works. Wadden Sea Ecosystem.Brasseur, S. M. J. M. and P. J. H. Reijnders. 1995. The harbour seal in the Netherlands : ecological profile harbour seal. Directoraat-Generaal Rijkswaterstaat, Rijksinstituut voor Kust en Zee, [S.l.].Brasseur, S. M. J. M. and P. J. H. Reijnders. 2016a. Baardrob Erignatus barbatus. Pages 272-273 in Sim Broekhuizen, Kamiel Spoelstra, Johan Thissen, Kees Canters, Jan Buys (eds.) Atlas van de Nederlandse zoogdieren - Natuur van Nederland 12. KNNV, Zeist, the Netherlands.Brasseur, S. M. J. M. and P. J. H. Reijnders. 2016b. Grijze zeehond Halichoerus grypus. Pages 276-278 in Sim Broekhuizen, Kamiel Spoelstra, Johan Thissen, Kees Canters, Jan Buys (eds.) Atlas van de Nederlandse zoogdieren - Natuur van Nederland 12. KNNV, Zeist, the Netherlands.Brasseur, S. M. J. M. and P. J. H. Reijnders. 2016c. Klapmuts Cystophora cristata. Pages 274-275 in Sim Broekhuizen, Kamiel Spoelstra, Johan Thissen, Kees Canters, Jan Buys (eds.) Atlas van de Nederlandse zoogdieren - Natuur van Nederland 12. KNNV, Zeist, the Netherlands. Brasseur, S. M. J. M. and P. J. H. Reijnders. 2016d. Ringelrob Pusa hispida. Pages 286-287 in Sim Broekhuizen, Kamiel Spoelstra, Johan Thissen, Kees Canters, Jan Buys (eds.) Atlas van de Nederlandse zoogdieren - Natuur van Nederland 12. KNNV, Zeist, the Netherlands. Brasseur, S. M. J. M. and P. J. H. Reijnders. 2016e. Walrus Odobenus rosmarus. Pages 270-271 in Sim Broekhuizen, Kamiel Spoelstra, Johan Thissen, Kees Canters, Jan Buys (eds.) Atlas van de Nederlandse zoogdieren - Natuur van Nederland 12. KNNV, Zeist, the Netherlands.Brasseur, S. M. J. M. and P. J. H. Reijnders. 2016f. Zadelrob Pagophilus groenlandicus. Pages 279-280 in Sim Broekhuizen, Kamiel Spoelstra, Johan Thissen, Kees Canters, Jan Buys (eds.) Atlas van de Nederlandse zoogdieren - Natuur van Nederland 12. KNNV, Zeist, the Netherlands.Dankers, N. M. J. A., B. Brinkman, E. M. Dijkman, J. S. M. Cremer and S. M. J. M. Brasseur. 2000. Beschrijving van het Waddengebied tussen Lauwersoog en Schiermonnikoog ten behoeve van de milieu-aspect rapportage over de gevolgen van aanleg van een galsvezelkabel. In: P.C.W. Voet & B.A. van Mameren, Milieuaspect rapport glasvezelkabel Lauwersoog-Schiermonnikoog. Zwolle, KPN Telecom, 2000, Bijl. D.Dankers, N. M. J. A., J. S. M. Cremer, E. M. Dijkman, S. M. J. M. Brasseur, K. S. Dijkema, F. E. Fey-Hofstede, M. L. D. Jong and C. J. Smit. 2007. Ecologische atlas Waddenzee. IMARES, Texel.De Jong, G., S. Brasseur and P. Reijnders. 1997. Harbour seal Phoca vitulina vitulina. Pages 76-97 Status of pinnipeds relevant to the European Union. IBN Scientific Contributions. IBN-DLO, Wageningen, the Netherlands.Härkönen, T., S. M. J. M. Brasseur, J. Teilmann, C. Vincent, R. Dietz, K. Abt and P. J. H. Reijnders. 2007. Status of grey seals along mainland Europe from the Southwestern Baltic to France. Pages 57-68 Grey Seals in the North Atlantic and the Baltic. NAMMCO Scientific Publication Series : Volume 6. NAMMCO, Polar
156 157
Seals in motion publications
Environmental Centre, Tromso, Norway.Janssen, J. A. M., J. H. J. Schaminée, S. M. J. M. Brasseur and R. H. D. Bruyne. 2008. Europese Natuur in Nederland. Soorten van de Habitatrichtlijn. Tweede sterk herziene en uitgebreide druk. KNNV-Uitgeverij, Zeist.Janssen, J. A. M., J. H. J. Schaminée, S. M. J. M. Brasseur, F. G. W. A. Ottburg, A. H. P. Stumpel and A. H. Hoffmann. 2004. Europese natuur in Nederland; soorten van de habitatrichtlijn. KNNV, Utrecht.Reijnders P. J. H. and Brasseur S. M. J. M. , 2016. Gewone zeehond Phoca vitulina. Pages 281-285 in J. T. Sim Broekhuizen, Kamiel Spoelstra, Johan Thissen, Kees Canters, Jan Buys (eds.) Atlas van de Nederlandse zoogdieren - Natuur van Nederland 12. KNNV, Zeist, the Netherlands.Reijnders, P., S. M. J. M. Brasseur, J. Van Der Toorn, P. Van Der Wolf, I. Boyd, J. Harwood, D. Lavigne and L. Lowry. 1993. Seals, Fur Seals, Sea Lions and Walrus, Status survey and conservation action plan. USA: IUCN, Gland, Switzerland 88 p. Reijnders, P. J., K. Abt, S. Brasseur, K. Camphuysen, B. Reineking, M. Scheidat, U. Siebert, M. Stede, J. Tougaard and S. Tougaard. 2004. Marine mammals. Pages 305-318 Wadden Sea Quality Status Report.Reijnders, P.J.H., S.M.J.M. Brasseur, T. Borchardt, K. Camphuysen, R. Czeck, A. Gilles, L. F. Jensen, M. Leopold, K. Lucke and S. Ramdohr. 2009a. QSR 2009 Thematic Report No. 20: Marine Mammals.Reijnders, P. J., S. M. Brasseur, S. Tougaard, U. Seibert, T. Borchardt and M. Stede. 2010. Population development and status of harbour seals (Phoca vitulina) in the Wadden Sea. Pages 95-105 NAMMCO Scientific Publications volume 8.Reijnders, P. J. H., S. M. J. M. Brasseur and E. H. Ries. 1991. The release of seals from captive breeding and rehabilitation programmes: a usefull management tool? Pages 54-65 in J. R. Geraci, D.J. St. Aubin and V.J. Lounsbury (eds). Rescue rehabilitation and release of marine mammals: an analysis of, current views and practices. NOAA Technical Memorandum NMFS-OPR-8.Reijnders, P. J. H., Brasseur S.M.J.M. 1996. Meerestiere zeigen fremdstoffinduzierte Störungen von Hormonsystemen und hormonabhängigen Entwicklungs- prozessen. Pages 63 -93 in M. L. W. Schlumpf ed. Sinkt die Fertilität? [Declining fertlity?] -Kind und Umwelt Verlag, Zürich, Switzerland.Reijnders, P. J. H. and S. M. J. M. Brasseur. 1997. Xenobiotic induced hormonal and associated development disorders in marine organisms and related effects in humans; an overview. Chemically - induced alterations in sexual and functional development : the wildlife - human connection. Advances in modern environmental toxicology : 21 pages 159-174. Princeton, USA.Reijnders, P. J. H. and S. M. J. M. Brasseur. 2003b. Veränderungen in Vorkommen und Status der Bestände von Seehunden und Kegelrobben in der Nordsee - mit Anmerkungen zum Robbensterben 2002. Pages 330-339 Warnsignale aus Nordsee & Wattenmeer; eine aktuelle Umweltbilanz. Wissentschaftliche Auswertungen, Hamburg.Reijnders, P. J. H., S. M. J. M. Brasseur, T. Borchardt, C. Camphuysen, R. Czeck, A. Gilles, L. F. Jensen, M. Leopold, K. Lucke, S. Ramdohr, M. Scheidat, U. Siebert and J. Teilmann. 2009b. Marine mammals. in H. Marencic; and J. D. Vlas eds. Quality Status Report 2009, Thematic Report No. 20, Wadden Sea Ecosystems No. 25 (2009). (www.waddensea-secretariat.org/management/QSR-2009/ index.htm).Reijnders, P. J. H., G. Verriopoulos and S. M. J. M. Brasseur. 1997. Status of
pinnipeds relevant to the European Union. IBN-DLO, Wageningen.Sertlek, H. Ö., G. Aarts, S. Brasseur, H. Slabbekoorn, C. Ten Cate, A. Von Benda- Beckmann and M. Ainslie. 2016. Mapping Underwater Sound in the Dutch Part of the North Sea. Pages 1001-1006 in A. N. Popper and A. Hawkins eds. The Effects of Noise on Aquatic Life II. Advances in Experimental Medicine and Biology. Springer New York.
reporTS
Aarts, G., S. Brasseur, S. Geelhoed, R. Van Bemmelen and M. Leopold. 2013. Grey and harbour seal spatiotemporal distribution along the Dutch West coast. C103/13 IMARES Wageningen UR. 63 pp.Aarts, G., J. Cremer, R. Kirkwood, J. T. Van Der Wal, J. Matthiopoulos and S. Brasseur. 2016. Spatial distribution and habitat preference of harbour seals (Phoca vitulina) in the Dutch North Sea. (Wageningen Marine Research rapport C118/16) - 43 p.Aarts, G. M. and S. M. J. M. Brasseur. 2008. Modelling habitat preference and estimating the spatial distribution of Australian Sea Lions (Neophoca cinerea); “A first exploration “. IMARES. (Report / Wageningen IMARES C107/08) - 18 p.Brasseur, S., G. Aarts and R. Kirkwood. 2014a. Habitat quality for Grey seals in the Dutch Wadden Sea. IMARES Wageningen UR. (Report / IMARES Wageningen UR C090/14) - 77 pBrasseur, S., G. Aarts, E. Meesters, T. V. Polanen Petel, E. Dijkman, J. Cremer and P. Reijnders. 2012a. Habitat preferences of harbour seals in the Dutch coastal area: analysis and estimate of effects of offshore wind farms. IMARES, (Report / IMARES C043A/10) - 55 pBrasseur, S., T. Borchardt, R. Czeck, L. F. Jensen, A. G. Jørgensen, P. Körber, S. Ramdohr, U. Siebert and J. Teilmann. 2009a. Trilateral Seal Expert Group (TSEG) Aerial Surveys of Harbour Seals in the Wadden Sea in 2009: Growth of the harbour seal population slowing down? . Common Wadden Sea Secretariat Wilhelmshaven.Brasseur, S., T. Borchardt, R. Czeck, L. F. Jensen, A. G. Jørgensen, P. Körber, S. Ramdohr, U. Siebert and J. Teilmann. 2010a. Trilateral Seal Expert Group (TSEG) Aerial Surveys of Harbour Seals in the Wadden Sea in 2010: Strong increase in pups, slight increase in total number? Common Wadden Sea Secretariat, Wilhelmshaven.Brasseur, S., T. Borchardt, R. Czeck, L. F. Jensen, A. G. Jørgensen, P. Körber, S. Ramdohr, U. Siebert and J. Teilmann. 2011a. Trilateral Seal Expert Group (TSEG) Aerial Surveys of Harbour Seals in the Wadden Sea in 2011: - Solid increases in total number as well as pups. Common Wadden Sea Secretariat, Wilhelmshaven.Brasseur, S., R. Czeck, B. Diederichs, A. Galatius, L. F. Jensen, P. Körber, U. Siebert, J. Teilmann and S. Klöpper. 2014b. Trilateral Seal Expert Group (TSEG). Grey Seal surveys in the Wadden Sea and Helgoland in 2013-2014. Grey seal population recovered after decrease. CWSS, Willemshaven.Brasseur, S., R. Czeck, A. Galatius, L. F. Jensen, J. Armin, P. Körber, R. Pund, U. Siebert, J. Teilmann and S. Klöpper. 2016. Trilateral Seal Expert Group (TSEG). Grey Seal surveys in the Wadden Sea and Helgoland in 2015-2016. First year of almost complete monitoring by aerial surveys. CWSS, Willemshaven.
158 159
Seals in motion publications
Brasseur, S., R. Czeck, A. Galatius, L. F. Jensen, J. Armin, P. Körber, U. Siebert, J. Teilmann and S. Klöpper. 2015a. Trilateral Seal Expert Group (TSEG). Grey Seal surveys in the Wadden Sea and Helgoland in 2014-2015. The first aerial surveys in Denmark. CWSS, Willemshaven.Brasseur, S., A. De Groot, G. Aarts, E. Dijkman and R. Kirkwood. 2015b. Pupping habitat of grey seals in the Dutch Wadden Sea. . IMARES (Report / IMARES C009/15) - 104 p.Brasseur, S.M.J.M. and P. Reijnders. 2001a. [Harbour seals in the Eastern Scheldt, phase 2: effects of extra transit in the Oliegeul]. 1566-7197. Brasseur, S. and P. Reijnders. 2001b. Zeehonden in Oosterschelde fase 2. Effecten van extra doorvaart door de Oliegeul. Alterra rapport 353, 58 pp. Alterra, Wageningen, the Netherlands.Brasseur, S., P. Reijnders, O. D. Henriksen, J. Carstensen, J. Tougaard, J. Teilmann, M. Leopold, K. Camphuysen and J. Gordon. 2004a. Baseline data on the harbour porpoise, Phocoena phocoena, in relation to the intended wind farm site NSW, in the Netherlands. Alterra. (Alterra-rapport 1043) - 80 pp.Brasseur, S., P. Reijnders, E. Meesters, G. Aarts and J. Cremer. 2011b. Harbour seals, Phoca vitulina, in relation to the wind farm site OWEZ, in the Netherlands. IMARES for Noordzeewind.Brasseur, S., T. Van Polanen-Petel, S. Geelhoed, G. Aarts and H. Meesters. 2010b. Zeezoogdieren in de Eems 2009: overzicht van de verkregen data. IMARES IMARES, (Rapport / Wageningen IMARES C061_09) - 23 p.Brasseur, S. M., T. V. Polanen Petel, M. Scheidat, H. Meesters, J. Verdaat, J. Cremer and E. Dijkman. 2009b. Zeezoogdieren in de Eems: evaluatie van de vliegtuig- tellingen van zeezoogdieren tussen oktober 2007 en september 2008. Wageningen IMARES..Brasseur, S. M., I. Tulp, P. Reijnders, C. Smit, E. Dijkman, J. Cremer, M. Kotterman and H. Meesters. 2004b. Voedselecologie van de gewone en grijze zeehond in de Nederlandse kustwateren; I onderzoek naar de voedselecologie van de gewone zeehond; II literatuurstudie naar het dieet van de grijze zeehond. Alterra. (Alterra-rapport 905) - 116 p Brasseur, S. M. J. M. 2007. Zeezoogdieren in de Eems, cumulatieve effecten van de activiteiten rond de ontwikkeling van de Eemshaven. IMARES. (Rapport / Wageningen IMARES nr. C107/07) - 44 p.Brasseur, S. M. J. M., G. M. Aarts, E. Bravo Rebolledo, J. S. M. Cremer, F. E. Fey-Hofstede, S. C. V. Geelhoed, H. J. Lindeboom, K. Lucke, M. a. M. Machiels, H. W. G. Meesters, M. M. Scholl, L. R. Teal and R. H. Witte. 2011c. Zeezoogdieren in de Eems: studie naar de effecten van bouwactiviteiten van GSP, RWE en NUON in de Eemshaven in 2010. IMARES. 212 pp.Brasseur, S. M. J. M., G. M. Aarts and R. J. Kirkwood. 2014c. Habitat quality for Grey Seals in the Dutch Wadden Sea. IMARES. 77 pp.Brasseur, S. M. J. M., G. M. Aarts, H. W. G. Meesters, T. V. Polanen-Petel, E. M. Dijkman, J. S. M. Cremer and P. J. H. Reijnders. 2010c. Habitat preferences of harbour seals in the Dutch coastal area: analysis and estimate of effects of offshore wind farms. IMARES.Brasseur, S. M. J. M., G. M. Aarts, H. W. G. Meesters, T. V. Polanen-Petel, E. M. Dijkman, J. S. M. Cremer and P. J. H. Reijnders. 2010d. Habitat preferences of harbour seals in the Dutch coastal area: analysis and estimate of effects of offshore wind farms. IMARES. 55 pp.Brasseur, S. M. J. M., T. Borchardt, R. Czeck, L. F. Jensen, A. Galatius, S. Ramdohr,
U. Siebert and J. Teilman. 2012b. Trilateral Seal Expert Group (TSEG). Aerial surveys of grey seals in the Wadden Sea in 2011-2012: Increase in Wadden Sea grey seals continued in 2012. Common Wadden Sea Secretariate (CWSS). http://www.waddensea-secretariat.org/news/news/Seals/Annual-reports/ seals2012.html.Brasseur, S. M. J. M., J. S. M. Cremer, E. M. Dijkman and J. P. Verdaat. 2013a. Monitoring van gewone en grijze zeehonden in de Nederlandse Waddenzee 2002-2012. Wettelijke Onderzoekstaken Natuur & Milieu, (WOt-werkdocument 352) - 31 pBrasseur, S. M. J. M., G. De Jong and R. Van De Velde. 1990. Survey of the Dugong (Dugong dugong) in the Moluccas, Indonesia, and the recolonization of their feeding tracks. AID-Environment (Amsterdam) Project Report. 65 pp.Brasseur, S. M. J. M., B. Diederichs, R. Czeck, L. F. Jensen, A. Galatius, S. Ramdohr, U. Siebert and J. Teilman. 2013b. Trilateral Seal Expert Group (TSEG). Aerial surveys of grey seals in the Wadden Sea in 2012-2013: Mixed messages. Common Wadden Sea Secretariat (CWSS). http://www.waddensea- secretariat.org/sites/default/files/downloads/TMAP_downloads/Seals/aerial_ surveys_of_grey_seals_in_the_wadden_sea_in_the_season_of_2012-13.pdf.Brasseur, S. M. J. M. and R. J. Kirkwood. 2015. Seal monitoring and evaluation for the Gemini offshore windpark: Pre-construction, T0 - 2014 report. IMARES. (Report / IMARES Wageningen UR C128/14) - 52 pBrasseur, S. M. J. M. and R. J. Kirkwood. 2016. Seal monitoring and evaluation for the Gemini offshore windpark: T-construction - 2015 report. IMARES, C043/16. 52 pp.Brasseur, S. M. J. M., Peter J.H. Reijnders, Thomas Borchardt, Ursula Siebert, Sven Ramdohr, Lasse Fast Jensen and Jonas Teilman 2009. Trilateral Seal Expert Group (TSEG) Aerial surveys of grey seals in the Wadden Sea in the seasons of 2007-2008 and 2008-2009. Annual reports http://www.waddensea-secretariat. org/news/news/Seals/Annual-reports/greyseals2009.html.Brasseur, S. M. J. M., T. V. Polanen-Petel, S. C. V. Geelhoed, G. M. Aarts and H. W. G. Meesters. 2010e. Zeezoogdieren in de Eems 2009: overzicht van de verkregen data. IMARES. (Rapport / IMARES C023/10) - 63 p.Brasseur, S. M. J. M., T. V. Polanen-Petel, S. C. V. Geelhoed, G. M. Aarts and H. W. G. Meesters. 2010f. Zeezoogdieren in de Eems; studie naar de effecten van bouwactiviteiten van GSP, RWE en NUON in de Eemshaven in 2009. IMARES. (Jaarrapportage/Rapport / IMARES Wageningen UR C086/10) - 110 pBrasseur, S. M. J. M., T. V. Polanen Petel, G. M. Aarts, H. W. G. Meesters, E. M. Dijkman and P. J. H. Reijnders. 2010g. Grey seals (Halichoerus grypus) in the Dutch North sea: population ecology and effects of wind farms. IMARES. (Rapport / IMARES Wageningen UR C137/10) - 72 p.Brasseur, S. M. J. M., T. V. Polanen Petel, M. Scheidat, H. W. G. Meesters, J. P. Verdaat, J. S. M. Cremer and E. M. Dijkman. 2009c. Zeezoogdieren in de Eems Evaluatie van de Vliegtuigtellingen van zeezoogdieren tussen oktober 2007 en september 2008. IMARES. 23 pp.Brasseur, S. M. J. M. and P. J. H. Reijnders. 1994. Invloed van diverse verstorings- bronnen op het gedrag en habitatgebruik van gewone zeehonden : consequenties voor de inrichting van het gebied. IBN-rapport 113, 70 pp, IBN, Wageningen, the Netherlands (ISSN: 0928-6888) Brasseur, S. M. J. M. and P. J. H. Reijnders. 1996. De zeehond terug op z’n bank : een haalbaarheidsstudie voor het Brielse Gat. IBN-rapport 208, 35 pp. IBN-DLO,
160 161
Seals in motion publications
Wageningen, the Netherlands. (ISSN: 0928-6888) Brasseur, S. M. J. M. and P. J. H. Reijnders. 1997. The Harbour Seal in The Netherlands. Rijksinstituut voor Kust en Zee, Den Haag. 40 pp.Brasseur, S. M. J. M., P. J. H. Reijnders, T. Borchardt, U. Siebert, M. Stede, S. Ramdohr, L. F. Jensen, J. Teilman and J. Tougaard. 2008a. Trilateral Seal Expert Group (TSEG) Aerial surveys of harbour seals in the Wadden Sea in 2008: Back to pre-epizootic level, and still Growing: Wadden Sea harbour seal population in 2008. Annual reports http://www.waddensea-secretariat.org/news/news/Seals/ Annual-reports/seals2008.html.Brasseur, S. M. J. M., P. J. H. Reijnders, T. Borchardt, U. Siebert, M. Stede, S. Ramdohr, L. F. Jensen, J. Teilman and J. Tougaard. 2011d. Trilateral Seal Expert Group (TSEG). Aerial surveys of grey seals in the Wadden Sea in 2010-2011: Continued growth, through birth and immigration. Common Wadden Sea Secretariat (CWSS) http://www.waddensea-secretariat.org/news/news/Seals/ Annual-reports/Grey Seals/greyseals2011.html.Brasseur, S. M. J. M., M. Scheidat, G. M. Aarts, J. S. M. Cremer and O. G. Bos. 2008b. Distribution of marine mammals in the North Sea for the generic appropriate assessment of future offshore wind farms. IMARES. IMARES, (Report / Wageningen Imares C046/08) - 59 p.Cremer, J. S. M., S. M. J. M. Brasseur and H. W. G. Meesters. 2012. MZI’s en zeehonden in de Waddenzee: een eerste aanzet tot een analyse. IMARES, (Rapport / IMARES Wageningen UR C133/12) - 30 p.Dedert, M., S. M. J. M. Brasseur and M. J. V. D. Heuvel-Greve. 2015. Zeehonden in het Deltagebied; populatiesontwikkeling en geperfluoreerde verbindingen. IMARES. (Rapport / IMARES Wageningen UR C178/14) - 32 p.Galatius, A., S. M. J. M. Brasseur, R. Czeck, B. Diederichs, L. F. Jensen, P. Körber, U. Siebert, J. Teilman and S. Klöpper. 2014. Trilateral Seal Expert Group (TSEG). Aerial surveys of Harbour Seals in the Wadden Sea in 2014. The highest pup count recorded yet. Common Wadden Sea Secretariate (CWSS). http://www. waddensea-secretariat.org/sites/default/files/downloads/TMAP_downloads/ Seals/harbour_seal_report_2014_b.pdf.Galatius, A., S. M. J. M. Brasseur, R. Czeck, L. F. Jensen, J. Armin, P. Körber, P. Ralf, U. Siebert, J. Teilman and S. Klöpper. 2015. Trilateral Seal Expert Group (TSEG). Aerial surveys of Harbour Seals in the Wadden Sea in 2015. Moderate impact of the 2014 influenza epidemic. Common Wadden Sea Secretariate (CWSS). .Galatius, A., S. M. J. M. Brasseur, B. Diederichs, R. Czeck, L. F. Jensen, S. Ramdohr, U. Siebert, J. Teilman and P. Körber. 2013. Trilateral Seal Expert Group (TSEG). Aerial surveys of Harbour Seals in the Wadden Sea in 2013. Is the population growth rate slowing down? Common Wadden Sea Secretariate (CWSS). http:// www.waddensea-secretariat.org/sites/default/files/downloads/TMAP_downloads/ Seals/aerial_surveys_of_harbour_seals_in_the_wadden_sea_in_2013.pdf Galatius, A., S. M. J. M. Brasseur, P. J. H. Reijnders, T. Borchardt, U. Siebert, M. Stede, S. Ramdohr, L. F. Jensen and J. Teilman. 2012. Trilateral Seal Expert Group (TSEG). Aerial Surveys of Harbour Seals in the Wadden Sea in 2012. Substantial increases in moult counts. Common Wadden Sea Secretariate (CWSS). http://www.waddensea-secretariat.org/sites/default/files/downloads/ trilateral_seal_counts_report_2012.pdf.Kamermans, P., M. Poelman, H. W. G. Meesters, I. G. D. Mesel, C. J. Smit and S. M. J. M. Brasseur. 2008. Onderzoek naar Duurzame Schelpdiervisserij (PRODUS) Eindrapport deelproject 1 c. IMARES. (Rapport / Wageningen
IMARES C075/08) - 49 pKirkwood, R. J., G. M. Aarts and S. M. J. M. Brasseur. 2015. Seal monitoring and evaluation for the Luchterduinen offshore wind farm: 2. T-construction - 2014 report. IMARES. (Rapport / IMARES Wageningen UR C152/14) - 65 p.Kirkwood, R. J., O. G. Bos and S. M. J. M. Brasseur. 2014a. Seal monitoring and evaluation for the Luchterduinen offshore wind farm 1. T0 - 2013 report. IMARES. (Report / IMARES Wageningen UR C067/14) - 47 pKirkwood, R. J., S. M. J. M. Brasseur, E. M. Dijkman and G. M. Aarts. 2014b. Use of the East Anglia Offshore windfarm area, UK, by seals tracked from the Netherlands. IMARES. 13 pp.Kirkwood, R. J. B., S.M.J.M.; Dijkman, E.M.; Aarts, G.M. . 2014. Use of the East Anglia Offshore windfarm area, UK, by seals tracked from the Netherlands. IMARES. (Report / IMARES Wageningen UR C061/14) - 13 p.Leopold, M. F., N. M. J. A. Dankers, S. M. J. Brasseur, A. Brenninkmeijer, K. S. Dijkema and C. M. Bisseling. 1997. Natuur in de zoute wateren. IKC Natuurbeheer. pp.Leopold, M. F., M. M. Scholl, R. S. a. V. Bemmelen, S. M. J. M. Brasseur, J. S. M. Cremer, S. C. V. Geelhoed, K. Lucke, S. Lagerveld and H. V. Winter. 2013. Haalbaarheidsstudie wind op zee: vijf potentiele zoekgebeiden binnen de 12-mijlszone vergeleken in relatie tot beschermde natuurwaarden. IMARES, (Rapport / IMARES Wageningen UR C132/13) - 71 pLindeboom, H. J., M. F. Leopold, N. M. J. A. Dankers, S. M. J. M. Brasseur, V. Bezemer and J. C. a. M. Bervaes. 2002. Een zeereservaat in de Voordelta als marienecompensatie voor Maasvlakte II. Alterra. (Alterra-rapport 443) - 77 p.Meesters, H. W. G., R. T. Hofstede, I. G. D. Mesel, J. a. M. Craeymeersch, C. M. Deerenberg, P. J. H. Reijnders, S. M. J. M. Brasseur and F. E. Fey-Hofstede. 2009. De toestand van de zoute natuur in Nederland : vissen, benthos en zee- zoogdieren. Wettelijke Onderzoekstaken Natuur & Milieu. Wettelijke Onder- zoekstaken Natuur & Milieu, (WOt-rapport 97) - 97 p.Meesters, H. W. G., R. Ter Hofstede, C. M. Deerenberg, J. a. M. Craeijmeersch, I. G. De Mesel, S. M. J. M. Brasseur, P. J. H. Reijnders and R. Witbaard. 2008. Indicator system for biodiversity in Dutch marine waters: Ecoprofiles of indicator species for Wadden Sea, North Sea and Delta Area. Wettelijke Onderzoekstaken Natuur & Milieu. Wettelijke Onderzoekstaken Natuur & Milieu, IMARES, (WOt-rapport 82) - 30 p.Murphy, S., S. Brasseur, K. Brensing, M. Clarke, C. Duck, S. Geelhoed, J. Haelters, A. Hall, T. Härkönen and I. Hasselmeier. 2010. Report of the Working Group on Marine Mammal Ecology (WGMME), 12-15 April 2010, Horta, The Azores. International Council for the Exploration of the Sea.Radstake, Y., G. M. Aarts, S. C. V. Geelhoed, K. Lucke, S. M. J. M. Brasseur, M. Boonstra and K. Camphuysen. 2011. Temporal variability in harbour porpoise (Phocoena phocoena) occurrence determined usning continuous passive acoustic monitoring devices.Reijnders, P., S. Brasseur and A. Brinkman. 2000a. Habitatgebruik en aantals- ontwikkelingen van gewone zeehonden in de Oosterschelde en het overige Deltagebied [Habitat use and number of harbour seals in Oosterschelde and remaining Delta area]. Alterra, (Alterra-rapport 78) - p. 56.Reijnders, P. J. H., S. M. J. M. Brasseur and A. G. Brinkman. 2000b. Habitatgebruik en aantalsontwikkelingen van gewone zeehonden in de Oosterschelde en het overige Deltagebied. Alterra, Research Instituut voor de Groene Ruimte,

162 163
Seals in motion publications
078. 56 pp.Reijnders, P. J. H., S. M. J. M. Brasseur, P. W. V. Leeuwen and C. J. Smit. 2005. Onderzoek naar vermindering van bijvangst van zeehonden in fuiken; risico- analyse voor de Oosterschelde en algemene maatregelen in Nederlandse kust- wateren. Alterra, (Alterra-rapport 1211) - 30 p..Scheidat, M., G. Aarts, A. Bakker, S. Brasseur, J. Carstensen, P. V. Leeuwen, M. Leopold, T. V. Polanen Petel, P. Reijnders and J. Teilmann. 2012. Assessment of the Effects of the Offshore Wind Farm Egmond aan Zee (OWEZ) for Harbour Porpoise (comparison T0 and T1). IMARES (Report / Offshore Wind Farm Egmond aan Zee OWEZ_R_253_T1_20120202) - 64 p.Slijkerman, D. M. E., M. F. Leopold, S. M. J. M. Brasseur, A. G. Brinkman, N. M. J. A. Dankers and W. E. V. Duin. 2008. Doelen in omvang, ruimte en tijd Noordzeekustzone. Deel A: Uitwerking instandhoudingsdoelen (versie 1.0). IMARES, (Rapport / IMARES C029/08) - 90 p.Smit, C. J., S. M. J. M. Brasseur, B. J. Ens and K. H. Oosterbeek. 2007. Effecten van schietoefeningen vanaf Fort Erfprins op natuurwaarden in het zeegat van Texel. Een inventarisatie van bestaande kennis en een voorstudie voor nader onderzoek. IMARES. (SOVON-onderzoeksrapport 2007/05) - 49 p.Smit, C. J., A. G. Brinkman, S. M. J. M. Brasseur, E. M. Dijkman, M. F. Leopold and P. J. H. Reijnders. 2003. Ecologische effecten van een derde spuimiddel in de Afsluitdijk op vogels, zeezoogdieren en beschermde habitats in de westelijke Waddenzee. Alterra. (Alterra-rapport 874) - 159 p.Werner, M. H. J., S. M. J. M. Brasseur and E. H. Ries. 1995. Habitatgebruik, activiteitspatroon en gedrag van teruggezette, gerevalideerde gewone zeehonden in de Oosterschelde : winterperiode 1993 - 1994. IBN-DLO. 70 pp.Wortelboer, F. G., F. Arts, O. G. Bos, S. M. J. M. Brasseur, A. G. Brinkman, J. a. M. Craeymeersch, C. M. Deerenberg, E. M. Dijkman, H. J. Lindeboom, H. W. G. Meesters, I. G. D. Mesel, P. J. H. Reijnders, F. J. Quirijns, R. T. Hofstede, S. V. Breukelen, W. L. T. V. Densen, W. E. V. Duin, H. M. J. V. Overzee and R. Witbaard. 2010. Natuurkwaliteit en biodiversiteit van de Nederlandse zoute wateren. Planbureau voor de Leefomgeving. 240 pp.
conFerence preSenTaTionS
Aarts, G., S. Brasseur, A. Rindorf, S. Smout, M. Dickey-Collas and J. Matthiopoulus. 2011. Spatial selection of sandeel (Ammodytes marinus) by grey seals (Halichoerus grypus). ICES Council Meeting 2011.Aarts, G. M., E. Jones, S. M. J. M. Brasseur, A. Rindorf, S. C. Smout, M. Dickey-Collas, P. Wright, D. Russell, B. J. Mcconnell, R. J. Kirkwood, M. Fedak, J. Matthiopoulos and P. J. H. Reijnders. 2014. Prey habitat model outperforms prey data in explaining grey seal distribution. 28th Annual Conference European Cetacean Society.Brasseur, S. 1993. Tolerance of harbour seals to human related disturbance sources during haulout. Pages 130 10th Bienn. Conf. Biol. Mar. Mamm.Brasseur, S. and M. Fedak. 2002. Habitat use of harbour seals in relation to recreation, fisheries, and large infra-structural works. Pages 27-31 Proceedings of the International Symposium at EcoMare, 29–30 November 2002; Texel, The Netherlands. CWSS: Management of North Sea Harbour and Grey Seal Populations.
Brasseur S., P. Reijnders, G. De Jong , R. van de Velde and H. D. Iongh. 1991. Feeding related scattered occurrence of dugongs in the Moluccas, East Indonesia. Oral presentation at the Ninth Biennial Conference on the Biology of Marine Mammals December 5-9 1991. . Chicago, Illinois.Brasseur, S. M. J. M., P.J.H. Reijnders. 1999. Behaviour of satellite tagged naive harbour seals released in the wild. 13th biennial conference Society for Marine Mammals Brasseur, S. M. J. M., P.J.H. Reijnders. 2007. Individual variation in Dutch harbour seals. 16th biennial conference Society for Marine Mammals Brasseur, S. M. J. M., T. V. Polanen Petel, G. M. Aarts, H. W. G. Meesters, E. M. Dijkman and P. J. H. Reijnders. 2009. Grey seals and Offshore Wind Farms. Den Helder, The Netherlands.Brasseur, S. M. J. M., T. V. Polanen Petel, H. W. G. Meesters, G. M. Aarts and P. J. H. Reijnders. 2014a. Seals on holiday: Expansion of the Grey Seal Population in the Dutch Wadden Sea. 28th Annual Conference European Cetacean Society, 5-9 April 2014, Liege, Belgium.Brasseur, S. M. J. M. and P. J. H. Reijnders. 2000. Radio tracking of seals - behaviour and habitat use of free ranging harbour seals. in C. M.-C. R. Hutterer ed. Deutsche Gesellschaft für Säugetierkunde und Vereniging voor Zoogdierkunde en Zoogdierbescherming, gemeinsame Tagung, ; Kurzfassungen der Vorträge un Posterdemonstrationen. Jena (Germany), p. 10. Urban & Fischer, 2000, Groningen.Brasseur, S. M. J. M. and P. J. H. Reijnders. 2001. Satellite tracking breeding harbour seal (Phoca vitulina) females in Dutch waters, diving, haulout and movement. 14th biennial conference on the biology of marine mammals; abstracts; November 28 - December 3, 2001, Vancouver B.C. Canada, p. 32.Brasseur, S. M. J. M., P. J. H. Reijnders, E. M. Dijkman and J. P. Verdaat. 2014. Monitoring harbour seals in the Dutch Wadden Sea: more than 50 years recorded recovery. 28th Annual Conference European Cetacean Society: Marine mammals as sentinels of a changing environment.Bravo Rebolledo, E. ; Franeker, J.A. van; Jansen, O.E. ; Brasseur, S.M.J.M. 2013 Plastic ingestion by harbour seals (Phoca vitulina) In: Proceedings of the 27th conference of the European Cetacean Society, Setubal, Portugal, 8-10 April 2013.- p. 331.Camalich, J., E. Svensson, L. Ijsseldijk, S. Brasseur, R. Witbaard and S. Schouten. 2014. Using stable carbon and nitrogen isotopes to study dietary habits and migrational patterns of bow caught and stranded fin whales (Balaenoptera physalus) in the Netherlands. 28th Annual Conference European Cetacean Society, 5-9 April 2014, Liege, Belgium. Cremer, J., Brasseur, S.M.J.M. ; Reijnders, P.J.H. ; Dijkman, E.M. ; Verdaat, J.P. 2014. Monitoring harbour seals in the Dutch Wadden Sea: more than 50 years recorded recovery. 28th Annual Conference European Cetacean Society, 5-9 April 2014, Liege, BelgiumEngelhard, G. H., S. M. J. M. Brasseur, A. J. Hall, D. J. Slip, H. R. Burton, M. A. Fedak and P. J. H. Reijnders. 1998. Effect of disturbance on pup weaning mass in Southern Elephant Seals. 12th Biennial Conference on the Biology of Marine Mammals Monaco.Geert Aarts, Jason Matthiopoulos, Sophie Brasseur and P. Reijnders. 2007. Spatial extrapolation of habitat preference models; a case study with British and Dutch grey seals (Halichoerus grypus). 16th biennial conference Society for Marine
164 165
Seals in motion publications
Mammals IJzer, J., R. Keesler, M. Kik, S. Brasseur, J. Verdaat, M. Smit and A. Grone. 2014. Pathology in stranded seals in the southern Wadden Sea and North Holland province, The Netherlands, 2009-2013. 28th Annual Conference European Cetacean Society, 5-9 April 2014, Liege, Belgium.Janssen, J., J. Schaminée and S. Brasseur. 1993. Nature in the Netherlands. Pages 23 Proceedings: international symposium operationalization of remote sensing.Kirkwood, R. J., S. Kirkman, J. Arnould, K. Carlyon, R. Alderman, T. Mitchell, D. Sutherland, S. M. J. M. Brasseur and G. M. Aarts. 2014. Recovering? sea populations. 28th Annual Conference European Cetacean Society.Kuiper, J., J.A. Enemark, T. Härkönen, P.J.H. Reijnders, S.M.J.M. Brasseur, A.G.Brinkman, M.Fedak, U.Siebert, A. Osterhaus, T. Kuiken, A.Bosch, F. Stafleu, B. Bovenkerk, R.Tramper, J.Vorstenbosch, F.W.A.Brom, T.Jensen, B. Reineking. 2003. Seal management Management of North Sea Harbour and Grey Seal Populations. Wadden Sea Ecosystem Proceedings of the International Symposium at EcoMare, Texel, nov.29-30, 2002. Texel.Meesters, E., P. Reijnders, S. Brasseur, S. Tougaard, M. Stede, U. Siebert and T. Härkönen. 2009. An effective survey design for harbour seals in the Wadden Sea: tuning Trilateral Seal Agreement and EU Habitat Directive requirements. Abstract. 12th International Scientific Wadden Sea Symposium.Meesters, H. W. G., P. J. H. Reijnders, S. M. J. M. Brasseur, S. Tougaard, M. Stede, U. Siebert and T. Härkönen. 2007. An effective survey design for harbour seals in the Wadden Sea: tuning Trilateral Seal Agreement and EU-Habitat Directive requirement. Pages 82 The meeting of the Trilateral Working Group TWG 07/1, Delfzijl, The Netherlands, 18 - 19 April, The Netherlands. Trilateral Working Group, Wilhelmshaven.Reijnders, P., S. Brasseur and A. Brinkman. 2002. The phocine distemper virus outbreak of 2002 amongst harbour seals in the North Sea and Baltic Sea: spatial and temporal development, and predicted population consequences. Pages 19-25 Management of North Sea harbour and grey seal populations. Proceedings of the International Symposium at Eco-Mare, Texel, The Netherlands.Roquet, F., Boehme L, Bester Mn, Bornemann H, Brasseur S, Charrassin Jb, Costa D, Fedak Ma, Guinet C, Hall A and H. R. 2016. When diving animals help us to observe the oceans: the MEOP data portal. IMDIS.Roquet, F., Boehme, L. , Bester, M. N. , Bornemann, H. , Brasseur, S. , Charrassin, J. B. , Costa, D. , Fedak, M. A. , Guinet, C. , Hall, A. , Harcourt, R. , Hindell, M. A. , Kovacs, K. M. , Lea, M. A. , Lovell, P. , Lowther, A. , Lyderson, C. Mcmahon, C. , Picard, B. , Reverdin, G. And Vincent, C. 2017. In-situ observations using tagged animals. ALPS - Autonomous and Lagrangian Platforms and Sensors, Scripps Seaside Forum La Jolla, CA, USA, 21 February 2017 - 24 February 2017.Tougaard, J., M. Scheidat, S. Brasseur, J. Carstensen, T. Van Polanen Petel, J. Teilmann and P. Reijnders. 2010. Harbour porpoises and offshore development: increased porpoise activity in an operational offshore wind farm. European Cetacean Society.
© HERcULES & vALKEMA www.ELSjE.NL
166 167
Seals in motion Acknowledgements
166
AcKNOwLEDgE MENTS
166
In 1991 (27 jaar geleden) kwam ik voor een kort contract bij het toenmalige Rijks-instituut voor Natuurbeheer (RIN), waar ik ben blijven werken, al doen de vele naamswijzigingen anders vermoeden: IBN-DLO (1992-2000), Alterra (2000-2006), IMARES (2006-2016) en nu WMR (2016–nu). Als je zolang ergens hebt gewerkt, met zoveel collega’s (binnen en buiten het instituut), studenten maar ook opdracht-gevers, opdrachtnemers en geïnteresseerden, is het bijna onmogelijk niemand te vergeten te bedanken. Daarom op voorhand: allen bedankt voor alle hulp, steun, advies, verdraagzaamheid, humor, begrip en geduld die op een of andere manier heeft bijgedragen om tot dit resultaat te komen: dank aan iedereen. Ook bedankt aan al jullie partners die het mogelijk maakten dat er tijd was om dit te doen.As it is almost impossible not to forget someone that in some way has contributed to the studies presented in this thesis: thanks to all that have helped, supported, ad-vised in the realisation of this thesis and thanks also for the humour, understanding and patience in our cooperation. Thanks also to all your partners who made sure it was possible for you to do so.
Allereerst dank aan al mijn collega’s en oud-collega’s die mij geholpen en gesteund hebben in dit werk. Het enthousiasme en de passie die ik aantrof toen ik bij het in-stituut kwam en nog steeds bij jullie zie is de grootste kracht achter het werk dat we verzetten. Zonder passie en enthousiasme zou geen enkel bedrijfsplan werken. As for my master’s thesis in 1990 I was due to study Dugongs in Indonesia, I deci-ded we needed a marine mammologist and approached Peter Reijnders for his view on the projects. I have had the pleasure and honour to work with him ever since. Peter thank you for teaching me all you know (or at least a great deal) and still letting me choose my own way, most of the time. Thanks for kicking me under the table when in a meeting I would talk too much, but not during the discussions we had as we criss-crossed through many fields of the marine mammalogy. Or as we chatted about culture, art, politics and cuisine. It was great to be introduced to the field of marine mammalogy by one of the pioneers, you knew everybody. Thanks most of all for your friendship.
More recently, I have worked intensively with Geert Aarts who is an enormous asset to marine mammalogy for his ecological, statistical and spatial capacities, but also is just a great guy to work with. Thanks, Geert for your companionship and help, I couldn’t have done it without you. I am certain one day you will get the break you deserve, and can concentrate on better understanding how seals (or animals in general) function in their environment. I am looking forward to continue to explore the details in the mountains of data we still haven’t worked through and collecting new ones to fill the gaps. Data is fun, and field work is great (especially with great food and someone to eat it).
The Seal Team consists of many more: Cheers Tamara van Polanen Petel for your fresh view on seal research and the fun times we had. Roger Kirkwood thanks for your kindness and all you did also for this thesis. I admire your unpretentious ap-proach, despite the incredible load of knowledge and experience you brought in the team. I just wish you both could have stayed longer. Jenny Cremer thank you for standing up for us and filling the gaps. Without you running the monitoring database and the GIS this would never have been written. Thanks Elze Dijkman for setting the system. You’re always welcome to join a survey. Jessica Schop, you were a great help on many fronts as a student and now as a colleague. Piet-Wim van Leeu-wen and André Meijboom you both have been there for ever: thanks for all the help in the different projects, and your incredible energy to get the job done. And later also Hans Verdaat, you are a great addition to the group. Steve Geelhoed not only for your excellent adimin. capacities in the field, Erik Meesters for your input and analytical views (not only on seal data) and Oscar Bos thanks for all the support in the team it would be great to work more with you. Frouke Fey always managed to produce great text when we needed to explain our work. And though not really into seals Willem van Duin, has been a moral support, never forgetting a birthday or anniversary. I was very sad to see both of you leave our institute.
The aerial surveys, the results of which I extensively used in this thesis, is the pro-duct of numerous hours planning, flying, counting, analysing, modelling and repor-ting. I would like to express my gratitude to all that have endeavoured to collect and archive this incredibly valuable dataset - which is one of the best long-term records for pinniped populations in the world. I thank the funding bodies, the respective ministries of the different Wadden regions and the Common Wadden Sea Secreta-riat, which supported the effort to harmonise the counts, and unify management. In each region specific departments were responsible for the actual counts. Currently these are the Ministry of Economic Affairs in the Netherlands, the Niedersäch-sisches Landesamt für Verbraucherschutz und Lebensmittelsicherheit in Lower Saxony, Nationalpark Hamburgisches Wattenmeer in Hamburg, Landesbetrieb für Küstenschutz, Nationalpark und Meeresschutz Schleswig-Holstein and The Danish Agency for Water and Nature Management. In all regions, volunteers and professio-nals have endeavoured to collect the count data every year. I am also grateful for the additional data provided for our studies: Harbour seal pup counts in Lower Saxony and Schleswig Holstein were obtained from CWSS, FTZ, Seehundaufzuchtstation Norden-Norddeich and thanks to David Steel on the Farne Islands, for exchanging data on grey seals pups that washed up along the Dutch coasts.For the Netherlands, annual flights have been carried out since the 1960s. Most impressively, almost all flights were carried out by one pilot: Aad Droog. His seal survey flying capabilities are unprecedented (undoubtfully the same counts for all
168 169
Seals in motion Acknowledgements
Aad’s flying); Aad, thank you for always being there, organising your other work around our flights, and making sure we were all comfortable and safe all these years (and I hope for quite a few more). Thank you also for the nice conversations during the many hours on board and the help in eating and drinking all the sweets and pic-nics I tend to bring. Thanks also to the other pilots that were prepared to fly in your stead on the rare occasions you could not be there. I hugely appreciate the coopera-tion and friendship of Ed and Mike de Bruin of the Texel International Airport and the Kortehoeven family (Vliegtuig Onderhoud Texel) that looked after the planes.Monitoring in the Dutch Wadden Sea started as occasional surveys initiated in the 1960’s by Jan van Haaften. In the early 1970s Peter Reijnders set up the surveys which were then carried out on a more regular basis. Peter continued the flights assisted during the 1980s by Edith Ries and in the late 1990s by myself. Our cur-rent survey team consists of Jenny, André, Hans, recently Jessica and is assisted by Jan Tjalling van der Wal. With this team we have now set up a great system, which thanks also to Elze Dijkman, is partially automated and geo-referenced. Thanks to all for the willingness to be available for the flights, even during the holidays and of course thanks for the great team I can be part of. We could not have kept the monitoring going without the continuous effort by se-veral civil servants in the ministry (currently The Ministry of Economic Affairs, but there used to be “Nature management” and even “Nature” in their title) to finance it. This includes Bernard Baerends, Sytse Braaksma, Gerrit van Brakel, Gerard Mast, Bram Streefland, Wilmar Remmelts, their colleagues and predecessors, which I have not had the honour to meet. I seriously appreciate how hard it is to uphold such a monitoring effort in the current world of efficiency and gain, and hope we can keep this up to document the further development of the seal populations in the Netherlands. This is especially crucial in the light of the recent coastal and off shore expansions of human activities, as plans are drawn to further enhance sand mining, off shore wind farming, aquaculture and fisheries, tourism, and ship traffic. I am also extremely grateful to the group of wardens currently called the “Wadden unit”, in the service of the Ministry of Economic Affairs. They form the crew of the patrol vessels the “Harder”, the “Krukel” the “Phoca” and the “Stormvogel” (re-cently exchanged for the “Asterias”). Throughout the years they have helped in the surveys by indicating new seal haul outs and when necessary provided for additio-nal counts. This was specifically the case for the crew of the “Phoca”: Jan van Dijk, Dirk Kuiper, and later Bram Fey, who collected the grey seal data in the early years. The aerial surveys would have been incomplete without their help or that of their successors on the “Phoca”: Peggy, Niels and Eelke but also John, Klaas, Freek Jan, Jan on the “Harder”, Jan, Halbe, Gribbert and Cor; and later Arjen, Bert, Chris on the “Krukel” and finally Nico, Eelke-Sybren and Theo on the “Stormvogel” and their new colleagues on the “Asterias”.
The tracking data used in this thesis consists of a compilation of data we collected for different projects. As consultants, much of the data collection is financed by so called “third parties”, though it would be unjust to only thank them for that. I am grateful that in many cases our cooperation went beyond the contractor-contracted level and would like to also express my gratitude to the individuals responsible in these cases. As mentioned above I this holds for personnel of the ministry of Economic Affairs but also for the province of Zeeland, where I would like to thank Jaap Brillman, Vera Aarden, Henk Zandstra, Bouke Bouwman. For supporting our initial tracking work thanks to Joop Marquenie (NAM). Thanks to Henk Kouwen-
hoven (Shell/Nuon) it has become clear that seals do use the coastal zone more than was believed. The organisation of We@sea facilitated our first grey seal tracking. For the work in the Eems I would like to thank Duurt Zuidema, Sjaak de Boer and the representatives of NUON and RWE. More recently, Sytske van den Akker (ENECO) and Luuk Folkerts (Gemini) but also Suzanne Lubbe and Aylin Erkman (RWS), have been instrumental to collecting data on the movements of seals in relation the off-shore windfarms, but have shown great interest in understanding more about the seals than just that. Thanks also to those that helped in procuring the permits to do the work particularly Richard Deen, Henk Denters, Ina Gjaltema, Marion Pross, Ann-Marie Mol, Luc Boerema, Marcelle Lock and Harrie Miedema.
Without the Wadden Unit we would not have be able to collect the tracking data that form the other large part of the thesis. The first tracking of seals using VHF-telemetry in the Netherlands was carried out by Ditta Ries with Peter and their catching teams. As the technology developed in the late 1990’s we switched to satel-lite transmitters developed by Wildlife Computers enabling us to follow the animals in open sea. Thanks to Melinda Holland, Ann Rupley, Roger Hill, and their crew for introducing me in the world of telemetry (and the great chocolate.). Later so called FastLoc (GPS) technology was developed by Ed Bryant. Combined with SMRU’s tags that could use the GSM phone grid we now have very complete behavioural data from the seals with exact locations. Cheers to all SMRU personnel for the help in setting our tagging system up and for being prepared to answer all my queries. Especially cheers to Phil Lovell, Mike Fedak, Simon Halliwell, Bernie McConnel, Clint Blight, and the guys from the instrumentation lab. In the field of animal ethics we had immense help from Chris Pool and Nanneke van der Wal; thanks for having my back. I am grateful for the veterinarian support from Loek van Vliet and David Tijssen. Perfecting catching methods is an ongoing process: the initial set up was developed with the help of Jan van Dijk, Dirk Kuiper and Piet-Wim, André, Koos Zegers and Aad Sleutel. Bram van Dijk and his colleagues knotted our nets so they would hang perfectly during the catch. It was great to also have the help of Paddy Pomeroy, Simon Moss and Dave Thompson in the field. For the use of their vessels and the valuable help in the field thanks to VOF van Leeuwen, duikbedrijf Hercules and the OD2 Neeltje. Thanks also to the rest of the “core team” in our current cat-ches: Piet-Wim, André, Geert, Hans, Steve, Jessica, Erika Koelemij, Cor Sonneveld, Simon de Vries, Arnold Bakker, Maarten Van Hoppen and former catches: Tamara, Roger, Elisa Bravo Rebolledo and Okka Bangma. Thanks also to the colleagues, stu-dents and volunteers in the collection and analysis of the data: Anja, Emiel, Jacco, Ad, Jack, Santi, Jakob, Tammo, Joke, Gerda, Olvin, Niamh, Sebastiaan, Jaime, Dana, Jerome, Kees, Kees, Lonneke, Sytske, Bram, Ingrid, Aad, Marjolein, Johan, Flip, Maarten, Henk, Anke, Henne, Thierry, Tjitske, Martine, David, Maureen, Edwin, Esmé, Gert, Evert, Jeroen, Nadine, Wendy, Chantal, Bas, Wendy, Eveline, Eileen, Jasper. Thanks also to everyone that has helped and advised in all kinds of ways: Jooske IJzer, Jaap van der Hiele, Ecomare personnel, particularly Mariette Smit, Salko de Wolf and Henk Brugge, and the personnel of Zeehondencentrum Pieter-buren specifically Ana Rubio Garcia and Arnout de Vries. Salko special thanks for the cover-photo!
I could not have done this without the support and understanding of the many friends outside work. Jeroen, Gert, Marcus, Peet en Vic onze onregelmatige ontmoetingen zijn altijd geweldig. Ik blijf hopen dat we elkaar vaker kunnen
170 171
Seals in motion Acknowledgements
zien. Vanaf onze studie tijd hebben jullie me op allerlei manieren geholpen, ook al was het soms alleen met een praatje aan de telefoon. Margriet en Simon, mijn oude huisgenootjes, wanneer we elkaar weer eens zien is het alsof we nooit uit de Padangstraat zijn vertrokken. Zoen ook aan jullie geweldige dochter, Sophie. Dank jullie Theo, Irene, Sou-li, Storm en Kato voor onze regelmatige thema diners die altijd veel meer zijn dan alleen voedsel. En Theo (mijn toetermaat) dank voor je ongelofelijk geduld met mijn mediocre sax talent. Maria, dank zij jou kon ik nog meer tijd aanmijn proefschift werken. Erk bedankt voor de geweldige werkkamer en Annemarie ik verheug me op het feest. Arthur dank voor je attente bezoekjes en verhalen. Marleen, bedankt voor alle morele steun van jou en Gert Jan ondanks de ongelofelijke zware tijden. Frank-Marieke-Nilas (of was het nu andersom?): jullie zijn geweldige vrienden dank voor de warmte, humor en blijdschap jullie brengen. Erik and Riksta, Marte, Remmelt and Pyter: bedankt voor al die jaren vriendschap en steun; wat er ook gebeurt jullie zijn er. Nu weer met Erik als één van mijn para-nymfen. Veel dank ook aan de lieve Robbert Kamphuis die van mijn proefschrift een kunstwerkje heeft gemaakt.
To my parents and brothers and sisters: an incredible thanks for a magical youth and adventures throughout the world. It is great that Donatienne can help me as my paranymphe, also with the less scientific parts of my doctorate. Papa et ma-man, sans vous je ne serais jamais arrivée ou je suis. C’est grâce à vous que j’ai eu le courage de m’y mettre à l’école, à mes études, mon travail et maintenant ma thèse, même quand d’autres pensait ou me disait que je n’en serait pas capable. C’est un dont incroyable que je souhaite a tout parents de pouvoir donner, merci. Aan de hele familie Hercules: ontzettend bedankt voor alle begrip en steun, ik had me geen betere schoonfamilie kunnen bedenken. Dank ook aan Annie en Charles die mij tot het laatste moment hebben gesteund.
Felix en Josephine bedankt voor alle steun en hulp en bedankt dat jullie mijn niet altijd perfecte huisvrouw-kunst accepteren (maar wie zou dat willen?). Bovenal bedankt dat jullie er zijn. Jullie zijn geweldige kinderen en ik sta dagelijks versteld van jullie kracht en vermogen dingen te leren en verzinnen, jullie kunnen alles wat je zou willen. Eric, jij bent al 34 jaar mijn maatje, mijn vriend en mijn man. Bedankt dat je voor mij bent verhuisd naar Texel waar je nu, denk ik, beter bent ingeburgerd dan ik. Dank zij jou heb ik twee geweldige kinderen en een fantastisch leven ook buiten mijn werk. Ook bedankt voor de hulp in mijn werk: ook voor dit proefschrift kon ik putten uit je schrijfervaring en tips. Belangrijk waren ook de discussies waar-door het me, na wat sparren met jou, beter lukte te focussen in een betoog. Bovenal bedankt dat je er bent.
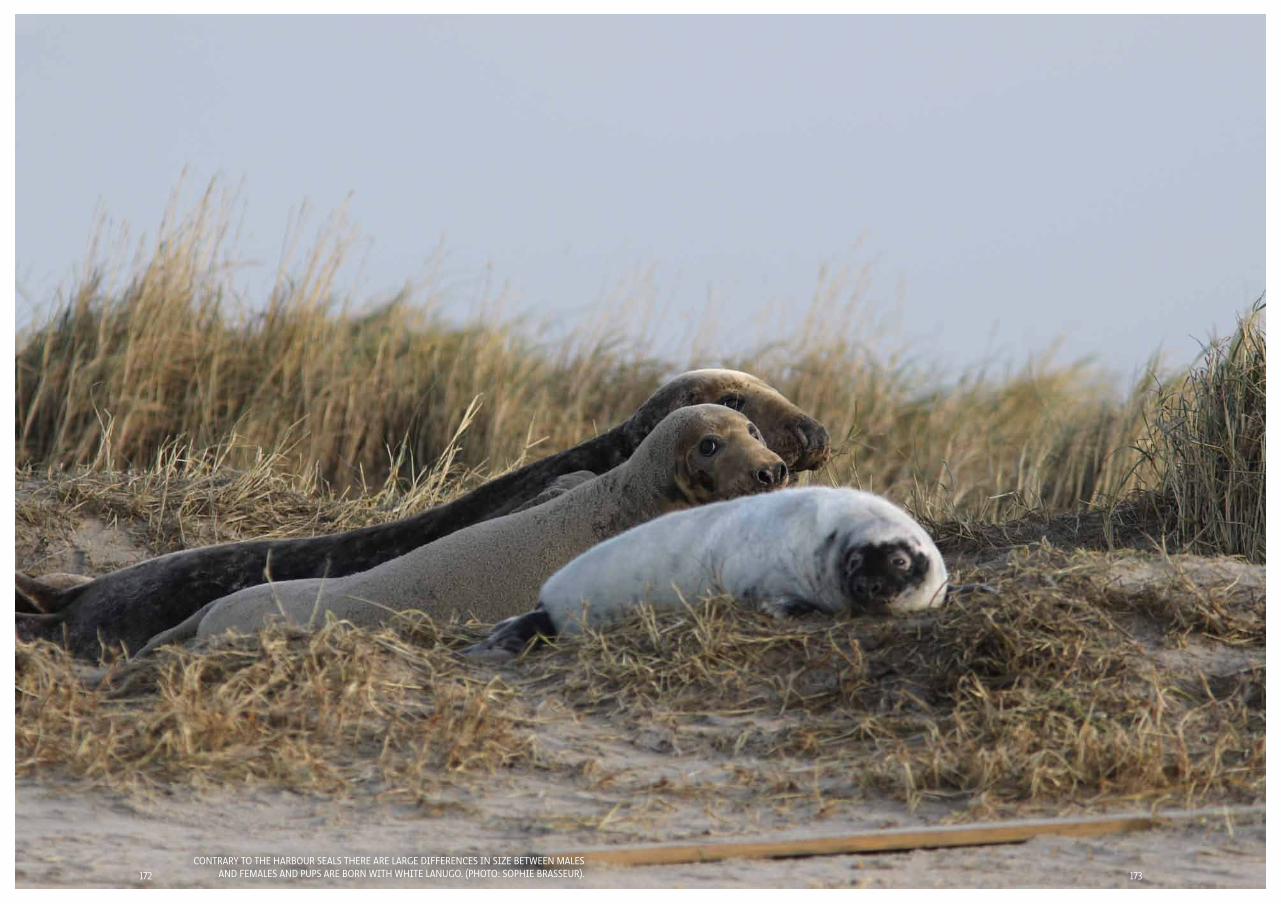
173172conTrary To The harBour SealS There are large DiFFerenceS in Size BeTWeen MaleS
anD FeMaleS anD pupS are Born WiTh WhiTe lanugo. (phoTo: Sophie BraSSeur).
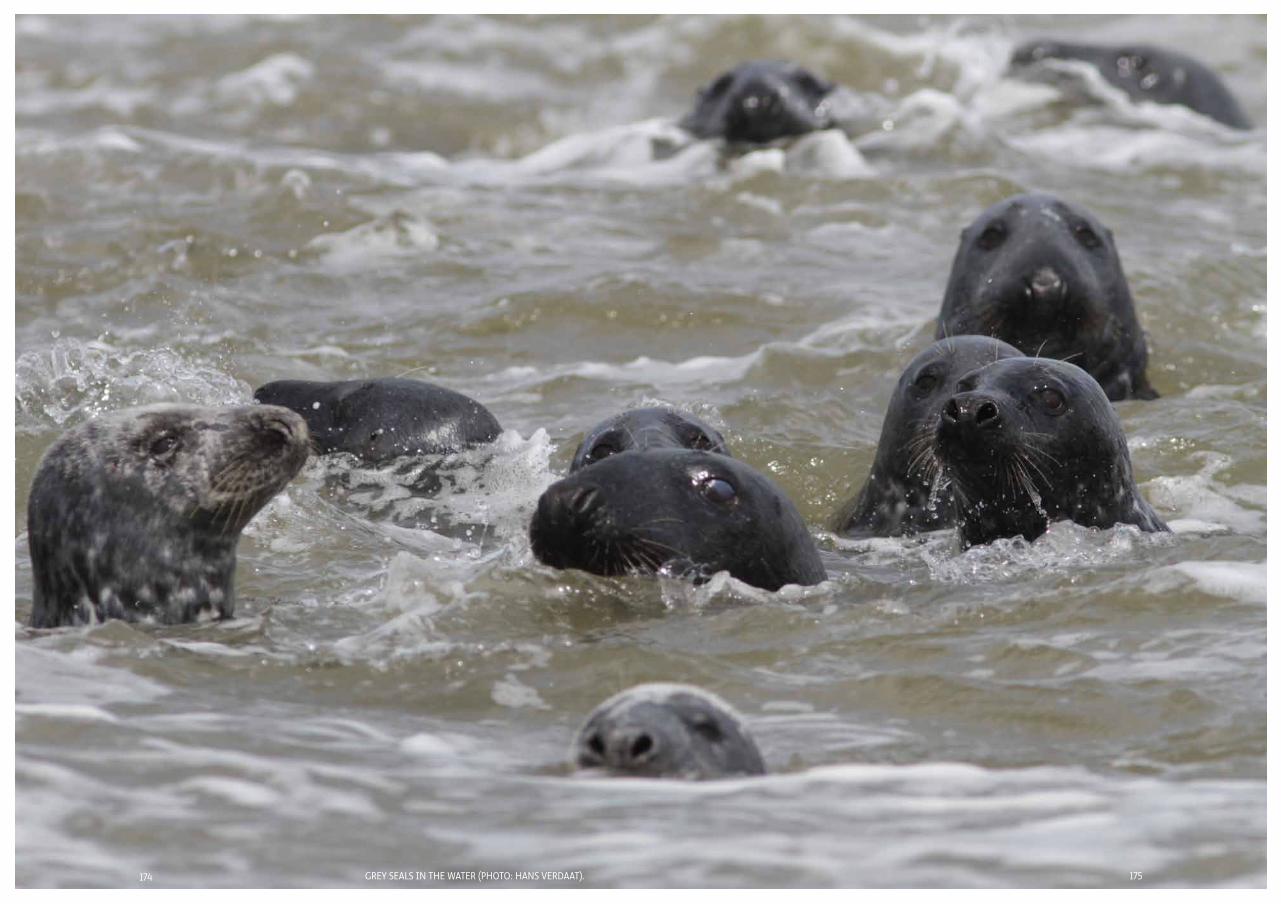
174 175
Seals in motion hoofdstuk
174 grey SealS in The WaTer (phoTo: hanS VerDaaT). 175

176
Seals in motion
176 SealS are releaSeD aBouT one hour aFTer Being caughT (phoTo: anDré MeiJBooM).
colofon
coverphoto Skin of harbour seal (photo: Salko de Wolf) design www.robbertkamphuis.nlseal in motion Gerben Valkemafonts Minion Pro (designed by Robert Slimbach) and Ratio Display (designed by ps.type)paper 90 grs Biotop3 chlorine free (TCF) paper without any optical brightening agents (OBAs) and FSC certificateprinted by GVO, Ede