Agricultural Systems - WUR eDepot
20
Agricultural Systems 198 (2022) 103391 Available online 28 February 2022 0308-521X/© 2022 The Authors. Published by Elsevier Ltd. This is an open access article under the CC BY license (http://creativecommons.org/licenses/by/4.0/). Bioeconomic evaluation of extended season and year-round tomato production in Norway using supplemental light Muhammad Naseer a, * , Tomas Persson a , Isabela Righini b , Cecilia Stanghellini b , Henk Maessen a , Peter Ruoff c , Michel J. Verheul a a NIBIO, Norwegian Institute of Bioeconomy Research, NO-1431 Ås, Norway b Wageningen UR Greenhouse Horticulture, P.O. Box 644, 6700, AP, Wageningen, the Netherlands c Centre for Organelle Research, University of Stavanger, Stavanger, Norway HIGHLIGHTS G R A P H I C A L ABSTRACT • A simulation model was applied to evaluate greenhouse design elements with artificial light in Norway; • The economic and environmental per- formance of extended season and year round tomato production was determined; • Observed temperature, CO 2 -concentra- tion and yield were predicted fairly accurately; • For year-round, the design with day and night thermal screens, heat pump and top and inter-lighting LED had the highest NFR; • High-tech energy saving equipment has better results for greenhouse tomato production in colder regions than stan- dard designs. A R T I C L E INFO Editor: Dr. Emma Stephens Keywords: Artificial light CO 2 emissions Economic analysis Greenhouse Optimum resource use Profit maximization ABSTRACT CONTEXT: For high latitude countries like Norway, one of the biggest challenges associated with greenhouse production is the limited availability of natural light and heat, particularly in winters. This can be addressed by changes in greenhouse design elements including energy saving equipment and supplemental lighting, which, however, also can have a huge impact on investments, economic performance, resources used and environmental consequences of the production. OBJECTIVE: The study aimed at identifying a greenhouse design from a number of feasible designs that generated highest Net Financial Return (NFR) and lowest fossil fuel use for extended seasonal (20th January to 20th November) and year-round tomato production in Norway using different capacities of supplemental light sources as High Pressure Sodium (HPS) and Light Emitting Diodes (LED), heating from fossil fuel and electricity sources and thermal screens by implementing a recently developed model for greenhouse climate, tomato growth and economic performance. METHODS: The model was first validated against indoor climate and tomato yield data from two commercial greenhouses and then applied to predict the NFR and fossil fuel use for four locations: Kise in eastern Norway, * Corresponding author. E-mail address: [email protected] (M. Naseer). Contents lists available at ScienceDirect Agricultural Systems journal homepage: www.elsevier.com/locate/agsy https://doi.org/10.1016/j.agsy.2022.103391 Received 12 July 2021; Received in revised form 29 January 2022; Accepted 22 February 2022
-
Upload
khangminh22 -
Category
Documents
-
view
0 -
download
0
Transcript of Agricultural Systems - WUR eDepot

Agricultural Systems 198 (2022) 103391
Available online 28 February 20220308-521X/© 2022 The Authors. Published by Elsevier Ltd. This is an open access article under the CC BY license (http://creativecommons.org/licenses/by/4.0/).
Bioeconomic evaluation of extended season and year-round tomato production in Norway using supplemental light
Muhammad Naseer a,*, Tomas Persson a, Isabela Righini b, Cecilia Stanghellini b, Henk Maessen a, Peter Ruoff c, Michel J. Verheul a
a NIBIO, Norwegian Institute of Bioeconomy Research, NO-1431 Ås, Norway b Wageningen UR Greenhouse Horticulture, P.O. Box 644, 6700, AP, Wageningen, the Netherlands c Centre for Organelle Research, University of Stavanger, Stavanger, Norway
H I G H L I G H T S G R A P H I C A L A B S T R A C T
• A simulation model was applied to evaluate greenhouse design elements with artificial light in Norway;
• The economic and environmental per-formance of extended season and year round tomato production was determined;
• Observed temperature, CO2-concentra-tion and yield were predicted fairly accurately;
• For year-round, the design with day and night thermal screens, heat pump and top and inter-lighting LED had the highest NFR;
• High-tech energy saving equipment has better results for greenhouse tomato production in colder regions than stan-dard designs.
A R T I C L E I N F O
Editor: Dr. Emma Stephens
Keywords: Artificial light CO2 emissions Economic analysis Greenhouse Optimum resource use Profit maximization
A B S T R A C T
CONTEXT: For high latitude countries like Norway, one of the biggest challenges associated with greenhouse production is the limited availability of natural light and heat, particularly in winters. This can be addressed by changes in greenhouse design elements including energy saving equipment and supplemental lighting, which, however, also can have a huge impact on investments, economic performance, resources used and environmental consequences of the production. OBJECTIVE: The study aimed at identifying a greenhouse design from a number of feasible designs that generated highest Net Financial Return (NFR) and lowest fossil fuel use for extended seasonal (20th January to 20th November) and year-round tomato production in Norway using different capacities of supplemental light sources as High Pressure Sodium (HPS) and Light Emitting Diodes (LED), heating from fossil fuel and electricity sources and thermal screens by implementing a recently developed model for greenhouse climate, tomato growth and economic performance. METHODS: The model was first validated against indoor climate and tomato yield data from two commercial greenhouses and then applied to predict the NFR and fossil fuel use for four locations: Kise in eastern Norway,
* Corresponding author. E-mail address: [email protected] (M. Naseer).
Contents lists available at ScienceDirect
Agricultural Systems
journal homepage: www.elsevier.com/locate/agsy
https://doi.org/10.1016/j.agsy.2022.103391 Received 12 July 2021; Received in revised form 29 January 2022; Accepted 22 February 2022
Agricultural Systems 198 (2022) 103391
2
Mære in mid Norway, Orre in southwestern Norway and Tromsø in northern Norway. The CO2 emissions for natural gas used for heating the greenhouse and electricity used for lighting were calculated per year, unit fruit yield and per unit of cultivated area. A local sensitivity analysis (LSA) and a global sensitivity analysis (GSA) were performed by simultaneously varying the energy and tomato prices. RESULTS AND CONCLUSIONS: Across designs and locations, the highest NFR for both production cycles was observed in Orre (116.9 NOK m− 2 for extended season and 268.5 NOK m− 2 for year-round production). Fossil fuel was reduced significantly when greenhouse design included a heat pump and when extended season pro-duction was replaced by a year-round production. SIGNIFICANCE: The results show that the model is useful in designing greenhouses for improved economic performance and reduced CO2 emissions from fossil fuel use under different climate conditions in high latitude countries. The study aims at contributing to research on greenhouse vegetable production by studying the effects of various designs elements and artificial lighting and is useful for local tomato growers who either plan to build new greenhouses or adapt existing ones and in policy formulation regarding incentivizing certain greenhouse technologies with an environmental consideration or with a focus on increasing local tomato production.
1. Introduction
Efficient use of energy, effects on the environment and competi-tiveness of the production process are inherent challenges for the agri-culture sector (Pinho et al., 2012). The use of fossil fuel continues to rise at the global level in this sector and has numerous environmental and social consequences, notably significant greenhouse gas emissions (GHG) (Lamb et al., 2016). A recent report by The Food and Agriculture Organization of the United Nations (FAO) (2020) states that in 2017, the percentage contribution of agriculture to world CO2eq emissions from all human activities was 20%. The anthropogenic pressures along with an increase in the demand for food require energy intensive methods that between 1989 and 2009 have led to the decrease in energy use efficiency (Martinho, 2016). The high dependence of the agricultural sector on energy resources can also make it vulnerable to the fluctuating global energy prices (Taki et al., 2018). Thus, efficient use of energy in food production systems could at the same time reduce their negative environmental impact and increase their economic viability (Rohani et al., 2018). Such positive effects from increased energy use efficiency could be particularly significant for greenhouse production in northern latitude countries whose climatic conditions often necessitate the use of energy intensive methods due to the shortage of light and heat during the winter season. Norway is one of those countries in which short growing seasons and low availability of light and heat, particularly in the winter months, limit the ability to produce fresh greenhouse vege-tables and fruits. According to the data from Statistics Norway, the to-mato production decreased from 13,763 t in 2014 to 10,574 t in 2017 (Statistics Norway, 2021). Nonetheless, there is high demand and pref-erence for locally produced fruits and vegetables in the Norwegian market (Bremnes et al., 2019) highlighting the need to make local production efficient.
Protected cultivation in greenhouses, as a means to increase the production per area and extend the production period, can include the use of artificial lighting, heating, cooling and CO2-enrichment in addi-tion to wind and rain protection, depending on the type of crop and its needs (Gupta and Agarwal, 2017; Tap, 2000). An added benefit of protected cultivation is that it enables increased efficiency and variation of resources according to the specific crop needs. This includes efficient use of technologies related to artificial light, heating, cooling, and sup-ply of CO2 (Hemming, 2009). Artificial light has been used in green-houses since the early twentieth century, primarily to extend the production season of vegetable and fruit production (Pinho and Hal-onen, 2017; Pan et al., 2019). Such an extension of the production season by artificial light to fall, winter and early spring season when natural light limits production is especially relevant in high latitude regions (Verheul et al., 2012; Pinho and Halonen, 2017). Annual yield increase of 100 kg m− 2 year− 1 (from 40 to 140 kg) with artificial light has been reported for tomato greenhouse production at the 59th parallel north (Verheul et al., 2012; Paponov et al., 2020). Still, only limited production takes place during the winter season from November to
March, with a partial or total dependence on artificial light (Verheul et al., 2012).
The use of supplemental light in greenhouses ensures that electric energy is converted into light and convective heat. For the most part, high pressure sodium (HPS) lamps and light emitting diode (LED) lamps are in use within greenhouses. The efficiency, which is expressed as photosynthetic active radiation (PAR) output per unit of input electric energy, is higher for the latter lamp type (Persoon & Hogewoning, 2014). Moreover, HPS lamps exchange more infra-red, thermal radia-tion, causing higher temperatures on plants and in the greenhouse air, while LED lamps facilitate cooling and thus loose comparatively more heat through convection. Owing to the high temperatures that the HPS lamps can attain, they are used as top lights i.e., well above the canopy, while the LEDs can be used as both top and between the canopy as inter- lighting.
The capacity of greenhouse lamps can be evaluated by the photo-synthetic photon flux densities (PPFD) (μmol m− 2 s− 1) that they emit, and which can be used by the plants. Previous studies on greenhouse production in high latitude regions recommend lighting capacities of up to 300 μmol m− 2 s− 1 (Moe et al., 2005), whereas currently, capacities of up to 322 μmol m− 2 s− 1 are in use as top lights in the Norwegian greenhouses (Righini et al., 2020) as measured below the lamps and above the plants’ heights.
Nonetheless, despite the ability to regulate inputs such as light, heat and CO2 to specific crop demand in greenhouse production, such pro-duction still requires large amounts of energy. Greenhouses are energy intensive, with energy as a pre-requisite component that is used throughout the production process, from seed plantation to crop har-vesting, and is heavily dependent on fossil fuels (Woods et al., 2010). An increase in artificial light use from current level would further increase the energy use in the greenhouse sector should there be no significant increase in the energy use efficiency. Production designs of greenhouses, which increase the energy use efficiency and can be combined with artificial light, could potentially increase the profitability for individual growers as well as for the horticultural sector in Norway as a whole, while at the same time decrease the negative environmental impact (Verheul et al., 2012). Such production designs could include altered greenhouse construction types as well as different energy sources and production seasons.
Different studies focus on different aspects of the production process, such as prediction of crop yield, optimization of light strategies in greenhouses for different crops using a variation in artificial light, including High-Pressure Sodium (HPS) and Light Emitting Diodes (LED), CO2 enrichment, and heating and cooling. Slager et al. (2014) developed a model to evaluate the productivity and economic feasibility of greenhouse production of tomato crop and algae with a focus on Dutch conditions without the use of artificial lighting. Some studies have incorporated various optimization techniques using algorithms (the iterative search (IS) and genetic algorithm (GA), ant colony optimization (ACO)) in order to determine the optimum values for artificial light and
M. Naseer et al.

Agricultural Systems 198 (2022) 103391
3
the energy used for lamps for greenhouse production (Mahdavian and Wattanapongsakorn, 2017; Xin et al., 2019). Likewise, the GroIMP modelling platform has been used for evaluating different light strate-gies to reduce the energy use by using a 3D light model in conjunction with a 3D tomato model (de Visser et al., 2014). Likewise, Righini et al. (2020) added artificial lighting and heat harvesting to a greenhouse production model by Vanthoor et al. (2011a, 2011b) in order to validate the model for northern climatic conditions. Naseer et al. (2021) applied the model by Vanthoor et al. (2011a, 2011b, 2012) and adapted different design elements with respect to local climatic conditions to provide an economic and environmental analysis of greenhouse sea-sonal (from mid-March to mid-October) tomato production for northern climates such as Norway. Another recent study on the optimisation of supplemental light against the net financial return (NFR) in greenhouse production in the Norwegian conditions has found the optimum ca-pacities of supplemental lighting to be in the range of 256 to 341 μmol m− 2 s− 1 (Wacker et al., 2022).
Currently most of the greenhouse tomato production in Norway takes place in the south-eastern part of the country (Statsforvalteren i Rogaland, 2019) but other greenhouse vegetables such as cucumbers are to a larger extent produced in other regions of the country (https://www .hridir.org/countries/norway/index.htm). The conditions for green-house production with additional light vary considerably between re-gions within Norway. Firstly, there are large geographic differences in the outdoor climate, which potentially can have large effect on both the profitability of the production, and the use of energy and emissions of greenhouse gases. These climatic differences could also mean that the suitability of different greenhouses varies between regions. Moreover, the price of electricity, which in Norway is mostly generated from hy-dropower plants, can vary considerably within the country (Hofstad et al., 2021; Norwell, 2021). To understand the advantages and disad-vantages of different greenhouses, production regimes and locations in Norway and hence the prospects of a geographic differentiation of the artificial light-based tomato greenhouse production in Norway, there is a need for further analyses about how the variation in climate and electricity price affects greenhouse tomato production with artificial light.
In our present study, we evaluated different artificial lighting stra-tegies along with design elements in order to determine the impact of the greenhouse design on the Net Financial Return (NFR), energy use and CO2 emissions for extended season (ES) (from 20th January to 20th November) and year-round (YR) tomato production in several different climate conditions including 4 locations in Norway, thereby identifying suitable greenhouse designs. The study was performed by applying the model by Vanthoor et al. (2011a, 2011b) as modified by Righini et al. (2020) comparing different sets of plausible design elements, green-house climate management, light types (LED, HPS) and PPFD gradients. The study also took into account seasonal tomato price differences.
2. Material and methods
2.1. Model overview
The study was based on the model by Vanthoor (2011), and later modified by Righini et al. (2020), in order to identify a greenhouse that generates the maximum profit while reducing the energy use for the production of tomatoes under Norwegian climatic conditions. The applied model comprises of three inter-connected modules including a greenhouse climate module, a crop yield module and an economic module and reproduces the hourly indoor climate conditions of the greenhouse, growth and yield of the tomato crop, and the greenhouse resources used. As a result, it calculates the yearly NFR. The original model as developed by Vanthoor (2011) and its parameter settings have been validated for different climatic conditions including mild and extreme temperature conditions as well as non-optimal and long-term diurnal temperature variations, including indoor temperature and CO2
and tomato yield data from a greenhouse in southwestern Norway (Naseer et al., 2021). The adaptation to greenhouses with artificial light and heat pumps were developed and validated for Norwegian conditions by Righini et al. (2020). See Vanthoor (2011), Righini et al. (2020) and Naseer et al. (2021) for further details about model developments and validations. We considered the validated parameter settings represen-tative of the conditions included here and hence did not perform any additional model validations.
The indoor climate of the greenhouse and the resource usage are determined by the climate module based on the effects of the outdoor climate, indoor temperature set-points, CO2-concentration, humidity, and the greenhouse design elements and calculated in the greenhouse climate module. While the crop yield module determines the growth and yield of the tomato crop based on the indoor climate, the economic module predicts the NFR of the production, which is influenced by the resources used and the yield of the crop. For a more detailed explanation see Vanthoor et al. (2012). Equations for artificial light were obtained from Righini et al. (2020).
2.1.1. Economic module The following equation is used to calculate the yearly net financial
return PNFR (NOK m− 2 year− 1):
PNFR(tf)= − Cfixed +
∫ t=tf
t=t0QCropYield − CVar
(NOKm− 2 Year− 1 ) (1)
where t0 and tf denote the beginning and the end of the production season respectively, Cfixed (NOKm− 2Year− 1) represents the fixed costs for investments for greenhouse structure, artificial lights ((LED, HPS), which includes bulbs, fixtures and cables), climate computer, cooling system, heating system and structure (i.e. construction elements) and maintenance and interest costs, CVar (NOKm− 2Year− 1) denotes the var-iable costs including costs for the resources used, labor costs and other production related costs (plant material, slabs, crop protection equip-ment), while QCropYield (NOKm− 2Year− 1) represents the economic value of the crop yield.
2.1.1.1. Fixed costs. The annual fixed costs are determined on the basis of the entire investments of the construction elements and the interests, Cfixed(NOKm− 2Year− 1), which also include costs for maintenance and depreciation. Moreover, the costs for the artificial lights depend on the kind of light used (LED or HPS) and their depreciation costs depend on how much they are used. Fixed costs are calculated by:
Cfixed = Cinterest +∑N
i=1Cconstruction,i +CRem
(NOK m− 2year− 1) (2)
where Cinterest (NOKm− 2Year− 1) denotes the interest costs of the entire investments, i stands for the construction elements, and N denotes the overall set of design elements used in the construction of the green-house. Cconstruction(NOKm− 2Year− 1) represents the depreciation and maintenance costs and CRem (NOKm− 2Year− 1) represents the remaining costs of construction and equipment. For a detailed explanation of how the interests, costs of construction elements and remaining costs are calculated, see Vanthoor et al. (2012). The fixed costs associated with the design elements used in our study are shown in Table 1.
2.1.1.2. Variable costs. The variable costs are the costs for the plants and plant materials (including slabs, fertigation), water usage, CO2, the types of energy used (fossil fuel and electricity) and are denoted by:
Cvar = Cplant + CWater + CCO2 + CFossil fuel + CElectricity(NOKm− 2h− 1) (3)
where Cplant
(NOKm− 2h− 1
)represents the costs related to the produc-
tion (labour, packaging, sales, bumblebees for pollination and the pro-
tection of crops), CWater
(NOKm− 2h− 1
)represents the costs for the usage
M. Naseer et al.

Agricultural Systems 198 (2022) 103391
4
of water and CCO2
(NOKm− 2h− 1
)denotes the costs for pure CO2,
CFossil fuel
(NOKm− 2h− 1
)denotes the costs for the natural gas used and
CElectricity
(NOKm− 2h− 1
)represents the costs for electricity used in
heating, cooling and artificial lighting in the greenhouse. The variable costs used for our study are shown in Table 2. For details about how the equations for the variable costs are calculated, see Vanthoor et al. (2012).
2.2. Selected locations, description of evaluated greenhouses and greenhouse climate controls
In order to determine the greenhouse design that accrued the highest NFR and the lowest use of energy, we used the model summarized in the previous section for two scenarios: 1. Extended seasonal production (from 20th January to 20th November), and three combinations of design elements with the addition of LED inter-lighting, and 2. Year- round production and three combinations of greenhouse design ele-ments with multiple light strategies including HPS and LED with various
power capacities. Two inter-plantings of tomato production were considered for year-round production, however, for the simulation the leaf area index (LAI) of 3 was kept constant, and the initial crop stages were adjusted accordingly. Information about the locations, greenhouse structure and settings, and economic settings are explained in the following sections along with a detailed explanation of the different design elements.
2.2.1. Selected locations The suitability for extended season and year round greenhouse
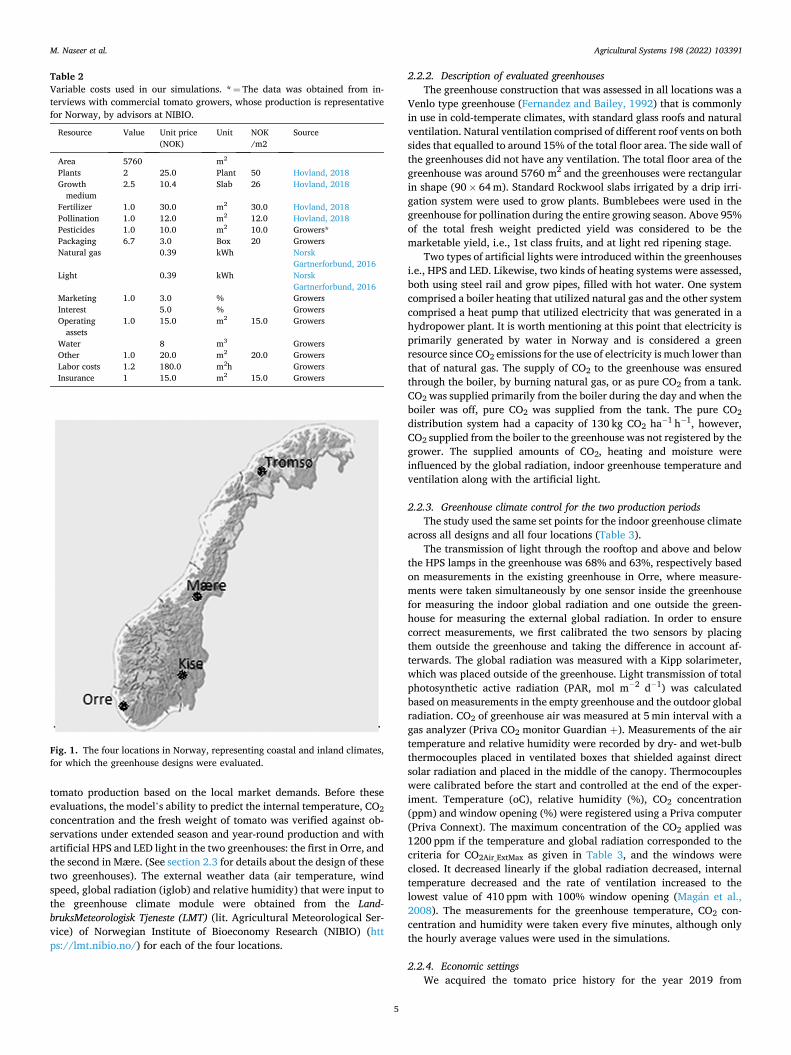
production of tomatoes under conditions representing Norway was evaluated against the NFR, energy use and CO2 emissions from fossil fuel for four locations across the country that included Orre in southwestern (SW) Norway (lat. 58.71, long. 5.56, alt. 18 m a.s.l.), Kise in eastern (E) Norway (lat. 60.46, long. 10.48, alt. 130 m a.s.l.), Mære in mid (M) Norway (lat. 63.43, long. 10.40, alt. 18 m a.s.l.), and Tromsø in northern (N) Norway (lat. 69.65, long. 18.96, alt. 60 m a.s.l.) (Fig. 1.). These lo-cations represent different light conditions and coastal and inland cli-mates (Fig. 2.). Moreover, the regions around these locations have existing tomato production or may have the possibility of greenhouse
Table 1 The fixed costs associated with the greenhouse design elements and element alternatives. ej in the second column represent the number for each design element option. E* = 10% extra costs for transportation expenses and exchange rate (7th Column). Growers** = The data was obtained from interviews with commercial tomato growers, whose production is representative for Norway, by advisors at NIBIO.
Design element/Fixed costs ej Investment (NOK m− 2)
Investment (NOK unit− 1)
Depreciation (% year− 1)
Maintenance (% year− 1) Construction (NOK m− 2 year− 1)
Source
Structure Vermeulen (2016) +E*
Venlo 5760 m2 519.0 5.0 0.5 28.5
Covers Growers** Glass 93.5 5.0 0.5 5.1 Day screen 2 35.5 25 0 8.7 Night screen 3 100 15 5 15.5 Structure screens 130 7.0 5 10.5
Boiler Vermeulen (2016) + E*
Boiler: 0.5 MW 1 620,530 7.0 1 9.0 Boiler: 1.12 MW 2 660,000 7.0 1 9.3 Heating pipes 65 5.0 0.5 3.8 Grow pipe 45 5.0 0.5 2.5
Mechanical Heating Vermeulen (2016) + E*
No 1 0 0.0 0 0.0 Mechanical heat and cool: 25 W/m2unit− 1 2 2,688,000 7.0 2 37.0
Cooling systems Vermeulen (2016) + E*
No 1 0 0 0 0 0 Fogging: 200 g h− 1 m− 2 2 65 7.0 5 5
CO2 supply Vermeulen (2016) + E*
Pure: 130 kg ha− 1 h− 1 1 48,763 10.0 0 0.9 CO2: from boiler 2 31,700 10 5 0.6 CO2distribution system 5 10.0 5 0.7
Remaining costs for irrigation, crop protection, internal transport Growers Crop protection 50,000 10.0 5 1.3 Packaging and sorting 150,000 5 5 3.1 Emergency power supply 80,000 7 7 2.2 Water collection tank 250,000 7 5 5.2 Fertilizer system 150,000 7 5 3.1 Gutters 70 7 1 5.6
Artificial lighting Growers HPS bulbs NOK/W 0.3 36*106h 1 HPS fixture NOK/W 2.13 15 1 HPS cable NOK/W 0.25 10 1 LED fixture NOK/W 12.9 126*106h 0.5 LED cable NOK/W 0.25 10 1
M. Naseer et al.
Agricultural Systems 198 (2022) 103391
5
tomato production based on the local market demands. Before these evaluations, the model’s ability to predict the internal temperature, CO2 concentration and the fresh weight of tomato was verified against ob-servations under extended season and year-round production and with artificial HPS and LED light in the two greenhouses: the first in Orre, and the second in Mære. (See section 2.3 for details about the design of these two greenhouses). The external weather data (air temperature, wind speed, global radiation (iglob) and relative humidity) that were input to the greenhouse climate module were obtained from the Land-bruksMeteorologisk Tjeneste (LMT) (lit. Agricultural Meteorological Ser-vice) of Norwegian Institute of Bioeconomy Research (NIBIO) (htt ps://lmt.nibio.no/) for each of the four locations.
2.2.2. Description of evaluated greenhouses The greenhouse construction that was assessed in all locations was a
Venlo type greenhouse (Fernandez and Bailey, 1992) that is commonly in use in cold-temperate climates, with standard glass roofs and natural ventilation. Natural ventilation comprised of different roof vents on both sides that equalled to around 15% of the total floor area. The side wall of the greenhouses did not have any ventilation. The total floor area of the greenhouse was around 5760 m2 and the greenhouses were rectangular in shape (90 × 64 m). Standard Rockwool slabs irrigated by a drip irri-gation system were used to grow plants. Bumblebees were used in the greenhouse for pollination during the entire growing season. Above 95% of the total fresh weight predicted yield was considered to be the marketable yield, i.e., 1st class fruits, and at light red ripening stage.
Two types of artificial lights were introduced within the greenhouses i.e., HPS and LED. Likewise, two kinds of heating systems were assessed, both using steel rail and grow pipes, filled with hot water. One system comprised a boiler heating that utilized natural gas and the other system comprised a heat pump that utilized electricity that was generated in a hydropower plant. It is worth mentioning at this point that electricity is primarily generated by water in Norway and is considered a green resource since CO2 emissions for the use of electricity is much lower than that of natural gas. The supply of CO2 to the greenhouse was ensured through the boiler, by burning natural gas, or as pure CO2 from a tank. CO2 was supplied primarily from the boiler during the day and when the boiler was off, pure CO2 was supplied from the tank. The pure CO2 distribution system had a capacity of 130 kg CO2 ha− 1 h− 1, however, CO2 supplied from the boiler to the greenhouse was not registered by the grower. The supplied amounts of CO2, heating and moisture were influenced by the global radiation, indoor greenhouse temperature and ventilation along with the artificial light.
2.2.3. Greenhouse climate control for the two production periods The study used the same set points for the indoor greenhouse climate
across all designs and all four locations (Table 3). The transmission of light through the rooftop and above and below
the HPS lamps in the greenhouse was 68% and 63%, respectively based on measurements in the existing greenhouse in Orre, where measure-ments were taken simultaneously by one sensor inside the greenhouse for measuring the indoor global radiation and one outside the green-house for measuring the external global radiation. In order to ensure correct measurements, we first calibrated the two sensors by placing them outside the greenhouse and taking the difference in account af-terwards. The global radiation was measured with a Kipp solarimeter, which was placed outside of the greenhouse. Light transmission of total photosynthetic active radiation (PAR, mol m− 2 d− 1) was calculated based on measurements in the empty greenhouse and the outdoor global radiation. CO2 of greenhouse air was measured at 5 min interval with a gas analyzer (Priva CO2 monitor Guardian +). Measurements of the air temperature and relative humidity were recorded by dry- and wet-bulb thermocouples placed in ventilated boxes that shielded against direct solar radiation and placed in the middle of the canopy. Thermocouples were calibrated before the start and controlled at the end of the exper-iment. Temperature (oC), relative humidity (%), CO2 concentration (ppm) and window opening (%) were registered using a Priva computer (Priva Connext). The maximum concentration of the CO2 applied was 1200 ppm if the temperature and global radiation corresponded to the criteria for CO2Air_ExtMax as given in Table 3, and the windows were closed. It decreased linearly if the global radiation decreased, internal temperature decreased and the rate of ventilation increased to the lowest value of 410 ppm with 100% window opening (Magan et al., 2008). The measurements for the greenhouse temperature, CO2 con-centration and humidity were taken every five minutes, although only the hourly average values were used in the simulations.
2.2.4. Economic settings We acquired the tomato price history for the year 2019 from
Table 2 Variable costs used in our simulations. * = The data was obtained from in-terviews with commercial tomato growers, whose production is representative for Norway, by advisors at NIBIO.
Resource Value Unit price (NOK)
Unit NOK /m2
Source
Area 5760 m2
Plants 2 25.0 Plant 50 Hovland, 2018 Growth
medium 2.5 10.4 Slab 26 Hovland, 2018
Fertilizer 1.0 30.0 m2 30.0 Hovland, 2018 Pollination 1.0 12.0 m2 12.0 Hovland, 2018 Pesticides 1.0 10.0 m2 10.0 Growers* Packaging 6.7 3.0 Box 20 Growers Natural gas 0.39 kWh Norsk
Gartnerforbund, 2016 Light 0.39 kWh Norsk
Gartnerforbund, 2016 Marketing 1.0 3.0 % Growers Interest 5.0 % Growers Operating
assets 1.0 15.0 m2 15.0 Growers
Water 8 m3 Growers Other 1.0 20.0 m2 20.0 Growers Labor costs 1.2 180.0 m2h Growers Insurance 1 15.0 m2 15.0 Growers
Fig. 1. The four locations in Norway, representing coastal and inland climates, for which the greenhouse designs were evaluated.
M. Naseer et al.

Agricultural Systems 198 (2022) 103391
6
Grøntprodusentenes Samarbeidsråd (lit. The Green Growers’ Cooperative Marked Council) (Markeds- og prisinformasjon, 2019) and applied it for all the greenhouse designs and locations. Similarly, we set the same fixed and variable costs per unit related to the construction and pro-duction conditions in Norway throughout the four locations and greenhouse designs as obtained from literature and from interviews with tomato growers across the country conducted by advisors at NIBIO (Table 1 and Table 2).
2.3. Description of the evaluated design elements and greenhouses
Greenhouse designs for the extended season and year-round pro-duction that were evaluated for the four locations in Norway with different design elements are presented in Table 4 and Table 5. These designs were considered as a result of our discussions with advisors at NIBIO and a review of literature (Verheul et al., 2012; Ahamed et al., 2019; Singh and Tiwari, 2010; Zhang et al., 1996; Von Elsner et al., 2000; Verheul et al., 2022). We considered the design with HPS lighting, one thermal screen, boiler pipe for heating and CO2 from two sources (from boiler and pure from tank) as our basic design. This is the design of the existing greenhouses in Orre and Mære. In Mære HPS lighting was supplemented by LED inter-lighting for which model outputs were verified. For the subsequent designs, for extended season and year- round production, we used a variation in design elements including type and capacities of light and their positioning, number of thermal screens and source of heating (heat pump and boiler) as shown in Ta-bles 4 and 5.
The growing season for unlighted tomato production in Norway is from March to October and in order to extend the growing season arti-ficial is necessary. For the extended season, only low intensity LED inter- lighting was used with an installed amount of 125 μmol (43.7 Wm− 2). For the year-round production season, a variation of HPS and LED was used as top lights with only LED as inter-lighting. In designs where HPS was used as top light in combination with LED inter-lighting, its capacity varied between 150 μmol (87 Wm− 2) and 350 μmol (203.5Wm− 2). In
designs where LED was used both as top-light and inter-lighting, its capacity as top-light ranged from 150 μmol (52 Wm− 2) to 350 μmol (122.8 Wm− 2) while the capacity of LED inter-lighting was kept the same, i.e., 125 μmol (43.7 Wm− 2). The capacities of top lights have been varied in designs containing both HPS and LED in order to find the best combination of top and inter-lighting within the greenhouses that yield best results.
We used two types of thermal screens: i. 100% Polyethylene (PE) and, ii. 50% Polyethylene and 50% Aluminium (Alu). The former was considered as a day screen since it has high light transmission and the latter as night screen since it has high energy saving power. Heat was provided to the greenhouse by a natural gas-powered boiler with a ca-pacity of 1.12 MWunit− 1 and by an electric-powered heat pump with a capacity of 25 Wm− 2 and having a cold and hot water buffer of volumes 0.02 m3m− 2. The heat pump can store excess heat produced during the day or when the artificial lights are on in the greenhouse in a cold buffer to be used later through a hot buffer.
2.4. Prediction accuracy evaluation
The prediction accuracy of the internal relative humidity, concen-tration of CO2 and fresh tomato weight yield was evaluated by the relative root mean squared error (RRMSE):
RRMSE =100ydata
1n
∑n
i=1
(yMod,i − yData,i
)√
where ydata denotes the average of calculated data over the entire growing period, n denotes the number of measurements, yMod,i repre-sents the simulated yield at time instant i and yData,i represents the measured value at time instant i.
2.5. CO2 emissions
The CO2 emissions for two main input variables i.e., natural gas used
Fig. 2. The mean air temperature and global radiation (iglob) recorded in the four locations during the last 30 years (from 1989 to 2019). Months are shown clockwise from January to December.
M. Naseer et al.

Agricultural Systems 198 (2022) 103391
7
for heating the greenhouse and electricity used for lighting, were calculated per year, unit fruit yield and per unit of cultivated area. Previous studies (Verheul and Thorsen, 2010) have shown that the environmental impact of greenhouse production is mainly related to the global warming potential due to the use of fossil fuel. Other environ-mental impacts, like Ozone depletion, acidification, eutrophication, depletion of resources, toxicity and pollution and land use, in green-house production are very low compared to other agricultural produc-tion systems. This also applies to the production of elements like greenhouses, screens and lamps and is mainly due to the high yields in greenhouse production. For this reason, we have only taken in to ac-count the CO2 emissions from heating and lighting. The total natural gas and electricity used were simulated by using the greenhouse climate module. The CO2 emission as a result of burning the natural gas and electricity per m2, as predicted by the climate module, was calculated per kg of fresh weight tomato yield.
2.6. Sensitivity analysis
With regards to the economic value of the crop yield, the temporal electricity, natural gas and tomato price variation were taken into ac-count. These are the variables that have the most impact on the NFR for extended and year-round production. In Norway there is a significant difference in off-season and seasonal tomato whole-sale price mainly due to seasonal variation in import duties for tomatoes (Import tariffs for agricultural products, 2016). From week 19 to week 41 during the year 2019 the tariff rate for tomatoes ranged from 10.21 NOK kg− 1 and 6.86 NOK kg− 1, while for the rest of the year the tariff rate was zero NOK (Markeds- og prisinformasjon, 2019). The range of tomato prices (Fig. 3.) that was applied throughout the greenhouse designs and loca-tions was acquired from Grøntprodusentenes Samarbeidsråd (Markeds- og prisinformasjon, 2019).
We carried out a local sensitivity analysis (LSA) (Tian, 2013) in order to analyse the effect of tomato prices on the NFR. Since the LSA does not take into account the relationship between the various input variables, we also carried out global sensitivity analysis (GSA) (Tian, 2013; Ahamed et al., 2018) by simultaneously varying the electricity, natural gas and tomato prices. To be precise, we varied the electricity and natural gas prices from 0.3 NOK kWh− 1 to 0.65 NOK kWh− 1, with a step size of 0.05 NOK kWh− 1 and the tomato prices from 14 NOK kg− 1 to 21 NOK kg− 1, with a step size of 1 NOK kg− 1.
3. Results
3.1. Results from the Model evaluation
The model predicted air temperature and yield with fair accuracy. The relative root mean squared error (RRMSE) for temperature, CO2- concentration and fresh weight tomato yield was less than 10%. The predicted and measured indoor air temperature for the commercial greenhouses in Orre and Mære are shown in Fig. 4a and b respectively,
Table 3 A description of internal climate set-points for the two production seasons.
Greenhouse climate management
Production seasons Unit Explanation
Extended season
Year-round
Tair_vent_on 23 23 (◦C) The indoor greenhouse temperature above which the greenhouse is ventilated during the daytime
RHair_vent_on 90 90 (%) The indoor greenhouse relative air humidity above which the greenhouse is ventilated
Tair_heat_on
(night/day) 17/19 17/20 (◦C) The heat is turned
on below this temperature for night and day respectively
Tair_fog_on 24 24 (◦C) The indoor temperature above which fogging is used
Tair_heat pump_on 21 22 (◦C) The heat pump is turned on if the indoor air temperature reaches above these points
Tout_ThScr_on 12 14 (◦C) Night thermal screen is used below this outdoor temperature
Tout_Day_EnScr_on 10 10 (◦C) Day thermal screen is used below this outdoor temperature
iglob_Day_EnScr_on 150 150 (Wm− 2) Day thermal screen is used below this global radiation
CO2Air_Min 410 410 (ppm) The CO2
concentration below which CO2 is added
CO2Air_Max 1200 1200 (ppm) Set point for maximum amount of CO2 if all lights are on
Time_Led_on 04:00 04:00 LED’s are switched on at this time after 5 weeks’ planting in greenhouse
Time_Led_off 22:00 22:00 LED’s are switched off at this time
Time_HPS_on 04:00 HPS is used from the first day of planting at this time.
Time_HPS_off 22:00 HPS are switched off at this time
iglob_HPS_on 350 (Wm− 2) HPS are switched off if the global radiations are above this value
Crop conditions LAI_start (Initial) 0.3 0.3 (− ) Initial leaf area
index LAI_max 3 3 (− ) Maximum leaf area
index
Year-round Production
Table 3 (continued )
Greenhouse climate management
Production seasons Unit Explanation
Extended season
Year-round
Start growing period
October 1st
End growing period
September 31st
Extended season duration Start growing
period January 20th
(− )
End growing period
November 20th
(− )
M. Naseer et al.

Agricultural Systems 198 (2022) 103391
8
and Fig. 5 shows the predicted and measured yield at Orre and Mære. At the start of the production season (from February 24th to March 5th) and the end of the production season (from September 26th to October 6th) for the year-round production season, the model predicted the temperature with high accuracy. However, in the middle of the pro-duction season, when the outdoor global radiation and the temperature were high, the prediction was less accurate than at the start and end of the season.
3.2. NFR for different designs and locations
The results showed clear differences for the NFR and CO2 emissions between the designs and locations (Figs. 6-11). Of the four locations, the greenhouse in Orre, in SW Norway, resulted in the highest yield and NFR with the production process having the lowest CO2 emissions from natural gas and electricity use throughout all the selected designs and lighting strategies. Tromsø, in N Norway, had the lowest NFR, yield and the highest energy use and the maximum impact on the environment regardless of the selected designs and lighting strategies. These results were also consistent across the two production seasons, extended sea-son, and year-round production.
Orre had the highest yield: 81.9 kg m− 2 for extended season in the design NDSFML_LED_ES and 136.8 kg m− 2 for year-round production in the design NDSFML_HPS+LED_YR (Fig. 6.), and NFR: 116.9 NOK m− 2 for extended season and 268.5 NOK m− 2 for year-round production (Fig. 7.). Meanwhile, Tromsø had the lowest yield and NFR for both production seasons (74.8 kg m− 2 in extended season and 102 kg m− 2 in year-round production and − 1.2 NOK m− 2 for the extended season and 7.5 NOK m− 2 for the year-round production) (Fig. 7). Moreover, the designs with LED as top lighting with capacities 300 μmol or lower (105.26 Wm− 2 or lower) resulted in higher NFR than the designs with HPS as top lighting having same capacities. On the contrary when the capacities of LED as a top light were increased, it did not result in sig-nificant yield increase and in fact led to a decrease in the economic performance due to high investment costs and higher energy use.
With the exception of the design NSL_LED_ES in Tromsø, all other designs across all locations resulted in positive NFR for extended sea-sonal production. NFR for year-round production was higher compared to NFR for extended seasonal production. The design NDSFML_
LED200μmol+LED125μmol _YR had the highest NFR for all locations (Fig. 7).
3.3. Fixed and variable costs
The fixed and variable costs varied across different designs, with the variable costs also varying among locations (Fig. 8). The fixed costs were highest for the design NDSFML_LED125μmol_ES, (336 NOK m− 2) for extended season, and for NDSFML_LED350μmol+LED125μmol_YR (728 NOK m− 2) for year-round production in Tromsø due to the high investment costs in LED lights and heat pump. Fixed costs were the lowest in the
design NSL_LED125μmol_ES (280 NOK m− 2) for extended season and for NSL_HPS150μmol+LED125μmol_YR (around 388 NOK m− 2) for year-round production in Kise because of the low investment costs of lighting. This was due to the lower light capacities used in these designs as compared to the other designs along with the lesser energy-saving equipment used. Meanwhile the variable costs were the lowest for the design NDSFML_LED125μmol_ES for extended season and for NDSFML_LED150μmol+LED125μmol_YR because of the lowest energy use in this particular design, and highest for the design NSL_LED125μmol_ES dur-ing the extended season and for NSL_HPS350μmol+LED125μmol_YR during year-round due to the high fuel usage.
3.4. Energy use
For the extended season, the design NDSFML_LED_ES used the lowest amount of natural gas across all locations, with the lowest in Kise (262 kWh m− 2) (Fig. 9.). Regarding electricity used, the designs NSL_LED_ES and NDSL_LED_ES used the lowest amount of electricity for the extended season, with the lowest in Kise (197 kWh m− 2), while for the year-round production, the designs NSL_LED+LED_YR and NDSL_LED+LED_YR had the lowest electricity use, with the lowest in Kise (485 kWh m− 2) (Fig. 10.).
3.5. CO2 emissions
CO2 emissions from natural gas and electricity varied between the production seasons, designs and the types of lights used (Fig. 11). The emissions were highest for the design NSL_LED125μmol_ES at Tromsø, (2.4 kg CO2eq kg− 1 fresh weight), and lowest in Orre and Kise for the design NDSFML_LED125μmol_ES, (0.9 kg CO2 eq kg− 1 fresh weight), in extended seasonal production. For the year-round production kg CO2 emissions were highest in Tromsø for the design NSL_HPS350μmol_YR (1.8 kg CO2 eq kg− 1 fresh weight), and the lowest in NDSFMLHPS150μmol+LED125μmol_YR in Orre (0.6 kg CO2 eq kg− 1 fresh weight).
3.6. Sensitivity analysis
The study showed a linear relationship between the tomato prices and the NFR, and that the lower the electricity prices and the higher the tomato prices, the higher the NFR. For the extended season, for Tromsø the minimum off-season tomato price needed for the NFR to be positive for all designs was 16.5 NOK kg− 1 assuming an electricity price 0.4 NOK kWh− 1. This is the same price of electricity that we have used for our simulations for both production seasons (Fig. 12.). A price of 17 NOK kg− 1, or higher, garnered profit for all designs in all locations, with the same energy prices. Likewise, price of 13 NOK kg− 1 or lower resulted in net losses for all greenhouse designs across all locations. For the year- round production, off-season tomato price of 14 NOK kg− 1 or higher will result in positive NFR for all locations and designs, considering the
Table 4 The different greenhouse designs for the extended seasonal (ES) production. The greenhouse design with one thermal screen was extended with various combinations of thermal screens, CO2 enrichment (i.e., from the boiler and pure) and with heat pump. PE refers to Polyethylene Screen; Alu stands for Aluminium; inter stands for inter-lighting. Costs for the design elements are given in Table 1.
Greenhouse designs evaluated for extended season tomato production
Design Elements Type/Capacity NSL_LED_ES NDSL_LED_ES NDSFML_LED_ES
Light type and capacity LED (inter) 125 μmol (43.7 Wm− 2)
LED (inter) 125 μmol (43.7 Wm− 2)
LED (inter) 125 μmol (43.7 Wm− 2)
Boiler- Pipe Boiler Yes Yes Yes Screen Indoor Day Screen (100% PE) No Yes Yes
Thermal Screen (50% PE+50% Alu) Yes Yes Yes CO2 Boiler (if on during the day) Yes Yes Yes
Pure (130 kg ha− 1 h− 1) Yes Yes Yes
Humidification/ Dehumidification Fogging No No Yes Heat pump (25 Wm− 2) No No Yes
M. Naseer et al.

AgriculturalSystems198(2022)103391
9
Table 5 The different greenhouse designs for year-round (YR) production season. The greenhouse design with one thermal screen was extended with various combinations of thermal screens, CO2 enrichment (i.e., from the boiler and pure) and with heat pump. PE refers to Polyethylene Screen; Alu stands for Aluminium; inter stands for inter-lighting. Prices used for the design elements are explained in Table 1.
Greenhouse designs evaluated for year-round tomato production
Design Elements Type/ Capacity NSL_HPS_YR NSL_HPS+LED_YR NSL_LED+LED_YR NDSL_HPS_YR NDSL_HPS+LED_YR NDSL_LED+LED_YR NDSFML_HPS_YR NDSFML _HPS+LED_YR NDSFML _LED+LED_YR
Light HPS (top 350 μmol (203.5Wm− 2))
HPS (top 150 μmol (87 Wm− 2) to 350 μmol (203.5Wm− 2)) + LED (inter 125 μmol (43.7 Wm− 2))
LED (top 150 μmol (52 Wm− 2) to 350 μmol (122.8 Wm− 2)) + LED (inter 125 μmol (43.7 Wm− 2))
HPS (top 350 μmol (203.5Wm− 2))
HPS (top 150 μmol (87 Wm− 2) to 350 μmol (203.5Wm− 2)) + LED (inter 125 μmol (43.7 Wm− 2))
LED (top 150 μmol (52 Wm− 2) to 350 μmol (122.8 Wm− 2)) + LED (inter 125 μmol (43.7 Wm− 2))
HPS (top 350 μmol (203.5Wm− 2))
HPS (top 150 μmol (87 Wm− 2) to 350 μmol (203.5Wm− 2)) + LED (inter 125 μmol (43.7 Wm− 2))
LED (top 150 μmol (52 Wm− 2) to 350 μmol (122.8 Wm− 2)) + LED (inter 125 μmol (43.7 Wm− 2))
Boiler- Pipe Boiler Yes Yes Yes Yes Yes Yes Yes Yes Yes Thermal Screens Day Screen (100%
PE) No No No Yes Yes Yes Yes Yes Yes
Night Screen (50%PE+50% Alu.)
Yes Yes Yes Yes Yes Yes Yes Yes Yes
CO2 Boiler (if on during the day)
Yes Yes Yes Yes Yes Yes Yes Yes Yes
Pure (130 kg ha− 1 h− 1)
Yes Yes Yes Yes Yes Yes Yes Yes Yes
Humidification/ Dehumidification
Fogging No No No No No No Yes Yes Yes Heat pump (25 Wm− 2) No No No No No No Yes Yes Yes
M. N
aseer et al.

Agricultural Systems 198 (2022) 103391
10
energy prices remain the same (Fig. 13.). Likewise, the NFR remained negative for all locations and designs if the tomato prices were 12 NOK kg− 1 or lower, with the same energy prices. Moreover, it was found that if the energy prices increased the design with energy-saving elements resulted in higher NFR as compared to the design NSL.
For greenhouse tomato production in Norway, the biggest costs of production are due to energy and labour while other costs such as pes-ticides, fertilizers and pollination etc. have a negligible effect, for the year-round production. Since labour costs were outside the scope of our study, we have only conducted a sensitivity analysis on energy prices. Furthermore, the biggest impact on the NFR in year-round production is of the electricity prices and tomatoes prices. The reason being that in year-round production, electricity is primarily used for the supplemental
lighting along with energy-saving equipment such as heat pump, while the use of natural gas is lower as compared to the overall use of elec-tricity within the greenhouse. With regards to natural gas prices, it was found that of the four locations, Tromsø was the most sensitive to any variations in the natural gas prices for the year-round production. For instance, for the design NSL in Tromsø, a minimum tomato price of 15 NOK kg− 1 or higher with the natural gas price of 0.4 NOK kWh− 1 was needed for the NFR to be positive. Moreover, it was found that the design without the heat pump i.e., NSL was the most sensitive to variations in natural gas prices, as shown in Fig. 14.
Fig. 3. Tomato prices used for season and off-season production period. The dark area depicts the off-season tomato price while the light area depicts the seasonal tomato price.
Fig. 4. Prediction of temperature for the commercial greenhouse in Orre (Southwestern Norway) with HPS top light at the beginning of the year (Day of the year (DOY): 55–65), Mid-year (DOY: 150–160) and end of the growing period (DOY: 270–280). The dotted line represents the measured indoor air temperature; the light solid line represents the simulated indoor air temperature while the solid dark line is the measured outdoor temperature (figure a). Figure b represents prediction of temperature for the commercial greenhouse with HPS top and LED inter-lighting in Mære (mid Norway) at the DOY: 125–135 and DOY: 240–247. DOY = day of the year. The dotted line represents the measured air temperature; the light solid line represents the simulated temperature, while the dark solid line is the outdoor air temperature.
M. Naseer et al.

Agricultural Systems 198 (2022) 103391
11
4. Discussion
The effects of different design elements, especially the thermal screens, heat pump and the type of light, on NFR that were found, highlight the need to take into account these elements, input costs and tomato prices when designing greenhouses for tomato production in Norway and other regions having similar climate. The NFR sensitivity to the electricity price, which was higher in the year-round production than in the extended season production, indicates that energy saving equipment including day thermal screen and mechanical heating and cooling would become more useful should the fuel and electricity prices increase.
The greater need for heating and electricity in colder climates makes Tromsø the least favourable location -both economically and environ-mentally- for greenhouse tomato production, while the milder coastal areas such as Orre being the most favourable location for both extended season and year-round production. This is in contrast to greenhouse summer season production from March to October in Norway, which has been shown to generate higher NRF and lower energy use under inland climate conditions than under coastal climate conditions (Naseer et al., 2021). It goes without saying, of course, that changes in the outdoor conditions in a particular year could yield different results.
Our results show that for year-round production in higher latitude countries such as Norway, greenhouses with high-tech energy saving equipment yield far better results than simple greenhouse designs without energy-saving equipment due to the high amount of energy saved especially during winter, which results in positive NFR. For instance, the significantly better performance of the NDSFML green-house as compared to other designs, as reflected in the NFR across all locations is in contrast to the studies on the summer season tomato production in Norway (Naseer et al., 2021). In total, the better economic performance and the lower CO2-emissions from fossil fuel use in the NDSFML design greenhouse than in the other greenhouses indicate that in colder climates investing in high-tech energy saving equipment can have positive environmental effects while also being economically efficient.
The type of lighting used within the greenhouse affects its perfor-mance since different types of lamps consume different levels of energy. Our study notes that LED as top and inter-lighting improves the eco-nomic performance of greenhouses in the year-round production and
that the performance can be improved further through performing the optimization of inter-lighting capacities in both production seasons since it reduces the variable costs and increases the crop yield. It was found that an appropriate level of light is crucial in order to achieve optimal NFR and that both lower capacities and higher capacities than that, which in this case was found to be about 200 μmol (70.2 Wm− 2) for LED top light and 125 μmol (43.7 Wm− 2) for LED inter-lighting, can either result in lower levels of yield, and lower NFR or higher investment and variable costs and not enough yield, and thereby lower NFR. While we kept capacities for inter-lighting the same for both seasons in our present study, our simulations showed (data not shown) that for the extended season, the inter-lighting capacities can also be varied in order to achieve better results.
The high fixed costs in the designs containing LED lights at the top and inter-lighting for year-round production are due to the high in-vestment costs associated with the LED lights. One possible reason for the relatively lower fixed costs in Kise as compared to other locations for these designs is the low artificial light use due to the high global radi-ation during summer and the resultant low depreciation costs of the lamps in Kise. The lower investment costs associated with the HPS notwithstanding, the designs with LED top and inter-lighting perform better since they are more efficient than HPS and affect the yield posi-tively along with reducing the energy use, making it a better choice for lighting in existing greenhouse production keeping in mind the current investment costs of LEDs. Moreover, with the global prices of LEDs decreasing steadily, the option of LEDs could prove to be more practical in the future greenhouse tomato production (Van Iersel, 2017).
During the extended season, despite the use of same lighting throughout all designs, there was a variation in NFR due to different design elements that require different investment costs, and variations in amounts of energy saved. For instance, day and night energy screens performed better in milder regions while night and day screens along with mechanical heating and cooling performed better in colder climate (Tromsø). For the year-round production, across the four locations and the selected designs, the design NSLHPS+LED_YR had the highest variable costs due to the addition of LED along with the existing HPS lights and the resultant electricity and natural gas used by the combination. On the other hand, the design NDSFMLLED+LED had the lowest variable costs due to the LEDs being more energy efficient and lower amounts of natural gas used due to the addition of energy saving equipment.
Fig. 5. Measured (dashed line) and predicted (solid line) yield for southwestern Norway (Orre) greenhouse for the year-round production (figure a.). The figure presents the measured yield for second crop cycle for the year-round production for the year 2016. Measured and predicted yield for Mære (mid Norway) greenhouse for the extended season production (figure b.). DOY: day of the year
M. Naseer et al.

Agricultural Systems 198 (2022) 103391
12
The availability of light and heat during the cold winter months in high latitude countries such as Norway is a persistent concern for greenhouse production. Verheul et al. (2020), Paponov et al. (2018) and Paponov et al. (2020) have shown that by adding supplemental lighting in greenhouse production, the yield of tomatoes grown in Norway can be increased significantly. Likewise, Paucek et al. (2020), Li et al. (2014), Tian (2016) and Liu et al. (2012) have shown that supplemental LED inter-lighting also enhance tomato yield in the Mediterranean region. Likewise, our study noted that certain combinations of capacities of LEDs as top and inter-lighting not only reduce fuel use, increase the yield but also are an economically viable option for existing greenhouse to-mato production due to the lower variable costs associated with them, which is also reflected in other studies (Verheul et al. (2022); Van Iersel and Gianino, 2017). Moreover, combining LED top and inter-lighting with a heat pump can be even more economically and environmen-tally feasible especially for Northern areas such as Tromsø. Therefore, in order for the year-round greenhouse production in northern latitude countries to be both economically efficient and environmentally
friendly, our study highlights the importance of designing relevant economic policies that enable and encourage the local growers to use LEDs and other energy-saving equipment, such as thermal screens and heat pumps.
4.1. Limitations
The study attempted to analyse the economic viability and CO2 emissions of greenhouse tomato production in colder climates such as that of Norway for both the extended season and year-round production. Our results indicate that achieving economic efficiency along with the production being environmentally friendly is a difficult task since the climatic conditions in high latitude regions dictate energy intensive production systems, requiring both light and heat, particularly in the cold winter months, and likewise high investment costs in order to install energy-saving equipment.
Previous studies have shown that in closed greenhouses, higher levels of CO2 can result in great increase in yield (De Gelder et al., 2012;
Fig. 6. Predicted marketable yield for greenhouse designs with different light strategies for extended season (20th January to 20th November) and year-round production, where ES denotes extended season and YR denotes the year-round. NSL (blue bar) denotes the design with night screen; NDSL (green bar) denotes the design with day and night screens; NDSFML (yellow bar) denotes the design with day and night screens along with fogging and heat pump. (For interpretation of the references to colour in this figure legend, the reader is referred to the web version of this article.)
M. Naseer et al.

Agricultural Systems 198 (2022) 103391
13
Fig. 7. Net financial return (NFR) for different designs and locations for the extended seasonal (20th January to 20th November) and year-round tomato production, where ES denotes extended season and YR denotes the year-round. NSL (blue bar) denotes the design with night screen; NDSL (green bar) denotes the design with day and night screens; NDSFML (yellow bar) denotes the design with day and night screens along with fogging and heat pump. (For interpretation of the references to colour in this figure legend, the reader is referred to the web version of this article.)
M. Naseer et al.

Agricultural Systems 198 (2022) 103391
14
Fig. 8. Total variable costs for the designs and the light strategies for the extended season (20th January to 20th November) and year-round production for the four locations, where ES denotes extended season and YR denotes the year-round. NSL (blue bar) denotes the design with night screen; NDSL (green bar) denotes the design with day and night screens; NDSFML (yellow bar) denotes the design with day and night screens along with fogging and heat pump. (For interpretation of the references to colour in this figure legend, the reader is referred to the web version of this article.)
M. Naseer et al.

Agricultural Systems 198 (2022) 103391
15
Fig. 9. Natural gas used for the different designs, light strategies, and locations for extended season (20th January to 20th November) and year-round production. ES denotes extended season and YR denotes the year-round; NSL (blue bar) denotes the design with night screen; NDSL (green bar) denotes the design with day and night screens; NDSFML (yellow bar) denotes the design with day and night screens along with fogging and heat pump. (For interpretation of the references to colour in this figure legend, the reader is referred to the web version of this article.)
M. Naseer et al.

Agricultural Systems 198 (2022) 103391
16
Fig. 10. Electricity used for the different designs, light strategies, and locations for extended season (20th January to 20th November) and year-round production.ES denotes extended season and YR denotes the year-round; NSL (blue bar) denotes the design with night screen; NDSL (green bar) denotes the design with day and night screens; NDSFML (yellow bar) denotes the design with day and night screens along with fogging and heat pump. (For interpretation of the references to colour in this figure legend, the reader is referred to the web version of this article.)
M. Naseer et al.

Agricultural Systems 198 (2022) 103391
17
Huber et al., 2021; Sanchez-Guerrero et al., 2005). However, during our simulations, levels of yield did not increase to the extent as expected in the closed greenhouse design NDSFML, making the prediction for this design somewhat uncertain. This is because the model used is not particularly sensitive to CO2, which lowers the accuracy of outputs from simulations of closed greenhouse designs, pointing toward the need for further modifications in the model. Another challenge with closed greenhouse systems is that the levels of humidity within the greenhouse can increase due to the high intensity of artificial lighting. This can substantially affect the marketable yield, which was seen during our simulations, while also bringing about changes within the indoor climate of the greenhouse. Thus, windows must be opened, which in turn lead to the energy and CO2 losses. One possible solution can be the introduction of an advanced and responsive climate control system to handle excess humidity, and temperature control such as the GreenCap Solution process technology (https://greencap-solutions.com/), but its possible impact on the economic performance and the environment needs to be studied further.
Another limitation with our study is that it excludes costs and CO2
emissions related to transportation. Previous studies show that envi-ronmental burden of transporting fresh vegetables long distances can be considerable (Verheul and Thorsen, 2010). Hence, should such trans-portation aspects have been taken into account, especially the NFR and CO2-emissions for the distant Tromsø location may have been relatively better compared to the other locations.
4.2. Practical implications
Of the regions in Norway having existing facilities for seasonal to-mato production, our study found that southwestern Norway seems to be the best region for greenhouse tomato production in both the extended and year-round production given the current tomato and en-ergy prices, with it being the location that had greenhouses with the highest NFR in both production seasons. The fact that NDSFML in Tromsø resulted in a much higher NFR as compared to other designs, is an interesting finding since it points to the possibility of using energy saving equipment such as energy screens and heat pumps under condi-tions that are similar to this. Nonetheless, regarding the CO2 emissions
Fig. 11. CO2 emissions for different designs, light strategies, and locations for extended season (20th January to 20th November) and year-round production. ES denotes extended season and YR denotes the year-round; NSL (blue bar) denotes the design with night screen; NDSL (green bar) denotes the design with day and night screens; NDSFML (yellow bar) denotes the design with day and night screens along with fogging and heat pump. (For interpretation of the references to colour in this figure legend, the reader is referred to the web version of this article.)
M. Naseer et al.

Agricultural Systems 198 (2022) 103391
18
from natural gas and electricity, and keeping in mind the current costs of different types of supplemental lighting, our study recommends the design NDSFMLLED+LED_YR in high latitude countries such as Norway for the year-round tomato production.
Our study aimed at identifying a design out of several possible de-signs that gives the highest NFR and lowest energy use for extended season and year-round greenhouse tomato production. The findings of our study point toward the need for governments to formulate relevant policies, such as the regulation of electricity prices and investment costs of LED lighting and heat pump.
4.3. Way forward
The particular emphasis on energy saving design elements along with a consideration of increased profitability would be beneficial for
not only the governments by promoting sustainable greenhouse pro-duction but also prove to be valuable in terms of opening up new di-rections for further research related to the off-season greenhouse production. With regards to the CO2 emissions, the combination of LED as top and inter-lighting with heat pump and the resulted lower CO2 emissions, due to a low energy use as compared to other light strategies, implies the need for the formulation of relevant policies that provide incentives to growers in order to encourage them to use LED lighting with energy saving equipment in greenhouses which would make the production process not only economically viable but also environmen-tally friendly.
Nonetheless, further work may be conducted to vary the indoor climate set-points, amend the model used in this study to make it more sensitive to variables such as CO2 and relative humidity in order to achieve further accuracy in simulated scenarios and on optimizing
Fig. 12. The effect of tomato price and energy costs on the NFR for the designs NSL and NDSFML for extended seasonal greenhouse production in all four selected locations in Norway. The figure shows that if the energy prices increase, the design with energy-saving elements results in higher NFR as compared to the standard greenhouse in Norway. NSL denotes the design with night screen; NDSFML denotes the design with day and night screens along with fogging and heat pump. The type of light in each design along with the production season is given in subscript.
Fig. 13. The effect of tomato price and energy costs on the NFR for the designs NSL and NDSFML for year-round greenhouse production in all four selected locations in Norway. The figure shows that if the energy prices increase, the design with energy-saving elements results in higher NFR as compared to the standard greenhouse in Norway. NSL denotes the design with night screen; NDSFML denotes the design with day and night screens along with fogging and heat pump. The type of light in each design along with the production season is given in subscript.
M. Naseer et al.

Agricultural Systems 198 (2022) 103391
19
capacities of inter-lighting along with top-light for different production seasons. To further understand the prospects of greenhouse tomato production in different regions, aspects such as the economic cost and environmental burden of transporting the tomato from the production sites to the consumers also need to be taken into account.
5. Conclusions
The study showed that for year-round production even though the HPS lamps had lower investment costs, in the long run the LED lamps are still the better choice since it not only saved energy significantly but also were more efficient in yield increase. Moreover, the study noted that the capacities of supplemental lighting have a significant impact on the NFR and if the lighting strategies and the capacities are not optimised, it can result in negative NFR despite low investment costs, as is apparent during extended season in our study, for which the lighting capacities were not varied.
The study also showed that adding a night and day screen increased the economic performance of all selected designs across all locations for the two different production seasons. With regards to the CO2 emissions from fossil fuel and electricity use, the design with the two thermal screens, fogging and mechanical heating and cooling with LED light had the most positive outcome. This implies that investing in high-tech en-ergy saving equipment could be a better option than the standard greenhouses for greenhouse tomato production especially in the colder regions, since they not only help in saving energy but also yield in better NFR. Of the two different production seasons, the year-round production was more sensitive to variations in the prices of tomato and energy. The results of the study are useful for growers in order to select appropriate greenhouse designs according to the production season and local cli-matic conditions and can help facilitate future research in order to maximise the advantage of greenhouse technology that is both economically efficient and energy efficient. The results can also assist policy makers in formulating appropriate policies that can encourage growers to increase local tomato production while also keeping the production environmentally sound.
Declaration of Competing Interest
The authors declare that they have no known competing financial interests or personal relationships that could have appeared to influence
the work reported in this paper.
Acknowledgement
This study is a part of the research project ‘Bioeconomic production of fresh greenhouse vegetables in Norway (BioFresh)’, which is finan-cially supported by the Bionær program of the Research Council of Norway, project number 255613/ E50.
References
Ahamed, M.S., Guo, H., Tanino, K., 2018. Sensitivity analysis of CSGHEAT model for estimation of heating consumption in a Chinese-style solar greenhouse. Comput. Electron. Agric. 154, 99–111. https://doi.org/10.1016/j.compag.2018.08.040.
Ahamed, M.S., Guo, H., Taylor, L., Tanino, K., 2019. Heating demand and economic feasibility analysis for year-round vegetable production in Canadian Prairies greenhouses. Inform. Proc. Agricult. 6 (1), 81–90. https://doi.org/10.1016/j. inpa.2018.08.005.
Bremnes, E., Hansen, J.S., Slimestad, R., Verheul, M., 2019. Gartneryrket. NIBIO, NOFIMA. https://nofima.no/publikasjon/1807024/.
De Gelder, A., Dieleman, J.A., Bot, G.P.A., Marcelis, L.F.M., 2012. An overview of climate and crop yield in closed greenhouses. J. Hortic. Sci. Biotechnol. 87 (3), 193–202.
De Visser, P.H.B., Buck-Sorlin, G., van der Heijden, G., 2014. Optimizing illumination in the greenhouse using a 3D model of tomato and a ray tracer. Front. Plant Sci. 5, 48. https://doi.org/10.3389/fpls.2014.00048.
FAO, 2020. The share of agriculture in total greenhouse gas emission. Global, regional and country trends 1990–2017. In: FAOSTAT Analytical Brief Series No 1. Rome.
Fernandez, J.E., Bailey, B.J., 1992. Measurement and prediction of greenhouse ventilation rates. Agric. For. Meteorol. 58 (3–4), 229–245. https://doi.org/10.1016/ 0168-1923(92)90063-A.
Gupta, S.D., Agarwal, A., 2017. Light Emitting Diodes for Agriculture. Springer, Singapore. https://doi.org/10.1007/978-981-10-5807-3.
Hemming, S., 2009. Use of natural and artificial light in horticulture-interaction of plant and technology. In: VI International Symposium on Light in Horticulture, 907, pp. 25–35. https://doi.org/10.17660/ActaHortic.2011.907.1.
Hofstad, S., Aabakken, E., Solheim, M., 2021. Strømkunder i sør betaler dyrt for den fine sommeren. https://www.nrk.no/trondelag/billig-strom-i-midt-norge-_-skyhoye- priser-i-sor-norge-1.15639328. Retrieved on 23rd January 2022.
Hovland, I., 2018. Dekningsbidragskalkyler for hagebruk. In: Hovland, I. (Ed.), Handbok far driftsplanlegging. NIBIO, Oslo, pp. 45–71. https://nibio.brage.unit.no/nibio-xm lui/bitstream/handle/11250/2569688/NIBIO_BOK_2018_4_10.pdf?sequence=2&is Allowed=y.
Huber, B.M., Louws, F.J., Hernandez, R., 2021. Impact of different daily light integrals and carbon dioxide concentrations on the growth, morphology, and production efficiency of tomato seedlings. Front. Plant Sci. 12, 289.
Lamb, et al., 2016. The potential for land sparing to offset greenhouse gas emissions from agriculture. Nat. Clim. Chang. 6, 488–492. https://doi.org/10.1038/nclimate2910.
Li, H.D., Ji, J.Z., Zheng, G.J., Liu, H.C., Lei, B.F., 2014. Effects of different LED light- supplement on the yield and quality of cherry tomato. Guangdong Agricult. Sci. 41, 37–39.
Fig. 14. The effect of tomato price and natural gas costs on the NFR for the designs NSL and NDSFML for year-round greenhouse production in all four selected locations in Norway. The figure shows that if the natural gas prices increase, the design with energy-saving elements results in higher NFR as compared to the standard greenhouse in Norway. NSL denotes the design with night screen; NDSFML denotes the design with day and night screens along with fogging and heat pump. The type of light in each design along with the production season is given in subscript.
M. Naseer et al.

Agricultural Systems 198 (2022) 103391
20
Liu, X., Xu, Z., Jiao, X., Chen, W., 2012. Design on LED flexible light system and its effect on growth of spinach. Trans. Chinese Soc. Agricult. Eng. 28 (1), 208–212.
Magan, J.J., Lopez, A.B., Perez-Parra, J.J., Lopez, J.C., 2008. Invernaderos con cubierta de plastico y cristal en el sureste espan ol. Cuadernos Invest. 54.
Mahdavian, M., Wattanapongsakorn, N., 2017. Optimizing greenhouse lighting for advanced agriculture based on real time electricity market price. Math. Probl. Eng. 6862038 https://doi.org/10.1155/2017/6862038.
Martinho, V., 2016. Energy consumption across European Union farms: efficiency in terms of farming output and utilized agricultural area. Energy 103, 543–556.
Moe, R., Grimstad, S.O., Gislerod, H.R., 2005. The use of artificial light in year round production of greenhouse crops in Norway. In: V International Symposium on Artificial Lighting in Horticulture, 711, pp. 35–45. https://doi.org/10.17660/ ActaHortic.2006.711.2.
Naseer, M., Persson, T., Righini, I., Stanghellini, C., Maessen, H., Verheul, M.J., 2021. Bio-economic evaluation of greenhouse designs for seasonal tomato production in Norway. Biosyst. Eng. https://doi.org/10.1016/j.biosystemseng.2021.11.005.
Norwell, F., 2021. Explained: Why are Energy Costs Soaring in Southern Norway? htt ps://www.thelocal.no/20210908/explained-why-are-energy-costs-soaring-in-sout hern-norway/. Retrieved on 23rd January 2022.
Pan, T., Ding, J., Qin, G., Wang, Y., Xi, L., Yang, J., Li, J., Zhang, J., Zou, Z., 2019. Interaction of supplementary light and CO2 enrichment improves growth, photosynthesis, yield, and quality of tomato in autumn through spring greenhouse production. HortScience 54 (2), 246–252, 2019. 10.21273/HORTSCI13709-18.
Paponov, M., Verheul, M.J., Paponov, I.A., 2018. LED inter-lighting increases tomato yield due to the higher photosynthetic light use efficiency of low-positioned leaves. 1st Eur. Congress Photosynth. Res. Uppsala 25 (06), 2018–28.06.2018.
Paponov, M., Kechasov, D., Lacek, J., Verheul, M.J., Paponov, I.A., 2020. Supplemental light emitting diode inter-lighting increases tomato fruit growth through enhanced photosynthetic light use efficiency and modulated root activity. Front. Plant Sci. 10, 1656. https://doi.org/10.3389/fpls.2019.01656.
Paucek, I., Pennisi, G., Pistillo, A., Appolloni, E., Crepaldi, A., Calegari, B., Spinelli, F., Cellini, A., Gabarrell, X., Orsini, F., Gianquinto, G., 2020. Supplementary LED interlighting improves yield and precocity of greenhouse tomatoes in the Mediterranean. Agronomy 10 (7), 1002. https://doi.org/10.3390/ agronomy10071002.
Persoon, S., Hogewoning, S., 2014. Consultancy opdracht: Onderzoek naar de fundamenten van energiebesparing in de belichte teelt. Productschap Tuinbouw 16–18.
Pinho, P., Halonen, L., 2017. Agricultural and horticultural lighting. In: Karlicek, R., Sun, C.C., Zissis, G., Ma, R. (Eds.), Handbook of Advanced Lighting Technology. Springer International Publishing Switzerland.
Pinho, P., Jokinen, K., Halonen, L., 2012. Horticultural lighting–present and future challenges. Light. Res. Technol. 44 (4), 427–437. https://doi.org/10.1177/ 1477153511424986.
Righini, I., Vanthoor, B., Verheul, M.J., Naseer, M., Maessen, H., Persson, T., Stanghellini, C., 2020. A greenhouse climate-yield model focussing on additional light, heat harvesting and its validation. Biosyst. Eng. 194, 1–15. https://doi.org/ 10.1016/j.biosystemseng.2020.03.009.
Rohani, A., Taki, M., Abdollahpour, M., 2018. A novel soft computing model (Gaussian process regression with K-fold cross validation) for daily and monthly solar radiation forecasting (Part: I). Renew. Energy 115, 411–422. https://doi.org/10.1016/j. renene.2017.08.061.
Sanchez-Guerrero, M.C., Lorenzo, P., Medrano, E., Castilla, N., Soriano, T., Baille, A., 2005. Effect of variable CO2 enrichment on greenhouse production in mild winter climates. Agric. For. Meteorol. 132, 244–252.
Singh, R.D., Tiwari, G.N., 2010. Energy conservation in the greenhouse system: a steady state analysis. Energy 35 (6), 2367–2373. https://doi.org/10.1016/j. energy.2010.02.003.
Slager, B., Sapounas, A.A., van Henten, E.J., Hemming, S., 2014. Modelling and evaluation of productivity and economic feasibility of a combined production of tomato and algae in Dutch greenhouses. Biosyst. Eng. 122, 149–162. https://doi. org/10.1016/j.biosystemseng.2014.04.008.
Statsforvalteren i Rogaland, 2019. Norske tomater har lågere klimaavtrykk enn importerte tomater. https://www.statsforvalteren.no/nn/Rogaland/Landbruk-og- mat/Jordbruk/norske-tomater-harlagere-klimaavtrykk-enn-importerte-tomater/. Retrieved on 27th January 2022.
Taki, M., Rohani, A., Soheili-Fard, F., Abdeshahi, A., 2018. Assessment of energy consumption and modeling of output energy for wheat production by neural network (MLP and RBF) and Gaussian process regression (GPR) models. J. Clean. Prod. 172, 3028–3041. https://doi.org/10.1016/j.jclepro.2017.11.107.
Tap, F., 2000. Economics-Based Optimal Control of Greenhouse Tomato Crop Production. PhD thesis. Agriculture University of Wageningen, The Netherlands. http s://library.wur.nl/WebQuery/wurpubs/fulltext/195235.
Tian, W., 2013. A review of sensitivity analysis methods in building energy analysis. Renew. Sust. Energ. Rev. 20, 411–419. https://doi.org/10.1016/j.rser.2012.12.014.
Tian, F., 2016. Study and Optimization of Lighting Systems for Plant Growth in a Controlled Environment (Doctoral Dissertation, Universite Paul Sabatier-Toulouse III).
Van Iersel, M.W., 2017. Optimizing LED lighting in controlled environment agriculture. In: Dutta, Gupta S. (Ed.), Light Emitting Diodes for Agriculture. Springer, Singapore. https://doi.org/10.1007/978-981-10-5807-3_4.
Van Iersel, M.W., Gianino, D., 2017. An adaptive control approach for light-emitting diode lights can reduce the energy costs of supplemental lighting in greenhouses. HortScience 52 (1), 72–77. https://doi.org/10.21273/HORTSCI11385-16.
Vanthoor, B.H., 2011. A Model-Based Greenhouse Design Method. Phd thesis. Agriculture University of Wageningen, The Netherlands. https://edepot.wur. nl/170301.
Vanthoor, B.H.E., Stanghellini, C., Van Henten, E.J., De Visser, P.H.B., 2011a. A methodology for model-based greenhouse design: part 1, a greenhouse climate model for a broad range of designs and climates. Biosyst. Eng. 110 (4), 363–377. https://doi.org/10.1016/j.biosystemseng.2011.06.001.
Vanthoor, B.H.E., Stanghellini, C., Van Henten, E.J., De Visser, P.H.B., 2011b. A methodology for model-based greenhouse design: part 2, description and validation of a tomato yield model. Biosyst. Eng. 110 (4), 378–395. https://doi.org/ 10.1016/j.biosystemseng.2011.08.005.
Vanthoor, B.H., Gazquez, J.C., Magan, J.J., Ruijs, M.N., Baeza, E., Stanghellini, C., van Henten, E.J., de Visser, P.H., 2012. A methodology for model-based greenhouse design: part 4, economic evaluation of different greenhouse designs: a Spanish case. Biosyst. Eng. 111 (4), 336–349. https://doi.org/10.1016/j. biosystemseng.2011.12.008.
Verheul, M.J., Thorsen, S.M., 2010. Klimagassregnskap for norske veksthusprodukter. Bioforsk Rapport 5 (135).
Verheul, M., Grimstad, S.O., Maessen, H.F.R., 2012. Optimizing a year-round cultivation system of tomato under artificial light. In: In VII International Symposium on Light in Horticultural Systems, 956, pp. 389–394. https://doi.org/10.17660/ ActaHortic.2012.956.45.
Verheul, M.J., Maessen, H.F.R., Panosyan, A., Naseer, M., Paponov, M., Paponov, I.A., 2020. Effects of supplemental lighting and temperature on summer production of tomato in Norway. In: International Symposium on Advanced Technologies and Management for Innovative Greenhouses: GreenSys2019 1296, pp. 707–714. https://doi.org/10.17660/ActaHortic.2020.1296.89.
Verheul, M.J., Maessen, H.F.R., Paponov, M., Panosyan, A., Kechasov, D., Naseer, M., Paponov, I.A., 2022. Artificial top-light is more efficient for tomato production than inter-light. Sci. Hortic. 291, 110537.
Vermeulen, P.C.M., 2016. Kwantitatieve informatie voor de glastuinbouw 2016-2017: kengetallen voor groenten, snijbloemen, pot en perkplanten teelten (No. 5121). Wageningen UR Glastuinbouw, Bleiswijk.
Von Elsner, B., Briassoulis, D., Waaijenberg, D., Mistriotis, A., Von Zabeltitz, C., Gratraud, Russo G., Suay-Cortes, R., 2000. Review of structural and functional characteristics of greenhouses in European Union countries: Part I, design requirements. J. Agric. Eng. Res. 75 (1), 1–16. https://doi.org/10.1006/ jaer.1999.0502.
Wacker, J., Verheul, M.J., Righini, I., Maessen, H., Stanghellini, C., 2022. Optimisation of supplemental light systems in Norwegian tomato greenhouses - A simulation study. Biosyst. Eng. https://doi.org/10.1016/j.biosystemseng.2021.12.020.
Woods, J., Williams, A., Hughes, J.K., Black, M., Murphy, R., 2010. Energy and the food system. Philos. Trans. R. Soc. Lond. Ser. B Biol. Sci. 365 (1554), 2991–3006. https:// doi.org/10.1098/rstb.2010.0172.
Xin, P., Li, B., Zhang, H., Hu, J., 2019. Optimization and control of the light environment for greenhouse crop production. Sci. Rep. 9 (1), 1–13. https://doi.org/10.1038/ s41598-019-44980-z.
Zhang, Y., Gauthier, L., De Halleux, D., Dansereau, B., Gosselin, A., 1996. Effect of covering materials on energy consumption and greenhouse microclimate. Agric. For. Meteorol. 82 (1–4), 227–244. https://doi.org/10.1016/0168-1923(96)02332-5.
Websites Import tariffs for agricultural products, 2016. https://www.regjeringen.no/en/topics
/food-fisheries-and-agriculture/jordbruk/innsikt/handel-med-jordbruksprodukt/i mportvernet-for-jordbruksvarer/id2364459/. Retrieved on 24th January 2021. Verified [January 2022].
Markeds- og prisinformasjon, 2019. https://www.grontprodusentene.no/prisinforma sjon-alle-kulturer/. Retrieved on 24th July 2020. Verified [January 2022].
Norsk Gartnerforbund, 2016. https://www.ngfenergi.no retrieved on 5th March 2019. Verified [January 2022].
Statistics Norway, 2021. Horticulutre Prodcution. https://www.ssb.no/en/statbank/ta ble/10507. Retrieved on 18th May 2021. Verified [January 2022].
M. Naseer et al.