
Denise Nahon - WUR eDepot
143
Psychophysical Evaluation of Interactive Effects between Sweeteners and Aroma Compounds \ Denise Nahon
-
Upload
khangminh22 -
Category
Documents
-
view
1 -
download
0
Transcript of Denise Nahon - WUR eDepot
Psychophysical Evaluation
of Interactive Effects between
Sweeteners and Aroma Compounds
\
Denise Nahon
Promotor: Dr. Ir. A.G.J. Voragen Hoogleraar in de levensmiddelenchemie, werkzaam bij het departement Levensmiddelentechnologie en Voedingswetenschappen
Co-promotor: Dr. Ir. J.P. Roozen Universitair hoofddocent, werkzaam bij het departement Levensmiddelentechnologie en Voedingswetenschappen
^ o t o ^ ^ W
Denise Francisca Nahon
Psychophysical Evaluation
of Interactive Effects between
Sweeteners and Aroma Compounds
Psychofysische evaluatie van interactieve effecten tussen
zoetstoffen en aromastoffen
Proefschrift ter verkrijging van de graad van doctor
op gezag van de rector magnificus van de Landbouwuniversiteit Wageningen,
dr. CM. Karssen, in het openbaar te verdedigen op vrijdag 3 September 1999
des namiddags te vier uur in de Aula.
Those parts of the thesis which have been published elsewhere have been reproduced with the permission of both publishers and authors.
ISBN: 90-5808-085-4
Printing: Ponsen & Looijen
Cover: Nicole ter Maten, Wageningen
The research described in this thesis was financially supported by EC Grant PL94-2102.
BiBLlOTHEEK LANDBOUWUNIVERSITBfi

STELLINGEN
1. Het gebruik van niet-lineaire psychofysische nineties is af te raden als men zoetstofinengsels met een gelijke zoetheid wil samenstellen. Dit proefschrift, hoofdstuk 4.
2. De synergie in meervoudige mengsels van zoetstoffen is een lineaire combinatie van de synergieen in de samenstellende tweevoudige mengsels. Dit proefschrift, hoofdstuk 5.
3. Verschillen in de vluchtigheid van geurstoffen ten gevolge van de aanwezigheid van bepaalde zoetstoffen in een produkt zijn niet sensorisch waarneembaar voor panelleden/consumenten. Dit proefschrift, hoofdstuk 6.
4. Het gebruik van de term 'uitzouten' is niet correct voor de toename in het vrijkomen van vluchtige verbindingen bij aanwezigheid van componenten anders dan zout.
5. Smaakonderzoek is in trek.
6. Ecotoerisme getuigt niet van veel respect voor de natuur.
7. De doeltreffendheid van vitamines in shampoo valt te betwijfelen, gezien de contacttijd van de shampoo met het haar.
8. Een snelkassa is alleen een snelle kassa wanneer je er slechts met contant geld kunt betalen.
9. De beste stellingen vind je bij de bouwmarkt.
Stellingen behorende bij het proefschrift
Psychophysical evaluation of interactive effects between
sweeteners and aroma compounds
D.F. Nahon
Wageningen, vrijdag 3 September 1999

Abstract
Nahon, D.F. (1999) Psychophysical evaluation of interactive effects between sweeteners and
aroma compounds. Ph.D. thesis, Wageningen University and Research Centre.
Keywords: sucrose, maltitol, aspartame, Na-cyclamate, Na-saccharinate, orange aroma,
sweeteners, interactions, sensory analysis, flavour release
The presence of intense sweeteners in a light soft drink influences the preferences for, and the
flavour profiles of these drinks to various extents, depending on the aroma and sweeteners
present. In this study equisweet mixtures of sweeteners were composed at 10% Sucrose
Equivalent Value. The sucrose/maltitol and sucrose/aspartame mixtures were additive,
whereas equisweet binary sucrose/Na-cyclamate mixtures and ternary sucrose/aspartame/Na-
cyclamate mixtures revealed synergistic effects. The synergy observed for the ternary
mixture was a linear combination of the synergy of the binary mixtures. Sensory analysis
(quantitative descriptive analysis) of different solutions containing sweetener mixtures and a
water soluble orange aroma revealed that aspartame and Na-cyclamate both differed from
sucrose on the attributes chemical and aftertaste. The addition of orange aroma levelled out
the differences observed between the sweetener solutions. Instrumental analysis revealed that
high sucrose concentrations changed the release of the volatile compounds, while Na-
cyclamate did not show this effect. Modelling of volatile release showed that the gas/solution
partition coefficient and the mass transfer coefficient are the main factors influencing the
release.

Contents
Chapter Page
1 General introduction 1
2 Preliminary studies on commercial products 17
3 Sensory evaluation of mixtures of maltitol or aspartame, sucrose and an 31
orange aroma
4 Sensory evaluation of mixtures of sodium cyclamate, sucrose and an 49
orange aroma
5 Sensory evaluation of ternary mixtures of sodium cyclamate, aspartame, 63
sucrose and an orange aroma
6 Flavour release from mixtures of sodium cyclamate, sucrose and an 87
orange aroma
7 Modelling flavour release from aqueous sucrose solutions, using mass 103
transfer and partition coefficients
8 General discussion 123
Summary 131
Samenvatting 135
Nawoord 141
Curriculum Vitae 143
List of publications 145

1 General introduction
Chapter 1
The taste of a classic soft drink is largely defined by its sweet taste from sucrose, while from
a nutritional and marketing point of view there is a large and increasing demand for a reduced
intake of sucrose. Therefore, the production of beverages containing less sucrose is of
increasing importance to the beverage industry (O'Brien Nabors & Gelardi, 1991). Sucrose
can be substituted by intense sweeteners to lower its content in soft drinks. Due to this
substitution, however, the flavour of a soft drink changes. To obtain acceptable light
beverages of optimum quality, their flavour should be similar to that of classic soft drinks.
These drinks can be considered as flavour standards for beverages containing single
sweeteners and combinations of them. The quality of the flavour of a beverage can be
changed by the properties of the intense sweeteners themselves or because of interactive
effects of the sweeteners with aroma compounds. Interactions between intense sweeteners
and aroma-active compounds can lead to the selective release of these compounds during
consumption. Information on this release is important for selecting the appropriate flavour
compounds to be added to a beverage and the methods for dispersing or isolating them
(Kinsella, 1988).
The research described in this thesis formed part of an EC-project The mechanistic
understanding of the sweetness response. The aim of the research was to elucidate whether
changes in the quality of the sweet taste are due to the properties of the sweeteners
themselves and/or to interactive effects between these sweeteners and aroma compounds.
Besides, the effect of the use of mixtures of sweeteners was studied. In Chapter 2 two
preliminary studies on commercial soft drinks are described. Chapters 3-5 deal with the
sensory analysis of interactive effects between sweeteners and an orange aroma. Furthermore
the techniques to obtain equisweet mixtures are discussed. Additive binary sucrose/maltitol
and sucrose/aspartame mixtures were studied in Chapter 3. In Chapter 4 the synergistic
mixture of sucrose and Na-cyclamate is investigated. Chapter 5 then describes a ternary
mixture of sucrose, aspartame and Na-cyclamate. Chapters 6 and 7 deal with the flavour
release from aqueous solutions containing sweeteners and an orange aroma. In Chapter 6 the
flavour release from mixtures of sucrose, Na-cyclamate and an orange aroma is described. In
Chapter 7 the parameters influencing the release of volatile compounds from aqueous
sucrose solutions are revealed by modelling the release. Finally, the general discussion in
Chapter 8 integrates the studies described in this thesis. In the next paragraphs aspects
relevant to this thesis are discussed.

General introduction
1.1 Flavour stimuli
The sensory perception of foods comprises several impressions, among which the
appearance, the texture, the taste and the smell. Flavour can be considered as being the
sensation arising from the integration or interplay of signals produced as a consequence of
sensations in the nose (aroma), on the tongue (taste) and in the mouth (mouthfeel and/or
texture) (Laing and Jinks, 1996; Taylor and Linforth, 1998).
Odorants are volatile and their molecular weight is limited to a maximum of- 400 (Beets,
1978). When an odorant binds to a receptor protein, the chemical energy will be transduced
into electrical energy by two pathways. Binding of an odorant to a receptor protein activates
specific G-proteins to stimulate either an olfactory-specific adenylate cyclase, generating
cyclic AMP (cAMP), or phospholipase C, which converts the membrane lipid phosphadityl
inositol biphosphate into the second messenger inositol triphosphate (IP3) and diacylglycerol.
The cAMP and IP3 open different ion channels, changing the membrane potential of the cell
and resulting in electrical signals to the brain (Laing and Jinks, 1996). Information about the
identity of odorants is achieved by the production of spatial maps in the olfactory bulb and
other brain structures. The perceived intensity of an odorant is probably a function of the
responses of the different receptor cells (Chastrette et al, 1998; Livermore and Laing, 1998).
Generally, sweet substances stimulating the sense of taste are non-volatile and vary in
molecular weight from 120 (erythritol) to 22000 (thaumatine) (Van der Wei et al, 1987). The
reception and transduction of sugars and other sweeteners includes two pathways. Sugars
bind to a receptor protein in the membrane of a taste receptor cell. Binding activates a G-
protein to stimulate the enzyme adenylate cyclase to synthesize cyclic AMP, which activates
protein kinase A to phosphorylate K channels; this induces their closure and a change in the
membrane potential. Although not fully demonstrated experimentally, the prevailing view is
that synthetic sweeteners such as saccharin may bind to receptor protein(s) but, unlike sugars,
they stimulate phospholipase C to produce diacylglycerol, which may activate protein kinase
C to phosphorylate and close the same K+ channels as are involved in transduction of the
binding of sugars and alters the membrane potential. For the coding of taste information two
major theories exist: the 'across fibre' or 'pattern' theory and the 'labelled line' theory (Laing
and Jinks, 1996).
The model solutions studied in this thesis are made up of sweeteners and aroma
compounds. The sweeteners used for the different studies were either bulk sweeteners or

Chapter 1
intense sweeteners. Up to date sucrose is the most used sweetener, as it has a good sweet taste
and no sidetastes. Next to the fact that sucrose is a tastant, it has a function as bulking agent,
preservative and as fermentation substrate. However, the cariogenity of sucrose and its role as
energy-provider causes a demand for intense sweeteners (Frijters, 1989). The taste of sucrose
is seen as the standard for sweet taste by the consumer. Up till now no intense sweetener was
found having all the positive properties of sucrose. The ideal intense sweetener has the taste
and functional properties of sucrose, has a low caloric density on a sweetness equivalency
basis, is physiologically inert, non-toxic and non-cariogenic. Furthermore it should be
colourless, odourless, water-soluble, chemically stable and competitively priced (Bakal,
1983; Van der Wei et ai, 1987; O'Brien Nabors and Gelardi, 1991; Verdi and Hood, 1993).
Intense sweeteners have a sweetening power which is several times larger than that of
sucrose. This sweetness depends on the used concentration. Besides, the price of most intense
sweeteners based on equivalent sweetnesses is lower than the price of sucrose and other
energy containing sweeteners (Table 1.1).
The use of mixtures of intense sweeteners helps in approaching the optimal sucrose taste.
Combining sweeteners offers various advantages such as an improvement of the time-
intensity profile, an improved stability, lower costs (even more in case of synergy) and a
smaller daily consumption as compared to the use of a specific sweetener on its own (Verdi
and Hood, 1993). Manufacturers can use combinations of sweeteners in their products. Each
sweetener can be used in the applications for which it is best suited. Manufacturers can
overcome limitations of individual sweeteners by using them in blends. Na-cyclamate and
Na-saccharinate historically provided sweetness in a number of popular products. Their use
Table 1.1 Different sweeteners with their relative sweetnesses on weight basis at 10% SEV (sucrose = 1) and prices per kilo. Relative sweetnesses for maltitol, aspartame and Na-cyclamate were taken from Chapters 3, 4 and 5; - = no values possible at 10% SEV, because of off-tastes.
Sweetener Relative sweetness Price (Euro/kg) Sucrose 1 1 Maltitol 0.7 3 Aspartame 100 44 Na-cyclamate 21 2 Na-saccharinate - 3 Acesulfame-K - 52

General introduction
;H2OH CH2OH
0 \ | yCH,OH HO
OH OH Sucrose
;H2OH CH2OH , J-OH
' OH Maltitol
CH2OH
NH^CH—C—NH 2 I
CH2
o=c I
OH
Aspartame
—C—OCH,
* H S 0 - - N -© i™* o CH,
P N"rS02 K 2
Na-cyclamate Na-saccharinate Acesulfame-K
Figure 1.1 Structures of sucrose, maltitol, aspartame, Na-cyclamate, Na-saccharinate and acesulfame-K.
in combination was the first practical application of the multiple sweetener approach
(O'Brien Nabors and Gelardi, 1991).
To incorporate intense sweeteners in foods and beverages successfully, a thorough
understanding of their roles in each food application is necessary. The sensory and chemical
properties of the intense sweeteners must be understood as these frequently will restrict
application. Attention must be paid to factors including texture, bulk and flavour quality
(Lindley, 1983). The sweeteners used for the research described in this thesis were sucrose,
maltitol, aspartame, Na-cyclamate, Na-saccharinate and acesulfame-K. Their structures are
given in Figure 1.1.
1.2 Psychophysical models for mixtures of sweeteners
Psychophysics is the study of the relationship between what exists in the real world (the
stimulus or stimuli) and the human experience of these events (Meiselman, 1972). Taste
receptors are stimulated by physical interaction with tastant molecules. A stimulus molecule
absorbs onto the surface of the receptor, which creates a disturbance of the neural response of
the receptor. Beidler (1954) assumes a concept of receptor binding, analogous to the
Michaelis-Menten model for the study of enzyme-substrate reactions, in which one stimulant
combines with one receptor. The theory of taste stimulation given by Beidler (1954) relates
Chapter 1
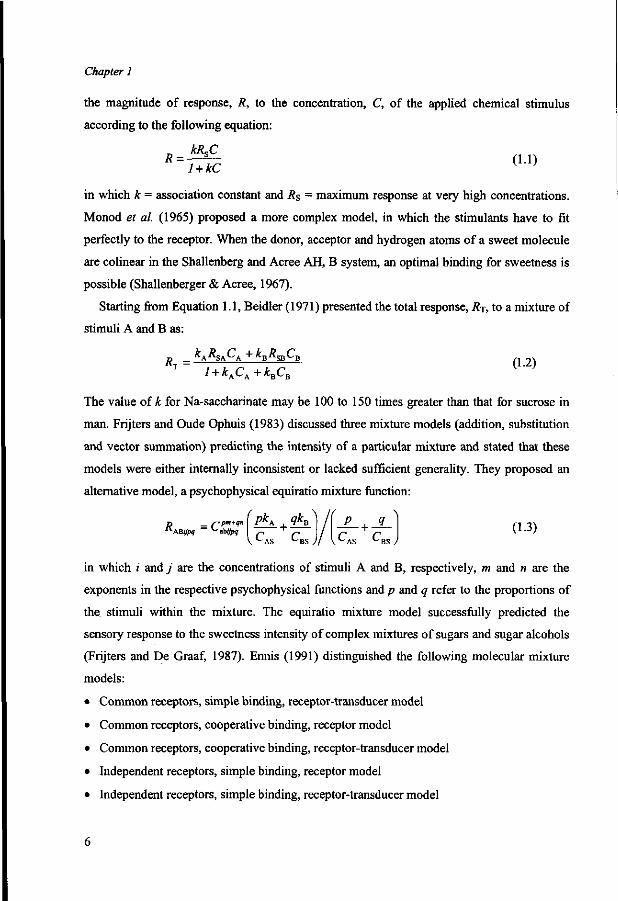
the magnitude of response, R, to the concentration, C, of the applied chemical stimulus
according to the following equation:
R = 77kd (L1)
in which k = association constant and 7?s = maximum response at very high concentrations.
Monod et al. (1965) proposed a more complex model, in which the stimulants have to fit
perfectly to the receptor. When the donor, acceptor and hydrogen atoms of a sweet molecule
are colinear in the Shallenberg and Acree AH, B system, an optimal binding for sweetness is
possible (Shallenberger & Acree, 1967).
Starting from Equation 1.1, Beidler (1971) presented the total response, RT, to a mixture of
stimuli A and B as:
T l + kACA+kBCB
The value of A: for Na-saccharinate may be 100 to 150 times greater than that for sucrose in
man. Frijters and Oude Ophuis (1983) discussed three mixture models (addition, substitution
and vector summation) predicting the intensity of a particular mixture and stated that these
models were either internally inconsistent or lacked sufficient generality. They proposed an
alternative model, a psychophysical equiratio mixture function:
ABijpq abijpq PkA +1kB
c c
\ If \ P + q C C
VWs '"BS J
(1.3)
in which i and j are the concentrations of stimuli A and B, respectively, m and n are the
exponents in the respective psychophysical functions and p and q refer to the proportions of
the stimuli within the mixture. The equiratio mixture model successfully predicted the
sensory response to the sweetness intensity of complex mixtures of sugars and sugar alcohols
(Frijters and De Graaf, 1987). Ennis (1991) distinguished the following molecular mixture
models:
• Common receptors, simple binding, receptor-transducer model
• Common receptors, cooperative binding, receptor model
• Common receptors, cooperative binding, receptor-transducer model
• Independent receptors, simple binding, receptor model
• Independent receptors, simple binding, receptor-transducer model

General introduction
Ennis (1991) stated that if a common receptor for two substances exists and if simple
binding to the receptor occurs, there will be a linear relationship between the components of
mixtures which have equal perceptual, or other, effects. Mixture models involving a common
receptor are a generalization of the mixture model for taste proposed by Beidler (1971)
(Equation 1.2). In the case of independent receptor models, each substance reacts with a
unique receptor and/or unique transducer. Ayya and Lawless (1992) explained that the
equiratio mixture model (Equation 1.3) assumes a single receptor mechanism. As different
sweeteners may stimulate independent or at least partially independent receptor sites
(Schiffman et al, 1979; Faurion et al, 1980; Lawless and Stevens, 1983; Van der Wei et al,
1987; McBride, 1988; Frank et al, 1989; Froloff et al, 1998), the model is limited to the
study of molecularly similar sweeteners. Schifferstein (1995) modified the equiratio mixture
model and used equi-intense units to predict the mixture intensities for aspartame/sucrose
mixtures. Schifferstein (1996) applied this equiratio mixture model to the non-additive
aspartame/acesulfame-K mixtures by using equi-intense units as the measure of physical
concentration, an interaction index and a nonlinear response output transformation.
1.3 Sweetness flavour interactions
When sucrose is replaced by intense sweeteners, the sweetness of a soft drink is kept the
same as much as possible, but its flavour often changes. Interactive effects of aroma-active
compounds as well as the mechanism of sensory perception could account for this result.
Interactions can occur in the soft drink itself (physical and chemical interaction), at the
periphery of the sense (receptor interaction) or in the brain (perceptual interaction).
1.3.1 Physical & chemical interaction
Several factors determine the rate of release of a volatile compound from an aqueous food
during consumption. Homologous series of volatile compounds in aqueous solutions were
used for preliminary research on their behaviour in drinks (Buttery et al, 1969, 1971). A low
solubility in these solutions increased the volatility of a compound (Buttery et al, 1971).
Drinks are complex mixtures of water, carbohydrates, lipids, proteins and other organic
compounds, and all of them can interact with and/or bind flavours. The release of volatile
compounds depends on the concentration of the volatile, its disposition in the drink (free,

Chapter 1
entrapped, adsorbed, complexed), the composition (components) of the drink, the amount of
saliva in the mouth and the influence of temperature on their partition coefficients. The
properties of the volatile compound (functional groups, molecular size, shape, volatility etc.)
and the physical and chemical properties of the components in the drink determine the
relative importance of these factors (Kinsella, 1988; Taylor and Linforth, 1998).
Carbohydrates as polysaccharides contribute often to the viscosity of a beverage and
therefore influence the diffusion of small volatile compounds. The effects of polysaccharides
are usually of minor importance in soft drinks, because their concentrations are rather low
(Overbosch et al, 1991). Mono- and disaccharides affect the volatility by altering the activity
coefficients of volatile compounds (Land, 1978). At relatively high concentrations, these
components lower the amount of bulk water by structuring water, which increases the
effective concentration of some volatile compounds and therefore can enhance their volatility
(Nawar, 1971; Wientjes, 1968).
Lipids can adsorb or dissolve hydrophobic aroma compounds. In drinks these lipids are
present in a dispersed form and mostly exist in distinct regions (for example droplets). The
concentrations of hydrophobic volatiles in the aqueous and vapour phases are reduced,
because of their physical partition between the lipid and aqueous phases of the drink (Buttery
etal, 1971).
Interactions between proteins and volatile compounds in drinks mainly depend on the
type, amount and composition of the proteins, and temperature, pH and ionic strength of the
medium (Kim & Min, 1988). The hydrophobicity of the protein influences the binding of
volatile compounds. Small apolar compounds can diffuse into hydrophobic regions for
further binding reactions (Solms et al, 1973). Some compounds, such as aldehydes, can be
bound irreversibly in covalent bindings with free sulphide and amino groups in the protein
(Overbosch et al, 1991). Van Ruth et al. (1995a) found a decreased release of volatile
compounds from rehydrated bell peppers as well as from French beans, due to the presence
of the protein mucin in saliva. The influence of pH and ionic strength of the medium is
mainly evident from the isoelectric point, at which the protein can precipitate. Changes in
conformation and solubility of the protein strongly alter the affinity to bind with volatile
compounds (Dumont & Land, 1986).
Similar to carbohydrates, salts can increase the release of volatile compounds from drinks,
due to a 'salting out' effect (Land, 1978). Salts in saliva did not affect the flavour release of
General introduction
some rehydrated vegetables (Van Ruth et al, 1995 a), probably because of their low
concentrations.
As binding of aroma molecules to receptors largely depends on its concentration in the
vapour phase (nose) for olfaction and in the aqueous phase (saliva) for taste (Kinsella, 1988),
the perception of these compounds will be influenced by their physical and chemical
interactions with components of the soft drink.
1.3.2 Receptor interaction
The perception of the sweet taste of intense sweeteners largely depends on their binding
affinity to the hydrophobic part of the receptor; it is also influenced by changes in the micro-
environment. The relative binding strength of sweet molecules alters because of these
changes (Van der Wei et al., 1987). For example, Hoopman et al. (1993) noticed a decrease
in perceived sweet taste due to an increased ethanol concentration in the solution. Kurihara
(1992) has demonstrated taste modifications for the curculin protein due to changes in the
micro-environment of its receptor. The protein induces a sweet taste when it binds to a sweet
taste receptor. The sweet taste of this protein disappears in the presence of divalent cations of
saliva and is regenerated by tasting water, probably by removing the cations. At acidic pH
divalent cations of the saliva do not bind to the receptor and the sweetness of curculin will
last longer in the presence of acids, as in soft drinks.
1.3.3 Perceptual interaction
The consumption of a food implies a simultaneous stimulation of several senses, e.g. vision,
taste and smell. The character and acceptability of a drink is largely determined by the
integration of percepts of these senses. Von Sydow et al. (1974) ascribed the enhancement of
aroma perception by sucrose in beverages to psychological interactions rather than to
receptor or chemical interactions. Frank and Byram (1988) examined the influence of
strawberry aroma on sweetness. It was demonstrated that the modification of taste perception
by olfactory stimuli was both tastant- and odorant-dependent. The influence of the strawberry
aroma on sweetness seems to be more olfactory than gustatory. Murphy and Cain (1980) and
Algom et al. (1993) proposed an additive model of taste-smell integration, in which the
overall intensity of taste-smell mixtures is equal to the sum of the intensities of the unmixed
components. Taste and smell behave in an independent manner, however, percepts of them
Chapter 1
are often mixed up, whereby olfactory stimulation can evoke sensations of taste. The
influence of the colour of a stimulus on its taste or smell is often reported (Maga, 1974;
Dubose et al, 1980; Johnson & Clydesdale, 1982). It is probable that colours are associated
with particular tastes and smells. Booth (1994) reports that indications about calorie content
and artificial nature on the label influence the sweetness and overall preferences for a soft
drink.
Besides the integration of several senses, the interaction between different stimuli of one
sense can be found on a psychological level, e.g. the interaction of sucrose and NaCl
(McBurney & Bartoshuk, 1973; Smith, 1974). Kroeze (1978, 1979) and Lawless (1979) have
shown that the interaction of sweet and salty or bitter tastes does not occur at the periphery,
but at a higher level in the transduction process.
1.4 Techniques to study molecular interaction
The binding of flavours to components of soft drinks may be studied by sensory analysis
and/or instrumental techniques (Kinsella, 1988). In order to obtain meaningful correlations of
the data, sensory and instrumental measurements need to be considered together (Linforth et
al, 1999).
1.4.1 Sensory analysis
In sensory analysis, the human subject is used as an instrument (Koster, 1975). People can be
trained to adopt an analytical attitude and to use judgment procedures which are needed for
the analysis of percepts (Kroeze, 1990). As molecular interactions would change the
perception of a soft drink, sensory analysis can be used for their study. Sensory analysis
comprises difference and descriptive tests (Meilgaard et al, 1991; Punter, 1991). In
descriptive analyses, assessors assign attributes to a type of beverage and then give intensity
scores for these attributes for different products (Punter, 1991). The amount of aroma
compounds reaching the olfactory epithelium is different for each person. It varies with the
adsorption along the respiration track, the flow of air and the amount of saliva in the mouth,
the time, the temperature and the profile of the mouth (Rothe, 1988; Overbosch et al, 1991).
Measurements of the actual profile sensed by the olfactory bulb might improve the
correlation between instrumental and sensory measurements (Taylor & Linforth, 1994). A
10

General introduction
special type of sensory analysis is the time intensity measurement, which can be used to
study aroma and taste release from soft drinks in the mouth. Assessors score the intensity of a
particular attribute with time during consumption (Cliff & Heymann, 1993).
1.4.2 Instrumental analysis
The release of volatiles from a beverage can be estimated by static headspace analysis of the
product (Buttery et al, 1969, 1971; Franzen & Kinsella, 1974). The volatile compounds of
most beverages are present in extremely low concentrations and therefore provide a near
ideal state of infinite dilution. Under such conditions Henry's law can be applied, which
means that the concentration of a volatile compound in the static headspace is proportional to
its concentration in the aqueous phase of a soft drink, at equilibrium. However, the volatile
profile of the static headspace can be below the detection limit of gas chromatography.
Therefore, techniques were developed for isolation and concentration of aroma compounds
from soft drinks, which are purge-and-trap, dynamic headspace analysis, steam distillation,
vacuum distillation and extraction with solvents (Taylor & Linforth, 1994). Oral vapour gas
chromatography offers a possibility to analyse the release of volatiles in the mouth of human
subjects, who had to follow instructions during eating (Legger & Roozen, 1994). In vitro
mouth models can be used to obtain volatile profiles, which are closely related to the profiles
of oral vapour gas chromatography, as Van Ruth et al. (1995b) found for rehydrated bell
peppers. Oral conditions influencing the flavour release are saliva composition and volume,
temperature, mouth volume and mastication.
The dynamic headspace techniques imply a transport of the volatile compounds by an
inert gas, after which the volatiles are condensed and/or adsorbed on an appropriate medium
(Taylor & Linforth, 1994). Subsequently, the volatile compounds can be analysed by gas
chromatography, using different detection methods (Van Ruth & Roozen, 1994). These
methods are limited to qualitative analyses, because each adsorbance material has a different
affinity for each volatile compound (Wyllie et al., 1978). The identity of the volatile
compounds can be determined by gas chromatography combined with mass spectrometry,
flame ionisation detection (retention times and peak areas) and description of odours by
assessors at the sniffing port (Acree et al, 1984; Van Ruth & Roozen, 1994). This sensory
technique is capable of associating flavour descriptors with chemical constituents (Acree et
al, 1984). Human subjects are used to detect aroma-active compounds at the outlet of a gas
11
Chapter 1
chromatograph. They differ in sensitivity with chemical detectors and therefore they produce
different chromatograms (Acree & Barnard, 1994). The number of assessors who smell an
odour can be related to the concentration of odour-active volatile compounds at the sniffing
port (Van Ruth et al, 1995c), although an increase in concentration could also change the
descriptions of an odour.
1.5 References
Acree, T.E.; Barnard, J. Gas chromatography-olfactometry and CharmAnalysis™. In Trends in
Flavour Research; Maarse, H., Van der Heij, D.G., Eds.; Elsevier Science: Amsterdam, The
Netherlands, 1994; pp 211-220.
Acree, T.E.; Barnard, J.; Cunningham, D.G. A procedure for the sensory analysis of gas
chromatographic effluents. Food Chem. 1984,14, 273-286.
Algom, D.; Marks, L.E.; Cain, W.S. Memory psychophysics for chemoreception: perceptual and
mental mixtures of odor and taste. Chem. Senses 1993,18, 151-160.
Ayya, N.; Lawless, H.T. Quantitative and qualitative evaluation of high-intensity sweeteners and
sweetener mixtures. Chem. Senses 1992,17, 245-259.
Bakal, A.I. Mixed sweetener functionality. In Alternative Sweeteners; O'Brien Nabors, L., Gelardi,
R.C., Eds.; Marcel Dekker: New York, USA, 1991; pp. 381-399.
Beets, M.G.J. Structure-Activity Relationships in Human Chemoreception; Applied Science
Publishers Ltd: London, UK, 1978.
Beidler, L.M. A theory of taste stimulation. J. Gen. Physiol. 1954, 38, 133-139.
Beidler, L.M. Taste receptor stimulation with salts and acids. In Handbook of Sensory Physiology,
Vol. 4, Chemical Senses, Part 2, Taste; Beidler, L.M., Ed.; Springer-Verlag: New York, 1971; pp
200-220.
Booth, DA. Flavour quality as cognitive psychology: the applied science of mental mechanisms
relating flavour descriptions to chemical and physical stimulation patterns. Food Qual. Pref. 1994, 5,41-54.
Buttery, R.G.; Bomben, J.L.; Guadagni, D.G.; Ling, L.C. Some considerations of the volatilities of
organic flavor compounds in foods. J. Agric. Food Chem. 1971,19, 1045-1048.
Buttery, R.G.; Ling, L.C; Guadagni, D.G. Volatilities of aldehydes, ketones, and esters in dilute
water solutions. J. Agric. Food Chem. 1969,17, 385-389.
Chastrette, M.; Thomas-Danguin, T.; Rallet, E. Modelling the human olfactory stimulus-response
function. Chem. Senses 1998, 23, 181-196.
Cliff, M.; Heymann, H. Development and use of time-intensity methodology for sensory evaluation -
a review. Food Res. Int. 1993, 26, 375-385.
De Graaf, C ; Frijters, J.E.R. A psychophysical investigation of Beidler's mixture equation. Chem.
Senses 1986, 77,295-314.
12

General introduction
DuBose, C.N.; Cardello, A.V.; Mailer, O. Effects of colorants and flavorants on identification,
perceived flavor intensity, and hedonic quality of fruit-flavored beverages and cake. J. Food Sci.
1980,45, 1393-1399, 1415.
Dumont, J.P.; Land, D.G. Binding of diacetyl by pea proteins. J. Agric. Food Chem. 1986, 34, 1041-
1045.
Ennis, D.M. Molecular mixture models based on competitive and non-competitive agonism. Chem.
Senses 1991,16, 1-17.
Faurion, A.; Saito, S.; MacLeod, P. Sweet taste involves several distinct receptor mechanisms. Chem.
Senses, 1980, 5, 107-121.
Frank, R.A.; Byram, J. Taste-smell interactions are tastant and odorant dependent. Chem. Senses
1988,75,445-455.
Frank, R.A.; Mize, S.J.S.; Carter, R. An assessment of binary mixture interactions for nine
sweeteners. Chem. Senses 1989,14, 621-632.
Franzen, K.L.; Kinsella, J.E. Parameters affecting the binding of volatile flavor compounds in model
food systems. I. Proteins. J. Agric. Food Chem. 1974, 22, 675-678.
Frijters, J.E.R.; Oude Ophuis, P.A.M. The construction and prediction of psychophysical power
functions for the sweetness of equiratio sugar mixtures. Perception 1983,12, 753-767.
Froloff, N.; Lloret, E.; Martinez, J-M.; Faurion, A. Cross-adaptation and molecular modeling study of
receptor mechanisms common to four taste stimuli in humans. Chem. Senses 1998, 23, 197-206.
Hoopman, T.; Birch, G.; Serghat, S.; Portmann, M-O.; Mathlouthi, M. Solute-solvent interactions and
the sweet taste of small carbohydrates. Part II: Sweetness intensity and persistence in ethanol-
water mixtures. Food Chem. 1993, 46, 147-153.
Johnson, J.; Clydesdale, F.M. Perceived sweetness and redness in colored sucrose solutions. J. Food
Sci. 1982, 47, 747-752.
Kim, H.; Min, D.B. Interaction of flavor compounds with protein. In Flavour chemistry of lipid foods;
Min, D.B., Smouse, T.H., Eds.; 79th Annual meeting of American Oil Chemists Society: Phoenix,
USA, 1988; pp 404-420.
Kinsella, J.E. Flavor perception and binding to food components. In Flavour chemistry of lipid foods;
Min, D.B., Smouse, T.H., Eds.; 79th Annual meeting of American Oil Chemists Society: Phoenix,
USA, 1988; pp 376-403.
Koster, E.P. The human instrument in sensory analysis. In Aroma Research; Maarse, H., Groenen,
P.J., Eds.; Pudoc: Wageningen, The Netherlands, 1975; pp 103-110.
Kroeze, J.H.A. The taste of sodium chloride: masking and adaptation. Chem. Senses Flavor 1978, 3,
443-449.
Kroeze, J.H.A. Masking and adaptation of sugar sweetness intensity. Physiol. Behav. 1979, 22, 141-
351.
Kroeze, J.H.A. The perception of complex taste stimuli. In Psychological Basis of Sensory
Evaluation; McBride, R.L., McFie, H.J.H., Eds.; Elsevier Applied Science: London, UK, 1990; pp
41-68.
Kurihara, Y. Characteristics of antisweet substances, sweet proteins, and sweetness-inducing proteins.
Crit. Rev. Food Sci. Nutr. 1992, 32, 231-252.
13
Chapter 1
Laing, D.G.; Jinks, A. Flavour perception mechanisms. Trends in Food Sci. & Technol. 1996, 7, 387-
389.
Land, D.G. Some factors influencing the perception of flavour-contributing substances in food. In
Progress in Flavour Research; Land, D.G., Nursten, H.E. Eds.; Applied Science Publishers:
London, UK, 1978; pp 53-66.
Lawless, H.T. Evidence for neural inhibition in bittersweet taste mixtures. J. Comp. Physiol. Psychol.
1979, 93, 538-547.
Lawless, H.T.; Stevens, D.A. Cross adaptation of sucrose and intensive sweeteners. Chem. Senses
1983,7,309-315.
Legger, A.; Roozen, J.P. Gas chromatography and sensory analysis of chocolate flavour: intensity
changes in time. In Trends in Flavour Research; Maarse, H., Van der Heij, D.G., Eds.; Elsevier
Science: Amsterdam, The Netherlands, 1994; pp 287-291.
Lindley, M.G. Non-nutritive sweeteners in food systems. In Developments in sweeteners 2; Grenby,
T.H., Parker, K.J., Lindley, M.G., Eds.; Applied Science Publishers: London, UK, 1983; pp 225-
246.
Linforth, R.S.T.; Baek, I.; Taylor, A.J. Simultaneous instrumental and sensory analysis of volatile
release from gelatine and pectin/gelatine gels. Food Chem. 1999, 65, 77-83.
Livermore, A.; Laing, D.G. The influence of odor type on the discrimination and identification of
odorants in multicomponent odor mixtures. Physiol. Behav. 1998, 65, 311-320.
McBride, R.L. Taste reception of binary sugar mixtures: Psychophysical comparison of two models.
Percept. Psychophys. 1988, 44, 167-171.
McBurney, D.H.; Bartoshuk, L.M. Interactions between stimuli with different taste qualities. Physiol.
Behav. 1973,70,1101-1106.
Maga, J.A. Influence of color on taste tresholds. Chem. Senses Flavor 1974, / , 115-119.
Meilgaard, M.; Civille, G.V.; Carr, B.T. Sensory Evaluation Techniques. Statistical Methods and
Procedures. CRC Press: Boca Raton, USA, 1991.
Meiselman, H.L. Human taste perception. CRC Crit. Rev. Food Technol. 1972, 3, 89-119.
Monod, J.; Wyman, J.; Changeux, J-P. On the nature of allosteric transitions: a plausible model. J.
Molec. Biol. 1965,12, 88-118.
Murphy, C ; Cain, W.S. Taste and olfaction: Independence vs interaction. Physiol. Behav. 1980, 24,
601-605.
Nawar, W.W. Some variables affecting composition of headspace aroma. J. Agric. Food Chem. 1971,
19, 1057-1059.
O'Brien Nabors, L.; Gelardi, R.C. Alternative sweeteners: an overview. In Alternative sweeteners;
O'Brien Nabors, L., Gelardi, R.C, Eds.; Marcel Dekker: New York, USA, 1991; pp 1-10.
Overbosch, P.; Afterof, W.G.M.; Haring, P.G.M. Flavor release in the mouth. Food Rev. Int. 1991, 7,
137-184.
Punter, P.H. Sensorisch onderzoek: een historisch overzicht. In Sensorisch Onderzoek, Eindelijk
Volwassen?; De Graaf, C , Punter, P.H. Eds.; Agricultural University: Wageningen, The
Netherlands 1991; pp 1-28.
Rothe, M. Introduction to aroma research. Kluwer: Dordrecht, The Netherlands, 1988.
14
General introduction
Schifferstein, H.N.J. Prediction of sweetness intensity for equiratio aspartame/sucrose mixtures.
Chem. Senses 1995, 20, 211-219.
Schifferstein, H.N.J. An equiratio mixture model for non-additive components: a case study for
aspartame/acesulfame-K mixtures. Chem. Senses 1996, 21, 1-11.
Schiffman, S.S.; Reilly, D.A.; Clark III, T.B. Qualitative differences among sweeteners. Physiol.
Behav. 1979,23,1-9.
Shallenberger, R.S.; Acree, T.E. Molecular theory of sweet taste. Nature 1967, 216, 480-482.
Smith, D.V. Electrophysiological correlates of gustatory cross adaptation. Chem. Senses Flavor 1974,
1, 29-40.
Solms, J.; Osman-Ismail, F.; Beyeler, M. The interaction of volatiles with food components. Can.
Inst. FoodSci. Technol. J. 1973, 6, A10-A16.
Taylor, A.J.; Linforth, R.S.T. Methodology for measuring volatile profiles in the mouth and nose
during eating. In Trends in Flavour Research; Maarse, H., Van der Heij, D.G., Eds.; Elsevier
Science: Amsterdam, The Netherlands, 1994; pp 3-14.
Taylor, A.J.; Linforth, R.S.T. Understanding flavour release: the key to better food flavour?. Nutr.
FoodSci. 1998,4,202-206.
Van der Wei, H.; Van der Heijden, A.; Peer, H.G. Sweeteners. Food Rev. Int. 1987, 3, 193-268.
Van Ruth, S.M.; Roozen, J.P. Gas chromatography/sniffing port analysis and sensory evaluation of
commercially dried bell peppers (Capsicum annuum) after rehydration. Food Chem. 1994, 51,
165-170.
Van Ruth, S.M.; Roozen, J.P.; Cozijnsen, J.L. Volatile compounds of rehydrated French beans, bell
peppers and leeks. Part I. Flavour release in the mouth and in three mouth model systems. Food
Chem. 1995b, 53, 15-22.
Van Ruth, S.M.; Roozen, J.P.; Hollmann, M.E.; Posthumus, M.A. Instrumental and sensory analysis
of the flavour of French beans (Phaseolus vulgaris) after different rehydration conditions. Z
Lebensm.-Unters. Forsch. 1995c, 203, 7-13.
Van Ruth, S.M.; Roozen, J.P.; Nahon, D.F.; Cozijnsen, J.L. Flavour release from rehydrated French
beans (Phaseolus vulgaris) influenced by composition and volume of artificial saliva. Z Lebensm.-
Unters. Forsch. 1995a, 203, 1-6.
Verdi, R.J.; Hood, L.L. Advantages of alternative sweetener blends. Food Technol. 1993, 6, 94, 96,
98, 100, 101.
Von Sydow, E.; Moskowitz, H.; Jacobs, H.; Meiselman, H. Odor-taste interaction in fruit juices.
Lebensm.- Wiss. -Technol. 1974, 7, 18-24.
Wientjes, A.G. The influence of sugar concentrations on the vapor pressure of food odor volatiles in
aqueous solutions. J. Food Sci. 1968, 33, 1-2.
Wyllie, S.G.; Alves, S.; Filosoof, M.; Jennings, W.G. Headspace sampling: use and abuse. In Analysis
of Foods and Beverages. Headspace Techniques; Charalambous, G., Ed.; Academic Press: New
York, USA, 1978; pp 1-15.
15
2 Preliminary studies on commercial products
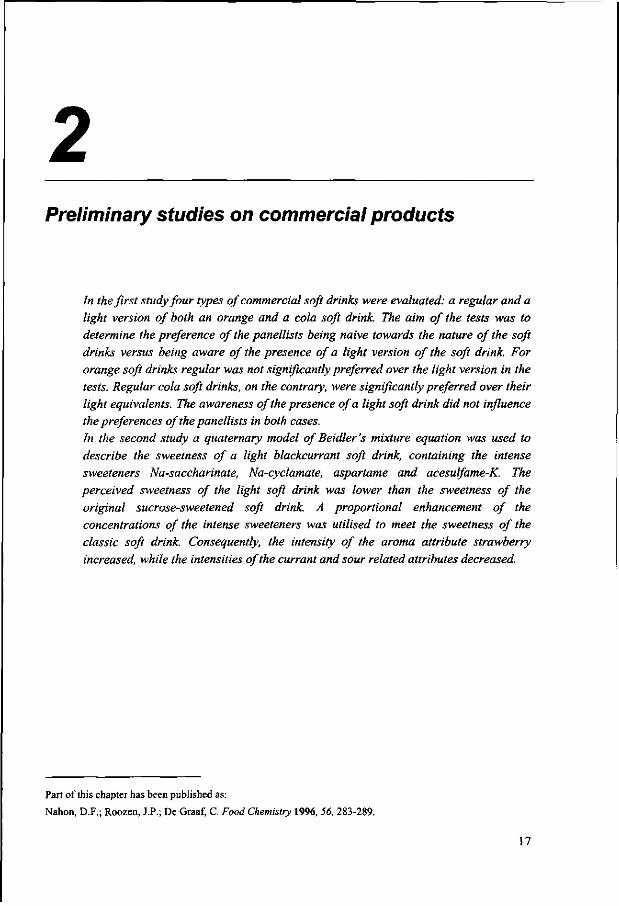
In the first study four types of commercial soft drinks were evaluated: a regular and a light version of both an orange and a cola soft drink. The aim of the tests was to determine the preference of the panellists being naive towards the nature of the soft drinks versus being aware of the presence of a light version of the soft drink. For orange soft drinks regular was not significantly preferred over the light version in the tests. Regular cola soft drinks, on the contrary, were significantly preferred over their light equivalents. The awareness of the presence of a light soft drink did not influence the preferences of the panellists in both cases. In the second study a quaternary model of Beidler 's mixture equation was used to describe the sweetness of a light blackcurrant soft drink, containing the intense sweeteners Na-saccharinate, Na-cyclamate, aspartame and acesulfame-K. The perceived sweetness of the light soft drink was lower than the sweetness of the original sucrose-sweetened soft drink. A proportional enhancement of the concentrations of the intense sweeteners was utilised to meet the sweetness of the classic soft drink. Consequently, the intensity of the aroma attribute strawberry increased, while the intensities of the currant and sour related attributes decreased.
Part of this chapter has been published as:
Nahon, D.F.; Roozen, J.P.; De Graaf, C. Food Chemistry 1996, 56, 283-289.
17

Chapter 2
2.1 Preferences
Recent data from the Dutch association of the soft drinks industry (1998) show that 17.8% of
the consumed soft drinks in the Netherlands were light soft drinks. Cola soft drinks were the
most popular ones, showing a market share of 51.5% in 1998. Orange soft drinks represented
22.7% of the total consumption of soft drinks in 1998 (NFI, 1999). For soft drinks, cola is the
number one preferred flavour all over the world and in Europe orange is, with a few
exceptions, the second preferred flavour (Sinki, 1994). The assumption that taste differences
between regular and light soft drinks exist inspired us to study interactive effects between
sweeteners and aroma compounds (Nahon et ah, 1996). However, we do not know whether
these differences are important enough to be noticed by regular consumers and to alter their
choice for beverages. We wonder whether consumers have a marked preference for one of
the soft drinks. Booth et ah (1987) explained that an absence of affective data in sensory
analysis creates a risk of developing an expert gastronomy, or studying human perception,
hereby wrongly predicting food selection in the market. In this study paired preference tests
were used to compare four types of commercial soft drinks (of the same brand): a regular and
a light orange soft drink and a regular and a light cola soft drink. The aim of the tests was to
determine the preference of the panellists when naive towards the nature of the soft drinks
and when aware of the presence of a light version of the soft drink. The habits of the
panellists to drink regular or light soft drinks, as well as their gender and age were considered
for their influence on the preferences.
The regular and the light version of each soft drink were compared in two sessions: the
orange soft drink in 1996 and the cola soft drink in 1998. Each session comprised two paired
preference tests. In test I two coded samples were presented, containing the regular and the
light soft drink. The panellists did not know that they were tasting different sweeteners; they
had no sample information. The panellists were asked to choose the sample they preferred
most. In test II two differently coded samples were presented, containing the same soft drinks
as before. The panellists were told that one of the samples was a light soft drink and that they
had to choose their preferred sample again. Finally the panellists were asked to write down
their age, gender and what kind of soft drinks (regular or light) they are used to drink. The
regular versions of the soft drinks are sweetened by sucrose, whereas the light orange soft
drink contains the intense sweeteners Na-saccharinate and Na-cyclamate and the light cola
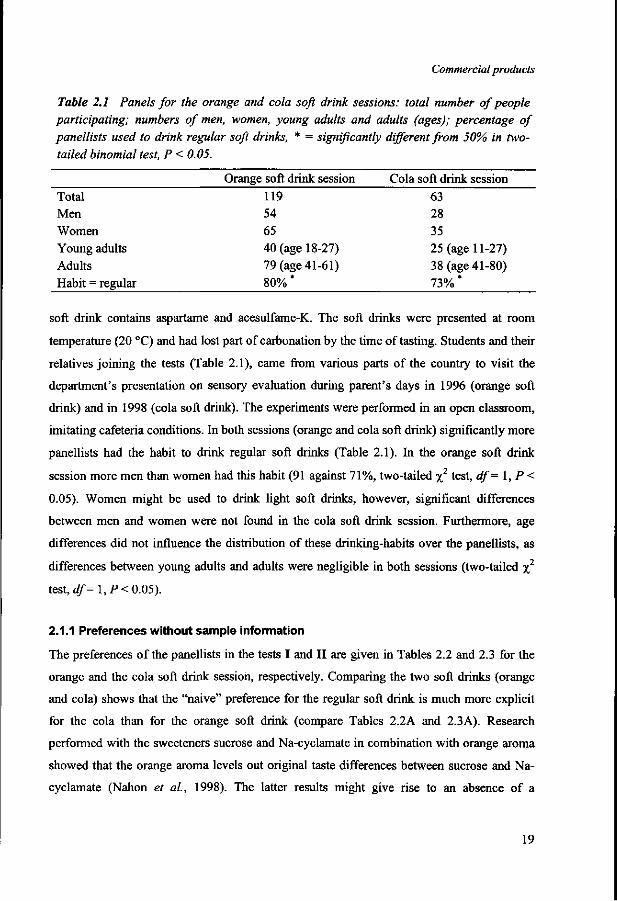
119 54 65 40 (age 18-27) 79 (age 41-61) 8 0 % *
63 28 35 25 (age 11-27) 38 (age 41-80) 7 3 % *
Commercial products
Table 2.1 Panels for the orange and cola soft drink sessions: total number of people participating; numbers of men, women, young adults and adults (ages); percentage of panellists used to drink regular soft drinks, * = significantly different from 50% in two-tailed binomial test, P < 0.05.
Orange soft drink session Cola soft drink session Total Men Women Young adults Adults Habit = regular
soft drink contains aspartame and acesulfame-K. The soft drinks were presented at room
temperature (20 °C) and had lost part of carbonation by the time of tasting. Students and their
relatives joining the tests (Table 2.1), came from various parts of the country to visit the
department's presentation on sensory evaluation during parent's days in 1996 (orange soft
drink) and in 1998 (cola soft drink). The experiments were performed in an open classroom,
imitating cafeteria conditions. In both sessions (orange and cola soft drink) significantly more
panellists had the habit to drink regular soft drinks (Table 2.1). In the orange soft drink
session more men than women had this habit (91 against 71%, two-tailed %2 test, df= 1, P <
0.05). Women might be used to drink light soft drinks, however, significant differences
between men and women were not found in the cola soft drink session. Furthermore, age
differences did not influence the distribution of these drinking-habits over the panellists, as
differences between young adults and adults were negligible in both sessions (two-tailed %2
test, df=\,P< 0.05).
2.1.1 Preferences without sample information
The preferences of the panellists in the tests I and II are given in Tables 2.2 and 2.3 for the
orange and the cola soft drink session, respectively. Comparing the two soft drinks (orange
and cola) shows that the "naive" preference for the regular soft drink is much more explicit
for the cola than for the orange soft drink (compare Tables 2.2A and 2.3A). Research
performed with the sweeteners sucrose and Na-cyclamate in combination with orange aroma
showed that the orange aroma levels out original taste differences between sucrose and Na-
cyclamate (Nahon et al, 1998). The latter results might give rise to an absence of a
19
Chapter 2
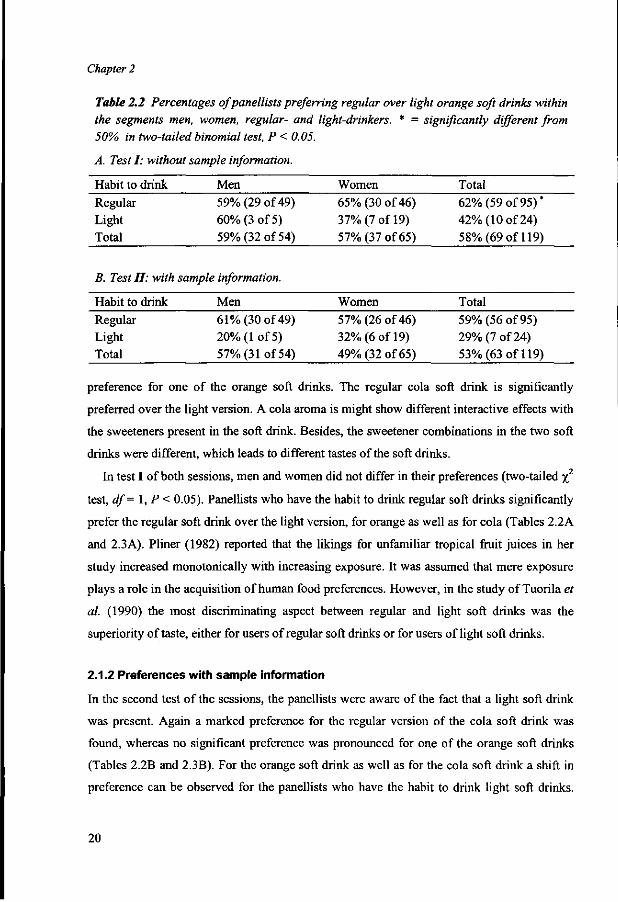
Table 2.2 Percentages of panellists preferring regular over light orange soft drinks within the segments men, women, regular- and light-drinkers. * = significantly different from 50% in two-tailed binomial test, P < 0.05.
A. Test I: without sample information.
Habit to drink Regular Light Total
B. Test II: with
Habit to drink Regular Light Total
Men 59% (29 of 49) 60% (3 of 5) 59% (32 of 54)
sample information.
Men 61% (30 of 49) 20% (1 of 5) 57% (31 of 54)
Women 65% (30 of 46) 37% (7 of 19) 57% (37 of 65)
Women 57% (26 of 46) 32% (6 of 19) 49% (32 of 65)
Total 62% (59 of 95)* 42% (10 of 24) 58% (69 of 119)
Total 59% (56 of 95) 29% (7 of 24) 53% (63 of 119)
preference for one of the orange soft drinks. The regular cola soft drink is significantly
preferred over the light version. A cola aroma is might show different interactive effects with
the sweeteners present in the soft drink. Besides, the sweetener combinations in the two soft
drinks were different, which leads to different tastes of the soft drinks.
In test I of both sessions, men and women did not differ in their preferences (two-tailed x2
test, df= 1, P < 0.05). Panellists who have the habit to drink regular soft drinks significantly
prefer the regular soft drink over the light version, for orange as well as for cola (Tables 2.2A
and 2.3A). Pliner (1982) reported that the likings for unfamiliar tropical fruit juices in her
study increased monotonically with increasing exposure. It was assumed that mere exposure
plays a role in the acquisition of human food preferences. However, in the study of Tuorila et
al. (1990) the most discriminating aspect between regular and light soft drinks was the
superiority of taste, either for users of regular soft drinks or for users of light soft drinks.
2.1.2 Preferences with sample information
In the second test of the sessions, the panellists were aware of the fact that a light soft drink
was present. Again a marked preference for the regular version of the cola soft drink was
found, whereas no significant preference was pronounced for one of the orange soft drinks
(Tables 2.2B and 2.3B). For the orange soft drink as well as for the cola soft drink a shift in
preference can be observed for the panellists who have the habit to drink light soft drinks.
20

Commercial products
Table 2.3 Percentages of panellists preferring regular over light cola soft drinks within the segments men, women, regular- and light-drinkers. * = significantly different from 50% in two-tailed binomial test, P < 0.05.
A. Test I: without
Habit to drink Regular Light Total
sample information.
Men 55% (11 of 20) 63% (5 of 8) 57% (16 of 28)
Women 85% (22 of 26)* 44% (4 of 9) 74% (26 of 35)*
Total 72% (33 of 46)* 53% (9 of 17) 67% (42 of 63)*
B. Test II: with sample information.
Habit to drink Regular Light Total
Men 50% (10 of 20) 13% (1 of 8) 39% (11 of 28)
Women 92% (24 of 26)* 67% (6 of 9) 86% (30 of 35)*
Total 74% (34 of 46)* 41% (7 of 17) 65% (41 of 63)*
Their preference for regular soft drinks is smaller in test II than in test I of the sessions.
When comparing Tables 2.2A and B with Tables 2.3A and B, we can observe a shift from 42
to 29%) and from 53 to 41% for respectively the orange and the cola soft drinks. The
information of a light drink being present might help these panellists in recognising their
"own" drink and thus adjust their preferences. However, further study of the data of the group
of light-drinkers showed that the observed shifts were not significant. Lahteenmaki and
Tuorila (1997) reported that their panellists rated pleasantness almost identical before and
after getting a brief description of the drinks. However, direct hedonic comparisons between
the two sweeteners sucrose and aspartame were not possible in their analysis. These authors
also noticed that the short time between the ratings might diminish differences in
pleasantness ratings if subjects feel committed to their first evaluation. As test I and test II in
our evaluation were also performed directly after each other, we might have a similar effect.
2.1.3 Preferences for light soft drinks
The commercial light orange soft drink used in the present study contained the intense
sweeteners Na-saccharinate and Na-cyclamate. A study of the consumer acceptance of
sweeteners in tea at room temperature (Sprowl and Ehrcke, 1984) showed a significant lower
preference for Na-saccharinate as well as for aspartame compared to sucrose. The authors
concluded that there was no completely acceptable low-calorie substitute for sucrose
21
Chapter 2
available to consumers. As appears from the study of Moskowitz and Klarman (1975), the
sweetness imparted by sucrose is considered to be more acceptable than the sweetness
imparted by the intense sweeteners. At moderate concentration Na-cyclamate was almost
pleasant, but showed a rapid drop-off into unpleasantness with increasing concentrations.
Schiffman et al. (1985) investigated whether several sweeteners could be discriminated from
one another in uncarbonated soft drinks. For colas they found that sucrose, aspartame and a
Ca-cyclamate/Na-saccharinate blend, were statistically equivalent in "goodness".
Acesulfame-K was rated least in "goodness" in their study. The commercial light cola soft
drink used in the present study, contained the intense sweeteners aspartame and
acesulfame-K.
2.2 Sweetness-flavour interactions in a light blackcurrant soft drink
2.2.1 Known interactions performed by intense sweeteners
Several studies report on the chemical reactions of intense sweeteners with volatile
compounds. The data of Hussein et al. (1984) showed that aspartame reacts with aldehydes
such as benzaldehyde, cinnamaldehyde, citral, n-decanal and vanillin. Also Le Quere et al.
(1994) found a decrease in the concentrations of several aldehydes in diet orange soft drinks
containing aspartame, whereas Tateo et al. (1988) proved aspartame to be reactive with
carbonyl compounds. Le Quere et al. (1994) observed the formation of new volatile
compounds in diet orange drinks containing cyclamate. These new volatiles were found to be
structurally related to sodium cyclamate.
Concerning flavour enhancement, Higginbotham (1983) mentions special properties of
thaumatin. In soft drinks, certain flavours such as blackcurrant, would allow a replacement
level of sucrose up to 50 % as the enhancement of flavour masks the aftertaste of thaumatin.
Baldwin and Korschgen (1979) found a significant higher sensory intensity of fruit-flavour in
orange- and cherry-flavoured beverages sweetened with aspartame than in their standards
sweetened with sucrose. The intense sweetener neohesperidine dihydrochalcone (NHDC) can
improve the overall flavour profile and mouthfeel of certain soft drinks, even at very low
concentrations (< 5 ppm) (Borrego & Canales, 1992). Lindley et al. (1993) recorded an
intensification of fruity flavour attributes by addition of 1-4 ppm NHDC to sweet and non-
22

Commercial products
sweet beverages. In these cases NHDC acts as a flavour enhancer and modifier rather than as
a sweetener.
2.2.2 Light blackcurrant soft drink
Substitution of sucrose by intense sweeteners demands a complete copy of taste and
functional properties of sucrose. As none of the currently known sucrose substitutes
possesses all of these qualities, manufacturers of soft drinks use combinations of intense
sweeteners to solve flavour problems encountered with single sweeteners (Bakal, 1991;
Houghton, 1988; Verdi & Hood, 1993). The sweetness of a light blackcurrant soft drink was
evaluated as being lower than the sweetness of the classic soft drink. With the help of a
quaternary model of Beidler's mixture equation the concentrations of the sweeteners in the
light drink can be adjusted in order to meet the sweetness of the sucrose-sweetened soft
drink. Descriptive sensory tests will allow a comparison of the classic and light soft drinks.
De Graaf and Frijters (1986) showed that Beidler's mixture equation can predict the
intensity of a mixture of two substances. Beidler's mixture model describes the peripheral
interaction between two taste substances; therefore, it is limited to mixtures of taste
substances of similar taste qualities. Moskowitz et al. (1978) showed that psychological rules
of sensory perception, which predict the responses to pure aqueous systems of sweeteners,
hold for complex beverages. According to Beidler's mixture model, the magnitude of the
response of a mixture containing particular concentrations W, X, Y and Z (mM) of
respectively substances A, B, C and D is given by:
_ k„R^W + kuRKRX + krR^rY + knRvnZ lABCDWXYZ n _ "-A-"-SA" T " - B J t S B ^ T ^ C ^ S C * T J V D - I V S D ^
^ABCDWXYZ ~ , . , , „ i „ , T, . . r, KZ-L) l + kAW + kBX + kcY + kDZ
in which RSA, RSB, RSC and RSD = maximum responses to substances A, B, C and D,
respectively; kA, ks, kc and kD = association constants of substances A, B, C and D,
respectively. Assuming that the responses to each mixture of a series of mixtures of
substances A, B, C and D, containing the concentrations W (of A), X (of B), Y (of C) and Z
(of D) (mM) are equal to the response magnitude R, the following equation can be derived (in
analogy with the derivation by De Graaf and Frijters (1986) for a mixture of two substances):
W + ̂ -X + ̂ -Y + ̂ -Z = CM (2.2) ^ B / *-Ck *~DI
23
Chapter 2
CA, (mM) is the concentration of substance A that evokes the response of magnitude R when
substances B, C and D are not present. This is the point of subjective equality (PSE) for
substance A. Similarly CB/, Cct and CD/ (mM) can be determined for substances B, C and D,
respectively.
The combination of intense sweeteners in the light blackcurrant soft drink should
approximate the sweetness of a 10% sucrose soft drink as closely as possible. The light soft
drink contains the sweeteners Na-saccharinate, Na-cyclamate, aspartame and acesulfame-K.
Na-saccharinate is one of the cheapest sweeteners, however, the taste of this sweetener limits
its use to a maximum dose (Mitchell & Pearson, 1991). Therefore the maximum
concentration of Na-saccharinate in the light soft drink was kept at 0.18 mM. Several
combinations of the other three sweeteners can be chosen to improve the taste and sweetness
of the light soft drink.
The difference in taste between the various blackcurrant soft drinks was judged using
quantitative descriptive analysis. This analysis was performed by a sensory panel of 12
selected and trained assessors (aged 20-23). A computer interactive interviewing system for
composing questionnaires was used to gather survey information (Ci2 system, Sawtooth
Software Inc., Ketchum, USA). In consultation with the panel, a vocabulary of 12 attributes
was composed to describe the flavour of an assortment of blackcurrant soft drinks (Table
2.4). The sucrose-sweetened, light and adjusted light blackcurrant soft drinks were evaluated
by tasting and the intensities of the attributes were marked on a 120 mm visual analogue
scale on a portable computer screen.
The four axes of the quaternary model were respectively presented by Na-saccharinate
(W), Na-cyclamate (X), aspartame (Y) and acesulfame-K (Z). PSEs were determined for the
four sweeteners, compared to a 10% sucrose blackcurrant soft drink. The PSEs are derived
from equisweet values reported by O'Brien Nabors and Gelardi (1991), they are presented in
Table 2.5. Ketelsen et al. (1993) reported difficulties in determining PSEs for Na-
saccharinate and acesulfame-K, due to their inherent bitterness and metal taste at that
concentration. The PSE of aspartame was determined according to Bock and Jones (1968),
using the method of constant stimuli (De Graaf & Frijters, 1986). As this PSE of 2.0 mM
approximates (sufficiently) the value calculated from O'Brien Nabors and Gelardi (1991), it
was assumed that the other PSEs could be used as well.
24

Commercial products
Table 2.4 Attributes describing the aroma of blackcurrant soft drinks (Bakker, 1995).
Attributes Strawberry Sharp Blackcurrant Watery Bitter Tart Refreshing Sour Metallic Aftertaste Musty Sweet
Table 2.5 Points of subjective equality (PSEs) calculated from O'Brien Nabors and Gelardi (1991) for the intense sweeteners Na-saccharinate, Na-cyclamate, aspartame and acesulfame-K, related to a 10% sucrose-sweetened blackcurrant soft drink.
Intense sweeteners PSE (mM) Na-saccharinate (W) 1.6 Na-cyclamate (X) 16.6 Aspartame (Y) 1.9 Acesulfame-K (Z) 2.5
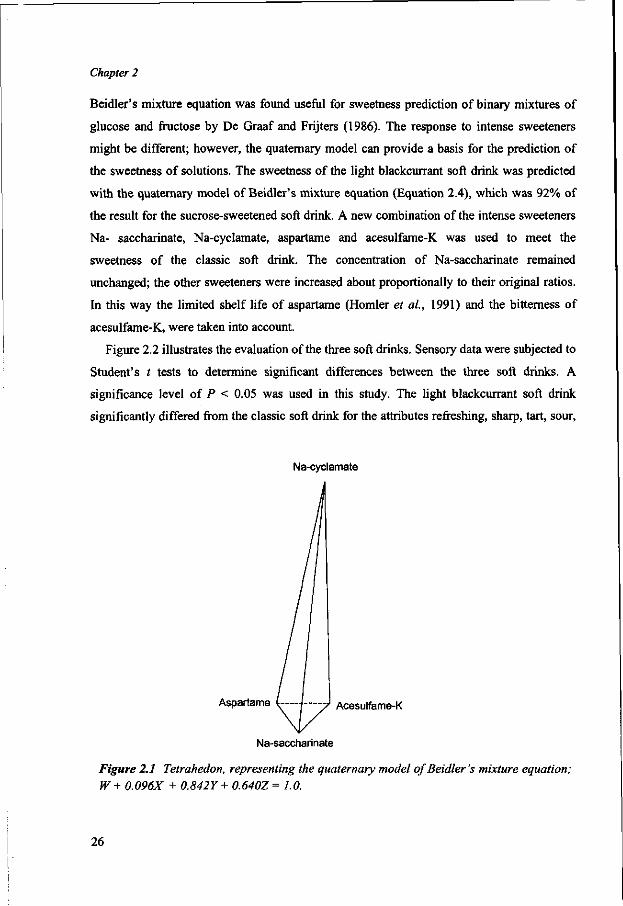
The PSEs are the intercepts in the four dimensional coordinate system representing the
quaternary model by a tetrahedon. Combinations of the intensive sweeteners, on the
peripheral triangles of this tetrahedon predict equal sweetness to the 10% sucrose
blackcurrant soft drink. Beidler's mixture equation for this tetrahedon was
W + 0.096X + 0.842Y+ 0.6402 = 1.6 (2.3)
in which W, X, Y and Z are the concentrations (mM) of Na-saccharinate, Na-cyclamate,
aspartame and acesulfame-K, respectively. This equation represents an additive model for
concentrations of sweeteners needed to obtain a particular sweetness. However, synergistic
effects occurred when combinations of intense sweeteners were tried out. The average score
was 41 on a visual analogue scale instead of 28 found for the sucrose-sweetened drink. The
tetrahedon in the four dimensional coordinate system was uniformly reduced to reckon with
this synergy. After a reduction of 38% the tetrahedon (Figure 2.1) approximately fits with the
sweetness of a 10% sucrose blackcurrant soft drink. The outcome of Beidler's mixture
equation was then
W + 0.096X + 0.842Y + 0.6402 = 1.0 (2.4)
25
Chapter 2
Beidler's mixture equation was found useful for sweetness prediction of binary mixtures of
glucose and fructose by De Graaf and Frijters (1986). The response to intense sweeteners
might be different; however, the quaternary model can provide a basis for the prediction of
the sweetness of solutions. The sweetness of the light blackcurrant soft drink was predicted
with the quaternary model of Beidler's mixture equation (Equation 2.4), which was 92% of
the result for the sucrose-sweetened soft drink. A new combination of the intense sweeteners
Na- saccharinate, Na-cyclamate, aspartame and acesulfame-K was used to meet the
sweetness of the classic soft drink. The concentration of Na-saccharinate remained
unchanged; the other sweeteners were increased about proportionally to their original ratios.
In this way the limited shelf life of aspartame (Homier et al, 1991) and the bitterness of
acesulfame-K, were taken into account.
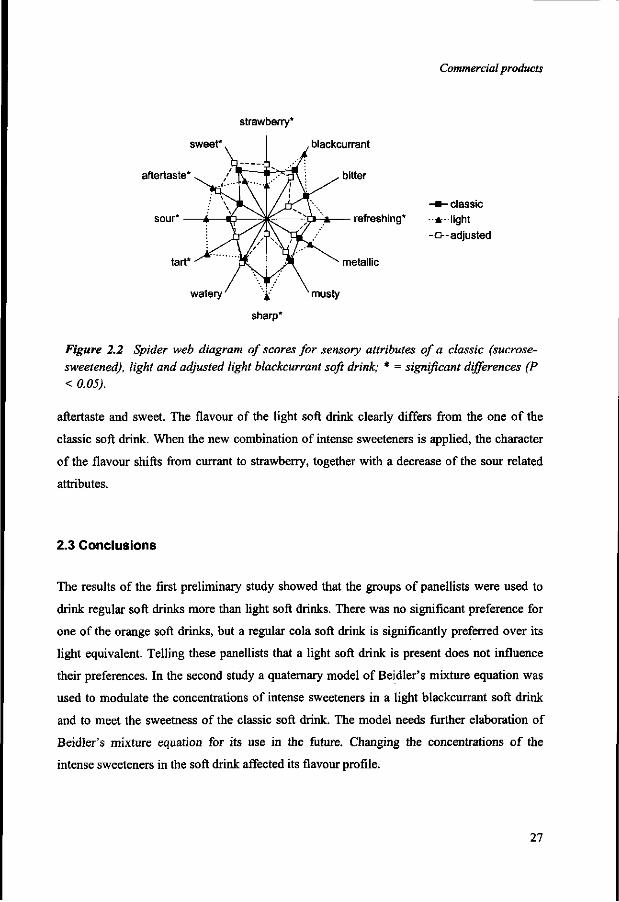
Figure 2.2 illustrates the evaluation of the three soft drinks. Sensory data were subjected to
Student's t tests to determine significant differences between the three soft drinks. A
significance level of P < 0.05 was used in this study. The light blackcurrant soft drink
significantly differed from the classic soft drink for the attributes refreshing, sharp, tart, sour,
Na-cyclamate
Aspartame Acesulfame-K
Na-saccharinate
Figure 2.1 Tetrahedon, representing the quaternary model of Beidler's mixture equation; W+ 0.096X + 0.842Y + 0.640Z = 1.0.
26
Commercial products
strawberry*
sweet*
aftertaste*
sour* *•
tart*
^o—ik refreshing*
metallic
- • - classic
-A- light
-•--adjusted
Figure 2.2 Spider web diagram of scores for sensory attributes of a classic (sucrose-sweetened), light and adjusted light blackcurrant soft drink; * = significant differences (P < 0.05).
aftertaste and sweet. The flavour of the light soft drink clearly differs from the one of the
classic soft drink. When the new combination of intense sweeteners is applied, the character
of the flavour shifts from currant to strawberry, together with a decrease of the sour related
attributes.
2.3 Conclusions
The results of the first preliminary study showed that the groups of panellists were used to
drink regular soft drinks more than light soft drinks. There was no significant preference for
one of the orange soft drinks, but a regular cola soft drink is significantly preferred over its
light equivalent. Telling these panellists that a light soft drink is present does not influence
their preferences. In the second study a quaternary model of Beidler's mixture equation was
used to modulate the concentrations of intense sweeteners in a light blackcurrant soft drink
and to meet the sweetness of the classic soft drink. The model needs further elaboration of
Beidler's mixture equation for its use in the future. Changing the concentrations of the
intense sweeteners in the soft drink affected its flavour profile.
27
Chapter 2
Apparently, the presence of intense sweeteners in a light soft drink influences the
preferences for and the flavour profiles of these drinks to various extents, depending on the
flavour and sweeteners present. More research on interactive effects between sweeteners and
aroma compounds is therefore important.
2.4 References
Bakal, A.I. Mixed sweetener functionality. In Alternative sweeteners; O'Brien Nabors, L., Gelardi,
R.C., Eds.; Marcel Dekker: New York, USA, 1991; pp 381-399.
Baldwin, R.E.; Korschgen, B.M. Intensification of fruit-flavors by aspartame. J. Food Sci. 1979, 44,
938-939.
Bakker, D. De invloed van een mengsel van intensieve zoetstoffen op de zoetheid en het aroma van
cassis light. M.Sc. thesis, Department of Food Science, Agricultural University: Wageningen, The
Netherlands, 1995.
Bock, R.D.; Jones, L.V. The Measurement and Prediction of Judgment and Choice; Bush, R., Ed.;
Holden-Day: San Francisco, USA, 1968.
Booth, D.A.; Conner, M.T.; Marie, S. Sweetness and food selection: measurement of sweeteners'
effects on acceptance. In Sweetness. Papers presented at a symposium held in Geneva, May 21-23,
1986; Dobbing, J., Ed.; Springer-Verlag: Berlin, Germany, 1987; pp 143-160.
Borrego, F.; Canales, I. De rol van neohesperidine DC in zoetstofcombinaties. Voedingsmiddelen
Technol. 1992, 24, 32-33.
De Graaf, C; Frijters, J.E.R. A psychophysical investigation of Beidler's mixture equation. Chem.
Senses 1986, 77,295-314.
Higginbotham, J.D. Recent developments in non-nutritive sweeteners. In Development in sweeteners
- 2; Grenby, T.H., Parker, K.J., Lindley, M.G., Eds.; Applied Science Publishers: London, UK,
1983; pp 119-155.
Homier, B.E.; Deis, R.C.; Shazer, W.H. Aspartame. In Alternative sweeteners; O'Brien Nabors, L.,
Gelardi, R.C., Eds.; Marcel Dekker: New York, USA, 1991; pp 39-69.
Houghton, H.W. Low-calorie soft drinks. In Low-Calorie Products; Birch, G.G., Lindley, M.G., Eds.;
Elsevier Applied Science: London, UK, 1988; pp 11-21.
Hussein, M.M.; D'Amelia, R.P.; Manz, A.L.; Jacin, H.; Chen, W-T.C. Determination of the reactivity
of aspartame with flavor aldehydes by gas chromatography, HPLC and GPC. J. Food Sci. 1984, 49, 520-524.
Ketelsen, S.M.; Keay, C.L.; Wiet, S.G. Time-intensity parameters of selected carbohydrate and high
potency sweeteners. J. Food Sci. 1993, 58, 1418-1421.
Lahteenmaki, L.; Tuorila, H. Item-by-use appropriateness of drinks varying in sweetener and fat
content. Food Qual. Pref. 1997, 8, 85-90.
Le Quere, J.L.; Leschaeve, I.; Demaizieres, D.; Issanchou, S.; Delache, R. Chemical and sensory
effects of intense sweeteners on the flavour of diet orange soft drinks. In Trends in Flavour
28
Commercial products
Research; Maarse, H., Van der Heij, D.G., Eds.; Elsevier Science: Amsterdam, The Netherlands,
1994; pp 387-393.
Lindley, M.G.; Beyts, P.K.; Canales, I.; Borrego, F. Flavor modifying characteristics of the intense
sweetener neohesperidin dihydrochalcone. J. Food Sci. 1993, 58, 592-594, 655.
Mitchell, M.L.; Pearson, R.L. Saccharin. In Alternative sweeteners; O'Brien Nabors, L., Gelardi,
R.C., Eds.; Marcel Dekker: New York, USA, 1991; pp 127-156.
Moskowitz, H.R.; Klarman, L. The hedonic tones of artificial sweeteners and their mixtures. Chem.
Senses Flavor 1975, / , 423-429.
Moskowitz, H.R.; Wolfe, K.; Beck, C. Sweetness and acceptance optimization in cola flavored
beverages using combinations of artificial sweeteners - a psychophysical approach. J. Food Qual.
1978,2, 17-26.
Nahon, D.F.; Roozen, J.P.; De Graaf, C. Sweetness flavour interactions in soft drinks. Food Chem.
1996, 56, 283-289 (this Chapter).
Nahon, D.F.; Roozen, J.P.; De Graaf, C. Sensory evaluation of mixtures of sodium cyclamate, sucrose
and an orange aroma. J. Agric. Food Chem. 1998, 46, 3426-3430 (this thesis, Chapter 4).
NFIJaarbericht 1998, 1999.
O'Brien Nabors, L.; Gelardi, R.C. Alternative sweeteners: an overview. In Alternative sweeteners;
O'Brien Nabors, L., Gelardi R.C, Eds.; Marcel Dekker: New York, USA, 1991; pp 1-10.
Pliner, P. The effects of mere exposure on liking for edible substances. Appetite: J. Intake Res. 1982, 3, 283-290.
Schiffman, S.S.; Crofton, V.A.; Beeker, T.G. Sensory evaluation of soft drinks with various
sweeteners. Physiol. Behav. 1985, 34, 369-377.
Sinki, G. Soft drink flavor preferences. Perfum. Flavorist 1994,19, 19-23.
Sprowl, D.J.; Ehrcke, L.A. Sweeteners: consumer acceptance in tea. J. Am. Diet. Assoc. 1984, 84,
1020-1022.
Tateo, F.; Triangeli, L.; Panna, E.; Berte, F.; Verderio, E. Stability and reactivity of aspartame in cola-
type drinks. In Frontiers of Flavor; Charalambous, G., Ed.; Elsevier Science Publishers,
Amsterdam, The Netherlands, 1988; pp 217-231.
Tuorila, H.; Pangborn, H.M.; Schutz, H.G. Choosing a beverage: comparison of preferences and
beliefs related to the reported consumption of regular vs. diet sodas. Appetite 1990,14, 1-8.
Verdi, R.J.; Hood, L.L. Advantages of alternative sweetener blends. Food Technol. 1993, 6, 94, 96, 98, 100, 101.
Elodie Orambot and Aagje Legger are thanked for their assistance during the preference experiments. Desiree
Bakker is thanked for her skilful contribution to the study of the blackcurrant soft drink. EC Grant PL94-2102 is
acknowledged for kind support.
29

3 Sensory evaluation of mixtures of maltitol or aspartame, sucrose and an orange aroma
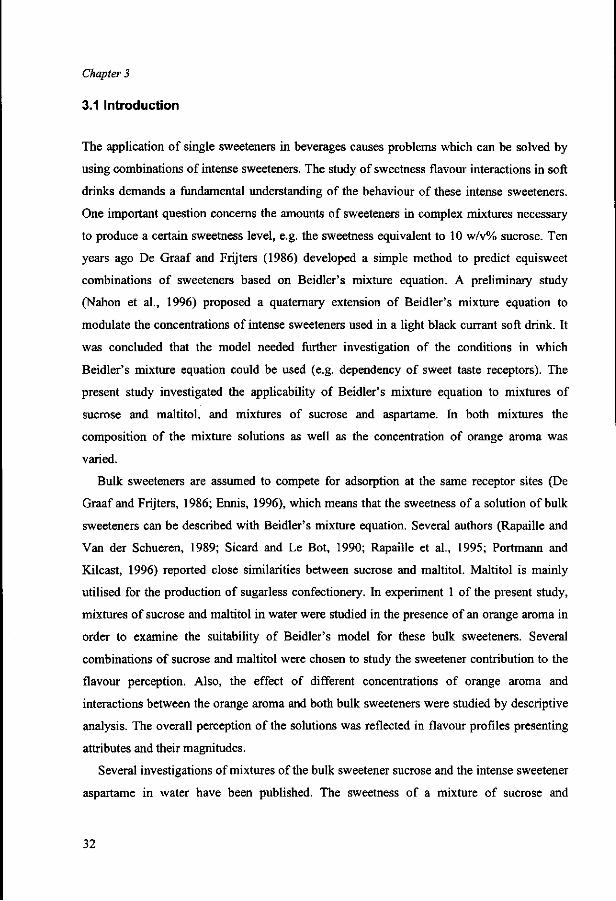
The suitability of Beidler's mixture equation for mixtures of sucrose and maltitol as well as for mixtures of sucrose and aspartame was examined in the presence of an orange aroma. The mean scores for the attribute sweet remained constant for each combination of sucrose and maltitol and for each combination of sucrose and aspartame. Therefore, Beidler 's mixture equation can be used to choose combinations of sucrose and maltitol and combinations of sucrose and aspartame giving the same sweetness. Quantitative descriptive analysis of different solutions indicated that the flavour profiles of sucrose and maltitol did not differ significantly at a constant concentration of orange aroma. However, flavour profiles of solutions with increasing aspartame concentrations (but constant aroma levels) showed significantly higher scores for the attributes sour, chemical and aftertaste. Addition of orange aroma provided the different solutions with a more distinct flavour. The mean scores for the attributes orange, sour, fruity and aftertaste increased significantly for most of the sucrose/maltitol mixtures. This effect of orange aroma was even more pronounced in solutions containing combinations of sucrose and aspartame. Further comments on the attribute aftertaste showed similar terms for the different solutions, the most often mentioned being orange, sour, fruity and chemical for solutions containing the orange aroma. The aftertaste of solutions containing relatively more aspartame was mainly described as sweet and chemical.
This chapter has been published as:
Nahon, D.F.; Roozen, J.P.; De Graaf, C. Chemical Senses 1998, 23, 59-66.
31
Chapter 3
3.1 Introduction
The application of single sweeteners in beverages causes problems which can be solved by
using combinations of intense sweeteners. The study of sweetness flavour interactions in soft
drinks demands a fundamental understanding of the behaviour of these intense sweeteners.
One important question concerns the amounts of sweeteners in complex mixtures necessary
to produce a certain sweetness level, e.g. the sweetness equivalent to 10 w/v% sucrose. Ten
years ago De Graaf and Frijters (1986) developed a simple method to predict equisweet
combinations of sweeteners based on Beidler's mixture equation. A preliminary study
(Nahon et al., 1996) proposed a quaternary extension of Beidler's mixture equation to
modulate the concentrations of intense sweeteners used in a light black currant soft drink. It
was concluded that the model needed further investigation of the conditions in which
Beidler's mixture equation could be used (e.g. dependency of sweet taste receptors). The
present study investigated the applicability of Beidler's mixture equation to mixtures of
sucrose and maltitol, and mixtures of sucrose and aspartame. In both mixtures the
composition of the mixture solutions as well as the concentration of orange aroma was
varied.
Bulk sweeteners are assumed to compete for adsorption at the same receptor sites (De
Graaf and Frijters, 1986; Ennis, 1996), which means that the sweetness of a solution of bulk
sweeteners can be described with Beidler's mixture equation. Several authors (Rapaille and
Van der Schueren, 1989; Sicard and Le Bot, 1990; Rapaille et al., 1995; Portmann and
Kilcast, 1996) reported close similarities between sucrose and maltitol. Maltitol is mainly
utilised for the production of sugarless confectionery. In experiment 1 of the present study,
mixtures of sucrose and maltitol in water were studied in the presence of an orange aroma in
order to examine the suitability of Beidler's model for these bulk sweeteners. Several
combinations of sucrose and maltitol were chosen to study the sweetener contribution to the
flavour perception. Also, the effect of different concentrations of orange aroma and
interactions between the orange aroma and both bulk sweeteners were studied by descriptive
analysis. The overall perception of the solutions was reflected in flavour profiles presenting
attributes and their magnitudes.
Several investigations of mixtures of the bulk sweetener sucrose and the intense sweetener
aspartame in water have been published. The sweetness of a mixture of sucrose and
32

Sensory evaluation ofmaltitol- and aspartame-sucrose mixtures
aspartame was compared with the sweetness of sucrose or aspartame. The presence of
synergy between sucrose and aspartame (-33 to 11%) was indicated by results of Frank et al.
(1989) and Portmann and Kilcast (ECRO XII Symposium Zurich, August 25-31, 1996,
unpublished data). However, Ayya and Lawless (1992) and Schifferstein (1995) showed that
the sweetness of a mixture of sucrose and aspartame lies somewhere between the intensities
of the composing compounds. Furthermore, Lawless and Stevens (1983) observed a partial
cross adaptation with sucrose and aspartame, suggesting that these two sweeteners may share
receptor site mechanisms (Ayya and Lawless, 1992). Descriptive analyses of solutions
containing aspartame were carried out by Samundsen (1985), Redlinger and Setser (1987),
Ott et al. (1991), Ketelsen et al. (1993) and Hanger et al. (1996). All these studies, except the
one by Ott et al. (1991), reported a sweet aftertaste as well as bitter and off-flavour
(after)tastes. Several sweeteners were arranged by Schiffman et al. (1979) in a three-
dimensional space, which revealed that aspartame clusters with the sweet taste of sugars.
However, at a high concentration (0.25 w/v%), a bitter component developed with time.
DuBois and Lee (1983) demonstrated that aspartame is similar to sucrose in taste onset and
persistence times. Wiet and Beyts (1992) noted a slight non-sweet aftertaste for aspartame in
water compared to sucrose. Portmann and Kilcast (1996) found significantly higher scores for
aspartame on the attributes liquorice and bitter (after)tastes, in comparison to sucrose or
maltitol.
In experiment 2 of the present study, Beidler's mixture equation was studied with mixtures
of sucrose and aspartame in water and in the presence of an orange aroma. Several
combinations of sucrose and aspartame were chosen and interactions between the orange
aroma and both sweeteners were studied and compared, as in experiment 1. Several authors
described the interactions between sweeteners and flavours; however, they only presented the
intensities of one to three attributes. Baldwin and Korschgen (1979) asked the panellists to
judge fruit-flavour and found that an orange-flavoured beverage sweetened with aspartame
had a more intense fruit-flavour than its counterpart sweetened with sucrose. Matysiak and
Noble (1991) investigated the time-related perception of sweetness and fruitiness in model
systems sweetened with aspartame or sucrose and flavoured with an orange extract. Their
results show that aspartame has a longer sweetness duration and that its sweetness was
enhanced by the orange flavour. Fruitiness persisted longer in aspartame-sweetened samples
than in sucrose-sweetened ones. Bonnans and Noble (1993) varied the acid-content of these
33

Chapter 3
beverages and found the same results as in the previous experiment. Larson-Powers and
Pangborn (1978a) found time-intensity curves for the attributes sweet, bitter, sour and flavour
of aspartame which were comparable to those of sucrose in all media. Van der Klaauw
(1989) demonstrated that changes in perceived taste intensity can be instruction-dependent
and that cognitive factors may affect judgements of chemosensory attributes. It is important
to have appropriate descriptors available. Odour-induced enhancement of sweetness depends
on the appropriateness of the stimulus attributes that subjects are instructed to rate. As
fruitiness and sweetness appeared to be similar attributes, the fruitiness of a taste-smell
mixture may be included in the working concept of sweetness under those conditions in
which subjects were not asked to pay attention to the fruitiness. The quantitative descriptive
analysis used in this study allows subjects to generate their own appropriate descriptors.
3.2 Experiment 1
This experiment was designed to examine the suitability of Beidler's mixture equation for
mixtures of the bulk sweeteners sucrose and maltitol. Interactions between the orange aroma
and both bulk sweeteners were also analysed.
3.2.1 Materials and methods
Subjects
Of the 61 applicants for the panel screened by a questionnaire, 48 candidates were further
selected on such criteria as motivation, possession of good general perception, judgement of
sweetness and the ability to generate and distinguish attributes and score these separately.
From a pool of 35 available subjects, a panel of twenty-four paid subjects (4 men and 20
women) was chosen to be trained for experiment 1. Most subjects were students of
Wageningen Agricultural University, ranging in age from 19 to 27 years and having no prior
experience of psychophysical experiments. Informed consents were obtained from the
subjects and the study was approved by the Medical Ethical Commission of Wageningen
Agricultural University.
34

Sensory evaluation ofmaltitol- and aspartame-sucrose mixtures
Stimuli
The stimuli were solutions of sucrose (CSM Suiker BV, Amsterdam, The Netherlands) and
maltitol (Roquette Freres, Lestrem, France) and mixtures of these two substances in
demineralised water. Solutions of limonene (Sigma, St. Louis, USA) and octanal (Merck,
Hohenbrunnen, Germany) were used to generate attributes.
According to Portmann and Kilcast (1996), the 10% SEV (Sucrose Equivalent Value) for
maltitol is 13.5 w/v%. These concentrations, 10 w/v% sucrose and 13.5 w/v% maltitol, were
chosen as starting concentrations for the Beidler's mixture equation. This equation should
then predict the concentration and composition of sucrose/maltitol mixtures having a constant
perceived taste intensity of 10% SEV. The validity of the Beidler's mixture equation was
assessed over a series of nine sucrose/maltitol ratios (100/0; 90/10; 75/25; 60/40; 50/50;
40/60; 25/75; 10/90 and 0/100). The overall sweetness of each mixture being equisweet at
10% SEV. The orange aroma added was a sample of the watery vapour phase of stripped
orange juice (Cargill juice division, Amsterdam, The Netherlands). It was used in
concentrations of 0, 15 and 30 g/L. The standard stimuli 'not sweet' and 'very sweet'
consisted of 0 and 16w/v% sucrose, respectively. The solutions were prepared at least 24
hours before evaluation and stored at 4 °C overnight. A stimulus consisted of 15 mL of
solution, presented in a glass jar, covered by a plastic lid and aluminium foil to prevent
interactions between plastic and orange aroma. The stimuli were presented to the panel at
room temperature (22 °C).
Procedure
The relative sweetness factors (10% SEV) of sucrose (10 w/v%) and maltitol (13.5 w/v%) are
introduced in Beidler's mixture equation. Beidler's mixture equation becomes then
W + 0.74X =10 (w/v%) (3.1)
for mixtures of sucrose (=W) and maltitol (=X) (De Graaf and Frijters, 1986). The panel
performed a quantitative descriptive analysis to evaluate the solutions containing nine
different combinations of sucrose and maltitol chosen with Equation 3.1 and three
concentrations of orange aroma. With the help of several solutions, flavour attributes were
generated during training of the subjects, which were ranked and clustered in consultation
with the panel (Table 3.1). The panel was calibrated by tasting sucrose references of 0 and
16 % (w/v), which were the anchors of the visual analogue scale for sweetness. Similar scales
35
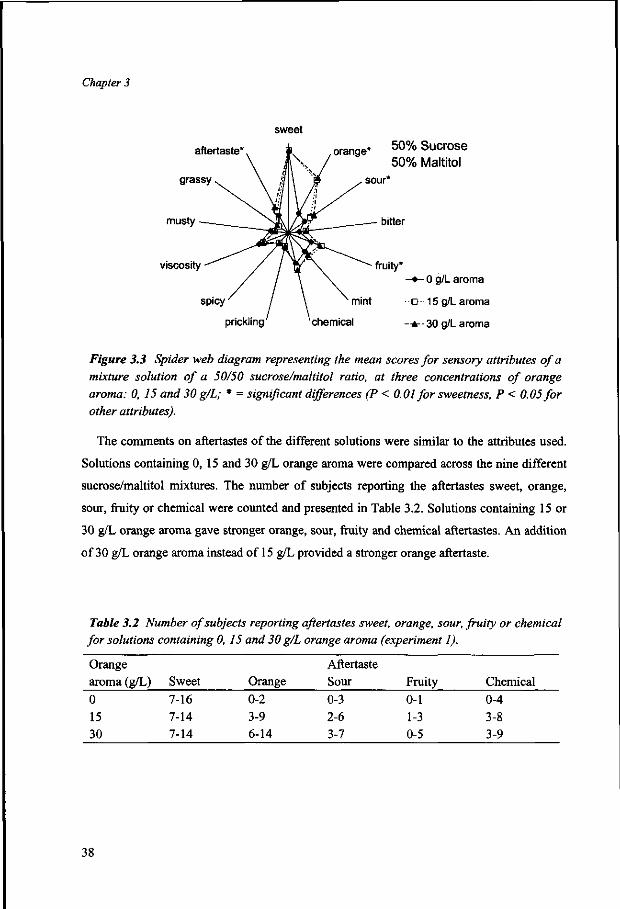
Chapter 3
musty
viscosity
orange* 50% Sucrose 50% Maltitol
prickling
sour*
bitter
fruity*
- • - 0 g/L aroma
mint • D- 15 g/L aroma
chemical --A--30 g/L aroma
Figure 3.3 Spider web diagram representing the mean scores for sensory attributes of a
mixture solution of a 50/50 sucrose/maltitol ratio, at three concentrations of orange
aroma: 0, 15 and 30 g/L; * = significant differences (P < 0.01 for sweetness, P < 0.05 for
other attributes).
The comments on aftertastes of the different solutions were similar to the attributes used.
Solutions containing 0, 15 and 30 g/L orange aroma were compared across the nine different
sucrose/maltitol mixtures. The number of subjects reporting the aftertastes sweet, orange,
sour, fruity or chemical were counted and presented in Table 3.2. Solutions containing 15 or
30 g/L orange aroma gave stronger orange, sour, fruity and chemical aftertastes. An addition
of 30 g/L orange aroma instead of 15 g/L provided a stronger orange aftertaste.
Table 3.2 Number of subjects reporting aftertastes sweet, orange, sour, fruity or chemical
for solutions containing 0, 15 and 30 g/L orange aroma (experiment 1).
Orange aroma (g/L) 0 15 30
Sweet 7-16 7-14 7-14
Orange 0-2 3-9 6-14
Aftertaste Sour 0-3 2-6 3-7
Fruity 0-1 1-3 0-5
Chemical 0-4 3-8 3-9
38
Sensory evaluation ofmaltitol- and aspartame-sucrose mixtures
3.2.3 Conclusions
Beidler's mixture equation makes it possible to choose equisweet combinations of the bulk
sweeteners sucrose and maltitol. The flavour profiles of the sweeteners sucrose and maltitol
do not significantly differ at a constant concentration of orange aroma. Flavour profiles of
different concentrations of orange aroma show significant differences for several attributes.
3.3 Experiment 2
The aim of this experiment was to examine the suitability of Beidler's mixture equation as in
experiment 1, this time for mixtures of sucrose and aspartame.
3.3.1 Materials and methods
Subjects
Again the panel consisted of twenty-four paid subjects (4 men and 20 women), ranging in age
from 19 to 27 years. Nineteen subjects also participated in experiment 1, the five additional
subjects were taken from the pool made in experiment 1.
Stimuli
The stimuli were solutions of sucrose (CSM Suiker BV, Amsterdam, The Netherlands) and
aspartame (Holland Sweetener Company, Maastricht, The Netherlands) and mixtures of these
two substances in demineralised water.
Like in experiment 1, nine sucrose/aspartame ratios (100/0, 90/10, 75/25, 60/40, 50/50,
40/60, 25/75, 10/90 and 0/100) were chosen to assess the validity of the Beidler's mixture
equation, with the overall sweetness of each mixture equisweet at 10% SEV. Again the
orange aroma added was a sample of the watery vapour phase of stripped orange juice, used
in concentrations of 0, 15 and 30 g/L. Further preparation, storage and presentation of the
solutions were done as in experiment 1.
39

Chapter 3
Table 3.3 Sucrose Equivalent Values (SEVs) for aspartame, as reported by several authors, the standard sucrose reference, details about the preparation of the solutions and the number of subjects used for the determination.
Authors
Ayya and Lawless Baldwin and Korschgen
Bornstein et al. Cloninger and Baldwin DuBois and Lee Faurion et al.
Frank et al. Ketelsen et al. Larson-Powers and Pangborn Lawless and Stevens Matysiak and Noble Ott et al. Portmann and Kilcast Schifferstein and Frijters
Theunissen and Kroeze
Year
1992 1979
1993 1974 1983 1980
1989 1993 1978a
1983 1991 1991 1996 1991
1995
10% SEV (w/v %) 0.100 0.065
0.053 0.090 0.075 0.085
0.080 0.090 0.190
0.056 0.085 0.113 0.120 0.088 0.094 0.130
Sucrose (w/v %) 10 9.5
9 10 10 9.6
8.6 9 10
10.3 10 10 10 8.6 9.2 10.5
Preparation solutions 24h before flavoured beverage fresh -' -frozen samples 24h before -16h before
informal 48h before 16h before 24h before 24h before
24h before
# Subjects
10-13 8 (lab panel) 15? 20 12 9
18-20 ±30 13
25 8 12 14
15
Procedure
In several studies, the SEV of aspartame has been determined (Table 3.3). Whereas we found
one SEV for maltitol in the literature, the values for aspartame were quite different, which
may result from differences between panels or methods of preparation. The SEV for
aspartame described by Nahon et al. (1996) was determined in a black currant soft drink, in
which some additional sweetness from a fruit concentrate may be present. Therefore the 10%
SEV of aspartame was again determined with the described panel and method of preparation.
The 10% SEV was determined using the method of constant stimuli (Guilford, 1954) and
weighted linear regression (Bock and Jones, 1968) as described previously (De Graaf and
Frijters, 1986). Substituting the established 10 w/v% for sucrose and the resulting SEV of
0.096 w/v% for aspartame to Beidler's mixture equation gives
40

Sensory evaluation ofmaltitol- and aspartame-sucrose mixtures
W + 104.06X = 10 (w/V%) (3.2)
for mixtures of sucrose (=W) and aspartame (=X). Similar to the first experiment, nine
sucrose/aspartame ratios were chosen and three different concentrations of orange aroma
were added. Again the panel performed a quantitative descriptive analysis to evaluate the
solutions containing several combinations of sucrose and aspartame chosen with
Equation 3.2. The experimental design was the same as in the first experiment, except that
the solutions were only tasted once. The attributes generated and used in experiment 1 also
involved solutions containing aspartame (Table 3.1). Therefore, the same attributes were used
in experiment 2. To stimulate a better use of the scales, 5% and 12.5% (w/v) sucrose
solutions were evaluated in experiment 2. These solutions were randomly given with the
other solutions to be evaluated.
sweet No aroma aftertaste*, A . orange
sour* grassy
musty
viscosity
bitter
fruity
prickling
mint
chemical* - • - 1 0 0 % sucrose
o-100% aspartame
Figure 3.4 Spider web diagram representing the mean scores for sensory attributes of a sucrose and an aspartame solution at 10% SEV (in the absence of orange aroma); * = significant differences (P < 0.01 for sweetness, P < 0.05 for other attributes).
41
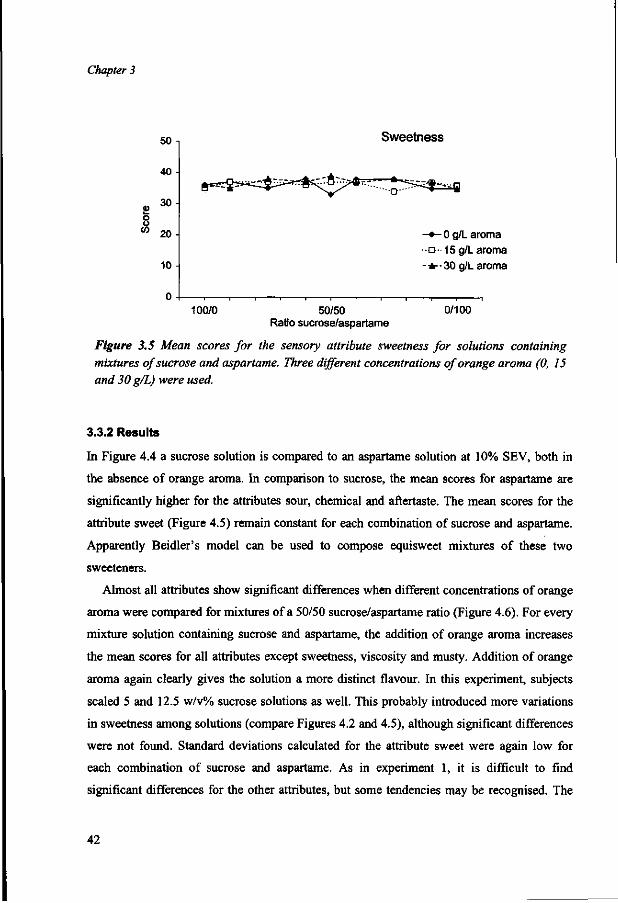
Chapter 3
50
40
30 -
20 -
10 -
Sweetness
P*»fi
- • - 0 g/L aroma •D- 15 g/L aroma -•A--30 g/L aroma
100/0 50/50 Ratio sucrose/aspartame
0/100
Figure 3.5 Mean scores for the sensory attribute sweetness for solutions containing mixtures of sucrose and aspartame. Three different concentrations of orange aroma (0, 15 and 30 g/L) were used.
3.3.2 Results
In Figure 4.4 a sucrose solution is compared to an aspartame solution at 10% SEV, both in
the absence of orange aroma. In comparison to sucrose, the mean scores for aspartame are
significantly higher for the attributes sour, chemical and aftertaste. The mean scores for the
attribute sweet (Figure 4.5) remain constant for each combination of sucrose and aspartame.
Apparently Beidler's model can be used to compose equisweet mixtures of these two
sweeteners.
Almost all attributes show significant differences when different concentrations of orange
aroma were compared for mixtures of a 50/50 sucrose/aspartame ratio (Figure 4.6). For every
mixture solution containing sucrose and aspartame, the addition of orange aroma increases
the mean scores for all attributes except sweetness, viscosity and musty. Addition of orange
aroma again clearly gives the solution a more distinct flavour. In this experiment, subjects
scaled 5 and 12.5 w/v% sucrose solutions as well. This probably introduced more variations
in sweetness among solutions (compare Figures 4.2 and 4.5), although significant differences
were not found. Standard deviations calculated for the attribute sweet were again low for
each combination of sucrose and aspartame. As in experiment 1, it is difficult to find
significant differences for the other attributes, but some tendencies may be recognised. The
42

Sensory evaluation ofmaltitol- and aspartame-sucrose mixtures
sweet
orange 50% Sucrose 50% Aspartame
prickling
sour
bitter*
fruity*
- • - 0 g/L aroma
mint* o- 15 g/L aroma
chemical* - * - -30 g/L aroma
Figure 3.6 Spider web diagram representing the mean scores for sensory attributes of a mixture solution of a 50/50 sucrose/aspartame ratio, at three concentrations of orange aroma: 0, 15 and 30 g/L; * = significant differences (P < 0.01 for sweetness, P < 0.05 for other attributes).
mean scores for the attributes sour, bitter, chemical, prickling, spicy and aftertaste tend to be
higher when more aspartame is present in the mixture (see for example Figures 4.7 and 4.8).
The contribution of orange aroma to the mean scores of the attributes is of equal magnitude
for every mixture solution. In case of interaction it is expected that the differences in mean
scores of the attributes either decrease or increase when the ratio sucrose/aspartame changes.
Therefore, interactions between aroma and sweetener are assumed to be absent. Besides, the
mean scores for the attributes orange and fruity remain fairly constant for every possible
combination of sucrose and aspartame. These attributes would change with the ratio
sucrose/aspartame, if either sucrose or aspartame implied any of these tastes.
The terms used for the comments on the aftertastes of the different solutions did not differ
from the attributes. However, solutions containing more aspartame tended to have more
aftertaste, which is mainly described by the attributes sweet and chemical. Similar to
solutions in experiment 1, solutions containing 15 or 30 g/L orange aroma provided stronger
orange, sour, fruity and chemical aftertastes in comparison to solutions without orange
aroma.
43

Chapter 3
CD
8
50
40
30 -
20
10 •
Sour
- • - 0 g/L aroma
•o- 15 g/L aroma
--A--30 g/L aroma
100/0 50/50 Ratio sucrose/aspartame
0/100
Figure 3.7 Mean scores for the sensory attribute sour for solutions containing mixtures of sucrose and aspartame. Three different concentrations of orange aroma (0, 15 and 30 g/L) were used.
3.3.3 Conclusions
Beidler's mixture equation can be used to choose combinations of the sweeteners sucrose and
aspartame having the same sweetness. The flavour profiles of mixtures containing more
aspartame as compared to those containing sucrose provide significantly higher scores on the
attributes sour, chemical and aftertaste. Different concentrations of orange aroma provide
significantly different flavour profiles.
3.4 Discussion
Beidler's mixture equation seems to be suitable for mixtures of sucrose and maltitol and for
mixtures of sucrose and aspartame. Addition of orange aroma gives the solutions a more
distinct taste. Solutions containing maltitol did not significantly differ from solutions
containing sucrose in this study, whether in absence or in the presence of orange aroma. The
same results were reported in the literature (Rapaille and Van der Schueren, 1989; Sicard and
Le Bot, 1990; Rapaille et al, 1995; Portmann and Kilcast, 1996). As expected, Beidler's
mixture equation was appropriate for mixtures of these two sweeteners, the two bulk
sweeteners seem to share the same receptor sites.
44
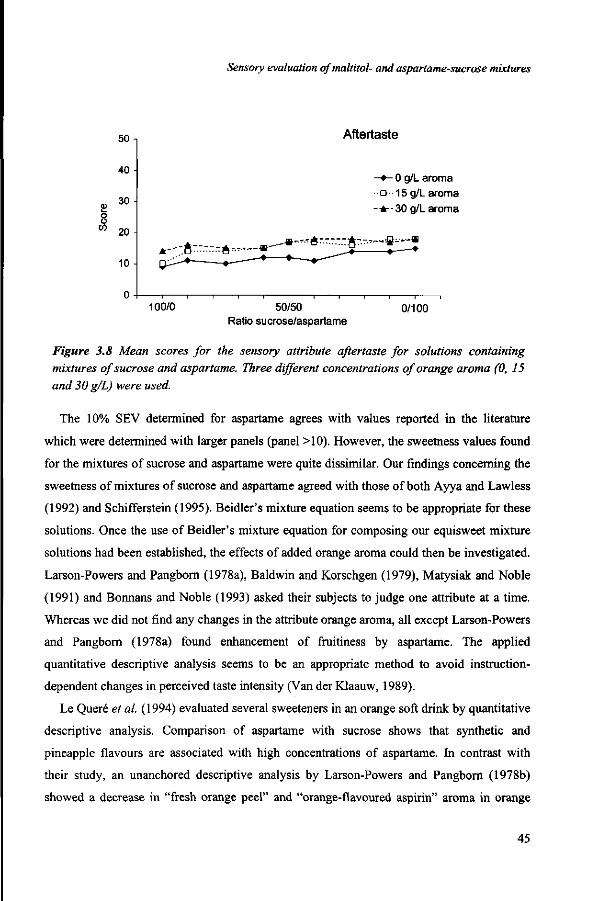
o u
CO
50
40
30
20 -
10 -
Sensory evaluation ofmaltitol- and aspartame-sucrose mixtures
Aftertaste
- • - 0 g/L aroma -o- 15 g/L aroma
--A--30 g/L aroma
§;.•*-«
100/0 50/50 Ratio sucrose/aspartame
0/100
Figure 3.8 Mean scores for the sensory attribute aftertaste for solutions containing mixtures of sucrose and aspartame. Three different concentrations of orange aroma (0, 15 and 30 g/L) were used.
The 10% SEV determined for aspartame agrees with values reported in the literature
which were determined with larger panels (panel >10). However, the sweetness values found
for the mixtures of sucrose and aspartame were quite dissimilar. Our findings concerning the
sweetness of mixtures of sucrose and aspartame agreed with those of both Ayya and Lawless
(1992) and Schifferstein (1995). Beidler's mixture equation seems to be appropriate for these
solutions. Once the use of Beidler's mixture equation for composing our equisweet mixture
solutions had been established, the effects of added orange aroma could then be investigated.
Larson-Powers and Pangborn (1978a), Baldwin and Korschgen (1979), Matysiak and Noble
(1991) and Bonnans and Noble (1993) asked their subjects to judge one attribute at a time.
Whereas we did not find any changes in the attribute orange aroma, all except Larson-Powers
and Pangborn (1978a) found enhancement of fruitiness by aspartame. The applied
quantitative descriptive analysis seems to be an appropriate method to avoid instruction-
dependent changes in perceived taste intensity (Van der Klaauw, 1989).
Le Quere et al. (1994) evaluated several sweeteners in an orange soft drink by quantitative
descriptive analysis. Comparison of aspartame with sucrose shows that synthetic and
pineapple flavours are associated with high concentrations of aspartame. In contrast with
their study, an unanchored descriptive analysis by Larson-Powers and Pangborn (1978b)
showed a decrease in "fresh orange peel" and "orange-flavoured aspirin" aroma in orange
45

Chapter 3
flavoured drinks, when comparing aspartame with sucrose. The flavour of drinks sweetened
with sucrose or aspartame was judged as sweet-chemical and bitter. The aftertaste of samples
containing sucrose or aspartame was described as "sweet-clean" (Larson-Powers and
Pangborn, 1978b). In the present study, mixtures containing more aspartame were
characterised by higher scores on attributes related to sour, bitter and chemical-related tastes.
The aftertaste of these solutions was described as sweet-chemical. The quantitative
descriptive analysis of the solutions did not reveal interactions between the sweeteners and
the orange aroma. Mixtures of sweeteners showing synergistic effects might give more
flavour effects. Orange aromas containing other flavour compounds, such as aromas based on
peel oil, could also give different results.
In conclusion, it was shown that Beidler's mixture equation is valid for mixtures of
maltitol or aspartame, sucrose and an orange aroma. Equisweet mixtures of them can be
formulated to provide a basis for studying sweetness-flavour interactions. Furthermore, a
quantitative descriptive analysis seems to be the most appropriate method for the study of
these interactions.
3.5 References
Ayya, N.; Lawless, H.T. Quantitative and qualitative evaluation of high-intensity sweeteners and sweetener mixtures. Chem. Senses 1992,17, 245-259.
Baldwin, R.E.; Korschgen, B.M. Intensification of fruit-flavors by aspartame. J. Food Sci. 1979, 44, 938-939.
Bock, R.D.; Jones, L.V. The Measurement and Prediction of Judgment and Choice; Bush, R., Ed.; Holden-Day: San Francisco, USA, 1968.
Bonnans, S.; Noble, A.C. Effect of sweetener type and of sweetener and acid levels on temporal perception of sweetness, sourness and fruitiness. Chem. Senses 1993,18, 273-283.
Bornstein, B.L.; Wiet, S.G.; Pombo, M. Sweetness adaptation of some carbohydrate and high potency sweeteners. J. Food Sci. 1993, 58, 595-598.
Cloninger, M.R.; Baldwin, R.E. L-aspartyl-L-phenylalanine methyl ester (aspartame) as a sweetener. J. Food Sci. 1974, 39, 347-349.
De Graaf, C; Frijters, J.E.R. A psychophysical investigation of Beidler's mixture equation. Chem. Senses 1986, / /, 295-314.
DuBois, G.E.; Lee, J.F. A simple technique for the evaluation of temporal taste properties. Chem. Senses 1983, 7, 237-247.
46
Sensory evaluation ofmaltitol- and aspartame-sucrose mixtures
Ennis, D. A general molecular model for the effect of multicomponent mixtures on biological
systems. Food Chem. 1996, 56, 329-335.
Faurion, A.; Saito, S.; MacLeod, P. Sweet taste involves several distinct receptor mechanisms. Chem.
Senses 1980, J, 107-121.
Frank, R.A.; Mize, S.J.S.; Carter, R. An assessment of binary mixture interactions for nine
sweeteners. Chem. Senses 1989,14, 621-632.
Guilford, J.P. Psychometric Methods; McGraw-Hill Book: New York, USA, 1954.
Hanger, L.Y.; Lotz, A.; Lepeniotis, S. Descriptive profiles of selected high intensity sweeteners
(HIS), HIS blends, and sucrose. J. Food Sci. 1996, 61, 456-458, 464.
Ketelsen, S.M.; Keay, C.L.; Wiet, S.G. Time-intensity parameters of selected carbohydrate and high
potency sweeteners. J. Food Sci. 1993, 58, 1418-1421.
Larson-Powers, N.; Pangborn, R.M. Paired comparison and time-intensity measurements of the
sensory properties of beverages and gelatins containing sucrose or synthetic sweeteners. J. Food
Sci. 1978a, 43, 41-46.
Larson-Powers, N.; Pangborn, R.M. Descriptive analysis of the sensory properties of beverages and
gelatins containing sucrose or synthetic sweeteners. J. Food Sci. 1978b, 43, 47-51.
Lawless, H.T.; Stevens, D.A. Cross adaptation of sucrose and intense sweeteners. Chem. Senses 1983,
7,309-315.
Le Quere, J.L.; Leschaeve, I.; Demaizieres, D.; Issanchou, S.; Delache, R. Chemical and sensory
effects of intense sweeteners on the flavour of diet orange soft drinks. In Trends in Flavour
Research; Maarse, H., Van der Heij, D.G., Eds.; Elsevier Science: Amsterdam, The Netherlands,
1994; pp 287-291.
Matysiak, N.L.; Noble, A.C. Comparison of temporal perception of fruitiness in model systems
sweetened with aspartame, an aspartame + acesulfame K blend, or sucrose. J. Food Sci. 1991, 56,
823-826.
Nahon, D.F.; Roozen, J.P.; De Graaf, C. Sweetness flavour interactions in soft drinks. Food Chem.
1996, 56, 283-289 (this thesis, Chapter 2).
Ott, D.B.; Edwards, C.L.; Palmer, S.J. Perceived taste intensity and duration of nutritive and non-
nutritive sweeteners in water using time-intensity (T-I) evaluations. J. Food Sci. 1991, 56, 535-
542.
Portmann, M.-O.; Kilcast, D. Psychophysical characterization of new sweeteners of commercial
importance for the EC food industry. Food Chem. 1996, 56, 291-302.
Rapaille, A.; Van der Schueren, F. Sorbitol en maltitol: functionele eigenschappen en gebruik in
suikervrije voedingsmiddelen. Voedingsmiddelen Technol. 1989, 13, 32-35.
Rapaille, A.; Gonze, M.; Van der Schueren, F. Formulating sugar-free chocolate products with
maltitol. Food Techn. 1995, 49, 51-52, 54.
Redlinger, P.A.; Setser, C.S. Sensory quality of selected sweeteners: aqueous and lipid model
systems. J. Food Sci. 1987, 52, 451-454.
Samundsen, J.A. Has aspartame an aftertaste?/ Food Sci. 1985, 50, 1510, 1512.
Schifferstein, H.N.J. Prediction of sweetness intensity for equiratio aspartame/sucrose mixtures.
Chem. Senses 1995, 20, 211-219.
47

Chapter 4
4.1 Introduction
Equisweet mixtures of sweeteners can be used as a basis for studying sweetness-flavour
interactions. In previous experiments equisweet mixtures of maltitol or aspartame, sucrose
and an orange aroma were formulated with the help of Beidler's mixture equation (Nahon et
al., 1998). A quantitative descriptive analysis (QDA) of the solutions did not reveal
interactions between the sweeteners and the orange aroma. Mixtures of sweeteners showing
synergy might affect the flavour profiles of these solutions (Nahon et al, 1996). Literature
data showed that mixtures of sucrose and Na-cyclamate give positive synergy and thus this
mixture would be interesting to study.
Synergy between sucrose and cyclamate has been described before by Yamaguchi et al.
(1970b), Hoppe (1981), Frank et al. (1989) and Portmann en Kilcast (1996b). The latter two
determined a significant synergy; Frank et al. (1989) specified this synergy to be 15%. Hoppe
(1981), on the contrary, reported a hindering between sucrose and Na-cyclamate, which
would suggest a competition between sweetener molecules for receptor sites and thus an
absence of synergy.
Showing synergy means that Beidler's mixture equation cannot be used to compose
equisweet mixtures of the sweeteners sucrose and Na-cyclamate. A different approach has
been chosen to equal their sweetness to the level of a 10 w/v% sucrose solution (denoted as
10% Sucrose Equivalent Value, SEV). Several authors reported quite different SEVs for
Na-cyclamate (Table 4.1). The background of the panellists (e.g. age, food preferences)
might account for different judgments in sensory evaluation.
The results obtained with mixtures of sucrose and maltitol or aspartame showed that
sucrose fits in the linear equation of Beidler (Nahon et al., 1998). Up to a concentration of
10w/v% sucrose, the concentration of and response to this bulk sweetener are linearly
related. The contribution of sucrose to the mixtures was thus fixed according to the chosen
ratios. The next step was addition of Na-cyclamate until a sweetness equal to 10% SEV was
reached.
Mixtures of sucrose and Na-cyclamate equisweet at 10% SEV were composed. QDA was
used to find possible interactive effects between an orange aroma and mixtures of both
sweeteners. The composition of the mixture solutions as well as the concentration of orange
aroma was varied. The overall perception of the solutions was reflected in flavour profiles
50
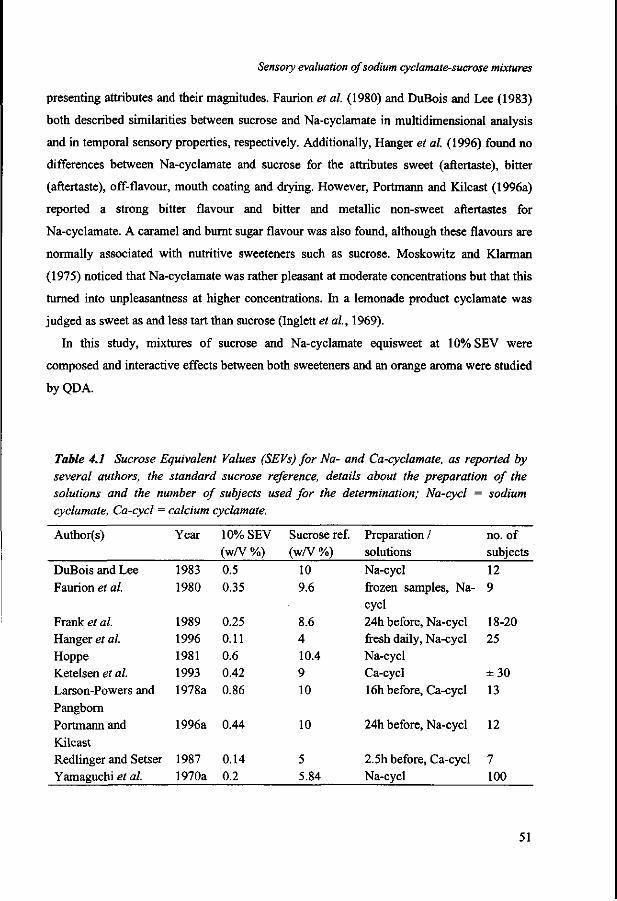
Sensory evaluation of sodium cyclamate-sucrose mixtures
presenting attributes and their magnitudes. Faurion et al. (1980) and DuBois and Lee (1983)
both described similarities between sucrose and Na-cyclamate in multidimensional analysis
and in temporal sensory properties, respectively. Additionally, Hanger et al. (1996) found no
differences between Na-cyclamate and sucrose for the attributes sweet (aftertaste), bitter
(aftertaste), off-flavour, mouth coating and drying. However, Portmann and Kilcast (1996a)
reported a strong bitter flavour and bitter and metallic non-sweet aftertastes for
Na-cyclamate. A caramel and burnt sugar flavour was also found, although these flavours are
normally associated with nutritive sweeteners such as sucrose. Moskowitz and Klarman
(1975) noticed that Na-cyclamate was rather pleasant at moderate concentrations but that this
turned into unpleasantness at higher concentrations. In a lemonade product cyclamate was
judged as sweet as and less tart than sucrose (Inglett et al, 1969).
In this study, mixtures of sucrose and Na-cyclamate equisweet at 10% SEV were
composed and interactive effects between both sweeteners and an orange aroma were studied
by QDA.
Table 4.1 Sucrose Equivalent Values (SEVs) for Na- and Ca-cyclamate, as reported by several authors, the standard sucrose reference, details about the preparation of the solutions and the number of subjects used for the determination; Na-cycl = sodium cyclamate, Ca-cycl = calcium cyclamate.
Author(s)
DuBois and Lee Faurion et al.
Frank et al. Hanger et al. Hoppe Ketelsen et al. Larson-Powers and Pangborn Portmann and Kilcast Redlinger and Setser Yamaguchi et al.
Year
1983 1980
1989 1996 1981 1993 1978a
1996a
1987 1970a
10% SEV (w/V %) 0.5 0.35
0.25 0.11 0.6 0.42 0.86
0.44
0.14 0.2
Sucrose ref. (w/V %)
10 9.6
8.6 4 10.4 9 10
10
5 5.84
Preparation / solutions Na-cycl frozen samples, Na-cycl 24h before, Na-cycl fresh daily, Na-cycl Na-cycl Ca-cycl 16h before, Ca-cycl
24h before, Na-cycl
2.5h before, Ca-cycl Na-cycl
no. of subjects 12 9
18-20 25
±30 13
12
7 100
51

Chapter 4
4.2 Materials and methods
Sensory evaluation was used to determine relative sweetnesses and to perform descriptive
analyses. Whereas stimuli and subjects were the same in both cases, the methods (10% SEV
determinations and QDA) are described separately.
4.2.1 Stimuli
Analogous with earlier experiments (Nahon et al., 1998), the stimuli were solutions of
sucrose (CSM SuikerBV, Amsterdam, The Netherlands) and of Na-cyclamate (Flevo chemie
BV, Harderwijk, The Netherlands) and mixtures of these two substances in demineralized
water. Nine sucrose/Na-cyclamate ratios (100/0, 90/10, 75/25, 60/40, 50/50, 40/60, 25/75,
10/90 and 0/100) were chosen to study possible interactive effects between sweeteners and
aroma compounds. The pH of these solutions was measured with a Metrohm (Herisau,
Switzerland) pH-meter. The overall sweetness of each mixture had to meet with a constant
perceived taste intensity of 10% SEV. The standard stimulus for the SEV determinations was
a 10 w/v% sucrose solution.
Solutions of sucrose, Na-cyclamate, acesulfame-K (Hoechst, Amsterdam, The
Netherlands), orange aroma and octanal (Merck, Hohenbrunnen, Germany) were used to
generate attributes for the QDA. The standard stimuli 'not sweet' and 'very sweet' used in
this analysis consisted of 0 and 16 w/v% sucrose, respectively. The orange aroma added to
evaluate interactive effects was a sample of the watery vapor phase of stripped orange juice
(Cargill juice division, Amsterdam, The Netherlands). It was used in concentrations of 0, 15
and 30 g/L.
All solutions were prepared at least 24 h before evaluation and stored at 4 °C overnight. In
all evaluations, a stimulus consisted of 15 mL of solution. These stimuli were presented in a
glass jar, covered by a plastic lid and aluminium foil to prevent interactions between the
plastic and the orange aroma. The stimuli were presented to the panel at room temperature
(22 °C).
4.2.2 Subjects
The panel for both sensory evaluations (at least 18 subjects) was chosen from a pool of 25
paid subjects (7 men and 18 women), ranging in age from 19 to 26 years. These subjects were
52
Sensory evaluation of sodium cyclamate-sucrose mixtures
selected and trained for the two experiments. Most subjects were students of Wageningen
Agricultural University, some of them having prior experience of psychophysical
experiments. Informed consents were obtained from the subjects and the study was approved
by the Medical Ethical Commission of Wageningen Agricultural University. Subjects were
instructed to taste according to the sip-and-spit method, the time intervals between stimuli
being kept at 60 s. After tasting of a solution, the subjects neutralized their mouth with water
and crackers. Information from the survey was gathered by a computer interactive
interviewing system (Ci2 system, Sawtooth Software Inc., Ketchum, USA).
4.2.3 SEV determinations
Equisweet mixtures of the sweeteners sucrose and Na-cyclamate were composed by fixing
the contribution of sucrose to the mixtures, according to the chosen ratios. Na-cyclamate was
added until a sweetness of 10% SEV was reached (the partial SEV of Na-cyclamate). The
extent of this addition was determined using the method of constant stimuli (Guilford, 1954)
and weighted linear regression analysis (Bock and Jones, 1968). The panel was presented the
standard stimulus, which is the 10 w/v% sucrose solution and seven comparison stimuli.
These consist of a fixed amount of sucrose and amounts of Na-cyclamate that vary
exponentially near the expected partial SEV for Na-cyclamate. The determination of this
partial SEV further follows the method as described by De Graaf and Frijters (1986). At least
252 datapoints were used for the determination of the composition of one ratio mixture
(correlation coefficients of weighted linear regressions > 0.91). This method was then
repeated for all nine ratio mixtures, which provides the composition of mixtures matching a
10% SEV.
53
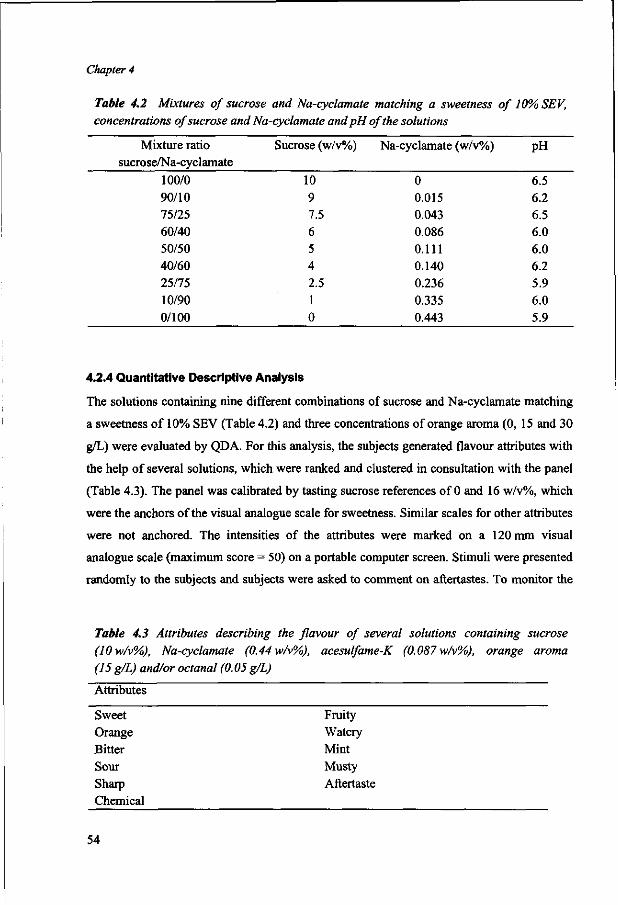
Chapter 4
Table 4.2 Mixtures of sucrose and Na-cyclamate matching a sweetness of 10% SEV, concentrations of sucrose and Na-cyclamate and pH of the solutions
Mixture ratio sucrose/Na-cyclamate
100/0 90/10 75/25 60/40 50/50 40/60 25/75 10/90 0/100
Sucrose (w/v%)
10 9 7.5 6 5 4 2.5 1 0
Na-cyclamate (w/v%)
0 0.015 0.043 0.086 0.111 0.140 0.236 0.335 0.443
pH
6.5 6.2 6.5 6.0 6.0 6.2 5.9 6.0 5.9
4.2.4 Quantitative Descriptive Analysis
The solutions containing nine different combinations of sucrose and Na-cyclamate matching
a sweetness of 10% SEV (Table 4.2) and three concentrations of orange aroma (0, 15 and 30
g/L) were evaluated by QDA. For this analysis, the subjects generated flavour attributes with
the help of several solutions, which were ranked and clustered in consultation with the panel
(Table 4.3). The panel was calibrated by tasting sucrose references of 0 and 16 w/v%, which
were the anchors of the visual analogue scale for sweetness. Similar scales for other attributes
were not anchored. The intensities of the attributes were marked on a 120 mm visual
analogue scale (maximum score = 50) on a portable computer screen. Stimuli were presented
randomly to the subjects and subjects were asked to comment on aftertastes. To monitor the
Table 4.3 Attributes describing the flavour of several solutions containing sucrose (10w/v%), Na-cyclamate (0.44 w/v%), acesulfame-K (0.087w/v%), orange aroma (15 g/L) and/or octanal (0.05 g/L)
Attributes
Sweet Fruity Orange Watery Bitter Mint Sour Musty Sharp Aftertaste Chemical
54
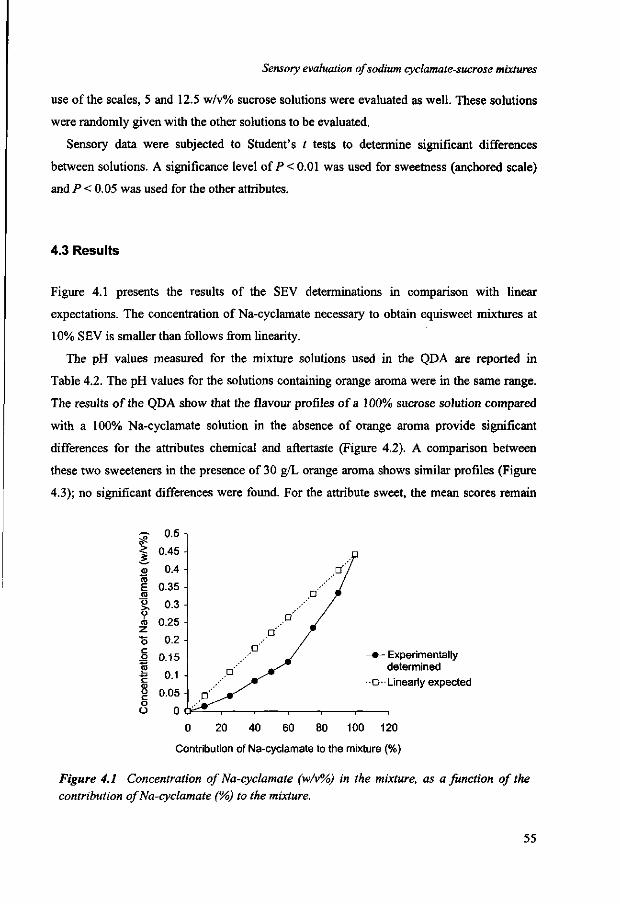
Sensory evaluation of sodium cyclamate-sucrose mixtures
use of the scales, 5 and 12.5 w/v% sucrose solutions were evaluated as well. These solutions
were randomly given with the other solutions to be evaluated.
Sensory data were subjected to Student's t tests to determine significant differences
between solutions. A significance level of P< 0.01 was used for sweetness (anchored scale)
and P < 0.05 was used for the other attributes.
4.3 Results
Figure 4.1 presents the results of the SEV determinations in comparison with linear
expectations. The concentration of Na-cyclamate necessary to obtain equisweet mixtures at
10% SEV is smaller than follows from linearity.
The pH values measured for the mixture solutions used in the QDA are reported in
Table 4.2. The pH values for the solutions containing orange aroma were in the same range.
The results of the QDA show that the flavour profiles of a 100% sucrose solution compared
with a 100% Na-cyclamate solution in the absence of orange aroma provide significant
differences for the attributes chemical and aftertaste (Figure 4.2). A comparison between
these two sweeteners in the presence of 30 g/L orange aroma shows similar profiles (Figure
4.3); no significant differences were found. For the attribute sweet, the mean scores remain
~̂. > £ ro E <0
o ro z "o c o
ro c o c o O
0.5 •,
0.45 -
0.4 -
0.35
0.3 •
0.25
0.2
0.15
0.1 •
0.05 -
0 C
• - Experimentally determined
o - Linearly expected
0 20 40 60 80 100 120
Contribution of Na-cyclamate to the mixture (%)
Figure 4.1 Concentration of Na-cyclamate (w/v%) in the mixture, as a function of the contribution of Na-cyclamate (%) to the mixture.
55
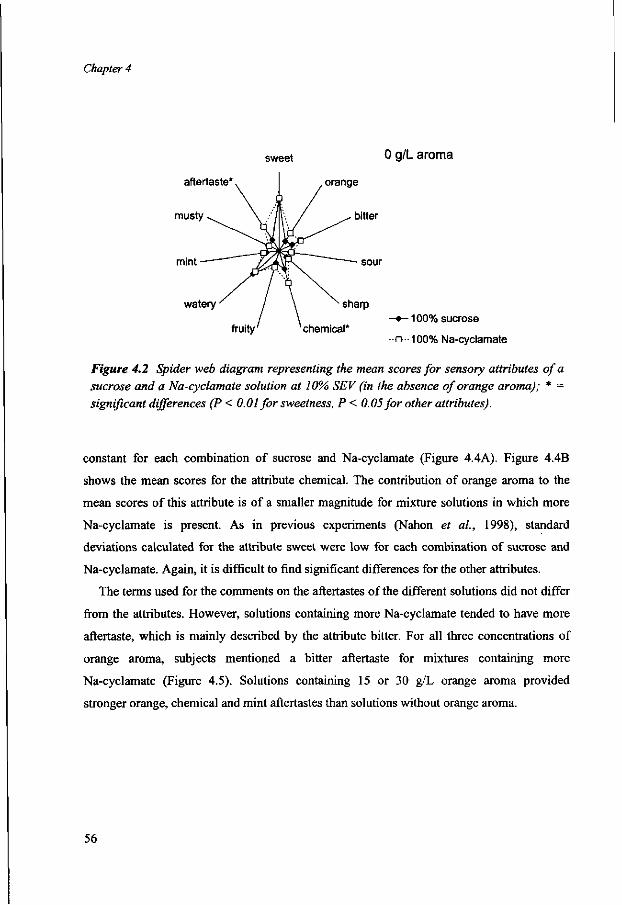
Chapter 4
sweet ° 9 / L a roma
aftertaste*. . orange
musty v. \ ••'['• / ^ ^ bitter
mint — A^4Ark " sour
/ \ - • - 1 0 0 % sucrose fruity chemical*
•o- 100% Na-cyclamate
Figure 4.2 Spider web diagram representing the mean scores for sensory attributes of a sucrose and a Na-cyclamate solution at 10% SEV (in the absence of orange aroma); * = significant differences (P < 0.01 for sweetness, P < 0.05 for other attributes).
constant for each combination of sucrose and Na-cyclamate (Figure 4.4A). Figure 4.4B
shows the mean scores for the attribute chemical. The contribution of orange aroma to the
mean scores of this attribute is of a smaller magnitude for mixture solutions in which more
Na-cyclamate is present. As in previous experiments (Nahon et al, 1998), standard
deviations calculated for the attribute sweet were low for each combination of sucrose and
Na-cyclamate. Again, it is difficult to find significant differences for the other attributes.
The terms used for the comments on the aftertastes of the different solutions did not differ
from the attributes. However, solutions containing more Na-cyclamate tended to have more
aftertaste, which is mainly described by the attribute bitter. For all three concentrations of
orange aroma, subjects mentioned a bitter aftertaste for mixtures containing more
Na-cyclamate (Figure 4.5). Solutions containing 15 or 30 g/L orange aroma provided
stronger orange, chemical and mint aftertastes than solutions without orange aroma.
56
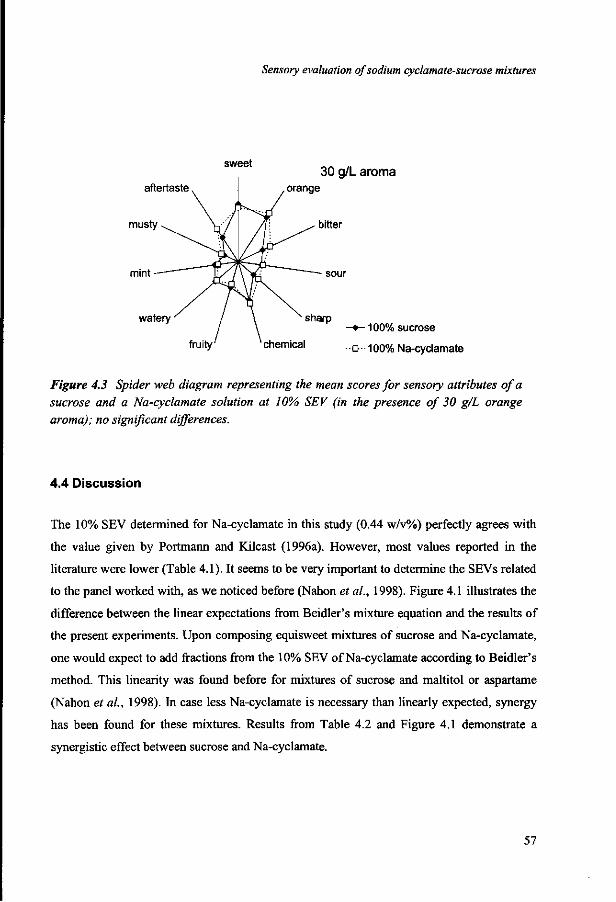
Sensory evaluation of sodium cyclamate-sucrose mixtures
30 g/L aroma orange
musty ^ V• I /\\ ^, bitter
mint
sharp - • - 1 0 0 % sucrose
chemical - o - 100% Na-cyclamate
Figure 4.3 Spider web diagram representing the mean scores for sensory attributes of a sucrose and a Na-cyclamate solution at 10% SEV (in the presence of 30 g/L orange aroma); no significant differences.
4.4 Discussion
The 10% SEV determined for Na-cyclamate in this study (0.44 w/v%) perfectly agrees with
the value given by Portmann and Kilcast (1996a). However, most values reported in the
literature were lower (Table 4.1). It seems to be very important to determine the SEVs related
to the panel worked with, as we noticed before (Nahon et al., 1998). Figure 4.1 illustrates the
difference between the linear expectations from Beidler's mixture equation and the results of
the present experiments. Upon composing equisweet mixtures of sucrose and Na-cyclamate,
one would expect to add fractions from the 10% SEV of Na-cyclamate according to Beidler's
method. This linearity was found before for mixtures of sucrose and maltitol or aspartame
(Nahon et al, 1998). In case less Na-cyclamate is necessary than linearly expected, synergy
has been found for these mixtures. Results from Table 4.2 and Figure 4.1 demonstrate a
synergistic effect between sucrose and Na-cyclamate.
57
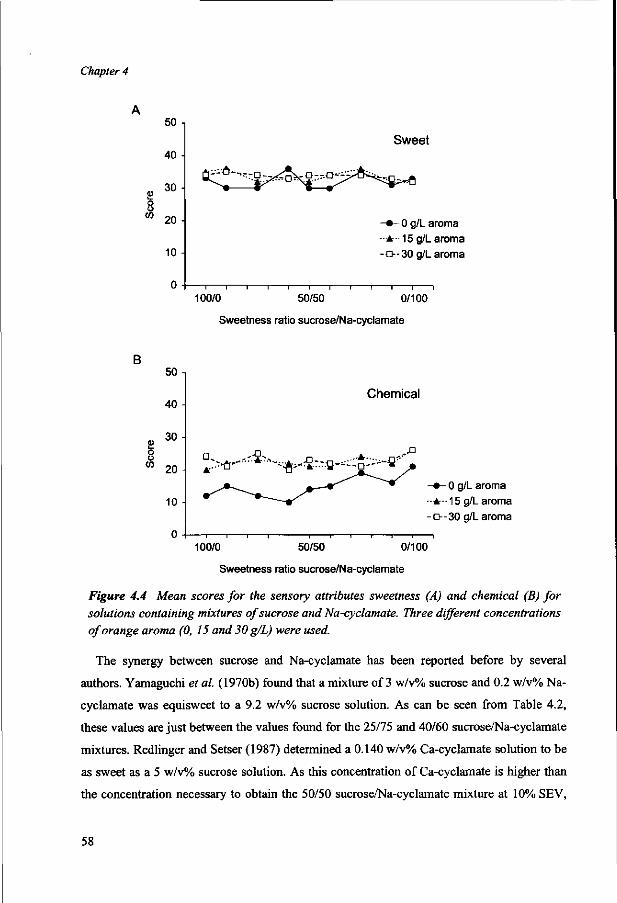
Chapter 4
50
40 -
30 -
20 -
10
Sweet
- • - 0 g/L aroma •A- -• 15 g/L aroma -a--30 g/L aroma
1 r
100/0 50/50 0/100
Sweetness ratio sucrose/Na-cyclamate
B
o o
OU -i
40 •
30 -
20
10 -
0 -
Chemical
0- - ' 5 - , r, .-A-.... nr.''D
1 1 1 1 1 1 1 1 1 1 1 1
0 g/L aroma
A--15 g/L aroma
-a--30 g/L aroma
100/0 50/50 0/100
Sweetness ratio sucrose/Na-cyclamate
Figure 4.4 Mean scores for the sensory attributes sweetness (A) and chemical (B) for solutions containing mixtures of sucrose and Na-cyclamate. Three different concentrations of orange aroma (0, 15 and 30 g/L) were used.
The synergy between sucrose and Na-cyclamate has been reported before by several
authors. Yamaguchi et al. (1970b) found that a mixture of 3 w/v% sucrose and 0.2 w/v% Na-
cyclamate was equisweet to a 9.2 w/v% sucrose solution. As can be seen from Table 4.2,
these values are just between the values found for the 25/75 and 40/60 sucrose/Na-cyclamate
mixtures. Redlinger and Setser (1987) determined a 0.140 w/v% Ca-cyclamate solution to be
as sweet as a 5 w/v% sucrose solution. As this concentration of Ca-cyclamate is higher than
the concentration necessary to obtain the 50/50 sucrose/Na-cyclamate mixture at 10% SEV,
58
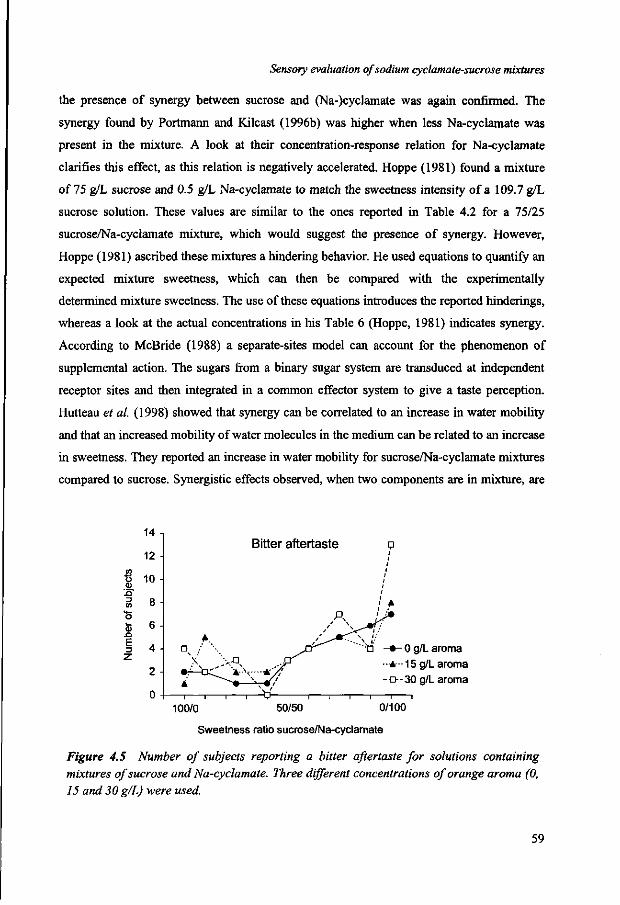
Sensory evaluation of sodium cyclamate-sucrose mixtures
the presence of synergy between sucrose and (Na-)cyclamate was again confirmed. The
synergy found by Portmann and Kilcast (1996b) was higher when less Na-cyclamate was
present in the mixture. A look at their concentration-response relation for Na-cyclamate
clarifies this effect, as this relation is negatively accelerated. Hoppe (1981) found a mixture
of 75 g/L sucrose and 0.5 g/L Na-cyclamate to match the sweetness intensity of a 109.7 g/L
sucrose solution. These values are similar to the ones reported in Table 4.2 for a 75/25
sucrose/Na-cyclamate mixture, which would suggest the presence of synergy. However,
Hoppe (1981) ascribed these mixtures a hindering behavior. He used equations to quantify an
expected mixture sweetness, which can then be compared with the experimentally
determined mixture sweetness. The use of these equations introduces the reported hinderings,
whereas a look at the actual concentrations in his Table 6 (Hoppe, 1981) indicates synergy.
According to McBride (1988) a separate-sites model can account for the phenomenon of
supplemental action. The sugars from a binary sugar system are transduced at independent
receptor sites and then integrated in a common effector system to give a taste perception.
Hutteau et al. (1998) showed that synergy can be correlated to an increase in water mobility
and that an increased mobility of water molecules in the medium can be related to an increase
in sweetness. They reported an increase in water mobility for sucrose/Na-cyclamate mixtures
compared to sucrose. Synergistic effects observed, when two components are in mixture, are
<0
0)
E
14
12
10
8 -i
6
4
2
0
Bitter aftertaste
.' A
• * - 0 g/L aroma ±-••15 g/L aroma a--30 g/L aroma
100/0 50/50 0/100
Sweetness ratio sucrose/Na-cyclamate
Figure 4.5 Number of subjects reporting a bitter aftertaste for solutions containing mixtures of sucrose and Na-cyclamate. Three different concentrations of orange aroma (0, 15 and 30 g/L) were used.
59
Chapter 4
specific and depend on the compatibility of the hydration of each component and their
influence on water structure.
Synergistic mixtures of sweeteners might show interactive effects with aroma compounds.
The pH values measured for mixture solutions containing orange aroma were in the range of
the pH values reported in Table 4.2. Apparently, the addition of orange aroma has no
influence on the pH of the solutions. The results of the QDA are presented in Figures 4.2-4.5.
Figure 4.2 shows a comparison between a sucrose solution and a Na-cyclamate solution at
10% SEV, both in the absence of orange aroma. In comparison with sucrose, the mean scores
for Na-cyclamate are significantly higher for the attributes chemical and aftertaste. The
observed significant difference for the attribute aftertaste is quite common for intense
sweeteners. The results agree with the findings of Portmann and Kilcast (1996a). Other
authors (Faurion et al, 1980; DuBois and Lee, 1983; Hanger et al, 1996) reported more
similarities between sucrose and Na-cyclamate. In the descriptive analysis by Larson-Powers
and Pangborn (1978b) samples containing Ca-cyclamate were characterised as "sweet-
chemical" and "bitter"; they also had a cloying, "sticky-sweet" and "medicinal" aftertaste.
Overall differences between Ca-cyclamate and sucrose were not found by Ketelsen et al.
(1993), although Ca-cyclamate tends to have a longer aftertaste than sucrose. When a 100%
sucrose and a 100% Na-cyclamate solution in the presence of 30 g/L orange aroma were
compared (Figure 4.3), no significant differences were found. Apparently, the addition of
orange aroma levels out differences mentioned for sucrose and Na-cyclamate.
Sweetnesses for all mixtures were kept at 10% SEV, as can be deduced from Figure 4.4A.
The mean scores for the attribute sweet remain constant for each combination of sucrose and
Na-cyclamate. The addition of orange aroma has no effect on these mean scores, as subjects
accurately separate the scores on the different attributes, following the applied QDA method.
The lines representing the mean scores for the attribute chemical for the three concentrations
of orange aroma (Figure 4.4B) converge when more Na-cyclamate is present in the mixture.
The addition of orange aroma accounts for this effect; the significant differences between
sucrose and Na-cyclamate were levelled out. Comparison of Figures 4.2 and 4.3 illustrates
the effect of an addition of orange aroma. For solutions containing Na-cyclamate only three
attributes (orange, sour and sharp) increase significantly, whereas for sucrose seven attributes
change significantly (orange, sour, chemical, fruity, watery, mint and aftertaste). When more
sucrose is present in the mixtures, initial scores are relatively low and an addition of orange
60
Sensory evaluation of sodium cyclamate-sucrose mixtures
aroma substantially contributes to the mean scores. The addition of orange aroma then clearly
gives the solutions a more distinct flavour. As Na-cyclamate gives higher mean scores on
most of the attributes (Figure 4.2), an addition of orange aroma hardly increases these scores,
according to the Weber ratio. For all mixture solutions, addition of orange aroma
significantly increases the mean scores for the attribute orange. As expected, the addition of
30 g/L orange aroma did not double the mean scores obtained with 15 g/L orange aroma
(Nahon etal, 1998).
Comments on the aftertaste of the different solutions show that the significantly higher
scores of Na-cyclamate on this attribute (Figure 4.2) can be ascribed to a lingering bitterness.
The bitter aftertaste mentioned for mixtures containing more Na-cyclamate, appears
especially for the sweetness ratios 25/75,10/90 and 0/100 sucrose/Na-cyclamate (Figure 4.5).
Time-intensity measurements by Larson-Powers and Pangborn (1978a) showed a greater
sourness and a marked, persistent bitterness of Ca-cyclamate compared to sucrose. Hanger et
al. (1996) and Portmann and Kilcast (1996a) reported bitter aftertastes as well. The mean
scores for the attribute aftertaste decrease as soon as a slight amount of sucrose is present in
the mixture. The presence of sucrose in the mixture solution might change the system in such
a way that effects of Na-cyclamate are suppressed immediately. Addition of orange aroma
increases the orange, chemical and mint aftertastes of solutions.
In conclusion, it was shown that mixtures of sucrose and Na-cyclamate are synergistic.
With the help of SEV determinations equisweet mixtures were composed, which form an
optimal basis for the study of sweetener-flavour interactions. A QDA then showed a levelling
effect of orange aroma for significant differences observed between sucrose and Na-
cyclamate.
4.5 References
Bock, R.D.; Jones, L.V. The Measurement and Prediction of Judgment and Choice; Bush, R., Ed.;Holden-Day: San Francisco, USA, 1968.
De Graaf, C; Frijters, J.E.R. A psychophysical investigation of Beidler's mixture equation. Chem. Senses 1986,11, 295-314.
DuBois, G.E.; Lee, J.F. A simple technique for the evaluation of temporal taste properties. Chem. Senses 1983, 7, 237-247.
Faurion, A.; Saito, S.; MacLeod, P. Sweet taste involves several distinct receptor mechanisms. Chem. Senses 1980, 5, 107-121.
61
Chapter 4
Frank, R.A.; Mize, S.J.S.; Carter, R. An assessment of binary mixture interactions for nine
sweeteners. Chem. Senses 1989,14, 621-632.
Guilford, J.P. Psychometric Methods; McGraw-Hill Book: New York, NY, 1954.
Hanger, L.Y.; Lotz, A. ; Lepeniotis, S. Descriptive profiles of selected high intensity sweeteners
(HIS), HIS blends, and sucrose. J. FoodSci. 1996, 61, 456-458, 464.
Hoppe, K. BeitrSge zur Psychophysik des Su(3geschmacks 3. Mitt. Uber den Einflup verschiedener
Mischungen von Saccharose, Saccharin und Cyclamat auf die SuPintensitat wapSriger Losungen
(Contribution to the psychophysics of sweet taste. Part III. On the effect of various mixtures of
saccharose, saccharin and cyclamate on the sweetness of aqueous solutions). Die Nahrung 1981, 25, 769-777.
Hutteau, F.; Mathlouthi, M.; Portmann, M.O.; Kilcast, D. Physicochemical and psychophysical
characteristics of binary mixtures of bulk and intense sweeteners. Food Chem. 1998, 63, 9-16.
Inglett, G.E.; Krbechek, L.; Dowling, B.; Wagner, R. Dihydrochalcone sweeteners - sensory and
stability evaluation. J. Food Sci. 1969, 34,101-103.
Ketelsen, S.M.; Keay, C.L.; Wiet, S.G. Time-intensity parameters of selected carbohydrate and high
potency sweeteners. J. Food Sci. 1993, 58, 1418-1421.
Larson-Powers, N.; Pangborn, R.M. Paired comparison and time-intensity measurements of the
sensory properties of beverages and gelatins containing sucrose or synthetic sweeteners. J. Food
Sci. 1978a, 43, 41-46.
Larson-Powers, N.; Pangborn, R.M. Descriptive analysis of the sensory properties of beverages and
gelatins containing sucrose or synthetic sweeteners. J. Food Sci. 1978b, 43, 47-51.
McBride, R.L. Taste reception of binary sugar mixtures: Psychophysical comparison of two models.
Percept. Psychophys. 1988, 44, 167-171.
Moskowitz, H.R.; Klarman, L. The hedonic tones of artificial sweeteners and their mixtures. Chem.
Senses Flavor 1975,1, 423-429.
Nahon, D.F.; Roozen, J.P.; De Graaf, C. Sweetness flavour interactions in soft drinks. Food Chem.
1996, 56, 283-289 (this thesis, Chapter 2).
Nahon, D.F.; Roozen, J.P.; De Graaf, C. Sensory evaluation of mixtures of maltitol or aspartame,
sucrose and an orange aroma. Chem. Senses 1998, 23, 59-66 (this thesis, Chapter 3).
Portmann, M.-O.; Kilcast, D. Psychophysical characterization of new sweeteners of commercial
importance for the EC food industry. Food Chem. 1996a, 56, 291-302.
Portmann, M.-O.; Kilcast, D. Psychophysical characteristics of binary mixtures of bulk and intense
sweeteners. In Abstracts ECRO XII Symposium Zurich, August 25-31; ETH: Zurich, 1996b; p. 63.
Redlinger, P.A.; Setser, C.S. Sensory quality of selected sweeteners: aqueous and lipid model
systems. J. Food Sci. 1987, 52, 451-454.
Yamaguchi, S.; Yoshikawa, T.; Ikeda, S.; Ninomiya, T. Studies on the taste of some sweet substances.
Part I. Measurement of the relative sweetness. Agric. Biol. Chem. 1970a, 34, 181-186.
Yamaguchi, S.; Yoshikawa, T.; Ikeda, S.; Ninomiya, T. Studies on the taste of some sweet substances.
Part II. Interrelationships among them. Agric. Biol. Chem. 1970b, 34, 187-197.
This research was financially supported by EC Grant PL94-2102.
62
5 Sensory evaluation of ternary mixtures of sodium cyclamate, aspartame, sucrose and an orange aroma
Ternary mixtures of sucrose, aspartame and Na-cyclamate were studied in the presence of an orange aroma. Equisweet mixtures of the sweeteners were composed, which account for the observed synergistic effects between the sweeteners. The sweetness contributions of sucrose and Na-cyclamate were fixed on forehand according to their synergy, and the matching concentration of aspartame was determined. The composition of the equisweet ternary mixtures was described in a regression equation. The mixtures of aspartame and Na-cyclamate exhibited more synergy than the mixtures of sucrose and Na-cyclamate. Sucrose and aspartame were exchangeable in the sense that the synergy observed for the ternary mixture was a linear combination of the synergies of the binary mixtures.
The flavour profiles of combinations of the mixtures and an orange aroma were obtained with the help of quantitative descriptive analysis and indicated possible interactive effects between the sweeteners and the orange aroma. The sweetness contribution of Na-cyclamate to the ternary mixtures determined the flavour profile of this mixture to a large extent. The ternary mixtures containing mainly Na-cyclamate were described as being more chemical, bitter and musty and having more aftertaste. Further comments on this aftertaste revealed the descriptions bitter and chemical.
This chapter has been submitted as:
Nahon, D.F.; Roozen, J.P.; De Graaf, C. Chemical Senses
63
Chapter 5
5.1 Introduction
Observed flavour differences between regular and light beverages gave rise to various studies
involving sweeteners and aroma compounds. Muir et al. (1998) studied the influence of
sweetener type on the sensory profiles of commercial fruit juice drinks. Differences noticed
between the effects of sweetener combinations provide a basis for further studies of
sweetener-aroma interactions. Instrumental methods were also used to determine the
interaction of aroma compounds with sweeteners. Reineccius et al. (1998) indicated in such a
study that significant differences observed in the headspace analysis of sweetened beverages
needed to be checked for sensory significance. A rather direct comparison between sensory
and instrumental analysis (Nahon et al, 1998a) showed that this sensory significance was not
found for beverages containing Na-cyclamate, sucrose and an orange aroma. In a preliminary
experiment with a commercial light blackcurrant soft drink, a modulation of the
concentrations of the four intense sweeteners in the drink caused shifts in the flavour
descriptions of the drink (Nahon et al, 1996).
Equisweet mixtures of sweeteners form an optimal basis for the study of sweetener-aroma
interactions. It was demonstrated that Beidler's mixture equation can be used to describe the
sweetness of the binary sucrose/maltitol and sucrose/aspartame mixtures (Nahon et al,
1998b), which means that these mixtures behave linear: they do not show any synergistic
effects. For mixtures of sucrose and Na-cyclamate synergy was observed and precisely
described (Nahon et al, 1998c). To approach the effect observed with the quaternary mixture
of sweeteners, ternary mixtures are of interest for study. A combination of sucrose, aspartame
and Na-cyclamate will be the next step towards the study of the complexity of mixtures
containing more than two components. In this combination, the behaviour of the mixture of
aspartame and Na-cyclamate is unknown. The ternary mixtures studied, will be chosen in
such a way that possible synergistic effects between aspartame and Na-cyclamate or for the
ternary mixture as a whole, will be revealed.
Ternary mixtures can be visualised by a plane in a three dimensional coordinate system,
with the axes sucrose, aspartame and Na-cyclamate, respectively (Figure 5.1). The extremes
of the triangle in this coordinate system, will be set by the 10% Sucrose Equivalent Values
(SEVs) for the three sweeteners. The triangle between these points then indicates the linear
expectations. As synergy between sucrose and Na-cyclamate was already shown and synergy
64

Ternary sweetener mixtures
Aspartame (w/v%)
10%SEV intersection curve 1
intersection curve 2
Sucrose (w/v%) 10% SEV
Na-cyclamate (w/v%)
Figure 5.1 Linear expectations for equisweet ternary mixtures represented in a three dimensional coordinate system. Intersection curve 1: concentration of Na-cyclamate constant, intersection curve 2: ratio sucrose/aspartame constant.
between aspartame and Na-cyclamate can be expected, a concave triangle will probably
represent the experimental plane at a total sweetness of 10% SEV. The experimental plane
will be defined by equisweet mixtures of sucrose, aspartame and Na-cyclamate. To determine
these equisweet mixtures the concentrations of sucrose and Na-cyclamate will be chosen on
forehand, deducted from the results obtained in the sucrose-Na-cyclamate experiment (Nahon
et al, 1998c). With the help of partial SEV determinations (Nahon et al, 1998c) we will
determine how much aspartame should be added to the sucrose/Na-cyclamate mixture to
obtain a sweetness equivalent to the sweetness of a 10 w/v% sucrose solution. In the first part
of the experiment, the sweetness contribution of Na-cyclamate to the mixture will be fixed at
50%. In this way, intersection curve 1 (Figure 5.1) through the triangle plane in the three
dimensional coordinate system will be studied. The second part of the experiment will deal
with intersection curve 2 (Figure 5.1), which consists of increasing concentrations of Na-
cyclamate, with a constant sucrose/aspartame ratio.
Synergy observed in ternary mixtures has been reported before (Schiffman et al, 1996),
however, a complete set of results has never been published. Within the ternary mixture
sucrose/aspartame/Na-cyclamate, we have studied the binary mixtures sucrose/aspartame and
sucrose/Na-cyclamate, but not aspartame/Na-cyclamate. Bakal (1983) indicated the presence
of synergy between aspartame and cyclamates and reported that combinations of these two
sweeteners in aqueous solutions exhibit superior taste qualities over the single sweetener
65
Chapter 5
solutions (Bakal, 1991). Schiffman et al. (1979) studied qualitative differences among
sweeteners with the help of multidimensional scaling techniques and found that Ca-cyclamate
and aspartame fell closest to and thus tasted most like the sugars. These sweeteners also
clustered in the multidimensional analysis by Faurion et al. (1980). Frank et al. (1989)
established the presence of significant synergy (20%) between aspartame and cyclamate.
Schiffman et al. (1996) suggested in their abstract that the synergy observed for binary
mixtures was larger than that for ternary mixtures of sweeteners.
Mixtures of sweeteners were described in theoretical models (e.g. Beidler, 1971) and by
empirical fitting equations (e.g. Moskowitz et al, 1978). Laffort (1989) applied his empirical
models for odor mixtures to the mixtures studied by De Graaf and Frijters (1986) and
describes models for ternary mixtures as well (Laffort and Dravnieks, 1982). Most models
start from the intensities of the components of the mixtures, for which the individual
concentration-response relationships should be known. For the ternary mixture studied in the
present experiment, an empirical fitting equation was established, which is useful for the
calculation of the composition of equisweet mixtures in practice. Furthermore, this equation
can be used to obtain information on the aspartame/Na-cyclamate mixtures.
The equisweet ternary mixtures obtained are essential to study the interactive effects with
aroma compounds by quantitative descriptive analysis (QDA). Analogous to earlier
experiments, the ternary mixtures were studied in the presence of a water soluble orange
aroma. Sucrose/aspartame mixtures did not show interactive effects with the orange aroma
added (Nahon et al, 1998b). However, orange aroma levelled out taste differences detected
between sucrose and Na-cyclamate solutions (Nahon et al, 1998c).
In this study, ternary mixtures of sucrose, aspartame and Na-cyclamate, equisweet at 10%
SEV were composed and described in a regression equation. Interactive effects between the
sweeteners and an orange aroma were studied by QDA.
5.2 Materials and methods
Equisweet ternary mixtures were determined with the help of sensory evaluation and
afterwards descriptive analyses were performed. Subjects and stimuli were the same in both
cases, but the methods (10% SEV determinations and QDA) differed and are therefore
described separately.
66
Ternary sweetener mixtures
5.2.1 Subjects
The panel for both sensory evaluations (19-24 subjects) was chosen from a pool of 28 paid
subjects (7 men and 21 women), ranging in age from 20 to 24 years. Some of these subjects
(13) participated in earlier experiments, others were selected from a pool of 24 subjects
participating in the selections for the present experiment. All subjects were trained for the
two experiments. Most subjects were (former) students of Wageningen University and
Research Centre, some of them having prior experience of psychophysical experiments.
Informed consents were obtained from the subjects and the study was approved by the
Medical Ethical Commission of Wageningen University and Research Centre. Subjects were
instructed to taste according to the sip-and-spit method, the time intervals between stimuli
were kept at 60 s. The subjects used water and crackers to neutralise their mouth after tasting
of a solution. A computer interactive interviewing system (Ci2 system, Sawtooth Software
Inc., Ketchum, USA) was used to gather survey information.
5.2.2 Stimuli
Analogous to earlier experiments (Nahon et al, 1998b and c) the stimuli were solutions of
sucrose, aspartame (Holland Sweetener Company, Maastricht, The Netherlands) and Na-
cyclamate (Flevo Chemie BV, Harderwijk, The Netherlands) and mixtures of these three
substances in demineralised water. Different sucrose/aspartame/Na-cyclamate ratios were
chosen to study possible interactive effects between sweeteners and aroma compounds. The
pH of the solutions was measured with a Metrohm (Herisau, Switzerland) pH-meter. The
overall sweetness of each mixture had to meet with a constant perceived taste intensity of
10% SEV. The standard stimulus for the SEV determinations was a 10 w/v% sucrose
solution.
Solutions of sucrose, aspartame, Na-cyclamate, orange aroma and octanal (Merck,
Hohenbrunnen, Germany) were used to generate attributes for the QDA. The standard stimuli
'not sweet' and 'very sweet' used in this analysis consisted of 0 and 16 w/v% sucrose,
respectively. The orange aroma added to evaluate interactive effects was a sample of the
watery vapor phase of stripped orange juice (Cargill juice division, Amsterdam, The
Netherlands). It was used in concentrations of 0, 15 and 30 g/L.
All solutions were prepared at least 24 h before evaluation and stored at 4 °C overnight. In
all evaluations, a stimulus consisted of 15 mL of solution. These stimuli were presented in a
67

Chapter 5
glass jar, covered by a plastic lid and aluminium foil to prevent interactions between the
plastic and the orange aroma. The stimuli were presented to the panel at room temperature
(22 °C).
5.2.3 SEV determinations
As a new panel and a new batch of Na-cyclamate was used in the present experiment, the
10% SEV values for aspartame and Na-cyclamate were determined once more (as compared
to Nahon et al, 1998b and c). The partial SEV for Na-cyclamate in the 50/50 sucrose/Na-
cyclamate mixture was set again as well (Nahon et al, 1998c). Next, equisweet mixtures of
the sweeteners sucrose, aspartame and Na-cyclamate were composed by fixing the
contributions of sucrose and Na-cyclamate to the mixtures, according to the chosen ratios.
Aspartame was added until a sweetness of 10% SEV was reached (the partial SEV of
aspartame). The extent of this addition was determined using the method of constant stimuli
(Guilford, 1954) and weighted linear regression analysis (Bock and Jones, 1968). The panel
was presented the standard stimulus, which is the 10 w/v% sucrose solution, and seven
comparison stimuli. These consist of fixed amounts of sucrose and Na-cyclamate and
amounts of aspartame which vary exponentially near the expected partial SEV for aspartame.
The determination of this partial SEV further follows the method as described by De Graaf
and Frijters (1986). According to this method, the standard and the comparison stimulus are
tasted in both orders. McBride (1988) verified this procedure by finding a significant effect of
order of tasting, with the first solution tasted being identified as sweeter. In this way, at least
266 datapoints were used for the determination of the composition of one ratio mixture
(correlation coefficients of weighted linear regressions > 0.91). This method was then
repeated for all ratio mixtures, providing the composition of ternary mixtures matching a
10% SEV.
5.2.4 Quantitative Descriptive Analysis
The solutions containing different combinations of sucrose, aspartame and Na-cyclamate
matching a sweetness of 10% SEV (Table 5.1) and three concentrations of orange aroma (0,
15 and 30 g/L) were evaluated by QDA. For this analysis, 23 subjects generated flavour
attributes with the help of several solutions, which were ranked and clustered in consultation
with the panel (Table 5.2). The panel was calibrated by tasting sucrose references of 0 and 16
68
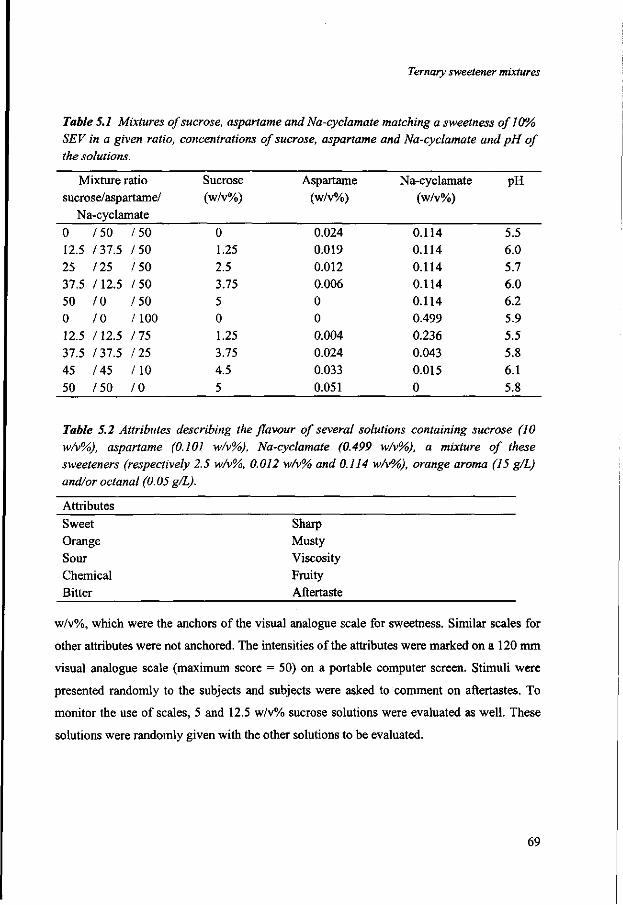
Ternary sweetener mixtures
Table 5.1 Mixtures of sucrose, aspartame and Na-cyclamate matching a sweetness of 10% SEV in a given ratio, concentrations of sucrose, aspartame and Na-cyclamate and pH of the solutions.
Mixture ratio sucrose/aspartame/
Na-cyclamate 0 /50 12.5 /37.5 25 /25 37.5 /12.5 50 / 0 0 / 0 12.5 /12.5 37.5 /37.5 45 /45 50 /50
/50 /50 /50 /50 /50 /100 115 I2S /10 /O
Sucrose (w/v%)
0 1.25 2.5 3.75 5 0 1.25 3.75 4.5 5
Aspartame (w/v%)
0.024 0.019 0.012 0.006 0 0 0.004 0.024 0.033 0.051
Na-cyclamate (w/v%)
0.114 0.114 0.114 0.114 0.114 0.499 0.236 0.043 0.015 0
pH
5.5 6.0 5.7 6.0 6.2 5.9 5.5 5.8 6.1 5.8
Table 5.2 Attributes describing the flavour of several solutions containing sucrose (10 w/v%), aspartame (0.101 w/v%), Na-cyclamate (0.499 w/v%), a mixture of these sweeteners (respectively 2.5 w/v%, 0.012 w/v% and 0.114 w/v%), orange aroma (15 g/L) and/or octanal (0.05 g/L).
Attributes
Sweet Orange Sour Chemical Bitter
Sharp Musty Viscosity Fruity Aftertaste
w/v%, which were the anchors of the visual analogue scale for sweetness. Similar scales for
other attributes were not anchored. The intensities of the attributes were marked on a 120 mm
visual analogue scale (maximum score = 50) on a portable computer screen. Stimuli were
presented randomly to the subjects and subjects were asked to comment on aftertastes. To
monitor the use of scales, 5 and 12.5 w/v% sucrose solutions were evaluated as well. These
solutions were randomly given with the other solutions to be evaluated.
69

Chapter 5
5.2.5 Data analysis
Sensory data were subjected to Student's t tests to determine significant differences between
solutions. A significance level of P < 0.01 was used for sweetness (anchored scale) and P <
0.05 for the other attributes.
The composition of the equisweet ternary mixtures was described in a regression equation
with the help of a surface-fitting program (Tablecurve 3D, SPSS Inc., Chicago, USA). The
equation was based on experimental data from the present experiment and on results obtained
before (Nahon et al, 1998b and c). A comparison was made with an equation based on
information on the binary mixtures of the components. The fit of the empirical regression
equation to the experimental results was determined.
5.3 Results
The starting points of all partial SEV determinations were set by the determinations of the
10% SEVs for aspartame and Na-cyclamate (compare Figure 5.1). For aspartame the same
batch was used as before (Nahon et al, 1998b) and with the panel used for the present
experiment the 10% SEV for aspartame was 0.101 w/v% instead of 0.096 w/v%. In case of
Na-cyclamate a new batch was used and the panel used for the present experiment
determined its 10% SEV to be 0.499 w/v% compared to 0.443 w/v% found before (Nahon et
al, 1998c). As the partial SEV of Na-cyclamate in the 50/50 sucrose/Na-cyclamate mixture
was the starting point for the study of ternary mixtures with a fixed sweetness contribution of
Na-cyclamate of 50%, this partial SEV was determined once more. The value for this partial
SEV was 0.114 w/v% instead of 0.111 w/v% (Nahon et al., 1998c).
Given the results obtained for intersection curves 1 and 2 (Table 5.1) and the results on the
mixtures of sucrose and aspartame (Nahon et al, 1998b) and sucrose and Na-cyclamate
(Nahon et al, 1998c) the following ternary regression equation (Figure 5.2) was obtained:
_ 0.10-0.34X + 0.26X2 -0.016Y + 0.00058Y2
1 + 20.33X-79.28X2 +197.18X3 -0.058Y
70

Ternary sweetener mixtures
4 6 8
Sucrose (w/v%) 0.6 Na-Cyclamate (w/v%)
Figure 5.2 Representation of equisweet ternary mixtures in a three dimensional coordinate system. The grid plane represents Equation 1, the filled circles (*) are experimental results obtained from intersection curves 1 and 2 and the open circles (o) are obtained from Nahon et al. (1998b and c).
in which X = Na-cyclamate (w/v%), Y = sucrose (w/v%) and Z = aspartame (w/v%). After
fixing the concentrations of Na-cyclamate and sucrose in the ternary mixtures, the
concentrations of aspartame in these mixtures can be calculated with the help of this
equation.
The outcome of each experiment can be illustrated by an intersection curve located on its
two dimensional plane in the three dimensional coordinate system. As in earlier experiments
(Nahon et al., 1998c), the linear expectations were then compared to the experimental results.
Intersection curves 1, based on linear expectations and experimental results and calculated
from Equation 5.1, are all presented in Figure 5.3. The concentration of aspartame necessary
to obtain equisweet mixtures at 10% SEV is linearly related to the concentration of sucrose in
the ternary mixture, but is only half its linear expectation. Similarly, intersection curves 2 are
presented in Figure 5.4. The concentration of aspartame necessary to get these mixtures
equisweet at 10% SEV is smaller than linearly expected.
71

Chapter 5
0.06 n Linear expectations
• Experimentally determined
— Curve calculated from Equation 5.1
0 1 2 3 4 5 6
Sucrose (w/v%)
Figure 5.3 Intersection curve 1. The concentration of Na-cyclamate in the ternary mixture was kept constant at 0.114 w/v%, its contribution to the total sweetness being 50%. Concentration of aspartame (w/v%) in the mixture, as a function of the concentration of sucrose (w/v%) in the mixture; linear expectations, experimental results and curve obtained from Equation 5.1.
Linear expectations
A Experimentally determined
-Curve calculated from Equation 5.1
0 20 40 60 80 100
Sweetness contribution of Na-cyclamate (%)
Figure 5.4 Intersection curve 2. The ratio between the sweetness contributions of aspartame and sucrose was kept constant at 50/50. Concentrations of aspartame (w/v%) in the ternary mixture, as a function of the contribution of Na-cyclamate (%) to the sweetness of the mixture; linear expectations, experimental results and curve obtained from Equation 5.1.
72

Ternary sweetener mixtures
• 0% Na-cyclamate a 10% Na-cyclamate • 25% Na-cyclamate x 50% Na-cyclamate x 75% Na-cyclamate A 100% Na-cyclamate
— Linear (0% Na-cyclamate) Linear (10% Na-cyclamate)
— Linear (25% Na-cyclamate) — Linear (50% Na-cyclamate)
Linear (75% Na-cyclamate)
4 6 Sucrose (w/v%)
10
Figure 5.5 Linear extrapolations of intersections 1 and 2 (see Figure 5.1), which gives the
relationships between sucrose (w/v%) and aspartame (w/v%) for various sweetness
contributions of Na-cyclamate (0, 10, 25, 50, 75 and 100%).
• Extrapolations aspartame
— Aspartame curve calculated from Equation 5.1
-•--Sucrose
0.1 0.2 0.3 0.4 Na-cyclamate (w/v%)
0.5
12
10
0.6
CD CO
e o co
Figure 5.6 The concentrations of aspartame (w/v%) and sucrose (w/v%) in binary
mixtures, as a function of the concentration of Na-cyclamate (w/v%) in these mixtures. The
total sweetness of these mixtures being 10% SEV. For aspartame the curve obtained from
Equation 5.1 is given, along with the results from linear extrapolations (Figure 5.5). The
results for the sucrose/Na-cyclamate mixture are obtained from Nahon et al. (1998c).
73
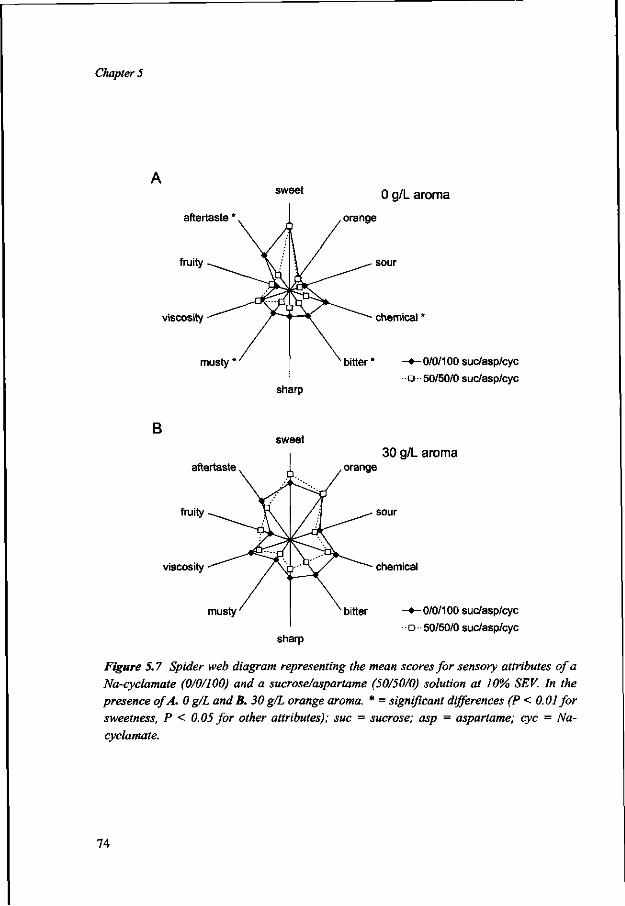
Chapter 5
sweet 0 g / |_ a r o m a
aftertaste * v 1 , orange
fruity
viscosity
sour
chemical'
musty
sharp
bitter * - • - 0/0/100 suc/asp/cyc
• o - 50/50/0 suc/asp/cyc
B sweet
aftertaste orange
fruity
viscosity
30 g/L aroma
sour
chemical
sharp
-•-0/0/100 suc/asp/cyc
• • o • • 50/50/0 suc/asp/cyc
Figure 5.7 Spider web diagram representing the mean scores for sensory attributes of a Na-cyclamate (0/0/100) and a sucrose/aspartame (50/50/0) solution at 10% SEV. In the presence of A. 0 g/L and B. 30 g/L orange aroma. * = significant differences (P < 0.01 for sweetness, P < 0.05 for other attributes); sue = sucrose; asp = aspartame; eye = Na-cyclamate.
74

Ternary sweetener mixtures
sweet 0 g/L aroma
aftertaste orange
fruity
viscosity chemical
musty
sharp
- • - 0/50/50 suc/asp/cyc
•D- 50/0/50 suc/asp/cyc
B sweet
aftertaste orange
fruity
viscosity
30 g/L aroma
sour
chemical
sharp
- • - 0/50/50 suc/asp/cyc
-Q- 50/0/50 suc/asp/cyc
Figure 5.8 Spider web diagram representing the mean scores for sensory attributes of an aspartame/Na-cyclamate (0/50/50) and a sucrose/Na-cyclamate (50/0/50) solution at 10% SEV. In the presence of A. 0 g/L and B. 30 g/L orange aroma. No significant differences; sue = sucrose; asp = aspartame; eye = Na-cyclamate.
75
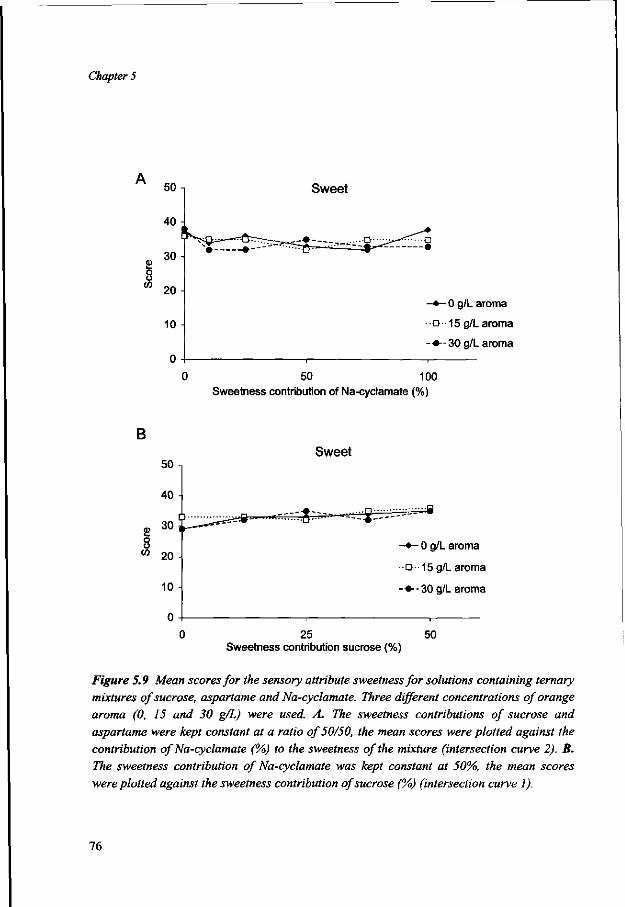
Chapter 5
o o to
B
50
40
30
20 H
10
Sweet
- • - 0 g/L aroma
•o- 15 g/L aroma
- • - -30 g/L aroma
50 100 Sweetness contribution of Na-cyclamate (%)
Sweet
^ ^ — ^ i ^ i
- • - 0 g/L aroma
•D -15 g/L aroma
- • - -30 g/L aroma
25 Sweetness contribution sucrose (%)
50
Figure 5.9 Mean scores for the sensory attribute sweetness for solutions containing ternary mixtures of sucrose, aspartame and Na-cyclamate. Three different concentrations of orange aroma (0, 15 and 30 g/L) were used. A. The sweetness contributions of sucrose and aspartame were kept constant at a ratio of 50/50, the mean scores were plotted against the contribution of Na-cyclamate (%) to the sweetness of the mixture (intersection curve 2). B. The sweetness contribution of Na-cyclamate was kept constant at 50%, the mean scores were plotted against the sweetness contribution of sucrose (%) (intersection curve 1).
76
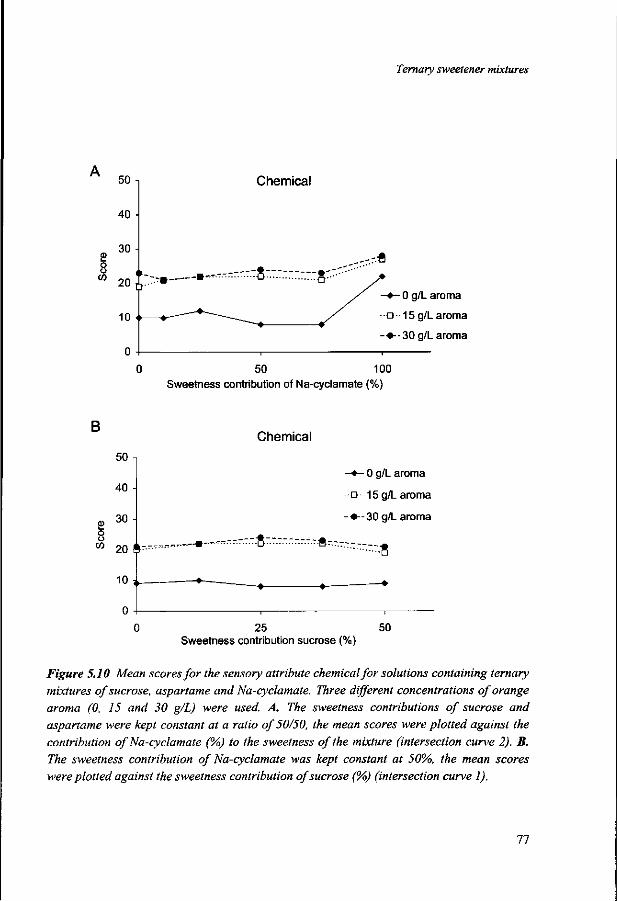
Ternary sweetener mixtures
o o
Chemical
0 g/L aroma
o 15 g/L aroma
• - -30 g/L aroma
50 100 Sweetness contribution of Na-cyclamate (%)
B
£ o o
50 n
40 -
30 -
20 I
1 0 ,
n -
i-
_ - , — m - — -
Chemical
---T-.-S-T----7-- .S--
' • •—
—•- 0 g/L aroma
"D- 15 g/L aroma
- • - -30 g/L aroma
" " *
0 25 50 Sweetness contribution sucrose (%)
Figure 5.10 Mean scores for the sensory attribute chemical for solutions containing ternary
mixtures of sucrose, aspartame and Na-cyclamate. Three different concentrations of orange
aroma (0, 15 and 30 g/L) were used. A. The sweetness contributions of sucrose and
aspartame were kept constant at a ratio of 50/50, the mean scores were plotted against the
contribution of Na-cyclamate (%) to the sweetness of the mixture (intersection curve 2). B.
The sweetness contribution of Na-cyclamate was kept constant at 50%, the mean scores
were plotted against the sweetness contribution of sucrose (%) (intersection curve 1).
11
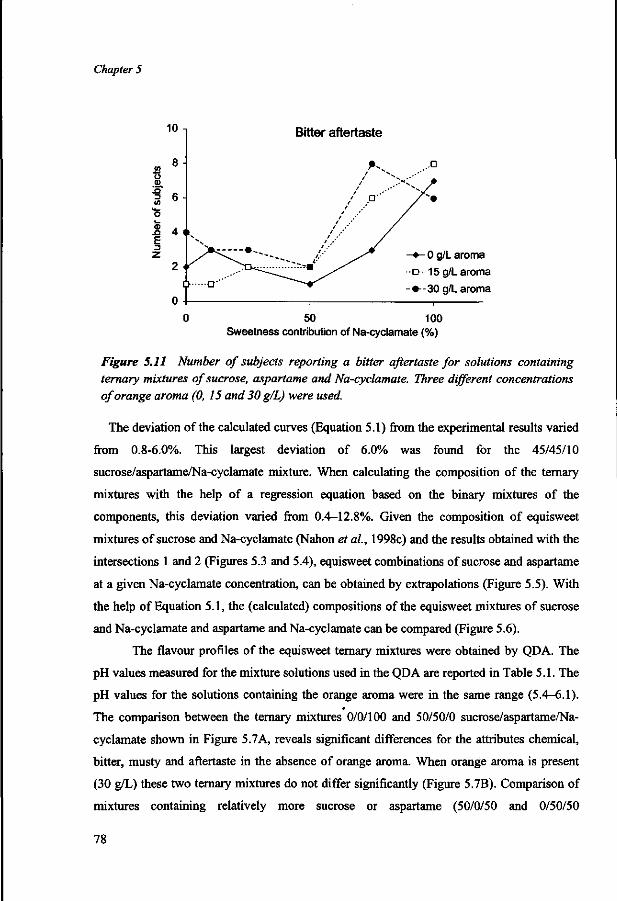
Chapter 5
Bitter aftertaste
- • - 0 g/L aroma
o- 15 g/L aroma
• - -30 g/L aroma
0 50 100 Sweetness contribution of Na-cyclamate (%)
Figure 5.11 Number of subjects reporting a bitter aftertaste for solutions containing ternary mixtures of sucrose, aspartame and Na-cyclamate. Three different concentrations of orange aroma (0, 15 and 30 g/L) were used.
The deviation of the calculated curves (Equation 5.1) from the experimental results varied
from 0.8-6.0%. This largest deviation of 6.0% was found for the 45/45/10
sucrose/aspartame/Na-cyclamate mixture. When calculating the composition of the ternary
mixtures with the help of a regression equation based on the binary mixtures of the
components, this deviation varied from 0.4-12.8%. Given the composition of equisweet
mixtures of sucrose and Na-cyclamate (Nahon et ai, 1998c) and the results obtained with the
intersections 1 and 2 (Figures 5.3 and 5.4), equisweet combinations of sucrose and aspartame
at a given Na-cyclamate concentration, can be obtained by extrapolations (Figure 5.5). With
the help of Equation 5.1, the (calculated) compositions of the equisweet mixtures of sucrose
and Na-cyclamate and aspartame and Na-cyclamate can be compared (Figure 5.6).
The flavour profiles of the equisweet ternary mixtures were obtained by QDA. The
pH values measured for the mixture solutions used in the QDA are reported in Table 5.1. The
pH values for the solutions containing the orange aroma were in the same range (5.4-6.1).
The comparison between the ternary mixtures 0/0/100 and 50/50/0 sucrose/aspartame/Na-
cyclamate shown in Figure 5.7A, reveals significant differences for the attributes chemical,
bitter, musty and aftertaste in the absence of orange aroma. When orange aroma is present
(30 g/L) these two ternary mixtures do not differ significantly (Figure 5.7B). Comparison of
mixtures containing relatively more sucrose or aspartame (50/0/50 and 0/50/50
78

Ternary sweetener mixtures
sucrose/aspartame/Na-cyclamate) shows no significant differences between the two flavour
profiles, either in the absence or in the presence of orange aroma (Figures 5.8A and B). For
the attribute sweet, the mean scores are constant, for each possible mixture of sucrose,
aspartame and Na-cyclamate (Figures 5.9A and B). Figures 5.10A and B show the mean
scores for the attribute chemical for the ternary mixtures of sucrose, aspartame and Na-
cyclamate. Figure 5.10A, showing the results obtained for intersection curve 2, illustrates the
effect of relatively more Na-cyclamate in the ternary mixture. The contribution of orange
aroma to the mean scores of the attribute chemical is of a smaller magnitude for solutions in
which only Na-cyclamate is present. The standard deviations for the attribute sweet were low
for all mixtures of sucrose, aspartame and Na-cyclamate. Standard deviations for the other
attributes were larger and significant differences for these attributes were hardly found.
The comments on aftertastes of the different solutions resembled the attributes used.
Solutions containing more Na-cyclamate tended to have more aftertaste, which is mainly
described by the attributes bitter (Figure 5.11) and chemical. The number of subjects
mentioning a bitter aftertaste increases when more Na-cyclamate is present in the ternary
mixture, for all three concentrations of orange aroma. Solutions containing 15 or 30 g/L
orange aroma provided stronger orange, chemical and bitter aftertastes than solutions without
orange aroma.
5.4 Discussion
10% SEV determinations for aspartame and Na-cyclamate were repeated because of
replacements in the sensory panel and the use of new product batches; they showed
deviations of 5 respectively 13% compared to the determinations done before (Nahon et al,
1998b and c). As the two determinations for aspartame were performed with the same
sweetener batch but different panels, it is confirmed that SEV determinations performed with
different panels can be compared to a certain extent only (Nahon et al, 1998b). As the partial
SEV of Na-cyclamate in the 50/50 sucrose/Na-cyclamate mixture was quite close to its value
determined before (0.114 w/v% compared to 0.111 w/v%), the partial SEVs of Na-cyclamate
for the other mixtures were taken from the results obtained in the earlier experiment (Nahon
etal., 1998c).
79
Chapter 5
The linear relationship for sucrose and aspartame shown in Figure 5.3, implies an absence
of extra synergy when comparing ternary mixtures with binary mixtures. As the contribution
of Na-cyclamate to the ternary mixture was fixed for intersection curve 1, the synergy
between sucrose and Na-cyclamate was already taken into account. A full exchangeability
between sucrose and aspartame in the mixture, would result in the figure marked as 'linear
expectations aspartame' (Figure 5.3). As a straight line was obtained, a certain amount of
exchangeability will be present. Apparently, aspartame and Na-cyclamate show synergy as
well and from Figure 5.6, we can conclude that aspartame and Na-cyclamate show more
synergy than sucrose and Na-cyclamate. The difference between the linear expectations and
the experimental results observed in Figure 5.3, can be ascribed to the extra synergy between
aspartame and Na-cyclamate compared to the synergy between sucrose and Na-cyclamate.
The exact figure for the synergy between aspartame and Na-cyclamate was not determined,
but was approached by extrapolations of experimental results (Figure 5.5) and calculations
using Equation 5.1 (Figure 5.6). Frank et al. (1989) reported more synergy for the
aspartame/Na-cyclamate mixture (20%) as compared to the sucrose/Na-cyclamate mixture
(15%). However, they also reported a synergy of 11% between sucrose and aspartame. Bakal
(1983) reported synergies for the combination sucrose/Na-cyclamate and aspartame/Na-
cyclamate, but also for the combination sucrose/aspartame. The results obtained in this
experiment indicate that the resulting synergy in a ternary mixture, is the arithmetical sum of
the synergies of the composing binary mixtures. Schiffman et al. (1996) suggested that binary
mixtures might reach a greater degree of synergism than ternary mixtures. The synergistic
effect reported refers to the effect that less aspartame or Na-cyclamate is needed than linearly
expected. Lawless (1998) indicated in his short communication that various methods used for
the determination of the presence or absence of synergy (ours included) may under- or
overestimate the sweetness of a mixture. The reduction of concentrations found in our
investigation might be a logical consequence of the method, but still this does not change the
practical advantage of the fact that smaller amounts of sweeteners are needed to obtain the
same sweetness.
In intersection 2, the sweetness contribution of Na-cyclamate to the mixture was varied
and the ratio sucrose/aspartame was kept constant. The contributions of sucrose and Na-
cyclamate were fixed on forehand, according to the synergistic effects observed by Nahon et
al. (1998c). The linear expectations for the concentration of aspartame given in Figure 5.4,
80
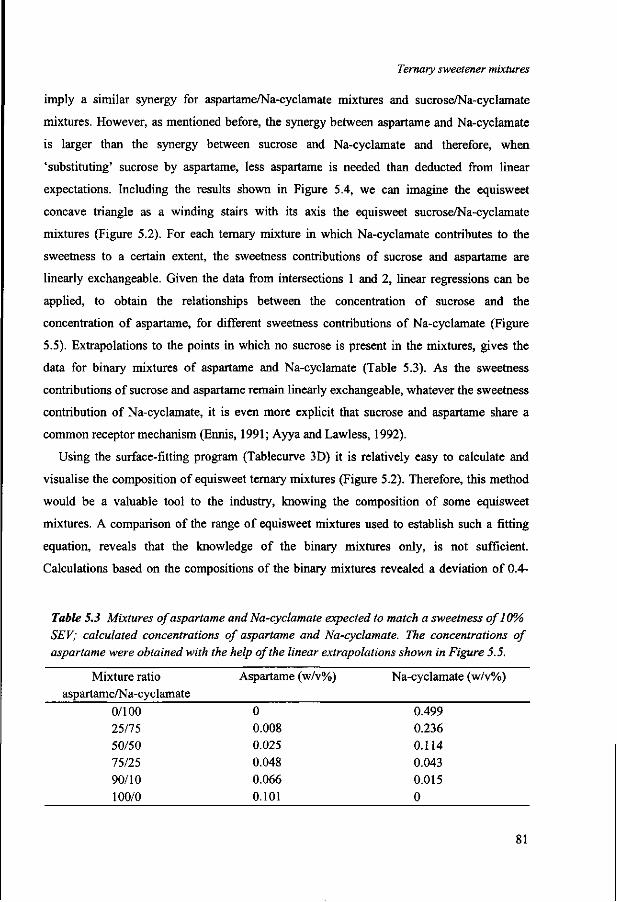
Ternary sweetener mixtures
imply a similar synergy for aspartame/Na-cyclamate mixtures and sucrose/Na-cyclamate
mixtures. However, as mentioned before, the synergy between aspartame and Na-cyclamate
is larger than the synergy between sucrose and Na-cyclamate and therefore, when
'substituting' sucrose by aspartame, less aspartame is needed than deducted from linear
expectations. Including the results shown in Figure 5.4, we can imagine the equisweet
concave triangle as a winding stairs with its axis the equisweet sucrose/Na-cyclamate
mixtures (Figure 5.2). For each ternary mixture in which Na-cyclamate contributes to the
sweetness to a certain extent, the sweetness contributions of sucrose and aspartame are
linearly exchangeable. Given the data from intersections 1 and 2, linear regressions can be
applied, to obtain the relationships between the concentration of sucrose and the
concentration of aspartame, for different sweetness contributions of Na-cyclamate (Figure
5.5). Extrapolations to the points in which no sucrose is present in the mixtures, gives the
data for binary mixtures of aspartame and Na-cyclamate (Table 5.3). As the sweetness
contributions of sucrose and aspartame remain linearly exchangeable, whatever the sweetness
contribution of Na-cyclamate, it is even more explicit that sucrose and aspartame share a
common receptor mechanism (Ennis, 1991; Ayya and Lawless, 1992).
Using the surface-fitting program (Tablecurve 3D) it is relatively easy to calculate and
visualise the composition of equisweet ternary mixtures (Figure 5.2). Therefore, this method
would be a valuable tool to the industry, knowing the composition of some equisweet
mixtures. A comparison of the range of equisweet mixtures used to establish such a fitting
equation, reveals that the knowledge of the binary mixtures only, is not sufficient.
Calculations based on the compositions of the binary mixtures revealed a deviation of 0.4-
Table 5.3 Mixtures of aspartame and Na-cyclamate expected to match a sweetness of 10% SEV; calculated concentrations of aspartame and Na-cyclamate. The concentrations of aspartame were obtained with the help of the linear extrapolations shown in Figure 5.5.
Mixture ratio Aspartame (w/v%) Na-cyclamate (w/v%) aspartame/Na-cyclamate
0/100 0 0.499 25/75 0.008 0.236 50/50 0.025 0.114 75/25 0.048 0.043 90/10 0.066 0.015 100/0 0.101 0
81

Chapter 5
12.8%, whereas calculations based on the intersections and two binary mixtures gave a
deviation of maximal 6.0%. With the help of Equation 5.1, the composition of other
equisweet (binary) mixtures can be found. In this way, we could directly compare
sucrose/Na-cyclamate and aspartame/Na-cyclamate mixtures (Figure 5.6). A more important
synergy for the aspartame/Na-cyclamate mixtures was revealed.
Ternary mixtures of sweeteners might show interactive effects with aroma compounds, as
we noticed similarly with quaternary mixtures (Nahon et al, 1996). Again the pH values
measured were in the same range for all ternary mixtures, in the absence and in the presence
of orange aroma. This pH measurement additionally offers a control considering the quality
of the orange aroma and the sweeteners present in the mixtures. The fluctuations in the pH
can be ascribed to the low buffering capacity of the mixtures studied near neutral pH. The
results of the QDA are shown in Figures 5.7-5.11. In Figure 5.7A a Na-cyclamate and a
50/50 aspartame/sucrose solution at 10% SEV are compared, both in the absence of orange
aroma. The mean scores for the Na-cyclamate solution are significantly higher for the
attributes chemical, bitter, musty and aftertaste. In a comparison between sucrose and Na-
cyclamate we found the same results for the attributes chemical and aftertaste (Nahon et al,
1998c). When the Na-cyclamate and 50/50 aspartame/sucrose solution in the presence of 30
g/L orange aroma (Figure 5.7B) were compared, no significant differences were found. As
discussed in the same study, the addition of orange aroma levels out differences noticed for
the solutions. An earlier comparison between sucrose and aspartame solutions (Nahon et al,
1998b) showed significant differences for the attributes sour, chemical and aftertaste. The
comparison between the 50/50 aspartame/Na-cyclamate and the 50/50 sucrose/Na-cyclamate
solutions in the absence of orange aroma (Figure 5.8A) reveals no significant differences.
Apparently the flavour profiles of these binary mixtures are dominated by the flavour profile
of Na-cyclamate, which is after all present in the same amount in both binary mixtures.
McBride and Finlay (1990) reported a similar effect for mixtures of sucrose and citric acid.
The total intensity of the mixtures was determined by the intensity of the stronger, or
dominant component alone. As expected, a comparison between the 50/50 aspartame/Na-
cyclamate and the 50/50 sucrose/Na-cyclamate in the presence of 30 g/L orange aroma did
not show significant differences either (Figure 5.8B).
Mixtures were prepared equisweet at 10% SEV, as can be deduced from Figures 5.9A and
B. The mean scores for the attribute sweet remained constant for each ternary combination of
82

Ternary sweetener mixtures
sucrose, aspartame and Na-cyclamate. Addition of orange aroma did not influence the mean
scores for the attribute sweetness. Panellists were trained to accurately separate the scores on
the different attributes, following the QDA method. The mean scores given for the attribute
chemical (Figures 5.10A and B) illustrate a similar effect as noticed before (Nahon et al.,
1998c); the addition of orange aroma levels out the differences between the various mixture
solutions. Again the presence of Na-cyclamate singly influences the mean scores on the
attribute chemical to the largest extent (Figure 5.10A), whereas changes in the sweetness
contributions of sucrose and aspartame do not influence these mean scores (Figure 5.1 OB).
Muir et al. (1998) compared several fruit juice drinks, made up with different sweetener
combinations. The type of sweetener influenced the perception on flavour, aftertaste,
mouthfeel and in particular the perception of natural character. Their panellists separated the
juice drinks mainly on the basis of sweetener type. However, the perception of aroma was not
influenced by sweetener type, which might indicate that no sweetener-aroma interactions
were present for these juice drinks. For solutions containing mixtures of sucrose, aspartame
and Na-cyclamate, the addition of orange aroma increases the mean scores for all attributes
except sweetness, musty and viscosity. The addition of orange aroma clearly gives the
solution a more distinct flavour.
Comments on the aftertaste of the different mixture solutions reveal that the significantly
higher scores of Na-cyclamate solutions on this attribute (Figure 5.7A) can be ascribed to a
lingering chemical bitterness. Figure 5.11 shows that the number of subjects mentioning a
bitter aftertaste is high for Na-cyclamate solutions (whether orange aroma is present or not)
and decreases as soon as a certain amount of sucrose and/or aspartame is present in the
solutions as well. The mean scores for the attribute aftertaste also decrease as soon as a slight
amount of sucrose and/or aspartame is present in the ternary mixtures, just as described
before by Nahon et al. (1998c). Addition of orange aroma increases the orange, chemical and
bitter aftertastes of mixture solutions.
In conclusion, it was shown that equisweet ternary mixtures of sucrose, aspartame and Na-
cyclamate can be composed when the compositions of the equisweet binary mixtures of these
sweeteners are known. Describing the composition of the ternary mixtures in a regression
equation, opens the possibility to compose ternary mixtures, knowing (maximal)
contributions of one or two sweeteners. The equisweet ternary mixtures were used as a basis
for the study of sweetness-flavour interactions, for which QDA revealed a levelling effect of
83

Chapter 5
the orange aroma for significant differences between taste attributes of mixture solutions. The
relative sweetness contribution of Na-cyclamate to the ternary mixtures seemed to influence
the flavour profiles of these mixtures to the largest extent.
5.5 References
Ayya, N.; Lawless, H.T. Quantitative and qualitative evaluation of high-intensity sweeteners and
sweetener mixtures. Chem. Senses 1992, 7, 245-259.
Bakal, A.I. Functionality of combined sweeteners in several food applications. Chemistry and
Industry 1983,19 sept, 700-708.
Bakal, A.I. Mixed sweetener functionality. In Alternative Sweeteners; O'Brien Nabors, L., Gelardi,
R.C., Eds.; Marcel Dekker: New York, USA, 1991; pp 381-399.
Beidler, L.M. Taste receptor stimulation with salts and acids. In Handbook of Sensory Physiology,
Vol. IV Chemical Senses, Part 2, Taste; Beidler, L.M., Ed.; Springer Verlag: New York, USA,
1971; pp 200-220.
Bock, R.D.; Jones, L.V. The Measurement and Prediction of Judgment and Choice; Bush, R., Ed.;
Holden-Day: San Francisco, USA, 1968.
De Graaf, C; Frijters, J.E.R. A psychophysical investigation of Beidler's mixture equation. Chem.
Senses 1986, 77,295-314.
Ennis, D.M. Molecular mixture models based on competitive and non-competitive agonism. Chem.
Senses 1991,16, 1-17.
Faurion, A.; Saito, S.; MacLeod, P. Sweet taste involves several distinct receptor mechanisms. Chem.
Senses 1980, 5, 107-121.
Frank, R.A.; Mize, S.J.S.; Carter, R. An assessment of binary mixture interactions for nine
sweeteners. Chem. Senses 1989,14, 621-632.
Guilford, J.P. Psychometric Methods; McGraw-Hill Book: New York, USA, 1954.
Lawless, H.T. Theoretical note: tests of synergy in sweetener mixtures. Chem. Senses 1998, 23, 447-
451.
Laffort, P. Models for describing intensity interactions in odor mixtures: a reappraisal. In Perception
of complex smells and tastes; Laing, D.G., Cain, W.S., McBride, R.L., Ache, B.W., Eds.;
Academic Press: Sydney, Australia, 1989; pp 205-223.
Laffort, P.; Dravnieks, A. Several models of suprathreshold quantitative olfactory interaction in
humans applied to binary, ternary and quaternary mixtures. Chem. Senses 1982, 7, 153-174.
McBride, R.L. Taste perception of binary sugar mixtures: psychophysical comparison of two models.
Percept. & Psychophys. 1988, 44, 167-171.
McBride, R.L.; Finlay, D.C. Perceptual integration of tertiary taste mixtures. Percept. & Psychophys.
1990, 48, 326-330.
84
Ternary sweetener mixtures
Moskowitz, H.R.; Wolfe, K.; Beck, C. Sweetness and acceptance optimization in cola flavored
beverages using combinations of artificial sweeteners - a psychophysical approach. J. Food Qual.
1978, 2, 17-26.
Muir, D.D.; Hunter, E.A.; Williams, S.A.R.; Brennan, R.M. Sensory profiles of commercial fruit juice
drinks: influence of sweetener type. J. Sci. Food Agric. 1998, 77, 559-565.
Nahon, D.F.; Navarro y Koren, P.A.; Roozen, J.P.; Posthumus, M.A. Flavor release from mixtures of
sodium cyclamate, sucrose and an orange aroma. J. Agr. Food Chem. 1998a, 46, 4963-4968 (this
thesis, Chapter 6).
Nahon, D.F.; Roozen, J.P.; De Graaf, C. Sweetness flavour interactions in soft drinks. Food Chem.
1996, 56, 283-289 (this thesis, Chapter 2).
Nahon, D.F.; Roozen, J.P.; De Graaf, C. Sensory evaluation of mixtures of maltitol or aspartame,
sucrose and an orange aroma. Chem. Senses 1998b, 23, 59-66 (this thesis, Chapter 3).
Nahon, D.F.; Roozen, J.P.; De Graaf, C. Sensory evaluation of mixtures of sodium cyclamate, sucrose
and an orange aroma. J. Agr. Food Chem. 1998c, 46, 3426-3430 (this thesis, Chapter 4).
Reineccius, G.; Schirle-Keller, J-P.; Hatchwell, L.C. The interaction of aroma compounds with simple
sugars and aspartame. In Proceedings of the COST 96 meeting at Deutsche Forschungsansta.lt fur
Lebensmittelchemie, Garching, Germany, 9-11 oct. 1997; Schieberle, P., Ed.; Office for Official
Publications of the European Commities: Luxembourg, 1998; pp 25-37.
Schiffman, S.S.; Reilly, D.A.; Clark III, T.B. Qualitative differences among sweeteners. Physiol.
Behav. 1979, 23, 1-9.
Schiffman, S.S.; Sattely-Miller, E.A.; Graham, B.G.; Booth, B.J.; Gibes, K. Synergism among ternary
mixtures of fourteen sweeteners [abstract]. Chem. Senses 1996, 21, 664.
85
6 Flavour release from mixtures of sodium cyclamate, sucrose and an orange aroma
Mixtures of sucrose and sodium cyclamate (Na-cyclamate) were studied to evaluate possible interactive effects between these sweeteners and orange aroma compounds. Equisweet mixtures (10% Sucrose Equivalent Value) of the sweeteners were prepared by taking into account the observed synergistic effects between sucrose and Na-cyclamate. The release of volatile compounds from the solutions containing these mixtures and a water soluble orange aroma was studied. The volatile compounds were quantified and identified by gas chromatography combined with flame ionisation detection (GC/FID) and mass spectrometry (GC/MS). The presence of sucrose significantly changes the release of 15 selected volatile compounds from a solution containing the aroma compared to the aqueous control. Increasing sucrose concentrations in the solutions (0-60 w/v%) caused an increased release of the volatile compounds with short GC/FID retention times and a decreased release of the compounds with longer retention times. Increasing Na-cyclamate concentrations (0-2.658 w/v%) did not change the release of volatile compounds.
This chapter has been published as:
Nahon, D.F.; Navarro y Koren, P.A.; Roozen, J.P.; Posthumus, M.A. Journal of Agricultural and Food
Chemistry 1998, 46, 4963-4968.
87
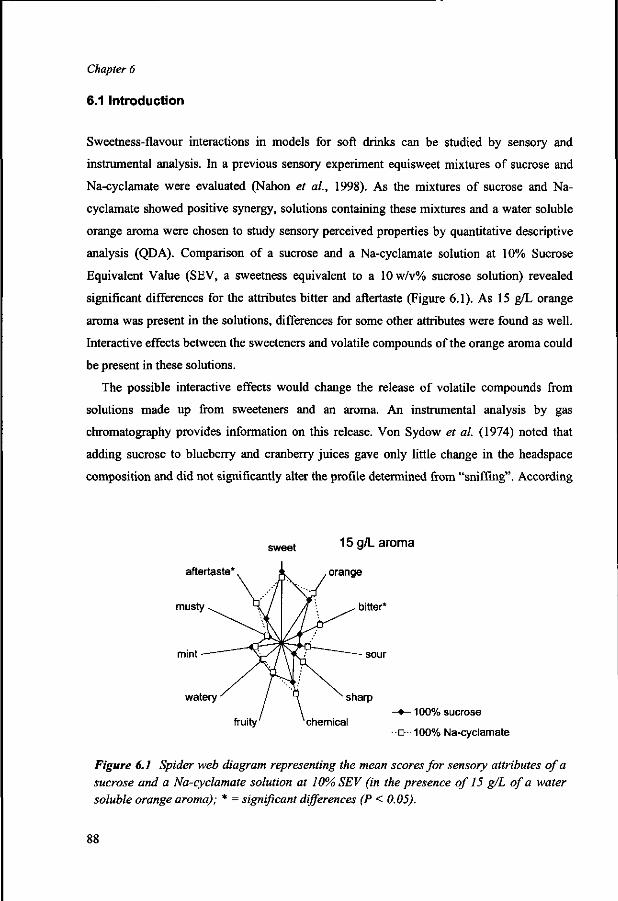
Chapter 6
6.1 Introduction
Sweetness-flavour interactions in models for soft drinks can be studied by sensory and
instrumental analysis. In a previous sensory experiment equisweet mixtures of sucrose and
Na-cyclamate were evaluated (Nahon et al, 1998). As the mixtures of sucrose and Na-
cyclamate showed positive synergy, solutions containing these mixtures and a water soluble
orange aroma were chosen to study sensory perceived properties by quantitative descriptive
analysis (QDA). Comparison of a sucrose and a Na-cyclamate solution at 10% Sucrose
Equivalent Value (SEV, a sweetness equivalent to a 10w/v% sucrose solution) revealed
significant differences for the attributes bitter and aftertaste (Figure 6.1). As 15 g/L orange
aroma was present in the solutions, differences for some other attributes were found as well.
Interactive effects between the sweeteners and volatile compounds of the orange aroma could
be present in these solutions.
The possible interactive effects would change the release of volatile compounds from
solutions made up from sweeteners and an aroma. An instrumental analysis by gas
chromatography provides information on this release. Von Sydow et al. (1974) noted that
adding sucrose to blueberry and cranberry juices gave only little change in the headspace
composition and did not significantly alter the profile determined from "sniffing". According
sweet 15 g/L aroma
aftertaste* v fc. , orange
musty
mint
watery
bitter*
sour
sharp
fruity chemical - • - 1 0 0 % sucrose
-o - 100% Na-cyclamate
Figure 6.1 Spider web diagram representing the mean scores for sensory attributes of a sucrose and a Na-cyclamate solution at 10% SEV (in the presence of 15 g/L of a water soluble orange aroma); * = significant differences (P < 0.05).
88

Flavour release from mixtures
to them, sucrose appears to enhance aroma on a psychological level, rather than acting upon
chemical constituents and thus modifying the vapor composition. Their semiquantitative data
showed that an increasing sucrose level in the juices increases the peak areas for the very
low-boiling constituents in the gas phase. However, they reported that these compounds are
not important for the desirable aroma of a fruit juice. Wiseman and McDaniel (1991) found
that sucrose-sweetened solutions did not significantly affect the perception of orange or
strawberry fruitiness. Le Quere et al. (1994) observed chemical effects of intense sweeteners
on the flavour of diet orange soft drinks. They mainly followed tendencies upon aging of the
soft drinks. Johnson and Vora (1983) and Ohta et al. (1992) recognised the oxygen-
containing components, including aldehydes such as octanal and alcohols, as the major
contributors to the fresh and pleasant flavour of orange essences because of their low
threshold and their olfactory characteristics. According to Moshonas and Shaw (1984), citrus
juice volatiles concentrated in the aqueous fraction reflect both quantitatively and
qualitatively the flavour and aroma of the parent juice. The aqueous fraction is thus a
desirable flavouring material.
Mixtures of sucrose and Na-cyclamate equisweet at 10% SEV were prepared, and
interactive effects between both sweeteners and a water soluble orange aroma were studied
by instrumental analysis. The effect of sucrose on the flavour release was compared with the
effect of Na-cyclamate by studying the release of the volatile compounds in solutions
containing increasing concentrations of sucrose or Na-cyclamate.
6.2 Materials and methods
The release of volatile compounds from the solutions was studied by gas chromatography.
6.2.1 Stimuli
Stimuli were solutions of sucrose (CSM Suiker BV, Amsterdam, The Netherlands) and Na-
cyclamate (Flevo Chemie BV, Harderwijk, The Netherlands) and mixtures of these two
substances in demineralized water. Nine sucrose/Na-cyclamate ratios (100/0, 90/10, 75/25,
60/40, 50/50, 40/60, 25/75, 10/90 and 0/100) were chosen to study possible interactive effects
between (mixtures of) sweeteners and aroma compounds. The overall sweetness of these
mixtures met with a constant perceived taste intensity of 10% SEV (Nahon et al, 1998). The
89

Chapter 6
orange aroma added was a sample of the watery vapor phase of stripped orange juice (Cargill
Juice Division, Amsterdam, The Netherlands). It was used in a constant concentration of 15
g/L. Increasing concentrations of sucrose (0, 5, 10, 20, 40 and 60w/v%) and Na-cyclamate
(0, 0.222, 0.443, 0.886, 1.772 and 2.658 w/v%) were chosen to study the effect of adding
sweeteners on the release of volatile compounds from a solution containing the aroma.
All solutions were prepared at least 24 h before evaluation and stored at 4 °C overnight. In
all evaluations, a sample consisted of 15 mL of solution. The samples were brought to room
temperature (22 °C) before further analysis.
6.2.2 Isolation of volatile compounds
Samples consisting of 15 mL of the different mixtures mentioned (identical to the stimuli)
were transferred in a so-called mouth model (Figure 6.2), consisting of a sample flask
(50 mL) at a temperature of 37 °C (water bath), to which 4 mL of diluted artificial saliva
containing salts, murine and a-amylase in water was added (Van Ruth et al, 1994). A
purified nitrogen gas flow (20 mL/min) passed through the stirred solution for 10 min to trap
the volatile compounds in 0.10 g of Tenax TA (poly(2,6-diphenyl-p-phenylene oxide, 0
Ethanol(-10°C)
Figure 6.2 Mouth model used for the purge and trap method. Nitrogen gas passes through the stirred solution to trap the volatile compounds in Tenax TA.
90
Flavour release from mixtures
0.25-0.42 mm, Alltech Nederland b.v., Zwijndrecht, The Netherlands), positioned in a glass
tube, 100 mm long and 3 mm i.d.. One measurement consists of four repetitions of this
method.
6.2.3 Gas Chromatography (GC)
The volatile compounds were desorbed from Tenax by a thermal desorption/cold trap device
(Carlo Erba TDAS 5000, Interscience b.v., Breda, The Netherlands). The compounds were
analyzed by GC on a Carlo Erba HRGC 5300 (Interscience b.v.), equipped with a
Supelcowax 10 capillary column (60 m x 0.25 mm x 0.25 urn) and a flame ionisation
detector (FID) at 275 °C. The oven temperature was 40 °C for 4 min and then programmed to
92 °C at a rate of 2 °C/min and then to 272 °C at 6 °C/min.
The volatile compounds were identified with the help of a gas chromatograph/mass
spectrometer (GC/MS, Varian 3400/Finnigan MAT 95, Bremen, Germany), equipped with a
Chrompack 16200 thermal desorption/cold trap unit (Chrompack, Middelburg, The
Netherlands). The capillary column and the temperature program were the same as described
above. The mass spectrometer was operated in the 70 eV EI ionisation mode and scanned
from mass 24 to 300 with a cycle time of 1.0 s.
6.3 Results
Flavour release from nine equisweet sucrose/Na-cyclamate mixtures was studied. Figure 6.3
shows an example of the gas chromatograms obtained by purging 10%SEV sucrose
solutions, containing 15 g/L orange aroma. With the help of GC/FID for quantity evaluation
and GC/MS for identity evaluation, 15 volatile compounds were selected (Table 6.1). To
observe possible interactive effects between sweeteners and aroma compounds, graphs of the
average peak area versus the sweetness ratio were plotted for each volatile compound. In
Figure 6.4 the results obtained for (E)-2-pentenal are given, which are representative for
results obtained for the other volatile compounds. In Table 6.1, the average peak areas for the
extremes, that is, sucrose (100/0 mixture) and Na-cyclamate (0/100 mixture) are compared.
For six volatile compounds (peaks 1-6), the release was significantly higher from the sucrose
solution. Afterwards, flavour release was studied, using increasing concentrations of sucrose
or Na-cyclamate. The fifteen selected volatile compounds were divided into three groups of
91

Chapter 6
retention times (RT), based on the results obtained in the GC/FID analysis and on the polarity
of the volatile compound as calculated by the method of Rekker (1977) (Table 6.1; peak 1-5,
6-13 and 14-15). Log P represents the hydrophobicity of the volatile compound; a negative
value implies hydrophilicity. In Figure 6.5 A the relative sum of the peak areas presented was
obtained by summing the average peak areas within one retention time group and then
relating to the 0 w/v% solution, which is the control. Increasing the concentration of sucrose
enlarged the release of the volatile compounds with smaller RT; it did not change the release
of the volatile compounds with medium RT and decreased the release of the volatile
compounds with larger RT. Increasing the concentration of Na-cyclamate did not reveal any
differences among the three retention time groups (Figure 6.5B).
Table 6.1 Volatile compounds of an orange aroma, released from solutions containing sucrose or Na-cyclamate at 10% SEV, their peak numbers, retention times (RT), hydrophobicity constants log P as calculated (Rekker, 1977), average areas and standard deviations (n=4). Short (< 15 min), medium (15-31 min) and long (> 31 min) retention time groups are distinguished. * = significant differences (P < 0.05), CV [%] = overall coefficient of variance.
Peak 1
2 3 4 5
6 7 8 9 10 11 12 13
14 15
RT (min) 9.1
10.4 10.6 14.7 15.0
17.0 18.1 18.1 20.9 21.4 24.3 29.8 30.8
31.8 35.3
Volatile compound 1-Ethoxy-l-methoxyethane Ethyl acetate 1,1 -Diethoxyethane 2-Pentanone Methyl butanoate
l-Penten-3-one Ethyl butanoate 2-Methyl-3-buten-2-ol Hexanal 2-Methyl-1 -propanol (£)-2-Pentenal 3 -Methyl-1 -butanol (£)-2-Hexenal
Ethyl hexanoate Octanal
CV [%]
logP -0.291
0.642 0.239 1.033 1.172
0.736 1.702 1.123 1.476 0.678 0.356 1.208 0.886
2.762 2.536
Average areas and standard deviations (mVs)
Sucrose 103 ±11
460 ±31 867 + 86 56 ±6 20 ±2
51 ±4 519 ±32 106 ±7 220 ±18 14 ±1 14 ±2 29 ±10 67 ±11
9 ±2 206 ± 37
11.9
Na-cyclamate 8 5 + 7 *
396 ±22 * 724 ±70 * 3 9 + 4 * 17 ±1 *
42 ±2 * 473 ± 25 97 ±5 204 ± 11 13 ±1 12 ±1 27 ±8 64 ±6
10 ±0 238 ±9
8.2
92
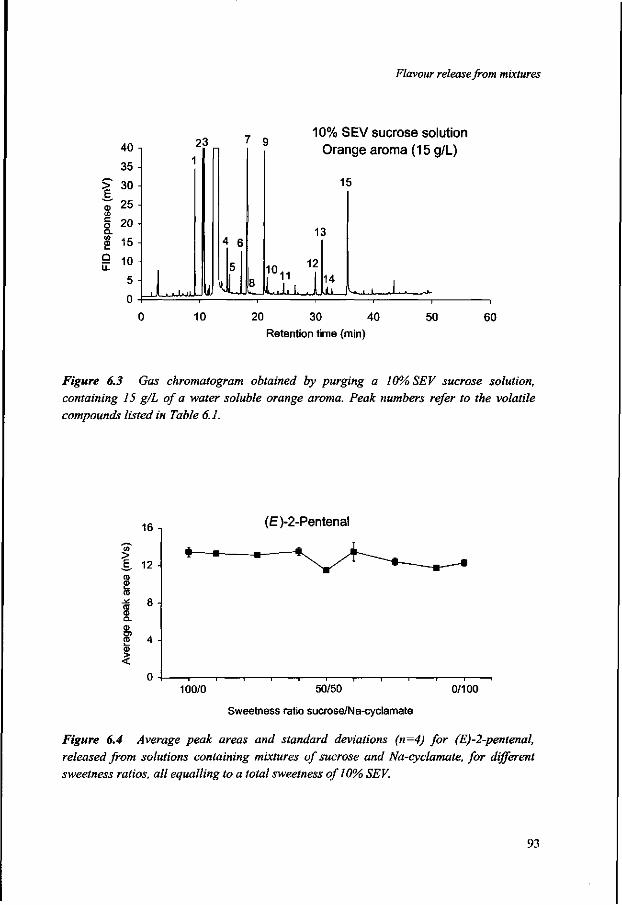
Flavour release from mixtures
s ^
> h CI) 0) c o Q.
0)
Q U-
40 n
35 -
SO •
25
20 -
15 -
m -
23 7 9
4 6
H uu Lf 10 11
10% SEV sucrose solution Orange aroma (15 g/L)
15
13
12 14 UU_J ULJL>-
10 20 30 40
Retention time (min)
50 60
Figure 6.3 Gas chromatogram obtained by purging a 10% SEV sucrose solution,
containing 15 g/L of a water soluble orange aroma. Peak numbers refer to the volatile
compounds listed in Table 6.1.
16
in > £ 12
CD <D
a. CD D >
co CD > <
8 -
(£)-2-Pentenal
100/0 50/50
Sweetness ratio sucrose/Na-cyclamate
0/100
Figure 6.4 Average peak areas and standard deviations (n=4) for (E)-2-pentenal,
released from solutions containing mixtures of sucrose and Na-cyclamate, for different
sweetness ratios, all equalling to a total sweetness of 10% SEV.
93

Chapter 6
160
o E 3
20
- • - ret. times < 15 min
• D - ret. times 15-31 min
- * - - ret. times > 31 min
20 40
Concentration of sucrose (w/v%)
60
B CO
co
CO
» ^
§ § (D a> <D -b-
o E co
160!
140
120
100
80 -|
60
40
20 -I
0
- • - re t . times < 15 min
•D- ret. times 15-31 min
-*--ret. times > 31 min
0 0.5 1 1.5 2 2.5 3
Concentration of Na-cyclamate (w/v%)
Figure 6.5 Volatile compounds of an orange aroma, released from solutions with increasing concentrations of sucrose (A) or Na-cyclamate (B). Sum of average peak areas and mean coefficients of variance, both related to a control solution of orange aroma in water, for volatile compounds with short (< 15 min), medium (15 - 31 min) and long (> 31 min) retention times (Table 6.1).
6.4 Discussion
The release of volatile compounds from solutions containing a water soluble orange aroma
and sucrose and/or Na-cyclamate was studied; 15 volatile compounds were selected for the
instrumental analysis (Table 6.1). Although ethanol is the volatile compound present in the
largest quantity in fresh orange juice (Shaw, 1977, 1991), this compound was not selected for
94
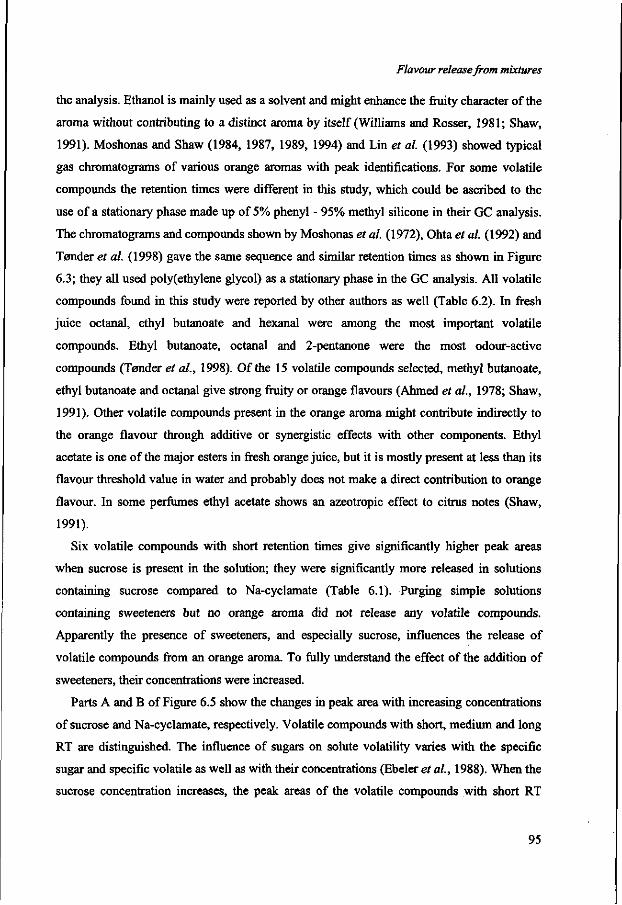
Flavour release from mixtures
the analysis. Ethanol is mainly used as a solvent and might enhance the fruity character of the
aroma without contributing to a distinct aroma by itself (Williams and Rosser, 1981; Shaw,
1991). Moshonas and Shaw (1984, 1987, 1989, 1994) and Lin et al. (1993) showed typical
gas chromatograms of various orange aromas with peak identifications. For some volatile
compounds the retention times were different in this study, which could be ascribed to the
use of a stationary phase made up of 5% phenyl - 95% methyl silicone in their GC analysis.
The chromatograms and compounds shown by Moshonas et al. (1972), Ohta et al. (1992) and
Tander et al. (1998) gave the same sequence and similar retention times as shown in Figure
6.3; they all used poly(ethylene glycol) as a stationary phase in the GC analysis. All volatile
compounds found in this study were reported by other authors as well (Table 6.2). In fresh
juice octanal, ethyl butanoate and hexanal were among the most important volatile
compounds. Ethyl butanoate, octanal and 2-pentanone were the most odour-active
compounds (Tonder et al., 1998). Of the 15 volatile compounds selected, methyl butanoate,
ethyl butanoate and octanal give strong fruity or orange flavours (Ahmed et al., 1978; Shaw,
1991). Other volatile compounds present in the orange aroma might contribute indirectly to
the orange flavour through additive or synergistic effects with other components. Ethyl
acetate is one of the major esters in fresh orange juice, but it is mostly present at less than its
flavour threshold value in water and probably does not make a direct contribution to orange
flavour. In some perfumes ethyl acetate shows an azeotropic effect to citrus notes (Shaw,
1991).
Six volatile compounds with short retention times give significantly higher peak areas
when sucrose is present in the solution; they were significantly more released in solutions
containing sucrose compared to Na-cyclamate (Table 6.1). Purging simple solutions
containing sweeteners but no orange aroma did not release any volatile compounds.
Apparently the presence of sweeteners, and especially sucrose, influences the release of
volatile compounds from an orange aroma. To fully understand the effect of the addition of
sweeteners, their concentrations were increased.
Parts A and B of Figure 6.5 show the changes in peak area with increasing concentrations
of sucrose and Na-cyclamate, respectively. Volatile compounds with short, medium and long
RT are distinguished. The influence of sugars on solute volatility varies with the specific
sugar and specific volatile as well as with their concentrations (Ebeler et al, 1988). When the
sucrose concentration increases, the peak areas of the volatile compounds with short RT
95
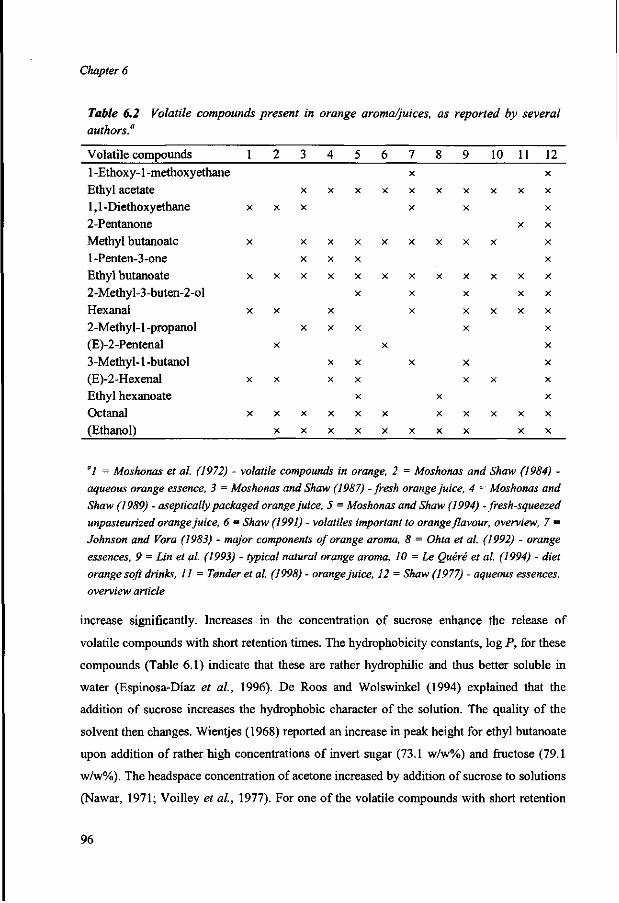
Chapter 6
Table 6.2 Volatile compounds present in orange aroma/juices, as reported by several
authors."
Volatile compounds
1 -Ethoxy-1 -methoxyethane
Ethyl acetate 1,1 -Diethoxyethane
2-Pentanone
Methyl butanoate
l-Penten-3-one
Ethyl butanoate
2-Methyl-3-buten-2-ol
Hexanal
2-Methyl-1 -propanol
(E)-2-Pentenal
3-Methyl-1 -butanol
(E)-2-Hexenal Ethyl hexanoate
Octanal
(Ethanol)
1
X
X
X
X
X
X
2
X
X
X
X
X
X
X
3
X
X
X
X
X
X
X
X
4
X
X
X
X
X
X
X
X
X
X
5
X
X
X
X
X
X
X
X
X
X
X
6
X
X
X
X
X
X
7
X
X
X
X
X
X
X
X
X
8
X
X
X
X
X
X
9
X
X
X
X
X
X
X
X
X
X
X
10
X
X
X
X
X
X
11
X
X
X
X
X
X
X
12
X
X
X
X
X
X
X
X
X
X
X
X
X
X
X
X
"1 = Moshonas et al. (1972) - volatile compounds in orange, 2 = Moshonas and Shaw (1984) -
aqueous orange essence, 3 = Moshonas and Shaw (1987) -fresh orange juice, 4 = Moshonas and
Shaw (1989) - aseptically packaged orange juice, 5 = Moshonas and Shaw (1994) -fresh-squeezed
unpasteurized orange juice, 6 = Shaw (1991) - volatiles important to orange flavour, overview, 7 =
Johnson and Vora (1983) - major components of orange aroma, 8 = Ohta et al. (1992) - orange
essences, 9 = Lin et al. (1993) - typical natural orange aroma, 10 = Le Quere et al. (1994) - diet
orange soft drinks, 11 = Tender et al. (1998) - orange juice, 12 = Shaw (1977) - aqueous essences,
overview article
increase significantly. Increases in the concentration of sucrose enhance the release of
volatile compounds with short retention times. The hydrophobicity constants, log P, for these
compounds (Table 6.1) indicate that these are rather hydrophilic and thus better soluble in
water (Espinosa-Diaz et al., 1996). De Roos and Wolswinkel (1994) explained that the
addition of sucrose increases the hydrophobic character of the solution. The quality of the
solvent then changes. Wientjes (1968) reported an increase in peak height for ethyl butanoate
upon addition of rather high concentrations of invert sugar (73.1 w/w%) and fructose (79.1
w/w%). The headspace concentration of acetone increased by addition of sucrose to solutions
(Nawar, 1971; Voilley et al., 1977). For one of the volatile compounds with short retention
96
Flavour release from mixtures
times, ethyl acetate, Voilley and Bosset (1986) determined the partition and activity
coefficients in pure water compared with a 50 w/w% glucose solution. Both partition and
activity coefficients were larger in the 50 w/w% glucose solution. Chandrasekaran and King
(1972) measured the activity coefficients of ethyl acetate and hexanal as a function of sucrose
concentration. The experimentally determined activity coefficients of the volatile compounds
increased with increasing sucrose concentration. Kieckbusch and King (1979) found the
partition coefficients for C1-C5 acetates between air and solutions of sucrose to increase
sharply with increasing sucrose contents. This effect could be attributed qualitatively to a loss
of free water due to hydration of sugar molecules. Only the free water is available as a
solvent for the acetates. Several other authors (Nawar, 1971; Darling et al, 1986) described
this effect as "salting-out". According to Nawar (1971), the effects on the headspace
concentration of volatiles are related to the interactions of the solids with water. Changes in
headspace concentrations of volatiles upon addition of sucrose to aqueous volatile solutions
do not involve a direct interaction between sugar and volatile but mostly occur via interaction
of the sugar with the water molecules.
The peak areas of the volatile compounds with medium RT remain constant and those of
the volatile compounds with long RT decrease significantly. This decrease in the release of
the volatile compounds with longer retention times might be due to an effect of an increasing
viscosity of the solution. According to Fick's law, the release of volatile compounds is
linearly related to their diffusion coefficients, which are inversely proportional to the
viscosities. The diffusion of volatile compounds then decreases with increasing viscosity of
the solution (Roberts et al, 1996). As we used a purge and trap method to analyse the release
of volatile compounds, the viscosity of the solutions is probably less important. Nawar (1971)
reported viscosities for 0, 20, 40 and 60 w/w% sucrose solutions to be 0.8, 1.5, 4.3 and 33.8
cP, respectively. As we composed sucrose solutions of 0 to 60 w/v%, which is 0 to 48.75
w/w%, the viscosities obtained will increase less. In the experiments of Nawar (1971) the
headspace concentrations of heptanone and heptanal decreased with increasing sucrose
concentrations in the solutions. Contradictory findings by Wientjes (1968) show an increase
in peak height for ethyl hexanoate upon addition of invert sugar or fructose, both in rather
high concentrations (73.1 and 79.1 w/w%, respectively).
De Roos and Wolswinkel (1994) reported a retention of hydrophobic volatile compounds,
such as a-ionone and naphthalene, upon addition of sucrose. The volatility did not change for
97
Chapter 6
esters and carbonyl-compounds, such as methyl butanoate, 2-hexanone, 1-hexanol,
methylbenzoate and methylcinnamate. Bakker et al. (1996) found a detectable decrease in
release of rather large volatiles with high volatility when increasing viscosity and thus
sucrose concentrations. For the less volatile flavours no detectable effect was found by them.
According to Roberts et al. (1996), the volatility of a flavour molecule may be affected by the
reduction of diffusion of flavour molecules, by the formation of barriers occurring in high-
viscosity matrices, or by specific binding interactions with the solute/thickening agent.
Highly volatile compounds are most affected by a change in viscosity. Less volatile flavours
do not show a significant decrease in volatility. Roberts et al. (1996) suggest also that
inclusion complexes may be present in the sucrose solutions for hydrophobic molecules.
They determined whether any decreases in aroma release were due to mass transfer alone or
to odorant binding by the thickening agents. From a comparison between the thickening
agents sucrose, carboxymethylcellulose and guar gum they concluded that binding
interactions are probably present, giving a different flavour release for the various thickening
agents. As sucrose solutions are concentrated, they become more glassy or crystalline in
state. Trapping of volatiles in these solutions could occur due to partial crystalline formation.
Hydrophobic complexes will be formed, which results in a greater depression of volatility by
sucrose. Pangbom and Szczesniak (1974) investigated the effect of hydrocolloids and
viscosity on flavour and odour intensities of flavour compounds, and also found effects that
were specific for the gum/odorant combination. The addition of hydrocolloids generally
decreased both odour and flavour intensities.
Increasing concentrations of Na-cyclamate do not significantly change the peak areas for
either of the three groups of volatile compounds (Figure 6.5B). Beck (1956) determined the
increase of viscosity of a solution with an increasing concentration of Na-cyclamate. The
properties found are radically different from those of a sucrose solution of comparable
sweetness. The relative viscosity n/no at 25 °C for a 10% SEV Na-cyclamate solution (0.44
g/L) is indistinguishable from 1. The viscosity of this solution is thus equal to the viscosity of
water. Beck (1956) also reported Na-cyclamate to have the properties of a strong electrolyte
salt and to act as NaCl would do. Then, at higher concentrations, Na-cyclamate could have
the same effect as salts and salt-out volatile compounds. Bopp and Price (1991) reported
cyclamate to enhance fruit aromas. In the results obtained in the GC analysis (Figure 6.5B)
no specific changes could be observed by increasing the concentration of Na-cyclamate.
98
Flavour release from mixtures
Apparently the significant differences observed within the instrumental analysis cannot be
confirmed by the panellists in the quantitative descriptive analysis (Nahon et al., 1998), as the
sensory analysis did not show significant differences for any of the aroma-related attributes
when a water soluble orange aroma was present in the solutions (Figure 6.1). Ebeler et al.
(1988) found that an addition of up to 40w/v% sucrose did increase the headspace
concentrations but did not significantly affect the perceived aroma intensity of either
menthone or isoamyl acetate. Their GC analysis also showed that the GC was much more
sensitive to small changes in the headspace than the sensory panel was. As expected from
Fechner's law, the perceived aroma intensity is logarithmically related to the concentration of
the volatile compound. Godshall (1995) concluded that the aroma of a beverage could,
theoretically, be intensified by increasing the volatility of its trace aroma constituents by
increasing the sucrose content. The results obtained in the described experiment, however,
show that increasing the sucrose content will influence the release of the volatiles differently,
depending on the properties of the volatile compound itself. In contrast to the desired effect, a
retention of volatile compounds might result. Besides, threshold values for odour and flavour
may differ in such a way that a volatile compound might be detected as a flavour (e.g.,
mouthfeel) but not as an odour. In the study of Ahmed et al. (1978), octanal was found to
have a significantly higher odour threshold when compared to the corresponding flavour
threshold. Their panellists found octanal to possess an orange-like flavour and aroma and a
slightly bitter taste. Shaw and Wilson III (1980) observed such significant differences
between aroma and taste thresholds for octanal, citral, nonanal and (£)-2-hexenal.
Apparently, the flavour of an aroma can be more important to the overall perception than the
odour.
In conclusion, it was shown that increasing concentrations of sucrose significantly alter
the release of volatile compounds, but that these changes are probably not noticeable at the
sweetness level normally found in soft drinks (i.e., 10% SEV). Increasing concentrations of
Na-cyclamate have no influence on the release of volatile compounds from a water soluble
orange aroma. Flavour differences observed among various sweeteners and aroma
combinations can probably be ascribed to differences in flavour among the sweeteners.
99

Chapter 6
6.5 References
Ahmed, E.M.; Dennison, R.A.; Dougherty, R.H.; Shaw, P.E. Flavor and odor thresholds in water of
selected orange juice components. J. Agric. Food Chem. 1978, 26, 187-191.
Bakker, J.; Brown, W.; Hills, B.; Boudaud, N.; Wilson, C ; Harrison, M. Effect of the food matrix on
flavour release and perception. In Flavour Science. Recent Developments; Taylor, A.J., Mottram,
D.S., Eds.; The Royal Society of Chemistry: Cambridge, UK, 1996; pp 369-374.
Beck, K.M. Properties of the synthetic sweetening agent, cyclamate. Food Technology 1956, 3, 156-
158.
Bopp, B.A.; Price, P. Cyclamate. la Alternative Sweeteners; O'Brien Nabors, L., Gelardi, R.C., Eds.;
Marcel Dekker: New York, USA, 1991; pp 71-95.
Chandrasekaran, S.K.; King, C.J. Multicomponent diffusion and vapor-liquid equilibria of dilute
organic components in aqueous sugar solutions. AIChEJ. 1972,18, 513-520.
Darling, D.F.; Williams, D.; Yendle, P. Physico-chemical interactions involved in aroma transport
processes from solution. In Interactions of Food Components; Birch, G.G., Lindley, M.G., Eds.;
Elsevier Applied Science Publishers: London, UK, 1986; pp 165-188.
De Roos, K.B.; Wolswinkel, K. Non-equilibrium partition model for predicting flavour release in the
mouth. In Trends in Flavour Research; Maarse, H., Van der Heij, D.G., Eds.; Elsevier Science B.V.:
Amsterdam, The Netherlands, 1994; pp 15-32.
Ebeler, S.E.; Pangborn, R.M.; Jennings, W.G. Influence of dispersion medium on aroma intensity and
headspace concentration of menthone and isoamyl acetate. J. Agric. Food Chem. 1988, 36, 791-796.
Espinosa-Diaz, M.; Seuvre, A.M.; Voilley, A. Influence of physico-chemical properties of aroma
compounds on their interactions with other constituents. In Flavour Science. Recent Developments;
Taylor, A.J., Mottram, D.S., Eds.; The Royal Society of Chemistry: Cambridge, UK, 1996; pp 442-
445.
Godshall, M.A. Role of sucrose in retention of aroma and enhancing the flavor of foods. In Sucrose:
Properties and Applications; Mathlouthi, M., Reiser, P., Eds.; Blackie academic & Professional:
London, UK, 1995; pp 248-263.
Johnson, J.D.; Vora, J.D. Natural citrus essences. Food Technol. 1983,12, 92-93, 97.
Kieckbusch, T.G.; King, C.J. Partition coefficients for acetates in food systems. J. Agric. Food Chem.
1979, 27, 504-507.
Le Quere, J.L.; Leschaeve, I.; Demaizieres, D.; Issanchou, S.; Delache, R. Chemical and sensory
effects of intense sweeteners on the flavour of diet orange soft drinks. In Trends in Flavour
Research; Maarse, H., Van der Heij, D.G., Eds.; Elsevier: Amsterdam, The Netherlands, 1994; pp
387-393.
Lin, J.C.C.; Nagy, S.; Klim, M. Application of pattern recognition techniques to sensory and gas
chromatographic flavor profiles of natural orange aroma. Food Chem. 1993, 47, 235-245.
Moshonas, M.G.; Lund, E.D.; Berry, R.E.; Veldhuis, M.K. Distribution of aqueous aroma
components in the orange. J. Agric. Food Chem. 1972, 20, 688-690.
Moshonas, M.G.; Shaw, P.E. Changes in composition of volatile components in aseptically packaged
orange juice during storage. J. Agric. Food Chem. 1989, 37, 157-161.
100

Flavour release from mixtures
Moshonas, M.G.; Shaw, P.E. Direct gas chromatographic analysis of aqueous citrus and other fruit
essences. J. Agric. Food Chem. 1984, 32, 526-530.
Moshonas, M.G.; Shaw, P.E. Quantitative analysis of orange juice flavor volatiles by direct-injection
gas chromatography. J. Agric. Food Chem. 1987, 35, 161-165.
Moshonas, M.G.; Shaw, P.E. Quantitative determination of 46 volatile constituents in fresh,
unpasteurized orange juices using dynamic headspace gas chromatography. J. Agric. Food Chem.
1994,42,1525-1528.
Nahon, D.F.; Roozen, J.P.; De Graaf, C. Sensory evaluation of mixtures of sodium cyclamate, sucrose
and an orange aroma. J. Agric. Food Chem. 1998, 46, 3426-3430 (this thesis, Chapter 4).
Nawar, W.W. Some variables affecting composition of headspace aroma. J. Agric. Food Chem. 1971,
19, 1057-1059.
Ohta, H.; Nogata, Y.; Yoza, K-I.; Maeda, M. Glass capillary gas chromatographic identification of
volatile components recovered from orange essence by continuous liquid extraction. J. Chromatogr.
1992,607,154-158.
Pangborn, R.M.; Szczesniak, A.S. Effect of hydrocolloids and viscosity on flavor and odor intensities
of aromatic flavor compounds. J. Texture Stud. 1974, 4,467-482.
Rekker, R.F. The hydrophobic fragmental constant. Its derivation and application; a means of
characterizing membrane systems. In Pharmacochemistry Library; Nauta, W.Th., Rekker, R.F.,
Eds.; Elsevier Scientific Publishing: Amsterdam, The Netherlands, 1977; Vol. 1.
Roberts, D.D.; Elmore, J.S.; Langley, K.R.; Bakker, J. Effects of sucrose, guar gum, and
carboxymethylcellulose on the release of volatile flavor compounds under dynamic conditions. J.
Agric. Food Chem. 1996, 44, 1321-1326.
Shaw, P.E. Aqueous essences. In Citrus Science and Technology. Vol. 1 Nutrition, Anatomy,
Chemical Composition and Bioregulation; Nagy, S., Shaw, P.E., Veldhuis, M.K., Eds.; AVI
Publishing: Westport, CT, USA, 1977; pp 463-478.
Shaw, P.E. Fruits II. In Volatile Compounds in Foods and Beverages; Maarse, H., Ed.; Marcel
Dekker: New York, USA, 1991; pp 305-327.
Shaw, P.E.; Wilson III, C.W. Influence of selected volatile components to natural orange, grapefruit,
tangerine, and mandarin flavors. In Citrus Nutrition and Quality; ACS Symposium Series 143;
Nagy, S, Attaway, J.A., Eds.; American Chemical Society: Washington, DC, USA, 1980; pp 167-
190.
T0nder, D.; Petersen, M.A.; Poll, L.; Olsen, C.E. Discrimination between freshly made and stored
reconstituted orange juice using GC Odour Profiling and aroma values. Food Chem. 1998, 61, 223-
229.
Van Ruth, S.M.; Roozen, J.P.; Cozijnsen, J.L. Comparison of dynamic headspace mouth model
systems for flavour release from rehydrated diced bell peppers. In Trends in Flavour Research;
Maarse, H., Van der Heij, D.G., Eds.; Elsevier: Amsterdam, The Netherlands, 1994; pp 59-64.
Voilley, A.; Bosset, J.O. Nouvelle technique de determination rapide de la volatilite de composants
d'arome dans des milieux a forte viscosite (New method for rapid determination of flavour
compounds in high viscosity media). Lebensm. -Wiss. -Technol. 1986,19, 47-52.
Voilley, A.; Simatos, D.; Loncin, M. Gas phase concentration of volatiles in equilibrium with a liquid
aqueous phase. Lebensm. -Wiss. -Technol. 1977,10,45-49.
101
Chapter 6
Von Sydow, E.; Moskowitz, H.; Jacobs, H.; Meiselman, H. Odor-taste interaction in fruit juices.
Lebensm.-Wiss. -Technol. 1974, 7, 18-24.
Wientjes, A.G. The influence of sugar concentrations on the vapor pressure of food odor volatiles in
aqueous solutions. J. Food Sci. 1968, 33, 1-2.
Williams, A.A.; Rosser, P.R. Aroma enhancing effects of ethanol. Chem. Senses 1981, 6, 149-153.
Wiseman, J.J.; McDaniel, M.R. Modification of fruit flavors by aspartame and sucrose. J. Food Sci.
1991, 56, 1668-1670.
This research was financially supported by EC Grant PL94-2I02.
102

7 Modelling flavour release from aqueous sucrose solutions, using mass transfer and partition coefficients
The penetration theory of interfacial mass transfer was used to model flavor release from aqueous solutions containing different concentrations of sucrose. The mass transfer coefficient as well as the gas/solution partition coefficient are the main factors of the model influencing the release in time. Parameters governing the isolation by a purge and trap method at mouth conditions (volume, temperature, artificial saliva) were used in the model description of the flavor release. Viscosities of the different sucrose solutions (0-60 w/V%) at 37 °C were estimated and their influence on the mass transfer coefficients was determined. The gas/solution partition coefficients for ethyl acetate, methyl butanoate, ethyl butanoate, hexanal and octanal were measured for the different sucrose concentrations at 37 °C. At lower sucrose concentrations the partition coefficient primarily controls flavor release during a purge time often minutes, whereas at higher sucrose concentrations the influence of the mass transfer coefficient is more important.
This chapter has been submitted as:
Nahon, D.F.; Harrison, M ; Roozen, J.P. Journal of Agricultural and Food Chemistry
103
Chapter 7
7.1 Introduction
The instrumental analysis of the release of volatile compounds from solutions containing
sucrose and an orange aroma formed part of the study of sweetness-flavour interactions in
models for soft drinks (Nahon et al, 1998). In the presence of sucrose, volatile compounds
from a watery vapor phase of stripped orange juice (orange aroma) were isolated by a purge
and trap method at mouth conditions (volume, temperature, artificial saliva), during ten
minutes. The volatile compounds were trapped onto an adsorbance material (Tenax) and then
quantified by gas chromatography coupled with flame ionisation detection (GC/FID). To
understand the effect of the addition of sucrose (as compared with an addition of e.g. Na-
cyclamate), the release of volatile compounds was studied in solutions containing increasing
concentrations of sucrose. The latter caused an increased release of the volatile compounds
with short GC/FID retention times and a decreased release of the volatile compounds with
longer retention times (Nahon et al, 1998). Modelling of these results will improve the
understanding of the system worked with and elucidate the parameters influencing the
flavour release.
Harrison and Hills (1997) modelled the dynamic flavour release from liquid emulsions in
the mouth. Their model revealed the most important parameters influencing the release. One
important parameter is the viscosity, which determines the diffusion coefficient, D and thus
the interfacial mass transfer coefficient, hd (Harrison et al, 1997). The mass transfer
coefficient is a measure for the rate of release (De Roos and Wolswinkel, 1994). The other
important parameter is the gas/solution partition coefficient, Kgs, which is influenced by the
sucrose concentration as well and reflects the concentration ratios at equilibrium (De Roos
and Wolswinkel, 1994).
In the literature, several tables can be found, reporting the viscosities for different sucrose
solutions, at different temperatures (e.g. Bates, 1942). However, these tables do not give the
exact viscosity values for the sucrose concentrations relevant to the present study and
moreover not for the specific temperature of 37 °C. Bretsznajder (1971) and Genotelle (1978)
presented equations and figures reflecting relationships between temperatures and viscosities
for various sucrose solutions.
104

Modelling flavour release
Table 7.1 Authors reporting partition coefficients (xl(r ) for ethyl acetate, methyl butanoate, ethyl butanoate, hexanal and/or octanal. A. Specifications of the determinations; author number, author, volatile concentration, temperature, equilibration time, method. SHGC = Static headspace gas chromatography. B. Partition coefficients determined in water and sucrose/glucose solutions; author number between brackets.
A.
no.
1
2 3 4
5 6
7
8
9
10
author
Amoore and Buttery (1978) Buttery et al. (1965) Buttery et al. (1969) De Roos and Wolswinkel (1994) Guitarte/a/. (1989) Hall and Andersson (1983) Kieckbusch and King (1979b) YLoVoetal. (1992)
Landy etal. (1995)
Voilley and Bosset (1986)
volatile concentration
(ppm) solubility level 5 5-200
20-5000 0.25-1.2
400
+1000
20-1000
1000/10000
temp. (°C)
25
25 25 37
37 40
30
37
25
25
equilibration time (min)
15 >30 60
30 60
<30
60
5
method
calculation
SHGC SHGC stripping
SHGC SHGC
SHGC
extrapolated /calculated exp. dilution mol fractions SHGC
B.
water
ethyl acetate
9.2 (7) 9.0 (5) 9.6 (9) 11.6 (10) 14.8 (8)
+ sucrose 12.0-30.3 (7) + glucose 38.1 (10)
methyl butanoate 8.4 (3) 11.0 (1) 15.8 (4)
<15.8 (4)
ethyl butanoate 22.4 (9)
hexanal
6.9 8.7 11.4 36
(2) (3) (1) (6)
octanal
5.4 (2) 14.0 (1) 21.0 (3) 79 (6)
105

Chapter 7
Table 7.1 shows an overview of the authors reporting partition coefficients for five volatile
compounds studied in the present experiment. These volatile compounds were taken from the
three retention time groups as distinguished by Nahon et al. (1998); ethyl acetate and methyl
butanoate (short GC/FID retention times), ethyl butanoate and hexanal (medium retention
times) and octanal (long retention times). Several gas/solution partition coefficients were
reported in literature, but not for all sucrose solutions and at temperatures different from 37
°C. The results of Kieckbusch and King (1979a) indicated that the partition coefficients are
linearly related to the reciprocal temperature (in K). Overbosch et al. (1991) also reported
that the partition coefficients increase with increasing temperatures. Hall and Andersson
(1983) determined the influence of temperature on the volatility of various aldehydes. They
reported different linear temperature dependencies of partition coefficients for different
compounds in the media: vegetable oil, dioctyl phthalate, paraffin oil and water. These
authors found that varying the temperature does not only change the overall concentration
level of volatile compounds in the gas phase, but also the relative composition of the gas
phase. In the course of time, different methods for the determination of gas/solution partition
coefficients were given in literature. Chaintreau et al. (1995) and Chai and Zhu (1998)
proposed indirect headspace gas chromatographic methods, for the determination of partition
coefficients independently of the concentration of the reference. This method uses two
sample vials filled with different volumes of an identical solution.
In the present study, the dependency of the mass transfer coefficient on the viscosity was
described in an equation. The gas/solution partition coefficients for ethyl acetate, methyl
butanoate, ethyl butanoate, hexanal and octanal over the different sucrose solutions were
determined. Then the release of these volatile compounds from sucrose solutions was
described by a model. The mass transfer coefficient in water was used as a fitting parameter
to approach experimental results published before (Nahon et al, 1998). Modelling these
experimental results will reveal the parameters influencing the flavour release.
7.2 Materials and methods
Viscosities of different sucrose solutions were calculated, partition coefficients of volatile
compounds over these solutions were determined and the release of the volatile compounds
was described by a model.
106
Modelling flavour release
7.2.1 Sample preparation
Samples were solutions of sucrose (CSM Suiker BV, Amsterdam, The Netherlands) and
volatile compounds in demineralized water. The sucrose concentrations were 0, 5, 10, 20, 40
and 60 w/v%. The volatile compounds were ethyl acetate (E. Merck, Darmstadt, Germany),
ethyl butanoate (Janssen Chimica, Geel, Belgium), methyl butanoate, hexanal and octanal (all
Merck-Schuchardt, Germany). The purities of the volatile compounds were all over 98%
(synthesis-grade). Preparation of solutions was at room temperature (22 °C), 6 to 15 hours
before analysis at 37 °C.
7.2.2 Viscosity
The required viscosities at 37 °C can be determined by using equations given in literature.
Genotelle (1978) established the following relationship between the dynamic viscosity (77),
the sucrose concentration and the temperature of the solution;
log 77 =22.46 AT-0.114+ 0>(l. 1 + 43.1 Nh25) (7.1)
in which AT = (5/(1900 - 18 B) is the molar fraction of sucrose, B being °Brix and O = (30 -
7)/(91 + T), T being the temperature. The data generated with the help of Equation 7.1
deviate maximal 1% from the data for standard solutions as published by the National Bureau
of Standards (Bates, 1942). Given the experimental temperature of 37 °C, the weight
fractions or °Brix for the sucrose solutions were determined to be able to calculate the
viscosities for the different sucrose solutions with the help of Equation 7.1. An Abbe
refractometer (Atago Type No. 302 with Power Source) was used for this determination.
7.2.3 Gas/solution partition coefficients
The samples for the measurements of the gas/solution partition coefficients were prepared by
adding 14-17 ppm of volatile compound to the various sucrose solutions. Sealed volumetric
flasks with solutions containing ethyl butanoate, hexanal or octanal were placed in a
sonification bath (Sonicar Ultrawave CE) at room temperature for 30 min, to fully solubilize
these more apolar volatile compounds. The homogeneity of the solutions was checked
visually, according to the method described by Buttery et al. (1969).
The equilibrium concentrations of the volatile compounds in the gas phase were measured
at 37 °C using static headspace gas chromatography (SHGC). The sample solution (3 mL)
107
Chapter 7
was transferred into a 12 mL vial, which was capped and incubated at 37 °C for 15 or 30 min
in the headspace unit (Fisons HS800) of the gas chromatograph. The gas/solution equilibrium
is considered to be reached when the volatile concentration in the headspace remains
constant. For ethyl acetate and octanal an incubation time of 15 min was testified to be
sufficient; for methyl butanoate, ethyl butanoate and hexanal an equilibrium was reached
after an incubation time of 30 min. After incubation, 300 |aL of the sample headspace passed
a MFA 815 cold trap (Fisons Instruments) for cryofocussing and was then injected into a
HRGC 5300 Mega Series gas chromatograph (Carlo Erba Instruments, Interscience BV,
Breda, The Netherlands). The GC was equipped with a DB-wax column (30 m x 0.542 mm x
1.0 jam) and a flame ionisation detector at 220 °C. The oven temperature was 40 °C for 5 min
and then programmed to 110 °C at a rate of 3 °C/min and further to 170 °C at 20 °C/min. One
measurement consisted of at least three repetitions of this method.
For calibration curves, 2 or 10 uL of a pure volatile compound were dissolved in 10 mL
solvent and different volumes of these two solutions were manually injected on the column.
The solvent used for ethyl acetate and methyl butanoate was demineralized water, and the
solvent for ethyl butanoate, hexanal and octanal was hexane. The method was repeated two
times, to obtain significant and reliable calibration curves (R2 > 0.84).
The gas/solution partition coefficient Kgs is given by the following equation:
Qeq
K„=^~ (7.2)
in which C/9 is the concentration of the volatile compound in the gas phase at equilibrium
and Cf is the concentration of the volatile compound in the solution at equilibrium. As the
volatile compound in the system distributes between the gas phase and the solution until
equilibrium has been reached, the concentration in the solution can be calculated from the
initial volatile concentration, the concentration in the gas phase and the volumes of the gas
phase and solution;
C,=C,(0)-C. 'O (7.3)
in which Cs(0) is the initial volatile concentration in the solution and vg and vs are the
volumes of the gas phase and the solution, respectively.
108
Modelling flavour release
7.2.4 Flavour release model
Parameters in the model of Harrison and Hills (1997) were adjusted to approximate the
experimental design used in the study of Nahon et al. (1998). The ratios of release in time are
then given by the following model:
cg(0 = 4A C,(0) v*
expr,t - expr2t r, -r,
(7.4)
in which r!t r2 = j\hd, Kgs, Q, Ags, vg, vs). Apparently, the concentration of the volatile
compound in the headspace in time, Cg(t), is a function of the initial concentrations in the
solution, Cs(0), the viscosity-dependent mass transfer coefficient, hd, the gas/solution
partition coefficient, Kgs, the nitrogen gas flow rate, Q, the interface surface area, Ags, the
volume of the headspace, vg and the volume of the solution, vs (sample + artificial saliva).
Parameters were substituted in the model presented by Equation 7.4. Similar to the
expressions reported by Harrison and Hills (1997), ri and r2 in Equation 7.4 are given by
.^EUL (7.5) 2 2
and
with
and
a__EHt (7.6) 2 2 2
a = i + ^ + ^ (7.7) v v K v
QKK P= d ss (7.8)
The following parameters, necessary for Equations 7.4, 7.5, 7.6, 7.7 and 7.8, were known
from the set-up of the release experiments:
Q =20mL/min vg =31mL
vs = 19 mL
109

Chapter 7
The partition coefficients, Kgs, were determined for the different volatile compounds,
dissolved in the different sucrose solutions. As the volatile concentrations in and above the
solutions {Cs and Cg) are unknown, the relative concentrations given by Cg(t)/Cs(0) will be
studied in time.
The mass transfer coefficient, ha, is an unknown parameter, which can be described as a
function of the viscosity, rj. Harrison et al. (1997) and Bakker et al. (1998) reported the
following relationship:
A,cc-}= (7.9)
Starting from this relationship, the mass transfer coefficient can be described as a function of
the mass transfer coefficient in water, hd(0), the viscosity in water, rj(0) and the viscosity for
a specific sucrose solution, with concentration, Csuc-
K(CJ_ rw: (710)
As TJ(0) and t](CSUQ) will be calculated using Equation 7.1, the mass transfer coefficient for a
specific volatile compound at a given sucrose concentration depends on ha(0) for that volatile
compound. The interface area, Ags, concerns the complete interface between the gas phase
and the solution, including the gas bubbles in the solution caused by the nitrogen flow. As Ags
can only be approximated, it was included in the mass transfer coefficient to give hda (= hj x
Ags). Then hda depends on the sucrose concentration and the magnitude of hj(0). The latter
Table 7.2 Average and standard deviations (n=10 for 0 and 60 w/v% sucrose; n=3 for 5, 10, 20 and 40 w/v% sucrose) for gas/solution partition coefficients (x JO3) of ethyl acetate, methyl butanoate, ethyl butanoate, hexanal and octanal for different sucrose solutions (w/v%) at37°C (Verset, 1998).
sucrose (w/v%)
0 5 10 20 40 60
ethyl acetate
10.3±0.33 11.210.26 11.310.61 13.210.78 16.410.74 22.811.66
methyl butanoate
11.210.35 13.810.37 14.910.12 16.6 1 0.65 21.010.08 28.4 1 7.76
ethyl butanoate
14.8 10.67 18.910.59 19.710.50 22.111.98 28.211.18 29.811.72
hexanal
12.910.99 13.010.08 13.5 1 0.04 13.310.10 13.910.15 13.111.09
octanal
21.111.80 20.010.32 19.210.38 17.510.99 16.111.49 14.313.17
110

Modelling flavour release
was used as the fitting parameter, to approach the experimental results with the model
description (Equation 7.4).
Using a partition coefficient measured for a certain volatile compound in a sucrose
solution (Table 7.2) and given the relationship between the mass transfer coefficient and the
sucrose concentration, the release of this volatile compound in time can be determined with
the use of Equation 7.4. To be able to compare this predicted release with that determined
previously (Nahon et al, 1998), the time-release curves were integrated with the help of the
technical computing program Mathematica (Version 3.0, Wolfram Research Inc.,
Champaign, IL, USA). For each volatile compound, the amount of volatile released from the
sucrose solution in ten minutes (i.e. the purge time) was related to the amount of volatile
released from water. These ratios of release predicted by the model (integration areas) were
compared with the ratios of release obtained in the purge and trap experiment (GC/FID peak
areas). The hd(0) was used to adjust the ratios of release predicted by the model. The optimal
hda(0) was given by the optimal least squares solution for the fit of the model integration
ratios to the experimental peak area ratios.
7.3 Results & discussion
The release of volatile compounds from aqueous solutions containing sucrose was described
in a model (Equation 7.4). One of the parameters used in the model was the viscosity of the
different sucrose solutions. Another parameter used in the model is the gas/solution partition
coefficient.
7.3.1 Viscosity
The viscosities of the sucrose solutions were calculated from the sucrose concentrations in
°Brix (Equation 7.1). The weight fractions or °Brix for the different sucrose solutions and the
calculated viscosities are given in Table 7.3. These viscosities are in the same range as values
reported in literature (Bates, 1942; Nawar, 1971; Voilley and Bosset, 1986), when
considering the different sucrose concentrations and the different temperatures. The °Brix
was determined at room temperature and then used for the calculation of the viscosity at 37
°C. This temperature difference introduces a deviation in °Brix of about 0.5%, resulting in a
deviation of maximal 2.5% for the calculated viscosity according to Genotelle (1978).
I l l
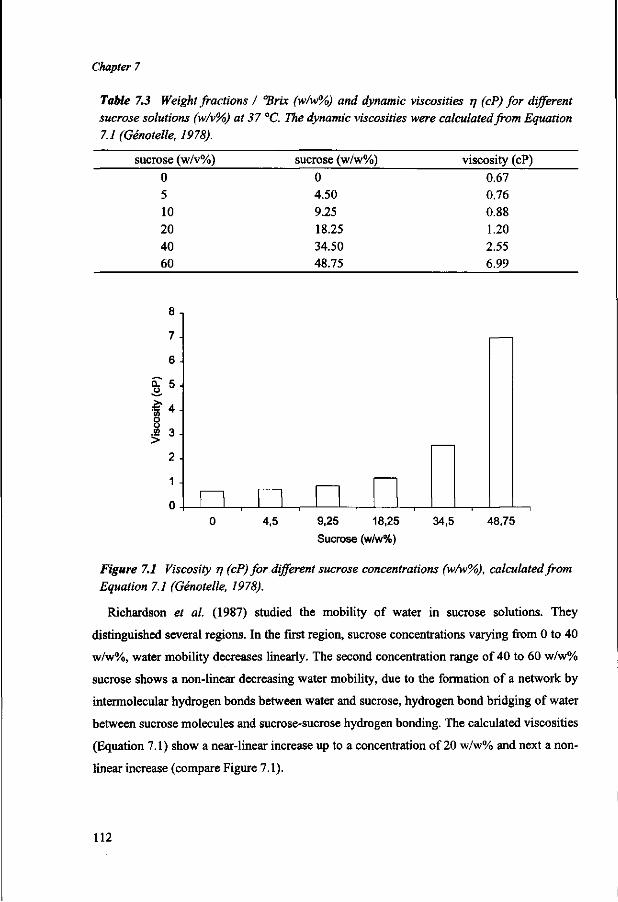
Chapter 7
Table 7.3 Weight fractions / °Brix (w/w%) and dynamic viscosities TJ (cP) for different sucrose solutions (w/v%) at 37 °C. The dynamic viscosities were calculated from Equation 7.1 (Genotelle, 1978).
sucrose (w/v%) sucrose (w/w%) viscosity (cP) 0 5 10 20 40 60
0 4.50 9.25 18.25 34.50 48.75
0.67 0.76 0.88 1.20 2.55 6.99
8
7
6
I5
</>
8 ID "J
> J
2
1
0 4,5 9,25 18,25
Sucrose (w/w%)
34,5 48,75
Figure 7.1 Viscosity t] (cP) fordifferent sucrose concentrations (w/w%), calculated from Equation 7.1 (Genotelle, 1978).
Richardson et al. (1987) studied the mobility of water in sucrose solutions. They
distinguished several regions. In the first region, sucrose concentrations varying from 0 to 40
w/w%, water mobility decreases linearly. The second concentration range of 40 to 60 w/w%
sucrose shows a non-linear decreasing water mobility, due to the formation of a network by
intermolecular hydrogen bonds between water and sucrose, hydrogen bond bridging of water
between sucrose molecules and sucrose-sucrose hydrogen bonding. The calculated viscosities
(Equation 7.1) show a near-linear increase up to a concentration of 20 w/w% and next a non
linear increase (compare Figure 7.1).
112
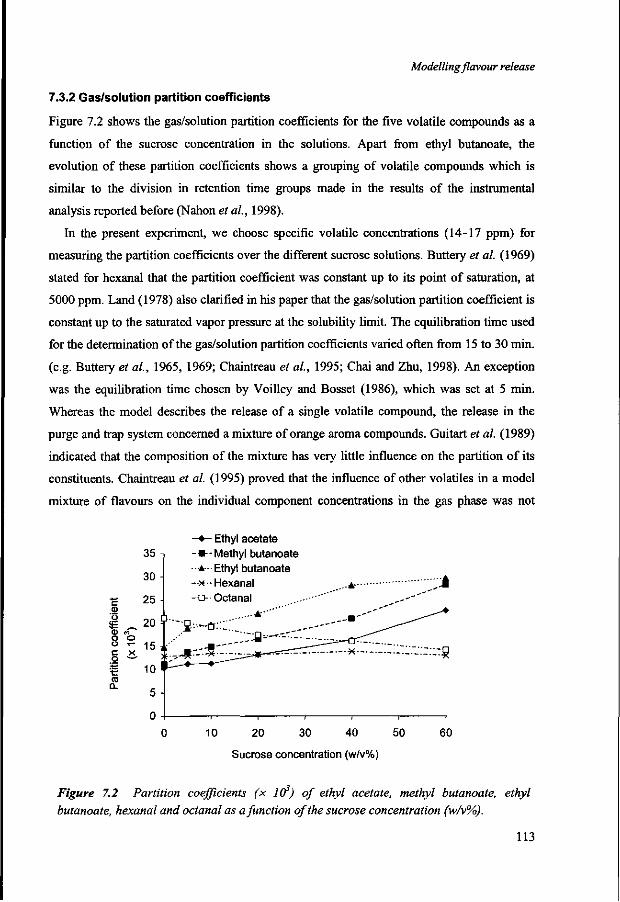
Modelling flavour release
7.3.2 Gas/solution partition coefficients
Figure 7.2 shows the gas/solution partition coefficients for the five volatile compounds as a
function of the sucrose concentration in the solutions. Apart from ethyl butanoate, the
evolution of these partition coefficients shows a grouping of volatile compounds which is
similar to the division in retention time groups made in the results of the instrumental
analysis reported before (Nahon et al, 1998).
In the present experiment, we choose specific volatile concentrations (14-17 ppm) for
measuring the partition coefficients over the different sucrose solutions. Buttery et al. (1969)
stated for hexanal that the partition coefficient was constant up to its point of saturation, at
5000 ppm. Land (1978) also clarified in his paper that the gas/solution partition coefficient is
constant up to the saturated vapor pressure at the solubility limit. The equilibration time used
for the determination of the gas/solution partition coefficients varied often from 15 to 30 min.
(e.g. Buttery et al, 1965, 1969; Chaintreau et al, 1995; Chai and Zhu, 1998). An exception
was the equilibration time chosen by Voilley and Bosset (1986), which was set at 5 min.
Whereas the model describes the release of a single volatile compound, the release in the
purge and trap system concerned a mixture of orange aroma compounds. Guitart et al. (1989)
indicated that the composition of the mixture has very little influence on the partition of its
constituents. Chaintreau et al. (1995) proved that the influence of other volatiles in a model
mixture of flavours on the individual component concentrations in the gas phase was not
s
O O O T -C X .2 "^ '•E ro Q.
35
30
25
20 h
15
10
5
0
- • - Ethyl acetate -•--Methyl butanoate
A - Ethyl butanoate - x -Hexanal -a- Octanal
. . .A""
0 10 20 30 40 50
Sucrose concentration (w/v%)
60
Figure 7.2 Partition coefficients (x Iff) of ethyl acetate, methyl butanoate, ethyl butanoate, hexanal and octanal as a function of the sucrose concentration (w/v%).
113
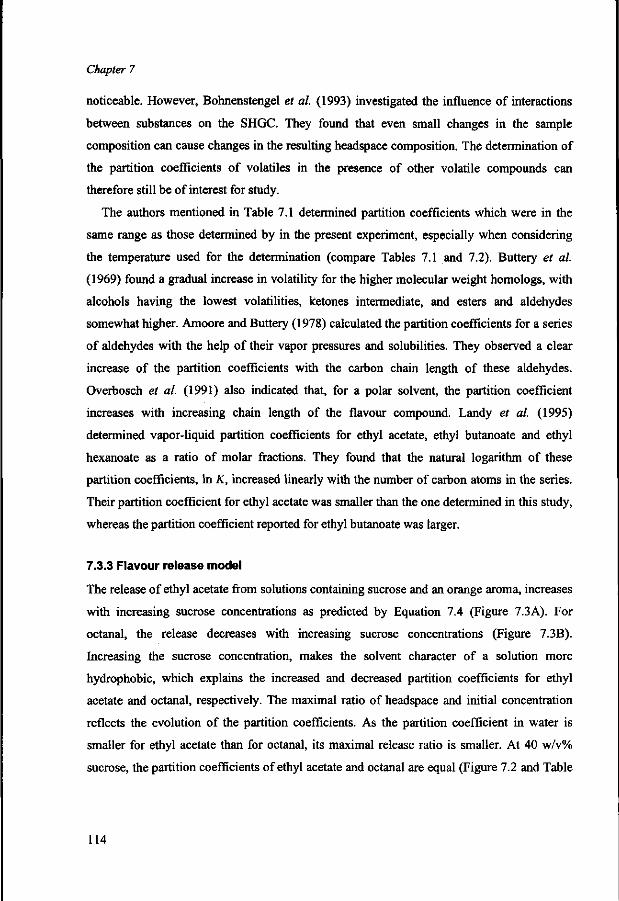
Chapter 7
noticeable. However, Bohnenstengel et al. (1993) investigated the influence of interactions
between substances on the SHGC. They found that even small changes in the sample
composition can cause changes in the resulting headspace composition. The determination of
the partition coefficients of volatiles in the presence of other volatile compounds can
therefore still be of interest for study.
The authors mentioned in Table 7.1 determined partition coefficients which were in the
same range as those determined by in the present experiment, especially when considering
the temperature used for the determination (compare Tables 7.1 and 7.2). Buttery et al.
(1969) found a gradual increase in volatility for the higher molecular weight homologs, with
alcohols having the lowest volatilities, ketones intermediate, and esters and aldehydes
somewhat higher. Amoore and Buttery (1978) calculated the partition coefficients for a series
of aldehydes with the help of their vapor pressures and solubilities. They observed a clear
increase of the partition coefficients with the carbon chain length of these aldehydes.
Overbosch et al. (1991) also indicated that, for a polar solvent, the partition coefficient
increases with increasing chain length of the flavour compound. Landy et al. (1995)
determined vapor-liquid partition coefficients for ethyl acetate, ethyl butanoate and ethyl
hexanoate as a ratio of molar fractions. They found that the natural logarithm of these
partition coefficients, In K, increased linearly with the number of carbon atoms in the series.
Their partition coefficient for ethyl acetate was smaller than the one determined in this study,
whereas the partition coefficient reported for ethyl butanoate was larger.
7.3.3 Flavour release model
The release of ethyl acetate from solutions containing sucrose and an orange aroma, increases
with increasing sucrose concentrations as predicted by Equation 7.4 (Figure 7.3A). For
octanal, the release decreases with increasing sucrose concentrations (Figure 7.3B).
Increasing the sucrose concentration, makes the solvent character of a solution more
hydrophobic, which explains the increased and decreased partition coefficients for ethyl
acetate and octanal, respectively. The maximal ratio of headspace and initial concentration
reflects the evolution of the partition coefficients. As the partition coefficient in water is
smaller for ethyl acetate than for octanal, its maximal release ratio is smaller. At 40 w/v%
sucrose, the partition coefficients of ethyl acetate and octanal are equal (Figure 7.2 and Table
114

Modelling flavour release
0.016 -, Release of ethyl acetate (hda(0) = 3E-08)
(0 : <D ° i (0 ' Q. to
"O • (0 ' <B
X : •
•s
o
Q:
0.012
0.008
0.004
— 0 % sucrose
-—20 % sucrose
40 % sucrose
—• 60 % sucrose
200 400 600
Time (s)
B 0.02 Release of octanal (hda(0) = 3E-08)
0 % sucrose
20 % sucrose
40 % sucrose
60 % sucrose — i — - ~ ~ ~ - ^ i
200 400
Time (s)
600
Figure 7.3 Predicted release (Equation 7.4) of A. ethyl acetate and B. octanal into headspace from solutions containing sucrose (0, 20, 40 and 60 w/v%) and an orange aroma, represented by the ratio of headspace and initial concentration of the volatile compound as a function of time. hda(0) was set at 3 x 10s (m3/s)for both compounds.
7.2), resulting in an equal maximal release ratio for a 40 w/v% sucrose solution (compare
Figures 7.3A and B).
115
Chapter 7
160 <D in o o 3 CO
a> (0
o o ra
Q:
N ? • —
£ ro .5 c o 3 o tn
140
120
100
80
60
40
20
Ethyl acetate
10 20 30 40
Sucrose (w/v%)
50 60
B
o a>
o q ro
160 Methyl butanoate
20 30 40
Sucrose (w/v%)
50 60
140 -,
Ethyl butanoate
20 30 40
Sucrose (w/v%)
50 60
116

Modelling flavour release
CD
(/> 2 — § g. v> TT CD . 2
8-5
o = o o ~ «) CO
140
120
100
80
60 ^
40
20
0
Hexanal
10
Experimental results
- 6E-8
5E-8
• 4E-8
20 30
Sucrose (w/v%)
40 50 60
140 -,
120 2 o 3 CO CD CO CO CI)
£ o o
ra a.
~s
CD
m ^ c o 3 O 40
20-I
Octanal
Experimental results
- 4E-8
3E-8
• 2E-8
10 20 30 40
Sucrose (w/v%)
50 60
Figure 7.4 Peak area and integration ratios representing the release of A. ethyl acetate, B.
methyl butanoate, C. ethyl butanoate, D. hexanal and E. octanal, for different sucrose
concentrations. The peak area ratios (M) and their standard deviations were deducted from
experimental observations (Nahon et al., 1998); the integration ratios were obtained by
modelling (Equation 7.4). The model predictions are given for three hda(0) 's, the middle
providing the optimal fit.
The mass transfer coefficient decreases with increasing sucrose concentrations. In Figures
7.3 A and B this is demonstrated by a smaller initial slope of the time-release curve (Bakker et
al., 1998). These authors also reported that the initial release rates for diacetyl decreased as
the concentration of gelatin increased, i.e. as the viscosity increases. Chandrasekaran and
King (1972) found that the activity coefficients for ethyl acetate and hexanal increased with
117

Chapter 7
increasing sugar concentrations. The diffusion coefficients of these volatile compounds
decreased with increasing sucrose concentrations. Darling et al. (1986) observed for isopentyl
acetate that for higher sucrose concentrations (> 30%) the viscosity of the solution increased
steeply and consequently the diffusion coefficient fell.
In order to compare the release described by the model (Equation 7.4) with the release in
the purge and trap system, the areas under the release curves were integrated. In Figures
7.4A-E the integration ratios as obtained with the model (lines) and the peak area ratios as
obtained in the experiments (marks) (Nahon et al, 1998) are compared. For each volatile
compound, the model predictions for three hda(0)'s are given, the middle hda(0) being the
optimal least squares solution for the fit of the model to the experimental results. The optimal
values of hda(0) for ethyl acetate, methyl butanoate, ethyl butanoate, hexanal and octanal
were 3 x 10"8, 2 x 10"8, 2 x 10"8, 5 x 10"8 and 3 x 10"8 m3/s, respectively. Figures 7.4A-E
reflect the fit of the model to the experimental results. Figure 7.4A shows that the predicted
and observed release of ethyl acetate increase with increasing sucrose concentration.
Choosing a higher mass transfer coefficient (and thus hdd) increases the release of for all
volatile compounds (Figure 7.4). Comparing Figures 7.4A-C with 7.4D-E shows that the
influence of the mass transfer coefficient/Zirfa, is much smaller for the volatile compounds
hexanal and octanal. Increasing the sucrose concentration and thus the mass transfer
coefficient, hardly influences the ratios of release for these compounds. Therefore, changes in
the fitting parameter hda will not influence these ratios either. The optimal values of hda(0)
for the five volatile compounds are similar. Overall they vary from 2 x 10"8 to 5 x 10~8 m3/s.
There is no special trend when looking at more polar or more apolar volatile compounds. The
purge and trap method used for the instrumental analysis of the flavour release included
stirring of the solution. Bakker et al. (1998) reported an effect of stirring rate on the dynamic
release of diacetyl. Therefore, stirring is one of the factors introducing variation in the
experimental data. As the fit of the model to the experiments is adjusted per volatile
compound, the fitting parameter hda will vary as well. According to Overbosch et al. (1991),
the diffusion coefficient does not vary significantly between flavour compounds. As the
diffusion coefficient determines the mass transfer coefficient, this latter coefficient will not
vary much with the flavour compound either. De Roos and Wolswinkel (1994) also neglected
differences in diffusion coefficients between volatile compounds in their release study.
118

Modelling flavour release
However, Harrison and Hills (1997) stated that the hd(0) will vary between volatile
compounds.
Knowing the hda giving the best fit of the model to the experimental results, the expected
mass transfer coefficient ha can be deducted from an approximation of the interface surface
area Ags. This area is composed of the surface area of the solution and the surface areas of the
nitrogen gas bubbles purged through the solution. The diameter of the tube through which the
nitrogen gas is let into the solution is 3 x 10"3 m, which produces bubbles with a calculated
volume of 1.4 x 10"8 m3. Given the experimental nitrogen flow of 20 mL/min, 14147 bubbles
will pass through the solution during the ten minutes of the analysis. This gives an interface
area of 0.4 m2 as provided by the bubbles. The surface area of the solution can be assumed
neglectable (= 4.8 x 10"4 m2). As the average best fitting hda was 3 x 10"8 m3/s in the present
experiment, the best estimate of the mass transfer coefficient in this system is 7.5 x 10"8 m/s.
When comparing the model predictions (Figure 7.4) with the evolution of the partition
coefficients (Figure 7.2), it appears that the ratio-curves at low sucrose concentrations, are
mainly controlled by the partition coefficient of a specific volatile compound. When the
sucrose concentration and thus the viscosity of the solution increases, the mass transfer
coefficient becomes smaller (as given by Equation 7.10). Then the partition coefficient looses
impact on the release during a purge time often minutes. In accordance with the explanations
of Richardson et al. (1987) the viscosity of the solutions increases especially for the two
highest sucrose concentrations (40 and 60 w/v%) in Figure 7.1. A comparison of Figures 7.2
and 7.4 demonstrates that the partition coefficient has the largest influence on the ratios of
release up to a sucrose concentration of 40 w/v%. De Roos and Wolswinkel (1994) also
found that the effect of the resistance to mass transfer on the relative release rate was
relatively small and that flavour release was mainly partition-controlled for water and an
aqueous solution of 25% sucrose.
The model describing the flavour release from the sucrose solutions, includes the mass
transfer coefficient as being dependent of the viscosity. It is questionable whether it is
actually the viscosity or the sucrose concentration influencing the diffusion coefficient and
thus the mass transfer coefficient. Roberts et al. (1996) studied flavour release for different
thickeners at equal viscosities and found that the three thickened systems did not have the
same flavour release profiles. Thickener-specific influence on the flavour release was
revealed. Apparently, viscosity-dependent mass transfer does occur, but other mechanisms
119

Chapter 7
such as changes in the water activity are also important. Darling et al. (1986) explained that
interactions between long chain polymers will induce the 'macro' viscosity of solutions,
while still very large pores of 'free' water are available to small molecules for diffusion.
Diffusion in this water phase is not related to the viscosity of the bulk solution. For solutions
thickened by large quantities of small molecules (e.g. sucrose) the 'macro' viscosity extends
down into the 'micro' environment, which will be experienced by the diffusing aroma
molecules. Richardson et al. (1987) reported a decreasing water mobility when the sucrose
concentration passes 40 w/w%. In this study, the mass transfer coefficient could be better
described as a function of the sucrose concentration instead of the viscosity.
In conclusion, the model described the dynamic flavour release for five volatile
compounds from aqueous sucrose solutions. By determination of the viscosities and the
partition coefficients, the model provided an acceptable fit to the experimental data obtained
with instrumental analysis. The model description revealed that at low sucrose concentrations
the partition coefficient primarily controls the flavour release, whereas at higher sucrose
concentrations the mass transfer coefficient has more influence.
7.4 References
Amoore, J.E.; Buttery, R.G. Partition coefficients and comparative olfactometry. Chem. Senses Flavor 1978,5,57-71.
Bakker, J.; Boudaud, N.; Harrison, M. Dynamic release of diacetyl from liquid gelatin in the headspace. J. Agric. Food Chem. 1998, 46, 2714-2720.
Bates, J. Polarimetry, saccharimetry and the sugars. Circular of the National Bureau of Standards C440; United States Government Printing Office: Washington, DC, USA, 1942; 810 p.
Bohnenstengel, F.; Soltani, N.; Baltes, W. Headspace analysis with large sample volumes. Influence of sampling device volume, analyte concentration and sample matrix. J. Chromatogr. A 1993, 655, 249-255.
Bretsznajder, S. Viscosities of liquids. In International Series of Monographs in Chemical Engineering. Volume 11. Prediction of transport and other physical properties of fluids; Pergamon Press, 1971; pp. 189-231.
Buttery, R.G.; Guadagni, D.G.; Okano, S. Air-water partition coefficients of some aldehydes. J. Sci. FoodAgr. 1965,16, 691-692.
Buttery, R.G.; Ling, L.C.; Guadagni, D.G. Volatilities of aldehydes, ketones, and esters in dilute water solution. J. Agric. Food Chem. 1969,17, 385-389.
120
Modelling flavour release
Chai, X.S.; Zhu, J.Y. Indirect headspace gas chromatographic method for vapor-liquid phase
equilibrium study. J. Chromatogr. A 1998, 799, 207-214.
Chaintreau, A.; Grade, A.; Munoz-Box, R. Determination of partition coefficients and quantitation of
headspace volatile compounds. Anal. Chem. 1995, 67, 3300-3304.
Chandrasekaran, S.K.; King, C.J. Multicomponent diffusion and vapor-liquid equilibria of dilute
organic components in aqueous sugar solutions. AIChEJ. 1972,18, 513-520.
Darling, D.F.; Williams, D.; Yendle, P. Physico-chemical interactions involved in aroma transport
processes from solution. In Interactions of Food Components; Birch, G.G., Lindley, M.G., Eds.;
Elsevier Applied Science Publishers: London, UK, 1986; pp 165-188.
De Roos, K.B.; Wolswinkel, K. Non-equilibrium partition model for predicting flavour release in the
mouth. In Trends in Flavour Research; Maarse, H., Van der Heij, D.G., Eds.; Elsevier Science:
Amsterdam, The Netherlands, 1994; pp 15-32.
Genotelle, J. Expression de la viscosite des solutions sucrees. Indust. Alim. Agric. 1978, 95, 747-755.
Guitart, R.; Puigdemont, A.; Arboix, M. Rapid headspace gas chromatographic method for the
determination of liquid/gas partition coefficients. /. Chromatogr. 1989, 491, 271-280.
Hall, G.; Andersson, J. Volatile fat oxidation products II. Influence of temperature on volatility of
saturated, mono- and di-unsaturated aldehydes in liquid media. Lebensm. -Wiss. -Technol. 1983, 16, 362-366.
Harrison, M.; Hills, B.P. Effects of air flow-rate on flavour release from liquid emulsions in the
mouth. Int. J. Food Sci. Technol. 1997, 32, 1-9.
Harrison, M.; Hills, B.P.; Bakker, J.; Clothier, T. Mathematical models of flavor release from liquid
emulsions. J. Food Sci. 1997, 62, 653-658, 664.
Kieckbusch, T.G.; King, C.J. An improved method of determining vapor-liquid equilibria for dilute
organics in aqueous solution. J. Chromatogr. Sci. 1979a, 17, 213-21(3.
Kieckbusch, T.G.; King, C.J. Partition coefficients for acetates in food systems. J. Agric. Food Chem.
1979b, 27, 504-507.
Kolb, B.; Welter, C ; Bichler, C. Determination of partition coefficients by automatic equilibrium
headspace gas chromatography by vapor phase calibration. Chromatogr. 1992, 34, 235-240.
Land, D.G. Some factors influencing the perception of flavour-contributing substances in food. In
Progress in Flavour Research; Land, D.G., Nursten, H.E., Eds.; Applied Science Publishers:
London, UK, 1978; pp 53-66.
Landy, P.; Druaux, C; Voilley, A. Retention of aroma compounds by proteins in aqueous solution.
Food Chem. 1995, 54, 387-392.
Nahon, D.F.; Navarro y Koren, P.A.; Roozen, J.P.; Posthumus, M.A. Flavor release from mixtures of
sodium cyclamate, sucrose, and an orange aroma. J. Agric. Food Chem. 1998, 46, 4963-4968 (this
thesis, Chapter 6).
Nawar, W.W. Some variables affecting composition of headspace aroma. J. Agric. Food Chem. 1971, 19, 1057-1059.
Overbosch, P.; Afterof, W.G.M.; Haring, P.G.M. Flavor release in the mouth. Food Rev. Int. 1991, 7,
137-184.
121

Chapter 7
Richardson, S.J.; Baianu, I.C.; Steinberg, M.P. Mobility of water in sucrose solutions determined by
deuterium and oxygen-17 nuclear magnetic resonance measurements. J. Food Sci. 1987, 52, 806-
809, 812.
Roberts, D.D.; Elmore, J.S.; Langley, K.R.; Bakker, J. Effects of sucrose, guar gum, and
carboxymethylcellulose on the release of volatile flavor compounds under dynamic conditions. J.
Agric. Food Chem. 1996, 44, 1321-1326.
Verset, D. Parameters influencing the release of volatile compounds from sucrose solutions. M.Sc.
Thesis, Department of Food Science, Wageningen University and Research Centre, Wageningen,
The Netherlands, 1998.
Voilley, A.; Bosset, J.O. Nouvelle technique de determination rapide de la volatility de composants
d'arome dans des milieux a forte viscosite (New method for rapid determination of the volatility of
flavour components in high viscosity media). Lebensm. -Wiss. -Technol. 1986,19, 47-52.
Denis Verset (Erasmus student from ENSBANA, Dijon, France) is thanked for his contribution to the
determination of the partition coefficients. The COST action 96 Short Time Scientific program is acknowledged
for financial support.
122

8 General discussion
123

Chapter 8
In this thesis the presence or absence of interactive effects between sweeteners and aroma
compounds has been studied with the help of sensory and instrumental analysis. The results
of the sensory analysis reveal whether panellists are able to perceive differences in the
flavour profiles of several stimuli. The results of the instrumental analysis clarify whether the
presence of (intense) sweeteners influences the release of volatile compounds from a
solution. Mathematical modelling of this release reveals the parameters influencing the
release.
The two preliminary studies on commercial products (Chapter 2) demonstrate that the
presence of intense sweeteners in a light soft drink influences the preferences for and the
flavour profiles of these drinks to various extents, depending on the flavour and sweeteners
present. The results of the preference study show that regular orange soft drinks are not
significantly preferred over their light equivalents. Regular cola soft drinks, on the contrary,
were significantly preferred over the light version in the tests. Informing the panellists about
the presence of a light soft drink does not influence their preferences. In the sensory study
(quantitative descriptive analysis, QDA) a commercial light blackcurrant soft drink,
sweetened with a combination of four intense sweeteners, has been investigated. A change in
the sweetener composition of the soft drink causes a shift in the character of the flavour from
blackcurrant to strawberry, together with an intensity decrease of the sour-related attributes
(Chapter 2).
The aim of the research described in the present thesis is to determine whether changes in
the quality of sweet taste are due to the properties of the sweeteners themselves and/or to
interactive effects between these sweeteners and aroma compounds. To be able to study
possible interactions, the starting point for all investigations should be similar, i.e. the
solutions containing the sweeteners should be equisweet. Sensory and instrumental analysis
will elucidate interactive effects between sweeteners and an orange aroma.
8.1 Equisweet mixtures
The sweetness level used in the research described in this thesis, is the one commonly present
in sucrose-sweetened soft drinks, i.e. equivalent to the sweetness of a 10 w/v% sucrose
solution (10% SEV). In each study (Chapters 3-5) the 10% SEV for a certain sweetener is
determined with the panel involved in that study. Differences in individual subjects'
124
General discussion
sensitivities to various taste compounds can be quite pronounced and this results in very
different responses to mixtures of compounds (Pangborn and Chrisp, 1964; Pangborn and
Trabue, 1964). Pangborn (1960) has suggested that many of the discrepancies among
laboratories may be due to the employment of expert panels in some studies and naive panels
in others. Gregson and McCowen (1963) also attribute inter-laboratory differences to
variations in the sensitivities of the different populations of panellists. In Chapter 5 SEV
determinations are repeated because of replacements in the sensory panel and the use of new
product batches. Comparison with the determinations reported in Chapter 3 and 4 confirm
that SEV determinations performed with different panels can be compared to a certain extent
only.
When studying combinations of sweeteners in solutions, the equisweetness of 10% SEV
can be attained in different, sweetener-specific ways. For mixtures of bulk sweeteners,
Beidler's mixture equation can be used, as demonstrated with mixtures of sucrose and
maltitol in Chapter 3. Given the 10% SEV of maltitol, a linear equation could be derived
from Beidler's mixture equation. All mixtures of sucrose and maltitol meeting with this
equation are equisweet. The mean scores on the attribute sweetness, taken from the
quantitative descriptive analysis, are constant for all different sucrose/maltitol mixtures
(Chapter 3, Figure 3.2).
For additive mixtures of bulk and intense sweeteners, such as the mixtures of sucrose and
aspartame, the validity of Beidler's mixture equation has been studied (Chapter 3). After
determining the 10% SEV for aspartame, again a linear equation has been obtained from
Beidler's mixture equation. Mixtures composed with the help of this equation are equisweet,
as confirmed by their constant mean scores on the attribute sweetness from the QDA
(Chapter 3, Figure 3.5).
Equisweet mixtures of sweeteners showing synergy were obtained by using a new method,
developed for mixtures of sucrose and Na-cyclamate (Chapter 4). The contribution of sucrose
to the mixtures was fixed, according to the chosen ratios of sweetness. Next Na-cyclamate
was added until a sweetness of 10% SEV was reached. The magnitude of this addition was
determined with the help of the method of constant stimuli in combination with weighted
linear regression. A comparison between the linear expectations derived from Beidler's
mixture equation and the additions determined in this way, then illustrated the synergy which
occurred in sucrose/Na-cyclamate mixtures during tasting.
125

Chapter 8
For the ternary mixtures of sucrose, aspartame and Na-cyclamate, a similar method as
mentioned for binary mixtures was applied. In Chapter 5 the concentrations of sucrose and
Na-cyclamate were fixed and deducted from the results given in Chapter 4. Then the
necessary concentration of aspartame for reaching 10% SEV was determined. The
composition of the equisweet ternary mixtures demonstrated that the synergy observed in
these mixtures is a combination of the relationships found for the composing binary mixtures.
The method used for composing the equisweet ternary mixtures is suitable for industrial
applications. The determination of some relevant equisweet binary and ternary sweeteners
mixtures is sufficient for the constitution of an equation representing equisweet mixtures of
sweeteners. An optimal sweetener-combination can be chosen with the help of such an
equation, taking into account possible taste limitations (as mentioned for Na-saccharinate in
Chapter 2), differences in costs and maximal doses (Allowed Daily Intake). Moskowitz et al.
(1978) also used this approach in their study of the sweetness and acceptance optimization of
cola flavored beverages, although they did not start from equisweet mixtures.
8.2 Methodology in sensory analysis
The use of QDA for the evaluation of different stimuli allows subjects to generate their own
appropriate descriptors. Only then subjects pay attention to all aspects of a solution, which
prevents cognitive factors affecting the judgments of chemosensory attributes (Van der
Klaauw, 1989). The instructional set given to subjects can have a substantial impact on odor-
induced enhancement of sweetness (Frank et al., 1990). The instructions and prototypes
offered can influence the subjects in their judgments to be in- or excluded in a particular
sensory attribute. In the present work no changes in the scores of the attribute sweetness were
observed, whether in the absence or in the presence of orange aroma (Chapters 3-5). Baldwin
and Korschgen (1979), Matysiak and Noble (1991) and Bonnans and Noble (1993) found
enhancement of fruitiness by aspartame. However, the results reported in Chapter 3 do not
reveal any changes in the attribute orange upon the addition of aspartame. Mixture-induced
taste quality enhancement is reduced or eliminated when appropriate attribute rating scales
are provided. Odor- or taste-induced enhancement of specific taste qualities in mixtures of
chemosensory stimuli is strongly influenced by the instructions given to subjects and the
specific taste and odor qualities of a mixture. As subjects are provided with additional,
126
General discussion
appropriate rating categories, either absence of interaction or mixture suppression replaces
enhancement (Frank et ai, 1993). According to Noble (1996) the enhancement of fruitiness
by sweetness and the enhancement of sweetness by fruitiness will occur, even after rigorous
training and rating of separate taste and aroma attributes. However, it should not be
concluded that mixture experiments should always use multiple, simultaneous, independent
ratings of 'appropriate' sensory qualities in order to avoid the 'biases' observed with the
other rating procedures. The choice of the method clearly depends on the aim of the
experiment (Frank et al, 1993).
8.3 Sensory analysis of interactive effects
Starting from the equisweet mixtures of sweeteners, interactive effects of these mixtures with
aroma compounds can be studied. Considering sensory analysis, changes in the flavour
profiles of the different solutions containing mixtures of sweeteners and an orange aroma
(watery vapour phase of stripped orange juice) were investigated using QDA. The
contribution of the different sweeteners to the sweetness of the mixture was varied to
elucidate possible effects of sweeteners and/or aroma compounds. The flavour profiles of
sucrose and maltitol do not differ significantly at a constant concentration of orange aroma
(Chapter 3). The intense sweeteners aspartame and Na-cyclamate both differ from sucrose on
the attributes chemical and aftertaste (Chapters 3 and 4). In the ternary sucrose/aspartame/Na-
cyclamate mixture, the relative sweetness contribution of Na-cyclamate to this mixture
determines the flavour profile to the largest extent (Chapter 5).
The graphs of the mean scores for each attribute, over the different mixtures of sweeteners
and for different concentrations of orange aroma, demonstrate whether interactions with the
orange aroma are present. Possible interactions with orange aroma would cause these mean
scores to either diverge or converge upon changes in the composition of the sweetener
mixture. The contribution of orange aroma to the mean scores of the attributes is similar for
the sucrose/maltitol and the sucrose/aspartame mixtures (Chapter 3). For these sweeteners the
difference in taste between the sweetener/aroma solutions is due to the sweeteners themselves
and not to a possible interaction with aroma compounds. For the binary sucrose/Na-
cyclamate mixture and the ternary sucrose/aspartame/Na-cyclamate mixture the added orange
127
Chapter 8
aroma levels out taste differences observed between the sweetener solutions without orange
aroma (Chapters 4 and 5).
For all solutions, the addition of orange aroma provides a more distinct flavour profile. In
general the addition of orange aroma increases the mean scores for the attributes orange,
sour, chemical, fruity and aftertaste. Chastrette et al. (1998) compared the models of Fechner,
Stevens, Beidler and Hill for their prediction of the human olfactory stimulus-response
function. These authors concluded that the model of Hill fitted the experimental data for 20
odorous compounds as well as, or better than, the other models. According to the latter
model, a twofold increase of the original concentration of orange aroma increased the mean
scores of the attributes involved only slightly, as we observed in Chapters 3-5.
8.4 Instrumental analysis of the flavour release
The presence or absence of interactive effects between sweeteners and an orange aroma has
also been studied by an instrumental analysis of the flavour release. Volatile compounds were
isolated by a purge and trap method at mouth conditions (volume, temperature, artificial
saliva) and then quantified and identified by gas chromatography combined with different
detection methods. A comparison of a sucrose and a Na-cyclamate solution at 10% SEV
reveals significant differences in the release of some volatile compounds from the solution
(Chapter 6). However, sensory analysis of these solutions (Chapter 5) shows that the scores
for the different attributes remain constant when comparing the sweeteners in the presence of
an orange aroma. Differences observed in the instrumental analysis are not perceived by the
panellists. To be able to fully understand possible effects of adding sweeteners to the orange
aroma solution, the concentrations of the sweeteners were enhanced. At high sucrose
concentrations (60 w/v%) the release of the volatile compounds with short retention times in
the GC/FID analysis increased and the release of the volatile compounds with large retention
times in the GC/FID analysis decreased. The hydration of the sucrose molecules in the
solution diminishes the availability of free water for the rather polar volatile compounds,
therefore increasing their concentration/release. The addition of sucrose to the solutions
changes the solvent character of these solutions, thus changing the release of the more apolar
volatile compounds. At higher Na-cyclamate concentrations (2.658 w/v%) the release of
volatile compounds from the orange aroma solutions does not significantly change (Chapter
128
General discussion
6). Apparently, at this Na-cyclamate concentration no physical and/or chemical interactions
with the volatile compounds of the orange aroma occur. However, in the sensory analysis
(Chapter 5) a levelling effect of the orange aroma has been observed.
The release of volatile compounds from aqueous solutions containing increasing sucrose
concentrations was modelled to improve the understanding of the system worked with. The
mass transfer coefficient as well as the gas/solution partition coefficient are the main
parameters influencing the release. The viscosities of the different sucrose solutions were
estimated and their influence on the mass transfer coefficients was determined. By measuring
the gas/solution partition coefficients for five volatile compounds, the model provides an
acceptable fit to the experimental flavour release data. The model description reveals that at
low sucrose concentrations primarily the partition coefficient determines the release of the
volatile compounds, whereas at higher sucrose concentrations the interfacial mass transfer
coefficient is more important (Chapter 7).
8.5 Concluding remarks
The studies presented in the thesis on Psychophysical evaluation of interactive effects
between sweeteners and aroma compounds, show that
• sensory perceived equisweetness is an evident condition for understanding sweetness-
flavour interactions
• composition of equisweet mixtures of synergistic sweeteners can only be obtained by
determining the partial SEVs and not from the psychophysical concentration-response
relationships
• the synergy observed in sweet taste perception of ternary mixtures is a combination of the
synergies observed in the composing binary mixtures of sweeteners
• taste differences among sweeteners cause flavour differences found among the various
sweetener/aroma solutions
• modelling of the flavour release emphasises the role of partition and mass transfer
coefficients in the release.
Substitution of sucrose by intense sweeteners at a sweetness level commonly present in soft
drinks (i.e. 10% SEV), will cause differences in the release of volatile compounds, which are
129
Chapter 8
probably not noticeable by panellists/consumers. Flavour differences observed among the
sweeteners and aroma combinations studied in this thesis can probably be ascribed to
differences in taste among the sweeteners. However, aromas containing flavour compounds
in micro emulsions, such as oil based aromas, could give quite different results. Sensory
analysis revealed a levelling effect of the orange aroma. Possibly this can be ascribed to
perceptual interaction, the specific mechanism of this is currently being unknown; it is
extremely unlikely that taste-odour interactions occur at the receptor level.
8.6 References
Baldwin, R.E.; Korschgen, B.M. Intensification of fruit-flavors by aspartame. J. Food Sci. 1979, 44,
938-939.
Bonnans, S.; Noble, A.C. Effect of sweetener type and of sweetener and acid levels on temporal
perception of sweetness, sourness and fruitiness. Chem. Senses 1993,18, 273-283.
Chastrette, M.; Thomas-Danguin, T.; Rallet, E. Modelling the human olfactory stimulus-response
function. Chem. Senses 1998, 23, 181-196.
Frank, R.A.; Wessel, N.; Shaffer, G. The enhancement of sweetness by strawberry odor is instruction-
dependent. Chem. Senses 1990, 75, 576-577.
Frank, R.A.; Van der Klaauw, N.J.; Schifferstein, H.N.J. Both perceptual and conceptual factors
influence taste-odor and taste-taste interactions. Percept. Psychophys. 1993, 54, 343-353.
Gregson, R.A.M.; McCowen, P.J. The relative perception of weak sucrose-citric acid mixtures. J.
Food Sci. 1963,25,371-378.
Matysiak, N.L.; Noble, A.C. Comparison of temporal perception of fruitiness in model systems,
sweetened with aspartame, an aspartame + acesulfame K blend, or sucrose. J. Food Sci. 1991, 56,
823-826.
Moskowitz, H.R.; Wolfe, K.; Beck, C. Sweetness and acceptance optimization in cola flavored
beverages using combinations of sweeteners - a psychophysical approach. J. Food Qual. 1978, 2,
17-26.
Noble, A.C. Taste-aroma interactions. Trends in Food Sci. & Technol. 1996, 7, 439-443.
Pangborn, R.M. Taste interrelationships. Food Res. 1960, 25, 245-256.
Pangborn, R.M.; Chrisp, R.B. Taste interrelationships. VI. Sucrose, sodium chloride, and citric acid in
canned tomato juice. J. Food Sci. 1964, 29, 490-498.
Pangborn, R.M.; Trabue, I.M. Taste interrelationships. V. Sucrose, sodium chloride, and citric acid in
lima bean puree. J. Food Sci. 1964, 29, 233-240.
Van der Klaauw, N.J. Judging the Intensity of Complex Stimuli: an Instruction-dependent Model for
Judgments of Chemosensory Attributes; Dissertation, University of Cincinnati: OH, USA, 1989.
130

Summary
131

Summary
Sucrose can be substituted by intense sweeteners to lower its content in soft drinks, however,
their flavour often changes. The aim of the research described in this thesis is to elucidate
whether these changes are due to the properties of the intense sweeteners themselves and/or
to interactive effects between sweeteners and aroma compounds. The effect of mixtures of
sweeteners and the presence or absence of interactive effects have been studied with the help
of sensory and instrumental analysis. The results of the sensory analysis reveal the ability of
panelists to perceive differences in the flavour profiles of several stimuli. The results of the
instrumental analysis clarify whether the presence of (intense) sweeteners influences the
release of volatile compounds from a solution. Mathematical modelling of this release
revealed the parameters influencing the release of volatiles.
In Chapter 1 the outline of the thesis and aspects relevant to the thesis are presented. A
general introduction to flavour stimuli and psychophysical models for mixtures of sweeteners
is given. Furthermore three levels of sweetness flavour interactions are discussed:
physicochemical, receptor and perceptual interactions. Finally techniques to study molecular
interaction are briefly presented.
Chapter 2 deals with two preliminary studies on commercial products. In a study on
sensory preferences the panelists did not significantly prefer regular orange soft drinks
(sweetened with sucrose) over their light equivalents (sweetened with intense sweeteners).
For cola soft drinks, on the contrary, the regular soft drink was significantly preferred over
the light version. In a sensory study (quantitative descriptive analysis, QDA) the
concentrations of intense sweeteners in a light blackcurrant soft drink were changed, which
affected the flavour profile of this drink. It was concluded from these studies that the
presence of intense sweeteners in a light soft drink influences the preferences for and the
flavour profiles of these drinks to various extents, depending on the flavour and sweeteners
present.
In Chapter 3 Beidler's mixture equation was used to compose equisweet mixtures of
sucrose and maltitol as well as equisweet mixtures of sucrose and aspartame at 10% Sucrose
Equivalent Value (SEV). QDA of different solutions containing combinations of these
sweeteners and a water soluble orange aroma revealed that the mean scores for the attribute
sweet remained constant for each solution. The flavour profiles of sucrose and maltitol did
not significantly differ at a constant concentration of orange aroma. Flavour profiles of
solutions with increasing aspartame concentrations (at constant aroma levels) showed
132

Summary
significantly higher scores for the attributes sour, chemical and aftertaste. Addition of orange
aroma provided the different solutions with a more distinct flavour. Requested comments on
the attribute aftertaste showed similar expressions for the different solutions. The aftertaste of
solutions containing relatively more aspartame was mainly described as sweet and chemical.
Chapter 4 deals with mixtures of sucrose and Na-cyclamate in the presence of orange
aroma. Equisweet mixtures at 10% SEV were composed, which accounted for the observed
synergistic effects between sucrose and Na-cyclamate. Sensory analysis (QDA) revealed that
the flavour profiles of a sucrose solution and a Na-cyclamate solution, both in the absence of
orange aroma, significantly differed for the attributes chemical and aftertaste. Addition of
orange aroma provided the solutions with a more distinct flavour and levelled out differences
observed between sucrose and Na-cyclamate solutions. Comments on the attribute aftertaste
showed that the aftertaste of solutions containing mainly Na-cyclamate was characterized as
bitter.
In Chapter 5 the results of Chapters 3 and 4 are used in the study of the ternary
sucrose/aspartame/Na-cyclamate mixtures in the presence of an orange aroma. Equisweet
mixtures were composed, which account for the observed synergistic effects between the
sweeteners. The sweetness contributions of sucrose and Na-cyclamate were fixed on
forehand according to their synergy and the matching concentration of aspartame was
determined. The composition of the equisweet ternary mixtures was described in a regression
equation. The binary mixtures of aspartame and Na-cyclamate exhibited more synergy than
the mixtures of sucrose and Na-cyclamate. Sucrose and aspartame were exchangeable in the
sense that the synergy observed for the ternary mixture was a linear combination of the
synergy of the binary mixtures. The flavour profiles of combinations of the mixtures and an
orange aroma were obtained with the help of QDA. In the ternary mixtures Na-cyclamate
contributed mostly to their flavour profiles, i.e. they were described as being more chemical,
bitter and musty and having more aftertaste. Comments on the attribute aftertaste revealed the
descriptions bitter and chemical.
Instrumental analysis, as described in Chapter 6, was used to evaluate possible interactive
effects between sucrose/Na-cyclamate mixtures and orange aroma compounds. The release of
volatile compounds from the solutions containing equisweet mixtures of these sweeteners
(Chapter 4) and a water soluble orange aroma was studied. The volatile compounds were
quantified and identified by gas chromatography combined with flame ionisation detection
133
Summary
(GC/FID) and mass spectrometry. The presence of sucrose significantly changed the release
of 15 selected volatile compounds compared to the aqueous control. Increasing sucrose
concentrations in the solutions (0-60 w/v%) caused an increased release of the volatile
compounds with short GC/FID retention times and a decreased release of the compounds
with longer retention times. Increasing Na-cyclamate concentrations (0-2.658 w/v%) did not
change the release of volatile compounds.
In Chapter 7 the flavour release from aqueous solutions containing sucrose was described
in a mathematical model. Parameters involved in the isolation by a purge and trap method at
mouth conditions (volume, temperature, artificial saliva) were used in the model description
of the flavour release. The viscosities and the gas/solution partition coefficients determined
for the volatile compounds were included in the model, which provided an acceptable fit to
the experimental data obtained with the instrumental analysis in Chapter 6. The model
description revealed that at low sucrose concentrations primarily the partition coefficient
controls the flavor release, whereas at higher sucrose concentrations the mass transfer
coefficient has more influence.
In Chapter 8 the main results of this thesis are discussed. It can be concluded that
substitution of sucrose by intense sweeteners at a sweetness level commonly present in soft
drinks (i.e. 10% SEV), will influence the flavour release by changes in the partition or mass
transfer coefficients. However, these changes in the release of volatile compounds at the 10%
SEV level are probably not noticeable by panelists/consumers. Flavour differences observed
among the sweeteners and aroma combinations studied in this thesis can probably be ascribed
to differences in flavour among the sweeteners. Sensory analysis revealed a levelling effect
of the orange aroma (Chapters 4 and 5). Possibly, this can be ascribed to perceptual
interaction, of which the specific mechanism is currently being unknown.
134
Samenvatting
135

Samenvatting
Sucrose ofwel suiker kan in frisdranken vervangen worden door intensieve zoetstoffen om
zijn aandeel te verlagen. Echter, ten gevolge van deze vervanging verandert het aroma van
een frisdrank. Het doel van het onderzoek, dat beschreven is in dit proefschrift, is het
beantwoorden van de vraag of de veranderingen in de kwaliteit van de zoete smaak toe te
schrijven zijn aan de eigenschappen van de intensieve zoetstoffen zelf en/of aan interactieve
effecten tussen deze zoetstoffen en aromacomponenten. Daarnaast is het effect van mengsels
van zoetstoffen bestudeerd. De aan- of afwezigheid van interactieve effecten is bestudeerd
met behulp van sensorische en instrumentele analyse. De resultaten van de sensorische
analyse laten zien of panelleden in staat zijn om verschillen waar te nemen tussen de
aromaprofielen van verscheidene combinaties van zoetstoffen. De resultaten van de
instrumentele analyse maken duidelijk of de aanwezigheid van (intensieve) zoetstoffen
invloed heeft op het vrijkomen van vluchtige verbindingen uit een oplossing. Dit vrijkomen
van vluchtige verbindingen wordt in een model beschreven om te zien welke parameters het
vrijkomen bei'nvloeden.
In Hoofdstuk 1 worden de opbouw van het proefschrift en het doel van het onderzoek
gepresenteerd. Er wordt een algemene inleiding gegeven over geur- en smaakwaarneming en
psychofysische modellen voor mengsels van zoetstoffen. Bovendien worden drie niveau's
van zoetstof-aroma interacties behandeld: fysisch-chemische, receptor en perceptuele
interacties. Tenslotte worden technieken ter bestudering van moleculaire interacties in het
kort besproken.
Hoofdstuk 2 betreft twee inleidende sensorische onderzoeken met commerciele produkten.
In een preferentie onderzoek bleken de panelleden geen significante voorkeur te hebben voor
gewone frisdranken (gezoet met sucrose) ten opzichte van hun 'light' equivalenten (gezoet
met intensieve zoetstoffen). Voor cola frisdranken daarentegen, werd de gewone frisdrank
significant geprefereerd ten opzichte van de 'light' versie. In een profiel onderzoek werden
de concentraties van de intensieve zoetstoffen in een 'light' cassis frisdrank verandert,
hetgeen het aromaprofiel van deze drank bei'nvloedde. Er werd geconcludeerd dat de
aanwezigheid van intensieve zoetstoffen in een 'light' frisdrank de preferenties en ook het
aromaprofiel van deze frisdranken in verschillende mate be'invloedt. Dit is afhankelijk van
het aanwezige aroma en de aanwezige zoetstoffen.
In Hoofdstuk 3 is Beidler's mengvergelijking gebruikt voor het samenstellen van
mengsels van sucrose en maltitol, evenals van sucrose en aspartaam, met een zoetheid gelijk
136
Samenvatting
aan die van een 10 w/V% sucrose oplossing (10% SEV). Kwantitatieve beschrijvende
sensorische analyse (QDA) van verschillende oplossingen van combinaties van deze
zoetstoffen en een water oplosbaar sinaasappelaroma liet zien dat de gemiddelde scores voor
het attribuut zoet gelijk bleven voor elke oplossing. De aromaprofielen van sucrose en
maltitol verschilden niet significant van elkaar bij gelijke concentraties van het
sinaasappelaroma. De aromaprofielen van oplossingen met toenemende concentraties
aspartaam (maar gelijke concentraties sinaasappelaroma) lieten significant hogere scores zien
voor de attributen zuur, chemisch en nasmaak. Een toevoeging van sinaasappelaroma gaf de
verschillende oplossingen een meer uitgesproken aromaprofiel. Nadere omschrijvingen van
het attribuut nasmaak waren gelijk voor de verschillende oplossingen. De nasmaak van de
oplossingen, die relatief meer aspartaam bevatten, werd voornamelijk beschreven als zoet en
chemisch.
Hoofdstuk 4 behandelt mengsels van sucrose en Na-cyclamaat in de aanwezigheid van
sinaasappelaroma. Mengsels met een gelijke zoetheid van 10% SEV werden samengesteld,
waarbij rekening gehouden werd met de waargenomen synergistische effecten tussen sucrose
en Na-cyclamaat. Sensorische analyse (QDA) liet zien dat de aromaprofielen van een sucrose
oplossing en een Na-cyclamaat oplossing, beide in afwezigheid van sinaasappelaroma,
significant van elkaar verschilden voor de attributen chemisch en nasmaak. De toevoeging
van sinaasappelaroma gaf de oplossingen een meer uitgesproken aromaprofiel en nivelleerde
de waargenomen verschillen tussen sucrose en Na-cyclamaat oplossingen. Nadere
omschrijvingen van het attribuut nasmaak toonden aan dat de nasmaak van oplossingen met
relatief meer Na-cyclamaat voornamelijk bitter was.
In Hoofdstuk 5 werden de resultaten van de Hoofdstukken 3 en 4 gebruikt in het
onderzoek van het tertiaire sucrose/aspartaam/Na-cyclamaat mengsel in de aanwezigheid van
sinaasappelaroma. Mengsels met een gelijke zoetheid van 10% SEV werden samengesteld,
waarbij rekening gehouden werd met de waargenomen synergistische effecten tussen de
zoetstoffen. De zoetheidsbijdrages van sucrose en Na-cyclamaat werden vantevoren
vastgelegd volgens hun synergie, en daarna is de aanvullende aspartaam concentratie
bepaald. De samenstelling van de tertiaire mengsels met gelijke zoetheid (10% SEV) is
beschreven in een regressievergelijking. De mengsels van aspartaam en Na-cyclamaat
vertoonden meer synergie dan de mengsels van sucrose en Na-cyclamaat. Sucrose en
aspartaam waren uitwisselbaar, in zoverre dat de waargenomen synergie in de tertiaire
137

Samenvatting
mengsels een lineaire combinatie was van de synergie in de binaire mengsels. De
aromaprofielen van combinaties van deze mengsels en een sinaasappelaroma werden
verkregen met behulp van QDA. Het aandeel van Na-cyclamaat in de tertiaire mengsels
bepaalde in grote mate het aromaprofiel van deze mengsels, die hoger scoorden op de
attributen chemisch, bitter, muf en nasmaak. Verdere omschrijvingen van deze nasmaak
waren weer bitter en chemisch.
De instrumentele analyse, die in Hoofdstuk 6 beschreven wordt, is gebruikt om mogelijke
interactieve effecten tussen sucrose/Na-cyclamaat mengsels en componenten van
sinaasappelaroma te bestuderen. Het vrijkomen van vluchtige verbindingen uit de even zoete
waterige mengsels van deze zoetstoffen (Hoofdstuk 4) en een water oplosbaar
sinaasappelaroma is bestudeerd. De vluchtige verbindingen werden gekwantificeerd en
geidentificeerd met behulp van gas chromatografie gecombineerd met vlamionisatie detectie
(GC/FID) en massaspectrometrie. Het vrijkomen van 15 geselecteerde vluchtige
verbindingen uit een sucrose oplossing met sinaasappelaroma veranderde significant ten
opzichte van de standaard (water + sinaasappelaroma). Hoge sucrose concentraties in de
oplossingen (60 w/V%) veroorzaakten een toename in het vrijkomen van de vluchtige
verbindingen met korte GC/FID retentietijden en een afhame in het vrijkomen van de
verbindingen met langere retentietijden. Hoge Na-cyclamaat concentraties (2.658 w/V%)
veranderden het vrijkomen van vluchtige verbindingen niet.
In Hoofdstuk 7 werd het vrijkomen van vluchtige verbindingen uit sucrose oplossingen
beschreven in een model. De parameters, die van belang zijn voor de isolatie onder
mondomstandigheden (volume, temperatuur, kunstspeeksel), werden gebruikt in een
modelbeschrijving voor het vrijkomen van vluchtige verbindingen. Met viscositeiten en
gas/oplossing verdelingscoefficienten voor de bestudeerde vluchtige verbindingen, gaf het
model een goede benadering van de experimentele data van de instrumentele analyse in
Hoofdstuk 6. De modelbeschrijving maakte duidelijk dat het vrijkomen van vluchtige
verbindingen bij lagere sucrose concentraties voornamelijk bepaald wordt door de
verdelingscoefficient, terwijl de massatransport coefficient meer invloed heeft bij hogere
sucrose concentraties.
In Hoofdstuk 8 worden de belangrijkste resultaten van dit proefschrift besproken. Er kan
geconcludeerd worden dat bij het vervangen van sucrose door intensieve zoetstoffen, op een
zoetheidsniveau zoals dat gebruikelijk is voor frisdranken (10% SEV), het vrijkomen van
138

Samenvatting
vluchtige verbindingen bei'nvloed wordt door veranderingen in de verdelingscoefficient of de
massatransport coefficient. Echter, deze veranderingen in het vrijkomen van vluchtige
verbindingen op het 10% SEV niveau zijn niet zo zeer waarneembaar voor
panelleden/consumenten. Verschillen in smaak, die waargenomen worden in de bestudeerde
combinaties van zoetstoffen en aroma, kunnen waarschijnlijk geheel worden toegeschreven
aan verschillen in de smaak van de zoetstoffen. De sensorische analyse liet een nivellerend
effect van het sinaasappelaroma zien (Hoofdstukken 4 en 5). Waarschijnlijk kan dit
toegeschreven worden aan een perceptuele interactie, waarvan het specifieke mechanisme
(nog) onbekend is.
139

Dankwoord
JA, we zijn er: het meest gelezen deel van het proefschrift vrees ik. Oh help, nu moet ik
echt mijn best doen. Alhoewel, zo moeilijk is het niet! Fons Voragen, een fijnere promoter
kan ik me niet indenken. Ik vond de tussentijdse evaluaties altijd erg plezierig, bedankt!
Jacques Roozen, hartstikke bedankt voor je begeleiding de afgelopen jaren. Ik vind het toch
echt ongelovelijk hoe je elke keer weer, in de zoveelste versie van een schrijfsel precies de
zwakke punten weet aan te stippen! Ook je enorme kennis van de levensmiddelenchemische
processen heeft ons door vele discussies heen geleid. Ik wil Cees de Graaf graag bedanken
voor zijn rol als mede-begeleider.
Dan absoluut: Aagje Legger. Je bent echt mijn grote steun en toeverlaat geweest de afgelopen
jaren, op alle fronten. Onwijs bedankt voor dat alles. En natuurlijk gaan we door met
overheerlijke uit-etentjes, met of zonder sigaret, wat jij (moet je toch effe plagen)! Harold
Bult, je hebt de laatste labjaren tot een waar chaotisch feest gemaakt, thanks a million. Je zal
de kraak- en knispergeluiden van koekjesverpakkingen nu toch echt helemaal in je eentje
moeten gaan produceren; die koekjes dan weer op eten deed je toch al bijna geheel alleen.
Ik heb het bepaald niet slecht getroffen met mijn studenten! Mijn eerste studente, Desiree
Bakker, wil ik graag bedanken voor haar enorme inzet tot verder onderzoekswerk. Elodie
Orambot, je te remercie beaucoup pour tes efforts de mettre Panalyse instrumentele sur pied
et pour ta personnalite enormement agreable. Tu as degage la route pour Peter Navarro y
Koren, die ondanks zijn persoonlijke omstandigheden een prachtig stukje onderzoekswerk
afleverde, dat zelfs beloond werd door en meepubliceren en de NVVL-prijs. Te gek!
Finalement je voudrais remercier Denis Verset qui a livre une piece de travail de benedictin
en mesurant quelques coefficients de partage.
Een van de motivaties om aan dit AlO-schap te beginnen was het internationale karakter van
deze functie. En internationaal is mijn deelname aan het EG-project geworden! Engeland
(4x), Zwitserland (2x), Frankrijk, Italie (straks) en zelfs Amerika heb ik op mijn lijstje
kunnen zetten. I would like to thank Marcus Harrison for his help of all sorts during my stay
in Norwich. I envy your ease of tackling mathematical problems! Nicole ter Maten, toffe
meid, ontzettend bedankt voor je creatieve hulp bij het ontwerpen van de omslag en
natuurlijk voor die overheerlijke babbels. Jan Cozijnsen, bedankt voor je gezelligheid, je
141

Dankwoord
vaderlijke gevoelens (nee, ik ben niet alleen door dat bos gefietst) en je gaschromatografische
hulp. En sorry dat ik je spoetnik niet heb gebruikt. Ik wil uiteraard mijn panelleden, zeker die
van het eerste uur, van harte bedanken voor al hun inzet, en ook voor hun interesse in het
onderzoek. Dini Wesselkamp van de spoelkeuken, bedankt! We klagen gewoon niet over die
ontelbare potjes die ik telkens weer bij je afleverde, en het is fantastisch dat die standaard de
volgende ochtend weer helemaal schoon voor me klaarstonden!
Aan het eind van mijn promotieonderzoek weet ik weer helemaal waarom ik voor de sectie
Levensmiddelenchemie koos: collega's bedankt voor de leuke tijd! Familie en vrienden die
soms urenlang gezeur van mij moesten doorstaan en dat flink de kop in wisten te drukken
door een enorme portie gezelligheid: hartstikke bedankt!
Lieve Rene, vond je ze niet h6erlijk, die avonden en weekenden Biotechnion?! 'k Ben blij dat
we nog jaaaaaren andere vormen van gezelligheid tegemoet gaan, nie-waar? In ieder geval
vind ik het onbeschrijflijk dat jij er zo voor me bent; ongeloveloos bedankt!
Lieve mama, als er iemand is die er altijd en eeuwig voor me is, dan ben jij dat wel. Het valt
gewoon niet uit te leggen hoeveel dat voor mij betekent. Ik kan je wel vertellen dat ik
ontzettend trots op je ben en dat ik me gewoon verheug op al die jaren die nog komen gaan.
142
Curriculum Vitae
Denise Francisca Nahon werd op 30 januari 1971 geboren te Rijswijk Z.H. Halverwege haar
lagere school tijd verruilde zij de 'meesters' van het Westen voor de 'meneren' in het Zuiden
des lands, en daarom volgde zij haar VWO-opleiding aan het Mgr. Frencken College te
Oosterhout N.B. Na het behalen van het diploma in 1989 begon zij met de studie
Levensmiddelentechnologie aan de Landbouwuniversiteit Wageningen (LU). Binnen deze
studie deed zij een afstudeervak Wiskundige Statistiek bij Coberco Arnhem, een afstudeervak
Levensmiddelenchemie bij de betreffende leerstoelgroep van de LU en een stage bij
ENSBANA in Dijon, Frankrijk. Op 30 januari 1995 studeerde Denise af, en drie dagen later
begon zij als Assistent In Opleiding bij de leerstoelgroep Levensmiddelenchemie van het
Departement Levensmiddelentechnologie en Voedingswetenschappen aan de LU. In het
kader van dit promotieonderzoek heeft zij een door het COST action 96 program
gefinancierde wetenschappelijke stage uitgevoerd bij het Institute of Food Research te
Norwich, Engeland. Het in januari 1999 afgeronde promotieonderzoek staat beschreven in dit
proefschrift.
143

List of publications
Nahon, D.F., Harrison, M. and Roozen, J.P. (1999) Modelling flavor release from aqueous sucrose solutions, using mass transfer and partition coefficients. J. Agric. Food Chem., submitted.
Nahon, D.F., Roozen, J.P. and De Graaf, C. (1999) Sensory evaluation of ternary mixtures of sodium cyclamate, aspartame, sucrose and an orange aroma. Chem. Senses, submitted.
Nahon, D.F., Roozen, J.P. and Harrison, M. (1999) Modelling flavour release from aqueous solutions containing sucrose and ethyl acetate. In Proceedings of the COST 96 meeting at the Eidgenossische Technische Hochschule Zurich, Switzerland, 14-16 May 1998, in press.
Nahon, D.F., Navarro y Koren, P.A., Roozen, J.P. and Posthumus, M.A. (1998) Flavor release from mixtures of sodium cyclamate, sucrose, and an orange aroma. J. Agric. Food Chem., 46, 4963-4968.
Nahon, D.F., Roozen, J.P. and De Graaf, C. (1998) Sensory evaluation of mixtures of sodium cyclamate, sucrose, and an orange aroma. J. Agric. Food Chem., 46, 3426-3430.
Nahon, D.F., Roozen, J.P. and De Graaf, C. (1998) Sensory evaluation of mixtures of maltitol or aspartame, sucrose and an orange aroma. Chem. Senses, 23, 59-66.
Nahon, D.F., Orambot, E. and Roozen, J.P. (1997) Modelling of orange flavour release from a soft drink matrix. In Proceedings of the COST 96 meeting at Instituto Agroquimica y Tecnologia de Alimentos Valencia, Spain, 14-16 November 1996, ed. J. Bakker. Office for Official Publications of the European Commities: Luxembourg, pp. 55-56.
Nahon, D.F., Roozen, J.P. and De Graaf, C. (1996) Sweetness flavour interactions in soft drinks. Food Chem., 56, 283-289.
Nahon, D.F. (1996) De geur- en smaakwaarneming. In Vademecum voor de Voeding, afl. 5, Kluwer Editorial: Diegem, Belgie.
Van Ruth, S.M., Roozen, J.P., Nahon, D.F., Cozijnsen, J.L. and Posthumus, M.A. (1996) Flavour release from rehydrated French beans (Phaseolus vulgaris) influenced by composition and volume of artificial saliva. Z. Lebensm.-Unters. Forsch., 203,1-6.
145