Homegarden commercialization - WUR eDepot
19
Vol.:(0123456789) 1 3 Sustainability Science https://doi.org/10.1007/s11625-020-00788-9 ORIGINAL ARTICLE Homegarden commercialization: extent, household characteristics, and effect on food security and food sovereignty in Rural Indonesia Oekan S. Abdoellah 1,3,5 · Mindi Schneider 2 · Luthfan Meilana Nugraha 3 · Yusep Suparman 6 · Cisma Tami Voletta 3 · Susanti Withaningsih 3,4,5 · Parikesit 3,4,5 · Amanda Heptiyanggit 3 · Lukmanul Hakim 3 Received: 11 November 2018 / Accepted: 10 February 2020 © The Author(s) 2020 Abstract Homegardens have long been recognized for contributing to household food security, nutritional status, and ecological sus- tainability in especially poor, rural areas in low-income countries. However, as markets and policies drive the commercializa- tion of food and farming systems, and of rural livelihoods in general, it becomes increasingly difficult for small-holder farmers to maintain homegarden plots. Rather than autonomous spaces to grow food for self-consumption, farmers are transforming the land around their dwellings into an income-generating space by planting commercial crops for sale in urban and process- ing markets. The objective of this study was to examine homegarden commercialization in the Upper Citarum Watershed of West Java, Indonesia, and its effects on food security and food sovereignty. We employed a mixed-method approach to survey 81 village households involved in agricultural production. For quantitative analysis, we calculated a “homegarden commercialization index,” and developed indicator frameworks to examine relationships between commercialization, house- hold food security, and food-related decision-making. Accompanied by insights from qualitative interviews, our results show that homegardens are highly commercialized, which contributes to the spread of monocultural production in the region. We argue that homegardens should be included and supported in food, agricultural, health, environmental, and rural develop- ment policy, in Indonesia and generally. Keywords Homegardens · Agricultural commercialization · Food security · Food sovereignty · Indonesia Introduction Around the world and for millennia, small-scale farmers have used plots of land around or near their dwellings to produce vegetables, fruits, herbs, and small livestock for household consumption (Soemarwoto and Christanty 1985). Research demonstrates the importance of these small plots— referred to as homegardens—for small-holder food security and livelihoods (e.g., Kumar and Nair 2004; Rooduijn et al. 2017). Homegardens can provide a stable source of fresh and nutritious food, especially for farm households that produce mostly for the market, and that experience income stress or Handled by Osamu Saito, Institute for Global Environmental Strategies, Japan. * Mindi Schneider [email protected] 1 Department of Anthropology, Faculty of Social and Political Sciences, Universitas Padjadjaran, Jalan Raya Bandung-Sumedang KM. 21 Jatinangor-Sumedang 45363, Bandung, West Java, Indonesia 2 Sociology of Development and Change, Wageningen University, 3041, Leeuwenborch, Hollandseweg 1, 6707KN Wageningen, The Netherlands 3 Graduate Studies on Environmental Sciences, Universitas Padjadjaran, JalanSekeloa Selatan1, Bandung 40132, West Java, Indonesia 4 Department of Biology, Faculty of Mathematic and Natural Sciences, Universitas Padjadjaran, Jalan Raya Bandung Sumedang KM. 21 Jatinangor-Sumedang 45363, Bandung, West Java, Indonesia 5 Center for Environment and Sustainability Science, Universitas Padjadjaran, Jalan Sekeloa Selatan 1, Bandung 40132, West Java, Indonesia 6 Department of Statistics, Faculty of Mathematics and Natural Science, Universitas Padjadjaran, Jalan Raya Bandung Sumedang KM. 21 Jatinangor-Sumedang 45363, Bandung, West Java, Indonesia
-
Upload
khangminh22 -
Category
Documents
-
view
0 -
download
0
Transcript of Homegarden commercialization - WUR eDepot

Vol.:(0123456789)1 3
Sustainability Science https://doi.org/10.1007/s11625-020-00788-9
ORIGINAL ARTICLE
Homegarden commercialization: extent, household characteristics, and effect on food security and food sovereignty in Rural Indonesia
Oekan S. Abdoellah1,3,5 · Mindi Schneider2 · Luthfan Meilana Nugraha3 · Yusep Suparman6 · Cisma Tami Voletta3 · Susanti Withaningsih3,4,5 · Parikesit3,4,5 · Amanda Heptiyanggit3 · Lukmanul Hakim3
Received: 11 November 2018 / Accepted: 10 February 2020 © The Author(s) 2020
AbstractHomegardens have long been recognized for contributing to household food security, nutritional status, and ecological sus-tainability in especially poor, rural areas in low-income countries. However, as markets and policies drive the commercializa-tion of food and farming systems, and of rural livelihoods in general, it becomes increasingly difficult for small-holder farmers to maintain homegarden plots. Rather than autonomous spaces to grow food for self-consumption, farmers are transforming the land around their dwellings into an income-generating space by planting commercial crops for sale in urban and process-ing markets. The objective of this study was to examine homegarden commercialization in the Upper Citarum Watershed of West Java, Indonesia, and its effects on food security and food sovereignty. We employed a mixed-method approach to survey 81 village households involved in agricultural production. For quantitative analysis, we calculated a “homegarden commercialization index,” and developed indicator frameworks to examine relationships between commercialization, house-hold food security, and food-related decision-making. Accompanied by insights from qualitative interviews, our results show that homegardens are highly commercialized, which contributes to the spread of monocultural production in the region. We argue that homegardens should be included and supported in food, agricultural, health, environmental, and rural develop-ment policy, in Indonesia and generally.
Keywords Homegardens · Agricultural commercialization · Food security · Food sovereignty · Indonesia
Introduction
Around the world and for millennia, small-scale farmers have used plots of land around or near their dwellings to produce vegetables, fruits, herbs, and small livestock for
household consumption (Soemarwoto and Christanty 1985). Research demonstrates the importance of these small plots—referred to as homegardens—for small-holder food security and livelihoods (e.g., Kumar and Nair 2004; Rooduijn et al. 2017). Homegardens can provide a stable source of fresh and nutritious food, especially for farm households that produce mostly for the market, and that experience income stress or
Handled by Osamu Saito, Institute for Global Environmental Strategies, Japan.
* Mindi Schneider [email protected]
1 Department of Anthropology, Faculty of Social and Political Sciences, Universitas Padjadjaran, Jalan Raya Bandung-Sumedang KM. 21 Jatinangor-Sumedang 45363, Bandung, West Java, Indonesia
2 Sociology of Development and Change, Wageningen University, 3041, Leeuwenborch, Hollandseweg 1, 6707KN Wageningen, The Netherlands
3 Graduate Studies on Environmental Sciences, Universitas Padjadjaran, JalanSekeloa Selatan1, Bandung 40132, West Java, Indonesia
4 Department of Biology, Faculty of Mathematic and Natural Sciences, Universitas Padjadjaran, Jalan Raya Bandung Sumedang KM. 21 Jatinangor-Sumedang 45363, Bandung, West Java, Indonesia
5 Center for Environment and Sustainability Science, Universitas Padjadjaran, Jalan Sekeloa Selatan 1, Bandung 40132, West Java, Indonesia
6 Department of Statistics, Faculty of Mathematics and Natural Science, Universitas Padjadjaran, Jalan Raya Bandung Sumedang KM. 21 Jatinangor-Sumedang 45363, Bandung, West Java, Indonesia
Sustainability Science
1 3
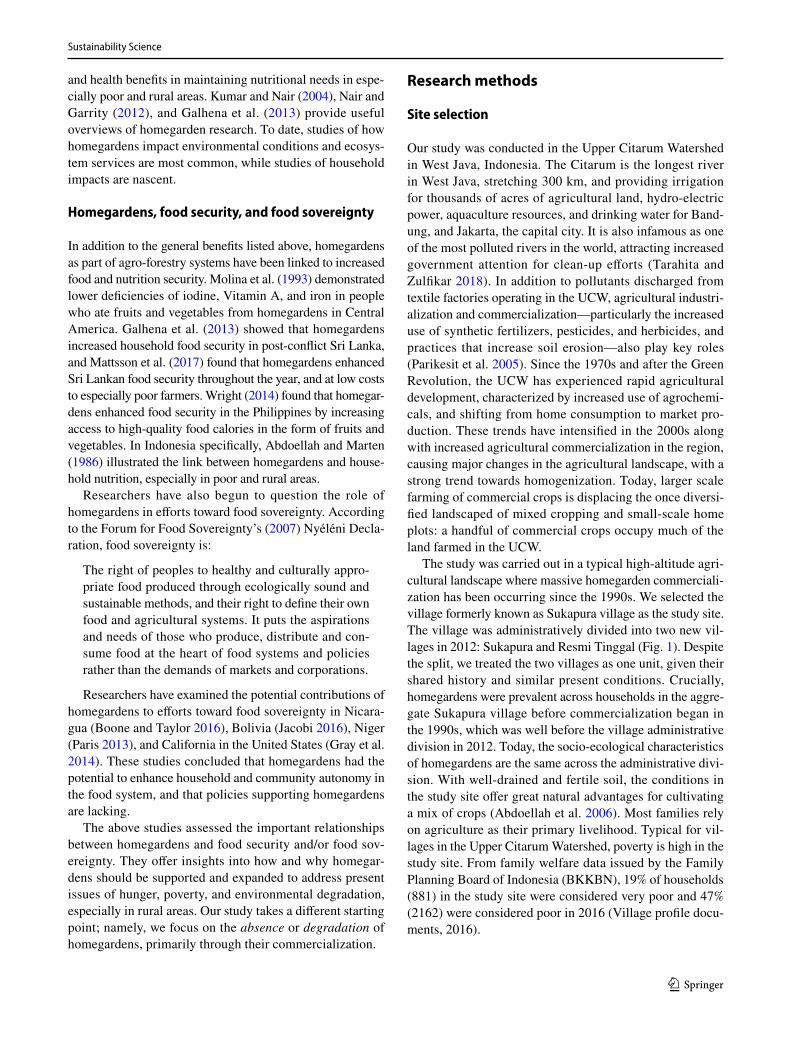
shortfalls during the growing season (Abdoellah and Marten 1986; Mohri et al. 2013; Mattsson et al. 2017; Wright 2014). In addition to contributing to household food security, homegardens also offer the potential to enhance household food sovereignty in otherwise market-integrated agrarian landscapes; even if their crop lands are subject to the chang-ing demands of food markets and government agricultural programs, households can maintain decision-making control over how and what they produce in the homegarden, and how and what they eat from it (Boone and Taylor 2016). For especially poor rural households, homegardens can serve as a buffer against food price shocks, a source of fresh food, and a space of self-determination. As such, homegardens can be important considerations and factors in Sustainable Development Goals 1 and 2 on “No Poverty” and “Zero Hunger”, respectively.
In recent decades, however, it has become increasingly difficult for small-holder households in the developing world to maintain homegardens (e.g., Abdoellah et al. 2006). Agri-culture has become increasingly commercialized and indus-trialized, and off-farm pressures have come to dominate food systems across many parts of the globe. To keep up with these developments, policies and markets encourage farm-ers to industrialize, specialize, and standardize, to engage more directly with buyer–driver commodity chains and the “supermarket revolution,” and often, to contract their pro-duction (Clapp and Fuchs 2009; Reardon et al. 2012). In this context, homegardens can be seen as a waste of otherwise income-producing space, spurring small-scale farmers to commercialize the land around their homes (e.g., Abdoe-llah et al. 2006). Beyond the general industrialization of agriculture, precise causes of these changes are not yet fully understood, nor are the long-term environmental, economic, and social impacts.
This paper examines homegarden commercialization in the Upper Citarum Watershed (UCW) in West Java, Indone-sia. Here, at the mouth of the longest river in the province, and one of the most polluted rivers in the world, small-scale farmers have been converting their homegardens to commercial and agro-chemical intensive production since the 1990s (Abdoellah et al. 2006). We conducted a mixed-method study in the UCW over a period of 10 months, ask-ing three questions: (1) To what extent have small-scale farmers commercialized their homegardens? (2) What household characteristics influence their choice to com-mercialize homegardens? and (3) What are the effects of homegarden commercialization on household food security and food sovereignty?
In the context of continuing rural poverty and growing environmental contamination in the region, understanding homegarden commercialization is an important issue for scholars, small-holder farmers, and policy makers. This is especially so given recent government calls to clean the
Citarum River (Tarahita and Zulfikar 2018), and the poten-tial contradiction between these calls, and the suite of agri-cultural policies that focus almost exclusively on increasing production using “modern” production methods including synthetic fertilizers, pesticides, and herbicides that leach into the river. Furthermore, because homegarden commercializa-tion is happening in relation to broader changes in Indone-sia’s food and farming systems—processes like commercial-ization, globalization, and industrialization, which are much more general and widespread (Nevins and Peluso 2008)—insights and methods from the study can apply to other con-texts where homegardens potentially contribute to household food security and broader sustainability, but where off-farm pressures are propelling their commercialization. Different from research that examines the benefits of homegardens for small-holder households, which we review below, our study examines the losses from not growing homegardens.
Homegardens and benefits to small‑scale farming households
Cultivating food in small plots adjacent to human settle-ments and/or households is one of the oldest and most endur-ing forms of agricultural production (Ninez 1987). Today, while there is no single definition of a homegarden, Galhena et al. (2013) synthesized the following from their extensive literature review. A homegarden can be considered:
a well-defined, multi-storied and multi-use area near the family dwelling that serves as a small-scale sup-plementary food production system maintained by the household members, and one that encompasses a diverse array of plant and animal species that mimics the natural ecosystem (2).
In the Upper Citarum Watershed, as elsewhere and espe-cially in tropical climates, homegardens operate as part of agro-forestry systems (Abdoellah and Marten 1986; Christanty et al. 1986). Here, vegetable, fruit, grain, herb, and medicinal crops are grown together with tree species. Researchers argue that in the context of deteriorating fam-ily farms, biodiversity loss, soil erosion, environmental pollution, and climate change, homegardens will play an increasingly important sustainable land-use role, now and in the future (e.g., Nair and Garrity 2012). This claim is further supported by research that shows the adaptability of homegarden systems to various land sizes and types, eleva-tions, and topographies, and kinds of crops planted (Jacobi 2016). Furthermore, scholars have shown that homegar-dens as part of agro-forestry systems can provide economic opportunities such as increased income; social functions such as preserving traditional knowledge and strengthening social capital; environmental benefits in terms of enhancing biodiversity, conserving ecosystems, and storing carbon;
Sustainability Science
1 3
and health benefits in maintaining nutritional needs in espe-cially poor and rural areas. Kumar and Nair (2004), Nair and Garrity (2012), and Galhena et al. (2013) provide useful overviews of homegarden research. To date, studies of how homegardens impact environmental conditions and ecosys-tem services are most common, while studies of household impacts are nascent.
Homegardens, food security, and food sovereignty
In addition to the general benefits listed above, homegardens as part of agro-forestry systems have been linked to increased food and nutrition security. Molina et al. (1993) demonstrated lower deficiencies of iodine, Vitamin A, and iron in people who ate fruits and vegetables from homegardens in Central America. Galhena et al. (2013) showed that homegardens increased household food security in post-conflict Sri Lanka, and Mattsson et al. (2017) found that homegardens enhanced Sri Lankan food security throughout the year, and at low costs to especially poor farmers. Wright (2014) found that homegar-dens enhanced food security in the Philippines by increasing access to high-quality food calories in the form of fruits and vegetables. In Indonesia specifically, Abdoellah and Marten (1986) illustrated the link between homegardens and house-hold nutrition, especially in poor and rural areas.
Researchers have also begun to question the role of homegardens in efforts toward food sovereignty. According to the Forum for Food Sovereignty’s (2007) Nyéléni Decla-ration, food sovereignty is:
The right of peoples to healthy and culturally appro-priate food produced through ecologically sound and sustainable methods, and their right to define their own food and agricultural systems. It puts the aspirations and needs of those who produce, distribute and con-sume food at the heart of food systems and policies rather than the demands of markets and corporations.
Researchers have examined the potential contributions of homegardens to efforts toward food sovereignty in Nicara-gua (Boone and Taylor 2016), Bolivia (Jacobi 2016), Niger (Paris 2013), and California in the United States (Gray et al. 2014). These studies concluded that homegardens had the potential to enhance household and community autonomy in the food system, and that policies supporting homegardens are lacking.
The above studies assessed the important relationships between homegardens and food security and/or food sov-ereignty. They offer insights into how and why homegar-dens should be supported and expanded to address present issues of hunger, poverty, and environmental degradation, especially in rural areas. Our study takes a different starting point; namely, we focus on the absence or degradation of homegardens, primarily through their commercialization.
Research methods
Site selection
Our study was conducted in the Upper Citarum Watershed in West Java, Indonesia. The Citarum is the longest river in West Java, stretching 300 km, and providing irrigation for thousands of acres of agricultural land, hydro-electric power, aquaculture resources, and drinking water for Band-ung, and Jakarta, the capital city. It is also infamous as one of the most polluted rivers in the world, attracting increased government attention for clean-up efforts (Tarahita and Zulfikar 2018). In addition to pollutants discharged from textile factories operating in the UCW, agricultural industri-alization and commercialization—particularly the increased use of synthetic fertilizers, pesticides, and herbicides, and practices that increase soil erosion—also play key roles (Parikesit et al. 2005). Since the 1970s and after the Green Revolution, the UCW has experienced rapid agricultural development, characterized by increased use of agrochemi-cals, and shifting from home consumption to market pro-duction. These trends have intensified in the 2000s along with increased agricultural commercialization in the region, causing major changes in the agricultural landscape, with a strong trend towards homogenization. Today, larger scale farming of commercial crops is displacing the once diversi-fied landscaped of mixed cropping and small-scale home plots: a handful of commercial crops occupy much of the land farmed in the UCW.
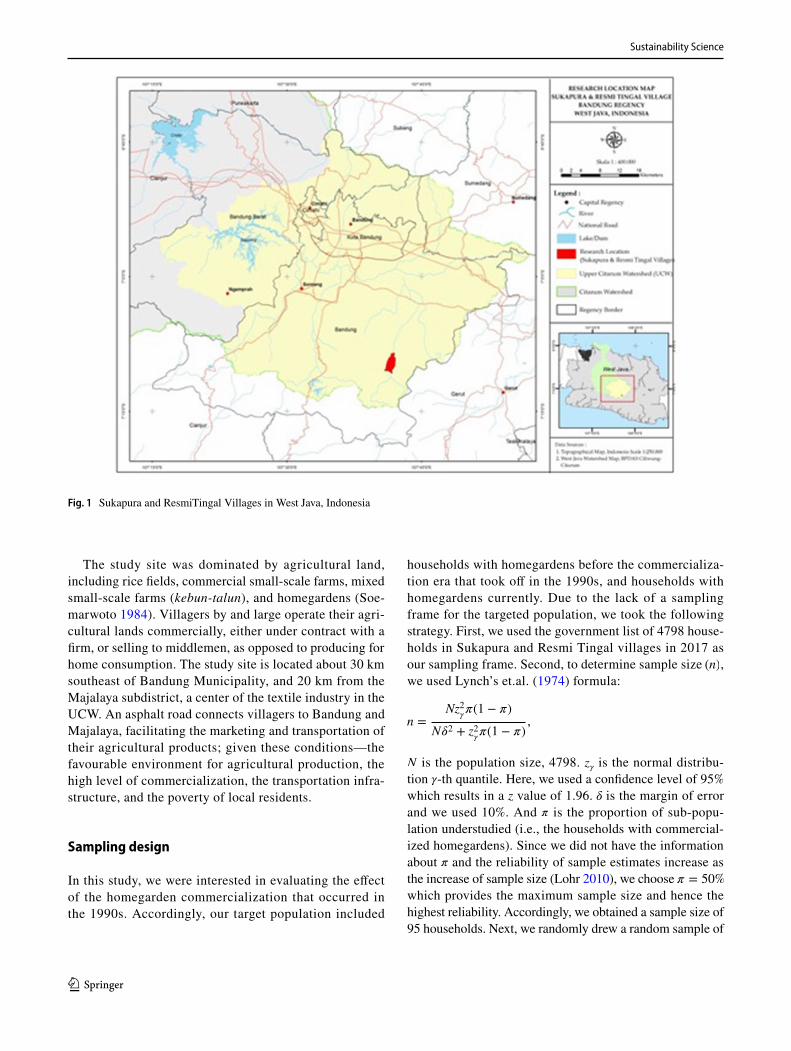
The study was carried out in a typical high-altitude agri-cultural landscape where massive homegarden commerciali-zation has been occurring since the 1990s. We selected the village formerly known as Sukapura village as the study site. The village was administratively divided into two new vil-lages in 2012: Sukapura and Resmi Tinggal (Fig. 1). Despite the split, we treated the two villages as one unit, given their shared history and similar present conditions. Crucially, homegardens were prevalent across households in the aggre-gate Sukapura village before commercialization began in the 1990s, which was well before the village administrative division in 2012. Today, the socio-ecological characteristics of homegardens are the same across the administrative divi-sion. With well-drained and fertile soil, the conditions in the study site offer great natural advantages for cultivating a mix of crops (Abdoellah et al. 2006). Most families rely on agriculture as their primary livelihood. Typical for vil-lages in the Upper Citarum Watershed, poverty is high in the study site. From family welfare data issued by the Family Planning Board of Indonesia (BKKBN), 19% of households (881) in the study site were considered very poor and 47% (2162) were considered poor in 2016 (Village profile docu-ments, 2016).
Sustainability Science
1 3
The study site was dominated by agricultural land, including rice fields, commercial small-scale farms, mixed small-scale farms (kebun-talun), and homegardens (Soe-marwoto 1984). Villagers by and large operate their agri-cultural lands commercially, either under contract with a firm, or selling to middlemen, as opposed to producing for home consumption. The study site is located about 30 km southeast of Bandung Municipality, and 20 km from the Majalaya subdistrict, a center of the textile industry in the UCW. An asphalt road connects villagers to Bandung and Majalaya, facilitating the marketing and transportation of their agricultural products; given these conditions—the favourable environment for agricultural production, the high level of commercialization, the transportation infra-structure, and the poverty of local residents.
Sampling design
In this study, we were interested in evaluating the effect of the homegarden commercialization that occurred in the 1990s. Accordingly, our target population included
households with homegardens before the commercializa-tion era that took off in the 1990s, and households with homegardens currently. Due to the lack of a sampling frame for the targeted population, we took the following strategy. First, we used the government list of 4798 house-holds in Sukapura and Resmi Tingal villages in 2017 as our sampling frame. Second, to determine sample size (n) , we used Lynch’s et.al. (1974) formula:
N is the population size, 4798. z� is the normal distribu-tion �-th quantile. Here, we used a confidence level of 95% which results in a z value of 1.96. � is the margin of error and we used 10%. And � is the proportion of sub-popu-lation understudied (i.e., the households with commercial-ized homegardens). Since we did not have the information about � and the reliability of sample estimates increase as the increase of sample size (Lohr 2010), we choose � = 50% which provides the maximum sample size and hence the highest reliability. Accordingly, we obtained a sample size of 95 households. Next, we randomly drew a random sample of
n =Nz2
��(1 − �)
N�2 + z2��(1 − �)
,
Fig. 1 Sukapura and ResmiTingal Villages in West Java, Indonesia
Sustainability Science
1 3
95 households from the list. And finally, we threw out house-holds from the random sample that did not fit these criteria. This led to a sample of 81 households, which we used in our analyses. This strategy may not an ideal one, and we are aware that the sample size may under-determined. However, the use of � = 50% might compensate the problem and keep the sample reliability at the defined level.
In addition to administering questionnaires, we also car-ried out in-depth interviews with 12 informants, who we purposively selected because of their knowledge about homegarden conditions and management before and after commercialization. Interviews with such informants were carried out to obtain initial qualitative information concern-ing “changes” in homegardens at the village level. These interviews provided important information and insights prior to the administration of survey questionnaires. Because the commercialization era began after the Green Revolution in the 1970s, and intensified in the 1990s, we selected heads of households who were at least 30 years of age as our informants.
Data collection and instruments
Research took place from April to November 2017, using sequential mixed methods. We used a standard question-naire to survey household heads from 81 households, sup-plemented with qualitative interviews with 12 informants. The survey included demographic questions (income, edu-cation, household size, and land area), and questions about agricultural output and sales, which we used to determine the extent of homegarden commercialization. To examine the effects of commercialization on household food security and food sovereignty, we developed a set of indicators for each (see Appendix A).
For food security, we built indicators based on the Food and Agriculture Organization’s (FAO et al. 2017) definition of food security as “A situation that exists when all people, at all times, have physical, social and economic access to suf-ficient, safe and nutritious food that meets their dietary needs and food preferences for an active and healthy lifestyle” (p. 107). The FAO’s definition includes four dimensions, which we used as indicators: food availability, economic and physi-cal access to food, food utilization, and stability over time. We populated each indicator with variables for quantification using FAO (2008) definitions combined with insights from Lang and Heasman’s (2016) work on food paradigms. Lang and Heasman argue that there are currently three competing paradigms about how to grow, distribute, and consume food: (1) a Productionist Paradigm that frames problems of hunger and rural poverty as problems of low production and produc-tivity, (2) a related Life Sciences Integrated paradigm (LSIP) that applies new scientific technologies to productionist log-ics, and (3) an Ecologically Integrated Paradigm (EIP) that
focuses on how human and environmental health are related through practices like agro-ecology. In our study, to meas-ure food security—especially as associated with homegar-dens—we scored responses that aligned with a Productionist Paradigm (including its LSIP variant) lower than those that aligned with an EIP, since approaches that combine human and environmental health have higher potential for long-term and sustainable solutions that address hunger and especially rural poverty.
Specifically, food availability refers to the “supply side” of food security, which we defined in terms of how much food was available from homegardens, from 0 to 100%. Food access goes beyond the availability of food at household or national levels, to consider barriers for attaining food: markets, prices, and income are central to the food access category. Because food is accessible in the UCW—increas-ingly industrially processed foods from market shops—we defined access in terms of what factors people considered most when buying food; buying lots and cheap food was scored lower than buying from local sources, since the for-mer indicates a shift toward industrial diets. Utilization of food is related to food quality and the nutritional status of individuals. We were interested to understand how people perceive food quality, as a matter primarily about quantity and price, or about quality and hygiene. For stability of food security over time, we used environmental awareness in land management, and the kind of knowledge used to cultivate homegardens as variables. Our assumption, based on Lang and Heasman, the FAO, and others, was that achieving and maintaining food security in the long term will depend on taking care of the environment, and using forms of produc-tion and knowledge that recognize the interconnectedness of human–nature systems.
While the FAO definition of food security is generally agreed upon,1 and is repeated in international and national policies, food sovereignty is perhaps more contested, with different understandings and applications in public and private, and community and national/international settings (Patel 2009). Given this, we developed indicators, variables, and parameters based on the definition of food sovereignty from the Declaration of combined with insights from Lang and Heasman’s Ecologically Integrated Paradigm. Accord-ing to Nyéléni, there are six pillars of food sovereignty, namely, that food sovereignty: (1) focuses on food for the people, (2) values food providers, (3) localizes food sys-tems, (4) puts control locally, (5) builds knowledge and skills, and (6) works with nature. As such, local markets,
1 This is not to say that the food security definition, or its operation-alization for policy, is not without its problems and critics. See, for instance, Lappé et al. (2013) on weaknesses in the FAOs methodol-ogy for defining and counting hunger.
Sustainability Science
1 3
agro-ecology, and farmer/pastoralist/fisher-led production, distribution, and consumption are key to food sovereignty discourse and practice. Similarly, Lang and Heasman’s EIP—with which food sovereignty is associated—takes a “whole-chain systems approach” (p. 40), including localized and decentralized food systems and economies, which rely on farmer-knowledge and environmentally friendly produc-tion methods to promote dietary diversity and human and ecosystem health.
Based on the above, we defined three food sovereignty indicators. First, for food system sustainability, we measured motivations and practices in homegardens and on farms, scored in relation to Nyéléni and the EIP. Because health is central, especially in Lang and Heasman, we defined a food consumption habits indicator to assess what people were eating, and how they were preparing their meals. As indus-trial food products are those in which most decisions are made and most value is added off-farm, we proposed that high rates of instant food consumption in the household is less associated with food sovereignty and the Ecologically Integrated Paradigm. We also included a food expenditure indicator, based on previous studies that illustrate the posi-tive relationship between farm-level commercialization and marketized food expenditures (e.g., Pingali 1997.).
Populating both indicator schemes with insights from Lang and Heasman’s paradigms helps to move beyond the food security–food sovereignty impasse that exists in much of the literature, and proposes the two as mutually exclu-sive (Clapp 2014; Jarosz 2014). We do not, for instance, consider food security as simply a discursive and political expression of the Productionist Paradigm, just as we do not understand food sovereignty as the only Ecologically Inte-grated Paradigm. Rather, we were concerned to start to study the intersections between and among these four concepts, related especially to the lived experiences of poor, small-holder households.
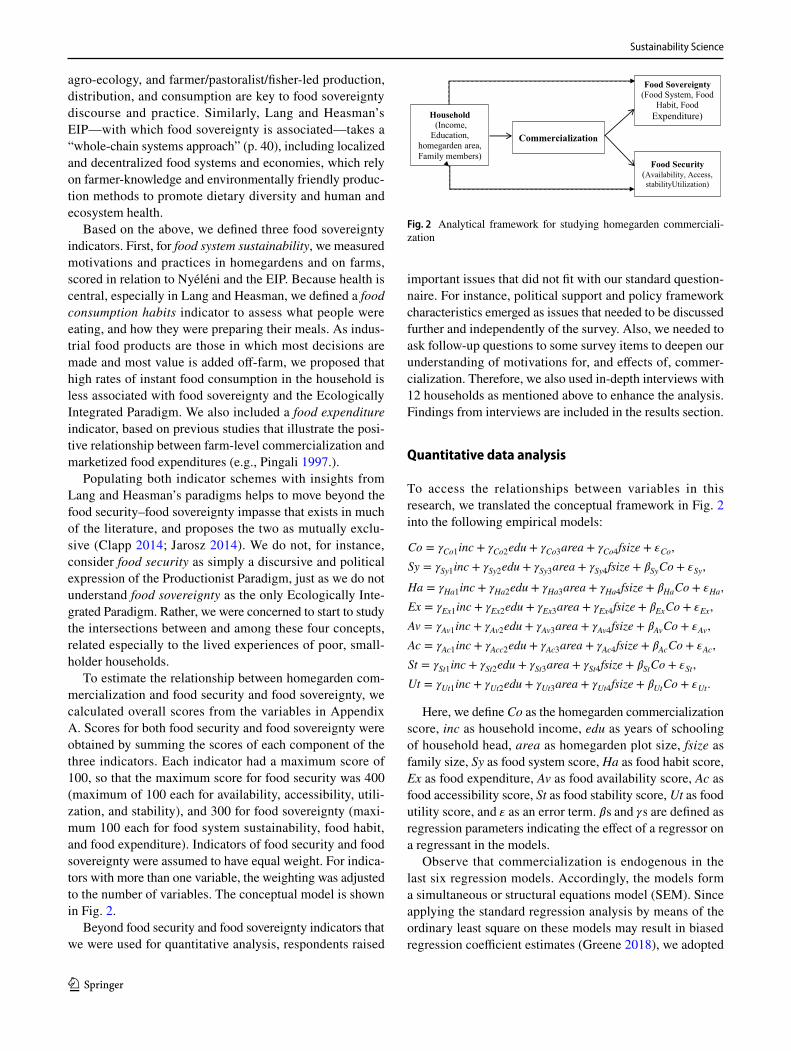
To estimate the relationship between homegarden com-mercialization and food security and food sovereignty, we calculated overall scores from the variables in Appendix A. Scores for both food security and food sovereignty were obtained by summing the scores of each component of the three indicators. Each indicator had a maximum score of 100, so that the maximum score for food security was 400 (maximum of 100 each for availability, accessibility, utili-zation, and stability), and 300 for food sovereignty (maxi-mum 100 each for food system sustainability, food habit, and food expenditure). Indicators of food security and food sovereignty were assumed to have equal weight. For indica-tors with more than one variable, the weighting was adjusted to the number of variables. The conceptual model is shown in Fig. 2.
Beyond food security and food sovereignty indicators that we were used for quantitative analysis, respondents raised
important issues that did not fit with our standard question-naire. For instance, political support and policy framework characteristics emerged as issues that needed to be discussed further and independently of the survey. Also, we needed to ask follow-up questions to some survey items to deepen our understanding of motivations for, and effects of, commer-cialization. Therefore, we also used in-depth interviews with 12 households as mentioned above to enhance the analysis. Findings from interviews are included in the results section.
Quantitative data analysis
To access the relationships between variables in this research, we translated the conceptual framework in Fig. 2 into the following empirical models:
Here, we define Co as the homegarden commercialization score, inc as household income, edu as years of schooling of household head, area as homegarden plot size, fsize as family size, Sy as food system score, Ha as food habit score, Ex as food expenditure, Av as food availability score, Ac as food accessibility score, St as food stability score, Ut as food utility score, and � as an error term. �s and �s are defined as regression parameters indicating the effect of a regressor on a regressant in the models.
Observe that commercialization is endogenous in the last six regression models. Accordingly, the models form a simultaneous or structural equations model (SEM). Since applying the standard regression analysis by means of the ordinary least square on these models may result in biased regression coefficient estimates (Greene 2018), we adopted
Co = �Co1inc + �Co2edu + �Co3area + �Co4fsize + �Co,
Sy = �Sy1inc + �Sy2edu + �Sy3area + �Sy4fsize + �SyCo + �Sy,
Ha = �Ha1inc + �Ha2edu + �Ha3area + �Ha4fsize + �HaCo + �Ha,
Ex = �Ex1inc + �Ex2edu + �Ex3area + �Ex4fsize + �ExCo + �Ex,
Av = �Av1inc + �Av2edu + �Av3area + �Av4fsize + �AvCo + �Av,
Ac = �Ac1inc + �Acc2edu + �Ac3area + �Ac4fsize + �AcCo + �Ac,
St = �St1inc + �St2edu + �St3area + �St4fsize + �StCo + �St,
Ut = �Ut1inc + �Ut2edu + �Ut3area + �Ut4fsize + �UtCo + �Ut.
Household (Income, Education,
homegarden area, Family members)
Commercialization
Food Sovereignty(Food System, Food
Habit, FoodExpenditure)
Food Security(Availability, Access, stabilityUtilization)
Fig. 2 Analytical framework for studying homegarden commerciali-zation
Sustainability Science
1 3
the maximum-likelihood approach under the structural equa-tion modeling (SEM) framework. SEM can simultaneously overcome endogeneity problems with regards to simultane-ity, measurement errors, as well as omitted variables and provide consistent estimates (e.g., Suparman et al. 2016; Ren et al., 2017). In the absence of measurement models, an SEM model is a simultaneous equations system which consistently can be estimated by the (full information) max-imum-likelihood method (Greene 2018).
Furthermore, there are several motivations in analyzing the proposed model using the SEM framework (Joreskog and Sorbom 1996). First, the data of dependent variables availability, accessibility, and utility are binary and SEM allows binary-dependent variables in addition to numerical and ordinal data. This is possible to combine numerical, ordinal, and binary-dependent variables, since SEM can be based on a correlation data matrix. In our case, we use prod-uct–moment correlations for numerical data, tetra-choric correlations for binary data, and bi-serial correlations for numeric-binary data. Second, SEM provides estimates of indirect and total effect in addition to direct effect estimates. And finally, SEM provides overall model fit indices. The indices can be used to evaluate how well empirical data fit to the conceptual framework proposed. The analysis was done in Lisrel 8 with a 5% significance level. We present SEM specification of the empirical models in Appendix B.
Results
Homegarden commercialization
Commercialization in agriculture is the process of trans-forming subsistence farming into market-oriented agricul-ture. Agricultural produce is no longer seen as a means for merely meeting household food needs, but becomes a source of household income. Farmers are thus brought into broader markets through the sale of agricultural commodities, and by participating in markets for inputs, labor, assets, credit, and consumer goods. With commercialization, crop type and variety change to meet the needs of the market. From our interviews and previous research in the region (refer-ences removed for review), farmers and officials in the UCW expect commercialization to increase farmers’ incomes in direct proportion to the area of land owned by the house-hold and brought into market production, and in relation to fluctuations in the selling price.
The process of agricultural commercialization in the UCW kicked off in the 1990s when farmers began planting vegetable commodities on agricultural land, both small scale (homegarden) and large scale (cropland not surrounding the dwelling). All interviewees stated that at the beginning of the 1990s, homegardens were still common, and crops in
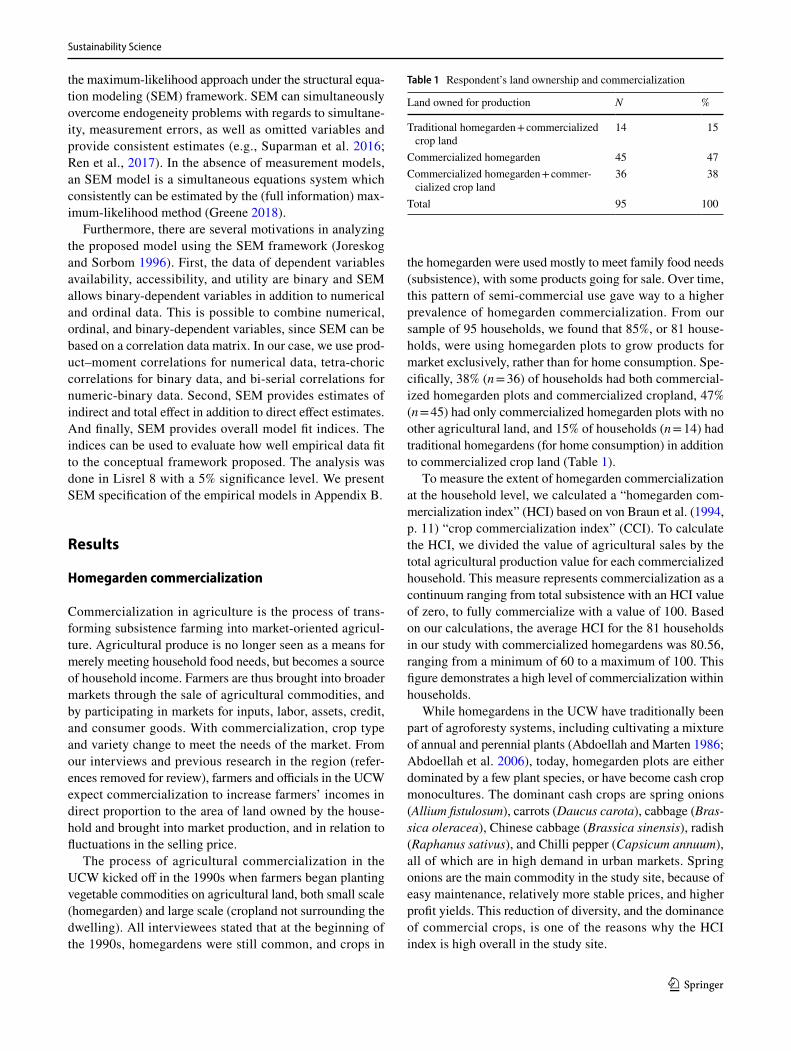
the homegarden were used mostly to meet family food needs (subsistence), with some products going for sale. Over time, this pattern of semi-commercial use gave way to a higher prevalence of homegarden commercialization. From our sample of 95 households, we found that 85%, or 81 house-holds, were using homegarden plots to grow products for market exclusively, rather than for home consumption. Spe-cifically, 38% (n = 36) of households had both commercial-ized homegarden plots and commercialized cropland, 47% (n = 45) had only commercialized homegarden plots with no other agricultural land, and 15% of households (n = 14) had traditional homegardens (for home consumption) in addition to commercialized crop land (Table 1).
To measure the extent of homegarden commercialization at the household level, we calculated a “homegarden com-mercialization index” (HCI) based on von Braun et al. (1994, p. 11) “crop commercialization index” (CCI). To calculate the HCI, we divided the value of agricultural sales by the total agricultural production value for each commercialized household. This measure represents commercialization as a continuum ranging from total subsistence with an HCI value of zero, to fully commercialize with a value of 100. Based on our calculations, the average HCI for the 81 households in our study with commercialized homegardens was 80.56, ranging from a minimum of 60 to a maximum of 100. This figure demonstrates a high level of commercialization within households.
While homegardens in the UCW have traditionally been part of agroforesty systems, including cultivating a mixture of annual and perennial plants (Abdoellah and Marten 1986; Abdoellah et al. 2006), today, homegarden plots are either dominated by a few plant species, or have become cash crop monocultures. The dominant cash crops are spring onions (Allium fistulosum), carrots (Daucus carota), cabbage (Bras-sica oleracea), Chinese cabbage (Brassica sinensis), radish (Raphanus sativus), and Chilli pepper (Capsicum annuum), all of which are in high demand in urban markets. Spring onions are the main commodity in the study site, because of easy maintenance, relatively more stable prices, and higher profit yields. This reduction of diversity, and the dominance of commercial crops, is one of the reasons why the HCI index is high overall in the study site.
Table 1 Respondent’s land ownership and commercialization
Land owned for production N %
Traditional homegarden + commercialized crop land
14 15
Commercialized homegarden 45 47Commercialized homegarden + commer-
cialized crop land36 38
Total 95 100
Sustainability Science
1 3
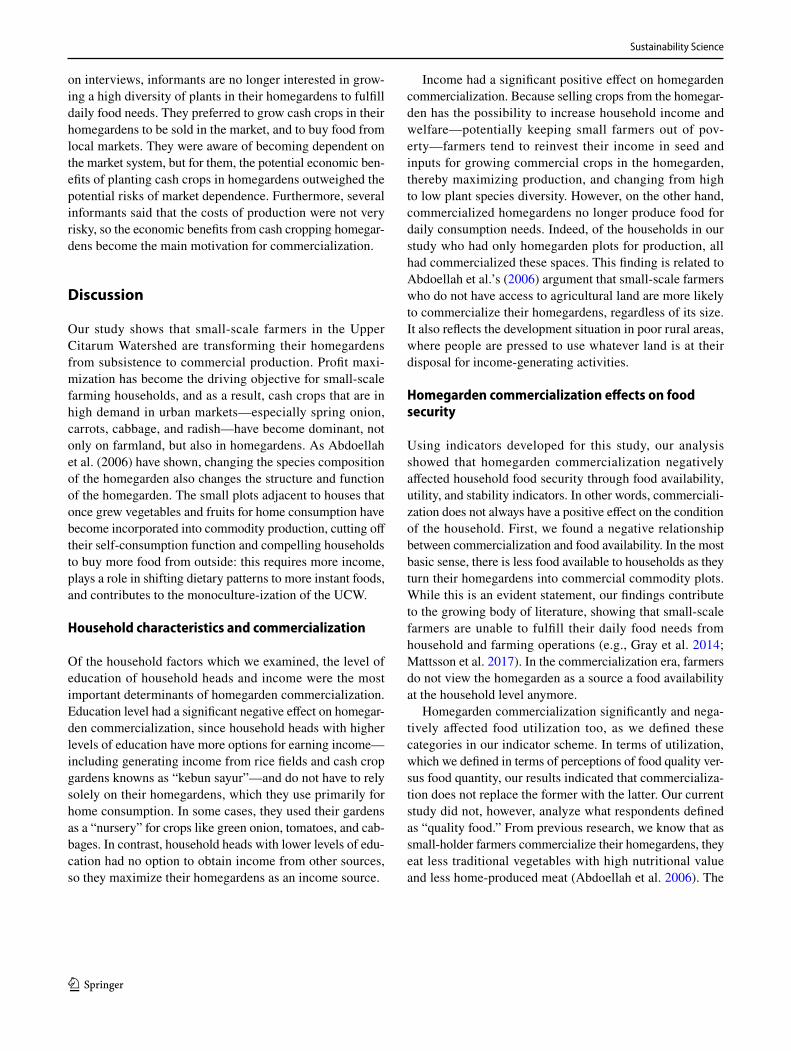
The survey instrument asked respondents why they commercialized their homegardens, and why they did not. Improving agricultural productivity and generating sur-plus was the primary reason for those who had, which they tried to achieve using farm inputs. In fully commercialized homegardens, inputs were predominantly obtained from markets, and profit maximization became the farm house-hold’s driving objective. In the 14 households that had not commercialized homegardens, the main reason for maintain-ing home plots was that they preferred to commercialize other types of land, such as rice fields and mixed gardens, which are usually much larger than homegardens.
Household characteristics and commercialization
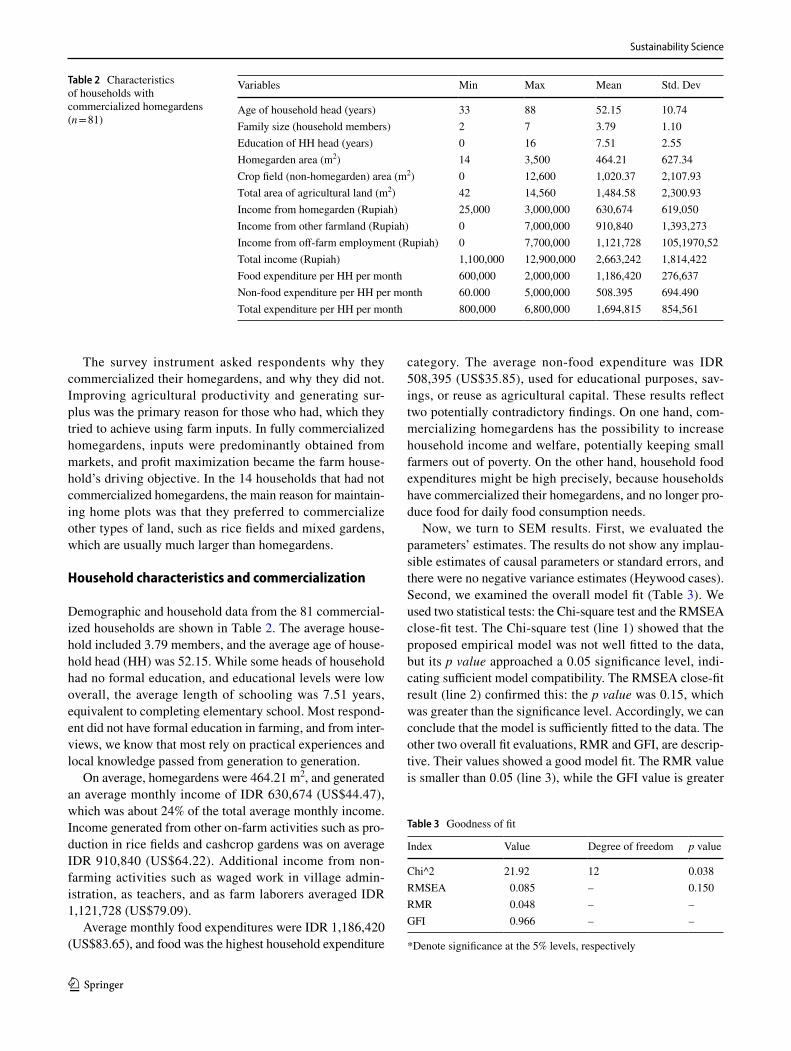
Demographic and household data from the 81 commercial-ized households are shown in Table 2. The average house-hold included 3.79 members, and the average age of house-hold head (HH) was 52.15. While some heads of household had no formal education, and educational levels were low overall, the average length of schooling was 7.51 years, equivalent to completing elementary school. Most respond-ent did not have formal education in farming, and from inter-views, we know that most rely on practical experiences and local knowledge passed from generation to generation.
On average, homegardens were 464.21 m2, and generated an average monthly income of IDR 630,674 (US$44.47), which was about 24% of the total average monthly income. Income generated from other on-farm activities such as pro-duction in rice fields and cashcrop gardens was on average IDR 910,840 (US$64.22). Additional income from non-farming activities such as waged work in village admin-istration, as teachers, and as farm laborers averaged IDR 1,121,728 (US$79.09).
Average monthly food expenditures were IDR 1,186,420 (US$83.65), and food was the highest household expenditure
category. The average non-food expenditure was IDR 508,395 (US$35.85), used for educational purposes, sav-ings, or reuse as agricultural capital. These results reflect two potentially contradictory findings. On one hand, com-mercializing homegardens has the possibility to increase household income and welfare, potentially keeping small farmers out of poverty. On the other hand, household food expenditures might be high precisely, because households have commercialized their homegardens, and no longer pro-duce food for daily food consumption needs.
Now, we turn to SEM results. First, we evaluated the parameters’ estimates. The results do not show any implau-sible estimates of causal parameters or standard errors, and there were no negative variance estimates (Heywood cases). Second, we examined the overall model fit (Table 3). We used two statistical tests: the Chi-square test and the RMSEA close-fit test. The Chi-square test (line 1) showed that the proposed empirical model was not well fitted to the data, but its p value approached a 0.05 significance level, indi-cating sufficient model compatibility. The RMSEA close-fit result (line 2) confirmed this: the p value was 0.15, which was greater than the significance level. Accordingly, we can conclude that the model is sufficiently fitted to the data. The other two overall fit evaluations, RMR and GFI, are descrip-tive. Their values showed a good model fit. The RMR value is smaller than 0.05 (line 3), while the GFI value is greater
Table 2 Characteristics of households with commercialized homegardens (n = 81)
Variables Min Max Mean Std. Dev
Age of household head (years) 33 88 52.15 10.74Family size (household members) 2 7 3.79 1.10Education of HH head (years) 0 16 7.51 2.55Homegarden area (m2) 14 3,500 464.21 627.34Crop field (non-homegarden) area (m2) 0 12,600 1,020.37 2,107.93Total area of agricultural land (m2) 42 14,560 1,484.58 2,300.93Income from homegarden (Rupiah) 25,000 3,000,000 630,674 619,050Income from other farmland (Rupiah) 0 7,000,000 910,840 1,393,273Income from off-farm employment (Rupiah) 0 7,700,000 1,121,728 105,1970,52Total income (Rupiah) 1,100,000 12,900,000 2,663,242 1,814,422Food expenditure per HH per month 600,000 2,000,000 1,186,420 276,637Non-food expenditure per HH per month 60.000 5,000,000 508.395 694.490Total expenditure per HH per month 800,000 6,800,000 1,694,815 854,561
Table 3 Goodness of fit
*Denote significance at the 5% levels, respectively
Index Value Degree of freedom p value
Chi^2 21.92 12 0.038RMSEA 0.085 – 0.150RMR 0.048 – –GFI 0.966 – –

Sustainability Science
1 3
than 0.95 (line 4). Thus, we conclude that the model is fit to the data and we can proceed to the discussion regarding the causal parameters.
Using SEM, we tested the effect of four household char-acteristics (education, land area, family size, and income) on the degree of homegarden commercialization (Table 4). Education of the household head had a significant negative effect on homegarden commercialization: an increase in edu-cation of 1 standard deviation (1 SD) will decrease homegar-den commercialization (HGC) by 0.49 standard deviation (SD). Household total income had a significant positive effect, with an increase of 1 SD increasing HGC by 0.44 SD. This could be due to farmers’ tendency to reinvest their income in seed and inputs for growing commercial crops in the homegarden, thereby maximizing production, and changing from high to low plant species diversity. Several informants indicated that monocultural homegardens gen-erated more income than homegardens planted with a high diversity of plants. It means that higher income households opt more for market-based homegarden production. The size of the homegarden and family size had no a significant effect on homegarden commercialization.
Commercialization and food security
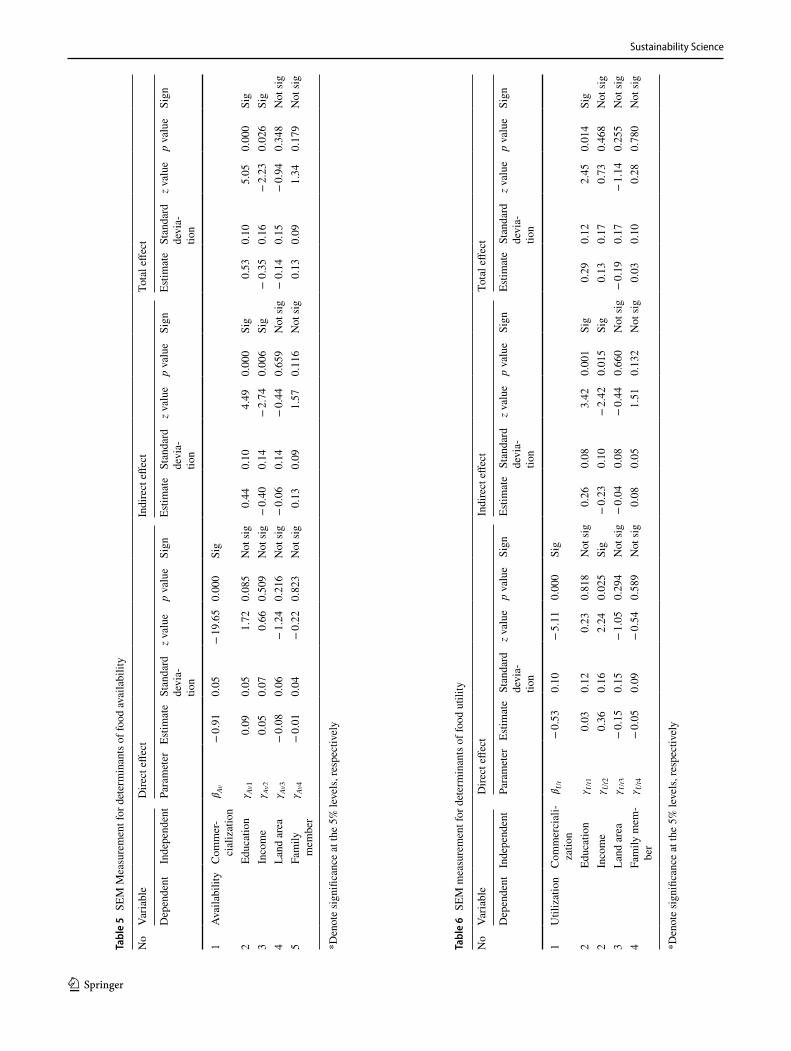
Results indicate that homegarden commercialization had a significant negative effect on food security through food availability (0.91 SD decrease), utility (0.53 SD decrease), and stability (0.33 SD decrease) (Tables 5, 6, 7), and a sig-nificant positive effect on food security through food acces-sibility (Table 8).
The strong negative relationship between commerciali-zation of, and availability of food from, homegardens is not surprising. By producing commercial crops in their homegardens, respondents already transformed the primary function of homegardens from fulfilling household needs, to generating more agricultural outputs for sale. Based on our interviews, homegardens have largely lost their food availa-bility function, and respondents bought most their food from the market. In addition, the food availability is also signifi-cantly influenced by the educational level and income of the household heads through commercialization. The amount of influence from educational level of the household head and income were 0.44 and − 0.40, respectively (Table 5).
Homegarden commercialization also had a significant negative effect on food utility (Table 6). While income had a significant and positive effect on food utility, its indirect effect was negative. As a result, its total effect was insignifi-cant. We can conclude that there was no influence of income on food utility. Table 6 shows that educational level of the household head had a significant and positive indirect effect on food utility through commercialization.
Tabl
e 4
SEM
mea
sure
men
t for
det
erm
inan
ts o
f hom
egar
den
com
mer
cial
izat
ion
*Den
ote
sign
ifica
nce
at th
e 5%
leve
ls, r
espe
ctiv
ely
No
Varia
ble
Dire
ct e
ffect
Indi
rect
effe
ctTo
tal e
ffect
Dep
ende
ntIn
depe
nden
tPa
ram
eter
Estim
ate
Stan
dard
de
viat
ion
z val
uep
valu
eSi
gnEs
timat
eSt
anda
rd
devi
atio
nz v
alue
p va
lue
Sign
Estim
ate
Stan
dard
de
viat
ion
z val
uep
valu
eSi
gn
1C
omm
erci
ali-
zatio
nEd
ucat
ion
�Co1
− 0.
490.
11 −
4.61
0.00
0Si
g
2In
com
e�Co2
0.44
0.16
2.77
0.00
6Si
g3
Land
are
a�Co3
0.07
0.15
0.44
0.65
9N
ot si
g4
Fam
ily m
em-
ber
�Co4
− 0.
150.
09 −
1.58
0.11
4N
ot si
g
Sustainability Science
1 3
Tabl
e 5
SEM
Mea
sure
men
t for
det
erm
inan
ts o
f foo
d av
aila
bilit
y
*Den
ote
sign
ifica
nce
at th
e 5%
leve
ls, r
espe
ctiv
ely
No
Varia
ble
Dire
ct e
ffect
Indi
rect
effe
ctTo
tal e
ffect
Dep
ende
ntIn
depe
nden
tPa
ram
eter
Estim
ate
Stan
dard
de
via-
tion
z val
uep
valu
eSi
gnEs
timat
eSt
anda
rd
devi
a-tio
n
z val
uep
valu
eSi
gnEs
timat
eSt
anda
rd
devi
a-tio
n
z val
uep
valu
eSi
gn
1A
vaila
bilit
yC
omm
er-
cial
izat
ion
�Av
− 0.
910.
05 −
19.6
50.
000
Sig
2Ed
ucat
ion
�Av1
0.09
0.05
1.72
0.08
5N
ot si
g0.
440.
104.
490.
000
Sig
0.53
0.10
5.05
0.00
0Si
g3
Inco
me
�Av2
0.05
0.07
0.66
0.50
9N
ot si
g −
0.40
0.14
− 2.
740.
006
Sig
− 0
.35
0.16
− 2.
230.
026
Sig
4La
nd a
rea
�Av3
− 0.
080.
06 −
1.24
0.21
6N
ot si
g −
0.06
0.14
− 0.
440.
659
Not
sig
− 0
.14
0.15
− 0.
940.
348
Not
sig
5Fa
mily
m
embe
r�Av4
− 0.
010.
04 −
0.22
0.82
3N
ot si
g0.
130.
091.
570.
116
Not
sig
0.13
0.09
1.34
0.17
9N
ot si
g
Tabl
e 6
SEM
mea
sure
men
t for
det
erm
inan
ts o
f foo
d ut
ility
*Den
ote
sign
ifica
nce
at th
e 5%
leve
ls, r
espe
ctiv
ely
No
Varia
ble
Dire
ct e
ffect
Indi
rect
effe
ctTo
tal e
ffect
Dep
ende
ntIn
depe
nden
tPa
ram
eter
Estim
ate
Stan
dard
de
via-
tion
z val
uep
valu
eSi
gnEs
timat
eSt
anda
rd
devi
a-tio
n
z val
uep
valu
eSi
gnEs
timat
eSt
anda
rd
devi
a-tio
n
z val
uep
valu
eSi
gn
1U
tiliz
atio
nC
omm
erci
ali-
zatio
n�Ut
− 0.
530.
10 −
5.11
0.00
0Si
g
2Ed
ucat
ion
�Ut1
0.03
0.12
0.23
0.81
8N
ot si
g0.
260.
083.
420.
001
Sig
0.29
0.12
2.45
0.01
4Si
g2
Inco
me
�Ut2
0.36
0.16
2.24
0.02
5Si
g −
0.23
0.10
− 2.
420.
015
Sig
0.13
0.17
0.73
0.46
8N
ot si
g3
Land
are
a�Ut3
− 0.
150.
15 −
1.05
0.29
4N
ot si
g −
0.04
0.08
− 0.
440.
660
Not
sig
− 0.
190.
17 −
1.14
0.25
5N
ot si
g4
Fam
ily m
em-
ber
�Ut4
− 0.
050.
09 −
0.54
0.58
9N
ot si
g0.
080.
051.
510.
132
Not
sig
0.03
0.10
0.28
0.78
0N
ot si
g
Sustainability Science
1 3
Tabl
e 7
SEM
mea
sure
men
t for
det
erm
inan
ts o
f foo
d st
abili
ty
*Den
ote
sign
ifica
nce
at th
e 5%
leve
ls, r
espe
ctiv
ely
No
Varia
ble
Dire
ct e
ffect
Indi
rect
effe
ctTo
tal e
ffect
Dep
ende
ntIn
depe
nden
tPa
ram
eter
Estim
ate
Stan
dard
de
via-
tion
z val
uep
valu
eSi
gnEs
timat
eSt
anda
rd
devi
a-tio
n
z val
uep
valu
eSi
gnEs
timat
eSt
anda
rd
devi
a-tio
n
z val
uep
valu
eSi
gn
1St
abili
tyC
omm
erci
ali-
zatio
n�St
− 0.
330.
12 −
2.83
0.00
5Si
g
2Ed
ucat
ion
�St1
− 0.
010.
13 −
0.05
0.96
3N
ot si
g0.
160.
072.
410.
016
Sig
0.15
0.12
1.29
0.19
6N
ot si
g2
Inco
me
�St2
0.23
0.18
1.27
0.20
3N
ot si
g −
0.14
0.07
− 1.
970.
049
Sig
0.08
0.18
0.47
0.63
7N
ot si
g3
Land
are
a�St3
− 0.
030.
16 −
0.17
0.86
5N
ot si
g −
0.02
0.05
− 0.
440.
663
Not
sig
− 0.
050.
17 −
0.29
0.77
0N
ot si
g4
Fam
ily m
em-
ber
�St4
0.07
0.10
0.72
0.47
0N
ot si
g0.
050.
041.
380.
168
Not
sig
0.12
0.11
1.16
0.24
6N
ot si
g
Tabl
e 8
SEM
mea
sure
men
t for
det
erm
inan
ts o
f foo
d ac
cess
ibili
ty
*Den
ote
sign
ifica
nce
at th
e 5%
leve
ls, r
espe
ctiv
ely
No
Varia
ble
Dire
ct e
ffect
Indi
rect
effe
ctTo
tal e
ffect
Dep
ende
ntIn
depe
nden
tPa
ram
eter
Estim
ate
Stan
dard
de
via-
tion
z val
uep
valu
eSi
gnEs
timat
eSt
anda
rd
devi
a-tio
n
z val
uep
valu
eSi
gnEs
timat
eSt
anda
rd
devi
a-tio
n
z val
uep
valu
eSi
gn
1A
cces
sibi
l-ity
Com
mer
-ci
aliz
atio
n�Ac
0.50
0.10
5.05
0.00
0Si
g
2Ed
ucat
ion
�Ac1
0.24
0.11
2.25
0.02
5Si
g −
0.24
0.07
− 3.
400.
001
Sig
0.00
0.11
0.01
0.99
2N
ot si
g3
Inco
me
�Ac2
− 0.
230.
15 −
1.54
0.12
4N
ot si
g0.
220.
092.
430.
015
Sig
− 0.
020.
16 −
0.09
0.92
5N
ot si
g4
Land
are
a�Ac3
− 0.
310.
14 −
2.24
0.02
5Si
g0.
030.
070.
440.
660
Not
sig
− 0.
280.
16 −
1.77
0.07
7N
ot si
g5
Fam
ily
mem
ber
�Ac4
− 0.
180.
09 −
2.09
0.03
6Si
g −
0.07
0.05
− 1.
510.
132
Not
sig
− 0.
250.
10 −
2.63
0.00
9Si
g
Sustainability Science
1 3
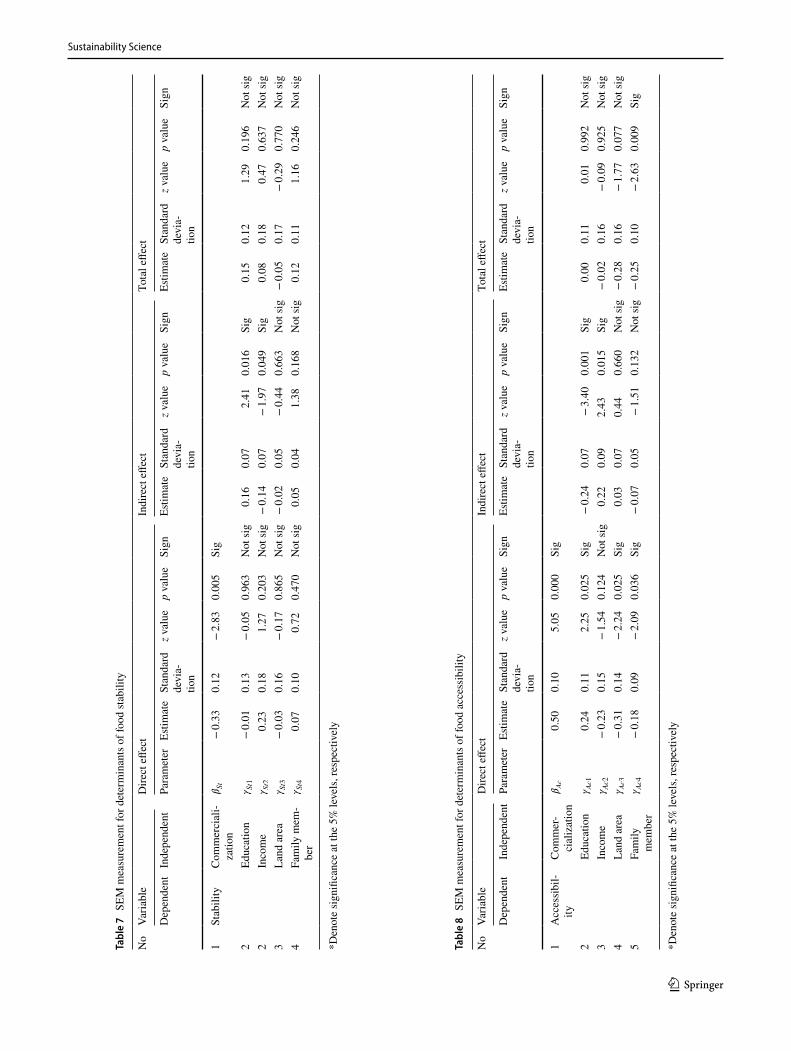
Homegarden commercialization had a significant nega-tive effect on food stability, which we defined in terms of sustainable farming practices (Table 7). Education had a significant and positive effect on food stability (0.16 SD increase), and income a significant negative effect (0.14 SD decrease) (Table 7). Under commercialization, farmers remake homegardens as market spaces oriented to high pro-ductivity, typically increasing their use of agrochemicals. The homegarden becomes just another source of income, losing its nutritional function, while contributing further to soil and water pollution through expanded pesticide and synthetic fertilizer use. In contrast, results from SEM analy-sis revealed that the commercialization of homegarden did significantly and positively affect food accessibility (0.50 SD increase) (Table 8). The strong relationship between com-mercialization of, and food accessibility from, homegardens is very understandable due to the loss of homegardens as sources of local food. Respondents become more concerned with cheap prices and large quantities of food, rather than quality, hygiene, and nutritional status.
The size of homegarden and family size had significant negative effects on food accessibility, and income through commercialization had a significant positive effect on food accessibility (Table 8). Food accessibility is also positively influenced by educational level of household heads. In con-trast, the indirect effect of educational level on food acces-sibility through commercialization was negative. As a conse-quence, the total effect of educational level food accessibility was insignificantly different from zero (Table 8).
Commercialization and food sovereignty
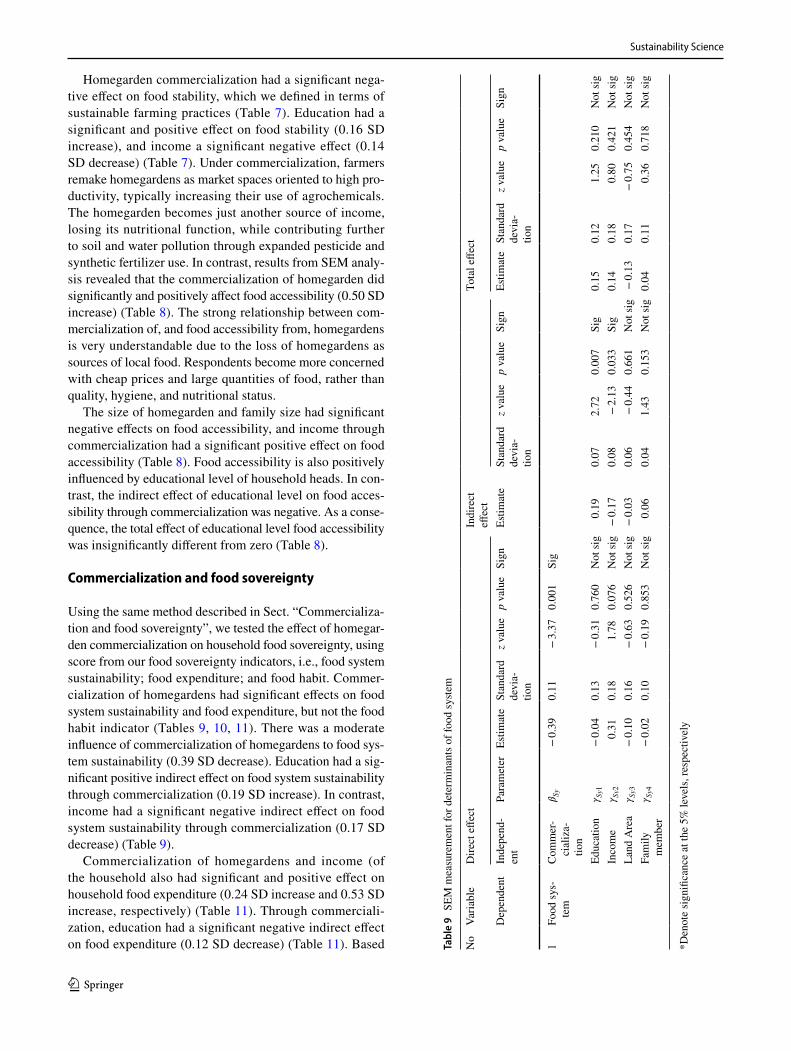
Using the same method described in Sect. “Commercializa-tion and food sovereignty”, we tested the effect of homegar-den commercialization on household food sovereignty, using score from our food sovereignty indicators, i.e., food system sustainability; food expenditure; and food habit. Commer-cialization of homegardens had significant effects on food system sustainability and food expenditure, but not the food habit indicator (Tables 9, 10, 11). There was a moderate influence of commercialization of homegardens to food sys-tem sustainability (0.39 SD decrease). Education had a sig-nificant positive indirect effect on food system sustainability through commercialization (0.19 SD increase). In contrast, income had a significant negative indirect effect on food system sustainability through commercialization (0.17 SD decrease) (Table 9).
Commercialization of homegardens and income (of the household also had significant and positive effect on household food expenditure (0.24 SD increase and 0.53 SD increase, respectively) (Table 11). Through commerciali-zation, education had a significant negative indirect effect on food expenditure (0.12 SD decrease) (Table 11). Based Ta
ble
9 S
EM m
easu
rem
ent f
or d
eter
min
ants
of f
ood
syste
m
*Den
ote
sign
ifica
nce
at th
e 5%
leve
ls, r
espe
ctiv
ely
No
Varia
ble
Dire
ct e
ffect
Indi
rect
eff
ect
Tota
l effe
ct
Dep
ende
ntIn
depe
nd-
ent
Para
met
erEs
timat
eSt
anda
rd
devi
a-tio
n
z val
uep
valu
eSi
gnEs
timat
eSt
anda
rd
devi
a-tio
n
z val
uep
valu
eSi
gnEs
timat
eSt
anda
rd
devi
a-tio
n
z val
uep
valu
eSi
gn
1Fo
od sy
s-te
mC
omm
er-
cial
iza-
tion
�Sy
− 0.
390.
11 −
3.37
0.00
1Si
g
Educ
atio
n�Sy1
− 0.
040.
13 −
0.31
0.76
0N
ot si
g0.
190.
072.
720.
007
Sig
0.15
0.12
1.25
0.21
0N
ot si
gIn
com
e�Sy2
0.31
0.18
1.78
0.07
6N
ot si
g −
0.17
0.08
− 2.
130.
033
Sig
0.14
0.18
0.80
0.42
1N
ot si
gLa
nd A
rea
�Sy3
− 0.
100.
16 −
0.63
0.52
6N
ot si
g −
0.03
0.06
− 0.
440.
661
Not
sig
− 0.
130.
17 −
0.75
0.45
4N
ot si
gFa
mily
m
embe
r�Sy4
− 0.
020.
10 −
0.19
0.85
3N
ot si
g0.
060.
041.
430.
153
Not
sig
0.04
0.11
0.36
0.71
8N
ot si
g

Sustainability Science
1 3
Tabl
e 10
SE
M m
easu
rem
ent f
or d
eter
min
ants
of f
ood
habi
t
*Den
ote
sign
ifica
nce
at th
e 5%
leve
ls, r
espe
ctiv
ely
No
Varia
ble
Dire
ct e
ffect
Indi
rect
effe
ctTo
tal e
ffect
Dep
ende
ntIn
depe
nden
tPa
ram
eter
Estim
ate
Stan
dard
de
via-
tion
z Val
uep
Valu
eSi
gnEs
timat
eSt
anda
rd
devi
a-tio
n
z Val
uep
Valu
eSi
gnEs
timat
eSt
anda
rd
devi
a-tio
n
z Val
uep
Valu
eSi
gn
1Fo
od h
abit
Com
mer
cial
i-za
tion
�Ha
− 0.
190.
12 −
1.62
0.10
5N
ot si
g
Educ
atio
n�Ha1
− 0.
050.
13 −
0.35
0.72
6N
ot si
g0.
090.
061.
530.
127
Not
sig
0.05
0.12
0.40
0.68
6N
ot si
gIn
com
e�Ha2
− 0.
140.
18 −
0.74
0.46
1N
ot si
g −
0.08
0.06
− 1.
400.
162
Not
sig
− 0.
220.
18 −
1.23
0.21
7N
ot si
gLa
nd a
rea
�Ha3
0.06
0.17
0.37
0.71
2N
ot si
g −
0.01
0.03
− 0.
430.
670
Not
sig
0.05
0.17
0.29
0.77
3N
ot si
gFa
mily
mem
-be
r�Ha4
− 0.
050.
11 −
0.44
0.66
4N
ot si
g0.
030.
031.
130.
258
Not
sig
− 0.
020.
11 −
0.16
0.86
9N
ot si
g
Tabl
e 11
SE
M m
easu
rem
ent f
or d
eter
min
ants
of f
ood
expe
nditu
re
*Den
ote
sign
ifica
nce
at th
e 5%
leve
ls, r
espe
ctiv
ely
No
Varia
ble
Dire
ct e
ffect
Indi
rect
effe
ctTo
tal E
ffect
Dep
ende
ntIn
depe
nden
tPa
ram
eter
Estim
ate
Stan
dard
de
via-
tion
z val
uep
valu
eSi
gnEs
timat
eSt
anda
rd
devi
a-tio
n
z val
ueP
valu
eSi
gnEs
timat
eSt
anda
rd
devi
a-tio
n
z val
uep
valu
eSi
gn
1Fo
od
expe
ndi-
ture
Com
mer
-ci
aliz
atio
n�Ex
0.24
0.10
2.36
0.01
8Si
g
2Ed
ucat
ion
�Ex1
0.05
0.11
0.41
0.68
0N
ot si
g −
0.12
0.06
– 2.
100.
036
Sig
− 0.
070.
10 −
0.69
0.49
3N
ot si
g3
Inco
me
�Ex2
0.53
0.16
3.38
0.00
1Si
g0.
100.
061.
800.
071
Not
sig
0.63
0.15
4.10
0.00
0Si
g4
Land
are
a�Ex3
− 0.
120.
14 −
0.87
0.38
6N
ot si
g0.
020.
040.
430.
665
Not
sig
− 0.
110.
15 −
0.73
0.46
3N
ot si
g5
Fam
ily
mem
ber
�Ex4
0.10
0.09
1.10
0.27
2N
ot si
g −
0.04
0.03
− 1.
310.
190
Not
sig
0.06
0.09
0.69
0.48
9N
ot si
g
Sustainability Science
1 3
on interviews, informants are no longer interested in grow-ing a high diversity of plants in their homegardens to fulfill daily food needs. They preferred to grow cash crops in their homegardens to be sold in the market, and to buy food from local markets. They were aware of becoming dependent on the market system, but for them, the potential economic ben-efits of planting cash crops in homegardens outweighed the potential risks of market dependence. Furthermore, several informants said that the costs of production were not very risky, so the economic benefits from cash cropping homegar-dens become the main motivation for commercialization.
Discussion
Our study shows that small-scale farmers in the Upper Citarum Watershed are transforming their homegardens from subsistence to commercial production. Profit maxi-mization has become the driving objective for small-scale farming households, and as a result, cash crops that are in high demand in urban markets—especially spring onion, carrots, cabbage, and radish—have become dominant, not only on farmland, but also in homegardens. As Abdoellah et al. (2006) have shown, changing the species composition of the homegarden also changes the structure and function of the homegarden. The small plots adjacent to houses that once grew vegetables and fruits for home consumption have become incorporated into commodity production, cutting off their self-consumption function and compelling households to buy more food from outside: this requires more income, plays a role in shifting dietary patterns to more instant foods, and contributes to the monoculture-ization of the UCW.
Household characteristics and commercialization
Of the household factors which we examined, the level of education of household heads and income were the most important determinants of homegarden commercialization. Education level had a significant negative effect on homegar-den commercialization, since household heads with higher levels of education have more options for earning income—including generating income from rice fields and cash crop gardens knowns as “kebun sayur”—and do not have to rely solely on their homegardens, which they use primarily for home consumption. In some cases, they used their gardens as a “nursery” for crops like green onion, tomatoes, and cab-bages. In contrast, household heads with lower levels of edu-cation had no option to obtain income from other sources, so they maximize their homegardens as an income source.
Income had a significant positive effect on homegarden commercialization. Because selling crops from the homegar-den has the possibility to increase household income and welfare—potentially keeping small farmers out of pov-erty—farmers tend to reinvest their income in seed and inputs for growing commercial crops in the homegarden, thereby maximizing production, and changing from high to low plant species diversity. However, on the other hand, commercialized homegardens no longer produce food for daily consumption needs. Indeed, of the households in our study who had only homegarden plots for production, all had commercialized these spaces. This finding is related to Abdoellah et al.’s (2006) argument that small-scale farmers who do not have access to agricultural land are more likely to commercialize their homegardens, regardless of its size. It also reflects the development situation in poor rural areas, where people are pressed to use whatever land is at their disposal for income-generating activities.
Homegarden commercialization effects on food security
Using indicators developed for this study, our analysis showed that homegarden commercialization negatively affected household food security through food availability, utility, and stability indicators. In other words, commerciali-zation does not always have a positive effect on the condition of the household. First, we found a negative relationship between commercialization and food availability. In the most basic sense, there is less food available to households as they turn their homegardens into commercial commodity plots. While this is an evident statement, our findings contribute to the growing body of literature, showing that small-scale farmers are unable to fulfill their daily food needs from household and farming operations (e.g., Gray et al. 2014; Mattsson et al. 2017). In the commercialization era, farmers do not view the homegarden as a source a food availability at the household level anymore.
Homegarden commercialization significantly and nega-tively affected food utilization too, as we defined these categories in our indicator scheme. In terms of utilization, which we defined in terms of perceptions of food quality ver-sus food quantity, our results indicated that commercializa-tion does not replace the former with the latter. Our current study did not, however, analyze what respondents defined as “quality food.” From previous research, we know that as small-holder farmers commercialize their homegardens, they eat less traditional vegetables with high nutritional value and less home-produced meat (Abdoellah et al. 2006). The
Sustainability Science
1 3
health implications of switching to marketed foods, includ-ing processed foods, have not yet been studied in the UCW.
Homegarden commercialization had also a significant negative relationship with the food stability variable. The importance of environmentally friendly farming and of ecologically informed knowledge seems to be declining and changing in the era of commercialization. With com-mercialization, the homegarden becomes just another source of income, losing its other functions as mentioned several authors (Abdoellah and Marten 1986; Kumar and Nair 2004; Nair and Garrity 2012; Galhena et al. 2013; and Mattsson et al. 2017). This tends to contrast with the concept of food security as defined by the FAO, which includes considera-tions for environmentally responsible for management prac-tices. Our results-combined with interview data—show that farmers attitudes have changed, and they do not consider using environmentally sustainable production methods as important.
Finally, in term of food accessibility, people in the study villages could easily meet their daily food needs through markets. Shops that sell food were abundant in the study site, spread evenly in every hamlet (dusun/kampung), and even in the smallest administrative units of neighbourhood associations (rukun tetangga). Easy access was also sup-ported by good road conditions connecting people to big-ger, more urban markets if necessary. Food accessibility, of course, also depend on the household’s ability to buy food—and what kind of food—based on income and price (FAO 2008). Previous research in the UCW has shown that focusing on a narrow range of cash crops has resulted in only short-term improvements in farmers’ incomes. The high productivity required to maintain this improvement is often difficult to sustain, especially since cash crops also require higher energy and higher cost inputs in the form of fertilizers and pesticides (Abdoellah et al. 2006). Further longitudinal research is needed (1) to examine the extent to which income increases resulting from commercialization are sustainable, (2) to assess the extent to which households have become dependent on the market, and (3) to evaluate the nutritional contribution of the kinds of food that mar-ginally (and often temporarily) increased incomes allows a household to purchase.
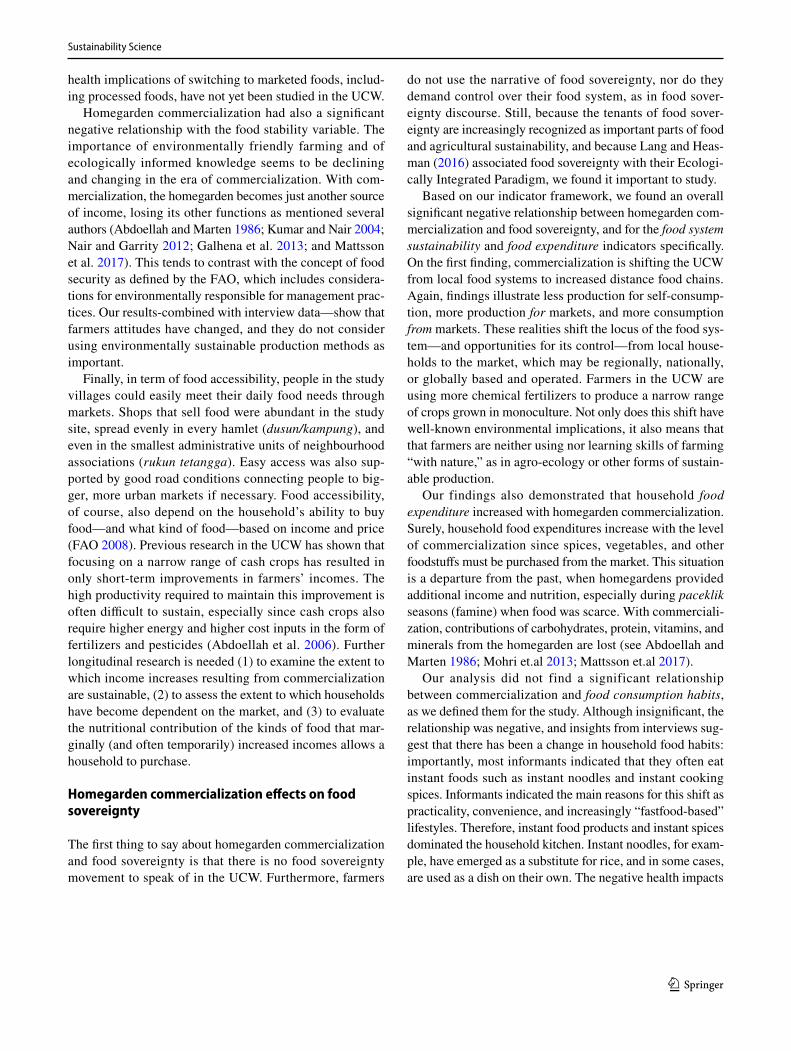
Homegarden commercialization effects on food sovereignty
The first thing to say about homegarden commercialization and food sovereignty is that there is no food sovereignty movement to speak of in the UCW. Furthermore, farmers
do not use the narrative of food sovereignty, nor do they demand control over their food system, as in food sover-eignty discourse. Still, because the tenants of food sover-eignty are increasingly recognized as important parts of food and agricultural sustainability, and because Lang and Heas-man (2016) associated food sovereignty with their Ecologi-cally Integrated Paradigm, we found it important to study.
Based on our indicator framework, we found an overall significant negative relationship between homegarden com-mercialization and food sovereignty, and for the food system sustainability and food expenditure indicators specifically. On the first finding, commercialization is shifting the UCW from local food systems to increased distance food chains. Again, findings illustrate less production for self-consump-tion, more production for markets, and more consumption from markets. These realities shift the locus of the food sys-tem—and opportunities for its control—from local house-holds to the market, which may be regionally, nationally, or globally based and operated. Farmers in the UCW are using more chemical fertilizers to produce a narrow range of crops grown in monoculture. Not only does this shift have well-known environmental implications, it also means that that farmers are neither using nor learning skills of farming “with nature,” as in agro-ecology or other forms of sustain-able production.
Our findings also demonstrated that household food expenditure increased with homegarden commercialization. Surely, household food expenditures increase with the level of commercialization since spices, vegetables, and other foodstuffs must be purchased from the market. This situation is a departure from the past, when homegardens provided additional income and nutrition, especially during paceklik seasons (famine) when food was scarce. With commerciali-zation, contributions of carbohydrates, protein, vitamins, and minerals from the homegarden are lost (see Abdoellah and Marten 1986; Mohri et.al 2013; Mattsson et.al 2017).
Our analysis did not find a significant relationship between commercialization and food consumption habits, as we defined them for the study. Although insignificant, the relationship was negative, and insights from interviews sug-gest that there has been a change in household food habits: importantly, most informants indicated that they often eat instant foods such as instant noodles and instant cooking spices. Informants indicated the main reasons for this shift as practicality, convenience, and increasingly “fastfood-based” lifestyles. Therefore, instant food products and instant spices dominated the household kitchen. Instant noodles, for exam-ple, have emerged as a substitute for rice, and in some cases, are used as a dish on their own. The negative health impacts
Sustainability Science
1 3
of instant noodles, which are high in sodium and low in nutritional value, are well known (e.g., Lee et al. 2009).
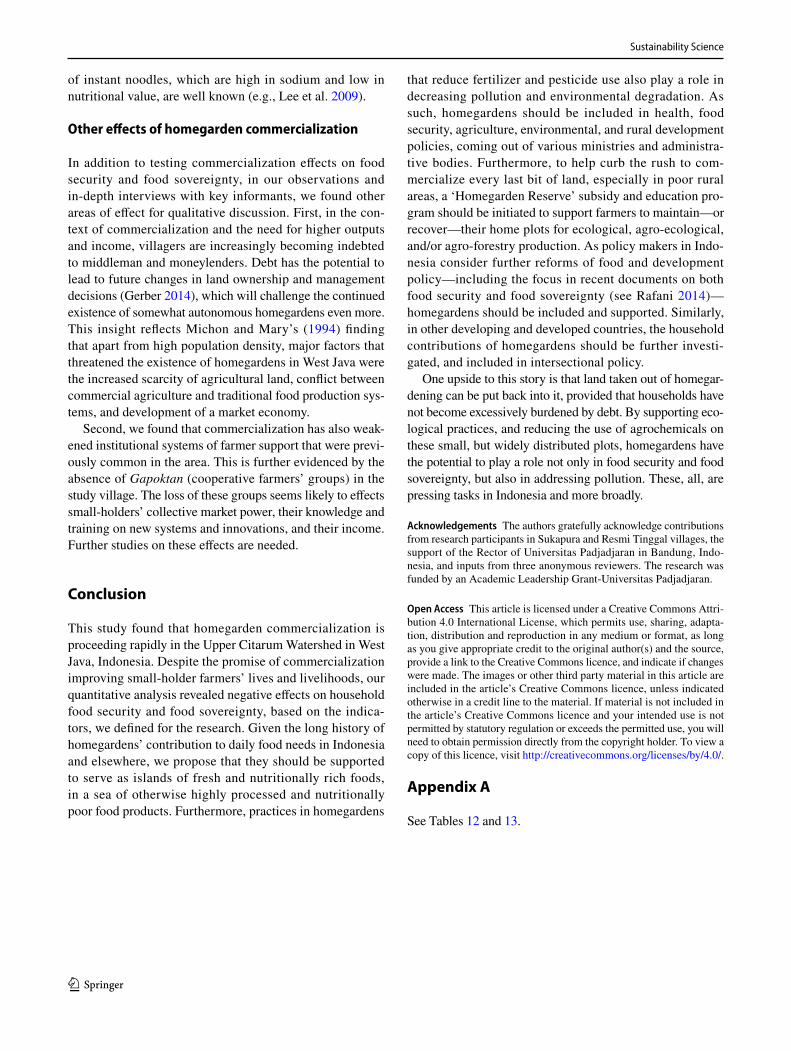
Other effects of homegarden commercialization
In addition to testing commercialization effects on food security and food sovereignty, in our observations and in-depth interviews with key informants, we found other areas of effect for qualitative discussion. First, in the con-text of commercialization and the need for higher outputs and income, villagers are increasingly becoming indebted to middleman and moneylenders. Debt has the potential to lead to future changes in land ownership and management decisions (Gerber 2014), which will challenge the continued existence of somewhat autonomous homegardens even more. This insight reflects Michon and Mary’s (1994) finding that apart from high population density, major factors that threatened the existence of homegardens in West Java were the increased scarcity of agricultural land, conflict between commercial agriculture and traditional food production sys-tems, and development of a market economy.
Second, we found that commercialization has also weak-ened institutional systems of farmer support that were previ-ously common in the area. This is further evidenced by the absence of Gapoktan (cooperative farmers’ groups) in the study village. The loss of these groups seems likely to effects small-holders’ collective market power, their knowledge and training on new systems and innovations, and their income. Further studies on these effects are needed.
Conclusion
This study found that homegarden commercialization is proceeding rapidly in the Upper Citarum Watershed in West Java, Indonesia. Despite the promise of commercialization improving small-holder farmers’ lives and livelihoods, our quantitative analysis revealed negative effects on household food security and food sovereignty, based on the indica-tors, we defined for the research. Given the long history of homegardens’ contribution to daily food needs in Indonesia and elsewhere, we propose that they should be supported to serve as islands of fresh and nutritionally rich foods, in a sea of otherwise highly processed and nutritionally poor food products. Furthermore, practices in homegardens
that reduce fertilizer and pesticide use also play a role in decreasing pollution and environmental degradation. As such, homegardens should be included in health, food security, agriculture, environmental, and rural development policies, coming out of various ministries and administra-tive bodies. Furthermore, to help curb the rush to com-mercialize every last bit of land, especially in poor rural areas, a ‘Homegarden Reserve’ subsidy and education pro-gram should be initiated to support farmers to maintain—or recover—their home plots for ecological, agro-ecological, and/or agro-forestry production. As policy makers in Indo-nesia consider further reforms of food and development policy—including the focus in recent documents on both food security and food sovereignty (see Rafani 2014)—homegardens should be included and supported. Similarly, in other developing and developed countries, the household contributions of homegardens should be further investi-gated, and included in intersectional policy.
One upside to this story is that land taken out of homegar-dening can be put back into it, provided that households have not become excessively burdened by debt. By supporting eco-logical practices, and reducing the use of agrochemicals on these small, but widely distributed plots, homegardens have the potential to play a role not only in food security and food sovereignty, but also in addressing pollution. These, all, are pressing tasks in Indonesia and more broadly.
Acknowledgements The authors gratefully acknowledge contributions from research participants in Sukapura and Resmi Tinggal villages, the support of the Rector of Universitas Padjadjaran in Bandung, Indo-nesia, and inputs from three anonymous reviewers. The research was funded by an Academic Leadership Grant-Universitas Padjadjaran.
Open Access This article is licensed under a Creative Commons Attri-bution 4.0 International License, which permits use, sharing, adapta-tion, distribution and reproduction in any medium or format, as long as you give appropriate credit to the original author(s) and the source, provide a link to the Creative Commons licence, and indicate if changes were made. The images or other third party material in this article are included in the article’s Creative Commons licence, unless indicated otherwise in a credit line to the material. If material is not included in the article’s Creative Commons licence and your intended use is not permitted by statutory regulation or exceeds the permitted use, you will need to obtain permission directly from the copyright holder. To view a copy of this licence, visit http://creat iveco mmons .org/licen ses/by/4.0/.
Appendix A
See Tables 12 and 13.

Sustainability Science
1 3
Table 12 Food Security indicators a, variables b, parameters, and scoring rubrics
Indicator Variable Parameter Score Values
Availability Availability of food for self-consumption from homegarden
Food available from homegarden 0–100 Percentage of food available from homegarden (%)
Access Consideration in buying food outside the home
0 = Price and quantity1 = Buy from local sources
0 = 0;1 = 100
0 = does not support food security1 = supports Food Security
Utilization Food quality perception 0 = Quantity and price1 = Quality and hygiene
0 = 0;1 = 100
0 = does not support food security1 = supports food security
Stability Environmental awareness in land manage-ment
0 = No consideration for environment1 = Consideration for environment
0 = 0;1 = 50
0 = does not support food security1 = supports food security
Kind of knowledge used to cultivate homegardens
0 = Industrial agriculture1 = Local knowledge
0 = 0;1 = 50
Table 13 Food Sovereignty indicators a, variables b, parameters, and scoring rubrics
a Indicators are based on statements in the Forum for Food Sovereignty’s (2007) Nyéléni Declaration, insights from Lang and Heasman’s (2016) Ecologically Integrated Paradigm, and academic work (e.g., Patel 2009)b Variables were defined based on the food sovereignty “pillars” in the Nyéléni Declaration
Indicator Variable Parameter Score Values
Food system sustainability Motivation to cultivate homegar-den land
(pillars 2,3,4)
0 = Market oriented (for sale)1 = For family needs
0 = 0;1 = 12,5
0 = does not support Food Sovereignty
1 = supports Food SovereigntyTypes of crops in homegarden(pillars 5,6)
0 = Monoculture1 = Polyculture
0 = 0;1 = 12,5
Considerations in choosing crop type
(pillars 1,3,4)
0 = Quantity and market oriented1 = Quality and for subsistence
0 = 0;1 = 12,5
Type of fertilizer commonly used for farming activities
(pillars 5,6)
0 = Chemical1 = Organic
0 = 0;1 = 12,5
Type of seed commonly used for farming activities
(pillars 4,5,6)
0 = Genetically modified1 = Local seed
0 = 0;1 = 12,5
Sales of crop products(pillars 2,3,4)
0 = Own sale to market1 = Through traders
0 = 0;1 = 12,5
Land ownership(pillars 2,3,4)
0 = Land rent1 = Land owner
0 = 0;1 = 12,5
Food expenditure(pillar 1)
0 = > 50% income for food1 = < 50% income for food
0 = 0;1 = 12,5
Food consumption habits Staple food consumption(pillar 1)
0 = < 3x/day1 = ≥ 3x/day
0 = 0;1 = 25
0 = does not support Food Sovereignty
1 = supports Food SovereigntyProcessed food consumption(pillars 1,3,4)
0 = > 2x/week1 = 1x/week
0 = 0;1 = 25
Food cooking methods(pillar 1)
0 = Fried1 = Boiled
0 = 0;1 = 25
Spices commonly used for cook-ing activities
(pillars 1,3)
0 = Instant spices1 = Natural spices
0 = 0;1 = 25
Food expenditures Food expenditure/month/capita (pillars 1,4)
0 = Food expenditure/month > 60% of total expendi-ture
1 = Food expenditure < 60% total expenditure
0 = 0;1 = 100
0 = does not support Food Sovereignty
1 = supports Food Sovereignty
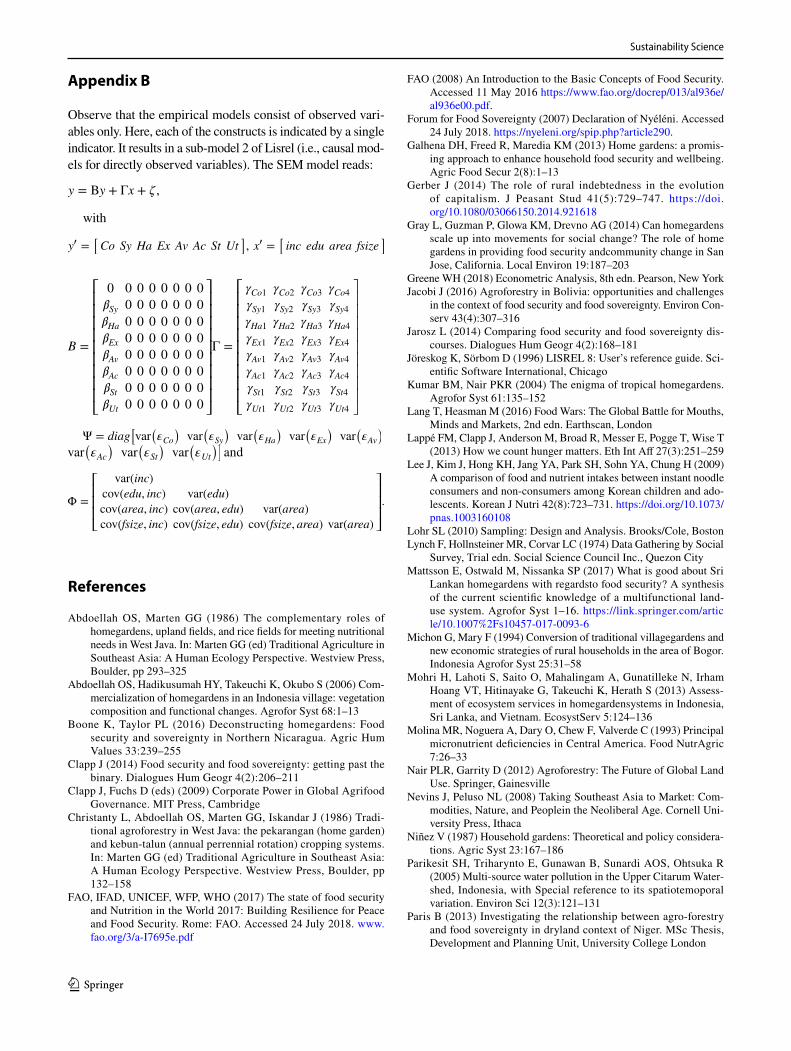
Sustainability Science
1 3
Appendix B
Observe that the empirical models consist of observed vari-ables only. Here, each of the constructs is indicated by a single indicator. It results in a sub-model 2 of Lisrel (i.e., causal mod-els for directly observed variables). The SEM model reads:
with
Ψ = diag[var
(�Co
)var
(�Sy
)var
(�Ha
)var
(�Ex
)var
(�Av
)var
(�Ac
)var
(�St
)var
(�Ut
)] and
References
Abdoellah OS, Marten GG (1986) The complementary roles of homegardens, upland fields, and rice fields for meeting nutritional needs in West Java. In: Marten GG (ed) Traditional Agriculture in Southeast Asia: A Human Ecology Perspective. Westview Press, Boulder, pp 293–325
Abdoellah OS, Hadikusumah HY, Takeuchi K, Okubo S (2006) Com-mercialization of homegardens in an Indonesia village: vegetation composition and functional changes. Agrofor Syst 68:1–13
Boone K, Taylor PL (2016) Deconstructing homegardens: Food security and sovereignty in Northern Nicaragua. Agric Hum Values 33:239–255
Clapp J (2014) Food security and food sovereignty: getting past the binary. Dialogues Hum Geogr 4(2):206–211
Clapp J, Fuchs D (eds) (2009) Corporate Power in Global Agrifood Governance. MIT Press, Cambridge
Christanty L, Abdoellah OS, Marten GG, Iskandar J (1986) Tradi-tional agroforestry in West Java: the pekarangan (home garden) and kebun-talun (annual perrennial rotation) cropping systems. In: Marten GG (ed) Traditional Agriculture in Southeast Asia: A Human Ecology Perspective. Westview Press, Boulder, pp 132–158
FAO, IFAD, UNICEF, WFP, WHO (2017) The state of food security and Nutrition in the World 2017: Building Resilience for Peace and Food Security. Rome: FAO. Accessed 24 July 2018. www.fao.org/3/a-I7695 e.pdf
y = By + Γx + � ,
y� =[Co Sy Ha Ex Av Ac St Ut
], x� =
[inc edu area fsize
]
B =
⎡⎢⎢⎢⎢⎢⎢⎢⎢⎢⎣
0 0 0 0 0 0 0 0
�Sy 0 0 0 0 0 0 0
�Ha 0 0 0 0 0 0 0
�Ex 0 0 0 0 0 0 0
�Av 0 0 0 0 0 0 0
�Ac 0 0 0 0 0 0 0
�St 0 0 0 0 0 0 0
�Ut 0 0 0 0 0 0 0
⎤⎥⎥⎥⎥⎥⎥⎥⎥⎥⎦
Γ =
⎡⎢⎢⎢⎢⎢⎢⎢⎢⎢⎣
�Co1 �Co2 �Co3 �Co4�Sy1 �Sy2 �Sy3 �Sy4�Ha1 �Ha2 �Ha3 �Ha4�Ex1 �Ex2 �Ex3 �Ex4�Av1 �Av2 �Av3 �Av4�Ac1 �Ac2 �Ac3 �Ac4�St1 �St2 �St3 �St4�Ut1 �Ut2 �Ut3 �Ut4
⎤⎥⎥⎥⎥⎥⎥⎥⎥⎥⎦
Φ =
⎡⎢⎢⎢⎣
var(inc)
cov(edu, inc) var(edu)
cov(area, inc) cov(area, edu) var(area)
cov(fsize, inc) cov(fsize, edu) cov(fsize, area) var(area)
⎤⎥⎥⎥⎦.
FAO (2008) An Introduction to the Basic Concepts of Food Security. Accessed 11 May 2016 https ://www.fao.org/docre p/013/al936 e/al936 e00.pdf.
Forum for Food Sovereignty (2007) Declaration of Nyéléni. Accessed 24 July 2018. https ://nyele ni.org/spip.php?artic le290 .
Galhena DH, Freed R, Maredia KM (2013) Home gardens: a promis-ing approach to enhance household food security and wellbeing. Agric Food Secur 2(8):1–13
Gerber J (2014) The role of rural indebtedness in the evolution of capitalism. J Peasant Stud 41(5):729–747. https ://doi.org/10.1080/03066 150.2014.92161 8
Gray L, Guzman P, Glowa KM, Drevno AG (2014) Can homegardens scale up into movements for social change? The role of home gardens in providing food security andcommunity change in San Jose, California. Local Environ 19:187–203
Greene WH (2018) Econometric Analysis, 8th edn. Pearson, New YorkJacobi J (2016) Agroforestry in Bolivia: opportunities and challenges
in the context of food security and food sovereignty. Environ Con-serv 43(4):307–316
Jarosz L (2014) Comparing food security and food sovereignty dis-courses. Dialogues Hum Geogr 4(2):168–181
Jöreskog K, Sörbom D (1996) LISREL 8: User’s reference guide. Sci-entific Software International, Chicago
Kumar BM, Nair PKR (2004) The enigma of tropical homegardens. Agrofor Syst 61:135–152
Lang T, Heasman M (2016) Food Wars: The Global Battle for Mouths, Minds and Markets, 2nd edn. Earthscan, London
Lappé FM, Clapp J, Anderson M, Broad R, Messer E, Pogge T, Wise T (2013) How we count hunger matters. Eth Int Aff 27(3):251–259
Lee J, Kim J, Hong KH, Jang YA, Park SH, Sohn YA, Chung H (2009) A comparison of food and nutrient intakes between instant noodle consumers and non-consumers among Korean children and ado-lescents. Korean J Nutri 42(8):723–731. https ://doi.org/10.1073/pnas.10031 60108
Lohr SL (2010) Sampling: Design and Analysis. Brooks/Cole, BostonLynch F, Hollnsteiner MR, Corvar LC (1974) Data Gathering by Social
Survey, Trial edn. Social Science Council Inc., Quezon CityMattsson E, Ostwald M, Nissanka SP (2017) What is good about Sri
Lankan homegardens with regardsto food security? A synthesis of the current scientific knowledge of a multifunctional land-use system. Agrofor Syst 1–16. https ://link.sprin ger.com/artic le/10.1007%2Fs10 457-017-0093-6
Michon G, Mary F (1994) Conversion of traditional villagegardens and new economic strategies of rural households in the area of Bogor. Indonesia Agrofor Syst 25:31–58
Mohri H, Lahoti S, Saito O, Mahalingam A, Gunatilleke N, Irham Hoang VT, Hitinayake G, Takeuchi K, Herath S (2013) Assess-ment of ecosystem services in homegardensystems in Indonesia, Sri Lanka, and Vietnam. EcosystServ 5:124–136
Molina MR, Noguera A, Dary O, Chew F, Valverde C (1993) Principal micronutrient deficiencies in Central America. Food NutrAgric 7:26–33
Nair PLR, Garrity D (2012) Agroforestry: The Future of Global Land Use. Springer, Gainesville
Nevins J, Peluso NL (2008) Taking Southeast Asia to Market: Com-modities, Nature, and Peoplein the Neoliberal Age. Cornell Uni-versity Press, Ithaca
Niñez V (1987) Household gardens: Theoretical and policy considera-tions. Agric Syst 23:167–186
Parikesit SH, Triharynto E, Gunawan B, Sunardi AOS, Ohtsuka R (2005) Multi-source water pollution in the Upper Citarum Water-shed, Indonesia, with Special reference to its spatiotemoporal variation. Environ Sci 12(3):121–131
Paris B (2013) Investigating the relationship between agro-forestry and food sovereignty in dryland context of Niger. MSc Thesis, Development and Planning Unit, University College London
Sustainability Science
1 3
Patel R (2009) Food sovereignty. J Peasant Stud 36(3):663–706. https ://doi.org/10.1080/03066 15090 31430 79
Pingali PL (1997) From subsistence to commercial production sys-tems: the transformation of Asian agriculture. Am J Agr Econ 79(2):628–634
Rafani I (2014) The Law No. 18/2012 governing food security in Indo-nesia. FFTC Agricultural Policy Articles. Accessed 24 July 2018. https ://ap.fftc.agnet .org/ap_db.php?id=182.
Reardon T, Timmer CP, Minten B (2012) Supermarket revolution in Asia and emerging development strategies to include small farmers. PNAS 109(31):12332–12337. https ://doi.org/10.1073/pnas.10031 60108
Ren H, Folmer H (2017) Determinants of residential satisfaction in urban China: A multi-group structural equation analysis. Urban Stud 54:1407–1425
Rooduijn B, Bongers F, van der Wal H (2017) Wild native trees in trop-ical homegardens of Southeast Mexico: fostered by fragmentation, mediated by management. Agr Ecosyst Environ 254:149–161
Soemarwoto O (1984) The talun-kebun system, a modified shifting cultivation in West Java. Environ 4 (Supp No. 7): 96–98
Soemarwoto O, Christanty L (1985) Homegarden in the tropics. In: Proceedings of the First International Worshop on Tropical Homegarden, Bandung, Indonesia, December 2–9, Institute of Ecology, Padjadjaran University and United Nations University, Tokyo
Suparman Y, Folmer H, Oud JHL (2016) The willingness to pay for in-house piped water in urban and rural Indonesia. Papers Reg Sci 95:407–426
Tarahita D, Zulfikar M (2018) Indonesia’s Citarum: the world’s most polluted river. The Diplomat, 28 April. Accessed 24 July 2018. https ://thedi ploma t.com/2018/04/indon esias -citar um-the-world s-most-pollu ted-river /
von Braun J, Bouis H, Kennedy ET (1994) Conceptual framework. In: Agricultural Commercialization, Economic Development and Nutrition. In: von Braun J, Kennedy ET (eds.) John Hopkins Uni-versity Press, Baltimore
Wright S (2014) Food sovereignty in practice: a study of farmer-led sustainable agriculture in the Philippines. In: Andrée P, Ayres J, Bosia MJ, Massicotte MJ (eds.). Globalization and Food Sover-eignty: Global and Local Change in the New Politics of Food. University of Toronto Press, Toronto
Publisher’s Note Springer Nature remains neutral with regard to jurisdictional claims in published maps and institutional affiliations.