
STELLINGEN - WUR eDepot
147
STELLINGEN I -SDO^) 1. De vorm van een IgGmolecuul kan gebruikt worden om zijn orientatie op een oppervlak te sturen. Dit proefschrift. 2. Gedeeltelijk voorcoaten van een oppervlak is een effectieve manier om de conformatie van geadsorbeerd IgG te controleren. Dit proefschrift. 3. De grote herseninhoud van mensen heeft niet alleen temaken met denkvermogen maar duidt vooral op het vermogen om in een ingewikkelde sociale structuur te leven. Barton, ILA., Prvc. R. Soc. Lond. B (1998) 265, 1933. 4. Als de opheldetingvan de structuur van DNA door Watson, Crick, Wilkins en Franklin een mijlpaal is in dewetenschap, dan is het in kaart brengen van het menselijk genoom slechts een hectometerpaal op weg naar een volgende mijlpaal. 5. Een land dat ouderen die in een sociaal isolement verkeren niets anders biedt dan depilvan Drion leeft in een enorme armoede. 6. De daklozenkrant is een volwaardig tijdschrift en zou door meer mensen op zijn juiste waarde geschat worden indien het blad in de boekhandel verkocht zou worden. Stellingen behorende bij het proefschrift "Immunoglobulin adsorption on modified surfaces". M.G.E.G. Bremer, Wageningen, 25 juni 2001.
-
Upload
khangminh22 -
Category
Documents
-
view
0 -
download
0
Transcript of STELLINGEN - WUR eDepot
STELLINGEN
I -SDO^)
1. De vorm van een IgG molecuul kan gebruikt worden om zijn orientatie op een oppervlak te sturen.
Dit proefschrift.
2. Gedeeltelijk voorcoaten van een oppervlak is een effectieve manier om de conformatie van geadsorbeerd IgG te controleren.
Dit proefschrift.
3. De grote herseninhoud van mensen heeft niet alleen te maken met denkvermogen maar duidt vooral op het vermogen om in een ingewikkelde sociale structuur te leven.
Barton, ILA., Prvc. R. Soc. Lond. B (1998) 265, 1933.
4. Als de opheldeting van de structuur van DNA door Watson, Crick, Wilkins en Franklin een mijlpaal is in de wetenschap, dan is het in kaart brengen van het menselijk genoom slechts een hectometerpaal op weg naar een volgende mijlpaal.
5. Een land dat ouderen die in een sociaal isolement verkeren niets anders biedt dan de pil van Drion leeft in een enorme armoede.
6. De daklozenkrant is een volwaardig tijdschrift en zou door meer mensen op zijn juiste waarde geschat worden indien het blad in de boekhandel verkocht zou worden.
Stellingen behorende bij het proefschrift "Immunoglobulin adsorption on modified surfaces".
M.G.E.G. Bremer, Wageningen, 25 juni 2001.
IMMUNOGLOBULIN ADSORPTION
ON MODIFIED SURFACES
CENTRALE LANDBOUWCATALOOUS
0000 0872 2775

Promotor: prof. dr. J. Lyklema emeritus hoogleraar in de Fysische Chemie, met bijzondere aandacht voor de Grensvlak- en Kolloi'dchemie
Co-promotoren: dr. ir. W. Norde universitair hoofddocent bij de leerstoelgroep Fysische Chemie en Kolloidkunde
dr. ir. T.A.M Beumer senior scientist physics bij Organon Teknika BV
Samenstelling promotiecommissie:
prof. dr. M.A. Cohen Stuart prof. dr. E.J.R. Sudholter prof. dr. AJ.W.G. Visser prof. dr. K. Nicolay
(Wageningen Universiteit) (Wageningen Universiteit) (Vrije Universiteit Amsterdam) (Universiteit Utrecht)

IMMUNOGLOBULIN ADSORPTION
ON MODIFIED SURFACES
M.G.E.G. Bremer
Proefschrift ter verkrijging van de graad van doctor op gezag van de rector magnificus van Wageningen Universiteit, prof. dr. ir. L. Speelman, in het openbaar te verdedigen op maandag 25 juni 2001 des namiddags te vier uur in de Aula.
tl i ^'z

Bremer, M.G.E.G.
Immunoglobulin adsorption on modified surfaces / Bremer, M.G.E.G. Thesis Wageningen University
ISBN 90-5808-440-x
Subject headings: immunoglobulins / block copolymers / adsorption
The research described in this thesis was supported financially by Organon Teknika BV Boxtel.

Table of Contents
Chapter 1 - General Introduction Abstract 1
1.1 Introduction 2
1.1.1 The immune system, antibodies and antigens 2
1.1.2 Applications, immobilisation and biological activity 3
1.2 Factors determining physical adsorption of IgG 4
1.2.1 Immunoglobulin G 5
1.2.2 Interactions involved in physical adsorption of proteins 6
1.3 Size-exclusion adsorption 9
1.4 Outline of this thesis 10
1.5 References 13
Chapter 2 - Electrostatic interactions between IgG molecules and a charged sorbent surface Abstract 15
2.1 Introduction 16
2.1.1 DLVO theory 17
2.2 Experimental 19
2.2.1 Proteins 19
2.2.2 Chemicals 20
2.2.3 Surfaces 20
2.2.4 Refiectometry 20
2.2.5 Biological activity 21
2.3 Results and discussion 22
2.3.1 DLVO calculations 22
2.3.2 IgG adsorption 23
2.3.3 Initial adsorption rate 24
2.3.4 Maximum adsorbed amount 25
2.3.5 Desorption 27
2.3.6 Biological Activity 28
2.4 Conclusion 29
2.5 References 30

Chapter 3 - 'Molecular sieving': oriented IgG adsorption on (block copolymer) precoated surfaces Abstract 33
3.1 Introduction 34
3.2 Size-and shape exclusion phenomena in IgG adsorption 34
3.2.1 Manipulating initial IgG orientation upon adsorption 34
3.2.2 Manipulating IgG orientation after initial adsorption 37
3.3 Model calculations 37
3.4 Materials and methods 40
3.4.1 Proteins 40
3.4.2 Chemicals 40
3.4.3 Surfaces 41
3.4.4 Reflectometry 41
3.4.5 Biological activity 42
3.5 Results and discussion 42
3.5.1 IgG layers 42
3.5.2 Triblock copolymer layers 46
3.5.3 IgG adsorption on pre-adsorbed P75 layers 48
3.6 Conclusion 50
3.7 References 51
Chapter 4 - ATR-FTIR study of IgG adsorbed on different silica surfaces Abstract 53
4.1 Introduction 54
4.2 Materials and Methods 55
4.2.1 Proteins 55
4.2.2 Surfaces 56
4.2.3 Other solutions 56
4.2.4 FT-IR measurements 56
4.3 Results and Discussion 57
4.3.1 Structural Analysis 57
4.3.2 Adsorbed amount 71
4.4 Conclusions 72
4.5 References 74
Chapter 5 - Structural changes of IgG induced by heat treatment and by adsorption onto a hydrophobic surface studied by Circular Dichroism Spectroscopy Abstract 76
5.1 Introduction 77
5.2 Materials and methods 80
5.2.1 Immunoglobulin 80
5.2.2 Teflon particles 80
5.2.3 Adsorption of IgG onto Teflon 81
5.2.4 Differential Scanning Calorimetry 81
5.2.5 Circular Dichroism measurements 81
5.2.6 Circular Dichroism Spectral Analysis 82
5.3 Results and Discussion 82
5.3.1 Thermal unfolding of IgG 82
5.3.2 Heat induced changes in the secondary structure of IgG 84
5.3.3 Adsorption characteristics of IgG 89
5.3.4 Heat induced changes in the secondary structure of adsorbed IgG 90
5.4 Conclusions 94
5.5 References 95
Chapter 6 - Influence of pre-adsorbed (block copolymer) molecules on IgG conformation Abstract 99
6.1 Introduction 100
6.2 Experimental 101
6.2.1 Materials 101
6.2.2 Method 102
6.3 Results 103
6.3.1 IgG conformation as a function of its surface coverage. Absence
of pre-adsorbed polymer 103
6.3.2 IgG conformation on a triblock copolymer precoated surface 106
6.3.3 Biological activity of IgG adsorbed on precoated surfaces 109
6.3.4 Effect of adsorption conditions on IgG conformation 109
6.4 Conclusion I l l
6.5 References 112
Chapter 7 - Oriented IgG adsorption induced by a 'molecular sieve' in a microplate assay Abstract 115
7.1 Introduction 116
7.2 Theoretical aspects of 'molecular sieving' and its effect on subsequent
IgG adsorption 117
7.3 Experimental 119
7.3.1 Materials 119
7.3.2 Method 120
7.4 Results 123
7.4.1 Non-specific adsorption 123
7.4.2 IgG adsorption 126
7.4.3 The specific activity and binding capacity of adsorbed IgG 129
7.5 Conclusions 131
7.6 References 133
Summary 135
Samenvatting 139
Curriculum Vitae 145
Nawoord 147
Chapter 2 - submitted t o / . Colloid Interface Science
Chapter 3 - submitted to Langmuir
Chapter 4 - Carla E. Giacomelli, Maria G.E.G. Bremer, and Willem Norde
/ . Colloid and Interface Science (1999) 220, 13
Chapter 5 - A.W.P. Vermeer, M.G.E.G. Bremer and W. Norde
Biochimica etBiophysica Acta (1998) 1425, 1
Chapter 6 - submitted to Langmuir
Chapter 7 - submitted to Analytical Chemistry
Chapter 1
GENERAL INTRODUCTION
Abstract
Monoclonal antibodies are highly selective molecules that are widely used as the
sensing elements in a range of technical and medical applications. In many of
these, antibodies are physically adsorbed onto solid surfaces. The interactions
involved in physical adsorption of proteins are described. Physical adsorption
often results in an undesired loss of biological activity. In this thesis, a novel
approach for controlling the physical adsorption of antibodies, and consequently
their biological activity is introduced. This method is based only on the non-
spherical shape of the immunoglobulins. Finally, an outline of this thesis is given.
Chapter 1
1.1 Introduction
/. /. / The immune system, antibodies and antigens
The immune system, which is specific to vertebrates, is a sophisticated defensive
mechanism which offers protection against foreign substances like microorganisms
and viruses. An important role in this system is played by a special kind of soluble
proteins, immunoglobulins, which function as antibodies. Antibodies are produced
by differentiated blood cells in response to the presence of foreign material.
Foreign substances that induce the formation of antibodies are called antigens.
Antibodies have the unique feature of recognizing and specifically binding the
antigen that initially caused its synthesis. In this way, antibodies act as the
recognition elements of the humoral immune response. The binding of the antigen
by the matching antibody initiates processes that inactivate and eliminate the
antigen.
Each antibody-producing cell is capable of making only one unique type of
antibody. Since many different antibody-producing cells are involved in the
immune response, serum (the aqueous part of blood) contains a mixture of various
types of antibodies, i.e. polyclonal antibodies. From a biological point of view,
polyclonal antibodies increase the probability of binding intruding antigens and
thus improve the protection against infections. However, in research and industrial
applications the using of polyclonal antibodies shows several disadvantages, e.g. a
lack of specificity and variable composition of the antibody mixture. In 1975,
Milstein and Kohler [1] developed the hybridoma technique, which enables the
production of large amounts of antibodies of one single molecular species
(monoclonal antibodies) by fusing a single antibody-producing cell with a single
tumor cell. In this way, series of monoclonal antibodies directed against one
particular antigen can be produced, and for each particular application those
antibodies that are most suited can be selected.
Due to their high specificity and sensitivity, monoclonal antibodies have proven to
be excellent probes for the recognition of, among others, proteins, peptides, lipids,
and hormones. Nowadays, they are widely used in a range of technical and medical
applications including affinity columns for preparative purification of protein
mixtures or for separating different molecular forms of a protein, and in consumer
goods like toothpaste and shampoo to inactivate the microorganisms that cause
caries and dandruff, respectively. In medical practice, monoclonal antibodies are
used to locate and possibly destroy tumor cells. Another group of health care
applications is the use of monoclonal antibodies in in-vitro diagnostic tests. Here,
one of the large-scale applications is that of screening blood, e.g. in blood banks,

General Introduction
for the presence of diseases like HIV and hepatitis. Another, less life-threatening
application is the detection of the human pregnancy hormone [2,3].
It may be concluded that monoclonal antibodies play an increasingly important
role in many disciplines, including biomedical engineering, biotechnology and
environmental science.
1.1.2 Applications, immobilisation and biological activity
Many applications of antibodies require these to be attached onto solid surfaces in
order to facilitate the concentration and visualisation of antibody-antigen
complexes. Applications mainly involve immunoglobulin G (IgG) because this is
the principal antibody in serum. In immunoassays such as Enzyme-Linked
Immunosorbent Assay (ELISA) [4,5] and latex agglutination assays, [6,7] IgG is
often immobilized (attached) to polystyrene micro titer wells or -particles. To
achieve high sensitivity in applications maximized biological activity of the
immobilized immunoproteins is a necessity. The biological activity of IgG is
defined as the number of molecules of antigen bound per molecule of IgG. As the
structure of IgG molecules is such that one molecule of IgG can bind two
molecules of antigen the maximum value for the biological activity is two.
F(ab)2 £&
777777777777} C
Figure 1.1: The effect of physical adsorption on the biological activity of IgG (schematic). (A) Optimal orientation and conformation and, hence, maximal biological activity. (B) Reduced activity caused by conformational changes or (C) reduced accessibility of antigen binding sites. The antigen binding sites are represented by the white dots at the top of the F(ab) parts.
The predominant immobilization procedure in industrial applications is physical
adsorption, mainly because it is relatively easy to perform. Physical adsorption,
however, often results in an undesired loss of biological activity [5,8]. This loss of
activity may be caused by changes in the specific folding (the conformation) of the
antibody or by a reduced accessibility of the antigen binding sites by blocking
(figure 1.1). The antigen binding sites become inaccessible for antigens when they
Chapter 1
are too close to the sorbent surface, for instance when the IgG molecules are
adsorbed with their antigen binding sites oriented towards the sorbent surface. To
overcome these problems several alternative immobilization techniques for IgG
have been developed. Thereby it is tried to force the antigen binding parts towards
the solution and hence, keeping them accessible to bind antigens. These techniques
include covalent coupling [8] of the IgG molecules to the solid surface,
streptavidine bridging [5], immobilisation using a previously adsorbed antiglobulin
[5] or protein A [9]. Although some of these techniques have been reported to
increase the average biological activity of IgG molecules, they may also introduce
new complications: more costly manufacturing procedures, the need for expensive
chemicals and dedicated solid surfaces, to mention some.
This leads us to the c entral t h e m e of this thesis:
Controlling the orientation and conformation of adsorbing IgG molecules to
achieve optimum biological activity of the adsorbed layer avoiding chemical
modification of the IgG molecule or the solid surface. In this thesis we present a
new method to achieve oriented physical adsorption of IgG. This concept is based
on the anisodimensionality of IgG molecules and resembles 'molecular sieving' on
the sorbent surface.
1.2 Factors determining physical adsorption of IgG
In order to control and manipulate the adsorption process, the characteristics of
the IgG molecules and the relevant interactions between the different components
in the system (i.e. the IgG molecules, the solvent, the solutes, pre-adsorbed
molecules and the solid surface) must be understood.
General Introduction
1.2.1 Immunoglobulin G
antigen
*p binding
F(ab) "K
t 7„m ^mr Fc
4 polypeptide chains ^ T Secondary structure of 1&
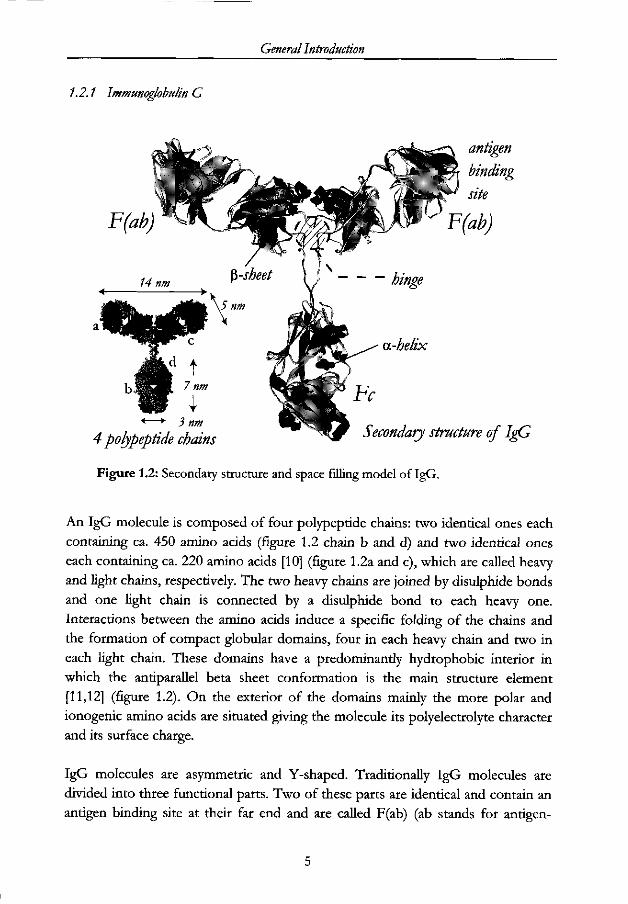
Figure 1.2: Secondary structure and space filling model of IgG.
An IgG molecule is composed of four polypeptide chains: two identical ones each
containing ca. 450 amino acids (figure 1.2 chain b and d) and two identical ones
each containing ca. 220 amino acids [10] (figure 1.2a and c), which are called heavy
and light chains, respectively. The two heavy chains are joined by disulphide bonds
and one light chain is connected by a disulphide bond to each heavy one.
Interactions between the amino acids induce a specific folding of the chains and
the formation of compact globular domains, four in each heavy chain and two in
each light chain. These domains have a predominantly hydrophobic interior in
which the antiparallel beta sheet conformation is the main structure element
[11,12] (figure 1.2). On the exterior of the domains mainly the more polar and
ionogenic amino acids are situated giving the molecule its polyelectrolyte character
and its surface charge.
IgG molecules are asymmetric and Y-shaped. Traditionally IgG molecules are
divided into three functional parts. Two of these parts are identical and contain an
antigen binding site at their far end and are called F(ab) (ab stands for antigen-
Chapter 1
binding, F for fragment). The antigen binding site is formed by combined regions
in the N-terminal domains on the light and heavy chains. The third part, called Fc
(because it crystallises readily) does not bind antigens but has other biological
functions such as attaching the molecule to receptors on foreign cell walls. The
three fragments are joined by a hinge. This hinge allows variation in the angle
between the two F(ab) units [10]. The whole IgG molecule, the top part of the
molecule (i.e., the two linked F(ab) fragments), and the bottom part (i.e., the Fc
part) have a molecular weight of 150 kDa, 100 kDa and 50 kDa, respectively.
1.2.2 Interactions involved in physical adsorption of proteins
The Derjaguin-Landau-Verwey-Overbeek (DLVO) theory [13,14] has often been
used to describe interactions between biological colloids [15,16]. Had the long-
range electrostatic double layer forces and van der Waals forces been the sole
forces between proteins and surfaces, such an application would have been
appropriate. However, protein-surface interactions are complicated by additional
non-DLVO contributions such as solvent structure mediated forces [16,17] and
structural rearrangements [18,19]. Although these forces are generally short-range,
i.e. acting within separations of a few nm, they can have a dominating impact.
Therefore, we will use DLVO theory to describe only the long-range interactions
between an IgG molecule and a sorbent surface.
In general, interactions between proteins and surfaces involve the following major
contributions: [20-22] (a) electrostatic interactions between the protein and the
sorbent, (b) London-van der Waals interactions, (c) dehydration of (hydrophobic)
parts of the adsorbent and/or protein molecules and (d) structural rearrangements
in the protein molecule.
Protein adsorption is promoted by those interactions that lead to a decrease in the
Gibbs energy of the system upon adsorption. This means that interactions that
decrease the enthalpy and/or increase the entropy of the system (at constant
temperature and pressure) promote protein adsorption. A brief description of
electrostatic interactions, van der Waals interactions, hydrophobic dehydration and
structural rearrangements will be given below.
Electric double layer interactions
In most systems both the protein molecule and the sorbent surface are electrically
charged. These surface charges are fully compensated by an excess of counterions
and a deficit of co-ions in the adjoining solution. As a rule, a fraction of the
counter ions and co-ions is specifically adsorbed on the surface. The surface

General Introduction
charge, together with its countercharge, forms an electric double layer and as a
whole the system is electroneutral. Upon adsorption of the IgG molecule the
double layers of the molecule and the sorbent surface overlap, giving rise to
electrostatic interaction. Yet, accumulation of net charge in the protein-sorbent
contact region is highly unfavourable due to the non-aqueous character of this
region. The charge density in this region may be regulated by charge adjustment on
the protein [23] and/or the sorbents surface or by the uptake of low molecular
weight ions in this region [24]. However, this uptake of ions from an aqueous
environment into the non-aqueous region is chemically unfavorable. In general,
electrostatic interactions stimulate adsorption when the protein and the surface
have opposite charge sign and when the charge density on the protein just matches
that on the sorbent surface [20].
Ijondon-Van der Waals interaction
For macrobodies (except for highly polar materials) the London-van der Waals
interaction is the most dominant term in the van der Waals interaction [25]. In
gases, London-van der Waals, or dispersion, forces originate from the correlation
between time dependent dipoles in atoms or molecules and depends only on the
polarisabilities of the interacting molecules. The London-van der Waals interaction
between two atoms is relatively weak and short ranged. For macroscopic bodies,
however, the dispersion forces are to a large extent additive and therefore longer
ranged [26]. The London-van der Waals interaction between two macrobodies
depends on the radii of the interacting particles, their distance of separation and
the so called Hamaker constant. In the Hamaker constant the molecular properties
of the materials involved are accounted for, i.e., the polarisabilities and densities of
the interacting particles. The value of the Hamaker constant is hard to assess and
often an approximation is used.
In aqueous media usually the Hamaker constant has a positive value and this
implies attraction between the interacting particles.
Water structure-mediated interaction
Surfaces immersed in aqueous solutions are covered by a thin layer of water
molecules that are restricted in their orientation and position [25]. These
structurised adjacent water layers give rise to an interaction when two surfaces
approach each other. These water structure-mediated forces are sometimes called
hydrophobic forces when they are attractive and hydration forces when they are
repulsive.
Chapter 1
Water molecules, adjoining non-polar groups at the exterior of proteins and
hydrophobic surfaces, posses a higher degree of ordering than those in the bulk
and hence their molar entropy is lower. Dehydration of such hydrophobic patches
upon interaction results in increasing the entropy of the water molecules and
therefore this phenomenon promotes protein adsorption at hydrophobic surfaces
[20].
On the other hand, adsorption of proteins at a hydrophilic surface may be
hindered by the hydration layers of ionic or polar functional groups at both
surfaces [27]. When such surfaces approach each other partial dehydration of the
ions and the polar surface would have to occur leading to an increase in the Gibbs
energy and, hence, to repulsion.
Structural rearrangements in the protein
Upon adsorption changes in the environment of a protein molecule occurs, i.e. the
protein molecule is not longer solely exposed to water but also to the sorbent
surface. Therefore, the apolar parts that originally were situated at the interior of
the protein may now become exposed to (hydrophobic parts of) the sorbent
surface without making unfavourable contact with the water. This means that the
intra-molecular interactions, that form the basis of the secondary structure of
proteins, may be exchanged by interactions between the molecule and the surface.
If such protein-surface interactions are profitable this will result in a decrease in
secondary structure (and a favourable increase in conformational entropy of the
protein) [21]. On the other hand, if favourable interactions between peptide units
and the surface are not possible this may induce the formation of extra intra
molecular interactions, and in this way promote the formation of ordered structure
[28]. It is clear, that structural rearrangements are determined by an intricate
interplay of all the components in the system.
All the interactions between proteins and surfaces mentioned above may play
important roles in the adsorption process. These interactions have been
extensively studied [20-22,25] and many attempts have been made to apply the
insight into these interactions to controlling the orientation of IgG molecules upon
and after adsorption. However, in attempting to let the IgG molecules adsorb
upright one aspect of these molecules, viz. their 'Y'-shape, has not yet been
exploited. In this thesis we present a new method to achieve oriented physical
adsorption of IgG. Our method is based on a further consideration of the
molecular dimensions and it resembles 'molecular sieving' on a sorbent surface.
We will call it size-exclusion adsorption and it will be explained below. Based on

General Introduction
this principle, a very simple procedure for the oriented immobilization of IgG will
be elaborated rendering complicated chemical or biochemical modifications of the
surface or the immunoglobulins redundant.
1.3 Size-exclusion adsorption Physical adsorption of proteins can take place only when there is sufficient free
space available on the surface and when the individual areas of uncovered
adsorbate are sufficiently large to accommodate an individual protein molecule. By
pre-coating a surface with polymers, proteins or other molecules the surface
becomes partially blocked for further adsorption. At a properly selected surface
coverage, only relatively small uncovered areas remain available to subsequendy
adsorbing proteins. Only those molecules that fit in these uncovered areas are able
to adsorb when the size distribution of individual areas excludes larger molecules.
In other words, a molecular sieve is created which induces a size-exclusion
adsorption.
Such size-exclusion adsorption may also be extended to protein molecules of one
and the same type that are anisodimensional, i.e. consisting of parts having
different properties: the smaller part may attach whereas accommodation at the
sorbent surface of the larger part may be obstructed (figure 1.3a). Under these
circumstances, size-exclusion adsorption essentially becomes shape-exclusion
adsorption. As mentioned above, a typical example of such an asymmetrical
molecule is the Y-shaped IgG; the larger part (F(ab)2) consists of two similar
domains that bind antigens whereas the smaller part (Fc) only mediates effector
functions. As a result of the difference in the biological function of the two parts,
size-exclusion adsorption of IgG may lead to a more advantageously oriented and
correspondingly to a biologically more active layer.
Chapter 1
F(ab) 2
(b)
{a)^Jk " ^
77777777777777777777777777. 777
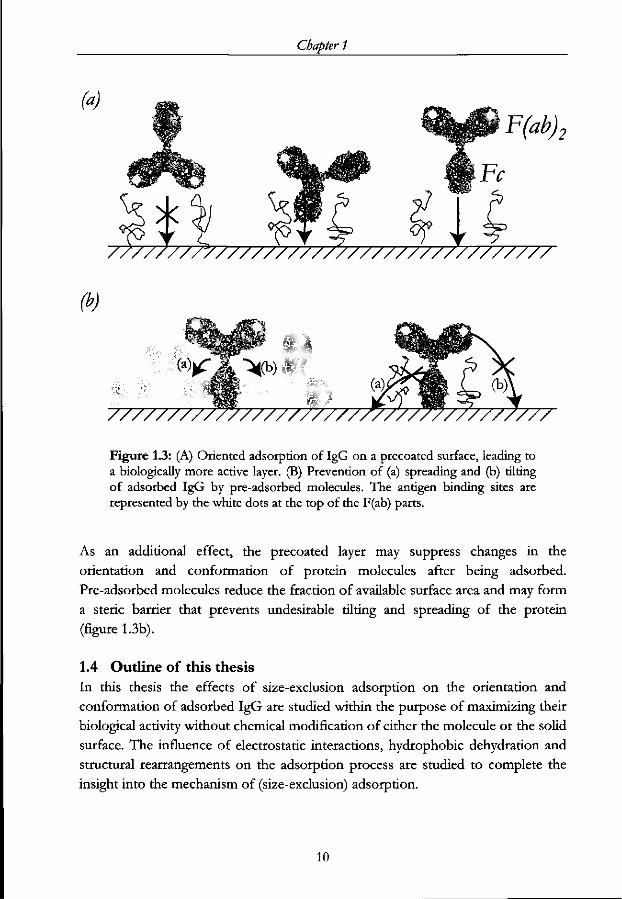
Figure 1.3: (A) Oriented adsorption of IgG on a precoated surface, leading to a biologically more active layer. (B) Prevention of (a) spreading and (b) tilting of adsorbed IgG by pre-adsorbed molecules. The antigen binding sites are represented by the white dots at the top of the F(ab) parts.
As an additional effect, the precoated layer may suppress changes in the
orientation and conformation of protein molecules after being adsorbed.
Pre-adsorbed molecules reduce the fraction of available surface area and may form
a steric barrier that prevents undesirable tilting and spreading of the protein
(figure 1.3b).
1.4 Outline of this thesis
In this thesis the effects of size-exclusion adsorption on the orientation and
conformation of adsorbed IgG are studied within the purpose of maximizing their
biological activity without chemical modification of either the molecule or the solid
surface. The influence of electrostatic interactions, hydrophobic dehydration and
structural rearrangements on the adsorption process are studied to complete the
insight into the mechanism of (size-exclusion) adsorption.
10
General Introduction
The monoclonal IgG molecules used in this study are directed against human
chorionic gonadotropin (hCG). hCG is a hormone produced by the placenta
during pregnancy. This hormone is found in pregnant woman's urine and
pregnancy tests are designed to detect it [2,3]. The use of monoclonal IgG offers
the advantage of studying a system that has well-defined physical properties.
In chapter 2 we study the prospect of using the dipolar character of IgG
molecules to control their orientation upon adsorption. The influence of
electrostatic interactions on the adsorption of IgG is examined both theoretically
and experimentally. The long range interaction between IgG and the sorbent
surface is treated in terms of the DLVO theory. Reflectometry experiments for
adsorption are performed on hydrophilic surfaces and the electrostatic interactions
are investigated using pH and ionic strength as the experimental variables.
In chapter 3 we describe the theoretical aspects of size-exclusion adsorption and
report a set of experiments demonstrating the influence of the non-spherical
molecular shape of IgG on its adsorption on surfaces partially covered with
pre-adsorbed layers of either IgG or triblock copolymers of poly(ethylene oxide),
PEO, and polypropylene oxide), PPO, of the type PEO-PPO-PEO. The effect of
these layers on the biological activity of adsorbed IgG is studied by choosing the
surface coverage of the sorbent by the pre-adsorbed layer as the experimental
variable. We monitored the adsorption process by reflectometry which allows us to
study the effect of adsorption kinetics on the biological activity of adsorbed IgG.
In chapters 4, 5 and 6 conformational changes in IgG are studied. In chapter 4 a
structural analysis of one monoclonal IgG adsorbed on different silica surfaces
(hydrophilic, hydrophobic, hydrophobic with pre-adsorbed triblock copolymers)
using ATR-FTIR spectroscopy is given. These experiments were carried out using
a cylindrical internally reflecting silicon element that has been covered with a silica
surface layer. For comparison purposes, experiments were also carried out with
bovine serum albumin (BSA).
In chapters 5 and 6, Circular Dichroism (CD) is used as a spectroscopic technique
for studying protein structure. Chapter 5 gives information on the structural
changes of IgG molecules induced by heat treatment and compares these changes
with those induced by adsorption on a hydrophobic surface. Prior to discussing
the CD measurements, the thermal stability of IgG, as determined by differential
scanning calorimetry (DSC), is presented. In chapter 6 the effect of pre-adsorbed
11
Chapter 1
layers on the secondary structure of adsorbed IgG is studied by choosing the
surface coverage of the sorbent by the pre-adsorbed layer as the experimental
variable. In addition, the effect of adsorption conditions, such as pH and
adsorption time on the secondary structure is studied.
In chapter 7 we examine whether the favourable results of size-exclusion
adsorption obtained in our reflectometry model system (chapter 3) also apply to
industrial diagnostic methods. We implemented the triblock copolymer pre-
adsorption procedure in an assay designed for the early diagnosis of pregnancy.
Radioactively labeled IgG and hCG molecules made it possible to monitor the
adsorption of IgG and the subsequent binding of hCG. The data obtained are in
agreement with our earlier model studies and demonstrate that sieving of the IgG
by the polymer does takes place resulting in the creation of a more favourably
oriented IgG layer.
12
General Introduction
1.5 References 1. Kohler, G., and Milstein, C. (1975) Nature 256, 495.
2. Frances, R., and Batzer, M.D. (1980) Fertil. Steril. 34,1.
3. Konings, B.L.J.C, Pelssers, E.G.M., Verhoeven, A.J.C.M., and Kamps,
K.M.P. (1993) Colloids Surf. B 1, 69.
4. Engvall, E., and Perlmann, P. (1971) Immunochemistry 8, 871.
5. Buder, J.E., Ni, L., Nessler, R., Joshi, K.S., Suter, M., Rosenberg, B., Chang,
J., Brown, W.R., and Cantarero, L.A. (1992)/. Immunol. Methods 150,11.
6. Singer, J.M., and Plotz, CM., (1956) Am. J. Med. 21, 888.
7. Ortega-Vinuesa, J.L., Hidalgo-Alvarez, R., de las Nieves, F.J., Davey, C.L.,
Newman, D.J., and Price, C.P (1998)/. ColloidInterf. Sri. 204, 300.
8. Molina-Bolivar, J.A., Galisteo-Gonzalez, F., and Hidalgo-Alvarez, R. (1998)
/ . Biomater. Sri. Polymer Edn. 9 (10), 1089.
9. Murata, M., Arakawa, M., Yoshida, T., and Hato, M. (1998) Colloids and Surf.
B 12, 35.
10. Bagchi, P., and Birnbaum, S.M. (1981) / . Colloid Interf. Sri. S3, 460.
11. Amzel, L. M., and Poljak, R. J. (1979) Annu. Rev. Biochem. 48, 961.
12. Padlan, E. A. (1994) Mol. Immunol. 31,169.
13. Derjaguin, B.V., and Landau, L.D. (1941) Acta Physicochim. USSR 11, 633.
14. Verwey, E.J.W., and Overbeek, J.T.G., Theory of the Stability of lyophobic
Colloids, (Elsevier, 1948).
15. Molina-Bolivar, J.A, and Ortega-Vinuesa, J.L (1999) Langmuir 15, 2644.
16. Leckband, D., and Sivasankar, S. (1999) Colloids Surf. B 14, 83.
17. Molina-Bolivar, J.A., Galisteo-Gonzalez, F. and Hidalgo-Alvarez, R. (1999)
Colloids Surf. B 14,3.
18. Vermeer, A.W.P., Bremer, M.G.E.G., and Norde, W. (1998) Biochim. Biophys.
Acta 1425, 1.
19. Geddes, N.J., Furlong, D.N., Zientek, P., Than, K.A., and Edgar, J.A. (1993)
/ . Colloid Interf. Sri. 157, 491.
20. Norde, W. (1986) Adv. Colloid Interf. Sri. 25, 26.
21. Norde, W. (1998) Biopolymers at interfaces, Driving forces for protein adsorption at
solid surfaces, Vol. 75, Marcel Dekker, Inc., New York.
22. Hayes, C.A., and Norde, W. (1994) Colloids Surf. B2,5\l.
23. Hayes, C.A., Sliwinski, E., and Norde, W. (1994) / . Colloid Interf Sri. 164,
394.
24. Van Dulm, P., Norde, W., and Lyklema, J. (1981) / . Colloid Interf. Sri. 82,11.
25. Israelachvili, J.N., Intermodular and Surface forces, (2nd ed., Academic Press,
New York, 1992).
13
Chapter 1
26. Lyklema, J. Fundamentals of Interface and Colloid Science, Vol I Fundamentals
(Academic Press, London, 1991).
27. Pashley, R.M. (1981)/. Colloid Interf. Sci. 83, 531.
28. Zoungrana, T., Findenegg, G.H., and Norde, W. (1997) / . Colloid Interf. Sci.
190, 437.
14

Chapter 2
ELECTROSTATIC INTERACTIONS BETWEEN I G G MOLECULES AND
A CHARGED SORBENT SURFACE
Abstract
In this chapter we study the prospect of using the dipolar character of IgG
molecules to control their orientation upon adsorption. The influence of
electrostatic interactions on the adsorption of IgG is examined theoretically and
experimentally. The long range interaction between IgG and the sorbent surface is
treated in terms of the DLVO theory. Experiments are performed on hydrophilic
surfaces, namely negatively charged silica and positively charged amine-
functionalised silica. It is concluded that electrostatic interactions have a strong
influence on the adsorption behaviour of IgG molecules on hydrophilic charged
surfaces. The relevant electrostatic interactions are a combination of interactions
between IgG and the sorbent surface and lateral interactions between adsorbed
IgG molecules. The electrostatic interactions between the IgG molecules and the
surfaces are relatively weak and cannot ensure permanent attachment of the
molecules. Due to extensive desorption of IgG from both surfaces, electric field-
induced orientation of IgG could not be established unambiguously.

Chapter 2
2.1 Introduction
The adsorption of proteins at interfaces is a widespread phenomenon in both
natural and man-made systems and it plays an important role in many disciplines,
including biomedical engineering, biotechnology and environmental science. For
instance, in various diagnostic test systems, such as ELISA [1,2], RIA [3,4] and
latex agglutination assays [5,6], immunoproteins are adsorbed at solid surfaces. The
use of immunoglobulin G (IgG) is of primary interest; it constitutes an important
part of the immune system because it recognises and specifically binds antigens.
The adsorption of immunoglobulins onto solid surfaces often results in a loss of
antigen binding specifity and/or capacity [2,7]. For optimal biological activity the
orientation and conformation of the adsorbed IgG molecule should allow the
antigen-binding sites to be accessible to antigens [8]. In order to control IgG
adsorption the interactions between proteins and interfaces must be understood.
Interactions between proteins and surfaces may be divided into the following
major contributions: [9,10] (a) electrostatic interaction between protein and
sorbent, (b) hydrophobic dehydration of parts of the adsorbent and/or protein
molecules, (c) structural rearrangements in the protein molecule and (d) van der
Waals interactions.
In this chapter we will focus on the electrostatic interactions between IgG
molecules and a charged sorbent surface. It should be realised that the IgG
molecules used in this study have a (large) dipole moment as the iso electric point
of its antigen binding parts (Fab) differs from that of its Fc part. We study the
prospect of using the dipolar character of the IgG molecules to control their
orientation upon adsorption. A molecular dipole placed in the electric field of a
sorbent surface at an angle relative to the field experiences a torque, which tends to
align the dipole along the field direction [11]. For such alignment to occur, the
complete dipole should be located within the field. This is the case provided the
penetration depth of the sorbent's electric field exceeds the dimensions of the
molecule. This penetration depth, however, strongly depends on the ionic strength
of the solution and may vary from values much larger than the size of an IgG
molecule down to values in the same order of magnitude. We will examine the
influence of electrostatic interactions on the adsorption behaviour of IgG both
theoretically and experimentally, following a colloid-chemical approach. The
interaction between the IgG molecule and the sorbent surface will be treated in
terms of the DLVO theory [12,13] for the interaction between a charged sphere
and a charged flat surface.
16

Electrostatic interactions between IgG molecules and a charged sorbent surface
Obtaining unambiguous experimental evidence on the contribution of electric
field-induced orientation of adsorbed molecules is far from trivial. In earlier work
[8,14-16] in this field, where charged dispersed hydrophobic surfaces were applied,
all possible interactions between protein molecules and a surface acted
simultaneously. It is generally found [9,17] that hydrophobicity of the sorbent
surface promotes structural changes in the adsorbed protein molecule. Therefore,
with hydrophilic surfaces electrostatic interactions are expected to play a dominant
role. This lead us to perform experiments using hydrophilic surfaces, namely
negatively charged silica and positively charged amine-functionalised silica. By
selecting appropriate pH and ionic strength values, we may be able to monitor the
role of electrostatic interactions. The adsorption process itself is followed in real
time by reflectometry [18]. The use of monoclonal IgG offers the advantage of
studying a system that has well-defined physical properties.
2.1.1 DLVO theory
The DLVO theory [12,13], developed to explain the roles of electric and van der
Waals contributions in colloidal stability, has often been used to describe the
interaction between biological colloids [8,19-21]. This theory describes the
interaction Gibbs energy between two macroscopic bodies as a function of their
separation. According to the DLVO theory the total interaction Gibbs energy is
the sum of the London-van der Waals interaction and the interaction resulting
from double layer overlap.
The DLVO theory has received considerable theoretical and experimental
attention. Agreement between theory and experimental data has been shown at
separations beyond a few nanometers. At shorter separations, however,
interactions are found to be complicated by non-DLVO interactions such as
solvent structure-mediated forces [19,22-24]. Therefore, we will use the DLVO
theory to describe only the long-range interactions between an IgG molecule and a
sorbent surface. Our experimental system will be modelled as a charged dipolar
sphere interacting with a charged flat surface.
ljondon-van der Waals interaction
For macrobodies (except for highly polar materials) the dispersion interaction is
the most dominant term in the van der Waals interaction [23]. In gases, London-
van der Waals, or dispersion, forces originate from the correlation between time-
dependent dipoles in atoms or molecules and depends only, on the polarisabilities
of the interacting molecules. The London-van der Waals interaction between two
atoms is relatively weak and short ranged. For macroscopic bodies, however, the
17

Chapter 2
dispersion forces are to a large extent additive and therefore longer ranged. Based
on additivity, according to the Hamaker-de Boer approximation [25] (pairwise
summation of the interaction energies between all interparticle molecule pairs)
some simple equations can be derived. For the interaction between a sphere and a
macroscopically flat surface interacting across a medium, the following
approximation has been established [25]:
G ww(* ) = — •*132 2R(x + R) ^
x(x + 2R)
x + 2R\ (2.1)
Where x is the distance of separation between the sphere and the surface and R the radius of the sphere. Al32 is the Hamaker constant for the system, where the
subscripts indicate the phases, with 1 the solid, 2 the particle and 3 the medium.
The Hamaker constant depends on the polarisabilities and densities of the
interacting bodies. The value of the Hamaker constant is hard to assess and often
an approximation is used. Tables of the values are listed in several references
[25,26]. The Hamaker constant for a more-phase system can be derived from the
individual Hamaker constants of the materials involved [25].
Electric double layer interaction
In most systems both the protein molecule and the sorbent surface are electrically
charged. These surface charges are fully compensated by an excess of counterions
and a deficit of co-ions in the adjoining solution. As a rule, a fraction of the
counter ions and co-ions is specifically adsorbed on the surface. The surface
charge, together with its countercharge, forms an electric double layer and as a
whole the system is electroneutral. When two charged species approach each
other, the electric double layers overlap. This results in repulsion if the particle and
the surface have the same charge sign and in attraction if the signs are opposite.
The simplest description of the diffuse part of the double layer is given by the
Gouy-Chapman theory [27,28]. In this theory it is assumed that the surface is flat
and uniformly charged, the ions in solution are point charges, distributed according
to Boltzmann and that the solvent is a structureless continuum.
In calculating the contribution of double layer interactions to the total interaction
energy one has to assume that either the electric potential or the electric charge
density at the interacting surfaces remains constant. Because of the relatively large
dimensions of the protein its diffusion rate towards the sorbent surface will be
18
Electrostatic interactions between IgG molecules and a charged sorbent surface
slow as compared to the relaxation rate of the electrical double layer. Therefore,
the assumption of constant potential seems appropriate. Double layer overlap is
governed by the diffuse part of the double layer; therefore the potentials needed in
the equations are the diffuse double layer potentials, which are usually
approximated by the experimentally accessible electrokinetic or ^ potential [29].
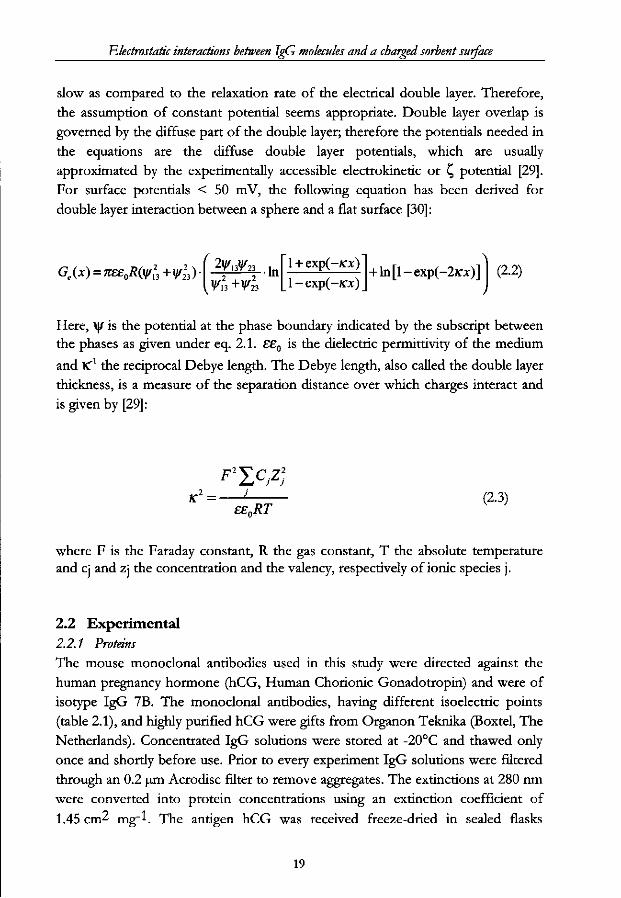
For surface potentials < 50 mV, the following equation has been derived for
double layer interaction between a sphere and a flat surface [30]:
Ge(x) = 7iee0R(y/23+y/223) •In 1 + exp(-KTjt)
1 - exp(-?cx) + ln[l-exp(-2K-x)] (2.2)
Here, \|/ is the potential at the phase boundary indicated by the subscript between the phases as given under eq. 2.1. ££0 is the dielectric permittivity of the medium
and K4 the reciprocal Debye length. The Debye length, also called the double layer
thickness, is a measure of the separation distance over which charges interact and
is given by [29]:
F^CJ2
K2=-££0RT
(2.3)
where F is the Faraday constant, R the gas constant, T the absolute temperature and ci and zj the concentration and the valency, respectively of ionic species j .
2.2 Experimental
2.2.1 Proteins
The mouse monoclonal antibodies used in this study were directed against the
human pregnancy hormone (hCG, Human Chorionic Gonadotropin) and were of
isotype IgG 7B. The monoclonal antibodies, having different isoelectric points
(table 2.1), and highly purified hCG were gifts from Organon Teknika (Boxtel, The
Netherlands). Concentrated IgG solutions were stored at -20°C and thawed only
once and shortly before use. Prior to every experiment IgG solutions were filtered
through an 0.2 um Acrodisc filter to remove aggregates. The extinctions at 280 nm
were converted into protein concentrations using an extinction coefficient of
1.45 cm2 mg~l. The antigen hCG was received freeze-dried in sealed flasks
19
Chapter 2
containing 550 IU (1 mg roughly equals 8000 IU) and stored at 7°C. Bovine serum
albumin (BSA) was purchased from Sigma Chemical Co.
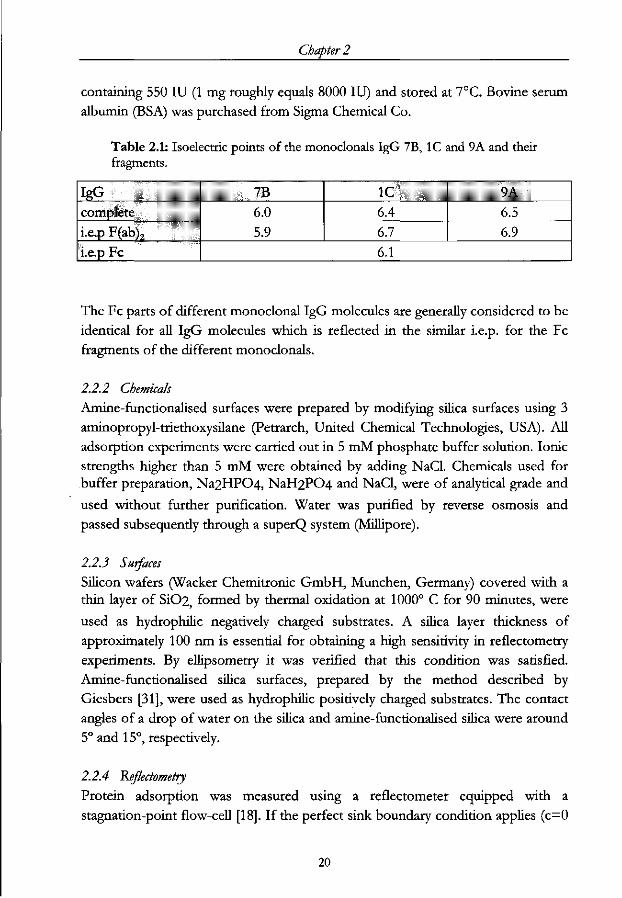
Table 2.1: Isoelectric points of the monoclonals IgG 7B, 1C and 9A and their fragments.
IgG 7B complete 6.0 i.e.p F(ab)7 5.9 i.e.p Fc
1C 6.4 6.7
9A 6.5 6.9
6.1
The Fc parts of different monoclonal IgG molecules are generally considered to be
identical for all IgG molecules which is reflected in the similar i.e.p. for the Fc
fragments of the different monoclonals.
2.2.2 Chemicals
Amine-functionalised surfaces were prepared by modifying silica surfaces using 3
aminopropyl-triethoxysilane (Petrarch, United Chemical Technologies, USA). All
adsorption experiments were carried out in 5 mM phosphate buffer solution. Ionic
strengths higher than 5 mM were obtained by adding NaCl. Chemicals used for
buffer preparation, Na2HP04, NaH2PC>4 and NaCl, were of analytical grade and
used without further purification. Water was purified by reverse osmosis and
passed subsequently through a superQ system (Millipore).
2.2.3 Surfaces
Silicon wafers (Wacker Chemitronic GmbH, Munchen, Germany) covered with a thin layer of Si02, formed by thermal oxidation at 1000° C for 90 minutes, were
used as hydrophilic negatively charged substrates. A silica layer thickness of
approximately 100 nm is essential for obtaining a high sensitivity in reflectometry
experiments. By ellipsometry it was verified that this condition was satisfied.
Amine-functionalised silica surfaces, prepared by the method described by
Giesbers [31], were used as hydrophilic positively charged substrates. The contact
angles of a drop of water on the silica and amine-functionalised silica were around
5° and 15°, respectively.
2.2.4 Reflectometry
Protein adsorption was measured using a reflectometer equipped with a
stagnation-point flow-cell [18]. If the perfect sink boundary condition applies (c=0
20
Electrostatic interactions between IgG molecules and a charged sorbent surface
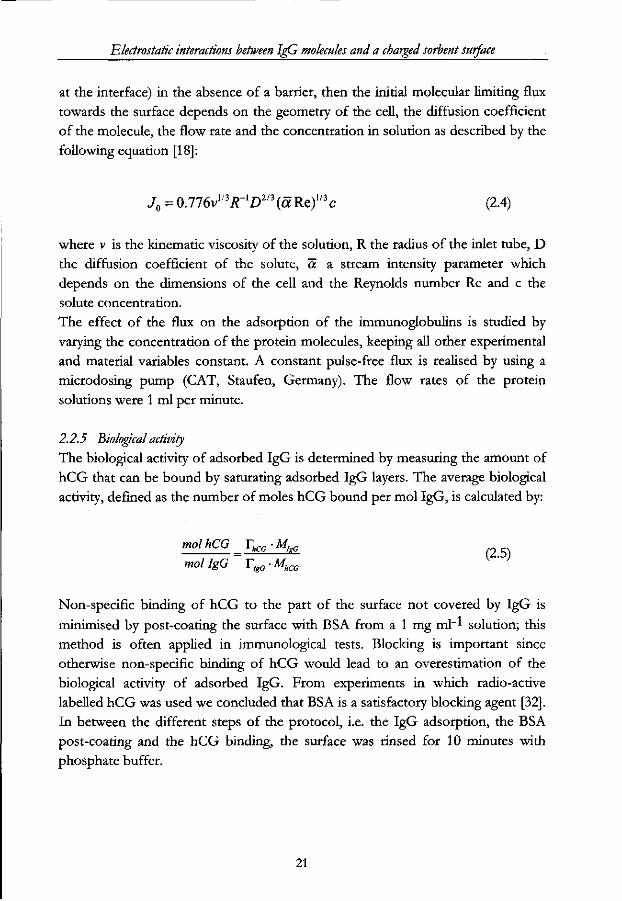
at the interface) in the absence of a barrier, then the initial molecular limiting flux
towards the surface depends on the geometry of the cell, the diffusion coefficient
of the molecule, the flow rate and the concentration in solution as described by the
following equation [18]:
J0 = 0.776v1/3i?"'D2/3 ( a Re)1/3 c (2.4)
where v is the kinematic viscosity of the solution, R the radius of the inlet tube, D
the diffusion coefficient of the solute, a a stream intensity parameter which
depends on the dimensions of the cell and the Reynolds number Re and c the
solute concentration.
The effect of the flux on the adsorption of the immunoglobulins is studied by
varying the concentration of the protein molecules, keeping all other experimental
and material variables constant. A constant pulse-free flux is realised by using a
microdosing pump (CAT, Staufen, Germany). The flow rates of the protein
solutions were 1 ml per minute.
2.2.5 Biological activity
The biological activity of adsorbed IgG is determined by measuring the amount of
hCG that can be bound by saturating adsorbed IgG layers. The average biological
activity, defined as the number of moles hCG bound per mol IgG, is calculated by:
mol hCG _Thcc • MleG
mol IgG TIgG • MhCG
Non-specific binding of hCG to the part of the surface not covered by IgG is
minimised by post-coating the surface with BSA from a 1 mg ml"* solution; this
method is often applied in immunological tests. Blocking is important since
otherwise non-specific binding of hCG would lead to an overestimation of the
biological activity of adsorbed IgG. From experiments in which radio-active
labelled hCG was used we concluded that BSA is a satisfactory blocking agent [32].
In between the different steps of the protocol, i.e. the IgG adsorption, the BSA
post-coating and the hCG binding, the surface was rinsed for 10 minutes with
phosphate buffer.
21

Chapter 2
2.3 Results and d iscuss ion
2.3.1 DU/O calculations
When a molecular dipole enters an electric field at an angle relative to the field it
experiences a torque which tends to align the dipole along the field direction. The
thermal motion involving an energy of kT per molecule, however, tends to
randomise the molecular orientation distribution. Furthermore, the molecule will
be further aligned only if it can be accommodated completely within the field.
Hence, to achieve alignment the interaction energy with the electric field must
exceed kT and the penetration depth of the electrical field should exceed the
dimensions of the molecule.
In 0.005 M and 0.1 M phosphate buffer the double layer thickness at the surfaces
(equation 2.3) is around 3 nm and 1 nm, respectively. As the dimensions of the
IgG molecule are 15*6*3 n nP it is evident that only a small part of the molecule
can enter the sorbent's electric field so that no further alignment of the dipolar IgG
molecule will occur.
<3 -10 Ionic strength (mol/l) - • - 0 . 5 ^ » - 0 . 1 ^ * - 0 . 0 1 - • - 0 . 0 0 5 - • - 0.001
4 6 8 10
separation distance (nm)
-1 ^ ^ - ^
Y i
.
0 2
^ +—f. J—t̂ t—>—-1— * * ~ t^=*^^_^--*-~-~-
Ionic strength (mol/l) - • - 0.5 ^T-0.1 ^4^0.01 - • - 0.005 - - • - 0.001
4 6 8 10 12 14
separation distance (nm)
Figure 2.1: Interaction energy curves for a particle and surface with (A) same charge sign (\\fn = \|/23 = 30 mV) and (B) the opposite charge sign (\|/n = -\|/23 = 30 mV).
Figure 2.1 gives curves for the total Gibbs energies of interaction between a
charged sphere of radius 7.5 10"9 m and a charged flat surface, as calculated
according to (eq. 2.1) and (eq. 2.2). By convention, negative values for G
correspond to attraction and positive ones to repulsion. From equation 2.1 it is
clear that the London-van der Waals interaction depends on the radius of the
particle, the particle-surface separation and the Hamaker constant. Electrostatic
22

Electrostatic interactions between IgG molecules and a charged sorbent surface
interactions (eq. 2.2) depend on the radius, the separation, the surface potentials
and K. As K (eq. 2.3) and the surface potentials are sensitive to the ionic strength of
the medium, so is the total interaction energy. Therefore, calculations are
performed for various values of ionic strength. We used a value of 5.10"21 J for the
Hamaker constant in agreement with the value reported by others [8,20,22,33].
Figure 2.1a shows that attractive van der Waals interaction dominates at small
separations. At intermediate distances, however, the repulsive double layer
interactions dominate and the potential energy shows a maximum having a positive
value. At low ionic strength, the Gibbs energy barrier opposing attachment to the
surface is about 7 kT for IgG molecules arriving with a side that has the same
charge sign as the surface. At the outer boundary of the electric field IgG
molecules are randomly oriented with a thermal energy of 0.5 kT normal to the
sorbent surface. It follows that the molecules that arrive with the part that has the
same charge sign as the sorbent directed towards the sorbent will not be able to
surpass the energy barrier and adsorption is prevented. Conversely, there is no
energy barrier for the dipoles that arrive in an electrostatically favourable
orientation (fig. 2.1b) and each particle-surface collision results in attachment. At
high ionic strength, both electrostatic repulsion and attraction (fig. 2.1a and b) are
decreased and hence, the influence of the electrostatic interactions on the
adsorption will be suppressed.
Based on these calculations, we expect at low ionic strength a sort of 'on/off
adsorption mechanism: under conditions of electrostatic attraction the molecules
will adsorb in the orientation in which they entered the field, whereas under
conditions of electrostatic repulsion the molecules cannot adsorb. The extent to
which electrostatic interactions control the adsorption process can be varied by
adjusting the ionic strength of the solution. At high ionic strength the influence of
electrostatic interaction on the adsorption behaviour is largely suppressed.
2.3.2 IgG adsorption
Prior to examining the effect of the surface charge on the antigen binding capacity
of adsorbed IgG (indicative of the orientation of IgG molecules at the surface), we
will study more general aspects of the adsorption of IgG. The various IgG
molecules used in this study show similar adsorption characteristics and therefore
we give, by way of example, only those for IgG 7B.
23
Chapter 2
2.3.3 Initial adsorption rate
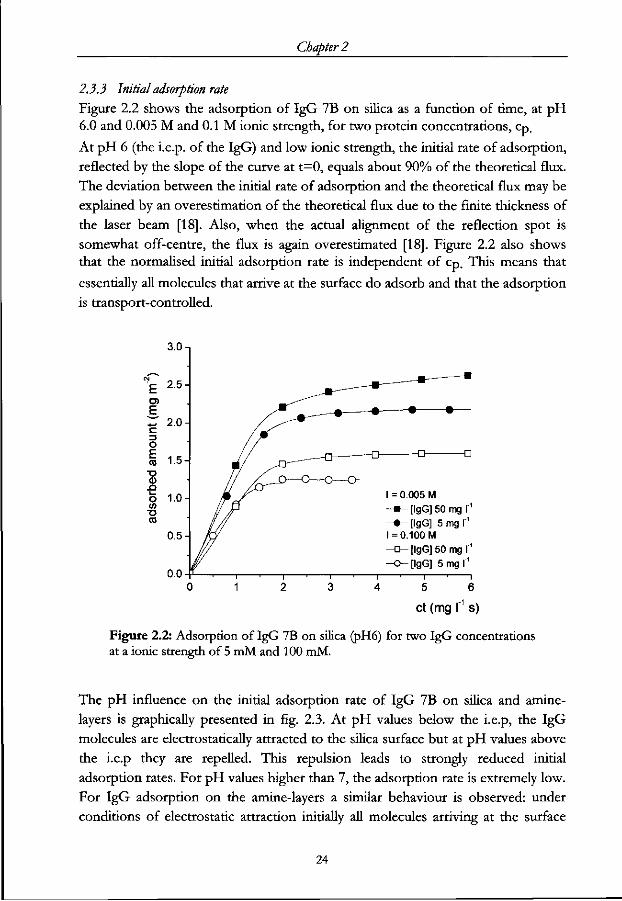
Figure 2.2 shows the adsorption of IgG 7B on silica as a function of time, at pH 6.0 and 0.005 M and 0.1 M ionic strength, for two protein concentrations, cp.
At pH 6 (the i.e.p. of the IgG) and low ionic strength, the initial rate of adsorption,
reflected by the slope of the curve at t=0, equals about 90% of the theoretical flux.
The deviation between the initial rate of adsorption and the theoretical flux may be
explained by an overestimation of the theoretical flux due to the finite thickness of
the laser beam [18]. Also, when the actual alignment of the reflection spot is
somewhat off-centre, the flux is again overestimated [18]. Figure 2.2 also shows
that the normalised initial adsorption rate is independent of cp. This means that
essentially all molecules that arrive at the surface do adsorb and that the adsorption
is transport-controlled.
3.0 n
E ^ 2.0 c o
i is • o <D
_Q O 1.0 </> •o to
0.5
0.0
I = 0.005 M -» - [ lgG]50mgr 1
- • - [ I g G ] 5mgr1
I = 0.100 M - c^ [ lgG]50mgr ' - o - [ l gG] 5mgr1
ct (mg I" s)
Figure 2.2: Adsorption of IgG 7B on silica (pH6) for two IgG concentrations at a ionic strength of 5 mM and 100 mM.
The pH influence on the initial adsorption rate of IgG 7B on silica and amine-
layers is graphically presented in fig. 2.3. At pH values below the i.e.p, the IgG
molecules are electrostatically attracted to the silica surface but at pH values above
the i.e.p they are repelled. This repulsion leads to strongly reduced initial
adsorption rates. For pH values higher than 7, the adsorption rate is extremely low.
For IgG adsorption on the amine-layers a similar behaviour is observed: under
conditions of electrostatic attraction initially all molecules arriving at the surface
24
Electrostatic interactions between IgG molecules and a charged sorbent surface
adsorb, whereas this rate is strongly reduced under conditions of electrostatic
repulsion. This is in line with the 'on/off adsorption mechanism predicted on the
basis of our DLVO calculations and with adsorption behaviour reported for
immunoglobulins [8,15,17] and different proteins [8,34].
1.0
0.9 a) = 0.7 c o e- o.6 o I 0.4 TO I "3 0)
I 0.1 2
0.0
A
D 0.005 M • 0.1M
1.0
0.9
2 0.7 C o o. 0.6 o W
~% 0.4
1 0-3
1 o.H 0.0
• 0.005 M • 0.1 M
PH B
pH
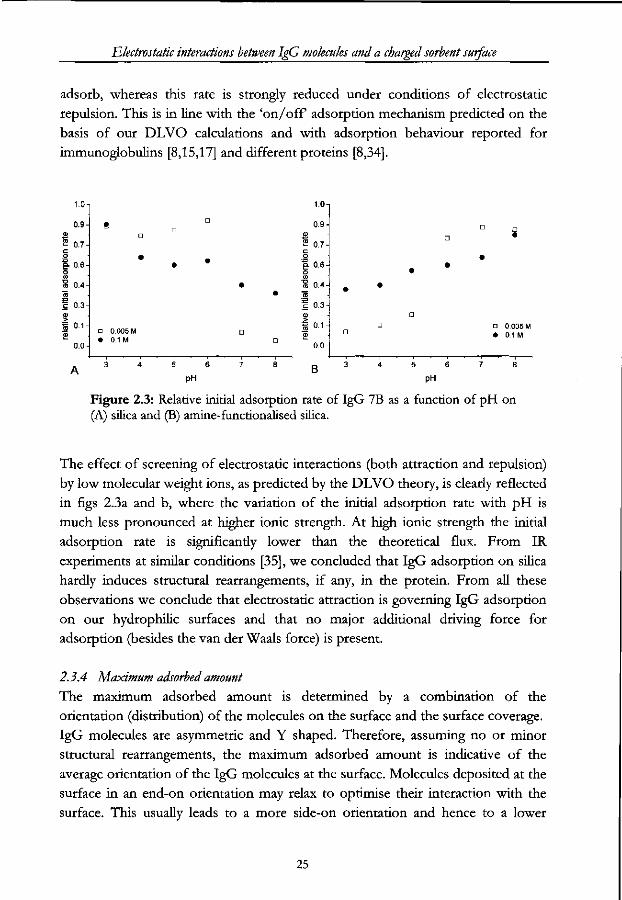
Figure 2.3: Relative initial adsorption rate of IgG 7B as a function of pH on (A) silica and (B) amine-functionalised silica.
The effect of screening of electrostatic interactions (both attraction and repulsion)
by low molecular weight ions, as predicted by the DLVO theory, is clearly reflected
in figs 2.3a and b, where the variation of the initial adsorption rate with pH is
much less pronounced at higher ionic strength. At high ionic strength the initial
adsorption rate is significantly lower than the theoretical flux. From IR
experiments at similar conditions [35], we concluded that IgG adsorption on silica
hardly induces structural rearrangements, if any, in the protein. From all these
observations we conclude that electrostatic attraction is governing IgG adsorption
on our hydrophilic surfaces and that no major additional driving force for
adsorption (besides the van der Waals force) is present.
2.3.4 Maximum adsorbed amount
The maximum adsorbed amount is determined by a combination of the
orientation (distribution) of the molecules on the surface and the surface coverage.
IgG molecules are asymmetric and Y shaped. Therefore, assuming no or minor
structural rearrangements, the maximum adsorbed amount is indicative of the
average orientation of the IgG molecules at the surface. Molecules deposited at the
surface in an end-on orientation may relax to optimise their interaction with the
surface. This usually leads to a more side-on orientation and hence to a lower
25
Chapter 2
maximum adsorbed amount. A reorientation can only take place when there is
sufficient time and space. Consequendy, when the initial rate of adsorption is high
relative to the relaxation rate the possibilities for reorientation are minimised.
Electrostatic interactions between the arriving protein and the adsorbent surface
play a role, as well as those between two adjacently adsorbed molecules. A change
in electrostatic interactions between the surface and the adsorbing protein causes a
change in initial adsorption rate and, as discussed above, a different maximum
adsorbed amount. Lateral repulsion between two adsorbed charged protein
molecules results in a lower surface coverage and therefore a smaller adsorbed
amount.
E O) 1.5 E
•e $ 0.5
0.0
A pH
0.0
B
• 0.005 M - • - 0 . 1 M
5 6
pH
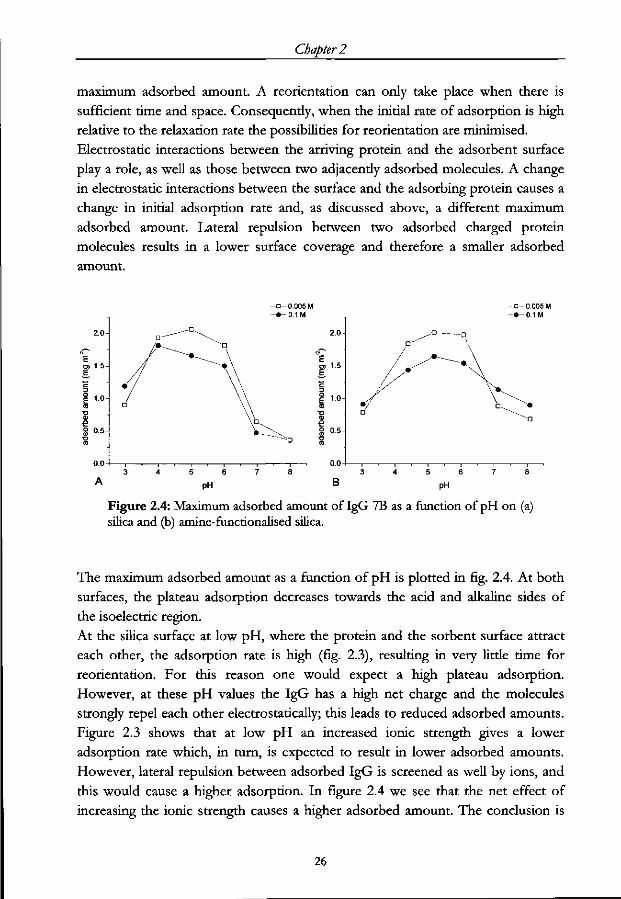
Figure 2.4: Maximum adsorbed amount of IgG 7B as a function of pH on (a) silica and (b) amine-functionalised silica.
The maximum adsorbed amount as a function of pH is plotted in fig. 2.4. At both
surfaces, the plateau adsorption decreases towards the acid and alkaline sides of
the isoelectric region.
At the silica surface at low pH, where the protein and the sorbent surface attract
each other, the adsorption rate is high (fig. 2.3), resulting in very little time for
reorientation. For this reason one would expect a high plateau adsorption.
However, at these pH values the IgG has a high net charge and the molecules
strongly repel each other electrostatically; this leads to reduced adsorbed amounts.
Figure 2.3 shows that at low pH an increased ionic strength gives a lower
adsorption rate which, in turn, is expected to result in lower adsorbed amounts.
However, lateral repulsion between adsorbed IgG is screened as well by ions, and
this would cause a higher adsorption. In figure 2.4 we see that the net effect of
increasing the ionic strength causes a higher adsorbed amount. The conclusion is
26
Electrostatic interactions between IgG molecules and a charged sorbent surface
that lateral repulsion, rather than protein-sorbent attraction, dominates the
electrostatic interaction in this pH regime.
At intermediate pH values, around the i.e.p., the net charge on the protein
molecules is essentially zero and the lateral repulsion is a minimum. The rate of
adsorption is high, hence reorientation cannot take place. These two features allow
high maximum adsorbed amounts, and this is observed for many different proteins
[8,15,34]. Around the i.e.p. of the IgG the adsorption rate is lower at the higher
ionic strength (see fig. 2.3), leaving more time for reorientation. This results in the
smaller adsorbed amount shown in figure 2.4. In this pH regime there is no
significant lateral repulsion so that the electrostatic interaction between the surface
and the arriving molecule is dominant.
At high pH values the IgG molecules are electrostatically repelled from the silica
surface, causing a very low adsorption rate. Moreover, the lateral repulsion is
strong, resulting in a low adsorption saturation. With increasing ionic strength the
repulsion between the surface and the protein as well as the lateral repulsion are
decreased. This should result in a higher adsorbed amount, but no significant
effect of the ionic strength is observed experimentally. It could be that, even at the
higher ionic strength the adsorption rate is already sufficiently low to allow
orientational relaxation of the adsorbed protein molecules.
The adsorption of IgG as a function of pH on the amine-functionalised surfaces
(fig. 2.3b and 2.4b) displays similar features as on the charged silica but is mirrored
with respect to the i.e.p. of the protein because the sorbent surface is oppositely
charged.
It can be seen from fig. 2.2 that the IgG concentration has a profound effect on the final adsorbed amount. Plateau adsorption decreases with decreasing cp. This
effect may be caused by (re)orientation of the adsorbed molecules at a rate that is comparable with the rate of deposition at the sorbent surface, the latter being decreased with decreasing cp.
2.3.5 Desorption
IgG desorption from both surfaces is studied by rinsing the adsorbed IgG layers
with buffer. The extent of desorption reflects the average strength of the protein-
sorbent interactions. On hydrophilic surfaces considerable desorption of proteins
is observed, in particular for proteins adsorbed around their i.e.p. [36].
27
Chapter 2
We measured the desorption of our immunoglobulins from both silica and amine-
funcdonalised silica surfaces for periods of more than an hour. At both surfaces
after 30 minutes of rinsing with buffer already 50% of the previously adsorbed
molecules were desorbed. Furthermore, desorption still proceeded after 1 hour,
although the desorption rate decreased in time. The extensive desorption from
both positively and negatively charged surfaces contradicts the proposed selective
desorption of the Fc fragment, as proposed by Buijs [36]. Furthermore, Ortega
Vinuesa et al [16] found that removing electrostatic attractive interactions resulted
in an almost complete desorption of antigen binding fragments (F^b)^ from a
hydrophilic surface.
Because the adsorption of IgG on a hydrophilic surface is driven by electrostatic
(and van der Waals) interactions only, we must conclude that these interactions are
relatively weak and cannot ensure permanent attachment of the IgG molecules.
2.3.6 Biological Activity
The biological activity of the immunoglobulins is measured at their i.e.p. on both
surfaces. At this pH the F(ab)2 and the Fc parts have opposite charge signs, and
therefore the influence of electrostatic interactions on the orientation of adsorbing
IgG molecules may be maximal. In addition, the biological activity of IgG 7B is
measured at various pH of adsorption on the silica surface.
If there were no directional forces involved in the adsorption process a more or
less randomly organised adsorbed layer would result. However, at the negatively
charged silica we expect a certain degree of preferential adsorption of the (slightly)
more positively charged Fc parts, thereby forcing the antigen-binding parts
directed towards the solution. Therefore, we expected that the antigen-binding
sites would be at least partially accessible for binding hCG. Unexpectedly, we did
not observe any biological activity of the adsorbed IgG at any pH value. Neither
were IgG 9A and IgG 1C biologically active at the silica surface. The results for the
two last mentioned IgG molecules is not surprising because the antigen-binding
parts of these molecules have a charge sign opposite to that of the surface and
unfavourable orientation for binding antigens was therefore anticipated. Upon
supplying hCG to the adsorbed IgG layers we even did observe some protein
desorption.
For IgG 7B on the positively charged amine-functionalised silica we expected an
unfavourable orientation of the binding sites. For the other IgGs, however, a
favourable orientation was expected. With IgG 9A and IgG 1C layers, after
supplying hCG we initially detected a very small amount of bound hCG. However,
on further hCG supply to the surface this binding was immediately overshadowed
28
Electrostatic interactions between IgG molecules and a charged sorbent surface
by desorption of proteins, either IgG or BSA (used as blocking agent). For this
reason, no accurate estimation of the biological activity of the adsorbed
immunoglobulins could be made.
2.4 Conclusion
It is concluded that electrostatic interactions have a strong influence on the
adsorption behaviour of IgG molecules on hydrophilic, charged surfaces. DLVO
theory showed that only IgG molecules arriving at the periphery of the electrical
field with a side that is charged opposite to the sorbent surface can further
approach the surface. During this approach no alignment of the dipolar IgG
molecules will occur.
The relevant electrostatic interactions are a combination of (a) interactions
between IgG and the sorbent surface and (b) lateral interaction between adsorbed
IgG molecules. The latter dominates at the acid and alkaline sides of the i.e.p.. The
rate of deposition at the sorbent surface relative to the relaxation rate of adsorbed
molecules is an additional important parameter: it influences the orientation of
adsorbed IgG molecules.
The extensive desorption of the imunoglobulins from both positively and
negatively charged surfaces showed that the electrostatic interactions between the
IgG molecules and the surfaces are relatively weak and cannot ensure permanent
attachment of the molecules. Unfortunately, this IgG desorption obstructed
determination of its biological activity. Hence, electric-field induced orientation of
IgG could not be established unambiguously. In conclusion, in the production of
immunoassays hydrophobic surfaces are preferred to hydrophilic surfaces because
of their stronger binding of immunoglobulins.
29
Chapter 2
2.5 References
1. Engvall, E. and Perlmann, P. (1971) Immunochemistry 8, 871.
2. Butler, J.E., Ni, L., Nessler, R., Joshi, K.S., Suter, M., Rosenberg, B., Chang,
J., Brown, W.R. and Cantarero, L.A. (1992) / . Immunol. Methods 150,11.
3. Yalow, R.S. and Berson, S.A. (1960) / . Clin. Invest. 39,\\51.
4. Benesch, J., Askendal, A., Tengvall, P. (2000) Colloids Surf. B18,l\.
5. Singer, J.M. and Plotz, CM., (1956) Am. J. Med. 21, 888.
6. Ortega-Vinuesa, J.L., Hidalgo-Alvarez, R., de las Nieves, F.J., Davey, C.L.,
Newman, D.J. and Price, C.P (1998)/. Colloid Interf. Sci. 204, 300.
7. Molina-Bolivar, J.A., Galisteo-Gonzalez, F. and Hidalgo-Alvarez, R. (1998)
/ . Biomater. Sci. Polymer Edn. Vol 9 (10), 1089.
8. Molina-Bolivar, J.A., and Ortega-Vinuesa, J.L. (1999) Langmuir 15, 2644.
9. Norde, W. (1986) Adv. Colloid Interf. Sci. 25, 267.
10. Haynes, C.A., Norde, W. (1994) Colloids Surf. B 2,5110.
11. Worley, C.G., Linton, W.R., and Samulski, E.T. (1995) Langmuir 11,3805.
12. Derjaguin, B.V. and Landau, L.D., (1941) Acta Physicochim. USSR, 11, 633.
13. Verwey, E.J.W. and Overbeek, J.T.G., Theory of the Stability of Lyophobic
Colloids, (Elsevier, 1948).
14. Galisteo-Gonzalez, F., Puig, J., Martin-Rodriguez, A., Serra-Domenech, J.,
F. and Hidalgo-Alvarez, R. (1994) Colloids Surf. B 2, 435.
15. Galisteo-Gonzalez, F., Martin-Rodriguez, A., Hidalgo-Alvarez, R. (1994)
Colloid Potym. Sci. 272, 352.
16. Ortega-Vinuesa, J.L., Galvez Ruiz, M.J., and Hidalgo-Alvarez, R. (1996)
Langmuir 12, 3211.
17. Buijs, J., Norde, W. and Lichtenbelt, J.W.Th. (1996) Langmuir 12, 1605.
18. Dijt, J.C., Cohen Stuart, M.A., and Fleer, G.J. (1994) Adv. Colloid Interf. Sci.
50, 79.
19. Leckband, D., and Sivasankar, S. (1999) Colloids Surf. B 14, 83.
20. Norde, W., and Lyklema, J. (1989) Colloids Surf. 38, 1.
21. Leckband, D., Schmitt, F.-J., and Israelachvili, J.N. (1994) Biochemistry 4611.
22. Molina-Bolivar, J.A., Galisteo-Gonzalez, F. and Hidalgo-Alvarez, R. (1999)
Colloids Surf. B 14, 3.
23. Israelachvili, J.N., Intermolecular and Surface forces, (2nd ed., Academic Press,
New York, 1992).
24. Pashley, R.M., (1981) / . Colloid Interf. Sci. 83, 531
25. Lyklema, J. Fundamentals of Interface and Colloid Science, Vol I Fundamentals
(Academic Press, London, 1991).
26. Visser, J. (1972)) Adv. Colloid Interf. Sci. 2, 331.
30
Electrostatic interactions between IgG molecules and a charged sorbent surface
27. Gouy, M. (1910) / . Phys. Paris, 9, 457.
28. Chapmann, D.L., (1913) Philos. Mag. 25, 475.
29. Lyklema, J. Fundamentals of Interface and Colloid Science, Vol II Solid-Uquid
Interfaces (Academic Press, London, 1995).
30. Hogg, R., Healy, T.W., and Fuerstenau, D.W. (1966) Trans. Faraday Soc. 62,
1638.
31. Giesbers, M., Ph.D. Thesis, Wageningen University, 2001.
32. Chapter 7, this thesis.
33. Roth, CM. and Lenhoff, A.M. (1995) Langmuir 11, 3500.
34. Ortega-Vinuesa, J.L., Tengvall, P., and Lundstrom, I. (1998) Thin Solid films
324, 257.
35. Giacomelli, C.E., Bremer, M.G.E.G., and Norde, W. (1999) / . Colloid Interf.
Sci. 220, 13.
36. Buijs, J., Ph.D. Thesis, Wageningen Agricultural University, 1995.
31

Chapter 3
'MOLECULAR SIEVING': ORIENTED I G G ADSORPTION ON
(BLOCK COPOLYMER) PRECOATED SURFACES
Abstract
A method to achieve oriented physical adsorption of Immunoglobulin G (IgG) is
presented which is based only on the non-spherical shape of IgG molecules. This
concept resembles 'molecular sieving' on the sorbent surface in that binding of the
smaller part of non-spherical molecules, in the case of IgG the Fc part, is favoured.
Thus, the larger, antigen binding, parts become directed towards the solution and,
hence, accessible to bind antigens. The mechanism of 'Molecular sieving' is first
theoretically demonstrated using a Random Sequential Adsorption (RSA) model.
This is followed by a set of reflectometer experiments. A 'sieve' formed either with
pre-adsorbed IgG molecules or with triblock copolymers was proven to yield a
high specific biological activity of the subsequently adsorbing IgG molecules.
The mass flux towards the surface also has a profound effect on the adsorbed
amount and, consequently on the orientation of IgG. This indicates that the rate of
reorientation of adsorbed IgG molecules was comparable to the rate of adsorption.
We estimated a reorientation time of more than 2000 seconds for IgG molecules
adsorbed on a hydrophobic surface. A specific feature of the 'molecular sieve' is
that the pre-adsorbed molecules prevent this undesirable reorientation of adsorbed
IgG.
Chapter 3
3.1 Introduction
The preservation of biological functioning of proteins upon immobilisation is of
special interest in various biomedical and biotechnical applications. In industry,
including the manufacturing of capture immunoassays [1,2], physical adsorption of
immunoglobulins onto solid surfaces is still the predominant immobilisation
procedure. The immobilisation technique, however, often leads to an undesired
loss of biological activity [3,4]. This loss may be caused by a reduced accessibility
of the antigen binding sites for instance when they are in the vicinity of the sorbent
surface or by conformational changes in the antibodies [5,6], the latter especially
when hydrophobic surfaces are used. To overcome these intrinsic problems
several alternative, mostly chemical, immobilisation techniques have been
developed [3,4,7]. Thereby it is tried to force the antigen binding parts towards the
solution and hence, keeping them accessible to bind antigens. Although some of
these techniques have been reported to increase average biological activity of IgGs,
they have given rise to new complications: more costly manufacturing procedures,
the need for expensive chemicals and dedicated solid surfaces to name some.
So, rather than applying chemical modifications to orient IgG molecules on a solid
surface, we propose a fresh view on the physical adsorption of molecules which is
based on only one intrinsic physical property of the adsorbing molecules: viz. their
anisodimensionality. Our concept resembles molecular sieving on a sorbent
surface. It leads to a very simple procedure for the oriented immobilisation of IgG
and rendering complicated chemical or biochemical modifications to the surface or
the immunoglobulins redundant.
The set-up of this paper is the following: first, we describe the theoretical aspects
of size-excluded adsorption. Second we report a set of experiments that
demonstrate the influence of the molecular anisodimensionality on the adsorption
of IgG on pre-adsorbed layers of either IgG or triblock copolymers of the type
PEO-PPO-PEO. The effect of these layers on the biological activity of later
adsorbed IgG is studied by choosing the surface coverage of the sorbent by the
pre-adsorbed layer as the experimental variable. Hydrophobised silica is used as
the sorbent material and the adsorption process is monitored by reflectometry.
3.2 Size-and shape exclusion phenomena in IgG adsorption
3.2.1 Manipulating initial IgG orientation upon adsorption
When a mixture of proteins in aqueous solution is exposed to a bare solid surface,
34

'Molecular sieving: oriented IgG adsorption on (block copolymer) precoated surfaces
it often results in adsorption [8,9], especially when the surface is hydrophobic.
However, when such a surface is already partially covered by other molecules,
additional binding can only take place when the remaining uncovered areas are
sufficiently large to accommodate at least single protein molecules. In other words,
only those proteins that fit in these uncovered areas are able to adsorb when the
size distribution of individual areas excludes larger molecules. This concept
resembles a molecular sieve mechanism which induces adsorption to depend on
the molecular dimensions. A more advanced size-excluded adsorption applies to
single protein molecules provided they have an orientation-dependent footprint.
Considering, for instance an immunoglobulin G molecule, which is Y-shaped: the
desired mode of adsorption has the smaller Fc-part, that only mediates effector
functions, attached whereas accommodation at the sorbent surface of the larger
(F(ab)2) part, that can bind antigens, is obstructed. As a result of the difference in
the biological function of the two parts, this shape-excluded physical adsorption
leads to a larger fraction of properly oriented molecules.
Figure 3.1: IgG adsorption process.
During the IgG adsorption process (fig. 3.1) the (charged) sorbent surface is
gradually filled with adsorbed molecules. Initially, a constant rate of adsorption is
observed. This indicates that a constant fraction of the molecules that arrive at the
periphery of the sorbent's electric field adsorbs. At this outer boundary of the field
the molecules have a random orientation. The electric field, however, may
influence the orientation of adsorbing IgG molecules. When exposed to the field,
the dipolar IgG molecules may experiences a torque, which tends to align the
35
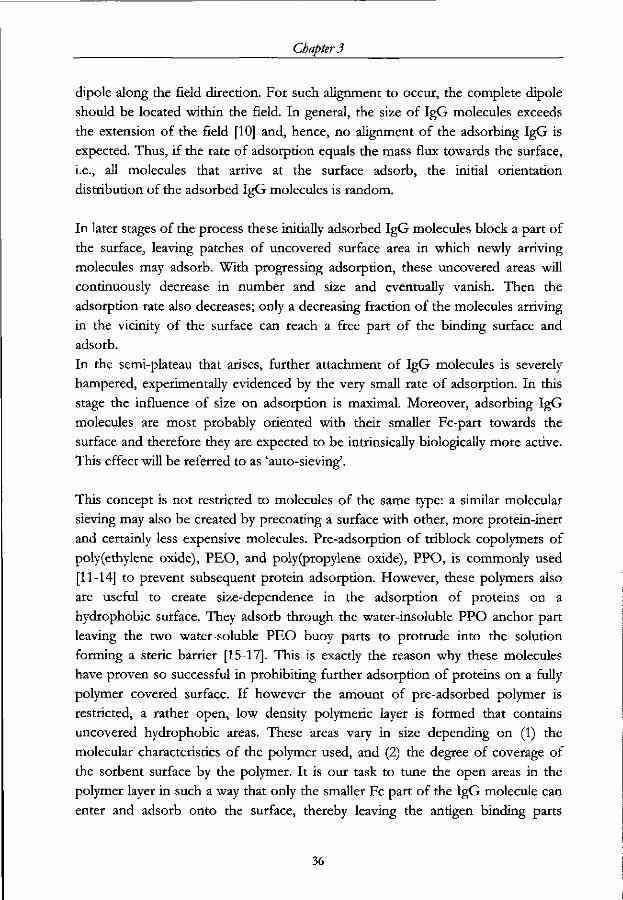
Chapter 3
dipole along the field direction. For such alignment to occur, the complete dipole
should be located within the field. In general, the size of IgG molecules exceeds
the extension of the field [10] and, hence, no alignment of the adsorbing IgG is
expected. Thus, if the rate of adsorption equals the mass flux towards the surface,
i.e., all molecules that arrive at the surface adsorb, the initial orientation
distribution of the adsorbed IgG molecules is random.
In later stages of the process these initially adsorbed IgG molecules block a part of
the surface, leaving patches of uncovered surface area in which newly arriving
molecules may adsorb. With progressing adsorption, these uncovered areas will
continuously decrease in number and size and eventually vanish. Then the
adsorption rate also decreases; only a decreasing fraction of the molecules arriving
in the vicinity of the surface can reach a free part of the binding surface and
adsorb.
In the semi-plateau that arises, further attachment of IgG molecules is severely
hampered, experimentally evidenced by the very small rate of adsorption. In this
stage the influence of size on adsorption is maximal. Moreover, adsorbing IgG
molecules are most probably oriented with their smaller Fc-part towards the
surface and therefore they are expected to be intrinsically biologically more active.
This effect will be referred to as 'auto-sieving'.
This concept is not restricted to molecules of the same type: a similar molecular
sieving may also be created by precoating a surface with other, more protein-inert
and certainly less expensive molecules. Pre-adsorption of triblock copolymers of
poly(ethylene oxide), PEO, and poly(propylene oxide), PPO, is commonly used
[11-14] to prevent subsequent protein adsorption. However, these polymers also
are useful to create size-dependence in the adsorption of proteins on a
hydrophobic surface. They adsorb through the water-insoluble PPO anchor part
leaving the two water-soluble PEO buoy parts to protrude into the solution
forming a steric barrier [15-17]. This is exactly the reason why these molecules
have proven so successful in prohibiting further adsorption of proteins on a fully
polymer covered surface. If however the amount of pre-adsorbed polymer is
restricted, a rather open, low density polymeric layer is formed that contains
uncovered hydrophobic areas. These areas vary in size depending on (1) the
molecular characteristics of the polymer used, and (2) the degree of coverage of
the sorbent surface by the polymer. It is our task to tune the open areas in the
polymer layer in such a way that only the smaller Fc part of the IgG molecule can
enter and adsorb onto the surface, thereby leaving the antigen binding parts
36
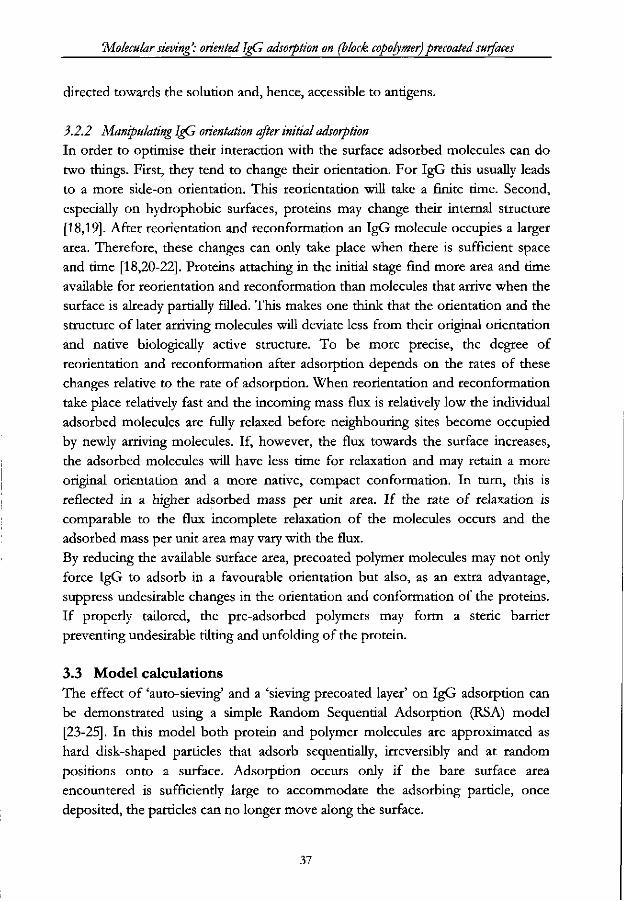
'Molecular sieving': oriented IgG adsorption on (block copolymer)precoated surfaces
directed towards the solution and, hence, accessible to antigens.
3.2.2 Manipulating IgG orientation after initial adsorption
In order to optimise their interaction with the surface adsorbed molecules can do
two things. First, they tend to change their orientation. For IgG this usually leads
to a more side-on orientation. This reorientation will take a finite time. Second,
especially on hydrophobic surfaces, proteins may change their internal structure
[18,19]. After reorientation and reconformation an IgG molecule occupies a larger
area. Therefore, these changes can only take place when there is sufficient space
and time [18,20-22]. Proteins attaching in the initial stage find more area and time
available for reorientation and reconformation than molecules that arrive when the
surface is already partially filled. This makes one think that the orientation and the
structure of later arriving molecules will deviate less from their original orientation
and native biologically active structure. To be more precise, the degree of
reorientation and reconformation after adsorption depends on the rates of these
changes relative to the rate of adsorption. When reorientation and reconformation
take place relatively fast and the incoming mass flux is relatively low the individual
adsorbed molecules are fully relaxed before neighbouring sites become occupied
by newly arriving molecules. If, however, the flux towards the surface increases,
the adsorbed molecules will have less time for relaxation and may retain a more
original orientation and a more native, compact conformation. In turn, this is
reflected in a higher adsorbed mass per unit area. If the rate of relaxation is
comparable to the flux incomplete relaxation of the molecules occurs and the
adsorbed mass per unit area may vary with the flux.
By reducing the available surface area, precoated polymer molecules may not only
force IgG to adsorb in a favourable orientation but also, as an extra advantage,
suppress undesirable changes in the orientation and conformation of the proteins.
If properly tailored, the pre-adsorbed polymers may form a steric barrier
preventing undesirable tilting and unfolding of the protein.
3.3 Model calculations
The effect of 'auto-sieving' and a 'sieving precoated layer' on IgG adsorption can
be demonstrated using a simple Random Sequential Adsorption (RSA) model
[23-25]. In this model both protein and polymer molecules are approximated as
hard disk-shaped particles that adsorb sequentially, irreversibly and at random
positions onto a surface. Adsorption occurs only if the bare surface area
encountered is sufficiently large to accommodate the adsorbing particle, once
deposited, the particles can no longer move along the surface.
37

Chapter 3
Polymer molecules are simulated by disks of radius 3 nm. A precoated surface is
formed by the adsorption of these disks up to a certain surface coverage.
In our model an IgG molecule can adsorb in only two orientations:
with (a) its Fc part or (b) its F(ab)2part directed towards the surface.
A complete IgG molecule attached with its Fc part at the surface is simulated by an
adsorbed disk of radius 6 nm (see figure 3.2). An IgG molecule oriented with its
F(ab)2 part directed towards the surface is simulated, in turn, by an adsorbing disk
of radius 10 nm. The areas of the model disks are proportional to the projected
areas of PEO chains used in the experiments and of crystallised Fc and F(ab)2
fragments [28]. Adsorption of IgG molecules is simulated by the simultaneous
adsorption of one 'Fc disk and one F(ab)2 disk.
simulated by a disk
r—3 nm simulated by a disk r=6 nm
F(ab)2
simulated by a disk
r—10 nm
Figure 3.2: An IgG molecule can adsorb in only two orientations: with its Fc part or its F(ab)2 part directed towards the surface.
In figure 3.3a, a simulated IgG adsorption on a bare, non precoated, surface is
shown. The adsorbed amount, here represented by the number of particles
attached to the surface, is plotted as a function of the mass flux towards the
surface, here represented as the number of particles that has collided with the
surface. From this graph we see that initially an equal number of Fc disks (i.e., IgG
molecules attached with their Fc part to the surface) and F(ab)2 disks adsorb (i.e.,
IgG molecules attached with their F(ab)2 part). This means that the initial
orientation distribution of the adsorbed IgG is random. After approximately 2000
particle-surface collisions the adsorption of the larger particles is inhibited, whereas
adsorption of the small particles can still proceed. In other words, the concept of
'auto-sieving' is demonstrated: the pre-adsorbed IgG molecules force the newly
38
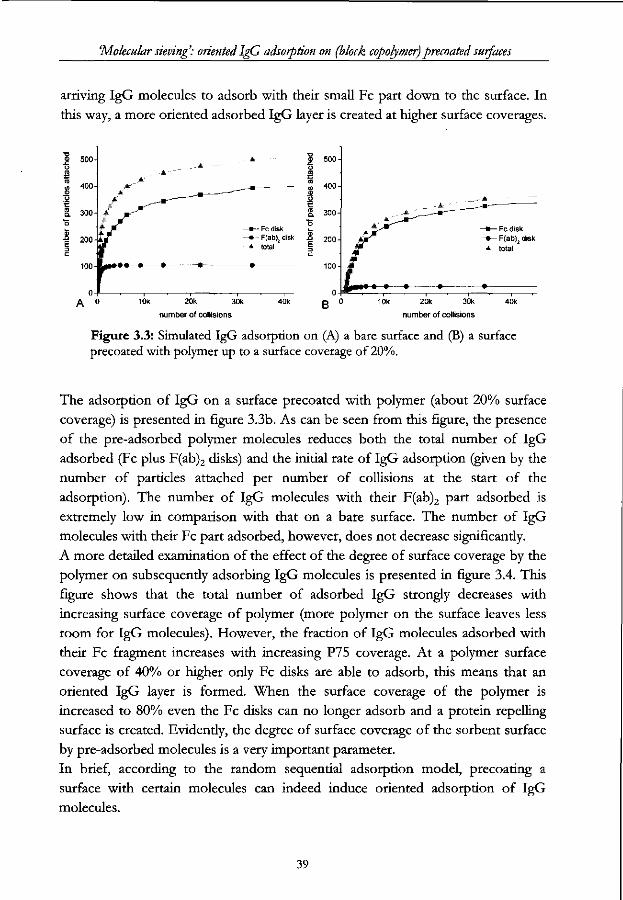
'Molecular sieving': oriented IgG adsorption on (block copolymer)precoated surfaces
arriving IgG molecules to adsorb with their small Fc part down to the surface. In
this way, a more oriented adsorbed IgG layer is created at higher surface coverages.
A o 10k 20k 30k
number of collisions
Fc disk i_ F(ab)2 disk .a 200
0
B °
-
. * • " L ^ -
A- -•
—«— Fcdisk • F(ab)2 disk A total
10k 20k 30k
number of collisions
Figure 3.3: Simulated IgG adsorption on (A) a bare surface and (B) a surface precoated with polymer up to a surface coverage of 20%.
The adsorption of IgG on a surface precoated with polymer (about 20% surface
coverage) is presented in figure 3.3b. As can be seen from this figure, the presence
of the pre-adsorbed polymer molecules reduces both the total number of IgG
adsorbed (Fc plus F(ab)2 disks) and the initial rate of IgG adsorption (given by the
number of particles attached per number of collisions at the start of the
adsorption). The number of IgG molecules with their F(ab)2 part adsorbed is
extremely low in comparison with that on a bare surface. The number of IgG
molecules with their Fc part adsorbed, however, does not decrease significantly.
A more detailed examination of the effect of the degree of surface coverage by the
polymer on subsequently adsorbing IgG molecules is presented in figure 3.4. This
figure shows that the total number of adsorbed IgG strongly decreases with
increasing surface coverage of polymer (more polymer on the surface leaves less
room for IgG molecules). However, the fraction of IgG molecules adsorbed with
their Fc fragment increases with increasing P75 coverage. At a polymer surface
coverage of 40% or higher only Fc disks are able to adsorb, this means that an
oriented IgG layer is formed. When the surface coverage of the polymer is
increased to 80% even the Fc disks can no longer adsorb and a protein repelling
surface is created. Evidently, the degree of surface coverage of the sorbent surface
by pre-adsorbed molecules is a very important parameter.
In brief, according to the random sequential adsorption model, precoating a
surface with certain molecules can indeed induce oriented adsorption of IgG
molecules.
39
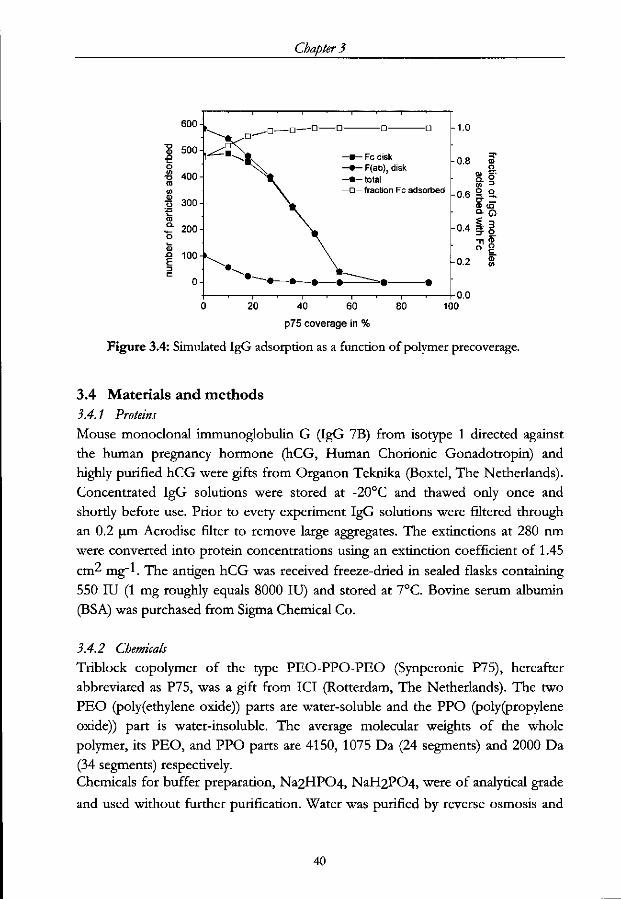
Chapter 3
<D .g O </)
XJ m Vi
o XL as a. **— o 5> E c
600-
500-
400-
300-
200-
100-
0-
t
»._ _ n -
L
^ • ^
)
•̂—-_-. • -
20
—•— Fc disk - • - F(ab)2 disk - • - total
^ —o— fraction Fc adsorbed
\ V — • — • — • — = = = •
40 60 80
p75 coverage in %
—•
-1.0
-0.8 m o
-o .61 a (D (Q
°- a -0 4 I' 3
-n <»
0.2 £
100
Figure 3.4: Simulated IgG adsorption as a function of polymer precoverage.
3.4 Materials and methods
3.4.1 Proteins
Mouse monoclonal immunoglobulin G (IgG 7B) from isotype 1 directed against
the human pregnancy hormone (hCG, Human Chorionic Gonadotropin) and
highly purified hCG were gifts from Organon Teknika (Boxtel, The Netherlands).
Concentrated IgG solutions were stored at -20°C and thawed only once and
shortly before use. Prior to every experiment IgG solutions were filtered through
an 0.2 um Acrodisc filter to remove large aggregates. The extinctions at 280 nm
were converted into protein concentrations using an extinction coefficient of 1.45
cm^ mg~l. The antigen hCG was received freeze-dried in sealed flasks containing
550 IU (1 mg roughly equals 8000 IU) and stored at 7°C. Bovine serum albumin
(BSA) was purchased from Sigma Chemical Co.
3.4.2 Chemicals
Triblock copolymer of the type PEO-PPO-PEO (Synperonic P75), hereafter
abbreviated as P75, was a gift from ICI (Rotterdam, The Netherlands). The two
PEO (poly(ethylene oxide)) parts are water-soluble and the PPO (poly(propylene
oxide)) part is water-insoluble. The average molecular weights of the whole
polymer, its PEO, and PPO parts are 4150, 1075 Da (24 segments) and 2000 Da
(34 segments) respectively.
Chemicals for buffer preparation, Na2HP04, NaH2P04, were of analytical grade
and used without further purification. Water was purified by reverse osmosis and
40
'Molecular sieving': oriented IgG adsorption on (block copolymer)precoated surfaces
passed subsequently through a superQ system (Millipore).
3.4.3 Surfaces
Silicon wafers (Wacker Chemitronic GmbH, Munich, Germany) covered with a thin layer of Si02, formed by thermal oxidation at 1000° C for 90 minutes, were
used as the hydrophilic substrates. A silica layer thickness of approximately 100 nm
is essential for obtaining a high sensitivity in reflectometry experiments. By
ellipsometry it was verified that this condition was satisfied. Hydrophobic
methylated silica surfaces were prepared by immersion of the silica surfaces in
1 % (v/v) dichlorodimethylsilane in toluene for 15 minutes. Afterwards the
surfaces were extensively rinsed with ethanol and water. The contact angle of a
drop of water on the hydrophilic and the hydrophobised silica surface were around
5° and 90°, respectively.
The surfaces were cleaned with a plasma cleaner prior to every individual
adsorption experiment and before the surfaces were hydrophobised.
3.4.4 Reflectometry
All experiments were carried out in a 5 mM phosphate buffer solution of pH 6,
which is the isoelectric point of the applied IgG.
Polymer and protein adsorption were measured using a reflectometer equipped
with a stagnation-point flow-cell [26]. If the perfect sink boundary condition
applies (c=0 at the interface) and in the absence of a barrier, then the initial
molecular limiting flux towards the surface depends on the geometry of the cell,
the diffusion coefficient of the molecule, the flow rate and the concentration in
solution as described by the following equation [26]:
J0 =0.776v1/3i?"1JD
2/3(aRe)1/3c (3.1)
where v is the kinematic viscosity of the solution, R the radius of the inlet tube, D
the diffusion coefficient of the solute, a a stream intensity parameter, which
depends on the dimensions of the cell and the Reynolds number Re and c the
solute concentration.
The effect of the flux on the adsorption of the polymers and proteins is studied by
varying the concentration of the molecules, keeping all other experimental and
material variables constant. A constant pulse-free flux is realised by using a
microdosing pump (CAT, Staufen, Germany). The flow rates of the protein and
41

Chapter 3
polymer solutions were 1 ml per minute and 0.5 ml per minute, respectively.
3.4.5 Biological activity
The biological activity of adsorbed IgG is determined by measuring the amount of
hCG that can be bound by saturating adsorbed IgG layers. The average intrinsic
biological activity, mol hCG bound per mol IgG, is calculated by:
molhCG _ r , c c -M / g G
mol IgG rigG • MhCG
Non-specific binding of hCG to the part of the surface not covered by IgG is
minimised by post-coating the surface by adsorption of BSA from a 1 mg ml~l
solution; this method is often applied in immunological tests. This blocking is
important since possible non-specific binding of hCG would lead to an
overestimation of the biological activity of adsorbed IgG. From experiments in
which radio-active labelled hCG was used we concluded that BSA is a satisfactory
blocking agent [27]. In between the different steps of the protocol, i.e. the IgG
adsorption, the BSA post-coating and the hCG binding, the surface was rinsed for
10 minutes with phosphate buffer.
3.5 Results and d iscuss ion
The effect of the presence of pre-adsorbed molecules on the adsorption behaviour
of IgG molecules is studied. We examined whether this pre-adsorption leads to a
more favourable average orientation of the adsorbed IgG and whether this results
in a higher specific biological activity of the adsorbed IgG. First, the effect of pre-
adsorbed IgG layers is studied, followed by the effect of pre-adsorbed triblock
copolymer layers.
3.5.1 IgG layers
IgG adsorption on bare surfaces
A typical adsorption curve for IgG on methylated silica is shown in figure 3.5a.
Figure 3.5b shows the relative rate of IgG adsorption as a function of time. When
the adsorbed IgG layer is rinsed with a buffer solution only a small fraction of the
IgG molecules desorbs. Hence, found before [28,29], the adsorption of IgG is
essentially irreversible with respect to dilution.
42

'Molecular sieving': oriented IgG adsorption on (block copolymer)precoated surfaces
Figure 3.5: (A) IgG adsorption on methylated silica, rinse with buffer indicated by arrow. (B) Relative initial adsorption rate.
On the hydrophobic surface the initial rate of adsorption of IgG, reflected by the
slope of the adsorption curve at t=0, equals about 85% to 90% of the theoretical
flux (fig. 3.5a). This difference between the initial rate of adsorption and the
theoretical flux may be explained by an overestimation of the theoretical flux due
to the finite thickness of the laser beam [26]. Also, when the actual alignment of
the reflection spot is somewhat off-centre, the flux is again overestimated [26].
Roughly, all IgG molecules that arrive at the surface do adsorb and this means that
the adsorption is transport limited, which is also reported in literature [28]. The
sticking probability of an IgG molecule on a freely accessible bare part of the
surface approaches unity. In this case, binding occurs irrespective of the molecular
orientation upon arrival. This is also observed for e.g. albumin adsorbed on a
hydrophobic surface [21].
The range where the relative rate of IgG adsorption starts to deviate from unity
marks the end of the transport-limited regime. At longer adsorption times the
adsorption rate decreases gradually with surface coverage and time (fig. 3.5b). Such
a gradual transition from the transport-limited region to the saturation value is also
observed for e.g. albumin and fibrinogen adsorbing on a hydrophobic surface [21].
Due to the build-up of the adsorbed layer the attachment to the surface becomes
more and more difficult. According to [21], unfolding (and to a lesser extent
reorientation) of albumin and fibrinogen on the surface was the main reason for
the restricted further attachment of protein molecules. Considering IgG, the
rounded appearance of the adsorption curves may reflect both the need for a
specific orientation of the later adsorbing molecules and spreading of the
43
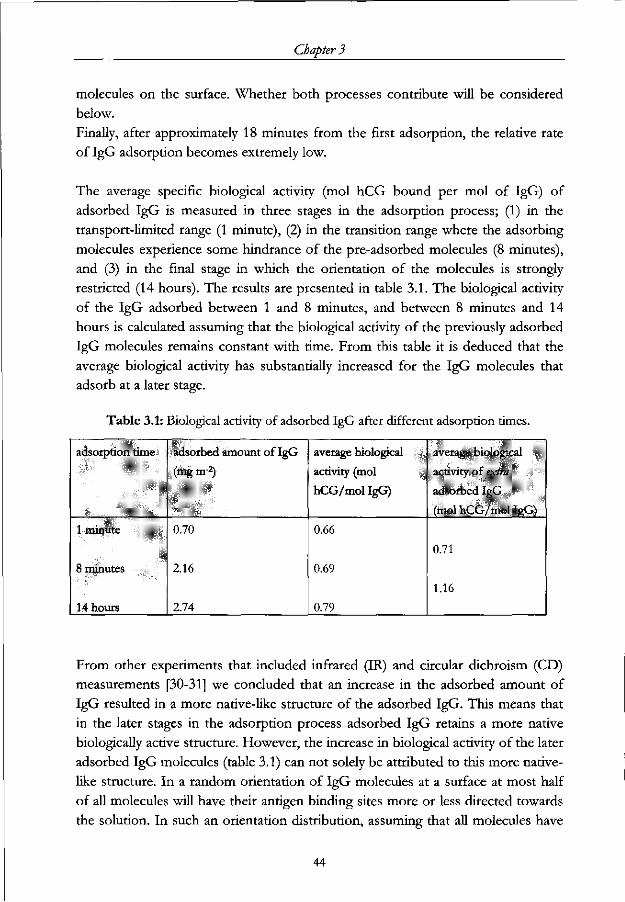
Chapter 3
molecules on the surface. Whether both processes contribute will be considered
below.
Finally, after approximately 18 minutes from the first adsorption, the relative rate
of IgG adsorption becomes extremely low.
The average specific biological activity (mol hCG bound per mol of IgG) of
adsorbed IgG is measured in three stages in the adsorption process; (1) in the
transport-limited range (1 minute), (2) in the transition range where the adsorbing
molecules experience some hindrance of the pre-adsorbed molecules (8 minutes),
and (3) in the final stage in which the orientation of the molecules is strongly
restricted (14 hours). The results are presented in table 3.1. The biological activity
of the IgG adsorbed between 1 and 8 minutes, and between 8 minutes and 14
hours is calculated assuming that the biological activity of the previously adsorbed
IgG molecules remains constant with time. From this table it is deduced that the
average biological activity has substantially increased for the IgG molecules that
adsorb at a later stage.
Table 3.1: Biological activity of adsorbed IgG after different adsorption times.
adsorption time
1 minute
8 minutes
14 hours
adsorbed amount of IgG
(mg m 2)
0.70
2.16
2.74
average biological
activity (mol
hCG/mol IgG)
0.66
0.69
0.79
avcragi- binl.-ipoil
,icti\itv ot'r.v/w
mlsorlu'd IsrCJ
Miiol hCCi/miil lj;( ii
0.71
1.16
From other experiments that included infrared (IR) and circular dichroism (CD)
measurements [30-31] we concluded that an increase in the adsorbed amount of
IgG resulted in a more native-like structure of the adsorbed IgG. This means that
in the later stages in the adsorption process adsorbed IgG retains a more native
biologically active structure. However, the increase in biological activity of the later
adsorbed IgG molecules (table 3.1) can not solely be attributed to this more native
like structure. In a random orientation of IgG molecules at a surface at most half
of all molecules will have their antigen binding sites more or less directed towards
the solution. In such an orientation distribution, assuming that all molecules have
44
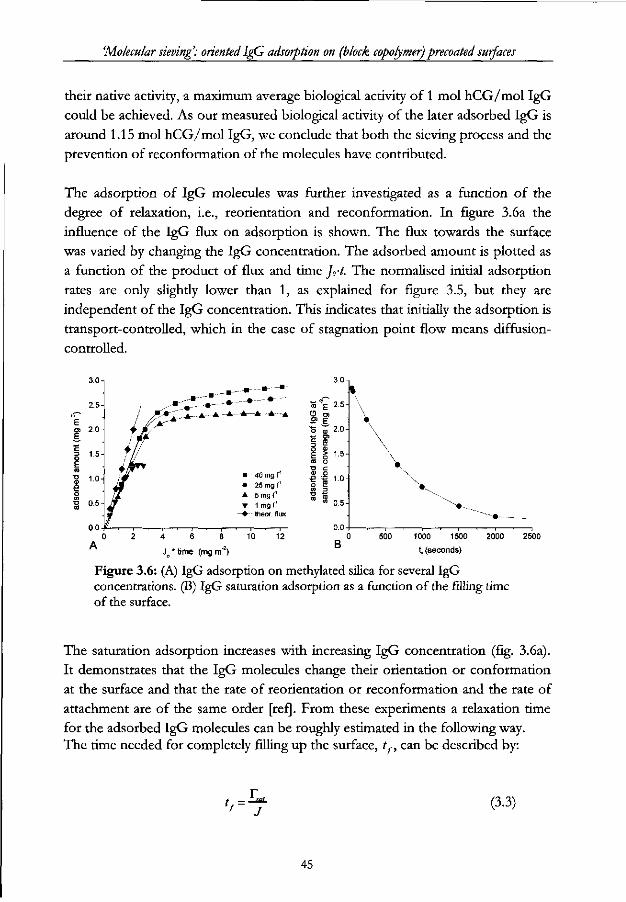
'Molecular sieving: oriented IgG adsorption on (block copolymer) precoated surfaces
their native activity, a maximum average biological activity of 1 mol hCG/mol IgG
could be achieved. As our measured biological activity of the later adsorbed IgG is
around 1.15 mol hCG/mol IgG, we conclude that both the sieving process and the
prevention of reconformation of the molecules have contributed.
The adsorption of IgG molecules was further investigated as a function of the
degree of relaxation, i.e., reorientation and reconformation. In figure 3.6a the
influence of the IgG flux on adsorption is shown. The flux towards the surface
was varied by changing the IgG concentration. The adsorbed amount is plotted as
a function of the product of flux and time J0-t. The normalised initial adsorption
rates are only slightly lower than 1, as explained for figure 3.5, but they are
independent of the IgG concentration. This indicates that initially the adsorption is
transport-controlled, which in the case of stagnation point flow means diffusion-
controlled.
, - • - — • -
40 mg T 25 mg I'1
5 mg I' 1 mg I'1
- theor. flux
ro £ 2.5 O o> 2> E •S T 2 0
E § 1.5-
B 1000 1500
t( (seconds) 1 time (mg nV )
Figure 3.6: (A) IgG adsorption on methylated silica for several IgG concentrations. (B) IgG saturation adsorption as a function of the filling time of the surface.
The saturation adsorption increases with increasing IgG concentration (fig. 3.6a).
It demonstrates that the IgG molecules change their orientation or conformation
at the surface and that the rate of reorientation or reconformation and the rate of
attachment are of the same order [ref]. From these experiments a relaxation time
for the adsorbed IgG molecules can be roughly estimated in the following way.
The time needed for completely filling up the surface, tf, can be described by:
L j
(3.3)
45

Chapter 3
assuming transport control everywhere. Tsal is the adsorbed amount at saturation
coverage. In figure 3.6b the saturation adsorption is plotted as a function tf. After
more than 2000 seconds the saturation adsorption becomes constant with time.
This indicates that above that time the IgG molecules are fully relaxed with respect
to orientation and configuration and that the relaxation time is shorter than the
filling time. Accordingly, we estimate a relaxation time of more than 30 minutes.
From IR and CD measurements [30,31] we concluded that the time scales over
which structural changes were completed were less than 2 minutes. Therefore, an
overall relaxation time of over 30 minutes implies a substantial contribution of
orientation relaxation of the IgG molecules. Furthermore, these data show that
pre-adsorbed IgG molecules can suppress the degree of orientational changes of
adsorbed IgG molecules.
Wertz and Santore [21] estimated interfacial protein relaxation rates of 0.12 and
0.15 nm2 molecule"1 s"1 for albumin and fibrinogen, respectively. We estimate a
relaxation rate of 0.3 nm2 molecule"1 sA for IgG (in about 2000 seconds IgG has
spread from approximately 90 nm2 per molecule (c. 2.8 mg m"2) to 800 nm2 per
molecule (c. 0.3 mg m"2)). This value is comparable to those found by Wertz and
Santore.
The biological activity of the adsorbed IgG layers shown in figure 3.6 was also
measured. At high adsorbed amounts, when the molecules have a more end-on
orientation, the specific biological activity of IgG is much higher. From this we
conclude that reorientation leads to a loss in biological activity and that
suppression of this phenomenon will lead to a biologically more active layer of
IgG.
It is thus demonstrated that the orientation of later adsorbing IgG molecules can
be improved by pre-adsorbed IgG molecules. In the next section the effect of
other pre-adsorbed molecules, in our case triblock copolymers on subsequently
adsorbing IgG molecules will be discussed.
3.5.2 Triblock copolymer layers
First the adsorption behaviour of triblock copolymers on the hydrophobised silica
will be discussed and thereafter its effect on the adsorption and biological activity
of IgG.
Triblock copolymer (p75) adsorption
Figure 3.7 shows the adsorption of P75 as a function of the flux towards the
46
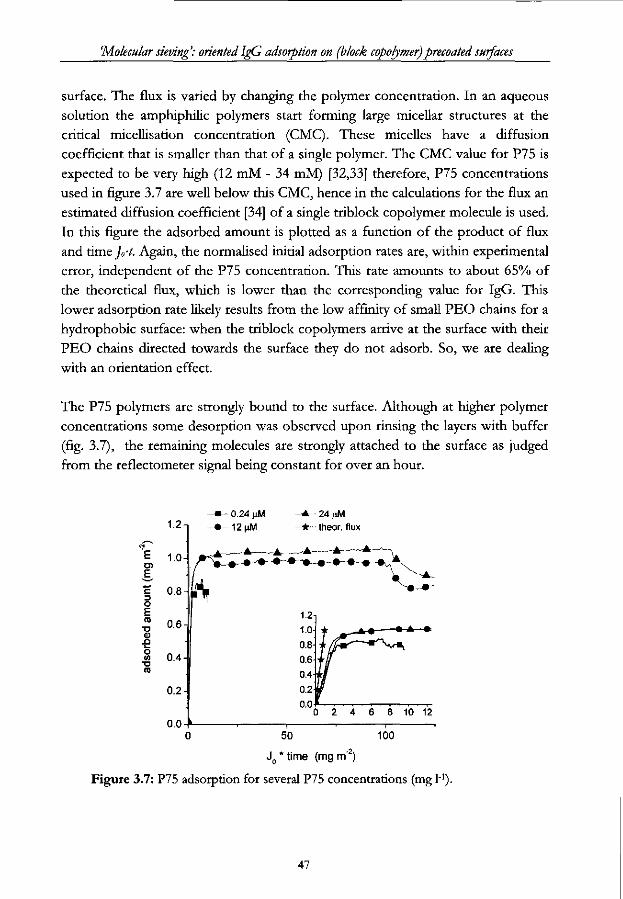
'Molecular sieving: oriented IgG adsorption on (block copolymer) precoated surfaces
surface. The flux is varied by changing the polymer concentration. In an aqueous
solution the amphiphilic polymers start forming large micellar structures at the
critical micellisation concentration (CMC). These micelles have a diffusion
coefficient that is smaller than that of a single polymer. The CMC value for P75 is
expected to be very high (12 mM - 34 mM) [32,33] therefore, P75 concentrations
used in figure 3.7 are well below this CMC, hence in the calculations for the flux an
estimated diffusion coefficient [34] of a single triblock copolymer molecule is used.
In this figure the adsorbed amount is plotted as a function of the product of flux
and time J0-t. Again, the normalised initial adsorption rates are, within experimental
error, independent of the P75 concentration. This rate amounts to about 65% of
the theoretical flux, which is lower than the corresponding value for IgG. This
lower adsorption rate likely results from the low affinity of small PEO chains for a
hydrophobic surface: when the triblock copolymers arrive at the surface with their
PEO chains directed towards the surface they do not adsorb. So, we are dealing
with an orientation effect.
The P75 polymers are strongly bound to the surface. Although at higher polymer
concentrations some desorption was observed upon rinsing the layers with buffer
(fig. 3.7), the remaining molecules are strongly attached to the surface as judged
from the reflectometer signal being constant for over an hour.
O)
E,
c o E (0
T3 0) £ O (0 •o TO
1.2
1.0
0.8
0.6
0.4-
0.2
0.0-K
0.24 nM -12|xM
-A 24 nM * theor. flux
£~
8 10 12
0 50 100
J0 * time (mg m"2)
Figure 3.7: P75 adsorption for several P75 concentrations (mg l1).
47
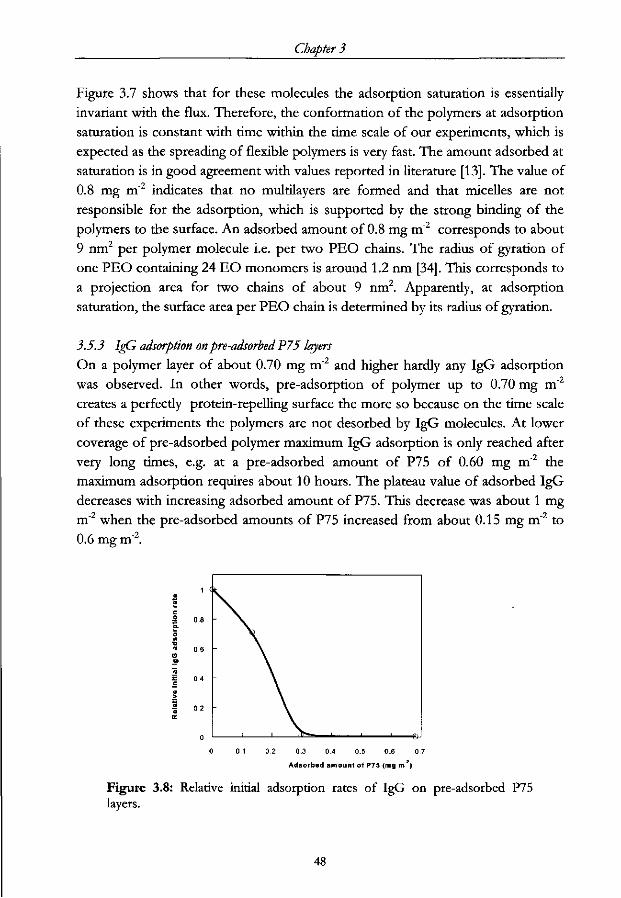
Chapter 3
Figure 3.7 shows that for these molecules the adsorption saturation is essentially
invariant with the flux. Therefore, the conformation of the polymers at adsorption
saturation is constant with time within the time scale of our experiments, which is
expected as the spreading of flexible polymers is very fast. The amount adsorbed at
saturation is in good agreement with values reported in literature [13]. The value of
0.8 mg m"2 indicates that no multilayers are formed and that micelles are not
responsible for the adsorption, which is supported by the strong binding of the
polymers to the surface. An adsorbed amount of 0.8 mg m"2 corresponds to about
9 nm2 per polymer molecule i.e. per two PEO chains. The radius of gyration of
one PEO containing 24 EO monomers is around 1.2 nm [34]. This corresponds to
a projection area for two chains of about 9 nm2. Apparently, at adsorption
saturation, the surface area per PEO chain is determined by its radius of gyration.
3.5.3 IgG adsorption on pre-adsorbed P75 layers
On a polymer layer of about 0.70 mg m"2 and higher hardly any IgG adsorption
was observed. In other words, pre-adsorption of polymer up to 0.70 mg m"2
creates a perfectly protein-repelling surface the more so because on the time scale
of these experiments the polymers are not desorbed by IgG molecules. At lower
coverage of pre-adsorbed polymer maximum IgG adsorption is only reached after
very long times, e.g. at a pre-adsorbed amount of P75 of 0.60 mg m"2 the
maximum adsorption requires about 10 hours. The plateau value of adsorbed IgG
decreases with increasing adsorbed amount of P75. This decrease was about 1 mg
m 2 when the pre-adsorbed amounts of P75 increased from about 0.15 mg m"2 to
0.6 mg m"2.
= o
0.1 0.2 0.3 0.4 0.5 0.6 0.7
Adsorbed amount of P75 (mg m" )
Figure 3.8: Relative initial adsorption rates of IgG on pre-adsorbed P75 layers.
48
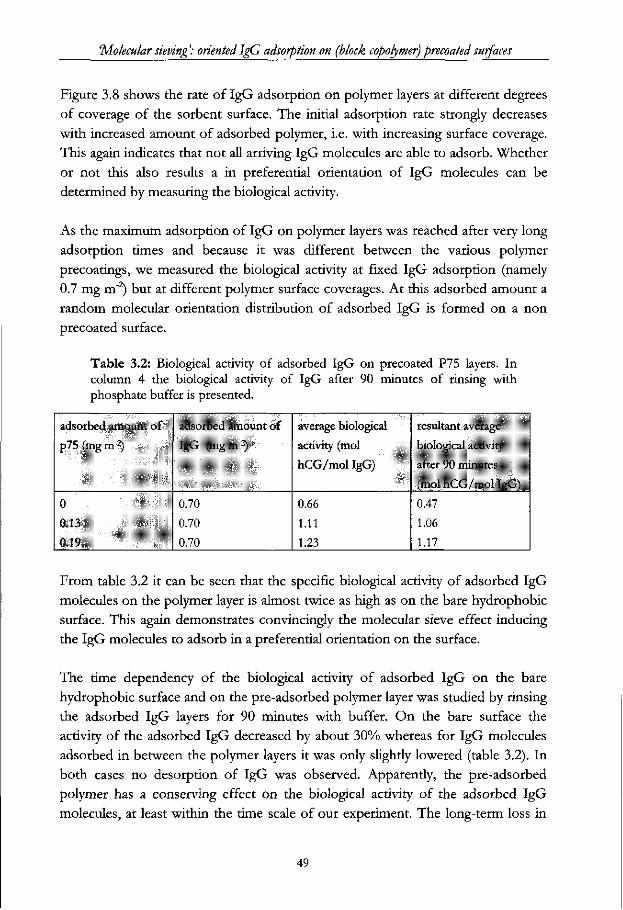
'Molecular sieving': oriented lgG adsorption on (block copolymer)precoated surfaces
Figure 3.8 shows the rate of IgG adsorption on polymer layers at different degrees
of coverage of the sorbent surface. The initial adsorption rate strongly decreases
with increased amount of adsorbed polymer, i.e. with increasing surface coverage.
This again indicates that not all arriving IgG molecules are able to adsorb. Whether
or not this also results a in preferential orientation of IgG molecules can be
determined by measuring the biological activity.
As the maximum adsorption of IgG on polymer layers was reached after very long
adsorption times and because it was different between the various polymer
precoatings, we measured the biological activity at fixed IgG adsorption (namely
0.7 mg m"2) but at different polymer surface coverages. At this adsorbed amount a
random molecular orientation distribution of adsorbed IgG is formed on a non
precoated surface.
Table 3.2: Biological activity of adsorbed IgG on precoated P75 layers. In column 4 the biological activity of IgG after 90 minutes of rinsing with phosphate buffer is presented.
adsorbed amount of
p75 (mg nr2)
0
0.13
0.19
adsorbed amount of
IgG (mgm-2)
0.70
0.70
0.70
average bioJogicul
activity (mol
hCG/molIgC;)
0.66
1.11
1.23
resultant .IYIT.IJ>C
bioloyir.il iifiivnv
al'iiT ')D mimiti's
(nml h(;C;.'innl l|i( i;
0.47
1.06
1.17
From table 3.2 it can be seen that the specific biological activity of adsorbed IgG
molecules on the polymer layer is almost twice as high as on the bare hydrophobic
surface. This again demonstrates convincingly the molecular sieve effect inducing
the IgG molecules to adsorb in a preferential orientation on the surface.
The time dependency of the biological activity of adsorbed IgG on the bare
hydrophobic surface and on the pre-adsorbed polymer layer was studied by rinsing
the adsorbed IgG layers for 90 minutes with buffer. On the bare surface the
activity of the adsorbed IgG decreased by about 30% whereas for IgG molecules
adsorbed in between the polymer layers it was only slightly lowered (table 3.2). In
both cases no desorption of IgG was observed. Apparently, the pre-adsorbed
polymer has a conserving effect on the biological activity of the adsorbed IgG
molecules, at least within the time scale of our experiment. The long-term loss in
49

Chapter 3
26. Dijt, J.C., Cohen Stuart, M.A., and Fleer, G.J. (1994) Adv. Colloid Interf. Sci.
50, 79.
27. Chapter 7, this thesis.
28. Buijs, J., Ph.D. Thesis, Wageningen Agricultural University, 1995.
29. Ortega-Vinuesa, J.L., Galvez Ruiz, M.J., and Hidalgo-Alvarez, R. (1996)
I^angmuir 12, 3211.
30. Chapter 6, this thesis.
31. Giacomelli, C.E., Bremer, M.G.E.G., and Norde, W. (1999) / . Colloid Interf.
Sci. 220,13.
32. McPherson, T., Kidane, A., Sleifer, I., and Park, K. (1998) luingmuir 14, 176.
33. Alexandridis, P., Holzwarth, J.F., and Hatton, T.A. (1994) Macromolecules 27,
2414.
34. Fleer, G.J., Cohen Stuart, M.A., Scheutjens, J.M.H.M., Cosgrove, T.,
Vincent, B. Polymers at Interfaces, Chapmann & Hall, London, 1993.
52
Chapter 4
ATR-FTIR STUDY OF I G G A D S O R B E D O N D I F F E R E N T SILICA
SURFACES
Abstract The secondary structure of adsorbed immunoglobulin G (IgG) on different silica surfaces (hydrophilic, hydrophobic, hydrophobic with pre-adsorbed triblock copolymers consisting of a polypropylene oxide buoy and two polyethylene oxide chains dangling in the solution) is studied by ATR-FTIR. Some results for adsorbed bovine serum albumin (BSA) are also presented. The secondary structure of adsorbed IgG was quantified using second derivative spectra for the input parameters of the curve-fitting analysis of the original spectra. The secondary structure of adsorbed IgG on hydrophilic silica surface resembles that of IgG in solution (about 60% of p-sheet and almost no a-helix content). There is some loss in the helix content of BSA after adsorption on the hydrophilic surface but this structural element is still the most important one in the adsorbed protein. The IR spectra of the adsorbed proteins on the hydrophobic silica surface can not be interpreted probably because of a large contribution to the IR signal of water molecules that are exchanged against the proteins during adsorption. The presence of pre-adsorbed triblock copolymers reduces the adsorbed amount and causes an effect on the adsorbed proteins similar to that exerted by ethylene glycol: a different type of P-sheet structure in IgG and a more ordered a-helix structure in BSA are provoked.
Chapter 4
4.1 Introduction
Adsorption of monoclonal immunoglobulin G (IgG) to solid surfaces is of great
interest for designing immuno-diagnostic test systems. In these systems IgG is
immobilised onto particles (e.g. immunolatices) or onto flat surfaces (e.g. ELISA).
To assure proper antigen binding it is essential that the IgG molecule retains
sufficient structural integrity and that it adopts a right orientation on the sorbent
surface. An IgG molecule is composed of four polypeptide chains that are
connected by disulphide bonds and non-covalent forces. The four chains can be
divided into two groups: two heavy and two light chains. All four polypeptide
chains are grouped in different domains, two F(ab) segments and one Fc segment,
together forming a Y-shaped conformation. The antigen-binding sites are located
on the far ends of the F(ab) segments. It may be clear that the right orientation of
the adsorbed IgG molecules is obtained when the Fc part is attached to the
surface and its F(ab) parts are exposed to the antigen-containing solution.
Co-adsorption of proteins and copolymers may be applied to control the
conformation and/or orientation of adsorbed IgG. The copolymer used anchor
with one block to the sorbent surface, whereas the other part(s) extend into the
solution. The adsorption of (co)polymers may reduce or even prevent the
subsequent protein adsorption due to a steric repulsion. Furthermore, the
adsorbed (co)polymers influence the sorbent surface characteristics as charge
density, hydrophobicity, etc. Hence, the interaction between IgG and the sorbent
surface modified by the pre-adsorbed copolymers is determined by a complex
combination of steric, electrostatic, hydrophobic and van der Waals contribution.
Whatever the exact mechanism of the interaction is, the subsequent IgG
adsorption behavior, with respect to the adsorbed amount, conformation and
orientation, strongly depends on the surface density of the pre-adsorbed
copolymer and on the lengths of its parts that anchor to the surface and that
extend into the solution, respectively [5,6]. In addition, the presence of pre-
adsorbed components influences the sorbent surface characteristics as charge
density, hydrophobicity, etc. In turn, these properties are known to affect the
protein adsorption behaviour. Hence, even if the proper orientation is achieved,
the pre-adsorbed copolymer or protein may affect the amount and the
conformation of the subsequently adsorbed IgG.
The secondary structure of proteins in an environment relevant for immunological
applications may be studied by spectroscopic methods. Infrared (IR) spectrometry
has been used extensively to examine the structure of proteins in solution [7-9]
54
A.TR-FTIR study oflgG adsorbed on different silica surfaces
while IR in combination with attenuated total reflectance (ATR) has been used to
obtain spectra of adsorbed protein [10-11]. The IR spectra of proteins exhibit a
number of amide bands; the amide I band (1600-1700 cm"1) is mosdy used to
extract information on the protein's secondary structure. Because each of the
different secondary structural elements contributes to the IR spectrum, the
observed amide bands are composed of several overlapping components. The
fundamental difficulty encountered in the analysis of the contour of an amide
band is that the individual component peaks can not be resolved and/or identified
direcdy in the measured spectra. Derivation of structural information requires
extensive mathematical manipulation [12]. Separation of the overlapping peaks can
be increased by calculating the nth (usually second) derivative of the original
absorption spectrum [10,13] or by using the computational procedure of Fourier
deconvolution [7,14]. A quantitative analysis of the secondary structure of the
protein can then be performed by using the information provided by the «th
derivative to curve-fitting the original spectra or by curve-fitting the Fourier
deconvolved spectra.
A structural analysis of a monoclonal IgG adsorbed on different silica surfaces
(hydrophilic, hydrophobic, hydrophobic with pre-adsorbed triblock copolymers)
was performed using ATR-FTIR spectroscopy. The experiments were carried out
with a silicon cylindrical internal reflecting element which has a silica surface layer.
Structural analysis was obtained from the amide I region and the area of the amide
II region was used to asses the relative adsorbed amounts. A fitting procedure
using second derivative spectra for the input parameters was applied to the ATR-
FTIR original spectra in order to analyse the secondary structure elements. In
addition, some experiments were carried out with bovine serum albumin (BSA) in
order to compare the results between this protein and IgG.
4.2 Materials and Methods
4.2.1 Proteins
The monoclonal immunoglobulin, IgG, was obtained from Organon Teknika
(Boxtel, The Netherlands); its characteristics were published elsewhere [10,15].
The IgG concentration was spectroscopically determined using an extinction
coefficient of 1.45 cm2 mg"1 at 280 nm. BSA was a commercial product (Sigma,
A7906) and used without further purification. Protein solutions were prepared in a
5 mM phosphate buffer at pH 6 and the experiments were performed using
0.050 g l"1 solution.
55
Chapter 4
4.2.2 Surfaces
The experiments were carried out with three different surfaces:
Hydrophilic silica, the cylindrical internal reflectance crystal. This silicon crystal has a
silica surface layer. The contact angle of a drop of water on such an oxide layer is
between 0° and 5°.
Hydrophobic methylated silica, obtained by immersion of the crystal in 9 % (v/v)
dichlorodimethylsilane in toluene for 30 minutes, then shortly rinsed with ethanol
and finally heated at 110 °C during 15 minutes. After this treatment the contact
angle of a drop of H 2 0 on this surface was 90°.
Hydrophobic methylated silica mth adsorbed triblock copolymers of poly(ethylene oxide)
(PEO) and polypropylene oxide) (PPO), i.e. PEO-PPO-PEO.
The crystal was cleaned with a plasma cleaner prior to IR measurements
(hydrophilic silica surface) or before the surface was hydrophobised.
4.2.3 Other solutions
Buffer solutions were prepared by mixing the appropriate volumes of 5 mM
Na 2 HP0 4 and 5 mM NaH 2 P0 4 solutions.
A 0.3 g l"1 stock solution of the P75 triblock copolymer (ICI, Rotterdam The
Netherlands) was prepared in buffer, stored at 5 °C and diluted properly for the
experiments. The molecular weight of the PPO and PEO segments in the P75
triblock copolymer is 2000 Da (34 monomers) and 1075 Da (24 monomers)
respectively.
4.2.4 FT-IR measurements
Spectra were collected with a model 1725X FTIR spectrometer (Perkin-Elmer).
The spectra were obtained with a N2-cooled mercury cadmium telluride detector at
a resolution of 1 cm"1, using a normal Norton-Beer apodisation function. The
FTIR spectrometer was continuously purged with air which was freed from H 2 0
and C 0 2 vapour. The data acquisition and processing were performed as described
by Buijs et al. [10]. Briefly, the protein spectra were obtained after subtracting the
background (buffer solution) from the sample (buffer + protein solution) spectra,
using a scaling factor that made the 1720-1800 cm"1 region flat [16]. A correction
for the presence of water vapour was also carried out. Before taking the second
derivative spectra, the original protein spectra were smoothed using a triangular
smoothing procedure. The curve-fitting was performed on the original spectra by
assuming a Lorentzian shape for the amide I band and for each individual peak.
56

ATR-b'l 1R study oflgG adsorbed on different silica surfaces
4.3 Results and D i scuss ion
4.3.1 Structural Analysis
Hydrophilic Silica
Representative spectra of IgG adsorbed on hydrophilic silica are shown in figure
4.1. In order to compare data obtained at different adsorption times and in
separate experiments, the spectra were normalised between 0 and 1. Figure 4.1
compares the normalised spectra obtained in the same experiment at different
adsorption times; the deviation between these curves is less than 2%. The spectra
obtained at the same adsorption time but in different experiments (not shown)
revealed that the reproducibility is within 5%. Table 4.1 lists the positions of the
maximum of the amide I and amide II bands and their intensity and area ratios for
different adsorption times (Si; IgG). These values are the average of, at least, two
separate experiments. There is almost no variation with adsorption time neither in
the positions of the bands nor in their intensity and area ratios.
1500 1550 1600 1650 1700 1750 Frequency (em )
Figure 4.1: Normalised spectra of IgG adsorbed on hydrophilic silica surface at different adsorption times. The time scale is based on the sequence in which the spectra were taken, i.e., the first spectrum (t=0) was taken after 13 minutes of the first protein-surface contact (5 minutes for filling the cell and 8 minutes to perform the frequency scan).
57

Chapter 4
Table 4.1: comparison of the amide I and II bands for IgG and BSA adsorbed on hydrophilic (Si) and hydrophobic + copolymer (Si+C) silica surfaces.
Position
Amide I
(cm-')
Position
Amide II
(cm-1)
Intensity
Ratio2
Area
Ratio2
Time (minutes)2
Si IgG
BSA
Si+C IgG
BSA
Si IgG
BSA
Si+C IgG
BSA
Si IgG
BSA
Si+C IgG
BSA
Si IgG
BSA
Si+C IgG
BSA
0
1637
1647
1637
1650
1548
1547
1545
1547
1.56
1.64
1.58
1.53
1.30
1.86
1.33
1.53
8
1637
1647
1637
1649
1549
1546
1546
1547
1.61
1.58
1.60
1.56
1.30
1.73
1.33
1.68
16
1637
1648
1635
1649
1548
1546
1547
1547
1.65
1.55
1.60
1.50
1.37
1.67
1.46
1.50
2-1
1637
1647
1635
1649
1548
1547
1545
1547
1.63
1.53
1.61
1.53
1.36
1.66
1.44
1.57
32
1637
1648
1635
1649
1549
1547
1549
1547
1.69
1.53
1.60
1.52
1.38
1.64
1.34
1.67
40
1637
1649
1635
1649
1549
1547
1549
1547
1.67
1.53
1.59
1.49
1.38
1.61
1.43
1.62
"The time scale is based on the sequence in which the spectra were taken, i.e., the first spectrum
(t=0) was taken after 13 minutes of the first protein-surface contact (5 minutes for filling the cell
and 8 minutes to perform the frequency scan). 2Amide I / Amide II.
Table 4.2: comparison of the peak positions obtained with the second derivative spectra (SD) and after curve-fitting (CF) the original spectra of IgG adsorbed on different silica surfaces.
(i-sheet
P-tums
Ot-helix-' unordered
side chains
Hydrophilic Silica
SD <:i
1672 ± 3 cm '
1637 1 2 cm-1
1624 ± 4 cm1
1692 ± 1 cm-1
1661 ± 3 cm-1
1652 ± 5 cm-1
1615 ± 3 cm-1
10"5 _ . 2 a n
1636 ± 1 cm1
1625 1 2 cm 1
1688 ± 2 cm1
1661 ± 1 env1
1647 ± 1 cm-1
1613 1 2 cm1
Hydrophobic
SO
1072 ±4 cm-1
1638 ± 1 cm-
1622 ± 2 cm-
1631 ± 1 cm-
1693 ± 1 cm-
1662 ± 1 cm-
1650 ± 5 cm-
1612 ± 3 cm-
Silica + Copolymer
CF
1674 ± 2 cm-1
1637 ± 1 cm-1
1622 ± 2 cm-1
1630 ± 1 cm-1
1 6 8 8 1 2 cm1
1660 ± 1 cm-1
1647 ± 1 cm-1
1 6 1 3 1 2 cm1
58

ATR-FTIR study oflgG adsorbed on different silica surfaces
> CO
> CD
a T3 C o o a> CO
1600 1620 1640 1660 1680 1700 1720
Frequency (cm-1)
Figure 4.2: Second derivative (SD) spectra of IgG adsorbed on hydrophilic silica surface at different adsorption times after smoothing the original spectra over a range of 13 cm1. From top to bottom, t=8 minutes, t=24 minutes and t=40 minutes (see figure 4.1, for time scale).
All IR spectra obtained for IgG adsorbed on hydrophilic silica show the maximum
of the amide I band at 1637 cm'1, which is typical of proteins with high P-sheet
content [7,17]. Several different experimental methods to determine the structural
components of IgG in solution reveal that this protein largely consists of p-sheet
structures while the CC-helix content, if any, is small [7,15,18]. The amide I position
at 1637 cm"1 found in the spectra shows that also in adsorbed IgG the p-sheet
structure is the main structural component. Moreover, the fact that the normalised
spectra of adsorbed IgG at various adsorption times show no differences in their
positions and band widths strongly suggests that the protein does not change its
structure after adsorption on the hydrophilic surface, or if there is any change it
has occurred before the first spectrum is taken. This last possibility should not be
ruled out, because before the first spectrum is taken there may have been enough
time elapsed for the adsorbed protein to change its conformation: 5 minutes were
59
Chapter 4
necessary to displace the buffer solution and fill the cell with protein solution and
another 8 minutes were required to take the first spectrum.
Some studies suggest that the amide I/amide II intensity and area ratios may be
associated with changes in the secondary structure of the protein [19,20]. The
observation that for the adsorbed IgG these ratios do not significantly change with
time reinforces the idea that the secondary structure of the protein is the same for
the different adsorption times. Therefore the number of peaks in the second
derivative (SD) spectra should be invariant with time as well, which implies that
the input parameters for the curve-fitting (CF) procedure should be the same.
Figure 4.2 compares the SD spectra of the amide I band obtained at three
adsorption times. Since small fluctuations in absorption intensity are magnified in
the derivatives, noise must be suppressed before taking the SD in order to
discriminate noise from real peaks. The spectra in Figure 4.2 were obtained after
smoothing the original spectra over a range of 13 cm"1. Table 4.2 lists the average
positions of the peaks found in the SD spectra of the amide I band for different
adsorption times and in different experiments. It shows that the deviation in the
average of each characteristic frequency is in the worst case + 5 cm"1. These
positions are in very good agreement with those reported in the literature for IgG
using different IR methods (ATR and transmission) and using different
mathematical manipulation of the data, such as SD, CF or Fourier self-
deconvolution [7,10,21-23].
The CF procedure was performed on the normalised original spectra (without
smoothing) using the seven peak positions found in the SD as input parameters.
Figure 4.3 shows a representative CF result for IgG adsorbed on hydrophilic silica.
Table 4.2 compares the peak positions of each structural element present in the
SD spectra and those obtained after CF of the original spectra. A great deal of care
must be taken with CF, because there are a large number of adjustable parameters
(3n, where n is the number of peaks) and the solution may not be unique.
Nevertheless, the aim of this fitting procedure is to compare the secondary
structure of the IgG adsorbed on different surfaces and if the procedure is carried
out always in the same way the results allow such a comparison. It is to be noted
that the amide I band can be fitted using less than seven peaks but their positions
are different from those obtained in the SD spectra (they are somewhat in the
middle of two positions) and the widths of the peaks are larger than those
reported as 'normal' for structural elements [7,10].
60

ATR-tllR study ofl^G adsorbed on different silica surfaces
1580 1600 1620 1640 1660 1680 1700
Frequency (cm-1) Figure 4.3: Experimental (solid curve) and calculated spectra (dashed curves) of IgG adsorbed on hydrophilic silica surface. The calculated spectrum was obtained by curve-fitting the experimental one using 7 peaks.
Perhaps the most critical step in the interpretation of IR spectra is the assignment
of each peak to an individual structural element. However, the analysis becomes
less ambiguous if the protein is known to possess a major secondary structural
element. It is well known that the (3-sheet is the main secondary structure element
of IgG in solution. As it can be concluded from the amide I band position, from
the lack of changes in its band width and in the intensity and area ratios and from
the dominant peak in the SD spectra, the (3-sheet is also the main structure in the
adsorbed IgG molecules. The absorption peaks at 1637 and 1624 cm"1 are
univocally related to P-sheet structure, and are usually called as the low frequency
'P-component'. This multiplicity between 1620 and 1640 cm"1 in 'P-peaks' has
been frequendy observed in P-sheet-containing proteins and reflects differences in
the hydrogen bonding strength as well as differences in transition dipole coupling
in different P-strands [12]. The high frequency 'P-component' may be overlapping
with contributions from P-turns and unordered structures and it is not univocally
related to a particular absorption peak: in the literature the peaks observed
61
Chapter 4
between 1690 and 1660 cm"1 were assigned to either (3-turns or (3-sheet [7,10,21].
Based on the spectra of proteins with very high P-sheet content, Byler and Susi
[7,13] assign the peaks observed in the region of 1680-1670 cm"1 to the high
frequency component of (3-sheet structure and suggested that the sum of all the
integrated areas of the 'p-peaks', as a fraction of the total amide I band area, is
closely related to the total '(3-content' of a given protein. On this basis, the P-sheet
content of the adsorbed IgG was calculated by using the peaks centred at 1675,
1636 and 1625 cm"1. The peaks at 1688 and 1661 cm"1 were assigned to P-turns.
The peak centred at 1613 cm"' was assigned to the absorption of the side chains of
tyrosine and arginine [10,22] and it was therefore ignored in the quantification of
the different structural elements. The largest problem in the assignment of the
secondary structure of the IgG to a particular absorption peak arises with the (X-
helix and unordered structures because the positions of these structural elements
differ only slightly [12]. It is well established that the presence of H 2 0 vapor gives
rise to narrow adsorption peaks in the amide I region which are very weak in the
original spectrum but become amplified upon derivation [12]. Then, H 2 0 vapor
should be properly eliminated (by purging the spectrometer with dry air) and
corrected for (by spectral subtraction) to remove as much as possible these
artefacts appearing in the SD spectra. The presence of these peaks becomes
critical in the assignment when the real component peak is produced by a
structural element which overlaps with another component or is not the main
element. Usually, peaks centred at around 1655 cm"1 are assigned to a-structures
and those around 1646 cm"1 to unordered structures [7,24]. A comparison between
positions obtained in the SD and in the CF procedure respectively, reveals that the
peak obtained with the SD (1652 cm"1) seems to be related with (X-helix while that
obtained after CF (1647 cm"1) should rather be assigned to unordered structure.
Therefore, the absorption peak centred at around 1650 cm"1 may reflect either one
of the two elements or both. As it is known that IgG contains both structural
elements, this peak was interpreted as representing the sum of OC-helix and
unordered structure.
The percentage of each individual structural element was calculated as the ratio
between the area of the corresponding peak and the total amide I band area. This
implies that the effective absorptivities of each structural element were assumed to
be equal. Figure 4.4 shows the average percentages of the different structural
elements as a function of adsorption time. The error bars were calculated from the
differences between the percentages obtained in separate experiments at the same
adsorption time. In order to check the certainty of the CF procedure different
62
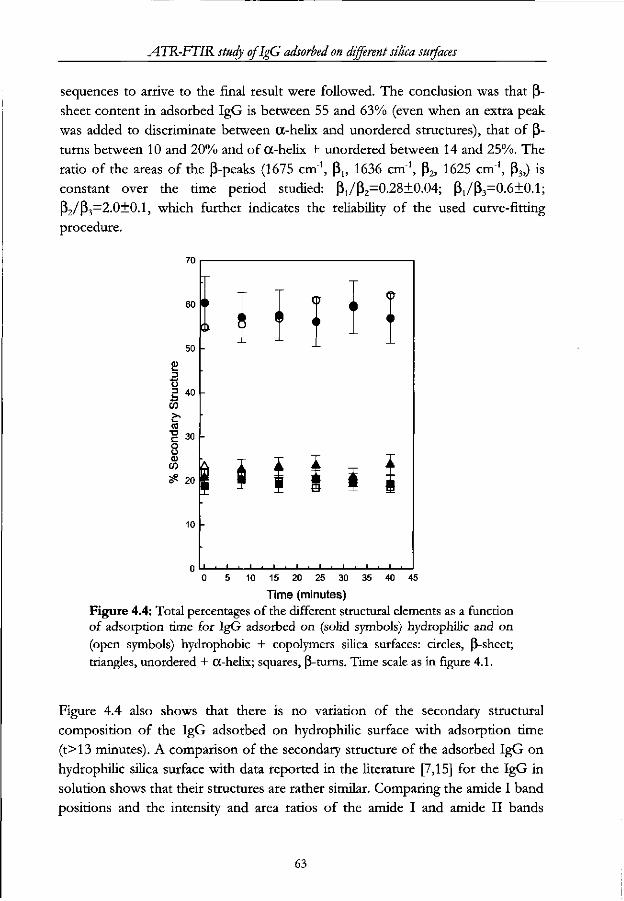
A.TK-b'11R study oflgG adsorbed on different silica surfaces
sequences to arrive to the final result were followed. The conclusion was that P-
sheet content in adsorbed IgG is between 55 and 63% (even when an extra peak
was added to discriminate between OC-helix and unordered structures), that of P-
turns between 10 and 20% and of (X-helix + unordered between 14 and 25%. The
ratio of the areas of the p-peaks (1675 cm"1, p1; 1636 cm"1, (32, 1625 cm"1, (33,) is
constant over the time period studied: P,/f32=0.28±0.04; p1/P3=0.6±0.1;
p2 /P3=2.0±0.1, which further indicates the reliability of the used curve-fitting
procedure.
15 20 25 30 35 40 45
Time (minutes) Figure 4.4: Total percentages of the different structural elements as a function of adsorption time for IgG adsorbed on (solid symbols) hydrophilic and on (open symbols) hydrophobic + copolymers silica surfaces: circles, P-sheet; triangles, unordered + (X-helix; squares, p-turns. Time scale as in figure 4.1.
Figure 4.4 also shows that there is no variation of the secondary structural
composition of the IgG adsorbed on hydrophilic surface with adsorption time
(t>13 minutes). A comparison of the secondary structure of the adsorbed IgG on
hydrophilic silica surface with data reported in the literature [7,15] for the IgG in
solution shows that their structures are rather similar. Comparing the amide I band
positions and the intensity and area ratios of the amide I and amide II bands
63

Chapter 4
already points to that conclusion. However, SD and CF analyses are required to
estimate the secondary structural composition of the adsorbed protein in a
quantitative way.
8 0.4 -
1600 1650 1700 Frequency (cm-1)
1750
Figure 4.5: Normalised spectra of (solid curves) IgG and 9 (dashed curves) BSA adsorbed on hydrophilic silica surface and their second derivative (SD) spectra in the amide I region.
Before presenting the results obtained for IgG adsorbed on a modified silica
surface, some results obtained for BSA adsorbed on hydrophilic silica under the
same experimental conditions will be discussed. Figure 4.5 compares the
normalised spectra (and their SD in the amide I region) of IgG with those of BSA,
both at the same adsorption time (24 minutes). The figure shows a shift in the
position of the amide I maximum when the protein is changed while the amide II
position is almost the same. This is not surprising because the secondary structures
of BSA and IgG are rather different. It is reported that, in contrast to IgG, BSA in
64
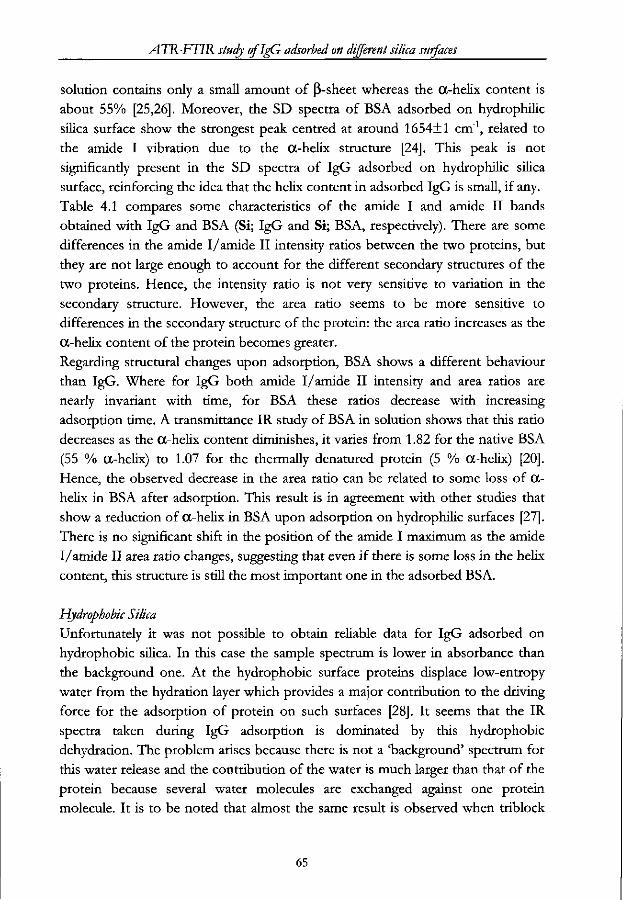
ATRrb'L 1R study oflgG adsorbed on different silica surfaces
solution contains only a small amount of (5-sheet whereas the Ot-helix content is
about 55% [25,26]. Moreover, the SD spectra of BSA adsorbed on hydrophilic
silica surface show the strongest peak centred at around 1654+1 cm1 , related to
the amide I vibration due to the (X-helix structure [24]. This peak is not
significandy present in the SD spectra of IgG adsorbed on hydrophilic silica
surface, reinforcing the idea that the helix content in adsorbed IgG is small, if any.
Table 4.1 compares some characteristics of the amide I and amide II bands
obtained with IgG and BSA (Si; IgG and Si; BSA, respectively). There are some
differences in the amide I/amide II intensity ratios between the two proteins, but
they are not large enough to account for the different secondary structures of the
two proteins. Hence, the intensity ratio is not very sensitive to variation in the
secondary structure. However, the area ratio seems to be more sensitive to
differences in the secondary structure of the protein: the area ratio increases as the
OC-helix content of the protein becomes greater.
Regarding structural changes upon adsorption, BSA shows a different behaviour
than IgG. Where for IgG both amide I/amide II intensity and area ratios are
nearly invariant with time, for BSA these ratios decrease with increasing
adsorption time. A transmittance IR study of BSA in solution shows that this ratio
decreases as the OC-helix content diminishes, it varies from 1.82 for the native BSA
(55 % OC-helix) to 1.07 for the thermally denatured protein (5 % OC-helix) [20].
Hence, the observed decrease in the area ratio can be related to some loss of OC-
helix in BSA after adsorption. This result is in agreement with other studies that
show a reduction of OC-helix in BSA upon adsorption on hydrophilic surfaces [27].
There is no significant shift in the position of the amide I maximum as the amide
I/amide II area ratio changes, suggesting that even if there is some loss in the helix
content, this structure is still the most important one in the adsorbed BSA.
Hydrophobic Silica
Unfortunately it was not possible to obtain reliable data for IgG adsorbed on
hydrophobic silica. In this case the sample spectrum is lower in absorbance than
the background one. At the hydrophobic surface proteins displace low-entropy
water from the hydration layer which provides a major contribution to the driving
force for the adsorption of protein on such surfaces [28]. It seems that the IR
spectra taken during IgG adsorption is dominated by this hydrophobic
dehydration. The problem arises because there is not a 'background' spectrum for
this water release and the contribution of the water is much larger than that of the
protein because several water molecules are exchanged against one protein
molecule. It is to be noted that almost the same result is observed when triblock
65

Chapter 4
copolymers are adsorbed on the hydrophobic silica surface. Therefore, this effect
is related to dehydration of the hydrophobic sorbent surface rather than to the
adsorbed protein or copolymer molecules.
Hydrophobic Silica + Copolymer
The experimental procedure was slightly different when triblock copolymers were
firstly adsorbed on the surface. First, a spectrum was measured in the presence of
buffer solution, then the flow cell was filled with a triblock copolymer solution
(0.3 mg l"1) and a copolymer spectrum was taken. After that, the cell was rinsed
with buffer solution and the background spectrum was taken. Finally, the cell was
filled with protein and the sample spectra were taken following the same
experimental procedure as described above.
The silica surface was hydrophobised before copolymer adsorption in order to
have the copolymer adsorbed through its PPO parts (approximately 12 nm)
whereas its PEO parts (approximately 6 nm) protrude into the solution. The result
of this adsorption is a brush conformation of the adsorbed copolymers [29]. It is
well known that such a coating, under well-chosen conditions regarding the length
and the adsorption density of the PEO chains, diminishes or even prevents
protein adsorption [29]. However, the adsorption density and length of the chains
chosen in this study are lower than those that prevent protein adsorption. The
adsorption of the P75 copolymer on hydrophobic surfaces, as determined by
streaming potential measurements, leads to a layer thickness ranging between 1.5
and 2.5 nm, which is smaller than the radius of gyration expected from the
dimensions of the PEO blocks (3.6 nm). The maximum adsorbed amount of the
PEO-PPO-PEO copolymers on hydrophobic silica was measured to be 1 mg m 2
[29]. In the present study the adsorbed amount is lower than the maximum in
order not to fully block the surface for subsequent IgG adsorption but rather to
direct the arriving IgG molecules to attach in a preferred orientation on the
surface. Therefore, the modified silica surface contains an incomplete monolayer
of PEO-PPO-PEO block copolymers in a brush conformation. The
hydrophobicity of the surface is expected to be intermediate between that of the
hydrophilic unmodified silica surface (0°-5°) and that of the methylated silica
surface (90°). However, the water wettability of surfaces modified with PEO show
substantial hysteresis between the advancing and receding contact angles [30].
Consequently, contact angle measurements on such surfaces do not provide
unambiguous information on its hydrophobicity.
66
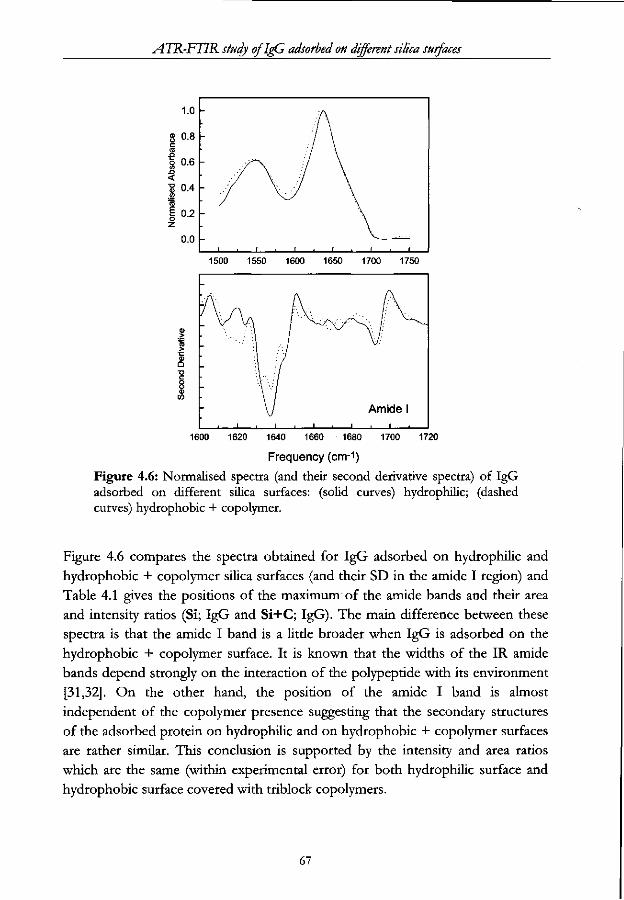
ATR-FTIR study oflgG adsorbed on different silica surfaces
1600 1620 1640 1660 1680 1700 1720
Frequency (cm-1)
Figure 4.6: Normalised spectra (and their second derivative spectra) of IgG adsorbed on different silica surfaces: (solid curves) hydrophilic; (dashed curves) hydrophobic + copolymer.
Figure 4.6 compares the spectra obtained for IgG adsorbed on hydrophilic and
hydrophobic + copolymer silica surfaces (and their SD in the amide I region) and
Table 4.1 gives the positions of the maximum of the amide bands and their area
and intensity ratios (Si; IgG and Si+C; IgG). The main difference between these
spectra is that the amide I band is a litde broader when IgG is adsorbed on the
hydrophobic + copolymer surface. It is known that the widths of the IR amide
bands depend strongly on the interaction of the polypeptide with its environment
[31,32]. On the other hand, the position of the amide I band is almost
independent of the copolymer presence suggesting that the secondary structures
of the adsorbed protein on hydrophilic and on hydrophobic + copolymer surfaces
are rather similar. This conclusion is supported by the intensity and area ratios
which are the same (within experimental error) for both hydrophilic surface and
hydrophobic surface covered with triblock copolymers.
67

Chapter 4
The SD spectra of IgG adsorbed on hydrophobic + copolymer silica surface were
analysed in the same way as those obtained with the hydrophilic surface. There are
no major differences between the SD spectra obtained for adsorbed IgG on both
surfaces (Figure 4.6 and Table 4.2). The only remarkable difference is the
appearance of an extra peak, pardy overlapping with the dominant peak, centred at
1631 cm"1, when IgG is adsorbed on the hydrophobic + copolymer surface.
Wasacz et al. [21] reported a shift of the strongest amide I peak from 1638 cm"1 to
1629 cm"1 leaving a weak shoulder near 1640 cm"1 when y-globulins were
transferred from aqueous solution to ethylene glycol. This shift was interpreted as
a change in the (3-sheet structure, i.e. the P-sheet type of y-globulins exposed to
ethylene glycol is different from that observed in aqueous solution. The authors
assigned the shoulder to the original p-sheet structure (in aqueous solution) and
the strongest peak to a different type of P-sheet structure (in ethylene glycol). The
low frequency shift indicates The additional peak found in the presence of the
pre-adsorbed copolymers (of which the PEO parts resemble the structure of
ethylene glycol) could as well reflect a change in the type of p-sheet structure.
Indeed, the change in the environment of the protein (from hydrophilic to
hydrophobic + copolymer surface) is to some extent comparable with the change
from water to ethylene glycol. This change is less pronounced in the system
studied here because of the dimensions of the IgG molecule and the PEO chains,
relative to each other. The IgG has a Y-shaped conformation with dimensions of
7.0x6.3x3.1 nm3 for the Fc fragment and 8.25x5.0x3.8 nm3 for each of the two
F(ab) fragments [10,15], whereas the PEO parts of the copolymer protrude into
the solution over shorter distances [29]. Hence, IgG can penetrate the PEO-brush
only partly, leaving a part of its molecule in the aqueous environment. This could
be the reason that the P-sheet peak appearing around 1631 cm"1 does not replace
the original one at 1637 cm"1. The low frequency shift indicates stronger hydrogen
bonds [33] which could result from either intermolecular or intramolecular
bonding. Wasacz et al. [21] suggested intermolecular p-sheet formation (related to
some unfolding of the protein) when IgG is transferred from aqueous solution to
ethylene glycol. However, as stated above, the presence of the copolymers on the
adsorbed IgG has a smaller effect on the P-sheet structure than ethylene glycol. In
the copolymer case the shift may be related to the difference in the strength of the
hydrogen bonds within the p-sheet structure upon changing the protein to a less
polar environment.
Ethylene glycol further causes an increase in the amount of helix in IgG; such a
variation in helical content is not induced by the presence of copolymers because
68

ATR-FTIR study oflgG adsorbed on different silica surfaces
the amide I maximum does not shift and the SD spectrum does not indicate an
additional peak. Altogether, it seems that the pre-adsorbed copolymers have a
similar, but smaller, effect on the (3-sheet of IgG than that caused by ethylene
glycol.
10 15 20 25 30 35
Time (minutes)
Figure 4.7: Percentages of the different structural elements in |3-sheet as a function of adsorption time of IgG adsorbed on (solid symbols) hydrophilic and on (open symbols) hydrophobic + copolymer silica surfaces: circles, low frequency component; triangles, low frequency component; squares, high frequency component; , diamonds 'additional' component. Time scale as in figure 4.1.
The CF procedure was performed as with the hydrophilic surface except that, in
view of the appearance of the peak at 1631 cm"1, eight peaks (instead of seven)
were used. Table 4.2 and Figure 4.4 compare the peak positions and the
percentages of the different structural elements as a function of adsorption time
for IgG on hydrophilic and on hydrophobic + copolymer surfaces, respectively.
There are no significant differences in the total content of each element. Figure 4.7
compares the percentage of each (3-sheet component (1672, 1637, 1625 and 1631
cm"1) with and without copolymers on the surface. There is a decrease in the
percentage of the two low frequency components when the copolymer is present
on the surface while the high frequency one is unaffected. As it is the case with
ethylene glycol, the new form of (3-sheet structure is formed from the original (3-
sheet segments [21]. The ratio of the areas of the (3-peaks are also constant for (3^
69
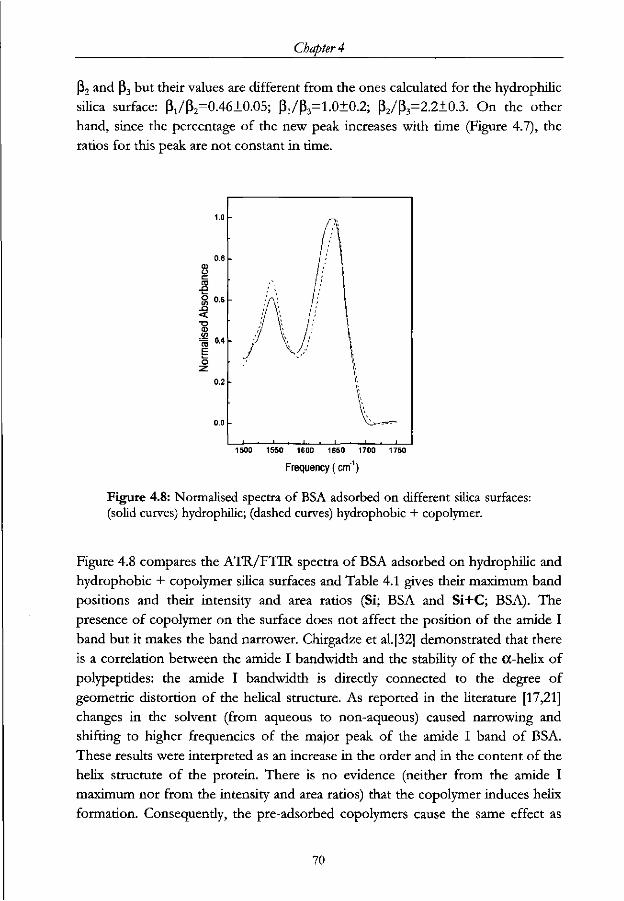
Chapter 4
(32 and P3 but their values are different from the ones calculated for the hydrophilic
silica surface: (31/p2=0.46±0.05; p,/p3=1.0±0.2; p2/p3=2.2±0.3. On the other
hand, since the percentage of the new peak increases with time (Figure 4.7), the
ratios for this peak are not constant in time.
1500 1550 1600 1650 1700 1750
Frequency (cm")
Figure 4.8: Normalised spectra of BSA adsorbed on different silica surfaces: (solid curves) hydrophilic; (dashed curves) hydrophobic + copolymer.
Figure 4.8 compares the ATR/FTIR spectra of BSA adsorbed on hydrophilic and
hydrophobic + copolymer silica surfaces and Table 4.1 gives their maximum band
positions and their intensity and area ratios (Si; BSA and Si+C; BSA). The
presence of copolymer on the surface does not affect the position of the amide I
band but it makes the band narrower. Chirgadze et al.[32] demonstrated that there
is a correlation between the amide I bandwidth and the stability of the OC-helix of
polypeptides: the amide I bandwidth is direcdy connected to the degree of
geometric distortion of the helical structure. As reported in the literature [17,21]
changes in the solvent (from aqueous to non-aqueous) caused narrowing and
shifting to higher frequencies of the major peak of the amide I band of BSA.
These results were interpreted as an increase in the order and in the content of the
helix structure of the protein. There is no evidence (neither from the amide I
maximum nor from the intensity and area ratios) that the copolymer induces helix
formation. Consequently, the pre-adsorbed copolymers cause the same effect as
70
ATR-FTIR study oflgG adsorbed on different silica surfaces
ethylene glycol on both proteins except that they do not increase the OC-helix
content. The change is more pronounced in BSA than in IgG which can be
understood because a BSA molecule is much smaller than an IgG molecule. The
BSA molecule in its native state is heart-shaped of 8 nm of side and 3 nm of depth
[26]. Then, assuming this size for the adsorbed molecule, it can be completely
surrounded by a copolymer environment while, as mentioned before, IgG can
only partially penetrate the pre-adsorbed copolymer layer.
Whereas the amide I/amide II area ratio for BSA at the bare silica surface
decreases with increasing time (from 1.86 to 1.61), it has a rather constant value of
1.6±0.1 at the hydrophobic + copolymer silica surface. It suggests that at the
copolymer-silica surface the (small) conformational change in BSA occurs quickly,
i.e. before the first spectrum is taken, whereas it takes more time at the bare
hydrophilic silica surface. It is worth to note that the structural change in BSA at
the hydrophobic + copolymer silica surface does not seem to be larger than at the
hydrophilic silica surface.
In summary, the pre-adsorbed triblock copolymers do not to a large extent
influence the adsorption characteristics of IgG and BSA. This result is remarkable
because varying the sorbent surface hydrophobicity usually provokes different
extent of changes in the protein structure. The result obtained in this study
suggests that the presence of copolymers on the surface, even though it increases
the surface hydrophobicity, does not allow the protein to rearrange its structure
extensively. Indeed, the PEO chains cause an additional lateral steric interaction
that could prevent the protein from spreading over the surface. It is known that, as
a rule, the extent of structural alterations in adsorbed protein molecules decreases
with increasing surface coverage [27,34], in a similar way the precoated copolymers
may restrict structural changes in the subsequent adsorbing protein molecules.
4.3.2 Adsorbed amount
The amide II band may be used to determine the adsorbed amount. The
maximum of this band is commonly found around 1550 cm4 , independently of
the type of protein. The position of the amide II band for IgG and BSA adsorbed
on both surfaces does not change neither with the type of protein nor with the
type of surface (Table 4.1). Figure 4.9 compares the relative adsorbed amounts
(amide II areas) at the two surfaces as a function of time.
71
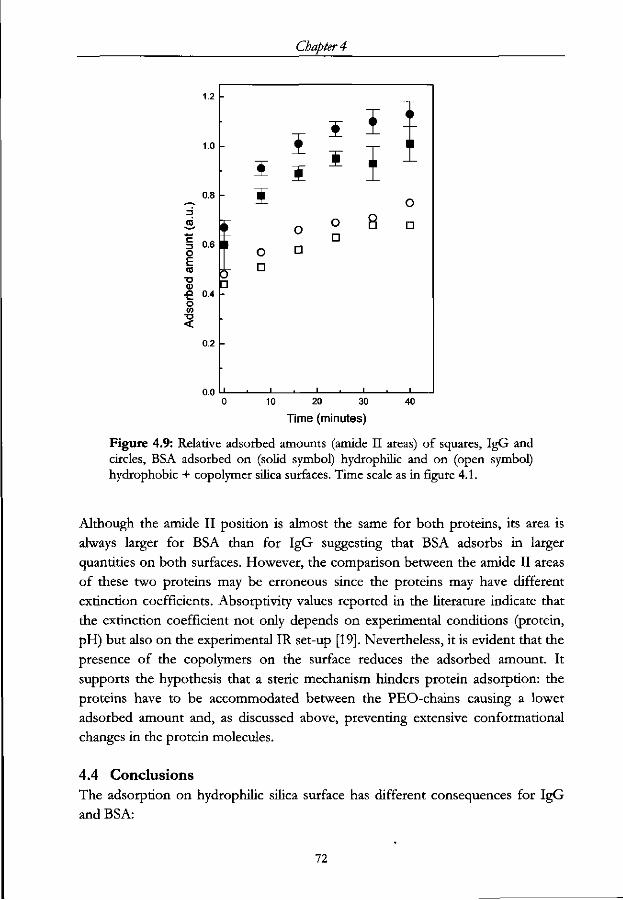
Chapter 4
3
ai. c o E CO
•a
o CO
<
1.2
1.0
0.8
0.6
0.4
0.2
5 1
T ° A- D
•
i . i
o D
•
J I
O •
•
I " I 1
o 8 •
i
10 20 30
Time (minutes)
40
Figure 4.9: Relative adsorbed amounts (amide II areas) of squares, IgG and circles, BSA adsorbed on (solid symbol) hydrophilic and on (open symbol) hydrophobic + copolymer silica surfaces. Time scale as in figure 4.1.
Although the amide II position is almost the same for both proteins, its area is
always larger for BSA than for IgG suggesting that BSA adsorbs in larger
quantities on both surfaces. However, the comparison between the amide II areas
of these two proteins may be erroneous since the proteins may have different
extinction coefficients. Absorptivity values reported in the literature indicate that
the extinction coefficient not only depends on experimental conditions (protein,
pH) but also on the experimental IR set-up [19]. Nevertheless, it is evident that the
presence of the copolymers on the surface reduces the adsorbed amount. It
supports the hypothesis that a steric mechanism hinders protein adsorption: the
proteins have to be accommodated between the PEO-chains causing a lower
adsorbed amount and, as discussed above, preventing extensive conformational
changes in the protein molecules.
4.4 Conclusions
The adsorption on hydrophilic silica surface has different consequences for IgG
and BSA:
72
ATR-FTIR study oflgG adsorbed on different silica surfaces
I. The secondary structure of adsorbed IgG is rather similar to that of the
protein in solution: a major (3-sheet content and a low, if any, CX-helix
content.
II. There is some loss in the a-helix content of adsorbed BSA, although this
structural element is still the most important one.
The pre-adsorbed triblock copolymers (PEO-PPO-PEO) on the hydrophobic
silica surface cause two significant effects on both IgG and BSA adsorption:
I. A change in the IR spectra, similar to that observed when the proteins are
exposed to ethylene glycol: a different type of (3-sheet in IgG and a more
ordered a-helix in BSA are induced. The effect is more clear for BSA than
for IgG probably due to the fact that BSA can be completely surrounded by
the copolymers while IgG is located partly between the copolymers and
pardy in the aqueous solution.
II. A decrease of the adsorbed amount, probably due to a steric effect that,
moreover, hampers severe structural rearrangements in the adsorbed
protein molecules.
73
Chapter 4
4.5 References
1 Lee, J., Martic, P. A., and Tan, J. S.J. Colloid Interface Sci. 131, 252 (1989).
2 Jeon, J. S., Sperline, R. P., and Raghavan, S., Appl. Spectrosc. 46, 1644 (1992).
3 Peula, J. M., Hidalgo-Alvarez, R., and De Las Nieves, F. J., / . Biomater. Sci.
Polymer Edn. 7, 241 (1995).
4 Peula, J. M., Hidalgo-Alvarez, R., and De Las Nieves, F. J., / . Biomater. Sci.
Polymer Edn. 7,231 (1995)..
5 Jeon, S. I., Lee, J. H., Andrade, J. D., and De Gennes, P. G.J. Colloid Interface
Sci. 142, 149 (1991).
6 Jeon, S. I., and Andrade, J. D.J. Colloid Interface Set. 159,149 (1991).
7 Byler, D. M., and Susi, H., Biopolymers 25, 469 (1986).
8 Bramanti, E., and Benedetti, E., Biopolymers 38, 639 (1996).
9 van Stokkum, I. H. M., Linsdell, H., Hadden, J. M., Haris, P. I., Chapman, D.,
and Bloemendal, B., Biochemistry 34,10508 (1995).
10 Buijs, J., Norde, W., and Lichtenbelt, J. W. Th., LangmuirM, 1605 (1996).
11 Ball, A., and Jones, R. A. L., LangmuirM, 3542 (1995).
12 Surewicz, W. K., Mantsch, H. H., and Chapman, D., Biochemistry 32, 389
(1993).
13 Susi, H., and Byler, D. M., Biochem. Biophys. Res. Commun. 115, 391 (1983).
14 Singh, B. R., Fuller, M. P, and Schiavo, G., Biophys. Chem. 46,155 (1990).
15 Vermeer, A. W. P., Bremer, M. G. E. G., and Norde, W., Biochim. Biophys. Acta
1425, 1 (1998).
16 Jakobsen, R. J., and Strand, S. W., in "Internal Reflection Spectroscopy. Theory
and Applications", Practical Spectroscopy Series Vol. 15 (F. M. Mirabella, Jr,
Ed.), p. 107. Marcel Dekker, Inc., New York, 1993.
17 Jakobsen, R. J., and Wasacz, F. M., in "Proteins at Interfaces. Physicochemical
and Biochemical Studies" ACS Symposium Series 343 (J. L. Brash and T. A.
Horbett, Eds.), p. 339. American Chemical Society, Washington DC, 1987.
18 Levitt, M., and Greer, J . J . Mol. Biol. 114,181 (1977).
19 Ishida, K. P., and Griffiths, P. R.,Appl. Spectroscopy 47, 584 (1993).
20 Kato, K., Matsui, T., and Tanaka, S.,Appl. Spectroscopy 41, 861 (1987).
21 Wasacz, F. M., Olinger, J. M., and Jakobsen, R. J., Biochemistry 26, 1464 (1987).
22 Fu, F., DeOliveira, D. B., Trumble, W. R., Sarkar, H. K., and Singh, B. R.,
Appl. Spectroscopy 48, 1432 (1994).
23 Singh, B. R., and Fuller, M. V.,Appl. Spectroscopy 45, 1017 (1991).
24 Jakobsen, R. J., and Wasacz, F.M., Appl. Spectroscopy 44,1478 (1990).
25 Peters, T. Jr., Adv. Protein Chem. 37,161 (1985).
26 Carter, D. C , and Ho, J. X.,Adv. Protein Chem. 45, 153 (1993).
74

ATR-FTIR study oflgG adsorbed on different silica surfaces
27 Norde, W., and Favier, J. P., Colloids and Surfaces 64, 87 (1992).
28 Haynes, C. A , and Norde, W.J. Colloid Interface Sci. 169, 313 (1995).
29 Schroen, C. G. P., Cohen Smart, M. A., van der Voort Maarschalk, K., van der
Padt, A., and van't Riet, K., Langmuir 11, 3068 (1995).
30 Freij-Larsson, C , Nylander, T., Jannasch, P., and Wesslen, B., Biomaterials 17,
2199 (1996).
31 Jakobsen, R. J., Wasacz, F. M., Brasch, J. W., and Smith, K. B., Biopolymers 25,
639 (1986).
32 Chirgadze, Yu. N., Brazhnikov, E. V., and Nevskaya, N.A., / . Mol. Biol. 102,
781 (1976).
33 Jackson, M., and Mantsch, H. H., Can.]. Chem. 69,1639 (1991).
34 Kondo, A., Murakami, F., and Higashitani, K., Biotechnol. Bioeng. 40, 889 (1992).
75

Chapter 5
STRUCTURAL CHANGES OF I G G INDUCED BY HEAT
TREATMENT AND BY ADSORPTION ONTO A HYDROPHOBIC
SURFACE STUDIED BY CIRCULAR DLCHROISM SPECTROSCOPY
Abstract
Thermal denaturation of immunoglobulin G, as well as structural rearrangements
resulting from adsorption on a hydrophobic surface, are studied by circular
dichroism spectroscopy. It is observed that both heat induced and adsorption
induced denaturation do not lead to complete unfolding into an extended
polypeptide chain but leave a significant part of the IgG molecule in a globular or
corpuscular form. Heating dissolved IgG causes a decrease of the fractions of 13-
sheet and P-tum conformations, whereas those of random coil and, to a lesser
extent, OC-helix increase. Adsorption enhances the formation of (X-helixes and
random coils, but the f}-sheet content is strongly reduced. Heating adsorbed IgG
results in a gradual break-down of the CC-helix and |3-turn contents, and a
concomitant formation of f$-sheet structures. Thus, the structural changes in IgG
caused by heating and by adsorption, respectively, are very different. However,
after heating the structure of adsorbed IgG approaches the structure of thermally
denatured IgG in solution.

Chapter 5
5.1 Introduction
Since recently, immunoglobulin G (IgG) molecules, i.e., antibodies, are widely used
as convenient and valuable tools for various immunochemical and biochemical
analyses. Progress in monoclonal antibody technology has led to the production of
substantial amounts of highly specific monoclonal antibodies. The availability of
these monoclonal antibodies has resulted in the development of various diagnostic
tests. An example of a typical diagnostic application taking full advantage of the
specificity of monoclonal antibodies, their sensitivity and their ability to identify
different epitopes, are immunoassays against Human Chorionic Gonadotropin,
(hCG) [1], a glycoprotein hormone that is commonly used as a marker for the early
detection and monitoring of pregnancy [2].
The main principle of such diagnostic tests is based on the agglutination or a
colour reaction of the immunoassay, induced by the presence of antigen. To assure
that these processes can be followed by eye, the monoclonal IgG molecules are
adsorbed onto a particle or flat surface. It is evident that the orientation and
structural integrity of the adsorbed antibody and the related activity of the antigen
binding site are essential factors for the preparation of a reliable immunoassay.
The immobilisation of monoclonal antibodies against hCG (ahCG) onto
polystyrene latex and on silica particles has been studied extensively [3,4]. An
important mechanism for immobilisation of immunoglobulins on a solid surface is
physical adsorption. It is generally accepted that protein adsorption is the net result
of various interactions between and within the components of the system,
including the sorbent surface, the protein molecules, the solvent (water) and other
solutes (ions of low molecular weight). These interactions originate from
electrostatic forces, Lifshits- van der Waals forces, hydrogen bonding and more
entropically based effects such as hydrophobic interactions and internal
conformational restrictions in the protein molecules. At apolar surfaces
hydrophobic interactions dominate the overall protein-sorbent interaction, so that
essentially all proteins adsorb on hydrophobic surfaces even under adverse
electrostatic conditions. At polar surfaces proteins do adsorb when they are
electrostatically attracted. However, in case adsorption-induced structural changes
lead to a sufficient increase in the conformational entropy of the protein,
adsorption may also occur on a like-charged, polar surface [5-7]. Hence, surface
characteristics such as hydrophobicity [8,9], surface charge [10] and co-adsorption
of, and exchange with surfactants, copolymers [11,12] or proteins [13,14] are key
controlling factors for the adsorption of proteins and for the stability and
specificity of adsorbed IgG in immunoassays in particular. From these studies it
can be concluded that, as a trend, protein adsorption increases with increasing
78
Structural changes oflgG studied by Circular Dichroism Spectroscopy
hydrophobicity of the substrate, with a lower degree of competition with other
surface active components, and with increasing steric hindrance. Further, it has
been shown that for most proteins the rate of adsorption is enhanced by the
hydrophobicity of the sorbent surface.
As mentioned above, in addition to the adsorbed amount, the orientation and
conformation of the adsorbed immunoglobulin molecules are very important in
relation to the performance of the assay. An IgG molecule is composed of four
polypeptide chains that are connected by disulphide bonds and non-covalent
forces. The four chains can be divided into two groups: two heavy and two light
chains. All four polypeptide chains are grouped in different domains, two F(ab)
segments and one Fc segment, together forming a Y-shaped conformation. The
antigen binding sites are located on the far ends of the F(ab) segments. From this
description it is clear that the antigen binding sites on the F(ab) segments must be
accessible, for the antigen for the adsorbed IgG to be immunologically active. Buijs
et al. [15] have mentioned that the orientation of IgG is the main factor that
influences the adsorbed amount and the antigen binding capacity of the adsorbed
molecules. However, in addition to the orientation effects, conformation of the
adsorbed molecules may as well be an important factor that affects the
performance of the assay.
The secondary structure of native immunoglobulins has been extensively studied,
mostly by X-ray spectroscopy. The different domains of the IgG molecule form
compact globular structures with a characteristic fold [16-18]. The predominant
secondary structure elements in immunoglobulins are the anti-parallel |3-sheet and
random coil conformations. Further, short stretches of OC-helices (that are found in
some bends) and |3-turns are present. These structure elements are partially
stabilised by intramolecular hydrogen bonding. The amounts of the structural
components in IgG fragments as determined by X-ray spectroscopy [19,20] are 45
% and 47 % of p-sheets and 7 % and 2 % of (X-helices for the Fc and F(ab)
segments, respectively. It should be realised that the X-ray data are taken from the
IgG in its solid state and that no interactions with solvent are involved. It is, of
course, desirable to monitor the protein structure in an environment that is of
interest for the above described immunological applications. However,
experimental studies on determining the structure of immunoglobulins in an
aqueous environment are still in a relatively primitive stage.
It is well known that spectral vibrations and electronic transitions of the amide
79
Chapter 5
linkages of the polypeptide chain reflect the presence of the different secondary
structure elements. Thus, studying these vibrations by spectroscopic methods gives
information about the structure surrounding these amide groups. FT-IR attenuated
total reflection (ATR) spectroscopy [21-23] is one of the methods that may be used
to study the conformation of proteins adsorbed from aqueous solution. Buijs et al.
[23] reported FT-IR/ATR spectra of IgG adsorbed on both hydrophilic and
hydrophobic surfaces. They mentioned that the structural changes induced by
adsorption onto a hydrophobic surface are significant, whereas for hydrophilic
surfaces such changes are much smaller. However, especially at hydrophobic
surfaces determination of the protein structure becomes practically impossible [52].
The reason is that water, released from the hydrophobic surface, largely
contributes to the IR-spectrum. The appearance of a water peak upon protein
adsorption is far less with a hydrophilic surface, indicating that hydration water
largely remains in the protein-sorbent contact region. A further problem is that the
spectral bands for the random coil structure, the (3-turns and to a lesser extent the
OC-helices are difficult to assign because of their low intensity and overlap with
other bands [24]. Thus, infrared spectroscopy is, in the first place, suitable to
detect fJ-sheets and can only be successfully be applied to proteins adsorbed on a
hydrophilic surface.
Circular Dichroism (CD) [25] is another spectroscopic technique that has been
used to study the secondary structure of proteins, including IgG [26-28]. A major
advantage of this technique is that the spectroscopic signal is not affected by the
presence of water and that well-defined procedures are available to elucidate the
secondary structure based on reference spectra of the different structure elements.
It is furthermore possible to study the protein both in solution and in the adsorbed
state. To accomplish the latter, particles have to be used that neither absorb nor
scatter in the far-UV region. In a previous study Maste et al. [29] have shown that
hydrophobic perfluoro-alkoxy fluoro carbon Teflon particles can be used for this
purpose. Finally, as compared to FT-IR, CD may be a suitable technique to study
the protein structure at different temperatures since no correction spectrum has to
be taken at each temperature. This enables us to compare the heat-induced
denaturation of IgG in solution with the structural changes induced by adsorption
onto a hydrophobic surface [30-32].
Structural rearrangements in proteins are not only induced by their adsorption on
(hydrophobic) surfaces. The most common cause for structural rearrangements in
proteins is heat treatment. McCarthy and Drake [33] suggested that heating IgG
80

Structural changes oflgG studied by Circular Dichroism Spectroscopy
induces partial unfolding of the F(ab) segment which, consequendy, aggregate,
leaving the Fc parts exposed to the aqueous environment.
The aim of this paper is to obtain information on the structural changes of IgG
molecules induced by heat treatment and to compare these changes with those
induced by adsorption on a hydrophobic surface. Furthermore, the effects of
heating on the conformation of pre-adsorbed IgG is studied. In order to support
the temperature dependence observed in the CD measurements, the thermal
stability of IgG as determined by differential scanning calorimetry (DSC) is
presented prior to the CD results.
5.2 Materials and methods
All chemicals used were of analytical grade and were used without further
purification. The experiments were carried out in a 5 mM phosphate buffer, pH
6.0. The water used was purified by percolation through a mixed bed ion exchange
column followed by an activated carbon column and a micro filter.
5.2.1 Immunoglobulin
The immunoglobulin studied is a monoclonal mouse immunoglobulin G (IgG)
from isotype 1, specific for the binding of the human pregnancy hormone human
Chorionic Gonadotropin (hCG). The antibody was kindly donated by Organon
Teknika (Akzo Nobel, Boxtel, The Netherlands). Concentrated IgG solutions were
stored at -20 °C and thawed shortly before use. The IgG samples were filtered
through an 0.2 |J,m Acrodisc filter prior to the CD experiments to remove
aggregates. The concentration of the IgG solutions was determined by UV-
spectroscopy at 280 nm assuming an extinction coefficient of 1.45 cm2 mg1 . A
sample of 3.3 mg ml"1 was, without further purification, used for Differential
Scanning Calorimetry. The iso-electric point (i.e.p.) of the molecules was measured
on a PhastSystem (Pharmacia LKB, Uppsala, Sweden), using a Phastgel, with a pH
range of 3.5 to 8.65. The i.e.p. of the IgG molecules was about 6.
5.2.2 Teflon particles
In order to study the secondary structure of adsorbed IgG molecules by Circular
Dichroism, colloidal particles, representing a sufficiently large surface area to
volume ratio, are required with a refractive index nearly matching that of water
[29]. The sorbent used in this study was a Teflon latex suspension. The latex is
prepared by emulsion polymerisation of tetrafluorethylene and perfluorovinylether.
The latex suspension was kindly donated by Du Pont de Nemours (Du Pont de
81

Chapter 5
Nemours SA, Le Grand-Saconnex, Switzerland). The dispersion is charge-
stabilised with sulphate groups originating from the polymerisation initiator
potassium persulphate. The refractive index of these particles is 1.35, which is
about equal to that of water, i.e. 1.33. The diameter of the Teflon particles is 215
nm yielding a specific surface area, as determined by N2 adsorption (BET), of 12.5
mV-
5.2.3 Adsorption of IgG onto Teflon
The adsorption of IgG on the Teflon particles was accomplished by adding 262 jil
of 0.20 mg ml4 IgG in a 5 mM phosphate buffer, pH 6.0, to 238 |ll 1 % Teflon
suspension. Prior to further experiments the sample was incubated at room
temperature for at least 30 minutes. Additional experiments have shown that after
this period all IgG was adsorbed. These conditions result in an adsorbed amount
of 1.68 mgm'2 .
5.2.4 Differential Scanning Calorimetry
DSC experiments were performed using a Setaram Micro-DSC III (Setaram,
Caluire, France). The samples were placed in the calorimeter in a 1 ml sample cell
against a 1 ml reference cell that was filled with the appropriate blank solution. The
cells were stabilised for 1 hour at 20 °C inside the calorimeter before heating up, at
a given heating rate, to the final temperature. Subsequent cycles of cooling and
reheating of the samples were performed as indicated. The peak temperature and
enthalpy were determined using the Setaram software (Setaram, Caluire, France,
Version 1.3).
5.2.5 Circular Dichroism measurements
The far-UV CD spectra were measured with a JASCO spectropolarimeter, model
J-715 (JASCO International Co., Tokyo, Japan). A quartz cuvette of 0.1 cm path
length was used. Temperature regulation was carried out using a JASCO PTC-
348WI (JASCO International Co., Tokyo, Japan) thermocouple. Comparison of
the actual temperature in the cell with the temperature set by the Peltier element
showed that the deviation of the actual temperature was less than 0.1 °C. In the
190-260 nm wavelength region (0.2 nm resolution) 64 scans were accumulated
with a scan rate of 100 nm min"1 and a time constant of 0.125 sec. The final spectra
are the average of these scans. Additionally, temperature scans at 206.5 nm were
recorded. For these experiments the temperature is increased using the Peltier
thermocouple at a given scan rate (°C min"1) with a resolution of 0.2 °C and a time
constant of 16 sec. Prior to the spectral analysis both wavelength and temperature
82

Structural changes oflgG studied by Circular Dichroism Spectroscopy
scans were corrected for the buffer background signal.
5.2.6 Circular Dichroism Spectral Analysis
The CD curves of poly-L-lysine containing varying amounts of OC-helix, (3-sheet, |3-
turn and randomly coiled conformations have been applied for determining the
IgG conformation. The CD spectra of IgG are a superposition of the spectra of
these four structure elements. The poly-L-lysine reference spectra used were
described by Greenfield and Fasman [34] and Chang et al. [35]. Fitting of the
measured spectra was performed by a non-linear regression procedure, making use
of the Gauss-Newton algorithm [36]. The reference spectra (data from Chang et al.
[35]) were fitted independendy from 190 to 240 nm with 1 nm resolution. Fitting
of an experimental IgG CD spectrum was performed with a 1 nm resolution. No
constraints were used in the fit procedure. The quality of the fit was expressed
using the definition of the normalised root-mean-square (RMS) error as described
by Brahms and Brahms [37]. A fit was considered to be reliable when the RMS
error is smaller than 10.
5.3 Results and D i scuss ion
5.3.1 Thermal unfolding of IgG
The thermal stability of IgG was studied by differential scanning calorimetry. The
DSC thermograms of IgG in a 5 mM phosphate buffer at a heating rate of
0.5 °C min"1 and 0.1 °C min"1 are shown in Fig. 5.1 and Fig. 5.2, respectively. In
spite of the multi-domain character of IgG, only a single endothermic transition is
observed. It is known from literature that thermal denaturation of IgG occurs in
different domains [38-41]. Because of the appearance of only one single peak, it is
impossible to distinguish, without further deconvolution analysis, such domains
from the thermogram. Fig. 5.1 shows that, at a heating rate of 0.5 °C min"1, an
exothermic aggregation peak is present, whereas this peak disappears when the
heating rate is lowered (Fig 5.2). After cooling down, the thermograms of the
subsequent cycle do neither show a denaturation nor aggregation peak, indicating
that the structural changes in the IgG are irreversible. It is generally accepted that
the irreversibility results from aggregation succeeding a reversible unfolding step
and that the enthalpy of aggregation is far less than that of unfolding [42]. The
denaturation enthalpy, AdH, is evaluated as the peak area of the transition and the
denaturation temperature, Td, corresponds with the temperature at the half peak
area. In the thermogram obtained at 0.5 °C min"1 the peak position and enthalpy
could not be determined accurately because the aggregation peak disturbed the
signal. After treatment in the calorimeter the sample was observed to be strongly
83
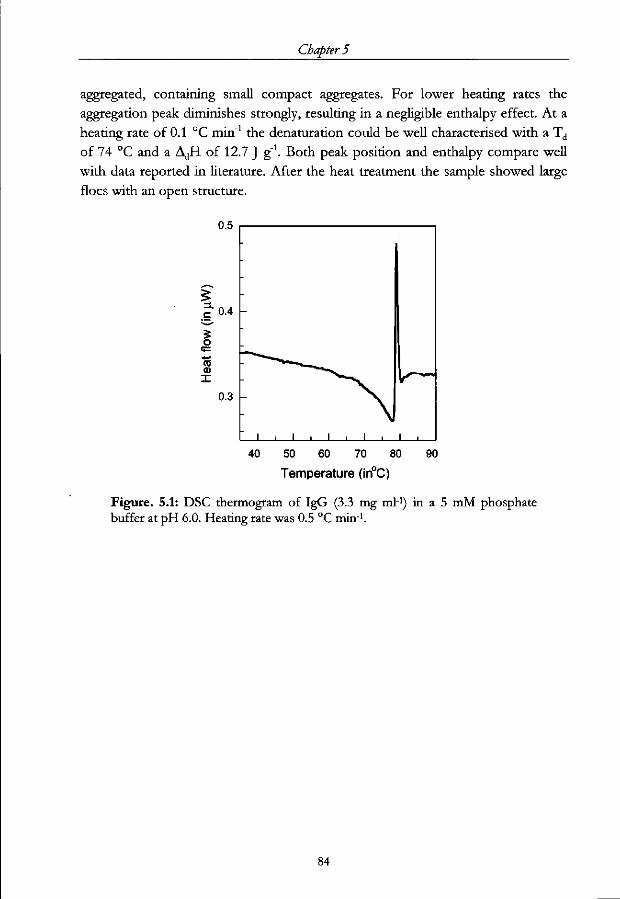
Chapter 5
aggregated, containing small compact aggregates. For lower heating rates the
aggregation peak diminishes strongly, resulting in a negligible enthalpy effect. At a
heating rate of 0.1 °C min ' the denaturation could be well characterised with a Td
of 74 °C and a AdH of 12.7 J g"1. Both peak position and enthalpy compare well
with data reported in literature. After the heat treatment the sample showed large
floes with an open structure.
40 50 60 70 80
Temperature (in°C) 90
Figure. 5.1: DSC thermogram of IgG (3.3 mg ml1) in a 5 mM phosphate buffer at pH 6.0. Heating rate was 0.5 °C min1.
84

Structural changes of IgG studied by Circular Dichroism Spectroscopy
-0.03
5 o CO 0
X
-0.04
Temperature (in C)
Figure 5.2: DSC thermogram of IgG (3.3 mg ml1) in a 5 mM phosphate buffer at pH 6.0. Heating rate was 0.1 °C mirr1. Td = 74 °C and AdH = 12.7 Jg-1-
Although the thermogram obtained for the lower heating rate does not show an
aggregation peak, aggregates were well observed upon heat treatment in DSC. The
absence of an aggregation peak when the protein is heated at a rate of 0.1 °C min"1
can be explained by assuming that at low heating rates at any time only a low
concentration of denatured molecules is available for aggregation. This leads to the
incoherent formation of less intensive contacts [43], resulting in the formation of
fractal aggregates with an open structure. This sterically unhindered aggregation
finally results in the formation of a gel [44], as was indeed observed experimentally.
At the higher heating rate (0.5 °C min"1), however, a much higher concentration of
denatured molecules is available, resulting in the formation of small, very dense,
aggregates.
5.3.2 Heat induced changes in the secondary structure of IgG
Having established the heat induced denaturation of immunoglobulin using a
calorimetric method, information is obtained on the enthalpy effects involved in
the structural transitions. The (endothermic) enthalpy change is related to the
unfolding of the protein molecule. The information obtained by DSC is on a
macroscopic level. Spectroscopy would be a complementary approach because it
provides information about the protein structure at a sub-molecular level. To
85
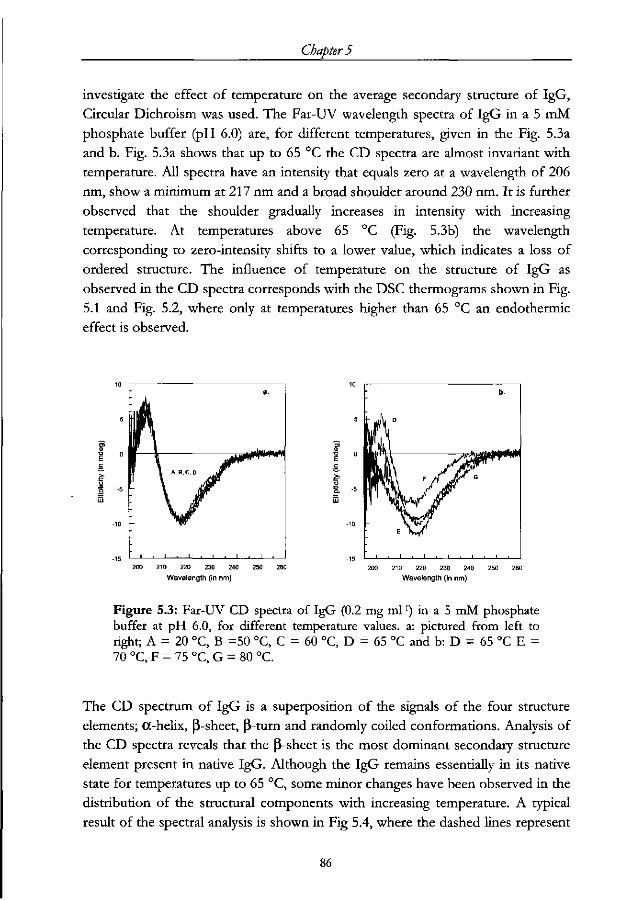
Chapter 5
investigate the effect of temperature on the average secondary structure of IgG,
Circular Dichroism was used. The Far-UV wavelength spectra of IgG in a 5 mM
phosphate buffer (pH 6.0) are, for different temperatures, given in the Fig. 5.3a
and b. Fig. 5.3a shows that up to 65 °C the CD spectra are almost invariant with
temperature. All spectra have an intensity that equals zero at a wavelength of 206
nm, show a minimum at 217 nm and a broad shoulder around 230 nm. It is further
observed that the shoulder gradually increases in intensity with increasing
temperature. At temperatures above 65 °C (Fig. 5.3b) the wavelength
corresponding to zero-intensity shifts to a lower value, which indicates a loss of
ordered structure. The influence of temperature on the structure of IgG as
observed in the CD spectra corresponds with the DSC thermograms shown in Fig.
5.1 and Fig. 5.2, where only at temperatures higher than 65 °C an endothermic
effect is observed.
- ILM
1 I A, B,C, D jMT
I . 1 . 1 1
a.
210 220 230 240
Wavelength (in nm) 210 220 230 240
Wavelength (in nm)
Figure 5.3: Far-UV CD spectra of IgG (0.2 mg ml1) in a 5 mM phosphate buffer at pH 6.0, for different temperature values, a: pictured from left to right; A = 20 °C, B =50 °C, C = 60 °C, D = 65 °C and b: D = 65 °C E = 70 °C, F = 75 °C, G = 80 °C.
The CD spectrum of IgG is a superposition of the signals of the four structure
elements; OC-helix, (3-sheet, p-turn and randomly coiled conformations. Analysis of
the CD spectra reveals that the fj-sheet is the most dominant secondary structure
element present in native IgG. Although the IgG remains essentially in its native
state for temperatures up to 65 °C, some minor changes have been observed in the
distribution of the structural components with increasing temperature. A typical
result of the spectral analysis is shown in Fig 5.4, where the dashed lines represent
86

Structural changes oflgG studied by Circular Dichroism Spectroscopy
the contributions of the four structure elements to the fitted curve. To assure that
the RMS error was lower than 10, the fit was performed in the wavelength range
203-240 nm. It is observed that the fit, for wavelengths higher than 205 nm,
matches the experimental data points very well. At lower wavelengths the
calculated value deviates significantly from the measured signal. An explanation for
the overestimation of the fitted curve may be that at lower wavelengths the light
scattering by the protein becomes too large, which was indeed indicated by a very
high photomultiplier signal.
20
190 200 210 220 230 240 250 260
Wavelength (in nm)
Figure 5.4: A result of the fitting procedure for a Far-UV CD spectra of IgG (0.2 mg ml1) in a 5 mM phosphate buffer at pH 6.0. Symbols, experimental data point at 20 °C; solid line, fitted curve; The different contributions of the four structure elements are shown by the dashed lines.
Table 5.1 summarises the content of the different structure elements as a function
of temperature. For the native IgG about 75 % of the polypeptide chain was found
to be in a [3-sheet type conformation. The fractions of |3-turn and random coil
conformations are much lower and the OC-helix structure was not observed at all.
These results compare well with those reported in literature [23,45]. The gradual
87
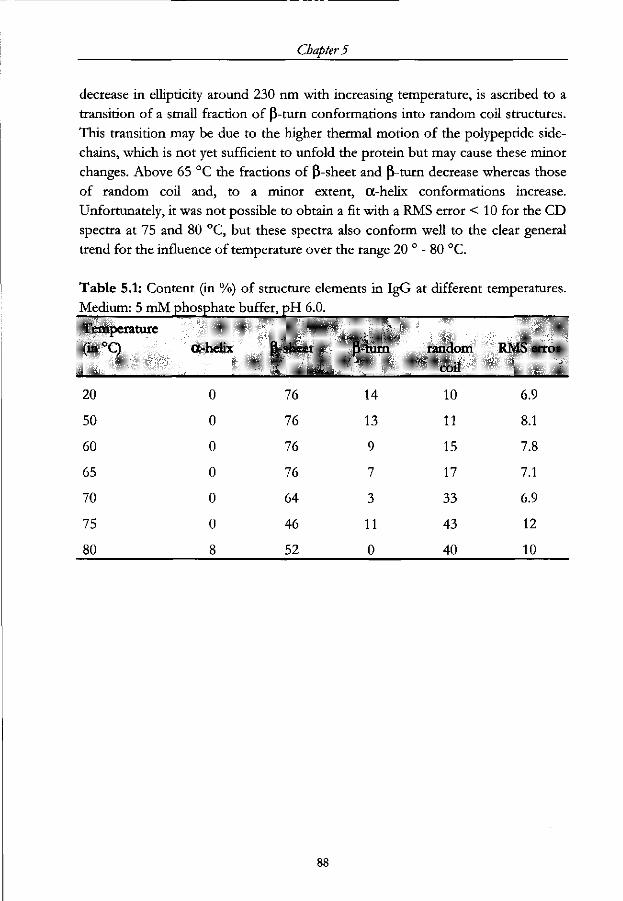
Chapter 5
decrease in ellipticity around 230 nm with increasing temperature, is ascribed to a
transition of a small fraction of P-turn conformations into random coil structures.
This transition may be due to the higher thermal motion of the polypeptide side-
chains, which is not yet sufficient to unfold the protein but may cause these minor
changes. Above 65 °C the fractions of P-sheet and P-turn decrease whereas those
of random coil and, to a minor extent, OC-helix conformations increase.
Unfortunately, it was not possible to obtain a fit with a RMS error < 10 for the CD
spectra at 75 and 80 °C, but these spectra also conform well to the clear general
trend for the influence of temperature over the range 20 ° - 80 °C.
Table 5.1: Content (in %) of structure elements in IgG at different temperatures.
Medium: 5 mM phosphate buffer, pTT 6.0.
Temperature
(in °C) OC-helix P-shcct P-turn random RMS error
coil
20
50
60
65
70
75
80
0
0
0
0
0
0
8
76
76
76
76
64
46
52
14
13
9
7
3
11
0
10
11
15
17
33
43
40
6.9
8.1
7.8
7.1
6.9
12
10

Structural changes oflgG studied by Circular Dichroism Spectroscopy
In addition to these wavelength scans, a temperature scan at a given wavelength
may be used to study the effect of temperature on the secondary structure of IgG.
With such temperature scans a spectrum may be obtained under conditions that
can be compared with those of the DSC thermograms, previously shown. A more
thorough investigation of the CD reference spectra [35] reveals that at 206.5 nm
the contribution from the fi-sheet to the ellipticity is essentially zero, whereas those
of the other structures are significant. Thus, by measuring the ellipticity at 206.5
nm as a function of temperature, one monitors the changes in (5-turn, Ct-helix and
random coil content. At this wavelength the ellipticity due to the fraction of P-
turns is positive, whereas formation of a-helixes and random coil structures gives a
negative contribution to the ellipticity.
0
-2
-4 1-
O) o> •o E % -6
i -s o ig- -io Gj _12 -14
—
-
-
I
»
\ '1 \ ' 1 -
1 ' • \ ' >
- -V */ -
\ I1
\ 1 ' —
I 1 '
i iV
44U
420
400
380
360
o I-*-
o 3 c_
ST —i
00 to'
5' <
40 50 60 70 80 90 Temperature (in °C)
Figure 5.5: CD temperature scan (solid line) and the corresponding CD photomultiplier signal (dashed line) of IgG (0.2 mg ml1) in a 5 mM phosphate buffer at pH 6.0 and a heating rate of 0.5 °C mirr1.
Fig. 5.5 shows the ellipticity at 206.5 nm and the corresponding photomultiplier
signal, as a function of temperature for a heating rate of 0.5 °C min"1. This heating
rate is the same as that of the DSC thermogram, shown in fig. 5.1. It is observed
that the signal remains constant and zero up to a temperature of about 65 °C, after
which it starts to decrease. The decrease corresponds to a loss in p-turn and/or
formation of random coil and OC-helix conformations. These trends correspond
well with those reported in Table 1. Comparison with fig. 5.1 clearly shows that the
temperature at which this transition occurs is the same as the denaturation
temperature measured by DSC. Above 81 °C the CD signal strongly increases.
This may be caused by aggregation of the IgG sample (cf. Fig. 5.1), after which the
89

Chapter 5
aggregates settle and no longer contribute to the absorbance. It is further observed
that above 75 °C the photomultiplier signal increases, most likely because of light
scattering by the growing IgG aggregates. When the aggregates grow even further
and settle, the signal decreases drastically, which illustrates that the protein
aggregates disappear from the solution. The same phenomena may explain why at
these high temperatures the fitting of the CD spectra was less successful.
Comparing the DSC and CD experiments clearly indicates that the transition
observed in the thermograms corresponds with the change in secondary structure
observed in the CD spectra. Dissolved IgG unfolds as a result of heat treatment,
after which the molecules strongly aggregate causing the irreversibility of the
denaturation process.
5.3.3 Adsorption characteristics of IgG
The adsorption is monitored by refiectometry and the adsorbed amount is
calculated as described by Dijt et al. [46]. The adsorption of IgG from a 5 mM
phosphate buffer, pH 6.0, onto a hydrophilic and a hydrophobic surface is shown
in Fig. 5.6.
10 15 20 25 30 35
Time (in min)
Figure 5.6: The adsorbed amount of IgG as a function of time in a 5 mM phosphate buffer, pH 6.0, on a hydrophobic surface (methylated silica) and a hydrophilic surface (silica), (open symbols = hydrophobic; solid symbols = hydrophilic).
It is observed that the adsorbed amount reached in about half an hour does not
differ very much between the two surfaces, i.e. 2.2 mg m"2 at the hydrophilic
90

Structural changes oflgG studied by Circular Dichroism Spectroscopy
surface and 2.0 mg m"2 at the hydrophobic one. It is further shown that the initial
adsorption is somewhat lower on the hydrophobic surface. Our results compare
well with those previously reported by Buijs et al. [47]. Buijs et al. [48] also studied
the antigen binding capacity of adsorbed IgG molecules. They found a reduced
antigen binding capacity under conditions where the interaction between the F(ab)
fragment and the surface was relatively strong. This result was primarily ascribed to
unfavourable orientations of the IgG molecules on the hydrophobic surface.
However, it seems likely that conformational changes in the protein also play an
important role. Upon adsorption on a hydrophobic surface the IgG molecule may
partly unfold, due to which it occupies more space which, in turn, leads to a
decreasing capacity for antigen binding. To study the degree of denaturation and
its effect on the secondary structure, we will now discuss some CD data for IgG
molecules adsorbed on Teflon particles.
5.3.4 Heat induced changes in the secondary structure of adsorbed IgG
The CD spectra for different temperatures of IgG adsorbed onto Teflon are
shown in Fig. 5.7. The CD spectra measured at intermediate temperatures changed
gradually from the curve at 20 °C to that at 85 °C. For reasons of clarity only the
two extremes are shown. In contrast to the effect of temperature on the secondary
structure of dissolved IgG, the heat-induced changes in the structure of adsorbed
IgG are only minimal. -All spectra have zero intensity at 199 nm and show a
minimum at 208 nm with a broad shoulder around 220 nm that gradually changes
to a single minimum at 215 nm. In Fig. 5.8 the CD spectra of dissolved and
adsorbed IgG are plotted for 20 and 75 °C. Comparison of the spectra of the
dissolved and adsorbed IgG at 20 °C, which is much lower than the Td observed
by DSC, shows that adsorption at the hydrophobic surface has a strong effect on
the secondary structure. It is further unambiguously demonstrated that the
secondary structure of heat induced denatured IgG is different from that of
adsorbed IgG; after heat treatment of the adsorbed molecules the difference is less
pronounced.
91
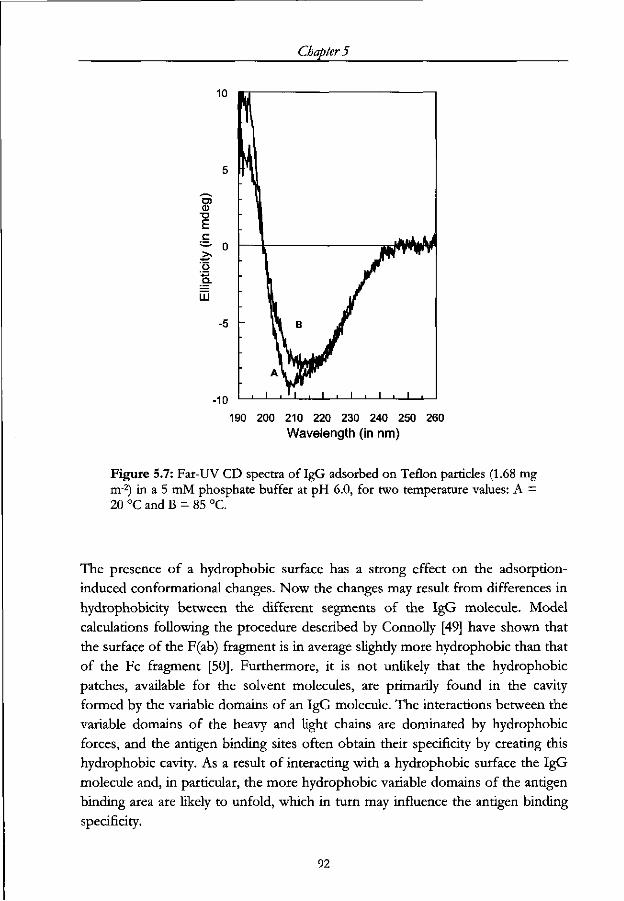
Chapter 5
10
'a a.
EH
-5 -
-10 190 200 210 220 230 240 250 260
Wavelength (in nm)
Figure 5.7: Far-UV CD spectra of IgG adsorbed on Teflon particles (1.68 mg nr2) in a 5 mM phosphate buffer at pH 6.0, for two temperature values: A = 20 °C and B = 85 °C.
The presence of a hydrophobic surface has a strong effect on the adsorption-
induced conformational changes. Now the changes may result from differences in
hydrophobicity between the different segments of the IgG molecule. Model
calculations following the procedure described by Connolly [49] have shown that
the surface of the F(ab) fragment is in average slighdy more hydrophobic than that
of the Fc fragment [50]. Furthermore, it is not unlikely that the hydrophobic
patches, available for the solvent molecules, are primarily found in the cavity
formed by the variable domains of an IgG molecule. The interactions between the
variable domains of the heavy and light chains are dominated by hydrophobic
forces, and the antigen binding sites often obtain their specificity by creating this
hydrophobic cavity. As a result of interacting with a hydrophobic surface the IgG
molecule and, in particular, the more hydrophobic variable domains of the antigen
binding area are likely to unfold, which in turn may influence the antigen binding
specificity.
92
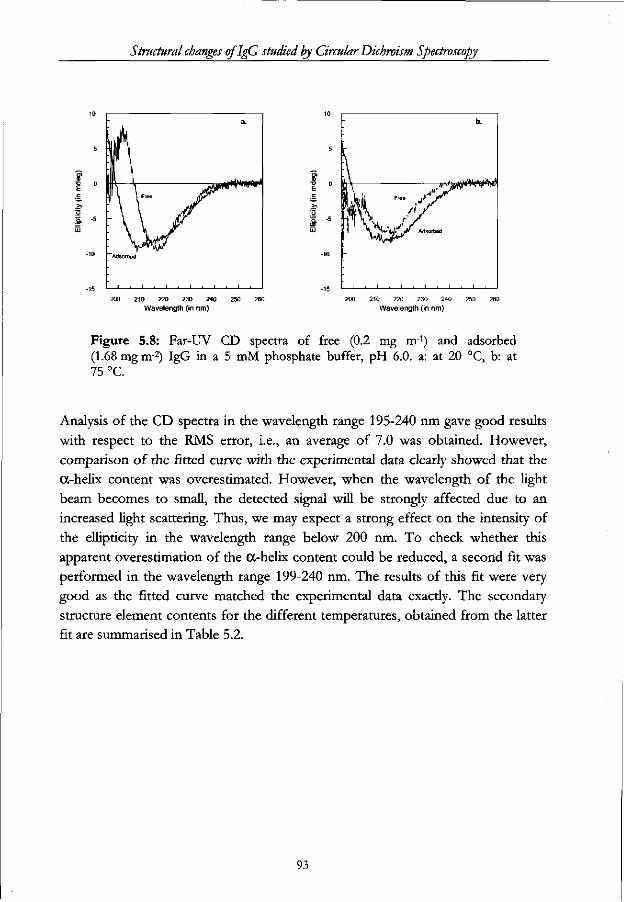
Structural changes oflgG studied by Circular Dichroism Spectroscopy
200 210 220 230 240 250 260
Wavelength (in nm) 200 210 220 230 240 250 260
Wavelength (in nm)
Figure 5.8: Far-UV CD spectra of free (0.2 mg rrr1) and adsorbed (1.68 mgm-2) IgG in a 5 mM phosphate buffer, pH 6.0. a: at 20 °C, b: at 75 °C.
Analysis of the CD spectra in the wavelength range 195-240 nm gave good results
with respect to the RMS error, i.e., an average of 7.0 was obtained. However,
comparison of the fitted curve with the experimental data clearly showed that the
(X-helix content was overestimated. However, when the wavelength of the light
beam becomes to small, the detected signal will be strongly affected due to an
increased light scattering. Thus, we may expect a strong effect on the intensity of
the ellipticity in the wavelength range below 200 nm. To check whether this
apparent overestimation of the OC-helix content could be reduced, a second fit was
performed in the wavelength range 199-240 nm. The results of this fit were very
good as the fitted curve matched the experimental data exacdy. The secondary
structure element contents for the different temperatures, obtained from the latter
fit are summarised in Table 5.2.
93

Chapter 5
Table 5.2. Content (in %) of structure elements in IgG adsorbed on Teflon particles (1.68 mg nr2) at different temperatures (only wavelength > 199 used for fit). Medium: 5 mM phosphate buffer, pH 6.0.
Temperature
(in'
20
30
40
50
60
65
70
75
80
85
5Q a-hclix
17
17
15
12
11
11
11
11
10
9
(i-sheet
32
33
36
38
40
40
41
41
42
43
P lurti
12
12
11
10
9
9
8
8
8
8
random
coil
39
38
38
40
40
40
40
40
40
40
RMS error
5.5
6.1
5.9
5.5
5.4
4.7
5.6
5.0
4.7
5.8
As compared to the native IgG, the fractions of a-helix and random coil
conformation are strongly increased due to the adsorption, whereas the P-sheet
content is strongly diminished. With increasing temperature the a-helix and P-turn
contents gradually decrease whereas the fraction of p-sheet structures increases.
The strong a-helix induction observed upon adsorption on a hydrophobic surface
has more often been observed for the adsorption of proteins on hydrophobic
surfaces [29,51]. Because no favourable hydrogen bonds can be formed between
the IgG and a hydrophobic surface, the adsorbed molecules may tend to form
intramolecular hydrogen bonds, thereby promoting the formation of a-helixes.
These results clearly show that IgG molecules undergo structural rearrangements
upon contact with a hydrophobic surface. This is in contrast with the results
described by Buijs et al. [23] for the adsorption of the same IgG onto a hydrophilic
surface.
94

Structural changes oflgG studied by Circular Dichroism Spectroscopy
5.4 Conclusions It is demonstrated that combining Differential Scanning Calorimetry and Circular
Dichroism Spectroscopy provides useful information about heat induced
denaturation of immunoglobulin G. At elevated temperatures IgG unfolds, which,
in turn, causes formation of aggregates. The aggregation step is likely to cause the
irreversibility of the structural transition. The DSC thermogram shows one
endothermic transition at a temperature at which the major change in the
secondary structure indicated in the CD spectrum is observed as well.
The secondary structure of the native IgG, calculated from the CD spectra,
compares well with that measured by other techniques. Due to the unfolding of
the IgG the fractions of P-sheet and (3-turn decrease, whereas those of random coil
and, to a lesser extent, OC-helix conformations increase. It was observed that even
after heat induced denaturation a significant part of the secondary structure
remains.
IgG also changes its structure due to the adsorption on a hydrophobic surface. The
fractions of (X-helix and random coil conformation are strongly increased after
adsorption, whereas the p-sheet content is strongly reduced. Heating adsorbed IgG
results in a gradual decrease of the OC-helix and P-turn contents, whereas the
fraction of P-sheet structure increases. After heating up to 75 °C the structure of
dissolved and adsorbed IgG, respectively, still deviate from each other although
the difference is much less than at lower temperatures.
In view of these conclusions it can be stated that, in addition to, or instead of,
unfavourable molecular orientations, changes in the three-dimensional (secondary
and possibly tertiary) structure may explain the lower antigen binding affinity of
IgG molecules adsorbed on hydrophobic surfaces.
Acknowledgement
We wish to thank Dr. H.H.J, de Jongh of the Centre for Protein Technology
Wageningen for his assistance with the CD experiments and for giving a useful
introduction into the ins and outs of the data processing. Discussions with Drs. T.
Beumer and W. Carpay of Organon Teknika B.V., The Netherlands, were
appreciated.
95
Chapter 5
5.5 References
1. Sevier, E.D. (1985) / . Med. Technol. 2, 287.
2. Frances, R., Batzer, M.D. (1980) Fertil. Steril. 34, 1.
3. van Erp, R., Linders, Y.E.M., van Sommeren, A.P.G., Gribnau, T.C.J. (1992)
/ . Immunol. Methods 152,191.
4. Lichtenbelt, J.W.T., Heuvelsland, W.J.M., Oldenzeel, M.E., Zsom, R.LJ.
(1993) Colloids Surfaces B: Biointerfaces 1, 75.
5. Haynes, C.A., Norde, W. (1994) Colloids Surfaces B: Biointerfaces 2, All.
6. Hidalgo-Alvarez, R., Galisteo-Gonzalez, F. (1995) HCR Comprehensive Review
2, 249.
7. Norde, W. (1996) Macromol. Symp. 103, 5.
8. Lee, S.H., Ruckenstein, E. (1988) / . Colloid Interface Sci. 125, 365.
9. Wesslen, B., Kober, M., Freij-Larsson, C , Ljungh, A., Paulsson, M. (1994)
Biomaterials 15, 278.
10. Elgersma, A.V., Zsom, R.L.J., Lyklema, J., Norde, W. (1992) / . Colloid Interface
Sci. 152,410.
11. Freij-Larsson, C , Nylander, T., Jannasch, P., Wesslen, B. (1996) Biomaterials
17, 2199.
12. Lee, J., Martic, P.A., Tan, J.S. (1989)/. Colloid Interface Sci. 131, 252.
13. Peula, J.M., Hidalgo-Alvarez, R., De Las Nieves, F.J. (1995) / . Biomater. Sci.
Polymer Edn. 7, 231.
14. Puig, J., Fernandez-Barbero, A., Bastos-Gonzalez, D., Serra-Domnenech, J.,
Hidalgo-Alvarez, R. (1994) in Proceedings of the International Symposium on Surface
Properties of Biomaterials (West, R., Batts, G. eds.), pp. 39, Butterworth-
Heinemann, London.
15. Buijs, J., Lichtenbelt, J.W.T., Norde, W., Lyklema, J. (1995) Colloids Surfaces B:
Biointerfaces 5,\\.
16. Edmundson, A.B., Ely, K.R. (1986) in Handbook of experimental Immunology in
four volumes (Weir, D.M. ed.), Blackwell Scientific Publications, Oxford.
17. Chothia, C , Novotny, J., Bruccoleri, R., Karplus, M. (1985) / . Mol. Biol. 186,
651.
18. Padlan, E.A. (1997) Mol. Immunol. 31,169.
19. Deisenhofer, J. (1981) Biochemistry 20, 2361.
20. Marquart, M., Deisenhofer, J., Huber, R., Palm, W. (1980) / . Mol. Biol. 141,
369.
21. Singh, B.R., Fuller, M.P. (1991) Appl. Spectrosc. 45, 1017.
22. Jeon, J.S., Sperline, R.P., Raghavan, S. (1992) Appl. Spectrosc. 46,1644.
23. Buijs, J., Norde, W., Lichtenbelt, J.W.T. (1996) Langmuir 12,1605.
96
Structural changes oflgG studied by Circular Dichroism Spectroscopy
24. Kirsch, J.L., Koenig, J.L. (1989) Appl. Spectrosc. 43, 445.
25. Fasman, G.D. (1996) Circular Dichroism, the conformational analysis of' biomolecules,
Plenum Press, New York.
26. Kate, M., Richberg, P.C., Hughes, D.E. (1995) Anal. Chem. 67, 2943.
27. Tetin, S.Y., Linthicum, D.S. (1996) Biochemistry 35, 1258.
28. Rousseaux, J., Aubert, J.P., Loucheux-Lefebvre, M. (1982) Biochim. Biophys.
Acta 701, 93.
29. Maste, C.L.M., Pap, E.H.W., van Hoek, A., Norde, W., Visser, A.J.W.G.
(1996)/. Colloid Interface Sci. 180, 632.
30. Norde, W. (1992) Clinical Materials 11, 85.
31. Takeda, K., Hamada, S., Wada, A. (1993) / . Protein Chem. 12, 223.
32. Haynes, C. A., Norde, W. (1995) / . Colloid Interface Sci. 169,313.
33. McCarthy, D.A., Drake, A.F. (1989) Mol. Immunol. 26, 875.
34. Greenfield, N., Fasman, G.D. (1969) Biochemistry 8, 4108.
35. Chang, C.T., Wu, C.-S.C, Yang, J.T. (1978) Anal. Biochem. 91, 13.
36. de Jongh, H.H.J., Goormaghtigh, E., Killian, J.A. (1994) Biochemistry 33,
14521.
37. Brahms, S., Brahms, J. (1980) / . Mol. Biol. 138,149.
38. Buchner, J., Renner, M., Lilie, H., Hinz, H.-J., Jaenicke, R., Kiefhaber, T.,
Rudolph, R. (1991) Biochemistry 30, 6922.
39. Martsev, S.P., Kravchuk, Z.I., Vlasov, A.P., Lyakhnovich, G.V. (1995) FEBS
Letters 361,113.
40. Tischenko, V.M., Zav'yalow, V.P., Medgyesi, G.A., Potekhin, S.A., Privalov,
P.L. (1982) Eur. J. Biochem. 126, 517.
41. Vlasov, A.P., Kravchuk, Z.I., Martsev, S.P. (1996) Biochemistry (Moscow) 61,
155.
42. Privalov, P.L. (1980) Pure & Appl. Chem. 52, 479.
43. Barone, G., Giancola, C , Verdoliva, A. (1992) Thermochim. Acta 199, 197.
44. Bremer, L.G.B., Walstra, P., van Vliet, T. (1995) Colloids Surfaces A: Physicochem.
Eng. Aspects 99, 121.
45. Byler, D.M., Susi, H. (1986) Biopolymers 25, 469.
46. Dijt, J.C., Cohen Stuart, M.A., Fleer, G.J. (1994) Adv. Colloid Interface Sci. 50,
79.
47. Buijs, J., van den Berg, P.A.W., Lichtenbelt, J.W.T., Norde, W., Lyklema, J.
(1996)/. Colloid Interface Sci. 178, 594.
48. Buijs, J., White, D.D., Norde, W. (1997) Colloids Surfaces B: Biointerfaces 8, 239.
49. Connolly, M.L. (1983) / . Appl. Cryst. 16, 548.
50. Buijs, J. PhD thesis, Wageningen Agricultural University, Wageningen, the
97

Chapter 5
Netherlands, 1995. 51. Zoungrana, T., Findenegg, G.H., Norde, W. (1997) /. Colloid Interface Sci. 190,
437. 52. Chapter 4, this thesis.
98
Chapter 6
INFLUENCE OF PRE-ADSORBED (BLOCK COPOLYMER) MOLECULES ON IGG CONFORMATION
Abstract
The effect of pre-adsorbed molecules on the secondary structure of subsequendy
adsorbing monoclonal immunoglobulin G (IgG) molecules is studied by circular
dichroism spectroscopy. The Teflon latex used as the sorbent surface is precoated
with triblock copolymers of the type poly(ethylene oxide)-poly(propylene oxide)-
poly(ethylene oxide) (PEO-PPO-PEO). The water-soluble PEO buoy parts
protrude into the solution and form a steric barrier that reduces the surface area
available for adsorption and structural rearrangements of the IgG molecules.
Structural rearrangements were less extensive with increasing surface coverage of
the polymer. It was found that pre-adsorbed IgG molecules have comparable
effects on the secondary structure of subsequendy adsorbing IgG; a more native
like structure is retained at higher pre-adsorbed amounts. Hence, appropriate
partial pre-coating of a surface is an effective way to control the secondary
structure of adsorbed IgG.
Chapter 6
6.1 Introduction
In most proteins the biological activity requires structural integrity of the
molecules, irrespective of this molecule being an enzyme, an antibody, or a
receptor. The conformation of proteins, which is determined by an intricate
balance of interactions between all components in the system, is only marginally
stable and sensitive to changes in environmental conditions such as pH,
temperature and ionic strength [1-3]. In line with this, physical adsorption of
proteins onto solid surfaces, as employed in industrial applications like
immunoassays, biosensors or colloidal drug carriers, can significandy alter the
conformation [4, 5]. As a result, the biological functioning of adsorbed proteins is
often impaired. To preserve biological activity one therefore frequently aims for
procedures to reduce, or eliminate adsorption-induced conformational changes.
In general, adsorption-induced conformational changes involve some degree of
spreading of the protein at the sorbent surface. This spreading is hindered by the
presence of other protein molecules on the surface [6]. For instance, for Savinase
on Teflon and silica [7], catalase on silica [35], albumin and fibrinogen on
hydrophobic self-assembled monolayers and hemoglobin on various surfaces [8] it
is observed that adsorption-induced conformational changes are less pronounced
at higher surface coverages. For this reason, reducing the fraction of the surface
area available for the adsorbing protein molecules may be a meaningful approach
to suppress the degree of conformational changes and increase the biological
activity per molecule of the adsorbed proteins. Such a reduction of available
surface area can be achieved by pre-coating the sorbent surface with molecules
that form a barrier inhibiting unfolding of the protein molecule. The pre-adsorbed
molecules need not necessarily be of the same type as the protein molecules in
which one is interested: a similar effect may also be obtained by pre-coating a
surface with other possibly more protein-inert molecules.
Pre-adsorption of triblock copolymers composed of poly(ethylene oxide), PEO,
and poly(propylene oxide), PPO, and PEO again is commonly used [9-12] to
prevent or reduce subsequent protein adsorption. The copolymer adsorbs on a
hydrophobic surface through the water-insoluble PPO anchor part leaving the
water-soluble PEO buoy parts to protrude into the solution [13-15]. These buoy
parts form a steric barrier that, on a fully covered surface, prevents protein
adsorption. If, however, the amount of pre-adsorbed polymer is low, a rather
open, low density polymeric layer is formed that contains uncovered areas in
which proteins are still able to adsorb onto the surface [16-18]. The buoy parts in
100

Influence ofpre-adsorbed (block copolymers) molecules on IgG conformation
these layers may prevent unfolding of the adsorbed protein. In addition, the pre-
adsorbed polymers may alter the properties of the sorbent surface (e.g. its
hydrophobicity) which are known to affect the conformational rearrangements in
adsorbed proteins. Furthermore, pre-adsorbed triblock copolymers can direct
asymmetrically shaped proteins, i.e. IgG molecules, to adsorb in a preferential
orientation [18].
In a previous study we performed a structural analysis of a monoclonal IgG
adsorbed on different silica surfaces (hydrophilic, hydrophobic, hydrophobic with
pre-adsorbed triblock copolymers) using ATR-FTIR spectroscopy [17].
Unfortunately with this technique it was not possible to obtain reliable data for
IgG adsorbed on bare hydrophobic silica because of interference of hydrophobic
dehydration water. Therefore, such a spectroscopic comparison between IgG
adsorbed on a bare hydrophobic surface and on a hydrophobic surface precoated
with triblock copolymers was impossible and, hence, the effect of the pre-
adsorbed polymers on the conformation of subsequently adsorbed IgG could not
unambiguously be determined. However, the protein structure in solution as well
as adsorbed on a hydrophobic surface [4, 19] can be studied by Circular Dichroism
(CD) spectroscopy.
The main purpose of the present work is to determine by CD the effect of pre-
adsorbed polymer molecules on the secondary structure of adsorbed monoclonal
IgG molecules. We used PEO-PPO-PEO triblock copolymers to pre-coat the
sorbent surface. The effect of these layers on the secondary structure of adsorbed
IgG is studied by taking the coverage of the sorbent by the pre-adsorbed layer as
the experimental variable. In addition, the effects of adsorption conditions, such as
incubation time and pH are studied. Hydrophobic perfluoro-alkoxy fluoro carbon
Teflon particles are selected as the sorbent surface.
6.2 Experimental
6.2.1 Materials
Protein
Mouse monoclonal Immuno gamma Globulin (IgG) from isotype 1 directed
against the human pregnancy hormone (hCG, Human Chorionic Gonadotropin)
was a gift from Organon Teknika (Boxtel, The Netherlands).
The isoelectric points of the whole IgG and its fragments F(ab')2 a n d F(c) are 6.0,
101

Chapter 6
5.9 and 6.1 respectively, as determined by isoelectrical focusing.
Concentrated IgG solutions were stored at -20°C and thawed once shortly before
use. Prior to every experiment protein solutions were filtered through an 0.2 um
Acrodisc filter to remove aggregates. The extinctions at 280 nm were converted
into protein concentrations using an extinction coefficient of 1.45 cm^ mg~l.
Chemicals
Triblock copolymer of the type PEO-PPO-PEO (Synperonic P75), hereafter
abbreviated as P75, was a gift from ICI (Rotterdam, The Netherlands). The two
PEO (poly(ethylene oxide)) parts are water-soluble but the PPO (poly(propylene
oxide)) part is water-insoluble. The average molecular weights of the whole
polymer, its PEO, and PPO parts are 4150, 1075 Da (24 monomers) and 2000 Da
(34 monomers) respectively. Chemicals for buffer preparation, Na2HP04, NaH2P04, were of analytical grade
and used without further purification. Water was purified by reverse osmosis and
passed subsequently through a superQ system (Millipore).
Adsorbent
The Teflon latex used as the sorbent was a gift from Du Pont de Nemours (Le
Grand-Saconnex, Switzerland). The particles are monodisperse, hydrophobic
(contact angle of a drop of water on a tablet of dried material was 96°) and have a
diameter of 215 nm and a specific surface area of 13 m2g_1 [19]. The latex particles
are negatively charged due to sulfonate groups which stem from the
polymerisation initiator, potassium persulphate. As sulphate groups are strong, the
particles carry a constant (negative) surface charge density over the pH range
(pH 5-8) used in our experiments. The Teflon particles do not contain
UV-absorbing groups and their refractive index (1.35) is close to that of water
(1.33). Hence, these particles absorb and scatter negligibly in the far UV and are
therefore well suited to be used as an adsorbent when measuring circular
dichroism of adsorbed proteins.
6.2.2 Method
Teflon particles are precoated with polymer by incubation for 15 minutes in
polymer solutions of various concentrations. From reflectometry experiments we
know that under these experimental conditions all polymer molecules are
completely adsorbed.
By adjusting the number of Teflon particles per experiment it was possible to
102
Influence ofpre-adsorbed (block copolymers) molecules on IgG conformation
control the protein surface concentration at fixed total protein concentration.
The coverage of the (precoated) Teflon surface by the protein is adjusted while the
total protein concentration is maintained constant. For IgG an incubation time of
30 minutes is used, unless stated otherwise. A background spectrum of the (precoated) particles is taken before each measurement.
Circular Dichroism
CD spectra were recorded on a JASCO spectropolarimeter, model J-715 (JASCO
International Co., Tokyo, Japan). Solutions of protein as well as dispersions of the
protein-covered particles were scanned between 190 nm and 260 nm. The CD
measurements and the fitting of the spectra were performed as described in a
previous paper [4].
6.3 Results
6.3.1 IgG conformation as a function of its surface coverage. Absence of pre-adsorbed polymer
Representative far UV CD spectra of IgG in solution and adsorbed at hydrophobic
Teflon particles (1.68 mg m"2) are shown in figure 6.1. The spectrum of IgG in
solution has extremes at 217 nm (negative) and at 203 nm (positive) and intersects
the zero intensity line at a wavelength of 206 nm. It reflects the so-called
immunoglobulin fold, indicating a high content of beta sheet [20-22]. As expected
[3, 23], the spectra of adsorbed IgG strongly differ from that of IgG in solution
indicating major adsorption-induced changes in the secondary structure of IgG.
The contents of secondary structure elements calculated from these spectra are
summarised in table 6.1.
103
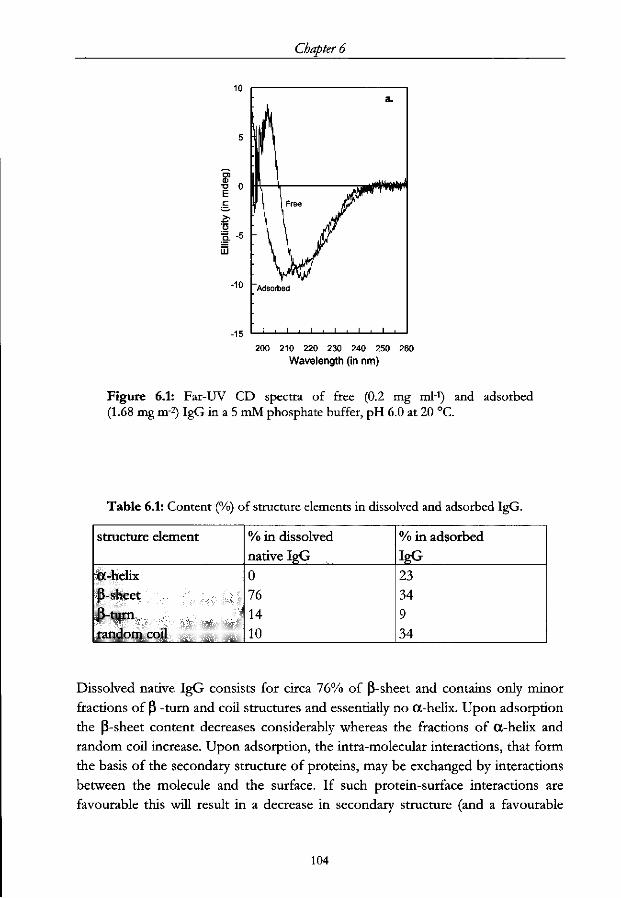
Chapter 6
200 210 220 230 240 250 260
Wavelength (in nm)
Figure 6.1: Far-UV CD spectra of free (0.2 mg ml1) and adsorbed (1.68 mg m-2) IgG in a 5 mM phosphate buffer, pH 6.0 at 20 °C.
Table 6.1: Content (%) of structure elements in dissolved and adsorbed IgG.
structure element
OC-helix p-sheet P-turn random coil
% in dissolved native IgG 0 76 14 10
% in adsorbed IgG 23 34 9 34
Dissolved native IgG consists for circa 76% of P-sheet and contains only minor
fractions of p -turn and coil structures and essentially no OC-helix. Upon adsorption
the P-sheet content decreases considerably whereas the fractions of OC-helix and
random coil increase. Upon adsorption, the intra-molecular interactions, that form
the basis of the secondary structure of proteins, may be exchanged by interactions
between the molecule and the surface. If such protein-surface interactions are
favourable this will result in a decrease in secondary structure (and a favourable
104
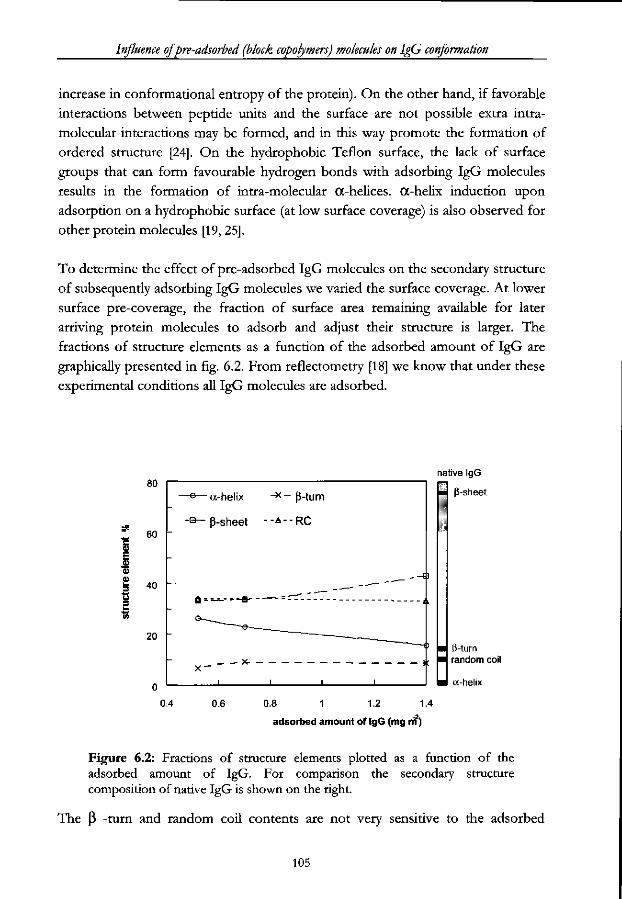
Influence ofpre-adsorbed (block copolymers) molecules on IgG conformation
increase in conformational entropy of the protein). On the other hand, if favorable
interactions between peptide units and the surface are not possible extra intra
molecular interactions may be formed, and in this way promote the formation of
ordered structure [24]. On the hydrophobic Teflon surface, the lack of surface
groups that can form favourable hydrogen bonds with adsorbing IgG molecules
results in the formation of intra-molecular CC-helices. OC-helix induction upon
adsorption on a hydrophobic surface (at low surface coverage) is also observed for
other protein molecules [19, 25].
To determine the effect of pre-adsorbed IgG molecules on the secondary structure
of subsequently adsorbing IgG molecules we varied the surface coverage. At lower
surface pre-coverage, the fraction of surface area remaining available for later
arriving protein molecules to adsorb and adjust their structure is larger. The
fractions of structure elements as a function of the adsorbed amount of IgG are
graphically presented in fig. 6.2. From reflectometry [18] we know that under these
experimental conditions all IgG molecules are adsorbed.
£ ai a>
3
3
80
60 "
40 "
20
-®— a-helix
- B ~ |3-sheet
- x - P-turn
-A- -RC
& = — - - * -
x- s:
native IgG
p-sheet
Mum random coil
a-helix
0.4 0.6 0.8 1 1.2 1.4
adsorbed amount of IgG (mg rri2)
Figure 6.2: Fractions of structure elements plotted as a function of the adsorbed amount of IgG. For comparison the secondary structure composition of native IgG is shown on the right.
The (3 -turn and random coil contents are not very sensitive to the adsorbed
105
Chapter 6
amount. However, the fraction of OC-helix decreases with increasing adsorbed
amount whereas the fraction of (3-sheet increases. Clearly, structural changes are
smaller when the degree of surface coverage is larger; a more native-like structure
is retained at higher adsorbed amounts. In other words, pre-adsorbed IgG
molecules suppress structural rearrangements in subsequently adsorbing molecules
by reducing the available area for spreading at the surface. This is found for many
different proteins adsorbing on various solid surfaces [6,7,26,35]. For monolayers
of IgG molecules at the air-water interface a similar effect is observed by Tronin et
al. [27]. At low surface pressure, i.e. at low surface coverage, the IgG film is
expanded; the effective molecular cross section grows as a result of unfolding of
the molecules. At higher surface pressure the film is more compressed. In other
words, unfolding of the IgG molecules is prevented by increasing the surface
pressure or, for that matter, by increasing the surface coverage.
6.3.2 IgG conformation on a triblock copolymerprecoated surface
We demonstrated that pre-adsorbed IgG molecules can suppress the degree of
structural changes in subsequendy adsorbing IgG molecules. Now it will be
investigated whether a similar effect can also be obtained by precoating the surface
with a triblock copolymer.
It is well known that interactions of some ionic surfactants with globular proteins
induce major changes in the protein conformation [28, 29], whereas in general,
nonionic surfactants do not interact, or interact only mildly with proteins [30] so
that no severe changes in the secondary structure are induced. To check whether
specific interactions of the (nonionic) polymer influence the conformation of IgG,
spectra of IgG are measured in solutions containing varying concentrations of P75
up to 1 mg ml"1.
The obtained spectra (not shown) were identical to that of dissolved IgG for every
polymer concentration. This demonstrates that in solution the presence of polymer
does not induce any changes in the conformation of native IgG. Absence of
interaction in solution between a PEO-PPO-PEO triblock copolymer and
albumin, fibrinogen, and immunoglobulin, was also reported by Tan and
Martic [31].
With increasing adsorbed amount of P75, the rate of adsorption and the maximum
adsorbed amount of subsequendy adsorbing IgG decreases strongly [18].
Moreover, an IgG-repelling surface was created at polymer coverages of
0.7 m g m 2 [18]. For P75, saturation adsorption at a hydrophobic surface
106

Influence ofpre-adsorbed (block copolymers) molecules on IgG conformation
corresponds to an adsorbed amount of 0.8 mg m"'
£
3
80
60
40
20 -
v--~
~e— a-nelix -* p-turn -B— p-sheet - -A - - RC
. ,—-a' J 3 —
Q-""^
— X X x
1 1
. ' J 1
y / -
y -
-,v
%*K
i — • — 1 >
native IgG
-sheet
(i-turn random coil
a-helix
0.2 0.4 0.6 0.8
adsorbed amount of P7S (mg m2)
Figure 6.3: Fractions of structure elements of adsorbed IgG as a function of the pre-adsorbed amount of P75. For comparison the secondary structure composition of native IgG is shown on the right.
The Teflon particles are precoated with P75 up to surface coverages of 0.8 mg m"2.
CD spectra of IgG adsorbed at polymer precoated particles are measured and the
corresponding secondary structure compositions are graphically presented in
fig 6.3.
As found with pre-adsorbed IgG, the P-turn and random coil content are the least
sensitive for the pre-adsorbed amount of P75. In adsorbed IgG the fraction of RC
amounts to approximately 35% and it is invariant with the adsorbed amount of
IgG or P75, whereas in solution it only amounts to about 10%. Thus, the fraction
of random coil structure serves well to probe whether IgG is adsorbed or not.
At intermediate amounts of P75 the fraction of Ot-helix decreases whereas the
fraction of (3-sheet increases with increasing P75 surface coverage. Thus, pre-
adsorbed triblock copolymer P75 suppresses the degree of structural changes in
subsequently adsorbing IgG and a more native-like structure is retained. From the
fraction of random coil structure, 35%, we conclude that at these surface coverages
of P75 all IgG molecules are in the adsorbed state.
107
Chapter 6
In a previous paper we reported on the effect of pre-adsorbed polymers on the
structure of adsorbed proteins using ATR-FTIR spectroscopy [17]. Information on
the exact adsorbed amount of polymer was not available, but it was lower than the
maximum in order not to fully block the surface for subsequent protein
adsorption. The results of that study are in good agreement with those obtained in
the present study, i.e., the presence of the polymer on the surface allowed neither
IgG nor BSA to rearrange its structure extensively.
It is observed that at high surface coverage of P75, approximately 0.6 mg m"2 and
0.8 mg m"2, the conformation of the IgG is similar to the conformation of native
dissolved IgG. Furthermore, the fraction of random coil structure, 10%, indicates
that the IgG molecules are, as expected, in solution rather than adsorbed.
Carignano et al. [32] performed a theoretical study of model systems resembling
our experimental system of pre-adsorbed PEO chains and a protein that may
change its conformation upon adsorption. The fractions of native and denatured
proteins were calculated as a function of polymer grafting density. As a model for
PEO chains on a hydrophobic surface they used a flexible chain consisting of
segments that are attracted by the surface. The model protein molecule is assumed
to be spherical in solution, upon adsorption it can either retain its spherical shape
or denature into a pancake-like configuration. The contact energy for pancakes
with a bare surface was assumed to be twice as high as for spheres. As a result, on
a bare surface the amount of adsorbed pancakes was twice that of adsorbed
spheres.
An increase in the surface coverage by PEO chains resulted in a strong decrease of
the amount of adsorbed pancakes while the amount of adsorbed spheres
increased. The density of spheres on the surface decreased once there were no
more pancakes on the surface. This behaviour can be explained by the strong
repulsion that a pancake configuration experiences on a surface precoated with
polymers. In the pancake configuration most of the volume of the protein is close
to the surface where, due to the polymer-surface attraction, the polymer segments
are located as well.
These calculations provide agreement with our experimental observations.
Unfortunately, CD experiments are not suitable to discriminate between a protein
layer in which each molecule is unfolded to some extent and a layer in which a part
of the protein population is completely unfolded and the rest has a native
conformation, so this part of the assumptions of Carignano and Szleifer could not
108
Influence ofpre-adsorbed (block copolymers) molecules on IgG conformation
be tested experimentally.
Although IgG and P75 are very different molecules, increasing pre-adsorbed
amounts of these molecules have comparable effects on the secondary structure of
subsequent adsorbing IgG. This trend suggests a similar underlying mechanism,
viz., a reduction in the available area for spreading at the sorbent surface.
6.3.3 Biological activity of IgG adsorbed on precoated surfaces
Elsewhere we observed [18] an increased biological activity of IgG molecules both
at higher adsorbed amounts of IgG and on surfaces precoated with polymer. This
increase is likely the result of both retaining a more native-like structure and a
more favourable orientation. In [18] we present a detailed study of the IgG
adsorption process on (polymer) precoated surfaces and its effect on the
immunological activity.
The positive effect of surface coverage on the biological activity was also observed
by Tronin et al. [27]. They found that at an air-water interface at high surface
pressure IgG was still active, whereas a complete loss of activity was registered at
low surface pressure.
6.3.4 Effect of adsorption conditions on IgG conformation
Incubation time
The time dependence of the structural changes in adsorbed IgG are studied for
various adsorption conditions: different pH values, different adsorbed amounts of
IgG and relatively low adsorbed amounts of triblock copolymer (to ensure that all
IgG molecules are adsorbed at the surface). To enable determination of the
secondary structure after short periods of incubation of the protein with the
sorbent surface the spectra were an average of only 2 scans. At the start of the IgG
adsorption a spectrum was taken every two minutes up to 15 minutes of
incubation time. Thereafter, spectra were taken after 20, 30 and 60 minutes and 2,
3 and 24 hours.
The spectra obtained for each adsorption condition are almost invariant with
incubation time. This indicates that essentially all changes in the protein structure
occur before the first spectrum is taken and that no additional reconformation
occurs after that, up to a day. In our measurements approximately 2 minutes were
necessary to fill the cuvette with protein solution, and to take the first spectrum,
implying that sufficient time may have elapsed for the adsorbed protein to change
its conformation. This also is in agreement with our ATR-FTIR results [17].
109
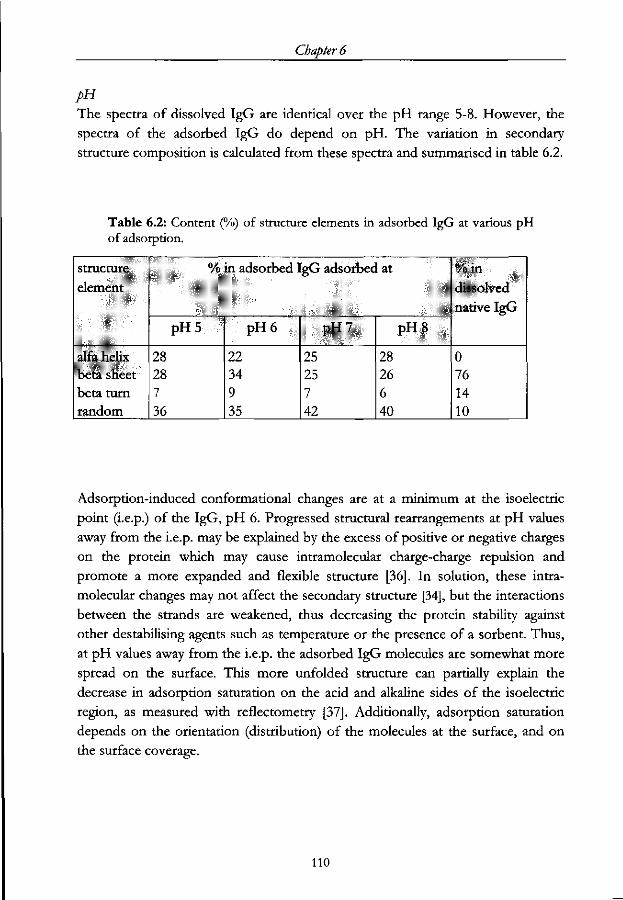
Chapter 6
pH
The spectra of dissolved IgG are identical over the pH range 5-8. However, the
spectra of the adsorbed IgG do depend on pH. The variation in secondary
structure composition is calculated from these spectra and summarised in table 6.2.
Table 6.2: Content (%) of structure elements in adsorbed IgG at various pH of adsorption.
s true lure element
alfa helix beta sheet beta turn random
% in adsorbed IgG adsorbed at
pH5
28 28 7 36
pH6
22 34 9 35
pH7
25 25 7 42
pH8
28 26 6 40
% in
dissolved native IgG
0 76 14 10
Adsorption-induced conformational changes are at a minimum at the isoelectric
point (i.e.p.) of the IgG, pH 6. Progressed structural rearrangements at pH values
away from the i.e.p. may be explained by the excess of positive or negative charges
on the protein which may cause intramolecular charge-charge repulsion and
promote a more expanded and flexible structure [36]. In solution, these intra
molecular changes may not affect the secondary structure [34], but the interactions
between the strands are weakened, thus decreasing the protein stability against
other destabilising agents such as temperature or the presence of a sorbent. Thus,
at pH values away from the i.e.p. the adsorbed IgG molecules are somewhat more
spread on the surface. This more unfolded structure can partially explain the
decrease in adsorption saturation on the acid and alkaline sides of the isoelectric
region, as measured with reflectometry [37]. Additionally, adsorption saturation
depends on the orientation (distribution) of the molecules at the surface, and on
the surface coverage.
110

Influence ofpre-adsorbed (block copolymers) molecules on IgG conformation
6.4 Conclusion The fraction of random coil structure of an IgG molecule can be used to
determine whether it is in an adsorbed state or in solution.
Pre-adsorbed molecules can suppress the degree of structural changes in
subsequently adsorbing IgG molecules by reducing the available surface area. This
effect was observed on surfaces precoated with IgG and triblock copolymer
molecules. Hence, partial pre-coating of a surface is an effective way of controlling
the conformation and the biological activity of adsorbed IgG. In a following paper
we will extend our study on the effect of pre-adsorbed polymer on the adsorption
and biological activity of IgG in an ELISA application.
Adsorption-induced structural changes in IgG occur within seconds and no
additional reconformation occurs over a timescale of hours. This shows that long
term reorientation of the IgG molecules on the surface [18] does not involve
further structural changes.
The pH at which the adsorption process takes place has an effect on the secondary
structure of adsorbed IgG. The structural integrity is best retained around the i.e.p.
of the IgG. Hence, solution conditions may be an interesting variable in the
production of immunoassays.
I l l
Chapter 6
6.5 References
1. Welfle, K., Missehvitz, R., Hausdorf, G., Hohne, W., and Welfle, H. (1999)
Biochim. Biophys. Acta 1431, 120.
2. Vlasov, A. P., Kravchuk, Z. I., and Martsev, S. P. (1996) Biokhimiyia 61, 212.
3. Buijs, J., Norde, W., and Lichtenbelt, J.W.T. (1996) Langmuir 12, 1605.
4. Vermeer, A.W.P., Bremer, M.G.E.G., and Norde, W. (1998) Biochim. Biophys.
Acta 1425, 1.
5. Geddes, N.J., Furlong, D.N., Zientek, P., Than, K.A., and Edgar, J.A. (1993)
/ . Colloid Interf. Sci. 157, 491.
6. Wertz, C. F., and Santore, M.M. (1999) Langmuir 15, 8884.
7. Maste, M.C.L., Norde, W., and Visser, A.J.W.G. (1997) / . Colloid Interf. Sci.
196, 224.
8. Kondo, A., and Mihara, J. (1996) / . Colloid Interf. Sci. 177, 214.
9. Lee, J. H., Kopecek, J., and Andrade, J. (1989)/. Biomed. Mater. Res. 23, 351.
10. Amiji, M., and Park, K. (1992) Biomaterials 13, 682.
11. Schroen, C.G.P.H., Cohen Stuart, M.A., van der Voort Maarschalk, K., van
der Padt, A., and van 't Riet, K. (1995) Langmuir 11, 3068.
12. Freij-Larsson, C , Nylander, T., and Wesslen, B. (1996) Biomaterials 17, 2199.
13. Lee, J., Martic, P.A., and Tan, J.S. (1989) / . Colloid Interf. Sci. 131, 252.
14. Tiberg, F., Malmsten, M., Linse, P., and Lindman, B. (1991) Langmuir 7,
2723.
15. O'Connor, S.M., Gehrke, S.H., and Retzinger, G.S. (1999) Langmuir 15,
2580.
16. McPherson, T., Kidane, A., Sleifer, I., and Park, K. (1998) Langmuir 14,176.
17. Giacomelli, C.E., Bremer, M.G.E.G., and Norde, W. (1999) / . Colloid Interf.
Sci. 220, 13.
18. Chapter 3, this thesis.
19. Maste, M.C.L., Pap, E.H.W., Hoek, A. v., Norde, W., and Visser, A.J.W.G.
(1996)/. Colloid Interf. Sci. 180, 632.
20. Amzel, L.M., and Poljak, RJ. (1979) Annu. Rev. Biochem. 48, 961.
21. Davies, D.R., and Metzger, H. (1983) Annu. Rev. Immunol. 1, 87.
22. Padlan, E.A. (1994) Mol. Immunol. 31,169.
23. Vermeer, A.P.W., and Norde, W. (2000) / . Colloid Interf. Sci. 225, 394.
24. Norde, W. (1998) Biopolymers at interfaces, Driving forces for protein adsorption at
solid surfaces, Vol. 75, Marcel Dekker, Inc., New York.
25. Zoungrana, T., Findenegg, G.H., and Norde, W. (1997) / . Colloid Interf. Sci.
190, 437.
26. Norde, W., and Favier, J. P. (1992) Colloids Surf. 64, 87.
112
Influence ofpre-adsorbed (block copolymers) molecules on IgG conformation
27. Tronin, A., Dubrovsky, T., Dubrovskaya, S., Radicchi, G., and Nicolini, C.
(1996) Langmuir 12, 3272.
28. Rao, K. S., and Prakash, V. (1993) / . Biol.Chem. 268,14769.
29. Subramanian, M., Seshadri, B. S., and Venkatappa, M. P. (1986) / . Biosci. 10.
30. Ananthapadmanabhan, K. P. (1993) Protein-surfactant interactions, CRC Press,
Boca Raton, Fl.
31. Tan, J .S , and Martic, P.A. (1990) / . Colloid Interf. Sci. 136, 415.
32. Carignano, M.A., and Szleifer. I. (2000) Colloids Surfaces B 18, 169.
34. Chehin, R., Iloro, I., Marcos, M.J., Villar, E., Shnyrov, V.L., and Arrondo,
J.L.R. (1999) Biochemistry 38, 1525.
35. Kondo, A., Murakami, F., Kawagoe, M., and Higashitani, K., (1993,) Appl.
Microbiol. Biotechnol. 39, 726.
36. Kleijn, M., and Norde, W. (1995) Heterogeneous Chem. Rev. 2,157.
37. Chapter 2, this thesis.
113

Chapter 7
7.1 Introduction
Since their introduction in the early nineteen seventies [1], solid phase
immunoassays (SPI) form the basis of many commercially available
immunodiagnostic tests. Even though a large number of successful technical
variations have been introduced, the fundamental principle has not changed: SPI
configurations consist of an immobilized capture reagent (an antibody, antigen or a
fragment of one of these), the substance to be measured and a detection system
that at least includes a second specifically binding agent carrying a detectable label.
In an enzyme-linked immunosorbent assay (ELISA)[1], the label is an enzyme that
causes a matching substrate to change its colour or otherwise reflects its presence
quantitatively. The major advantages of such assays are their high stability and
sensitivity, the potential for obtaining rapid quantitative results and the possibility
of using relatively simple equipment [2].
To achieve high sensitivity in ELISA assays (1) maximized biological activity of the
immobilized immunoproteins and (2) minimized non-specific binding of reactants
to each other and to residual free solid surface are prerequisites. Yet, capture
proteins are generally immobilized through physical adsorption [3], a process
which is known to result in a partial loss of immunoreactivity [4]. This loss of
reactivity may be caused by a spatially reduced accessibility of the antigen binding
sites or by conformational changes in the antibodies, especially when hydrophobic
surfaces are used. The antigen binding sites become inaccessible for antigens when
they are in the vicinity of the sorbent surface. To avoid these problems a variety of
immobilisation techniques have been proposed, e.g. covalent coupling to the solid
surface [4], streptavidine bridging [2], immobilisation using a previously adsorbed
antiglobulin [2] or protein A [5]. Although some of these techniques may indeed
lead to increased average biological activity of IgGs, they may also introduce new
difficulties: more cosdy manufacturing procedures, the need for expensive
chemicals and dedicated solid surfaces to name some. The main reason for
industry to persist in using physical adsorption is its easy processing and its
acceptable product performance.
With these considerations in mind the present paper will focus on achieving
improved immuno-performance of adsorbed proteins. Previously [6], we showed
that, in an experimental model system that the anisotropic shape of the IgG
molecules can be exploited advantageously to let them adsorb in a preferential
orientation, leading to a considerably higher specific activity of adsorbed IgG. This
was realised by creating a 'molecular sieve' on the sorbent surfaces by pre-
116
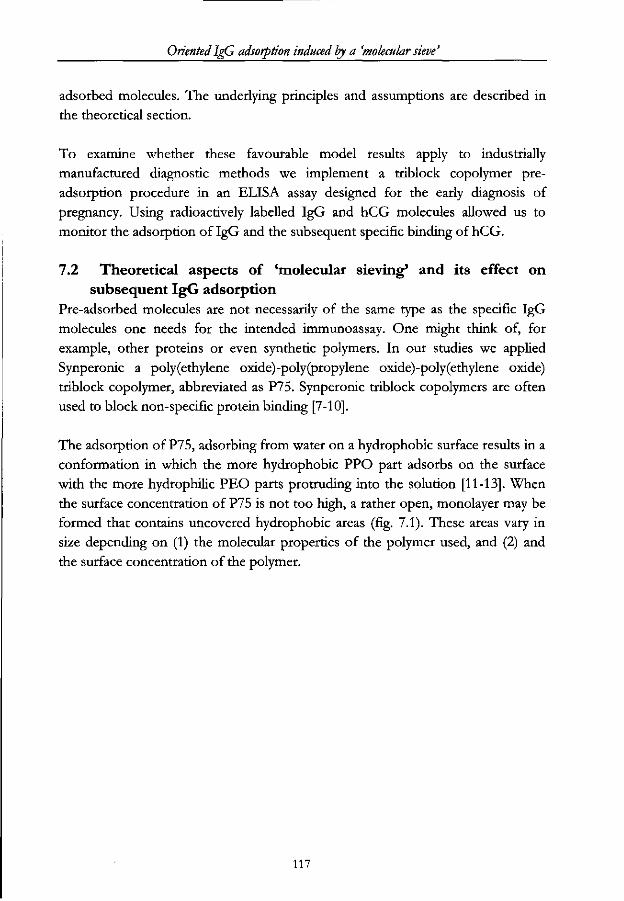
Oriented IgG adsorption induced by a 'molecular sieve'
adsorbed molecules. The underlying principles and assumptions are described in
the theoretical section.
To examine whether these favourable model results apply to industrially
manufactured diagnostic methods we implement a triblock copolymer pre-
adsorption procedure in an ELISA assay designed for the early diagnosis of
pregnancy. Using radioactively labelled IgG and hCG molecules allowed us to
monitor the adsorption of IgG and the subsequent specific binding of hCG.
7.2 Theoretical aspects of 'molecular s ieving' and its effect on
subsequent IgG adsorption
Pre-adsorbed molecules are not necessarily of the same type as the specific IgG
molecules one needs for the intended immunoassay. One might think of, for
example, other proteins or even synthetic polymers. In our studies we applied
Synperonic a poly(ethylene oxide)-poly(propylene oxide)-poly(ethylene oxide)
triblock copolymer, abbreviated as P75. Synperonic triblock copolymers are often
used to block non-specific protein binding [7-10].
The adsorption of P75, adsorbing from water on a hydrophobic surface results in a
conformation in which the more hydrophobic PPO part adsorbs on the surface
with the more hydrophilic PEO parts protruding into the solution [11-13]. When
the surface concentration of P75 is not too high, a rather open, monolayer may be
formed that contains uncovered hydrophobic areas (fig. 7.1). These areas vary in
size depending on (1) the molecular properties of the polymer used, and (2) and
the surface concentration of the polymer.
117
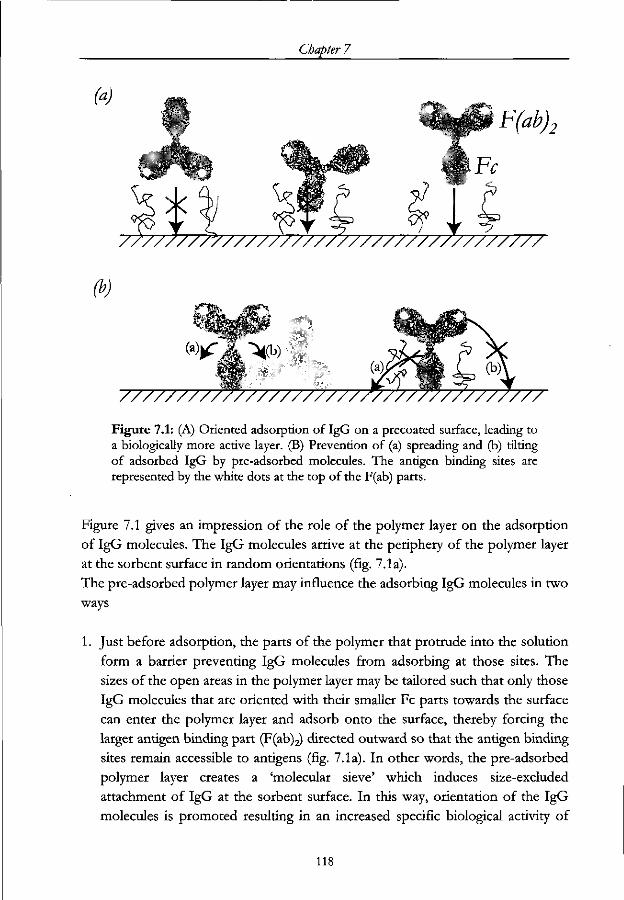
Chapter 7
(a)
i*^:F(ab)2
(b)
Figure 7.1: (A) Oriented adsorption of IgG on a precoated surface, leading to a biologically more active layer. (B) Prevention of (a) spreading and (b) tilting of adsorbed IgG by pre-adsorbed molecules. The antigen binding sites are represented by the white dots at the top of the F(ab) parts.
Figure 7.1 gives an impression of the role of the polymer layer on the adsorption
of IgG molecules. The IgG molecules arrive at the periphery of the polymer layer
at the sorbent surface in random orientations (fig. 7.1a).
The pre-adsorbed polymer layer may influence the adsorbing IgG molecules in two
ways
1. Just before adsorption, the parts of the polymer that protrude into the solution
form a barrier preventing IgG molecules from adsorbing at those sites. The
sizes of the open areas in the polymer layer may be tailored such that only those
IgG molecules that are oriented with their smaller Fc parts towards the surface
can enter the polymer layer and adsorb onto the surface, thereby forcing the
larger antigen binding part (F(ab)2) directed outward so that the antigen binding
sites remain accessible to antigens (fig. 7.1a). In other words, the pre-adsorbed
polymer layer creates a 'molecular sieve' which induces size-excluded
attachment of IgG at the sorbent surface. In this way, orientation of the IgG
molecules is promoted resulting in an increased specific biological activity of
118

Oriented IgG adsorption induced by a 'molecular sieve'
the adsorbed IgG molecules.
2. Following adsorption, pre-adsorbed molecules may suppress changes in the
orientation and conformation of subsequently adsorbing immunoglobulins by
reducing the available surface area (fig. 7.1b). Generally, IgG molecules
adsorbing at a surface tend to adjust their orientation and conformation in such
a way as to optimise their interaction with the surface. Given their non-globular
geometry, this usually leads to a rather side-on orientation and a spread
molecule and, hence, a relatively low maximum adsorption. In such an
orientation the antigen binding sites, which are located at the far ends of the
antigen binding domains, are poorly accessible for binding antigens. However,
orientational and conformational changes can only take place when there is
sufficient space and time. The PEO-parts that protrude into the solution may
form a barrier that prevents this undesired tilting and spreading of the IgG
molecules.
In this study we will test the validity of these processes in a microliter plate study.
7.3 Experimental
7.3.1 Materials
Adsorbent
Flat-bottomed 96-well polystyrene microtiter plates were obtained from Organon
Teknika BV (Boxtel, The Netherlands).
Chemicals
Triblock copolymer of the type PEO-PPO-PEO (Synperonic P75), hereafter
denoted as P75, was a gift from ICI (Rotterdam, The Netherlands). The two PEO
(poly(ethylene oxide)) parts are relatively hydrophilic and the PPO (poly(propylene
oxide)) part is relatively hydrophobic. The average molecular weights of the whole
polymer, its PEO, and PPO parts are 4150, 1075 (24 segments) and 2000 (34
segments) respectively. Chemicals for buffer preparation, Na2HP04 and NaH2P04 (Merck) were of
analytical grade and used without further purification. Milli-Q water quality was
used throughout.
Proteins
Mouse monoclonal immunoglobulins G (IgG 7B and IgG 3A) from isotype 1
119
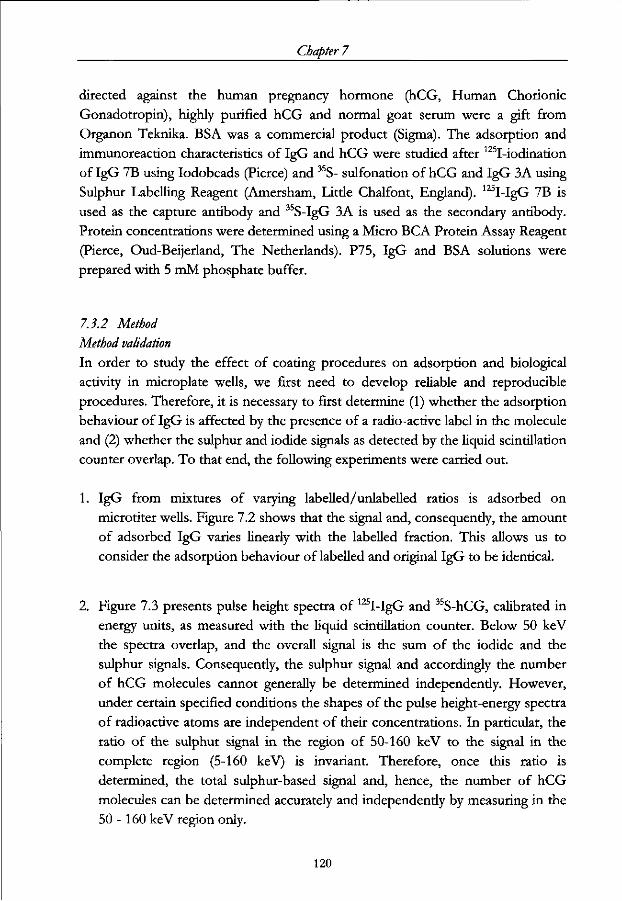
Chapter 7
directed against the human pregnancy hormone (hCG, Human Chorionic
Gonadotropin), highly purified hCG and normal goat serum were a gift from
Organon Teknika. BSA was a commercial product (Sigma). The adsorption and
immunoreaction characteristics of IgG and hCG were studied after 125I-iodination
of IgG 7B using Iodobeads (Pierce) and 35S- sulfonation of hCG and IgG 3A using
Sulphur Labelling Reagent (Amersham, Litde Chalfont, England). 125I-IgG 7B is
used as the capture antibody and 35S-IgG 3A is used as the secondary antibody.
Protein concentrations were determined using a Micro BCA Protein Assay Reagent
(Pierce, Oud-Beijerland, The Netherlands). P75, IgG and BSA solutions were
prepared with 5 mM phosphate buffer.
7.3.2 Method
Method validation
In order to study the effect of coating procedures on adsorption and biological
activity in microplate wells, we first need to develop reliable and reproducible
procedures. Therefore, it is necessary to first determine (1) whether the adsorption
behaviour of IgG is affected by the presence of a radio-active label in the molecule
and (2) whether the sulphur and iodide signals as detected by the liquid scintillation
counter overlap. To that end, the following experiments were carried out.
1. IgG from mixtures of varying labelled/unlabelled ratios is adsorbed on
microliter wells. Figure 7.2 shows that the signal and, consequendy, the amount
of adsorbed IgG varies linearly with the labelled fraction. This allows us to
consider the adsorption behaviour of labelled and original IgG to be identical.
2. Figure 7.3 presents pulse height spectra of 125I-IgG and 35S-hCG, calibrated in
energy units, as measured with the liquid scintillation counter. Below 50 keV
the spectra overlap, and the overall signal is the sum of the iodide and the
sulphur signals. Consequendy, the sulphur signal and accordingly the number
of hCG molecules cannot generally be determined independendy. However,
under certain specified conditions the shapes of the pulse height-energy spectra
of radioactive atoms are independent of their concentrations. In particular, the
ratio of the sulphur signal in the region of 50-160 keV to the signal in the
complete region (5-160 keV) is invariant. Therefore, once this ratio is
determined, the total sulphur-based signal and, hence, the number of hCG
molecules can be determined accurately and independendy by measuring in the
50 -160 keV region only.
120
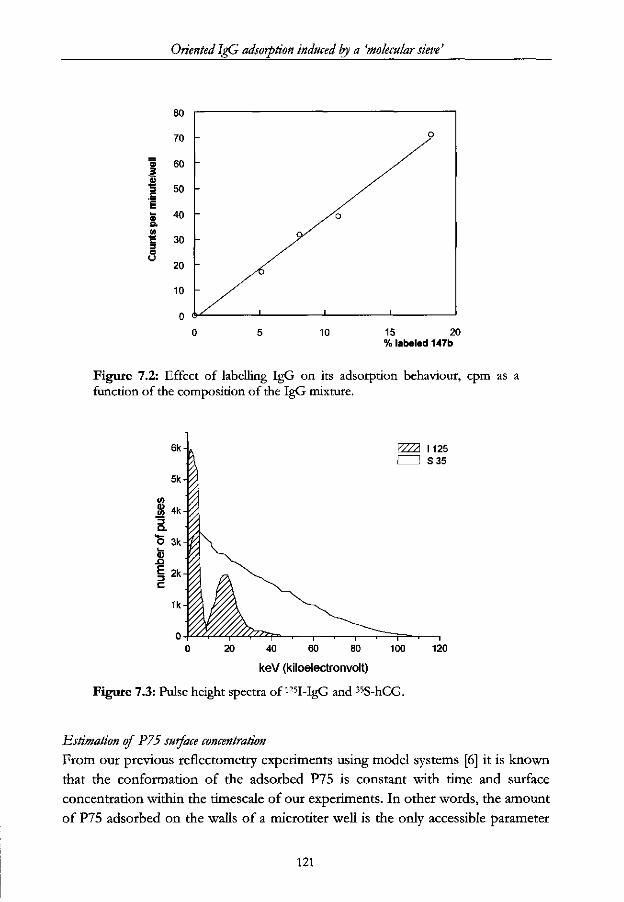
Oriented IgG adsorption induced by a 'molecular sieve'
-s
a) a. v>
3 a
15 20 % labeled 147b
Figure 7.2: Effect of labelling IgG on its adsorption behaviour, cpm as a function of the composition of the IgG mixture.
VZZA 1125
tzzn s35
40 60 80
keV (kiloelectronvolt)
Figure 7.3: Pulse height spectra of 125I-IgG and 35S-hCG.
Estimation of P75 surface concentration
From our previous reflectometry experiments using model systems [6] it is known
that the conformation of the adsorbed P75 is constant with time and surface
concentration within the timescale of our experiments. In other words, the amount
of P75 adsorbed on the walls of a microtiter well is the only accessible parameter
121
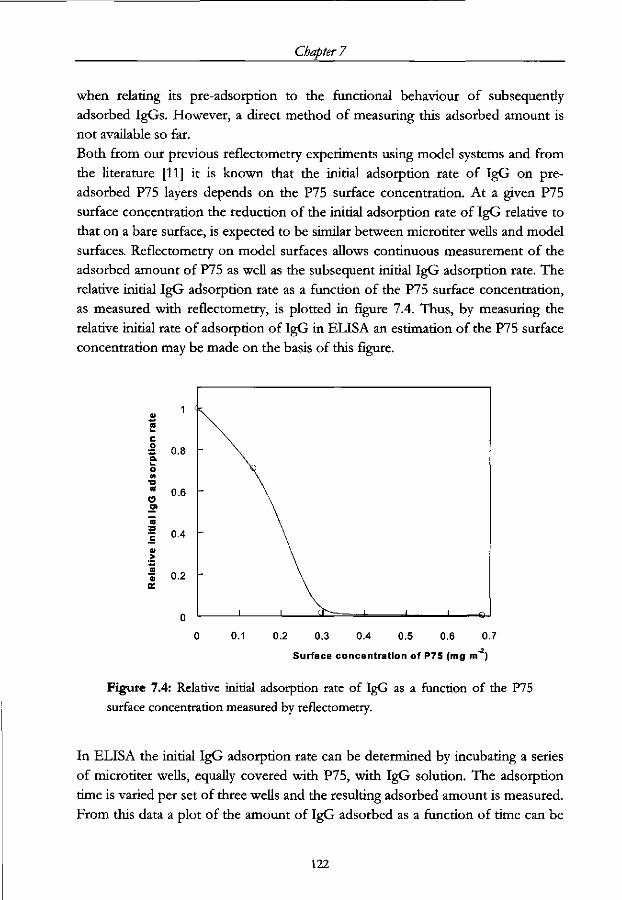
Chapter 7
when relating its pre-adsorption to the functional behaviour of subsequently
adsorbed IgGs. However, a direct method of measuring this adsorbed amount is
not available so far.
Both from our previous reflectometry experiments using model systems and from
the literature [11] it is known that the initial adsorption rate of IgG on pre-
adsorbed P75 layers depends on the P75 surface concentration. At a given P75
surface concentration the reduction of the initial adsorption rate of IgG relative to
that on a bare surface, is expected to be similar between microtiter wells and model
surfaces. Reflectometry on model surfaces allows continuous measurement of the
adsorbed amount of P75 as well as the subsequent initial IgG adsorption rate. The
relative initial IgG adsorption rate as a function of the P75 surface concentration,
as measured with reflectometry, is plotted in figure 7.4. Thus, by measuring the
relative initial rate of adsorption of IgG in ELISA an estimation of the P75 surface
concentration may be made on the basis of this figure.
1 <i
o Q. O 0) •D n 0
0.8 '
0.6 -
= 0.4 -
« 0.2
0 0.1 0.2 0.3 0.4 0.5 0.6 0.7
Surface concentration of P75 (mg m~ )
Figure 7.4: Relative initial adsorption rate of IgG as a function of the P75
surface concentration measured by reflectometry.
In ELISA the initial IgG adsorption rate can be determined by incubating a series
of microtiter wells, equally covered with P75, with IgG solution. The adsorption
time is varied per set of three wells and the resulting adsorbed amount is measured.
From this data a plot of the amount of IgG adsorbed as a function of time can be
122
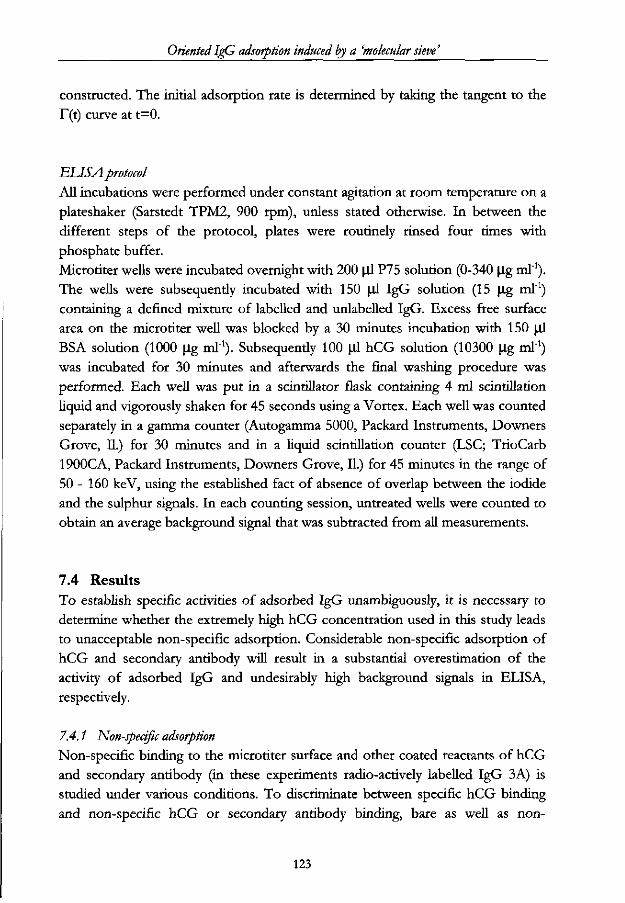
Oriented IgG adsorption induced by a 'molecular sieve'
constructed. The initial adsorption rate is determined by taking the tangent to the
r( t) curve at t=0.
BUS A protocol
All incubations were performed under constant agitation at room temperature on a
plateshaker (Sarstedt TPM2, 900 rpm), unless stated otherwise. In between the
different steps of the protocol, plates were routinely rinsed four times with
phosphate buffer.
Microliter wells were incubated overnight with 200 |il P75 solution (0-340 |ig ml"1).
The wells were subsequently incubated with 150 (il IgG solution (15 |ig ml"1)
containing a defined mixture of labelled and unlabelled IgG. Excess free surface
area on the microtiter well was blocked by a 30 minutes incubation with 150 (il
BSA solution (1000 (Ig ml1). Subsequently 100 (il hCG solution (10300 (Ig ml1)
was incubated for 30 minutes and afterwards the final washing procedure was
performed. Each well was put in a scintillator flask containing 4 ml scintillation
liquid and vigorously shaken for 45 seconds using a Vortex. Each well was counted
separately in a gamma counter (Autogamma 5000, Packard Instruments, Downers
Grove, II.) for 30 minutes and in a liquid scintillation counter (LSC; TrioCarb
1900CA, Packard Instruments, Downers Grove, II.) for 45 minutes in the range of
50 - 160 keV, using the established fact of absence of overlap between the iodide
and the sulphur signals. In each counting session, untreated wells were counted to
obtain an average background signal that was subtracted from all measurements.
7.4 Results
To establish specific activities of adsorbed IgG unambiguously, it is necessary to
determine whether the extremely high hCG concentration used in this study leads
to unacceptable non-specific adsorption. Considerable non-specific adsorption of
hCG and secondary antibody will result in a substantial overestimation of the
activity of adsorbed IgG and undesirably high background signals in ELISA,
respectively.
7.4.1 Non-specific adsorption
Non-specific binding to the microtiter surface and other coated reactants of hCG
and secondary antibody (in these experiments radio-actively labelled IgG 3A) is
studied under various conditions. To discriminate between specific hCG binding
and non-specific hCG or secondary antibody binding, bare as well as non-
123
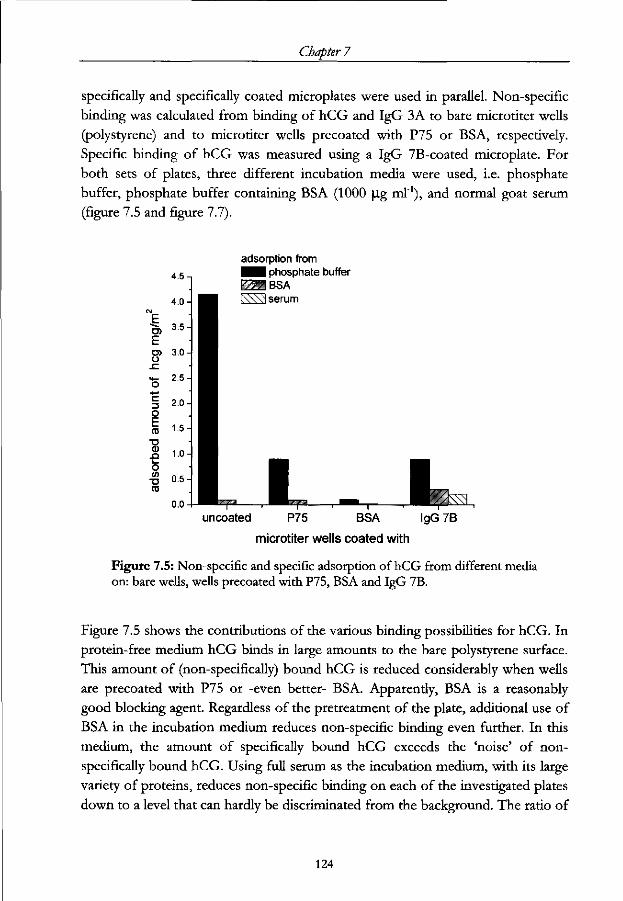
Chapter 7
specifically and specifically coated microplates were used in parallel. Non-specific
binding was calculated from binding of hCG and IgG 3A to bare microtiter wells
(polystyrene) and to microtiter wells precoated with P75 or BSA, respectively.
Specific binding of hCG was measured using a IgG 7B-coated microplate. For
both sets of plates, three different incubation media were used, i.e. phosphate
buffer, phosphate buffer containing BSA (1000 |ag ml4), and normal goat serum
(figure 7.5 and figure 7.7).
adsorption from • H I phosphate buffer
uncoated P75 BSA IgG 7B microtiter wells coated with
Figure 7.5: Non-specific and specific adsorption of hCG from different media on: bare wells, wells precoated with P75, BSA and IgG 7B.
Figure 7.5 shows the contributions of the various binding possibilities for hCG. In
protein-free medium hCG binds in large amounts to the bare polystyrene surface.
This amount of (non-specifically) bound hCG is reduced considerably when wells
are precoated with P75 or -even better- BSA. Apparently, BSA is a reasonably
good blocking agent. Regardless of the pretreatment of the plate, additional use of
BSA in the incubation medium reduces non-specific binding even further. In this
medium, the amount of specifically bound hCG exceeds the 'noise' of non-
specifically bound hCG. Using full serum as the incubation medium, with its large
variety of proteins, reduces non-specific binding on each of the investigated plates
down to a level that can hardly be discriminated from the background. The ratio of
124

OrientedIgG adsorption induced by a 'molecular sieve'
specifically to non-specifically bound hCG (figure 7.6) i.e., the signal to noise ratio,
convincingly shows the improvement that can be achieved by proper selection of
the incubation conditions.
LU w O
CD
50-
40-
30-
20 -
10-
0 -
Microtiter wells • • 1 uncoated Y//A P75 coated NWN BSA coated
l\\\\1
BSA
medium
serum phosphate buffer
Figure 7.6: Signal to noise ratio for hCG binding from different media.
Considering the binding of secondary antibody IgG 3A, similar experiments were
performed. As could be expected, in phosphate buffer this protein binds in large
amounts to bare polystyrene. More surprisingly, it binds in even larger amounts to
wells precoated with IgG 7B (figure 7.7). This indicates that our coated IgG 7B
and our secondary antibodies 3A strongly interact. Similar to our hCG data, non
specific binding is reduced considerably in a BSA-rich medium, and even further in
goat serum. Yet, the non-specific binding of IgG 3A to the coated IgG could not
entirely be prevented, not even in normal goat serum. This will result in a higher
background signal. Clearly, lower background signals could be achieved when the
amount of IgG in the coat can be reduced.
125
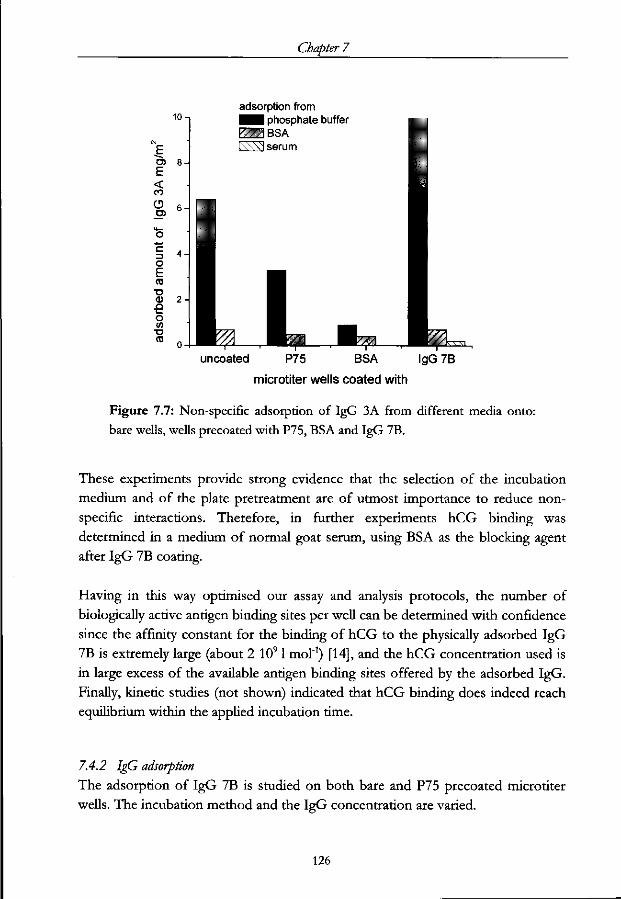
Chapter 7
adsorption from • • • phosphate buffer ^ B S A ES53 serum
uncoated P75 BSA IgG 7B microtiter wells coated with
Figure 7.7: Non-specific adsorption of IgG 3A from different media onto:
bare wells, wells precoated with P75, BSA and IgG 7B.
These experiments provide strong evidence that the selection of the incubation
medium and of the plate pretreatment are of utmost importance to reduce non
specific interactions. Therefore, in further experiments hCG binding was
determined in a medium of normal goat serum, using BSA as the blocking agent
after IgG 7B coating.
Having in this way optimised our assay and analysis protocols, the number of
biologically active antigen binding sites per well can be determined with confidence
since the affinity constant for the binding of hCG to the physically adsorbed IgG
7B is extremely large (about 2 1091 mol"1) [14], and the hCG concentration used is
in large excess of the available antigen binding sites offered by the adsorbed IgG.
Finally, kinetic studies (not shown) indicated that hCG binding does indeed reach
equilibrium within the applied incubation time.
7.4.2 IgG adsorption
The adsorption of IgG 7B is studied on both bare and P75 precoated microtiter
wells. The incubation method and the IgG concentration are varied.
126

Oriented IgG adsorption induced by a 'molecular sieve'
Experiments in which the bare microtiter plate is continuously agitated during
adsorption not only show a higher initial adsorption rate; they also display a higher
maximum adsorbed amount (fig. 7.8). The maximum amount of IgG adsorbed
clearly depends on the rate of supply; for instance, after 24 hours of static
incubation the adsorbed amount is lower than after 1 hour of permanent
homogenisation.
Precoated P75 (mg/m2) • 0 • 0.03
" ^ * 0.16
I 6.1 • 026 o -a) 5-
I 3
8 -
* 7 . E
nfi-l D)
O h -
3 u 4 -01
* 3 "
82-3
0-
Precoated P75 (mg/m2) • 0 • 0.06 A 0.20 T 0.26
•
r? V*A hnrvT
• A
•
1.0
Time (hours)
2.0 10 15
Time (hours)
20 25
Figure 7.8: IgG adsorption on microtiter wells precoated with P75. IgG incubation (left) under constant agitation and (right) statically.
This striking effect of agitation shows that convection prevails over diffusion-
controlled adsorption [15]. The difference in plateau value means that in the
adsorbed state the (non-globular) IgG molecules occupy a larger surface area with
increasing adsorption time. Most probably this is caused by relaxation
(reorientation and reconformation) of the molecules. Indeed, from CD
measurements, we concluded that structural changes in IgG on a hydrophobic
surface progress further when the amount of IgG adsorbed is lower [16].
Reorientation and reconformation can only take place when there is sufficient
space and time available [17-19]. From the observed trends it can be inferred that
the rate of these relaxation processes must be comparable to the rate of deposition
at the sorbent surface. Beyond some critically high supply rate, adsorbed molecules
no longer have time for relaxation before adjacent surface is covered by additional
molecules. Additional support for this mechanism can be gained from varying the
protein concentration in the incubation medium, because increasing concentration
implies higher fluxes. Figure 7.9 shows the binding curves of a large series of IgG
concentrations.
127
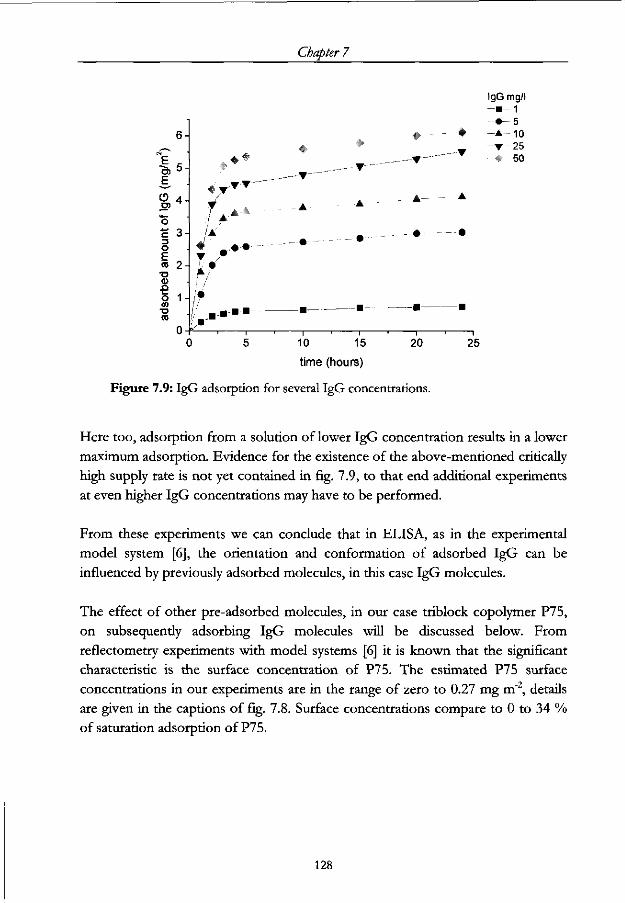
Chapter 7
6-
\
E, .
O 4 .
'o r 3-3 0
E to 2 -
T3 0)
£t
O 1 --0 ni
0-
4 •
A
•
• v
• •
/ f A .A* A'
_ . • • •
•
.•-•-•"• ' I
•if
A
-- •
I
•
•
B —
I
•
•
• -
I
•
- - - - •
Jk
•
1 1
IgG mg/l - • - 1
• 5 A 10 T 25 • 50
0 5 10 15 20
time (hours)
Figure 7.9: IgG adsorption for several IgG concentrations.
25
Here too, adsorption from a solution of lower IgG concentration results in a lower
maximum adsorption. Evidence for the existence of the above-mentioned critically
high supply rate is not yet contained in fig. 7.9, to that end additional experiments
at even higher IgG concentrations may have to be performed.
From these experiments we can conclude that in ELISA, as in the experimental
model system [6], the orientation and conformation of adsorbed IgG can be
influenced by previously adsorbed molecules, in this case IgG molecules.
The effect of other pre-adsorbed molecules, in our case triblock copolymer P75,
on subsequendy adsorbing IgG molecules will be discussed below. From
reflectometry experiments with model systems [6] it is known that the significant
characteristic is the surface concentration of P75. The estimated P75 surface
concentrations in our experiments are in the range of zero to 0.27 mg m"2, details
are given in the captions of fig. 7.8. Surface concentrations compare to 0 to 34 %
of saturation adsorption of P75.
128

Oriented IgG adsorption induced by a 'molecular sieve'
Similar to the protein adsorption findings on a bare plate, agitation has its effect on
the initial binding rate and the adsorbed mass. At increasing amounts of pre-
adsorbed 75, the initial adsorption rate of IgG decreases (figure 7.8), as does the
maximum amount of protein that is bound. At high surface concentrations by P75
no differences in the maximum adsorbed amount are found any more: apparently
the IgG can no longer relax on a sufficiently dense precoated surface.
In general, the binding probability of an IgG molecule on a freely accessible bare
part of a hydrophobic surface approaches unity [6]. Therefore, the observed
reduction in initial adsorption rate (fig. 7.8) indicates that the binding probability
reduces because a smaller fraction of the incoming IgG molecules can interact with
the sorbent surface due to the repulsion by the polymer.
7.4.3 The specific activity and binding capacity of adsorbed IgG
The dependence of the initial adsorption rates and the plateau values on the
polymer surface concentration indicates that the orientation and/or the
conformation of the later adsorbing IgG molecules may be influenced. Whether a
biologically more active IgG layer is created by the presence of the pre-adsorbed
polymer can be investigated by measuring the specific activity of IgG in the
adsorbed layer.
> "5 o E CO - ^
go o O
2.0
1.8
1.6
1.4
1.2H
1.0
0.8
0.6 H
0.4
0.2
Maximum specific activity -
• t=15 • t=30 A t=60 • t=120
A
Increasing P75 coverage (mg/m )
— i —
•0.3
Figure 7.10: Specific activity of IgG as a function of P75 surface concentration, measured after 15, 30, 60 and 120 minutes of IgG incubation.
129

Chapter 7
We observed that the amount of IgG adsorbed depends on the estimated P75
surface concentration. Based on these reliable estimates figures 7.10 and 7.11
represent the trends in the effect that surface concentration of P75 has on the
specific activity of the adsorbed IgG molecules for its antigen hCG. IgG
adsorption times were varied between 15, 30, 60 and 120 minutes.
Once adsorbed on bare microtiter wells, or at very low P75 surface concentration,
the specific activity of IgG is approximately 0.3 mole/mole at all investigated
incubation times (fig. 7.10). In solution, each molecule of IgG possesses two
antigen binding sites. In other words, after adsorption on practically empty
surfaces only 15% of all antigen binding sites are capable of binding antigens. Loss
of internal structure of the IgG and/or a reduced geometric accessibility of binding
sites due to an adverse orientation on the surface may explain part of this low
activity [16,20]. Similar losses in functionality have been reported by many others,
both for IgG [3] and for other proteins [21]. The specific activity of IgG on bare
microtiter wells is -on the time scales of our experiments- independent of the
coating time.
Fortunately, at high P75 surface concentration the specific activity of adsorbed
IgG molecules strongly increases with this concentration regardless of the
incubation time of the IgG. At these high surface concentrations specific activities
as high as 1.8 mole/mole can be achieved, i.e. over 90% of all antigen binding sites
are active. When IgG is forced to adsorb in between pre-adsorbed polymer
molecules, the specific activity increases by well over a factor of five. These data
demonstrate that, in full agreement with our earlier model studies on this subject
[6], a more favourably oriented IgG layer is created and that the sieving of the IgG
by the polymer, as described in the introduction, not only takes place in our model
experiments but also occurs in ELISA experiments! Within the given experimental
accuracy no differences in the specific activity can be distinguished between
differing IgG incubation times. This trend is in line with our model studies.
130
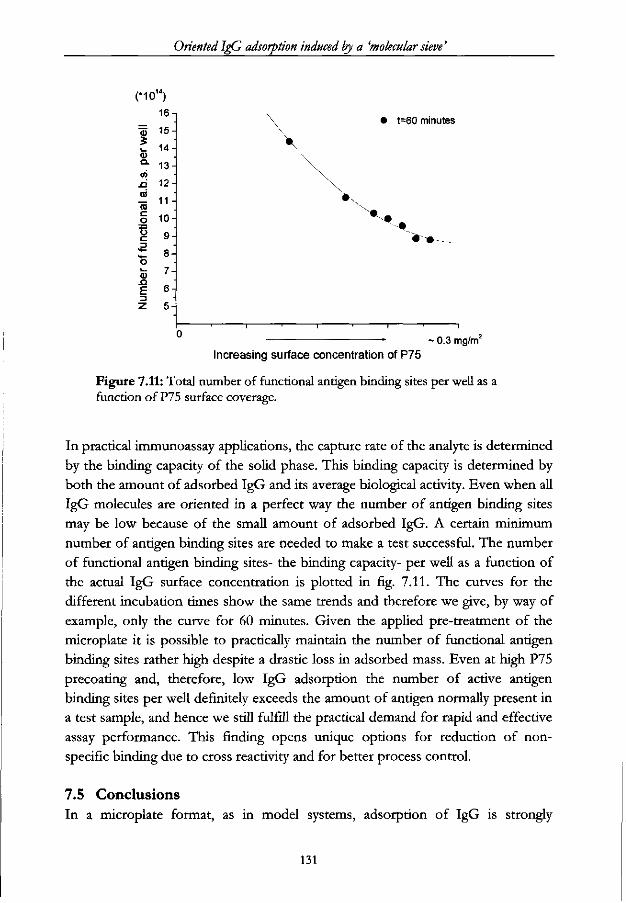
Oriented IgG adsorption induced by a 'molecular sieve'
(*10
"55 * (U Q .
(0 . O
(0
(0 c 0 0
3
M— O
(1)
n F 3
z
") I 6 - 1
15-
14-13-
•
12-
11 -
10-
9-. 8-
7-
t>-
b-
\ \
• t=60 minutes
' * " . . * ' " " •
1 • 1
- 0.3 mg/m Increasing surface concentration of P75
Figure 7.11: Total number of functional antigen binding sites per well as a function of P75 surface coverage.
In practical immunoassay applications, the capture rate of the analyte is determined
by the binding capacity of the solid phase. This binding capacity is determined by
both the amount of adsorbed IgG and its average biological activity. Even when all
IgG molecules are oriented in a perfect way the number of antigen binding sites
may be low because of the small amount of adsorbed IgG. A certain minimum
number of antigen binding sites are needed to make a test successful. The number
of functional antigen binding sites- the binding capacity- per well as a function of
the actual IgG surface concentration is plotted in fig. 7.11. The curves for the
different incubation times show the same trends and therefore we give, by way of
example, only the curve for 60 minutes. Given the applied pre-treatment of the
microplate it is possible to practically maintain the number of functional antigen
binding sites rather high despite a drastic loss in adsorbed mass. Even at high P75
precoating and, therefore, low IgG adsorption the number of active antigen
binding sites per well definitely exceeds the amount of antigen normally present in
a test sample, and hence we still fulfill the practical demand for rapid and effective
assay performance. This finding opens unique options for reduction of non
specific binding due to cross reactivity and for better process control.
7.5 Conclusions
In a microplate format, as in model systems, adsorption of IgG is strongly
131
Chapter 7
influenced by the presence of previously coated molecules. Pre-adsorbed
molecules form a 'molecular sieve' on the sorbent surface, which induces oriented
adsorption of IgG yielding a higher specific biological activity of the IgG
molecules. The underlying mechanism may be generic in origin and effective to
orient a variety of other non-spherical molecules or particles on a solid surface.
Advantages of this new degree of freedom in adsorption-based assay development
can be the prospect of using highly specific antibodies which normally lose their
bio-activity upon adsorption, the possibility of tailoring non-specific interactions,
the application in multi-analyte assays and using smaller amounts of expensive
biomaterials.
Our studies indicate that control of the amount of precoated material may be
critical, and further work in this area holds promises.
132
OrientedIgG adsorption induced by a 'molecular sieve'
7.6 References
1. Engvall, E. and Perlmann, P. (1971) Immunochemistry 8, 871.
2. Butler, J.E. Enzyme-Linked Immunosorbent Assay.
3. Buder, J.E., Ni, L., Nessler, R., Joshi, K.S., Suter, M., Rosenberg, B., Chang,
J., Brown, W.R. and Cantarero, L.A. (1992)/. Immunol. Methods 150,11.
4. Molina-Bolivar, J.A., Galisteo-Gonzalez, F. and Hidalgo-Alvarez, R. (1998)
/ . Biomater. Sri. PolymerEdn. Vol9, No.10,1089.
5. 5 Murata, M., Arakawa, M., Yoshida, T., and Hato, M. (1998) Colloids Surf. B
12, 35.
6. Chapter 3, this thesis.
7. Lee, J.H., Kopecek, J., and Andrade, J. (1989) / . Biomed. Mater. Res. 23, 351.
8. Amiji, M., and Park, K. (1992) Biomaterials 13, 682.
9. Schroen, C.G.P.H., Cohen Stuart, M.A., van der Voort Maarschalk, K., van
der Padt, A., and van 't Riet, K. (1995) Langmuir 11, 3068.
10. Freij-Larsson, C , Nylander, T., and Wesslen, B. (1996) Biomaterials 17, 2199.
11. Lee, J., Martic, P.A., and Tan, J.S. (1989)/. ColloidInterf. Sri. 131, 252.
12. Tiberg, F., Malmsten, M., Linse, P., and Lindman, B. (1991) Langmuir 7,
2723.
13. O'Connor, S.M., Gehrke, S.H., and Retzinger, G.S. (1999) Langmuir 15,
2580.
14. Van Erp, R. Ph.D. Thesis, Utrecht University 1991.
15. Beumer, T., Stoffelen, E., Smits, J., and Carpay, W. (1992) / Immunol.
Methods 154,11.
16. Chapter 6, this thesis.
17. Maste, M.C.L., Norde, W., and Visser, A.J.W.G. (1997) / Colloid Interf. Sri.
196, 224.
18. Wertz, C.F., and Santore, M.M. (1999) Langmuir 15, 8884.
19. Kondo, A., Murakami, F., Kawagoe, M., and Higashitani, K. (1993) Appl.
Microbiol. Biotechnol. 39, 726.
20. Vermeer, A.W.P., Bremer, M.G.E.G., and Norde, W. (1998) Biochim. Biophys.
Acta 1425,1.
21. Zoungrana, T., Findenegg, G. H., and Norde, W. (1997) / . Colloid Interf. Sri.
190, 431.
133
SUMMARY
Preservation of biological functioning of proteins during immobilisation is of
special interest in various biomedical and biotechnical applications. In industry
physical adsorption of immunoglobulins (IgGs) onto solid surfaces is still the
predominant immobilisation procedure because it is relatively easy to perform.
Physical adsorption, however, often results in an undesired loss of biological
activity. This loss of activity may be caused by changes in the specific folding (the
conformation) of the IgG or by a reduced accessibility of the antigen binding sites
by blocking, for instance when IgG molecules are adsorbed with their antigen
binding sites oriented towards the sorbent surface.
To control the orientation and conformation of adsorbed IgG molecules we
studied the interactions involved in physical adsorption of IgG molecules on solid
surfaces. Our goal was to optimize the biological activity of adsorbing IgG
molecules. For this, we introduced a new method to achieve oriented physical
adsorption of IgG. This concept is based on the anisodimensionality of IgG
molecules and resembles 'molecular sieving' on the sorbent surface. The 'sieve' is
created by preadsorbed molecules that form a steric barrier preventing adsorption
at some sites, but leaving patches of uncovered surface area. The open areas in the
preadsorbed layer can be tuned in such a way that only the smaller part of
anisodimensional molecules can enter and adsorb. In the case of IgG this means
that only the Fc part can adsorb to the surface and thereby forcing the larger
antigen binding parts (F^b)^ directed towards the solution and, hence, accessible
to bind antigens. A 'sieve' formed either with preadsorbed IgG molecules or with
triblock copolymers of poly(ethylene oxide), PEO, and poly(propylene oxide),
PPO, of the type PEO-PPO-PEO was proven to yield a higher specific biological
activity of subsequently adsorbing IgG.
In brief, the effect of a 'molecular sieve' on IgG adsorption is essentially threefold.
Firstly, it induces oriented IgG adsorption. Secondly, it prevents extended
undesirable structural changes in adsorbed IgG and thirdly, it prevents undesirable
reorientation of the adsorbed IgG.
In chapter 1 it is explained that in many applications there is a need to control the
biological activity of adsorbed IgG. The physical properties and characteristics of
135

Summary - Immunoglobulin adsorption on modified surfaces
IgG molecules and the interactions involved in physical adsorption of proteins are
described and, more importantly, our variant of 'molecular sieving' is introduced.
Finally, an outline of this thesis is given.
The influence of electrostatic interactions on the adsorption of IgG is examined
both theoretically and experimentally in chapter 2. The long range interaction
between IgG and the sorbent surface is treated in terms of the DLVO theory. We
attempted to make use of the dipolar character of the IgG molecules to control
their orientation upon adsorption. It is concluded that electrostatic interactions
have a strong influence on the adsorption behaviour of IgG molecules on
hydrophilic charged surfaces. Due to extensive desorption of IgG from both
positively and negatively charged surfaces, electric field-induced orientation of IgG
could not be established unambiguously.
Chapter 3 is mainly dedicated to the orientational aspects of IgG adsorption. In this
chapter the phenomenon of 'molecular sieving' is demonstrated first theoretically
using a Random Sequential Adsorption (RSA) model and second experimentally by
a set of reflectometry experiments on surfaces partially covered with preadsorbed
layers of either IgG or triblock copolymers of PEO-PPO-PEO. The rate of IgG
adsorption and the maximum adsorbed amount decreases with increasing adsorbed
amount of triblock copolymer. On the precoated layers, IgG is indeed adsorbed in
a preferential orientation which yielded a higher specific biological activity of the
IgG molecules. Furthermore, we observed that the preadsorbed layers prevent
undesirable reorientation of adsorbed IgG.
The mass flux towards the surface also has a profound effect on the adsorbed
amount and, consequently, on the orientation of IgG.
In chapters 4, 5 and 6 conformational changes in IgG are studied. In chapter 4 a
structural analysis of a monoclonal IgG adsorbed on different silica surfaces
(hydrophilic, hydrophobic, hydrophobic with preadsorbed triblock copolymers)
using ATR-FTIR spectroscopy is given. The secondary structure of adsorbed IgG
on a hydrophilic silica surface resembles that of native IgG in solution. The
presence of preadsorbed triblock copolymers on the hydrophobic silica surface
cause a decrease in the adsorbed amount of IgG and, more importantly prevent
substantial structural rearrangements in the adsorbed IgG molecules.
In chapters 5 and 6, Circular Dichroism (CD) is used as a spectroscopic technique
for studying protein structure in the adsorbed state. Chapter 5 gives information on
the structural changes of IgG molecules induced by adsorption on a hydrophobic
136
Summary - Immunoglobulin adsorption on modified surfaces
surface and compares these changes with those induced by heat treatment. Neither
heat-induced nor adsorption-induced structural changes lead to complete unfolding
into an extended polypeptide chain, but leave a significant part of the IgG molecule
in a globular or corpuscular form. The structural changes induced by heating and
by adsorption are different.
The effect of preadsorbed IgG and triblock copolymer molecules on the secondary
structure of subsequently adsorbing IgG molecules is studied in chapter 6.
Structural rearrangements were less extensive with increasing surface coverage of
the polymer. It was found that preadsorbed IgG molecules have comparable effects
on the secondary structure of subsequent adsorbing IgG; a more native-like
structure is retained for the higher adsorbed amounts. Hence, partial pre-coating of
a surface is an effective way to control the secondary structure of later adsorbed
IgG molecules.
To examine whether the model results apply to industrially manufactured
diagnostic methods we implemented in chapter 7 the triblock copolymer pre-
adsorption procedure in a microplate assay. Radio-actively labelled IgG and hCG
molecules allowed us to monitor the adsorption of IgG and the subsequent specific
binding of hCG. The data obtained are in agreement with our earlier model studies
and demonstrate that sieving of the IgG by the polymer does take place, resulting
in the creation of a more favourably oriented IgG layer. Our studies indicate that
the amount of precoated material is critical in the formation of an operational
'sieve'.
137
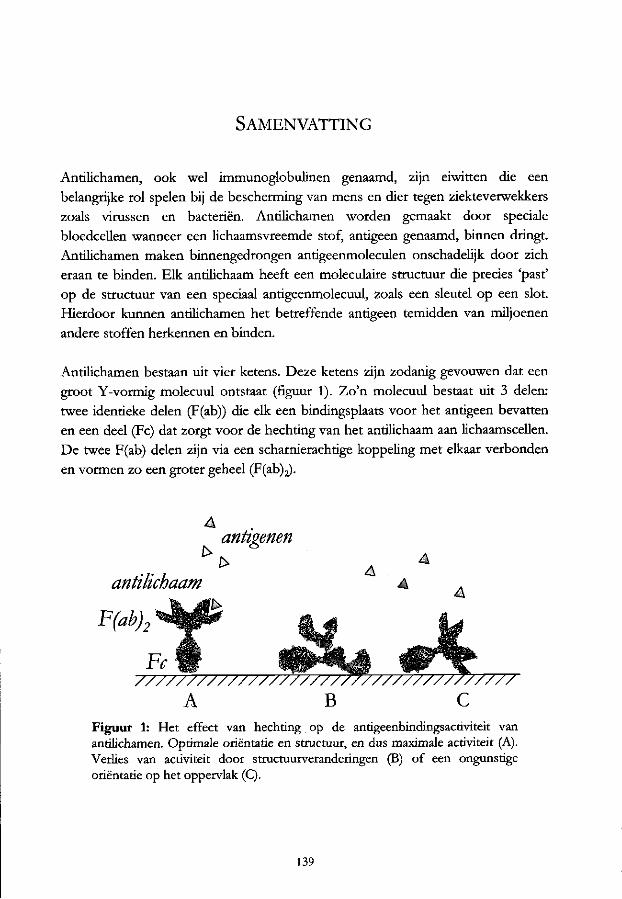
SAMENVATTING
Antilichamen, ook wel immunoglobulinen genaamd, zijn eiwitten die een
belangrijke rol spelen bij de bescherming van mens en dier tegen ziekteverwekkers
zoals virussen en bacterien. Antilichamen worden gemaakt door speciale
bloedcellen wanneer een lichaamsvreemde stof, antigeen genaamd, binnen dringt.
Antilichamen maken binnengedrongen antigeenmoleculen onschadelijk door zich
eraan te binden. Elk antilichaam heeft een moleculaire structuur die precies 'past'
op de structuur van een speciaal antigeenmolecuul, zoals een sleutel op een slot.
Hierdoor kunnen antilichamen het betreffende antigeen temidden van miljoenen
andere stoffen herkennen en binden.
Antilichamen bestaan uit vier ketens. Deze ketens zijn zodanig gevouwen dat een
groot Y-vormig molecuul ontstaat (figuur 1). Zo'n molecuul bestaat uit 3 delen:
twee identieke delen (F(ab)) die elk een bindingsplaats voor het antigeen bevatten
en een deel (Fc) dat zorgt voor de hechting van het antilichaam aan lichaamscellen.
De twee F(ab) delen zijn via een scharnierachtige koppeling met elkaar verbonden
en vormen zo een groter geheel (F(ab)^.
antigenen
antilichaam
F(ab)2 "^0?
Fc
A B C Figuur 1: Het effect van hechting op de antigeenbindingsactiviteit van antilichamen. Optimale orientatie en structuur, en dus maximale activiteit (A). Verlies van activiteit door structuurveranderingen (B) of een ongunstige orientatie op het oppervlak (C).
139

Samenvatting
In medische testen wordt veel gebruik gemaakt van de eigenschap van antilichamen
om heel specifiek bepaalde biologische moleculen te binden. Zo worden
antilichamen bijvoorbeeld gebruikt om ziekteverwekkers of hormonen in bloed of
urine aan te tonen. In deze testen worden antilichamen vaak gehecht aan vaste
oppervlakken. Dit vergemakkelijkt het aantonen en scheiden van antilichamen die
antigenen hebben gebonden. Echter, door de hechting op een oppervlak verliezen
de antilichamen ten dele hun vermogen om antigenen te binden (figuur 1). Voor dit
verlies aan bindingsactiviteit kunnen twee belangrijke oorzaken gegeven worden.
Ten eerste, de specifieke vouwing van de ketens kan veranderen waardoor de
structuur van het antilichaam niet meer 'past' op het antigeen en het antilichaam het
antigeen niet meer herkent (figuur IB). Ten tweede, intacte bindingsplaatsen
kunnen geblokkeerd en dus onbereikbaar zijn voor antigenen, bijvoorbeeld
wanneer ze zich in de buurt van het oppervlak bevinden (figuur 1C). Voor een
optimale bindingsactiviteit op een oppervlak moet dus zowel de orientatie als de
structuur van antilichamen gunstig zijn. Er is veel onderzoek uitgevoerd om
hechtingsmethoden te ontwikkelen waarbij aan bovenstaande voorwaarden wordt
voldaan. Hoewel deze nieuwe methoden soms hebben geleid tot een redelijk
behoud van antigeenbindingscapaciteit, kleefden er ook vaak duidelijke nadelen aan
zoals een moeilijke productieprocedure of de noodzaak kostbare chemicalien of
speciale oppervlakken te gebruiken.
Inzicht in de wisselwerkingen tussen antilichamen en vaste oppervlakken is van
groot belang voor de ontwikkeling van nieuwe hechtingsmethoden. Het in dit
proefschrift beschreven onderzoek is uitgevoerd om inzicht in deze
wisselwerkingen te verkrijgen. Dit inzicht wordt gebruikt om op een eenvoudige
manier de orientatie en structuur van antilichamen op een oppervlak te sturen en
hiermee de antigeenbindingsactiviteit van de antilichamen te optimaliseren.
Eerst is in modelsystemen met verschillende technieken de effecten van lading (pH
en zoutsterkte), het type oppervlak en de verblijftijd op het oppervlak op de
structuur en orientatie van de antilichamen bestudeerd. Op basis van deze gegevens
is besloten om voor de gewenste orientatie op een oppervlak gebruik te maken van
de specifieke Y-vorm van de antilichamen. Vervolgens is een nieuwe
hechtingsmethode ontwikkeld.
140
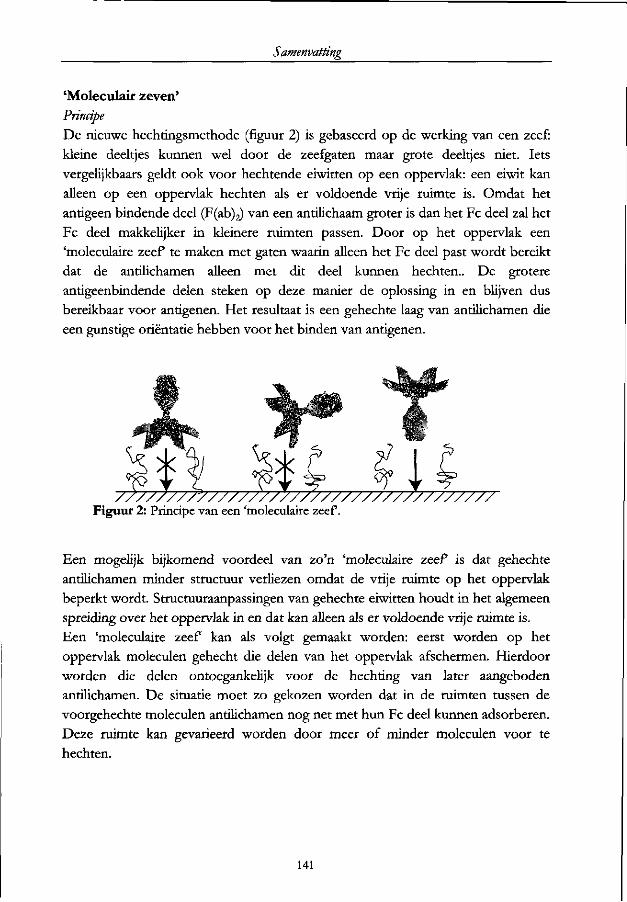
Samenvatting
'Moleculair zeven'
Principe
De nieuwe hechtingsmethode (figuur 2) is gebaseerd op de werking van een zeef:
kleine deeltjes kunnen wel door de zeefgaten maar grote deeltjes niet. lets
vergelijkbaars geldt ook voor hechtende eiwitten op een oppervlak: een eiwit kan
alleen op een oppervlak hechten als er voldoende vrije ruimte is. Omdat het
antigeen bindende deel (F^b)^ van een antilichaam groter is dan het Fc deel zal het
Fc deel makkelijker in kleinere ruimten passen. Door op het oppervlak een
'moleculaire zeef te maken met gaten waarin alleen het Fc deel past wordt bereikt
dat de antilichamen alleen met dit deel kunnen hechten.. De grotere
antigeenbindende delen steken op deze manier de oplossing in en blijven dus
bereikbaar voor antigenen. Het resultaat is een gehechte laag van antilichamen die
een gunstige orientatie hebben voor het binden van antigenen.
m ^••ViiV-
*LV • . V
Figuur 2: Principe van een 'moleculaire zeef.
Een mogelijk bijkomend voordeel van zo'n 'moleculaire zeef is dat gehechte
antilichamen minder structuur verliezen omdat de vrije ruimte op het oppervlak
beperkt wordt. Structuuraanpassingen van gehechte eiwitten houdt in het algemeen
spreiding over het oppervlak in en dat kan alleen als er voldoende vrije ruimte is.
Een 'moleculaire zeef kan als volgt gemaakt worden: eerst worden op het
oppervlak moleculen gehecht die delen van het oppervlak afschermen. Hierdoor
worden die delen ontoegankelijk voor de hechting van later aangeboden
antilichamen. De situatie moet zo gekozen worden dat in de ruimten tussen de
voorgehechte moleculen antilichamen nog net met hun Fc deel kunnen adsorberen.
Deze ruimte kan gevarieerd worden door meer of minder moleculen voor te
hechten.
141

Samenvatting
Resultaten
In modelsystemen is met verschillende technieken het hechtingsgedrag van
antilichamen bestudeerd. Met behulp van reflectometrie wordt de gehechte massa
van moleculen in de tijd gemeten. De antigeenbindingscapaciteit van een laag
gehechte antilichamen wordt bepaald door een oplossing met antigenen aan de laag
aan te bieden. De gebonden massa aan antigeen kan omgerekend worden naar het
aantal antigeenmoleculen gebonden per antilichaam. De bindingscapaciteit
weerspiegelt de orientatie van een antilichaam op het oppervlak. Infrarood-
spectroscopie en circulair dichroisme spectroscopic zijn optische technieken die we
hebben gebruikt om de vouwing/structuur van antilichamen te bepalen. Met deze
technieken kunnen de veranderingen in de structuur door hechting op een
oppervlak gevolgd worden.
Het effect van lading op de hechting van antilichamen is onderzocht op twee
hydrofiele ('waterminnende') oppervlakken met verschillend ladingsteken. Uit de
experimenten blijkt dat lading weliswaar een belangrijke rol speelt in het
hechtingsgedrag van antilichamen, maar dat elektrostatische wisselwerkingen tussen
antilichamen en dit type oppervlak niet zo sterk zijn dat een permanente hechting
van de antilichamen wordt verkregen. Deze oppervlakken zijn dan ook niet
geschikt om te gebruiken als dragermateriaal in testsystemen.
In het vervolg van het onderzoek is gebruik gemaakt van hydrofobe
('waterafstotende') oppervlakken omdat eiwitten zich wel sterk hechten aan dit type
oppervlak. Op dit oppervlak is een 'moleculaire zeef gemaakt met zogeheten
triblok-copolymeren. Dit zijn moleculen die bestaan uit een lange keten waarvan
het middendeel op het oppervlak hecht en de twee uiteinden de oplossing in
steken. Zo vormen ze een soort spijkerbed op het oppervlak. De antilichamen
moeten dan tussen de spijkers hechten. Met de verschillende genoemde technieken
is gekeken naar de orientatie en de structuur van antilichamen op hydrofobe
oppervlakken. Dit is gebeurd op een leeg oppervlak en op een oppervlak waarop
zo'n 'moleculaire zeef is aangebracht. Zo kon het effect van de zeef bepaald
worden.
Uit de resultaten is gebleken dat op een leeg hydrofoob oppervlak antilichamen
zich in allerlei orientaties hechten. De antilichamen die eerst eindstandig
georienteerd waren vielen na verloop van tijd om waardoor ze met hun zijkant op
het oppervlak kwamen te liggen. Hierdoor waren de bindingsplaatsen minder goed
bereikbaar. Ook ging door hechting op het oppervlak een deel van de structuur van
142
de antilichamen verloren. Door de ongunstige orientatie en de veranderingen in de
structuur was de antigeenbinding van de gehechte antilichamen verre van optimaal.
Hierna is het hechtingsgedrag van de triblok-copolymeren bestudeerd. De
polymeren hechten snel en sterk aan het hydrofobe oppervlak. Wanneer
antilichamen op de 'moleculaire zeef (de voorgehechte laag polymeren) gehecht
zijn is hun antigeenbindingscapaciteit groter. De fractie gunstig georienteerde
antilichamen neemt toe wanneer zich op het oppervlak meer voorgehechte
moleculen bevonden, dus wanneer de ruimten tussen die moleculen kleiner is. De
polymeermoleculen voorkomen bovendien het ongunstige omvallen van
antilichamen. Het totale aantal gunstig georienteerde antilichamen neemt echter af
met de bezettingsgraad van de voorgehechte moleculen. Dit komt doordat er
minder hechtingsplaatsen beschikbaar zijn; het oppervlak is bijna vol. Bij hoge
concentraties aan voorgehechte polymeren wordt zelfs een antilichaam afstotend
oppervlak gevormd. De antilichamen die gehecht zijn op de 'zeef behouden voor
een groot deel hun originele structuur. Dit gunstige effect neemt toe naarmate er
meer voorgehechte moleculen aanwezig waren.
De 'moleculaire zeef is ook toegepast in een industrieel vervaardigbare test. Om de
hechting en bindingscapaciteit van de antilichamen in dit systeem te kunnen volgen
zijn de antilichamen en het antigeen radioactief gemerkt (gelabeld). Deze labeling
heeft geen effect op het hechtingsgedrag en de bindingsactiviteit van de
antilichamen. De effecten zijn kwalitatief in overeenstemming met de resultaten in
de modelsystemen. De antilichamen gehecht op de 'moleculaire zeef hebben een
veel hogere bindingscapaciteit dan antilichamen gehecht op een leeg oppervlak.
Voordelen van deze nieuwe adsorptiemethode zijn onder andere dat het
hechtingsproces beter te sturen is en dat kleinere hoeveelheden kostbaar
antilichaam gebruikt hoeven te worden om toch een goed werkende test te maken.
Dit biedt weer de mogelijkheid om in een en hetzelfde testsysteem antilichamen
tegen verschillende antigenen te gebruiken.
Uit het onderzoek beschreven in dit proefschrift weten we nu hoe we de orientatie
en structuur, en daarmee de antigeenbindingsactiviteit, van antilichamen op een
oppervlak kunnen manipuleren. Het is gebleken dat dit mogelijk is door een soort
'moleculaire zeef op het oppervlak aan te brengen door eerst polymeermoleculen
op het oppervlak te hechten. Het voordeel van deze methode is dat het eenvoudig
en op grote schaal toe te passen is in bestaande industriele testsystemen.
143

CURRICULUM VITAE
Maria Gabrielle Eleonore Gerarda Bremer werd
geboren op 15 augustus 1971 te Randwijk. In
1989 behaalde zij het VWO-diploma aan het
'Heldring College' te Zetten. Daarna begon zij
aan de studie Moleculaire Wetenschappen aan
de Landbouwuniversiteit Wageningen. Tijdens
de doctoraalfase volgde zij de fysisch-
chemische orientatie met de afstudeervakken
Kolloid- en Grensvlakchemie en Natuurkunde. Een
stage van 6 maanden werd afgelegd bij het Ian
Wark Research Institute van de University of
South Australia te Adelaide. In September 1995
studeerde zij af en begon in november van dat
jaar aan een promotieonderzoek bij de vakgroep
Fysische- en Kolloi'dchemie van de Landbouwuniversiteit. Het onderzoek werd
uitgevoerd in samenwerking met Organon Teknika BV te Boxtel, en heeft geleid
tot dit proefschrift. Vanaf 1 april 2001 is zij werkzaam als wetenschappelijk
onderzoeker bij de afdeling Radiochemie van het Interfacultair Reactor Instituut
van de Technische Universiteit Delft.
1 & 3 M W J M S M J
145

NAWOORD
Dat was het dan, het proefschrift is af! Nu is het tijd om iedereen te bedanken.
Afgelopen jaren waren Hans Lyklema, Willem Norde, Tom Beumer en Wim
Carpay zeer betrokken bij mijn project. Hans, ik ben blij en trots dat jij mijn
promotor bent! Bedankt voor je inzet en interesse. Willem, bedankt voor alle tips,
goede ideeen, verbeteringen en de prettige samenwerking. Tom, jouw no-nonsense
aanpak viel in goede aarde. Jouw co-promotorschap is dan ook dik verdiend! Wim,
bedankt voor je verhelderende kijk op de zaken. Het was altijd nuttig om met jou
het werk te bespreken.
Carla, Ronald en Bram, bedankt voor de samenwerking en jullie bijdrage aan mijn
onderzoek.
In het kader van het onderzoek heb ik een tijdje gewerkt bij Organon Teknika BV
in Boxtel. Monique, Esseline, Andre, Thea en alle anderen wil ik graag bedanken
voor de gastvrijheid, hulp en de plezierige samenwerking.
Dan zijn er nog veel bijzondere Fysko'ers die de afgelopen jaren, ieder op zijn of
haar manier, hebben bijgedragen. Daarom wil ik die graag apart vermelden en
bedanken.
Marcel, met wie ik binnen en buiten het lab prima kan opschieten. Ben, die
gelukkig zijn wilde haren nog heeft. Kamergenoot Desiree, die altijd in is voor een
goed gesprek over onderzoek en andere zaken. Remco, die een onmisbare hulp is
wanneer de reflectometer het dreigt te begeven en altijd een lyricsquiz bij de hand
heeft. Wim T., die zorgt voor een vrolijke noot op de Fritesexpres. £2e Ab, waar je
niet alleen voor chemische vragen terecht kunt maar ook voor haar- en kleding
adviezen. Anneke, die over een steeds grotere stapel artikelen moest springen. De
mede-aio's Bert, Maarten, Marijn, Joanne, Rene, Stefan J., en niet te vergeten Rob,
Jan Knui, Mieke, Josie, Wil, Gert, Bert en Ronald.
Beste Fysko'ers, ik heb het dankzij jullie reuze naar mijn zin gehad!
Bedankt allemaal!!
Monique
147