Stellingen - WUR eDepot
632
Stellingen 1. Het beheer van gezonde zeezoogdierenpopulaties impliceert dat de voedsel- behoefte van deze populaties in aanmerking moet worden genomen bij het vaststellen van vangstquota voor de visserij. (Dit Proefschrift) 2. Hoewel de waargenomen voedselopnames van zeezoogdieren in dolfinaria waarschijnlijk lager liggen dan die van in het wild levende soortgenoten, zijn deze gegevens als schattingen van het voedselverbruik van wilde soort- genoten betrouwbaarder dan die welke via de huidige indirecte technieken zijn verkregen. (Dit Proefschrift) 3. Dagelijks eten is voor een bruinvis van groter belang dan voor een orka. (Dit Proefschrift) 4. De relatief hoge voedselopname van orka's is voor een groot deel veroor- zaakt door hun langdurige groeiperiode, (Dit Proefschrift) 5. Het relatief kleine effect van de dracht op het jaarlijkse voedselverbruik van vrouwelijke zeezoogdieren hangt samen met hun aquatische levenswijze. (Dit Proefschrift) 6. Geslachtelijk dimorfisme hangt samen met het haremsysteem en is daarom opvallend bij de meeste vinpotigen en zeldzaam bij tandwalvissen. (Dit Proefschrift) 7. Om voedselopname als graadmeter voor het welzijn van gehouden zeezoogdieren te kunnen hanteren is kennis van de baselineniveaus van individuen noodzakelijk. (Dit Proefschrift) 8. De wetenschappelijke waarde van voedselopnamegegevens van zeezoog- dieren hangt af van de frequentie waarmee lichaamsgewichten worden gemeten in diezelfde periode. (Dit Proefschrift) 9. De grote variatie in speenleeftijd bij tuimelaars wijst er op dat alle drie de factoren, moeder, kind en omgeving, een grote rol spelen. (Dit Proefschrift) 10. Voor het foerageergedrag van grijze zeehonden geldt: jong zelf geleerd, oud gedaan. (Dit Proefschrift) 11. "Postnatale-depressies" zitten bij grijze zeehondmoeders meer in de huid dan in het hoofd. (Dit Proefschrift) z.o.z.
-
Upload
khangminh22 -
Category
Documents
-
view
0 -
download
0
Transcript of Stellingen - WUR eDepot

Stellingen
1. Het beheer van gezonde zeezoogdierenpopulaties impliceert dat de voedsel-behoefte van deze populaties in aanmerking moet worden genomen bij het vaststellen van vangstquota voor de visserij. (Dit Proefschrift)
2. Hoewel de waargenomen voedselopnames van zeezoogdieren in dolfinaria waarschijnlijk lager liggen dan die van in het wild levende soortgenoten, zijn deze gegevens als schattingen van het voedselverbruik van wilde soortgenoten betrouwbaarder dan die welke via de huidige indirecte technieken zijn verkregen. (Dit Proefschrift)
3. Dagelijks eten is voor een bruinvis van groter belang dan voor een orka. (Dit Proefschrift)
4. De relatief hoge voedselopname van orka's is voor een groot deel veroor-zaakt door hun langdurige groeiperiode, (Dit Proefschrift)
5. Het relatief kleine effect van de dracht op het jaarlijkse voedselverbruik van vrouwelijke zeezoogdieren hangt samen met hun aquatische levenswijze. (Dit Proefschrift)
6. Geslachtelijk dimorfisme hangt samen met het haremsysteem en is daarom opvallend bij de meeste vinpotigen en zeldzaam bij tandwalvissen. (Dit Proefschrift)
7. Om voedselopname als graadmeter voor het welzijn van gehouden zeezoogdieren te kunnen hanteren is kennis van de baselineniveaus van individuen noodzakelijk. (Dit Proefschrift)
8. De wetenschappelijke waarde van voedselopnamegegevens van zeezoogdieren hangt af van de frequentie waarmee lichaamsgewichten worden gemeten in diezelfde periode. (Dit Proefschrift)
9. De grote variatie in speenleeftijd bij tuimelaars wijst er op dat alle drie de factoren, moeder, kind en omgeving, een grote rol spelen. (Dit Proefschrift)
10. Voor het foerageergedrag van grijze zeehonden geldt: jong zelf geleerd, oud gedaan. (Dit Proefschrift)
11. "Postnatale-depressies" zitten bij grijze zeehondmoeders meer in de huid dan in het hoofd. (Dit Proefschrift)
z.o.z.

12. Het verantwoordelijk stellen van landen voor delen van de oceanen, en vervolgens het oprichten van een aquatische UN, zal het beheer van deze wateren verbeteren.
13. De bijvangst van dolfijnen in de visserij kan alleen worden opgelost door vissers op een positieve manier te betrekken bij de aanpak van het probleem.
14. Fortune favors the well-prepared.
15. Om educatieve- en onderzoeksredenen is het houden van dolfijnen, mits onder goede omstandigheden, volstrekt aanvaardbaar.
16. Het opvoeden van kinderen is gelijk aan het trainen van dieren. De basistechnieken zijn: consequent zijn, slecht gedrag negeren en goed gedrag belonen. Deze principes van training zouden moeten worden bijgebracht aan aanstaande ouders.
17. De meest duurzame manier van filebestrijding is geboortebeperking.
18. Niet een bereikt doel, maar de manier waarop dit doel wordt bereikt, bepaalt de kwaliteit van het leven.
19. Managers die het begrip "human resources" gebruiken gaan voorbij aan het feit, dat personeelsleden als individuen benaderd willen worden en zo het best functioneren.
20. Functionele anatomie is net zo spannend als detectivewerk.
21. Het tolereren van criminaliteit door de overheid bevordert burgerlijke ongehoorzaamheid.
22. In psychofysisch onderzoek is het trainen van het dier de grootste geestelijke uitdaging van het project. Dit aspect wordt in de rapportage vaak schromelijk onderbelicht.
23. Het welzijn van dieren in de houderij zou sterk verbeteren, als de verzorgers zouden beseffen, dat geen twee dieren gelijk zijn, en dus dat ieder dier specifieke behoeften kan hebben.
Ronald Aart Kastelein Food consumption and growth of marine mammals Wageningen, 12 Juni 1998.

Food consumption and growth of marine mammals
Ronald Aart Kastelein
Harderwijk
1998 CENTRALE LANDBOUWCATALOGUS
0000 0751 7580
Food consumption and growth of marine mammals
Ronald Aart Kastelein
m

Promotor: Dr. P.R. Wiepkema Hoogleraar in de Ethologie
IV

Food consumption and growth of marine mammals
Voedselopname en groei van zeezoogdieren
Proefschrift
ter verkrijging van de graad van doctor op gezag van de rector magnificus van de Landbouwuniversiteit Wageningen, Dr. CM. Karssen, in het openbaar te verdedigen op
vrijdag 12 juni 1998 des namiddags te vier uur in de Aula.
Door
Ronald Aart Kastelein
Cover art: Rijkent Vleeshouwer
Kastelein, Ronald Aart
Food consumption and growth of marine mammals/Ronald Aart Kastelein: Landbouw-universiteit Wageningen, vakgroep Veehouderij. Thesis Landbouwuniversiteit Wageningen.- With summary in Dutch.
ISBN 90-5485-871-0
The research projects described in this PhD thesis were financially supported by the Harder-wijk Marine Mammal Park, The Netherlands.
Printed by: Drukkerij Zuidam & Zonen B.V., Woerden.
Bl3UOTHZvK VI T-ANDBOUWUNIVbRSITCIT

To my wife Brigitte Slingerland who supported me throughout this endeavour
VII

Contents
Chapter 1. Introduction 3
Chapter 2. Odontocetes (toothed whales)
2.1 Food consumption, body measurements and weight changes of a female Killer whale (Orcinus orca) R.A. Kastelein and N. Vaughan Aquatic Mammals (1989), 15(1), 18-21. 9
2.2 Food consumption of a female killer whale {Orcinus orca) R.A. Kastelein, S. Walton, D. Odell, S.H. Nieuwstraten and P.R. Wiepkema 13
2.3 Food consumption and suckling of killer whales {Orcinus orca) R.A. Kastelein, J. Kershaw, E. Berghout and P.R. Wiepkema 19
2.4 Food consumption, growth and reproduction of Belugas (Delphinapterus leucas) in human care R.A. Kastelein, J. Ford, E. Berghout, P.R. Wiepkema and M. van Boxsel Aquatic Mammals (1994), 20(2), 81-97. 37
2.5 Food consumption, growth, body dimensions and respiration rate of false killer whales (Pseudorca crassidens) R.A. Kastelein, J. Mosterd, N.M. Schooneman and P.R. Wiepkema 55
2.6 Food consumption and growth of Atlantic bottlenose dolphins (Tursiops truncatus) R.A. Kastelein, C. Staal and P.R. Wiepkema 73
2.7 Food intake and growth of Atlantic bottlenose dolphins (Tursiops truncatus) R.A. Kastelein, S.H. Nieuwstraten, S. Walton and P.R. Wiepkema 93
2.8 Food consumption and body measurements of Amazon river dolphins (Inia geoffrensis) R.A. Kastelein, B. Neurohr, S.H. Nieuwstraten and P.R. Wiepkema 119
2.9 Food consumption and growth of common dolphins (Delphinus delphis) R.A. Kastelein, G.J. Macdonald and P.R. Wiepkema 135
2.10 Food consumption, growth, body dimensions and body temperatures of a female dusky dolphin (Lagenorhynchus obscurus) R.A. Kastelein, C.A. van der Elst, H.K. Tennant and P.R. Wiepkema 151
IX

Contents
2.11 The food consumption of Commerson's dolphins (Cephalorhynchus commersonii) R.A. Kastelein, J. McBain, B. Neurohr, M. Mohri, S. Saijo, I. Wakabayashi and P.R. Wiepkema Aquatic Mammals (1993), 19(2), 99-121. 163
2.12 Information on the biology of Commerson's dolphins (Cephalorhynchus commersonii) R.A. Kastelein, J. McBain and B. Neurohr Aquatic Mammals (1993), 19(1), 13-19. 187
2.13 Food consumption and body weight of harbour porpoises (Phocoena phocoena) R.A. Kastelein, J. Hardeman and H. Boer In: The biology of the harbour porpoise (Eds. A.J. Read, P.R. Wiepkema and P.E. Nachtigall). De Spil Publishers, Woerden, The Netherlands (1997), 217-233. 195
2.14 A method for tube-feeding juvenile harbour porpoises (Phocoena phocoena) R.A. Kastelein, N.M. Schooneman, C. Staal and H. Boer In: The biology of the harbour porpoise (Eds. A.J. Read, P.R. Wiepkema and P.E. Nachtigall). De Spil Publishers, Woerden, The Netherlands (1997), 63-83. 213
2.15 Passage time of carmine red dye through the digestive tract of harbour porpoises (Phocoena phocoena) R.A. Kastelein, S.H. Nieuwstraten and M.W.A. Verstegen In: The biology of the harbour porpoise (Eds. A.J. Read, P.R. Wiepkema and P.E. Nachtigall). De Spil Publishers, Woerden, The Netherlands (1997), 265-275. 235
2.16 Blubber thickness in harbour porpoises (Phocoena phocoena) R.A. Kastelein, S.J. van der Sijs, C. Staal and S.H. Nieuwstraten In: The biology of the harbour porpoise (Eds. A.J. Read, P.R. Wiepkema and P.E. Nachtigall). De Spil Publishers, Woerden, The Netherlands (1997), 179-199. 247
2.17 The medical treatment of 3 stranded Harbour porpoises (Phocoena phocoena) R.A. Kastelein, M.J. Bakker and T. Dokter Aquatic Mammals (1990), 15(4), 181-202. 269
Chapter 3. Phocids (true seals)
3.1 The food consumption of Southern elephant seals (Mirounga leonina) R.A. Kastelein, J. Kershaw and P.R. Wiepkema Aquatic Mammals (1991), 17(2), 76-87. 293
X

Contents
3.2 The food consumption of Grey seals (Halichoerus grypus) in human care R.A. Kastelein, P.R. Wiepkema and N. Vaughan Aquatic Mammals (1990), 15(4), 171-180. 305
3.3 Food consumption and growth of harbour seals (Phoca vitulina) R.A. Kastelein, C. Staal and P.R. Wiepkema 315
3.4 Case study of the neonatal period of a Grey Seal pup {Halichoerus grypus) in captivity R.A. Kastelein and P.R. Wiepkema Aquatic Mammals (1988), 14(1), 33-38. 329
3.5 The suckling period of a Grey seal (Halichoerus grypus) while confined to an outdoor land area R.A. Kastelein and P.R. Wiepkema Aquatic Mammals (1990), 16(3), 120-128. 335
3.6 The suckling period of a Grey seal (Halichoerus grypus) while the mother had access to a pool R.A. Kastelein, P.R. Wiepkema and N. Vaughan Aquatic Mammals (1991), 17(1), 42-51. 345
3.7 Effective mass transfer in a suckling Grey seal (Halichoerus grypus) R.A. Kastelein, P.R. Wiepkema, E. Berghout and H.J. Groenenberg Aquatic Mammals (1994), 20(1), 11-27. 355
3.8 Detailed observations of suckling behaviour of a Grey seal Halichoerus grypus at Harderwijk Marine Mammal Park R.A. Kastelein, H.J. Groenenberg and P.R. Wiepkema Int. Zoo Yearb. (1995), 34, 186-200. 373
3.9 The relationship between suckling time and body weight increase in a grey seal (Halichoerus grypus) pup R.A. Kastelein, C. Staal, S.H. Nieuwstraten and P.R. Wiepkema 389
3.10 Behaviour and weight changes of a grey seal (Halichoerus grypus) pup before and after weaning R.A. Kastelein, C. Staal, S.H. Nieuwstraten and P.R. Wiepkema 417
3.11 Fishing technique development in a newly weaned Grey seal (Halichoerus grypus) R.A. Kastelein, C. Staal and P.R. Wiepkema In: Sensory Systems of Aquatic Mammals (Eds. R.A. Kastelein, J.A. Thomas and P.E. Nachtigall). De Spil Publishers, Woerden, The Netherlands (1995), 515-528. 443
XI

Contents
Chapter 4. Otariids (sea lions)
4.1 The food consumption of Steller sea lions (Eumetopias jubatus) R.A. Kastelein, N. Vaughan and P.R. Wiepkema Aquatic Mammals (1990), 15(4), 137-144. 459
4.2 The food consumption of South American sea lions (Otaria flavescens) R.A. Kastelein, J. Kershaw, E. Berghout and P.R. Wiepkema Aquatic Mammals (1995), 21(1), 43-53. 467
4.3 Food consumption and growth of California sea lions (Zalophus californianus californianus) R.A. Kastelein, N.M. Schooneman, N. Vaughan and P.R. Wiepkema 479
4.4 The food consumption of South African fur seals (Arctocephalus pusillus) at the Harderwijk Marine Mammal Park R.A. Kastelein, I. Verhoeven and P.R. Wiepkema Int. Zoo Yearb. (1990), 29, 175-179. 501
Chapter 5. Odobenids (walruses)
5.1 Food consumption and growth of Pacific walruses (Odobenus rosmarus divergens) R.A. Kastelein, N.M. Schooneman and P.R. Wiepkema 509
5.2 Food consumption, growth and food passage times in Pacific walrus pups (Odobenus rosmarus divergens) R.A. Kastelein, W.J.C. Klasen, J. Postma, H. Boer and P.R. Wiepkema 533
5.3 Apparent digestive efficiency in walruses (Odobenus rosmarus) fed herring (Clupea harengus) and clams (Spisula sp.) K.I. Fisher, R.E.A. Stewart, R.A. Kastelein and L.D. Campbell Can. J. Zool. (1992), 70, 30-36. 547
Chapter 6. Odontocete overview
6.1 Parameters determining the food intake of odontocetes (toothed whales): a general discussion R.A. Kastelein 557
Chapter 7. Pinniped overview
7.1 Parameters determining the food intake of pinnipeds: a general discussion R.A. Kastelein 583
XII

Contents
Chapter 8. Biological, husbandry, and wildlife management aspects
8.1 Food consumption of marine mammals: biological, husbandry, and wildlife management aspects R.A. Kastelein 621
Summary 633
Samenvatting 639
Dankwoord 645
Curriculum vitae 647
XIII

Chapter 1
Introduction

Introduction
Marine mammals have been maintained in zoos and oceanaria only recently compared to many other animal species. Most of the technology for keeping marine mammals was only developed after the second world war, as they require high water and food quality. The food type and intake of many individuals has been documented for veterinary and immediate husbandry purposes, but such data has rarely been published in international journals or books. Publication of this data is important as it could help improve the veterinary care and husbandry of marine mammals in other zoos. In addition, some species are infrequently kept in captivity and existing knowledge on food consumption, not published in the open literature, can get lost.
All over the world fish stocks are over- exploited, affecting not only the availability of fish for human consumption, but also the food availability of top predators such as marine mammals and birds (Beddington et al., 1985). Food quantity and quality influence health and reproduction. To ensure sufficient long-term fish availability for humans and marine mammals, catch quota should be established for fish stocks. Human catch may be measured at the fishing ports, but the food requirements of marine mammals can only be estimated from models. Food records of captive marine mammals may improve the accuracy of these models.
Basic information such as food consumption of marine mammals might be expected to have been published years ago, but this is not the case. Staff at most oceanaria, however, keep detailed records of diet and consumption of individual marine mammals, and the pool water parameters. These records may cover decades, but never have been made available outside the park. Such detailed, long-term records of individual food consumption may not have been pub
lished even for domestic animals or humans. Through strong international contacts, the Harderwijk Marine Mammal Park in The Netherlands had access to the records of 6 parks in 6 countries and has thus been able to publish the food consumption and growth records of 4 odontocete species (Kas-telein and Vaughan, 1989: chapter 2.1; Kaste-lein and Wiepkema, 1990: chapter 3.5; Kaste-lein et al, 1990 a: chapter 2.17; 1993 a and b: chapters 2.12 and 2.11; 1994 a: chapter 2.4; 1997 a, b, c and d: chapters 2.13, 2.15, 2.14 and 2.16) and 5 pinniped species (Fisher et al, 1992: chapter 5.3; Kastelein and Wiepkema, 1988: chapter 3.4; Kastelein et al, 1990 b, c and d: chapters 4.1, 4.4 and 3.2; 1991 a and b: chapters 3.1 and 3.6; 1994 b: chapter 3.7; and 1995 a, b and c: chapters 3.8,4.2 and 3.11). Since 1994, it has been possible to analyze the records of an additional 5 odontocete species (bottlenose dolphins and Commer-son's dolphins were studied twice, the killer whale 3 times) and 3 pinniped species (the walrus was studied twice) housed in 6 parks in 6 countries, within a relatively short period.
This thesis describes the food consumption and growth of 9 odontocete and 8 pinniped species, differing greatly in weight. As most parks keep only a few marine mammal species, oceanaria around the world were asked to cooperate with the research department at the Harderwijk Marine Mammal Park by making food and body weight records available. Most of the food consumption data and body weight measurements included here were not recorded for analysis and publication, but were used for short-term husbandry and veterinary decisions. As time and man-power is limited in most parks, body measurements were taken infrequently. However, all the available data was included. 'When at sea, you must row with the oars you've got', which is a Dutch nautical version of the English proverb ' to cut one's coat to fit the cloth'.

Introduction
As would be expected in a study comprising information from so many different sources, the sample sizes and value of the chapters vary greatly. Information on food consumption of different numbers of animals over various periods of time are compared with different numbers of body measurements in each chapter. The value of each study should be evaluated on basis of the likelihood of similar information on the same species being published in the near future. In the chapter on California sea lions, for instance, data from a large number of individuals is included, but similar information is probably available elsewhere, as this species is commonly kept in captivity. In contrast, the food consumption of only one individual dusky dolphin is described, but this species has only been kept once before, and is unlikely to be kept in an oceanarium in the near future. The value of the reported information increases if one considers that data can be lost in fires, natural catastrophes or through the closing of a park. The latter was the case at Windsor Safari Park, UK, the records of which were analyzed at the last minute and are presented here. Statistical analysis is hampered by the fact that animals arrived at a park at different ages, and were kept there for different periods before transport to another park or death. Therefore the sample sizes of each age group vary greatly in the chapters.
In some cases, food consumption of an odon-tocete species is described in 2 chapters to give full credit to the parks where the animals were kept, although some repetition occurs in the discussion sections of those chapters. The methods sections of some papers are similar, as different species were kept at the same facility. For this reason, readers of the whole thesis are asked to skip the repetitions, as each chapter stands alone for the convenience of readers interested in individual species.
The studies are presented in order of decreasing body weight of the study species. In the 2 overview chapters (6 and 7), food consumption differences between species, between conspecific individuals and monthly fluctuations during the year are compiled and discussed for odontocetes and pinnipeds. The aim is to better understand the causes of these differences and fluctuations. In the final chapter, the general differences in life histories between the 2 orders are discussed to allow food intake differences to be better understood, and the value of food records of marine mammals in oceanaria for animal husbandry and wildlife management is discussed.
References
Beddington, J.R., Beverton, R.J.H. and La-vigne, D.M. (1985) Marine Mammals and Fisheries. Allen & Unwin Inc. Mass. U.S.A., 354 pp.
Fisher, K.I., Stewart, R.E.A., Kastelein, R.A. and Campbell, L.D. (1992: chapter 5.3) Apparent digestive efficiency in walruses (Odo-benus rosmarus) fed herring (Clupea harengus) and clams (Spisula sp.). Can. J. Zool. 70, 30-36.
Kastelein, R.A. and Wiepkema, P.R. (1988: chapter 3.4) Case study of the neonatal period of a Grey Seal pup (Halichoerus grypus) in captivity. Aquatic Mammals 14(1), 33-38.
Kastelein, R.A. and Vaughan, N. (1989: chapter 2.1) Food consumption, body measurements and weight changes of a female Killer whale (Orcinus orca). Aquatic Mammals 15(1), 18-21.
Kastelein, R.A. and Wiepkema, P.R. (1990: chapter 3.5) The suckling period of a Grey seal (Halichoerus grypus) while confined to
Introduction
an outdoor land area. Aquatic Mammals 16 (3), 120-128.
Kastelein, R.A., Bakker, M.J. and Dokter, T. (1990 a: chapter 2.17) The medical treatment of 3 stranded Harbour porpoises (Phocoena phocoena). Aquatic Mammals 15(4), 181-202.
Kastelein, R.A., Vaughan, N. and Wiepke-ma, P.R. (1990 b: chapter 4.1) The food consumption of Steller sea lions (Eumetopias ju-batus). Aquatic Mammals 15(4), 137-144.
Kastelein, R.A., Verhoeven, I. and Wiepke-ma, P.R. (1990 c: chapter 4.4) The food consumption of South African fur seals (Arcto-cephalus pusillus) at the Harderwijk Marine Mammal Park. In: Int. Zoo Yearb. (Eds. Ol-ney, P.J.S., Ellis, P. and Sommerfelt, B.). The Zool. Soc. of London. 29, 175-179.
Kastelein, R.A., Wiepkema, P.R. and Vaughan, N. (1990 d: chapter 3.2) The food consumption of Grey seals (Halichoerus grypus) in human care. Aquatic Mammals 15(4), 171-180.
Kastelein, R.A., Kershaw, J. and Wiepkema, P.R. (1991 a: chapter 3.1) The food consumption of Southern elephant seals (Mirounga leonina). Aquatic Mammals 17(2), 76-87.
Kastelein, R.A., Wiepkema, P.R. and Vaughan, N. (1991 b: chapter 3.6) The suckling period of a Grey seal (Halichoerus grypus) while the mother had access to a pool. Aquatic Mammals 17(1), 42-51.
Kastelein, R.A., McBain, J., Neurohr, B. (1993 a: chapter 2.12) Information on the biology of Commerson's dolphins (Cephalorhynchus commersonii). Aquatic Mammals 19(1), 13-19.
Kastelein, R.A., McBain, J., Neurohr, B., Mohri, M., Saijo, S., Wakabayashi, I. and
Wiepkema, P.R. (1993 b: chapter 2.11) The food consumption of Commerson's dolphins {Cephalorhynchus commersonii). Aquatic Mammals 19(2), 99-121.
Kastelein, R.A., Ford, J, Berghout, E., Wiepkema, P.R. and Boxsel, M. van (1994 a: chapter 2.4) Food consumption, growth and reproduction of Belugas (Delphinapterus leu-cas) in human care. Aquatic Mammals 20(2), 81-97.
Kastelein, R.A., Wiepkema, P.R., Berghout, E. and Groenenberg, H.J. (1994 b: chapter 3.7) Effective mass transfer in a suckling Grey seal (Halichoerus grypus). Aquatic Mammals 20(1), 11-27.
Kastelein, R.A., Groenenberg, H.J. and Wiepkema, P.R. (1995 a: chapter 3.8) Detailed observations of suckling behaviour of a Grey seal Halichoerus grypus at Harderwijk Marine Mammal Park. Int. Zoo Yb. 34, 186-200.
Kastelein, R.A., Kershaw, J., Berghout, E. and Wiepkema, P.R. (1995 b: chapter 4.2) The food consumption of South American sea lions (Otaria flavescens). Aquatic Mammals 21(1), 43-53.
Kastelein, R.A., Staal, C. and Wiepkema, P.R. (1995 c: chapter 3.11) Fishing technique development in a newly weaned Grey seal (Halichoerus grypus). In: Sensory Systems of Aquatic Mammals (Eds. Kastelein, R.A., Thomas, J.A. and Nachtigall, P.E.). De Spil Publishers, Woerden, The Netherlands, 515-528.
Kastelein, R.A., Hardeman, J. and Boer, H. (1997 a: chapter 2.13) Food consumption and body weight of harbour porpoises (Phocoena phocoena). In: The biology of the harbour porpoise (Eds. Read, A.J., Wiepkema, P.R. and

Introduction
Nachtigall, P.E.). De Spil Publishers, Woer-den, The Netherlands, 217-233.
Kastelein, R.A., Nieuwstraten, S.H. and Ver-stegen, M.W.A. (1997 b: chapter 2.15) Passage time of carmine red dye through the digestive tract of harbour porpoises (Phocoe-na phocoena). In: The biology of the harbour porpoise (Eds. Read, A.J., Wiepkema, P.R. and Nachtigall, P.E.). De Spil Publishers, Woerden, The Netherlands, 265-275.
Kastelein, R.A., Schooneman, N.M., Staal, C. and Boer, H. (1997 c: chapter 2.14) A method for tube-feeding juvenile harbour porpoises (Phocoena phocoena). In: The biology of the harbour porpoise (Eds. Read, A.J., Wiepkema, P.R. and Nachtigall, P.E.). De Spil Publishers, Woerden, The Netherlands, 63-83.
Kastelein, R.A., Sijs, S.J. van der, Staal, C. and Nieuwstraten, S.H. (1997 d: chapter 2.16) Blubber thickness in harbour porpoises (Phocoena phocoena). In: The biology of the harbour porpoise (Eds. Read, A.J., Wiepkema, P.R. and Nachtigall, P.E.). De Spil Publishers, Woerden, The Netherlands, 179-199.

Chapter 2
Odontocetes (toothed whales)

Chapter 2.1
Aquatic Mammals 198'), 15.1, 18 21
Food consumption, body measurements and weight changes of a female Killer whale (Orcinus orca)
R. A. Kastelein and N. Vaughan
Harderwijk Marine Mammal Park, Strandboulevard-oost 1,3841 AB, Harderwijk, Holland
Summary
The Harderwijk Marine Mammal Park housed a female Killer whale for 11 years, after which she was sent to Sea World Orlando on a breeding loan basis. This report is on the food consumption, body measurements and weight changes of this animal during her first 11 years.
Introduction
The food consumption, body measurements and weight changes of marine mammal species could be of importance to many interest groups. Marine mammal parks which consider keeping a marine mammal species might want to calculate the costs involved in feeding the animals. Facilities that already keep the species might want to compare their food and weight data to a reference for veterinary purposes. Body measurements and weights can be used in the making of transport equipment or for strength calculations for animal husbandry equipment such as dolphin lifts (Kastelein & Dokter, 1988). Also for the management of a species in the wild, food consumption data from animals in human care can be used as one of the main parameters in evaluating the impact of the species on the fisheries. The data also permits the management of the prey to create/allow for a carrying capacity for a certain number of marine mammals in a particular geographical area.
The Harderwijk Park housed a female Killer whale for 11 years. This paper describes the food consumption of the animal during that period and evaluates the use of a formula based on body measurements, in estimating the weight.
Materials and Methods
Study animal The study is about a female Killer whale (Orcinus orca, code: OoZHOOl) which was caught on 28 October 1976 in the waters around Iceland. The animal is thought to have been born in October 1975.
She arrived at the park on 13 November 1976 and participated in performances from then on.
In spring 1986 she became pseudo-pregnant for the first time. This changed her behaviour dramatically for some weeks. Because this pseudo-pregnancy returned in spring 1987 it was decided to send her to a facility with a male Killer whale. On 17 November 1988 she was transported to Sea World Orlando, USA, on a breeding loan basis. She is now amongst conspecifics, and is pregnant at the moment of writing. Birth is expected in July 1989.
Study area During her stay at the Harderwijk Park the animal was kept in a main pool of 30 m (1) x 15 m (w) x 4 m (d) and in an adjacent holding pool 10 (1) x 10 (w) x 4 (d). In these pools she was in company of 1.8 Bottlenose dolphins (Tursiops truncatus) of which the male was dominant over her. During the year the temperature of the salt water varied between 15 and 22°C.
Food The animal was fed 3-5 times per day on a diet of 35% Herring (Clupea harengus), 36% Mackerel (Scomber scombrus), 6% Whiting (Merlangus mer-langus), 12% Sprat (Sprattus sprattus) and 11% Squid (Illex spp.). Her food intake was strongly influenced by the training technique used in that period when food was the only reward used. Presently new training techniques are used at the Harderwijk Park in which food is only one of the many types of rewards used.
Weight calculation The weight was calculated by the following formula based on body measurements:
L 2 x G W = -
44 000
in which L is the total body length (cm), G is the maximum girth between pectoral fins and dorsal fin (cm) and W the calculated weight (kg). The body

R.A. Kastelein and N. Vaughan
0)17000
.2 15000 Q.
= 13000 CO c o ° 11000 •o o
r 9000 TO 3
.§ 7000
5 0 0 0 -
1 2 3 4 5 6 7 8 9 10 11 Age (year)
Figure 1. The annual food consumption of the female Killer whale.
Table 1. The body measurements and calculated weight estimates of the female Killer whale. The * indicates a real weight measurement
Date
13-11-1976 25-03-1977 01-05-1977 23-06-1977 01-08-1977 26-11-1977 21-11-1978 13-02-1979 06-11-1979 29-10-1980 19-12-1983 05-09-1986 15-05-1987 17-11-1987
Age (yr)
1 1 1 1 1 2 3 3 3 5 8
10 11 12
Body length (cm)
270 298 300 320 321 330 400 400 410 450 473 510 518 —
Girth caudal of pectoral find
(cm)
190 205 209 211 219 245 246 259 254 254 — 310 317 —
Estimated weight (kg)
315 414 428 491 513 553 895 942 970
1170 —
1832 1933 1900*
measurements were taken when the animal was hauled out on land.
Results Food consumption The annual food consumption of the female Killer whale increased over the years (Fig. 1). The food
20001
oi 1800'
2 1600' O)
'3>
I.1400-•D
2 •a 1200' 4) ns 3 1000-u (S
O
800-
600
400-
200 2
T " 4 8
—r— 10
- 1 12
Age (year)
Figure 2. The body weight changes of the female Killer whale during her stay at the Harderwijk Park.
consumption records of her second year could not be retrieved. In 1983, when she was 7 years old, she ate less every month than the monthly average of 1982. No illness was detected so this reduced food intake remains unexplained.
Body measurements and weight estimation The animal was measured 13 times and the weight estimates could be calculated for 12 of those measurements (Table 1). The animal was also weighed once.
The body weight increased steadily over the years (Fig. 2). The animal grew relatively faster between her first and third year than between her fourth and eleventh year.
More details of the animal were measured on 5 September 1986 (Fig. 3). This data was needed to construct a transport hammock. The relative position of the pectoral fins and genital slit could be used in designing hammocks for different sized Killer whales.
Food consumption relative to body weight Although few data points exist it was possible to calculate a regression line for the correlation between
10

Food consumption, body measurements and weight changes
Dorsal f in
510
Figure 3. The measurements (cm) of several body parts of the female Killer whale, and their relative position.
O) J*
c o a E 3 CO
o o u o o
(0 3 C C <
17000
15000
13000
11000
9000-
7000-
5000'
r = 0.98
0 200 400 i i i i i i i i
600 800 10001200 1400 1600 1800 2000 Calculated body weight (kg)
Figure 4. The relation between the calculated body weight and annual food consumption of the female Killer whale. r=correlation coefficient.
the calculated body weight and the annual food consumption (Fig. 4). There is a close correlation between these two parameters (r = 0.98).
Discussion and conclusions We do not suggest that the annual food consumption
the same age, but the food consumption per kg body weight might well reflect that of conspecifics in the wild, because this animal was in good physical condition during the 11 years that she was at the Harderwijk Park.
No regular pattern was seen in the monthly food consumption of this animal. Although the natural
of this animal was equal to that of other females of light cycle could have influenced the food intake, this
11

R.A. Kastelein and N. Vaughan
Table 2. The body measurements, weights and food consumption of Killer whales found in the literature. An * indicates a subjective weight estimate
No.
1 2 3 4 5 6 7 8 9
10 11 12 13
Sex
F F F M F F M F M F M — —
Age (yr)
4.5 6 — — — — — — — — —
neonate neonate
Body length (cm)
411 450 439 660 250 330 430 460 698 579 385 — —
Girth (cm)
_ — 322 — — — — — — — — — —
Weight (kg)
1088 1358 1200* 3600* 270* 700*
1000* 1360* 4554 2540 1031 158 155
Food consumption
(kg/day)
36-63 — 45 — — — — — — — — — —
Source
Burgess, 1968 Burgess, 1968 Hewlett, 1968 Griffin, 1968 Griffin, 1968 Griffin, 1968 Griffin, 1968 Griffin, 1968 Griffin, 1968 Griffin, 1968 Griffin, 1968 Benirschke, 1987 Benirschke, 1987
cycle (if there is one) was probably overruled by the food ration offered by the trainers.
The formula for calculating the body weight estimate of Killer whales used in this study proved fairly accurate when the calculated weight on 15 May 1987 (1933 kg) was compared to the real weight measured during transport on 17 November 1987 (1900 kg). The animal at that time had fasted for two days prior to transport which would have reduced her weight by at least 50 kg.
Data on food consumption, body weight and body measurements found in the literature are compiled in Table 2. Unfortunately most authors give incomplete information. Some data can be compared to data from this study. The weight and body measurements of animal No. 1 and No. 2 fit very well in Figure 2. However, our animal ate an average of 29 kg/day when she had that weight compared to the 36-63 kg/ day of No. 1 and 2. The subjective estimated weight of No. 3 was probably an underestimation. The calculated weight estimate, using the formula used in this study, is 1410 kg.
The subjective weight estimate of animals No. 5, No. 7 and No. 8 are close to the calculated weight of the animal in this study at the same length. The subjective estimate of No. 6 is probably too high. The other animals in Table 2 are too large or too small for comparison with our data.
We are aware that we are comparing the weight of the food consumed irrelevant of its food quality. Fish species have different calorimetric contents, and even fish caught in a different region or season may vary in
composition and caloric content. The diet of the animal in this study consisted for 71 % of species with a high calorimetric content (Herring and Mackerel).
It seems that body measurements combined with real weight measurements fit well with the calculated weight estimates of this study. This supports the accuracy of the formula. Subjective weight measurements can be very inaccurate.
Acknowledgements We thank everyone, and especially Teun Dokter, who was involved in recording the food consumption and body measurements. Thanks to their dedication this study could be completed. We also thank Ida Smit for drawing the graphs.
References Benirschke, K. & Cornell, L. H. (1987). The placenta of the
Killer whale, Orcinus orca. Mar. Mamm. Sci. 3(1), 82-86. Burgess, K. (1968). The behaviour and training of a Killer
whale, Orcinus orca, at San Diego Sea World. Int. Zoo Yearbook. 8,202-205.
Griffin, E. I. & Goldsberry, D. G. (1968). Notes on the capture, care and feeding of the Killer whale, Orcinus orca, at Seattle Aquarium. Int. Zoo Yearbook, 8, 206-208.
Hewlett, K. G. & Newman, M. A. (1968). 'Skana', the Killer whale, Orcinus orca, at Vancouver Public Aquarium. Int. Zoo Yearbook, 8,209-211.
Kastelein, R. A. & Dokter, R. (1988). A safe and standardized technique to identify individual dolphins in human care. Aquatic Mammals 14(1), 13-20.
12

Chapter 2.2
Food consumption of a female killer whale (Orcinus orca)
R.A. Kastelein1, S. Walton2, D. Odell3, S.H. Nieuwstraten1 and P.R. Wiepkema4
1 Harderwijk Marine Mammal Park, Strandboulevard Oost 1,3841 AB Harderwijk, The Netherlands
2 Marineland, White Rocks, Bahar ie Caghaq NXR 08, Malta
3 Sea World, 7007 Sea World drive, Orlando, Florida 32821-8097, U.S.A.
4 Emeritus Professor of Ethology, Wageningen Agricultural University, Stationsweg 1, 6861 EA Oosterbeek, The Netherlands
Summary
This report is on the food consumption of a female killer whale between 1978 and 1995, while she was at 3 different zoological parks. Although social factors and the calorific density of the food may have played a role, her annual food consumption after the initial growth spurt, appears to have been affected primarily by the water temperature in the pools in which she was kept; she ate less when the water was warmer than when it was colder. When she was 18 years old, she ate on average 3.6% of her body weight per day. There were no obvious seasonal patterns in her food intake. She grew in length at least until she was 19 years old.
Key words: odontocete , nutr i t ion, energetics
Introduction
Although a number of killer whales (Orcinus orca) are kept at oceanaria, very little detailed information about their food consumption quantity has been published. Kastelein and Vaughan (1989) describe the food consumption of a female killer whale at the Harderwijk Marine Mammal Park, The Netherlands. Kriete (1995) describes the food consumption and metabolic rates of killer whales at Vancouver Aquarium, Canada, and Marine World Africa/USA. Kastelein et al. (1998) describe the food consumption of 8 killer whales at Marineland Anti-bes, France.
Information on the food consumption of toothed whales could be useful to personnel at zoological parks where odontocetes are
kept, who may want to compare the food intake of their animals to a reference for husbandry or veterinary purposes. For the management of toothed whales in the wild, information on food consumption is needed to evaluate interactions between whales and fish populations.
This report is on the food consumption of a female killer whale which was kept at 3 different parks.
Materials and methods
Study animal The female killer whale was caught in the waters around Iceland in 1978 and was estimated to have been born in 1975. From 1978 to 26 October 1991 she was housed at Windsor Safari Park, London, UK. After that date
13

R.A. Kastelein et al.
she was transported to Sea World of Florida, Orlando, U.S.A.. In April 1993 she was moved to Sea World of Ohio, Aurora, U.S.A.. This study is based on her food records between 1978 and 1995.
The study animal was small for her age, compared to most other killer whales of similar ages (Kastelein et al., 1998).
Study area At Windsor Safari Park, the killer whale was kept outdoors in a main pool (26 m x 14 m; depth: 3.5 m) and a side pool (10 m x 7.6 m; depth: 3 m). She shared these rectangular pools with up to 9 bottlenose dolphins (Tur-siops truncatus). During the study animal's 10th and 11th years a male killer whale (7 years old, 432 cm long and with a body weight of 1200 kg) was also in the pools. During the year the salinity varied between 2.2 and 3.4% NaCl, and the average monthly water temperature between 15.1 °C in winter and 21.2°C in summer (when the temperature dropped below 14°C, the water was heated). In years when bottlenose dolphin calves were present in the pools (1985 and 1986), the water temperature was allowed to vary between 17°C in winter and 23°C in summer. The average annual air temperature was 10.7°C (the average monthly air temperature varied between 4.3°C in January and 17.7°C in July). Windsor Safari Park is at 0°39' W and 51°29' N.
At Sea World of Florida the study animal was kept in an outdoor pool system consisting of a main pool (50 m diameter; depth: 12 m) and 2 small pools (each 21 m x 19 m; depth: 5 m). These pools are connected to a breeding and research pool (31 m x 21 m; depth: 5 m) via 2 examination pools (each 12 m x 6 m; depth 4 m; Asper et al., 1988). She shared these pools with up to 6 other killer whales. The average water temperature was
13.5°C (range 13-14°C) and the salinity was kept at 3% NaCl. The average annual air temperature was 24.0°C (the average monthly air temperature varied between 19.4°C in January and 27.9°C in August). Sea World of Florida is at 81° W and 29° N.
At Sea World of Ohio the study animal was kept in an outdoor pool system consisting of a main pool (30 m x 15 m; depth: 5-9 m; 4000 m3) and 2 circular side pools (each: 12 m diameter; depth: 3 m) which were also connected to a hexagonal examination pool (22 m diameter; depth 4-5 m). In these pools she was kept with 2 young female killer whales and 3 female Pacific white-sided dolphins (Lagenorhynchus obliquidens). During the year the water temperature was on average 13°C (range from 12.7°C in January to 14.7°C in August) and the salinity varied between 3.0 and 3.2% NaCl. The annual average air temperature was 9.9°C (the average monthly air temperature varied between -2.8°C in January and 23.3°C in July). Sea World of Ohio is at 81° W and 41° N.
Food At Windsor Safari Park, between 1978 and October 1991, the study animal was fed 3 to 7 times per day on a diet of on average 85% herring (Clupea harengus), 9% whiting (Mer-langius merlangus) or squid (Illex sp.), 5% sprat (Sprattus sprattus) and 1% boiled lamb or pig liver. The percentages are based on weight. Vitamins (Aquavits ®) and iron tablets were added to the fish, after it had been defrosted. The animal was allowed to eat as much as she wanted during the last meal of the day; feeding was stopped when she lost interest or started to play with the fish.
At Sea World of Florida, between October 1991 and April 1993, the animal was fed a varying number of times per day. She derived on average 35% of her calories from
14

Food consumption of a killer whale
herring, 38% from capelin (Mallotus villosus), 20% from smelt (Osmeridae) and 7% from mackerel (Scomber scombrus). Multi-vitamins (Mazuri® and Sea World© Marine Mammal Vitamins) were added to the fish, after it had been defrosted. The amount of food given depended on the weight of the animal and on her appetite.
At Sea World of Ohio, between April 1993 and December 1995, the animal was fed a varying number of times per day. On average her diet consisted for 46% of herring, 28% of capelin, 15% of surf smelt, 10% of mackerel and 1 % of salmon (Salmo spp.). The percentages are based on weight. Multi- vitamins (Mazuri ® and Sea World © Marine Mammal Vitamins) were added to the fish, after it had been defrosted. The amount of food given depended on the estimated weight of the animal and on her appetite.
24000 -i
£. 20000 c o
E 16000 3 (0 c o £ 12000 o o
3 C C <
8000
4000
©
Results
Annual food consumption The female killer whale was estimated to be 3 years old on arrival at Windsor Safari Park. During her 4th calendar year (1979) she consumed around 7000 kg of fish (Fig. 1). Her food intake increased to around 14000 kg during her 8th year, after which it decreased to around 12000 kg/year when she was 11 years old. Her low food intake during her 10th and 11th year coincided with an increase in water temperature to accommodate bottlenose dolphin calves in the same pool system, and with the introduction and later death of a killer whale pool mate. During her 12th year the study animal's annual food intake increased greatly, but temporarily, to 17000 kg. This high food intake coincided with the return of the water temperature to the level it was at before the
©
f 1979
10 12 14 16 18 20
/t- t Age (years) October April
1991 1993
Figure 1. The annual food consumption of the female killer whale when she was at Windsor Safari Park (1979-October 1991), Sea World of Florida (October 1991- April 1993) and at Sea World of Ohio (after April 1993). Age 1 represents the first calendar year after the estimated year of birth. 1) Low food intake coinciding with relatively warm water and the introduction of a male killer whale. 2) Low food intake coinciding with relatively warm water and the death of the male killer whale. 3) High food intake coinciding with a reduced water temperature and increased food given in an attempt to prevent regurgitation. 4) High food intake coinciding with the first full year at Sea World of Florida, where the water was much colder than at Windsor Safari Park.
15

R.A. Kastelein et al.
study animal's 10th year. In her 12th year, she was also fed more than usual in an attempt to control her habit of regurgitation. Between her 12th and 16th year her food intake was around 14000 kg/year. After her transport to Sea World of Florida in October 1991 her food intake increased strongly to 24000 kg/year during her 17th year. After her 17th year, when she was moved to Sea World of Ohio, her food intake dropped and stabilized at around 20000 kg/year.
Seasonal fluctuation in food consumption The study animal's monthly food intake varied very little during the year, and no systematic seasonal pattern could be detected.
Body measurements and food intake relative to body weight The animal was weighed only once in May 1993, at the age of 18 years. She weighed 1530 kg, had a standard body length of 441 cm and a girth in front of the dorsal fin of 296 cm. At this time, she consumed on average 56 kg fish per day or 3.6% of her body weight per day. Between May 1993 and July 1994, her standard body length increased from 441 cm to 474 cm.
Discussion and conclusions
Annual food consumption Although social factors may have played a role in determining food intake, water temperature appears to be the main factor influencing the food consumption of the study animal. She ate less than usual when the water temperature at Windsor Safari Park was increased. When the water temperature was returned to the previous lower level, her food intake increased temporarily, maybe because her blubber layer had become thinner in the warmer water. She may have lost more thermal energy to her environment because of this, and /o r she may have eaten
more in order to rebuild her blubber layer. Williams and Friedl (1990) showed that bot-tlenose dolphins can adapt their thermal neutral zone (the water temperature range at which the metabolic rate is lowest) by varying their blubber thickness; perhaps killer whales can also do this.
When she arrived at Sea World of Florida, where the water temperature was much lower than it was at Windsor Safari Park, the animal's food intake first increased strongly and then dropped after a period of adaptation, but remained higher than when she was at Windsor. As well as the change in water temperature, she experienced a change in diet at this age, which may also have influenced her food consumption. In general the annual food consumption of the study animal was similar to that of killer whales of similar ages kept at Harderwijk Marine Mammal Park, The Netherlands (Kastelein and Vaughan, 1989), Marineland Antibes, France (Kastelein et ah, 1998), Vancouver Aquarium, Canada, and Marine World Africa/USA (Kriete, 1995).
The food consumption of the study animal increased at least until she was 17 years old (although the increase in food intake may, at least partly, have been caused by diet and water temperature changes). At Marineland Antibes, the food consumption of male and female killer whales continued to increase, at least until the age of 20 years (Kastelein et ah, 1998). The body length of the study animal increased at least until the age of 19 years. This corresponds to killer whales in the wild which reach physical maturity at the age of 20-25 years (Christensen, 1984). At the age of 18 years (at a body weight of 1530 kg), the study animal consumed a similar amount of food per day as a percentage of her body weight as other killer whales of the same body weight (Kastelein et ah, 1998).
16

Food consumption of a killer whale
Seasonal fluctuation in food consumption Like the animal in the present study, a female killer whale which was kept indoors at Harderwijk Marine Mammal Park did not have seasonal fluctuations in food intake (Kastelein and Vaughan, 1989). This suggests that the seasonal temperature changes experienced by both animals were within their thermal neutral zone.
Body measurements Kastelein and Vaughan (1989) present a formula to estimate the body weight of killer whales based on the standard body length and the girth in front of the dorsal fin (W = L2
x G/44000; in which W = the estimated weight in kg, L = the standard body length in cm, and G is the maximum girth between pectoral fins and the dorsal fin in cm). Using this formula, the estimated weight of the 441 cm long study animal in May 1993 would have been 1310 kg, 220 kg less than her actual weight. Bigg and Wolman (1975) give a formula with which the body weight (W in kg) of killer whales can be estimated based on body length (L in cm) (W = 0.000208 L2577). Using this formula, the estimated weight of the study animal in May 1993 would have been 1357 kg, 170 kg less than her actual weight. This suggests that either the formulas slightly underestimate the weight of female killer whales in this length range, or the study animal was slightly overweight at the time of measurement. The latter seems to be the case, when her body length-body weight relationship is compared to that of other killer whales in the literature (Kastelein et al., 1998).
Around 30 species of fish have been found in the stomachs of wild killer whales in various parts of the world (Hoyt, 1990). Therefore it is impossible to say whether their diet in the wild generally has a higher or lower calorific value than the diet of the killer whale in the present study. The diet of wild killer whales probably depends on the individual, season and geography and may vary from one year to another, depending on fish stocks. In addition to fish, 13 odontocete, 9 baleen whales, 14 pinniped, 1 mustelid, 9 bird, 1 turtle and 2 cephalopod species have been found in the stomachs of killer whales (Hoyt, 1990; Silber et al., 1990).
Killer whales have a large geographical distribution area, and individuals encounter different temperatures. Therefore this species probably has a large and possibly flexible thermal neutral zone.
The amount of time wild killer whales spend foraging probably depends on the availability of fish, the animal's ability to catch prey, its age, the geographical area and the season. When salmon (Oncorhynchus spp.) are plentiful, killer whales off Alaska spend a great deal of time investigating boats, perhaps because foraging takes up less of their time than usual (Hall, 1986). Although the animal in the present study was active most of the time, she could not dive as deep as wild conspecifics often do when they are foraging. Therefore non- reproductive wild female killer whales probably consume more than the animal in the present study (Kriete, 1995).
Ecological significance In order to predict the amount of fish killer whales consume in the wild, information is needed on their natural diet and activity level, and on the water temperatures they encounter.
Acknowledgements
We thank Rob Triesscheijn for making the graph. The air temperatures were provided by Meteo Consult, Wageningen, The Netherlands. We thank Hendrik Jan Groenen-
17

R.A. Kastelein et al.
berg and the Animal Training departments at Sea World of Florida and Sea World of Ohio for part of the data collection and Nancy Vaughan (University of Bristol, U.K.) for her comments on the manuscript. This is Sea World of Florida technical contribution No. 9605-F.
References
Asper, E.D., Young, W.G. and Walsh, M.T. (1988) Observations on the birth and development of a captive-born Killer whale. Int. Zoo Yb. 27, 295-304.
Bigg, M.A. and Wolman, A.A. (1975) Live-capture killer whale (Orcinus orca) fishery, British Columbia and Washington 1962-73. J. Fish. Res. Board Can. 32(7), 1213-1221.
Christensen, I. (1984) Growth and Reproduction of Killer Whales, Orcinus orca, in Norwegian Coastal Waters. Rep. Int. Whal. Commn., Special Issue 6, 253-258.
Hall, J.D. (1986) Notes on the distribution and feeding behavior of killer whales in prince William Sound, Alaska. In: Behavioral biology of killer whales (Eds. Kirkevold, B.C. and Lockard, J.S.). Alan R. Liss, Inc., New York, 69-83.
Hoyt, E. (1990) Orca, the whale called killer. Robert Hale, London. 291 pp.
Kastelein, R.A. and Vaughan, N. (1989, chapter 2.1) Food consumption, body measurements and weight changes of a female Killer whale (Orcinus orca). Aquatic Mammals 15(1), 18-21.
Kastelein, R.A., Kershaw, J., Berghout, E. and Wiepkema, P.R. (1998, chapter 2.3) Food consumption and suckling of killer whales (Orcinus orca). In: Food consumption and growth of marine mammals (Ed. Kastelein, R.A.). De Spil Publishers, Woerden, The Netherlands.
Kriete, B. (1995) Bioenergetics in the killer whale, Orcinus orca. Ph.D. thesis, University of British Columbia. 138 pp.
Silber, G.K., Newcomer, M.W. and Perez-Cortez M.H. (1990) Killer whales (Orcinus orca) attack and kill a Bryde's whale (Balae-noptera edeni). Can. J. Zool. 68, 1603- 1606.
Williams, T.M. and Friedl, W.A. (1990) Heat flow properties of dolphin blubber: insulating warm bodies in cold water. American Zool. 30(4), 191.
18

Chapter 2.3
Food consumption and suckling of killer whales (Orcinus orca)
R.A. Kastelein1, J. Kershaw2, E. Berghout3 and P.R. Wiepkema4
1 Harderwijk Marine Mammal Park, Strandboulevard Oost 1,3841 AB Harderwijk, The Netherlands
2 Marineland, Avenue Mozart, 06600 Antibes, France
3 Veterinary practice, Verkeersweg 29, 3842 LD Harderwijk, The Netherlands
4 Emeritus Professor of Ethology, Wageningen Agricultural University, Stationsweg 1, 6861 EA Oosterbeek, The Netherlands
Summary
The food consumption and suckling of killer whales at Marineland Antibes in France between 1976 and 1996 is described. The food intake of the whales was still increasing when they were 20 years old. At this age, the whales ate approximately 19000 kg of fish each year. Wild killer whales probably eat more than this, as they spend much energy during fourag-ing. A seasonal pattern in food consumption per month was found in all animals, but this may have been caused by seasonal changes in the feeding schedule. The number of suckling bouts per 24 h in the first 10 days after birth of 2 calves is presented, along with some external body measurements of a 13-year-old male.
Key words: odontocete , energetics, r eproduct ion , lactation
Introduction
Although the killer whale (Orcinus orca) is the third most widely kept toothed whale in the world after the bottlenose dolphin (Jur-siops truncatus) and the beluga (JDelphinapte-rus leucas), only a few studies have been done on its food requirements (Scheffer and Slipp, 1948; Nishiwaki and Handa, 1958; Norris and Prescott, 1961; Burgess, 1968; Griffin and Goldsberry, 1968; Hewlett and Newman, 1968; Rice, 1968; Caldwell and Caldwell, 1969; Martinez and Klinghammer, 1969; Sergeant, 1969; Yukhov et al., 1975; Castello, 1977; Heyning, 1988; Kastelein and Vaughan, 1989; Hoyt, 1990; Kriete, 1995; Kastelein et al., 1998). Information on the food consumption, body measurements and weight changes of toothed whales could be useful to staff at zoological parks, who
might want to compare their food and weight data to a reference for veterinary and husbandry purposes. Food consumption data are also needed for the management of an odontocete species in the wild, to evaluate the relationship of the species with its prey populations. The data could be used for the management of fish stocks to create a carrying capacity for a certain number of toothed whales in a particular geographical area. This paper describes the food consumption and suckling of killer whales at Marineland Antibes, France, between 1976 and 1996.
Materials and methods
Study animals The study animals were 4 male and 4 female killer whales at Marineland, Antibes, France (Table 1). Three males and 3 females came
19

R.A. Kastelein et al.
Table 1. The 8 killer whales at Marineland Antibes.
Code
OoMAOOl OoMA002 OoMA003 OoMA004 OoMA005 O0MAOO6 OoMA007 O0MAOO8
Gender
M F F M F M F M
Estimated year or date of birth
1967 1974 1975(73-1976(75-1982 1982 25-02-1993 13-02-1996
78)* 80)*
Origin
Iceland ,, „ „ ,, ,,
Antibes, Antibes,
calf of 004 x calf of 004 x
005 003
Date of arrival at Marineland
29-10-1976 30-11-1978 06-03-1983 06-03-1983 12-01-1990 12-01-1990 -—
* range of estimated birth year
from the waters around Iceland; 1 male and 1 female calf were born at the park. The older an animal was on arrival, the less accurate its estimated age. Of 2 animals the standard body length (straight line between tip of rostrum and notch in tailfluke) and body weight were determined once each.
Study area From 1976 to 1986 the killer whales were kept in an outdoor pool system consisting of a square main pool (15 m x 25 m; depth: 3.5 m) and an adjacent medical pool (8 m x 15 m; depth: 3.5 m). In this system they were kept with a group of up to 3 bottlenose dolphins. From 1986 to 1996 the killer whales were kept without other odontocetes in a larger outdoor pool system consisting of an oval main pool (70 m x 30 m; depth: 2.5 to 10 m; volume: 8000 m3), and 2 circular side pools (each with a diameter of 20 m; depth: 4.5 m).
The pools were filled with natural sea-water from the Mediterranean Sea. The average monthly air temperature varied between 8°C in January and 23°C in July and August. The average monthly water temperature varied between 9°C in February and 24°C in August. Marineland is at 7°3' E. and 43°30' N.
Food The animals were fed 4 to 5 times per day (between July and November more often due to evening shows) on a diet of on average 50% herring (Clupea harengus) and 50% mackerel (Scomber scombrus). The percentages are based on weight. Vitamins (Sea-tabs® or Aquavits®) were added to the fish, after it had been defrosted. Frozen fish was stored for a maximum of 4 months. The animals were allowed to eat as much as they wanted during each meal; they were fed until they started to play with the fish instead of swallowing it immediately. Animals which were known to be pregnant, and their poolmates, were allowed to eat as much as they wanted at all meals.
Records were kept of the amount and type of food consumed during each feed. These daily food intake data form the basis of the present study. Only data collected in complete calendar years were used.
Suckling On 25 February 1993, after a gestation period of 15 months, female 005 gave birth to female calf 007. The calf had a standard body length of 2.1 m. Between 25 February 1993 and 7 March 1993 mother and calf were ob-
20

Food consumption and suckling of killer whales
served 24 hours a day and the duration of all suckling bouts was recorded.
On 13 February 1996, female 003 gave birth to male calf 008. Between 13 February 1996 and 18 February 1996 mother and calf were observed 24 hours a day and the duration of all suckling bouts was recorded.
Statistical analysis All statistical analysis was carried out on Minitab release 10 for Windows (Ryan et ah, 1985) with a significance level of 5%.
Results
Annual food consumption
Males Between his 10th and 14th year, male 001's annual food consumption was around 13500 kg, except during his 12th year when his food intake was relatively low (Fig. 1). In that year he was ill and indulged in sexual activity with newly-introduced female 002.
The annual food intake of male 004 gradually increased to around 17000 kg after which it appeared to stabilize except for during his 17th year (Fig. 2). In that year he and male 006 ate more than usual, as the amount of food offered per feed was also increased for the poolmates of the pregnant females (003 and 005).
The annual food intake of male 006 was around 12500 kg between his 8th and 10th year. During his 11th year he consumed 18000 kg and during his 12th year 17000 kg (Fig. 3). In November 1995 he was moved to Sea Paradise in Japan.
Females The annual food intake of female 002 increased gradually from 3600 kg to 14000 kg
between her 5th and 9th year, after which it dropped to around 12000 kg (Fig. 4).
The annual food intake of female 003 was around 10500 kg during her 9th and 10th year. After her 10th year her food intake increased to around 14500 kg (Fig. 5). She was pregnant for the first time during her 15th year when she ate 18000 kg and delivered a full-term still-born calf during her 16th year (3 March 1991). She was pregnant again during her 17th year when she ate 22000 kg and delivered another full-term still-born calf during her 18th year (5 June 1993). Her last pregnancy during the present study was in her 20th year, during which she ate 20500 kg. The calf (008) was delivered alive on 13 February 1996. After she gave birth to calf 008, female 003 increased her daily food consumption from around 55 kg /day to 80 kg / day. Four months after she gave birth, her food intake had returned to the pre-birth level.
The annual food intake of female 005 was around 12000 kg between her 8th and 10th year. She became pregnant for the first time when she was 9 years old. During her 11th year her food consumption increased to around 18000 kg/year (Fig. 6). In 1993 her food intake was normal (55 kg/day) until she delivered female calf 007 on 25 February. She ate the usual amount on the day of the birth, then hardly ate for 3 weeks. After this, her food intake increased to 65 kg /day in April and around 80 kg /day in May. Four months after she gave birth her food intake dropped much.
Calf 007 began to eat fish regularly at the age of 6 months. Her annual solid food intake increased from 575 kg during the calendar year in which she was born to 4700 kg during her second year (Fig. 7). She suckled, at least occasionally, until 1995.
21

R.A. Kastelein et al.
24000
20000 •
o>
o 16000-
I E w 12000 c o u •o o o
(0 3 C C <
8000-
4000
Male 001
©
10 11
1977
12 13 14
Age (year)
Figure 1. The annual food consumption of male killer whale 001. Age 1 is the first calendar year after birth. 1) A year during which the animal was ill for several months.
24000 -i
20000
C o a E 3 CO
r o o •o o a
n 3 C
<
16000
12000
8000
4000
Male 004 ©
8
t 1984
10 11 12 13 14 15 16 17 18 19
t 1990
Age (year)
Figure 2. The annual food consumption of male killer whale 004. Age 1 is the first calendar year after birth. 1) High food intake which coincided with pregnancy of females 003 and 005. The years 1984 and 1990 are indicated to synchronise the data of the different animals in the study.
22

Food consumption and suckling of killer whales
24000 -i
_ 20000-O)
o o
o
to
uonduin
g 12000-o o
o 8ooo •
75 § 4000 • <
n
Male 006
©
8 9 10 11 12
f Age (year) 1990
Figure 3. The annual food consumption of male killer whale 006. Age 1 is the first calendar year after birth. 1) High food intake which coincided with pregnancy of females 003 and 005.
The food records of the 7 study animals which consumed solid food are combined in figure 8. The food consumption of both male and female killer whales increased at least until they were 20 years old (older animals were not yet available for study).
Seasonal fluctuation in food consumption To determine whether repetitive seasonal fluctuations in food intake occurred, the average daily food intake for each month was calculated. Per year the average monthly intakes were ranked from 1 to 12. For each animal the average rank per month was calculated over all available normal years {i.e. years in which extreme growth, gestation, lactation and illness took place were omitted).
Most of the killer whales consumed less than the annual average between February and June, and more than average between July
and January (Fig. 9). The average monthly air and water temperatures are shown in figure 10.
Suckling Female calf 007 was born at 2200 h on 25 February 1993 and began to suckle 12 hours after birth (Figs. 11 and 12). The number of suckling bouts per day and their average duration during the first 10 days after birth are shown in table 2. In April 1993, at the age of 2 months, she began to eat fish occasionally. From the end of August 1993 she consumed some fish every day.
Male calf 008 was born at 1719 h on 13 February 1996. The calf began to suckle 3 hours after birth. The number of suckling bouts per day and their average duration during the first 5 days after birth are shown in table 2. On 2 April 1996, at the age of 6 weeks, he first began to eat some fish. By mid-September he
23

R.A. Kastelein et al.
Z4UUU -
^ 20000 -
"3 o 16000-
E g 12000-o
o 8000 -
(0
i 4000 • c <
n .
Female 002
1979
8 9 10 11 12
Age (year)
Figure 4. The annual food consumption of female killer whale 002. Age 1 is the first calendar year after birth.
2 4 0 0 0 1 Female 003
O) 20000-
o o. 16000-E 10
g 12000-
•a o •2 8000 -IS 3 C
< 4000 -
©
9
t 1984
©
©
I
10 11 12 13 14 15 16
t 1990
(3)
W
17 18 19 20
Age ! (year)
Figure 5. The annual food consumption of female killer whale 003. Age 1 is the first calendar year after birth. 1) Year in which the animal was ill for several months, 2) year in which she was pregnant. The full-term calf was born dead on 3 March the following year (arrow), 3) year in which she was pregnant. The full-term calf was born dead on 5 June the following year (arrow), 4) year in which she was pregnant. The calf was born alive on 13 February 1996. The years 1984 and 1990 are indicated to synchronise the data of the different animals in the study.
24

Food consumption and suckling of killer whales
{•H/VV •
JS 20000-
c o o. 16000-E 3
o 12000 -
•o o •2 8000 -
nu
al
< 4000 -
Female 005
©
8 9
t 1990
la,
©
10 11
<D ^
12 13
Age (year)
Figure 6. The annual food consumption of female killer whale 005. Age 1 is the first calendar year after birth. 1) A year in which the animal was pregnant, 2) calf 007 was born alive on 25 February (arrow) and was suckled during the rest of the year. 3) year in which the calf was still suckling occasionally.
24000
20000
D)
g 16000
a E g 12000 c o o
Female 007
(calf of female 005)
"g 8000 -
3 4000 • c <
n .
Birth 25 February
1993
©
^ °
©
1
©
2
je (year)
Figure 7. The annual food consumption of female killer whale 007. Age 1 is the first calendar year after birth. 1) Year in which she was still suckling in addition to eating fish.
25

R.A. Kastelein et al.
consumed fish every day. At the moment of writing this paper he is 1 year old and is, next to eating fish, still suckling.
A t-test showed that there was no significant difference between the numbers of suckling bouts of the 2 calves (T = 0.39; df = 5; p = 0.71).
Body measurements The standard body lengths and body weights of killer whales in the literature and those from the animals in the present study are shown in table 3. Independent measurements of this table (so only one per individual) are plotted in figure 13. The standard body length versus body weight relationship can best be expressed as y = 246.92e° °°63(x-200). In which x is standard body length in cm and y body weight in kg.
On 14 March 1995, when male 006 was 13 years old and weighed 2900 kg, the following external body measurements were taken:
Standard body length: 560 cm. Tip lower jaw to anterior insertion of flipper: 95 cm. Distance between insertion of flippers (chest): 64 cm. Flipper length: 65 cm. Flipper width: 50 cm. Dorsal fin height: 88 cm. Tailfluke span: 155 cm. Tailfluke width: 60 cm.
Food consumption as a percentage of body weight In all cases in literature and in the present study in which the food consumption and body weight of an animal was available, the
24000
20000 o>
g 16000
E | 12000 o u •o o o 8000
3 C
4000-
-o- Male 001 -x- Female 002 -o- Female 007
Male 004 + Male 006 Female 003 •-- Female 005 Pregnant and/or lactating
- i 1 i i i 1 i i 1 1 1 1 i i 1 1 1 i 1 i
0 1 2 3 4 5 6 7 8 9 10 11 12 13 14 15 16 17 18 19 20 Age (year)
Figure 8. The annual food consumption data of all fish eating study animals combined. Age 1 is the first calendar year after birth. Low annual food intakes due to illness are not included. * Pregnant and/or lactating.
26

Food consumption and suckling of killer whales
JC c 2 0 O) re % <
12
11
10
9
8
7
«
5
4
3
2
1
0
M001;n = 4 — F002;n = 4 -*-F003;n = 6 M004:n = 7 — F005;n = 3 — M006;n = 4
T 1
J J
Average
M M N
Month
Figure 9. indicates
The average monthly rank in food intake during the year of 6 study animals. A high rank number a high food intake, n = number of years over which the average was taken for each animal.
U
30
25
3 2 o Q. E <i> +* o O) S 0) > <
20
15
10
Water
1 i
J F M 1 1
M J J N D Month
Figure 10. The average monthly air and water temperatures at the study area (n = 10 years).
27

R.A. Kastelein et al.
average daily food consumption was calculated as a percentage of body weight (Table 3). Independent measurements of this table (so only one per individual) are plotted in figure 14. The relationship between body weight and average daily food consumption as a percentage of body weight can be expressed as y = 7.8325"° °°°5x. In which x is body weight in kg and y is average daily food consumption (wet weight) as a percentage of body weight.
Discussion and conclusions
Annual food consumption The food consumption of killer whales in the present study increased at least until the age of 20 years. In the wild, killer whales reach
physical maturity at the age of 20-25 years (Christensen, 1984). The average annual food consumption of the animals in the present study was similar to that of a non-pregnant, non-lactating female killer whale at Harderwijk Marine Mammal Park between the age of 5 and 11 years (Kastelein and Vaughan, 1989) and to that of a non- pregnant, non-lactating female killer whale at Windsor Safari Park and Sea World (Kastelein et al, 1998). The small difference in food intake between the males and females, despite that difference in body weight between the sexes after the age of 10 years, is probably due to the higher activity level of the females, because the calves mainly interacted with the females. The average food consumption of killer whales at Vancouver Aquarium and Marine World Africa/USA
Figure 11. Female killer whale 005 and her calf 007 some days after birth (Photo: Jacques Foudraz).
28

Food consumption and suckling of killer whales
Figure 12. Female killer whale 005 and her calf 007 on the left, and female 003 on the right (Photo: Jacques Foudraz).
was higher than those reported in the present study for animals of similar weights and gender (Kriete, 1995). This may have been due to a higher calorific value of the diet and /o r a higher water temperature of the animals in the present study compared to those reported by Kriete (1995).
Seasonal fluctuation in food consumption The seasonal fluctuation in the food intake in the animals in the present study does not seem to be related to the water temperature (see Figs. 9 and 10). This is probably due to seasonal changes in the feeding schedule. Between July and November additional shows are given in the evening, allowing the animals to eat over a longer period of the day. This resulted in a higher daily food
intake than in periods without evening shows. In 2 other killer whales at other facilities there was no systematic seasonal pattern in food intake (Kastelein and Vaughan, 1989; Kastelein et ah, 1998).
Influence of gestation and lactation When female 005 was pregnant during her 9th and 10th year, her food intake remained normal; only after she had given birth did she start to eat more than usual. This phenomenon was also observed by Kriete (1995) in killer whales in 2 oceanaria in North America. Gestation can vary between 15 and 18 months (Duffield et al., 1995). Asper et al. (1988) describe a pregnant female killer whale with an estimated weight of 2200 kg which ate 64 - 68 kg fish per day during the
29

R.A. Kastelein et al.
Table 2. The number of suckling bouts per day and mean bout duration (± standard deviation) of killer whale calves 007 and 008 at Marineland Antibes. Day 0 corresponds with the day of birth.
Days after birth
0 1 2 3 4 5 6 7 8 9
10
Calf 007
Number of suckling bouts
0 38 28 34 35 34 36 24 21 26 34
Mean bout duration (s)
— 183±303 663±313 403±218 364±164 400±180 316±151 320±172 341±141 389±173 283±131
Total daily suckling time (min)
— 116 287 215 188 194 187 122 113 149 146
Calf 008
Number of suckling bouts
10 55 33 27 26 20
Mean bout duration (s)
84±88 282±230 473±344 469±200 443±314 486±347
Total daily suckling time (min)
14 252 260 211 192 162
first few months of gestation, but increased to 77 k g /day by the beginning of the 13th month. During the last part of the 14th month and throughout the 15th, her food consumption varied between 64 and 82 k g / day, stabilizing at 82 kg /day for the rest of pregnancy. During the week before she gave birth, she ate around 91 kg /day , but reduced her food consumption the day before she gave birth.
After she gave birth in 1996, female 003 increased her daily food consumption from around 55 kg /day to 80 kg/day. Four months after she gave birth, her food intake had returned to the pre-birth level. The food consumption of the killer whale described by Asper et al. (1988) increased to 110 - 118 kg /day after birth and remained stable until the calf was weaned. Her food intake remained elevated until 6 months after her calf was weaned. Lactating females probably eat more after delivery than in late pregnancy,
because of the energy required by the suckling calf for thermoregulation.
Suckling and transfer to solid food During the first 10 days after birth calf 007 suckled on average 32 times per day (on average 172 minutes/day); calf 008 suckled on average 32 times per day during the first 5 days after birth (on average 215 minutes/ day, the day of birth excluded). Asper et al. (1988) describe a female calf which suckled for 26 minutes on the day of her birth and 55 - 90 minutes during the next 5 days. Suckling bouts continued for 4 to 26 seconds and their mean duration decreased over time to 8 seconds.
The calf described by Asper et al. (1988) ate her first fish at the age of 3 months and ate fish regularly at the age of 5.5 months. She suckled until she was about 18 months old. Calves 007 and 008 began to eat fish occasionally around the age of 2 months and
30

Food consumption and suckling of killer whales
regularly around the age of 6 months. However, female calf 007 continued to suckle, at least occasionally, for 2 years. This is normal for killer whales in the wild and in human care; solid food is taken at an early age, but the complete transfer to fish takes much longer (Heyning, 1988).
Body measurements Unfortunately, the study animals were rarely weighed and measured. They were probably not fully grown at the end of the study. Males can reach lengths of 9.5 m and weights of 8000 kg. Females remain smaller and rarely exceed 7 m and 4000 kg (Matkin and Leatherwood, 1986). Christensen (1984) showed data that suggest that after an age of about 14 years, male killer whales from the Lofoten area become on average longer than females. Physical maturity is attained at 20-25 years.
Some external body measurements of a male killer whale calf and an adult male from South African waters (Ross, 1984) and of a female killer whale (Kastelein and Vaughan, 1989) have been published. Bigg and Wol-man (1975) present a length to body weight relationship based on 32 killer whales from the eastern Pacific (W = 0.000208 L2577), which is almost equal to that reported in the present study.
Food consumption as a percentage of body weight The present study suggests that the larger the killer whale, the smaller the average daily food consumption as proportion of body weight. Kriete (1995) found a similar reduced proportional food intake in killer whales at Vancouver Aquarium and Marine World Africa/USA. Her study covers a larger weight range (500 and 5500 kg) than the animals in the present study. A decrease
„M^
O) J£
o> • »
5 >»
•o
o m
3UUU '
4500-
4000-
3500-
3000-
2500-
2000-
1500-
1000-
500-
0-' *"A
1 —
• Males A Females
y = 246.92e00063(x-200)
A ..'"' A A. --'
A ...--" A __ '""'
- a "
1 1 1 1 1
•
..•'A
'*
/
•
1
•
— 1 1
200 250 300 350 400 450 500 550 600 650 700 750 Standard body length (cm)
Figure 13. The relationship between standard body length and body weight of the killer whales from the present study and of those available in the literature (only independent data from table 3 are used).
31

R.A. Kastelein et al.
3
X £
c o
a.
c o
O O
T 3 C
to
to
T 3 O
CO
o CO
o 7= £ CO • )
# " " CO o
CD
0 O) CO 0 3
D . T 3
F O
g o 8s?
CO
•o uj
CO "
0 "2 •= > O 05
< £ i
O 0 O)
co 0 T3
5 E 2 o c
co CO 0 5
' r CO
E •4 CD
X • o
CO
*= CD
5 CD
X
>> • o
CO
CD CO
?
a.
co C O
O
i* CD
n ( 0
u o O
c CO
c £
<S
co o> ro 1 -co
0
c CD
CD
CO CO
*
co 0 5
CO 0
y 0
C/)
CO co 0 5
CO CO
0 O )
J
m
C O co 0 5 T —
CO CO
CD
E? J
m
• o
to
r CD CO
D.
C75 CO O ) T—
c CO
3 co > T 3 c CO
c 0
0
CO
cn *
CO O ) O )
*" -CO
5 c
0
0
- 0 ) - CO
*
en co O )
.. £
n CO
T 3
o C5
•D
CO
c *= O
co co OS
0
X
co co • *
"3-
co CO
O T-
cd c\i CO
co • < *
LO
in r~ o 05 1 - co • * T - t m i n
o "t o T—
o o » CM
C5 O CO CO
O O o • -
F CD
r o fc CO o Q .
•St LO LO
"*
F 0
r O
fc CO o o.
y -
co o • * -
o o CM T -
CO CO T -
T -
on on o T -
on in CO i -
co IO o 10 i - o co co O)
• » -
o co i n • » —
o o o T —
o l~-CM
r> CD CO
o o h~
o CO CO T -
F CD
r o fc CO o a. o • t LO CM
F CI) r o fc CO o o.
CO
C\l
h- o o o co i n CM co CO CO CO 05 co CO •<t i o co - * co co • *
O T - O O O O T - 0 0 0 0 0 0 5 0 h - . T - L O L O N o j ' S - c o i n c D c o c o r ^ c D ^ t t n o j i n ^ ' t w c M n t i n w
CO
2
F
CO
-> < ff> > 3 O
o c
£
CO 0 .a
< • o
CO
0
c
2
E 3
ttle
Aqu
ari
CO 0
en
i _
CO
Q .
CO
•cO
co J—
o CO
T 3
5
10 0
CD
f o
u .
F
co 3 CT < (1) > 3 o C) r
5!
o D ) 0
o
CO
co • D
1 en 0
co
CO 0
< -a
- CO
0 c
2
A:
co Q .
.* 0
CO
I
CO
= te < - = = - - CO
> 0) O . co co 2 " 0 0 ^
co co 5
•D c CO
I I or
1 •a co JS Q. g * co c o 3? 0 ^ CM ^ ^ 5 •^ ^ to
•D C CO
D5 &
%S , 0 |
o o
c
co CO
0
3 o io
c ± ;
CO 0
E CO
t 3
0
fc o 0 CO
J= E
LO
co
o 0 c
.o •c
Q- co
co co CO 3
I
o
E § to CD 0 ^
0
£ &
J - ™ ?? co
O) g . CM
o. d) CO c
>< t 0 0
2c5
32

Food consumption and suckling of killer whales
>> •o o .a ^ o s? (A
ra c o
4-*
a | 2 w .2" c a> ° i
•D O o H -
>. "i5 •o
a O) 2 3
10-1
9 -
8 -
7 -
6 -
5 -
4 -
3 -
2 -
1 -
(
* *•-.
) 300 600
• Males A Females
y - 7.8325e-"
— I 1 1 1 1 1 I 1 1 I 1 1 1 1 1
900 1200 1500 1800 2100 2400 2700 3000
Body weight (kg)
Figure 14. The relationship between body weight and average daily food consumption as a percentage of body weight of killer whales from the present study and of those available in the literature (only independent data from table 3 are used).
in metabolic rate per kg body weight when animals increase in weight is also observed in terrestrial mammals (Kleiber, 1975).
Ecological significance Killer whale movements appear to be linked to changes in the distribution of fish stocks (Heimlich-Boran, 1986). If humans wish to ensure that populations of killer whales remain healthy, fish catch quotas should be determined accordingly. How well the food consumption of the study animals reflects that of wild killer whales is not known. The food intake of odontocetes is probably influenced by individual variation in metabolic rate, their activity level, the water temperature and the calorific content and digestibility of their food.
The diet of the animals in the present study was not the same as that of wild conspecif ics. Wild killer whales hunt in groups and feed opportunistically on invertebrates, fish and
marine mammals (Rice, 1968; Castello, 1977; Slijper, 1979; Gaskin, 1982; Hall, 1986; Heyn-ing and Dahlheim, 1988; Thomas and Felle-man, 1988; Wenzel and Sears, 1988; Hoyt, 1990; Silber et al., 1990; Yano and Dahlheim, 1995; Matkin and Dahlheim, 1995). The effect of water temperature on food consumption in killer whales is not clear. The body weight to surface ratio of killer whales is higher than that of smaller odontocetes (Bro-dy, 1945), so they lose relatively less energy to the environment by convection than smaller odontocetes. In addition, their blubber layer has good insulating properties (Kasting et al., 1989). Because killer whales have a wide distribution, they probably have a flexible thermoneutral zone, like bot-tlenose dolphins (Williams et al., 1992). Kriete (1995) found no correlation between water temperature and food consumption in killer whales kept in water between 7 and 23°C, suggesting that this temperature range is within the thermoneutral range of the spe-
33

R.A. Kastelein et al.
cies. Little is known about the activity levels of wild killer whales, but they are probably much more active than the study animals. The study animals swim most of the time, but do not dive or encounter ocean currents. Chasing and catching live fish or mammals requires more energy than taking defrosted fish from a trainer (Kastelein et al., 1997). In conclusion, wild killer whales probably eat more than the animals in the present study. This was also concluded by Kriete (1995).
Acknowledgements
Burgess, K. (1968) The behaviour and training of a Killer whale, Orcinus orca, at San Diego Sea World. In: Int. Zoo Yearbook 8 (Ed. Jarvic, C ) . The Zool. Soc. of London, 202-205. Caldwell, D.L. and Caldwell, M.C. (1969) Addition of the Leatherback sea turtle to the known prey of the killer whale, Orcinus orca. J. Mamm. 50(3), 636.
Castello, H.P. (1977) Food of a killer whale: eagle sting-ray, Myliobatis found in the stomach of a stranded Orcinus orca. Sci. Rep. Whales Fres. Inst. 29, 107-111.
We thank all the trainers at Marineland An-tibes, especially Bruce Walton and Jean Chaperon, for record-keeping. The air temperatures were provided by Meteo-France. We thank Nicole Schooneman and Carolien Staal for doing part of the analysis, Rob Triesscheijn for making the graphs and Nancy Vaughan (University of Bristol, U.K.) for her comments on the manuscript.
References
Asper, E.D., Young, W.G. and Walsh, M.T. (1988) Observations on the birth and development of a captive-born Killer whale. In: Int. Zoo Yearbook 27 (Eds. Olney, P.J.S., Ellis, P. and Sommerfelt, B.). The Zool. Soc. of London, 295-304.
Bigg, M.A. and Wolman, A.A. (1975) Live-capture killer whale (Orcinus orca) fishery, British Columbia and Washington 1962-73. J. Fish. Res. Board Can. 32(7), 1213-1221.
Brody, S. (1945) Bioenergetics and growth, with special reference to the efficiency complex in domestic animals. Reinhold, New York.
Christensen, I. (1984) Growth and reproduction of killer whales, Orcinus orca, in Norwegian coastal waters. In: Rep. Int. Whal. Commn. (Eds. Perrin, W.F., Brownell, R.F. Jr., and Demaster, D.P.). Spec. Issue 6, 253-258.
Duffield, D.A., Odell, D.K., McBain, J.F. and Andrews, B. (1995) Killer whale (Orcinus orca) reproduction at Sea World. Zoo Biology, 14, 417-430.
Gaskin, D.E. (1982) The ecology of whales and dolphins. Heinemann Educational Books, Exeter, NH.
Griffin, E.I. and Goldsberry, D.G. (1968) Notes on the capture, care and feeding of the Killer whale, Orcinus orca, at Seattle Aquarium. In: Int. Zoo Yearbook 8 (Ed. Jarvis, C ) , The Zool. Soc. of London, 206- 208.
Hall, J.D. (1986) Notes on the distribution and feeding behavior of killer whales in Prince William Sound, Alaska. In: Behavioral Biology of Killer Whales (Eds. Kirkevold, B.C. and Lockard, J.S.). Alan R. Liss, Inc., New York, 69-83.
34

Food consumption and suckling of killer whales
Heimlich-Boran, J.R. (1986) Fishery correlations with the occurrence of Killer whales in Greater Puget Sound. In: Behavioral Biology of Killer whales (Eds. Kirkevold, B.C. and Lockard, J.S.). Alan R. Liss, Inc., New York, 113-131.
Hewlett, K.G. and Newman, M.A. (1968) 'Skana', the Killer whale, Orcinus orca, at Vancouver Public Aquarium. In: Int. Zoo Yearbook 8 (Ed. Jarvic, C ) . The Zool. Soc. of London, 209-211.
Heyning, J.E. (1988) Presence of solid food in a young calf Killer whale (Orcinus orca). Mar. Mamm. Sci. 4(1), 68-71.
Heyning, J.E. and Dahlheim, M.E. (1988) Orcinus orca. Mamm. Species 304, 1-9.
Hoyt, E. (1990) Orca, the whale called killer. Robert Hale, London. 291 pp.
Kastelein, R.A. and Vaughan, N. (1989, chapter 2.1) Food consumption, body measurements and weight changes of a female Killer whale (Orcinus orca). Aquatic Mammals 15(1), 18-21.
Kastelein, R.A., Hardeman, J. and Boer, H. (1997, chapter 2.13) Food consumption and body weight of harbour porpoises (Phocoena phocoena). In: The biology of the harbour porpoise (Eds. Read, A.J., Wiepkema, P.R. and Nachtigall, P.E.). De Spil Publishers, Woer-den, The Netherlands, 217-233.
Kastelein, R.A., Walton, S., Odell, D., Nieuwstraten, S.H. and Wiepkema, P.R. (1998, chapter 2.2) Food consumption of a female killer whale (Orcinus orca).
Kasting, N.W., Adderley, S.A., Safford, T. and Hewlett, K.G. (1989) Thermoregulation in Beluga (Delphinapterus leucas) and Killer
(Orcinus orca) whales. Physiological biol. 62 (3), 687-701.
Kleiber, M. (1975) The fire of life: An introduction to animal energetics. R.E. Kreiger Publishing Co. Ltd., Huntington, New York.
Kriete, B. (1995) Bioenergetics in the killer whale, Orcinus orca. Ph.D. thesis, University of British Columbia. 138 pp.
Martinez, D.R. and Klinghammer, E. (1969) The behavior of the whale, Orcinus orca; a review of the literature. Z. Tierpsychol. 27, 828-839.
Matkin, C O . and Leatherwood, S. (1986) General biology of the killer whale, orcinus orca: a synopsis of knowledge. In: Behavioral Biology of Killer whales (Eds. Kirkevold, B.C. and Lockard, J.C.). Alan R. Liss, Inc., New York, 35-68.
Matkin, D.R. and Dahlheim, M.E. (1995) Feeding behaviors of Killer whales in Northern Southeastern Alaska. Proc. of the third Glacier Bay Science Symp. (Ed. Engstrom, D.R.). National Park Service, Anchorage, Alaska.
Nishiwaki, M. and Handa, C. (1958) Killer whales caught in the coastal waters of Japan for recent 10 years. Sci. Rep. Whales Res. Inst. 13, 85-96.
Norris, K.S. and Prescott, J.H. (1961) Observations on Pacific cetaceans of Californian and Mexican waters. Univ. Calif. Publ. Zool. 63, 291-402.
Rice, D.W. (1968) Stomach contents and feeding behavior of killer whales in the eastern North Pacific. Nor. Hvalfangst-Tid. 57, 35-38.
35

R.A. Kastelein et al.
Ross, G.J.B. (1984) The smaller cetaceans of the south-east coast of southern Africa. Ann. Cape Prov. Mus. (Nat. Hist.) 15(2), 173-410.
Ryan, B.F., Joiner, B.I. and Ryan, T.A. (1985) Minitab handbook (2nd edition). Boston, PWS-Kent.
Scheffer, V.B. and Slipp, J.W. (1948) The whales and dolphins of Washington State with a key to the cetaceans of the west coast of North America. The Amer. Midland Nat. 39(2), 257-337.
Wenzel, F. and Sears, R. (1988) A note on killer whales in the Gulf of St. Lawrence, including an account of an attack on a minke whale. In: North Atlantic killer whales (Eds. Sigurjonsson, J. and Leatherwood, S.). Rit Fiskideildar, J. Marine Res. Inst., 202-204.
Williams, T.M., Haun, J.E., Friedl, W.A., Hall, R.W. and Bivens, L.W. (1992) Assessing the thermal limits of bottlenose dolphins: a cooperative study by trainers, scientists, and animals. IMATA Soundings Fall 1992, 16-17.
Sergeant, D.E. (1969) Feeding rates of Ceta-cea. Fisk. Dir. Skr. Ser. Hav. Unders., 15, 246-258.
Silber, G.K., Newcomer, M.W. and Perez-Cortez M.H. (1990) Killer whales (Orcinus orca) attack and kill a Bryde's whale (Balae-noptera edeni). Can. J. Zool. 68, 1603- 1606.
Slijper, E.J. (1979) Whales. Cornell University Press, Ithaca, N.Y.
Yano, K. and Dahlheim, M.E. (1995) Killer whale, Orcinus orca, depredation on longline catches of bottomfish in the southeastern Bering Sea and adjacent waters. Fishery Bulletin 93, 355-372.
Yukhov, V.L., Vinogradova, E.K. and Med-vedev, L.P. (1975) The diet of killer whales (Orcinus orca L.) in the Antarctic and adjacent waters. In: Marine mammals 2. Transl. Ser. Fish. Mar. Serv. (Can.) 1976, 183- 185.
Thomas, G.L. and Felleman, F.L. (1988) Acoustic measurements of the fish assemblage beneath killer whale pods in the Pacific Northwest. In: North Atlantic killer whales (Eds. Sigurjonsson, J. and Leather-wood, S.). Rit Fiskideildar, J. Marine Res. Inst., 276-284.
36

Chapter 2.4
Aquatic Mammals 1994, 20.2, 81-97
Food consumption, growth and reproduction of Belugas (Delphinapterus leucas) in human care
R. A. Kastelein, J. Ford*, E. Berghout, P. R. Wiepkema** and M. van Boxsel
Harderwijk Marine Mammal Park, Strandboulevard-oost J, 3841 AB Harderwijk, Holland * Vancouver Public Aquarium, Stanley Park, P.O. Box 3232, Vancouver, B.C., V6B3X8, Canada **Ethology Section, Department of Animal Husbandry, Agricultural University, Marijkeweg 40,
6709 PG Wageningen, Holland
Summary
This report describes the body measurements, weight changes and food consumption of 9 Belugas housed at Vancouver Public Aquarium between 1967 and 1991. Females' body growth leveled off at around 300 cm and 7 years, while males continued to grow until at least 14 years. Annual food consumption seems to be related to sex and age as well as to social group changes and feeding techniques. After reaching sexual maturity at about 7 years, males ate less than in the remainder of the year during August and September, the season in which they were sexually active. The females which were sexually approached also reduced their intake during those months. Belugas of 200 kg were found to eat around 4.5%, those of 1400 kg 1.2% of their body weight per day in water with average annual water temperatures between 10 and 12°C. A significant negative correlation was found between average monthly water temperature and average daily food intake per month. This relationship and water temperatures in the Belugas' distribution areas were used to calculate that a wild adult female Beluga of 600-700 kg may eat around 4900 kg of fish per year (8.144.000 Kcal/year). The passage time of carmine red dye through gastrointestinal tract was on average 4.5 hrs.
Keywords: Beluga, food consumption, passage time.
Delphinapterus, energetics, reproduction, growth, food
Introduction
Belugas {Delphinapterus leucas) are medium-sized toothed whales which inhabit arctic and sub-arctic waters (Stewart & Stewart, 1989) and experience lower water temperatures than most other toothed whales. They are adapted to maintain a constant core temperature of around 37°C in this cold en
vironment by having a thick dermis and a thick insulating blubber envelope. However, they use much energy to keep their core temperature stable. Because the Beluga is one of the most abundant odontocetes in arctic waters (Fay, 1979), it probably has a relatively large impact on its prey populations.
For the management of Beluga populations in the wild, information is needed about population size, age composition and sex ratio, seasonal distribution, diet, energy requirements relative to seasonal prey distribution and density, and competition with other marine mammals and fisheries. This information could facilitate prey management to allow target numbers of Belugas to survive in particular geographical areas.
The seasonal movements of Belugas have been described by Tomilin (1957), Kleinenberg et al. (1964), Sergeant & Brodie (1969a), Sergeant & Hoek (1973), Braham & Krogman (1977), Fraker et al. (1978), Harrison & Hall (1978), Fraker & Fraker (1979), Seaman & Burns (1981), Finley et al. (1982) and Krogman & Carrol (1982). Belugas usually feed in waters above the continental shelf (Fay, 1979).
As prey Belugas in the Saint Lawrence estuary (temperate water) take mainly Cod (Gadus morhua), Pollock (Pollachius vireus), Herring (Clupea harengus), Capelin (Mallotus villosus) and Smelt (Atherina presbyter), and to a lesser extent Sculpin (Myoxocephalus scorpius), polychaetes, cephalo-pods and crustaceans. These prey types and their proportions in the diets of different Beluga sex and age classes in various seasons have been described by Vladykov (1946), Kleinenberg et al. (1964) and Seaman et al. (1982). In the arctic waters the major food species of Belugas is the Polar or Arctic cod (Boreogadus saida), a fish which is frequently associated with the ice edge (Sergeant, pers. comm.). In arctic waters Belugas probably also eat a lot of benthic invertebrates, because Belugas can
37

R.A. Kastelein et al.
Table 1. Details of the studied Belugas at Vancouver Public Aquarium
Animal code
Dl D2 D3 D4 D5 D6 D7 D8 D9 D10
Sex
? 6* ? ?
s 2 3 6 ? S
Birth date
1961 1966 1970 1975 1977 1979 1982 1981 1986 1986
Origin
King Salmon, Alaska King Salmon, Alaska
Churchill river, Manitoba Churchill river, Manitoba
Born at Vancouver Aquarium Churchill river, Manitoba Churchill river, Manitoba Churchill river, Manitoba Churchill river, Manitoba Churchill river, Manitoba
Arrival date
09-1967 09-1967
29-07-1976 29-07-1976 13-07-1977 17-07-1985 17-07-1985 15-08-1990 15-08-1990 15-08-1990
dive to considerable depth to reach the bottom (Martin & Smith, 1992).
At present it is impossible to measure energetic requirements of odontocetes in the wild. Energetic studies on wild Belugas are particularly difficult due to the ice and weather conditions, and the continuous darkness of the arctic winter in some parts of the distribution area (Brodie, 1982). While the Beluga is a widely kept toothed whale, little is published from captive studies about its food requirements (Doidge, 1990a). Sergeant (1969) calculated food intake to body weight ratios for some Belugas, but the weights he used were estimated, the water temperature was not reported, and food intakes were not averaged over long periods. Since 1974 the Vancouver Public Aquarium has recorded food intake, body weight and morphological measurements of their Belugas as well as environmental parameters such as water temperature. The present study analyses this information for husbandry and wildlife management purposes.
Materials and Methods
Study animals The study was conducted on the 10 Belugas described in Table 1 housed at Vancouver Public Aquarium. Age estimates are based on the colour, size and weight of the animals (Sergeant, 1973). The younger the animal on arrival, the more accurate the age estimate is. Some of the age estimates for animals that were older than 3 years on arrival (Dl and D8) may be 1 year off to either side of the actual age.
Study area At the Vancouver Public Aquarium (123° 10' West longitude, 49° 11' North latitude) the animals were kept in the B.C. Tel pool (elliptical, 11 m x 5.5 m;
depth: 4.8 m) and during illness and pool maintenance in an adjoining pool (7.5 m x 4.5 m; depth: 3 m) until 31 May 1990. The water temperature, which was influenced by the sea temperature, was measured each day. The daily temperature varied between 7.5 and 16.9°C during the study period, while the annual average water temperature varied between 10.5 and 12.4°C. Salinity varied between 1.8 and 2.8% and the free chlorine level fluctuated between 0.28 and 0.90 mg/1.
After 31 May, 1990 the animals were housed in the Arctic Canada pool ( l l m x 5 m ; depth: 6.5 m) and in a 3 m deep adjacent medical pool. In addition the animals could be kept in a research pool (15 m x 15 m; depth: 3 m). The water was chilled and the temperature was kept between 10 and 11.5°C. The salinity varied between 2.5 and 2.7%, and the free chlorine level fluctuated between 0.38 and 0.64 mg/1.
Food The animals were fed 3 to 5 times a day. Until mid 1974 the diet consisted of around 90% Herring {Clupea harengus) and 10% Surf Smelt (Hypomesus pretiosus). In the second half of 1974 the diet consisted of 90% Herring and 10% Mackerel {Scomber scombrus). Starting in 1975 the diet was changed to about 75% Herring, 15% Mackerel and 10% squid (Loligo spp.). The squid was sometimes replaced by Whiting (Merlangius merlangus). The percentages are based on weight, and there were small variations in the percentages of the different species given to individuals. Vitamins were added to the fish, after it had been defrosted. All food was given during training and show sessions, and as a rule, feeding was stopped when the animals stopped swallowing their food immediately. Individual food records per day were kept from 1974. The present study is based on the food intake data between 1974 and 1991.
38

Food consumption, growth and reproduction of Belugas
Body weight and length The animals were weighed on arrival at the Aquarium, and usually when they were transported between pools. Because of the different frequencies of transports and lengths of time the whales were at the Aquarium, some animals were weighed more often than others. Body length measurements were taken irregularly, and not always simultaneously with weight measurements.
Sexual behaviour When sexual behaviour was observed by the trainers, this was registered on the food record sheets. Sexual behaviour is defined as attempts or acts of intromission by the males toward the females.
Passage time of food through gastrointestinal tract To measure the passage time of food through the gastrointestinal tract, a gelatine capsule containing 6 g of carmine red dye was added to the animal's normal feed between 09.30 and 11.10 hrs. The animal was then kept under constant observation until red dye was seen in the faeces. Tests were conducted twice on 2 animals (D8, an approximately 650 kg, 11-year-old male and D6, an approximately 600 kg, 13-year-old female), in November 1992 and 3 times on 7-year-old male D10 and 14-year-old female D6 in September 1993.
Results
Growth The body length of 4 male Belugas in this study increased from about 130 cm at birth to about 450 cm when 14 years old (Fig. 1A). However, length at the same age differed substantially; for instance D2 and D7 were 380 and 340 cm when both were 8 years old. The same is true for the females (Fig. IB), although females remained smaller than males when adult. Individual Belugas reached their maximum lengths at different ages.
Until the age of about 2 years, individuals of both sexes weighed about the same (Fig. 2). Thereafter, males were heavier than females of the same age.
Annual food consumption Male D7's average daily food intake increased from 8 kg when he was 4 years old to 14 kg when he was 7 years old (Fig. 3A). D2's daily food intake increased from 15.5 kg when he was 8 years old, to 19.5 kg when he was 13 years old. This animal decreased his intake during the second part of his 10th year and the first half of his 11th year. This reduction in food intake occurred simultaneously with changes in the social composition of the group; D2 lost his partner, was introduced to a new
partner, and he was moved to a holding pool next to the Killer whale (Orcinus orca) pool for part of the year. Animal D10 ate 12.5 kg/day when he was 4 years old, in his first year at the aquarium. Animal D8 ate 13 kg/day when he was 10 years old (Fig. 3A).
Female D4's average daily food intake increased from 7 kg when she was 2 years old to 11 kg when she was 9 years old (Fig. 3B). D6's daily food intake increased from 9 kg when she was 7 years old, to 13 kg when she was 12 years old. D3's daily food intake increased from 10.5 kg when she was 7 years old, to 12 kg when she was 21 years old. Animal D9 ate 11 kg/day when she was 5 years old. Animal Dl ate between 14 and 15 kg/day when she was 13 and 14 years old.
Seasonal food intake fluctuations and sexual behaviour During his 10th year, male D8 became sexually active in August. In that month he (Fig. 4A) and 5-year-old female D9 ate less than usual (Fig. 4C). This was the first full calender year after male D8 arrived. A year later he again reduced his food intake in August and September (Fig. 4B).
During his 7th year, male D7 became sexually active in September, and ate less than usual (Fig. 4D). That same month and year, 19-year-old female D3 and 10-year-old female D6 also reduced their intake (Figs 4E & F).
Male D2 showed little sexual behaviour and no seasonal depression of food intake.
Food consumption relative to body weight The few available data show that average daily food intake over a calender year per kg of body weight is dependent on the actual body weight (Fig. 5). The larger the animal, the smaller the relative food intake. Animals of 200 kg eat on average around 4.5% of their body weight per day, whereas animals of 1400 kg need only 1.2%. These percentages should be evaluated in relation to the water temperature. Here, average annual water temperatures were between 10.5 and 12.4°C.
Influence of water temperature on food intake In non-pregnant female D3, daily food intake was recorded over 15 years (Fig. 3B), while her body weight remained fairly constant (from 600 kg to around 700 kg). Because in these years the average monthly water temperature varied from about 8°C to 16°C it was possible to correlate monthly food intake and water temperature for one adult individual. This is shown in Fig. 6 (Pearson correl. coeff.: r= -0 .32 , P<0.005, N=158). Low water temperatures lead to increased food intake by this individual.
39

R.A. Kastelein et al.
5001
400
E o
^ 3 0 0 •4-1
c 0)
>.
S 200
A. Males
• ?°-D5
1 0 0 1 I T-- -I I I I I '""•'I' I I I I I • 1 ' '"I l i l t '
0 2 4 6 8 10 12 14 16 18 20 Age(years)
5001 B. Females
400
^J> E o
^ 3 0 0 +-D) C 0 >
co 200
1001 • i i i • i i i—i i i i i i i i i i i i i 0 2 4 6 8 10 12 14 16 18 20
Age(years) Figure 1. Body length changes with estimated age of studied Belugas at Vancouver Public Aquarium. A) Males, BJ Females.
40

Food consumption, growth and reproduction of Belugas
2 O)
T3 O 00
1500 1400-1300 1200-1100-1000-900 800 700 600H 500' 400 300 200' 100H
n Males o Females
• i i i i i i i i i i i i i i i i i i i 0 2 4 6 8 10 12 14 16 18 20
Age(years) Figure 2. Body weight changes with estimated age of studied Belugas of both sexes at Vancouver Public Aquarium.
Food intake during lactation Female D3 arrived at Vancouver Aquarium 12 months before she delivered her calf. As the gestation period in Belugas is 14.5 months (Brodie, 1971; Sergeant, 1973), she must have conceived in the wild. Her food intake before and after the birth was probably lower than it would have been in the wild due to her adaptation to a new environment, a new diet and feeding schedule (St. Aubin & Geraci, 1990). Her food consumption increased during the last 3 months of gestation to on average 12 kg/day during the last month (Fig. 7). The first month after the birth her food intake increased dramatically to 25 kg/day on average. Thereafter it decreased. Unfortunately calf D5 died of nocardium infection {Nocardia farcinicd) at the age of 3.5 months (Drinnan & Sadleir, 1981). The following month D3's food intake decreased to a normal level.
Passage time of food through gastrointestinal tract The passage times of carmine red dye are shown in Table 2. The average passage time was 4.5 hrs.
Discussion and Conclusions
Growth The birth length of calf D5 was similar to that of wild calves in Canadian waters (Sergeant & Brodie, 1969; Doidge, 1990a). In general, the body lengths
and body weight to body length ratios of the animals in the present study were similar to those found in Belugas of the same sex and age classes in various regions in the wild (Doidge, 1990a; Sergeant & Brodie, 1969b). Two of the animals (Dl and D2) in the present study were probably overfed for some time in 1976 (e.g. D2 when 8 to 9 years old, and Dl when 13 to 14 years old; Figs 2 & 3), since in that year the body weight to body length ratio was much higher than observed in general in wild conspecifics (Doidge, 1990a). The trainers tried to fatten the animals by being more patient when feeding. Belugas may become obese easily because: a) They have a tendency to store fat, which is perhaps used during spring and autumn migration (Brodie, 1982), or in winter; and b) Of wild Belugas part of the diet consists of small prey items of low energetic value, and feeding probably takes up a large proportion of their time. When hand-fed fish with a high energy content in oceanaria, the animals might store larger fat reserves than they could in the wild.
The length to age relationship in the animals in the present study is in close agreement of that of wild Belugas from Cumberland Sound, as noticed for the same male D2 by Brodie (1982). The males in the present study were larger than the females of the same age classes. This sexual dimorphism has also been noted in wild Belugas (Sergeant & Brodie,
41

R.A. Kastelein et al.
201 -3,18-
i16" | 14-.E 12-
| i o -> 8-TO c . T3 D
Q) 4 . O) 2 2-^ 0-
A. Males
- r -8 10 12 14 16 18 20
Age(years)
2
I
TO •D <D
TO
I
20HB. 18-16-14H 12 10H 8
6 4 2 0
Females
8 •
10 12 14 16 ' 18 20
Age(years) Figure 3. The average daily food consumption per year of Belugas at the Vancouver Aquarium relative to age. A) Males, B) Females. An * indicates low food intake corresponding with temporary changes in the composition of the group and location next to the Killer whale pool during part of the year.
1969b; Doidge, 1990a). Between the age of 8 and 10 years, male D2 increased his body weight quickly. This could be a maturation effect. In the wild, depending on the population, males show an increase in testis weight after they reach a body length of about 300 cm. They attain sexual maturity at 7-9 years of age (Brodie, 1971; Sergeant, 1973). The males in the present study reached a body length of 300 cm when they were 5 years old. Testosterone probably plays a role in the growth spurt during the period in which males become sexually mature. The maximum age in Belugas has been estimated to be between 25 and 30 years (Brodie, 1971; Sergeant, 1973), and in some cases even up to 35 years,
assuming 2 dental growth layers per annum (Sergeant, 1986).
The 2 animals from Alaska (male D2 and female Dl) were larger at the same age as the animals from the Hudson Bay (male D10 and female D3). This extremely small sample is in agreement with the suggested genotype difference in body size found in the wild between animals from Alaska and from Hudson's bay (Sergeant, 1973).
Annual food consumption It is possible to extrapolate the food intake curve of male D7 in Fig. 3 towards the food intake level of male D2 at the age of 12 years. Beluga males
42

Food consumption, growth and reproduction of Belugas
* A 2 301 c
erag
e fo
od
(k
g/da
y)
_L
ro
^ ^
D8
¥
1 "2 "3 4 5 6 7 8 9 "10 11 12 Calendar month
Q) R
S 301 c
^ —20-o >» O CO *- TD
Ave
rag
e (k
g
o
o
D8
*
1 2 3 4 5 ' 6 7 8 9 10 1112 Calendar month
Figui e 4. A andB
seem to increase their average daily food intake at least until the age of 13 years. In the wild, males attain sexual maturity at 7-9 years (Brodie, 1971; Sergeant, 1973), after which a growth spurt occurs which may require additional energy. The high food intake of D10 at the age of 4 years is probably recovery from a low food intake after his transfer from the wild to the aquarium. Transport can cause hematologic and metabolic changes in Belugas (St. Aubin & Geraci, 1989).
The food intake of the females in the present study stabilized when they were around 5 years old. In the wild, females attain sexual maturity at 4-7 years (Brodie, 1971; Sergeant, 1973). This suggests
that females become sexually mature at around the time that their food intake stabilizes.
Seasonal food intake fluctuations In this study, food weights are compared without taking the quality into account. Fish has different caloric values, depending on species, season and origin. The diet of the animals in this study consisted of 75% Herring, a fish species with a high caloric value. The Herring fed at Vancouver Aquarium is caught once a year in December or January, and is stored until needed. The fat content of the Herring is generally more than 10%, and its caloric value, based on one test, is 1780Kcal/kg.
43

R.A. Kastelein e t a l .
<D XL CD
c 301D9
o >s o TO
I 0 6 7 8 10 11 12
Calendar month
X. (0
O eg o T3
CO
> <
30"
20-
10-
D7
0 I 1 l 2 l 3 l 4 l 5 , 6 l 7 , 8 l 9 " * > " T r i 2 Calendar month
Figure 4. C and D.
Because of the long storage period, seasonal fluctuations in food intake cannot be caused by differences in energetic content of the food.
D8 displayed sexual behaviour at the age of 10 years. This was the year after he arrived at the park, and he may have been sexually active before that age in the wild. Male D7 showed sexual behaviour for the first time when he was 7 years of age. This corresponds with wild male Belugas, which attain sexual maturity at 7-9 years of age, although the age of sexual maturity depends on the location (Brodie, 1971; Sergeant, 1973). The males in the present study showed sexual behaviour in August and September, and ate relatively little during that
period. This reduction in food consumption corresponds with the months in which wild Belugas probably reduce their food intake. In the wild, migration occurs in mid-August and September (Sergeant, 1973). Stomachs of Belugas caught on migration are usually empty, suggesting that they eat little during this period (Seaman et al., 1982). However, this information may be biased because animals often vomit when shot. Little is known about Belugas' winter activities, and about what they eat during the winter.
During July and early August, female Belugas and their calves gather in relatively shallow, warm estuaries soon after giving birth (Sergeant & Brodie,
44

Food consumption, growth and reproduction of Belugas
CO E
30
•o^s 2 0 2 >» o cu
J) o,10 03 *
I d)
CO
0
D3
8 10 11 12 Calendar month
F 301D6
"5—20 2 >» o CO
0)^10 d)
3 0 2 3 8 10 11 12
Calendar month Figure 4. E and F.
Figure 4. The average daily food intake during the 10th year (A) and 11th year (B) of Beluga male D8, and of 5-year-old female D9 during the same year (C). The average daily food intake during the 7th year of male D7 (D), and of 19-year old female D3 and 10-year-old female D6 during the same year (E & F). The * indicates the month in which male sexual activity was observed.
1969b; Smith et al, 1992). Whether females eat during this period is unknown. It is believed that Belugas lay down 2 dental layers each year, each layer consisting of one opaque and one translucent zone of dentine. The translucent material is thought to be laid down during periods of reduced feeding, which may occur either during autumn and spring migration or winter deprivation (Sergeant, 1973). As the females in the present study reduced their food intake between August and October, it seems likely that wild females eat during the July
calving period. However, it is not known whether non-pregnant and non-lactating females also reside in the warmer estuaries in this period. At Duisburg Zoo, 2 female Belugas reduced their food intake by about 50% during August and September (Bartmann, 1974). The reduction in food intake of captive female Belugas in the same period in which wild Belugas reduce their food intake due to migration suggests that internal factors reduce the appetite of Belugas during this period.
45

R.A. Kastelein et al.
CO
73 O O
CO • o
<D O) CO i _
<D
3
^ 4 x: * o> "55 3
CQ ,
• Male Belugas o Female Belugas
Killer whale
200 400 600 800 1000 1200 1400 1600 Body weight(kg)
Figure 5. Average daily food intake in proportion to body weight of Belugas of different body weights at Vancouver Public Aquarium. The line is hand-drawn. The dotted line represents data from a growing female Killer whale housed at an average water temperature of 17°C (from Kastelein & Vaughan, 1989).
^ 20
c o S. 16
E 3 <0 § 12 o •D O O
(0
•o
> <
6 8 10 12 14 16 18 Average monthly water temperature (°C)
Figure 6. Relationship between the average monthly water temperature and average daily food intake per month for female D3 when her body weight varied between 600 and 700 kg (N=158, regression line: y=-0.33 x +15.4).
Food consumption relative to body weight Small cetaceans typically eat much more in relation to their body weight than large cetaceans. For instance studies in captivity revealed that adult Harbour porpoises (Phocoena phocoena) weighing about 35 kg eat around 8% of their body weight per day in water of around 18°C (Andersen, 1965; Kastelein et al., 1990), and adult Commerson's
dolphins (Cephalorhynchus commersonii) of about 40 kg eat 10% of their body weight per day in water of between 14 and 18°C (Kastelein et al, 1993b). The Beluga's lower proportional intake of food of similar caloric content, and its capacity to store large amounts of fat, probably mean that this animal can fast for long periods. Reduced feeding may occur during migration, when Belugas spend
46

Food consumption, growth and reproduction of Belugas
CD
< -7-6-5-4-3-2-1 1 2 3 4 5 6
(13-07-77) M o n t h S
Figure 7. The average daily food intake of Beluga female D3, 7 months prior to and 6 months after the delivery of a calf. She gave birth 12 months after she arrived at the Vancouver Public Aquarium. The * indicates the month in which the calf died.
Table 2. Passage times of 6 g of carmine red dye in 3 Belugas at Vancouver Public Aquarium
Animal
D8 D8 D6 D6 D6 D6 D6 D10 D10 D10
Sex
M M F F F F F M M M
Age (yr)
11 11 13 13 14 14 14 7 7 7
Est. weight (kg)
650 650 600 600 600 600 600 650 650 650
Time of day dye fed
11.00 11.00 11.10 11.05 09.39 09.38 11.00 09.35 09.57 09.30
Passage time (min)
247 305 250 230 315 259 380 287 223 238
Average: 273 (SD 46 min)
their time travelling instead of foraging, and/or may have to swim through areas with low food availability.
The present study shows that adult Belugas of both sexes eat about 1% of their body weight per day when kept in water of around 11 °C. Compared to a Killer whale (Orcinus orca) housed in a pool with a higher average water temperature of 17°C (Kastelein & Vaughan, 1989), Belugas of the same weight class (between 400 and 1400 kg) in the present study ate between 1.5 and 1.9% less in proportion to body weight (Fig. 5). If the Killer whale had been kept in water with the same temperature as the Vancouver Aquarium pool, the difference would probably have
been larger (assuming that the Killer whale was kept at the relatively horizontal part of the U-shaped water temperature versus metabolic rate curve). The difference in food intake is probably due to a difference in the basal metabolic rate of the 2 species, that of the Killer whale being higher than that of Belugas of the same weight classes.
The difference in metabolic rate could have one or several of the following speculative causes: 1) The body composition of Belugas is probably different from that of Killer whales. Sergeant & Brodie (1969b) showed that 43.4% of a Beluga's body weight was composed of blubber and nippers,
47
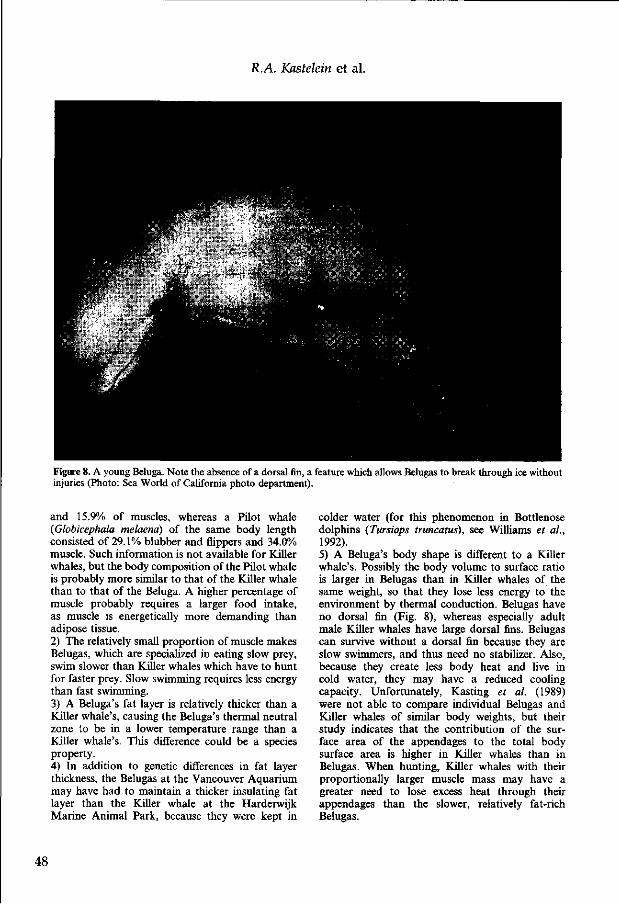
R.A. Kastelein et al.
Figure 8. A young Beluga. Note the absence of a dorsal fin, a feature which allows Belugas to break through ice without injuries (Photo: Sea World of California photo department).
and 15.9% of muscles, whereas a Pilot whale (Globicephala melaena) of the same body length consisted of 29.1% blubber and flippers and 34.0% muscle. Such information is not available for Killer whales, but the body composition of the Pilot whale is probably more similar to that of the Killer whale than to that of the Beluga. A higher percentage of muscle probably requires a larger food intake, as muscle is energetically more demanding than adipose tissue. 2) The relatively small proportion of muscle makes Belugas, which are specialized in eating slow prey, swim slower than Killer whales which have to hunt for faster prey. Slow swimming requires less energy than fast swimming. 3) A Beluga's fat layer is relatively thicker than a Killer whale's, causing the Beluga's thermal neutral zone to be in a lower temperature range than a Killer whale's. This difference could be a species property. 4) In addition to genetic differences in fat layer thickness, the Belugas at the Vancouver Aquarium may have had to maintain a thicker insulating fat layer than the Killer whale at the Harderwijk Marine Animal Park, because they were kept in
colder water (for this phenomenon in Bottlenose dolphins (Tursiops truncatus), see Williams et al, 1992). 5) A Beluga's body shape is different to a Killer whale's. Possibly the body volume to surface ratio is larger in Belugas than in Killer whales of the same weight, so that they lose less energy to the environment by thermal conduction. Belugas have no dorsal fin (Fig. 8), whereas especially adult male Killer whales have large dorsal fins. Belugas can survive without a dorsal fin because they are slow swimmers, and thus need no stabilizer. Also, because they create less body heat and live in cold water, they may have a reduced cooling capacity. Unfortunately, Kasting et al. (1989) were not able to compare individual Belugas and Killer whales of similar body weights, but their study indicates that the contribution of the surface area of the appendages to the total body surface area is higher in Killer whales than in Belugas. When hunting, Killer whales with their proportionally larger muscle mass may have a greater need to lose excess heat through their appendages than the slower, relatively fat-rich Belugas.
48

Food consumption, growth and reproduction of Belugas
Figure 9. An adult female Beluga with her calf. Note the birth folds in the skin of the calf (Photo: Sea World of California photo department).
6) The insulating qualities of the blubber layer vary among odontocetes (Worthy, 1991). The thermal conductance of the skin and blubber layer of the Beluga is lower than that of the Killer whale (Doidge, 1990b; Kasting et al, 1989). 7) The blubber distribution may be different between the 2 species (for the distribution in Belugas, see Doidge, 1990b). 8) The skin of the Beluga is thicker, and thus probably a better insulator, than that of the Killer whale. On arrival in the warm fresh water of estuaries in mid-July to mid-August, Belugas moult, probably as a thermoregulatory adaptation to the environment (St. Aubin et al, 1990; Smith et al, 1992).
Changes in food consumption due to birth and lactation Animal D3's increased food intake during the 2 months prior to birth could have at least 2 causes: 1) She ate more to meet the energy requirements of the foetus for its final growth; Commerson's dolphins eat less during the 11.5 month gestation period than during similar periods when they are neither pregnant nor lactating (Kastelein et al,
1993b). Spotte & Babus (1980) found that the food intake of a pregnant Bottlenose dolphin, kept in water of 27°C, showed large fluctuations, but that the average food intake did not increase although her body mass increased by 37%. However, based on a larger sample, Ridgway et al, 1991, found that captive Bottlenose dolphins consumed slightly more calories during the final stage of gestation. (2) The female may have deposited fat reserves for utilization during the suckling period.
After birth, the calf was observed to suckle successfully, and up to the age of 95 days possibly to satiation (Drinnan & Sadleir, 1981). In addition to the energetic requirements of rapid growth and the establishment of a thick blubber layer by the calf, the female's large increase in food intake after birth was probably also due to the strong increase in total combined body surface area of the mother and calf at birth (Fig. 9). The mother not only has to supply energy for the calf s growth and locomotion, but also has to compensate for the increased heat loss to the environment.
In the wild, birth occurs between June and August at sea after which the females and their calves move in relatively warm estuaries (Smith
49

R.A. Kastelein et al.
et al., 1992). In the St. Lawrence estuary, females with young calves remain in the south-central part where the temperature of the mixed water layer in July is above 9°C. There they mainly feed on benthic fish and invertebrates (Sergeant, 1973). Adult males live in the north-east marginal sector where the summer surface temperature at spring tides can be as low as 3°C, and where Capelin is abundant (Sergeant, 1986). Neonates have thick skins, but thin blubber layers compared to adults. The thick skin may serve as a thermal buffer at birth (Doidge, 1990b). The first period of suckling may well occur in relatively warm water to reduce heat loss by calves until they have ingested enough milk to increase body weight and synthesize an insulating blubber layer. Sergeant (1980) reported on an approximately 7-month-old toothless calf with a body length of 188 cm and a body weight of 116 kg. The blubber was exceptionally thick (around 10 cm) and blubber plus pectoral fins weighed about 50% of the body weight (Sergeant, pers. comm.). Perhaps in order to enable the mother to take in enough food during the energy demanding suckling period, the beginning of the calving season coincides with the beginning of the summer, the period in which food is probably abundant. This may not be relevant if the mother uses stored fat as a major energy source during suckling.
The decrease in the mother's food intake after the first month following birth is probably due to the calfs growth and the increase in its insulating blubber layer. The decrease seen in the present study may have occurred too early, and the calf may not have suckled enough after the age of 3 months. This could be due either to the nocardium infection itself (Drinnan & Sadleir, 1981), or to an unknown cause which may have made the calf more susceptible to the nocardium infection. In the wild, lactation lasts about 20 months (Brodie, 1971; Sergeant, 1973), so female D3's food consumption for about 3 months post partum cannot be used as a reference for what may occur in lactating females in the wild.
Maximum food intake per feed Although the same food components are found in stomachs of young and old Belugas of both sexes, the smaller the animal, the smaller the prey size (Seaman et al., 1982; Vladykov, 1946; Kleinenberg et al., 1964). Because Belugas swallow the prey whole, prey size is limited by the size of the Beluga's mouth and esophagus (Fay, 1979).
Based on Cephalopod beaks found in Beluga stomachs, Seaman et al. (1982) calculated that Belugas from Point Hope ate encephalopods with an average weight of 205 g. This means that an adult female which eats 12 kg of fish a day would
have to eat 58 encephalopods a day. However, this is a very conservative estimate because the caloric value of the fish fed in the present study is higher than that of encephalopods. The largest fish Vladykov (1946) found in a Beluga's stomach was 75 cm long and weighed 4.5 kg. An adult female Beluga would need to eat only 2.5 of such fishes each day to fulfil her energy requirements.
Vladykov (1946) found a forestomach volume of 191 for a 345 cm long (approximately 600 kg) Beluga. This suggests that Belugas can ingest their annual average daily food requirement in one meal if necessary. The large stomach size may be an adaptation to a larger daily food intake during periods in which food is abundant, so that periods of lesser abundancy can be bridged.
Passage time of food through gastrointestinal tract The passage time may vary according to the time of day. However, in the present study the carmine red dye was given between 09.30 and 11.10 hrs, so the differences in average passage times between individuals in the present study do not represent different activity levels of the digestive tract due to time of day. Future studies of food passage times should involve larger sample sizes of both sexes, animals of different ages, and the dyes should be given at different times of the day and night.
In spite of the small sample size, this study indicates a passage time in Belugas of about 270 min. For comparison, studies with carmine red dye in the food of Bottlenose dolphins showed an average food passage time of 235 min. (N=8, S.D.=25 min, Saskia Nieuwstraten, pers. comm), and in Commerson's dolphins 87-143 min (Kastelein et al., 1993a). This indicates that wild Belugas may feed often. This may allow them to go through periods of heavy feeding and synthesize fat deposits, which are used during migration or winter when food is limited.
Ecological significance As far as it is known, the Beluga is the only odontocete which deposits fat reserves in a non-cylindrical way. Most odontocetes simply become robust as they become heavier, whereas Belugas develop in addition fat rolls parallel to their body axis (Fig. 10). Very little is known about what Belugas do during the winter because the weather, drift ice, and darkness make studies very difficult during this season. The Beluga is one of the slowest odontocetes, so its swimming is probably not hindered by the absence of a dorsal fin and the presence of fat rolls. Fat rolls may create too much drag for fast swimming.
The thermal neutral zone or temperature range at which the metabolic rate is the lowest is unknown for Belugas. The relationship between water
50

Food consumption, growth and reproduction of Belugas
Figure 10. Belugas near Baffin island. Note the lateral rolls of fat, which may allow Belugas to go through periods of reduced food availability (Photo: John Ford).
temperature and food intake for one body size is shown in Fig. 6. It is likely that energy requirements would increase if the water temperature rose above a certain level, so that the animals had to dissipate heat actively to prevent heat stress. To do this, odontocetes circulate more blood through the superficial layers of their fins and flukes (Scholander & Schevill, 1955). If, at higher temperatures, food intake was to increase, the graph of Fig. 6 would be U-shaped (see Bartholomew, 1977). Belugas which were transported from Hawaii to San Diego ate more when kept in the warmer Hawaiian waters than when they were in California (Nachtigall, pers. comm.).
It is impossible to determine whether the food consumption of the animals at the Aquarium was equal to that of free living Belugas of the same sex and age classes. The study animals were in good physical condition during their stay at the Aquarium. They do not have to dive to forage for food like their wild conspecifics, but they do swim almost constantly at a speed comparable to wild Belugas, and exercise during training and performance.
In order to estimate the food intake of a wild Beluga, an estimate of the water temperature is needed. It is difficult to determine average monthly sea water temperatures because the Beluga has a wide circumpolar distribution. In addition the animals dive to deeper, colder, water for significant
periods during foraging (Martin & Smith, 1992). Therefore the following estimate is very rough. Sea water temperatures are derived from Sergeant, (pers. comm.) Fraker et al. (1979), and KNMI (the Royal Dutch Meteorological Institute) and are shown in Table 3. Extrapolation of the regression line of Fig. 6 towards these temperatures which
Table 3. Typical surface water temperatures in Canadian waters where Belugas occur, and the estimated monthly and annual food intake of a 600-700 kg female Beluga, based on extrapolation of the line in Fig. 6
Month
January February March April May June July August September October November December
Water temp. CQ
- 1 - 1
0 2 4
10 14 15 16 8 5 0
Estimated monthly food intake (kg)
487 440 477 442 437 363 335 322 303 397 411 477
Annual food intake estimate: 4900 kg
51

R.A. Kastelein et al.
Belugas may encounter in their distribution area produces an annual food consumption estimate for a 600-700 kg female Beluga in the wild of around 4900 kg for food with a caloric density of about 1662 Kcal/kg (Density based on a diet of 75% Herring (1780 Kcal/kg), 15% Mackerel (1587 Kcal/kg) and 10% squid (890 Kcal/kg)). This is around 8.144.000 Kcal/year.
Fig. 6 shows the linear relationship between water temperature and food intake for a 600-700 kg female Beluga in water between 7 and 17°C. For smaller Belugas, the line probably lies lower, and the slope is probably greater. For larger animals, the line probably lies higher, and is more horizontal. In addition to body size, body shape, which is somewhat age dependent according to Kasting et al. (1989), will influence food intake.
Acknowledgements
We thank everyone involved in recording the food consumption and body measurements, and especially Margaret Butschler, curatorial assistant at Vancouver Public Aquarium for the data analysis and Andy Johnson for the carmine red experiment. P. Mekking of the Agricultural University Wageningen, Holland, also helped with data analysis. The mean sea surface temperatures were provided by the Royal Dutch Meteorological Institute (KNMI). We thank Nancy Vaughan for her comments on the manuscript. We thank David Sergeant for the information on the sea water temperatures and for his extensive comments on the manuscript.
References
Andersen, S. (1965) L'alimentation du Masouin (Phoc-oena phocoena L.) en captivite. Vie et milieu 16 A, 799-810.
Bartholomew, G. A. (1977) Body temperature and metabolism. In: Animal physiology: principles and adaptations (ed. M. S. Gordon), pp. 364-449. Macmillan, New York.
Bartmann, W. (1974) Some remarks on the behaviour and handling of white whales (Delphinapterus leucas) in captivity. Aquatic Mammals 2(1), 16-21.
Bonin, W. & Vladykov, V. D. (1940) La Peau du Marsouin Blanc ou Beluga. Naluralisle canadien (Rev. Syst Ecologie) 67, 1-35.
Braham, H. W., Krogman, B. D. & Carroll, G. M. (1984) Bowhead and white whale migration, distribution and abundance in the Bering, Chukchi and Beaufort seas, 19775-78. NOAA Tech. Rept. NMFS SSRF-778, 39 pp. U.S. Dept. of Commerce, National Oceanic and Atmospheric Admin., National Marine Fisheries Service.
Braham, H. W. & Krogman B. D. (1977) Population biology of the bowhead (Balaena mysticetus) and beluga (Delphinapterus leucas) whale in the Bering, Chukchi and Beaufort Seas. Processed Report, U.S.
Department of Commerce, National Oceanic and Atmospheric Administration, National Marine Fisheries Service, Northwest Alaska Fisheries Center, National Marine Mammal Laboratory, Seattle, Washington, 29 p.
Brodie, P. F. (1971) A reconsideration of aspects of growth, reproduction, and behavior of the white whale (Delphinapterus leucas), with reference to the Cumberland Sound, Baffin Island, population. J. Fish. Res. Bd Canada 28, 1309-1318.
Brodie, P. F. (1982) The Beluga (Delphinapterus leucas); growth at age based on a captive specimen and a discussion of factors affecting natural mortality estimates. Rep. Int. What Commn. 32, 445-447.
Dhindsa, D. S., Metcalfe, J., Hoversland, A. S. & Hartman, R. A. (1974) Comparative studies of the respiratory functions of mammalian blood X. Killer whale (Orcinus orca Linnaeus) and Beluga whale (Delphinapterus leucas) Respiration Physiology 26, 93-103.
Doidge, D. W. (1990a) Age-length and length-weight comparisons in the beluga (Delphinapterus leucas), pp. 59-69. In Advances in research on the beluga whale (Delphinapterus leucas) (eds T. G. Smith, D. J. St. Aubin & J. R. Geraci) Can. Bull. Fish. Aquat. Sci. T1A, 59-68.
Doidge, D. W. (1990b) Integumentary heat loss and blubber distribution in the beluga (Delphinapterus leucas), with comparisons to the narwhal (Monodon monoceros), pp. 129-140. In Advances in research on the beluga whale (Delphinapterus leucas) (eds T. G. Smith, D. J. St. Aubin & J. R. Geraci) Can. Bull. Fish. Aquat. Sci. 224, 129-140.
Drinnan, R. L. & Sadleir R. M. F. S. (1981) The suckling behavior of a captive Beluga (Delphinapterus leucas) calf. Applied Animal Ethology 7, 179-185.
Fay, F. H. (1979) Belukha Whale. 'Whalewatcher'. J. Amer. Cetacean Soc. Vol. 13, 1, 4-6.
Finley, K. J., Miller, G. W., Allard, M., Davis, R. A. & Evans, C. R. (1982) The belugas (Delphinapterus leucas) of northern Quebec: Distribution, Abundance, Stock identity, Catch history and Management. Can. Techn. Rept. of Fisheries and Quatic Scis., no. 1123, 57 pp.
Fraker, M. A., Gordon, C. D., McDonald, J. W., Ford, J. K. B. & Cambers, G. (1979) White whale (Delphinapterus leucas) distribution and abundance and the relationship to physical and chemical characteristics of the Mackenzie Estuary. Fish, and Mar. Serv. tech. rep. No. 863. 56 p.
Fraker, M. A. & Fraker, P. N. (1979) The 1979 whale monitoring program Mackenzie Estuary. For Esso Resources Canada Ltd. Edmonton, Alberta.
Fraker, M. A., Sergeant, D. E. & Hoek, W. (1978) Bowhead and white whales in the southern Beaufort Sea. Beaufort Sea Project Tech. Rep. No. 4, Department of Fisheries and the Environment, Victoria, B.C. 128 p.
Goren, A. D., Brodie, P. F., Spotte, S., Ray, G. C , Kaufman, H. W., Gwynnett, A. W., Sciubba, J. J. & Buck, J. D. (1987) Growth layer groups (GLG's) in the teeth of an adult beluka whale (Delphinapterus leucas) of known age. Evidence for two annual layers. Mar. Mamm. Sci. 3(1), 14-21.
Hewlett, S. I. (1978) A New whale song: Pretty Baby. Animal Kingdom 81(2), 1527.
52

Food consumption, growth and reproduction of Belugas
Kastelein, R. A. & Vaughan N. (1989) Food consumption, body measurements and weight changes of a female Killer whale (Orcinus orca) Aquatic Mammals 15(1), 18-21.
Kastelein, R. A., Bakker M. J. & Dokter, T. (1990) The medical treatment of 3 stranded Harbour porpoises {Phocoena phocoena) Aquatic Mammals, 15(4), 181-202.
Kastelein, R. A., McBain, J., Neurohr, B., Mohri, M., Saijo, S., Wakabayashi, I. & Wiepkema, P. R. (1993b) The food consumption of Commerson's dolphins (Cephalorhynchus commersonii) Aquatic Mammals 19(2), 99-121.
Kastelein, R. A., McBain, J. & Neurohr, B. (1993a) Information on the biology of Commerson's dolphins {Cephalorhynchus commersonii) Aquatic Mammals 19(1), 13-19.
Kasting, N. W., Adderley, S. A. L., Safford, T. & Hewlett, K. G. (1989) Thermoregulation in Beluga (Delphi-napterus leucas) and Killer (Orcinus orca) Whales. Physiological biology 62(3), 687-701.
Kingsley, M. (1993) The programme to increase our knowledge of the St. Lawrence beluga. Beluga 4(1), 1-2. Fisheries and Oceans Canada, Quebec Region, 901 Cap Diamant, P.O. Box 15500 Quebec, G1K 7Y7 Canada.
Kleinenberg, S. E., Yablokov, A. V., Bel'kovich V. M., and Tarasevich, M. N. (1964) Belukha (the white whale) Moscow. Publ. House Nauka. 456 p.
Martin, A. R. & Smith T. G. (1992) Deep diving in wild, free-ranging beluga whales, Delphinapterus leucas. Can. J. Fish. Aquat. Sci. 49, 462-466.
Ridgway, S. H. (1972) Homeostasis in the aquatic environment. In Mammals of the sea (ed. S. Ridgway), Thomas publisher, Springfield, Illinois, 590-731.
Ridgway, S. H., Reddy, M., Kamolnick, T., Skaar, D. & Curry, C. (1991) Calorie consumption of growing, adult, pregnant, and lactating Tursiops. Presented at the IMATA conference in Vallejo, California.
Ridgway, S. H., Bowers, C. A., Miller, D., Schultz M. L., Jacobs, C. A. & Dooley, C. A. (1984) Diving and blood oxygen in the white whale. Can. J. Zool. 62, 2349-2351.
Ross, W. G. (1974) Distribution, migration and depletion of bowhead whales in Hudson Bay, 1860 to 1915. Arctic and Alpine Research 6(1), 85-98.
Scholander, P. F. & Schevill, W. E. (1955) Counter current heat exchange in the fins of whales. J. Applied Physiol. 8, 279.
Seaman, G. A., Lowry, L. F. & Frost, K. J. (1982) Foods of Belukha Whales (Delphinapterus leucas) in Western Alaska. Cetology, 44 p.
Seaman, G. & Burns, J. J. (1981) The distribution, natural history, and utilization of belukha whales (Delphinapterus leucas) in Alaska. Unpublished.
Sergeant, D. E. (1969) Feeding rates of cetacea. Fisk. Dir. Skr. Ser. HavUnders., 15, 246-258.
Sergeant, D. E. (1973) Biology of white whales (Delphinapterus leucas) in western Hudson Bay. J. Fish. Res. Board Can. 30, 1065-1090.
Sergeant, D. E. (1986) Present status of white whales (Delphinapterus leucas) in the St. Lawrence estuary. Naturaliste can. (Rev. Ecol. Syst.) 113, 61-81.
Sergeant, D. E. (1980) Levels of mercury and organo-chlorine residues in tissues of sea mammals from the St. Lawrence estuary. Int. Council Explor. Sea CM 1980/E.55. MS 10 pp. Copenhagen.
Sergeant, D. E. (1988) An update of the status of white whales (Delphinapterus leucas) in the Saint Lawrence estuary, Canada. Biological Conservation 45, 287-302.
Sergeant, D. E. & Hoek, W. (1974) Seasonal distribution of bowhead and white whales in the eastern Beaufort Sea. In The Coast and Shelf of the Beaufort Sea (eds J. C. Read & J. E. Sater), pp. 705-719. Arctic Inst, of N. America.
Sergeant, D. E. & Brodie, P. F. (1975) Identity, abundance and present status of populations of white whales (Delphinapterus leucas) in North America. /. Fish. Res. Board Canada 32, 1047-1054.
Sergeant, D. E. (1991) Harp seals, Man and Ice. Can. Special Publ. Fish. Aquatic Scis. 114, 153 pp.
Sergeant, D. E. & Brodie, P. F. (1969a) Tagging white whales in the Canadian Arctic. / . Fish. Res. Bd Canada 25, 2201-2205.
Sergeant, D. E. & Brodie, P. F. (1969b) Body size in white whales (Delphinapterus leucas) J. Fish. Res. Bd Canada 26, 2561-2580.
Sergeant, D. E. & Hoek, W. (1973) Whale-watching. Nature Canada (Ottawa) 2, 27-30.
Smith, T. G., St. Aubin, D. J. & Hammill, M. O. (1992) Rubbing behaviour of belugas, Delphinapterus leucas, in a high Arctic estuary. Can. J. Zool. 70, 2405-2409.
Spotte, S. & Babus, B. (1980) Does a pregnant dolphin (Tursiops truncatus) eat more? Cetology 39, 1-7.
St. Aubin, D. J. & Geraci, J. R. (1989) Adaptive changes in hematologic and plasma chemical constituents in captive Beluga whales, Delphinapterus leucas. Ca. J. Fish. Aquat. Sci. 46, 796-803.
St. Aubin, D. J., Smith, T. G. & Geraci, J. R. (1990) Seasonal epidermal molt in beluga whales, Delphinapterus leucas. Can. J. Zool. 68, 359-367.
Stewart, B. E. & Stewart, R. E. A. (1989) Delphinapterus leucas. Mammalian Species 336, 1-8.
Vladykov, V. D. (1946) Etudes sur les mammiferes aqua-tiques. IV.—Nourriture du Marsouin Blanc ou Beluga (Delphinapterus leucas) du fleuve Saint-Laurent. Dept. des pecheries, Quebec, 17.
Williams, T. M., Haun, J. E., Friedl, W. A., Hall, R. W. & Bivens, L. W. (1992) Assessing the thermal limits of Bottlenose dolphins: a cooperative study by trainers, scientists, and animals. IMATA Soundings, Fall issue, 16-17.
Worthy, G. A. J. (1991) Thermoregulatory implications of the interspecific variations in blubber composition of odontocete cetaceans, 9th Biennial Conf. on the Biol, of Mar. Mammals, Chicago, pg 74.
53

Chapter 2.5
Food consumption, growth, body dimensions and respiration rate of false killer whales (Pseudorca crassidens)
R.A. Kastelein1, J. Mosterd1, N.M Schooneman1 and P.R. Wiepkema2
1 Harderwijk Marine Mammal Park, Strandboulevard Oost 1, 3841 AB Harderwijk, The Netherlands
2 Emeritus Professor of Ethology, Wageningen Agricultural University, Stationsweg 1, 6861 EA Oosterbeek, The Netherlands
Summary
In this study the food consumption, growth, body measurements, initial food passage times and respiration rate of one male and 2 female false killer whales housed at the Harderwijk Marine Mammal Park are described. When they were between approximately 5 and 10 years old, the 2 females ate annual totals of around 5600 kg and 5700 kg. The annual food consumption of the male increased from 5500 kg during his third and fourth year to 6400 kg during his 5th year. No pattern of seasonal variation in food intake was observed. Female 001's body length increased steadily until she was 9 years old, after which it appeared to stabilize around 405 cm. At the age of 5 years (when she weighed 350 kg) she consumed on average 4.1% of her body weight daily and at the age of 8 years (when she weighed 450 kg) 3.4%. Female 002's body length increased steadily at least until she was 11 years old. At the age of 6 years (when she weighed 380 kg), she ate on average 4.1 % of her body weight a day. The male grew from 310 kg at the age of 2 years to 425 kg at the age of 5 years. His body length increased strongly during the 5-year study period. At the age of 3 years (350 kg), he consumed on average 4.3% of his body weight daily. The food consumption and body measurement data of the study are compared to those reported in the literature and to unpublished data of Sea Life Park, Hawaii. The mean initial passage times of carmine red dye through the gastrointestinal tract of the 2 females were 218 and 236 minutes. The mean respiration rate of the animals varied during the day between 10 and 20 breaths per 5 minutes. In all 3 animals the respiration rate was highest between 1200 and 1800 hours.
Key words: odontocete, energetics, initial passage time, carmine red
Introduction Tomilin, 1957; Ross, 1984) and sometimes on other odontocetes (Perryman and Foster,
False killer whales (Pseudorca crassidens; 1980). Very little is known about the ener-Owen, 1846) are social pelagic odontocetes, getic requirements of odontocetes of various which rarely approach land. They are found ages and sizes, as it is not yet feasible to in temperate to tropical seas worldwide measure their energetic requirements in the (Morzer Bruyns, 1969). Large groups of false wild. The present study describes the food killer whales often strand, most frequently consumption, initial food passage times, in Australia (Mell, 1988; Phillips, 1988). The growth, detailed body measurements and diet of false killer whales in the wild mainly respiration rates of 3 false killer whales at the consists of squid, and their large teeth allow Harderwijk Marine Mammal Park, The them to feed on sizable fish (Fraser, 1936; Netherlands.
55

R.A. Kastelein et al.
Materials and methods
Study animals The 3 false killer whales arrived at the Har-derwijk Park in November 1987. The animals came from Kamogawa in Japan and originated from waters around Japan. On arrival, male 003 was estimated to be 2 years old, female 001 4 years old, and female 002 5 years old. Age estimates were based on the length of the animals. The animals eventually all died of pneumonia. During illness they lost weight. Their food intake, body weight and girths during the last year before their deaths are not included here, as they are not considered to be representative data for healthy individuals of the species.
Study area During their stay at the Harderwijk Park the animals were kept in a pool system consisting of 2 large pools and several small pools. One large pool (oval: 30 m x 15 m; depth: 4 m) has 2 adjacent holding pools (both 9 m in diameter; one 2.9 m deep and the other 4 m deep) and is connected by a canal to the other large pool (rectangular: 21 x 7.5 m; depth: 3 m) with 4 holding pools. A plan of this indoor pool system was given by Dudok van Heel (1970). In the pool system, a group of u p to 8 bottlenose dolphins (Tursiops trun-catus) was kept with the false killer whales. During the year the average monthly water temperature varied between 17°C in February and 22°C in August. The average annual water temperature between 1987 and 1993 gradually increased from 18 to 20°C. The salinity varied between 2.0 and 2.5% NaCl. The air temperature varied between approximately 0°C and 30°C. Through windows in the roof the animals were exposed to the natural daily light cycle. The Harderwijk Park is at 5°37' E and 52°20' N.
Food The animals were fed 3 to 10 times per day
on a diet of on average 45% herring (Clupea harengus), 45% mackerel (Scomber scombrus), 5% sprat {Sprattus sprattus), and 5% squid (lllex spp.). The percentages are based on weight. The dietary composition varied slightly according to each animal's preference. Vitamins (Seavits, ®) were added to the fish, after it had been defrosted. The fish was stored for a maximum of 4 months. Records were kept of the amount and type of food consumed during each feed.
Body measurements The animals in the present study were weighed on arrival and once during their time at the park on a digital weighing platform (0.5 kg accuracy).
The length and girths in front of the pectoral fins and at the axilla were frequently measured with a tape measure while the animals were in the water. Variation in body posture caused inaccuracies in the length measurements. Detailed morphological measurements were taken shortly after the animals had died.
Food passage time To measure the passage time of food through the gastro-intestinal tract, 10 gelatine capsules each containing 100 mg carmine red dye were fed to the whales in fish (herring or mackerel). The capsules were offered between 0800 and 1600 hours. After the dye was given, the animals were watched constantly, and the time at which it appeared in the faeces was recorded. This is called the initial passage time (IPT). The IPTs of 2 animals were measured between 22 July and 26 August 1993.
Respiration rate Because the respiration rate in odontocetes varies greatly (Ridgway et al., 1969; Dral and Verwey, 1977; Kastelein and Gerrits, 1991;
56

Food consumption and growth of false killer whales
Kastelein et ah, 1997 a and b), the number of respirations were recorded in units of 5 minutes. To investigate diurnal changes in respiration rate, the animals' respiration rates were recorded during 4 six-hour-long periods throughout the day and night on various days in a period of 2 months (November 1987 - January 1988), when the animals were kept in the rectangular pool. Within each 6-hour period, the respirations of each animal were counted for 4-6 five- minute periods each hour.
Sea Life Park Some information on food consumption and body weights of false killer whales was made available for this study from animals at Sea Life Park, Hawaii, U.S.A. (Marlee Breese, pers. comm., unpublished data). The animals were fed herring, mackerel, smelt and some squid and kept in water with average monthly temperatures between 24.6 in January and 27.2°C in August (annual average: 25.9°C).
Results
Annual food consumption The total annual food consumption of female 001 was approximately 5600 kg (Fig. 1 a), while that of female 002 was approximately 5700 kg (Fig. 1 b). The annual food consumption of male 003 increased from 5500 kg during his third and fourth year to 6400 kg during his 5th year (Fig. 1 c).
Seasonal food intake From the monthly food consumption, no systematic seasonal variation could be detected in the food intake of any of the 3 study animals.
Weight and size Female 001 increased in weight from 340 kg when she was 4 years old to 450 kg when she
was 8 years old. Her body length increased steadily until she was 9 years old, after which it appeared to stabilize (Fig. 2 a). Her girths in front of the pectoral fins and at the axilla increased at least until she was 8 years old (Fig. 3 a).
Female 002 increased in weight from 360 kg when she was 5 years old to 500 kg when she was 10 years old. Her body length increased steadily at least until she was 11 years old (Fig. 2 b). Her girths in front of the pectoral fins and at the axilla increased until she was 10 years old (Fig. 3 b).
Male 003 increased in weight from 310 kg when he was 2 years old to 425 kg when he was 5 years old. His body length increased at least until he was 7 years old (Fig. 2 c). His girth in front of the pectoral fins and at the axilla increased at least until he was 5 years old (Fig. 3 c).
Detailed external body measurements of the 3 study animals after death are shown in table 1. The body of false killer whales is long and slender (Fig. 4). The pectoral fins are long and have a distinct hump at midpoint. Compared to that of the bottlenose dolphin the dorsal fin of the false killer whales is further towards the caudal side of the body. The rostrum is broad with a bulging melon (Fig. 5).
Food consumption relative to body weight The daily food consumption expressed as a percentage of the body weight of the 3 study animals is shown in table 2. The heavier the animal, the lower the daily food intake as a percentage of the body weight.
Food passage time through the digestive tract The normal colour of the faeces of the study animals was green so the red dye was clearly visible. The initial passage times (IPTs) are
57

R.A. Kastelein et al.
8000 A. Female 001
6000
o 4000
Age (years)
8000
6000
4000
2000
B. Female 002
8000
e 6000 o
1. E 3 (0 o 4000
3
t 1988
6 7
t 1988
C. Male 003
8 9 10
Age (years)
4 S
Age (years)
Figure 1. Annual food consumption of the 3 false killer whales, a) female 001, b) female 002, and c) male 003.
58

Food consumption and growth of false killer whales
A. Female 001 420 i
£ 380
S 340
10
Age (years)
B. Female 002 420 i
360
10 11 Age (years)
.C.Male 003
I £ c * o .0
C
s in
420-
400-
380
360
340
320
300 •
• • •
.
Z'
Age (years)
Figure 2. Standard body length of the 3 false killer whales, a) female 001, b) female 002, and c) male 003. The animals were measured while they were in the water. Variation in body posture caused inaccuracies in the length measurements.
59

R.A. Kastelein et al.
M « A. Famale 001 220 i
O 160
140
120
In front of pectoral nut
„ „ „ B. Fanuua 002 220 i
200-
•g- 1t0
5 160
7 I
Ag* (yMi«)
hi front of ptctoral fins
10
Ag« (yaars)
C. Mala 003 220 •<
200
f 180
f O 160-
140
120 In front of ptctoral fins
Age(yaars)
Figure 3. Girths in front of the pectoral fins and at axilla of the 3 false killer whales, a) female 001, b) female 002, and c) male 003. The rather large variations in the girth at axilla measurements in each animal were due to expansion and collapse of the chest during breathing.
60

Food consumption and growth of false killer whales
Figure 4. A young false killer whale jumping. Note the long, slender body (Photo: Courtesy of Sea World Inc., Florida, Orlando).
» . J j * ' !
Figure 5. Two of the study animals at Harderwijk Marine Mammal Park. Note the large teeth, the pigmentation patches on the palate, and the way the eyes of the animal on the right are protruded and turned in such a way that it has binocular vision towards the camera (Photo: Henk Merjenburgh).
61

R.A. Kastelein et al.
o
a.
X a
•73 O
01 X.
o> c
bo
<«
s
01 •d
O CO
oi •£• S .5 n o
CO o o
0 CO
b
2 CO
^ i ^
CM
• *
CO
Q.
a.
—: CO
a. a!
CM o o
CO 0 >.
CM
03 CO
E £ ;= ^ co
Q.
f
o g n
5 I o 9 TX o .£ T- o> co
c CD
E 3 03 CO 0
E
1 I 1 . 1 c 0 « co £ < C5 LU D 2
0 O) co
co co co
o m o o o o o o m o o o o o c o c o o o r l f l N O O n i O S N ^ m i D l D ^ ' t f t O t • * CM CM i - CM T -
co
m CO
(O CM O) ^t 00 i - N O 1^ • * N O CO CO <* CM CM i - CM •>-
O W N m m m
m CM in
m CO
O) N CO N N S (D O) M O K r (O (D CO CM CM - i - CM T -
m oo oo • t •* in
5 00 CO
in
ft Ij S - I I * s s o £S = = "> « co 0 % 3 o o o g o E E ^ g -^ c o l c ^ o o B ^ £ £ i t ?= M . « n ip o = = % B B <D <=
o ? S i c o S , | | S > l l l ^ ^ | ^ i g S S e ' S . E - g - g - g e E E e S o S i 5 f i * s * ; - t : , - ' - D 0 0 0 r ; 0 0 ' ! : i f i ™ m ; = Q . 0 0 0 § - S C C C Q 5 C > < © 0 C Q . S 0 O O O i i ^ C O C C C O O 0 0 O O C O C C c
> .55, .£5, .£5, .£5, .£5, .£5, .£2, .£5, .££1, .£2, .£5, .£5, .£5, .£5, .£5, S .£5, < D 0 O ) C D 0 0 0 0 0 0 0 0 0 0 0 ^ ,_ Q . Q . Q . Q . Q . Q . Q . Q . Q . Q . Q . Q . Q . O - Q . • 0 a a a a a a a a a a a a a a a c
Q . 3 D D D 3 3 D 3 3 3 3 3 3 3 3 C Q _ t|_ h|_ M — H— *•— "4— M— *4— M— M— S — M— M— S — H— r~*
3 0 0 0 0 0 0 0 0 0 0 0 0 0 0 0 * = Q.9.Q.9.Q.Q.9.9.Q.9.9.Q.Q.9.9.9.0
I — i — i — i — i — i — i — i — I — i — i — i — i — i — i — i — err
5 CO
0
j i 0
TJ
c 0
CI) n 1 CO 1—
0 a. a. 3
•s C~ 0
t» 0 O ' c. a.
r .c D)
0
>. 0
O JZ 4-» a> c 0>
_ l
_ * i 0
0 5 * 0
O
n> c <y> _ j
c a) • c
-— a> n m O)
"5 a) O)
c CO
O,
<i>
->, 0
0
P i_ 0 0
62
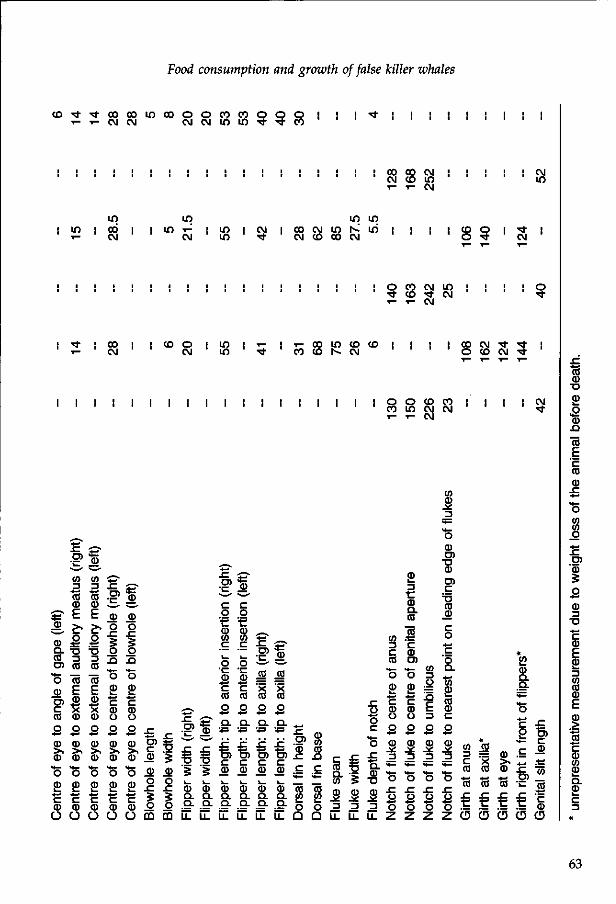
Food consumption and growth of false killer whales
c o ^ - t o o c o i n c o o o c o c o o o o T - T - w w N w in in ^ ^ n
i l l i I I I I I I I I C O G O C \ I , I , | I C M
i - i - CVJ
in in m m m i o d j I U ) ^ | i n [ N l e o w m s u ) i ! j ; <o o i * i i - CM CM in t CM CO CO CM O t C M
o co CM m i i i i o • * CO rf CM • * T- 1 - CM
t ! co ; i c o o i m i i - i - i - o o m c D C D ! i i j c o c M ^ t T - CM N Ifl * P) <D N N O CO CM • *
O O CO CO ! j ! ! CM co m CM CM • * i - i - CM
£~
0
a. CO
o 0 O)
c CO o 0
0
o
c CD
o
O) ' . CO 3
to CD
E o
T3 3 CO
to c
CD
CD O
0
0
O
8> ** c 0
O
,—. C _0
CO 3
to 0
E
o T3 3 CO
to c . 0
V. 0 o
••—»
0
0
o 8> c 0 O
** x .2> >iv 0 O
X
O
•s ** c 0 o o *-> 0 0
o 9> ** c 0
o
0
0 o x
o
O
c 0 o .2 0
0
o
c 0
O
X +* C 0
0
o X 5 o
CO
X
5 0
o x o m
x
x
g
0 a . Q.
ii
I X
0 Q.
g . EE
_ -•—» JZ O)
c o 0 CO c
o o c CO o Q.
x
C 0
0
a.
£~ 0
c o
' • e 0 CO c o ©
c CO o ** Q.
X
c
0
0 Q.
a .
ii
*—• O)
S o Q.
x *-> c 0
0 Q.
LL
o Q.
sz 4-«
c 0
0 Q. Q.
if
X O)
' 0 x
*^ "co 2 o
Q
0 CO CO
c
"co
e o Q
c CO OL CO
3 LL
x
>
J! 3
x Q O C
"5 x B. 0
•D
3 LL
CO 3 C co O
0 I t -
** c 0 O O
13 *-H—
O X o
•4—*
o
z
£ 3
0 Q . CO
Is 0 O)
H—
O
c 0 o 2 s _ZJ *^ **— o
X o
z z
CO 3 o 15 E 3 O
*->
5 13 **— M— O
X Q O
Z
CO
3 H —
"5 0 D )
TJ 0 D )
CO H>
o
c o Q.
to
CO 0 c 2 3 _ZJ **— H—
O X o
z z
CO 3 C CO
ts X
t b
* i5
to X
CD
0
0
to X
t b
* m 0 Q. Q.
*^ O
2 **— •4-< X O)
X
c
b
X
c
To to 'c 0
CD
63

R.A. Kastelein et al.
CO "Q
1 —' SO
is c g'E <o §
.S3 6 g M)TS
t a <u s
M-i ^ O J3
« Z C ° '3 > S «
Is g £ ^
e « S " l I I I
u C E
^ 8 T3
o co S
SP - L (U (0
^ 5 1 » o 2 I3 « « ^ c « T5 « 0-O S »
• ° ^ JS
<3 ° c
•g * «
111 4, O ffi
S 2 n
« S S H D H S
0 J3
X} o o LL
w 03
>. CO o <£ ^ CO
CI) rr> & r m H fii Q.
D ) CD
O
.^ co
u o o LL
U ) ^ — * •
JZ U ) CD
£ > 8 co
0} ^ CO
T3 0 CO E CO III
• o
9> 3 CO CO CD
>. CO T5 S) ^
O m
x_ 0
TJ r 0
O
••-» O) c CD
E" o.
CO
E c <
0 To Q
OS CO
CO
"fr O) • *
m CO
CO CO
CO
O)
o CVJ
o CVJ
I CO
o CM
I • > - CO
CO o • * co CVJ i - i -
I I I CO 1 - <tf
o o co o m
CO in •«t
in CO CO
O) CO CO
O)
^ • t
• *
to cvj
r-. <o
CO
o> ro CO
co m co co o i - CO CO O) i -CO CO CO CO TT
0 CO
E 0
in co o co CO CO
JP. CO
ip. CO
CO CO cvi
0
co
in CM CO
o s 0 m E 0
m in CO
-32 CO
3 Q .
2 CO
1 1 O
o o
O = Q-
a a. £ _i a 0 (0
in co
^ % S
N CD O)
0 CO
CO N o>
x : CO
2
O) N CD
x : y CO
2
^ eh 3 <
CM S 05
£
y CO
(T) h-
1 1
co O)
Q. 0
y—
C CO
~3
CO 1 ^
X I 0
LL
CO O) 1
d) 3 <
rvi N 05
x: y CO
in co rn
3 ~3
o N o>
JZ
y CO
2
CVJ
CD
3 ~5
(.VI O)
T—
o
64

Food consumption and growth of false killer whales
oo O) • * m i -cd c\i i n T T ^
CO ( O CO o CM
i n O i - CM CO cb co ^ CM
1 - " t -<t CO
CD CO
co in
CO
CO CO
CO
CD
E 3 w c o o CD 1— CD
• g
"D O " CO
c CO
V)
in o in o T - CM 1 - CM
^ t CO O O CM t CD CD - i - CO CO -i— S O ) co m CM co •* co T T
o o o o o o o t in io (O o r m CO CO •'S' CO CO CO CO
CO
J C
g
S O) c
• c 3
T3 i n co CD
CM in CO
CM CO CO 1
CD co E CD
o oo CO CO
• *
CM CO
CD CO E CD LL
O CD CO
=
O in CM
s CD CM
s CM CO
00
%
O) in CO
00 in CO
CO s s
m N •<t
CO • ^
CO
CD CO E CD LL
§ CO
c c
O CO CO
CD CO E CD LL
C\J T— CO
CO
O) 3 <
T3 C CO
CO CO O)
s c CD CD
_ 3
CO
CO
E CD O
O
CO CD CD T
CJ) 3 <
in CD CD
o U
CM cn CD
o (J
CO O) CD
*" U) 3 <
m O) CD
* j
n m LL
o (0 0.
•o c w
c
co m co co o> o>
§ <
£ (0
3 £ Q.
I"-00 CD
CO CO CD
CM O
o
CO o o
CO CD CD
Q . CD
CO
00 CD
c§ CD
00 CD
O CD
CD
2> CD
CD O)
CD
E S o o>
• o + J o> c
i 2 CD 3 O)
o c' CO O 5ii CO
65

R.A. Kastelein et al.
Table 3. Initial passage times (IPTs) of carmine red dye through the digestive tract of 2 false killer whales at Harderwijk Marine Mammal Park.
Animal Age (years)
Date Time of day the IPT dye was fed (h) (min)
Female 001
Female 002
10
11
22-07-1993 18-08-1993 26-08-1993 22-07-1993 18-08-1993 23-08-1993 26-08-1993
15.04 15.10 15.08 14.56 15.10 08.28 15.05
229 214 212 271 221 247 205
shown in table 3. The mean IPTs of carmine red dye through the gastrointestinal tract of the 2 female false killer whales were 218 minutes (standard deviation: 9 minutes; n = 3) and 236 minutes (standard deviation: 29 minutes; n = 4).
Respiration rate The animals' average respiration rates varied during the day between about 10 and 20 respirations per 5 minutes. Their respiration rate was highest between 1200 and 1800 h (Fig. 6).
Discussion and conclusions
Seasonal food intake No seasonal pattern of change in food intake was observed in any of the study animals, although a 5°C difference in average monthly water temperature occurred between summer and winter. The lack of seasonal fluctuation could be due to the masking effect of growth; the females in the present study grew during most of the study period and the male grew during the entire study period. Also, the animals had probably not reached sexual maturity during the study period and may not have experienced strong seasonal hormonal fluctuations. Both male and female false killer whales reach sexual
maturity when they are between 8 and 14 years old (Purves and Pilleri, 1978). They may also have adapted the thickness of their blubber layer to the water temperature.
Weight and size False killer whales are about 1.6 m long at birth (Ross, 1984). Although based on only 2 animals, the present study suggests that females reach their maximum body length at around the age of 10 years. The male's length increased during the entire study period, at least until his 7th year. Odell et al. (1980) provide the following formula based on 4 captive false killer whales which allows the calculation of body weight from body length:
W = 2.16 x 10⁻⁴ L2437
in which W is the body weight in kg and L is the standard body length in cm. Applying this formula to the present body length and weight data shows that it underestimates the whales' weight by about 60 kg when they were between 3.1 and 3.3 m long. When the whales were around 3.9 m long, the formula fitted the animals of the present study better.
All 3 animals in the present study were longer than the false killer whales of correspond-
66

Food consumption and growth of false killer whales
ing ages described by Purves and Pilleri (1978). Also, the age versus body length graph given by Purves and Pilleri suggests a constant growth rate until at least the age of 22 years in both sexes, whereas the 2 females in the present study showed a decrease in growth rate between the ages of 5 and 10 years.
The standard body length and weight ratios of the animals in the present study are similar to those of animals kept at Marineland of the Pacific and Sea World (Brown et al., 1966; Odell et ah, 1980) and at Sea Life Park (Mar-lee Breese, pers. comm. of unpublished data; Table 2). When data from all 4 parks are included (one data point per animal), the relationship between standard body length (L in cm) and body weight (W in kg) can be expressed as:
W = 260.33e00061<L-290>; ( F ig . 7)
Ross (1984) reports an intact carcass of a 358 cm, 372 kg, male false killer whale from South African waters. The length/ weight ratio of this wild animal agrees with the values in figure 7. Comparison of the real weights and estimated weights in table 2 shows that people tend to over-estimate the weights of false killer whales. This may be due to the long slender body shape of this species.
The rather large variations in the girth at axilla measurements in each animal in the present study were due to expansion and collapse of the chest during breathing.
Because the detailed morphological measurements of the study animals were taken after a period of illness, which caused weight loss, some of the girth measurements deviate from those of healthy animals of the same length. External measurements of false killer whales have been published only in a
few cases; a calf from waters around South Africa (Ross, 1984), and from stranded animals on the British Isles (Fraser, 1936).
Food consumption relative to body weight Only little information has been published on the body weights and food intake of false killer whales (Brown et al, 1966; Odell et al, 1980). The food intake as proportion of body weight of the animals at Sea Life Park was in the same range as that of the animals in the present study which were kept in water with a lower annual average temperature (Table 2; Fig. 8). This similarity, despite a large temperature difference, could be because the calorific content of the food at Sea Life Park was lower than that of the food in the present study (which is unlikely as the diets were similar), or because the animals were less active at Sea Life Park than in Harder-wijk (this seems also unlikely after having observed the animals at both parks). Maybe the animals adapted the thickness of their blubber layer (Williams and Friedl, 1990) or its composition (= insulating properties; Worthy and Edwards, 1990) to the water temperature. One of the 2 young animals at Sea World ate a relatively large amount. This and the relatively high food intake record reported for an animal at Marineland of the Pacific cannot be explained (Brown et al., 1966).
Food passage time Although the study is based on a small sample size, the passage time of carmine red through the digestive tract of the false killer whale seems to be short for its body size, compared to other odontocetes (Kastelein et al, 1993, 1994 1997 c, 1998 a, b and c). This suggests that the species has a relatively short digestive tract or a high metabolic rate for its body weight and size. The latter seems to be the case, as the animals in the present study had a high daily food intake as a per-
67

R.A. Kastelein et al.
•o o
E JO "3> c o
a M tt
XI
E 3 C re a>
25-
20-
15-
10-
5 -
n .
V. Female 001
n-135 n=130 n=133 n=130
0-6
22-12-87 29-12-87 12-01-88 19-01-88
6-12
22-12-87 29-12-87 14-01-88 21-01-88
12-18
22-12-87 29-12-87 11-01-88 18-01-88
18-24
22-12-87 29-12-87 13-01-88 20-01-88
Period (hour) Data collection
dates
•o o 11 2L c
I c o
2 o. w £
.Q E 3 C C
S
B. Female 002 25-i
20 -
15-
10-
5 -
0 -n=49
0-6
5-01-88 12-0 1-88
n=47
6-12
7-01-88 14-0 1-88
n=48
12-18
4-01-88 11-0 1-88
n=48
18-24 F
6-01-88 E 13-0 1-88
>eriod (hour)
)ata collection dates
68

Food consumption and growth of false killer whales
C. Male 003 25
•o o g 20
c E u>
c o
a M 9>
n E 3 C
a £
15-
10-
5-
n=130 n=124 n=124 #1=126
0-6 8-12-87
10-12-87 5-01-88
19-01-88
6-12 8-12-87
10-12-87 7-01-88
21-01-88
12-18 8-12-87
10-12-87 4-01-88
18-01-88
18-24 Period (hour) 8-12-87 Data collection
10-12-87 dates 6-01-88
20-01-88
Figure 6. The average number of respirations during 5 minute periods by 3 false killer whales during 6 hour periods, n = the number of 5 minute periods during which respirations were counted (these samples are not independent as they are taken on only 2 or 4 days per 6 hour period), a) female 001, b) female 002, and c) male 003.
centage of body weight compared to the smaller bottlenose dolphins kept in the same pool system (Kastelein et al., 1998 c). This high metabolic rate may be due to the elongated body shape of the false killer whale, making the body surface to body volume ratio relatively large.
Respiration rate Adult false killer whales in the wild breathe 20-25 times per 5 minutes when swimming at a speed of 11-22 k m / h (Morzer Bruyns, 1971). This rate is slightly higher than that found in the present study, probably because at the time of observation the wild animals were swimming faster than the study animals. Respiration rate in odonto-cetes are often related to diving patterns (Kastelein and Gerrits, 1991).
Ecological significance Differences between the food intakes report
ed in the present study and those of false killer whales of similar size and gender in the wild may be due to differences in the water temperature, the calorific content of the food or the animals' activity levels.
The annual average water temperature in the present study was 19°C. False killer whales usually inhabit seas with surface temperatures of above 20°C (Morzer Bruyns, 1971). However, when they dive, they encounter lower temperatures. As very little is known about the natural diet of false killer whales, it is not useful to speculate about possible calorific differences between the diets of the animals in the present study and their wild conspecifics. Little is known about the diving behaviour of false killer whales, and thus about the energy used for locomotion, but wild false killer whales dive deeper than the animals in the present study. Therefore, false killer whales in the
69

R.A. Kastelein et al.
900
800
700
5 600-
1 500-
1 * 400-•D
m 300
200
100
• Male * Female
y = 260.33e' 0.0061(x-290)
290 310
— i —
330 — i 1 1 —
350 370 — i 1 1 1 1 1 1 1 1 1 1
390 410 430 450 470 490
Standard body length (cm)
Figure 7. The relationship between standard body length and body weight of false killer whales at Harderwijk Marine Mammal Park (present study), Sea Life Park, Marineland of the Pacific, and Sea World (one data point per animal).
£ 7 i o>
I >» .o
(0 (0 c o
E « 3 (0 c o o •o 3 o
* Sea Life Park • Marineland of the Pacific o Sea World • Harderwijk Marine Mammal Park
- i — i — i — r T I I I
240 280 320 360 400 440 480 520 560 600 640 680 720 760 800
Body weight (kg)
Figure 8. The relationship between body weight and daily food intake as a percentage of body weight in false killer whales of both sexes at 4 oceanaria (one data point per animal).
70

Food consumption and growth of false killer whales
wild probably consume more than the animals in the present study.
Acknowledgements
We thank curator Teun Dokter and all the trainers for their record-keeping over the years and Piet Crucq for recording the pool temperatures. We thank Saskia Nieuwstra-ten for collecting the carmine red data. The respiration rate data were collected by Miriam van der Weide. We thank curator Mar-lee Breese for providing the food intake and body measurement data for the false killer whales at Sea Life Park, Hawaii, U.S.A., Rob Triesscheijn for making the figures and Nancy Vaughan for her comments on the manuscript.
References
Brown, D.H., Caldwell, D.K. and Caldwell, M.C. (1966) Observations on the behavior of wild and captive False killer whales, with notes on associated behavior of other genera of captive delphinids. Contributions in Science, Los Angeles County Museum, No. 95, 1-32.
Dral, A.D.G. and Verwey, J. (1977) Breathing and diving in Tursiops. Aquatic Mammals 5(1), 18-20.
Dudok van Heel, W.H. (1970) The Dolphinarium at Harderwijk. Int. Zoo Yearb. 10, 49-51.
Fraser, F.C. (1936) Recent standings of the false killer whale, Pseudorca crassidens. Scottish Naturalist. July-August, 105-114.
Kastelein, R.A. and Gerrits, N.M. (1991) Swimming, diving, and respiration patterns of a Northern bottlenose whale (Hyperoodon ampullatus, Forster, 1770). Aquatic Mammals 17(1), 20-30.
Kastelein, R.A., McBain, J. and Neurohr, B. (1993, chapter 2.12) Information on the biology of Commerson's dolphins (Cephalorhyn-chus commersonii). Aquatic Mammals 19(1), 13-19.
Kastelein, R.A., Ford, J., Berghout, E., Wiep-kema, P.R. and Boxsel, M. van (1994, chapter 2.4) Food consumption, growth and reproduction of Belugas (Delphinapterus leucas) in human care. Aquatic Mammals 20(2), 81-97.
Kastelein, R.A., Haan, D. de, Goodson, A.D., Staal, C. and Vaughan, N. (1997 a) The effects of various sounds on a harbour porpoise (Phocoena phocoena). In: The biology of the harbour porpoise (Eds. Read, A.J., Wiep-kema, P.R. and Nachtigall, P.E.). De Spil Publishers, Woerden, The Netherlands, 367-383.
Kastelein, R.A., Haan, D. de, Staal, C. and Goodson, A.D. (1997 b) The response of a harbour porpoise (Phocoena phocoena) to nets of various mesh sizes, with and without deterring sounds. In: The biology of the harbour porpoise (Eds. Read, A.J., Wiepkema, P.R. and Nachtigall, P.E.). De Spil Publishers, Woerden, The Netherlands, 385-409.
Kastelein, R.A., Nieuwstraten, S.H. and Ver-stegen, M.W.A. (1997 c, chapter 2.15) Passage time of carmine red dye through the digestive tract of harbour porpoises (Phocoena phocoena). In: The biology of the harbour porpoise (Eds. Read, A.J., Wiepkema, P.R. and Nachtigall, P.E.). De Spil Publishers, Woerden, The Netherlands, 265-275.
Kastelein, R.A., Neurohr, B., Nieuwstraten, S.H. and Wiepkema, P.R. (1998 a, chapter 2.8) Food consumption and body measurements of Amazon river dolphins (Inia geof-frensis) in human care.
71

R.A. Kastelein et al.
Kastelein, R.A., Elst, C.A. van der, Tennant, H.A. and Wiepkema, P.R. (1998 b, chapter 2.10) Food consumption, growth, body dimensions and body temperatures of a female dusky dolphin (Lagenorhynchus obscu-rus).
Phillips, S.S. (1988) Observations on a mass stranding of Pseudorca crassidens at Crowdy Head, New South Wales. In: Marine Mammals of Australia, Field Biology and Captive Management (Ed. Augee, M.L.) Royal Zool. Soc. of N.S.W. 33-41.
Kastelein, R.A., Staal C. and Wiepkema, P.R. (1998 c, chapter 2.6) Food consumption and growth of Atlantic bottlenose dolphins.
Mell, D.J. (1988) An operational perspective of the rescue of False Killer Whales (Pseudorca crassidens) s tranded at Augusta in July 1986. In: Marine Mammals of Australia, Field Biology and Captive Management (Ed. Augee, M.L.)Royal Zool.Soc.of N.S.W. 43-57.
Morzer Bruyns, W.F.J. (1969) Sight records and notes on the False Killer Whale, Pseudorca crassidens (Owen, 1846). Saugetierk. Mit-teilungen, 17(4), 351-356.
Morzer Bruyns, W.F.J. (1971) Field guide of whales and dolphins. Uitgeverij Tor, Amsterdam, 258 pp.
Odell, D.K., Asper, E.D., Baucom, J. and Cornell, L.H. (1980) A recurrent mass stranding of the false killer whale, Pseudorca crassidens, in Florida. Fishery Bulletin, 78(1), 171-177.
Perryman, W.L. and Foster, T.C. (1980) Preliminary report on predation by small whales, mainly the false killer whale, Pseudorca crassidens, on dolphins (Stenella spp. and Delphinus delphis) in the eastern tropical Pacific. U.S. Dept. of Commerce, report LJ-80-05.
Purves, P.E. and Pilleri, G. (1978) The Functional Anatomy and General Biology of Pseudorca crassidens (Owen) with a Review of the Hydrodynamics and Acoustics in Ceta-cea. In: Investigations on cetacea, Vol. 9 (Ed. Pilleri, G.). Institute for Brain Anatomy, Berne, Switserland, 68-227.
Ridgway, S.H., Scronce, B.L. and Kanwish-er, J. (1969) Respiration and deep diving in the bottlenose porpoise. Science 166, 1651-1654.
Ross, G.J.B. (1984) The smaller cetaceans of the south-east coast of southern Africa. Ann. Cape Prov. Mus. (Nat. Hist.) 15(2), 173-410.
Sergeant, D.E. (1969) Feeding rates of Cetacea. Fisk. Dir. Skr. Ser. Hav. Unders., 15, 246-258.
Tomilin, A.G. (1957) Mammals of the U.S.S.R. and adjacent countries. Vol. 9, Cetacea. Israel Program for Scientific Translations, Jerusalem (1967), 717 pp.
Williams, T.M. and Friedl, W.A. (1990) Heat flow properties of dolphin blubber: insulating warm bodies in cold water. American Zool. 30(4), 191.
Worthy, G.A.J, and Edwards, E.F. (1990) Morphometric and Biochemical factors affecting heat loss in a small temperate cetacean (Phocoena phocoena) and a small tropical cetacean (Stenella attenuata). Physiological Zoology 63(2), 432-442.
72

Chapter 2.6
Food consumption and growth of Atlantic bottlenose dolphins (Tursiops truncatus)
R.A. Kastelein1, C. Staal1 and P.R. Wiepkema2
1 Harderzvijk Marine Mammal Park, Strandboulevard Oost 1, 3841 AB Harderwijk, The Netherlands
2 Emeritus Professor of Ethology, Wageningen Agricultural University, Stationsweg 1, 6861 EA Oosterbeek, The Netherlands
Summary
Food consumption, body length and body weight were recorded in 19 Atlantic bottlenose dolphins at Harderwijk Marine Mammal Park between 1965 and 1995. After weaning, average annual food consumption of males and non-pregnant, non-lactating females increased until the age of 3 years, stabilizing at around 1900 kg per year. Food intake did not increase during pregnancy. Two calves were successfully suckled and raised by their mothers. After they gave birth, food consumption of the 2 mothers showed a comparable pattern; the food intake remained at a normal level during the month of birth, but increased rapidly in the following month. Although consumption began to drop during the fourth month, it remained higher than during non-lactating years during the entire suckling period (34 months in one case, where the calf began to eat fish at the age of 6 months, and 26 months in the case where the calf began to eat fish at the age of 19 months). Consumption was generally lower than average in the first half of the year and higher than average in the second half. This was probably due to a seasonally changing feeding method. Average standard body length was 116 cm for male and 114 cm for female neonates. It increased rapidly until the age of 5 years, after which growth rate declined. Average body weight at birth was 18.0 kg for males and 15.6 kg for females. Thereafter weight gain was rapid until the age of 4 years, after which it decreased. The relationship between standard body length (in cm) and body weight (in kg) can be expressed as body weight = 12.904e0017<body ^g^-ioo) There is a negative relationship between body weight and average daily food consumption as a percentage of body weight. The average initial passage time of carmine red through the digestive tract of 5 animals (with an average body weight of 185 kg) was 235 minutes.
Key words: odontocetes , energetics, r eproduct ion , ca rmine red , initial passage t ime
Introduction cott, 1977; Hinga, 1979; Geraci and St. Aubin, 1980; Spotte and Babus, 1980; Geraci, 1981;
Although the bottlenose dolphin (Tursiops Cates and Schroeder, 1986; Cockcroft and spp.) has a wide distribution and is the most Ross, 1990 a; Peddemors et al., 1992; Reddy et widely kept toothed whale in the world, rel- ah, 1994; Kastelein et al., 1998 d). The food atively little is known about its food require- consumption, body measurements and ments (McBride and Kritzler, 1951; Essa- weight changes of toothed whales may be pian, 1953; Tavolga, 1966; Sergeant, 1969; important for zoological parks with odonto-White, 1970; Shapunov, 1971; Van de Hurk, cetes, providing a reference for veterinary 1972; Van Dyke and Ridgway, 1977; Pres- and husbandry purposes. Food consump-
73

R.A. Kastelein et al.
Figure 1. Three of the bottlenose dolphins for which the food consumption is described in this study (Photo: Henk Merjenburgh).
tion data from animals in human care can also be used to evaluate the impact of wild individuals on fish populations, and to determine the carrying capacity. This paper, therefore, describes the food consumption and growth of bottlenose dolphins at the Harderwijk Marine Mammal Park between 1965 and 1995.
Materials and methods
Study animals Most of the 19 Atlantic bottlenose dolphins (Tursiops truncatus) originated from the eastern Gulf of Mexico (Fig. 1). The age, sex, origin and study period of each dolphin was recorded (Table 1). Age estimates were based on body size, and are more accurate for those arriving at the park at a young age. Body measurements were made infrequently for husbandry purposes. Body weights and lengths of full-term neonatal calves
which died during or shortly after birth were recorded, although both measurements were not made for all calves. Standard body length is defined as the length of a straight line between the tip of the rostrum and the notch in the tail fluke.
Study area The study animals were kept indoors in a main pool (30 m x 15 m, 4 m deep) with 2 adjacent holding pools (9 m diameter, depths: 2.9 m and 4 m). These pools were connected by a canal to another complex of a main pool (21 x 7.5 m, 3 m deep) and 4 holding pools (Dudok van Heel, 1970). A group of up to 14 bottlenose dolphins was kept with a female killer whale (Orcinus orca) between 1976 and 1987, and with 3 false killer whales (Pseudorca crassidens) between 1987 and 1993. The average monthly water temperatures varied between 17°C in February and 22°C in August (Fig. 9). Between
74

Food consumption of Atlantic bottlenose dolphins
Table 1. The characteristics of the Atlantic bottlenose dolphins used in this study.
Animal code
TtZH005 TtZH006 TtZH007 TtZH008 TtZH009 TtZHOlO TtZH013 TtZH014 TtZH015 TtZH016 TtZH017 TtZH018 TtZH019 TtZH022 TtZH023 TtZH025 TtZH027 TtZH034 TtZH078
Sex
M F F F M F F F F M F F F F F F F F F
Birth date
1958 1962 1962 1963 1982 1983 1982 1982 1960 1950 1960 04-08-1974 12-08-1975 1961 1955 1960 1946 1962 1960
Birth location
wild wild wild wild wild wild wild wild wild wild wild Harderwijk Harderwijk wild wild wild wild wild wild
Study period
1965 - 1995 1969 - 1995 1968 - 1995 1968-1995 1982-1991 1985-1995 1985-1995 1985- 1995 1965- 1982 1970 - 1981 1971 - 1982 1974-1980 1975-1982 1969-1979 1970-1979 1971 - 1987 1965-1977 1968-1977 1965- 1975
1987 and 1993, the average annual water temperature increased from 18 to 20°C. Air temperature varied between ap- proximately 0°C and 30°C, and salinity between 2.0 and 2.5%. Windows in the roof allowed the animals to be exposed to the natural daily light cycle at 5°37' E and 52°20' N.
Food The animals were fed 3-5 times per day on a diet of on average 25% herring (Clupea ha-rengus) and 75% mackerel {Scomber scom-brus) by weight, until 1980, and 30% herring, 30% mackerel, 15% whiting (Merlangius mer-langus), 20% sprat (Sprattus sprattus) and 5% squid (Illex spp.) between 1980 and 1995. Ratios of the fish species, however, varied with availability. Vitamins (Seavit ®) were added to the fish, after it had been defrosted
in running tap water. The frozen fish was stored for a maximum of 4 months. Between 1965 and 1988, food intake was strongly influenced by training in which food was the only reward used. From 1988, food was only one of the many types of reward and the animals were allowed to eat as much as they wanted (until the fish was not eaten immediately, or was played with) during the last meal of the day. Records were only used of animals in good health, and from full calendar years.
Passage time of food through the digestive tract Between 13 May and 16 July 1993, the passage time of food through the gastrointestinal tract was measured in 5 dolphins. Three gelatine capsules, each containing 100 mg carmine red dye, were fed to the dolphins in
75

R.A. Kastelein et al.
a herring or mackerel. The capsules were offered between 0800 and 1700 h and the time taken for the dye to first appear in the faeces was recorded (initial passage time).
Statistics The seasonal fluctuations in food intake between years were tested with the Kendall's coefficient of concordance test. The average daily food intake of each month of a year was given a rank number from 1 to 12.
Results
Annual food consumption After weaning, the average annual food consumption of males and non-pregnant, non-lactating females increased until the age of 3 years (Fig. 2). Thereafter, it averaged around 1900 kg per year (SD = 270 kg, n = 201). After the age of 20 years, food consumption of
several animals decreased slightly.
Impact of reproduction on food intake in females Although most calves died during or shortly after birth, 2 female calves were successfully suckled and raised by their mothers. Twelve months before parturition, consumption of both ceased almost entirely for one week, indicating oestrus. Food consumption was not noticeably higher during pregnancy than during previous seasons, in which the females were not pregnant. Food consumption of the 2 mothers remained normal during the month of delivery, increased during the following month and began to drop during the fourth month. The monthly food intake of female 017, whose calf (018) began to eat fish at the age of 6 months, remained above the monthly average for most of the suckling period (Fig. 3). Weaning occurred abruptly at 34 months, as the calf was moved
c o '•& E 3 10 c o u •a o o
3500
3000-
2500-
2000-
1500-
« 1000 c c <
500 Males Females
0 2 8 10 12 14 16 18 20 22 24 26 28 30 32 34 36 38 Age (year)
Figure 2. Annual food consumption of 3 male and 16 female bottlenose dolphins at Harderwijk Marine Mammal Park. Age 1 represents the first calendar year after birth. * A year during which a calf was born and suckled. + A year during which a calf was suckled.
76

Food consumption of Atlantic bottlenose dolphins
450
at
a. E
o o •o o
c o
i i i i i i i i i i i t i i i i i i i i i i i i i i i i i i i i i i i i i i i i i i i i i i i
J • J J J f Month
f Birth of calf 018 f f f End suckling 1974 o n 4 August 1975 1976 1977
Figure 3. Impact of reproduction on the monthly food intake of bottlenose dolphin female 017 and the transition from milk to solid food in her calf (018). * Calf moved to another park (acute weaning). J signifies January. The horizontal dashed line indicates the average monthly food consumption of the female during recent non-reproductive periods. The vertical dashed line indicates the moment the calf is fully weaned.
450
Birth of calf 019 f on 12 August 1976
Month
End suckling
Figure 4. Impact of reproduction on the monthly food intake of bottlenose dolphin female 023 and the transition from milk to solid food in her calf (019). 1) Reduced food consumption coinciding with illness. J signifies January. The horizontal dashed line indicates the average monthly food consumption of the female during recent non-reproductive periods. The vertical dashed line indicates the moment the calf is fully weaned.
77

R.A. Kastelein et al.
to another park. During the suckling period, the mother consumed 2600 kg (48%) more than during similar periods in non- reproductive years. Between 6 and 34 months of age, the calf consumed 2500 kg of fish, in addition to suckling. The monthly food intake of female 023, whose calf (019) was began to eat fish at the age of 19 months, remained above average for the entire suckling period (Fig. 4). During the 26 month suckling period, the mother consumed 3300 kg (72%) more than during similar periods in non-reproductive years. Between 19 and 26 months of age, the calf had consumed 570 kg of fish, in addition to suckling. Owing to difficulties recording the last suckling session in cetaceans, the end of the weaning process was defined in this study as the time at which monthly food consumption in the female returned to a level similar to that in non-reproductive years.
Seasonal fluctuations Monthly food consumption in both males and non-pregnant, non-lactating females showed a seasonal fluctuation. Male 005, a representative example of males, ate less than average during the first half of the year and more than average during the second half (Fig. 5 a, n - 27 years; Kendall's coefficient of concordance %J = 79.0; p < 0.001). Female 007, a representative example of nonpregnant, non-lactating females, showed a similar pattern (Fig. 5 b, n = 25; Kendall's coefficient of concordance %J = 84.97; p < 0.001). Food intake of both animals in February was limited by training methods.
Body measurements Average standard body length of neonates was 116 cm for males (SD: 6.0 cm, n = 15) and 114 cm for females (SD: 9.7 cm, n = 6). Body length increased rapidly until around the age of 5 years, after which growth rate declined (Fig. 6 a).
The average body weight at birth was 18.0 kg for males (SD: 3.8 kg, n - 15) and 15.6 kg for females (SD: 4.9 kg, n = 5). Weight gain was rapid until around the age of 4 years, after which it increased more slowly (Fig. 6 b). There is a positive relationship between standard body length (cm) and body weight (kg) which, using only 1 measurement per animal, can be expressed as:
b o d y we igh t = 12.904e00I7(body iength-i<x».
(Fig. 7).
Food consumption as a percentage of body weight There is a negative relationship between body weight and average daily food consumption as a percentage of body weight taken over the calendar month in which the body weight was measured (Fig. 8).
Passage time of food through the digestive tract The average initial passage time of carmine red through the digestive tract of 5 bottle-nose dolphins (weight range: 160-221 kg; average: 186 kg) was 235 minutes (SD: 49 minutes; n = 8, Table 2).
Discussion and conclusions
Annual food consumption Annual food consumption of adult male and non-reproducing female bottlenose dolphins in the present study was around 1900 kg, and comparable to animals at Windsor Safari Park (Kastelein et al, 1998 d). Annual food consumption by individuals of similar age, however, varied by up to 1000 kg, owing to differences in body weight, activity level, and degree of participation in shows. Changes between years of u p to 500 kg per animal may have been caused by changes in social structure, or the level of participation in shows.
78

Food consumption of Atlantic bottlenose dolphins
A. 28 -24-
20-
16-
12-
•2 4 -ra > n . a>
U - 4 -
- 8 -
-12-
-16-
-20-
-24-
-28-I
Male 005 Age: 10-37 year T
*
T 1
1
c o '•S ra 1 Q
i J F M i \ M
B. 28 1 24-
20-
16-
12-
8 -
4 -n •
•A •
- 8 -
•12-
•16-
•20-
24-
28 -i
Female 007 Age: 7 -33 year
1 *
|
1 J
J J i \ S ( 3 N D Month
_
_.
T i
1
*
L
M M N D Month
Figure 007 (n
5. The percentage deviation in average monthly food intake of a) male 005 (« = 27 years) and b) female = 25 years). * Reduced amount of food offered for training purposes.
79

R.A. Kastelein et al.
•o o .Q
•a
A. 300
280-
— 260-E u w 240 H c 220-
200-
180-
160 S OT 140
120
100
Males Females
-i—i—i—i—i—r
10 15 i i
20 -i—i—i—r—i—i—i—i i i—r
25 30 35 40 Age (year)
a
I >. •o o BO
B 260i
240
220
200
180
160
140
120
100
80
60
40
20
0 • !
-i—i—i—i—i—i—r -i—i—i—i—i—i—i—r -i—i—i—i—i—i—r -i—i—r—i—i—i—r—i—i—i—i—i—i—i—i
10 15 20 25 30 35 40 Age (year)
Figure 6. Age versus standard body length (a) and body weight (b) for 7 male and 13 non-pregnant, non-lactating female bottlenose dolphins at Harderwijk Marine Mammal Park. The measurements of neonates were very similar and thus some overlap, so the sample appears lower than mentioned in the section "Body measurements".
80

Food consumption of Atlantic bottlenose dolphins
No difference was apparent between annual food consumption of male and non-pregnant, non-lactating females in the present study, again, in agreement with bottlenose dolphins at Windsor Safari Park, U.K. (Kas-telein et ah, 1998 d). After the age of 20 years, the annual food consumption of animals in the present study decreased slightly. Whether this decrease is due to the sample size or to a biological phenomenon is not clear.
Impact of reproduction on the food intake in females Although female bottlenose dolphins can be polyestrous, with an observed maximum of 3 cycles per year, most ovulations occur in spring (Kirby and Ridgway, 1984). Ovulation appears to be spontaneous, occurring in the absence of males (Ozharovskaya, 1990). At Sea World, females begin to breed successfully at the age of 8-9 years, with a calving interval of 2-3 years (Kasuya, 1985; Cornell et ah, 1987). The gestation period is 11.5 to 12 months (Essapian, 1963; Harrison, 1969; Cornell et ah, 1987). Calves are born all year round, with peaks in spring and fall (Cornell et ah, 1987).
Food consumption by females, as demonstrated in previous studies on bottlenose and Commerson's dolphins (Cephalorhyn-chus commersonii) (Kastelein et ah, 1993b; 1998 d) did not appear to change during pregnancy, although Reddy et ah (1994) suggest that consumption shows a slight increase shortly before delivery. Nonetheless, a 244 cm female fed ad lib. has been reported to increase in body weight by up to 37% (from 150 to 205 kg) in the last trimester of pregnancy (Spotte and Babus, 1980). The unchanged food intake of female odontocetes during pregnancy, despite the requirement of the growing foetus, may be explained by increased body size during pregnancy (McBride and Kritzler, 1951; Tavolga and
Essapian, 1957). The consequently lower surface area to volume ratio would be expected to reduce conductive heat loss. Energy for future milk production, stored as blubber during gestation, may increase the thermal insulation, thus further reducing energy loss to the environment. In addition, gestation may have caused hormonally-reg-ulated changes in metabolism.
Food consumption in females did not increase in the month after parturition, despite the energy requirement of lactation. This suggests that fat reserves were relied on to provide the calves with energy for growth, locomotion and thermoregulation. During the second month after birth, food consumption increased rapidly, suggesting female fat reserves were low. By the fifth month, food consumption of the mothers had decreased. Suckling time per day of a bottlenose dolphin calf has been shown to decrease rapidly after the age of 4 months (Cockcroft and Ross, 1990 b). This may be due to lower energy loss, resulting from a smaller surface area to volume ratio and a thicker blubber layer. Food consumption by female Commerson's dolphins shows a similar pattern, increasing greatly after parturition, and remaining high for about 6 months (Joseph et ah, 1987; Kastelein et ah, 1993 b).
The present study, and the one by Kastelein et ah (1998 d), show that the extra energy bottlenose dolphin mothers require during the entire suckling period depends, among other factors, on the length of the suckling period, and the age at which the calf begins to consume fish. The annual food intake of lactating females has previously been demonstrated to be about 1700 kg to 1800 kg higher than during non-lactating years, representing a food intake increase from 5.2 to 8.3% of body weight per day. Daily food consumption in the first 6 months of lacta-
81

R.A. Kastelein et al.
3
1 >> o m
270
240
210
180
150
120
90
60
30
•
•
•
•
-
-
• Males
1 r—
o Females
o
/ •
-*" • o*
,-*6
y = 12.904e0 0 1 7 ( x-1 0 0 '
100 120 140 160 180 200 220 240 260 280
Standard body length (cm)
Figure 7. Standard body length versus body weight for 7 male and 9 non-pregnant, non-lactating female bottlenose dolphins at Harderwijk Marine Mammal Park.
6
o
£_ 4
« .5" c ® -
8 * 3
s ° s* 2 >» ra •o 0 1 O) T
2
**. o
"
-
•
•
"*o.
• **..
• Males o Females
•
o ** • . o
" o o •-<?..
50 75 100 125 150 175 200 225 250 275 300 Body weight (kg)
Figure 8. Body weight versus the daily food consumption as a percentage of body weight for 3 male and 7 nonpregnant, non-lactating female bottlenose dolphins.
82

Food consumption of Atlantic bottlenose dolphins
01 a
•a a
0>
V
B B> "3 01 O s jp o B
B c < in
B 01 > B
B DO
O
o>
T3 T3
o> 60 <8
3 55 « ON
0
E •i—»
0 05 CO
0) CO Q.
"cC 0)
2
>» CO
T3
"5 0
E F
o *-» CO Q
+-» c o> 0 g
^^ c "E • * • — *
3 m 0 N 'w
^ ^ T3 0
* -0 > N
TJ
>-.v O)
>*.*: • o O CO
0 D) <
^ 0
T3 C 0
CD
"(0
E c <
" — » '
J— CO 0
,>.
T - i - n i n i n c o w m N n o i n c D r - T - n C N J C M C M C M C M O N I O N I C M
m in in w • ^ • c o c o ^ c D i r i i r i i n
. £ O ) C O C M 3 O > C 0 i - ( D m T - m o n T - t c o o
o d d T ^ d o d c d d d O N — I - - > - 0 - I - - I - T -
c o c o c o c o c o c o c o c o 0 ) 0 ) 0 ) 0 ) 0 5 0 5 0 ) 0 0 ) 0 ) 0 ) 0 ) 0 5 0 5 0 5 0 5
i i i i i i i i i n c o c D i n i n c D i n N o o o o o o o o
l i l l i i i i c O ' t o o s o o c M i n c o I - O T - T - I - O C M I -
05 CM N oo E = oo r -T— 1 ~ T—
T- O K CNI CO
CM I -
N—N— N — O T - N — 0 5 C 0 CO CO CO T - CO CO T-
CO
o o I N =
O 1^ i - o o o 1 1
= N N
m N o o o o CO CO
83

R.A. Kastelein et al.
tion has been shown to be 2 to 3 times higher than before delivery (Cockcroft and Ross, 1990 b; Reddy et al, 1994; Kastelein et al, 1998 d). Much energy expenditure is believed to be in milk, which has a fat content of 6 to 27% depending on sample timing (Ridgway et al, 1995).
Transition from milk to solid food The calves in the present study began to eat some solid food at the ages of 6 and 19 months. Previous observations vary from 7 to 15 months (Peddemors et al, 1992; Reddy et al, 1994).
In the present study suckling continued until the ages of 26 and 34 months. This is a little longer than in previous reports, which show that the suckling time per day decreased strongly after the age of 4 months, and calves were usually completely weaned by 18-20 months of age (McBride and Krit-zler, 1951; Essapian, 1953; Tavolga and Essa-pian, 1957; Tavolga, 1966; Tayler and Saay-man, 1972; Dudok van Heel and Mettivier-Meyer, 1974; Leatherwood, 1977; Prescott, 1977; Cockcroft and Ross, 1990 b; Peddemors et al, 1992). However, in most reports, the moment of weaning has been defined as the last time suckling was observed, whereas in the present study it was defined as the time at which food intake of the mother returned to the pre-reproduction level. Previous studies, therefore, may have missed occasional suckling bouts, and thus may have underestimated the length of the suckling period. Kastelein et al. (1998 d) used the same definition for weaning as used in the present study, and found lactation periods to vary between 14 and 37 months.
Seasonal fluctuations The lower food intake during the first half of the year, and higher intake during the second half may have been related to the show
season, from the beginning of March to the end of October. However, with the exception of the artificially reduced food intake in February, and the potential after effects, fluctuations in food intake in the present study were not caused by changes in fish availability. Although availability may have differed from that in the wild, the good physical condition of the animals suggested an adequate diet.
The fish used in the present study may have varied in composition and calorific content (Worthy, 1990), but due to irregular supply and storage patterns, such variations are unlikely to have caused the consistent seasonal fluctuations in food intake.
Body measurements At birth, the average body length of 116 cm for males and 114 cm for females, and body weights of 18.0 kg for males and 15.6 kg for females, fall within the range of observations for neonatal bottlenose dolphins from the northwest Atlantic Ocean, which averaged 117 cm and 21.2 kg (Mead and Potter, 1990). In the present study, no body measurements of animals between birth and weaning were available, as handling may interfere with lactation. Consequently, there are no records of lengths between 120 and 200 cm or body weights between 20 and 90 kg. Based on photographs, Cockcroft and Ross (1990 b) show a body length increase from 109 to 215 cm between birth and the age of 2.5 years.
In the present study, no significant difference in length was evident between males and females of similar age. This was also found to be the case in wild bottlenose dolphins from the northwest Atlantic Ocean (Mead and Potter, 1990). The body length of both sexes in the present study, however, appeared to reach an asymptote at about 280
84

Food consumption of Atlantic bottlenose dolphins
cm, longer than reported for most bottlenose dolphin populations investigated in the wild. Bottlenose dolphins from the Gulf of Mexico reached an asymptote at about 230 cm (Solangi and Dukes, 1983), from near Japan at about 280-290 cm (Kasuya et ah, 1986), from near Southern Africa at about 240 cm (Ross, 1977 and 1984) and from the northwest Atlantic Ocean at about 250 cm (12 years old) (Mead and Potter, 1990). In the eastern Gulf of Mexico, where most of the animals in the present study originated, male bottlenose dolphins reached asymptote at 265 cm (30 years old) and females at 250 cm (15 years old) (Read et al., 1993). The greater maximum body length in the present study may be due to the limited number of measurements from wild individuals over 20 years of age.
A spurt in weight gain in males was found at sexual maturity coinciding with a body length of 245 cm (Ridgway and Fenner, 1982). The animals in the present study were weighed and measured too infrequently to detect such a growth spurt. A discontinuity in weight gain in males has also been recorded between the ages of 10 and 15 years, although this may have been an artifact of a small sample size (Read et al., 1993). If the apparent growth spurt, however, is a biological phenomenon, it may be the result of an increase in testosterone level during puberty. Sexual maturity in males is reached between 10 and 15 years, and in females at 5 to 12 years of age (Sergeant et al., 1973; Odell, 1975; Mead and Potter, 1990). Unfortunately, body measurements in the present study were made too infrequently to allow the detection of a possible growth spurt at puberty.
Body shape in bottlenose dolphins, as in other mammals, shows variability with some individuals being naturally leaner or more robust than others (Ridgway and Fenner,
1982). The relationship of body length to body weight in the present study is similar to that found in wild bottlenose dolphins off the central Atlantic coast of the U.S.A. (Mead and Potter, 1990), and in individuals in captivity (Ridgway and Fenner, 1982).
Food consumption as a percentage of body weight A negative relationship was apparent between body weight and average daily food intake expressed as a percentage of body weight. Food intake per kg body weight in non-pregnant, non-lactating bottlenose dolphins has also been shown to decrease with age (Reddy et al, 1994). A previous study recorded a 177 kg female bottlenose dolphin consuming an average of 4.1% and a 159 kg female consuming 4.3% of body weight per day (Sergeant, 1969). These values are a little higher than expected from the present study for animals of those body weights, probably due to a less calorific diet. A calf of around 120 kg in human care between 1 and 2 years of age in its first year of eating fish, was reported to have an average daily food intake of around 4% of its body weight (Ped-demors et al, 1992). This is similar to values in the present study, for animals of that age.
The stomach content of a 253 cm (estimated 170 kg) wild Atlantic bottlenose dolphin was 6.3% of body weight (Barros and Odell, 1990). In the present study, animals of 170 kg consumed about 3.5% of body weight per day, suggesting that bottlenose dolphins may be able to consume more than their daily requirement in one meal, and thus may not need to eat every day. However, it is also possible that wild dolphins require more energy than captive individuals. Captive bottlenose dolphins have been reported with higher percentage food intakes than those of the present study. Individuals of average weight (180 kg) consumed 3.0 - 6.0% of body weight per day (Barros and Odell, 1990).
85

R.A. Kastelein et al.
Black Sea bottlenose dolphins consumed on average 5.6% of body weight per day (Sha-punov, 1971), and food intake of a non-pregnant 150 kg female varied between 5.3 and 6.5% of body weight per day (Spotte and Babus, 1980). These animals may have been growing strongly, or have had a lower calorific diet than the animals in the present study.
A positive relationship has been demonstrated between dolphin body weight and mean prey length, and between body weight and stomach volume (Cockcroft and Ross, 1990 a). This suggests that larger dolphins take larger prey. Average daily food consumption of animals in the present study was compared with the stomach volumes of animals of similar body mass reported by Cockcroft and Ross (1990 a). This showed that 60 kg animals must fill their stomachs 3 times a day to obtain their daily energy requirement, 100 kg animals twice a day, and animals weighing 140 kg or more, can obtain their daily requirement in one meal. In conjunction with previously discussed estimates from stomach content analysis (Bar-ros and Odell, 1990), this suggests that only the largest individuals will need to feed less than once a day.
Passage time of food through the digestive tract Although the sample size is small, the passage times of carmine red through the digestive tract of dolphins in the present study seem to agree with the body weight to passage time relationship of other odontocetes, for which data are available (Kastelein et al, 1993 a; 1994; 1997; 1998 a, b and c).
Ecological significance Differences between food intake reported in the present study and for wild animals of similar size, gender and reproductive state, are likely to be caused mainly by differences
in water temperature, digestibility and calorific content of food (Reddy et al, 1994), and the activity levels of the dolphins.
The thermoneutral zone, the water temperature range at which metabolic rate is lowest, of the bottlenose dolphin varies with the thickness of blubber (Williams and Friedl, 1990; Williams et al, 1992 b). As the bottlenose dolphin is found worldwide, in tropical and temperate waters, it is subjected to a wide range of water temperatures (Mead and Potter, 1989) with average monthly sea surface temperatures varying from 1.2 to 29.5°C (Fig. 9). Assuming that the species is optimally adapted to its distribution area, this will be the range in which the flexible thermoneutral zone lies. The water temperatures in which the animals in the present study were kept, lay within the range con-specifics can experience in the wild (Fig. 9). It can, therefore, be assumed that the study animals were maintained within their natural thermoneutral zone, and required the same amount of energy for thermoregulation as wild conspecifics.
As the bottlenose dolphin has one of the widest distributions of all odontocetes (Martin, 1990), its diet varies greatly with geographical area. The abundance of different fish species, however, may also vary seasonally and annually (Townsend, 1914; Gunter, 1942; Kemp, 1949; Hoglund, 1965; Hoese, 1971; Caldwell and Caldwell, 1972; Odell, 1975; Ross, 1977; Barros and Odell, 1990; Cockcroft and Ross, 1990 a; Corkeron et al, 1990; and Mead and Potter, 1990). It is, therefore, difficult to compare the diet of the animals in the present study with that of con-specifics in the wild. Nonetheless, the diet in the present study, consisting mainly of herring and mackerel, had a high calorific content, so it can be assumed that many wild conspecifics have a diet of a generally lower
86

Food consumption of Atlantic bottlenose dolphins
35
t? 30
2 3
s 2L E » >. c o E 0) o> m o > <
25
?n
15
10
5
Maximum sea surface (southern hemisphere)
Water at Harderwijk
Minimum sea surface
/
M M N D
Month
Figure 9. Average monthly water temperatures at the Harderwijk Park, and the minimum and maximum sea surface temperatures in the distribution area of wild bottlenose dolphins.
calorific value, and thus a higher food intake.
Although animals in the present study did not need to forage for food like their wild conspecifics, they swam almost constantly, exercised in play, and were active during training programmes and performances. At sea, this species has a cruising speed of 7.5 km /h r (Williams et ah, 1992 a), can maintain a maximum speed of 30 km /h r for several seconds (Lang and Norris, 1966) and has been shown to dive to depths of 300 - 500 m (Ridgway, 1986). Recently developed telemetry techniques have allowed the study of activity of wild cetaceans, revealing an adult wild female to have spent 87% of her time submerged, with an average dive duration of 26 s (Mate et ah, 1995). The cruising speed observed in the present study was similar to
that in the wild, but diving was limited by the depth of the pool.
On the basis of differences in diet and activity between animals in the present study and wild conspecifics, it appears that wild bottlenose dolphins probably consume more than the animals in human care. The food intake data, therefore, can be used only to calculate a conservative estimate of the amount of fish consumed by bottlenose dolphin populations in the wild.
Acknowledgements
We thank curator Teun Dokter, head trainer Jan Mosterd, and all the trainers and water maintenance crew for accurate record keeping over the years. We thank Marie- Franchise van Bressem and Adeline Kroll for part
87

R.A. Kastelein et al.
of the food consumption data analysis, Sas-kia Nieuwstraten for the collection of the carmine red data and Nicole Schooneman for calculating the average water temperatures.
Our thanks also to Rob Triesscheijn for drawing the figures and Eleanor Hayes and Nancy Vaughan (University of Bristol, U.K.), Janny Hardeman and Nicole Schooneman for their comments on the manuscript.
References
Barros, N.B. and Odell, D.K. (1990) Food habits of Bottlenose Dolphins in the Southeastern United States. In: The Bottlenose dolphin (Eds. Leatherwood, S. and Reeves, R.R.). Academic Press, Inc. New York, 309-328.
Caldwell, D.K. and Caldwell, M.C. (1972) The World of the Bottlenosed Dolphin. Lip-pincott, 157 pp.
Cates, M.B. and Schroeder, J.P. (1986) The nutrition of acclimated vs. newly captured Tursiops truncatus. Aquatic Mammals 12,17-20.
Cockcroft, V.G. and Ross, G.J.B. (1990 a) Food and feeding of the Indian Ocean Bottlenose Dolphin off Southern Natal, South Africa. In: The Bottlenose dolphin (Eds. Leatherwood, S. and Reeves, R.R.). Academic Press, Inc., New York, 295-308.
Cockcroft, V.G. and Ross, G.J.B. (1990 b) Observations on the early development of a captive bottlenose dolphin calf. In: The Bottlenose dolphin (Eds. Leatherwood, S. and Reeves, R.R.). Academic Press, Inc., New York, 461-478.
Corkeron, P.J., Bryden, M.M. and Hedstrom, K.E. (1990) Feeding by Bottlenose dolphins in Association with Trawling Operations in Moreton Bay, Australia. In: The Bottlenose dolphin (Eds. Leatherwood, S. and Reeves, R.R.). Academic Press, Inc., New York, 329-336.
Cornell, L.H., Asper, E.D., Antrim, J.E., Sear-les, S.S., Young, W.G. and Goff, T. (1987) Progress Report: Results of a Long- range Captive Breeding Program for the Bottlenose Dolphin, Tursiops truncatus and Tursiops truncatus gilli. Zoo Biology 6, 41-53.
Dudok van Heel, W.H. (1970) The Dolphinarium at Harderwijk. Int. Zoo Yearb. 10, 49-51.
Dudok van Heel, W.H. and Mettivier-Meyer, M. (1974) Birth in dolphins (Tursiops truncatus, Mont.) in the Dolfinarium Harderwijk, Netherlands. Aquatic Mammals 2(2), 11-22.
Dyke, D. van and Ridgway, S.H. (1977) Diets for marine mammals. In: Handbook Series in Nutrition and Food (Ed. Rechcigl, M.). CRC Press, Cleveland, 595-598.
Essapian, F.S. (1953) The birth and growth of a porpoise. Natural History Magazine, November, 616-624.
Essapian, F.S. (1963) Observations on abnormalities of parturition in captive bottle-nosed dolphins, Tursiops truncatus, and concurrent behaviour of other porpoises. J. Mammal. 44 (3), 405-414.
88

Food consumption of Atlantic bottlenose dolphins
Geraci, J.R. (1981) Dietary disorders in marine mammals: synthesis and new findings. JAVMA 179(11), 1183-1191.
Geraci, J.R. and St. Aubin, D.J. (1980) Nutritional disorders of captive fish-eating animals. In: Comparative Pathology of Zoo Animals (Eds. Montali, R.J. and Migaki, G.). Proc. Symp. Nat. Zoo Parks. Smithsonian Institute Press, Washington D.C., 41-49.
Gunter, G. (1942) Contributions to the natural history of the bottlenose dolphin, Tur-siops truncatus (Montagu) on the Texas coast, with particular reference to food habits. J. Mammal. 23(3), 267-276.
Harrison, R.J. (1969) Reproduction and reproductive organs. In: The Biology of Marine Mammals (Ed. Anderson, H.T.). Academic Press, London, 253-348.
Hinga, K.R. (1979) The food requirements of whales in the southern hemisphere. Deep-Sea Research, 26A, 569-577.
Hoese, H.D. (1971) Dolphin feeding out of water in a salt marsh. J. Mammal. 52(1), 222-223.
Hoglund, R. (1965) Porpoises feeding. Underwater Naturalist 3(2), 50-51.
Hurk, C.F.G.W. van de (1972) Observation on the basic nutrition, vitamins and food preparation in dolphins. Aquatic Mammals 1(2), 9-21.
Joseph, B.E., Antrim, J.E. and Cornell, L.H. (1987) Commerson's dolphin (Cephalorhyn-chus commersonii): A discussion of the first live birth within a marine zoological park. Zoo Biology 6, 69-77.
Kastelein, R.A., McBain, J. and Neurohr, B. (1993 a, chapter 2.12) Information on the biology of Commerson's dolphins (Cephalor-hynchus commersonii). Aquatic Mammals 19 (1), 13-19.
Kastelein, R.A., McBain, J., Neurohr, B., Mohri, M., Saijo, S., Wakabayashi, I. and Wiepkema, P.R. (1993 b, chapter 2.11) Food consumption of Commerson's dolphins (Ce-phalorhynchus commersonii). Aquatic Mammals 19(2), 99-121.
Kastelein, R.A., Ford, J., Berghout, E., Wiepkema, P.R. and Boxsel, M. van (1994, chapter 2.4) Food consumption, growth and reproduction of Belugas (Delphinapterus leucas) in human care. Aquatic Mammals 20(2), 81-97.
Kastelein, R.A., Hardeman, J. and Boer, H. (1997, chapter 2.13) Food consumption and body weight of harbour porpoises (Phocoena phocoena). In: The biology of the harbour porpoise (Eds. Read, A.J., Wiepkema, P.R. and Nachtigall, P.E.). De Spil Publishers, Woer-den, The Netherlands, 217-233.
Kastelein, R.A., Elst, C.A. van der, Tennant, H.K. and Wiepkema, P.R. (1998 a, chapter 2.10) Food consumption, growth, body dimensions and body temperatures of a female dusky dolphin (Lagenorhynchus obscu-rus).
Kastelein, R.A., Mosterd, J., Schooneman, N.M. and Wiepkema, P.R. (1998 b, chapter 2.5) Food consumption, growth, body dimensions and respiration rate of false killer whales (Pseudorca crassidens).
Kastelein, R.A., Neurohr, B., Nieuwstraten, S.H. and Wiepkema, P.R. (1998 c, chapter 2.8) Food consumption and body measurements of Amazon river dolphins (Inia geof-frensis).
89

R.A. Kastelein et al.
Kastelein, R.A., Nieuwstraten, S.H., Walton, S. and Wiepkema, P.R. (1998 d, chapter 2.7) Food intake and growth of Atlantic bottle-nose dolphins (Tursiops truncatus).
Kasuya, T. (1985) Effect of exploitation on reproductive parameters of the spotted and striped dolphins off the Pacific Coast of Japan. Sci. Rep. Whales Res. Inst. Tokyo 36, 107-138.
Kasuya, T., Tobayama, T., Saiga, T. and Ka-taoka, T. (1986) Perinatal growth of delphi-noids: information from aquarium reared bottlenose dolphins and finless porpoises. Sci. Rep. Whales Res. Inst. 37, 85-97.
Kemp, R.J. (1949) Report on stomach analysis from June 1,1949 - August 31,1949. An-nu. Rep. Mar. Lab. Texas Fish, Game Oyster Comm., Fiscal Year 1948-1949, pp. I l l , 112, 126, 127.
Kirby, V.L. and Ridgway, S.H. (1984) Hormonal Evidence of Spontaneous Ovulation in Captive Dolphins, Tursiops truncatus and Delphinus delphis. Rep. Int. Whal. Commn (Special Issue 6), 459-464.
Lang, T.G. and Norris, K.S. (1966) Swimming Speed of a Pacific Bottlenose Porpoise. Science 151 (3710), 558-590.
Leatherwood, S. (1977) Some preliminary impressions on the numbers and social behavior of free-swimming bottlenosed dolphin calves (Tursiops truncatus) in the northern gulf of Mexico. In: Breeding Dolphins: Present status, Suggestions for the Future (Eds. Ridgway, S.H. and Benirschke, K.), U.S. Marine Mammal Commission Report MMC-76/07, Washington D.C., 143- 147.
Martin, A.R. (1990) Whales and dolphins. Salamander Books, Ltd. London, 136 pp.
Mate, B.R., Rossbach, K.A., Nieukirk, S.L., Wells, R.S., Irvine, A.B., Schott, M.D. and Read, A.J. (1995) Satellite-monitored movements and dive behavior of a Bottlenose dolphin (Tursiops truncatus) in Tampa Bay, Florida. Marine Mammal Science 11(4), 452- 463.
McBride, A.F. and Kritzler, H. (1951) Observations on pregnancy, parturition, and postnatal behaviour in the bottlenose dolphin. J. Mammal. 32, 251-266.
Mead, J.G. and Potter, C.W. (1989) Natural history of Bottlenose dolphin along the central Atlantic coast of the United States. In: The Bottlenose dolphin (Eds. Leatherwood, S. and Reeves, R.R.). Academic Press, Inc., New York, 165-195.
Mead, J.G. and Potter, C.W. (1990) Natural history of Bottlenose dolphins along the central Atlantic coast of the United States. In: The Bottlenose dolphin (Eds. Leatherwood, S. and Reeves, R.R.). Academic Press, Inc., New York, 165-195.
Odell, D.K. (1975) Status and aspects of the life history of the bottlenose dolphin, Tursiops truncatus, in Florida. J. Fish. Res. Board Can. 32, 1055-1058.
Ozharovskaya, L.V. (1990) The Female Reproductive Cycle of black Sea Bottlenose Dolphins as Revealed by Analysis of Plasma Progesterone Levels. Rep. Int. Whal. Commn. 40, 481-485.
Peddemors, V.M., Fothergill, M. and Cock-croft, V.G. (1992) Feeding and growth in a captive-born bottlenose dolphin Tursiops truncatus. S.-Afr.Tydskr.Dierk. 27(2), 74-80.
90

Food consumption of Atlantic bottlenose dolphins
Prescott, J. (1977) Comments on captive births of Tursiops truncatus at Marineland of the Pacific (1957-1972). In: Breeding Dolphins: Present status, suggestions for the future (Eds. Ridgway, S.H. and Benirschke, K.). Final Report - MMC 76/07. Marine Mammal Commission, 71-76.
Read, A.J., Wells, R.S., Hohn, A.A. and Scott, M.D. (1993) Patterns of growth in wild bottlenose dolphins (Tursiops truncatus). J. Zoology, London 231, 107-123.
Reddy, M., Kamolnick, T., Curry C , Skaar, D. and Ridgway, S. (1994) Energy requirements for the Bottlenose dolphin (Tursiops truncatus) in relation to sex, age and reproductive status. Marine Mammals: Public Display and research 1(1), 26-31.
Ridgway, S.H. (1986) Diving by cetaceans. In: Diving in Animals and Man (Eds. Bru-bakk, A.O., Kanwisher, J.W. and Sundness, G.). The Royal Norwegian Soc. of Science and Letters, Trondheim, Norway, 33-62.
Ridgway, S.H. and Fenner, C.A. (1982) Weight-length relationships of wild-caught and captive Atlantic bottlenose dolphins. JAVMA 181(11), 1310-1315.
Ridgway, S.H., Kamolnick, T., Reddy, M., Curry, C. and Tarpley, R. (1995) Orphan-induced lactation in Tursiops and analysis of collected milk. Marine Mammal Science 11 (2), 172-182.
Ross, G.J.B. (1977) The taxonomy of bottle-nosed dolphins Tursiops species in South African waters, with notes on their biology. Ann. Cape Prov. Mus. (Nat. Hist.) 11(9), 135-194.
Ross, G.J.B. (1984) The smaller cetaceans of the south-east coast of southern Africa. Ann. Cape Prov. Mus. (Nat. Hist.) 15(2), 173-410.
Sergeant, D.E. (1969) Feeding rates of ceta-cea. Fisk. Dir. Skr. Ser. Havunders 15, 246-258.
Sergeant, D.E., Caldwell, D.K. and Caldwell, M.C. (1973) Age, Growth, and Maturity of Bottlenosed Dolphin (Tursiops truncatus) from Northeast Florida. Journal Fisheries Res. Board of Canada 30(7), 1009-1011.
Shapunov, V.M. (1971) Food requirements and energy balance in the Black Sea bottlenose dolphin (Tursiops truncatus ponticus Ba-rabasch). In: Morphology and Ecology of Marine Mammals (Eds. Chapskii, K.K. and Sokolov, E.E.), 207-212. Israel Program for Scientific Translations, Jerusalem.
Solangi, M.A. and Dukes, G.E. (1983) Atlantic bottlenose dolphin, Tursiops truncatus, herd studies in the Mississippi Sound, U.S.A.: Capture, freeze marking and biological sampling. Fin. Rep. Natl. Mar. Fish. Serv. Contract No. NA82-GA-C-00023. xi + 178 pp.
Spotte, S. and B. Babus (1980) Does a pregnant dolphin (Tursiops truncatus) eat more? Cetology 39, 1-7.
Tavolga, M.C. (1966) Behaviour of the bottlenose dolphin (Tursiops truncatus); Social interactions in a captive colony. In: Whales, Dolphins and Porpoises (Ed. Norris, K.S.) University of California Press, Berkeley and Los Angeles, 718-730.
91

R.A. Kastelein et al.
Tavolga, M.C. and Essapian, F.S. (1957) The behaviour of the bottlenosed dolphin (Tur-siops truncatus): Mating, pregnancy, parturition and mother-infant behaviour. Zoolog-ica 42(1), 11-34.
Williams, T.M., Friedl, W. A., Fong, M.L., Ya-mada, R.M., Sedivy, P. and Haun, J.E. (1992 a) Travel at low energetic cost by swimming and wave-riding bottlenose dolphins. Nature 355, 821-823.
Tayler, C.K. and Saayman, G.S. (1972) The social organisation and behavior of dolphins (Tursiops aduncus) and baboons (Papio ursi-nus): some comparisons and assessments. Ann. Cape Prov. Mus. (Nat. Hist.), 9(2), 11-49.
Williams, T.M., Haun, J.E., Friedl, W.A., Hall, R.W. and Bivens, L.W. (1992 b) Assessing the thermal limits of bottlenose dolphins: a cooperative study by trainers, scientists, and animals. IMATA Soundings Fall 1992, 16-17.
Townsend, C.H. (1914) The porpoise in captivity. Zoologica 1(16), 289-299, 9 plates.
White, J.R. (1970) Thiamine deficiency in an Atlantic bottlenosed dolphin (Tursiops truncatus) on a diet of raw fish. JAWMA 157, 559-562.
Worthy, G.A.J. (1990) Nutritional energetics of marine mammals. In: CRC Handbook of Marine Mammal Medicine: Health, Disease, and Rehabilitation (Ed. Dierauf, L.A.). CRC Press, Boston, 489-520.
Williams, T.M. and Friedl, W.A. (1990) Heat flow properties of dolphin blubber: insulating warm bodies in cold water. American Zool. 30(4), 191.
92

1
Chapter 2.7
Food intake and growth of Atlantic bottlenose dolphins (Tursiops truncatus)
R.A. Kastelein1, S.H. Nieuwstraten1, S. Walton2 and P.R. Wiepkema3
Harderwijk Marine Mammal Park, Strandboulevard Oost 1, 3841 AB Harderwijk, The Netherlands
2 Marineland Limited, White Rocks, Bahar ie Caghaa NXR 08, Malta
3 Emeritus Professor of Ethology, Wageningen Agricultural University, Stationsweg 1, 6861 EA Oosterbeek, The Netherlands
Summary
Food consumption, body length and weight of 11 Atlantic bottlenose dolphins at Windsor Safari Park, UK (1979-1993/94) and Harderwijk Marine Mammal Park, The Netherlands (1993/94-1995) are reported. The average annual food consumption of adult males and nonpregnant, non-lactating females was around 2000 kg of fish. Food consumption showed little increase during gestation, but was 58 to 97% higher during suckling periods than during similar periods in non-reproductive years. In all 6 cases, the calves began to eat solid food within a year of birth although suckling continued for 14 to 37 months of age. The pattern of food intake of the mothers and calves varied substantially from suckling period to suckling period. No seasonal changes in food consumption were detected, although there were small seasonal changes in water temperature. Births occurred at various times of year, so the timing of mating will also have varied between years. From the few available weight measurements, the animals appeared to increase rapidly in body weight during the first 4 years of life, after which growth rate decreased. Adults of both sexes weighed around 260 kg. The relationship between standard body length (in cm) and body weight (in kg) can be expressed as body weight = 17.261 e00156*0^ '^h-ioro Animals weighing 155 to 225 kg consumed between 2 and 4% of their body weight per day.
Key words: odontocetes , energetics, r eproduc t ion , lactation, wean ing
Introduction 1914; Gunter, 1942; Kemp, 1949; Hoglund, 1965; Hoese, 1971; Caldwell and Caldwell,
Although the bottlenose dolphin (.Tursiops 1972; Odell, 1975; Ross, 1977; Barros and truncatus) is the most widely kept toothed Odell, 1990; Cockcroft and Ross, 1990 a; Cor-whale in the world, little is known of its keronefaZ., 1990 and Mead and Potter, 1990). feeding habits. In the wild, diet composition may vary with season, geographical loca- Although these studies have provided in-tion, age and sex and, in case of females, formation on the prey species taken, limited reproductive status. Variations in food con- data is available on the energetic require-sumption between sexes are likely, as males ments of bottlenose dolphins (McBride and and females often live in separate groups, Kritzler, 1951; Essapian, 1953; Tavolga, 1966; and may inhabit quite different parts of the Sergeant, 1969; Shapunov, 1971; Prescott, distribution area of the species (Townsend, 1977; Hinga, 1979; Spotte and Babus, 1980;
93

R.A. Kastelein et al.
Cockcroft and Ross, 1990 a; Peddemors et ah, 1992; Kastelein et ah, 1998). Most studies are based on one or very few animals, over a short period of time. In addition, the environmental parameters (such as water temperature and diet) are often not reported. Food consumption, body size and weight measurements of toothed whales could be of use to zoological parks which keep odonto-cetes, providing a reference for veterinary and husbandry purposes. In the management of an odontocete species in the wild, information on food consumption is necessary for the evaluation of its relationship with prey populations. The data could form the basis for the management programme of the prey species by allowing for sufficient food for a desirable number of toothed whales in a particular geographical area.
Windsor Safari Park, U.K., has housed Atlantic bottlenose dolphins since 1969 and accurate daily food records have been kept since 1979. When the park closed in 1993, the resident animals were moved to the Harder-wijk Park, The Netherlands. This paper describes the food consumption and growth of the animals at both parks between 1979 and 1995.
Materials and methods
Study animals Sex, estimated birth date, origin, and study period of each of the 11 Atlantic bottlenose dolphins (Fig. 1) was recorded (Table 1). Age estimates were based on body size, and the younger an animal was on arrival, the more
=:iSfc-:.. :!§!£: r.^-S "l' £
v < •#>&&'
Figure 1. Two of the Atlantic bottlenose dolphins for which the food consumption is described in this study (Photo: Henk Merjenburgh).
94

Food intake of Atlantic bottlenose dolphins
3
13
.s x, T3
O c
o X>
a;
•8
4= a ) CO Q.
E CO
Q
2 CO
> CO V= CO < -D
C
o
CD O
0 n c CD O
CO
I* < 8
m m m c o w m c o i f i - i - i n m 0)0505000)0)0)050500) 0)0)0)00)0)0505050505
1 O N o
i O h-O
i O N O
i O t^ o
i
00 O
s O
1
m CO O
i O CO O
1
O CO O
1 CM O O
1 CO O O
CO CM CO CM CM CO O O O O O O o o o o o o CO CO CO CO CO CO
5 5 5 5 5 P P P P P P
If3 o o CO
m o o CO
o o o o o o o o o o o o CO CO CO CO CO CO
5 5 5
O O CM CD |s» 1 ^ 05 0 ) 0 5
CO CO CO
o o o LL U . LL
CO CO CD O O) O) I— T— T—
5
fc o
1 1
£ O) 1 —
S f F F F F f
o CO o> ~~ • • 1 • I I
o o o o o o o o CO CO CO CO CO CO •rj TJ TJ TJ T3 T3 T3 g .g .g .g .g .g .g
•* in o o CM co CO CO CO CO O) O) 05 0 ) 0 5 0 ) 0 ) 0 5
CD CD CO O CO CM £ O o o ••- O O r^ i i i i i i O) O CM t O N O T- O CM CM CO O CM
^ U - U - L J - S 2 ^ 2
i -CMco^rmcoh-00050- i -o o o o o o o o o - > - - > -o o o o o o o o o o o cocococococococotococo
£MMMMM
accurate the age estimate. Animals 004, 007 and 009 died during the year after the end of their study period (Table 1). When Windsor Safari Park was closed in 1993, the animals were moved to Harderwijk in 3 groups, calves dependent on milk remained at Windsor with their mothers until they were dependent mainly on fish. The first group, males 001,005,006 and 007, was transported to Harderwijk in February 1993, male 008 in October 1993, and the third shipment, consisting of female 002 with calf 010 and female 003 with calf Oil, was in January 1994.
Because the animals arrived at Windsor at different ages, and times, were born in different years, and some died before 1995, the number of years for which food intake is available varies between individuals. Body measurements were made infrequently, for instance before transport or during pool maintenance. The animals were in good health throughout their study periods. At both parks, the animals participated in shows (maintaining trained behaviour) or training programmes (teaching new behaviours) all year.
Study area At Windsor Safari Park (0°39' W and 51°29' N) the animals were kept in an outdoor pool system consisting of a rectangular main pool (26 m x 14 m, 3.5 m deep), a rectangular side pool (10 m x 7.6 m, 3 m deep) and an oval pool (26 m x 12.5 m, 3.5 m deep). The dolphins were kept with a female killer whale (Orcinus orca). For most of the year, the males were housed separately, although after sexual maturity, the females were kept with mature males 001 and 005 for part of the year. The average monthly water temperature varied between 15.1 and 21.2°C; when it dropped below 14°C, the water was heated (Fig. 2). Annual average water temperature was around 18°C between 1981 and
95

R.A. Kastelein et al.
25
U ~ 20 £ 3
s 1 15 >.
i 10 o E o o> 2 5 I
' •
-
• T"~~^ / Water '
at Windsor .,
s
1 1 1 r—
Water at Harderwijk
^ ^ - ^ - - /
xAir S at Windsor "V
1 1 1 1 1 1 1 1
J F M A M J J A S O N D
Month
Figure 2. Average monthly water and air temperatures at Windsor Safari Park and the average monthly water temperature at Harderwijk Marine Mammal Park.
1987, and around 16°C from 1987-1995. The average monthly air temperature varied between 4.3°C in January and 17.7°C in July (Fig. 2). The salinity was maintained between 2.2 and 3.4% NaCl, with changes being unrelated to season.
At the Harderwijk Park (5°37' E and 52°20' N) most of the study animals were kept indoors in a main pool (30 m x 15 m, 4 m deep) with 2 adjacent holding pools (9 m diameter, depths 2.9 m and 4 m). These pools were connected by a canal to another complex consisting of an outdoor main pool (21 x 7.5 m, 3 m deep) and 4 indoor holding pools (Dudok van Heel, 1970). The females from Windsor with calves were kept in the rectangular outdoor pool, while the other Windsor animals were kept with bottlenose dolphins already present at the park in the rest of the pool system. The average monthly water
temperatures varied between 17°C in February and 22°C in August, with an annual average of 20°C (Fig. 2). The air temperature varied between approximately 0°C and 30°C. When indoors, the animals were exposed to the natural daily light cycle through windows in the roof. The salinity varied non-seasonally between 2.0 and 2.5%.
Food At Windsor Safari Park, the animals were fed 3-7 times per day on a diet of, on average, 65% herring (Clupea harengus), 30% mackerel (Scomber scombrus) and 5% squid (Illex spp.), by weight, until 1991, and 60% herring and 40% mackerel thereafter. Ratios of the fish species varied with availability. Vitamins (Aquavits ®) and iron tablets were added to the fish, after defrosting. The frozen fish was stored for a maximum period of 4 months. The animals were fed ad lib. at the end of the
96

Food intake of Atlantic bottlenose dolphins
day: feeding was ended when an animal lost interest or started to play with the fish. At the beginning of 1992, the park was closed and the animals did not perform in shows, and were fed ad lib. each meal.
At the Harderwijk Park, the animals were fed 3-5 times per day on a diet of, on average, 30% herring, 30% mackerel, 15% whiting (Merlangius merlangus), 20% sprat (Sprattus sprattus) and 5% squid, by weight. Ratios of fish species, however, varied with availability. Vitamins (Seavit ®) were added to the fish, after defrosting. The frozen fish was stored for a maximum of 4 months. During the last feed of the day, the animals were fed ad lib., until the fish was not eaten immediately or was played with.
Records were kept of the amount and type of food consumed during each feed, although daily food intake forms the basic unit in the present study. Only records from full calendar years were used.
Results
Annual food consumption
Males Males 006, 007, 008 and 011 began to eat solid food during the first calendar year after birth (Fig. 3 a, b, c and d), and their annual food intake increased to around 2000 kg at the age of 3-4 years, after which it stabilized. Food intake patterns during suckling are described later. During the last year at Windsor, annual food intake was several hundred kilograms above average, except for calf 011, which was still suckling. At Harderwijk, annual food intake returned to a more normal level.
Male 001 arrived at Windsor at the age of 6 years, although food intake records are only
available from the age of 16 years. Until the age of 19 years, his food intake averaged 1900 kg/year, decreasing slightly thereafter to stabilize at around 1700 kg/year, with the exception of a small increase in the last year at Windsor (Fig. 3 e). He bred successfully for the first time at the age of 20 years, after being for 14 years at the park (Table 1).
Male 005 was 6 years of age on arrival at Windsor. During his first full calendar year at the park food intake was around 1500 kg/year. The records for the following 3 years are incomplete, as he spent part of each year at Scarborough, UK, where he participated in shows. After 11 years of age, his annual food intake was around 2300 kg, although this increased dramatically during the last year at Windsor, after which it declined to 1800 kg/year (Fig. 3 f). Although he was housed for part of each year with females, it is not certain whether he mated during the study period (Table 1).
Females Female calves 009 and 010 began to eat fish during the first calendar year after birth. Food intake increased to around 1400 kg during their second year (Fig. 4 a and b).
On arrival at Windsor, female 004 was 6 years old, although food records are only available from 1979, when she was 8 years old. Annual average food intake was around 1700 kg/year, until the age of 14 years (Fig. 4 c). At the age of 15 years, she gave birth to a calf in July, which died after a week. During this year, her intake increased to around 2500 kg, after which it decreased and stabilized around 2000 kg/year.
Female 002 arrived at Windsor at 3 years of age, but food intake records are only available from 12 years of age. Until the age of 18 years, she consumed around 1900 kg per
97

A.
6000 n
5000
4000
3000
2000-
1000
R.A. Kastelein et al.
Male 006 (calf of female 003)
To Harderwljk
0 1 2 3 4 5 6 7 8 9 10 11 1 Age (year)
1984
B. 6000
i 5000 c o S 4000 E 3
s o 3000
£ 2000
3 c 1000
< 0
Male 007 (calf of female 002)
To Harderwijk
0 1 2 3 4 5 6 7 8 1 Age (year)
1985
6000 I
3 5000 • c o
con
sum
pt
i i
o
o
foo
d
o
o
o
g
An
ni
o
o
o
Male 008 (cal of female 003)
To Harderwijk
1
0 1 2 3 4 5 6 | Age (year)
1989
98

Food intake of Atlantic bottlenose dolphins
D 6000 n
S> sooo
£ 4000 E 3 M g 3000
5 2000
1000
Male 011 (calf of female 003)
To Harderwljk
0
t 1993
1 2 Age (year)
sooo-
5000
4000-
3000
2000-
1000-
Male 001
To Harderwljk
I
16 17 18 19 20 21 22 23 24 25 26 27 28 29 30 31 32
f Age (year)
6000
a. sooo-
Q
O
5 o
uopdw
nsu
o:
o
Ann
ual
o
9 O
Male 005
©
7 8 9
T 1981
10 11 12 13 14 15 16
To Harderwljk
17 18 19 20 21
Age (year)
Figure 3. Annual food consumption of male bottlenose dolphins 006 (a), 007 (b), 008 (c), 011 (d), 001 (e), and 005 (f). 1) A period in which the animal was at Scarborough during part of the year. The records from that period are incomplete. The location of the arrow indicates the moment of the year when the transport to Harderwijk took place.
99

R.A. Kastelein et al.
6000
3 5000 •
mp
tlon
§ 3 « C 8 3000
nual
foo
d
< 1000-
Fwnala 009 (calf of famate 002)
I 1 2 Age (year)
B. 6000-,
2000
Female 010 (calf of tomato 002)
0 1 2 3 f Age (year)
1992
C. 6000
5000
4000
3000
2000
1000
Female 004
©
8 9 10 11 12 13 14 15 16 17 f Age (year)
1979
100

Food intake of Atlantic bottlenose dolphins
D. 6000 i
5000-
4000
3000-
2000
1000
Female 002
Birth 007 Birth
009 Birth 010
To Hardorwijk
12 13 14 15 16 17 18 19 20 21 22 23 24 25 26 27 28
T Age (year) 1979
E. 6000
5000
4000-
3000-
2000
1000
Female 003
Birth 011
Birth 008
Birth 006
To Harderwljk
12 13 14 15 16 17 18 19 20 21 22 23 24 25 26 27 28
f Age (year) 1979
Figure 4. Annual food consumption of female bottlenose dolphins 009 (a), 010 (b), 004 (c), 002 (d) and 003 (e). The location of an arrow indicates the moment of the year when the transport to Harderwijk took place and when the births occurred. 1) Birth of a calf on 28 July which died after a week.
year, a similar value to that of later non-lactating years. Annual food intake was hardly affected by pregnancy, but rose during suckling periods to 3300-3500 kg per year (Fig. 4 d). The exact values depended, among other things, on the time of the year at which she gave birth (see arrows which indicate these times). At the ages of 18, 22 and 25 years, she delivered a calf.
Female 003 was 5 years of age when she arrived at Windsor. Her records began in
1979 when she was 12 years old. She consumed around 1700 kg/year until the age of 17 years (Fig. 4 e), although intake in later, non-lactating years was around 2000 kg per year. Pregnancy had no clear effect on annual food intake, which rose during suckling periods to 2900-5000 kg per year (Fig. 4 e). The extreme high annual intake during her 26th year coincided with a delivery very early in the year and the last year at Windsor. At the ages of 17, 22 and 26 years, she gave birth to a calf.
101

R.A. Kastelein et al.
In general, the animals showed an increase in annual food intake until the age of around 4 years, after which it stabilized at around 2000 kg of fish per year (Fig. 5). There were no apparent systematical differences in annual food consumption between males and non-reproductive females.
Females and calves The monthly food intake of female 002 during the months before and after the birth of her 3 calves is shown in figures 6, 7 and 8. Immediately after the birth of a calf, food intake of the mother doubled, after which it decreased gradually to the normal values for this female, as indicated by a dashed horizontal line (representing the average monthly level of this female outside the lactation period). As it was difficult to date the last suckling session, the end of the weaning process was defined as the time at which the
monthly food consumption of the mother returned to a level similar to that in non-reproductive years. Using this definition, calf 007 suckled for 35 months, calf 009 for 14 months, and calf 010 for 26 months. Food intake of the female during the period before each birth varied from approximately half the normal level (Fig. 8), to around twice the normal level (Fig. 7). The calves started to eat fish 8-18 months after birth, and this intake rapidly increased to levels of 100-125 kg per month. With respect to food intake by the mother or fish intake by the calf, each case has its own specific characteristics (Figs. 6,7 and 8 and Table 2).
The monthly food intake of female 003 for the months before and after the birth of her 3 calves are shown in figures 9,10 and 11. As in female 002, food intake increased sharply immediately after birth, but the pattern
-+- Male 001 -x- Male 008 -o- Female 004
-+- Male 005 -x-Male 011 -o- Female 009
Male 006 Female 002 Female 010
Male 007 Female 003
0 2 4 6 8 10 12 14 16 18 20 22 24 26 28 30 32 34
Age (year)
Figure 5. Annual food consumption of 6 male and 5 female bottlenose dolphins at Windsor Safari Park and one year at Harderwijk. Data points of each individual are connected by lines. * A year during which a calf was born and suckled. + A year during which a calf was suckled.
102

Food intake of Atlantic bottlenose dolphins
thereafter differs somewhat. As in female 002, there was a gradual decrease in intake after the initial peak (Fig. 10), followed either by a second peak (Fig. 9), or a continuously high intake (Fig. 11), then a decrease towards the end of the suckling period. As with female 002, the patterns of food intake differed substantially between births. The durations of the suckling periods of the 3 calves were 37 months for calf 006, 19 months for calf 008, and 17 months for calf 011. Food intake of the female in the months preceding parturition tended to be above average. There was little variation in the timing of the first intake of fish by the calves (9-12 months), rate of increase of intake or the final level of food consumption at complete weaning (Figs. 9,10 and 11 and Table 2).
Seasonal food intake fluctuations No seasonal changes in food consumption were detected, although there were small seasonal changes in water temperature (Fig. 2) and the animals were kept outdoors, exposed to the natural light cycle. In 3 of the 6 cases, food consumption of females 002 and 003 was little or non-existent for 2-5 days, around 12 months before parturition. This probably indicated oestrus. Calves were born at various times of the year (Table 1).
Body measurements Although none of the animals were measured over a long period, both sexes appear to show a rapid increase in body length during the first 4 years of age, with little subsequent increase (Fig. 12). Few animals were weighed and measured at the same time. The relationship between standard body length (in cm) and body weight (in kg) can be expressed as: body weight = 17.261e00156(body iength-ioo). One data point per animal is used (Fig. 13).
Food consumption as a percentage of body weight For those animals that were weighed, the daily food consumption (average for the month in which the body weight was measured) as a percentage of body weight was calculated. There appears to be a negative relationship between body weight and daily food consumption as a percentage of body weight (Fig. 14). One data point per animal is used.
Discussion and conclusions
Annual food consumption of males and nonpregnant, non-lactating females The 6 animals born at Windsor began to eat fish during the first calendar year after birth, and suckled for 14 to 37 months. They showed a rapid increase in food intake until the age of 4 years, after which it stabilized. The annual intake of males and non-lactating females was similar.
At the Harderwijk Park, annual food intake of bottlenose dolphins was similar to that at Windsor (Kastelein et al., 1998), although the average annual water temperature was 2 to 4°C higher. The temperature difference, therefore, does not appear to have an effect on food intake, suggesting that the water temperatures at both parks were within the thermoneutral zone of the dolphins.
Influence of reproduction on food intake Male 001 bred successfully for the first time at the age of 20 years, after he had been at the park for 14 years, during which time he was probably sexually mature for 5 to 10 years. Wild male bottlenose dolphins reach sexual maturity between the age of 10 and 15 years (Sergeant et al., 1973; Odell, 1975).
Female 004 bred successfully for the first time when she was 14 years of age, after 9 years at the park, female 002 at 17 years of
103
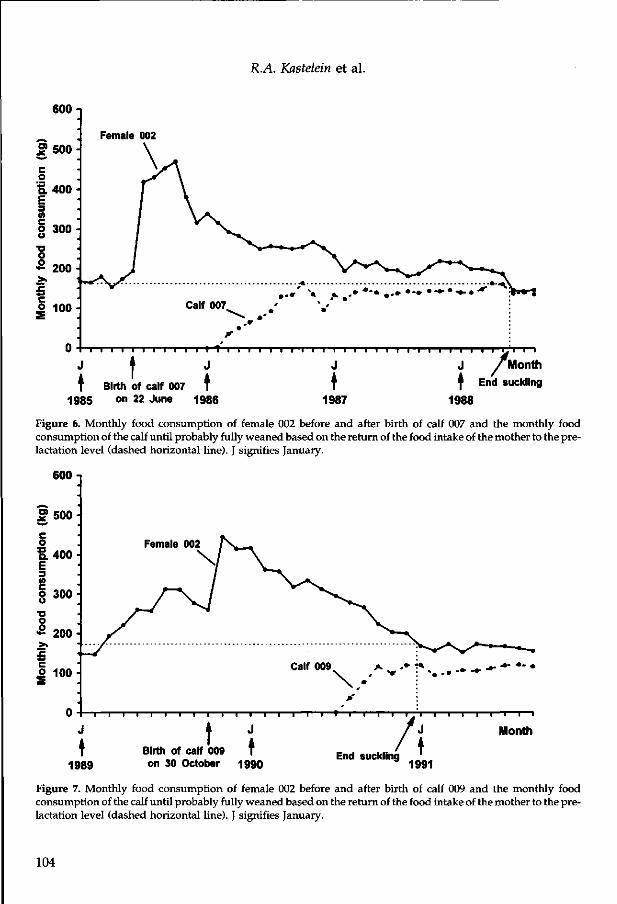
R.A. Kastelein et al.
600
J 100
i i i i i i i i i i i t t i i i i i i i i i i i i i i i i i i i i i i i i i i 1.1 i i
J • J J J / M o n t h
t Birth of calf 007 t t t E n d 8ucklin9 1985 on 22 June 1986 1987 1988
Figure 6. Monthly food consumption of female 002 before and after birth of calf 007 and the monthly food consumption of the calf until probably fully weaned based on the return of the food intake of the mother to the pre-lactation level (dashed horizontal line). J signifies January.
600 i
End suckling
Figure 7. Monthly food consumption of female 002 before and after birth of calf 009 and the monthly food consumption of the calf until probably fully weaned based on the return of the food intake of the mother to the pre-lactation level (dashed horizontal line). J signifies January.
104

Food intake of Atlantic bottlenose dolphins
600
J
t 1992
T—i—i—i—i—r
Birth of calf 010 T on 2 August 1993
i—i—i—i—i—i—i—i—i—i—i—i—i—i—i—I—T—r
J
t 1994
-I—i—i—I—rp—i
month
End suckling
Figure 8. Monthly food consumption of female 002 before and after birth of calf 010 and the monthly food consumption of the calf until probably fully weaned based on the return of the food intake of the mother to the pre-lactation level (dashed horizontal line). J signifies January.
600-1
u I f,MT" i • i i" i i' i' r ""i" i i i i i f i • i i i T*^~^^p"
j • j j f Birth of calf 006 T T
1984 on 8 June 1985 1986
Month
1 9 g 7 End suckling
Figure 9. Monthly food consumption of female 003 before and after birth of calf 006 and the monthly food consumption of the calf until probably fully weaned based on the return of the food intake of the mother to the pre-lactation level (dashed horizontal line). J signifies January.
105

R.A. Kastelein et al.
6OO-1
| 100
-i—i—i—i—i—i—i—i—i—i—i—i t f i—i—i—i—i—i—r—1—i—r^i—i—i
J 4 J J \ Month
t Birth of calf 008 T T End 1989 on 24 June 1990 1991 suckling
Figure 10. Monthly food consumption of female 003 before and after birth of calf 008 and the monthly food consumption of the calf until probably fully weaned based on the return of the food intake of the mother to the pre-lactation level (dashed horizontal line). J signifies January.
600-1
J
t 1992
t 1993
Birth of calf 011 on 20 February t
1994
Month 4
End suckling
Figure 11. Monthly food consumption of female 003 before and after birth of calf 011 and the monthly food consumption of the calf until probably fully weaned based on the return of the food intake of the mother to the pre-lactation level (dashed horizontal line). J signifies January.
106

Food intake of Atlantic bottlenose dolphins
age, after 14 years at the park, and female 003 at 16 years of age, after 11 years at the park. Female bottlenose dolphins at Sea World, USA, became sexually mature at 8-9 years of age (Cornell et al., 1987). After attaining sexual maturity, the females in the present study were kept with the sexually mature males 001 and 005 for part of the year. This suggests either that females bred successfully for the first time 4-7 years after sexually maturing, or that they became sexually mature at a later age than females at Sea World.
The calves in the present study were born in February, June, August and October. This agrees with previous information, that female bottlenose dolphins are polyestrous, with an observed maximum of 3 cycles per year (Kirby and Ridgway, 1984). They appear to be spontaneous ovulators, ovulating also in absence of males (Ozharovskaya, 1990). Pregnancy lasts for 11.5 to 12 months (Essapian, 1963; Harrison, 1969; Dudok van Heel, 1974; Cornell et al, 1987) with a calving interval of 2-3 years (Kasuya, 1985; Cornell et al, 1987).
The annual food intake of the females in the present study did not increase noticeably during pregnancy, despite the demands of the growing foetus. The same phenomenon was observed in pregnant females at the Harderwijk Park (Kastelein et al., 1998). Pregnant females show an increase in body size (Tavolga and Essapian, 1957; McBride and Kritzler, 1951), which is, in part, caused by an increase in blubber thickness. A 244 cm long pregnant female bottlenose dolphin, allowed to feed ad lib., was reported to increase 37% in body weight (from 150 to 205 kg) during the last trimester of pregnancy, although average food consumption was no higher than in previous, non-reproductive years (Spotte and Babus, 1980). This sug
gests an increase in blubber thickness, as new-born calves weigh only around 20 kg (Kastelein et al., 1998) and the combined weight of the placenta and amniotic fluid probably less than 10 kg. An increase in blubber thickness would probably reduce the energy loss to the surrounding water, thus lowering the energy requirements of the pregnant female. No change in food requirements during gestation was also observed in Commerson's dolphins (Cephalor-hynchus commersonii), but following parturition, the food consumption of the mother increased sharply, remaining at a level higher than in non-lactating periods for about 6 months (Joseph et al, 1987; Kastelein et al, 1993).
The food consumption of reproducing females in the present study generally increased during lactation, as in females at Harderwijk (Table 2; Kastelein et al, 1998). Six captive female bottlenose dolphins were reported to consume between 129 to 204% more during the first 6 months of lactation than before pregnancy (Reddy et al, 1994), a range comparable to that in the present study (Figs. 6-11). A 163 kg female bottlenose dolphin, however, was also reported to consume an average of 60% more fish during lactation than during similar periods in non-lactating years (Cockcroft and Ross, 1990 a). Lactating females lose much energy through milk which has a fat content of between 6 and 27%, depending on sampling time (Ridgway et al., 1995).
The food consumption of lactating females in the present study was not always highest during the month after delivery, although energy for thermoregulation, locomotion and growth of the calf, may have been highest at this time. This suggests that during this period, the mothers were relying sometimes also on energy reserves to feed the calves.
107

R.A. Kastelein et al.
<u i s a15 O «
g-a 5 3 3 " »H 0)
.S s « 3 -y to
•S c
•S o> to •£
1-2
S ° 2 ° * t •S O
c "S <u o
5 0)
IS*
oi at
•S £ B* **
0)
S (8 en 01
H M> a e
£ St
2 ~
to '53
*
^ ( 2
ai 5
O 1>
g « j ^ • £ to FJJ^
Q. o Ml u G to
CO HH
IB 4->
01 ^ o <s
o 6
- o o
n .3
o ••a „ _ 2 MH JS
Z •«
* I I B o
« ^
IS
«> O
•5 •« . D en
a ' J S o
M) is c
IS ^
bO.g < t5
Si * • "
.3 « C .2
§ g c .2 to 2 O E
01
a> a.
c
"O 0
E w C _
£:§ _
•a 0
O c u "S;
,? § ^i? 11. u ^ o
D) 0) OT < J3 ^
0)
^ o c O •!= O 3 0 C CO Q . £
as
o
is ^-^ (C ID 2
< T3 >2;
a) CO E
LL
m CD r^ oo co r^ CD CO t ^ m CO C3)
o o o o o o o in o o o o co o in "* m i -CO CM CO CO CM CO
o o o o o o O t O O CM O
i - CO s
00 O CO CM O) CM
i n ^ i D s m s CO i - CM CO T- T-
o> o
85 C D CO
o o o _co _g) o o o CD CO CO CD CO CO co E E E £ £
CO CO CO
E E E
CO
• D
CO
C CO
CO CM
0- o
CM m r^ CM co CM CM i - CM CM
003
CO CM
O O O O CO CO CM CO
O O o r in in CM
CD O
$
CO O)
o o 0 0 co co E E CO .CO
^ o T- CM
0
"E CO
X
N CO T- CM o o
c g
E 3 W c o o
• o o o • o 0 (/] co
o c
co </)
tl ><
O. m CO • *
£E o c a5 CO 5 | k_ ^ CO : t XD co >• O
* *
108

Food intake of Atlantic bottlenose dolphins
The food consumption of the lactating mothers in the present study peaked 1 to 5 months after parturition, by which time the blubber thickness of the calf may have increased, reducing energy loss to the water and thus the energy requirements of the calf. Suckling time per day of a bottlenose dolphin calf has been shown to decrease rapidly after the age of 4 months (Cockeroft and Ross, 1990 b). This might explain the decrease in food intake of the mothers in the present study, 2-6 months after giving birth. In Commerson's dolphins, the food consumption of the female also increased long after parturition, but remained at a level higher than in non-lactating periods for about 6 months (Joseph et al, 1987; Kastelein et al, 1993).
In all cases, the calves in the present study began to eat solid food within a year of birth, and probably continued to suckle until they were 14 to 37 months of age. Although bottlenose dolphins generally suckle for about 2 years, some fish is taken at a much earlier age, making weaning a gradual process (Peddemors et al, 1992; Reddy et al, 1994). In most reported cases, suckling stopped completely by the age of 18 months (McBride and Kritzler, 1951; Essapian, 1953; Tavolga, 1966; Prescott, 1977; Peddemors et al, 1992), but the moment at which the calves begin to eat fish varied. Accidental separation of mother and calf results in acute weaning; the survival of the calf depends on its degree of independence at the moment of separation. Apart from dependence on the mother for milk, calves also depend on their mothers for guidance.
The investment of the females in their calves, in the form of time and energy, varied between the calves (Table 2; Figs. 6- 11). In
general, the longer the suckling period, the larger the amount of extra food consumed by the mothers, but the smaller the proportional increase in food intake relative to non-reproductive periods of similar duration. There are a number of parameters which could have affected the duration of the suckling period and the amount of extra food consumed, but their actual values are largely unknown. These parameters are for the mothers:
1) Metabolic rate. This can be assumed to be similar for the 2 mothers during each of their 3 suckling periods. Thus, the duration of suckling period and the extra food consumed can be compared for each female between the 3 calvings (Table 2). These values differ between calves of each female, with approximately equal variation in the two females.
2) Weight at the onset of suckling. The blubber thickness of the mother after parturition would be expected to influence heat loss to the environment, and the amount of stored energy which could be converted to milk.
3) Rate at which the stored blubber was used.
4) Weight at the completion of weaning. 5) Composition of the milk.
Since the actual suckling events were not recorded, duration of the suckling period could only be assessed indirectly. Because food consumption after weaning (even if our estimated moment of weaning deviates a few months from the actual moment of weaning) was at the pre-reproductive level, it can be assumed that the body weights of the females also had returned to pre-reproductive levels.
109

R.A. Kastelein et al.
For the calves, the parameters which would affect the duration of the suckling period and the extra food intake of the mother are : 1) Metabolic rate. 2) Birth weight. 3) Rate at which the blubber layer in
creased. 4) Weight at the completion of weaning. 5) Age at which fish consumption began.
This varied markedly between calves. There is, however, no relationship between the age at which the calves began to consume fish and the duration of the suckling period, as precocious fish eaters are not necessarily early weaners. The age at which solid food consumption begins may depend on the behaviour of the calf and mother, the behaviour of surrounding dolphins, or the type of food available.
6) Amount of fish eaten by the calves in addition to suckling. After they began to eat fish, most calves showed a rapid increase in food intake to around 100 kg / month. The longer a calf ate fish before complete weaning, therefore, the greater the total amount consumed.
The values of most of the unknown parameters above are difficult to obtain, as they require frequent handling of the mother and calf during the suckling period. Such procedures may influence the mother-calf bond, and thus reduce the calf's chance of survival.
Seasonal food intake fluctuations Although food availability was constant, the food intake of the study animals fluctuated during the year in a non-systematic way: no seasonal pattern was apparent in the month-
300
_. 280 E — 260 £ | ) 240 a> ~ 220 .g 200
1 1»o n •a c 3 <n
140
160
120
100
Male 001 Male 008
Male 005 Female 002
Male 006 Female 003
Male 007 Female 010
10 15 20 25 —i—i—i—i—i—r
30 35 Age (year)
Figure 12. The relationship between age and standard body length for the bottlenose dolphins at Windsor Safari Park. Data points of individuals are connected by lines. * Average body length at birth of bottlenose dolphins (from Kastelein et al, 1998).
110
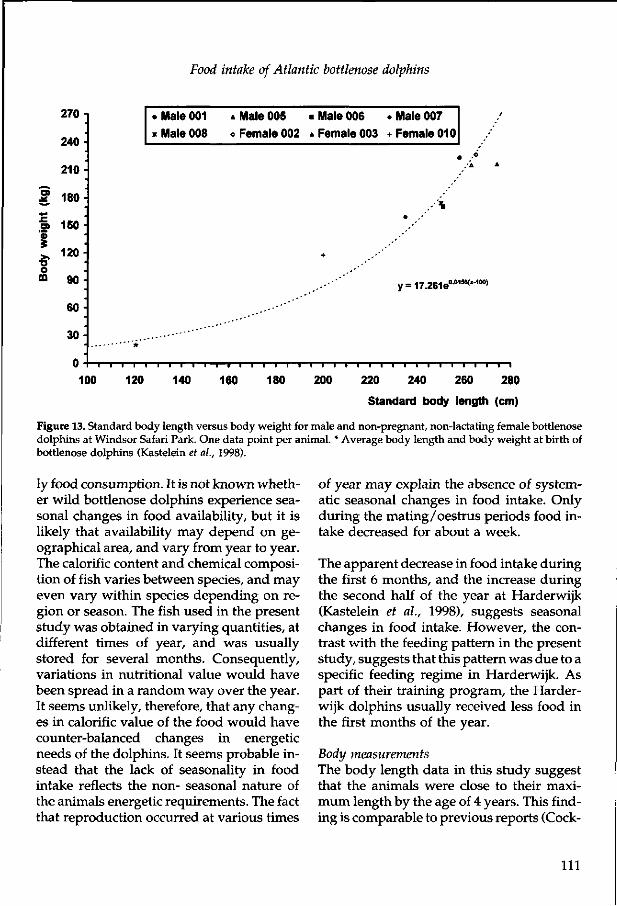
Food intake of Atlantic bottlenose dolphins
3
4-1
1 >< •o o o
270 i
240 -
210-
180-
150-
120-
90-
60-
30-
0-
• Male 001 > Male 008
i i—n—i—i—i—i—i—i—r
* Male 005 o Female 002
—i—i—i—i—i—i—r
• Male 006
& Female 003
+
-T—1—1—1—1—1—1
. Male 007 + Female 010
/ /
• \
•
y = 17.261e0 0 1 5 < K , ' -1 0 0 )
—i—i—i—i—i—i—i—i—r—i—i
100 120 140 160 180 200 220 240 260 280
Standard body length (cm)
Figure 13. Standard body length versus body weight for male and non-pregnant, non-lactating female bottlenose dolphins at Windsor Safari Park. One data point per animal. * Average body length and body weight at birth of bottlenose dolphins (Kastelein et al., 1998).
ly food consumption. It is not known whether wild bottlenose dolphins experience seasonal changes in food availability, but it is likely that availability may depend on geographical area, and vary from year to year. The calorific content and chemical composition of fish varies between species, and may even vary within species depending on region or season. The fish used in the present study was obtained in varying quantities, at different times of year, and was usually stored for several months. Consequently, variations in nutritional value would have been spread in a random way over the year. It seems unlikely, therefore, that any changes in calorific value of the food would have counter-balanced changes in energetic needs of the dolphins. It seems probable instead that the lack of seasonality in food intake reflects the non- seasonal nature of the animals energetic requirements. The fact that reproduction occurred at various times
of year may explain the absence of systematic seasonal changes in food intake. Only during the mating/oestrus periods food intake decreased for about a week.
The apparent decrease in food intake during the first 6 months, and the increase during the second half of the year at Harderwijk (Kastelein et al, 1998), suggests seasonal changes in food intake. However, the contrast with the feeding pattern in the present study, suggests that this pattern was due to a specific feeding regime in Harderwijk. As part of their training program, the Harderwijk dolphins usually received less food in the first months of the year.
Body measurements The body length data in this study suggest that the animals were close to their maximum length by the age of 4 years. This finding is comparable to previous reports (Cock-
I l l

R.A. Kastelein et al.
5-
4 -
n <fl n c o
H g | 3 o * " >.
J 5 » •D
«
3
•
X
1 1 T 1 1
• Male 001 • Male 007
—i 1 1 —
* Male 005 * Male 008
k •••
i i i
• Male 006
.• _
T 1 1 1 1
150 160 170 180 190 200 210 220 230
Body weight (kg)
Figure 14. Body weight versus average daily food consumption as a percentage of body weight for male and nonpregnant, non-lactating female bottlenose dolphins at Windsor Safari Park.
croft and Ross, 1990 b; Kastelein et al, 1998). Although very few length measurements were made, the present study suggests little or no difference between males and females, in accordance with findings on bottlenose dolphins from the northwest Atlantic Ocean (Mead and Potter, 1990).
Maximum body length in the present study appears to have been between 250 and 270 cm. This can vary in the wild depending on the geographic location and over time. Among bottlenose dolphins from northwest Atlantic Ocean, maximum body length was reached at 250 cm (Mead and Potter, 1990). In bottlenose dolphins northeast of Florida, males attained an asymptotic length of 270 cm, and females of 250 cm (Sergeant et al., 1973). Bottlenose dolphins from the Gulf of Mexico reached an asymptote at about 230 cm (Solangi and Dukes, 1983), from near Japan (Pacific bottlenose dolphins, Tursiops aduncus) at about 280-290 cm (Kasuya et al.,
1986), and from near Southern Africa at about 240 cm (Ross, 1977 and 1984). Males from the eastern Gulf of Mexico were reported to reach asymptote at a length of 265 cm and females at 250 cm (Read et al, 1993). The body weight to body length relationship in the present study is similar to that previously recorded for captive Atlantic bottlenose dolphins (Ridgway and Fenner, 1982; Kastelein et al, 1998). The latter found variability in dolphin body shape, as in other mammals, some animals being naturally leaner or more robust than others. An increase in the rate of weight gain was also found in males of a body length around 245 cm, at sexual maturity. Discontinuous weight gain was also reported in male bottlenose dolphins by Read et al. (1993) between the ages of 10 and 15 years although due to the small sample size, this may have been a sample artifact. The sample size in the present study was too small to detect such changes. The body length to body weight
112

Food intake of Atlantic bottlenose dolphins
relationship, however, falls within previously reported values for bottlenose dolphins off the central Atlantic coast of the U.S.A. (Mead and Potter, 1990).
Food consumption as a percentage of body weight There was a negative relationship between body weight and average daily food intake expressed as a percentage of body weight. The few data points of the present study are similar to those reported for Atlantic bottlenose dolphins at the Harderwijk Park (Kas-telein et ah, 1998). A bottlenose dolphin calf between 1 and 2 years of age, in its first year of fish consumption, was reported to have consumed around 4% of body weight per day (Cockcroft and Ross, 1990 b), which is in accordance with the findings in the present study. The daily food consumption as a percentage of body weight of 8 bottlenose dolphins in 3 institutions, however, was 1-2% above that of the animals of similar weight in the present study (Hinga, 1979). Further reports of daily food intake as a percentage of body weight for bottlenose dolphins of similar size, were also 1 to 2% above those of animals in the present study (Sergeant, 1969; Bossart, 1987 in Barros and Odell, 1990). The higher intakes of the latter animals may be due to the lower calorific content of the diet, lower water temperatures, higher activity levels of the dolphins, or growing animals.
While the maximum stomach content of a bottlenose dolphin off South Africa was reported as 5 kg (Cockcroft and Ross, 1990 a), 10.7 kg of fish were found in a wild Atlantic bottlenose dolphin weighing approximately 170 kg (Barros and Odell, 1990). This latter value represented 6.3% of body weight. In the present study, a female of that weight would have consumed only 3.4% of her body weight. This difference suggests that bottlenose dolphins are capable of consuming much more than their daily energy re
quirement in one meal. This would imply that they do not have to eat every day. Alternatively, wild bottlenose dolphins may require more energy than those housed in pools.
From a positive correlation between body weight and stomach volume (Cockcroft and Ross, 1990 a), it was calculated that larger bottlenose dolphins needed to fill their stomachs completely fewer times to obtain their daily energy requirements than smaller dolphins (Kastelein et at., 1998).
Ecological significance The accuracy with which the food consumption of wild bottlenose dolphins can be predicted from the data presented in the present study, depends on the diet of wild bottlenose dolphins, their thermoneutral zone, activity, and the water temperatures encountered.
The thermoneutral zone, or temperature range over which the metabolic rate is lowest, of the bottlenose dolphins varies with blubber thickness (Williams and Friedl, 1990). In the wide distribution area of the species (Mead and Potter, 1990), the average monthly sea surface temperature may vary between 1 and 29CC; if the species is optimally adapted, this may be the range in which the thermoneutral zone can move. The average monthly water temperature in the study area varied between 15.1 and 21.2°C and the average monthly air temperature between 4.8 and 20.5°C (Fig. 2), well within the temperature range potentially encountered in the wild. The study animals, therefore, were probably kept within their thermoneutral zone.
The animals in the present study, unlike wild dolphins, did not have to forage for food, although they swam almost constant
l y

R.A. Kastelein et al.
ly, exercised during play, and were active during training and performances. In the wild this species usually swims at a cruising speed of about 7.5 k m / h (Williams et al., 1992), about the general speed of the study animals. Diving, however, was limited by the depth of the pool. Recently developed telemetry techniques which allow the study of activity of wild cetaceans, showed that a wild adult female bottlenose dolphin spent 87% of her time submerged, with an average dive duration of 26 s (Mate et al, 1995). The energetic costs of diving are not well understood yet.
Taking into account the differences in diving capability and, possibly, in activity between the study animals and wild individuals, dolphins in the wild probably consume more than the values presented in the present study. Therefore the food intake data in the present study should be used only to provide a conservative estimate of the food intake of a bottlenose dolphin population in the wild.
Acknowledgements
R.R.). Academic Press, Inc., New York, 309-328.
Caldwell, D.K. and Caldwell, M.C. (1972) The World of the Bottlenosed Dolphin. Lip-pincott, 157 pp.
Cockcroft, V.G. and Ross, GJ.B. (1990 a) Food and feeding of the Indian ocean Bottlenose dolphin off Southern Natal, South Africa. In: The Bottlenose dolphin (Eds. Leather-wood, S. and Reeves, R.R.). Academic Press, Inc., New York, 295-308.
Cockcroft, V.G. and Ross, G.J.B. (1990 b) Observations on the early development of a captive bottlenose dolphin calf. In: The Bottlenose dolphin (Eds. Leatherwood, S. and Reeves, R.R.). Academic Press, Inc., New York, 461-478.
Corkeron, P.J., Bryden M.M. and Hedstrom, K.E. (1990) Feeding by Bottlenose dolphins in association with trawling operations in Moreton Bay, Australia. In: The Bottlenose dolphin (Eds. Leatherwood, S. and Reeves, R.R.). Academic Press, Inc., New York, 329-336.
We thank everyone at Windsor Safari Park who was involved in recording the dolphins' food consumption and Carolien Staal for analyzing part of the data. Thanks also go to Rob Triesscheijn for drawing the graphs, and Eleanor Hayes and Nancy Vaughan (University of Bristol, U.K.) for their comments on the manuscript.
References
Barros, N.B. and Odell, D.K. (1990) Food habits of Bottlenose dolphins in the Southeastern United States. In: The Bottlenose dolphin (Eds. Leatherwood, S. and Reeves,
Cornell, L.H., Asper, E.D., Antrim, J.E., Sear-les, S.S., Young, W.G. and Goff, T. (1987) Progress Report: Results of a Long- range Captive Breeding Program for the Bottlenose Dolphin, Tursiops truncatus and Tursiops truncatus gilli. Zoo Biology 6, 41-53.
Dudok van Heel, W.H. (1970) The Dolphinarium at Harderwijk. Int. Zoo Yearb. 10, 49-51.
Dudok van Heel, W.H. (1974) Birth in dolphins {Tursiops truncatus, Mont.) in the Dol-finarium Harderwijk, Netherlands. Aquatic Mammals 2(2), 11-22.
114

Food intake of Atlantic bottlenose dolphins
Essapian, F.S. (1953) The birth and growth of a porpoise. Natural History Magazine, November, 616-624.
Essapian, F.S. (1963) Observations on abnormalities of parturition in captive bottle-nosed dolphins, Tursiops truncatus, and concurrent behaviour of other porpoises. J. Mammal. 44, 405-413.
Gunter, G. (1942) Contributions to the natural history of the bottlenose dolphin, Tursiops truncatus (Montagu) on the Texas coast, with particular reference to food habits. J. Mammal. 23(3), 267-276.
Harrison, R.J. (1969) Reproduction and reproductive organs. In: The Biology of Marine Mammals (Ed. Anderson, H.T.). Academic Press, London, 253-348.
Hinga, K.R. (1979) The food requirements of whales in the southern hemisphere. Deep-Sea Research, 26A, 569-577.
Hoese, H.D. (1971) Dolphin feeding out of water in a salt marsh. J. Mammal. 52(1), 222-223.
Hoglund, R. (1965) Porpoises feeding. Underwater Naturalist 3(2), 50-51.
Joseph, B.E., Antrim, J.E. and Cornell, L.H. (1987) Commerson's dolphin (Cephalorhyn-chus commersonii): A discussion of the first live birth within a marine zoological park. Zoo Biology 6, 69-77.
Kastelein, R.A., McBain, J., Neurohr, B., Mohri, M., Saijo, S., Wakabayashi, I. and Wiepkema, P.R. (1993, chapter 2.11) Food consumption of Commerson's dolphins (Ce-phalorhynchus commersonii). Aquatic Mammals 19(2), 99-121.
Kastelein, R.A., Staal, C. and Wiepkema, P.R. (1998, chapter 2.6) Food consumption and growth of Atlantic bottlenose dolphins {Tursiops truncatus).
Kasuya, T. (1985) Effect of exploitation on reproductive parameters of the spotted and striped dolphins off the Pacific Coast of Japan. Sci. Rep. Whales Res. Inst. Tokyo, 36, 107-138.
Kasuya, T., Tobayama, T., Saiga, T. and Ka-taoka, T. (1986) Perinatal growth of delphi-noids: Information from aquarium reared bottlenose dolphins and finless porpoises. Sci. Rep. Whales Res. Inst., Tokyo 37, 85-97.
Kemp, R.J. (1949) Report on stomach analysis from June 1,1949-August 31,1949. Annu. Rep. Mar. Lab. Texas Fish, Game Oyster Comm., Fiscal Year 1948-1949, 111, 112,126, 127.
Kirby, V.L. and Ridgway, S.H. (1984) Hormonal Evidence of Spontaneous Ovulation in Captive Dolphins, Tursiops truncatus and Delphinus delphis. Rep. Int. Whal. Commn. (Special Issue 6), 459-464.
Mate, B.R., Rossbach, K.A., Nieukirk, S.L., Wells, R.S., Irvine, A.B., Schott, M.D. and Read, A.J. (1995) Satellite-monitored movements and dive behavior of a Bottlenose dolphin (Tursiops truncatus) in Tampa Bay, Florida. Marine Mammal Science 11(4), 452- 463.
McBride, A.F. and Kritzler, H. (1951) Observations on pregnancy, parturition, and postnatal behaviour in the bottlenose dolphin. J. Mammal. 32, 251-266.
115

R.A. Kastelein et al.
Mead, J.G. and Potter, C.W. (1990) Natural history of Bottlenose dolphins along the central Atlantic coast of the United States. In: The Bottlenose dolphin (Eds. Leatherwood, S. and Reeves, R.R.). Academic Press, Inc. New York, 165-195.
Odell, D.K. (1975) Status and aspects of the life history of the bottlenose dolphin, Tur-siops truncatus, in Florida. J. Fish. Res. Board Can. 32, 1055-1058.
Ozharovskaya, L.V. (1990) The Female Reproductive Cycle of Black Sea Bottlenose Dolphins as Revealed by analysis of Plasma Progesterone Levels. Rep. Int. Whal. Commn. 40, 481-485.
Peddemors, V.M., Fothergill, M. and Cock-croft, V.G. (1992) Feeding and growth in a captive-born bottlenose dolphin Tursiops truncatus. S.-Afr. Tydskr. Dierk. 27(2), 74-80.
Prescott, J. (1977) Comments on captive births of Tursiops truncatus at Marineland of the Pacific (1957-1972). In: Breeding Dolphins: Present status, suggestions for the future (Eds. Ridgway, S.H. and Benirschke, K.). Final Report - MMC 76/07. Marine Mammal Commission, 71-76.
Read, A.J., Wells, R.S., Hohn, A.A. and Scott, M.D. (1993) Patterns of growth in wild bottlenose dolphins (Tursiops truncatus). J. Zool. London, 231, 107-123.
Reddy, M., Kamolnick, T., Curry C , Skaar, D. and Ridgway, S. (1994) Energy requirements for the Bottlenose dolphin (Tursiops truncatus) in relation to sex, age and reproductive status. Marine Mammals: Public Display and research 1(1), 26-31.
Ridgway, S.H. and Fenner, C.A. (1982) Weight-length relationships of wild-caught and captive Atlantic bottlenose dolphins. JAVMA 181(11), 1310-1315.
Ridgway, S.H., Kamolnick, T., Reddy, M., Curry, C. and Tarpley, R. (1995) Orphan-induced lactation in Tursiops and analysis of collected milk. Marine Mammal Science 11 (2), 172-182.
Ross, G.J.B. (1977) The taxonomy of bottle-nosed dolphins Tursiops species in South African waters, with notes on their biology. Ann. Cape Prov. Mus. (Nat. Hist.) 11(9), 135-194.
Ross, G.J.B. (1984) The smaller cetaceans of the south-east coast of southern Africa. Ann. Cape Prov. Mus. (Nat. Hist.) 15(2), 173-410.
Sergeant, D.E. (1969) Feeding rates of ceta-cea. Fisk. Dir. Skr. Ser. HavUnders., 15,246-258.
Sergeant, D.E., Caldwell, D.K. and Caldwell, M.C. (1973) Age, Growth, and Maturity of Bottlenosed Dolphin (Tursiops truncatus) from Northeast Florida. Journal Fisheries Res. Board of Canada 30(7), 1009-1011.
Shapunov, V.M. (1971) Food requirements and energy balance in the Black Sea bottlenose dolphin (Tursiops truncatus ponticus Ba-rabasch). In: Morphology and Ecology of Marine Mammals (Eds. Chapskii, K.K. and Sokolov, E.E.). Israel Program for Scientific Translations, Jerusalem, 207-212.
Solangi, M.A. and Dukes, G.E. (1983) Atlantic bottlenose dolphin, Tursiops truncatus, herd studies in the Mississippi Sound, U.S.A.: Capture, freeze marking and biological sampling. Fin. Rep. Natl. Mar. Fish. Serv. Contract No. NA82-GA-C-00023. xi + 178 pp.
116

Food intake of Atlantic bottlenose dolphins
Spotte, S. and Babus, B. (1980) Does a pregnant dolphin (Tursiops truncatus) eat more? Cetology 39, 1-7.
Tavolga, M.C. and Essapian, F.S. (1957) The behaviour of the bottlenosed dolphin {Tursiops truncatus): Mating, pregnancy, parturition and mother-infant behaviour. Zoolog-ica 42(1), 11-34.
Tavolga, M.C. (1966) Behaviour of the bottle-nose dolphin {Tursiops truncatus); Social interactions in a captive colony. In: Whales, Dolphins and Porpoises (Ed. Norris, K.S.). Univ. of California Press, Berkeley and Los Angeles, 718-730.
Townsend, C.H. (1914) The porpoise in captivity. Zoologica 1(16), 289-299, 9 plates.
Williams, T.M. and Friedl, W.A. (1990) Heat flow properties of dolphin blubber: insulating warm bodies in cold water. American Zool. 30(4), 191.
Williams, T.M., Haun, J.E., Friedl, W.A., Hall, R.W. and Bivens, L.W. (1992) Assessing the thermal limits of bottlenose dolphins: a cooperative study by trainers, scientists, and animals. IMATA Soundings Fall 1992, 16-17.
117

3
Chapter 2.8
Food consumption and body measurements of Amazon river dolphins (Inia geoffrensis)
R.A. Kastelein1, B. Neurohr2, S.H. Nieuwstraten1 and P.R. Wiepkema3
! Harderwijk Marine Mammal Park, Strandboulevard Oost 1, 3841 AB Harderwijk, The Netherlands
'• Tiergarten Landau, Schlachthofstrasse 11, 76829 Landau, Germany
Emeritus Professor of Ethology, Wageningen Agricultural University, Stationsweg 1, 6861 EA Oosterbeek, The Netherlands
Summary
This report is on the food consumption of 3 male Amazon river dolphins which were housed in water of between 27 and 29°C at Duisburg Zoo, Germany. The food consumption of 2 animals was recorded for 17 successive complete calendar years, that of the third animal for 3 complete successive years. In male 002 the total annual food intake increased to 1280 kg at the age of 10 years, after which it decreased slightly and stabilized at around 1170 kg/year. Male 001 was adult on arrival at the zoo. His annual food intake fluctuated at around 1200 kg. Male 003 consumed around 930 kg/year during his third and fourth year. The food intake fluctuated during the year and was often low in February. Between the ages of 26 and 31 years, adult male 001 had a body length of 232 cm, an estimated weight of 145 kg, and consumed on average around 2.5% of his body weight daily. At the age of 12 years, male 002 was 200 cm long and weighed an estimated 95 kg. That year he ate on average 3.4% of his body weight daily. When he was 17 years old he was 212 cm long, weighed an estimated 105 kg and ate on average 3.1% of his body weight daily. The initial passage time of carmine red dye in the gastrointestinal tract of the 2 adult animals was on average 250 minutes. The 2 adult males breathed on average 6.7 and 7.3 times per 5 minutes.
Key words: odontocete , bo to , energetics, g rowth , initial passage t ime, s tomach vo lume , respira t ion rate
Introduction spread freshwater dolphin in the world, its distribution is limited compared to that of
The Amazon river dolphin or boto (Inia geof- most marine odontocetes and it is therefore frensis) is found in the Amazon and Orinoco very likely to become a threatened species, river basins. It inhabits slow and fast flowing For the management of Amazon river dol-rivers, side channels, lakes, and flooded for- phins in the wild, information is needed ests and grasslands. The principal limits to about the population size, age composition its distribution seem to be impassable rapids and sex ratio, seasonal distribution, diet, en-and cold waters in small tributaries at the ergy requirements relative to seasonal prey headwaters of the Amazon basin in the distribution and density, and about compe-Andes (Best and da Silva, 1989). Although tition with other animals and with fisheries, the Amazon river dolphin is the most wide- This information could facilitate prey man-
119

R.A. Kastelein et al.
agement to allow for a certain number of Amazon river dolphins in their distribution area.
The Amazon river dolphin is a generalist feeder whose diet is known to include over 50 fish species. Fish types taken by Amazon river dolphins (mainly sciaenids, cichlids and characins in order of importance) and their proportions in the diet have been described by Best and da Silva (1989).
Very little is known about the energetic requirements of individual odontocetes of various ages and sizes, as it is, at present, impossible to measure their energetic requirements in the wild. The present study describes the food consumption of Amazon river dolphins kept at Duisburg Zoo, Germany.
Materials and methods
Study animals The study was done on 3 male Amazon river dolphins housed at Duisburg Zoo. The animals are from the Venezuelan Amazon, and arrived at the zoo in 1975. On arrival, male 001 was judged to be 15 years old, male 002 one year old, and male 003 two years old. Age estimates were based on the length of the animals and the fact that male 002 was still fully dependent on mother milk, but soon after arrival started to eat fish. Morphological measurements of animals 001 and 002 were taken on 31 October 1986 and on 10 July 1991.
Study area The pool complex consisted of a main pool (6.8 m x 5.5 m; 1.7 m deep) and an adjacent holding pool (2.7 m x 1.9 m; 1.7 m deep). The animals usually had access to both pools. The non-chlorinated fresh water was cleaned by means of a biological filter and U.V. light
irradiation. During the study period the water was heated to 28°C (+ or - 1°C). The air temperature varied between 26 and 36°C. Natural light came through several skylights, and the pool was artificially lit between 0730 and 1900 h. U.V. irradiation continued 24 h a day in order to prevent algal growth. Duisburg Zoo is located at 6°45'E and 51°25' N.
Feeding The animals were individually fed 2 or 3 times a day, usually with live fish or freshly killed fish. Based on weight, the diet consisted on average of 60% trout (Salmo trutta), 35% carp (Cyprinus carpio) and 5% tench (Tinea tinea). Marine mammal multi-vitamins were added to this diet daily, and the animals were always fed to saturation; i.e. until they started to play with the fish instead of swallowing it. They were in public view, but no presentations were given. All available food consumption records between 1975 and 1992 were analyzed.
Passage time of food through the gastrointestinal tract To measure the passage time of food through the gastro-intestinal tract, gelatine capsules containing carmine red dye were fed to the dolphins in trout and carp. The capsules were offered at various times of the day, but never at night. After the dye was given, the animals were watched constantly, and the time when it appeared in the excreted faeces was recorded (initial passage time). Tests were conducted on males 001 and 002 between February and May 1993.
Respiration rate In March and April 1993 the respiration rates of males 001 and 002 were recorded, each during 36 five minute periods.
120

Food consumption of Amazon river dolphins
Statistics The seasonal fluctuations in food intake between years were tested with the Kendall's coefficient of concordance test. The average daily food intake of each month of a year was given a rank number from 1 to 12.
Results
Annual food consumption Male 002's total annual food intake increased gradually to 1280 kg at the age of 10 years, after which it decreased slightly and stabilized at around 1170 kg/year (Fig. 1 a). His food intake was elevated at the age of 15 years (1989). In this year the animal was given anabolic steroids and antibiotics for 4 weeks, because it was very lean due to pneumonia. The treatment was successful and the animal gained weight.
Male 001 was adult on arrival at the zoo. His annual food intake fluctuated at around 1200 kg (Fig. 1 b). His low food intake in 1978 (at age 18) coincided with the death of pool-mate 003 from pneumonia and with his own pneumonia. The high food intake in his 24th, 25th and 29th year coincided with 4 week treatments of pneumonia with anabolic steroids in combination with antibiotics. Both treatments were successful and the animal gained weight.
Male 003 only lived for 4 years at the zoo. In his 3rd and 4th year he consumed about 930 kg/year (Fig. 1 c). This was about 170 kg more per year than male 002 ate at the same age.
Seasonal food intake fluctuations When determining seasonal food intake fluctuations for male 001, food intake data from incomplete years in which he was sick or during which pool maintenance was carried out, were not considered (ages 18, 24,
25, 28 and 29 years). The food intake fluctuated during the year in a systematic seasonal pattern (Kendall's coefficient of concordance test: %\ = 21.78, p < 0.05). The food intake was often below average in February when an increase in sexual activity was observed (Fig. 2). In the following 6 months (March -August), he usually ate more than the monthly average. In September and November the animal usually ate less than the annual monthly average.
Between the age of 2 and 9 years (the period of growth), the food intake of animal 002 fluctuated systematically throughout the year (Kendall's coefficient of concordance test: %2
r = 21.56, p < 0.025 (Fig. 3 a). When calculating the average seasonal food intake fluctuations for male 002 when he was adult (between the ages of 10 - 18 years), food intake data from incomplete years and years in which he was sick were not considered (ages 15 and 16 years). The food intake fluctuated during the year in a systematic seasonal pattern (Kendall's coefficient of concordance test: x2
T = 31.57, p < 0.001). The food intake was often lowest in February when an increase in sexual activity was observed (Fig. 3 b). In the following 8 months (March -October), he usually ate more than the monthly average. Between November and February the animal usually ate less than the annual monthly average.
Body measurements The body shapes of animals 001 and 002 are shown in figure 4. Measurements show that between 31 October 1986 and 10 July 1991 male 002 was growing, while male 001 's standard body length remained constant (Table 1).
Food consumption relative to estimated body weight Adult males 001 and 002 were similar in
121

R.A. Kastelein et al.
1 7 5 0 1 A. Male 002
2 1500 H c •2 1250
i 1000 CO c o o 750
1 500 4
1 250 c
1976 / = 10 12 14 16 18
Age (year)
— 1 7 5 0 ^ o> * 1500 c i 1250 Q. E g 1000 c o ° 750 H •D
| 500-a 250 c <
B. Male 001 < \
1976 A 18 20 22 24 26 28 30 32
Age (year)
122

Food consumption of Amazon river dolphins
1750-|
£. 1500 •
mpt
ion
s
w 1000-c o o
750 -o •2 500-10
g 250-<
C. Male 003
3
/ Z 4 5 1976
Age (year)
Figure 1. The annual food consumption of Amazon river dolphins at Duisburg Zoo relative to age. a) Male 002, b) Male 001 and c) Male 003.1) A year in which the animal had pneumonia, 2) a year in which an anabolic steroid was administered to induce weight gain after pneumonia, and 3) A year during which the animal was ill (the animal died the day after this calendar year). Age 1 represents the first calendar year after birth.
body length to adult male Amazon river dolphins in the wild (Best and da Silva, 1989). Although the animals in the present study were never weighed, their body weight can be estimated by comparing their body lengths with healthy animals weighed and measured by Best and da Silva (1989). Between 31 October 1986 (age 26 yrs) and 10 July 1991 (age 31 yrs) adult male 001 had a body length of 232 cm, and weighed an estimated 145 kg. During that period he consumed on average around 2.5% of his body weight daily.
On 31 October 1986, 12-year-old male 002 had a body length of 200 cm and weighed an estimated 95 kg. That year he ate on average around 3.4% of his body weight daily. On 10 July 1991 he was 17 years old, 212 cm long, and weighed an estimated 105 kg. That year he ate on average around 3.1% of his body weight daily.
Maximum food intake per day When adult, male 001 's maximum daily food intake was 6.9 kg, that of male 002 was 5.5 kg.
Passage time of food through the gastrointestinal tract The initial passage times of carmine red dye in animals 001 and 002 are shown in table 2. The mean initial passage time was 250 minutes. No systematic variation in initial passage time could be detected in the 11 h of the day during which the animals were tested.
Respiration rate On average male 001 breathed 6.7 times per 5 minutes (SD: 2.1, n = 36), and had an average respiration interval of 45 s. Male 002 breathed on average 7.3 times per 5 minutes (SD: 2.9, n = 36,), with an average respiration interval of 41 s.
123

R.A. Kastelein et al.
Discussion and conclusions
Annual food consumption The subadult male Amazon river dolphin 002 increased its average daily food intake until the age of 10 years. Klocek (1981) describes a relatively constant weight gain of 4.8 kg /y r before sexual maturity in an Amazon river dolphin in human care. In the wild, males reach sexual maturity between the age of 10 and 12 years, at a body length of about 198 cm, when testicular weight is in excess of 0.4% of body weight (Best and da Silva, 1989). This suggests that testosterone plays a role in the growth spurt during the period that the males become sexually mature. On 31 October 1986, with a body length of 200 cm and at the age of 12 years, male 002 was probably just mature. Two years before this he ate a great deal, perhaps to power a growth spurt. Unfortunately the animal was not weighed or measured during that peri
od. A sudden mass increase of 21.9 kg /y r has been recorded in an Amazon river dolphin in human care (Herald, 1967). After male 002 reached maturity, his food intake stabilized.
Seasonal food intake fluctuations In the present study, fish weights are compared without reference to the composition or calorific content of the fish. Fish species have different calorific values, and even in different regions or seasons a species may vary in composition and calorific content. Since their arrival, the Amazon river dolphins at Duisburg Zoo have eaten live and freshly killed fish from a fish farm. This origin probably reduced seasonal differences in the fish's composition and energetic value to some extent relative to that of wild fish.
Wild Amazon river dolphins move seasonally, following fish migrations and the an-
24 « $ 20
16
12
8
4
0
-4
-8
.2 -12 I •o .16 as
•o o £ >« £ C o E « 2 o > <0
Male 001 (age 1 6 - 3 2 )
-20 J
M M N
Figure 2. The average proportional deviation of the average monthly food intake of male 001 between the age of 16 and 32 years (years with illness or pool maintenance are not included; n = 11). The bars indicate the standard deviations.
124

Food consumption of Amazon river dolphins
A. 32-|
28
24
20
16
12 H
8
4
Male 002 (age 2 - 9)
-4
-8
-12
-16
-20
-24
M M
B. Male 002 (age 10 - 18) 16-i
12-|
8
4
-4
-8
-12
-16
-20
-24
M M N
Figure 3. The average proportional deviation of the average monthly food intake of male 002. a) While growing between the age of 2 and 9 years (n = 8) and b) between the age of 10 and 18 years (n = 7). Years with illness are not included. The bars indicate the standard deviations.
125

R.A. Kastelein et al.
Figure 4. Adult males 001 and 002 at Duisburg Zoo. Note the relatively large pectoral fins, and the low and broad dorsal fins (Photo: Bernhard Neurohr).
nual flood cycle. In the dry season they are restricted to deep channels, while during the wet season (December to June) they are found along the edges of flooded meadows and forests, and often at the confluence of tributaries (Best and da Silva, 1989). The reduced food intake of the adult Duisburg dolphins in November coincides with April in the southern hemisphere; the middle of the wet season. Maybe in this period fish density in the river basins is low because the rivers are in spate. Although this is highly speculative, seasonal changes in hormone levels may reduce appetite in periods of low food availability.
In the wild, Amazon river dolphins are born between May to July. This coincides with peak river levels at the start of the dry season and is the time of highest food availability, as fish are driven from inundated forests by falling water levels (Best and da Silva, 1984).
Gestation lasts 10-11 months (Caldwell et al., 1966), so that mating occurs from June to September. Assuming a 6 month shift in activity due to the 6 month shift in light cycle between the southern and northern hemispheres, mating should occur between December and March at Duisburg. The reduced food intake of the males at Duisburg in February may be due to changes in reproductive hormones. In Commerson's dolphins (Cephalorhynchus commersonii), an odontocete which only lives in waters on the southern hemisphere, a 6 month shift in breeding season was seen after transport to the northern hemisphere (Kastelein et ah, 1993 a).
Body measurements Compared to the bottlenose dolphin (Tur-siops truncatus), the Amazon river dolphin has a dorsal fin which is short (measurement 18 in table 1), but broad at the base, relatively
126

Food consumption of Amazon river dolphins
o o CO
<J>
I
I
o
CO 00
CO CM
CM O O
CO
CD
CM O o
CM
""
CO CO
o 1
CO
(fl E c
^—v
m CO
>; 0 O) co •o a) CO b
c 0 r S> 3 CO CO 0
E o 0 to
< Lil Q
CM CO CM
m o co CM in co
CO i- CM •* i "fr in O) CM co • l-
co c M c o o o T i - i n i - c o m o o o i - o c D T i - ' r j - ' r t c o c o i - • O - I - O N C O O O ) C J ) ' * C D C O ' ^ - C O C M C M I - C M ^ C O I - I O ' T - I ^ C D T -CM T - 1 - T -
CM
CM
o i n N c o i o c n c o o o o o i o i n w w ^
CM CO O) CM "* CO 9
CO CO
CO i n
d t r i c M i n i o o x o i - CM • * CO • *
O O CD 1^ CM IV
CD N N N T - CD 00 O
8. w
* 5 1 I 2 <- c ^ 0 M § ° 0 £ 0 o
• 5 c 0 £ « 0 O f f l - § , c o 0 _ t o i o i D g » a E ' E a s 2
i _ i _ i _ > . O i _ m i _ 0 i y t ?
t o ^ S ^ ^ ' g ^ ^ ^ D ) © 0 0 C C C o - S = C . C C C Q . +-o . 0 0 0 y - C 0 O ) 0 c o c o x : 0 O o o 2 c o o - = o O O Q ) . p )
- n O O O Q Q O O O — * - ' > . c
^ CO CO CO .CO .CO .ffl .CO .£0 "3" " ^ •§> $ T3
s z 'Z 'Z ' z rz r i r z ' i - 0 0-= 0 5 . 2 , 0 0 0 0 © 0 0 0 Q . Q . H _ H _ ^ !_ 0 . 0 0 . 0 . 0 . 0 0 . 0 . 0 . 0 . 0 ^ CO 0 0 . 0 0 . 0 . 0 0 0 . 0 . 3 3 _ r_ o Q . 3 3 3 3 3 3 3 3 . 4 _ M _ S { j j . c ; Q-H— V— M - X - H - X — M-H— O O 0 ) * = : ^
= O O O O O O O O a Q C § g 9 . 9 . 0 . 0 . 0 . 0 . 0 . 0 . o p c _j o m i— j— i— i— i— i— i— i— i— I . . . .
O - i - CM CO • * • r - C M C O - * m C D N C O O ) i - - i - i - T - i -
c 0 •c 0 co c
O
0 SS
« c§
2 2 0 . 0 .
£ x: x: ±± o) t5) P e c
er w
er
le
er le
a. a. a. 9. 9. 9.
H ^ H ^ H^ x: x: x: O) O) o>
x:
0 x: p
H ^
CO
O CC QC t r O
r m 0 CO
1 3
LL
3
CO
0
0 ••-» c 0
Q
1 • ^
"S x: 0 t»
CO CI)
^ 3 H—
O
0 O)
T3 0
O) C O CO 0
c 0
c 0 a. CO 0 (0 fl)
(-2 5 * "5 x: 0
«
CO 3
in
1o x : t
jtO
7n x : t
c
CO
2 0
**-O c
y c ... 0 CO
CI) E E x : r
Z Z O O O i n C O N C O O O i - C M C O ' * 1 - T - 1 - 1 - - I - C M C M C M C M C M
127
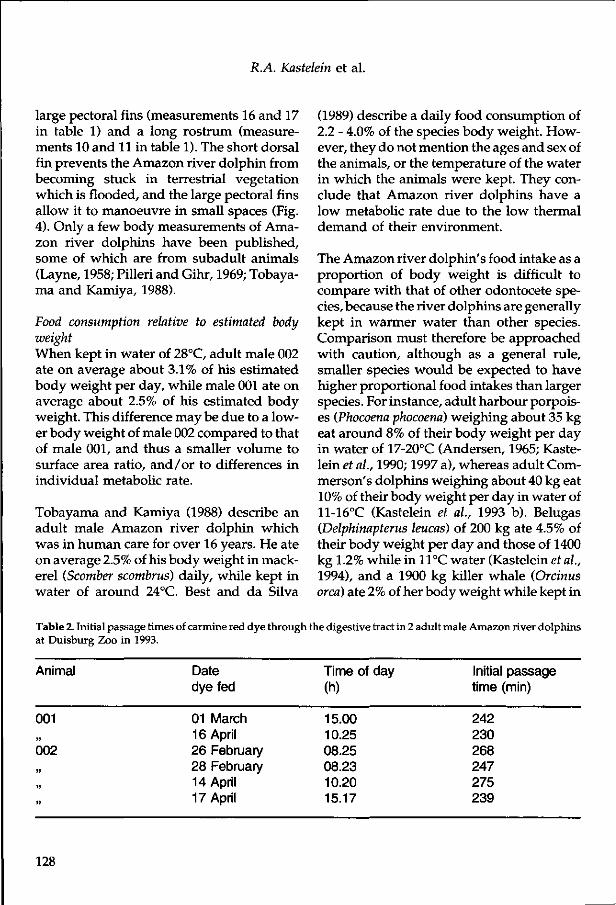
R.A. Kastelein et al.
large pectoral fins (measurements 16 and 17 in table 1) and a long rostrum (measurements 10 and 11 in table 1). The short dorsal fin prevents the Amazon river dolphin from becoming stuck in terrestrial vegetation which is flooded, and the large pectoral fins allow it to manoeuvre in small spaces (Fig. 4). Only a few body measurements of Amazon river dolphins have been published, some of which are from subadult animals (Layne, 1958; Pilleri and Gihr, 1969; Tobaya-ma and Kamiya, 1988).
Food consumption relative to estimated body weight When kept in water of 28°C, adult male 002 ate on average about 3.1% of his estimated body weight per day, while male 001 ate on average about 2.5% of his estimated body weight. This difference may be due to a lower body weight of male 002 compared to that of male 001, and thus a smaller volume to surface area ratio, and /o r to differences in individual metabolic rate.
Tobayama and Kamiya (1988) describe an adult male Amazon river dolphin which was in human care for over 16 years. He ate on average 2.5% of his body weight in mackerel (Scomber scombrus) daily, while kept in water of around 24°C. Best and da Silva
(1989) describe a daily food consumption of 2.2 - 4.0% of the species body weight. However, they do not mention the ages and sex of the animals, or the temperature of the water in which the animals were kept. They conclude that Amazon river dolphins have a low metabolic rate due to the low thermal demand of their environment.
The Amazon river dolphin's food intake as a proportion of body weight is difficult to compare with that of other odontocete species, because the river dolphins are generally kept in warmer water than other species. Comparison must therefore be approached with caution, although as a general rule, smaller species would be expected to have higher proportional food intakes than larger species. For instance, adult harbour porpoises (Phocoena phocoena) weighing about 35 kg eat around 8% of their body weight per day in water of 17-20°C (Andersen, 1965; Kastelein et al, 1990; 1997 a), whereas adult Com-merson's dolphins weighing about 40 kg eat 10% of their body weight per day in water of 11-16°C (Kastelein et al, 1993 b). Belugas (Delphinapterus leucas) of 200 kg ate 4.5% of their body weight per day and those of 1400 kg 1.2% while in 11°C water (Kastelein et al, 1994), and a 1900 kg killer whale (Orcinus orca) ate 2% of her body weight while kept in
Table 2. Initial passage times of carmine red dye through the digestive tract in 2 adult male Amazon river dolphins at Duisburg Zoo in 1993.
Animal Date dye fed
01 March 16 April 26 February 28 February 14 April 17 April
Time of day (h)
15.00 10.25 08.25 08.23 10.20 15.17
Initial passage time (min)
242 230 268 247 275 239
001
002
128

Food consumption of Amazon river dolphins
Figure 5. Male 001 at Duisburg Zoo with 2 fish in its mouth. Note the long rostrum (Photo: Bernhard Neurohr).
water of 15-22°C (Kastelein and Vaughan, 1989).
Maximum food intake per day Adult male 001 required on average 3.3 kg of fish a day, but he sometimes ate 6.9 kg per day. When adult, male 002 required on average 3.2 kg of fish a day, while he sometimes ate 5.5 kg/day. This indicates that the Amazon river dolphin is adapted to exploit unevenly distributed food sources by eating enough food during one day to provide energy for about 2 days. It can also use its large stomach to profit from large seasonal fluctuations in food availability by eating in excess of energetic needs when food is available. Fat can be stored and used during periods of low food availability.
Amazon river dolphins catch fish with their anterior teeth, then transfer them to the stronger posterior teeth to crush them and
swallow the head first (Fig. 5). Larger fish are torn to pieces, the head being shaken off before ingestion (da Silva, 1983). This means that Amazon river dolphins are not restricted to fish that can pass whole through the oesophagus. This is a limitation for many other odontocetes. The long rostrum, the flexible neck and the molar-like rear mastication teeth of Amazon river dolphins appear to be adaptations to their feeding technique. The large stomach of the Amazon river dolphin may also be an adaptation for taking large prey.
Passage time of food through the gastrointestinal tract Although the sample size is small, the present study indicates a relatively slow passage of food in Amazon river dolphins in relation to body weight, compared to in other odontocetes which were tested with the
129

R.A. Kastelein et al.
same dye (Kastelein et al., 1993 a and b, 1994, 1997 b, 1998 a, b and c).
Intestinal length of Amazon river dolphins can be calculated with the formula: intestinal length (m) = 4.598 +15.299 x body length (m) (da Silva, 1983). This results in intestinal lengths of 40.1 m for male 001 and 37 m for male 002. The total digestive tract length (mouth to anus) can be estimated by adding 1.1 m (distance from the base of the tongue to the small intestine) to these numbers, making 41.2 m for 001 and 38.1 m for 002. The average passage speed of carmine red through the entire digestive tract is therefore 0.29 cm/ s for male 001 (mean passage time: 236 minutes) and 0.25 cm/ s for 002 (mean passage time: 257 minutes). However, this calculation may not be valid, as the digesta velocity usually varies per compartment of the digestive tract (Warner, 1981). Compared to terrestrial carnivores the digestive tract of the Amazon river dolphin is very long, especially considering that it consumes easily digestible fish.
Respiration rate Similarly to the animals in the present study, a male Amazon river dolphin in an ocean-arium in Japan had an average respiration interval of about 42 s, while a female breathed at intervals of just over 30 s (To-bayama and Kamiya, 1988). Other respiration interval records for Amazon river dolphins in human care are 60 - 90 s for adults and 20 s for neonates (Layne, 1958; Layne and Caldwell, 1964; Caldwell and Caldwell, 1972; Trebbau, 1975). Wild Amazon river dolphins have been recorded to breathe at an average interval of 78 s (SD = 66.5 s, range: 8 - 210 s, n = 38) when hunting (Best and da Silva, 1989). Thus, the mean respiration intervals of the animals in the present study (41 and 45 s) are similar to those of other conspecifics in human care, and the
mean respiration rate is within the range of rates measured for wild conspecifics.
Ecological significance Whether the food consumption of wild adult male Amazon river dolphins can be estimated by using the results of the present study depends on the Amazon river dolphin's thermoneutral zone and the water temperatures it encounters in the wild. In addition its activity level in the wild is of importance.
The thermoneutral zone (temperature range at which the metabolic rate is lowest) is unknown for Amazon river dolphins. In the species' distribution area, water temperature varies between 23 and 30°C (Best and da Silva, 1989), and if the species is optimally adapted this may be its thermoneutral zone. The animals at Duisburg Zoo were probably kept within their natural thermoneutral zone, so the thickness of their fat layer may have been similar to that of wild conspecifics.
Because temperatures between 23 and 30°C are higher than those experienced by most other odontocetes, it would be of interest to know how Amazon river dolphins can dissipate enough heat to prevent heat stress during strenuous activity. To do this, most dolphins circulate more blood through the superficial layers of their fins and flukes (Scholander and Schevill, 1955). The Amazon river dolphin's pectoral fins are very large compared to those of most other odontocetes (Best and da Silva, 1989), and may play an important role in thermoregulation. In addition, the blubber layer in Amazon river dolphins is relatively thin (Bernhard Neurohr, pers. obs.).
The animals in the present study did not have to forage for food like their wild conspecifics, but they did have to catch live fish.
130

Food consumption of Amazon river dolphins
They swam almost constantly, and exercised by playing with each other or with toys (Ge-walt, 1989). In the wild this species usually swims at speeds of about 1.5 - 3.2 k m / h and only makes shallow dives (Cabrera and Yepes, 1940; Layne, 1958; Klima et al., 1980). These speeds are similar to those observed at other oceanaria (Defran and Pry or, 1980) and at Duisburg Zoo. However, the study animals' diving was limited by the depth of the pool.
Wild Amazon river dolphins feed both di-urnally and nocturnally, but fourage most actively between 0600 and 0900 h and between 1500 and 1600 h (da Silva, 1983). At Duisburg Zoo the animals were fed between 0800 and 1630 h, which is, to some degree, comparable to their natural feeding schedule.
The similarities in parameters which may influence food intake in the wild and at Duisburg Zoo suggest that the food intake of the male Amazon river dolphins in the present study may be comparable to that of their wild conspecifics. The information provided is not only of value for husbandry purposes, but also for conservation. Because this species is sexually dimorphic (adult males reach a length of 2.55 m, and weigh up to 160 kg, whereas females reach 1.96 m and 96.5 kg (Best and da Silva, 1984)), the present study (based on the food consumption of males) cannot be used to estimate the food requirements of the females.
Acknowledgements
We thank everyone at Duisburg Zoo who was involved in recording the dolphins' food consumption, especially U. Kluckner and P. Schulz. We thank Rob Triesscheijn for drawing the graphs, and Nancy Vaughan (Bristol University, United Kingdom), Ni
cole Schooneman and Dieter Kruska (Chris-tian-Albrechts University, Germany) for their comments on the manuscript.
References
Andersen, S. (1965) L'alimentation du Mar-souin (Phocoena phocoena L.) en captivite. Vie et milieu 16 A, 799-810.
Best, R.C. and da Silva, V.M.F. (1984) Preliminary analysis of reproductive parameters of the boutu Qnia geoffrensis) and the tucuxi (Sotalia fluviatilis), in the Amazon river system. In: Reproduction of Cetacea: with Special Reference to Stock Assessment (Eds. Perrin, W.F., DeMaster, D. and Brownell, R.L. Jr.). Int. Whaling Commn. Spec. Pub. 6, 361-369.
Best, R. C. and da Silva, V.M.F (1989) Amazon River dolphin, Boto Inia geoffrensis (de Blainville, 1817). In: Handbook of Marine Mammals, Vol. 4. River Dolphins and Larger Toothed Whales (Eds. S. Ridgway and R. Harrison). Academic Press, 1-23.
Cabrera, A. and Yepes, J. (1940) Mamiferos Sud-Americanos (Vida, Costumbres y Description). Historia Natural Ediar, Buenos Aires.
Caldwell, M.C. and Caldwell, D.K. (1972) The littlest ugly dolphin. Sea Front 18,24-30.
Caldwell, M.C, Caldwell, D.K. and Evans, W.E. (1966) Sounds and behavior of captive Amazon freshwater dolphins (Inia geoffrensis). L.A. County Mus. Contr. Sci. 108, 1-24.
Defran, R.H. and Pryor, K. (1980) The behavior and training of cetaceans in captivity. In: Cetacean behavior: mechanisms and processes (Ed. Herman, L.M.). John Wiley and Sons, Inc., New York, 319-362.
131

R.A. Kastelein et al.
Gewalt, W. (1989) Orinoco-Freshwater-dol-phins (Inia geoffrensis) using self-produced bubble 'rings' as toys. Aquatic Mammals 15 (2), 73-79.
Herald, E.S. (1967) Bouto and tookashee -Amazon dolphins. Pac. Discoveries 20, 2-9.
Kastelein, R.A. and Vaughan N. (1989, chapter 2.1) Food consumption, body measurements and weight changes of a female Killer whale (Orcinus orca). Aquatic Mammals 15 (1), 18-21.
Kastelein, R.A., Bakker M.J. and Dokter, T. (1990) The medical treatment of 3 stranded Harbour porpoises (Phocoena phocoena). Aquatic Mammals, 15(4), 181-202.
Kastelein, R.A., McBain, J. and Neurohr, B. (1993 a, chapter 2.12) Information of the biology of Commerson's dolphins (Cephalorhyn-chus commersonii). Aquatic Mammals 19(1), 13-19.
Kastelein, R.A., McBain, J., Neurohr, B., Mohri, M., Saijo, S., Wakabayashi, I. and Wiepkema, P.R. (1993 b, chapter 2.11) The food consumption of Commerson's dolphins (Cephalorhynchus commersonii). Aquatic Mammals 19(2), 99-121.
Kastelein, R.A., Ford, J., Berghout, E., Wiepkema, P.R. and Boxsel, M. van (1994, chapter 2.4) Food consumption, growth and reproduction of Belugas (Delphinapterus leucas) in human care. Aquatic Mammals 20(2), 81-97.
Kastelein, R.A., Hardeman, J. and Boer, H. (1997 a, chapter 2.13) Food consumption and body weight of harbour porpoises (Phocoena phocoena). In: The biology of the harbour porpoise (Eds. Read, A.J., Wiepkema, P.R. and Nachtigall, P.E.). De Spil Publishers, Woer-den, The Netherlands, 217-233.
Kastelein, R.A., Nieuwstraten, S.H. and Ver-stegen, M.W.A. (1997 b, chapter 2.15) Passage time of carmine red dye through the digestive tract of harbour porpoises (Phocoena phocoena). In: The biology of the harbour porpoise (Eds. Read, A.J., Wiepkema, P.R. and Nachtigall, P.E.). De Spil Publishers, Woerden, The Netherlands, 265-275.
Kastelein, R.A., Elst, C.A. van der, Tennant, H.K. and Wiepkema, P.R. (1998 a, chapter 2.10) Food consumption, growth, body dimensions and body temperatures of a female dusky dolphin (Lagenorhynchus obscu-rus).
Kastelein, R.A., Mosterd, J., Schooneman, N.M. and Wiepkema, P.R. (1998 b, chapter 2.5) Food consumption, growth, body dimensions and respiration rate of false killer whales (Pseudorca crassidens).
Kastelein, R.A., Staal, C. and Wiepkema, P.R. (1998 c, chapter 2.6) Food consumption and growth of Atlantic bottlenose dolphins (Tursiops truncatus).
Klima, M. Oelschlager, H.A. and Wiinsch, D. (1980) Morphology of the pectoral girdle in the Amazon dolphin (Inia geoffrensis) with special reference to the shoulder joint and the movements of the flippers. Z. Sauge-tierk. 45, 288-309.
Klocek, R. (1981) Chico's story: a special dolphin. Aquaticus 13, 1-13.
Layne, J.N. (1958) Observations on freshwater dolphins in the upper Amazon. J. Mammal. 39, 1-23.
Layne, J.N. and Caldwell, D.K. (1964) Behavior of the Amazon dolphin (Inia geoffrensis) (Blainville), in captivity. Zoologica 49, 81-108.
132

Food consumption of Amazon river dolphins
Pilleri, G. and Gihr, M. (1969) Zur Anatomie und Pathologie von Inia geoffrensis De Blain-ville 1817 (Cetacea, Susuidae) aus dem Beni, Bolivien. In: Investigations on cetacea, Vol. 1 (Ed. Pilleri, G.). Brain Anat. Inst., Univ. of Berne, 94-106.
Scholander, P.F. and Schevill, W.E. (1955) Counter current heat exchange in the fins of whales. J. Applied Physiol. 8, 279.
Silva, V.M.F. da (1983) Ecologia alimentar dol golfinhos da Amazonia. M.Sc. thesis, Univ. Amazonas, Manaus, Brazil.
Tobayama, T. and Kamiya, T. (1988) Observations on Inia geoffrensis and Platanista gan-getica at Kamogawa Sea World, Japan. In: Biology and Conservation of River Dolphins (Eds. Perrin, W.F, Brownell, R.L., Zhou Kai-ya and Liu Jiankang). IUCN Species Survival Commision Occasional Paper No. 5.
Trebbau, P. (1975) Measurements and some observations on the freshwater dolphin (Inia geoffrensis) in the Apure River, Venezuela. Zool. Garten N.F. (Jena) 45, 153-167.
Warner, A.C.I. (1981) Rate of passage of di-gesta through the gut of mammals and birds. Nutrition Abstracts and Reviews Series 'B' 51(12), 789-820.
133

Chapter 2.9
Food consumption and growth of common dolphins (Delphinus delphis)
R.A. Kastelein1, GJ. Macdonald2 and P.R. Wiepkema3
1 Harderwijk Marine Mammal Park, Strandboulevard Oost 1,3841 AB Harderwijk, The Netherlands
2 Marineland of New Zealand, Marine Parade, P.O. Box 123, Napier, New Zealand
3 Emeritus Professor of Ethology, Wageningen Agricultural University, Stationsweg 1, 6861 EA Oosterbeek, The Netherlands
Summary
Food consumption, body weight and body length were recorded in 4 female common dolphins at Marineland of New Zealand between 1974 and 1996. Annual food intake of 2 dolphins increased to 3300 kg at around 12 years of age, after which it decreased, stabilizing at around 2200 kg between the ages of 16 and 25 years. Annual food intake of the other 2 animals increased to 2700 kg at 7 years of age, then declined and stabilized at around 2000 kg between the ages of 8 and 12 years. The weights of 2 of the animals were first recorded at the ages of 7 and 8 years. During the following 19 years, body weight gradually increased from approximately 80 kg to around 95 kg. The other 2 animals grew from around 57 kg at the age of 3 years to about 100 kg at 12 years of age. No systematic seasonal food intake pattern was apparent in any of the 4 study animals. As body weight increased, daily food consumption as a percentage of body weight decreased. At around 55 kg, the dolphins consumed the equivalent of around 12% of their body weight per day. When body weight had reached around 100 kg, daily consumption had fallen to 6% of body weight.
Key words: odontocete, energetics, body length, body weight
Introduction mackerel and pilchards (Fitch and Brownell, 1968; Ross, 1984; Major, 1986; Overholtz and
Although the common dolphin (Delphinus Waring, 1991; Gaskin, 1992; Kuiken et ah, delphis) has a wide distribution (Gaskin, 1994; Osnes-Erie, 1995). 1992) and much is known about its foraging Diet may vary seasonally in some areas, habits, the species has seldom been main- Herds frequently cooperate in prey capture; tained in captivity. Consequently relatively for example, they may dive below a school little quantitative information is available on of fish to drive it to the surface. Common its food intake requirements. dolphins have also been reported seen to
catch fish in mid-air. Off southern Califor-Common dolphins feed on a wide variety of nia, they feed mostly nocturnally, on orga-squid and fish species, particularly school- nisms associated with the deep scattering ing fish such as sardines, anchovies, herring, layer, which rises at night (Gallo, 1991).
135

R.A. Kastelein et al.
Dives of up to 260 m and 8 minutes have been recorded (Evans, 1971).
Records of food consumption and body weight changes in toothed whales may be of interest to zoological parks that keep odon-tocetes, providing a reference for veterinary and husbandry purposes. Food consumption data from animals in human care may also be used to estimate the impact of wild individuals on fish populations, and to determine the carrying capacity in a particular area.
This study, therefore, describes the food consumption, body weight and body length changes of 4 female common dolphins at Marineland of New Zealand between 1974 and 1996.
Materials and methods
Study animals The 4 female common dolphins used in this study (Fig. 1) originated from Hawke Bay, North Island, New Zealand. The birth date of each animal was estimated on the basis of body size (Table 1). These estimates are believed to be accurate, as the animals were very young on arrival. Age one represents the first calendar year after the year of birth. Body weight was recorded 2-5 times per year (usually 4 times) for husbandry purposes, and standard body length (straight line from tip of rostrum to notch of tail fluke) of each animal was measured 3 to 4 times between 1987 and 1997. None of the study animals reproduced during the study period, as no males were present.
Figure 1. The 4 common dolphins at Marineland of New Zealand (Photo: R.W. Kluts).
136

Food consumption of common dolphins
Table 1. The estimated birth dates and arrival dates of the 4 female common dolphins at Marineland of New Zealand.
Animal Estimated year of birth
DdMNZOOl DdMNZ002 DdMNZ003 DdMNZ004
1971 1970 1984 1984
Arrival date at Marineland
13-12-1974 13-12-1974 27-01-1987 26-01-1987
Study area The animals were maintained primarily in an outdoor pool system consisting of a main pool (30 x 15 m, 4.1 m deep) and an adjacent holding pool (9.2 x 9.2 m, 2.3 m deep). The animals had free access to both pools. The main pool was the location of the 2-3 daily shows. A second pool system was used during maintenance work on the main system, consisting of a round pool (15 m diameter, 2.3 m deep), and an adjacent holding pool (9.1 x 4.5 m, 2 m deep). The dolphins had free access to both pools, and shows were presented as usual. Maintenance work on the main pool was done in 1977, 1978, 1983, 1984,1989, 1990, 1991, 1992, 1993 and 1995, generally in November. The water was pumped from the sea bed via feeder pipes laid under the seabed itself, and wells on the beach front. The salinity was recorded from 1992 to 1996, and remained low at between 1.008 ppm and 1.033 ppm. Average weekly water temperature from 1981 onwards, varied from 11.1 °C in June to 22.2°C in January. The average weekly air temperature at Marineland (1981 - 1996) ranged from 8.9°C in July to 28.4°C in February. Napier, the site of Marineland, lies on the east coast of North Island, New Zealand (176°56' E and 39°20' S).
Food The study animals were fed primarily on a vitamin-enriched diet of defrosted fish (Dutch herring, Clupea harengus harengus, king salmon, Oncorhynchus tschawytscha, yellow eyed mullet, Aldrichetta forsteri, Jack mackerel, Trachurus declivis, tuna/albacore, Thunnus alalunga, sprat, Sprattus antopodum, gemfish, Rexea solandri, alfonsino, Beryx splendens, barracouta, Thyrsites atun, pelagic carnidalfish, Howella brodiei, blue mackerel, Scomber australasicus, red gurnard, Chelidon-ichthys kumu, red cod, Pseudophycis bachus/ Phyiculus bachus, trevally, Pseudocaranx den-tex, kahawai, Arripis trutta, hake, Merluccius australis, hoki, macruronus novaezelandiae, and arrow squid, Nototodarus sloanii). Proportions were varied and, when available, fresh fish was included in the diet. The type and amount of fish eaten per feed was recorded for each dolphin. Daily food records form the basis of the present study.
The animals were fed a fixed base ration each day, normally in three meals. The base ration for each animal was monitored, and, if necessary, adjusted weekly, on the basis of progress in training, speed at which the fish were swallowed, and infrequent (about 4 times per year) body weight measurements. After the age of 7 years, animals 003 and 004 were given lower base rations to improve the consistency of their performance.
137

R.A. Kastelein et al.
A 3500-
3 3000 -
1 2500 • 4-1
a E g 2000-c o •o 1500 -o
£
An
nu
al
o
o
o
o
n .
V. Female 001
4 6 8 10 12 14 16 18 20 22 24
1 T
975
Age (year)
B. Female 001
o>
120
110
~ 100 £
| 90 >. •o
i 80 0) ra E 70 Q>
60
50 4 6
t 1975
8 —i 1 1 1 1 1 1 1 1 1 1 1 i 1 1 i 1
10 12 14 16 18 20 22 24 26
Age (year)
Figure 2. The annual food consumption (a) and average annual body weight (b) of female common dolphin 001.
138

Food consumption of common dolphins
Results
Annual food consumption and body weight Dolphin 001 showed an increase in annual food consumption from 1800 kg at 4 years of age to 3300 kg at the age of 12 years. Thereafter, her annual food intake decreased, to stabilize at around 2300 kg at the age of 17 years (Fig. 2 a). Her annual average body weight was stable between the ages of 7 and 8 years, increased until the age of 11 years, then stabilized (Fig. 2 b). Between the ages of 18 and 26 years, standard body length showed little change (Fig. 3).
Between the ages of 5 and 11 years, the annual food consumption of animal 002 increased from 1700 kg to 2900 kg, then decreased, stabilizing at around 2100 kg at the age of 18 years (Fig. 4 a). Her annual average
body weight increased gradually from 8 to 26 years of age (Fig. 4 b). Between the ages of 19 and 27 years, there was little change in standard body length (Fig. 3).
Female 003 showed an increase in annual food consumption from 2250 kg to 2700 kg between the ages of 3 and 7 years. Thereafter, annual food intake decreased under the new training regime, and stabilized at around 2200 kg (Fig. 5 a). Between the ages of 3 and 12 years, her annual average body weight showed a gradual increase (Fig. 5 b), and standard body length rose from 170 cm to 187 cm (Fig. 3). Between the ages of 3 and 7 years, dolphin 004 showed an increase in annual food consumption from 2300 kg to 2600 kg. Under the new training regime, this fell and stabilized at around 2000 kg (Fig. 6 a). Between 3 and 12 years of age, average body weight gradu-
E o
c O
>• •o o JO
210
200
190-
180-
ra •a I 170 (0
160
-o- Female 001 -*- Female 003
-Female 002 •Female 004
- i — i — i — i — i — i — i — i — i — i — i — i — i — i — i — i — i — i — i — i — i — i — i — i — i — i — i — i
0 2 4 6 8 10 12 14 16 18 20 22 24 26 28
Age (year) Figure 3. Age versus standard body length of all 4 study animals.
139

R.A. Kastelein et al.
A. Female 002 3500-1
o5 3000
I 2500 a. E 3 2000 c o
-o 1500 o & n 1000 3 C < 500
• 6 1975
10 12 14 16 18 20 22 24 26
Age (year)
B. Female 002 120
110 TO
Z 100 a | 90 >•
« TO E 70 o > < 60
50 -I 1 1 1 1 1 1 1 1 1 1 1 1 1 1 1 1 1 1 1 1 1 i 1
6 8 10 12 14 16 18 20 22 24 26 28
Age (year)
Figure 4. The annual food consumption (a) and average annual body weight (b) of female common dolphin 002.
t 1975
140

Food consumption of common dolphins
ally rose (Fig. 6 b), and standard body length increased from 162 cm to 190 cm (Fig. 3). During the course of a year, body weights fluctuated in all animals, but these fluctuations were not seasonal.
Seasonal food intake fluctuations The monthly food intake of the 4 animals fluctuated, but no systematic seasonal pattern was apparent.
Food consumption as a percentage of body weight There is a negative relationship between body weight and average daily food consumption as a percentage of body weight (of the month in which the weight measurement was recorded; Fig. 7). At around 55 kg, the dolphins consumed the equivalent of around 12% of their body weight per day; this fell to 6% at a body weight of around 100 kg. Animal 001 showed wide fluctuations around this pattern, associated with the training process and incomplete meals.
Discussion and conclusions
Annual food consumption Patterns in food intake and growth of dolphins 001 and 002, which arrived simultaneously, were comparable, but annual consumption and body weight of female 001 were consistently higher. The food intake and growth patterns of animals 003 and 004, which arrived one day apart, were also comparable, although after the age of 7 years, female 004 was heavier and consumed more fish per year than animal 003. The latter animals were 5 to 15 kg heavier than females 001 and 002 at similar ages. While this could be due to natural variation, it may reflect a slow habituation to captivity by animals 001 and 002. During the first 2 years, these animals ate relatively little and their body weights showed little change. Animals 003 and 004 may have habituated faster in the
presence of habituated animals 001 and 002, and due to the increased husbandry experience of the staff.
All 4 animals showed an initial increase in annual food intake, followed by a decrease and stabilization. The high food intake of young dolphins 003 and 004 probably reflected high growth rates. The maximum food intake in animals 001 and 002, however, was reached at 11-12 years of age, while the intake of animals 003 and 004 peaked at the age of 7 years. The decrease in food intake of animals 003 and 004 after the age of 7 years was caused by a change in feeding procedure.
The decline in food intake and length gain in the present study occurred when the dolphins were between 7 and 12 years old. The geographical distribution of the common dolphin is wide, and regional variations in size are large (Gihr and Pilleri, 1969). In the North Pacific Ocean, females are sexually mature at the age of approximately 8 years, with an average length of 171 cm, and with a predicted asymptotic length of 179 cm (Fer-rero and Walker, 1995). Off southern California females mature at around 7 to 12 years of age, at a length of between 165 and 182 cm (Hui, 1979). The wide range in the latter study suggests the sample may have contained both long- and short-snouted common dolphins, which differ in morphology-
There is very little available data on the relationship between age and body weight in common dolphins. The majority of studies of body weight used stranded animals, which are unlikely to be representative of healthy animals. A number of studies, however, relied on animals accidently caught in fisheries and are thought to be more representative. In the eastern tropical Pacific,
141

R.A. Kastelein et al.
3&UU -
_ 3000-
c 2500-
tio
Q.
| 2000-w c 8 1500-73 O
£ 1000-
Ann
ua
o
o
n .
3 4 5 6
t 1987
B. Female 003
7 8 9 10 11 12
Age (year)
i 1—
8 9
— i —
10
1 1 1
11 12 13
Age (year)
3 4 5 6 7
t 1987
Figure 5. The annual food consumption (a) and average annual body weight (b) of female common dolphin 003.
142

Food consumption of common dolphins
A 3500-
3 3000 -
c
food
con
sum
ptic
Ol
o
o
o o
c
o
o
c
Ann
ual
Ol
O
o
o
o
o
1
1 1
n .
k. Female 004
3 4 5 6 7 8
t 1987
B. Female 004 120-1
10 11 12
Age (year)
3 4 5 6 7 8 9 10 11 12 13
| Age (year) 1987
Figure 6. The annual food consumption (a) and average annual body weight (b) of female common dolphin 004.
143

R.A. Kastelein et al.
A. Female 001 13 T
12
11
10
9
8
5-
' • •
*
— i —
95 —r-100 80 85 90 105
Body weight (kg)
B. Female 002 13
12
.2 11 a. E -w .2? c o
8 * 9
J2 8 7 -
6-
70 75 — i —
80 85 — i —
90 95 100
Body weight (kg)
144

Food consumption of common dolphins
C. Female 003
13
12
11
3 "Si
£ 10
o 4-1 Q.
(0 ._ C «
o * 1 1 > «
8 °
d) M
& d>
3
9 -
8-
5s 7 - • • •
50 55 60 65 70
— i —
75 80 85
— i —
90
i
95
— i —
100 — i
105
Body weight (kg)
D. Female 004 13
12 c o
i. is
» .2> 10
8 o
11 -
9 -
>."S « 3 -0) W o) co
s I
8-
6 -
5 -
• • • -» • •
50 55 60 65 70 75 80 85 90 95 100 105 110 115 120
Body weight (kg)
Figure 7. The relationship between body weight and food intake as a percentage of body weight for the female common dolphins. 001 (a), 002 (b), 003 (c) and 004 (d).
145

R.A. Kastelein et al.
common dolphins, mostly male, were a little lighter than females of similar age in the present study (Andre et al, 1990) (Table 2). Only a 93 kg 14-year-old male was within the range of the females in the present study, possibly due to a more pronounced sexual dimorphism at an older age. Whether the weight difference between studies is due to sexual dimorphism, differences between stocks, or obesity of the study animals is not clear. However, a captive adult female from waters around New Zealand, the area from which the animals in the present study originate, had a body length (201 cm) and weight (94 kg) within the range for adults in the present study (Logan and Robson, 1971)
Seasonal food intake fluctuations No seasonal food intake patterns were found in the present study, despite the 10°C temperature difference between summer and winter. This may result from the animals being kept within their, probably flexible, thermoneutral zone, as demonstrated for bottlenose dolphins, Tursiops truncatus (Williams and Friedl, 1990).
In the wild, seasonal differences in food in
take may be induced by reproduction, once the animals have reached sexual maturity. In the north Pacific Ocean, females mature at the age of about 8 years. The gestation period is estimated to be 11 months, and calving appears to peak in May and June (Ferrero and Walker, 1995). In bottlenose dolphins, lactation drastically increases the food intake of the females (Kastelein et al, 1998 a and b), and may do so in common dolphins. In the present study, however, none of the females reproduced, so the effect of gestation and lactation on food intake could not be monitored.
Food consumption as a percentage of body weight Four common dolphins accidentally by-caught off the northeastern United States were shown, on the basis of stomach contents, to have been feeding exclusively on Atlantic mackerel, Scomber scombrus (Over-holtz and Waring, 1991). Their daily ration (Table 3) was estimated from a theoretical model of energetic needs and an assumed energy content of 1.43 kCal /g for Atlantic mackerel. The estimates agree fairly well with the data from the present study (Fig. 7), although the requirement of the 62 kg ani-
Table 2. Ages and body measurements from common dolphins caught at sea from the eastern tropical Pacific (from Andre et al, 1990).
Sex
M F M M M M M M
Body length (cm)
128 145 165 179 195 205 206 210
Body weight
(kg)
27 28 49 60 73 80 78 93
Age
(year)
0.6 0.8 2 3
12 10 14 14
146

Food consumption of common dolphins
Table 3. The stomach contents of 4 incidentally bycaught common dolphins off northeastern United States which had been feeding exclusively on Atlantic mackerel (Scomber scombrus), and the estimate of Overholtz and Waring (1991)* for the daily required ration, and the estimated daily ration based on data of the present study.
Body length (cm)
170 200 207 213
Body weight (kg)
62 94
104 110
Sex
M M F M
Stomach contents (kg)*
0.7 1.2 2.4 0.3
Est. % of ration
20 23 44
6
Est.daily ration (kg)*
3.5 5.2 5.5 5.0
Estimated daily ration based on data of present study (kg)
5.5 4.9, 5.0, 5.6, 5.8, 5.9, 7.2, 8.5 5.1 5.0
mal was underestimated. The estimate, however, probably did not take into consideration the fact that common dolphins of that weight are young, undergoing a period of rapid growth, and require a relatively large amount of food.
Ecological significance The present study can provide only a rough estimate of food intake in wild common dolphin populations, as it is based on only 4 animals, all female. Common dolphins show a distinct sexual dimorphism, adult males being on average 10 cm longer than females from the same stock (Hui, 1979; Ferrero and Walker, 1995). After maturation, therefore, males probably consume more than non-lactating females of similar age. Information on food intake of males, therefore, is necessary to provide a more accurate estimate of food intake of a common dolphin population. The females in the present study did not reproduce, as no males were present. Lactating small cetaceans require much more food than non-lactating females (Kas-telein et al., 1993; 1998 a and b), suggesting that average consumption of wild adult female common dolphins is higher than that of the study animals.
Water temperature may influence food intake in cetaceans, by affecting thermoregu
lation. While the common dolphin has been found in waters between 1 and 24°C, most sightings occur in waters between 7 and 23°C (Gaskin, 1968; Selzer and Payne, 1988; Winn, 1982). The water temperature at Mari-neland of New Zealand falls within this range, suggesting that the animals were maintained within the thermoneutral range for the species assuming wild animals are well-adapted to their environment. When considering temperature, therefore, data from the present study may be considered representative of wild populations.
Acknowledgements
We thank Janny Hardeman, Carolien Staal, Nicole Schooneman, Tineke Rippe and Eleanor Hayes (University of Bristol, U.K.) for their comments on this manuscript. Rob Triesscheijn made all the drawings.
References
Andre, J.M., Ribeyre, F. and Boudou, A. (1990) Relations entre l'age, la longueur to-tale, le poids total et le poids des organes chez trois especes de dauphins de la zone tropicale Est de 1'ocean Pacifique. Mammalia 54(3), 479-488.
147
R.A. Kastelein et al.
Evans, W.E. (1971) Orientation behaviour of delphinids: radio telemetric studies. Ann. N.Y. Acad. Sci. 188, 142-160.
Ferrero, R.C. and Walker, W.A. (1995) Growth and reproduction of the common dolphin, Delphinus delphis Linnaeus, in the offshore waters of the North Pacific Ocean. Fishery Bulletin 93, 483-494.
Fitch, J.E. and Brownell Jr, R.L. (1968) Fish otoliths in cetacean stomachs and their importance in interpreting feeding habits. J. Fish. Res. Board Can. 25, 2561-2574.
Gallo, J.P. (1991) Group behavior of common dolphins (Delphinus delphis) during prey capture. Anales Inst. Biol. Univ. Nac. Auton. Mexico. Ser. Zool. 62(2), 253-262.
Gaskin, D.E. (1968) Distribution of Delphini-dae (Cetacea) in relation to sea surface temperatures off eastern and southern New Zealand. New Zealand Journal of Marine and Freshwater Research 2, 527-534.
Gaskin, D.E. (1992) Status of the Common Dolphin (Delphinus delphis) in Canada. Can. Field-Nat. 106(1), 55-63.
Gihr, M. and Pilleri, G. (1969) On the Anatomy and Biometry of Stenella styx Gray and Delphinus delphis L. (Cetacea, Delphinidae) of the Western Mediterranean. In: Investigations on Cetacea, Vol. 1 (Ed. Pilleri, G.). Brain Anatomy Institute, Berne, Switzerland, 15-65.
Kastelein, R.A., McBain, J., Neurohr, B., Mohri, M., Saijo, S., Wakabayashi, I. and Wiepkema, P.R. (1993, chapter 2.11) Food consumption of Commerson's dolphins (Ce-phalorhynchus commersonii). Aquatic Mammals 19(2), 99-121.
Kastelein, R.A., Nieuwstraten, S.H., Walton, S. and Wiepkema, P.R. (1998 a, chapter 2.7) Food intake and growth of Atlantic bottle-nose dolphins (Tursiops truncatus).
Kastelein, R.A., Staal, C. and Wiepkema, P.R. (1998 b, chapter 2.6) Food consumption and growth of Atlantic bottlenose dolphins (Tursiops truncatus).
Kuiken, T., Simpson, V.R., Allchin, C.R., Bennet, P.M., Codd, G.A., Harris, E.A., Howes, G.J., Kennedy, S., Kirkwood, J.K., Law, R.J., Merrett, N.R. and Phillips, S. (1994) Mass mortality of common dolphins (Delphinus delphis) in south west England due to incidental capture in fishing gear. The Veterinary Record, January 22, 81-89.
Logan, F.D. and Robson, F.D. (1971) On the birth of a Common dolphin (Delphinus delphis L.) in captivity. Zool. Garten, Leipzig 40(3), 115-124.
Major, P.F. (1986) Notes on a predator-prey interaction between common dolphins (Delphinus delphis) and short-finned squid (Illex illecebrosus) in Lydonia Submarine Canyon, Western North Atlantic Ocean. J. Mamm. 67(4), 769-770.
Hui, C.A. (1979) Correlates of maturity in the common dolphin, Delphinus delphis. Fishery Bulletin 77, 295-300.
148

Food consumption of common dolphins
Osnes-Erie, L.D. (1995) Food habits of short-beaked (Delphinus delphis) and long-beaked (Delphinus capensis) common dolphins off California. Abstract of the Marine Mammal Society Conference, Orlando.
Overholtz, W.J. and Waring, G.T. (1991) Diet composition of Pilot whales (Globicephala sp.) and Common dolphins (Delphinus delphis) in the Mid-Atlantic Bight during Spring 1989. Fishery Bulletin, U.S. 89, 723-728.
Ross, G.J.B. (1984) The smaller cetaceans of the south-east coast of southern Africa. Ann. Cape Prov. Mus. (Nat. Hist.) 15(2), 173-410.
Selzer, L.A. and Payne, P.M. (1988) The distribution of white-sided (Lagenorhynchus acutus) and common dolphins (Delphinus delphis) vs. environmental features of the continental shelf of the northeastern United States. Marine Mammal Science 4, 141-155.
Williams, T.M. and Friedl, W.A. (1990) Heat flow properties of dolphin blubber: insulating warm bodies in cold water. American Zool. 30(4), 191.
Winn, H.E. (1982) A characterization of marine mammals and turtles in the mid and North American areas of the U.S. Outer Shelf. Final Report of Cetacean and Turtle Program (CeTAP), contract no. AA551-CT8-48 to the Bureau of Land Management, U.S. Department of the Interior, Washington, D.C.
149

2
3
Chapter 2.10
Food consumption, growth, body dimensions and body temperatures of a female dusky dolphin
(Lagenorhynchus obscurus)
R.A. Kastelein1, C.A. van der Elst2, H.K. Tennant2
and P.R. Wiepkema3
Harderzvijk Marine Mammal Park, Strandboulevard Oost 1, 3841 AB Harderzvijk, The Netherlands
Sea World, Durban, South African Association for Marine Biological Research, P.O. Box 10712, Marine Parade, 4056, Durban, South Africa
Emeritus Professor of Ethology, Wageningen Agricultural University, Stationsweg 1, 6861 EA Oosterbeek, The Netherlands
Summary
Food consumption, body measurements, weight changes and body temperatures of a female dusky dolphin are presented for 13 years that she was at Sea World, Durban. Her annual food consumption increased from 1870 kg at the age of 3 years to 2170 kg when she was 5 years old. During her 6th year her annual food intake increased to around 2900 kg. This increase coincided with the installation of a cooling system which was used in the summer in the years thereafter. After her sixth year, her food consumption fluctuated between 2400 and 2800 kg per year. The dolphin's body weight increased gradually from around 52 kg at the age of 2 to around 66 kg at the age of 6 years. Thereafter, her weight fluctuated between 61 and 74 kg. At the age of 3, when she weighed around 55 kg, she ate on average 9% of her body weight per day. At the age of 6, when she weighed around 65 kg, she consumed on average 12% of her body weight per day. At the age of 14 years, when she weighed around 70 kg, she consumed on average 10% of her body weight daily. In general, her food intake was above average during autumn and winter, and below average during spring and summer. The average pool water temperature fluctuated seasonally, being lowest (around 22°C) in July, and highest (around 27°C before 1985 and 25°C after 1985) in January. The median initial passage time of carmine red dye through the gastrointestinal tract of the dusky dolphin was 150 minutes and the average rectal temperature was 36.9°C.
Key words: odontocete, energetics, body weight, body measurements, carmine red, initial passage time
Introduction phins are found in schools of 2 to 800 animals (Findlay et al., 1992). They range from
The dusky dolphin {Lagenorhynchus obscu- close inshore to the continental shelf break rus) is a circumpolar coastal species of the (Hawke, 1989). During the summer, dusky southern hemisphere temperate zone, found dolphins in New Zealand waters move off-around New Zealand, South Africa and shore in the late afternoon and return to South America (Brownell, 1974). Dusky dol- nearshore in the early morning. They make
151

R.A. Kastelein et al.
relatively short dives (of less than 2 minutes) and seem to follow the diurnal vertical migration of prey (Cipriano et al., 1989).
So far, few quantitative data have been collected on the food requirements of dusky dolphins. This is probably because the dusky dolphin has only been kept in human care in South Africa and New Zealand. Food consumption, body measurements and weight changes of toothed whales can be of importance to many groups. For example, zoological parks that keep odontocetes might want to compare their food and weight data to a reference for husbandry and veterinary purposes. Also, for the management of a species in the wild, food consumption data may help in evaluating the relationship of the species with prey populations. The data may assist the management of the prey to allow for a certain number of toothed whales in a particular geographical area.
Sea World, Durban, has housed a female dusky dolphin since 1981. This paper describes the food consumption, food passage time, growth and body temperatures of the animal over 13 years.
Materials and methods
Study animal The study was conducted on a female dusky dolphin (LoSDOOl) which was head-netted off Hout Bay (34° S and 18°30' E), South Africa, on 24 February 1981. At the time of capture she weighed around 50 kg and was estimated to have been born in 1979. A month after capture the animal was transported by air to Sea World, Durban, to join a male dusky dolphin that had been rehabilitated after accidental capture in a beach seine net some years before. The study animal did not settle down readily, was hyper
active, and displayed signs of dominance over the much larger bottlenose dolphins (Tursiops truncatus) with which she shared the facility. Although her health was generally good, she was periodically treated for Candida spp. between 1983 and 1989 (Fother-gill and Jogessar, 1986).
Study area The animal was housed in an indoor and outdoor pool system consisting of 6 pools. The main show pool is outdoors (23 m x 13 m; 6 m deep). Two pools join the main pool; these are dolphin pool A (11 m x 8 m; 3 m deep) and dolphin pool B ( l l m x l l m ; 3 m deep). The 2 dolphin pools interconnect via a central medical pool (9 m x 6 m; 1.2 m deep). Leading off this pool are 2 additional pools: the isolation pool (7 m x 10 m; 3 m deep) and the training pool (17 m x 10 m; 3 m deep).
During the study period, the dusky dolphin occupied each of these pools, usually with the other dusky dolphin until 1985. After the death of her mate in that year, she was kept with an orphaned bottlenose dolphin for 2 years. Later she was housed with stranded subantarctic fur seal (Arctocephalus tropica-lus) pups. During the last 4 years of the study she displayed a preference for being housed alone. She would chase and fight with the bottlenose dolphins and, when not fighting, would stay on her own in one corner of the pool.
The pools were filled with natural sea water which was chlorinated. The salinity varied between 3.4 and 3.5%. During the year the average monthly water temperature varied between 22°C in July and 27°C in January. The installation of a cooling system in 1985 allowed the average monthly water temperatures between November and March to drop by about 2°C. In the first year with the new system, the temperatures dropped by
152

Food consumption of a dusky dolphin
on average 3°C. The average monthly air temperature varied between 17.9°C in July and 24.9°C in February. Sea World, Durban is located at 31 °1' E and 29°49' S.
Food The study animal was fed 5 to 6 times per day on a diet that was comprised on average by weight of 30% hake (Merluccius spp.), 45% cephalopods (squid (Loligo spp.) and octopus (Octopus vulgaris) or cuttlefish (Sepia spp.)) and 25% miscellaneous teleosts depending on availability (horse mackerel (Trachurus trachurus capensis), sardine (Sardi-nops sagax), maasbanker (Cubiceps spp.), sole (Austroglossus pectoralis), sciaenid fishes (Ar-gyrosomus spp., Atrobucca nibe, Johnius spp. and Otolithes ruber) and greeneye (Chloropth-almus punctatus)). The fish was kept frozen at -32°C for a maximum period of 4 months and regularly monitored to ensure high quality. Vitamin supplements, which were added to the food daily, provided multivitamins (Theragram M, 3 dd 500 mg), vitamin B, (Leppin, 2 dd 100 mg) and vitamin E (Alpha, 1 dd 1000 mg).
Prior to 1990, the daily food given was partly regulated by changes in the dolphin's body weight; when she had gained more than 6 kg, her food ration was reduced a little to increase her performance in the shows. At Durban, dusky dolphins do not perform if a little overweight unlike bottlenose dolphins that still perform when overweight. When the animal was 11 years old, training ceased, and she was allowed to eat as much as she wanted. Records were kept of the amount and type of food consumed during each feed. These daily food intake data form the basis of the present study.
To determine whether a systematic seasonal fluctuation in food intake occurred, the average daily food intake for each month was
calculated for the years 1986 to 1994, the years in which the cooling system was operational. Per year, the average monthly intakes were ranked from 1 to 12, such that the month with the highest food intake was designated as 12, and the month with the lowest food intake was ranked as 1. The average rank per month was calculated over 9 years.
Passage time of food through the gastrointestinal tract To measure the passage time of food through the gastrointestinal tract, 2 gelatine capsules each containing 100 mg of carmine red dye were fed to the dolphin in the diet. The capsules were offered at various times of day, but never at night. Normally, the study animal's faeces were dark green. The intake time of the dye and the time of its first appearance (initial passage time) in the faeces were recorded. Tests were conducted between May 1994 and January 1995.
Body weight and dimensions The animal was weighed frequently on a load-cell scale (Challenger, 2500 kg capacity, 1 kg accuracy). Her body length (point to point dorsally following the body contour) was measured twice, and detailed body measurements were taken once.
Rectal temperatures The animal's body temperature was determined using a digital rectal thermometer (YSI, model 49 TA). The dolphin was trained to present her rectum while she was in the water at the side of the pool. The thermometer inserted approximately 15 cm into the anus.
Results
Annual food consumption The dolphin's annual food consumption increased from 1870 kg at the age of 3 years to
153

R.A. Kastelein et al.
2170 kg when she was 5 years old (Fig. 1). The relatively low food intake at the age of 4 was due to a reduction in food as part of the animal's training programme.
After her 5th year her annual food intake increased to around 2900 kg. This increase coincided with the installation of a cooling system which was used between November and March (the summer) of that and subsequent years. During the learning process with the system, the average summer water temperature was dropped approximately one degree more during 1985 than during the following years. After her 6th year her food consumption fluctuated between 2400 and 2800 kg per year.
In her 11th year she became incompatible with the larger bottlenose dolphins. She was placed alone in a pool and was no longer trained. After this change she was allowed
to eat ad lib. This resulted in a sudden increase in food intake in her 11th year to 3100 kg/year (but did not result in a weight gain), after which her food intake stabilized at around 2600 kg/year.
Body weight The dolphin's body weight gradually increased from approximately 52 kg at the age of 2 years to around 66 kg at the age of 6 years. Thereafter, her weight fluctuated between 61 and 74 kg (Fig. 2).
Food consumption relative to body weight At the age of 3, when the animal weighed approximately 55 kg, she ate on average 9% of her body weight per day. At the age of 6, when she weighed around 65 kg, she consumed on average 12% of her body weight per day. At the age of 14 years, when she weighed about 70 kg, she consumed on average 10% of her body weight daily.
c o *3 o. E tf> C o •o
£ To 3 C C <
3SUU -
3000-
2500-
2000-
1500-
1000-
500-
n .
©
®
3 1982
10 11 12 13 1990
14 15
Age (year)
Figure 1. The female dusky dolphin's annual food consumption. Age 3 represents the third calender year after birth. 1) low food intake due to training regime, 2) first year (1985) in which the water was cooled during the summer, and 3) high food intake which coincided with separation from bottlenose dolphins and ad lib. feeding.
154

Food consumption of a dusky dolphin
8O-1
75
70
at £ 65 O)
'3 60 -S •o 55 m
50 H
45
40 — i 1 1 1 i i 1 1 1 1 i i i i
2 3 4 5 6 7 8 9 10 11 12 13 14 15 Age (year)
Figure 2. The body weight changes of the female dusky dolphin while at Sea World, Durban.
Seasonal food intake fluctuations The average ranks of monthly food intake between 1986 and 1994 (years in which her annual food intake was fairly stable) show that in general the dolphin's food intake was above average during autumn and winter, and below average during spring and summer (Fig. 3).
The average pool water temperature fluctuated seasonally, being lowest (around 22°C) in July, and highest (around 27°C before 1985 and 25°C after 1985) in January (Fig. 4). The seasonal food intake fluctuates conversely with monthly water temperature, but with a delay.
Passage time through the gastrointestinal tract Initial passage times and diets are shown in table 1. The median initial passage time of carmine red dye through the gastrointestinal tract was 150 minutes.
Body measurements The animal's body length (point to point following the body contour) was 169 cm on 9 February 1982, and 171 cm on 3 August 1982 (when she was 3 years old). Detailed body measurements were taken on 9 June 1994 when the animal was 15 years old (Table 2). In this table the body length was measured in a straight line parallel to the body axis.
Rectal temperatures The dolphin's rectal temperatures are shown in table 3. The temperature averaged 36.9°C (SD = 0.5, n = 12).
Discussion and conclusions
Annual food consumption and growth The growth curve (body weight) is of a similar shape as the annual food intake curve. Sergeant (1969) reports that a Pacific white-sided dolphin (Lagenorhynchus obliquidens)
155

R.A. Kastelein et al.
12
10 0
* -.E 8 •o o o
c S • . u> 4 &
2H
Summer Autumn Winter 1 1 •—i 1 1
J F M A M J i i
J A S
Spring
N D
Month Figure 3. The average seasonal fluctuations in food intake of the female dusky dolphin over 9 years. The higher the average rank number, the higher the relative food intake. The bars indicate standard deviations.
28
27 H
O S~ 26 S 2 25 0 Q.
| 24 H
fl) I 23 i S> 22 2 a> 3 21
20
Without cooling system
With cooling system
M M 1 1 1
J J A S 1 1 1
O N D Month
Figure 4. The average monthly water temperatures of the study pools, before the cooling system was installed (1981-1984) and after the cooling system became operational during the summers (1986-1994).
156

Food consumption of a dusky dolphin
of 87 kg consumed on average 7.9% of its body weight per day. This is comparable to the animal in the present study which ate on average 10% of her body weight per day when she weighed 70 kg. In general, the larger the animal, the smaller the relative food intake (i.e. the lower its basal metabolic rate).
Seasonal food intake fluctuations The seasonal food intake fluctuated conversely with monthly water temperature, but with a delay. Bottlenose dolphins adapt their blubber thickness to the temperature of the surrounding water (Williams and Friedl, 1990). If the dusky dolphin in the present study was also able to adapt her blubber thickness to the water temperature, the relatively low food intake in June, July and August could be explained. By that time the dolphin may have increased her blubber layer as an adaptation to the colder environment. If this assumption is true, the seasonal fluctuations in food intake were caused
mainly by thermal requirements. However, maybe due to the small temperature range, and the delay, no relationship was found between water temperature and food consumption.
The birthing and mating season of dusky dolphins is usually in the austral spring between August and October (Van Waerebeek and Read, 1994). Females are expected to have higher energy demands during lactation.
Body measurements Compared to a bottlenose dolphin, the dusky dolphin is slender (measurements 1 and 44 in Table 2; Fig. 5 a and b) and has a less elongated snout (Fig. 5 c).
Passage time of food through the gastrointestinal tract Although the sample size was small, and the values varied greatly (possibly due to the season, time of day, or diet), the present
Table 1. The initial passage times of carmine red dye through the digestive tract in the female dusky dolphin at Sea World, Durban.
Date Time of Meal day dye size fed (g)
Passage time (min)
Diet
04-05-1994 10-05-1994 18-05-1994 06-06-1994 09-06-1994 12-08-1994 14-09-1994 23-09-1994 29-11-1994 30-11-1994 17-01-1995 23-01-1995
0800 0800 0800 0800 0915 1200 1115 1130 1405 1410 1400 1540
1500 1500 1500 1500 1500 1500 1500 1500 1200 1200 1200 1200
215 225 250 180 165 150 150 135 105 115 120 100
Maasbanker, sardine, cuttlefish, hake, squid Maasbanker, sardine, cuttlefish, hake Maasbanker, sardine, cuttlefish Maasbanker, sardine, cuttlefish Maasbanker, sardine, cuttlefish Maasbanker, sardine, cuttlefish, hake Maasbanker, sardine, cuttlefish, kob, squid Maasbanker, sardine, cuttlefish, sole Greeneye, sardine, squid, corvina Greeneye, corvina, squid Greeneye, kob, squid Greeneye, sardine, kob, squid
157

R.A. Kastelein et al.
Table 2. Body measurements (cm) of the 15-year-old female dusky dolphin at Sea World, Durban, on 9 June 1994.
Measurement Straight line parallel to the body axis
162 133 129 80
120 81
Point to point
— ---~ -
1. Tip of upper jaw to deepest part of fluke notch 2. Tip of upper jaw to centre of anus 3. Tip of upper jaw to centre of genital slit 4. Tip of upper jaw to centre of umbilicus 5. Tip of upper jaw to top of dorsal fin 6. Tip of upper jaw to leading edge of dorsal fin 7. Tip of upper jaw to anterior insertion of right flipper 8. Tip of upper jaw to anterior insertion of left flipper 9. Tip of upper jaw to anterior edge of blowhole 10. Tip of upper jaw to centre of blowhole 11. Tip of upper jaw to right external auditory meatus 12. Tip of upper jaw to left external auditory meatus 13. Tip of upper jaw to centre of right eye 14. Tip of upper jaw to centre of left eye 15. Tip of upper jaw to angle of gape 16. Tip of upper jaw to apex of melon 17. Maximum width of rostrum 18. Projection of lower jaw beyond upper 19. Length of right eye 20. Length of left eye 21. Centre of right eye to angle of gape 22. Centre of left eye to angle of gape 23. Centre of right eye to external auditory meatus 24. Centre of left eye to external auditory meatus 25. Centre of right eye to centre of blowhole 26. Centre of left eye to centre of blowhole 27. Blowhole length 28. Right flipper width 29. Left flipper width 30. Right flipper length: tip to anterior insertion 31. Left flipper length: tip to anterior insertion 32. Right flipper length: tip to axilla 33. Left flipper length: tip to axilla 34. Dorsal fin height 35. Dorsal fin base 36. Fluke span 37. Fluke width 38. Fluke depth of notch 39. Notch of fluke to centre of anus 40. Notch of fluke to centre of genital aperture 41. Notch of fluke to umbilicus 42. Notch of fluke to nearest point on leading edge of flukes 43. Girth at anus 44. Girth at axilla 45. Girth at eye 46. Right mammary slit length 47. Left mammary slit length 48. Genital slit length 49. Anal slit length
26.5 26 23 17
0.3
27
2.5 55.5 58 83
2.3 2.3
13 1
42 46 27 28 25.5 31
22
3 3 5 4.5 6 6
18 16 2
10 10 32 32 22.5 23.5 27
50 12.5
11.8 61 96 72
158

Food consumption of a dusky dolphin
study indicates a passage time of food in dusky dolphins that was to be expected for her body size and weight in comparison with values found in other odontocetes in which the same dye-test was used (Kastelein et ah, 1993, 1994; 1997, 1998 a, b and c).
Ecological significance If humans wish to protect dusky dolphins, then fisheries based on primary prey species should be managed so that populations of dusky dolphins of given sizes can live and reproduce. Food availability influences dusky dolphins as shown by Manzanilla (1989), who describes hypocalcified dentine abnormalities of mature female dusky dolphins off Peru. These abnormalities seemed to be related to the 1983 El Nino event in which the water surface temperature increased, destroying the plankton communities. This caused anchovy (Engraulis ringens) stocks, on which the dusky dolphins feed in that region, to collapse.
Can food consumption data like those of the present study be used to assess the requirements of a wild dusky dolphin population? How does the food consumption of the animal in the present study compare to wild conspecifics of the same gender and age? As well as by individual variation in metabolic rate, the food intake of odontocetes seems to be influenced by the water temperature, by the calorific content of the food and by their activity level. The diet of the animal in the present study is not the same as that of wild dusky dolphins off Argentina, where they mainly consume southern anchovy {Engraulis achoita) (Wiirsig and Wiirsig, 1980). However, the diet in the present study was broadly similar to the diet of dusky dolphins off the South African coast (Sekiguchi et ah, 1992). This diet seems to be largely determined by the availability of prey species, which may change with season, year and
geographical location. Ecologically, the opportunistic foraging of the dusky dolphin could make it more resilient to prey-fishery related impacts than dolphin species which have a more specialized diet.
The dusky dolphin ranges from the Subtropical Convergence to the tips of southern hemisphere continents, and is generally found in water surface temperatures of about 14°C to 15°C (Gaskin, 1968). Off Argentina, dusky dolphins are surface feeders (Wiirsig and Wiirsig, 1980). However, dusky dolphins off the South Island of New Zealand mainly eat deep-water fish such as lantern fish (Myctophidae), but also hoki (Macruronus novaezealandiae), red cod (Pseu-dophycis bachus) and flounders (Pleuronecti-dae) (Cipriano, 1985). Dusky dolphins which feed in deep water are subjected to lower water temperatures than they would be at the surface. According to these studies, the temperatures at which the dolphin in the present study was kept (summer temperatures between 24-25°C) were much higher
Table 3. Rectal temperature measurements of the female dusky dolphin.
Date
31-08-82 03-11-82 24-09-84 06-05-85 04-06-85 03-09-85 30-09-85 05-11-85 03-12-85 06-01-86 03-02-86 22-06-87
Temperature (°C)
37.0 37.0 37.1 36.9 36.8 36.8 36.1 37.2 37.2 36.3 37.0 37.9
159

R.A. Kastelein et al.
B
Figure 5. The dusky dolphin of which the food intake and body measurements are described in this study, a) lateral view (the white stripes on the back are zinc ointment), b) dorsal view, and c) close-up of the lateral side of the head (Photos: Nat Kistnasamy).
160

Food consumption of a dusky dolphin
than those experienced by wild dusky dolphins. Therefore, wild dusky dolphins probably eat more than the animal in the present study, a fact also suggested by the higher food intake after the cooling system became operational. How much more is difficult to predict, because, like some other odonto-cetes, dusky dolphins may be able to adjust their blubber thickness to the environmental temperature (Williams and Friedl, 1990).
Acknowledgements
We thank Prof. Dr. A.J. de Freitas, Director of the South African Association for Marine Biological Research, for supporting this study. We thank all the trainers of Sea World for their record-keeping over the years. We thank Rob Triesscheijn for drawing the graphs, and Rudy van der Elst (Ocean-ographic Research Institute, South Africa) and Nancy Vaughan (University of Bristol, U.K.) for their comments on the manuscript.
References
Brownell, R.L. (1974) Small odontocetes of the Antarctic. In: Antarctic mammals (Ed. Brown, S.G.). Antarctic Map Folio Series 18, 13-18.
Findlay, K.P., Best, P.B., Ross, G.J.B. and Cockroft, V.G. (1992) The distribution of small odontocete cetaceans off the coasts of South Africa and Namibia. In: Benguela Trophic Functioning (Eds. Payne, A.I.L., Brink, K.H., Mann, K.H. and Hilborn, R.). S. Afr. J. Mar. Sci. 12, 237-270.
Fothergill, M. and Jogessar, V.B. (1986) Hae-matological changes in two Lagenorhynchus obscurus treated with Ketoconazole. Aquatic Mammals 12(3), 87- 91.
Gaskin, D.E. (1968) Distribution of Delphini-dae (Cetacea) in relation to sea surface temperatures off eastern and southern New Zealand. N.Z. J. Mar. Freshwat. Res. 2, 527-534.
Hawke, D.J. (1989) Dusky dolphins (Lagenorhynchus obscurus) on the continental shelf near Otago Peninsula, south-east New Zealand. New Zealand Natural Sciences 16,113-116.
Kastelein, R.A., McBain, J. and Neurohr, B. (1993, chapter 2.12) Information on the biology of Commerson's dolphins (Cephalorhyn-chus commersonii). Aquatic Mammals 19(1), 13-19.
Cipriano, F. (1985) Dusky dolphin research at Kaikoura, New Zealand. Mauri Ora 12, 151-158.
Cipriano, F., Wiirsig, B. and Wursig, M. (1989) Diurnal variation in dive times and movements of Dusky dolphins feeding on deep scattering layer-associated prey. American Zool. (29)4, 303.
Kastelein, R.A., Ford, J., Berghout, E., Wiep-kema, P.R. and Boxsel, M. van (1994, chapter 2.4) Food consumption, growth and reproduction of Belugas (Delphinapterus leucas) in human care. Aquatic Mammals 20(2), 81-97.
161

R.A. Kastelein et al.
Kastelein, R.A., Nieuwstraten, S.H. and Ver-stegen, M.W.A. (1997, chapter 2.15) Passage time of carmine red dye through the digestive tract of harbour porpoises (Phocoena pho-coena). In: The biology of the harbour porpoise (Eds. Read, A.J., Wiepkema, P.R. and Nachtigall, P.E.). De Spil Publishers, Woer-den, The Netherlands, 265-275.
Kastelein, R.A., Mosterd, J., Schooneman, N.M. and Wiepkema, P.R. (1998 a, chapter 2.5) Food consumption, growth, body dimensions and respiration rate of false killer whales (Pseudorca crassidens).
Kastelein, R.A., Neurohr, B., Nieuwstraten, S.H. and Wiepkema, P.R. (1998 b, chapter 2.8) Food consumption and body measurements of Amazon river dolphins (Inia geof-frensis).
Kastelein, R.A., Staal, C. and Wiepkema, P.R. (1998 c, chapter 2.6) Food consumption and growth of Atlantic bottlenose dolphins (Tursiaps truncatus).
Manzanilla, S.R. (1989) The 1982-1983 El Nino event recorded in dentinal growth layers in teeth of Peruvian dusky dolphins (Lage-norhynchus obscurus). Can. J. Zool. 67, 2120-2125.
Sekiguchi, K., Klages, N.T.W. and Best, P.B. (1992) Comparative analysis of the diets of smaller odontocete cetaceans along the coasts of southern Africa. In: Benguela Trophic Functioning (Eds. Payne, A.I.L., Brink, K.H., Mann, K.H. and Hilborn, R.). S. Afr. J. Mar. Sci. 12, 843-861.
Sergeant, D.E. (1969) Feeding rates of Ceta-cea. Fisk. Dir. Skr. Ser. Hav. Unders., 15, 246-258.
Waerebeek, K. van and Read, A.J. (1994) Reproduction of Dusky dolphins, Lagenorhyn-chus obscurus, from coastal Peru. Journal of Mammalogy 75(4), 1054-1062.
Williams, T.M. and Friedl, W.A. (1990) Heat flow properties of dolphin blubber: insulating warm bodies in cold water. American Zool. 30(4), 191.
Wiirsig, B. and Wiirsig, M. (1980) Behavior and ecology of the Dusky dolphin (Lagenor-hynchus obscurus) in the South Atlantic. Fishery Bulletin 77(4), 871-890.
162

Chapter 2.11
Aquatic Mammals 1993, 19.2, 99-121
The food consumption of Commerson's dolphins (Cephalorhynchus commersonii)
R. A. Kastelein1, J. McBain2, B. Neurohr3, M. Mohri4, S. Saijo5, I. Wakabayashi6
and P. R. Wiepkema7
1Harderwijk Marine Mammal Park, Strandboulevard-oost 1, 3841 AB Harderwijk, Holland 2Sea World of California, 1720 South Shores Road, San Diego, CA 92109-9980, USA
yZoo Duisburg, Muelheimerstrasse 273, 4100 Duisburg, Germany ^Sunshine International Aquarium, Higashi-Ikebukuro 3-1-3 Toshima-ku, Tokyo, Japan
$Matsushima Aquarium, Matsushima, Miyagi, Japan 6Toba Aquarium, Toba 3-3-6, Toba-shi, Mie Prefecture 517, Japan
1 Ethology section, Department of Animal Husbandry, Agricultural University, Marijkeweg 40, 6709 PG Wageningen, Holland
Summary
This study concerns the food consumption of Commerson's dolphins in 5 zoological parks. Adult animals of both sexes eat between 9 and 12% of their body weight per day. Food intake is influenced by many factors such as age, mating activity, lactation, time of year, reproductive status, diet, feeding pattern, water temperature and metabolic rate. Compared to calves of larger odontocetes, newborn Commerson's dolphin calves are large in proportion to adults. Calves approach adult body weight and adult food intake after approximately 2 years. Gestation mildly decreases female food consumption, but lactation causes a great increase in intake. Compared to larger odontocetes, Commerson's dolphins probably need to feed more frequently. Prey availability in the distribution area of this species should therefore be a key parameter in the design of a rational management plan. The annual food intake of an average adult Commerson's dolphin in the Strait of Magellan, South America, is estimated at around 1850 kg of Herring (37 x 105 kcal).
Key words: Cephalorhynchus commersonii, energetics, food consumption, reproduction, lactation, Phocoena phocoena.
Introduction
The Commerson's dolphin {Cephalorhynchus commersonii) is a small black and white dolphin indigenous to the waters around southern Chile, southern Argentina, the Falkland Islands and the Kerguelen Islands (Angot, 1954; Brownell, 1974;
Aguayo, 1975). What little is known about prey species taken by Commerson's dolphins, comes from descriptions of stomach contents (Harmer, 1922; Weber, 1929; Goodall et al., 1988; Bastida et al., 1988), and from Mermoz (1980) who drew conclusions from overlapping distribution of fish species and Commerson's dolphins. Stomach contents showed that Commerson's dolphins are opportunistic coastal feeders. They eat several fish species as well as a variety of invertebrates such as squid, mysid, shrimp, sessile tunicates, annelid worms and isopods. This diet indicates that these dolphins often feed on, or near, the sea floor. Commerson's dolphins have often been observed feeding in or just beyond the breakers, at a distance of 3-5 m from the shore, and in shallow harbours (Mermoz, 1980; Gewalt, 1985, 1990 & 1991; Goodall et al, 1988). Gewalt (1990, 1991) describes feeding sessions near the coast lasting about one hour. He describes the dolphins swimming around in all direction, and herding 12-15 cm sardines (Sprattus fuegensis) towards the shore, chasing them up the beach. He observed Commerson's dolphins feeding in the morning, at midday and in the late afternoon, often in the same place.
Apart from anecdotal information on the daily food consumption (Gewalt, 1979; Spotte et al., 1979; Shochi et al., 1982; Joseph et al, 1987; Cornell et al, 1988), little is known about the energy requirements of Commerson's dolphins. This small cetacean's low body mass to surface ratio (see roughly comparable values for harbour porpoises in Andersen, 1981), and its active nature, suggests the likelihood of a high metabolic rate. When food deprived, marine mammals with high metabolic rates may rapidly lose weight and fitness,
163

R.A. Kastelein et al.
due to the high heat conductively of the water around them (Kanwisher and Sundries, 1965). This may result in an increased susceptibility to disease. Weight loss in very small cetaceans, as indicated by the appearance of a depression over the cervical spine, may be apparent after as little as one day fasting (Fig. 1 in Boolootian, 1956; Spotte et al, 1979; Gewalt, 1990; Figure 3 in Kastelein and van Battum, 1990).
The size of the Commerson's dolphin population in the Strait of Magellan has been estimated twice (Anonymous, 1987; Leatherwood et al, 1988). Concern over this population was expressed by Goodall and Cameron (1980), because Commerson's dolphins were caught incidentally in Robalo (Eleginops maclovinus) and Centolla (Lithodes antarctica) nets and were harpooned for Centolla bait. Sightings and strandings suggest that the species has a disjointed distribution (Kastelein, 1984), which may make local populations more vulnerable.
In addition to data on the size of local dolphin populations and their sex ratio and age distribution, information on energy requirements is needed to set up an international conservation plan for Commerson's dolphins. Because energy requirement data are difficult to obtain in the field (Beddington et al., 1985), the daily food consumption of Commerson's dolphins in 5 zoological parks is analysed in the present study. The objective is to assess food intake and the parameters which influence it. Details of growth and food consumption are useful for the management of this species in oceanaria, and perhaps for the conservation of this and other small odontocete species in the wild. For species which are not kept in zoological parks, data on food consumption is difficult to gather. We also provide a brief overview of the history of Commerson's dolphins in oceanaria up until January 1991.
Materials and methods
Sea World of California
Study animals The age and sex of 14 Commerson's dolphins at Sea World of California, USA are shown in Table 1. The 6 original animals come from the Strait of Magellan, Chile, the others were born at Sea World. The study period was from December 1983 until January 1991.
Study area The animals are housed in 2 pool systems. Pool system A is covered and consists of a main pool (13 m x 13 m; 3.9 m deep) and an adjacent holding pool (8.5 mx 4.5 m; 1.5 m deep). The dolphins
usually have free access to both pools, except during educational presentations when they are confined to the main pool. During the study period the water temperature varied from 12.8 to 24.4°C. Through an opening in the ceiling the animals are exposed to the natural light cycle. Artificial lights are additionally used during the day. Pool system B consists of an outdoor pool (12 m x 12 m; 3m deep). By means of an adjoined examination pool (4 m x 8 m; 2.3 m deep) it is connected with pool system C (12 m x 12 m; 3 m deep). These systems are not used for educational presentations. During the study period the water temperature in pool systems B and C ranged from 13.3 to 21.7°C. In 1987 some animals were kept in another pool for 6 months, where the water temperature varied between 9.4 and l l .TC. The salinity in all pools varied from 3.0 to 3.4% NaCl. Sea World of California is located at 117°14' west longitude and 32°46' north latitude. The average monthly air temperature between 1984 and 1990 varied between 13.9 and 22.4°C.
Pregnant females were housed in pool system B to ensure a calm environment. The males were housed in pool system C beginning about 5 weeks before parturition. Although physically separated, the sexes were able to maintain both visual and acoustic contact with each other.
Feeding The animals were fed a thawed diet of 95% North Atlantic herring {Clupea harengus) and 5% Columbia river smelt (Thaleichthys pacificus), based on weight. The amounts fed at each feeding were recorded per animal with an accuracy of 0.1 kg. vitamins were added to this diet daily.
Feeding in pool system A (presentations to the public): Between June and September the animals were fed 10 times a day. Between October and May they were fed 4 times a day on week days and 7 times a day during the weekends. For each animal a daily food base was set. If an animal failed to eat its base amount, or showed a decreased appetite, the base was reduced. If the animal ate the base amount easily, it was increased. The animals were weighed regularly, but appetite was used as the primary indicator of their food requirements. The goal was to keep the animals healthy and looking robust at all times.
Feeding in pool system B (no presentations to the public): The animals were fed 3 to 4 times per day and were allowed all they could eat. At each feeding, fish were given to each dolphin until it started to drop fish. To monitor weight changes the animals were weighed regularly. No obesity was observed. The maximum amount of food ingested per feeding varied from 1.4 to 1.8 kg, depending on the individual.
164

Commerson's dolphin food consumption
Table 1. The Commerson's dolphins (Cephalorhynchus commersonii) in the present study
Location
Sea World Sea World Sea World Sea World Sea World Sea World Sea World Sea World Sea World Sea World Sea World Sea World Sea World Sea World
Duisburg Duisburg Duisburg Duisburg
Sunshine Int. Sunshine Int. Sunshine Int. Sunshine Int. Sunshine Int.
Matsushima Matsushima Matsushima Matsushima Matsushima Matsushima
Toba Toba Toba
Code M=male F=female
SIM S2M S6F S7F S3M S8F S4M S10F S11F S5M S9F S12F S13M S14M
DIM D2M D3M D4M
U1M* U2M* U3M U4F U5F
M3F M1M M4F M5F M2M M6F
TIM T2M T3F
Birth date or est. year
1978 1978 1978 1978 1978 1978
21-2-85 28-9-88 19^1-86 10-7-87 10-9-88 1-5-86
25-5-87 8-5-90
<1974 <1976 <1976 <1980
— — — —
— — — —
1-7-89
— —
Arrival date
13-12-83 13-12-83 13-12-83 13-12-83 13-12-83 13-12-83
— — — — — — — —
18-12-78 09-02-80 09-02-80 14-02-84
3-1987 3-1987 3-1987 3-1987 3-1987
3-1987 3-1987 3-1987 3-1987 3-1987
—
3-1987 3-1987 3-1987
Code sire
wild wild wild wild wild wild S2M SIM
? SIM SIM
? 7 ?
wild wild wild wild
wild wild wild wild wild
wild wild wild wild wild
7
wild wild wild
Code dam
wild wild wild wild wild wild S8F S6F S6F S8F S7F S7F S7F S8F
wild wild wild wild
wild wild wild wild wild
wild wild wild wild wild M4F
wild wild wild
Origin
Chile Chile Chile Chile Chile Chile
Sea World Sea World Sea World Sea World Sea World Sea World Sea World Sea World
Argentina Argentina Argentina
Chile
Chile Chile Chile Chile Chile
Chile Chile Chile Chile Chile
Matsushima
Chile Chile Chile
*Moved to Osaka Aquarium in June 1990.
Duisburg Zoo
Study animals The sex and estimated age of 4 Commerson's dolphins at Duisburg Zoo are shown in Table 1. One animal came from the bay of San Jorge betweenComodoro Rivadavia and Puerto Deseado Argentina, 2 from Bahia Grande, Argentina, and 1 from the Strait of Magellan, Chile. The study period was from January 1979 until January 1991.
pools (each 5.3 m x 3.0 m; 4.3 m deep). The animals usually have access to all 3 pools. Part of the pool complex is covered by a sheet of canvas as a roof. The Commerson's dolphins are housed with (1,1) Beluga whales (Delphinapterus leucas). During the study period the water temperature varied from 6 to 12°C (the pool has chilling facilities), the salinity varied from 2.5 to 3.0% NaCl. The air temperature varied from 14.9 to 37.2°C. Duisburg Zoo is located at 6°45' east longitude and 51°25' north latitude.
Study area The outdoor pool complex consists of a main pool (12 m x 15 m; 4.3 m deep) and 2 adjacent holding
Feeding The animals were fed 4 to 5 times per day. Once in the early morning, during 2 (November to
165

R.A. Kastelein et al.
February) or 3 (March to October) midday presentations, and once during the late afternoon. The thawed diet consisted on average of 30% Squid {Illex spp.) or Whiting {Merlanguis merlangus) and 70% Herring (Clupea harengus) and Sprat (Sprattus sprattus) or Mackerel {Scomber scombrus) and Sprat {Sprattus sprattus), according to the animal's preference. The percentages are based on weight, and rations per feeding per animal were weighed with an accuracy of 0.1 kg. Vitamins were added to this diet daily. The animals were always fed to saturation. The quantity of food offered was never influenced by the behaviour in the presentations. The dolphins did not seem to want more than 1 kg per meal, therefore the maximum per feeding was set to 0.8 kg. If the animals needed more food per day, an extra feeding was given.
Sunshine International Aquarium
Study animals The arrival dates and sex of the 5 Commerson's dolphins at Sunshine International Aquarium, Tokyo, Japan are shown in Table 1. The animals were originally from the Strait of Magellan, Chile. The study period was from March 1987 until January 1991. Two animals (U1M and U2M) were sent to Osaka Aquarium in June 1990, where the average water temperature in the second half of 1990 was 14.6°C.
Study area The animals are housed in an indoor pool system, consisting of a main pool and an adjacent hospital pool (total surface area 64.7 m2; 1.9 m deep; volume: 123 m3). They had access to both pools unless medical examination was taking place in the hospital pool. The animals were used for educational display only. During the study period the average monthly water temperature varied between 10.9 and 11.9°C, the salinity from 3.4 to 3.5% NaCl. The average monthly air temperature varied between 13.5 and 15.7°C. Through a window in the ceiling the animals were exposed to the outdoor light cycle. Sunshine International Aquarium is located at 139°43' east longitude and 36°44' north latitude.
Feeding The dolphins were fed a thawed diet of 50% Mackerel {Scomber japonicus) and 50% Toothed Smelt {Osmerus eperlanus mordax), based on weight. Vitamins were added to this diet daily. The animals were fed three times a day until April 1990, after which a fourth daily feeding was introduced. This was initially done because the food intake of a pregnant dolphin was irregular, and later became
the norm. Each animal's daily food base was set at 10% of its body weight. If the animal ate its base amount easily or its weight decreased, the base was adjusted upwards.
Matsushima Aquarium
Study animals The arrival dates and sex of 6 Commerson's dolphins at Matsushima Aquarium, Miyagi, Japan are shown in Table 1. The original 5 animals come from the Strait of Magellan, Chile, another was born at Matsushima Aquarium, so its age is known. The study period was from March 1987 until January 1991.
Study area The animals are usually kept in a main indoor pool (octagonal; 9.6 m diameter; 3.7 m deep). A month before expected parturition (1989), the males were housed separately in a round indoor pool (diameter: 6.m; 3.7 m deep). During the study period the water temperature in the main pool was between 7.9 and 20.0°C, and the air temperature varied from 9.0 to 27. TC. The salinity of the natural sea water was around 3%. Through a window in the ceiling the animals were exposed to the outdoor light cycle. In addition artificial lights were used. Matsushima Aquarium is located at 14T49' east longitude and 38°21' north latitude.
Feeding The animals were fed 3 times a day a thawed diet of North Pacific herring {Clupea pallasii) from March 1987 to 9 February 1988, and Chub mackerel {Scomber japonicus) after 9 February 1988. Vitamins were added to this diet daily. The animals were always allowed to eat as much as they wanted.
Toba Aquarium
Study animals The arrival dates and sex of 3 Commerson's dolphins at Toba Aquarium, Mie, Japan are shown in Table 1. They originate from the Strait of Magellan, Chile. The study period was from March 1987 until January 1991.
Study area The animals were kept in an indoor pool (9.0 m x 8.8 m; 5.4 m deep). During the study period the water temperature varied from 9.8 to 13.2°C. The air temperature was between 6.2 and 23.8°C. The pool contained natural sea water with a salinity of around 3%. Daylight could enter the pool area indirectly through windows in the wall,
166

Commerson's dolphin food consumption
and artificial light was also used. Toba Aquarium is located at 136°50' east longitude and 34°29' north latitude.
Feeding The animals were fed 3 times a day on a thawed diet of 100% White-tipped mackerel scad (Decapterus maruadsi) until June 1990, and 70% Yellowfm horse mackerel (Trachurus japonicus) and 30% White-tipped mackerel scad thereafter. Vitamins were added to this diet daily. The animals were always allowed to eat as much as they wanted.
Analysis units The food intake data available in the present study was the amount of food per animal per day. From this information, monthly and annual food intake were calculated, which are the basic measures used for the analysis here.
Results
Although slightly different feeding schedules and feeding methods were used in the 5 parks, the animals were in general allowed to eat ad libitum. therefore it might be useful to compare the food intake between parks, and study the effects of several environmental and biological parameters on food intake.
based on 8 cases is 345 ± 20 days (Asper et al., 1992). Six months after successful copulation, females weighed an average of 10.8 kg (S.D.= 1.9 kg, N=4) more than during non-pregnant periods. For health reasons, females in the present study were usually not weighed during the second part of the gestation period, except for female (S7F) which was weighed 4 months prior to delivery; she then weighed about 15 kg more than she had prior to pregnancy.
During their first full calender year, the solid food intake of Sea World dolphin calves averaged between 6 and 10% of their body weight per day. The range is due in part to the different birth dates and to variations in the length of the suckling period. Thereafter the proportional food intake increased to around 11% at the age of 5 years. Males and non-pregnant, non-lactating females over 5 years of age consumed between 9 and 13% of their body weight per day.
The animals from the other 4 parks were all, except one, of unknown age. No sexual dimorphism in body weight could be detected when animals from all 4 parks were pooled. Male body weight was between 29 and 54 kg, while the non-pregnant female weight varied between 32 and 53 kg. Males ate between 8.1% to 13.5% of their body mass per day, and non-pregnant non-lactating females between 7.5 to 13.1%.
Influences of age and sex on body weight and food consumption The annual food consumption and body weights of Commerson's dolphins and the average annual pool water and air temperatures at Sea World of California are shown in Figure 1, at Duisburg Zoo in Figure 2, at Sunshine Aquarium in Figure 3, at Matsushima Aquarium in Figure 4, and at Toba Aquarium in Figure 5. Many of the animals (the males at Sea World, all animals at Matsushima and Toba Aquarium) increased their food intake during the first year(s) of captivity. The acclimation process may have contributed to the low initial food intake. In addition, some of the animals were still growing.
It is believed that catching a newborn cetacean to take body measurements may be lethal, so that body measurements are only available for 1 full-term Commerson's dolphin calf, which died shortly after birth at Sea World. It was 91 cm long, and weighed 8.8 kg. At Sea World, where the ages of the animals are best known, both sexes grew fast, reaching almost adult weights after about 2 years (Fig. 6). There was no clear difference in body weights of adult males (range 36-43 kg) and non-pregnant adult females (range 37-41 kg). Female body weight increased during pregnancy. The gestation period of Commerson's dolphins
Perinatal changes The food intake pattern prior to birth, during the lactation period and after weaning could be studied in 6 cases (Fig. 7). Pregnant females showed a progressive increase in weight (Fig. IF, G, H), associated with increasing girth (Fig. 8). In all 6 cases, the total food intake during the 12 month gestation period was not higher than during non-pregnant, non-lactation 12 months periods (Table 2). In fact, they ate a little less when pregnant than when not pregnant. All 4 pregnant females maintained normal food intake until 1 or 2 days before parturition, when it decreased slightly. On the day of birth their appetites were poor.
During its first 4 days, calf S4M suckled about every 40 minutes with an average of 8 attachments, each lasting on average 5.5 seconds. The time that the calves were fully dependent on milk varied from 73 to 236 days (Kastelein et al, 1993). The increase in solid food intake was gradual in all cases; they continued to suckle several times per day for some months. During the suckling period, when the calf was fully dependent on milk, the mothers' daily food consumption was on average about 30% higher than in the same periods of other years, when they were not pregnant or non-lactating (Table 3).
167

R.A. Kastelein et al.
<jj 2 0 0 0 "
>> 1 8 0 0 . D)
S 1 6 0 0 , c
~ 1 4 0 0 .
a £ 1 2 0 0 . 3 <2 1 0 0 0 .
o O 8 0 0 .
• a O 6 0 0 . o
* " 4 0 0 .
ra C 2 0 0 . c
< 0
A.
8 4 * 8 5
6 7
ra 2 0 0 0 * 0)
- > • 1 8 0 0 .
J? • = 1 6 0 0 . c
• 2 1 4 0 0 .
a £ 1 2 0 0 . 3 "> 1 0 0 0 . c o O 8 0 0 .
O 6 0 0 . o
^ 4 0 0 .
ra j2 2 0 0 . c < 0
c.
= r t ^ - ;
8 4 " 8 5
6 7
S1M
/Ta
/ K
8 6 " 87 " 8 8 ' 8 9 " 9 0 5
8 9 10 11 12 <
S3M
— ^ ^
" 8 6 " 8 7 " 8 8 ' 8 9 " 9 0 1
8 9 10 11 12 <
,20 .18 . 16 O .14 ° .12 .10
- 6 0 5 0 _ 4 0 j ? 3 0 ,20 10
f e a r
a g e
,20 .18 .16 O .14 ° ,12 .10
r 6 0 •50 .40 J? .30 .20 10
/ e a r
a g e
ra t ?
J£ C O
a
E 3
c 0 0
- 0 O O
ra 3 c c
<
' h.*
ra • — .
. 0
a
E 3 (0 c 0 0
T3 O O
s—
_ ra 3 c c
<
2 0 0 0 "
1 8 0 0 .
1 6 0 0 .
1 4 0 0 .
1 2 0 0 .
1 0 0 0 .
8 0 0 .
6 0 0 .
4 0 0 .
2 0 0 .
0 ,
B. S2M
^ / a
u ^''
.20
.18
.16 O
.14 °
.12
.10
~^Y^^~~^*
r 6 0 ' 50 _ .40 2 . 30 .20 10
8 4 " 85 ' 8 6 ' 8 7 ' 8 8 ' 8 9 y e a r
6 7 8 9 10 11 a g e
2 0 0 0 -
1 8 0 0 .
1 6 0 0 .
1 4 0 0 .
1 2 0 0 .
1 0 0 0 .
8 0 0 .
6 0 0 .
4 0 0 .
2 0 0 .
0 .
D. S4M
j r A srT' N ' NT
.20 ,18 .16 O ,14 ° 12
,10
K P—
*S*t~ •»• »
8 5 ' 8 6 ' 87 • 8 8 " 8 9 " 9 0 5
P60 5 0 , . , 40 S ,30 ,20 10
/ e a r
0 1 2 3 4 5 a g e
F i j j u re 1 . / I E .
ra
c . 0
Q.
E 3
c 0 0
O O
ra 3 c c
<
2 0 0 0
1 8 0 0
1 6 0 0
1 4 0 0
1 2 0 0
1 0 0 0
8 0 0
6 0 0
4 0 0
2 0 0
0 B7 88 89 90 year 0 1 2 3 age
Post partum, the monthly food intake of most females increased, peaking approximately 2 months after birth. Then, the food intake slowly decreased to a rninimum at around the time the calves started to eat fish in addition to suckling (Fig. 7A, B, C, E, & F). After this, food consumption increased a little until it stabilized. An exception was female S8F, whose food intake increased dramatically (Fig. 7D) or remained high (Fig. 7E) after her calf started to eat fish.
Seasonal changes Seasonal food intake changes can result from, among other things, reproductive cycles and variations in water temperature. In the present study, air and water temperatures fluctuated simultaneously, except in facilities which cooled the water. The air temperature is assumed to be of less significance than the water temperature because water conducts heat 25 times better than air (Kanwisher and Sundnes, 1965) and the animals
are below the surface most of the time. Only the dominant effect of the water temperature on food intake will be described here.
In parks with seasonal peaks in pool water temperatures (Duisburg Zoo, Sea World and Matsushima Aquarium; Fig. 9A, B and D), adult dolphins ate less in the warmer months. In parks with fairly constant water temperatures (Sunshine Aquarium and Toba Aquarium, Fig. 9C and E), individual animals showed seasonal variations, but these were not consistent between years.
Fish of the same species can have different nutritional or caloric values depending on the season and geographical area in which they were caught. The fish fed in each of the parks in the present study were caught in different seasons, quantities, areas, and sometimes stored for several months. It is probable, that seasonal or regional differences in fish caloric value of the fish cancelled each other out over the years, and did not
168

Commerson's dolphin food consumption
J — , , ! _ , , _ • , , 110 84 85 86 87 88 89 90 year
7 s 9 10 11 12 age 84 85 86 87 88 89 90 year 6 7 8 9 10 11 12 age
S8F
84"85"86 6 7 8
-*-i 1 r-Z* '87 88 89 90 year
10 11 12 age
88 89 90 year o 1 2 age
88" 89 ' 90 year o 1 2 age
Figure 1. F-J.
Figure 1. A-J. The annual food intake and body weight of Commerson's dolphins and the average annual water (Tw) and air (Ta) temperature at Sea World of California. A triangle indicates a year in which a birth took place. An arrow above a triangle means that the calf did not suckle. Age 1 represents the first calendar year after the year of birth. The low average water temperature in 1987, was due to the temporary transport of S2M, S3M and S4M to another pool with a low water temperature.
lead to an artificial annual fluctuation in food consumption.
When the annual proportional food consumption data of all animals and the average annual water temperature per park are pooled, no correlation between proportional food consumption and average water temperature can be seen (Table 4). The absence of such an overall connection is surprising, but may simply result from combining divergent data over too long a period. The same relationship was calculated for a more homogenous group of animals that were followed over many years consistently. The animals involved are the four males from Sea World (SIM, S2M, S3M and S4M). Average water temperature
per month and total food intake for that month and per animal have been plotted in Figure 10. The data show a significant negative correlation (Pearson correl. coeff.: R= - 0.334, i><0.0001, N=295), indicating the effect of ambient water temperature on food intake.
On days of great sexual activity, the males at Sea World ate less than normal, or nothing at all. However, they compensated for this reduction in food intake during the other days of the month, so that no changes could be detected in their total monthly food consumption data. About 11.5 months prior to delivering a calf, each female copulated repeatedly on 1 day. Food intake was 20 to 50% less than on days around the copulation
169

R.A. Kastelein et ail.
<D 2000 a>
•>• 1800.
•£ 1600
c •2 1400. a £ 1200. 3 <2 iooo, o o
T3 O O
TO 3 C C <
800,
600.
400,
200,
D1M
79 " 8 0 " 81 '82 "83 "84 "85 "86 '87 " 88 ' 89 ' 9 0 y e a r
.20 ,18 ,16 O .14 ° .12
L10 r60
SO „ .40 g .30 ,20 .10
year
ro >> O)
J£ C o a F 3 w O o
•a o o
ro 3 C
<
2000"
1800 .
1600.
1400-
1200.
1000.
8 0 0 .
6 0 0 .
400 .
200 .
B.D3M
/Ta
,20 .18 .16 O .14 ° ,12 L10 |-60 •50 m .40.5? .30 .20 .10
8 1 ' year
r60 • S 0 m .40 j? .30 .20
• I 1 1 • 1 • 1 t l ° 81 82 83 84 85 86 87 88 y e a r
<0 2000'
fl> >• 1800.
J? •5 1600 c o
1400
a E 3 V) c o o T3 o o
c c <
1000
800.
600 .
200
D. D4M
85 ' 86 ' 87 ' 88 " 89
20 18 16 O 14 ° .12 10
r60 •50 „ .40 S .30 .20
110 ' 90 year
Figure 2. A-D. The annual food intake and only a few body weights of Commerson's dolphins and the average annual water (Tw) and air (Ta) temperatures at Duisburg Zoo. Tw is only available for years after 1983. An asterisk indicates high food intake due to large % of squid in the diet. A triangle indicates low food intake due to pneumonia.
day. Whether this reduction in food intake was the result of a hormone-influenced reduction in appetite due to oestrus, or simple business, is not clear.
Discussion and Conclusions
Before making an estimate of the annual amount of food a Commerson's dolphin needs in the wild, it is important to determine the parameters which influence food intake.
Factors influencing food intake
1. Gender Based on the small sample size of the present study, it seems that there is no significant sexual dimorphism in Commerson's dolphin body weight. This is also reflected in the food consumption; adult
males eat on average as much as non-pregnant, non-lactating adult females. However, Lockyer et al. (1988) found in a larger sample that female Commerson's dolphins are on average 4 cm longer than males. In another small cetacean, the Harbour porpoise (Phocoena phocoena), females are also larger than males of the same age class (van Utrecht, 1978; Gaskin et al., 1984), but the difference is more pronounced than in Commerson's dolphins.
2. Mating Seasonal food consumption changes in marine mammals such as pinnipeds are usually related to reproduction and moulting (Kastelein et al., 1990 a, b, & c; Kastelein et al, 1991), which is often correlated with annual cycles of food availability. If food intake is influenced by reproduction,
170
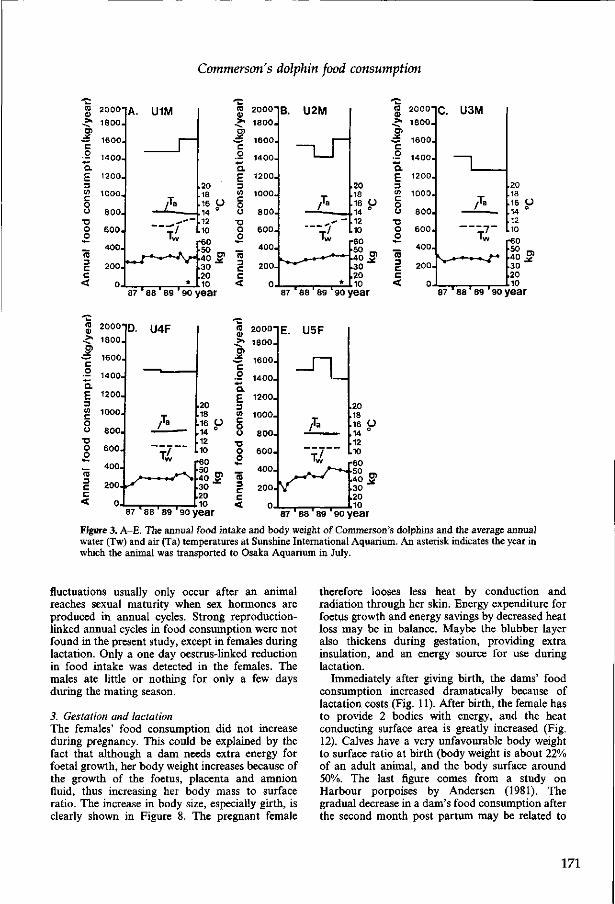
Commerson's dolphin food consumption
ra >
c
F Z3
C
o •o o o
flj
3 r c <
2000"
1800 .
1600.
1400.
1200.
1000.
800 .
6 0 0 .
400.
2 0 0 .
0 .
C. U3M
~l
/T°
~"TT
i . . i i__ }
20 18 16 O 14 ° 12 10 '60 50 „ , 40 j? 30
.20 10
87 "88 ' 8 9 ' 9 0 y e a r
90 y e a r 87 " 8 8 ' 89 " 90 y e a r
Figure 3. A-E. The annual food intake and body weight of Commerson's dolphins and the average annual water (Tw) and air (Ta) temperatures at Sunshine International Aquarium. An asterisk indicates the year in which the animal was transported to Osaka Aquarium in July.
fluctuations usually only occur after an animal reaches sexual maturity when sex hormones are produced in annual cycles. Strong reproduction-linked annual cycles in food consumption were not found in the present study, except in females during lactation. Only a one day oestrus-linked reduction in food intake was detected in the females. The males ate little or nothing for only a few days during the mating season.
3. Gestation and lactation The females' food consumption did not increase during pregnancy. This could be explained by the fact that although a dam needs extra energy for foetal growth, her body weight increases because of the growth of the foetus, placenta and amnion fluid, thus increasing her body mass to surface ratio. The increase in body size, especially girth, is clearly shown in Figure 8. The pregnant female
therefore looses less heat by conduction and radiation through her skin. Energy expenditure for foetus growth and energy savings by decreased heat loss may be in balance. Maybe the blubber layer also thickens during gestation, providing extra insulation, and an energy source for use during lactation.
Immediately after giving birth, the dams' food consumption increased dramatically because of lactation costs (Fig. 11). After birth, the female has to provide 2 bodies with energy, and the heat conducting surface area is greatly increased (Fig. 12). Calves have a very unfavourable body weight to surface ratio at birth (body weight is about 22% of an adult animal, and the body surface around 50%. The last figure comes from a study on Harbour porpoises by Andersen (1981). The gradual decrease in a dam's food consumption after the second month post partum may be related to
171

R.A. Kastelein et al.
ra 2000-
->• 1800 . B>
•=5 1600. c •2 MOO
'S. £ 1200. 3 g 1000. o O 800. •a O 6 0 0 . o ^ 400.
C 200. c < 0
<? 2000-I
•>• 1800. CT
-=5 1600. C
•2 1400.
£ 1200. 3 « 1000. c o O 800 .
O 600 . O
"~ 400. ra § 200. c < 0
A. M1M _ _ I
1 |
-3-" *-—~"
— " \ T W
87 ' 88 ' 89 ' 90 )
D. M4F
£ ^ _ -
T
87 "88 8 9 90 \
.20 ,18 ,16 O ,14 ° ,12 .10 P60 •50 .40 S .30 .20 10
/ear
. 20
.18
.16 O
.14 °
.12
.10 r60
.40 . g
.30
.20 10
/ear
(0 0) ,> "B> ^ c
. 0 +* a. £ 3 to c o o
T3 O o *.
3 C C
«4
>»
1 ~c o a E 3 (A C o o
o o
3 C C <
2000"
1800.
1600.
1400.
1200.
1000.
800 .
6 0 0 .
400.
200 .
0 .
2000"
1800.
1600.
1400.
1200.
1000 .
8 0 0 .
6 0 0 .
400.
2 0 0 .
0 .
B. M2M
| i 1
^J^ . 2 0 18 16 (J
' " .14 °
" V w 12 10
rSO •so .40 j? .30 , 20
87 ' 88 ' 89 ' 90 )
E. M5F
£_ "~ ~ ~"
**"""—
" " ^
87 ' 88 " 89 " 90
10
rear
. 20
.18
.16 O
.14 °
.12
.10 r60 •50 _ .40 S .30 .20 10
year
0) >. "B> ^ c o +* a E 3 (ft C o o
•D O O
3 C C
<
J c o a E 3 C o u
O O « > "en 3 C C <
2000"
1800 .
1600.
1400-
1200.
1000.
800 .
6 0 0 .
400.
200.
0
2000"
1 8 0 0 .
1600 .
1400 .
1200.
1000.
8 0 0 .
6 0 0 .
4 0 0 .
200 .
0 .
C. M3F
_J^ rf» ""
" " X T W
^^~—»
^ ^ ^ ^
87 ' 88 " 89 ' 90
F.M6F
_£ I
— —-\
•
8 9 9 0
. 20
.18
.16 O
.14 °
.12
.10 r60 •5° rr, .40 S .30 .20 10
/ear
.20
.18 ,16 O ,14 ° ,12 .10
P 6 0
' 5 0 n .40 5 .30 . 20 .10 /ear
o 1 age Figure 4. A-F. The annual food intake and body weight of Commerson's dolphins and the average annual water (Tw) and air (Ta) temperatures at Matsushima Aquarium. A triangle indicates a year in which a birth took place.
88 89 90 year 88 89 90 year 88 89 90 year
Figure 5. A-C. The annual food intake and body weight of Commerson's dolphins and the average annual water (Tw) and air (Ta) temperatures at Toba Aquarium.
172

60
50-
40-
5 30-O)
'55 > 20. •o o OQ
10H
oJ
Commerson's dolphin food consumption
• •
0 o - • • So
•
o
d> I T fr p * *
o female
• pregnant female
• lactating female
• male
0 1 T r T r 2 3 4 5 6 7 8 9 10 11 12
Age (years) Figure 6. The body weight of Commerson's dolphin males and females (in different reproductive stages) at Sea World of California related to age. Age 1 represents the first calendar year after the year of birth.
reduced energy needs of the calf, which by then has reached a more favourable body weight to surface ratio. The body composition of the calf also changes over time; the insulating blubber layer becomes thicker, reducing heat conduction. The strong increase in the females' food consumption during the first stage of lactation may for a small part be due to increased energetic investment in swimming. During the first week after giving birth, female Commerson's dolphins usually swim a great deal and 'pull' their calves with them in a slip stream reducing the calves' energy expenditure on locomotion and allowing for a larger part of the milk to be used for growth. The stomach contents of Harbour porpoises in the wild showed that lactating females ingested more fish and had a significantly higher caloric intake than non-lactating females or mature males (Recchia and Read, 1989). As a comparison, for six months following parturition, lactating Bottlenose dolphin females (Tursiops truncatus) may consume 129 to 204% more energy than before they became pregnant (Ridgway et ah, 1991).
The mother's low food intake in the month the calves started to eat fish may be linked to a decrease in mammary gland activity due to a decrease in milk demand. Generally, dolphins lactate as long as the calf nurses. When the suckling frequency decreases, hormones probably reduce the mother's milk production. This may also affect the calve's and mother's feeding behaviour. The quality of the milk probably also changes during the lactation period, as is observed in killer whales, Orcinus orca. Whether the suckling behaviour of the calf influences the milk composition or vice versa is unknown. Although calves continue suckling after they have started to eat fish, the decrease in the mother's food consumption after this moment suggests that little or no milk is transferred during these suckling bouts and/or that the milk has a low caloric density. Maybe the calf performs this suckling behaviour mainly to maintain a bond with its mother.
Several parameters, such as water temperature, activity level, fitness and current body weight, could influence the dam's food consumption after
173

R.A. Kastelein et al.
T
6-5'
s * §3-
2-
V
S7F
-6 -5 -4 -3 -2"-1 0 1 2 3 4 5 6 7 8 9 10 11 12 _i» months
birth S9F do-9-i988) weaned
T
6-
5'
5 4-1
2-
1
S6F
-6 -5 -2 -1 0 2 3 4 5 6 7 8 9 10 11 12 A. months
birth S11FH9-4-'86) weaned
7" 6-
5-<0 A
2>-\ 2-
1-0.
c. S6F
-6 -5 -4 -3 -2 -1 0 1 2 3 4 5 6 7 8 9 10 11 12
birth S10F (28-9-1988) weaned
Figure 7. A, B and C.
weaning. Her intake during the suckling period could have been sufficient for milk production, so that no use was made of her fat reserves. After weaning, she would not need extra energy to compensate for weight loss (Fig. 7A, B & C). Alternatively, the dam's food consumption during the suckling period may not have been sufficient to produce enough milk, so that she had to use part of her energy reserves. After weaning she would need to replenish her fat (Fig. 7D, E & F). Female S8F did not increase her food intake much during S4M's suckling period in 1985. This might explain
why her food intake increased drastically after weaning (Figs. 1H & 7D).
4. Diet The diet can influence food intake in at least 3 ways: palatability, caloric density, and bioavailability.
(a) Palatability. Food offered can be more or less attractive to the animals. An increase in food consumption at Matsushima Aquarium in October 1987 coincided with a new supply of smaller,
174

Commerson's dolphin food consumption
71
6-
5"
S3-2-
1-
0.
D. S8F
-6 "-5 -4 -3 -2 -1 0 1 2 3 4 5 A
birth S4M wear (21-2-1985)
T
6-
5->»
S3-2-
1-
n
8] T
6-
5"
23 -2-
1-
n
6 7 8 9 10 11 12 months
led
E. S8F ,—.
-6 "-5 -4 -3 -2 -1
F. M4F
0 1 2 3 4 5 A
birth S5M wear (10-7-1987)
-6 -5 -4 -3 -2 -1
birt (1-7
0
h M -'89
1
6F
2
6 7 8 9 10 11 12 months
led
3
wes
4 A jne<
5
i
6 7 8 9 10 r
11 non
12 ths
Figure 7. D, E, and F.
Figure 7. A-F The monthly food consumption of females S6F, S7F and S8F at Sea World of California, and of female M4F at Matsushima 6 months prior to and 12 months after the delivery of their calves. 0 indicates the month of birth. Weaning here means the moment when the calves started to eat fish, however, they continued to suckle for some months.
fresher fish. A decrease in food consumption in February 1988 at Matsushima Aquarium coincided with a change from Herring to Chub mackerel. Changes in food intake due to the preference for a particular fish species are probably short-term. When animals such as dolphins and pinnipeds
become hungry after some days to a week, they start to eat normal quantities.
(b) Caloric density The diet can contain more or less energy per unit weight. Table 4 shows that the relatively small animals at Duisburg Zoo ate
175

R.A. Kastelein et al.
Figure 8. Birth of a Commerson's dolphin. Consider the large combined body sizes of mother and calf (Photo: Sea World of California photo department).
Table 2. The total food consumption in 12 months prior to delivery for 8 cases, compared to the food consumption during non-pregnant, non lactating 12 month periods of the same animals.
Animal
Birth Food intake during date 12 months prior to birth calf (kg)
Food intake during non-pregnant, non-lactating 12 months periods
(kg)
M4F S6F S6F S8F S8F S7F S7F S7F
1/7/89 19/4/86 28/9/88 21/2/85 10/7/87 5/12/85 25/5/87 10/9/88
1246 1192 1312 1448 1349 1304 1241 1452
1469 (July 87-My 88), 1499 (1990) 139/(1987), 1299 (1989), 1404 (1990)
1626 (1986), 1922 (1988), 1409 (1989), 1559 (1990)
1376 (1984), 1442 (1988), 1327 (1989), 1426 (1990)
relatively little compared to their body weight while living in quite cold water. This may partly be explained by the high caloric density of the diet. A large part of their diet consists of Sprat, which on average has 15% more calories per weight unit than Herring (de Groot et al., 1988). The caloric value of a specimen of a fish species may vary and depends on its age, sex, origin and the season. In 1980 and
1986 a larger proportion of squid was fed to D IM and D4M. This resulted in an increased food intake (Figs. 2A & D). D2M's food intake did not increase in those years because he generally did not accept squid. This may also explain his relatively low intake, as it consisted mainly of Herring and Sprat (Fig. 2C). The high food intake of the animals at Toba Aquarium may be partly explained by the
176

Commerson's dolphin food consumption
Table 3. The food intake in the mother during the period that the calf was fully dependent on milk, and during periods of the same length in the same season in non-pregnant, non-lactating years (Baseline).
Mother
S8F S8F S7F S6F S6F M4F
Calf
S4M S5M S9F S11F S10F M6F
Period only dependent on milk (days)
133 163 236 73
198 112
Food intake when calf was fully dependent
a milk (kg/day)
5.5 6.0 4.4 4.6 4.4 6.6
Food intake during baseline
period (kg/day)
4.9 (1986), 4.3 (1989) 4.8 (1988), 4.4 (1990) 4.3 (1984), 3.6 (1990)
3.9 (1984), 3.1 (1987), 3.8 (1990) 4.3 (1984), 3.2 (1989) 3.9 (1987), 4.0 (1990)
small size of the animals, and partly by the relatively low caloric value of the fish. Per unit weight, Mackerel has about 20% less energy than Herring, and 25% less than Columbia river smelt (Table 3; Ridgway et al., 1991). However, the caloric content of Herring particularly is extremely variable depending on the season of catch.
(c) Bio-availability. The diet can be digested more or less efficiently. The enzymes of the digestive tract have to adapt to a new diet. Some of the fish species fed in the present study may not have been digested efficiently when the animals had recently arrived in human care. Changes in food intake due to digestibility changes are probably short-term, because the digestive tract will soon adapt to the new diet.
5. Metabolic rate The metabolic rate influences the food intake, depends on several factors.
and
a. Basal metabolism Individual animals may have different basal metabolic rates, which influence the food intake. Cetaceans have large thyroid glands compared to terrestrial mammals of similar weights, and the thyroid hormones regulate the metabolism. However, there seems to be no simple correlation between thyroid hormone plasma levels and the activity level of a cetacean species (Ridgway and Patton, 1971). The basal metabolic rate of Commerson's dolphins has not yet been determined. Too few thyroid hormone measurements have been carried out on Commerson's dolphins to be of any value, as T3 and T4 levels have only been measured on 2 animals (DIM & D4M) at Duisburg Zoo (Kastelein et al., 1993). T4 levels can fluctuate rapidly, so studies based on small sample sizes may lead to erroneous conclusions. A direct correlation between T4 levels and metabolic rate can therefore not be made.
b. Body weight Body weight seems to play an important role in food intake, because the comparatively small animals at Toba Aquarium ate more per unit of body weight than the bigger animals from Sea World and Matsushima Aquarium (where the water temperature was higher), and Sunshine Aquarium (where the water temperature was similar, Table 4). The comparison between the food intake of animals of Sea World and Toba Aquarium, in regards of effect of water temperature, may not be valid, because both parks fed different diets to their animals.
Sergeant (1969) describes the feeding rates of eight odontocete species living in oceanaria and research facilities. In some cases he mentions the diet, but he unfortunately never mentions water temperatures. He concludes that the smaller the dolphin, the higher the feeding rate as a percentage of body weight, although the activity level and body composition of the species are of influence as well. The data of the present study agree with this; all else being equal, the smaller the animals, the higher the metabolic cost per unit of body weight (kg0-75). This is true for virtually all mammals.
As a comparison, Kastelein and Vaughan (1989) describe the food consumption of a female killer whale {Orcinus orca). When she weighed 1900 kg, she ate 2.3% of her body weight per day. She was kept in a pool with a water temperature of between 15 and 22°C and on a diet of 35% Herring {Clupea harengus), 36% Mackerel {Scomber scombrus), 6% Whiting (Merlangus merlangus), 12% Sprat (Sprattus sprattus) and 11% Squid (Illex spp.) based on weight.
c. Growth In general, growing young animals eat more than adults relative to their body weight. Kastelein et al. (1990) described the food consumption of Harbour porpoises. In a pool with water temperatures between 17 and 20°C, 2 adult males, which were
177

R.A. Kastelein et al.
Code Y r s | j | F M A M J J | A | S | O | N | D |
_SIM_TBBT iLZ3H|HHfl s3^ 7 i i -°JK_^H S4M s T ^ m ^ ^ ^ H S5M T J o ^ ^ ^ m ^ ^ ^
201
15'
I P 10'
v 3
J ' F ' M ' A ' M " J " J " A ' S ' O ' N ' D ' Month
Code D1U
02 M D4M
Yrs| J
" I • < l
F
1
M A M J J A M O M D I
H 20
15'
5<->
J ' F ' M ' A ' M ' J ' J ' A ' S ' O ' N ' O " Month
Code U1M U2M
U3M
U4F U5F
Yrs 2
2
3
3
3
J F M| A
olo • I 1 I
M | J | J | A | S • • • r ^Wfc j
0 N D
• • 20
15'
*P %~ 10-1
3 ' J ' F ' M ' A ' M ' J ' J ' A ' S ' O ' N ' D '
Month
Code M1M M2M
M3F M5F
Yrs| J • 1 • 1 r 3 •
M A M J j | A | S | O | N | D | Hw LJ^H j ^ ^ B H B H 20n
15'
go > O 10-
o 3
J F M A M J J A S ' O ' N ' D ' Month
Code T1M T2M T3M
Yrs 3 3 3
J F M A | M | J | J | A | S | O | N
M*d M i D
• o^^H a E o
201
15-
SP 10'
+ J F M A M J J A S 0 N D Month
Figure 9. The average monthly water temperatures and an indication of the relative level of the average monthly food consumption taken over the available years. A black square indicates a month in which the animal ate more than the monthly average over the years. A blank square indicates a month in which the animal ate less than the monthly average over the years. A square with an o indicates a month during which the animal ate the monthly average over the years. (A) Sea World of California, (B) Duisburg Zoo, (C) Sunshine Aquarium, (D) Matsushima Aquarium, (E) Toba Aquarium.
stable at 38 and 32 kg, ate around 8% of their body weight per day, while a growing (16 to 24 kg) female ate 10.4% of her body weight per day. All animals were fed Herring. Meyers et al. (1978) described a growing female Harbour porpoise
which ate 10.8% of her body weight (Herring, Mackerel and Capelin, proportions not mentioned). This animal was kept in a pool at 19°C, and the data agree well with the above-mentioned growing female. Andersen (1965) described the
178

Commerson's dolphin food consumption
250
—' 200 c o Q. £ 150 3 CO c o o 73 o o
c o
100
50
o' o
0 6 12 18 24 30
Average monthly water temperature(°C) Figure 10. Relationship between average water temperature per month and total food intake per individual per month. Measurements (N = 295) of 4 individual males from Sea World of California (SIM, S2M, S3M, S4M). Regression line: y=179-3.1x.
Table 4. The average annual water and air temperatures at the 5 parks, the average relative food consumption (% of total body weight), average body weight and main fish species in the diet of the adult Commerson's dolphins (males and non-pregnant, non-lactating females)
Park
Sea World Matsushima Aquarium Toba Aquarium Sunshine Aquarium Duisburg Zoo
Average water temp. (°Q
16.9 13.4 11.8 11.3 10.7
Average air
temp. CQ
18.2 17.7 14.9 14.6 11.3
Average body
weight (kg)
40.2 42.5 34.0 41.4 37.7
Main fish
species
Herring Mackerel Mackerel
Mackerel/Smelt Sprat/squid
Average daily food consumption of adult animals
(% of body weight)
10.1 10.6 11.8 10.2 8.8
N
3 4 3 5 3
SD
0.3 0.5 0.1 0.6 0.4
Range
9.8-10.4 10.0-11.0 11.7-11.9 9.6-10.9 8.4-9.1
food consumption of 8 Harbour porpoises that were kept in an indoor pool (temperatures were not reported) and fed mainly Herring. He found that the adult animals weighing approximately 40 kg consumed on average around 8% of their body weight per day, whereas growing animals ate around 13% of their body weight each day.
Commerson's dolphins reach mature sizes early, and those in the present study eat as much as adult animals during their third year. At Matsushima, calf M6F even ate as much as an adult during her second year (Fig. 4F), 1 year in advance of the calves at Sea World. Table 1 shows that this calf was not born especially early in her first calender year. During their growth period Commerson's
dolphins in the present study were not found to eat more than adults in proportion to their body weight. This may be explained by the fact that adult Commerson's dolphins retain a high activity level.
d. Activity level The metabolic rate depends not only on the basal metabolism, but also on an animal's activity level. The adult Commerson's dolphins in the present study ate slightly more than adult Harbour porpoises under similar circumstances (Kastelein et al., 1990), which, other than by a difference in body composition, could be explained by the difference in swimming behaviour between the two species. Harbour porpoises swim fast for a few
179

R.A. Kastelein et al.
Figure 11. A newborn Commerson's dolphin calf suckling from its mother. This energy drain increases the mother's food intake (Photo: Sea World of California photo department).
minutes, then float at the surface. Commersons' dolphins usually swim much faster, and are very erratic.
When U1M and U2M were moved to the Osaka Aquarium in 1990, the animals lost weight at first, even though pool temperature and their food intake were higher than before (Fig. 3A+B). Adaptation to a new environment probably increases the metabolic rate because the animals are usually restless and temporarily swim faster. In addition, in warmer water, odontocetes often loose weight because their blubber layer becomes thinner (Williams et al, 1992).
Although the animals in the present study were kept in pools, their activity level is not necessarily lower than that of conspecifics in the wild. The animals in the present study swam most of the day. Even in the wild the animals are not active all the time. In a group which followed and surrounded a 15 m fishing boat in the Strait of Magellan,
some animals were resting whereas others were swimming very fast around the bow of the boat.
e. Ambient water temperature Ambient temperature has an effect on the metabolic rate in mammals (Innes et al, 1987), and changes in temperature should affect the feeding rate. At Sea World, when in 1987 the average annual temperature of a male Commerson's (S2M) dolphin's pool dropped from 17 to 13°C, his annual food consumption increased from 1550 to 1900 kg, while his body weight remained fairly constant at around 45 kg (Fig. IB). When the same happened to S3M, his annual food consumption increased from 1420 to 1640 kg, while his body weight remained fairly constant at around 42 kg (Fig. 1C). In 1989, U5F increased her food consumption while the water temperature remained constant, which resulted in an increase in body weight (Fig. 3E).
180

Commerson's dolphin food consumption
Figure 12. A new-born Commerson's dolphin calf with its mother. Note the oval genital patch, already indicating at this early age that it is a male, and the umbilical rostral of it. The calf has a large tail fluke relative to its body length. Also note the unfavourable body surface to body volume ratio of the calf relative to its mother. Even the adult is small in comparison to most odontocetes (Photo: Sea World of California photo department).
A comparison of the average proportional food consumption of males and non-pregnant, non-lactating females in the 5 institutions, yielded no significant correlation between proportional food consumption per year and water temperature. However, the data of Figure 9 do suggest that the animals eat less during the warmer months, and this is substantiated by the relationship between ambient water temperature and food intake expressed in Figure 10. Assuming a linear relationship between average monthly water temperature (x) and total monthly food intake (y) and assuming that the 4 males of Figure 10 are representative for Commerson's dolphins, it is possible to calculate how much one animal needs to eat per month (y= 179 — 3.1x).
The thermal neutral zone (temperature range in which the metabolic rate is the lowest) of the Commerson's dolphin is unknown. The relation
ship between water temperature and energy requirement is shown in fig 10. It is likely that the energy requirement also increases when the water temperature rises above a certain level, and the animals have to actively dissipate heat to prevent heat stress. To do so, dolphins circulate more blood through the superficial layers of their fins and flukes (Scholander and Schevill, 1955). It would be interesting to study whether redistribution of blood uses more or less energy than sweating or panting in terrestrial mammals. If at higher temperatures food intake increases, the graph of figure 10 would become U-shaped (see Bartholomew, 1977).
Only one other published report of Commerson's dolphin food consumption exists (Spotte et al., 1979). Two animals were mainly fed Atlantic Herring (Clupea harengus). Average water temperature was 17°C. The average food consumption of 2 animals, which had an average weight of 35 kg, was
181

R.A. Kastelein et al.
3.6 kg of Herring per day. This is 10.3% of their body weight, which is within the general range found in the present study, except at the Toba Aquarium and Duisburg Zoo (Table 4).
Possibly the radiation of the sun also has a small influence the metabolism of a Commerson's dolphin. When surface bobbing, the black dorsal fin and back are above the water. At Duisburg Zoo, the animals are very active swimmers most of the day, but when they float in the morning they do it in the sun, and later in the day they prefer to float in the shade.
/ Health status Food intake usually decreased during the rare occurrences of illness experienced by the animals in the present study. In 1985, D2M suffered from pneumonia for 3 periods which totalled 6 months. This caused an annual food intake reduction of 20% (Fig. 2C). However, in most cases during illness the animals were force-fed for some days to keep their digestive tract active, so that the influence of illness was not always visible because the smallest analysis unit was the average food consumption per month. After recovery the animals usually compensated for the period of reduced food intake by eating more afterwards.
Ecological significance The present study shows that Commerson's dolphin energy requirements depend on reproduction, lactation, diet, metabolic rate, body weight, growth, activity level, ambient temperature and health status. The relative importance of each parameter is difficult to determine when comparing data from different parks, due to the small sample size and the variation in parameters among the parks. Therefore it is difficult to isolate changes due to a single parameter.
Whether dolphins living in pools eat more or less than their conspecifics in the wild can only be speculated (Innes et al. 1987). However, food intake changes due to age, reproduction, water temperature and season are probably similar to those in the wild. The present study shows that lactating animals need a relatively large food supply, which should be available in the oceans at the time of year when lactation occurs. In the wild, births occur at the beginning of the austral summer (Gewalt, 1979 & 1981; Mermoz, 1980; Goddall et al., 1988) when the water is relatively warm, and food becomes relatively abundant. The present study suggests that females which lose excessive weight before or during the lactation period, require relatively more food after weaning. These females might compete with their calves if the
CO 5
2 2
I
10" 9-8 7H 6 5-0-"-
J ' F " M " A ' M " J " J " A 1 S " 0 N" D" Month
Figure 13. Annual fluctuations in the mean water surface temperature of the Strait of Magellan and surrounding waters.
Commerson's dolphin numbers are in balance with the amount of available prey in different seasons. The diets of young and adult animals may differ as it does in Harbour porpoises in Washington state waters (Gearin and Johnson, 1991). Different hunting skills due to age differences may serve to reduce competition among conspecifics.
How much food does an adult Commerson's dolphin require in the Straits of Magellan? The average monthly surface water temperature in the Straits of Magellan varies over the year between 6 and 10°C (Fig. 13). This means that most parks keep their Commerson's dolphins in wanner water than that experienced by their wild conspecifics (Table 4). However, using the extrapolated data from Figure 10 (and assuming that the animals were kept at temperatures below their thermal neutral zone), it is possible to make a rough food intake estimate for an average adult Commerson's dolphin in the Strait of Magellan. The data show that an adult Commerson's dolphin requires about 1850 kg of Herring (37 x 105 kcal) per year (Table 5). The fact that S2M ate more in 1987 with an average water temperature of D'C (Fig. IB) could be due to the fact that in that year the animal was moved to a new and colder pool twice, for a combined period of 5 months. Adaptations to a new environment probably made the animal more active than usual, causing him to require more energy, and when moved from a warmer pool to a colder pool, the animal needed some time to put on a thicker insulating layer. During that time the animal probably had to eat more to stay warm.
Estimating the number of Commerson's dolphins in a given area and measuring monthly water temperature enables a rough estimate to be made of the amount of food needed per month or per year by the Commerson's dolphin population involved. The fluctuation in the annual food intake can be related to the on and offshore fish migrations. It is possible that a shortage of fish in one particular season due to natural causes or activities of the fishing industry might cause a population decline in
182

Commerson's dolphin food consumption
Table 5. Average monthly surface water temperature in the Strait of Magellan, South America, and the estimated food intake per month per adult Commerson's dolphin, based on a diet of mainly Herring and the extrapolated line in Figure 10.
Month
January February March April May June July August September October November December
Annual food intake
Temp. CO
10 10 10 10 7 6 6 6 7 7 8 9
Food intake (kg)
148 148 148 148 157.3 160.4 160.4 160.4 157.3 157.3 154.2 151.1
1850
dolphins, as has been suggested to occur for Northern fur seals, Callorhinus ursinus (Trites, 1992).
Unlike most larger cetaceans, but in common with Harbour porpoises, Commerson's dolphins have a very unfavourable (i.e. low) body weight to surface ratio (Andersen, 1981). This is disadvantageous to both species because they live in relatively cold water (Kanwisher and Sundnes, 1965). This unfavourable body weight to surface ratio is partly compensated for by a thick insulating blubber layer relative to larger odontocetes. Commerson's dolphins probably cannot go several consecutive days without food. They may forage almost continuously, as shown by the energetic part of the present study, and (except for days on which breeding activities occur) they need several feedings per day as shown by the short passage time of food (at least the dyes) through the gastro-intestinal tract (Kastelein et ah, 1993). Whether Commerson's dolphins in the wild feed at night is not known. This means that Commerson's dolphins cannot readily migrate long distances in areas without suitable prey, and this could explain the fact that this species inhabits coastal waters. If not fed sufficiently, the animals visibly lose weight within days, become more susceptible to the effects of parasites and infectious diseases. In extreme cases they may become hypothermic and die. These events may also occur the other way around: the dolphins may be rendered incapable of catching sufficient fish due to a disease. Therefore it is important to consider the size and dynamics of the prey fish stocks in the design of rational
management plans for small odontocetes in certain geographical areas.
Acknowledgements
We thank all personnel at the 5 parks for keeping accurate food consumption records. We thank the following people for their help with this project: of Duisburg Zoo: Wolfgang Gewalt, director, and Reinhold Reimann, head trainer. Of Sea World of California: Jim Antrim, curator of mammals, Tom Goff, assistant curator of mammals, Dee Dee Dilworth, administrative assistant, and Keith Crew, senior trainer. Part of this study is Sea World of California Technical Contribution No. 9203-C. We also thank T. Kataoka of Toba Aquarium, Japan. Peter Mekking, Angelika Hutter, Nancy Vaughan and Brigitte Slingerland contributed to the data analysis. Liesbet Berghout made most of the graphs. The mean sea surface temperatures were provided by the Royal Dutch Meteorological Institute (KNMI). The mean air temperatures in Duisburg were supplied by the Deutscher Wetterdienst/Wetteramt Essen (DWD). We thank Dan Odell, research biologist at Sea World of Florida and Nancy Vaughan for their comments on the manuscript.
References
Aguayo, L. A. (1975) Progress report on small cetacean research in Chile. J. Fish. Res. Board Can. 32, 1123-1143.
Andersen, S. (1965) L'alimentation du Marsouin (Phocoena phocoena), L. en captivite. Vie et milieu, 16A, 799-810.
Andersen, S. H. (1981) Body surface area of juvenile Harbour porpoise, Phocoena phocoena. Aquatic Mammals, 8(3), 94-95.
Angot, M. (1954) Observations sur les mammiferes marins de l'archipel de Kerguelen, avec une etude detailee de l'Elephant de mer Mirounga leonina (L.) Mammalia, 18, 1-111.
Anonymous (1987) Estimacion de densidad de Toninas overas (Cephalorhynchus commersonii, Lacepede, 1804) en el sector oriental del Estricho de Magallanes. Universidad de Magallanes, Instituto de la Patagonia. Inf. Inst. Pat. 42.
Bartholomew, G. A. (1977) Body temperature and metabolism. In Animal physiology: principles and adaptations (ed. M. S. Gordon), pp. 364-449, Macmillan, New York.
Bastida, R., Lichtschein, V. & Goodall, R. N. P. (1988) Food habits of Cephalorhynchus commersonii of Tierra del Fuego (SC/36/SM24). In Biology of the Genus Cephalorhynchus (eds R. L. Brownell Jr & G. P. Donovan) Rep. of the I.W.C. Special Issue 9, pp. 143-160.
Beddington, J. R., Beverton, R. J. H. & Lavigne, D. M. (1985) Problems in estimating food consumption. In Marine mammals and fisheries (eds J. R. Beddington,
183

R.A. Kastelein et al.
R. J. H. Beverton & D. M. Lavigne). George Allen & Unwin, London, pp. 273-275.
Boolootian, R. A. (1956) Notes on a specimen of the Harbour porpoise. / Mammalogy, 38(2), 265-266.
Brownell, R. L. (1974) Small odontocetes of the Antarctic. In Antarctic mammals, Antarctic Map Folio series, Am. Geogr. Soc. New York, 18, 13-19.
Cornell, L. H., Antrim, J. E., Asper, E. D. & Pincheira, B. J. (1988) Commerson's dolphins (Cephalorhynchus commersonii) live-captured from the Strait of Magellan, Chile (SC/36/SM5) In Biology of the Genus Cephalorhynchus (eds R. L. Brownell, Jr & G. P. Donovan) Rep. of the I.W.C. Special Issue 9, pp. 183-196.
Gaskin, D. E., Smit, G. J. D., Watson, A. P., Yasui, W. Y. & Yurick, D. B. (1984) Reproduction in the Porpoises (Phocoenidae): Implications for management. In Reproduction in whales, dolphins and porpoises (eds W. F. Perrin, R. L. Brownell Jr & D. P. DeMaster). Rep. Int. Whal. Commn. Cambridge. Special Issue 6, pp. 135-148.
Gearin, P. J. & Johnson, M. A. (1991) Harbour porpoise food habits in Washington state. Abstract: a 9th biennial conference on the biology of marine mammals, Chicago.
Gewalt, W. (1979) The Commerson's dolphin (Cephalorhynchus commersoni) capture and first experiences. Aquatic Mammals 7(2), 37-40.
Gewalt, W. (1981) Ein 'neues' Zootier, Der Jacobita oder Commerson's dolphin (Cephalorhynchus commersoni) La Cepede 1804, in Walarium des Zoo Duisburg. Zoologische Beitrage. Neue Folge. 27, 199-204.
Gewalt, W. (1985) Commerson's dolphin (Cephalorhynchus commersoni). Aquatic Mammals 11(2), 41.
Gewalt, W. (1990) The Jacobita, or Commerson's dolphin (Cephalorhynchus commersoni), Aquatic Mammals 16(2), 53-64.
Gewalt, W. (1991) Unsere Jacobita (Cephalorhynchus commersoni Lacepede 1804) Expeditionen 1978, 1980 und 1984 (in German). Zool. Garten N.F. 61 (5/6), 289-359.
Goodall, R. N. P. & Cameron, I. S. (1980) Exploitation of small cetaceans off southern South America. Rep. Int. Whal. Comm. 30, 445^t50.
Goodall, R. N. P., Galeazzi, A. R., Leatherwood, S., Miller, K. W., Cameron, I. S., Kastelein, R. A. & Sobral, A. P. (1988) Studies of Commerson's dolphins, Cephalorhynchus commersonii, of Tierra del Fuego, 1976-1984, with a review of information on the species in the South Atlantic (SC/36/SM8). In Biology of the Genus Cephalorhynchus (eds R. L. Brownell Jr & G. P. Donovan) Rep. of the I.W.C. Special Issue 9, pp. 3-70.
De Groot, B., Dijkema, R. & Redant, F. (1988) Vis, schelp- en schaaldieren (in Dutch). SpectrumGids. Trendboek B. V. Maarssenbroek. 26-28.
Harmer, S. F. (1922) On Commerson's dolphin and other species of Cephalorhynchus. Proc. Zool. Soc. London, 627-638 + 3 plates.
Innes, S., Lavigne, D. M., Earle, W. M. & Kovacs, K. M. (1987) Feeding rates of seals and whales. / of Anim. Ecol, 56, 115-130.
Joseph, B. E., Antrim, J. E. & Cornell, L. H. (1987) Commerson's dolphin (Cephalorhynchus commersonii): a discussion of the first live birth within a marine zoological park. Zoo Biol, 6, 69-77.
Kanwisher, J. & Sundnes, G. (1965) Physiology of a small cetacean. Hralradets Skrift. 48, 45-53.
Kastelein, R. A. (1984) Commerson's dolphin, Cephalorhynchus commersonii (Lacepede, 1804). Review of published information and report on field research in the Strait of Magellan, Chile, January-February 1984. MSc. Thesis, Agricultural University Wageningen, NL.
Kastelein, R. A. & Vaughan, N. (1989) Food consumption, body measurements and weight changes of a female Killer whale (Orcinus orca). Aquatic Mammals, 15(1), 18-21.
Kastelein, R. A., Bakker, M. J. & Dokter, T. (1990) The medical treatment of 3 stranded Harbour porpoises (Phocoena phocoena). Aquatic Mammals, 15(4), 181-202.
Kastelein, R. A. & van Battum, R. (1990) The relationship between body weight and morphological measurements in Harbour porpoises (Phocoena phocoena) from the North Sea. Aquatic Mammals 16(2), 48-52.
Kastelein, R. A., Vaughan, N. & Wiepkema, P. R. (1990a) The food consumption of Steller sea lions (Eumetopias jubatus). Aquatic mammals 15(4), 137-144.
Kastelein, R. A., Verhoeven, I. & Wiepkema, P. R. (1990b) The food consumption of South African fur seals (Arctocephalus pusillus) at the Harderwijk Marine Mammal Park. Int. Zoo. Yearbook, 29, 175-179.
Kastelein, R. A., Wiepkema, P. R. & Vaughan, N. (1990c) The food consumption of Grey seals (Halichoerus grypus) in human care. Aquatic Mammals, 15(4), 171-180.
Kastelein, R. A., Kershaw, J. & Wiepkema, P. R. (1991) The food consumption of Southern elephant seals (Mirouga leonina). Aquatic Mammals, 17(2), 76-87.
Kastelein, R. A., McBain, J. & Neurohr, B. (1993) Information on the biology of Commerson's dolphins (Cephalorhynchus commersonii). Aquatic Mammals, 19(1).
Leatherwood, S., Kastelein, R. A. & Miller, K. W. (1988) Estimate of numbers of Commerson's dolphins in a portion of the northeastern Strait of Magellan, January-February 1984. (SC/36/SM7). In Biology of the Genus Cephalorhynchus (eds R. L. Brownell Jr & G. P. Donovan) Rep. of the I.W.C. Special Issue 9, pp. 93-102.
Lockyer, C , Goodall, R. N. P. & Galeazzi, A. R. (1988) Age and Body-length characteristics of Cephalorhynchus commersonii from incidentally-caught specimens off Tierra del Fuego (SC/36/SM4). In Biology of the Genus Cephalorhynchus (eds R. L. Brownell Jr & G. P. Donovan) Rep. of the I.W.C. Special Issue 9, pp. 103-118.
Mermoz, J. F. (1980) A brief report on the behaviour of Commerson's dolphin, Cephalorhynchus commersonii, in Patagonian shores. Sci. Rep. Whales res. Inst, 32, 149-153.
Meyers, W. A., Horton, H. C , Heard, F. A., Jones, A., Winsett, G. & McCulloc, S. A. (1978) The role of recorded data in acclimatizing a harbour porpoise (Phocoena phocoena). Aquatic Mammals, 6(2), 54-64.
184

Commerson's dolphin food consumption
Recchia, Ch. A. & Read, A. J. (1989) Stomach contents of harbour porpoises, Phocoena phocoena (L.), from the bay of Fundy. Can. J. Zool. 67, 2140-2146.
Ridgway, S. H. & Patton, G. S. (1971) Dolphin thyroid: some anatomical and physiological findings. Z. vergl. Physiologie, 71, 129-141.
Ridgway, S., Reddy, M., Kamolnick, T., Skaar, D. & Curry, C. (1991) Calorie consumption of growing, adult, pregnant, and lactating Tursiops. IAAAM Abstract.
Scholander, P. F. & Schevill, W. E. (1955) Counter current heat exchange in the fins of whales. / Applied Physiol. 8, 279.
Sergeant, D. E. (1969) Feeding rates of Cetacea, Fisk. Dir. Skr. Ser. Hav. Unders., 15, 246-258.
Shochi, Y„ Zbinden, K„ Kraus, C , Gihr, M. & Pilleri, G. (1982) Characteristics and directional properties of the sonar signals emitted by the captive Commerson's
dolphin, Cephalorhynchus commersonii (Gray. 1846). In Investigations on Cetacea (ed. G. Pilleri) Vol. 13, Institute of Brain Anatomy, Berne, pp. 177-204.
Spotte, S., Radcliffe, C. W. & Dunn, J. L. (1979) Notes on Commerson's dolphin (Cephalorhynchus commersonii) in captivity. Cetology 35, 1-9.
Trites, A. W. (1992) Northern fur seals: why have they declined? Aquatic Mammals, 18(1), 3-18.
Utrecht, W. L. van (1978) Age and growth in Phocoena phocoena Linnaeus, 1758 (Cetacea, Odontoceti) from the North sea. Bijdr. tot de Dierk. 48(1), 16-28.
Weber, H. (1929) Als Pelzjager im Feuerland (in German). August Scherl G.m.b.H., Berlin.
Williams, T. M., Haun, J. E., Friedl, W. A., Hall, R. W. & Bivens, L. W. (1992) Assessing the thermal limits of Bottlenose dolphins: a cooperative study by trainer?, scientists, and animals. IMATA Soundings, Fall Issue, 16-17.
185

Chapter 2.12
Aquatic Mammals 1993, 19.1, 13-19
Information on the biology of Commerson's dolphins (Cephalorhynchus commersonii)
R. A. Kastelein1, J. McBain2 and B. Neurohr3
iHarderwijk Marine Mammal Park, Strandboulevard-oost 1, 3841 AB Harderwijk, Holland 2Sea World of California, 1720 South Shores Road, San Diego, CA 92109-9980, USA
iZoo Duisburg, Muelheimerstrasse 273, 4100 Duisburg, Germany
Key words: Cephalorhynchus commersonii, food passage time, metabolism, reproduction, lactation, swimming bahaviour.
Introduction
Very little is known about the Commerson's dolphin (Cephalorhynchus commersonii) due to its remote distribution area around southern Chile, southern Argentina, the Falkland Islands and the Kerguelen Islands (Angot, 1954; Brownell, 1974; Aguayo, 1975). The small, black and white cetacean was first kept in human care in 1978 (Spotte et al., 1979; Gewalt, 1990). This paper presents some anecdotal information on passage time of food through the digestive tract, metabolic rate, reproduction, suckling, weaning and swimming behaviour of Commerson's dolphins in zoological parks. Some of these anecdotes may stimulate researchers to conduct more elaborate scientific studies. Details on the biology of the Commerson's dolphins may provide information required for the management of this dolphin and other small toothed whales in human care and in the wild. We report here details of the care of Commerson's dolphins at Sea World, USA, Duisburg Zoo, Germany, and Matsushima Aquarium, Japan.
Methods, Results & Discussion
Passage time of food through gastrointestinal tract To measure the passage time of food through the gastrointestinal tract, dyes were inserted into the food of some Commerson's dolphins. At Sea World of California, gelatine capsules containing carmine red dye were used in North Atlantic herring (Clupea harengus) and Columbia river smelt (Thaleichthys pacificus) and fed to the animals. In each test, the capsules were offered at a different time of day, but never at night. After feeding, the trainers watched the animals constantly, and
recorded the time when the red dye was passed in the faeces. Tests were conducted on 3 male animals, twice in September and once in October 1991.
At Duisburg Zoo, 2 gelatine capsules with methylene blue dye were given to each of 2 male Commerson's dolphins with the fish fed during presentations (200 g Mackerel, Scomber scombrus, 250 g Herring, Clupea harengus, and 250 g Squid, Illex spp.). The 2 capsules were fed together but at a different time each test day, and never at night. A researcher watched the animal constantly on test days, and recorded the time when the faeces were blue. This study was done in November and December 1991.
The passage times of carmine red dye in 3 animals at Sea World are shown in Table 1. The average passage time was 143 min. The 2 results from S5M in September 1991 were excluded from this calculation. With this small sample size, no temporal variation in passage times could be detected during the 8 hour period in which the animals were observed. The passage times of methylene blue in 2 animals at Duisburg Zoo are also shown in Table 1. The average passage time in DIM (a slow swimming animal which often floated) was 87 min., and the average passage time in D4M (a very dynamic, erratic swimming animal) was 50 min.
The difference in passage times between the animals from Sea World and from Duisburg Zoo may be due to the squid in the diet of the animals at Duisburg Zoo. Squid is often fed as a laxative. The animals at Duisburg Zoo were also much older than those at Sea World, but whether this has an influence on passage times is not known. The passage time may vary according to the time of day. However, in the present study dyes were given at different times in the 8 hour working day, so the differences in passage times between the animals in different places probably do not represent different activity levels of the digestive tract due to different timing. Future studies of food passage times should
187

R.A. Kastelein et al.
Table 1. The passage time of carmine red dye in 3 Commerson's dolphins at Sea World (S) and of methylene blue dye in 2 animals at Duisburg Zoo (D). M=male
Animal
S5M S5M S5M S4M S4M S4M SIM SIM SIM D4M D4M D4M D4M DIM DIM DIM
Age (year)
4 4 4 6 6 6
13 13 13
>10 >10 >10 >10 >16 >16 >16
Study period
Sept. 1991 Sept. 1991 Oct. 1991
Sept. 1991 Sept. 1991 Oct. 1991
Sept. 1991 Sept. 1991 Oct. 1991
Nov. 1991 Dec. 1991 Dec. 1991 Dec. 1991 Dec. 1991 Dec. 1991 Dec. 1991
Passage time (min)
86* 109* 131 155 149 131 150 148 134 50 40 60 50
100 105 56
*Fast passage times associated with a temporary appetite depression.
involve both sexes and animals of different ages, and the dyes should be given at different times of the day and night.
In spite of its limitations, this brief study shows a fast passage time in the Commerson's dolphin. For comparison, the passage time in Bottlenose dolphins (Tursiops truncatus) is around 6 hours (Ridgway, 1972), indicating that in the wild Commerson's dolphins probably feed often and are opportunistic feeders. Whether or not they feed at night is not known.
Metabolic rate Cetaceans generally have larger thyroid glands than terrestrial mammals of similar weights. Thyroid hormones regulate the metabolism. However, there is no simple correlation between the thyroid hormone plasma level and the activity level of a cetacean species (Ridgway and Patton, 1971). The only T3 and T4 measurements in Commerson's dolphins have been carried out on 2 male animals at Duisburg Zoo in 1990. They lived in the same pool system, but had completely different activity patterns. One animal designated D4M was very active, while another animal DIM had become slow in old age, and spent lots of time floating at the water surface. DIM was over 18 years old, and Commerson's dolphins are estimated to have a maximum life expectancy of about 18 years (Lockyer et al., 1988). Both animals had similar body weights, and ate about the same proportion of their body weights each day. T3 and T4 levels in
the dynamic, young D4M were lower than those of the older slower DIM (Table 2). The T4 values found in the present study are slightly lower than those found in Bottlenose dolphins {Tursiops truncatus), and slightly higher than those found in Pacific white-sided dolphins, Lagenorhynchus obliquidens (Ridgway and Patton, 1971). Sterling et al. (1975) showed that there is no correlation between body size and serum T3 concentration in cetaceans. However, 2 Dall's porpoises (Phocoenoides dalli) were found to have very high serum T3 concentrations. The authors speculate that this was attributed to an adaptation to the low water temperatures in the distribution area of this species. Although Commerson's dolphins seem to occupy a similar niche in the southern hemisphere, the few serum T3 values found in the present study are low compared to all other cetaceans described by Sterling et al. (1975). This difference may be due to the small sample sizes, or perhaps cetaceans maintain a large circulating pool of T4 for conversion to T3 when requirements are high, or because T3 has a fast turnover rate and a short half-life in these animals, making measurement difficult (Greenwood and Barlow, 1979). The conclusions possible from the present study are severely limited because of the small sample size and the lack of variation in samples (in relation to time of day, feeding, stress, sleep and wake cycles, etc.). In terrestrial mammals, high T4 levels are often found in neonates and lactating females. T4 levels can fluctuate rapidly and greatly in cetaceans and large decreases are often associated with illness (McBain, pers. obs.). The differences in the 2 dolphins at Duisburg Zoo are minimal. In future studies, baseline data about daily fluctuations in different aged animals should first be recorded, before different individuals and species are compared.
Reproduction In Commerson's dolphins of both sexes, the point of sexual maturity has been expressed in terms of the dolphin's age or body length. Collet and Robineau (1988) estimate that male Commerson's dolphins from the Kerguelen Islands reach sexual maturity at an age of about 8 years and a body length of 165 cm. Lockyer et al. (1988) reported that the testis weight increased dramatically in Commerson's dolphins from Tierra del Fuego when they were between 5 and 6 years of age and 127 to 131 cm in length. Cornell et al. (1988) describe a 144 cm long male from Tierra del Fuego, which produced motile sperm. Collet and Robineau (1988) concluded that female Commerson's dolphins from the Kerguelen Islands reach sexual maturity at 5 years of age and at a body length of about 165 cm. Lockyer et al. (1988) estimated that
188

Information on the biology of Commerson's dolphins
Table 2. The concentrations of T4 and T3 in the blood of 2 male Commerson's dolphins from the Duisburg Zoo
Animal
DIM D4M
Age (yr)
>18 >11
Behaviour
Slow Dynamic
Free (pg/ml)
2.60
T3
Total (ng/dl)
45.1 41.2
Free (ng/dl)
1.88
T4
Total (Hg/dl)
7.9 5.3
females from South America reached sexual maturity between the age of 5 and 6 years, at a body length of 139 to 152 cm. Collet and Robineau (1988) stated that on the Kerguelen Islands, the number of ovulations a female has had is more closely correlated to length than to age, and that ovulation occurs in January. Whether females ovulate regularly is not known. December and January seem to be the peak months for mating. Commerson's dolphin births around Tierra del Fuego occur predominantly in the austral summer when the water is relatively warm and food abundant (from November to February; Gewalt, 1979 & 1981; Mermoz, 1980; Goodall et al., 1988). Joseph et al. (1987) observed that during the first year after arrival at Sea World, a pregnant female's progesterone level increased dramatically between January and May to 6 ng/ml. The gestation period is 345 ±20 days («=8) (Asper et al, 1992), so calving coincides with the mating season.
After the first few years that individual Commerson's dolphins were kept in the northern hemisphere, their reproductive months changed. At Sea World of California, sexual activity took place between January and March for the first 2 years after the dolphins arrived (Fig. 1). Later, mating occurred mainly in the second half of the year. While conception occurred in the northern hemisphere, the first 4 calves at Sea World of California were born in first half of the year (Table 3). Later, births occurred towards the end of the year. The change is probably due to the transport of the animals from the southern hemisphere to the northern hemisphere. The reproductive cycle did not change at once to the same season in the northern hemisphere, but took about 4 years to shift by 6 months. This suggests that other factors besides daylength influence sexual behaviour, which in turn influences the appetite. If daylength changes had been the only parameter influencing ovulation, a 6 month shift of the first mating season would have occurred. Possibly seasonal differences in other environmental parameters such as prey abundance, available prey species, water temperature and internal biological rhythms are also causal factors. In deer transported from the U.K. to New Zealand a similar gradual shift has been seen. It
took about 2 years before the male rut and female oestrus in the transported animals became synchronized with those of the local deer (Marshall, 1942).
The first birth of a Commerson's dolphin at Matsushima Aquarium (animal M6F) occurred in the second half of the year. Conception occurred in the northern hemisphere, after the mother (M4F) had been at the park for 16 months. For this female, 16 months was sufficient to shift her reproductive cycle by 6 months, perhaps because her oestrous cycle had not yet started at transportation. Her ovulation cycles may have started under northern hemisphere light cycles.
Suckling and weaning A full-term calf (S15M) which died shortly after birth at Sea World on 08-12-92 was 91 cm long, and weighed 8.8 kg. During the first 4 days of its life, calf S4M suckled about every 40 minutes. Each suckling session consisted of an average 8 attachments, each lasting on average 5.5 seconds. The periods during which the 6 Commerson's calves at the three locations were completely dependant on milk varied from 73 to 236 days (Table 3). The increase in solid food intake was gradual in all cases, and the calves continued to suckle frequently for some months. One calf (SI IF) died shortly after her suckling period, which may have been too short. The suckling period in Commerson's dolphins of the present study was variable. This could be attributed to opportunism on behalf of the calves. Depending on the mother's social ranking in a group, food fish that she drops may be taken by other adults, or remain available for the calf to play with or perhaps eat. At Theater of the Sea, Florida, trainers feed Bottlenose dolphin calves with live shrimp from which the tail has been removed while the adults are occupied in the shows. This opportunity to play with slow-moving prey allows the calves to wean early at 3-4 months after birth (Beverley Abbitt, pers. comm.). Usually Tursiops weans at 12-18 months of age (Kastelein, pers. obs.).
In the Baltic Sea, Harbour porpoises, which are also small cold-water odontocetes, begin to take solid food when they are about 5 months old, and weigh around 25 kg (M0hl-Hansen, 1954). This is
189

R.A. Kastelein et al.
Figure 1. Sexual interaction between a male (left) and female Commerson's dolphin. Note the sexual dimorphism in the genital patch, the female having a boomerang-shaped patch, and the male an oval patch (Photo: Sea World of California photo department).
comparable to the age of when the Commerson's dolphin calves in the present study start to accept fish. Although the moment of weaning was not accurately determined in the Commerson's dolphin calves in the present study, it was probably soon after the animals started to accept fish (as was judged by the calves' sudden large increase in food intake).
The Commerson's dolphin's rapid development can only be achieved if many calories are transferred from mother to her calf in the suckling period. The fat content of Commerson's dolphin milk is unknown but probably high. Milk from the Harbour porpoise has a fat content of 46%. This is high compared to the 10-17% fat found in the milk of the larger Bottlenose dolphin (Ridgway, 1972; Peddemors et al., 1989). Milk of a medium sized odontocete, the Common dolphin (Delphinus delphis) contains between 30-37% fat (Peddemors et al., 1989). However, the fat content of milk is not
Table 3. Birth dates, and ages at which Commerson's dolphin calves at Sea World of California (S) and Matsushima Aquarium (M) started to eat fish. They continued to suckle for some months after dependence on milk ceased. M=male, F=female. An * indicates a calf which died soon after birth
Animal
S4M S12F S11F S13M S5M S9F S10F M6F S14M
Date of birth
21/02/1985 05/01/1986 19/04/1986 25/05/1987 10/07/1987 10/09/1988 28/09/1988 01/07/1989 05/08/1990
Time of full dependence
on milk (days)
133 0*
73 0*
163 236 198 112
0*
190

Information on the biology of Commerson's dolphins
Figure 2. A new-born calf with its mother. The calf has grey skin and birth folds. The latter disappear about a week after birth (Photo: Sunshine Aquarium).
always negatively correlated to the adult body size of a species; 6 weeks into lactation Killer whale milk has a fat content of between 40 to 45%. The fat content of milk in many terrestrial mammals shows large day to day fluctuations. This may also be the case in cetaceans. Because of small sample sizes in milk fat content studies in cetaceans, the above mentioned percentages should be interpreted carefully. The milk fat may have also provided the calf with a source of metabolic water.
A high milk fat content in small cetaceans is needed because of the calves' unfavourable body mass to surface ratio (Fig. 2), which causes them to lose a lot of energy to their aquatic environment (Kanwisher and Sundnes, 1965). Energy loss is minimized if the calves' body mass to surface ratio is improved by a quick increase in volume. In addition, calves develop an insulatory blubber layer. Also, blubber lipid content is an important factor in the insulation quality (Worthy, 1991). In adult Harbour porpoises, the blubber layer and the fat found in the melon constitutes around 40% of the body weight (Slijper, 1958). Perhaps as a mechanism to enhance survival, Commerson's dolphin calves are heavy at birth in relation to their
mother. The new-born calf constitutes around 22% of the mother's body weight, and 61% of her length. In the Harbour porpoise, a similarly sized cetacean, new-born calves also make up between 20 and 25% of the mother's body weight (Kanwisher and Sundness, 1965). For comparison, new-born Bottlenose dolphins constitute about 10% of their mother's weight and around 46% of their mother's length (Kastelein, per. obs.).
Swimming behaviour In oceanaria, Commerson's dolphins usually swim fast, and are very erratic. However, they do have periods of rest which are characterized by surface bobbing. Mermoz (1980) observed Commerson's dolphins' swimming behaviour in the wild. They usually swim at moderate speed of 11-13 km/hr, and remain submerged for 15 to 20 seconds, at a depth of 1 to 1.5 m. They rarely swim in a straight line. The erratic swimming behaviour may be a specific foraging technique, used in the wild to optimize food intake, and the erratic swimming behaviour observed in Commerson's dolphins in pools may be derived from this strategy. If this is true, an increase in this behaviour would be
191

R.A. Kastelein et al.
expected before a feeding session, and a decrease after feeding. Some anecdotal information seemed to support this idea; surface bobbing occurs particularly after feeding and at the hottest time of the day (Cornell et al, 1988). However, this decrease in activity after feeding is a general phenomenon in mammals.
Commerson's dolphins in oceanaria often swim upside down (Kastelein, pers. obs.). This could have 3 possible reasons. Firstly, the visual fields of the eyes of many cetaceans probably overlap in the rostro-ventral direction (Kastelein et al, 1990), so that the animal has binocular vision and possibly stereoscopic vision in this direction. For fish, the water-air interface is a real barrier. If fish are chased from below, they are in contrast with the sky, and can be trapped between the dolphin and the water surface. By swimming upside down, the Commerson's dolphin would have a better view of the fish during the last approach before capture. Secondly, the sonar beam pattern (see Au et al, 1988) in Commerson's dolphins may be directed in the dorso-rostal direction. The Commerson's dolphin may swim upside down in order to echolocate prey on the ocean floor. Thirdly, by rotating around their body axis, Commerson's dolphins direct their black genital patches in many directions, showing to conspecifics their sex (Goodall et al, 1988) and, in case of females, their age (Kastelein, 1984).
None of the information above is derived from elaborate scientific research, so care should be taken when interpreting the data. However, the information shows that many of the biological parameters of this species are different from those of other toothed whales. This is probably because the Commerson's dolphin is one of the smallest odontocetes. Therefore studies on Commerson's dolphins not only serve to gain knowledge of this species, but are also valuable for comparison with other odontocetes.
Acknowledgements We thank the following for their help with this project: of Duisburg Zoo, Germany: Wolfgang Gewalt, director, Reinhold Reimann, head trainer and Angelika Hutter, student. Of Sea World of California, U.S.A.: Jim Antrim, curator of mammals, Tom Goff, assistant curator of mammals and Dee Dee Dilworth, administrative assistant. Karen Novak, student of the School of Veterinary Medicine, University of Wisconsin, recorded the food passage times. Part of the data used in this paper come from Sea World of California Technical Contribution No. 9202-C. We also thank M. Mohri of Sunshine International Aquarium, Japan, and S. Saijo of Matsushima Aquarium, Matsushima, Japan. We thank Dan Odell, research
biologist at Sea World of Florida, Piet Wiepkema of the Agricultural University of Wageningen and Nancy Vaughan for their comments on the manuscript.
References
Aguayo, L. A. (1975) Progress report on small cetacean research in Chile. J. Fish. Res. Board Can. 32, 1123-1143.
Angot, M. (1954) Observations sur les mammiferes marins de l'archipel de Kerguelen, avec une etude detailee de l'Elephant de mer Mirounga leonina (L.) Mammalia 18, 1-111.
Asper, E. D., B. F. Andrews, J. E. Antrim & W. G. Young (1992) Establishing and maintaining successful breeding programmes for whales and dolphins in a zoological environment. Intern. Mar. Biol. Res. Inst. Report No. 3. Kamogawa, Japan, 71-84.
Au, W. L., R. H. Penner & C. W. Trul (1988) Propagation of beluga echolocation signals. In Animal Sonar, Processes and Performance (eds P. E. Nachtigall & P. W. B. Moore). Plenum Press. New York. 47-51.
Brownell, R. L. (1974) Small odontocetes of the Antarctic. In Antarctic mammals, Antarctic Map Folio series, Am. Geogr. Soc. New York, 18, 13-19.
Collet, A. & D. Robineau (1988) Data on the genital tract and reproduction in Commerson's dolphin, Cephalo-rhynchus commersonii (Lacepede, 1804), from the Kerguelen Islands. In Biology of the Genus Cephalo-rhynchus (eds R. L. Brownell Jr & G. P. Donovan) Rep. of the I.W.C. Special Issue 9, 119-141.
Cornell, L. H., J. E. Antrim, E. D. Asper & B. J. Pincheira (1988) Commerson's dolphins (Cephalorhyn-chus commersonii) live-captured from the Strait of Magellan, Chile (SC/36/SM5) In Biology of the Genus Cephalorhynchus (eds R. L. Brownell, Jr & G. P. Donovan) Rep. of the I.W.C. Special Issue 9, 183-196.
Gewalt, W. (1979) The Commerson's dolphin (Cephalorhynchus commersoni)—capture and first experiences. Aquatic Mammals 7(2), 37^10.
Gewalt, W. (1981) Ein "neues" Zootier, Der Jacobita oder Commerson's dolphin (Cephalorhynchus commersoni, La Cepede, 1804) in Walarium des Zoo Duisburg. Zoologische Beitrage 27(23), 199-204.
Gewalt, W. (1990) The Jabobita, or Commerson's Dolphin (Cephalorhynchus commersoni), Aquatic Mammals 16(2), 53-64.
Goodall, R. N. P., A. R. Galeazzi, S. Leatherwood, K. W. Miller, I. S. Cameron, R. A. Kastelein & A. P. Sobral (1988) Studies of Commerson's dolphins, Cephalorhynchus commersonii, of Tierra del Fuego, 1976-1984, with a review of information on the species in the South Atlantic (SC/36/SM8). In Biology of the Genus Cephalorhynchus (eds R. L. Brownell Jr & G. P. Donovan) Rep. of the I.W.C. Special Issue 9, 3-70.
Greenwood, A. G. & C. E. Barlow (1979) Thyroid function in dolphins: radioimmunoassay measurements of thyroid hormones. Br. vet. J. 135, 96-102.
Joseph, B. E., J. E. Antrim & L. H. Cornell (1987) Commerson's dolphin (Cephalorhynchus commersonii): a discussion of the first live birth within a marine zoological park. Zoo Biol. 6, 69-77.
192

Information on the biology of Commerson's dolphins
Kanwisher, J. & G. Sundries (1965) Physiology of a small cetacean. Hralradets Skrift. 48, 45-53.
Kastelein, R. A. (1984) Commerson's dolphin, Cephalo-rhynchus commersonii (Lacepede, 1804). Review of published information and report on field research in the Strait of Magellan, Chile, January-February 1984. MSc. Thesis, Agricultural University Wageningen, NL.
Kastelein, R. A., R. C. V. J. Zweypfenning & H. Spekreijse (1990) Anatomical and histological characteristics of the eyes of a month-old and adult harbor porpoise (Phocoena phocoena). In Sensory Abilities of Cetaceans (eds J. Thomas & R. Kastelein). Plenum Press, New York, 463^180.
Lockyer, C , R. N. P. Goodall & A. R. Galeazzi (1988) Age and Body-length characteristics of Cephalorhyn-chus commersonii from incidentally-caught specimens off Tierra del Fuego (SC/36/SM4). In Biology of the Genus Cephalorhynchus (eds R. L. Brownell Jr & G. P. Donovan) Rep. of the I.W.C. Special Issue 9, 103-118.
Marshall, F. H. A. (1942) Exteroceptive factors in sexual periodicity. Biol. Rev. 17, 68-90.
Mermoz, J. F. (1980) A brief report on the behaviour of Commerson's dolphin, Cephalorhynchus commersonii, in Patagonian shores. Sci. Rep. Whales Res. Inst. 32, 149-153.
Mahl-Hansen, U. (1954) Investigations on reproduction and growth of the porpoise (Phocoena phocoena (L)) from the Baltic. Vidensk. Medd. fra. Dansk naturh. Foren. Bd. 166, 369-396.
Peddemors, V. M., H. J. H. de Muelenaere & K. Devchand (1989) Comparative milk composition of the Bottlenose dolphin (Tursiops truncatus), Humpback dolphin (Sousa plumbed) and Common dolphin (Delphinus delphis) from southern African waters. Comp. Biochem. Physiol Vol. 94A(4), 639-641.
Ridgway, S. H. (1972) Homeostasis in the aquatic environment. In Mammals of the sea: Biology and Medicine (ed. S. H. Ridgway). Thomas publisher, Springfield, Illinois.
Ridgway, S. H. & G. S. Patton (1971) Dolphin thyroid: some anatomical and physiological findings. Z. vergl. Physiotogie, 71, 129-141.
Slijper, E. J. (1958) Organ weights and symmetry problems in porpoises and seals. Archs. neerl. zool. 13, 97-113.
Spotte, S., C. W. Radcliffe & J. L. Dunn (1979) Notes on Commerson's dolphin (Cephalorhynchus commersonii) in captivity. Cetology 35, 1-9.
Sterling, K., P. Milch & S. Ridgway (1975) The day of the dolphin: thyroid hormone metabolism in marine mammals. In Thyroid hormone metabolism (eds W. A. Harland & J. S. Orr). Academic Press, New York. 241-248.
Worthy, G. A. J. (1991) Thermoregulatory implications of the interspecific variations in blubber composition of odontocete cetaceans, (Abstract) 9th Biennial Conf. on the Biol, of Mar. Mammals, Chicago, pg 74.
193

2
Chapter 2.13
Food consumption and body weight of harbour porpoises (Phocoena phocoena)
R.A. Kastelein1, J. Hardeman1 and H. Boer2
Harderwijk Marine Mammal Park, Strandboulevard Oost 1, 3841 AB Harderwijk, The Netherlands
Department of Animal Nutrition, Wageningen Agricultural University, Marijkeweg 40, 6709 PC Wageningen, The Netherlands
Summary
The food consumption, body weight and body dimensions of 6 healthy harbour porpoises from the North Sea were recorded. All animals had previously stranded and had been rehabilitated at the Harderwijk Marine Mammal Park. They were kept in water of between 11 and 21 °C. In 4 of the animals, positive correlations existed between body weight, body length, girth in front of the pectoral fins and girth at axilla. The adult male, in which these relationships did not occur, weighed more than the growing animals of similar length; he was more robust. Food intake differed between animals of similar weight. The adult male ate less than growing animals of similar weight. On average, the harbour porpoises of various body sizes consumed between 750 and 3250 g fish (herring and/or sprat) per day (between 4 and 9.5% of their body weight), which was between 8000 and 25000 kj per day.
Key words: odontocete, nutrition, diet, energetics
Introduction ah, 1997 b), which has a low thermal conductance (Worthy and Edwards, 1990). As a
Because of its small size and its distribution harbour porpoise loses weight, it loses more in relatively cold waters of the northern thermal energy to the environment because hemisphere (Kanwisher and Sundnes, 1965; the insulating blubber layer decreases in Gaskin, 1992) and the necessity to maintain thickness and because its body surface to an internal temperature typical of mammals, volume ratio increases. The relatively small thermoregulation is crucial for harbour appendages and dorsal fin of the harbour porpoises {Phocoena phocoena). Their larger porpoise result in it having a low body sur-body surface to body volume ratio than that face area to volume ratio compared to aqua-of larger odontocetes means that harbour tic mammals of similar body weight (Ryg et porpoises lose a great deal of energy al., 1993). This adaptation reduces heat loss, through radiation and conduction. However, they have a relatively thick blubber The food consumption of harbour porpoises layer in relation to their body size compared has been described by Dudok van Heel to other cetaceans (Parry, 1949; Read, 1990; (1962), Andersen (1965), Myers et al. (1978) Koopman, 1994; Lockyer, 1995; Kastelein et and Kastelein et al. (1990). Some investiga-
The biology of the harbour porpoise (1997) A.J. Read, P.R. Wiepkema and P.E. Nachtigall (editors), pp. 217-233. De Spil Publishers, Woerden, The Netherlands, ISBN 90-72743-07-5
195

R.A. Kastelein et al.
tors have suggested that the harbour porpoise has a relatively high metabolism compared to terrestrial mammals of similar size (Kanwisher and Sundries, 1965 and 1966; Kanwisher, 1971), although Yashui and Gaskin (1987) disagree with this based on energetic models. Worthy et al. (1987) also conclude that the metabolic rate of harbour porpoises is similar to that of terrestrial mammals of similar weight. They measured the metabolic rate of swimming short-term captive immature harbour porpoises, which were probably under stress, and calculated the basal metabolic rate to be twice that predicted for an adult terrestrial mammal of the same weight. In fact, immature animals generally have metabolic rates of about twice that of adults of similar size (Kleiber, 1975). A conclusive study about the basal metabolic rate of harbour porpoises has not yet been completed.
The natural diet of harbour porpoises consists mainly of smooth rayed fish, especially gadoids and clupeoids of 10 - 25 cm in length. The diet varies geographically and seasonally, and differences in diet between sexes or age classes may exist (Scott, 1903; Stephen, 1926; Orr, 1937; Wilke and Kenyon, 1952; Svardson, 1955; Sergeant and Fisher,
1957; Fink, 1959; Lindroth, 1962; Rae, 1965 and 1973; Andersen, 1965; Tomilin, 1967; Smith and Gaskin, 1974; Recchia and Read, 1989; Silber and Smultea, 1990; Smith and Read, 1992; Gearin et al, 1994; Aarefjord et al, 1995; Brodie, 1995; Teilmann and Lowry, 1996; Rogan and Berrow, 1996).
Growth in harbour porpoises has been studied both in the wild (M0hl-Hansen, 1954; Slijper, 1958; van Utrecht, 1978; Fisher and Harrison, 1970; Gaskin et al, 1984 and 1993; Kastelein and van Battum, 1990; Lockyer, 1995) and in human care (Kastelein et al, 1990).
Several stranded harbour porpoises have been rehabilitated at the Netherlands Cetacean Research and Rehabilitation Centre of the Harderwijk Marine Mammal Park; the present study describes their food intake and body weight. Especially in small odontocetes, information on energetics is important in the design of rational management plans, because these animals cannot survive for more than a few days without food. The information can also be used to determine the approximate amount of food needed by stranded harbour porpoises during rehabilitation.
Table 1. Age, body weight and body length ranges of the harbour porpoises during the study.
Animal
PpSH027 PpSH030 PpSH031 PpSH035 PpSH036 PpSH037
Gender
Male Male Male Male Male Female
Age range (yr.mo)
From
0.10 0.4
10.5 0.9 0.10 1.11
To
2.11 2.6
11.0 1.0 2.6 3.3
Weight range (kg)
From
19.5 15.9 36.2 24.6 19.9 26.6
To
37.2 27.0 39.1 28.4 27.1 37.9
Length range (cm)
From To
102 138 93 121
134 136 113 118 102 121 118 148
196
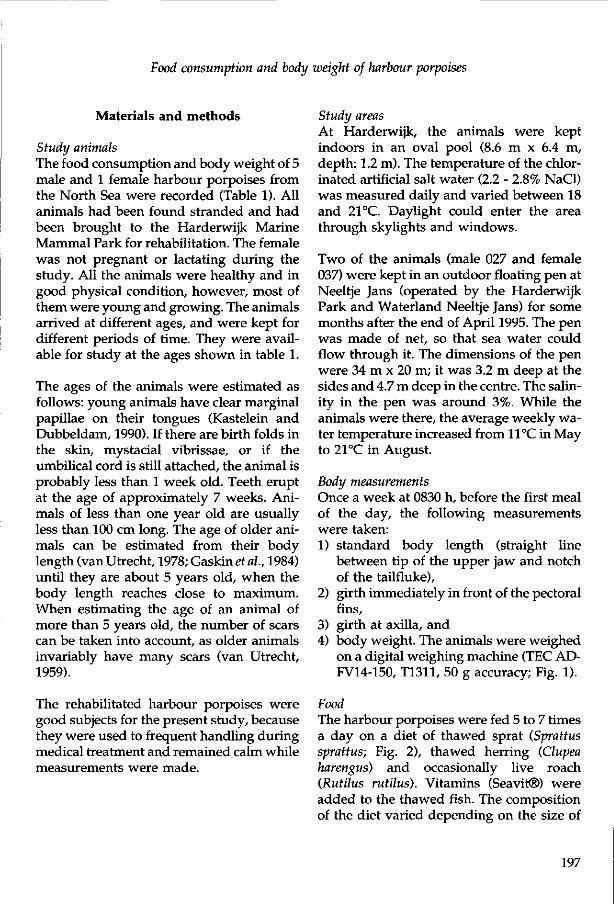
Food consumption and body weight of harbour porpoises
Materials and methods
Study animals The food consumption and body weight of 5 male and 1 female harbour porpoises from the North Sea were recorded (Table 1). All animals had been found stranded and had been brought to the Harderwijk Marine Mammal Park for rehabilitation. The female was not pregnant or lactating during the study. All the animals were healthy and in good physical condition, however, most of them were young and growing. The animals arrived at different ages, and were kept for different periods of time. They were available for study at the ages shown in table 1.
The ages of the animals were estimated as follows: young animals have clear marginal papillae on their tongues (Kastelein and Dubbeldam, 1990). If there are birth folds in the skin, mystacial vibrissae, or if the umbilical cord is still attached, the animal is probably less than 1 week old. Teeth erupt at the age of approximately 7 weeks. Animals of less than one year old are usually less than 100 cm long. The age of older animals can be estimated from their body length (van Utrecht, 1978; Gaskin et al, 1984) until they are about 5 years old, when the body length reaches close to maximum. When estimating the age of an animal of more than 5 years old, the number of scars can be taken into account, as older animals invariably have many scars (van Utrecht, 1959).
The rehabilitated harbour porpoises were good subjects for the present study, because they were used to frequent handling during medical treatment and remained calm while measurements were made.
Study areas At Harderwijk, the animals were kept indoors in an oval pool (8.6 m x 6.4 m, depth: 1.2 m). The temperature of the chlorinated artificial salt water (2.2 - 2.8% NaCl) was measured daily and varied between 18 and 21 °C. Daylight could enter the area through skylights and windows.
Two of the animals (male 027 and female 037) were kept in an outdoor floating pen at Neeltje Jans (operated by the Harderwijk Park and Waterland Neeltje Jans) for some months after the end of April 1995. The pen was made of net, so that sea water could flow through it. The dimensions of the pen were 34 m x 20 m; it was 3.2 m deep at the sides and 4.7 m deep in the centre. The salinity in the pen was around 3%. While the animals were there, the average weekly water temperature increased from 11°C in May to 21 °C in August.
Body measurements Once a week at 0830 h, before the first meal of the day, the following measurements were taken: 1) standard body length (straight line
between tip of the upper jaw and notch of the tailfluke),
2) girth immediately in front of the pectoral fins,
3) girth at axilla, and 4) body weight. The animals were weighed
on a digital weighing machine (TEC AD-FV14-150, T1311, 50 g accuracy; Fig. 1).
Food The harbour porpoises were fed 5 to 7 times a day on a diet of thawed sprat (Sprattus sprattus; Fig. 2), thawed herring (Clupea harengus) and occasionally live roach (Rutilus rutilus). Vitamins (Seavit®) were added to the thawed fish. The composition of the diet varied depending on the size of
197

R.A. Kastelein et al.
Figure 1. Harbour porpoise 030 being weighed (Photo: Henk Merjenburgh).
the porpoise and the availability of the fish species. The composition of each meal was recorded.
In growing animals, the food ration was regulated each week after weighing and observing the animals. If the animals did not gain weight or lost weight, the ration was increased. If they began to appear overweight, the ration was reduced. Adjustments were usually 70 g per day (i.e. around 10 g per meal) and sometimes 140 g per day. Adult animals were allowed to eat as much as they wanted per meal; feeding was stopped as soon as the animal dropped the fish or did not return to the care taker quickly (within approximately one minute) for another fish. Fish were fed at a temperature of 4°C. The fish were weighed (in g) on a small digital weighing machine (2 g accu
racy), and the weight of each fish species eaten during each meal was recorded.
Chemical composition and energy content of the fish Samples of the frozen fish species fed to the harbour porpoises were taken over several months. Per species the samples were put through a mincer. In this way seasonal variation in the composition of the individual fish species was ignored. However, the fish from one catch lasted for about 3 months. From the minced material, triplicate subsamples were taken to determine the gross composition, and a subsample was freeze-dried and minced for dry matter and gross energy content determination (Table 2).
Dry matter content was determined after drying samples in a vacuum oven at 50°C
198

Food consumption and body weight of harbour porpoises
Table 2. Average gross composition (g/kg) and gross energy content (kj/g) of each of the 3 fish species fed to the harbour porpoises.
Parameter Herring Roach Sprat
Dry matter Ash Crude protein Crude fat
280.3 20.1
153.2 104.3
262.2 32.6
158.4 73.2
381.0 15.7
144.8 223.7
Energy content 7.67 6.35 11.78
and a vacuum of 100 torr, using anhydrous calcium chloride as the drying agent. After 16 h, the vacuum was changed to 15 torr and the samples were weighed every 4 h until they obtained constant weight. Nitrogen content was determined in the fresh samples by Kjeldahl analysis according to ISO 5983 (1979). The crude protein was calculated by
multiplying the proportion of nitrogen by 6.25. Lipid content was assessed by extraction of freeze-dried samples with petroleum-ether and drying the extract at 103°C to a constant weight according to ISO 6492. Ash was analyzed by burning oven-dried samples in a muffle furnace at 550°C according to ISO 5984 (1978).
Figure 2. Harbour porpoise 030 eating a thawed fish (Photo: Nicole Schooneman).
199

R.A. Kastelein et al.
o>
D>
"3
>. •o o ffl
A. 4 0 -
38 -
36
34
32
30
28
26
24
22
20
18
16
14
12
80
o Male 027 • Male 030 A Male 031 x Male 035 A Male 036 • Female 037
ecee| f
90 100 110 120 130 140 150
Standard body length (cm)
"5
>. •o o 01
B 40
38
36
34
32
30
28
26
24
22
20
18
16 H 14
12
50
o Male 027 x Male 035
• Male 030 A Male 036
• •
A Male 031 • Female 037
e*l o . 8 5
. o a s ,
/ o f / O O
f * *
o _ t if " °
55 60 65 70 75
Girth in front of pectoral fins (cm)
200

Food consumption and body weight of harbour porpoises
_ O) .*
o> <D 5 >» O
m
40 38 36 34 3? 30 28
26 24
22 20 18 16 14 12
o Male 027 x Male 035
• Male 030 A Male 036
A Male 031 • Female 037
55 60 — i —
65 70 — i —
75 80
Girth at axilla (cm)
Figure 3. Relationship between body dimensions and body weight in 6 harbour porpoises, a) Standard body length, b) girth in front of pectoral fins, and c) girth at axilla.
Gross energy was determined anisothermic in a bomb-calorimeter (IKA C7000).
Analysis Relationships between body measurements of porpoises were investigated by means of Spearman rank correlation. The Bonferonni method was used to adjust for multiple correlations (Airman, 1991); the adjusted p value is given as Pb and the significance level is 0.05 throughout. Statistical analyses were carried out on Minitab release 10 (Ryan and Joiner, 1994).
Results
Body weight versus body dimensions The relationship between standard body length and body weight was positive and significant in animals 027, 030, 036 and 037 (Fig. 3a; Pb < 0.01 for all correlations).
Spearman rank correlations between all other combinations of the body measurements were also significant (see Fig. 3b and 3c; Pb < 0.01 for all correlations); standard body length, girth in front of the pectoral fins, girth at axilla, and body weight increased together as the animals grew. None of these correlations was significant in growing male 035 (of which data were collected over a short period) and adult male 031. When their body lengths were similar, adult male 031 weighed more than growing male 027 and female 037; he was more robust (Fig. 3a).
Body weight versus average daily food consumption The relationship between average daily food consumption (in g wet weight) of the harbour porpoises and their body weight is shown in figure 4 a. The average daily food consumption was calculated over the week
201

R.A. Kastelein et al.
o Male 027 x Male 035
• Male 030 A Male 036
A Male 031 • Female 037
3 c o ••s. E 3 (0 c o u •o o o
OS XI
9) O) 2 0)
3
JOUU •
3000-
2500-
2000-
1500-
1000-
500-
x x X x X x
^ A •«» *
A o *° * £ 8
— i — i — i — i — i — i — i — i — i — i — i — i —
• •
o
o o ° 0 o O o
&6> o v
$ °
- 1 1 — 1 —
• • - . -
. . , • • ° ' ° -* ^ 2*A 1 *
° * ° ° "A
° 0 m »A
•"A / J A A
A
T 1 I—I 1 1 1 1 1
16 18 20 22 24 26 28 30 32 34 36 38 40
Body weight (kg)
5 >.
•D O
.O
(A (0
3 _c
•o o o
(0 "O
<0 OJ tB
« > <
1 2
11 -
10-
9 -
8 -
7 -
6 -
5 -
4 -
3 -
2 -
!. o Male 027 • Male 030 x Male 035 A Male 036
A < > # x x " 4 o ° x x x v o «
J » O A 4 X X
V *% OA? A ° <D ° 4 A 4 A T 4 ^ A 4
A A * ^ . 4 A A * A „
• . • a ' * * » * * J 4 0 ° * • . ° 4» I " > * <X*°°
o
fi
A Male 031 • Female 037
• • _ •_
Km' * * -O OQ
o f I * oo^ o • O go 0 o ° o
°o o°
—i 1 1 1 1 1 r
• • A
o ^ . A
O A
As • • 4A A ' A 4
A
1 1 1 1
16 18 20 22 24 26 28 30 32 34 36 38 40
Body weight (kg)
202

Food consumption and body weight of harbour porpoises
30000
25000 a> J*
3 c >; 20000 a> c a>
£ 15000 «
T3
0)
| 10000
3
c. Male 027 Male 035
• Male 030 A Male 036
A Male 031 • Female 037
5000
O o
o
*4
O *<D
o o
A 4 O
Ax ° * A * * o X X X * * , ° A ( # » O
O O c
'*£• 'fo£ ^ A . i A
*c
• x»
16 18 - i —
20 22 24 — i — i — i — i — i — i — i — i — i — i — i — i — i — i — i
26 28 30 32 34 36 38 40 Body weight (kg)
Figure 4. Relationship between body weight and average daily food consumption in wet weight (a), average daily food consumption as % of body weight (b) and average daily energy intake (c) in 6 harbour porpoises.
previous to the body weight measurements. On average, the harbour porpoises of various body sizes consumed between 750 and 3250 g fish (herring and/or sprat) per day. On average, they consumed between 4 and 9.5% of their body weight daily in fresh fish (Fig. 4 b).
Animal 030 made the complete transfer from formula to fish when he weighed 15.9 kg (see also Kastelein et al., 1997 a). His food intake did not increase gradually as he gained weight. It increased strongly when he weighed between 20 and 22 kg, after which it dropped until he weighed 24 kg. Between 22 and 26 kg, male 030 ate less than males 027 and 036.
By multiplying the wet weight of the fish species in the diet of each animal by their caloric content, the data of figure 4 a can be
expressed in kilo Joules (Fig. 4 c). Younger animals were given mostly small high fat sprat, while the diet of the older animals consisted mainly of lower-fat herring. The harbour porpoises of various body sizes consumed between 8000 and 25000 kj per day.
Influence of activity level After she had spent 5 months in the outdoor floating pen, the activity level of female porpoise 037 suddenly increased noticeably. Such a change in activity level had never before been observed in harbour porpoises at the Harderwijk Park. She spent a great deal of time chasing the fish in the pen, which were up to 10 cm long (the fish had grown on average about 3 cm during the period she was in the pen). How successful she was in catching the fish was not clear. Although the water temperature had
203

R.A. Kastelein et al.
. . A . Female 037 40 T Released
in North Sea
17 5 12 19 26 2 9 16 23 30 7 14 4 18 25 1 8 April May June July August September
Date
B. Female 037 7000-1
3 6000
5000
4000
c o '& a. £ 3 M C o u •a o o >. 3000 ro
•D
2 2000-
1000
Released in North Sea
17 5 12 19 26
April May
9 16 23
June
7 14 July
4 18 25 August
1 8 September
Date
Figure 5. The weight changes of harbour porpoise female 037 when she was in the floating pen (a), and her average daily food intake during that period (b).
204

Food consumption and body weight of harbour porpoises
increased, she rapidly lost weight (Fig. 5 a). To compensate for her increased activity level, and to allow her blubber layer to increase (see Kastelein et ah, 1997 b), her food ration was increased substantially (Fig. 5 b). This had the desired effect.
Discussion and conclusions
Body weight and size Male 031 showed little variability in body length and weight because he was adult. In the North Sea, males reach their maximum length of approximately 146 cm at around the age of 10 years. Females reach their maximum length of approximately 170 cm at around the age of 14 years (van Utrecht, 1978; Gaskin et ah, 1984).
Slijper (1958) presented the lengths and weights of 28 harbour porpoises from the North Sea and Dutch and Danish coastal waters. For porpoises of between 80 and 140 cm long, the length-weight relationships of the animals in the present study and of those described by Slijper are similar. However, animals of more than 140 cm in length described by Slijper were heavier than the animals in the present study which had a similar length, perhaps because all but one of the animals in the present study were growing. The length-weight relationships of the animals in the present study and of those described by Andersen (1965 and 1981), Kastelein and van Battum (1990) and of the rehabilitated animals described by Kastelein et al. (1990), are similar. The animals in all these studies probably came from the harbour porpoise population in the North Sea; harbour porpoises of the same length from the Baltic are on average heavier (Mehl-Hansen, 1954; Gaskin et al., 1984). This could be due to the colder water in the Baltic compared to the North Sea. Harbour porpoises from Japanese waters are
also generally heavier than the animals of similar length in the present study (Gaskin et al, 1993).
Kastelein et al. (1990) described 2 stranded male harbour porpoises which increased in body weight during the recovery period. Their weight increase was associated with an increase in their blubber layer thickness but not in their length; both animals were mature. A substantial weight change in adult harbour porpoises was also observed by Spotte et al. (1978). They describe a stranded adult harbour porpoise which increased in weight from 27 kg to 42 kg without changing in length (148 cm). Adult animals of the same length may differ in weight by up to 25 kg (IVLahl-Hansen, 1954), and weight changes over short time periods are mainly caused by changes in the blubber layer thickness (Kastelein et al., 1997 b). The body weight of harbour porpoises can be estimated from their body length, by using separate equations for males and females (MLahl-Hansen, 1954; van Utrecht, 1978). A body weight estimate can be improved by including girth measurements in the equations and this method only requires one equation for both sexes. Lockyer (1995) used one girth measurement and Kastelein and van Battum (1990) used two girth measurements.
Food consumption Individual variation was observed in the relationship between food consumption and body weight. The decrease in food intake of male 030, when he weighed between 22 and 24 kg, was probably due to the development of a relatively thick blubber layer (Kastelein et al., 1997 b). His blubber layer was thicker than that of animal 036, which was of a similar size. Animal 030's thick blubber layer may have reduced the energy loss to the surrounding water.
205

R.A. Kastelein et al.
Male 031 ate less than male 027 and female 037 when they had similar body weights. However, animal 031 was adult whereas animals 027 and 037 were growing, and animal 031 was more robust than animals 027 and 037.
The food consumption data of harbour porpoises reported by Andersen (1965), Myers et al. (1978) and Kastelein et al. (1990) are difficult to compare with the results of the present study, as the food consumption of an animal may depend on several parameters such as:
1) The blubber thickness. In general, in healthy harbour porpoises, the blubber thickness decreases as the animals increase in body weight (Ryg et al., 1993; Koopman, 1994; Kastelein et al, 1997 b). So, the effect of increasing body volume on food consumption appears to be counteracted by the effect of decreasing thermal insulation of the blubber layer.
2) The insulative quality (chemical composition) of the blubber layer. This may change depending on age, body weight or environmental conditions (Worthy and Edwards, 1990).
3) The degree of growth. 4) The basal metabolic rate. 5) The activity level. 6) The diet. 7) The digestibility of the food. The
ingested gross energy of the fish fed in the present study does not represent the metabolized energy. To determine metabolized energy, the faecal and urinary energy have to be subtracted from the gross energy ingested. Information on faecal and urinary energy is difficult to obtain for odontocetes, as they urinate and defecate under water and their faeces disperse quickly.
8) The season. 9) The reproductive state.
Yasui and Gaskin (1987) calculated the metabolic requirements of harbour porpoises by a variety of indirect methods and concluded that a non-lactating adult harbour porpoise would require about 3.5% of its total body weight per day (982 000 kcal/year). Their calculation is based on the assumption that the basal metabolic rate of harbour porpoises is similar to that of terrestrial mammals of similar weight. They acknowledge that their calculations do not agree with studies based on actual food intake records (Dudok van Heel, 1962; Andersen, 1965; Myers et al, 1978), but disregard these studies on the basis that the animals were kept in human care. They assume that animals in human care in all 3 studies were obese, which is normally not the case in captive odontocetes.
Most of the information available on cetacean energetics is derived from studies on medium-sized odontocetes in oceanaria. Very little is known about the energetics of small cetaceans other than harbour porpoises and Commerson's dolphins, Cepha-lorhynchus commersonii (Kastelein et al., 1993 a and b). Commerson's dolphins in human care are usually kept in water between 10 and 17°C and consume around 10% of their body weight per day (herring and mackerel). This is slightly more than the harbour porpoises in the present study. Commerson's dolphins and harbour porpoises are of similar body sizes and appear to have similar habitat requirements. The present study shows that both species also have similar energetic requirements, although Commerson's dolphins eat slightly more than harbour porpoises. This latter aspect may be due to the fact that they gen-
206

Food consumption and body weight of harbour porpoises
erally swim faster and more erratically than harbour porpoises (Kastelein et ah, 1993 a).
Ecological significance A high number of meals per day is crucial for small odontocetes which live in cold water. They need such a large amount of food per day relative to their body weight, that they cannot survive by filling their stomachs completely a few times per day, even though their forestomach is relatively large and acts as a food reservoir (Kastelein and Lavaleije, 1992; Kastelein et al., 1997 a). This means that harbour porpoises require a relatively dependable, if not abundant, food supply to survive, and must eat often.
Mammals use energy to warm up food which is below 37°C when ingested. Perhaps harbour porpoises eat so much relative to their body weight, because their prey is cold and they use a large proportion of the energy of ingested food to heat it. The fish in the present study was fed at 4°C. How this compared to the temperature of the fish eaten by wild harbour porpoises is not known. The sea surface temperature in the harbour porpoise's distribution area is known (between 4 and 16°C; Gaskin, 1992), but the harbour porpoise finds most of its prey in deeper water (Westgate et al, 1995), where the temperature is lower.
The present study, based on the long-term food records of 6 animals of different ages and body sizes, shows that non-lactating harbour porpoises require between 4 and 9.5% of their body weight in fish each day, depending on the caloric content of the fish and on the age, body weight, exercise level, and individual basal metabolic rate of the porpoises. Most animals in human care were kept in water of between 15 and 20°C. Unless this temperature is above the thermal neutral zone of the harbour porpoise, one
would expect wild harbour porpoises to consume more than the animals in human care, as the water temperatures in their distribution areas are lower. Wild harbour porpoises may swim faster and certainly dive deeper than their conspecifics in the present study. In conclusion, wild harbour porpoises are expected to need more energy for thermoregulation and locomotion than the animals in the present study.
Acknowledgements
We thank Carolien Staal, Saskia Nieuw-straten and an army of volunteers and students of the School for Animal Husbandry at Barneveld for their help with feeding and weighing of the harbour porpoises and for record-keeping over the years. We thank Arian Zoeten, Klaas Dekker and Martin Kok for helping with the nightly meals. We thank Nancy Vaughan (Harderwijk Marine Mammal Park) for carrying out the statistical analyses and for her constructive comments on the manuscript, and Jane-Martine Muijlaert (Wage-ningen Agricultural University) for the chemical analyses of the fish. Martin Verste-gen (Department of Animal Nutrition, Wageningen Agricultural University), Heather Koopman (Duke University, U.S.A.) and the editors Andrew Read (Duke University, School of The Environment, Marine Laboratory, U.S.A.), Piet Wiepkema (Wageningen Agricultural University, The Netherlands) and Paul Nachtigall (Hawaii Institute of Marine Biology, University of Hawaii, U.S.A.) all gave valuable constructive comments on this manuscript.
207

R.A. Kastelein et al.
References
Aarefjord, H v BJ0rge, A.J., Kinze, C.C. and Lindstedt, I. (1995) Diet of the Harbour Porpoise (Phocoena phocoena) in Scandinavian Waters. Rep. Int. Whal. Commn. Special Issue 16, 211-222.
Altman, D.G. (1991) Practical statistics for medical research. Chapman and Hall, London.
Andersen, S. (1965) L'alimentation du Marsouin (Phocoena phocoena, L. en captivite. Vie et Milieu 16A, 799-810.
Andersen, S.H. (1981) Body surface area of juvenile Harbour porpoise, Phocoena phocoena. Aquatic Mammals 8(3), 94-95.
Brodie, P.F. (1995) The Bay of Fundy/Gulf of Maine Harbour Porpoise (Phocoena phocoena): Some Considerations Regarding Species Interactions, Energetics, Density Dependence and Bycatch. In: Biology of the Phocoenids (Eds. BJ0rge, A. and Donovan, G.P.). Rep. Int. Whaling Commn. Special Issue 16, 181-187.
Dudok van Heel, W.H. (1962) Experiments with Phocoena phocoena L. Netherlands J. Sea Res. 1(4), 427-458.
Fink, B.D. (1959) Observation of porpoise predation on a school of Pacific sardines. California Fish and Game 45, 216-217.
Fisher, H.D. and Harrison, R.J. (1970) Reproduction in the Common porpoise (Phocoena phocoena) of the North Atlantic. J. Zool., Lond. 161, 471-486.
Gaskin, D.E., Smit, G.J.D., Watson, A.P., Yasui, W.Y. and Yurick, D.B. (1984) Reproduction in the Porpoises (Phocoenidae):
Implications for management. In: Reproduction in whales, dolphins and porpoises (Eds. Perrin, W.F., Brownell Jr, R.L. and DeMaster, D.P.). Rep. Int. Whal. Commn., Special Issue 6, 135-148.
Gaskin, D.E. (1992) Status of the harbour porpoise, Phocoena phocoena, in Canada. Canadian Field-Naturalist 106, 36-54.
Gaskin, D.E., Yamamoto, S. and Kawamura, A. (1993) Harbour Porpoise, Phocoena phocoena (L.), in the coastal waters of northern Japan. Fish. Bull. 91, 440-454.
Gearin, P.J., Melin, S.R., DeLong, R.L., Kajimura, H. and Johnson, M.A. (1994) Harbor Porpoise Interactions With a Chinook Salmon Set-Net Fishery in Washington State. In: Gillnets and Cetaceans (Eds. Perrin, W.F., Donovan, G.P. and Barlow, J.). Rep. Int. Whal. Commn. 15,427-438.
Kanwisher J. and Sundnes, G. (1965) Physiology of a small cetacean. Hvalradets Skrift. 48, 45-53.
Kanwisher J. and Sundnes, G. (1966) Thermal regulation of cetaceans. In: Whales, dolphins and porpoises. Univ. of Cal. Press, Berkeley, 397-407.
Kanwisher, J.W. (1971) Temperature regulation in the sea. In: Topics in the study of life, the bio source book, XIII (Eds. Dethier, V.G. et al.). Harper and Row Publishers, New York, U.S.A., 209-214.
Kastelein, R.A. and Battum, R. van (1990) The relationship between body weight and morphological measurements in Harbour porpoises (Phocoena phocoena) from the North Sea. Aquatic Mammals 16(2), 48-52.
208

Food consumption and body weight of harbour porpoises
Kastelein, R.A. and Dubbeldam, J.L. (1990) Marginal papillae on the tongue of the Harbour porpoise (Phocoena phocoena), Bottlenose dolphin (Tursiops truncatus) and Commerson's dolphin (Cephalorhynchus commersonii). Aquatic Mammals 15(4), 158-170.
Kastelein, R.A., Bakker, MJ. and Dokter, T. (1990) The medical treatment of 3 stranded Harbour porpoises (Phocoena phocoena). Aquatic Mammals 15(4), 181-202.
Kastelein, R.A. and Lavaleije, M.S.S. (1992) Foreign bodies in the stomach of a female Harbour porpoise (Phocoena phocoena) from the North Sea. Aquatic Mammals 18(2), 40-46.
Kastelein, R.A., McBain, J. and Neurohr, B. (1993 a) Information on the biology of Commerson's dolphins (Cephalorhynchus commersonii). Aquatic Mammals 19(1), 13-19.
Kastelein, R.A., McBain, J., Neurohr, B., Mohri, M., Saijo, S., Wakabayashi, I. and Wiepkema, P.R. (1993 b) Food consumption of Commerson's dolphins (Cephalorhynchus commersonii). Aquatic Mammals 19(2), 99-121.
Wiepkema, P.R. and Nachtigall, P.E.). De Spil Publishers, Woerden, The Netherlands, 179-199.
Kleiber, M. (1975) The fire of life: an introduction to animal energetics. Krieger, Huntington, New York, 453 pp.
Koopman, H.N. (1994) Topographical distribution and fatty acid composition of blubber in the harbour porpoise, Phocoena phocoena. Univ. of Guelph, Thesis presented to the Faculty of Graduate Studies.
Lindroth, A. (1962) Baltic Salmon fluctuations 2: porpoise and salmon. Rep. Inst. Freshwater Res. Drottingholm, 44, 105-112.
Lockyer, C. (1995) Aspects of the morphology, body fat condition and biology of the Harbour porpoise, Phocoena phocoena, in British waters. In: The biology of the Phocoenids (Eds. Bj0rge, A. and Donovan, G.P.). Rep. Int. Whal. Commn. 16, 199-209.
M0hl-Hansen, U. (1954) Investigations on reproduction and growth of the porpoise (Phocoena phocoena (L)) from the Baltic. Vidensk. Medd. Fra. Dansk Naturh. Foren. Bd. 166, 369-396.
Kastelein, R.A., Schooneman, N.M., Staal, C. and Boer, H. (1997 a, this volume) A method for tube-feeding juvenile harbour porpoises (Phocoena phocoena). In: The biology of the harbour porpoise (Eds. Read, A.J., Wiepkema, P.R. and Nachtigall, P.E.). De Spil Publishers, Woerden, The Netherlands, 63-83.
Myers, W.A., Horton, H.C., Heard, F.A., Jones, A., Winsett, G. and McCulloch, S.A. (1978) The role of recorded data in acclimatizing a harbour porpoise (Phocoena phocoena). Aquatic Mammals 6(2), 54-64.
Orr, R.T. (1937) A porpoise chokes on a shark. J. Mammal. 18, 370.
Kastelein, R.A., Sijs, S.J. van der, Staal, C. and Nieuwstraten, S.H. (1997 b, this volume) Blubber thickness in harbour porpoises (Phocoena phocoena). In: The biology of the harbour porpoise (Eds. Read, A.J.,
Parry, D.A. (1949) The structure of whale blubber, and a discussion of its thermal properties. J. Microsc. Sci. 90, 13-25.
209

R.A. Kastelein et al.
Rae, B.B. (1965) The food of the Common porpoise (Phocaena phocaena). J. Zool. Lond. 146, 114-122.
Slijper, E.J. (1958) Organ weights and symmetry problems in porpoises and seals. Archs. Neerl. Zool. 13, 97-113.
Rae, B.B. (1973) Additional notes on the food of the Common porpoise (Phocoena phocoena). J. Zool., Lond. 169, 127-131.
Read, A.J. (1990) Estimation of body condition in harbour porpoises, Phocoena phocoena. Can. J. Zool. 68, 1962-1966.
Recchia, Ch.A. and Read, A.J. (1989) Stomach contents of harbour porpoises, Phocoena phocoena (L.), from the bay of Fundy. Can. J. Zool. 67, 2140-2146.
Rogan, E. and Berrow, S.D. (1996) A Review of Harbour Porpoises, Phocoena phocoena, in Irish Waters. Rep. Int. Whal. Commn. 46, 595-605.
Ryan, B.F. and Joiner, B.L. (1994) Minitab Handbook (3rd edition). Wadsworth Publishing company, Belmont, California.
Ryg, M., Lydersen, C. Knutsen, L.0., Bjorge, A., Smith, T.G. and 0ritsland, N.A. (1993) Scaling of insulation in seals and whales. J. Zool., Lond. 230, 193-206.
Scott, T. (1903) Some further observations on the food of fishes, with a note on the food observed in the stomach of a common porpoise. Rep. Fish. Bd. Scotland 21, 218-227.
Sergeant, D.E. and Fisher, H.D. (1957) The smaller Cetacea of Eastern Canadian waters. J. Fish. Res. Bd. Canada 14(1), 83-115.
Silber, G.K. and Smultea, M.A. (1990) Harbor Porpoises Utilize Tidally-induced Internal Waves. Bull. Southern California Acad. Sci. 89 (3), 139-142.
Smith, G.J.D. and Gaskin, D.E. (1974) The diet of Harbour porpoises (Phocoena phocoena) (L.) in coastal waters of Eastern Canada, with special reference to the Bay of Fundy. Can. J. Zool. 52, 777-782.
Smith, R.J. and Read, A.J. (1992) Consumption of euphausiids by harbour porpoise (Phocoena phocoena) calves in the Bay of Fundy. Can. J. Zool. 70, 1629-1632.
Spotte, S., Dunn, J.L., Kezer, L.E. and Heard, F.M. (1978) Notes on the care of a beach-stranded Harbour porpoise (Phocoena phocoena). Cetology 32, 1-5.
Stephen, A.C. (1926) Common porpoise stranded at Granton. Scot. Naturalist, 46.
Svardson, G. (1955) Salmon stock fluctuations in the Baltic Sea. Rep. Inst. Freshwater Res. Drottningholm 36, 226-262.
Teilmann, J. and Lowry, N. (1996) Status of the Harbour Porpoise (Phocoena phocoena) in Danish Waters. Rep. Int. Whal. Commn. 46, 619-625.
Tomilin, A.G. (1967) Cetacea. Mammals of the U.S.S.R. and adjacent countries (Zveri SSR i Prilezhaschchikh Stran), (Israel Program for Scientific Translation, Jerusalem). 9, XXI + 717.
Utrecht, W.L. van (1959) Wounds and scars in the skin of the common porpoise (Phocoena phocoena L.). Mammalia 23(1), 100-122.
210

Food consumption and body weight of harbour porpoises
Utrecht, W.L. van (1978) Age and growth in Phocoena phocoena Linnaeus, 1758 (Cetacea, Odontoceti) from the North Sea. Bijdr. tot de Dierk. 48(1), 16-28.
Westgate, A.J., Read, A.J., Berggren, P., Koopman, H.N. and Gaskin, D.E. (1995) Diving behaviour of Harbour porpoises, Phocoena phocoena. Can. J. Fish. Aquat. Sci. 52, 1064-1073.
Wilke, F. and Kenyon, K.W. (1952) Notes on the food of fur seal, sea lion, and harbor porpoise. J. Wildlife Mgt. 16, 396-397.
Worthy, G.A.J., Innes, S., Braune, B.M. and Stewart, R.E.A. (1987) Rapid Acclimation of Cetaceans to an Open-System Respirometer. In: Marine Mammal Energetics (Eds. Huntley, A.C., Costa, D.P., Worthy, G.AJ. and Castellini, M.A.). Allen Press, Lawrence, U.S.A., 115-126.
Worthy, G.A.J, and Edwards, E.F. (1990) Morphometric and Biochemical factors affecting heat loss in a small temperate cetacean (Phocoena phocoena) and a small tropical cetacean (Stenella attenuata). Physiological Zoology 63(2), 432-442.
Yasui, W.Y. and Gaskin, D.E. (1987) Energy budget of a small cetacean, the harbour porpoise, Phocoena phocoena. Ophelia, 25(3), 183-197.
211

2
Chapter 2.14
A method for tube-feeding juvenile harbour porpoises (Phocoena phocoena)
R.A. Kastelein1, N.M. Schooneman1, C. Staal1 and H. Boer2
Harderwijk Marine Mammal Park, Strandboulevard Oost 1, 3841 AB Harderwijk, The Netherlands
Department of Animal Nutrition, Wageningen Agricultural University, Marijkeweg 40, 6709 PG Wageningen, The Netherlands
Summary
A technique for tube-feeding juvenile harbour porpoises or other small odontocetes with artificial dolphin milk is described in detail. The preparation of the formula, its chemical composition, the required daily amount of formula and distribution of meals throughout the day in relation to the porpoises' body weight, physical condition and behaviour, and the transfer to solid food are described. Stranded juvenile harbour porpoises can be raised by tube-feeding on the formula, but flexibility should be maintained throughout the procedure. Without close monitoring of an animal's weight, physical condition, behaviour, blood parameters and faeces, and appropriate reaction to the values of these parameters, its chance of survival is small. Survival depends not only on the success of tube-feeding, but also on the physical condition of the stranded animal and its behaviour when it arrives at a facility.
Key words: odontocete, nutrition, hand-rearing, bottle-feeding, diet, formula, suckling, weaning
Introduction killer whale (Pseudorca crassidens) calf (Marlee Breese, pers. comm.).
Stranded unweaned odontocetes have little chance of survival (Gage, 1982). Andersen Since 1993, several stranded juvenile har-(1974) was able to raise 2 young harbour bour porpoises from the North Sea have porpoises, which were close to weaning, on been raised at the Harderwijk Marine Mam-40% chopped herring (Clupea harengus), 60 % mal Park on a tube-fed formula. The for-water, multivitamins and thiamine. Since mula has also been given to some sick adult 1989, 3 unweaned odontocetes have been animals, raised on formulas based on the composition of dolphin milk. A harbour porpoise The aim of this paper is to describe in detail {Phocoena phocoena) calf (Otten and Wilcox, the method used for tube-feeding unweaned 1990; Houck and Otten, 1992), a bottlenose harbour porpoises. The preparation and dolphin (Tursiops truncatus) calf (Forrest chemical composition of the formula, the Towsend, pers. comm.; Bottaro, 1992) and a tube-feeding technique, determination of the hybrid of a bottlenose dolphin and a false daily formula intake, the meal size, the
The biology of the harbour porpoise (1997) A.J. Read, P.R. Wiepkema and P.E. Nachtigall (editors), pp. 63-83. De Spil Publishers, Woerden, The Netherlands, ISBN 90-72743-07-5
213

R.A. Kastelein et al.
number of meals per day and meal intervals in relation to the porpoises' body size, physical condition and behaviour, and the transfer to solid food are described.
Animals The juvenile harbour porpoises (Table 1) which were tube-fed for various periods of time were found stranded on the Dutch and German coasts. Not all animals survived. Survival depends not only on the success of tube-feeding, but also on the physical condition of the stranded animal and its behaviour when it arrives at a facility.
The animals' ages were determined as follows: if part of the umbilicus was present they were estimated to be less than one week old. If the teeth had not yet erupted, the animals were estimated to be less than 7 weeks old. If the animals were less than 100 cm long they were estimated to be less than one year old, and assumed to have been born in June. Animals older than 1 year were aged by body length according to Gaskin et al. (1984) and assumed to have been born in June.
Holding pools Harbour porpoises can be kept in small pools up to the age of about 4 months, while they are being tube-fed. At Harderwijk, 2 juvenile animals were raised indoors in a circular fibreglass pool with a very smooth wall and floor surface (diameter 1.8 m, depth 0.7 m). Older animals were kept in an oval concrete indoor pool (length 8.6 m, width 6.4 m, depth 1.2 m) with smooth walls and floor. Both pools were connected to the same water filtration and pumping system. The temperature of the chlorinated salt water (2.2 - 2.8% NaCl) varied between 18 and 21 °C. Daylight could enter the area and it was also artificially lit.
Formula preparation The formula used to tube-feed and bottle-feed the porpoises consisted of the following ingredients: - 1300 ml water. - 850 g herrings de-boned but with intes
tines. - 250 g milk powder (Multimilk® by
PetAg, Elgrin, Illinois; this is composed of 30% protein, 55% fat, no lactose, 7% ash, 1.1% calcium, 0.85% phosphorous, 100 IU /g vit. A, 8.5 IU /g vit. D3 and 0.2 IU /g vit. E).
- 50 ml safflower oil. - 1.5 g Fel-addase® (by Mycofarm
Nederland B.V., de Bilt; this consists of 8500 IU amylase, 12500 IU protease, 12500 IU lipase, 3 x 10⁷ lactobacillus and 6.5 g yeast per 100 g. The main component is dextrine).
- 1 multi-vitamin tablet (Seavit® by Aesculaap), pulverised.
- 1 tablet of 600 mg Taurine® (by Nederma B.V. Nijmegen; this consists of 250 mg taurine, lecithin, lactose, yeast, calcium-stearate, calciumlactate and calcium-phosphate), pulverised.
- 1 tablespoon of lecithin 98%. - any other medication.
To prepare a homogenous formula, the herrings were ground and mixed with the water in a blender. Then all other ingredients were added and the mixture was blended again. The density of the formula was 0.995 g/cm3 . Slightly more than the amount needed for the day (allowing for spillage) was made fresh every morning and distributed over as many jars as meals were to be given. The jars were refrigerated until used. Ten minutes before each meal one jar was removed and heated to around 37°C in warm water.
214

Tube-feeding
Table 1. The estimated age, body weight and standard body length of the harbour porpoises fed on formula.
Animal
PpSH022 PpSH027* PpSH030* PpSH035* PpSH036* PpSH037* PpSH038 PpSH039 PpSH041 PpSH042
Gender
Female Male Male Male Male Female Male Female Male Male
Age (weeks)
15 37 11 37 56 93
1 6 1
55
Weight (kg)
9.0 19.3 14.2 24.6 19.3 26.4
6.9 12.0 7.7
12.5
Length (cm)
85 101 90
113 100 117 75 87 76
104
Animals that survived
Table 2. The average gross composition (% of fresh product) and gross energy content (kj/g fresh product) of harbour porpoise milk (Grimmer, 1925), and of the formula fed to harbour porpoises at Point Defiance Zoo (Otten and Wilcox, 1990), and in the present study.
Item
Dry matter Crude fat Crude protein Lactose Carbohydrate Ash Gross energy
Harbour porpoise milk
59 46 11
1.3 -
0.6 —
Formula at Point Def. Zoo
24 11 11 -
0.4 1.2 6.03
Formula of present study
22.5 11.9 9.0
-0.3 1.1 6.97
Chemical composition and energy content of the formula Samples of the formula fed to the harbour porpoises were taken over several months. The samples were put through a mincer. From this minced material triplicate subsamples were taken to determine the gross composition, and a subsample was freeze-dried and minced for dry matter and gross energy content determination (Table 2).
Dry matter content was determined after drying samples in a vacuum oven at 50°C and a vacuum of 100 torr, using anhydrous calcium chloride as the drying agent. After 16 h, the vacuum was changed to 15 torr and the samples were weighed every 4 h until they obtained constant weight. Nitrogen content was determined in the fresh samples by Kjeldahl analysis according to ISO 5983 (1979). The crude protein was calculated by multiplying the proportion of nitrogen by
215

R.A. Kastelein et al.
Figure 1. Juvenile male harbour porpoise 030 being tube-fed in the water (Photo: Henk Merjenburgh).
Figure 2. One person tube-feeding an experienced juvenile harbour porpoise. The porpoise hangs in a sling of neoprene which is attached to the side of the pool with a clamp (Photo: Henk Merjenburgh).
216

Tube-feeding
6.25. Lipid content was assessed by extraction of freeze-dried samples with petroleum ether (40-60°C) and drying the extract at 103°C to a constant weight according to ISO 6492. Ash was analyzed by burning oven-dried samples in a muffle furnace at 550°C according to ISO 5984 (1978). Gross energy was determined in an anisothermic bomb-calorimeter (IKA C7000).
Tube-feeding technique Before each meal, the content of a jar was poured into one or more large syringes. The syringe was connected to a soft rubber stomach tube (1 cm diameter) with a rounded tip and a hole near the end. The formula was squeezed into the tube until it flowed out of the hole, so that no air was pumped into the stomach. The amount which remained in the tube after the meal was measured and deducted from the total amount fed. The forestomach of a young harbour porpoise is below the rostral end of the dorsal fin. Before the tube was used, the maximum length to be inserted to reach the forestomach was marked on the tube, and the outside was lubricated. After the porpoise's mouth was opened by inserting a finger between its lips, the tube was inserted into the animal's throat. Sometimes the tube went into the porpoise's oesophagus easily. If it did not, the tube was pushed gently until it hit the larynx, and held against the larynx with light pressure until the animal swallowed, after which the tip of the tube passed into the oesophagus. Twisting the tube often helped it to pass the larynx. The formula was squeezed in slowly (about 100 ml /min) to allow time for the forestomach to expand. Vomiting, which can occur if the formula is given too quickly (see also Andersen, 1974), may cause lethal pneumonia in sick, weak odontocetes. If the tube
is not inserted all the way into the forestomach, the animal is likely to vomit. The porpoises were tube-fed in water, so that the stomach could expand (Fig. 1). The tube was withdrawn with a fluent movement to prevent vomiting.
At first the animals had to be caught for each meal; fortunately most did not resist when they were confined or held. After a few days they usually opened their mouths voluntarily when the tube was offered, and readily swallowed it, as did a harbour porpoise calf from the Pacific Ocean (Houck and Otten, 1992).
During tube-feeding, one person held the animal and made sure that the blowhole remained above the water surface, while another person opened the animal's mouth, inserted the tube, and emptied the syringes of formula. The porpoises were never allowed to face the pool wall during feeding as this made them uncooperative. Instead they were held with their bodies parallel to the pool wall (Fig. 1). When feeding an experienced cooperative calf, the person holding the animal was no longer required because the animal could be held with a piece of neoprene clamped to the side of the pool. The porpoise was moved onto the neoprene, or swam onto it. The neoprene was then looped around the animal and fixed to the side of the pool with the clamp. The stomach tube could then be inserted into the mouth as usual (Fig. 2).
After feeding, all utensils were cleaned thoroughly with detergent. Stomach tubes were connected to a hot tap and washed out after every meal, boiled for 5 minutes in water once a day, and replaced at least once a week.
217

R.A. Kastelein et al.
Figure 3. Juvenile male harbour porpoise 030 being bottle-fed. The tongue is wrapped around the nipple, and has marginal papillae (Photo: Ron Kastelein).
Bottle-feeding technique Juvenile harbour porpoises can be bottle-fed (Fig. 3), as they readily wrap their tongues with well-developed marginal papillae (Kastelein and Dubbeldam, 1990) around any round object inserted into their mouths and suck it. However, bottle-feeding is very labour-intensive, as porpoise calves only suckle for about 5 s before releasing the nipple. Because the formula is best presented fresh and warm, it cannot be offered continuously in a container fixed to the side of the pool. Juvenile porpoises suckle in short bouts, perhaps because in natural conditions they have to surface regularly in order to breathe. Common dolphin (Delphinus delphis) calves also suckle by wrapping the tongue around the nipple during short suckling bouts (Logan and Robson, 1971).
Amount of formula given per day The average amount and caloric content of formula given each day to harbour porpoise calves of various body weights is shown in figure 4. It is not clear how much of the energy of the formula was used by the porpoises.
When an animal was brought in for rehabilitation, it was usually given 8% of its body weight in formula each day. To determine whether this daily ration needed to be adjusted, the calves were weighed before the first meal every morning. For these small animals, a digital weighing machine with an accuracy of at least 50 g has to be used. The machine has to be able to compute the weight of moving animals from averages. Healthy juvenile harbour porpoises were allowed to gain between 50 and 100 g in
218

Tube-feeding
weight each day. As well as its weight, the animal's appearance was taken into account; if it looked stuffed and felt soft, the amount of formula was reduced. When a harbour porpoise loses weight, a typical "neck" appears (Kastelein and van Battum, 1990) and more food must be given.
Distribution of meals throughout the day The body size, physical condition and behaviour of each porpoise raised at Harderwijk was different. The following parameters were taken into consideration when determining meal size, number of meals per day and inter-meal intervals:
1) Physical parameters
a) Stomach capacity. The capacity of the forestomach or of all 4 stomachs was measured in some dead animals, by closing off the passage from the forestomach to the fundic stomach or
the caudal end of the duodenal ampulla (Kastelein and Lavaleije, 1992). The forestomach or all stomachs were filled under a tap until water spilled over the oesophagus. Then the passage from oesophagus to forestomach was closed and the water in the oesophagus was drained. Then the water from the forestomach or all stomachs was drained and measured 2 to 3 times, and the average volume was recorded for each animal (Table 3). Measurements of stomach capacity of bottlenose dolphin calves are also presented. The forestomach of a still suckling harbour porpoise can contain 40-60 ml, depending on the age of the animal; this is the maximum amount of formula which should be given in one meal.
b) Transport time through the digestive tract. The calves' ingestion rate should be in
n •o
a D)
2 <D
3
3500-i
3000
2500 H
2000
1500 H
1000
500 H
0
Animal: . 022 o 027 A 030 A 036 • 037 • 038 x 041 + 042
>
l * - i — i — i — i — i — r T — i — i — i — i — r — i — r - i i i i i i
24000
22000
20000
18000
16000
14000
h12000
10000
8000
6000
-4000
-2000
0
•o a> O)
2 > <
8 10 12 14 16 18 20 22 24 26 28 Body weight (kg)
Figure 4. The relationship between body weight and the amount of formula and energy given each day to the harbour porpoises which were hand-raised at the Harderwijk Marine Mammal Park.
219

R.A. Kastelein et al.
Table 3. The capacity of the forestomach or all 4 stomachs of harbour porpoise and bottlenose dolphin calves at Harderwijk Marine Mammal Park, measured after death. Most animals were emaciated at death.
Animal
Tursiops TtZH105 TtZH109 Phocoena PpSH027* PpSH038 PpSH039 PpSH041
Standard body length (cm)
110 124
138 75 87 76
Body weight (kg)
18.8 22.2
36.2 7.0
12.0 7.6
Forestomach capacity (ml)
— 95
150 60 -40
Capacity of all stomachs (ml)
151 —
----
160 —
adult animal
balance with their defecation rate. In harbour porpoises on formula, initial passage time of carmine red in faecal matter is around 3 hours (Kastelein et al., 1997 b), but may deviate from this value depending on the animal's health and activity level. Most porpoises treated at Harderwijk suffered from constipation at some stage. This could have been because they were lethargic and did not move enough to massage their intestines. Porpoises typically suffered from constipation during weaning. When they had constipation, the porpoises bent their tails underneath them, indicating belly cramps. Isogel® (90% w /w dried Isphagula Husk B.P., Charwell Health Care) can be mixed with the formula or added to the fish to stimulate bowel movements.
c) Faeces. The faeces can be used to diagnose digestive disorders. Therefore the following faecal parameters were recorded every day: frequency of defecation, colour, compactness, an estimate of the quantity
per defecation and buoyancy (whether they dissipated into the water column, or dropped to the bottom of the pool). Any gas bubbles coming from the anus were also recorded. Normal harbour porpoise faeces are dark green, and are dispersed as soon as the animal moves its tail through it. If the faeces are beige, it indicates that the formula has not been digested fully. Dark faeces may indicate bleeding in the digestive tract. Compact faeces may indicate constipation.
2) Behavioral parameters
a) Need for rest. Stranded porpoises appear to need rest for basic recovery. To give them time to rest, meals were not equally spaced over a 24 h period. Because noise and disturbance levels were lowest at night, this was used as a rest period and fewer meals were given at night than during the day. Such a schedule is also practical for the keepers.
220

Tube-feeding
b) Stress. Stranded animals need time to habituate to humans, their new environment and to tube-feeding. If tube-feeding led to behaviour associated with stress, and the animal was in a fair nutritional state, fewer meals than necessary to maintain or increase its body weight were given for a few days until the animal's behaviour returned to normal.
c) Pain. Many stranded calves had skin injuries: wounds inflicted at sea by sharks, other odontocetes, or by impacts with natural or man-made objects (such as fishing nets). The skin of many porpoises was also damaged due to dehydration and overheating on the beach, and many suffered muscle damage also due to overheating. In all such cases, handling the animals was judged to cause pain, and was done as gently as possible. If an animal's behaviour suggested severe pain, a pain-killer (mefenaminic acid, Parkamed® by Parke-Davis, 10 mg /kg , TID, p.o.) was added to the formula. If handling remained painful, fewer meals than necessary to maintain or increase its body weight were given for a few days until the animal's skin recovered.
Transfer to solid food In the wild, harbour porpoises probably suckle for about 5-9 months (M0hl-Hansen, 1954; Sorensen and Kinze, 1994). The transfer from milk to solid food (the weaning process) has not yet been studied. However, Smith and Read (1992) found mainly euphausiids in the stomachs of juvenile harbour porpoises, suggesting that during the first period of independent feeding they eat small and slow moving prey. At Harderwijk, porpoises were weaned in several ways, depending on the behaviour,
age and body weight of the individual, and on environmental factors such as the presence or absence of other animals in the pool.
The introduction of live fish into the pool often triggered hunting behaviour in the harbour porpoises. Some animals accepted dead fish during a meal which started with live fish (Kastelein et al., 1990; Spotte et al., 1978). Live marine fish such as herring, eel (Anguilla anguilla) and cod (Gadus morhua), or fresh-water fish such as roach (Rutilus rutilus; u p to 25 cm) can be used. Houck and Otten (1992) put live herring in a pool with a 2-month-old harbour porpoise calf, the teeth of which were just beginning to erupt. After a week, the calf ate live fish and formula; 7 weeks later it ate only fish.
As an alternative to live fish, small (15 cm) dead fish such as sprat (Sprattus sprattus) or sardines (Sardina pilchardus) were placed in the pool during tube-feeding. The calf usually played with the fish until they fell into pieces, some of which the porpoise swallowed. Eventually, it swallowed a whole fish, and then several fish per day. The amount of formula given per day was decreased gradually, while the amount of fish offered was increased.
When a porpoise calf was kept with other odontocetes, fish was introduced to the calf while the other animals were being fed at the opposite side of the pool. This way the inexperienced animal had time to manipulate and swallow the fish before a poolmate had a chance to steal it.
If these methods of weaning were unsuccessful, porpoises were force-fed. This was done as gently as possible; if the animal experienced the meals as negative events, the voluntary uptake of fish could have been delayed. At first, the porpoise was held by a
221

R.A. Kastelein et al.
keeper. The stiffer the fish, the easier and quicker force-feeding was. The head of 20-30 cm long fish could be pushed past the porpoise's larynx; this caused the calf to swallow. The reward for the calf was its immediate release after it had swallowed the fish. The amount of formula was reduced gradually and the amount of fish increased gradually. After force-feeding while the animal was held in the water, the next stage was free-feeding, by throwing fish into the water. This was usually only possible if no other animals were present in the pool. Next, the porpoise was fed from the hand. The animals were trained to feed voluntarily from the hand by first being fed from a rod and line; the tail of a fish was
attached to the line with a clothes peg (Fig. 5). Hand-feeding was usually easiest when another odontocete which was used to this procedure was in the pool, because harbour porpoises often mimicked the behaviour of their pool-mates.
In order to help animals make the transition from force-feeding to free-feeding, the food intake can be gradually reduced (Andersen, 1974; Kastelein et al., 1990), but this should be done carefully. Because harbour porpoises have a high body surface to volume ratio, they lose a great deal of energy through radiation and conduction, and can lose weight rapidly. At Harderwijk, animals were never allowed to lose more than 0.5 kg
Figure 5. A harbour porpoise being fed fish from a rod and line. The fish is attached to the line with a clothes peg (Photo: Henk Merjenburgh).
222

Tube-feeding
during this procedure. Harbour porpoises have a, relative to their body size, thick blubber layer compared to that of larger cetaceans. If harbour porpoises lose weight, the blubber layer is reduced and they develop a higher body surface to body mass ratio. These changes make the animal lose more energy to the environment, and even more weight.
Case studies
It is important to understand that feeding schedules and amounts of food to be given to porpoises cannot simply be derived from graphs or tables. Four case studies show that slightly different approaches to the care of individual harbour porpoises were successful.
Male 027 Prior to stranding, male 027 had been injured on his tailstock by a shark (Kastelein et al., 1997 a). He was emaciated on arrival and could not dive for 6 weeks. In the wild he may have already been eating fish, but at Harderwijk he was tube-fed from the second day after arrival. When his faeces turned from beige (the colour of the formula) to green (f.e. the formula was being digested well), he began to gain weight (Fig. 6). The transition to fish was done gradually, at first by giving fish as well as formula.
Male 030 Male calf 030 arrived at the age of 5 weeks from the island of Sylt, Germany. He was in good nutritional condition, but had been attacked by gulls on the beach and his skin had become dehydrated and overheated while on land (Kastelein et ah, 1997 a). This animal was unweaned when it stranded. He was fed formula for 63 days, after which he was weaned gradually (Fig. 7).
Male 036 Male calf 036 was about 8 months old on arrival, and had probably reached weaning age. He arrived in a good nutritional state. Initially the amount of formula fed was gradually increased; later he was weaned during a 10 day period (Fig. 8).
Adult female 037 Adult female 037 was emaciated when she arrived. Based on her size, she must have been eating fish in the wild. She was tube-fed for a while, because she was dehydrated and did not accept fish voluntarily for a while (Fig. 9).
Conclusions
Stranded juvenile harbour porpoises can be raised by tube-feeding on the formula described here, but flexibility in the methods used should be maintained throughout the procedure. Without close monitoring of an animal's weight, physical condition, behaviour, blood parameters and faeces, and appropriate reaction to the values of these parameters, its chance of survival is small. To increase this chance, and to facilitate possible future captive breeding programmes for this species which is threatened in some parts of its distribution area, all experiences in harbour porpoise rehabilitation should be described in detail and published.
Acknowledgements
We thank veterinary surgeon Martin Bakker for advice about tube-feeding, and an army of volunteers and students on internships from the School of Animal Husbandry in Barneveld for their help over the years with feeding and weighing the harbour porpoises and with record-keeping. We thank the night watchmen Arian Zoeten, Klaas
223

R.A. Kastelein et al.
26*-
24
22-
* • »
-C O) • S >< •o o ffi
20
18
16
14-
12-
Male 027
10 -i—i—i—i—i—i i i—i—r
0 5 10
1—i—i—i—i—i—i—i—i—i—i—i—i—i—i—i—i—i—i—i i i—i—i—i—i—i—i—i
15 20 25 30 35 40
Time (day)
JS 3 E p
c 3 O E (0
TO Q
Completely on fish
Faeces turned green Start transition to fish
224

Tube-feeding
16
14 H
% 12
a 10
w
g 8-1
0)
i 4H z
Male 027
/
W
0 -i—i—i—i—i—i—i—i—i—i—i—i—i—i—i—i—i—i—i—i—i—i—i—i—i—i i i i—i i i i—i—i—i—i—i—i—i—i
0 5 10 15 20 25 30 35 40
Time (day)
260-
240-
220-
200-
-£• 180-
£ 160 -
| 140-
£ 120-c I 100 -ra
| 8 0 -
6 0 -
4 0 -20-
n -
(
Faei
Male 027
\S \
i i i i i i i i i i i i i
) | 5 10
ces turned green
i i i i
15
• • i
2
\
r\
^
1 1 1 1 1 1 1
0 25
I
x A
\
30
7 on fish
/
/ w
35 40
Time (day) Start transition to fish
Figure 6. Body weight (a), daily amount of formula (b), number of meals per day (c) and meal interval during the day (d) while male harbour porpoise 027 was tube-fed. Time = days after arrival.
225

R.A. Kastelein et al.
2 0 *
18
16
O)
+* £ O)
'S 5 •a o m
14
12
10
Male 030
»••••••••••••• , — i M " n
I I I I I I I I I I I I I II I I I I I I II I I I I I I I I I l l l l II I I M II I I I I I I I I I I I I M l I I II I I I I I II I I II I I II I I I I I I I I I I I I
0 5 10 15 20 25 30 35 40 45 50 55 60 65 70 75 80 85 90
Time (day)
3
O
c 3 O E (0
Q
»•••••••••••>• »•••••••••
Completely on fish
0 fs 10
Faeces turned green
I II III I II I I I III III III II I m m
15 20 25 30 35 40 45 50 55 60 165
M l II I I II M l II I II II I III
165 70 75
Start transition to fish
80 85 90
Time (day)
226

Tube-feeding
Male 030
#« M i i m i i i i i m n
0 ll 111111111II111111111II111111111111II1111IIII11II111II1111111111111111111111111111II111111
0 5 10 15 20 25 30 35 40 45 50 55 60 65 70 75 80 85 90
Time (day)
D. 260
240
220
200-
£ 180-
•§- 160 H « 140
£ 120-
~ 100 -
I 80 60
40
20
Male 030
Completely on fish
/ I I I I I I I I I I I I I I I I I I I I I I I I I I I I I I I I I I I I I I I M I I I I I I M I I I I I I I I I I I I I I I II l l l l l l l l l l l l l l l l l l l l l l l l l
0 \5 10 15 20 25 30 35 40 45 50 55 60^65 70 75 80 85 90 Time (day) Faeces turned green
Start transition to fish
Figure 7. Body weight (a), daily amount of formula (b), number of meals per day (c) and meal interval during the day (d) while male harbour porpoise 030 was tube-fed. Time = days after arrival.
227

R.A. Kastelein et al.
2 . *
I >» •a o in
26-
24-
22-
20-
18-
16-
14-
12-
10
Male 036
-i—i i i—i—i—n—r-T—i—i-T—i I i i i—r- 1—i—i—i—i—i—i i i—i—n—i—r 10 15 20 25 30
-I-T—I—I—I
35 40
Time (day)
I I I I I I I I I I I I I I I I
15 20 25 30 Faeces turned green f
Start transition to fish Time (day)
228

Tube-feeding
w » »»" • • • • • m • » • • • « m m w*
TTT—I—I—I—l—l—I—I
20 25 30 35 40
Time (day)
0 -i—i—i—i—i—i—i—i—i—i—i—i—i—i—i—i—i—i—i—i—i—i—i—i—i—i—i—i—i—i—i—i—i—i—i—i—r
0 5 | 10 15 20 25 30 35 40 Faeces turned green f T j m e ( d g y )
Start transition to fish
Figure 8. Body weight (a), daily amount of formula (b), number of meals per day (c) and meal interval during the day (d) while male harbour porpoise 036 was tube-fed. Time = days after arrival.
229

R.A. Kastelein et al.
- 20 -
x 18 •o o
m 1 6
1 4
1 2
1 0 I i i i i i i i i i i i i i i i 1 1 i
10 15 I 1 1 1
20 25 T T T T T
30 1 1 1 1 1
35 T T T T T
40 T T T T T
45 i i i i
50 i i i i i i i i i
55 60 Time (day)
ra Q
3600 -|
3400-
3200-
3000-
2800-
2600
2400
2200
2000
1800 H
1600
Female 037
Completely on fish
i i i i i i i i i i i i i i i i i i i i i i i i i i i i i i i i i i i i i i i i i i i i i i i i i i i i i i i 1 1 i i
10 15 i 20 25 30 35 40 45 50 55 60
Time (day) ik 3 IU 10 A
Faeces turned green Start transition to fish
230

Tube-feeding
16?
14-
>> n •o
^ Q.
W
m 0) E ( o w d) A E 3
12^
10-
8 -
6-
4 -
Female 037
2 -
0+n-
W~Y W
1 1 1 1 1 1 1 1 1 1 1 1 1 1 1 1 1 1 1 1 1 1 1 1 1 1 1 1 1 1 1 1 1 1 1 1 1 1 1 1 1 1 1 1 1 1 1 1 1 1 1 1 1 1 1 1 1 1
10 15 20 25 30 35 40 45 50 55 60 Time (day)
2 2 0 ] Female 037 200-
180-
~ 160 H c
I 140-
| 120
| 100
5 80
£ 60
40
20
• • • • • • » » V - »
Completely on fish
i i i i i i i i i i i i i i i i i i i i i i i i i i i i i i i i i i i i i i i i i i i i i i i i i i i i i i i i i
0 T 5
Faeces turned green
10 15 20 25 30 35 40 45
Start transition to fish
50 55 60
Time (day)
Figure 9. Body weight (a), daily amount of formula (b), number of meals per day (c) and meal interval during the day (d) while female harbour porpoise 037 was tube-fed. Time = days after arrival.
231

R.A. Kastelein et al.
Dekker, Gerard Hoogendoorn and Martin Kok for their help with nightly meals and Piet Crucq, Ron de Paauw and Gerard Hoogendoorn for the water quality control. Jane-Martine Muijlaert (Department of Animal Nutrition, Wageningen Agricultural University) did the chemical analysis of the formula. We thank Rob Triesscheijn for making the graphs and Jim McBain (staff veterinarian, Sea World of California, San Diego, U.S.A.), Janny Hardeman (Harder-wijk Marine Mammal Park), Martin Verste-gen (Department of Animal Nutrition, Wageningen Agricultural University), Nancy Vaughan (Harderwijk Marine Mammal Park) and the editors Andrew Read (Duke University, School of The Environment, Marine Laboratory, U.S.A.), Piet Wiepkema (Wageningen Agricultural University, The Netherlands) and Paul Nachtigall (Hawaii Institute of Marine Biology, University of Hawaii, U.S.A.) for their constructive comments on this manuscript.
References
Andersen, S.H. (1974) The rearing of suckling Harbour porpoises (Phocoena phocoena). Aquatic Mammals 2(2), 23-27.
Bottaro, L. (1992) Sea life park, Hawaii. I.M.A.T.A. Soundings, Winter Issue, 4-5.
Gage, L. (1982) Care of a beached neonatal Harbour porpoise (Phocoena phocoena) a case report. Proceedings of the 1982 I.M.A.T.A. meeting, 55-58.
Gaskin, D.E., Smit, G.J.D., Watson, A.P., Yasui, W.Y. and Yurick, D.B. (1984) Reproduction in the Porpoises (Phocoenidae): Implications for management. In: Reproduction in whales, dolphins and porpoises (Eds. Perrin, W.F., Brownell Jr, R.L. and DeMaster, D.P.). Rep. Int. Whal. Commn.,
Special Issue 6, 135-148.
Houck, J. and Otten, J. (1992) Do you believe in Magic? I.M.A.T.A. Soundings, Summer Issue 11-12.
Kastelein, R.A. and Battum, R. van (1990) The relationship between body weight and morphological measurements in Harbour porpoises (Phocoena phocoena) from the North Sea. Aquatic Mammals 16(2), 48-52.
Kastelein, R.A. and Dubbeldam, J.L. (1990) Marginal papillae on the tongue of the Harbour porpoise (Phocoena phocoena), Bottle-nose dolphin (Tursiops truncatus) and Com-merson's dolphin (Cephalorhynchus commer-sonii). Aquatic Mammals 15(4), 158- 170.
Kastelein, R.A. and Lavaleije, M.S.S. (1992) Foreign bodies in the stomach of a female Harbour porpoise (Phocoena phocoena) from the North Sea. Aquatic Mammals 18(2), 40-46.
Kastelein, R.A., Bakker, M.J. and Dokter, T. (1990) The medical treatment of 3 stranded Harbour porpoises (Phocoena phocoena). Aquatic Mammals 15(4), 181-202.
Kastelein, R.A., Bakker, M.J. and Staal, C. (1997 a, this volume) The rehabilitation and release of stranded harbour porpoises (Phocoena phocoena). In: The biology of the harbour porpoise (Eds. Read, A.J., Wiepkema, P.R. and Nachtigall, P.E.). De Spil Publishers, Woerden, The Netherlands, 9-61.
Kastelein, R.A., Nieuwstraten, S.H. and Verstegen, M.W.A. (1997 b, this volume) Passage time of carmine red dye through the digestive tract of harbour porpoises (Phocoena phocoena). In: The biology of the harbour porpoise (Eds. Read, A.J.,
232

Tube-feeding
Wiepkema, P.R. and Nachtigall, P.E.). De Spil Publishers, Woerden, The Netherlands, 265-275.
Logan, F.D. and Robson, F.D. (1971) On the birth of a Common dolphin (Delphinus delphis L.) in captivity. Zool. Garten, Leipzig 40(3), 115-124.
Mahl-Hansen, U. (1954) Investigations on reproduction and growth of the porpoise (Phocoena phocoena (L)) from the Baltic. Vidensk. Medd. fra. Dansk Naturh. Foren. Bd. 166, 369-396.
Otten, J. and Wilcox, C. (1990) Husbandry, training and socializing of a stranded neo
nate Harbor porpoise. Proceedings of the 18th I.M.A.T.A. meeting, 235-245.
Smith, R.J. and Read, A.J. (1992) Consumption of euphausiids by harbour porpoise (Phocoena phocoena) calves in the Bay of Fundy. Can. J. Zool. 70, 1629-1632.
Sorensen, T.B. and Kinze, C.Ch. (1994) Reproduction and reproductive seasonality in Danish harbour porpoises, Phocoena phocoena. Ophelia 39(3), 159-176.
Spotte, S., Dunn, J.L., Kezer, L.E. and Heard, F.M. (1978) Notes on the care of a beach-stranded Harbour porpoise (Phocoena phocoena). Cetology 32, 1-5.
233

Chapter 2.15
Passage time of carmine red dye through the digestive tract of harbour porpoises (Phocoena phocoena)
R.A. Kastelein1, S.H. Nieuwstraten1 and M.W.A. Verstegen2
1 Harderwijk Marine Mammal Park, Strandboulevard Oost 1, 3841 AB Harderwijk, The Netherlands
2 Department of Animal Nutrition, Wageningen Agricultural University, Marijkeweg 40,6709 PC Wageningen, The Netherlands
Summary
The passage times of carmine red dye in 6 rehabilitated harbour porpoises (weight range 12 -39 kg) fed formula, herring or sprat were recorded. The mean initial passage times (time between when the dye was ingested and when it was first seen in the faeces) of the 6 healthy animals eating fish varied between 143 and 196 minutes. The initial passage times were longer than average when the animals were ill, did not swim normally or when they ate a new diet. When the animals were healthy and on a fish diet, no relationship between body weight or body length and initial passage time was found. The mean final passage times (time between when the dye was ingested and the time when it was last seen in the faeces) in 2 animals were 230 and 280 minutes. Initial passage times of harbour porpoises are compared to those of other odontocetes.
Key words: odontocete, dye, gastrointestinal tract, energetics, food, constipation
Introduction species or an individual, a single measurement on an animal which is eating his usual
The passage time of digesta through the daily ration may reveal whether an animal's digestive tract is an indication of the time digestive tract is disfunctioning. that food is subjected to digestive enzymes. In most experiments, longer passage times So far, the passage time of carmine red dye of digesta are associated with increased has been measured in 7 odontocete species: digestion (or decreased faecal bulk) and beluga whales (Delphinapterus leucas) by increased absorbtion (Warner, 1981). Differ- Kastelein et al. (1994), false killer whales ent values for passage time in different (Pseudorca crassidens) by Kastelein etal. (1997 species or classes of animals may be related d), bottlenose dolphins (Tursiops truncatus) to differences in diet, digestive capacity, by Kastelein et al. (1997 g), Amazon river digestive efficiency, food intake capacity, dolphins (Jnia geoffrensis) by Kastelein et al. time of day the food is eaten or metabolic (1997 e), dusky dolphins (Lagenorhynchus rate. obscurus) by Kastelein et al. (1997 b),
Commerson's dolphins (Cephalorhynchus By establishing a baseline passage rate for a commersonii) by Kastelein et al. (1993 a) and
The biology of the harbour porpoise (1997) A.J. Read, P.R. Wiepkema and P.E. Nachtigall (editors), pp. 265-275. De Spil Publishers, Woerden, The Netherlands, ISBN 90-72743-07-5
235

R.A. Kastelein et al.
a common dolphin (Delphinus delphis) by Kastelein (unpublished data). The objective of this study was to determine the mean initial passage time of carmine red dye through the digestive tract of 6 harbour porpoises (Phocoena phocoena) during and after recovery from stranding.
Materials and methods
Study animals The study was performed on 6 (5 males and 1 female) stranded harbour porpoises from the North Sea which were being, or had been, rehabilitated at the Netherlands Cetacean Research and Rehabilitation Centre at the Harderwijk Marine Mammal Park. The animals were weighed once a week on a digital scale (TEC AD-FV14-150, T1311,50 g accuracy) and their standard body length was measured. Their changes in age, body weight and body length during the study are shown in table 1.
mals of less than one year old are usually less than 100 cm long and are presumed to have been born in June. The age of older animals can be estimated from their body length (van Utrecht, 1978; Gaskin et al, 1984) until they are about 5 years old, when the body length reaches asymptote. When roughly estimating the age of an animal older than 5 years the number of scars can be taken into account, as older animals invariably have many scars (van Utrecht, 1959).
Study area The animals were kept indoors in an oval pool (length: 8.6 m, width: 6.4 m, depth: 1.2 m). They were in the pool alone or in groups of various numbers of animals. The temperature of the chlorinated salt water (2.2 -2.8% NaCl) varied between 18 and 21 °C. Daylight could enter the area and, in addition, it was artificially lit between 0800 and 1800 h.
The ages of the animals were estimated as follows: young animals have clear marginal papillae on their tongues (Kastelein and Dubbeldam, 1990). If there are birth folds in the skin, mystacial vibrissae, or if the umbilical cord is still attached, the animal is probably less than 1 week old. Teeth erupt at an age of approximately 7 weeks. Ani-
Experimental procedure For each measurement of the passage time of food through the gastro-intestinal tract, a 100 mg pulse dose of carmine red dye was added to one of the regular meals of a harbour porpoise. A dye was used, because toothed whales defecate in the water and their intact faeces cannot be collected. Pre-
Table 1. The changes in age, body weight and body length of the study animals during the study and the mean initial passage time of carmine red dye through their digestive tracts. Only data from healthy animals eating fish were used. Extreme values due to temporary changes in diet were excluded.
Animal/Sex
PpSH027/M PpSH030/M PpSH031/M PpSH035/M PpSH036/M PpSH037/F
Age range (months)
10-20 2-18
125-132 11-12 9-22
23-30
Weight range (kg)
19-31 12-24 37-39 26-28 19-24 29-34
Length range (cm)
102-128 89-112
133-136 114-118 101-112 123-138
Initial passage
Mean
157 160 196 166 171 143
(min) SD n
31 69 35 20 40 10 28 7 33 9 11 5
time
Range
106-212 115-235 150-240 125-218 109-215 130-160
Diet composition (% on Sprat
85 100
15 10 35 20
weight) Herring
15 0
85 90 65 80
Meal size range (g)
200 - 600 130-350 480 - 800 525 - 575 150-300 280 - 450
236

Passage time of carmine red
tests showed that carmine red dye clearly changed the colour of the faeces, and did not pass in visible amounts in the urine (so urine could not be judged as faeces). When young animals were being tube-fed, the dye was thoroughly mixed with the formula (see Kastelein et al. (1997 f) for the formula composition). When the animals were eating whole thawed fish, the dye was put in the gills of a fish in a gelatin capsule. When in water, the capsules dissolve within a few minutes. The carmine red dye was offered at different times of day (between 0800 and 1600 h) during the normal feeds. The animals were fed 4 to 9 times each day, and consumed a total of 4-9% of their body weight per day (Kastelein et al., 1997 c). After feeding, the animals were watched constantly, and the time when the red dye was first seen in the faeces was recorded; this is the initial passage time (IPT), initial recovery time or transit time (t0) (Warner, 1981). The dye was given to only one animal per day.
Ten tests were done with males 030 and 036 in which, in addition to IPT, the last occurrence of red dye in the faeces was recorded. This was termed final passage time (FPT). Statistical analysis was carried out on Minitab release 10 for Windows (Ryan and Joiner, 1994). Descriptive statistics are given as means ± standard deviations, n = sample size.
Results
dive normally, his IPT was between 140 and 280 minutes. After he was declared healthy the mean IPT decreased to 157 ± 31 minutes (Fig. 1 and Table 1). Based on fresh weight, his diet consisted, on average, of 85% sprat (Sprattus sprattus) and 15% herring (Clupea harengus). The IPTs were long on 2 days when the animal was fed sardines (Sardina pilchardus). Long IPTs also occurred when the animal appeared to have belly cramps indicating constipation. During belly cramps the animal bent his tail underneath his body. This was clearly visible as the pool was small, and the water clear. To cure this constipation 2 capsules of Isogel® (90% w / w dried Isphagula Husk B.P., Charwell Health Care) were added to each meal the days after these cramps occurred. It appears that this medication reduced the passage time slightly.
Male calf 030 was fed formula until 4 months after his arrival at Harderwijk. He was kept alone in a small pool (1.8 m diameter, 0.7 m deep). During this period his IPT was long (180-400 minutes; Fig. 2). When he was allowed to swim in the bigger pool during the day, his IPT gradually decreased. When he had become strong enough to be kept in the main pool constantly, his IPT decreased even more. After he had made the transfer from formula to fish (100% sprat) the mean IPT was 160 ± 35 minutes (Fig. 2 and Table 1). The IPT was exceptionally long (275 minutes) when he was fed squid (Illex spp.) for the first time.
Passage time changes over time Male 027 was very sick when he arrived. He had been bitten in his tailstock by a shark and was emaciated and dehydrated (Kastelein et al, 1997 a). He swam slowly at the surface for 6 weeks before he began to dive. During this period his IPT was long (180-300 minutes; Fig. 1). After he began to
When the animals were judged to be completely healthy, male 031's mean IPT was 196 ± 40 minutes, male 035's was 166 ± 28 minutes, male 036's was 171 ± 3 3 minutes and female 037's was 143 ± 1 1 minutes (Table 1).
237

R.A. Kastelein et al.
Male 027 400-1
350 c E. o> 300 E
§> 250 CO M W a _ 200 H
150-
100
Started diving
* Declared healthy
• • • • •
& *©
1 2
April 1993
10 11
Month
Figure 1. Initial passage time of carmine red through the digestive tract relative to the time male harbour porpoise 027 was in human care. 1) High passage times probably caused by a novel diet (sardines), 2) Passage times on days when belly cramps were observed, indicating constipation.
Male 030
400 -I
"c 350-E.
* 300-
Initi
al p
assa
ge ti
l
Ol O
O
l
o o
o
100-
•
* * * • •
< • • • m •
•
**
•
•
> • • •
•• • • •
Kept in big pool during the day
•« Moved to big pool permanently
» • • •
~ ^ — i i — i — i — i — i i i — i i —
© •
•
_ , 1 i i
1 2 3 4 5 6 7 8 9 10 11 12 13 14 15 16 17 18
July 1993 Month
Figure 2. Initial passage time of carmine red through the digestive tract relative to the time male harbour porpoise 030 was in human care. 1) High passage time probably caused by a novel diet (squid).
238

Passage time of carmine red
Individual differences in passage time A one-way analysis of variance on IPT with animal as a random factor showed that IPT varied between animals (F 5106 = 8.23; p < 0.0001). In similar analyses, the animals were found to differ in weight (F 5109 = 112; p < 0.0001) and in length (F 5106 = 82.0; p < 0.0001). However, when the animals were healthy and on a fish diet, no significant correlation between body weight or length and IPT was found (Fig. 3; Pearson's correlations on mean weights, lengths and IPT and separately for each individual).
Initial passage time and final passage time The mean interval between IPT and FPT in animal 030 was 69 ± 37 minutes (n = 7); the mean FPT was 230 ± 49 minutes. The mean interval between IPT and FPT in animal 036 was 103 ± 56 minutes (n = 3); the mean FPT was 280 ± 61 minutes.
Discussion and conclusions
Individual differences in passage time In general in a terrestrial mammal species, the older an animal, the longer the passage time of digesta through its gut (Warner, 1981). Whether this is because the digestive tract increases in length or because its movements slow down with age is unknown. Variation in passage times between individuals can depend, among other things, on genetic variation within a species. Wild animals have more variation in passage times than farm animals (Warner, 1981). However, this variation may be due not to genetic differences, but because the food of wild animals is more heterogenous than that of farm animals. Humans have more variable IPTs than animals (Warner, 1981).
Hepburn and Waterston (1901) found that the intestine of a harbour porpoise of 1.26 m was 15 m long; nearly 12 times the length of
the animal. In humans, the intestine is 4 to 5 times as long as the individual (Hepburn and Waterston, 1901) and the initial passage time is between 40 and 60 h (Warner, 1981). The flow rate of digesta is much higher in harbour porpoises than in humans, perhaps partly because the alimentary canal of harbour porpoises has no villi (Hepburn and Waterston, 1901). Including the oesophagus and stomachs, the entire digestive tract of the harbour porpoise is approximately 16 m long. However, a calculation of the average flow rate of digesta through the digestive tract is not informative, as flow rate varies greatly in the different compartments of the digestive tract (Warner, 1981).
Passage time relative to food type In the present study changes in the diet altered the IPT. This effect sometimes lasted only for a few days, during which the digestive system probably adjusted to the change in digesta. The same phenomenon occurs in many terrestrial mammals (Warner, 1981).
Passage time through a digestive tract depends on the composition of the material that has to be moved and on the size of the particles. In general, in mammals, solutes move from the stomach to the gut more rapidly than particles, and small particles faster than large particles. After the stomach, the transport speed varies less because the solutes and particles form a mixed mass (van der Klis, 1993).
Plant material hardly digests in the forestomach of a harbour porpoise, but remains in the forestomach and does not pass to the fundic stomach (Kastelein and Lavaleije, 1992). Undigested paper, swallowed at sea, has been found in the forestomachs of 3 stranded harbour porpoises and 2 whitebeaked dolphins (Lagenorhynchus albirostris) which, despite
239

R.A. Kastelein et al.
300-i
-=• 250-
.1 200 * • »
0) O) (0 to
g 150
£ 100-
50
A.
15
o Male 027 x Male 035
• Male 030 A Male 036
A Male 031 • Female 037
A
A . *
' / * • A * * 0 *
« « &>
o o
o 8 o 8 • o_x
°o° °>€ ,%.
20 25
— i —
30
i i
35 40
Body weight (kg)
90
ovv -
c*250-
E <u
• | 200 -
<D O) CO (0
18 150-a
m +•>
JE 100-
50-
B.
•
• • •
•
o Male 027
x Male 035
A
A •
• • •
A
A A G
O
O
• Male 030
A Male 036
o o <>x o
A * \ 0OO«T
• • a x
°«80° ° X
X
o
X 0
% 8 «
o «> • o
A Male 031
• Female 037
o
°a-P.
e o
%
1
A A
A A
A A
A A
A
A
•
A
1 1 1
95 100 105 110 115 140 120 125 130 135
Standard body length (cm)
Figure 3. Initial passage time of carmine red through the digestive tracts of 6 healthy harbour porpoises on a fish diet, a) Relative to body weight, and b) Relative to body length.
240

Passage time of carmine red
intensive veterinary treatment, died after eating well for several days (Kastelein, pers. obs.). Some objects are not digested and remain in the forestomach of odontocetes unless regurgitated. For example, male harbour porpoise 027 once ate a nylon rope of 83 cm long and 6 mm diameter. It stayed in his forestomach for 7 weeks until it was regurgitated. Except for a change in colour, the rope appeared to be in the same condition as before being ingested, and the animal showed no eating problems during the 7 week period. However, some objects are transported through the digestive tract. Mackay (1964) describes a radio transmitter of 8 cm long and 0.8 cm diameter which was expelled in the faeces 17 h after a bottlenose dolphin (Tursiops truncatus) had swallowed it. The passage time of this object was much longer than that of dye in the same species (6 h: Ridgway, 1972; 4 h: Kastelein et ah, 1997
g>-
Comparison with other odontocetes Figure 4 shows the mean IPTs of carmine red dye in 8 odontocete species. In general, the IPTs seem to increase with body weight. The Amazon river dolphin has a relatively long IPT.
Passage time may not only be related to the length of the digestive tract, but also to the animal's metabolic rate. The daily food intake as % of body weight is a measure of metabolic rate. The higher the metabolic rate in the 8 odontocete species, the lower the IPT (Fig. 5). The shortest mean passage times in a review by Warner (1981) were 1-3 h in small mammals such as shrews, mink and voles. The mean IPTs of the harbour porpoises in the present study fall in this range, although the harbour porpoise weighs much more. This could be because fish is easy to digest.
Applications The present study sets a baseline range for the IPT of carmine red through the digestive tract of harbour porpoises. If keepers suspect a health problem, a test with carmine red dye can sometimes show whether this is related to the digestive tract. Constipation causes serious discomfort in harbour porpoises. It may be caused by a lack of sufficient activity, because movement of the body wall is insufficient to massage the intestines. In most mammal species exercise increases the rate of passage (Warner, 1981). Constipation may also be caused by feeding thawed fish. When fish are frozen, ice crystals damage the muscle fibres. This makes the tissues softer and smoother. Fibres are thought to stimulate the movements of the intestines. Isogel®, administered in capsules which are inserted in the gills of some of the fish fed, increases the volume of the ingesta in the digestive tract and usually cures constipation in harbour porpoises (Kastelein et al., 1990). The need for Isogel® varies per individual animal over time and depends on the diet, the season and the animal's level of activity.
Ecological significance The passage time is a measure of how long individual portions of digesta are retained in the gut and are subject to the processes of mechanical mixing, digestion, microbial fermentation and absorbtion. Measures of rate of passage can help to characterize the digestive strategies available to an animal. For example, an animal with a short passage time must consume either a readily digestible food, or large amounts of less readily digestible food (Warner, 1981). The harbour porpoise probably uses the first strategy; it consumes fish which is easily digestible. Examination of the stomach content of a harbour porpoise which died 30 minutes after eating several thawed herring, showed
241

R.A. Kastelein et al.
300-i
275-
250
225
200
175
150
125
100
• Inia gaoffrenaia
• Turaiops tnjncatus
• Dalphinus delphis
Dalphinaptania • leucas
• Psaudorca crasaidana
• Lagenortiynchus obscunis
a • Caphalortiynchua commaraonii Phocoana phocoana
1 1 1 1 1 1 1 1 1 1 1 I 1
0 50 100 150 200 250 300 350 400 450 500 550 600 650
Body weight (kg) Figure 4. Average body weight versus mean initial passage time of carmine red in 8 odontocete species (sources: present study; Kastelein et al. (1990,1993 a and b, 1994,1997 b, c, d, e and g. Unpublished data of a 125 kg Common dolphin: mean IPT = 212 ± 71 minutes; n = 40; average daily food consumption: 4.4% of body weight; diet: herring and mackerel).
o> is w (0 10 Q.
c 10 W
s
260
240
•g 220 H
o I 200
I S O
'S 160
140
120
Oelphinapterus leucas* • Inia geoffrensis
• Tursiops truncatus
• Pseudorca crassidens
• D«.phii.us delphis
Lagenortiynchus obscurus*
Cephalorhynchus commersoniio
Phocoena phocoena
. , , 1 1 1 , _ . , 1 % 1 , , f , 1 , , , f ,
0 1 2 3 4 5 6 7 8 9 10 11 Daily food intake as % of body weight
Figure 5. Average daily food consumption as % of body weight (an indication of metabolic rate) versus mean initial passage time of carmine red in 8 odontocete species (sources: see figure 4).
242

Passage time of carmine red
that only bones remained in the f orestomach (Kastelein, pers. obs.). Different components of the diet (soft tissues versus bones) thus exhibit different passage times. The fore-stomachs of the porpoises in the present study were probably empty of most solid fish remains before each meal (meals were given at 1 to 1.5 h intervals).
Suggestions for future research Passage time in many other animal species depends on meal size, time of day and particle size (Warner, 1981). These parameters should also be studied in the harbour porpoise. Whether harbour porpoises have clear diurnal feeding rhythms is not yet clear, but radio telemetry studies may provide information on this subject. If diurnal patterns in feeding occur, it would be of interest to mimic such cycles in human care and record passage times during various moments of the cycle.
Acknowledgements
We thank Carolien Staal, Duncan Versteegh, Klaas Jan Janse and Nathalie van Mechelen for assisting with the data collection. The graphs were made by Rob Triesscheijn. Terrie Williams (Long Marine Laboratory, University of California Santa Cruz, U.S.A.), Nancy Vaughan (Harderwijk Marine Mammal Park) and the editors Andrew Read (Duke University, School of The Environment, Marine Laboratory, U.S.A.), Piet Wiepkema (Wageningen Agricultural University, The Netherlands) and Paul Nachtigall (Hawaii Institute of Marine Biology, University of Hawaii, U.S.A.) all gave valuable constructive comments on this manuscript. Nancy Vaughan also carried out the statistical analysis.
References
Gaskin, D.E., Smit, G.J.D., Watson, A.P., Yasui, W.Y. and Yurick, D.B. (1984) Reproduction in the Porpoises (Phocoenidae): Implications for management. In: Reproduction in whales, dolphins and porpoises (Eds. Perrin, W.F., Brownell, R.L. Jr. and DeMaster, D.P.). Rep. Int. Whal. Commn., Special Issue 6, 135-148.
Hepburn, D. and Waterston, D. (1901) The true shape, relations, and structure of the alimentary viscera of the Porpoise (Phocoena communis), as displayed by the formal method. Trans. Roy. Soc. Edin., Vol. XL, Part 11(16), 313-329.
Kastelein, R.A. and Dubbeldam, J.L. (1990) Marginal papillae on the tongue of the Harbour porpoise (Phocoena phocoena), Bottlenose dolphin (Tursiops truncatus) and Commerson's dolphin (Cephalorhynchus commersonii). Aquatic Mammals 15(4), 158-170.
Kastelein, R.A. and Lavaleije, M.S.S. (1992) Foreign bodies in the stomach of a female Harbour porpoise (Phocoena phocoena) from the North Sea. Aquatic Mammals 18(2), 40-46.
Kastelein, R.A., Bakker, M.J. and Dokter, T. (1990) The medical treatment of 3 stranded Harbour porpoises (Phocoena phocoena). Aquatic Mammals, 15(4), 181-202.
Kastelein, R.A., McBain, J. and Neurohr, B. (1993 a) Information on the biology of Commerson's dolphins (Cephalorhynchus commersonii). Aquatic Mammals 19(1), 13-19.
Kastelein, R.A., McBain, J., Neurohr, B., Mohri, M., Saijo, S., Wakabayashi, I. and Wiepkema, P.R. (1993 b) Food consumption
243

R.A. Kastelein et al.
of Commerson's dolphins {Cephalorhynchus commersonii). Aquatic Mammals 19(2), 99-121.
Kastelein, R.A., Ford, J., Berghout, E., Wiepkema, P.R. and Boxsel, M. van (1994) Food consumption, growth and reproduction of Belugas {Delphinapterus leucas) in human care. Aquatic Mammals 20(2), 81-97.
Kastelein, R.A., Bakker, M.J. and Staal, C. (1997 a, this volume) The rehabilitation and release of stranded harbour porpoises (Phocoena phocoena). In: The biology of the harbour porpoise (Eds. Read, A.J., Wiepkema, P.R. and Nachtigall, P.E.). De Spil Publishers, Woerden, The Netherlands, 9-61.
Kastelein, R.A., Elst, C.A. van der, Tennant, H.K. and Wiepkema, P.R. (1997 b, in press) Food consumption, growth, body dimensions and body temperatures of a female dusky dolphin {Lagenorhynchus obscurus). In: Food consumption and growth in marine mammals (Ed. Kastelein, R.A.). De Spil Publishers, Woerden, The Netherlands.
Kastelein, R.A., Hardeman, J. and Boer, H. (1997 c, this volume) Food consumption and body weight of harbour porpoises {Phocoena phocoena). In: The biology of the harbour porpoise (Eds. Read, A.J., Wiepkema, P.R. and Nachtigall, P.E.). De Spil Publishers, Woerden, The Netherlands, 217-233.
Kastelein, R.A., Mosterd, J., Schooneman, N.M. and Wiepkema, P.R. (1997 d, in press) Food consumption, growth, body dimensions and respiration rate of false killer whales {Pseudorca crassidens). In: Food consumption and growth in marine mammals (Ed. Kastelein, R.A.). De Spil Publishers, Woerden, The Netherlands.
Kastelein, R.A., Neurohr, B., Nieuwstraten, S.H. and Wiepkema, P.R. (1997 e, in press) Food consumption and body measurements of Amazon river dolphins (Inia geoffrensis) in human care. In: Food consumption and growth in marine mammals (Ed. Kastelein, R.A.). De Spil Publishers, Woerden, The Netherlands.
Kastelein, R.A., Schooneman, N.M., Staal, C. and Boer, H. (1997 f, this volume) A method for tube-feeding juvenile harbour porpoises {Phocoena phocoena). In: The biology of the harbour porpoise (Eds. Read, A.J., Wiepkema, P.R. and Nachtigall, P.E.). De Spil Publishers, Woerden, The Netherlands, 63-83.
Kastelein, R.A., Staal, C. and Wiepkema, P.R. (1997 g, in press) Food consumption and growth of Atlantic bottlenose dolphins {Tursiops truncatus). In: Food consumption and growth in marine mammals (Ed. Kastelein, R.A.). De Spil Publishers, Woerden, The Netherlands.
Klis, J.D. van der (1993) Physio-chemical conditions and mineral absorbtion in broilers. PhD thesis, Wageningen Agricultural University, The Netherlands, 140 pp.
Mackay, R.S. (1964) Deep body temperature of untethered dolphin recorded by ingested radio transmitter. Science 144, 864-866.
Ridgway, S.H. (1972) Homeostasis in the aquatic environment. In: Mammals of the sea (Ed. Ridgway, S.H.). Thomas publisher, Springfield, Illinois, 687.
Ryan, B.F. and Joiner, B.L. (1994) Minitab Handbook (3rd edition). Wadsworth Publishing Company, Belmont, California.
244

Passage time of carmine red
Utrecht, W.L. van (1978) Age and growth in Warner, A.C.I. (1981) Rate of passage of Phocoena phocoena Linnaeus, 1758 (Cetacea, digesta through the gut of mammals and Odontoceti) from the North Sea. Bijdr. tot de birds. Nutrition Abstracts and Reviews Dierk. 48(1), 16-28. Series 'B' 51(12), 789-820.
245

Chapter 2.16
Blubber thickness in harbour porpoises (Phocoena phocoena)
R.A. Kastelein, SJ. van der Sijs, C. Staal and
S.H. Nieuwstraten
Harderwijk Marine Mammal Park, Strandboulevard Oost 1,3841 AB Harderwijk, The Netherlands
Summary
The blubber thicknesses of 5 male and one female harbour porpoises were measured ultrasonically in 9 positions on the body over various periods of time. Most animals were immature and all grew during the study. The blubber was not evenly distributed over the body, and there were individual differences in blubber thickness. Most males had similar blubber thickness distributions; moving caudally, the thickness increased towards the beginning of the dorsal fin (around 25 mm) and then decreased towards the tailstock (around 17 mm). In the female, the blubber layer thickness varied less between positions than in the males, but was also thinnest laterally on the tailstock. At one time she experienced a large drop in mean blubber thickness and weight in a short time period (maximum rate of decrease: 6 mm blubber/week), despite a constant food intake and good health. Her energy requirements probably increased due to an increase in activity level. After the sudden weight drop had been noticed, she was fed ad lib. Her food intake increased by 70%, and her body weight and blubber thickness quickly returned to normal levels (maximum rate of increase: 7 mm blubber/week).
Key words: odontocete, adipose tissue, energetics, growth, thermoregulation
Introduction coena phocoena) because of its high body surface area to volume ratio (Kanwisher and
Odontocetes live in a medium which con- Sundnes, 1965; Ryg et ah, 1993) and because ducts heat 25 times faster than air. To main- it inhabits cold waters where sea surface tain a body temperature of around 36°C, temperatures range from 4 to 16°C (Gaskin, cetaceans have a skin temperature which is 1992). To compensate for this, harbour por-similar to that of the surrounding sea water poises have a blubber layer which is rela-(Hokkanen, 1990; Kastelein et ah, 1997 d) tively thick (Worthy and Edwards, 1990). and have an insulating blubber layer (Irving, However, the blubber is not evenly distrib-1970). The blubber of odontocetes improves uted over the body, but is thin or lacking on their hydrodynamic shape, stores elastic the dorsal and pectoral fins and on the tail energy, plays a role in buoyancy, stores fluke; these areas are used in heat exchange metabolic energy and provides thermal (Braun, 1905; Scholander and Schevill, 1955; insulation (Ryg et al., 1988; Pabst et al, 1995). Eisner et al., 1974; Parry, 1949). All studies
on the blubber thickness of harbour por-The risk of hypothermia is high for a small poises so far have been carried out on dead odontocete like the harbour porpoise (Pho- animals with unknown histories (Parry,
The biology of the harbour porpoise (1997) A.J. Read, P.R. Wiepkema and P.E. Nachtigall (editors) pp. 179-199. De Spil Publishers, Woerden, The Netherlands, ISBN 90-72743-07-5
247

R.A. Kastelein et al.
1949; Read, 1990; Koopman, 1994; Lockyer, 1995). When rehabilitated stranded harbour porpoises from the North Sea became available for research at Harderwijk, longitudinal blubber thickness studies could be conducted on live animals using ultrasound.
The aims of this study were to determine: 1) the distribution of blubber over the body
of harbour porpoises, 2) whether a relationship exists between
body size and blubber thickness, 3) whether a relationship exists between
water temperature and blubber thickness, and
4) the rates of change in blubber thickness.
Materials and methods
Study animals The 5 male and 1 female harbour porpoises had stranded on the North Sea coast and had been rehabilitated at the Netherlands Cetacean Research and Rehabilitation Centre at the Harderwijk Marine Mammal Park (Table 1). Their ages on stranding were determined as follows: if part of the umbilicus was present and both folds visible, the animal was estimated to be less than one week old. If the animal was less than 100 cm long it was estimated to be less than one year old, and was assumed to have been born in June. Animals up to 5 years old were
Figure 1. Measuring the blubber thickness of harbour porpoise 030 ultrasonically (Photo: Henk Merjenburgh).
248

Blubber thickness
Table 1. The age, weight and length changes of the harbour porpoises during the study.
Animal
PpSH027 PpSH030 PpSH031 PpSH035 PpSH036 PpSH037
Gender
Male Male Male Male Male Female
Age change
From
1.3 0.3
10.5 0.9 0.8 1.9
(yr.mo)
To
2.11 2.5
11.0 1.0 2.4 3.3
Weight change
From
26.8 14.4 36.2 24.6 18.2 24.2
(kg)
To
36.2 26.9 39.1 28.4 27.1 37.9
Length change (cm)
From To
122 138 93 121
134 136 113 118 100 119 115 148
aged by body length accord ing to Gaskin et al. (1984) and were assumed to have been born in June. The blubber thickness was not measured until the animals were healthy and had normal weights for their lengths. The female was not pregnant or lactating and all the study animals were growing during the study period. The rehabilitated harbour porpoises were good subjects for this study because they were used to frequent handling and thus remained calm during the measurements.
Each animal was weighed once a week, and its food ration for the next week was determined from its weight. Because the animals always ate all the food they were given, and because the composition of their diet did not change throughout a week, the daily energy intake of each animal was constant in each week.
Study areas Throughout most of the study period the animals were kept indoors in an oval pool (8.6 m x 6.4 m, depth: 1.2 m). The temperature of the chlorinated artificial salt water (2.2 - 2.8% NaCl) was measured daily and varied between 18 and 21°C. The area was artificially lit and daylight could enter through skylights and windows.
At the end of April 1995, male 027 and female 037 were moved to a floating pen at Neeltje Jans harbour (operated by the Harderwijk Marine Mammal Park and the Waterland Neeltje Jans). Male 027 was housed here for 4 weeks, female 037 for 5 months. The floating pen was 34 m x 20 m, 3.2 m deep at the sides and 4.7 m deep in the centre. The bottom and sides of the pen were made of net, so that the surrounding sea water could flow through the pen. The salinity in the pen was around 3%; the mean weekly water temperature increased from 11°C in May to 21 °C in August.
Measurements For the purposes of this paper, blubber is defined as the epidermis, dermis, and hypodermal tissues of porpoises. Integument is defined as the same tissues in terrestrial mammals. The blubber thickness of the study animals was measured ultrasonically with a Renco Lean-Meater®, which produced a 2.2 MHz, 3 or 4 cycle, dampened sinusoid signal with a pulse repetition rate of 200 Hz (Fig. 1). The apparatus measured the distance between the skin surface and the underlying muscle layer with ± 1 mm accuracy. The sound made by the transducer was audible to the porpoises (Fig. 2); they sometimes reacted
249

R.A. Kastelein et al.
0 100 200
F requency (kHz)
Figure 2. Power spectra of the signals produced by the Renco Lean-Meater® on PVDF film showing energy within the frequency hearing range of the harbour porpoise. Top line: activated transducer. Lower line: inactivated transducer (courtesy of Whitlow Au, Hawaii Institute of Marine Biology).
to it by curving their bodies and lashing their tails. They did this in particular when the transducer was placed near the auditory meatal orifice (position 2 in Fig. 3A) and on the middle of the tail stock (position 9).
To measure their blubber thickness, the porpoises were removed from the water and placed on a foam rubber mattress with their bodies straight. Blubber thickness was measured in 9 positions (Fig. 3). Two positions were above the pectoral fin, 3 just anterior of the dorsal fin, 3 just posterior of the dorsal fin and 1 was in the centre of the tailstock. The measurements were taken from the left or right side of the body. It was tried to measure blubber thickness in other positions, but these measurements failed for various reasons or were extremely variable, usually because the contact between the porpoise's skin and the transducer was inadequate, although contact gel was always used.
Measurements from the white skin of the porpoises (ventral and lateral) were relatively easy and quick to obtain because this skin was usually smooth; the black skin on their backs was sometimes ridged. This roughness was due to irregular skin sloughing, a phenomenon often observed in odontocetes (Sokolov and Kalashnikova, 1971; Harrison and Thurley, 1974; Kastelein et al, 1997 a). Similar ridges have been observed on the skin of bottlenose dolphins (Tursiops trun-catus; Ridgway and Carder, 1990). Occasionally, the ridges prevented measurements being taken in all 9 positions.
The blubber thickness was normally measured approximately once each month. When animal 027 and 037 were in the floating pen, their blubber thickness was measured more often. Once a week, the following additional parameters were recorded: - body mass (with a digital weighing
250

Blubber thickness
ness and differences in blubber thickness in different positions on the same animal were significant. Most males had a similar distribution of blubber thickness, with thicker blubber anterior to the dorsal fin and a thinner blubber layer towards the tailstock (Fig. 3 a-e). In the female the blubber layer thickness varied less between positions than in the males, but was also thinnest lateral of the tailstock (Fig. 3 f).
Blubber thickness was most variable between animals in the band around the pectoral fin and lateral and dorsal in the band rostral of the dorsal fin (positions 1, 2, 3 and 4). It was the least variable between animals ventral in the band anterior to the dorsal fin and the band posterior of the dorsal fin and on the tailstock (positions 5, 6, 7, 8 and 9).
Blubber thickness relative to body size The relationships between mean blubber thickness (of all 9 measurement points) and body weight (Fig. 4 a), and between mean blubber thickness and body length (Fig. 4 b) are shown. The results of Pearson correlations on these parameters for the animals which were measured more than 10 times are shown in table 2. The mean blubber thickness of males 030 and 036 was large
Table 2. Bonferroni adjusted p values for Pearson correlations on various parameters measured for the study. All blubber thickness measurements are means, n.s. = not significant.
machine, TEC, AD-FV14-150, T1311,50 g accuracy),
- standard body length (i.e. straight line from tip of upper jaw to notch of tailfluke),
- girth directly in front of the pectoral fins, and
- girth at axilla;
Statistical analysis The statistical analysis was carried out on Minitab release 10 for Windows (Ryan and Joiner, 1994) with a significance level of 5%. Values for blubber thickness were log transformed where necessary to bring the distribution closer to normality (Zar, 1984). Where several correlations were carried out on the same data, the p values were adjusted by using the Bonferroni method; adjusted p values are given as pb (Altaian, 1991).
Results
Topographical distribution of blubber A nested analysis of variance (ANOVA) with position of measurement nested within animal showed that both factors had a significant effect on log transformed blubber thickness (animal: F = 187.95; p < 0.0001, position: F = 29.20; p < 0.0001). This means that individual differences in blubber thick-
Correlation parameters Animal 027
Animal 030
Animal 036
Animal 037
Blubber thickness vs weight Blubber thickness vs length Blubber thickness at pectoral
fins vs girth rostral of fins/lengths Blubber thickness at pectoral
fins vs girth behind fins/lengths Blubber thickness vs water temperature
<0.05 <0.05
n.s.
n.s. n.s.
n.s. n.s.
n.s.
n.s. n.s.
n.s. n.s.
n.s.
n.s. n.s.
n.s. n.s.
<0.05
n.s. n.s.
251

R.A. Kastelein et al.
35 -i
30 -
? E.
in 25 -a> c
£
j . 2 0 -• 3
m 15-
in .
A. Male 027 Length: 122-138 cm
n=20 n=20
„-
I
n-20
©
©
n=19
© / <©
© ® ® "
— (D
I
1
n=19 n-20
I
n=20 n=19
_Jx"
I
'
n=20
9 Position
3 5 IB. Male 030 . Length: 93-121 cm
30-
E E
8 25 C u
s > 2 0 ja .a 3 CO
15 -
10 n=25 n=26 n=26 n=26 n=26 n=26 n"26 n=25 n=26
9 Position
252

Blubber thickness
35
30
? E.
3 25 a> c u
15 2 0
3 CD
15
10
; C. Male ( , Length: 13
"
• n= =6
)31 4-136 cm
n= 6 n> =6
i
n=6
I
n=5 u=6
I
n=6 n-=6
I
0=6
9 Position
35 -
30-^-E E
«> I E </> 25 -a> c JC
£
S 2 0 -
3 (0
15-
•in .
D. Male 035 Length: 113-118 cm
I I
n=4
I I
n=4 n=4 n=3
1
n =4
1 1
n=4 n=4
1
1
n=4
1 1
n=4
6 8 9 Position
Figure 3. The 9 positions on the harbour porpoise's body where the blubber thickness was measured and the mean blubber thickness and standard deviation on those 9 positions: 1) dorsal and 2) lateral in a band around the pectoral fin, 3) dorsal, 4) lateral and 5) ventral in a band just anterior of the dorsal fin, 6) dorsal, 7) lateral, 8) ventral in a band just posterior of the dorsal fin and 9) lateral in the middle of the tailstock. a) Male 027, b) Male 030, c) Male 031, d) Male 035, e) Male 036 and f) Female 037. The numbers on the x-axis refer to the positions on the body shown in A. The standard deviations in figure d have little meaning due to the small sample size.
253

R.A. Kastelein et al.
35-| E. Male 036 Length: 100-119 cm
9 Position
35
30-
? E.
3 25 « c o
CO
20-
15
10
I F . Female \ Length: 11
.
• n= 21 n=
) 037 5-148 cm
21 n= '21 n= 21 n- =21 n= =21
|
n=21 n» 21
I
n=21
1 6 8 9 Position
Figure 3. The 9 positions on the harbour porpoise's body where the blubber thickness was measured and the mean blubber thickness and standard deviation on those 9 positions: 1) dorsal and 2) lateral in a band around the pectoral fin, 3) dorsal, 4) lateral and 5) ventral in a band just anterior of the dorsal fin, 6) dorsal, 7) lateral, 8) ventral in a band just posterior of the dorsal fin and 9) lateral in the middle of the tailstock. a) Male 027, b) Male 030, c) Male 031, d) Male 035, e) Male 036 and f) Female 037. The numbers on the x-axis refer to the positions on the body shown in A. The standard deviations in figure d have little meaning due to the small sample size.
254

Blubber thickness
when they were small (Fig. 4). When both weighed around 25 kg, the mean blubber thickness of male 030 was about 7 mm more than that of male 036. Both animals were healthy, and had a similar activity level, but animal 036 ate on average around 70% more than animal 030 (Kastelein et al, 1997 c).
The bulkiness of an animal can be expressed as the ratio of a girth divided by the body length. To determine which of the 2 girth measurements is the best indicator of the physical condition of a harbour porpoise, the girth in front of the pectoral fins/body length ratio was plotted against the mean blubber thickness of measurement positions 1 and 2 in the band around the pectoral fins (Fig. 5 a). These positions were chosen as they were closest to the measured girths. The girth at axilla/body length ratio plotted against the mean blubber thickness of the same 2 measurement positions (1 and 2) in the band around the pectoral fins (Fig. 5 b). The results of Pearson correlations on these parameters are shown in table 2.
Blubber thickness relative to water temperature No correlation could be detected between the mean blubber thickness of any animal and the mean water temperature of the previous week (Fig. 6; see Table 2). This relatively short period was chosen as the blubber thickness in harbour porpoises can change quickly as a result of their small body volume (Kastelein and van Battum, 1990). Only animals 027 and 037 were exposed to the lower water temperatures because of their stay at Neeltje Jans harbour.
Rate of blubber thickness change Fluctuations in blubber thickness and distribution over time were observed in all animals. Those of the female are shown because she went through large weight changes in a short period (Fig. 7 a-d). Dur
ing her stay at the research and rehabilitation centre, the fluctuations in blubber thickness over time were highest in the rostral part of the body (Fig. 7 a and b) and lowest in the caudal part of the body (Fig. 7 c and d). When she was moved from the rehabilitation centre to Neeltje Jans harbour, the animal experienced a water temperature drop of 7°C. After having been at the field station for several months, she suddenly experienced a large drop in mean blubber thickness and weight in a short time period (maximum decrease: 6 mm blubber/week), despite her constant food quantity and quality intake (all fish fed came from the same catch). She was healthy during that period and showed normal behaviour. The largest decrease occurred in the band caudal of the dorsal fin (mainly lateral and dorsal; Fig. 7 c). After the sudden weight drop had been noticed, she was fed ad lib. Her food intake increased by 70%, and her body weight and blubber layer thickness quickly returned to normal levels (maximum increase: 7 mm blubber/week).
Discussion and conclusions
General blubber thickness The blubber thickness of the animals in the present study may have been partly determined by the food rations the animals received. The amounts to be fed were determined with reference to the weekly measurements, the animal's appearance and how eagerly it ate the fish. The animals in the present study did not have to forage, and thus their daily exercise level was probably different from that of conspecifics in the wild. Probably more importantly, the water temperature in the pool was much higher than the water temperatures experienced by conspecifics in the wild. Therefore the mean blubber thicknesses of the animals in the present study do not necessarily
255

R.A. Kastelein et al.
3 5 * -
| 3 0 -
M (A <D C
o 25 H
3 20
O) 2 a 15
10
° Male 027 x Male 035
• Male 030 * Male 036
* Male 031 • Female 037
• • •
A • A
• X •
O O O g A
•
J A ^
T 1 —
14 16
B.
— i — i — i — i — i — i — i — i — i — i — i — i — i — i — i — i — i — i — i — i — i — i — i
18 20 22 24 26 28 30 32 34 36 38 40
Bodv weiaht (ka)
? E <0 w o c o
4-1
3
n O o> & a> > <
J& -
30-
25-
20-
15-
10-
•
1—1 1 -
o Male 027 x Male 035
• * .
• • • * x " * • * . x X • » A A A I A *
A . A* A « A
i i i—i—i—t—i—\—i—i—r
• Male 030 A Male 036
• •
• o
g o ° •
- 1 — 1 — 1 1
A Male 031 • Female 037
o
-i—i—i—i—i—i—i—r
• •
"T 1 1 1-™1 1 -
90 94 98 102 106 110 114 118 122 126 130 134 138 142 146 150 154
Body length (cm)
Figure 4. Mean blubber thickness of all 9 positions relative to body weight (a), and body length (b) in 6 harbour porpoises.
256

Blubber thickness
E B
c
2 o o Q.
(A If)
a> c o
.Q
3
o O)
2
3
A 30-i
25-
20-
15-
•
1 1 1
• •
•
1 1 1 1 1
O
O •
•
•
•
r-r-r
0
o O 1 • •
© • c
• •
•
•
1 1 1
o Male 027 x Male 035
•
0 ••
o •
at A a A 0 •
1 O o
• o
A o
• •
• Male 030 A Male 036
• •
ft A • • • • X • A
• m x A m A A A AA
A *
O
1 1 1 1 1 1 1 1 1 1
A Male 031 • Female 037
• • •
X A • •
• • A
I 1 1 1 1 1 1 1 1 1 1 1 1 1 1 1 1 1 1 1 1 1
0.44 0.46 0.48 0.50 0.52 0.54 0.56 0.58 0.60 0.62 0.64 0.66 0.68 0.70
Girth in front of pectoral f ins /body length
i- B
I 30-i
o 0)
a 25 v> M e
JC u
20 5 3
O o> 2 o > <
o Male 027 • Male 030 A Male 031 x Male 035 A Male 036 • Female 037
A • •
A • • X A • • X
o a. • A • • • A . A
A\ A
O A A A
15 i i i • i i i i i i i i i • i i i i i i i i i i i i i i i • i i i i i i i
0.44 0 .46 0.48 0 .50 0 .52 0.54 0.56 0 .58 0.60 0 .62
• i i i i i • i i i • i • i
0.64 0.66 0.68 0.70
Girth at axi l la /body length
Figure 5. The girth in front of the pectoral fins/body length versus mean blubber thickness at the band around the pectoral fin (a), and the girth at axilla/body length versus the mean blubber thickness at the band around the pectoral fin (b).
257

R.A. Kastelein et al.
30-i
E E
S 25
*
o Male 027 x Male 035
• Male 030 A Male 036
A Male 031 • Female 037
•
A A '
* » A
V-A O
O O
rf> •
A
2 20 n a> D)
2
I 15 -I 1 1 i 1 1 1 1 1 1 1 r
10 11 12 13 14 15 16 17 18 19 20 21 22 Average water temperature (°C)
Figure 6. Mean blubber thickness relative to water temperature in 6 harbour porpoises.
resemble those of wild conspecifics. In the present study the term blubber includes skin and hypodermal tissues. The skin thickness in harbour porpoises decreases with age. The maximum skin thickness ranges from 3 to 10 mm in calves (mean: 3.8 mm), from 2 to 4 mm in immature animals (mean 3.3 mm) and from 2 to 5 mm in mature animals (mean 3.0 mm) (Heather Koopman, pers. comm.). This should be taken into consideration when comparing the findings of the present study with those of previous studies (Parry, 1949; van Utrecht, 1960; Read, 1990; Koopman, 1994; Lockyer, 1995), in which blubber thickness indicates only the thickness of the hypodermal tissue.
Parry (1949) found a male harbour porpoise dead in British waters. It was 155 cm long and its blubber was on average 18 mm thick. Van Utrecht (1960) described blubber thicknesses of 9 to 23 mm for stranded and
bycaught harbour porpoises from the North Sea and 30 mm for bycaught animals from the Baltic. Ivtefhl-Hansen (1954) also found thick blubber layers in harbour porpoises from the Baltic (adult females: 25 to 35 mm; young animals: 40 to 60 mm). He sampled in late autumn and early spring, months when the water temperatures were very low. In some of these animals a thick layer of fat was present in the loose connective tissue between the blubber and the fascia around the underlying muscles. These values are much higher than those in the present study, and may reflect low water temperatures in the Baltic (Slijper, 1958). Based on 85 harbour porpoises from Canadian and US waters, Koopman (1994) found that the blubber thickness varied per position on the body and per reproductive class of animals. Calves had thicker blubber than all other reproductive classes. Non-lactating females and immature females had blubber thicknesses that were slightly thinner than
258

Blubber thickness
that of calves. The blubber of immature males was thinner still. In general, lactating females had the thinnest blubber.
Topographical distribution of blubber The large variation in the blubber thickness measurements just above the pectoral fin could have been caused by the posture of the pectoral fin. In bottlenose dolphins, blubber thickness was not measured above the pectoral fin because reliable measurements could not be made there (Terrie Williams, pers. comm.). Although the pectoral fins of harbour porpoises are located more laterally than those of bottlenose dolphins, it is possible that the blubber thickness at the shoulder area was influenced by the posture of the pectoral fin when the animals were lying on the mattress, especially if they lay slightly to one side. Therefore future studies should probably not include this measurement.
In general, in males, the blubber was thickest just anterior to the dorsal fin and thinnest lateral of the tailstock. This pattern was also seen in transverse sections of a female harbour porpoise from the North Sea (Kastelein et ah, 1997 b), in a male harbour porpoise from the North Sea (Parry, 1949), and in 85 harbour porpoises from Canadian and US waters (Koopman, 1994).
The within-animal variability in blubber thickness is confounded by 2 factors. Firstly, measurements were taken over variable time periods (this resulted in different sample sizes), and secondly, the 6 animals used in the study were different sizes. The variation in blubber thickness in the younger animals may have been due to thickness changes incurred in growth. Adult male 031's blubber thickness varied less, but this is perhaps a result of the shorter measurement period.
The thickest blubber layer in harbour porpoises is found on the dorsal side of the centre of the tailstock (Parry, 1949; Koopman, 1994; Kastelein et al., 1997 b), a position in which the blubber thickness could not be measured with the equipment used in the present study. In a much larger odontocete, the beluga (Delphinapterus leucas), the blubber is also thickest on the dorsal aspect of the tailstock (Doidge, 1990).
The mean blubber thickness in a particular position was most variable between individuals in the thoracic and abdominal region and least variable in the tailstock. This suggests that energy is stored as adipose tissue mainly in the rostral part of the body. This was also found by Koopman (1994) in harbour porpoises from Canadian and US waters. She describes the blubber composition on the tailstock as homogenous, whereas on the rest of the body it was composed of at least 2 layers. The inner layer is thought to be mainly used for energy storage and the outer, more inert, layer for thermal insulation (Ackman et al, 1975; West et al, 1979; Koopman et al, 1996). Koopman (1994) concluded that harbour porpoises do not use the blubber in the tailstock as an energy source. However, the blubber layer lateral of the tailstock of the female in the present study decreased when her body weight decreased much. This suggests that once the more readily-available blubber has been depleted, the blubber in the tailstock will be used.
Blubber thickness relative to body size Due to the small sample size of the present study, any trends between body size and average blubber thickness may have been obscured by constitutional differences between individual animals. In the present study, animal 036 with the relatively thin blubber layer ate much more than animal
259

R.A. Kastelein et al.
30
E 25 E to
<u 20 c u E - 15 L. 0)
§ 1 0
A. Female 037 •Pectoral fin dorsal - Pectoral fin lateral
I I I I 1 *T 1 I
M A M J A S O N D F M A M J A S
3 0 i • B. Female 037
E E *" w (A 0> c
JC u
£
*-» h_
tt) A A 3
m
25
20
15
10
- ° - Rostral dorsal fin dorsal - ° - Rostral dorsal fin lateral -*- Rostral dorsal fin ventral
— i 1 1 1 1 i 1 i i i i 1 1 1 1 1 1 1 1
M A M J J A S O N D J F M A M J J A S
1994 1995 To Neeltje Jans harbour
(21 April)
Month
260
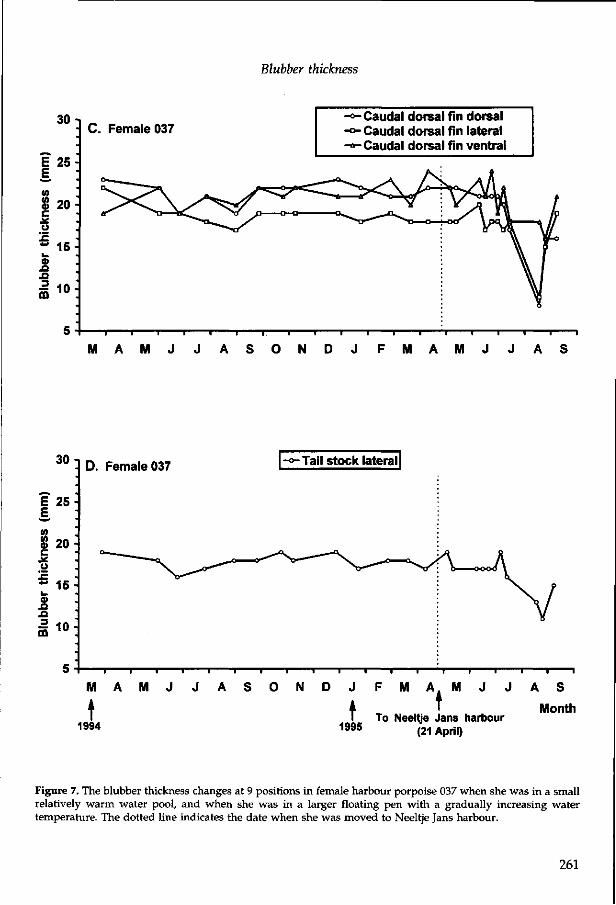
Blubber thickness
30
E 25 E CO
<D 20 c
JC o
*• 15 JQ
• C. Female 037 -°-Caudal dorsal fin dorsal - ° - Caudal dorsal fin lateral -"-Caudal dorsal fin ventral
M A M J A S O N D J F M A M J A S
30
E 25 E (A <0 i n 0) 20 c o !c - 15 a> ja OQ
D. Female 037
— i 1 1 1 i i 1 i i 1 i 1 1 i 1 1 i i i
M A M J J A S O N D J F M A M J J A S
Month 1994 1995
To Neeltje Jans harbour (21 April)
Figure 7. The blubber thickness changes at 9 positions in female harbour porpoise 037 when she was in a small relatively warm water pool, and when she was in a larger floating pen with a gradually increasing water temperature. The dotted line indicates the date when she was moved to Neeltje Jans harbour.
261

R.A. Kastelein et al.
030 with the relatively thick blubber layer, while both animals had a similar body weight and showed similar activity levels. Perhaps the thin blubber layer of animal 036 insulated the animal less than the thicker layer of animal 030.
In 40 incidentally caught harbour porpoises in Norwegian waters, the proportion of blubber decreased as body weight increased (Ryg et al., 1993). This phenomenon was also observed in stranded and bycaught animals from British waters (Lockyer, 1995). In 85 robust harbour porpoises from Canadian and US waters, average blubber thickness of calves was thicker than that of adults (Koopman, 1994).
Kleinenberg (1956) studied harbour porpoises from the Black Sea which consisted of 40% blubber. However, he does not state the body weight and age of the animals investigated. According to Slijper (1958), the blubber layer of 5 juvenile harbour porpoises from the Baltic weighed on average 45% of the total body weight. The blubber and flippers of a 9-day-old robust (7.50 kg) male harbour porpoise from Danish waters, which died at the Harderwijk Marine Mammal Park, weighed 3.65 kg. This is 49% of the animal's body weight (Kastelein, unpubl. data). The large proportion of blubber in this very young harbour porpoise calf is probably an adaptation to its small body size and low water temperatures.
The decrease in mean blubber layer thickness with increasing body size could be related to a reduced need for insulation in the larger animals. The larger the body mass, the smaller the body surface to body weight ratio, and thus the smaller the area which is in contact with the surrounding water (Lockyer, 1995). However, the reduction in mean blubber thickness could also be
due to an increase on insulative quality of the blubber as the animals grow older. Lockyer (1995) found an average lipid content of 83-87% of wet weight blubber tissue for all classes of (stranded and bycaught) animals except neonates (< 90 cm). Neonates were sampled mainly during July and their blubber had a lipid content of only 68%.
Blubber thickness relative to water temperature Williams and Friedl (1990) showed that in bottlenose dolphins the blubber layer thickness adapts to water temperature as quickly as 2 mm per month. This phenomenon was not seen in the present study. However, any effect of water temperature on blubber thickness may have been obscured by the small temperature range that the animals of the present study experienced, the short time that they were exposed to each temperature, the fact that almost all animals were growing (which led to blubber thickness changes), and the measurement accuracy. An animal's weight can also be influenced by its exercise level, which may vary from day to day.
In addition to thickness variations, the composition (lipid content) and thus the insulating capacity of the blubber may change over time (Worthy and Edwards, 1990; Williams et al., 1992), which could not be determined with the measurement technique of the present study. Also, due to the small sample size, individual constitutional differences in body shape and composition, may have obscured potential temperature effects on blubber thickness.
Rate of blubber thickness change The quick and large decrease in mean blubber thickness of the female porpoise at Neeltje Jans harbour in the second half of July and the beginning of August was thought to be due to an increase in activity
262

Blubber thickness
level, since her food consumption gradually increased by about 10% and the water temperature increased by a few degrees Celsius in that period. By mid-July she began to chase the small (approximately 7 cm long) herring (Clupea harengus) in the floating pen, and evidently lost more energy than she gained. When her food ration was increased (she was allowed to eat at lib.), her mean blubber thickness (and resulting body mass) was quickly restored. Spotte et al. (1978) described a live stranded harbour porpoise that increased in body weight from 27 kg to 42 kg in 8.5 months (on average 60 g/day), while the body length remained 148 cm. Adult animals of the same length can differ in weight by as much as 25 kg (M0I1I-Hansen, 1954). Kastelein et al. (1990) also observed large body weight fluctuations in rehabilitated harbour porpoises from the North Sea confirming the findings of Andersen (1965). These observations show that the mean blubber thickness of harbour porpoises can change quickly. This is necessary as the species lives in cold water. If food is not available in sufficient amounts, the animals will begin to use their energy deposits in the blubber. This puts them in a downward spiral, as with the decrease in thickness the thermal insulation of the layer is decreased and thus the animals lose much energy to the environment. Therefore it is important for harbour porpoises to be able to quickly restore their blubber layer when more food becomes available.
Ecological significance The blubber in the thoracic and abdominal region of harbour porpoises keeps the viscera warm, and probably functions as an energy depot. The blubber of harbour porpoises has a high insulative quality (Worthy and Edwards, 1990). Koopman (1994) calculated that the blubber of a harbour porpoise contains enough energy to keep a porpoise
alive for 3 to 5 days without eating. This potential period of fasting may depend on the porpoise's age and initial physical condition. Experience at the Harderwijk Marine Mammal Park with live rehabilitated, usually young animals, suggests that a 1 to 2 year-old harbour porpoise has a maximum life expectancy of 3 days without food in water of around 20°C. A normally looking animal can develop a "neck" when not eating for one day, the second day without eating, the skin lateral of the dorsal fin changes from bulging to being concave. The third day the animal becomes hypothermic. When using only body tissues as an energy source, harbour porpoises quickly lose much weight relative to their body weight.
Based on observations of bycaught animals in Canadian and U.S. waters, Koopman (1994) found that in general lactating female harbour porpoises had the thinnest blubber of all reproductive classes of animals. M0M-Hansen (1954) reported that in harbour porpoises from the Baltic, the blubber was generally thinnest in pregnant and lactating females. Based on a small sample of stranded and bycaught harbour porpoises Lockyer (1995) found that pregnant females are heavier and fatter, and that lactating females are lighter and leaner than anoestrus females. These studies suggest that during lactation, when energy demands are high, females have to convert part of their blubber into milk. Mature harbour porpoises are pregnant and lactating most of the year, and may use the months between lactation periods to store extra energy. During lactation and care for the calf they might not be able to eat as much as during non-lactating periods. In another cold-water small odontocete, the Commerson's dolphin (Cephalorhynchus commersonii), the female's food consumption remains normal during gestation, but increases strongly immediate-
263

R.A. Kastelein et al.
ly after delivery (Kastelein et al, 1993). This suggests that, in this species, females do not build up sufficient fat reserves to cover the extra energy demands during lactation, but for a large degree depend on sufficient food availability after delivery.
The relatively thin blubber layer in the tailstock and its relatively even thickness found in the present study suggests that it is less used for energy storage and may have other functions. The blubber of the tailstock seems to have a mainly biomechanical function in swimming, as it resists deformation through a weave of stiff collagen (Parry, 1949; Knospe, 1989) and rubbery elastin fibres which cross at roughly 45° angles. The layer works as a spring, storing elastic strain energy during swimming (Pabst et al, 1995). A benefit of the relatively thin blubber layer lateral of the tailstock is that it allows sufficient cooling of the muscles and tendons involved in swimming.
Acknowledgements
We thank David Carlson of the Renco corporation, Minneapolis, Minnesota, U.S.A. for the information on the Renco Lean-Meater® and Whitlow Au (Hawaii Institute of Marine Biology, University of Hawaii, U.S.A.) for determining the sound spectrum of the Renco Lean-Meater®. Krijn Saman of the Hydro-Meteo-Centrum-Zeeland, Mid-delburg provided the water temperatures in the Oosterschelde and the graphs were made by Rob Triesscheijn. We thank Terrie Williams (Long Marine Laboratory, University of California Santa Cruz), Heather Koopman (Duke University, U.S.A.), Nicole Schooneman (HMMP), Janny Hardeman (HMMP), Nancy Vaughan (HMMP) and the editors Andrew Read (Duke University, School of The Environment, Marine Laboratory, U.S.A.), Piet
Wiepkema (Wageningen Agricultural University, The Netherlands) and Paul Nachtigall (Hawaii Institute of Marine Biology, University of Hawaii, U.S.A.) for their constructive comments on the manuscript. Nancy Vaughan also carried out the statistical analysis.
References
Ackman, R.G., Hingley, J.H., Eaton, C.A., Sipos, J.C. and Mitchell, E.D. (1975) Blubber fat deposition in mysticeti whales. Can. J. Zool. 53, 1332-1339.
Altman, D.G. (1991) Practical Statistics for Medical Research. London, Chapman and Hall.
Andersen, S. (1965) L'alimentation du Marsouin (Phocoena phocoena, L. en captivite. Vie et milieu 16A, 799-810.
Braun, M. (1905) Einiges iiber Phocaena communis. Less. Zool. Anz. 29, 145-149.
Doidge, D.W. (1990). Integumentary heat loss and blubber distribution in the beluga (Delphinapterus leucas), with comparisons to the narwhal (Monodon monoceros). In: Advances in research on the beluga whale (Delphinapterus leucas), (Eds. Smith, T.G., St. Aubin, D.J. and Geraci, J.R.). Can. Bull. Fish. Aquat. Sci. 224, 129-140.
Eisner, R., Pirie, J., Kenney, D.D. and Schemmer, S. (1974) Functional circulatory anatomy of cetacean appendages. In: Functional anatomy of marine mammals. Vol. 2 (Ed. Harrison, R.J.) Academic Press, New York and London, 143-160.
Gaskin, D.E. (1992) Status of the harbour porpoise, Phocoena phocoena, in Canada. Canadian Field-Naturalist 106, 36-54.
264

Blubber thickness
Gaskin, D.E., Smit, G.J.D., Watson, A.P., Yasui, W.Y. and Yurick, D.B. (1984) Reproduction in the Porpoises (Phocoenidae): Implications for management. In: Reproduction in whales, dolphins and porpoises (Eds. Perrin, W.F., Brownell, R.L. Jr. and DeMaster, D.P.). Rep. Int. Whal. Commn. Special Issue 6, 135-148.
Harrison, R.J. and Thurley, K.W. (1974) Structure of the epidermis of Tursiops, Orcinus, and Phocoena. In: Functional anatomy of marine mammals, Vol. 2 (Ed. Harrison, R.J.), Academic Press, New York, 45-72.
Hokkanen, J.E.I. (1990) Temperature regulation of marine mammals. J. Theor. Biol. 145, 465-485.
Irving, L. (1970) Morpho-physiological adaptations in marine mammals for life in Polar Areas. In: Antarctic ecology (Ed. Holdgate, M.W.), 445-463.
Kanwisher, J. and Sundnes, G. (1965) Physiology of a small cetacean. Hvalradets Skrift, 48, 45-53.
Kastelein, R.A. and Battum, R. van (1990) The relationship between body weight and morphological measurements in Harbour porpoises (Phocoena phocoena) from the North Sea. Aquatic Mammals 16(2), 48-52.
Kastelein, R.A., Bakker, M.J. and Dokter, T. (1990) The medical treatment of 3 stranded Harbour porpoises (Phocoena phocoena). Aquatic Mammals 15(4), 181-202.
Kastelein, R.A., McBain, J., Neurohr, B., Mohri, M., Saijo, S., Wakabayashi, I. and Wiepkema, P.R. (1993) Food consumption of Commerson's dolphins (Cephalorhynchus commersonii). Aquatic Mammals 19(2), 99-121.
Kastelein, R.A., Bakker, M.J. and Staal, C. (1997 a, this volume) The rehabilitation and release of stranded harbour porpoises (Phocoena phocoena). In: The biology of the harbour porpoise (Eds. Read, A.J., Wiepkema, P.R. and Nachtigall, P.E.). De Spil Publishers, Woerden, The Netherlands, 9-61.
Kastelein, R.A., Dubbeldam, J.L., Luksenburg, J., Staal, C , Immerseel, F. (1997 b, this volume) An anatomical atlas of an adult female harbour porpoise (Phocoena phocoena). In: The biology of the harbour porpoise (Eds. Read, A.J., Wiepkema, P.R. and Nachtigall, P.E.). De Spil Publishers, Woerden, The Netherlands, 87-178.
Kastelein, R.A., Hardeman, J. and Boer, H. (1997 c, this volume) Food consumption and body weight of harbour porpoises (Phocoena phocoena). In: The biology of the harbour porpoise (Eds. Read, A.J., Wiepkema, P.R. and Nachtigall, P.E.). De Spil Publishers, Woerden, The Netherlands, 217-233.
Kastelein, R.A., Koene, P., Nieuwstraten, S.H. and Labberte, S. (1997 d, this volume) Skin surface temperature changes in a harbour porpoise (Phocoena phocoena) while on land. In: The biology of the harbour porpoise (Eds. Read, A.J., Wiepkema, P.R. and Nachtigall, P.E.). De Spil Publishers, Woerden, The Netherlands, 255-264.
Kleinenberg, S.E. (1956) Mammals of the Black Sea and Sea of Azow (in Russian). Inst. Morphol. Acad. Sci. U.S.S.R.. Moskow.
Knospe, C. (1989) Zur Wasseranpassung der Walhaut. Anat. Histol. Embryol. 18,193-198. Koopman, H.N. (1994) Topographical distribution and fatty acid composition of blubber in the Harbour porpoise, Phocoena phocoena. Masters thesis, University of Guelph, Canada.
265

R.A. Kastelein et al.
Koopman, H.N., Iverson, S.J. and Gaskin, D.E. (1996) Stratification and age-related differences in blubber fatty acids of the male harbour porpoise (Phocoena phocoena). J. Comp. Physiol. B. 165, 628-639.
Lockyer, C. (1995) Aspects of the morphology, body fat condition and biology of the Harbour porpoise, Phocoena phocoena, in British waters. In: The biology of the Phocoenids (Eds. Bjerge, A. and Donovan, G.P.). Rep. Int. Whal. Commn. 16, 199-209.
Mjahl-Hansen, U. (1954) Investigations on reproduction and growth of the porpoise (Phocoena phocoena) [L.]) from the Baltic. Vidensk. Medd. fra. Dansk Naturh. Foren. Bd. 166, 369-396.
Pabst, D.A., McLellan, W.A., Gosline, J.G. and Piermarini, P.M. (1995) Functional morphology of dolphin blubber. Abstract of the 11th Biennial Conference on the Biology of Marine Mammals, Orlando, Florida.
Parry, D.A. (1949) The structure of whale blubber, and a discussion of its thermal properties. J. Microsc. Sci. 90, 13-25.
Read, A. J. (1990) Estimation of body condition in harbour porpoises, Phocoena phocoena. Can. J. of Zool. 68, 1962-1966.
Ridgway, S.H. and Carder, D.A. (1990) Tactile sensitivity, somatosensory responses, skin vibrations, and skin surface ridges of the Bottlenose dolphin, Tursiops truncatus. In: Sensory Abilities of Cetaceans (Eds. Thomas, J.A. and Kastelein, R.A.). Plenum Press, New York, 163-179.
Ryg, M., Smith, T.G. and Oritsland, N.A. (1988) Thermal significance of the topographical distribution of blubber in ringed seals (Phoca hispida). Can. J. Fish, and Aquat. Sci. 45, 985-992.
Ryg, M., Lydersen, C, Knutsen L.0., Bj0rge, A., Smith, T.G. and 0ritsland, N.A. (1993) Scaling of insulation in seals and whales. J. Zool. Lond. 230, 193-206.
Scholander, P.F. and Schevill, W.E. (1955) Counter-current vascular heat exchange in the fins of whales. J. Appl. Physiol. 8, 279-282.
Slijper, E.J. (1958) Organ weights and symmetry problems in porpoises and seals. Arch. Neerl. Zool. 13(1), 97-113.
Sokolov, V. and Kalashnikova, M. (1971) The ultrastructure of epidermal cells in Phocoena phocoena. In: Investigations on cetacea. Vol. 3, part 2 (Ed. Pilleri, G.). Inst, of Brain Anat. Univ. of Berne, 194-199.
Spotte, S., Dunn, J.L., Kezer, L.E. and Heard, F.M. (1978) Notes on the care of a beach-stranded Harbour porpoise (Phocoena phocoena). Cetology 32, 1-5.
Utrecht, W.L. van (1960) Einige Notizen iiber Gewicht und Lange von Schweins-walen (Phocoena phocoena) aus der Nord-und Ostsee. Z. Saugetierk. Mitt. 8, 142-144.
West, G.C., Burns, J.J. and Modafferi, M. (1979) Fatty acid composition of Pacific walrus skin and blubber fats. Can. J. of Zool. 57, 1249-1255.
Ryan, B.F. and Joiner, B.L. (1994) Minitab Handbook (3rd edition). Wadsworth Publishing Company, Belmont, California.
Williams, T.M. and Friedl, W.A. (1990) Heat flow properties of dolphin blubber: insulating warm bodies in cold water. American Zool. 30(4), 191.
266

Blubber thickness
Williams, T.M., Haun, J.E., Friedl, W.A., Hall, R.W. and Bivens, L.W. (1992) Assessing the thermal limits of bottlenose dolphins: a cooperative study by trainers, scientists, and animals. I.M.A.T.A. Soundings Fall 1992, 16-17.
Worthy, G.A.J, and Edwards, E.F. (1990) Morphometric and Biochemical factors
affecting heat loss in a small temperate cetacean (Phocoena phocoena) and a small tropical cetacean (Stenella attenuata). Physiological Zoology 63(2), 432-442.
Zar, J.H. (1984) Biostatistical Analysis (2nd edition). Prentice Hall, Englewood Cliffs, New Jersey.
267

Chapter 2.17
Aquatic Mammals 1990,15.4, 181-202
The medical treatment of 3 stranded Harbour porpoises (Phocoena phocoena)
R. A. Kastelein, M. J. Bakker* and T. Dokter
Zeedierenpark Harderwijk (Harderwijk Marine Mammal Park), Strandboulevard-oosl I, 3841 AB, Harderwijk, Holland * Veterinary practice, Verkeersweg 29,3842 LD Harderwijk, Holland
Summary
In March 1988 three Harbour porpoises (Phocoena phocoena) were stranded on the Dutch coast and sent to the Harderwijk Marine Mammal Park for rehabilitation. The following parameters were recorded during their stay at the park: blood parameters, medication, parasites, health changes, weight and length changes, wound healing, food consumption, digestion, respiration rate and behaviour. The possible cause of the stranding and the amount of labour needed for the rehabilitation are discussed. After treatment, in November 1988, two of the animals were released into the North sea.
Introduction
Every year cetaceans are stranded on the Dutch coast. Approximately 80% of these animals are Harbour porpoises, Phocoena phocoena (Table 1). The carcasses of animals which die at sea and are later washed up onto the beach, are sent to the Natural History Museum of Leiden where the cause
Table 1. Total number of standings of Harbour porpoises on the Dutch coast between 1970 and 1986 (Husson & van Bree, 1972, 1976; van Bree & Husson, 1974; van Bree & Smeenk, 1978, 1982; Smeenk, 1986, 1988, 1989). *Live stranding treated at the Harderwijk Park. ""Treated animals. tLive stranding treated at Zandvoort
Date
1970 1971 1972 1973 1974 1975 1976 1977 1978
Number
17 13* 18* 26 7
16 14 22f 26**
Date
1979 1980 1981 1982 1983 1984 1985 1986
Number
15 13* 33* 20*t 26 19* 28** 19
of death is determined if possible, and parts of the body are preserved for further study.
Live stranded animals are reported to the Harderwijk Marine Mammal Park, which is the rehabilitation centre for stranded cetaceans on the Dutch coast. Several cetaceans stranded alive between 1971 and 1985, many of which died before or during transport to Harderwijk (Table 2). The survival chance of stranded cetaceans is small; often they have been out of the water for a long time and are dehydrated, and they are usually very sick. Additional stress is caused by contact with humans, by mechanical noises around them, and the total loss of control of their situation.
Because of these problems the Harderwijk Park's transport equipment was improved at the beginning of 1986. The equipment now consists of: stretchers that can be modified for cetaceans of different sizes; buckets; water containers; rope; a pocket-knife; a water spray system; towels, sponges; zinc oxide ointment; a stomach tube; a funnel; a first aid kit and overalls. All these items are packed in a polyesterized plywood transport box with a foam rubber lining. To improve comparisons between treatments, standardized forms have been designed which are filled in during the treatment and give detailed records. All this equipment is packed in such a way that it can be put into a transport van within minutes of a live stranding alarm.
For more than 2 years after this transport kit was assembled no live strandings were reported. Then 3 live Harbour porpoises stranded within a period of 17 days in March 1988. This article is about the treatment of these animals and contains additional information gathered during their stay at the Harderwijk Marine Mammal Park.
Materials and methods Study animals This study was carried out during the rehabilitation of 3 Harbour porpoises (Phocoena phocoena) that were stranded on the Dutch coast in March 1988 (Table 3).
269

R.A. Kastelein et al.
Table 2. Beached cetaceans treated at the Harderwijk Park between 1971 and 1985. H = coast of Holland, B = coast of Belgium, W.G.= coast of West Germany. Ph.ph = Phocoena phocoena; La.al = Lagenorhynchus albirostris; La.ac.= Lagenorhynchus acutus
Year
1971 1972 1973 1973 1978 1978 1980 1981 1982 1982 1984 1985 1985 1985
Location
H H B H H H H H H H
W.G. H H H
Species
Ph.ph Ph.ph Ph.ph La.al Ph.ph Ph.ph Ph.ph Ph.ph Ph.ph La.al Ph.ph Ph.ph Ph.ph La.ac
Date of arrival at the park
26 Feb — —
7 April 11 June 6 Nov 78
27 Dec 12 June 27 Apr 13 Aug 28 June 16 Mar 17 July 24 Dec
Date of
death
16 Mar 22 Aug 28 Nov 7 April 7 Aug
26 May 79 30 Dec
— 28 June 22 Aug 2 July —
18 July 30 Dec
Date of
release
— — — — — —
27 July — — —
16 Mar — —
Total days
treatment
18 0 0 0
57 201
3 45 62 9 5 0 2 6
Remarks
Died during transportation Died before transportation Died during transportation
Direct release
Table 3. The date and place of stranding, and estimated age of the 3 Harbour porpoises which stranded on the Dutch coast
Date of Place of Estimated Code Sex stranding stranding year of birth
PpSH012 PpSH013 PpSH014
F M M
10-3-8 22-3-8 27-3-8
Ameland Moddergat Ternaard
1987 1973 1982
Study area During the first period (between 10-3-88 and 16-6-88), the animals were kept in a circular pool (diameter: 6 m, depth: 1 m). The water of the pool was separated from the other pools in the park. The temperature of the chlorinated salt (2.4%) water varied between 17 and 20°C. The area around the pool was artificially lit 24 hours per day. Through a window in the ceiling additional daylight could enter the area. On 16-6-88 the animals were transferred into a rectangular pool (8 m x 3 m; depth: 1 m) which also had a separate water treatment system (Fig. 1). Shallow pools, preferably with sloping bottoms so that the animals can beach themselves, are very useful for rehabilitating stranded cetaceans, since they facilitate handling and treatment (Bain, 1981). Shallow pools seem to slow down the swimming speed of newly arrived Harbour porpoises and thus avoid possible collison with obstacles (Andersen, 1976).
Treatment When stranded animals arrive at the park, they usually have to be put into a hammock. A hammock serves several purposes: (1) it keeps the blowhole above the water so that the animal cannot drown, (2) it still keeps most of the body submerged and so prevents overheating and dehydration (body parts that extend above the water line are treated with zinc oxide ointment to prevent dehydration) and (3) it prevents the animals from swimming against the sides of the pool. The animals should be kept in a hammock for as short a time as possible, since their muscles become stiff due to lack of exercise (Gage, 1982). When the animals are released from a hammock, round-the-clock observers are usually needed to intervene if necessary.
Weight and length recording The animals were weighed in two ways: either they were held in the arms of a person who then stood on a domestic weighing machine, or the animals were placed on a professional digital weighing machine. The length of the animals was measured along the body surface, on the dorsal side, in a straight line from the tip of the upper jaw to the deepest part of the fluke notch. This way the length measurements were slightly influenced by the animal's movements.
Drugs The trade name, producer, and generic name of drugs mentioned in the text are listed below. The dosages of these drugs are shown in Figures 3, 9 and 10.
270

The medical treatment of stranded Harbour porpoises
Figure 1. The 3 Harbour porpoises in the rectangular pool.
Lacrybiotic (R) by Vetoquinol (chloramphenicol, neomycin, vit A); Synulox (R) by Beecham (amoxycillin and clavulanic acid); Stesolid (R) by Dumex (diazepam); Solu-delta-cortef (R) by Upjohn (prednisolone-Na-succinate); Aureomycin-spray by Cyanamid (chlortetracycline and gentian violet); Seavit (R) by Aesculaap (marine mammal vitamins); L-Ripercol (R) by Janssen (levamisole); O.R.S. (oral rehydration salts) (R) by Nutricia (Na, K, CI, HC03 and glucose); Isogel (R) by Allen and Hanburys Ltd (Ispaghula Husk B.P.); Argentii nitras by Braun Melsungen AG; Duoderm (R) by Squibb (hydro-active wound-dressing); Droncit (R) by Bayer (praziquantel), Clamoxyl (R) by Beecham (amoxycillin); Aluspray (R) by Vetoquinol (micronised aluminium); Cortexilar 50 (R) by Syntex (flu-methasone) and Decadron (R) by Frosst (dexa-methasone); Zinc oxide ointment by Interstate Drug Exchange.
Results
Animal PpSHOl2 Health condition on arrival Animal 012 had severe cuts on both sides of her tailstock and 3 shallow cuts in her rostrum. She was emaciated and dehydrated. She also had a large
abdominal wound which was probably caused by pressure and overheating when lying on the beach. She had well developed marginal papillae on her tongue (Fig. 2), which is a sign of young age (Kastelein & Dubbeldam, 1990).
Treatment Before transport from the beach to the Harderwijk Park, the animal was given Stesolid (R) per rectum to reduce the stress of transport, and an injection of Solu-delta-cortef (R) to suppress shock effects (Fig. 3A). After arrival at the park, the animal was given an antibiotic injection and luke warm water with O.R.S. (R) (oral rehydration salts) to rehydrate the animal. When the animal arrived she had to be kept in a hammock for 3 days before she was able to swim by herself (Fig. 4). Blood was taken from the tail fluke and analysed. The PCV, haemoglobin, and erythrocyte levels were low (Table 4). This could have been caused by a loss of blood through her wounds. Her sodium and potassium levels were high which was probably due to dehydration. To improve these blood values, the animal was given water with O.R.S. (R), vitamins and fish. Most of the liver enzyme levels were high (SCOT, SGPT and LDH), but her AP level was normal which was a strong indication of a liver fluke infection. The animal was first given the antibiotic Clamoxyl (R), later
271

R.A. Kastelein et al.
Figure 2. The mouth cavity of Harbour porpoise 012. The arrow indicates the marginal papillae on the tongue.
gentamicin, which was finally replaced by Synulox (R) which could be administered orally (Fig. 3A).
Parasites Floating faeces were found in the pool and were sent to the laboratory for analysis. They contained lung worms and their eggs (Pseudalius inflexus), unidentified round worms (Ascaridae sp.), and liver fluke eggs (Campula oblongata). Because it was impossible to determine from which animal the faeces came, all three animals were treated in the same way for parasites. The round worms were treated with piperazine. The liver fluke was treated with Droncit (R) which is not the medicine of choice, but we relied on the self-curing capacity of the animals, as they became stronger. The lungworms were treated with L-Ripercol (R). To reduce the reaction of the Harbour
porpoise to the remains of dead worms in the lungs, the animal was given the hormone prednisolone and the antibiotic Synulox (R). Some days after the treatment, dead (dried) lungworms were found against the edge of the pool just above the water level.
Wound healing The skin wound on the abdomen was treated by taking the animal out of the water and by superficially drying the wound with a hair dryer. Then the wound was treated with Aluspray (R) to increase epithelial growth (Fig. 5). Later in the treatment the Aluspray (R) was replaced by Aureomycin-spray (R), an antibiotic which adhered better to the wound. The wound healed perfectly, and very few scars could be seen afterwards (Fig. 6).
272

The medical treatment of stranded Harbour porpoises
DRUGS
ANTIBIOTICS Synutox ® Gentamicin Clamoxyl ®
METHOD OF ADMINISTRATION
PO I I
2dd/8mg/kg 2dd/4mg/kg 2dd/5mg/kg
PERIOD
HORMONES Flumethasone Sokl-delta-cortef ® Prednisolon
I I
PO
0.03 mg/kg once 3mg/kg once 2dd/0.5-1 mg/kg
ANTI-PARASITICA Piperazine Droncit ® L-Ripercol ®
PO PO PO
100 mg/kg once 3+6 mg/kg 1.8+3.6+5 mg/kg
WOUND TREATMENT Duoderm ® Aluspray ® Cod liver ointment Argentil nitras Aureomycjn spray ®
TOP TOP TOP TOP TOP
OTHERS Zinc ointment Stesolid ® Seavit ® Paraffin oil Qr.s. ® Isogel ® Ferrosi-fumaraat
TOP A PO PO PO PO PO
0.3mg/kg 2 dd/1 tablet 1-3dd/tOml 2dd/16gr/0.6l 2dd/1-2gr 2dd/5mg/Kg
belly-
tail.
I l l " wv
I
s If)
Figure 3. Harbour porpoise 012. (A) Medication (PO = oral;
A = anal; TOP = topical; I = injected in muscles).
(B) Healing of wounds. (C) Daily food consumption
(f = force-feeding; s = free-feeding; h = hand-feeding).
(D) Body weight. (E) Respiration rate. (F) Faeces quality. (G) Swimming quality.
I!
10'
normal-
trait
hard
>. normal. £ sometimes 3 underwater o, at surface,
g hammock E *
p s • ri D
jv^r^M
a
if 10 19 29
March 8 18 28
April
J May
273

R.A. Kastelein et al.
Table 4. The blood parameters of Harbour porpoise 012
Parameter
Hematology: Sedimentation in 10 min Sedimentation in 20 min Sedimentation in 30 min Sedimentation in 60 min PVC
Haemoglobin Erythrocytes Leucocytes
Bas. Eos. Band cells Seg. Lym. Mon.
Serum chemistry: Na K Ca Fe Fe binding cap. Phosphate
yGT AP SGOT SGPT LDH CPK
Total Bilirubin Uric acid Urea Creatinin Total protein
Unit
mm mm mm mm 1/1
mmol/1 x 1012/1 x lO'/l
% % % % % %
mmol/1 mmol/1 mmol/1 umol/1 umol/1 mmol/1
U/l U/l U/l U/l U/l U/l
umol/1 mmol/1 mmol/1 Umol/1
g/1
11-03 arrival
0 0 1 1 0.35
7.1 4.1 8.2 0
12 I
76 9 2
161 4.1 2.33 — — 2.14
— — — — — — — —
12.3 37 69
Date
18-03
0 1 2 4 0.36
7.9 4.4
11.0 0 2 0
86 11 1
152 3.0 2.70
11 130 — 48 —
693 242
1135 425
1 — 15.3 22 71
05-04
0 1 1 2 0.48
9.7 4.8 5.1 0 6 1
64 29 0
153 3.7 2.58 — — 2.60
50 140 310 180 800 577
1 0.03
18.7 35 75
28-04
0.5 1 2 2 0.52
10.3 5.1
11.3 0 8 0
76 16 0
155 3.4 2.41 — — —
27 245 299 304
— 279
— —
21.0 34 72
The tailstock wounds and rostrum wounds were treated in the same way, but because granular tissue started to grow through the skin lesions of the tail-stock, this was temporarily wrapped in Duoderm (R) to restrict the formation of granular tissue. Although the Duoderm (R) was beneficial to the healing process, it started to cause small skin abrasions on the dorsal side of the tailstock, so this treatment was replaced by treating the granular tissue with an etching reagent (Silver nitrate). Care was taken to only cauterize the overgrowth of flesh, and not to touch the surrounding skin. The tail-stock healed perfectly, but the pigment did not return to the skin over the scars (Figs. 3B and 7).
Food consumption First the animal had to be force-fed for 2 days (Fig. 3C). This involved taking the animal out of the water and opening the mouth, and pushing Sprats (Sprattus sprattus) deep into the throat (Fig. 8). On the third day after arrival the animal started to bite into 25 cms long Herring (Clupea harengus) that were presented in front of her mouth while the animal was held at the water surface. After biting the animal moved the fish around in the mouth and swallowed it. One day later (4 days after arrival) the animal started to eat Herring that was thrown into the pool. Her food intake increased from an average of around 2 kg a day during the first weeks to around 3.5 kg a
274

The medical treatment of stranded Harbour porpoises
Figure 4. Harbour porpoise 012 in a hammock to prevent drowning. The white colour on the dorsal side is zinc ointment.
Figures. The treatment of the abdominal wound of Harbour porpoise 012 with Aluspray (R).
275

R.A. Kastelein et al.
I I I 0 2 4 6 8 c m
Figure 6. Several healing stages of the abdominal wound of Harbour porpoise 012.
day after 20 days. After 36 days she started to take hand-fed fish. From that moment on her food consumption dropped to 2.5 kg a day, probably because she had to overcome her fear of humans. Later, her food intake increased to around 3 kg a day (Fig. 3C). Although her main diet consisted of Herring she also
accepted 30 cms long Mackerel (Scomber scombrus). During all feeding stages the animal was fed 3 to 4 times a day.
Digestion A few days after arrival the animal showed signs of
276

The medical treatment of stranded Harbour porpoises
1 I I 1 2 4 6 8Cm
Figure 7. The tailstock wounds of Harbour porpoise 012 on arrival (A) and after healing (B).
constipation (Fig. 3F). She regularly stopped swimming and bent her tail towards the bottom of the pool. As a laxative, paraffin oil was given orally by injecting it into the food. Later during the treatment the paraffin oil was replaced by Isogel (R) capsules which were inserted into the gills of the fish. This treatment had to be continued until release (Fig. 3A).
Body weight and body measurements When the animal arrived on March 10 she weighed
16.0 kg and had a body length of 107 cm. By July 6 her weight had increased to 24.5 kg and she measured 117 cm (Fig. 3D).
Respiration rate The respiration rate was monitored 3 times a day for 5 minutes each time. At first the respiration rate of the animal was stable at around 25 inhalations per 5 minutes. From March 30 on it increased to around 35 inhalations per 5 minutes (Fig. 3E). This coincided
277

R.A. Kastelein et al.
Figure 8. The force-feeding of a Harbour porpoise.
with an increase in food consumption followed by an extremely rapid growth (Figs. 3C and 3D).
Behaviour After 3 days in a hammock, the animal spent one day swimming at the surface of the water. The next day she occasionally submerged her head. The 5th day after arrival her swimming pattern was normal, and she spent most of the time under water (Fig. 3G). Around April 23, when the animal was in good condition, she started to become more interested in the other two Harbour porpoises. On April 25 she started to synchronize her swimming and respiration with animal 013. She was the most curious of the three animals, which was probably linked to her young age. She often rotated 360° along her axis when swimming close to the edge of the pool where observers were standing.
The animal was declared healthy on May 18 and medical treatment was stopped.
Animal PpSHOl3 Health condition on arrival Animal 013 had small skin wounds rostral of the dorsal fin. He also had more severe skin lesions around his tailstock. The latter wounds were similar to those seen on animal 012. He was very emaciated
and weak and coughed frequently. The animal was considered to be aged, since the teeth were very blunt (Mehl-Hansen, 1954).
Treatment Before transport the animal was given dexametha-sone to suppress stress effects and Stesolid (R) to sedate the animal for the trip (Fig. 9A). When the animal arrived at the park he was given another injection of dexamethasone and was given luke warm water with O.R.S. (R) before he was placed into a hammock, where he had to stay for 2 days before he was able to swim by himself. Blood was taken and analysed (Table 5). The leucocyte count was relatively high, which indicated an infection. A blowhole culture revealed 4 bacteria (Achromobacter; Pseudomonas luteola; Enterobacter agglomerans; Staphylococcus sp.) which were sensitive to the antibiotic gentamicin. Later, Synulox (R) was administered orally. The iron level was low which could have been caused by a loss of blood from the tailstock (Table 5). The animal was given food and vitamins to restore this deficiency. On May 6, some foaming blood came out the blowhole which was probably due to a mild bleeding somewhere in the respiratory system.
278

The medical treatment of stranded Harbour porpoises
DRUGS
ANTIBIOTICS Synulox ® Gentamicin Lacrybiotic ®
METHOD OF ADMINISTRATION
PO I
TOP
2dd/8mg/kg 2dd/4mg/kg
HORMONES
Predni80lon Dexamethason
PO I
2dd/0.5-1 mg/Kg 0.1mg/kg
ANTI- PARASITICA Plperazine Droncit ® L-Ripercol ®
PO PO PO
100 mg/kg once 3+6 mg/kg 1.8»3.6»5mg/kg
WOUND TREATMENT
Aureomycin spray ®
OTHERS Zinc ointment Stesolld ® Seavlt ® Paraffin oil Ors. ® Isogel ®
TOP A PO PO PO PO
0.3 mg/kg 2 dd/1 tablet 1.3dd/10ml 2do716gr/0.6l 2dd/1-2gr
•y» back
tall
f\K
Figure 9. Harbour porpoise 013. (A) Medication (PO = oral;
A = anal; TOP = topical; I = injected in muscles).
(B) Healing of wounds. (C) Daily food consumption
(f = force-feeding). (D) Body weight. (E) Respiration rate. (F) Faeces quality. (G) Swimming quality.
1 S rr
10
normal
trail
hard
:~~wv r
normal, sometimes underwater'
at surface.
hammock. /
22 31 K) 20 30 10 20
April May
279

R.A. Kastelein et al.
Table 5. The blood parameters of Harbour porpoise 013
Parameter
Haematology: Sedimentation in 10 min Sedimentation in 20 min Sedimentation in 30 min Sedimentation in 60 min PVC
Haemoglobin Erythrocytes Leucocytes
Bas. Eos. Band cells Seg. Lym. Mon.
Serum chemistry: Na K Ca Fe Fe-binding cap. Phosphate
yGT AP SGOT SGPT LDH CPK
Total Bilirubin Uric acid Urea Creatinin Total protein
Unit
mm mm mm mm 1/1
mmol/1 x 10,2/1 x lO'/l
% % % % % %
mmol/1 mmol/1 mmol/1 umol/1 umol/1 mmol/1
U/l U/l U/l U/l U/l U/l
umol/1 mmol/1 mmol/1 umol/1
g/1
22-03 arrival
0 1 2 3 0.47
10.1 5.6
13.6 0 4 0
88 4 4
146 4.7 2.07 6
117 1.46
23 67
290 154 940 146
— 0.04
12.6 63 —
Date
28-03
0 1 2 3 0.46
10.1 5.6
13.9 0
15 3
56 26 0
153 3.9 2.50
39 129 —
29 57
425 160 770 100
5 0.02
15.6 70 74
05-04
0 1 1 2 0.49
10.4 5.6 8.2 0
12 0
55 33 0
150 3.7 2.60
60 186
2.65
36 91
380 241 766 182
2 0.02
19.5 68 82
28-04
0 0 0 0 0.56
11.8 6.5 8.8 0 2 0
73 24
1
157 3.0 2.56
97 143
— 44
147 300 276 668 120
— — 11.4 61 77
Parasites Because it was impossible to say from which animal the faeces with parasites and parasite eggs came, all three animals were treated for these parasites. Lung worms were seen often crawling out of the blowhole of this animal after treatment with L-Ripercol (R). Concurrent with this treatment prednisolon and Synulox (R) were given (Fig. 9A).
Wound healing The wounds on the back were treated with Aureomycin-spray (R). The skin lesions around the tailstock healed quickly without medical assistance (Fig. 9B). In contrast to animal 012 no visual scars remained. Around May 23, an eye infection
(keratitis) appeared which was treated with Lacry-biotic (R), an antibiotic ointment, until June 15 when the infection had disappeared.
Food consumption The animal had problems with eating (Fig. 9C). He had to be force-fed for 69 days after arrival despite many different feeding techniques that were used, such as: decreasing the amount of food fed in order to make the animal hungry (April 20 to May 5); moving dead fish in front of the mouth by hand; moving dead fish on a fishing line through the water; and finally feeding live fish. All attempts failed, but on June 1 the animal suddenly started to eat fish that was thrown into the water to feed the other two animals.
280

The medical treatment of stranded Harbour porpoises
During the first 30 days the animal was fed approximately 3.5 kg a day (Fig. 9C). After that period the food intake was deliberately reduced to 1.5 kg a day in the hope that this would induce the animal to start to eat by itself. Because this attempt was not successful, the food intake was increased to around 2.5 kg a day. After he started to feed himself, the food intake stabilized at around 3 kg a day. During all feeding stages the animal was fed 3 to 4 times a day.
Digestion After a few days the animal showed signs of constipation. The symptoms were the same as seen in animal 012. The animal was given paraffin oil in addition to food. This oil was soon replaced by Isogel (R) which gave better results (Fig. 9A and F).
Body weight and body measurements The animal weighed 35 kg and measured 145 cm when it arrived on March 22. By August 11 his weight had increased to 38.2 kg and the length was the same (Fig. 9D).
Respiration rate The respiration rate of this animal was very high during the first 5 days after arrival (Fig. 8E). This was probably due to respiratory problems caused by lung worms. Later during the treatment period the breathing rate decreased to around 25 inhalations per 5 minutes.
Behaviour The animal had to stay in the hammock during the first 2 days at the park. After that there was a period of 9 days during which he swam or floated at the water surface without diving (Fig. 9G). Then for a period of 26 days he sometimes dived, but still spent a large proportion of the time at the surface. It took 37 days for the animal to show a normal swimming pattern in which only a little time was spent at the surface. This animal was the calmest of the three.
From 14 April 1988 this animal was approached sexually by the other male (PpSH 014) in the pool. From 23 April 1988 onwards he sometimes showed his reaction in an erection.
The animal was declared healthy on 15 June 1988 when medical treatment was stopped.
Animal PpSHO 14 Health condition on arrival Animal 014 had been on the beach for at least one day, since he was first seen the day before transport (but not recovered because he was not recognised as a Harbour porpoise). He was very emaciated and dehydrated. He had a small wound below each eye. These were probably caused by excoriation, since the
lesions were next to the areas where the mucous ran from the eyes. The outer skin layer of the animal was sloughing. The teeth of this animal were very sharp.
Treatment Prior to transport the animal was given Stesolid (R) per rectum to reduce stress. He was also given an injection of dexamethasone and Clamoxyl (R) before he was put into the hammock (Fig. 10A). Blood was taken from the tailstock and analysed. The blood had high PCV, haemoglobin and erythrocyte levels, which is consistent with dehydration (Table 6). The potassium level was also relatively high, which is indicative of muscle damage probably caused by the animal's long stay on the beach.
Parasites The animal was treated for parasites in the same way as animals 012 and 013 (Fig. 10A).
Wound healing The small skin lesions below the eyes healed within 6 days after arrival at the park without medical assistance. No scars remained (Fig. 10B).
Food consumption When the animal did not respond to dead Herring which were thrown into the water in front of his head for 23 days, other measures had to be taken. First, live freshwater fish (Rudd, Scardinius erythrophthalmus) were put into the pool (26 April 1988). The Harbour porpoises hardly reacted to them, and the fish died within 5 minutes in the salt water. The same day two species of marine fish (3 Coalfish, Pollachius virens and 3 Plaice, Pleuronectes platessa) were released into the pool. Within a few minutes animal 014 started to chase the Coalfish and succeeded in catching 2. Then a dead Herring was thrown into the water, and the animal ate it. Even more remarkable was the fact that a second Herring was taken from the hand. Usually it takes a long time to make the transition from free-feeding to hand-feeding. The Plaice were not touched by the Harbour porpoises. On a second occasion (29 April 1988) another species of live marine fish was introduced. This time, Coalfish and Cod (fladus morhud) (both 20 cms long) were released into the pool. Both species were taken by animal 012 and animal 014, while animal 013 did not react to live fish.
Animal 014 was force-fed approximately 3.5 kg a day during the first 10 days after arrival (Fig. 10C). Then the food intake was deliberately reduced to induce the animal to eat by itself. The food intake increased after the animal started to eat dead fish from the water (i.e. after introduction of live fish). Then the food intake dropped for a short period when the animal started to eat from the hand, and eventually stabilized at around 3 kg a day. During all feeding stages the animal was fed 3 to 4 times a day.
281

R.A. Kastelein et al.
DRUGS METHOD OF ADMINISTRATION DOSAGE
ANTIBIOTICS Synulox @
Clamoxyl ®
PO
I
2dd/8mg/kg
2dd/5mg/kg
HORMONES
Predni8olon Daxamfthason
PO I
2dd/O.S-1 mg/kg 0.1 mg/kg
ANTI- PARASITICA Plperazine Dronclt ® L-Ripercol ®
PO PO PO
100 mg/kg once 3*6 mg/kg 1.8*3.6+5 mg/kg
WOUND TREATMENT
OTHERS Zinc ointment Stosolkl ® SeavH ® Paraffin oil Ors. ® Isogel ®
TOP A PO PO PO PO
0.3 mg/kg 2 dd/1 tablet 1-3dd/10ml 2dd/16gr/0.6l 2dd/1-2gr
2 I
Figure 10. Harbour porpoise 014. (A) Medication (PO = oral;
A = anal; TOP=topical; I = injected in muscles).
(B) Healing of wounds. (C) Daily food consumption
(f = force-feeding; s = free-feeding; h = hand-feeding).
(D) Body weight. (E) Respiration rate. (F) Faeces quality. (G) Swimming quality.
15
8 .
8 . I'
1
s 40-
30-
10
normal-
trail
hard
normal -sometimes underwater*
at surface.
hammock
V*V-
Vs
r "T—p-
16 26 April May
282

The medical treatment of stranded Harbour porpoises
Table 6. The blood parameters of Harbour porpoise 014
Parameter
Haematology: Sedimentation in 10 min Sedimentation in 20 min Sedimentation in 30 min Sedimentation in 60 min PVC
Haemoglobin Erythrocytes Leucocytes
Bas. Eos. Band cells Seg. Lym. Mon.
Serum chemistry: Na K Ca Fe Fe-binding cap. Phosphate
yGT AP SGOT SGPT LDH CPK
Total Bilirubin Uric acid Urea Creatinin Total protein
Unit
mm mm mm mm 1/1
mmol/1 x 10,2/1 x lO'/l
% % % % % %
mmol/1 mmol/1 mmol/1 umol/1 umol/1 mmol/1
u/i U/i U/l U/l u/i U/l
umol/1 mmol/1 mmol/1 umol/1
g/1
29-03 arrival
0 0 0 0 0.69
14.2 7.7 6.2
— — — — — —
154 8.3 1.37
— — 1.61
— 53
244 157
1295 458
— —
277 107 79
Date
05-04
0 0 1 2 0.53
11.6 6.0 5.8 0 8 0
61 30 I
154 3.0 2.55
— — 1.54
290 339
1920 970
2470 422
7 0.02
144 55 73
28-04
0 0 0 0 0.62
12.4 6.8 6.0 0
13 0
55 32 0
155 3.2 2.31
36 109 —
131 249 23
270 1371 300
— —
166 40 75
Digestion Like animals 012 and 013, this animal developed constipation, and the problem was solved by administering paraffin oil and later by giving Isogel (R) in capsules in the fish (Fig. 10A and F).
Respiration rate The respiration rate was high during the first 5 days after arrival (Fig. 10E), but decreased later and levelled off around 20 inhalations per 5 minutes.
Body weight and body measurements The animal measured 139 cm and weighed 29.0 kg when it arrived on March 28. On May 17 his weight
had increased to 32 kg and he had a body length of 139 cm (Fig. 10D).
Behaviour The animal only had to stay in the hammock for 2 days after he arrived at the park (Fig. 10G). After that, he swam at the surface for 2 days and then started to dive periodically. His swimming behaviour was normal 26 days after arrival at the park.
Each time, when animal 013 had to be taken out of the water for treatment or weighing, animal 014 forcefully swam above his poolmate and showed, what looked like, sexual behaviour. A penis erection was also often observed when the animal was handled by the keepers (Fig. 11).
283

R.A. Kastelein et al.
•20 cm
Figure 11. The penis erection of animal 014 during handling.
The animal was declared healthy on 17 May 1988 after which medical treatment was stopped on that date.
Discussion and conclusions Cause of stranding Although nothing can be said with certainty, the sharp cuts in the tail-stocks of animal 012 and 013 seem to indicate entanglement in fishing nets. Maybe the animals inhaled water during the entanglement and/or were afterwards unable to catch fish because of the pain in their tail-stock. The fact that many Harbour porpoises are drowned or injured in fishing nets has been documented by several authors (Andersen, 1966, 1974*, 1978; Smith et al., 1983; Gaskin, 1984). Such accidents are probably the main threat to this species.
Area of stranding During the period in which these 3 Harbour porpoises were stranded, 5 more, but dead, Harbour porpoises were stranded on the Dutch coast (Smeenk, 1988). All animals in the present study came from the same area on the north coast of Holland. This is an area in which a relatively high density of Harbour porpoises is seen during aerial
surveys (Baptist, 1988). The animals probably drifted towards the same area on the coast in a particular current. The idea of them passively drifting to the beach is supported by observations in the circular pool. In the beginning, when the animals were just fit enough to be taken out of the hammock, they could not swim against the weak circular current in this pool.
Treatment Stress of capture and/or first contact with humans can cause illness to cetaceans in some cases (Dudok van Heel, 1962; Stuntz & Shay, 1979). Andersen (19746) reports that many Harbour porpoises died during transport from the fishing nets to the holding facility. Therefore the animals in this study were given Stesolid (R)per rectum to reduce stress prior to transport. This drug was successfully used by Krabbe (1987) on Harbour porpoises that were accidentally caught in fishing gear in Danish waters. It is also important to be gentle with the animals during transport and treatment (Bain, 1981).
Animal 014 died of an infection of Erysipelothrix rhusiopathiae. This disease was previously suspected in Harbour porpoises by Andersen (19746), and can be successfully treated with penicillin and semi-
284

The medical treatment of stranded Harbour porpoises
synthetic penicillins if diagnosed soon enough (Ridgway, 1972).
However, animal 014 did not give any warning except for a reduction in food intake the day before death. The total PCB concentrations in the fat (8.99 ppm), liver (8.55 ppm), muscle (9.20 ppm) and kidney (7.22 ppm) tissue were very low, and could not have affected the health of the animal (Reijnders, 1989).
The fact that the 3 animals were treated in the same pool was probably a very positive factor that increased the chances of survival. It is our experience that dolphins are usually calmer when they are put into a new environment in pairs. Bain (1981) discussed the successful rehabilitation of 1 stranded Common dolphin (Delphinus delphis) and 2 Pacific white-sided dolphins (Lagenorhynchus obliquidens) and noted that the treatment of the animals in the same tank was probably the main factor in their recovery.
Parasites Some lungworms were still present at the time of the necropsy on animal 014. In the future, Harbour porpoises carrying lungworms should be treated daily with Droncit (R) for at least 2 months (starting with 0.5 mg/kg during the first week, then 3 weeks 1 mg/kg, later 2 mg/kg) in order to remove all lung worms (Neurohr, 1988).
The lung nematode Pseudalius inflexus, and the liver trematode Campula oblongata seen in the present study were the same ones as found by Andersen (1966, 1974ft) in Harbour porpoises from Danish waters and by Balbuena et al. (1987) in French waters.
Blood samples Usually it is not difficult to obtain a blood sample from the ventral side of the tail fluke of Harbour porpoises. The sample is taken from the centre of a fluke where there are both arteries and veins (Eisner et al., 1974). Usually, putting the animal back into the water is enough to stop bleeding after sampling. Through vasoconstriction the blood pressure then drops, and the bleeding stops.
The values of the blood parameters of the 3 recovered Harbour porpoises in the present study were within the ranges reported by Andersen (1966) and Nielsen & Andersen (1982).
Wound healing This study showed that even severe wounds can heal well in Harbour porpoises. Even the large abdominal wound of the young animal 012 left virtually no scars after treatment. Often the wounds heal, but the pigmentation will usually not return. This lack of pigment will always remain an indicator of an old wound. Scars were mainly found on adult Harbour
porpoises by van Utrecht (1959). Corkeron et al.. (\9ila,b) described large wounds and scars on Bottlenose dolphins (Tursiops truncatus) which were caused by sharks and by other dolphins. Greenwood et al. (1974) also noted that even deep wounds in cetacean skin heal remarkably quickly, provided the wound does not gape. The wound on the tailstock of animal 012 gaped, so the underlying tissue had to be cauterised daily to prevent granular overgrowth.
The skin of the stranded Harbour porpoises started to slough one day after arrival at the park. This was probably due to several factors: (1) on the beach the upper skin of the animals became dehydrated and over-heated, (2) the animals were put into an environment with perhaps a slightly different salt concentration from the North sea water (although the salt concentration also varies in different parts of the North sea), and (3) the animals were put into chlorinated water. Spotte et al. (1978) also noticed sloughing of the skin on the dorsal surface of a stranded Harbour porpoise that recently arrived at their facility. Harrison & Thurley (1974) showed that rapid drying of the surface of the skin causes a change in the superficial cells of the stratum externum, creating a denser layer which is the stratum corneum. They observed similar changes when a dolphin was put into fresh water for a few days. After a week the skin of the animals in the present study had sloughed and a new shiny skin had appeared.
Food consumption Feeding was done in 4 stages:
(1) force-feeding out of the water, (2) force-feeding while constrained in the water, (3) free-feeding in the water, and (4) feeding from the hand.
For the first few days, the animals were fed out of the water when they had to be investigated and medication had to be administered. However, feeding is usually easier for the animal in the water. After some practice one person can force-feed a Harbour porpoise in the water. The method becomes less stressful for the animal as it gets used to the process. In order to help the animal to make the transition from force-feeding to free-feeding, the food intake was reduced for several days. This technique was successfully used by Andersen (1974a) when he was rearing young (normally suckling) Harbour porpoises. Andersen & Dziedzic (1964) report that healthy Harbour porpoises started accepting fish from the hand one hour to a week after arrival in a pool.
In order to regain a normal body weight the animals ate more during the early stages of recovery. Later their food intake dropped and stabilized. This change in food intake was also observed by Bain (1981) during the rehabilitation period of a Common dolphin (Delphinus delphis) and 2 Pacific White-sided
285

R.A. Kastelein et al.
dolphins (Lagenorhynchus obliquidens). At the end of the recovery period the animals in the present study had the following food intake per day (expressed as percentages of the total body weight):
Animal 012 (young, still growing): 10.4% Animal 013 (adult, not growing) : 7.8% Animal 014 (adult, not growing) : 8.1%
The young female 012 which was still increasing in weight and length, had a relatively high food intake compared to the adult males. In the wild, this animal had probably just started to shift from mother's milk to solid food, since after its recovery it weighed around 25 kg. In the Baltic, Harbour porpoises begin to take solid food when they are about 5 months old and weigh around 25 kg (Mohl-Hansen, 1954). Myers et al. (1978) mention a growing female Harbour porpoise, kept in a 19°C pool, with a daily food consumption of 10.8% of the body weight. This corresponds well with the energy consumption of the female in the present study. Andersen (1965) reports on the food consumption of 8 Harbour porpoises that were kept in an indoor pool (no temperature reported) and that were fed Herring, as in the present study. He found that the adult animals consumed around 8% of their body weight a day, whereas the still growing animals ate around 13% of their body weight a day. Yasui & Gaskin (1987) suggest that a non-lactating adult Harbour porpoise would require about 3.5% of its total body weight per day. This does not seem to be correct, since the animals in the present study were housed in a small pool with relatively warm water (17-20°C) and were fed fish with a relatively high caloric content. Therefore, the daily food intake of adult animals in the wild, which can swim (energy costing) distances of up to 20 km per 24 hours (Read & Gaskin, 1985), should be higher than 8% of the total body weight.
Because of the unfavourable body surface to volume ratio, Harbour porpoises lose much energy through radiation and conduction. To survive in a medium that conducts heat better than air, Harbour porpoises have a relatively thick blubber layer compared to other cetaceans, and a relatively high metabolism compared to other mammals of their size (Kanwisher & Sundnes, 1965). As a comparison: a 1900 kg female Killer whale (Orcinus orca) kept at the Harderwijk Marine Mammal Park on a diet with a lower caloric content than the Harbour porpoises in the present study, consumed only 2.3% of her body weight per day (Kastelein & Vaughan, 1989).
The introduction of live fish into the pool somehow triggered the feeding instincts of animal 014. Strangely, the animal suddenly accepted dead fish during the same feeding session. Spotte et al. (1978) had a very similar experience when feeding 5 cm long live Mummichogs (Fundulus heteroclitus) to a stranded Harbour porpoise. This animal also started
to accept dead fish after an encounter with live prey. Andersen (1976) warns that feeding live fish may postpone the transition to eating thawed fish. This was possibly just a hypothesis unsupported by observations. The animals in the present study did not eat flatfish (Plaice). This has also been previously reported by Verwey (1975). Dudok van Heel (1962) offered freshly killed Eelpout (Zoarces viviparus) and Flounder (Platichthusflesus) to Harbour porpoises; both species were refused. Andersen & Dziedzic (1964) report on Harbour porpoises that ate live Herring and live Eel (Anguilla anguilla). Animals 012 and 014 accepted 20 cm long live Cod, whereas Andersen & Dziedzic (1964) report of Harbour porpoises that swam together with Cod for two months without touching them. Maybe these Codfish were too large to swallow for Harbour porpoises. The animals in the present study were mainly fed on dead Atlantic Herring, which is a major prey species of Harbour porpoises in the Atlantic (Dudok van Heel, 1962; Smith & Gaskin, 1974; Gaskin & Watson, 1985; Watts & Gaskin, 1985). Rae( 1965, 1973) notes that the fish eaten by Harbour porpoises in Scottish waters was predominantly pelagic or semi-pelagic, and that most fish were less than 25 cm long.
Digestion The fact that all three animals showed constipation was probably due to a lack of roughage of the fibres in the thawed fish. Isogel (R) solved the constipation problem much better than paraffin oil. It also made the pool surface, pool side and working area less slippery, since some of the oil-filled fish were regurgitated during force-feeding.
Body weight and body measurements The males 013 and 014 increased in body weight during the recovery period. This was due to an increase of the fat layer thickness and not to a growth in length, since both animals were mature. That an adult animal can change dramatically in weight, was also observed by Spotte et al. (1978). They report on a stranded Harbour porpoise which increased in weight from 27 kg to 42 kg without changing in length (148 cm). Adult animals of the same length can have a weight difference of 25 kg (M0hl-Hansen, 1954). The blubber layer (the epidermis included) of Harbour porpoises from Danish waters can be 45% of the body weight (Slijper, 1958).
The young female 012 grew a great deal both in weight and in length. Her maximum growth rate was 0.24 kg a day during a period with an average food intake of 3.5 kg a day. According to van Utrecht (1978) female Harbour porposes have a slightly higher growth rate than the males. In the North sea, males reach their maximum length around the age of 10 years (average: 146 cm) and females (average:
286

The medical treatment of stranded Harbour porpoises
170 cm) around the age of 14 years (van Utrecht, 1978; Gaskin era/., 1984).
Respiration rate The respiration rate of most odontocetes increases during illness (Bain, 1981). This was also the case with animals 013 and 014 in the present study. Their respiration rates shortly after arrival at the park were almost double the rate they showed after recovery. Animal 012 showed a respiratory rate increase during the period of extreme food intake followed by a fast growth. The average respiratory rate of the female was higher than that of the older males. This was probably due to her age.
A study on the heart rates of these animals (Kastelein & Meijler, 1989) showed respiratory arrhythmia and an increase in average heart rate during the recovery period of animals 012 and 014 as they became more alert. The heart rate of animal 013 was relatively low compared to the other two. This was probably due to his larger body weight. Andersen (1969a) also observed arrhythmia in the heart rates of Harbour porpoises due to respiration. So in dolphins, an irregular heart beat is not a sign of illness as was suggested by Dudock van Heel (1962).
An average respiration rate of around 4 breaths a minute for Harbour porpoises has been observed by several authors (Parker, 1932; Andersen & Dziedzic, 1964; Andersen, 1976; Spotte et al., 1978 and Meyers et al., 1978). These values are roughly the same as in the animals in the present study, after recovery. The breathing rate seems low compared to terrestrial mammals, however, the ventilation in cetaceans is more effective. The tidal volume of a 26 kg Harbour porpoise is 1.85 litres containing 9% oxygen after expiration, compared to 0.4 litres in a 100 kg man containing still 16% oxygen after expiration (Kanwisher & Sundnes, 1964).
Behaviour A few weeks after the animals had been put into the rectangular pool, the dorsal fins of all 3 animals started to bend laterally to the left. This had not happened in the circular pool, and it was probably due to the shape of the pool. The animals usually swam anti-clockwise in both pools when they were not interacting. However, in the rectangular pool the animals could increase their speed on the long side of the pool and then had to make a relatively sharp bend to swim along the short side. The increased drag during this curve probably forced the dorsal fin to bend. Andersen & Dziedzic (1964) also report on the inclination of dorsal fins of Harbour porpoises after they have been in a pool for some time. This phenomenon was also observed in a lactating Bottlenose dolphin (Tursiops truncatus) by Neurohr (1989). The
animal usually showed an irregular swimming pattern, but during lactation she swam anti-clockwise most of the time. During that period her dorsal fin started to bend to the left. The dorsal fin contains no bones, and gets its stiffness from connective tissue and probably also from blood pressure in the circulatory system (Eisner et al., 1974). Changes in dorsal fin posture are probably temporary, and depend on the circumstances.
After the animals in this study had fully recovered from their illnesses, they started to interact with each other. Most of the interactions seemed to be sexual. Fisher & Harrison (1970) found a seasonal testicular activity, reaching a maximum during July and subsiding in late August. Because of these interactions the animals in the present study did not spend much time performing stereotyped motor patterns such as monotonous circle swimming. If stereotyped behaviour appears, it can be dealt with by increasing human attention (Kastelein & Wiepkema, 1988), by increasing the number of poolmates, or by introducing occupational therapies (Amundin, 1974; Markowitz, 1982; Kastelein & Wiepkema, 1989).
Animal 014 often started to swim above animal 013 when keepers went into the water to catch animal 013 for treatment or feeding. Whether this was succorant behaviour (care given to distressed individuals) was not clear, since animal 013 was pushed down. Anderson (19696) reports of succorant behaviour of only one of 30 Harbour porpoises in his laboratory.
Acoustics Although the social calls and most echolocation calls of Harbour porpoises are within the human hearing range (Busnel et al., 1963; Busnel & Dziedzic, 1966), the sounds emitted underwater by the animals in the present study were never heard by the researchers in the air. This is in contrast with Bottlenose dolphins {Tursiops truncatus), Killer whales (Orcinus orca) and False Killer whales (Pseudorca crassidens). The underwater social and (the audible part of) the echo-location calls of these species are often heard in air at the Harderwijk Park. The sound pressure level of the social sounds of Harbour porpoises is probably lower than those of the formerly mentioned cetaceans. This has also been reported by Schevill et al. (1969) who estimate Harbour porpoises to have a weak source sound pressure level of less than 1 dyne per cm2.
Labour Because of the usually bad health condition of stranded cetaceans, treatment is often labour-intensive. In most cases it is necessary to have round-the-clock watches to observe the animals and to give
287

R.A. Kastelein et al.
medical treatment and intervene when necessary. Treatment took 14 man-hours a day during the first 6 weeks of the 3 Harbour porpoises in the present study (excluding night watches). Andersen (1974a) reported that it was a full time job for one man to take care of a suckling Harbour porpoise.
Reintroduction to the wild The animals were first scheduled to be returned to the wild in June 1988. However, in that period many Harbour seals (Phoca vitulina) were dying in the North sea from a Phocine Distemper Virus infection (Osterhaus & Vedder, 1988). The Harderwijk Park was advised not to release the Harbour porpoises until a vaccine had been developed for the porpoises. In September the vaccine became available, and the animals were vaccinated twice in mid October. Unfortunately animal 014 died suddenly on 5 October 1988 before vaccination. The only warning sign of illness was one day of anorexia. The necropsy and bacterial culture showed that the animal was infected with Erysipelothrix rhusiopathiae. However, because this animal died of a disease which was not related to the cause of stranding, the medical treatment presented in the present study for the initial problems after stranding can be considered successful. On 16 November 1988 the remaining two animals were released in an area of the North sea with a relatively high density of Harbour porpoises (15 km north of the Dutch island Terschelling).
Acknowledgements
This rehabilitation could only have been carried out successfully with teamwork. We thank the people, and especially Timo Mank and the personnel of the seal rescue centre in Pieterburen, who reported the strandings. We thank head-trainer Jan Mosterd for his help and advice, and also Piet Mosterd, Arie van de Vaart, Jurgen Foortjes, Silvia Zeegerman, Erna van de Wetering, Aart Jan de Wit and Eveline Brauckman for assisting with the treatment of the animals. We also thank Jos Hermens D.V.M. and the veterinary students Suzan Hordijk, Peter van der Weij and Erik Laarakker for assisting in the treatment of the animals and for collecting part of the data. We further thank Jaques Nieuwenhuisen of the NIOZ for supplying live marine fish, Irma Verhoeven for drawing the graphs and Nancy Vaughan for her comments on the text. Most photographs were taken by Henk Merjenburgh. Special thanks go to Bernhard Neurohr D.V.M. of the Duisburg Zoo, Sam Dover D.V.M. of Sea World San Diego and Prof. Dr. Piet Wiepkema of the Agricultural University of Wageningen for giving their comments on the manuscript.
References Amundin M. (1974) Occupational therapy for Harbour
porpoises, Phocoena phocoena. Aquatic Mammals 2(3), 6-10.
Andersen S. (1965) L'aliraentation du Marsouin (Phocoena phocoena L.) en captivite. Vie et milieu 16A, 799-810.
Andersen S. (1966) The physiological range of the formed elements in the peripheral blood of the Harbour porpoise Phocoena phocoena (L) in captivity. Nord. Vet. Med. 18, 51-65.
Andersen S. (1969a) Electrocardiography of the Harbour porpoise (Phocoena phocoena) (L). In: Investigations on Cetaceans, Vol. I (Ed. G. Pilleri), Inst, of Brain Anat. University of Berne, 189-202.
Andersen S. (19696) Epimeletic behaviour in captive Harbour porpoise, Phocoena phocoena (L.). In: Invesli-gationson Cetaceans, Vol. 1 (Ed. G. Pilleri), Inst, of Brain Anat. University of Berne, 203-205.
Andersen S. H. (1974a) The rearing of suckling Harbour porpoises (Phocoena phocoena). Aquatic Mammals 2(2), 23-27.
Andersen S. H. (19746) A typical case history of the net-caught Harbour porpoise, Phocoena phocoena, from Danish waters. Aquatic Mammals 2(3), 1-6.
Andersen S. (1976) The taming and training of the Harbour porpoise. Cetology 24,1-9.
Andersen S. (1978) Experiences with Harbour porpoises, Phocoena phocoena, in captivity: mortality, autopsy findings and influence of the captive environment. Aquatic Mammals 6(2), 39-49.
Andersen S. & Dziedzic A. (1964) Behaviour patterns of captive Harbour porpoise, Phocaenaphocaena (L.). Bull. Inst, oceanogr. Monaco, vol. 63 (1316), 1-20.
Bain D. (1981) Concurrent rehabilitation of three stranded dolphins. Proceedings of the 198J I.M.A.T.A. meeting: 9-17.
Balbuena J. A., Raga J. A. & Duguy R. (1987) Some data on parasites of the Harbour porpoise Phocoena phocoena in French Atlantic waters. E.C.S. meeting, 56-58.
Baptist H. J. M. (1988) personal communication. Rijkswaterstaat, dienst getijde wateren.
Bree P. J. H. van & Husson A. M. (1974) Strandingen van Cetacea op de Nederlandse kust in 1972 en 1973. Lutra Vol. 16(1).
Bree P. J. H. van & Smeenk C. (1978) Strandingen van Cetacea op de Nederlandse kust in 1976 en 1977. Lutra Vol. 20.
Bree P. J. H. van & Smeenk C. (1982) Strandingen van Cetacea op de Nederlandse kust in 1978, 1979, en 1980. Lutra Vol. 25.
Busnel R., Dziedzic A. & Andersen S. (1963) Sur certaines caracteristiques des signaux acoustiques du marsouin Phocoena phocoena L., C. R. Acad. Sci. Paris 257, 2545-2548.
Busnel R. & Dziedzic A. (1966) Acoustic signals of the Pilot whale Globicephala melaena and the porpoises Delphinus delphis and Phocoena phocoena. In: Whales, dolphins and porpoises (Ed. K. Norris). Univ. of Cal. Press. Berkeley, 638-646.
Corkeron P. J., Morris R. J. & Bryden M. M. (1987a) A note on healing of large wounds in Bottlenose dolphins, Tursiops truncatus. Aquatic Mammals 13(3), 96-98.
Corkeron P. J., Morris R. J. & Bryden M. M. (19876) Interactions between Bottlenose dolphins and sharks in
288

The medical treatment of stranded Harbour porpoises
Moreton Bay, Queensland. Aquatic Mammals 13(3), 109-113.
Dudok van Heel W. H. (1962) Experiments with Phocoena phocoena L. Netherlands J. Sea Research 1(4), 427-458.
Eisner R., Pirie J., Kenny D. D. & Schemmer S. (1974) Functional circulatory anatomy of cetacean appendages. In: Functional anatomy of marine mammals. Vol. 2 (Ed. R. J. Harrison) Academic Press, New York and London, 143-160.
Fisher H. D. & Harrison R. J. (1970) Reproduction in the Common porpoise (Phocoena phocoena) of the North Atlantic. J. Zool., Lond. 161,471^*86.
Gage L. (1982) Care of a beached neonatal Harbor porpoise (Phocoena phocoena) a case report. Proceedings of the 19821.M.A.T.A. meeting: 55-58.
Gaskin D. E. (1984) The Harbour porpoise Phocoena phocoena (L): Regional populations, status, and information on direct and indirect catches. Rep. Int. Whal. Commn. 34. SC/35/SM24, 569-586.
Gaskin D. E. & Watson A. P. (1985) The harbor porpoise, Phocoena phocoena, in Fish Harbour, New Brunswick, Canada: Occupancy, distribution, and movements. Fishery Bulletin, Vol. 83(3), 427^*42.
Gaskin D. E., Smit G. J. D., Watson A. P., Yasui W. Y. & Yurick D. B. (1984) Reproduction in the Porpoises (Phocoenidae): Implications for management. In: Reproduction in whales, dolphins and porpoises (Eds. W. F. Perrin, R. L. Brownell Jr, and D. P. DeMaster), Rep. Int. Whal. Commn. Cambridge. Special Issue 6,135-148.
Greenwood A. G., Harrison R. J. & Whitting H. W. (1974) Functional and pathological aspects of the skin of marine mammals. In: Functional anatomy of marine mammals Volume 2. (Ed. R.J. Harrison), Academic Press, London, New York and San Francisco, 73-110.
Harrison R. J. & Thurley K. W. (1974) Structure of the epidermis of Tursiops, Orcinus, and Phocoena. In: Functional anatomy of marine mammals Volume 2. (Ed. R. J. Harrison), Academic Press, London, New York and San Francisco, 45-72.
Husson A. M. & Van Bree P. J. H. (1972) Strandingen van Cetacea op de Nederlandse kust in 1970 en 1971. Lutra, Vol. 14.
Husson A. M. & Van Bree P. J. H. (1976) Strandingen van Cetacea op de Nederlandse kust in 1974 en 1975. Lutra, Vol. 18(2).
Kanwisher J. & Sundnes G. (1965) Physiology of a small cetacean. Hvalradets Skrift. 48,45-53.
Kastelein R. A. & Vaughan N. (1989) Food consumption, body measurements and weight changes of a female Killer whale (Orcinus orca). Aquatic Mammals 15(1), 18-21.
Kastelein R. A. & Meijler F. L. (1989) Respiratory arrhythmia in the hearts of Harbour porpoises (Phocoena phocoena). Aquatic Mammals 15(2), 57-63.
Kastelein R. A. & Wiepkema P. R. (1988) The significance of training for the behaviour of Steller sea lions (Eumetopias jubatus) in human care. Aquatic Mammals 14(1), 39-41.
Kastelein R. A. & Wiepkema P. R. (1989) A digging trough as occupational therapy for Pacific Walrusses (Odobenus rosmarus divergens) in human care. Aquatic Mammals 15(1), 18-21.
Kastelein R. A. & Dubbeldam J. L. (1990) Marginal papillae on the tongue of the Harbour porpoise (Phocoena
phocoena), Bottlenose dolphin (Tursiops truncatus) and Commerson's dolphin (Cephalorhynchus commersonii). Aquatic Mammals 15.4,158-170.
Krabbe P. (1987) personal communication, Northsea Museum, Hirtshals.
Markowitz H. (1982) Behavioural enrichment in the zoo. Van Nostrand Reinhold Company, New York. pp. 210.
Meyers W. A., Horton H. C , Heard F. A., Jones A., Winsett G. & McCulloc S. A. (1978) The role of recorded data in acclimatizing a harbour porpoise (Phocoena phocoena). Aquatic Mammals 6(2), 54-64.
Mahl-Hansen U. (1954) Investigations on reproduction and growth of the porpoise (Phocoena phocoena (L)) from the Baltic. Vidensk. Medd.fra. Dansk naturh. Foren. Bd. 166, 369-396.
Neurohr B. (1988) personal communication, Duisburg Zoo.
Neurohr B. (1989) personal communication, Duisburg Zoo.
Nielsen E. & Andersen S. H. (1982) Clinical chemistry and hematologic findings in the Harbour porpoise (Phocoena phocoena) from Danish waters. Aquatic Mammals 9(1), 1-3.
Osterhaus A. D. M. E. & Vedder E. J. (1988) Identification of virus causing recent seal deaths. Nature 335,20.
Parker G. H. (1932) The respiratory rate of the common porpoise. J. Mammal. 13,68-69.
Rae B. B. (1965) The food of the Common porpoise (Phocoena phocoena). J. Zool. 146,114-122.
Rae B. B. (1973) Additional notes on the food of the Common porpoise (Phocoena phocoena). J. Zool, Lond. 169,127-131.
Read A. J. & Gaskin D. E. (1985) Radio tracking the movements and activities of harbor porpoises, Phocoena phocoena (L), in the Bay of Fundy, Canada. Fish. Bull. 83(4), 543-552.
Reijnders P. (1989) Personal communication. Research Institute for Nature Management, Den Burg.
Ridgway S. H. (1972) Homeostasis in the Aquatic Environment. In: Mammals of the sea (Ed. S. Ridgway). Thomas publisher, Springfield, Illinois, 590-731.
Schevill W. E., Watkins W. A. & Ray C. (1969) Click structure in the porpoise Phocoena phocoena. Jour. Mammal. 50,721-728.
Slijper E. J. (1958) Organ weights and symmetry problems in porpoises and seals. Arch. Neerl. Zool. 13(1), 97-113.
Smeenk C. (1986) Strandingen van Cetacea op de Nederlandse kust in 1981,1982 en 1983. Lutra Vol. 29.
Smeenk C. (1988) personal communication. Natural History Museum, Leiden.
Smeenk C. (1989) Strandingen van Cetacea op de Nederlandse kust in 1984-1986. Lutra Vol. 32.
Smith G. J. D. & Gaskin D. E. (1974) The diet of harbor porpoises (Phocoena phocoena (L)) in coastal waters of Eastern Canada, with special reference to the bay of Fundy. Can. J. Zool. 52,777-782.
Smith G. J. D., Read A. J. & Gaskin D. E. (1983) Incidental catch of Harbor porpoise, Phocoena phocoena (L.), in Herring weirs in Charlotte County, New Brunswick, Canada. Fishery Bulletin 81(3), 660-662.
Spotte S., Dunn J. L„ Kezer L. E. & Heard F. M. (1978) Notes on the care of a beach-stranded Harbor porpoise (Phocoenaphocoena). Cetology 32,1-5.
289

R.A. Kastelein et al.
Stuntz W. E. & Shay T. B. (1979) Report on capture stress workshop. National Fisheries Service. Adm. Report No. U-79-28.
Utrecht W. L. van (1959) Wounds and scars in the skin of the Common porpoise, Phocoena phocoena (L.). Mammalia 23,100-122.
Utrecht W. L. van (1978) Age and growth in Phocoena phocoena Linnaeus, 1758 (Cetacea, Odontoceti) from the North sea. Bijdr. tot de Dierk. 48(1), 16-28.
Verwey J. (1975) The cetaceans Phocoena phocoena and
Tursiops truncatus in the Marsdiep area (Dutch Waddensea) in the years 1931-1973. NIOZ, Publication no. 1975-17a&b, 1-53.
Watts P. & Gaskin D. E. (1985) Habitat index analysis of the Harbor porpoise {Phocoena phocoena) in the southern coastal Bay of Fundy, Canada. J. Mammology 66(4), 733-744.
Yasui W. Y. & Gaskin D. E. (1987) Energy budget of a small cetacean, the Harbour porpoise. Opthelia, Vol. 26.
290

Chapter 3
Phocids (true seals)
291

Chapter 3.1
Aquatic Mammals 1991.17.2,76-87
The food consumption of Southern elephant seals (Mirounga leonina)
R. A. Kastelein, J. Kershaw* and P. R. Wiepkema**
Harderwijk Marine Mammal Park, Strandboulevard-oost 1, 3841 AB Harderwijk, Holland * Marineland, Avenue Mozart, 06600 Antibes, France
** Ethology Section, Department of Animal Husbandry, Agricultural University, P.O. Box 338,6700 AH Wageningen, Holland
Summary
This study concerns the food consumption of 1 male and 2 female Southern elephant seals at Marineland, Antibes, France. The females' food intake increased for about 3 years after which it stabilized at around 3400 kg/year. The male's annual intake reached a peak of 11.600 kg during his 6th year after which it dropped and stabilized at around 8000 kg/year. Although the animals were allowed to eat as much as they wanted, the food intake fluctuated seasonally. The annual periods with a low food intake correspond with the breeding (after maturity) and moulting seasons in both sexes. After each moult, the animals increased their food consumption to replenish their energy reserves. In relation to their body weight, the animals ate less than the rough estimate normally used for animals in the wild. This could be because, at Marineland, the air and water temperatures are higher, the diet has a higher energy content, and less energy is needed for feeding than in the wild.
Introduction
The Southern elephant seal (Mirounga leonina) is the largest pinniped and has a circumpolar distribution in the Southern Ocean. The major breeding population occurs on islands around the Antarctic Convergence (McCann, 1985). Southern elephant seals were hunted so intensely that the numbers had declined to around 600 000 in 1960. After sealing stopped at South Georgia in 1964, numbers increased (Laws, 1979). However, the number of Southern elephant seals on the Kerguelen Islands seems to have decreased during the last decade. The causes for this decline are not known, but diminution of fish numbers due to increased commercial fishing activities could have been of influence (Laws, 1979; Van Aarde, 1980; Pascal, 1985). To determine the annual energy requirement of a population, information is needed on its size and composition, and on the annual food consumption of the animals. This latter is dependent on sex and age. Laws (1956) has studied the stomach contents of a few Southern
elephant seals. This small sample showed that cephalopods, taken mostly in pelagic waters, constitute roughly 75% of the diet, and fish (mainly Notothenia spp) constitute the remaining 25% of the diet and are taken mostly inshore. Clarke & MacLeod (1982) also found cephalopods in Southern elephant seal stomachs.
More detailed information is needed on the prey species taken in different areas, seasons and years. Very little is known about the amount of food consumed per day, or about food intake changes due to the time of year, the age, the reproductive cycle, and sex-linked food intake differences. This type of data can be derived from food records of animals kept in zoological parks. Marineland in Antibes, France, has kept Southern elephant seals from the Kerguelen Islands since 1972. This paper is about the food consumption of3 Southern elephant seals at the park. The results may be useful for energetic studies to assess the impact of the world population of Southern elephant seals (which is estimated at 750 000; McCann, 1985) on fish populations. The need of the parameter of food intake in the design of a rational management plan for this seal species has been stressed by Laws (1979), Bonner (1982) and McCann (1985).
Materials and Methods
Study animals This study concerns the food consumption of 3
Southern elephant seals (Mirounga leonina). One female (code: M1M A002) was born on the Kerguelen Islands in October 1971 and arrived at Marineland on 12 January 1972. The male (code: M1MA001) and another female (code: M1MA003) were born on the Kerguelen Islands in October 1975, and arrived at Marineland on 4 March 1976. All 3 animals were bottle-fed for some weeks until they accepted fish. To make the pups start to accept dead fish in a pool, live Trout (Salmo trutta) were offered, a technique which was described earlier by Bullier (1954). In the wild, newly weaned 3-week-old pups are deserted by their mothers and fast for 5 to 6 weeks during which they
293

R.A. Kastelein et al.
learn to swim near the beaches. A month later they leave the breeding grounds (Carrick et al., 1962a).
Study area Between 1972 and 1983 the animals were kept in
an outdoor pool (19 m x 13 m; 2 m deep) filled with natural sea water from the Mediterranean. In the beginning of 1984 they were transferred to a larger pool (30 m x 15 m; 2.5 m deep). The water temperature varied from 8°C to 25°C, air temperature from — 2°C to 35°C. Adjacent to the pool a beach was available where the animals could haul out. Marine-land is located 7°3' East longitude and 43°30' North latitude.
Food The animals were fed 2 to 4 times per day on a
mixed diet of, on average, 50% Mackerel (Scomber scombrus) and 50% Herring (Clupea harengus), based on weight. Vitamins were added to the fish, after it had been defrosted. During the last feed of the day the animals were given as much as they wanted to eat. Feeding was stopped as soon as the animals started to play with the food instead of consuming it immediately. This was considered a sign of satiety. Records were kept of the amount and type of food consumed during each feed. These daily food intake data form the basis of the present study.
In some months of 1979 and 1980, Herring and Mackerel were difficult to obtain. Instead Whiting (Merlangius merlangus) was given and a reduction in the food consumption resulted. For this reason the records of 1979 and 1980 were omitted in the analysis of the seasonal intake fluctuations. In 1984 the animals were moved into a new pool. This change of environment probably caused the male and female 002 to eat much less than expected in that year. The food records of 1986 were incomplete, so this year was omitted in the analysis.
Results
Age related changes and sexual differences The male's annual food consumption increased
steadily until in his 5th year he ate 6300 kg. Then his food intake increased dramatically to reach a maximum of 11.600 kg in his 6th year (Fig. 1 A). After this, his food consumption dropped and stabilized at around 8000 kg/year.
Female 002's annual food consumption increased slightly until her 4th year in which she ate 3500 kg (Fig. IB). During female 002's fifth year, animals 001 and 003 were introduced to her pool. In that year she only ate 2400 kg. After her fifth year, her intake remained around 3500 kg/year, but was lower during her 8th and 9th year (1979 & 1980). Each year between her 10th and 14th year she gave birth to a full-term pup in April or May. Although she did not
suckle her pups, the food intake increased during these reproductive years to a maximum of 4500 kg during her 14th year. After these reproductive years her food intake dropped to around 3200 kg/year.
Female 003's annual food consumption increased until her 3rd year in which she ate 3800 kg (Fig. 1C). After that it dropped for 2 years (1979 & 1980) and stabilized around 3500 kg/year. Although she mated, she never produced offspring.
Seasonal changes When examining the seasonal changes, the male's
food consumption record can be divided into 4 periods. In March of his first year he started to eat fish and no intake pattern could be detected that year. The food consumption increased almost every month of both his second and third year, indicating that the animal was growing (Fig. 2A). The food consumption was relatively less in September and October when moult occurred. No mating was observed in these years. Between the age of 4 and 9 years, when the animal did mate, there were marked seasonal fluctuations in the amount of food consumed per month (Fig. 2B). The animal ate much less than the yearly average between March and July (almost every year he stopped eating completely for about a week in that period), around average in August and September, and much more than average between October and January. In these years the period of sexual activity occurred between March and July. The male was obviously sexually active because his proboscis was erected and made the nose appear bigger, he made lots of noise, and he mated with and bit the females. The moult occurred between July and September, months during which his food intake was relatively low. Between the age of 10 and 13, the male's annual feeding pattern continued to fluctuate, but the extremes occurred in slightly different months (Fig. 2C). He ate less than average between February and April (when he was sexually active) and in September and October (when he moulted). Between November and January he ate much more than the yearly average.
The food consumption record of female 002 can be divided into 3 periods. She started to eat fish in January of her first year. Between the age of 1 and 8 (years without mating) her monthly food intake fluctuated only a little seasonally (Fig. 3A). She ate a little less than average between April and September, and a little more than average between October and February. Moult occurred between July and September. Until the age of 5 she was without a male companion. In 1976 the male was introduced, but he was not sexually mature until 4 years later in 1980 when female 002 was 9 years old. Between her 10th and 14th year of age she gave birth to a pup every year in April or May (Fig. 3B). In these years her monthly food intake showed marked seasonal
294

CO
a> —, J£
C
o a E 3 (0 c o u •D o o
c c CO
The food consumption of Southern elephant seals
12000-| A M a | e 0 0 1 11000. 10000.
9000.
8000.
7000.
6000.
5000.
4000.
3000,
2000.
1000.
0
Born in October 1975
\
0 1 2 3 4 5 6
5 0 0 0 -
4000.
3000.
2000,
1000,
0,
7 8 9 10 11 12 13 Age (year)
B. Female 002 Born in October 1971
0 1 2 3 4 5 6 7 8 9 10 11 12 13 14 15 16 17 Age (year)
5 4000-£ 3000.
2000. 1000.
0.
C. Female 003
Born in October 1975
\
0 1 2 3 4 5
1980
6 7 8 9 10 Age (year)
Figure 1. The annual food intake of a male (A) and 2 female (B & C) Southern elephant seals. Age 1 represents the first calendar year after the year of birth. 0 = low intake due to the introduction of a less preferred fish species. + = low intake due to transfer to a new pool. Triangle = a year in which a pup was born. x = a year in which the food records were incomplete and thus omitted.
changes. She ate much less than the yearly average between April and July (almost every year she stopped eating completely for about a week in that period), and much more than average between October and December. After these reproductive years, her food intake hardly fluctuated seasonally at all.
Female 003's food consumption record can be divided into 3 periods. She started to eat fish in March of her first year, and no monthly intake pattern could
be detected that year. Both during her second and third year (years without mating) female 003's food intake showed a monthly increase indicating growth (Fig. 4A). Between the age of 4 and 10 years (when the male was sexually mature and mated with her) she ate much less than average between March and July (almost every year she stopped eating completely for about a week in that period), and much more between October and January (Fig. 4B). Sexual activity took place between March and June but she
295

R.A. Kastelein et al.
Q
40" 30-
20-
10-
-10-
-20-
-30--40 J
Ma A.
ie001 age 2 . 3
1 2 3 4 5 6
Moult
7 8 9 10 11 12 Month
60 50 40' 30' 20' 10' 0"
-10--20--30--40--50--60--70-
50 40'
30'
20
10
0'
- 10' -20 -30--40-
B.age 4 . 9
Breeding Moult i * t
1 2 3 4 5 6 7 8
9 10 11 12 Month
Cage 10.13
Breeding
2 3 4 5 6 W
Moult » i
8 9 10 11 12
Month
Figure 2. The average deviation (%) from the annual average monthly food consumption of the male Southern elephant seal; A) between age 2 and 3, B) between age 4 and 9, and C) between age 10 and 13.
never produced offspring. The moult fell immediately afterwards between July and September.
The animals of the present study spent a relatively large amount of time on land during the moult. They usually lay on the beach or in the shallow part of the pool, never seeking the shade provided. Although food was offered ad libitum, they reduced their intake significantly.
ro >
° -20.
20' 10
0'
-10'
Female 002
A .age1 .8
ii Moult
4 5 6 7 8 9 1 2 3 U- l 10 11 12
Month
c o
B. age 10.14
Breeding Moult i • — " - ? »
2 3 4 5 6 7 tn m 8 9 10 12 13
Month
50' 40' 30' 20' 10'
| 0. S-10' 38 -20'
-30' -40'
Figure 3. The average deviation (%) from the annual average monthly food consumption of Southern elephant seal female 002; A) between age 1 and 8 (years without mating), B) between age 10 and 14 (years in which she delivered a pup).
Two fish of the same species can have different nutritional or caloric values depending on the season and geographical area in which the fish were caught. The fish fed at Marineland is caught in different quantities and areas, and sometimes stored for several months. Probably, the seasonal or regional changes in caloric value of the fish cancelled each other out over the years, and did not lead to an artifical annual fluctuation in food consumption.
Discussion and conclusions
Influence of age and sex on annual food intake Until the age of 2, the annual food consumption of
all 3 animals increased similarly. After this age the male's food intake continued to increase strongly until he was 6 years old. Female 002's food intake increased until she was 4 years old and female 003's until she was 3 years old. After these years, the females were neither growing nor lactating, and their food consumption stabilized, except during female 002's reproductive years. These food intake patterns seem to correspond with the growth pattern of wild Southern elephant seals. There is little difference in body size between males and females until the age of 3 years (Carrick et al., 1962b). After their third year the males continue to grow much faster than the females (Laws, 1953; Ling & Bryden, 1981). This difference in growth between males and females is thought to be linked to the age of maturation.
296

The food consumption of Southern elephant seals
30 20 10
3. 0
| - 1 0
s« - 20 -
- 3 0 - 4 0
c o
•
•
•
Female 003
A. age 2 - 3
1 2 3 4 5 6
I Moult r r
7 8 9 10 11 12
Mo nth
Figure 4. The average deviation (%) from the annual average monthly food consumption of Southern elephant seal female 003; A) between age 2 and 3 (years without mating), B) between age 4 and 10 (years in which she mated, but produced no pup).
On the Kerguelen Islands, males reach sexual maturity at 3 years, and they become harem bulls at 5 -7 years of age (Angot, 1954). However, the age at which sexual maturity is reached depends on the sexual composition of a population. In non-hunted wild populations, most males become sexually mature around the age of 6, but do not breed until they are almost 10 years old. In populations in which the breeding males are hunted, the males mature 2 to 3 years earlier probably because of the lack of competition (Carrick et al., 1962b). Since the male in the present study had no rivals he matured at an early age, around his 4th or 5th year. At around that time he went through a growth spurt, probably regulated partially by testosterone. At the Stuttgart Zoo, also in a situation without male competition, a pair of Southern elephant seals first mated when the male was only 5 years old and the female 4 (Neugebauer, 1967).
It is thought that at about the age of 4 the body size and body composition of males and females start to differ and sexual dimorphism becomes clear (Fig. 5) (Carrick et al., 1962b). Males produce more muscle
limn females (Bryden, 1972), (he head becomes broader, the huge canine teeth erupt, and the proboscis starts to develop (Carrick el at., 1962b). Around that age the food intake of the males and females in the present study started to differ. Sexual differences in food intake after maturation have also been observed in other sexually dimorphic pinnipeds such as Grey seals (Halichoerus grypus), Sleller sea lions (Eumetopias jubatus) and South African fur seals (Atotocephalus pusillus) (Kastelein et al., 1990, a , b&c ) .
If the females of the present study had been lactating, their annual food intake would probably have been higher. Pups weigh around 40 kg at birth and gain around 160 kg in the 23 day long suckling period (Laws, 1953). The mothers may lose up to 240 kg in that period (Bryden, 1969), which must be replenished after weaning. Lactation in Grey seals causes a 15% increase in the mother's annual food consumption (Kastelein et al., 1990b).
Seasonal changes The seasonal changes in food intake seem to be
mainly influenced by 2 events: breeding and moult.
A. Seasonal food intake changes due to breeding Males
The marked seasonal fluctuations in the male's food intake start in the year that copulation was first observed. This suggests that the decrease in the male's food consumption between March and July during his 4th to 9th year, was related to reproduction. In the wild, male Southern elephant seals start to come ashore in late August, a few weeks before gravid females haul out to give birth. Breeding bulls generally arrive earlier than bachelors (Carrick et al., 1962b). Bulls are polygamous, but there is no physically defined territory. Breeding bulls station themselves near small groups of cows, when they arrive. Such a group then forms the nucleus of a harem. The bulls eat almost nothing during the reproductive period and try to mate with every female in their surroundings that is in oestrus (Ling & Bryden, 1981). During mating the bull typically grips the cow by the neck and this may leave tooth-marks on her neck (Carrick et al., 1962b; McCann, 1981). For the breeding bulls, the breeding season is very long, since births, followed by females coming into oestrus, occur over a period of 2 months. During the breeding season the male in the present study usually stopped eating completely for a week.
Because the annual periods with the lowest food intake only partially overlap with the warmest months of the year (Fig. 7), the decrease in food consumption cannot be fully accounted for as a thermoregulatory adaptation. Because the male in the present study was given as much food as he wanted, it
297

R.A. Kastelein et al.
Figure 5. A mature Southern elephant seal bull surrounded by mature females. Note the obvious sexual dimorphism. (Photo: W. N. Bonner, courtesy of the British Antarctic Survey).
seems plausible that the reduction in appetite between March and July was caused at least partly by endogenous factors. Griffiths (198 5) observed that the testes of male elephant seals in the wild (= southern hemisphere) are quiescent from December to July inclusive. This corresponds to June to January in the northern hemisphere, the period in which the male of the present study eats much more than average. Griffiths (1985) found that as daylength increased, the gonadotrophin production by the pituitary gland increased, which initiated the onset of spermatogenesis. He reports that the first sperm reached the epididymis in September and the production was already reduced by November. This would be from March to May in the northern hemisphere, the period in which the food intake of the male in the present study was extremely low.
After the breeding season, Southern elephant seal bulls leave their breeding grounds in a generally emaciated condition. Bulls live longer (on average 18 years) than the females which live for 10 to 13 years (Laws, 1953; Carrick& Ingram, 1962). This is just the
opposite to Grey seals in which the females live longer than the males (35 versus 25 years) (Hewer, 1964). In Grey seals this difference in life expectancy was thought to be due to the stress of fighting and starvation to the males during the mating season. This may not be true, because the breeding strategy of Southern elephant seal bulls seems similar to that of the Grey seal bulls.
Seasonal food intake changes related to the male's reproductive strategy are also found in other pinnipeds. Reproductive males of Steller sea lions (Kastelein et al., 1990a), South African fur seals (Kastelein et al., 1990c), California sea lions (Zalophus californianus) (Schusterman & Gentry, 1971), Northern fur seals (Callorhinus ursinus) (Spotte & Adams, 1979), Atlantic Harp seals (Pagophilus groenlandicus) (Sergeant, 1973), Grey seals, (Kastelein et al. 1990b), and Northern elephant seals (Mirounga angustirostris) (Ortiz et al., 1984) also reduce their food intake during the breeding period when they haul out and spend most of their time defending their territories or mating.
298

The food consumption of Southern elephant seals
Females In the wild, most female Southern elephant seals
reach maturity at between 2 and 4 years of age (Angot, 1954; Ling&Bryden, 1981; McCann, 1985) and at some locations between 3 and 6 years (Carrick et al., 1962b). Cows then produce 1 pup every year, but sometimes miss a pregnancy after 6 or 7 pups (Laws, 1953). At the Kerguelen Islands, females produce a maximum of 6 pups (Angot, 1954). Female 002 in the present study did not become pregnant until the age of 9. This was because the male was not introduced until she was 5 years old and he only became sexually mature 4 years later.
In the wild, gravid cows haul out about 5 days before their pup is born. Most births are in September and October, the peak is in mid-October. Lactation continues for 3 weeks after birth, and mating occurs just before weaning. Thus the cows stay ashore and fast for 4 to 5 weeks each breeding season (Carrick et al, 1962a; Ling & Bryden, 1981). Bryden (1968) noticed seasonal changes in the body weight of female Southern elephant seals in the wild due to breeding and moult. During lactation females loose 200 to 240 kg. Laws (1953) reports of an even greater weight loss of 320 kg after a lactation period of 23 days. Ulmer (1962) also noted seasonal food intake fluctuations in a female Southern elephant seal at the Philadelphia Zoo. During the colder months she ate on average 27 kg or fish a day, and during the warm season only 13.5 kg/day.
The food intake of female 002 did not fluctuate seasonally until her first pup was delivered when she was 10 years old. Female 003 showed marked seasonal food intake changes, whereas she did not produce pups. The observations on both females suggests that the presence of a sexually active male influences endogenous factors (steroids) that induce ovulation in a female and make her appetite fluctuate. Induced ovulation has also been suggested for Harbour seals, Phoca vitulina (Bigg, 1973).
Comparison between males and females After the breeding season, both sexes are expected
to replenish energy reserves by a drastic increase in food consumption. Males fast for longer than females, and use more energy for locomotion while mating and defending their harem. Females spend a shorter period on land, but use extra energy for lactation. The period of sexual activity of the male in the present study was longer than that of both females. Laws (1953) expected the males to lose relatively less weight than the females due to different hauling out habits. Bryden (1969) expected seasonal fluctuations in condition to be less marked in immature and non-breeding animals, which do not suffer the severe breeding weight loss but have brief haul-out fasts several times during the winter. In some other phocid species the females use relatively more energy during
the breeding season than the males. Sergeant (1973) measured the thickness of the fat layer on Harp seals (Phoca groenlandica) during several seasons. In this species the blubber layer of reproducing females increased to 80 mm just before delivery and decreased to 20 mm just after weaning of the pup. In adult males, the blubber layer only changes from 60 to 40 mm. Similar sexual differences in weight loss were observed in Grey seals by Fedak & Anderson (1987). Northern elephant seal cows lose 42% of their body weight during lactation (15% loss of lean body mass and 58% loss of adipose tissue). Milk production accounted for 60% of the energy expenditure (Costa etal.,\ 986).
A sexual difference in food intake in Southern elephant seals has not resulted in relative differences in stomach size. Bryden (1971) reports that the weight of the stomachs of both males and females is 0.54% of total body weight.
The size difference between male and female Southern elephant seal is thought to be greater than in any other mammal (Bonner, 1989). There are at least 2 explanations for this large sexual dimorphism in Southern elephant seals both of which could be valid. The males could be selected for their strength to defend a harem, and/or for their ability to accrue energy reserves which permits mating in good condition for longer.
B. Seasonal food intake changes due to moult The moult in Southern elephant seals involves the
loss of large patches of cornified epidermis and old hairs (Ling & Thomas, 1967; Ling, 1968). Many pinnipeds grow a fresh coat before a long period in the ocean (Ling, 1970). In the wild, Southern elephant seals haul out on the subantarctic islands to moult (Laws, 1953) and feed at a reduced rate or fast altogether (Ling & Bryden, 1981). The increase in skin temperature caused by hauling out may increase the rate of moult (Ling, 1970). Like other seals, Southern elephant seals moult annually at varying times according to location, age, sex and reproductive condition (Ling & Bryden, 1981). Angot (1954) reports that date of onset of the moult of Southern elephant seals at Kergeulen Islands varies. The moult lasts for about 8 weeks. On average bulls moult a few days longer than females (Carrick et al., 1962b). Burton (1985) reports that 6 to 10 year old bulls at the Vestfold Hills, Antarctica, moult between the beginning of February and the end of April. On the northern hemisphere this would be between the beginning of August and the end of October. This corresponds with the moult and the period of low food intake of the male of the present study.
In the present study the moulting of all 3 animals also varied in timing and duration between individuals and between years. In the wild, Southern elephant seals spend much of their time ashore
299

R.A. Kastelein et al.
during the moult and therefore cannot feed. The animals of the present study also spent a relatively large amount of time on land to moult, and reduced their food intake significantly. The factors regulating the moult seem not only to prohibit the animals from spending much time in the water, but also seem to influence their appetite. In the wild this would make the period of fasting more bearable for the animals.
In the wild, especially immature Southern elephant seals sometimes have a winter haul-out. Some stay ashore for several weeks and often appear to be asleep, while others frequently go onjourneys.lt is not known whether they feed on such trips (Carrick etal.,\ 962a). This phenomenon is not reflected in the food consumption of the animals at Marineland. However, due to the irregularity of this haul-out observed in the wild, it may have gone unnoticed, and not effected the appetite much.
The present study shows that in Southern elephant seals, body fat plays an important role as an energy supply besides temperature regulation (Bryden, 1964; Irving, 1969), streamlining of the body, protection of the body from shocks, and improvement of buoyancy. Compared with other pinnipeds, Southern elephant seals spend long periods of their lives on land during which they fast and have to depend on their energy reserves (Carrick et al., 1962b; Ling & Bryden, 1981). Although blubber provides most of the energy needed, some energy in fasting seals comes from protein metabolism (Ortiz, 1987). This system has the advantage that it does not reduce the thermal insulation.
Factors influencing the timing of breeding and moult The 3 Southern elephant seals in the present study
were kept in the northern hemisphere, which means that they experience the opposite annual cycle of photo-periods to that which they would in their natural habitat. As a result, the breeding and moult cycles are shifted by approximately 6 months. A similar 6 month shift is seen in other Southern elephant seals kept in the northern hemisphere. Pups are born in April (Klos, 1966 & 1979) and May (Neugebauer, 1967) and the mating season is between April and August (Neugebauer, 1967). At Philadelphia Zoo, male Southern elephant seals start to moult in June and it is complete by early August (Ulmer, 1962).
In the wild, the timing of the breeding season varies at different breeding grounds (McCann, 1985), and could be controlled by annually re-occurring seasonal differences in food availability. Carrick et al., (1962a) report that the moment of weaning anticipates the summer rise of zooplankton in surface waters which increases the pup's chances of survival. The moment of implantation of the blastocyst is thought to be determined by the daylength. During moult, many biological processes in the body change. Ling (1970) noted that moulting is coordinated with
9 10 11 12 13 14 15 16 Age (years)
Figure 6. The body weight of the male and female 003 Southern elephant seals in the present study in relation to age (using the age-body length curve from Laws (1953), the post-mortem weights of the 2 full-grown animals in the present study and published birth weights).
season by the direct proximate stimulus of light acting through neuro-endocrine pathways. Pelage growth may also be regulated directly by nutritional status and, to some extent, indirectly by temperature and behaviour. Later, Condy (1979) reported that the mean day length appeared to act as an obligatory proximate factor initiating the haul-out to breed and onset of hair growth. He found that in addition temperature and radiation were obligatory factors initiating the haul-out to moult.
The variation in timing of breeding and moult linked to sex and age classes probably has an ecological advantage (Carrick et al., 1962a). The adjustment of the terrestrial phase of Southern elephant seals with respect to time of arrival of the different age and sex classes, prevents crowding which would lead to an increase in intraspecific aggression (Ling, 1969).
Applicability of the results Two of the animals in the present study were
weighed post mortem (the weighing machine rounded offto the nearest 100 kg). The male weighed 1400 kgat the age of 14 years. He was lean at death, and probably weighed around 1600 kg when he was healthy. Female 003 weighed 600 kg at the age of 11 years. She was in a robust condition when she died. A rough age/body weight curve (Fig. 6) of these animals can be constructed using their annual food intake (Fig. 1), Laws' (1953) age/body length curve, and reported birth weightsof27to45 kg(Laws, 1953;K16s, 1966& 1979; Neugebauer, 1967). This graph (Fig. 6) is not applicable for all Southern elephant seals, since several authors have reported large weight and growth rate
300

The food consumption of Southern elephant seals
Table 1. The estimated body weights and average daily food intake (taken over a year) of the male and female 003 Southern elephant seals at certain ages
Animal
M1MA001 M1MA001 M1MA001 M1MA001 M1MA001 M1MA001 M1MA003 M1MA003 M1MA003 M1MA003 M1MA003
Sex
M M M M M M F F F F F
Age (year)
2 4 6 8
10 12 2 4 6 8
10
Estimated body weight
(kg)
300 500 750
1150 1400 1550 300 450 550 575 600
Daily food consumption (% of body
weight)
3.0 2.9 4.3 2.5 1.7 1.4 2.9 1.7 1.8 1.6 1.7
differences in adult animals of both sexes within one population and between populations (Carrick et al., 1962b). Bryden (1972) reports that adult bulls weigh on average 2300 kg, and Laws (1979) estimates that mature males weigh between 2000 and 3000 kg. King (1983) describes adult males of 3600 kg. This suggests that the male in the present study was a relatively small animal. Also for female Southern elephant seals a wide range of weights have been reported. Bryden (1972) reports that adult cows weigh on average 390 kg, and Laws (1979) suggests a weight of between 400 and 900 kg. King (1983) describes cows weighing 900 kg. This suggests that female 003 was a medium-sized animal.
Figure 6 allows the comparison of the body weight estimate of the male and female 003 of the present study with their food consumption at different ages (Table 1). All intake averages are over an entire year and include the seasonal fluctuations. As expected, the data show that growing animals of both sexes need more energy relative to their body weight than full-grown animals. Especially the male ate a lot during his growth spurt around the age of 6 years. Unexpectedly in animals with such a pronounced sexual dimorphism, the adult male needed only about 0.3% less food in proportion to his body weight than adult female 003. Maybe this was due to his more strenuous and longer terrestrial breeding period. In the wild, both the breeding and moult periods are several weeks longer for the males than for the females (Ling, 1970). Condy (1979) calculates that the total annual haulout time of males is 65% longer than that of females.
The only food intake estimate discovered in the literature is from Laws (1960). He estimates the average weight of Southern elephant seals at 500 kg, and later (Laws, 1977) reports that they require 6% of
e 2 5 -0)
I 20H <o a.
| 15 - |
(0
>. 10
5-c o E a>
2 Oi «
3
a 3 +•» <V
0) a E 4)
2 3 4 5 6 7 8 9 10 11 12 Month
= 20
15
£ 10
i £ 5. E o E O 2 3 4 5 6 7 8 9 10 11 12
Month
— 1 01 O
O
d 5-l E
7 8 9 10 11 12 1 2 3 4 5 6 Month
Figure 7. A) The average monthly air temperature at Marineland between 1949 and 1989. B) The water temperature of the Southern elephant seal pool at Marineland recorded on the 15th of each month in 1990. C) The average monthly air temperature at Kerguelen Island between 1952 and 1973 (adapted from Azibane et al., 1977).
their body weight per day (30 kg/day) for 9-10 months (females fast 2 months, males 3 months; Laws, 1956). On a 12 month basis this would mean a daily food intake of 4.9% for females and 4.5% for males. When male 001 was estimated to weigh 500 kg (at the age of 4), he was eating around 3% of his body weight per day. When female 003 was estimated to
301

R.A. Kastelein et al.
weigh 500 kg (between 4 and 6 years old), she was eating around 1.7% of her body weight per day. The difference between Laws' estimate and the data from the present study could be due to the following factors:
1) The difference in activity level between animals in the wild and in a pool. In the wild dives of more than 30 minutes have been observed (Matthews, 1952) during which the seals were probably foraging actively. At Marineland the animals did not have to dive, and thus used less energy, in order to get their food. However, the animals in the present study swam a lot and often stayed submerged on the bottom of the shallow area of the pool with their heads just under water. Except for a reduction in the moult and breeding season, the amount of time spent in the water was similar in the other seasons.
2) The air and water temperatures at Marineland (Fig. 7A & B) are higher than in the Southern elephant seal's distribution area (Azibane et al., 1977; Fig. 7C). Angot (1954) reports water temperatures of 5 to 7°C near the Kerguelen Islands in January and Azibane et al. (1977) of temperatures between 2 to 4°C in December. These are summer months on the southern hemisphere, and the reported water temperatures are already less than the winter temperatures at Marineland.
3) Different species of fish have a different energy content per unit of weight (Costa, 1987; Prime & Hammond, 1987). Therefore, food intake quantities cannot simply be compared on the basis of the fresh weight of different food species. The fish species fed to the seals in the present study were not the natural prey of Southern elephant seals. Although the caloric content of the food eaten by the Southern elephant seals at Marineland (50% Herring and 50% Mackerel) was not determined it is clear that its energy content was much higher than that of the natural prey of Southern elephant seals (25% fish and 75% squid; Laws, 1956).
On the other hand the animals in the present study did eat some food during the breeding and moult seasons (probably because they were fed from the hand of the trainer), which would make their food intake higher than that of conspecifics in the wild. Reliable formula to convert the results of the present study to animals of other sizes, or to a different climate or water temperature do not yet exist (Naumov & Chekunova, 1981).
The present study was carried out on only 1 male and 2 females which reduces its representative value. However, most feeding patterns found were present for several years in each animal. Therefore the findings on these 3 animals may have a more general significance. There is thought to be little or no intermixing between the different wild populations of Southern elephant seals and the different growth rates and sizes in different stocks indicate this.
Reproductive parameters also differ between stocks (Carrick et al., 1962a; Bryden, 1972; Ling & Bryden, 1981). The animals in the present study come from Kerguelen Island, so the results may only apply to this population. Although the food intake data of the present study are difficult to extrapolate to the food intake of the wild population, the relative difference due to sex and age and changes due to season and breeding stage are probably comparable to those in the field. These changes were controlled by endogenous factors, because the animals at Marineland were offered as much as they wanted to eat.
The importance of fasting in the breeding season and moult is often forgotten in research on pinniped energetics. For instance, Spotte & Adams (1981) studied the energetics of adult female Northern fur seals and attributed all body weight changes to water temperature changes. They failed to take into account the endogenously regulated mechanism that allows females to fast during lactation. Studies on energy requirements (as summarized by Spalding, 1964), should be long term studies involving growing and adult individuals of both sexes, and males and females in different stages of reproduction.
The present study indicates that the food intake patterns in Southern elephant seals are extremely complex. It is risky to use a simple percentage of body weight to calculate the daily food requirement of an entire population of Southern elephant seals. To assess this requirement reliably, information on the geography, water temperature, climate, season, the diet and its caloric content, the digestive efficiency of the different prey species (Keiver et al., 1984; Ronald et al., 1984; Fisher et al., 1991), and the size, sexual composition and age structure of the population is needed. To study the impact of the seals on fish populations, information on the dynamics of the fish stocks is also necessary.
Acknowledgements We thank all animal care personnel at Marineland for recording the food consumption over the years. We thank the veterinary students Francois Roumegous, Olivier Maddens, Philippe Auternaud and Michelle Rivals for partially analysing the food records. We also thank Nancy Vaughan and Caroline Koopman for the partial analysis of the data. The mean monthly air temperature were provided by Meteo-France. We thank Liesbeth Berghout for making the graphs, and Nancy Vaughan for her comments on the manuscript.
References Angot M. (1954). Observations sur les mammiferes marins
de l'archipel de Kerguelen avec une etude detailee de l'Elephant de mer, Mirounga leonina (L.). Mammalia, 18, 1-111.
AzibaneC, Clavier B., Dujardin J. L., Touze U. & Rigaurd J. F. (1977). Etude sur le climat des iles Kerguelen et de la
302

The food consumption of Southern elephant seals
zone subantarctique de l'Ocean Indien. Climatologie de Port-aux-Francais. Monographic No. 99 de la meteorologie nationale. Paris.
Bigg M. A. (1973). Adaptations in the breeding of the Harbour seal, Phoca vitulina. J. Reprod. Ferl., Suppl. 19, 131-142.
Bonner W. N. (1982). The Southern elephant seal and elephant oilers. In: Seals and man. A study of interactions. Wash. Sea Grant Publ. 73-88.
Bonner W. N. (1989). The natural history of seals. Christopher Helm.
Bryden M. M. (1964). Insulating capacity of the subcutaneous fat of the southern elephant seal. Nature, 203, 1299-1300.
Bryden M. M. (1968). Lactation and suckling in relation to early growth of the southern elephant seal, Mirounga leonina (L.). Aust. J. ZooL, 16, 739-748.
Bryden M. M. (1969). Growth of the Southern elephant seal, Mirounga leonina (Linn.). Growth, 33,69-82.
Bryden M. M. (1971). Size and growth of viscera in the Southern elephant seal, Mirounga leonina (L.). Aust. J. ZooL, 19,103-120.
Bryden M. M. (1972). Body size and composition of elephant seals (Mirounga leonina): absolute measurements and estimates from bone dimensions. J. Zool. Lond., 167, 265-276.
Bullier P. (1954). Alimentation et acclimatement d'elephants de mer (Mirounga leonina L.) en captivite, au pare zoologique du bois de Vincennes. Mammalia, 18, 272-276.
Burton H. R. (1985). Tagging studies of male southern elephant seals (Mirounga leonina L.) in the Vestfold Hills area, Antarctica, and some aspects of their behaviour. In: Studies of sea mammals in south latitudes (Eds. J. K. Ling & M. M. Bryden). South Australian Museum. 19-30.
Carrick R„ Csordas S. E. & Ingham S. E. (1962a). Studies on the Southern elephant seal, Mirounga leonina (L.). 4. Breeding and development. CSIRO Wildl. Res., 7(2), 161-197.
Carrick R„ Csordas S. E., Ingham S. E. & Keith K. (1962b). Studies on the Southern elephant seal, Mirounga leonina (L.). 3. The annual cycle in relation to age and sex. CSIRO Wildl. Res., 7(2), 119-160.
Carrick R. & Ingham S. E. (1962). Studies on the southern elephant seal, Mirounga leonina (L.), 5: Population dynamics and utilization. CSIRO Wildl. Res., 198-206.
Clarke M. R. & MacLeod N. (1982). Cephalopods in the diet of elephant seals at Signy Island, Antarctic. Bull. Br. Antarc.Surv., 57,27-31.
Condy P. R. (1979). Annual cycle of the southern elephant seal Mirounga leonina (Linn.) at Marion Island. S.-Afr. Tydskr. Dierk., 14(2), 95-102.
Condy P. R. (1981). Annual food consumption, and seasonal fluctuations in biomass of seals at Marion Island. Mammalia, 45(1), 21-30.
Costa D. P. (1987). Isotopic methods for quantifying material and energy intake of free-ranging marine mammals. In: Marine Mammal Energetics (Eds. A. C. Huntley, D. P. Costa, G. A. J. Worthy and M. A. Castellini) Soc. for. Mar. Mamm. Special publ. no. 1, 29^12.
Costa D. P., Le Boeuf B. J., Huntley A. C. & Ortiz C. L. (1986). The energetics of lactation in the Northern
elephant seal. Mirounga angustiroslris. J. Zool., Lond., 209,21-33.
Fedak M. A. & Anderson S. S. (1987). Estimating energy requirements of seals from weight changes. In: Marine Mammal Energetics (Eds. A. C. Huntley, D. P. Costa, G. A. J. Worthy and M. A. Castellini) Soc. for. Mar. Mamm. Special publ. no. 1, 205-226.
Fisher K. I., Stewart R. E. A., Kastelein R. A. & Campbell L. D. (1991). Digestive efficiency in Walruses (Odobenus rosmarus). In prep.
Griffiths D. J. (1985). Endocrine regulation of seasonal breeding in the male Southern elephant seal (Mirounga leonina) at Macquarie Island. In: Studies of sea mammals in south latitudes (Eds. J. K. Ling and M. M. Bryden). South Australian Museum. 31—40.
Hewer H. R. (1964). The determination of age, sexual maturity, longevity and a life-table in the Grey seal (Halichoerus grypus). Proc. Zool. Soc. Lond., 142, 593-624.
Irving L. (1969). Temperature regulation in marine mammals. In: Marine Mammals (Ed. H. T. Anderson) Academic Press, New York, 1,147-174.
Kastelein R. A., Vaughan N. & Wiepkema P. R. (1990). The food consumption of Steller sea lions (Eumetopias jubatus). Aquatic Mammals, 15(4), 137-144.
Kastelein R. A., Wiepkema P. R. & Vaughan N. (1990b). The food consumption of Grey seals (Halichoerus grypus) in human care. Aquatic Mammals, 15(4), 171-180.
Kastelein R. A., Verhoeven I. & Wiepkema P. R. (1990c). The food consumption of South African fur seals (Arctocephalus pusillus) at the Harderwijk Marine Mammal Park. Int. Zoo. Yearb. Vol. 29, 175-179.
Keiver K.M., Ronald K. & Beamish F. W. H. (1984). Metabolizable energy requirements for maintenance and faecal and urinary losses of juvenile harp seals (Phoca groenlandica) Can. J. Zool, 62,769-776.
King J. E. (1983). Seals of the world. British Museum. Comstock Publishing Associates, New York. 119-124.
Klos H.-G. (1966). A note on the birth of an elephant seal, Mirounga leonina, at West Berlin Zoo. Int. Zoo Yearb., 6, 193.
Klos H.-G. (1979). Hand-rearing a Southern elephant seal Mirounga leonina at West Berlin Zoo. Int. Zoo Yrb., 19, 265-266.
Laws R. M. (1953). The elephant seal (Mirounga leonina Linn.) 1. Growth and age. Falkland Isl. Depend. Survey. Scientific report no. 8, London.
Laws R. M. (1956). The elephant seal (Mirounga leonina Linn.) 2. General, social and reproductive behaviour. FIDSSci.Rep.no. 13,1-88.
Laws R. M. (1960). The southern elephant seal (Mirounga leonina L.) at South Georgia. Norsk Hvalfangst. Tid. 49: 466-476, 520-542.
Laws R. M. (1977). Seals and whales of the Sourthern Ocean. Phil. Trans. R. Soc. Lond., B, 279,81-96.
Laws R. M. (1979). Southern elephant seal. In: Mammals in the sea. Rome, FAO, Fisheries Series, 5(2), 106-109.
Ling J. K. (1968). The skin and hair of the Southern elephant seal, Mirounga leonina (L.) 3. Morphology of the adult integument. Aust. J. Zool., 16, 629-645.
Ling J. K. (1969). A review of ecological factors affecting the annual cycle of inland populations of seals. Pacific Science, 23, 399-413.
303

R.A. Kastelein et al.
Ling J. K. (1970). Pelage and molting in wild mammals with special reference to aquatic forms. The quart, rev. ofbiol. State Univ. of New York. Stone Brook. N.Y. 45, 16-54.
Ling J. K. & Bryden M. M. (1981). Southern elephant seal Mirounga leonina Linnaeus, 1758. In: Handbook of marine mammals. Vol. 2 Seals (Eds. S. H. Ridgway and R. J. Harrison), Academic Press, London, 297-327.
Ling J. K. & Thomas C. D. B. (1967). The skin of the Southern elephant seal, Mirounga leonina (L.). 2. Prenatal and early post-natal development and moulting. Ausl.J. Zooi, 15,349-365.
Matthews L. H. (1952). Sea elephant. The life and death of the elephant seal. Macgibbon & Kee, London, pp. 185.
McCann T. S. (1981). Aggression and sexual activity of male southern elephant seals, Mirounga leonina. J. Zool. Land., 195,295-310.
McCann T. S. (1985). Size, status and demography of Southern elephant seal (Mirounga leonina) populations. In: Studies of sea mammals in south latitudes (Eds. J. K. Ling and M. M. Bryden). South Australian Museum. 1-17.
Naumov A. G. & Chekunova V. I. (1981). Energy requirements of Pinnipeds (Pinnipedia). Oceanology, 20(3), 348-350.
Neugebauer W. (1967). Breeding the Southern elephant seal, Mirounga leonina, at Stuttgart Zoo. Int. Zoo Yearbook,,!, 152-154.
Ortiz C. L. (1987). Measurement of protein metabolism in naturally fasting phocids. In: Marine Mammal Energetics (Eds. A. C. Huntley, D. P. Costa, G. A. J. Worthy and M. A. Castellini) Soc.for. Mar. Mamm. Special publ. no. 1,29-42.
Ortiz C. L., Le Boeuf B. J. & Costa D. P. (1984). Milk intake of elephant seal pups: an index of parental investment. Am. Naturalist 124(3), 416^122.
Pascal M. (1985). Numerical changes in the population of elephant seals (Mirounga leonina L) in Kerguelen Archipelago during the past 30 years. In: Marine Mammals and Fisheries (Eds. J. R. Beddington, R. J. H. Beverton and D. M. Lavigne) George Allen & Urwin, London, 170-186.
Prime J. H. & Hammond P. S. (1987). Quantitative assessment of Gray seal diet from faecal analysis. In: Marine Mammal Energetics (Eds. A. C. Huntley, D. P. Costa, G. A. J. Worthy and M. A. Castellini) Soc.for Mar. Mamm. Specialpubl.no. 1, 163-181.
Ronald K., Reiver K. M., Beamish F. W. H. & Frank R. (1984). Energy requirements for maintenance and faecal and urinary losses of the grey seal (Halichoerus grypus). Ca.J. Zooi, 62, 1101-1105.
Schusterman R. J. & Gentry R. L. (1971). Development of a fatted male phenomenon in California sea lions. Developmental psychobiology, 4(4), 333-338.
Sergeant D. E. (1973). Feeding, growth, and productivity of Northwest Atlantic Harp Seals (Pagophilus groentandicus). J. Fish. Board Can., 30, 17-29.
Spalding D. J. (1964). Comparative feeding habits of the Fur seal, Sea lion, and Harbour seal on the British Columbia coast. The Fish. Res. Board of Can. Ottowa, Bulletin no. 146,1-52.
Spotte S. & Adams G. (1979). Note on the food intake of captive adult male Northern fur seals (Callorhinus ursinus). Aquatic Mammals, 7(3), 65-67.
Spotte S. & Adams G. (1981). Feeding rate of captive adult female Northern fur seals, Callorhinus ursinus. Fisher. Bull., 79(1), 182-184.
Ulmer F. A. Jr. (1962). The Southern elephant seal Mirounga leonina in captivity. Int. Zoo Yearb., 4,26-32.
Van Aarde R. J. (1980). Fluctuations in the population of southern elephant seal Mirounga leonina (L.) at Kerguelen Island. 5. Afr. J. Zool, 15(2), 99-106.
304

Chapter 3.2
Aquatic Mammals 1990,1S.4,171-180
The food consumption of Grey seals (Halichoerus grypus) in human care
R. A. Kastelein, P. R. Wiepkema* and N. Vaughan
Zeedierenpark Harderwijk (Harderwijk Marine Mammal Park), Strandboulevard-oost 1,3841AB Harderwijk, Holland * Ethology Section, Department of Animal Husbandry, Agricultural University, PO Box 338,6700 AH Wageningen, Holland
Summary This study concerns the food consumption of a male and a female Grey seal at the Harderwijk Marine Mammal Park. The food intake changes due to age, time of year and reproductive stage and differences in intake due to sex are described and compared to data from other studies.
Introduction Grey seals usually feed in coastal waters. The stomach contents of Grey seals have been studied by several authors (Rae, 1960,1968 and 1973; Mansfield & Beck, 1977; Prime and Hammond, 1987). This research yields information about the prey species of Grey seals and the proportions in which they are eaten in different areas, seasons and years. Grey seals mainly eat fish of four families: salmonids, gadoids, clupeoids and pleuronectids. Sometimes they also eat crustaceans and molluscs. Very little is known about the amount of food consumed per day, or about possible food intake changes due to the time of year, age, the reproductive cycle, and possible sexual food intake differences. This type of data can be derived from food records of animals kept in marine mammal facilities. The Harderwijk Marine Mammal Park has kept Grey seals since 1973. This paper is about the food consumption of a pair of Grey seals during their stay at the park. The results may be useful for other marine mammal facilities who keep or consider keeping this species, for energetic studies, or to assess the impact of Grey seals on fish populations.
Materials and Methods Study animals This study concerns the food consumption of 2 Grey seals {Halichoerus grypus) during their stay at the Harderwijk Marine Mammal Park. The male (code: HgZH002) was estimated to have been born in 1972, found stranded on the Belgian coast in May 1978, and sent to Harderwijk. The female (code: HgZHOOl) was born in September 1973, stranded on the Belgian coast in November 1973 and was also sent to the Harderwijk park.
Study area The animals are kept in an outdoor freshwater pool (40 mx 14mx 1.2m deep). The water temperature varied from 0°C to + 14°C, while air temperature varied from — 15°C to 4- 35°C. Adjacent to the pool, sand areas are available for the animals to haulout. The Harderwijk Marine Mammal Park is located 5° 37' East longitude and 52° 20' North latitude.
Food The animals are fed 2 to 5 times perdayonamixeddiet of, on average, 45% Mackerel {Scomber scombrus), 40% Herring (Clupea harengus), 5% Whiting (Merlangius merlangus), and 10% Squid (Illex spp.), based on weight. Vitamins are added to the fish, after it has been defrosted. During the first or last feed of the day the animals are given as much as they want to eat. Feeding is stopped as soon as the animals start to play with the food instead of consuming it immediately. This is considered a sign of satiety. Records are keep of the amount and type of food consumed during each feed. Daily food intake data of the male between 1979 and 1988 and of the female between 1978 and 1988 form the basis of the present analysis
Results
Age related changes and sexual differences The annual food consumption of the male increased steadily until he reached the age of 15 years (Fig. 1 A). After this, the annual food consumption seemed to stabilize.
The annual food consumption of the female increased until she was 8 years old (Fig. IB). After that, her annual food consumption dropped to around 1400 kg. Although she was pregnant during her 12th and 13th year and delivered two full-grown pups (which died during, or straight after birth), her annual food intake did not differ much from previous years. However, her annual food intake increased by approximately 200 kg during her 14th and 15th year. In these years she delivered live pups which were suckled for a normal 3 week period.
305

R.A. Kastelein et al.
2300-1 2100-
1900-
1700-
1500-
g 1300-
"§ 1100-
~ 900-
iptio
i
o
•
E 500-W c o £ 1900-
£ 1700-
§ 1500" c = 1300-
1100-900-
700-
500-
A. Male
6 7 8 9 10 11 12 13 14 978 Ag< B. Female
• •
15
j(y<
•
16
jar)
•
5 6 7 8 9 10 11 12 13 14 15
197£ J Ag< e(y< ear) Figure 1. The annual food intake of a male (A) and a female (B) Grey seal. Age one represents the first calendar year after the year of birth. The circles indicate years with a birth, but without a suckling period because the pup died during, or soon after, the delivery. The triangles indicate years with a birth followed by a normal 3 week suckling period.
Seasonal changes Between 7 and 11 years of age the food consumption of the male fluctuated only a little during the year (Fig. 2A). The animal ate a little less around February and a little more around December. During these years no mating was observed.
Between the age of 12 and 16 years (years of mating and reproduction) the food consumption of the male started to show marked seasonal fluctuations (Fig. 2B). The animal ate less than average in January and
February and more than average between May and October.
Between the age of 5 and 10 years (years of no reproduction) the food intake of the female showed only small seasonal differences (Fig. 3A). During her 11th, 12th and 13th years (years during which she was carrying a pup, but was not lactating) her food intake was low in the first months of the year, and high between August and October (Fig. 3B). During years in which she gave birth to a live pup and suckled
306

20-
g 10-
I o-1-10-
B 40 30
20
10
0
The food consumption of Grey seals
AGE 7-11
n l f l 5 6 11 12
Month
c o
AGE 12-16
.2 1-10 **-20
-30 -40 -50
C 18-16-
~ 14-O ^ 12 H o>
1 2 3 4 12
5 6 7 8 9 10 TO Month
a> a E
8 6.
4
2
0 1 2 3 4 5 6 7 8 9 10 11 12
Month Figure 2. The deviation (%) of the average monthly food consumption of the male Grey seal; (A) between age 7 and 11 (years without reproduction), and (B) between age 12 and 16 (years with reproduction) and (C) the average monthly outdoor temperature at Harderwijk between 1978 and 1987.
307

20-
c 10' o
I °' a«-20 J
R.A. Kastelein et al.
AGE 5-10
1 2[-|4f-rL 3 I I 5 6 7
B 50 n
40
30 H
20
g 1 0 4
JS 0 > Q - 1 0 -8 8 - 2 0 -
- 30
-40 "
-50 -
8 9 10
11 12
Month
AGE 11-13
1 2 3 4 5
&? Lb 7 8 9 10 11 12
Month
c o
50
40
30 -i
20
10
0 .S
1-10 ^ - 2 0
- 30
AGE 14-15
1 2 7 8
3 4 5 6 TZCF 10
11 12
Month
-40 1
-50 Figure 3. The deviation (%) of the average monthly food consumption of the female Grey seal; (A) between age 5 and 10 (years without reproduction), (B) between age 11 and 13 (years during which the animal was pregnant, but did not suckle a pup), and (C) between age 14-15 (years in which a pup was delivered and suckled for a normal 3 week period).
308

The food consumption of Grey seals
3 5 7 9 11 13 1517 19 2123252729 31 2 4 6 8 10 12 14 16 18 January february Date february
3 5 7 January
9 1113 1517 19 212325,27 29 31 2 4 6 8 10 12 14 16 18 Birth' february Date
O l i i i i i i i i i i i i i i i i i i i I i i i i * i i i i . 1 3 5 7 9 11 13 1517 19 21,23252729 31 2 4 6 8 1 0 121416 18 January Birth february Date
1113 1517 19 21232527 29 31 2 4 6 8 10121416 18 20222426 28 January 'Birth february / \ Date
5 7 9 11 131517 19 21232527 29 31 2 4 6 8 10 12 14 16 18 January Birth february / *V Date
Weaning Separation Weaning Separation
Figure 4. The daily food consumption of the female Grey seal in January and February during years without a birth (A and B), during years with a birth, but without a suckling period (C and D) and during years with a birth followed by a normal 3 week suckling period (E and F).
it for 3 weeks, her food intake was low in January, February and November, and high between March and May, and in October (Fig. 3C).
Changes around birth Daily food consumption of the female in the January and February breeding period, varied during years in which she did not give birth (Figs. 4A and B). In January 1984 the female ovulated and copulated
with the male. In 1985 and 1986 she gave birth to 2 pups, which died during, or soon after birth. Therefore these pups were not suckled. Both in 1985 and 1986 her average food consumption during the last 2 weeks before she gave birth was higher than during the first 2 weeks after the birth (Figs 4C and D). In 1987 and 1988 her average food intake was also relatively high during the last 3 weeks before she gave birth and was reduced to on, or around zero on the
309

R.A. Kastelein et al.
day of the birth (Figs 4E and F). During the 3-week suckling period the female's food intake first increased and then (towards weaning) decreased. After the suckling period and copulation (which occurred on the day of separation of mother and pup), her food intake increased dramatically.
Discussion and conclusions
Age related changes and sexual differences Until the age of 8 years the annual food consumption of both animals increased. After this age the food intake of the male continued to increase, whereas the annual food intake of the non-growing, non-pregnant and non-lactating female dropped and stabilized. Around the age of 8 years the sexual dimorphism became pronounced. At the age of 8 to 12 years, most males in the wild become sexually mature (Piatt et al., 1975), which means that testosterone levels start to influence the growth of the male. Similar sexual differences in food intake are also observed in other sexually dimorphic pinnipeds such as Steller sea lions, Eumetopias jubatus (Kastelein et al., 1990) and South African fur seals, Arctocephalus pusillus (Kastelein etal, 1990).
The annual food intake of the male increased until around the age of 15, and of the female until around the age of 8. This corresponds with the increase in body weight with age of males and females in the wild at the Fame Islands, UK (Piatt et al., 1975). The same changes in growth rate were seen in the west Atlantic population (Mansfield, 1977). However, animals of the west Atlantic population are on average heavier than animals of similar ages in the east Atlantic population.
Seasonal changes The marked seasonal changes in the food intake of the male coincide with the first copulation resulting in a pup. This suggests that the decrease in appetite of the male in January and February is related to reproduction. In the wild, the Grey seal is polygamous (Bonner, 1981), but there is no physically defined territory or associated agonistic behaviour (Peterson, 1968; Cameron, 1969). Bulls station themselves in the water, or around the shoreline, and try to mate with every female in their surroundings that is in oestrus (Davies, 1949). Thus, Grey seal bulls use sexual activity instead of territorial fighting as a reproductive strategy (Andersen et al., 1975; Boness & James, 1979). In the wild, bulls eat almost nothing during the reproductive period because they spend most of their time trying to mate (Bonner, 1981). The breeding season for the males is very long, since births (followed by females coming into oestrus) occur over a period of 2 months. Because the male in the present study was offered as much food as he wanted, it
seems plausible that the reduction in appetite in January and February is caused by endogenous factors. The fact that the food intake was at its lowest during months with a relatively low average temperature (Fig. 2C) supports this idea, since in these months one would expect a high food intake. Keyes (1968) also reports fasting of seals in marine mammal facilities during breeding periods, while Nordoy & Blix (1988) report a reduction in appetite during the breeding period followed by a decline in body weight in a male Grey seal in human care.
Elevated Cortisol levels were measured in adult male Grey seals in January by Sangalang & Freeman (1976). Engelhardt & Ferguson (1979) found increased concentrations of thyroid hormone (T-3), Cortisol and aldosterone in the blood of adult male seals around the breeding period. They suggest that this might be related to mating stress. The results in the present study sugget that it is also likely that the increased levels are correlated with the need to metabolize body fat. Hewer (1964) reports on the loss of blubber and the generally emaciated condition of bulls as they leave the territories after the breeding season. He suggests that the strain of starvation on bulls could relate to the fact that bulls of the Atlantic population only reach a maximum age of 25 years, whereas females can become 35 years old.
Seasonal food intake changes related to the reproductive strategy of the males are also found in other pinniped species. Reproductive males of Steller sea lions (Kastelein et al., 1989), South African fur seals (Kastelein et al., 1990), Californian sea lions, Zalophus californianus (Schusterman & Gentry, 1971), Northern fur seals, Callorhinus ursinus (Spotte & Adams, 1979), Atlantic Harp seals, Pagophilus groenlandicus (Sergeant, 1973), Northern elephant seals, Mirounga angustirostris (Ortiz et al., 1984) also reduce their food intake during the breeding period when they spend most of their time defending their territories or mating.
In the wild, most Grey seal females become pregnant for the first time at the age of 5, and bear their first pup a year later (Hewer, 1964; Piatt et al., 1975). However, the female in the present study did not become pregnant until the age of 11. This was probably due to the fact that the male was not sexually mature before that time. The food intake of the female did not fluctuate much between her 5th and 10th year of age. Over a period of 6 years her food ' consumption was only 13% less than average in February. This means that any ovulations in this period had very little influence on her appetite.
The seasonal changes in the pregnant female's* food intake were probably due to the increase in food requirement due to a growing foetus. The total gestation period is around 351 days. However, for part of this period (around 100 days) the blastocyst is not implanted in the uterus. The moment
310

The food consumption of Grey seals
of implantation is probably influenced by some factors) in the environment. As in most mammals, the growth rate of the foetus of Grey seals increases towards birth (Hewer & Backhouse, 1968). This could explain the increased food intake in the second part of years in which the female in the present study was pregnant (Fig. 3B).
The extreme reduction in food intake in January and February during years of birth followed by lactation reflects the fact that lactating female Grey seals eat very little if at all during the suckling period (Davies, 1949; Cameron, 1969; Boness & James, 1979; Kastelein & Wiepkema, 1988). Over 80% of the females' energy reserves are used to feed their pups (Fedak & Anderson, 1982). The large increase in the female's food intake in the present study between March and May is probably for the fast replenishment of her fat reserves. Also at the Fame Islands (UK), reproductive Grey seal females gain weight most rapidly during March and April (Boyd, 1984). In Northern elephant seals (Mirounga angustirostris) the milk production of the female also accounts for a large part (60%) of the energy expenditure during the suckling period (Costa et al., 1986).
The male in the present showed his recovery after the breeding season by a more gradual increase in food intake between May and October (Fig. 2B). In the wild, the daily weight loss of breeding male Grey seals is approximately two-thirds that of females, who have to meet the high energy demands of suckling a pup (Anderson & Fedak, 1985). Because adult Grey seal females are pregnant almost every year, it might be more important to them to gain weight rapidly after the breeding season, than to the males.
Moult In the wild, Grey seals fast or feed at a reduced rate during the moult (Bonner, 1981). The females moult directly after the suckling period (Mansfield, 1966). The male in the present study moults in April, the female in March. No reduction in food intake during moult could be detected in the food records. In the wild, Grey seals spend much of their time ashore during the moult and therefore cannot feed. At the Harderwijk park the animals also spend a relatively large amount of time on land during the moult, but when food is offered, they still eat a normal amount. Therefore the hormones regulating the moult may prohibit the animals from spending much time in the water, but do not directly influence the appetite. Moreover, in the wild the moult might be synchronized with a season in which the availability of fish is low. In eastern Canada the end of the moult coincides with the moment that schools of Cod, Mackerel and Herring move inshore, and become available for Grey
seals (Mansfield & Beck, 1977). Keycs (1968) reports on pinnipeds fasting in marine mammal facilities during moult periods. However, he does not mention the species.
Changes around birth Single days without food intake are not unusual in Grey seals. However births in the present study were usually announced by a sudden reduction in food intake, or a complete day of fasting. During lactation the food intake increased again and then dropped towards weaning. This could be due to hormonal changes related to oestrus (Kastelein & Wiepkema, 1988). Depending on the density of pups on the breeding grounds, Grey seal mothers remain in the breeding area all the time, or leave after each suckling session, but remain in the vicinity of the breeding site (Boness & James, 1979). This means that in most cases the females do not eat at all during the 3 week suckling period. Therefore, the decrease in appetite seen in the present study, where food was available at libitum, was probably due to endogenous factors. The fact that at Aberdeen Zoo one female fasted for 15 days and another female for 19 days after delivery of a dead pup followed by copulation (Leslie, 1974) supports this idea.
Apart from not taking in food to cover her maintenance metabolism during the suckling period, a female Grey seal loses energy by producing enough milk, which contains 53% fat (Amoroso et al., 1950), to make a pup grow 2.1 kg a day (Kastelein & Wiepkema, 1988). A similar situation is seen in Harp seals, Phoca groenlandica (Stewart & Lavigne, 1984). Engelhardt & Ferguson (1979) found higher thyroid (T-4) levels in nursing as compared to post-nursing Harp seals. T-4 stimulates lipoly sis which is important in milk-producing animals. They also found elevated Cortisol levels in nursing females, and suggest that this might stimulate the mobilization of extrahepatic lipids necessary for the production of fat-rich milk.
The present study shows that in Grey seals, body fat plays an important role as an energy supply, besides temperature regulation (Irving, 1969), streamlining of the body, protection of the body against shocks, and improvement of buoyancy. Sergeant (1973) measured the thickness of the fat layer on Harp seals during several seasons. He showed that in this species the blubber layer of reproductive females increased to 80 mm just before delivery and decreased to 20 mm just after the weaning of the pup. The blubber layer of adult males only changes from 60 to 40 mm. Similar sexual differences in weight loss were observed in Grey seals by Fedak & Anderson (1987). Although blubber provides most of the energy needed, some energy in fasting seals can come from protein metabolism (Ortiz, 1987). This system has the advantage that it does not reduce the thermal insulation.
311

R.A. Kastelein et al.
Limitations in applicability Unfortunately the present study was carried out on only one male and one female which reduced its representative value. However, most feeding patterns found in the present study were present for several years in each animal. Therefore, the findings on these 2 animals may have more general significance.
Although the two Grey seals in the present study come from the east Atlantic population, and were exposed to the same photo-period as they would have been in the wild, so far the young have been born at the end of January. In the wild, pups of the east Atlantic population are usually born in autumn, and pups of the Baltic population are born in February and March (Davies, 1957). The reason for this shift in breeding season is not clear. Maybe seasonal differences in food availability in the wild play a role in determining the breeding season (Rae, 1968; Bigg, 1973; Bigg & Fisher, 1975), whereas the food availability in the park was constant. This suggests that other or additional factors than length of day influence the timing of blastocyst implantation and oestrus. Boyd (1984) shows that at the Fame Islands (UK) implantation coincides with a rapid increase in the female's body weight.
Unfortunately the animals in the present study were never weighed, but a graph from Piatt et al. (1975), in which the average body weight of males and females of the Atlantic Grey seal population are plotted in relation to age, allows estimation of their body weight at different ages. At age 7, the male (estimated weight 150 kg) ate on average 2.4% of his body weight per day. At age 16 (estimated weight 225 kg) he ate on average 2.7% of his body weight per day. At the age of 6, the female (estimated weight 100 kg) ate 3.5% of her body weight per day. At age 10 (estimated weight 150 kg) she ate 2.4% of her body weight per day. All intake averages are taken over the entire year and therefore include the seasonal fluctuations.
Mansfield & Beck (1977) report that in the wild female Grey seals of all ages require on average 4% and males 4.5% of their body weight per day. They state that there is little difference in food intake between adults and young in proportion to their body weight. The data in the present study support the idea that adult males eat relatively more than adult females, but show that the female ate proportionally more when she was growing, than when she was not growing, pregnant or lactating. The food intake relative to body weight of the Grey seals in the present study is lower than the estimates by Mansfield & Beck (1977). The difference between their data and the results of the present study could be due to a difference in activity level between animals in the wild and in a pool.
However, the estimates of Mansfield & Beck are based on the maximum weight of stomach contents
of animals that were found in the wild. The lower average energy requirements of the animals in the present study suggest that Grey seals do not eat every day (which is the experience of most marine mammal facilities). Therefore the estimates of Mansfield & Beck (1977) are probably too high. The hypothesis that Grey seals in the wild do not eat every day as well is supported by findings of extremely large food amounts in stomachs. This may compensate for days without food. Mansfield & Beck (1977) found a 245 kg, 11-year-old adult male with 13.5 kg of Herring in its stomach, which is 5.5% of its body weight. Bonner (1972) reports 10 kg of Salmon in the stomach of a bull Grey seal. Ivarsson (in Rae, 1973) found a Grey seal with around 30 Eels (Anguilla anguilla) in its stomach, weighing about 15 kg.
Nordey & Blix (1988) fed a young male Grey seal thawed Capelin (Mallotus villosus) and vitamins for 3 years. This animal ate 6.0% of his body weight per day at age 2,6.1 % at age 3, and 5.7% at age 4. These high percentages probably reflect the high growth rate of Grey seals during the first 7 years (Fig. 5). The male in the present study arrived at the Harderwijk park at the age of 6, so no data before that age are available. Ronald et al. (1984) estimated an average daily food requirement of 3.0 to 3.2% of body weight for juvenile and 1.5% for adult Grey seals. However, their study was done during a period of only 6 months, and they do not report at which time of year. This period is too short, because the food intake of Grey seals fluctuates greatly depending on the season. For example, the average daily food consumption of the male in the present study at age 16 in February, when the animal is at his heaviest (estimated 250 kg), was 1.2% of his body weight. One month later, after the breeding season when the animal was very lean (estimated 200 kg), his daily food requirement rose to 4.4% of his body weight (weight change based on Anderson & Fedak, 1985). Therefore, studies of average energy requirements (as summarized in Spalding, 1964), should be long term studies involving growing and adult individuals of both sexes and females in different stages of reproduction.
Also at the Harderwijk Marine Mammal Park (the same climate and roughly the same diet) an adult male South African fur seal {Atotocephaluspusillus), who was mainly kept indoors, ate a maximum of 3.8% of his body weight (261 kg) per day (Kastelein et al., 1990), and an adult Steller sea lion {Eumetopias jubatus), who was always kept outdoors, ate 3.6% of his body weight (550 kg) per day (Kastelein et al., 1989). Based on these few findings, otarids of a particular sex, age class, and in a particular reproductive state seem to have higher energy requirements than phocids of the same category. This difference in proportional food intake could be due to a difference in activity level, and may be due to the fact that phocids
312

The food consumption of Grey seals
have a thicker blubber layer lhan olurids relative lo body weight (Irving, 1969).
In the wild. Grey seals may need more food per day than the animals in the present study, because at the park the animals did not have to dive in order to get their food. However, the animals in the present study do swim a lot, even in the confined space of a pool, and the climate at the Harderwijk Park is the same as in a large part of the Grey seal's distribution range (Davies, 1957).
Food intake quantities cannot simply be compared on the basis of the wet weight of different food species. Different species of fish have a different energy content per unit of weight (Costa, 1987; Prime & Hammond, 1987), and 2 fish of the same species can also have different nutritional or caloric values depending on the season and geographical area in which the fish were caught. Although the caloric content of the food eaten by the Grey seals in the present study was not determined, the energy requirement can be calculated when using the average caloric content (over different seasons and in different geographical areas) of the species fed, and and the average proportions in which they were fed.
This study indicates that it is risky to apply one simple percentage of body weight to calculate the daily food requirement of an entire population of Grey seals. An attempt was made by Fedak & Hiby (1985). To assess this requirement reliably, one needs information on the geography, water temperature, climate, season, the diet and its caloric content, the digestive efficiency of the different prey species (Keiver et al., 1984; Ronald et al, 1984), and the size, age and sexual structure of a population. To study the impact on fish populations, information on the dynamics of the fish stocks is also needed.
Acknowledgements We thank Teun Dokter and Piet Mosterd for their advice and Irma Verhoeven, Ida Smit and Brigitte Slingerland for the partial analysis of the data and the drawing of the graphs. We thank all animal care personnel for accurately recording the food consumption over the years. The mean monthly air temperatures were provided by the Royal Dutch Meteorological Institute (KNMI).
References Amoroso E. C , Goffin A., Halley G. Matthews L. H. &
Mathews D. J. (1950) Lactation in the grey seal. J. Physiol. (London) 113,4-5.
Anderson S. S., Burton R. W., Summers C. F. (1975) Behaviour of grey seals (Halichoerus grypus) during a breeding season at North Rona. J. Zool. Land. \11, 179-195.
Andersen S. S. & Fedak M. A. (1985) Grey seal males: energetic and behavioral links between size and sexual success. An. Behav. 33, 829-838.
Higg M. A. (1973) Adaptations in the breeding of the I larbour seal, I'hoca vilulinu../. Rvprod. h'crt., Suppl. 19, 131 142.
Bigg M. A. & Fisher II. D. (1975) ElTect ol'pholoperiod on annual reproduction in female Harbour seals. Rapp. P. v. Reun. Cons. int. Explor. Mer 169, 141 144.
Boness D. J. & James H. (1990) Reproductive behavior of the Grey Seal (Halichoerusgrypus) on Sable Island, Nova Scotia. J. Zool., London. 188,477-500.
Bonner W. N., (1981) Grey seal, Halichoerus grypus Fabricius, 1791. In: Handbook of Marine Mammals. Vol. 2: seals (eds S. Ridgway & R. Harrison) Academic Press, London, 111-144.
Boyd I. L. (1984) The relationship between body condition and the timing of implantation in pregnant Grey seals (Halichoerusgrypus). J. Zool., London. 203,113-123.
Cameron A. W. (1969) The behavior of adult gray seals (Halichoerus grypus) in the early stages of the breeding season. Can. J. of Zool. 47,229-233.
Costa D. P. (1987) Isotopic methods for quantifying material and energy intake of free-ranging marine mammals. In: Marine Mammal Energetics, (eds A. C. Huntley, D. P. Costa, G. A. J. Worthy & M. A. Castellini) Soc.for Mar. Mamm. Special publ. no. 1,29—42.
Costa D. P. & Gentry R. L. (1986) Free-ranging energetics of Northern fur seals. In: Fur seals. Maternal strategies on land and al sea, (eds R. L. Gentry & G. L. Kooyman) Princeton University Press, 79-101.
Costa D. P., Le Boeuf B. J., Huntley A. C. & Ortiz C. L. (1986) The energetics of lactation in the Northern elephant seal, Mirounga angustirostris. J. Zool., Land. 209,21-33.
Coulson J. C. & Hickling C. (1964) The breeding biology of the Grey Seal on the Fame Islands. J. Anim. Ecol. 33, 485-512.
Davies J. L. (1949) Observations on the Grey Seal (Halichoerus grypus) at Ramsey Island, Pembrokeshire. Proc. Zool. Soc. Lond. 119,673-692.
Davies J. L. (1956) The Grey Seal at the Isles of Scilly. Proc. Zool. Soc. Lond. 127,161-166.
Davies J. L. (1957) The geography of the Gray seal. J. of Mammal. 38(3), 297-310.
Engelhardt F. R. & Ferguson J. M. (1979) Adaptive changes in Harp seals, Phoca groenlandica, and Grey seals, Halichoerus grypus, during the post-partum period. Aquatic Mammals, 7(3), 83-92.
Fedak M. A. & Anderson S. S. (1982) The energetics of lactation: accurate measurements from a large wild mammal, the Grey seal (Halichoerus grypus). J. Zool., Lond. 198,473^79.
Fedak M. A. & Anderson S. S. (1987) Estimating energy requirements of seals from weight changes. In: Marine Mammal Energetics, (eds A. C. Huntley, D. P. Costa, G. A. J. Worthy & M. A. Castellini) Soc. for Mar. Mamm. Special publ. no. 1, 205-226.
Fedak M. A. & Hiby A. R. (1985) Population requirements of seals. In: The impact of Grey and Common seals on North sea resources, (eds P. S. Hammond & J. Harwood) Rep. to the Comm. ofE.E.C. contract. ENV665 UK.
Fogden, S. C. L. (1971). Mother-young behaviour at Grey seal breeding beaches. J. Zool, Lond. 164,61-92.
Hewer H. R. (1964) The determination of age, sexual maturity, longevity and a life-table in the Grey seal (Halichoerus grypus). Proc. Zool. Soc. Lond. 142, 593-624.
313

R.A. Kastelein et al.
Hewer H. R. & Backhouse K. M. (1968) Embryology and foetal growth of the Grey Seal, Halichoerus grypus. J. Zool.. Lond. 155,507-533.
Irving L. (1969) Temperature regulation in marine mammals. In: Marine Mammals (ed. H. T. Andersen) Academic Press, New York, 1,147-174.
Kastelein R. A. & Wiepkema P. R. (1988) Case study of the neonatal period of a Grey seal pup (Halichoerus grypus) in captivity. Aquatic Mammals, 14(1), 33-38.
Kastelein R. A., Vaughan N. & Wiepkema P. R. (1990). The food consumption of Steller seal lions (Eumetopias jubatus). Aquatic Mammals, 15(4), 137-144.
Kastelein R. A., Verhoeven I. & Wiepkema P. R. (1990) The food consumption of South African fur seals (Arctocephalus pusUlus) in human care. Int. Zoo Yearb. Vol. 29 (in press).
Keiver K. M , Ronald K. & Beamish F. W. H. (1984) Metabolizable energy requirements for maintenance and faecal and urinary losses of juvenile harp seals (Phoca groenlandica). Can. J. Zool. 62,769-776.
Keyes M. C. (1968) The nutrition of pinnipeds. In: The behavior and physiology of pinnipeds, (eds R. J. Harrison, R. C. Hubbard, R. S. Peterson, C. E. Rice & R. Schusterman) Appleton-Century-Crofts, 359-399.
Leslie G. (1974) Breeding the Grey Seal at Aberdeen Zoo. Int. Zoo Yearb. 14,130-131.
Mansfield, A. W. (1966) The grey seal in eastern Canadian waters. Ca. Audubon Mag. (Nov-Dec), 161-166.
Mansfield A. W. (1977) Growth and longevity of the grey seal Halichoerus grypus in eastern Canada. Marine Mammal Committee. CM 1977/N:6.
Mansfield A. W. & Beck B. (1977) The grey seal in eastern Canada. Dept. of Fish, and the Emir, of Canada. Technical Report No. 704.
Nordey E. S. & Blix A. S. (1988) Sources of error in estimating food requirements of seals. Polar Record 24, 62-64.
Ortiz C. L. (1987) Measurement of protein metabolism in naturally fasting phocids. In: Marine Mammal Energetics, (eds A. C. Huntley, D. P. Costa, G. A. J. Worthy & M. A. Castellini) Soc. for Mar. Mamm. Special publ. no. 1, 29-42.
Ortiz C. L., Le Boeuf B. J. & Costa D. P. (1984) Milk intake of elephant seal pups: an index of parental investment. Am. Naturalist 124,416-422.
Peterson R. S. (1968) Social behaviour in pinnipeds with particular reference to the Northern fur seal. In: The behavior and physiology of pinnipeds, (eds R. J. Harrison, R. C. Hubbard, R. S. Peterson, C. E. Rice & R. J. Schusterman) Appleton-Century-Crofts, New York, 3-53.
Piatt N.E.,Prime J. H.&WitthamesS.R. (1975) The ageof the Grey seal at the Fame Islands. Trans. Nat. Hist. Soc. Northumb. 42(4), 99-106.
Prime J. H. & Hammond P. S. (1987) Quantitative assessment of Gray seal diet from faecal analysis. In: Marine Mammal Energetics, (eds A. C. Huntley, D. P. Costa, G. A. J. Worthy & M. A. Castellini) Soc. for Mar. Mamm. Special publ. no. 1, 163-181.
Rae B. B. (1960) Seals and Scottish fisheries. Mar. Res. Edinburgh 2,1-39.
Rae B. B. (1968) The food of seals in Scottish waters. Mar. Res. Edinburgh 2,1-23.
Rae B. B. (1973) Further observations on the food of seals. J. Zool., Lond. 169,287-297.
Ronald K., Keiver K. M., Beamish F. W. H. & Frank R. (1984) Energy requirements for maintenance and faecal and urinary losses of the grey seal (Halichoerus grypus). Can. J. Zool. 62,1101-1105.
Sangalang G. B. & Freeman H. C. (1976) Steroids in the plasma of the grey seal, Halichoerus grypus. Gen. Comp. Endocrinol. 29,419^122.
Schusterman R. J. & Gentry R. L. (1971) Development of a fatted male phenomenon in California sea lions. Developmental psychobiology 4(4), 333-338.
Sergeant D. E. (1973) Feeding, growth, and productivity of Northwest Atlantic Harp Seals (Pagophilus groenlandicus). J. Fish. Board Can. 30,17-29.
Spalding D. J. (1964) Comparative feeding habits of the Fur seal, Sea lion, and Harbour seal on the British Columbia coast. The Fish. Res. Board of Can. Ottowa, Bulletin no. 146, 1-52.
Spotte S. & Adams G. (1979) Note on the food intake of captive adult male Northern fur seals (Callorhinus ursi-nus). Aquatic Mammals 7(3), 65-67.
Stewart R. E. A. & Lavigne D. M. (1984) Energy transfer and female condition in nursing harp seals (Phoca groenlandica). Holarctic Ecology!, 182-194.
314

Chapter 3.3
Food consumption and growth of harbour seals (Phoca vitulina)
R.A. Kastelein1, C. Staal1 and P.R. Wiepkema2
1 Harderwijk Marine Mammal Park, Strandboulevard Oost 1,3841 AB Harderwijk, The Netherlands
2 Emeritus Professor of Ethology, Wageningen Agricultural University, Stationsweg 1, 6861 EA Oosterbeek, The Netherlands
Summary
The food consumption of 15 harbour seals at the Harderwijk Marine Mammal Park is described. There was a great deal of individual variation in the annual food consumption of males, but generally it increased from around 950 kg at the age of 1 year to around 1200 kg at the age of 13 years. The annual food consumption of the non-reproductive females also varied much between individuals, but generally increased from around 950 kg at the age of 1 year to around 1000 kg at the age of 12 years. A systematic seasonal fluctuation occurred in the food intake of adult males. They ate less than the annual average between January and April, more than average in May, around average between June and August and more than average between September and December. Mating took place in June and July. Moult usually occurred in August. A slightly different systematic seasonal fluctuation occurred in the food intake of adult non-reproductive females. They ate generally less than the annual average between January and April, around average in May and less than average in June and July, and more than average from August to December. Moult usually occurred in July. The reproducing female consumed less than average between November and May. After delivery of the pup in May, her food intake increased to above average. The animals were weighed relatively infrequently. In general, the heavier an animal, the lower its food intake as a percentage of body weight.
Key words: pinniped, phocid, energetics, body weight
Introduction Several authors have examined the stomach contents of harbour seals and the fish oto-
The harbour seal (Phoca vitulina) has the liths in their faeces (Scheffer and Sperry, widest distribution of all phocids and inhab- 1931; Havinga, 1933; Sergeant, 1951; Spald-its both the North Atlantic and the North ing, 1964; Rae, 1968 and 1973; Harkonen, Pacific Oceans (Bonner, 1972). In many areas 1987; Payne and Selzer, 1989). Through this harbour seals are thought to compete with research, information about the prey species the commercial fisheries for fish (Scheffer and the proportions in which they are eaten and Sperry, 1931; Havinga, 1933; Fisher, has become available. Compared to this 1952; Spalding, 1964; Bonner, 1972; Ashwell- knowledge on diet composition, relatively Erickson and Eisner, 1981; Makhnyr and little is known about the amount of food Perlov, 1988; Payne and Selzer, 1989). To consumed per day, or about fluctuations in assess the level of competition involved, in- food intake (Ashwell- Erickson and Eisner, formation is needed about the diet and daily 1981; Renouf et ah, 1988; Renouf and Nose-energy requirements of harbour seals. worthy, 1990). This kind of data can be de-
315

R.A. Kastelein et al.
Figure 1. One of the harbour seals in winter. Note the ice on the mystacial vibrissae (Photo: Henk Merjenburgh).
rived partly from the food records of animals kept in zoos. The Harderwijk Marine Mammal Park has housed harbour seals and recorded their daily food consumption and occasional body weights since 1977. The aim of this study, therefore, is to describe the food consumption and growth of these seals.
Materials and methods
parks. Two animals were born at the Harderwijk park. Body weight measurements were generally taken on arrival at the park, or when the animals were transported within the park. Until 1995 no pups were born at the park. This was probably due to reproductive mal-functioning of the males. Some of the females became pregnant soon after new males were introduced in 1994.
Study animals The study animals were 15 (8 males and 7 females) harbour seals at the Harderwijk Marine Mammal Park (Fig. 1; Table 1). Except for 2 animals, they originated from the east Atlantic Ocean, and came to Harderwijk either directly from the wild or from other
Study area The animals were kept in an outdoor freshwater pool (40 m x 14 m, 1.2 m deep) with a surrounding beach. The average monthly water temperature varied between 4°C in winter and 18°C in summer, while the average monthly air temperature varied be-
316

Food consumption of harbour seals
Table 1. The characteristics of the harbour seals of which the food consumption and growth were recorded. Birth dates of animals in parks are known precisely, those of animals originating from the wild were estimated from body size on arrival. All animals but one (animal 003 died on 26-6-1988) were at the park until the end of the study period.
Animal Gender Date of birth Date of arrival at Harderwijk
PvZHOOl PvZH002 PvZH003 PvZH004 PvZH009 PvZH013 PvZHOU PvZH015 PvZH016 PvZH017 PvZH018 FVZH019 PvZH020 PvZH023 FVZH025
F M F F M M M F M F F M M F M
1973 1973 1973 1984
02-07-1981 11-06-1992 00-07-1982 00-07-1987 00-06-1994 26-05-1994
1987 1987 1987
06-05-1996 22-06-1997
24-05-1977 24-05-1977 24-05-1977 06-09-1984 27-10-1986 01-12-1993 03-03-1994 03-03-1994 12-09-1994 06-10-1994 11-10-1994 11-10-1994 11-10-1994 Pup of 018x019 Pup of 018
tween -0.3°C in February and 17.5°C in July (Fig. 4). The Harderwijk Marine Mammal Park is at 5°37' E and 52°20' N.
Food The animals were fed 3 to 6 times per day on a mixed diet of on average 45% mackerel (Scomber scombrus), 40% herring (Clupea ha-rengus), 5% whiting (Merlangius merlangus), and 10% squid (Illex spp.), based on weight. Multi-vitamins (Seavit®) were added to this diet. During the last feed of the day the animals were allowed to eat as much as they wanted. Feeding was stopped as soon as the animal began to play with the food instead of consuming it immediately. After each meal, the amount of each fish species eaten per seal was recorded in kg.
Statistics The seasonal fluctuations in food intake be
tween years were tested with the Kendall's coefficient of concordance test. The average daily food intake of each month of a year was given a rank number from 1 to 12.
Results
Age related changes and sexual differences in food consumption The 2 pups began to eat during the year of birth (480 and 680 kg). The annual food consumption of the males varied between individuals, but generally increased from around 950 kg at the age of 1 year to around 1200 kg at the age of 13 years (Fig. 2). The annual food consumption of the non-reproductive females varied also between individuals, but generally increased from around 950 kg at the age of 1 year to around 1000 kg at the age of 12 years. The annual food intake of the reproductive female was
317

R.A. Kastelein et al.
1500 -
_ 1300-
food
con
sum
ptio
n
o
o
o
o
o
o
ual
£ 500-
300-
•A"''
•
1 1 1
f""--"A AX*
\ *' A -
1 1 1
A
A A \
' ^>^^LA^^ \ 1 J* y *""\A v^ 7jr A--"""j
? * 'r •••.. A \ ,• / '. \ \ .--A.. / X /
A A \ / • .A A A ' '« . /
'A
\—•— Males
\ / A
A Females |
— i — i • i • i — i — i
10 12 14 16 18 20 22 24 Age (year)
Figure 2. The annual food consumption of 8 male and 7 female harbour seals at Harderwijk Marine Mammal Park. Data points of the same individual are connected. * Year in which a pup was born and suckled.
around 1500 kg in one year, and around 1150 in the other.
Seasonal changes The males showed a seasonal fluctuation in their food intake. The seasonal food intake fluctuations of male 002 are representative of the fluctuations in the food intakes of the other adult males. The fluctuations returned almost every year (Kendall's coefficient of concordance test: x? = 73.85; p < 0.001). Between the ages of 5 and 22 years, male 002 generally ate less than the annual average between January and April, more than average in May, around average between June and August and more than average between September and December (Fig. 3 a). Mating occurred in June and July. The males usually moulted in August. They visibly lost weight during the mating and moulting period.
A slightly different seasonal fluctuation occurred in the food intake of the females. The seasonal food intake fluctuations of female
001 are representative of the fluctuations in the other adult non-reproductive females (Kendall's coefficient of concordance test: ~£ = 80.78; p < 0.001). Between the ages of 5 and 22 years, non-reproductive female 001 generally ate less than the annual average between January and April, around average in May, and less than average in June and July. Between August and December she consumed more than average (Fig. 3 b). The females usually moulted in July. Female 018 reproduced and suckled her pups in 2 successive years. During those years she consumed less than average between November and May. After delivery of the pups in May, her food intake increased to above average (Fig. 3 c).
The seasonal air and water temperature changes at Harderwijk are shown in figure 4.
Growth The animals were weighed relatively infrequently (Fig. 5).
318

Food consumption of harbour seals
Daily food consumption as a percentage of body weight The average daily food consumption over the calendar month in which each animal was weighed was compared to its weight. The relationship between body weight and average daily food consumption as a percentage of body weight both for males and females is shown in figure 6. In general, the heavier an animal, the lower its proportional food intake.
Discussion and conclusions
Food consumption and growth The observed difference in average annual food consumption between the males and females of similar ages was probably related to sexual dimorphism in weight. Ashwell-Erickson and Eisner (1981) found that the weight difference between male and female Pacific harbour seals increased until they were 10 years old, after which the difference stabilized at around 20 kg (males reached their maximum weight at 130 kg and females at 110 kg). Atlantic harbour seals are smaller than Pacific harbour seals of the same age (McLaren, 1993). Harkonen and Heide-J0rgensen (1990) found that adult male Northeast Atlantic harbour seals weigh around 72 kg (aged 13 years); adult females weigh 62 kg (aged 18 years). However, these weights are from stranded seals which died in the 1988 epizootic, and are thus not representative for healthy seals of that population.
Seasonal changes Males in the present study ate around average between June and August (during the breeding season and moult). In spite of this, they visibly lost weight, probably due to a higher activity level. Their increased food intake between September and December probably served to restore their fat reserves.
Females ate less than usual during the breeding season and moult; like in the males, their increased food intake between August and December probably served to restore their fat reserves. In the wild, harbour seals probably eat little during the breeding season. Only 5 of 45 stomachs of east Pacific harbour seals, collected during the pupping period, contained food (Fisher, 1952). The low food intake of the males and females in the present study between January and April coincided with time of year at which they had a relatively thick insulating blubber layer and were not very active.
During the mating season in July, the average body weight of east Atlantic harbour seal males decreased from 72 kg to 62 kg (Harkonen and Heide-Jorgensen, 1990). Ashwell-Erickson and Eisner (1981) found that the food consumption of captive adult Pacific harbour seals was 3% of body weight between April and August, increased to 8% between November and January, and then decreased. The blubber thickness of adult male harbour seals reduces during the reproductive period (Pitcher, 1986).
In the wild, males spend much of their time ashore during the breeding season, and do not feed as often as they do in other seasons. The fact that the animals of the present study showed seasonal fluctuations in their food intake even though they were fed ad lib. suggests that these fluctuations are regulated by an internal endocrine rhythm. This idea is supported by the fact that the testes of wild male harbour seals are larger in the breeding season than in the rest of the year (Harkonen and Heide-Jorgensen, 1990). Most of the study animals were mature during part of the study period. In the east Atlantic, males reach maturity when they are 4-5 years old and 130 cm long (Harkonen and Heide-Jor-gensen, 1990). Markussen et al. (1990) found
319

R.A. Kastelein et al.
A. 6 0 -
4 0 -
2 0 -
-40
Male 002 5 - 2 2 years
^ ^
Mating Mriod
— 1
|
1 Moult period
J F M A M
60 E
5 0 -
4 0 -
3 0 -
^0 •
1 0 -
- 1 0 -
-?n-
- 3 0 -
-40
- 5 0 -
-60
Female 001
5 - 2 2 years
| J
1 1 A 1
J
Moult
V 1 t
Mating
1 1
A S C N c Month
1 \ ; 3 < ) 1 i [ 3
c. 1 0 0 -
8 0 -
6 0 -
2 0 -
-20 •
- 4 0 -
- 6 0 -
- 8 0 -
-100-1
Female
9 - 1 0 j
018
ears
I H - |
i Puppin
i S uck
, 1
| 1 ' 1 '
ing
N D
Month
Figure 3. Deviation of the average monthly food intake of a) male 002 between the age of 5 and 22 years (n = 18)and b) of female 001 between the age of 5 and 22 years (n = 16; only non-reproductive years are included), and c) of female 018 at the ages of 9 and 10 years (n = 2; she reproduced and suckled in both years). The bars indicate the standard deviations.
320

Food consumption of harbour seals
Figure 4. Average monthly air and water temperatures at the study area and the minimum and maximum average monthly sea surface temperatures which wild harbour seals may encounter in their distribution area (depending on where they live).
no difference in maintenance requirements between individuals or age classes, or between seasons in harbour seals. However, this may have been because their 4 study animals were very young; they weighed between 21 and 55 kg and must have been immature. Walker and Bowen (1993) describe adult male harbour seals which lost up to 24% of their body weight during the breeding season, while subadult animals in the same area remained at the same weight. This suggests that food is available, but that adult males stop or reduce feeding during the mating season, although they do enter the water (Thompson et al., 1989). Adult males may also lose weight through increased activity during aquatic mating (Reil-ly and Fedak, 1991). In zoos, adult male harbour seals are very active during the breeding and moulting seasons (Renouf, 1993).
Harbour seal pups in the east Atlantic Ocean
are mainly born in June and suckling lasts for 4-6 weeks until the end of July when ovulation occurs. Pups are abandoned at weaning (Bonner, 1972; Bigg, 1981; Harko-nen and Heide-Jorgensen, 1990; Reijnders, 1990). Despite the fact that, unlike most larger phocid species, female harbour seals do feed during lactation, female East Atlantic harbour seals lose on average 26 kg (35% of body weight) during the lactation period (Harkonen and Heide-Jorgensen, 1990); this is 79% of their stored fat and 20% of their stored protein (Bowen et al, 1992). Most of the females in the present study were mature but did not reproduce, except for one at 9 and 10 years of age. In the east Atlantic, females become sexually mature at the age of 3-4 years and a body length of 127 cm (Harkonen and Heide-Jorgensen, 1990). The females in the present study did not reproduce, but showed seasonal fluctuations in food consumption. Pseudopregnancy in fe-
321

R.A. Kastelein et al.
140
120
100-1 "3
£ 80 H O)
1 o
CQ
40
20
- Males * Females
' 3 animals
T — i — i — i — i — i — i — i i — r — i — i — i — i i — i — i — i — i i—i i — i — I
0 2 4 6 8 10 12 14 16 18 20 22 24 Age (year)
Figure 5. The relationship between age and body weight of 8 male and 6 non-reproducing female harbour seals at Harderwijk Marine Mammal Park. Measurements of the same animal are connected by lines. Three newly born animals (1 female and 2 males) all weighed 13 kg and the points on the graph overlap.
o
e a
S o
^•s Is? O (A O) IB
&
I
10 i
9
8
7 -
6 -
5
4 -
3
2
Males * Females
-i—i—i—i—i—i—i—i—r
10 20 30 40 50 60 70 80 90 100 110 120 130 Body weight (kg)
Figure 6. The relationship between body weight and average daily food consumption as a percentage of body weight of 5 male and 5 non-reproducing female harbour seals at Harderwijk Marine Mammal Park. Data points of the same individual are connected.
322

Food consumption of harbour seals
male harbour seals of the East Pacific lasts for about 3 months, and oestrus occurs only once a year (Bigg, 1973; Bigg and Fisher, 1974). Bigg suggests that the selective factor which controls regional variation in reproductive timing may be geographical variation in the seasonal availability of food (shrimp) for newly weaned pups. The timing of oestrus seems to be influenced by the photoperiod (Bigg and Fisher, 1975).
Renouf et al. (1988) found seasonal variations in food consumption of captive West Atlantic harbour seals which were fed ad lib., but combined the intake of animals of various sexes and ages to calculate the seasonal changes. The above-mentioned studies suggest that males and females have slightly different cycles in food consumption, and that immature animals may not experience seasonal food intake changes. Renouf and Noseworthy (1990) found 2 cycles in the food consumption of harbour seals. Food intake was at its lowest during the breeding season in July, and then peaked at the end of the moult in late August, staying high until the end of September. Thereafter, food consumption fell progressively. The fluctuations in the food intake of the reproducing female in the present study were similar to those described by Renouf and Noseworthy (1990) as far as timing is concerned.
The blubber thickness of wild adult male harbour seals decreases during the moult (Pitcher, 1986). In the wild, moult of the adult pelage usually occurs soon after the breeding season, but there is individual variation in the date and pattern of moult (Stutz, 1967; Bonner, 1972; Ling, 1972). Serum Cortisol levels reach a maximum just before or during the main period of shedding of hair, and decrease abruptly during the main period of rapid growth of hair. Cortisol favours fat catabolism. Serum thyroxine levels in
crease in the period of maximum hair growth (Riviere et al, 1977; Ashwell-Erick-son et al, 1986), probably increasing metabolic rate. Harbour seal males around Orkney, UK, hauled out every day during moult (Thompson et ah, 1989). In contrast, females spent more time than usual at sea during moult. This difference may explain why the non-reproducing females in the present study began to eat more than average in August, while the males did so in September. High skin temperatures may increase the speed of moult (Feltz and Fay, 1966; Ling and Bryden, 1981). In the present study, females moulted in July, and males in August; wild female harbour seals complete their moult about 3 weeks earlier than males (Thompson and Rothery, 1987). Ashwell-Erickson and Eisner (1981) found that metabolism in harbour seals during moult was reduced to 83% of pre-moult levels. This would allow the animals to stay on land without food for longer than usual.
Daily food consumption as a percentage of body weight In general, the larger an animal, the lower the average daily food consumption as a percentage of body weight under similar environmental conditions and with a similar diet. The smaller the animal, the higher the body surface to volume ratio, and thus the more thermal energy the animal loses to its environment. Ashwell-Erickson and Eisner (1981) found that basal metabolism in harbour seals declined with increasing age (and thus with increasing weight), and that smaller animals, which were usually still growing, required extra food.
The relationship between body weight and average daily food consumption as a percentage of body weight in the seals in the present study is in agreement with the maximum stomach contents weights found in
323

R.A. Kastelein et al.
wild harbour seals. Spalding (1964) found a maximum of 3.15 kg of food in the stomach of a 28 kg (growing) harbour seal; it had eaten 11% of its body weight. Havinga (1933) found stomach contents weighing 5.7 kg in a 70 kg harbour seal; the food was 8% of its body weight. The largest stomach content described by Scheffer and Sperry (1931) was of a 86 kg male harbour seal with 3.8 kg of food in its stomach (4.4% of body weight). The maximum stomach content is not necessarily equal to the animal's daily food requirement, as it is unknown how often this species feeds in the wild and how quickly the stomach is emptied. However, the data suggest that the harbour seal is able to eat its daily food requirement in one meal, and can take advantage of patches of prey. It is also possible that harbour seals in the wild require more food than captive conspecifics of the same age and body weight.
Ashwell-Erickson and Eisner (1981) describe the food consumption of a male Pacific harbour seal. Food intake declined from a mean value of 13% of body weight during the first year to a mean of 3% of body weight at the age of 9 years. These values agree with those in the present study. Havinga (1933) describes a food consumption of 5% of body weight for a 30 kg harbour seal, and Scheffer (1950) 6% for a 32 kg harbour seal. These values are low compared to those of animals in the present study of similar size, perhaps because of short sampling periods in the other studies. Due to the seasonal variations in food intake, sampling to determine the average daily food intake of harbour seals should continue for at least one year. Based on the contents of stomachs of wild harbour seals, Havinga (1933) estimated that the seals required on average 1800 kg of fish per year per animal. This is much more than the animals in the present study consumed. Perhaps wild harbour seals do not feed every
day, or eat varying amounts of food, or need more food due to a high activity level.
Ecological significance Can information from the present study be used to determine the energetic requirement of harbour seals in the wild? The food consumption of phocids is probably mainly determined by the water temperatures they encounter, the energy content and digestibility of their diet, their activity level and the food availability.
Between June and August, the water temperatures in the present study were higher than the maximum sea surface temperatures experienced by wild harbour seals in their distribution area (Fig. 4). Temperatures experienced by wild harbour seals are probably within their thermoneutral zone. Hart and Irving (1959) give a lower critical temperature for 22-33 kg harbour seals in water of 20°C. Miller et al. (1976) give thermoneutral zones for two few-weeks-old (12-15 kg) harbour seals in water (12 - 34°C for one animal and 19 - 25°C for the other). Assuming that the upper critical value of 25°C is also valid for the adult study animals, the harbour seals in the present study probably did not consume more energy than their wild conspecifics due to water temperature differences.
Air temperature may also affect the energy requirements of seals, either directly or indirectly by influencing their haul-out behaviour. Watts (1992) showed that the number of harbour seals hauled out declined sharply when seals gained net heat from their environment. Hart and Irving (1959) report a lower critical temperature for 22-33 kg harbour seals in air of 2°C. Miller and Irving (1975) give a lower critical temperature of 3°C for less than 5-week-old (10-13 kg) harbour seal pups and -5°C for 3-5 month-old
324

Food consumption of harbour seals
(18-27 kg) pups in air. Because the study area in the present study is close to the distribution area of a wild harbour seal population, the animals in the present study probably did not have different energy requirements than wild harbour seals due to air temperature differences.
Based on scat samples, Harkonen (1987) found that harbour seals near Sweden were opportunistic feeders in choice of prey species, although some locally abundant species were not eaten. The diet varied depending on the habitat (rocky or sandy sea floor). Spalding (1964) found that the diet of harbour seals of the East Pacific varied during the year. Payne and Selzer (1989) found that regional differences in the diet of harbour seals of the Western Atlantic reflected the prey communities in those areas. The diet of wild harbour seals varies seasonally and geographically; therefore the composition and calorific content of the diet in the present study may have resembled that of some wild conspecifics.
The energy requirements of harbour seals also depend on their activity level. Davis et al. (1985) showed that metabolism increased curvilinearly with swimming speed. The study animals were kept in a large, shallow pool. They swam most of the time, but could not dive deep. Very little is known about the activity levels of wild harbour seals. Thompson et al. (1989) found a diurnal haul- out pattern in harbour seals around Orkney, UK, in summer. Males hauled out every day during moult while females spent more time at sea. In winter, no diurnal haul-out pattern was observed. More information about harbour seal activity is being collected using radio telemetry (Boness et ah, 1995; Coltman et ah, 1995; Corpe et ah, 1995; Eguchi and Harvey, 1995; Mackay et ah, 1995).
Based on the information and assumptions mentioned above, the food consumption of the harbour seals in the present study was probably less than that of wild conspecifics, mainly due to a difference in energy expenditure for swimming and diving. The food consumption data of the present study could thus serve only to make a conservative estimate of the amount of fish a wild harbour seal consumes.
Acknowledgements
We thank Teun Dokter, Piet Mosterd and Jan Mosterd and all animal care personnel for recording the food consumption of the harbour seals over the years. The mean monthly air temperatures were provided by the Royal Dutch Meteorological Institute (KNMI). We thank Rob Triesscheijn for making the graphs and Nancy Vaughan (University of Bristol, U.K.), Nicole Schooneman and Jan-ny Hardeman for their comments on the manuscript.
References
Ashwell-Erickson, S. and Eisner, R. (1981) The Energy Cost of Free Existence for Bering Sea Harbor and Spotted Seals. In: The eastern Bering Sea shelf: oceanography and resources. Vol. 2 (Eds. Hood, D. and Calder, J.A.). Univ. of Wash. Press, Seattle, WA, 869-899.
Ashwell-Erickson, S., Fay, F.H. and Eisner, R. (1986) Metabolic and hormonal correlates of molting and regeneration of pelage in Alaskan harbor and spotted seals (Phoca vi-tulina and Phoca largha). Can. J. Zool. 64, 1086-1094.
Bigg, M.A. (1973) Adaptations in the breeding of the harbour seal, Phoca vitulina. J. Re-prod. Fert , Suppl. 19, 131-142.
325

R.A. Kastelein et al.
Bigg, M.A. (1981) Harbour seal Phoca vitulina Linnaeus, 1758 and Phoca largha Pallas, 1811. In: Handbook of Marine Mammals, Vol. 2, Seals (Eds. Ridgway, S.H. and Harrison, R.J.) Academic Press, London, 1-27.
Bigg, M.A. and Fisher, H.D. (1974) The reproductive cycle of the female harbour seal off south-eastern Vancouver Island. In: Functional Anatomy of Marine Mammals, Vol. 2 (Ed. R.J. Harrison). Academic Press, London, 329-347.
Bigg, M.A. and Fisher, H.D. (1975) Effect of photoperiod on annual reproduction in female harbour seals. Rapp. P.-v. Reun. Cons. Int. Explor. Mer, 169, 141-144.
Boness, D.J., Bowen, W.D., Marshall, G. and Buhleier, B. (1995) Reproductive behavior of harbor seal mates at sea. Abstract of the 11th Biennial Conf. on the Biology of Marine Mammals, Orlando, U.S.A., 14.
Bonner, W.N. (1972) The grey seal and common seal in European waters. In: The grey seal and common seal in European waters. Oceanogr. Mar. Biol. Ann. Rev. (Ed. Barnes, H.). G. Allen and Unwin Ltd., London.
Bowen, W.D., Oftedal, O.T. and Boness, D.J. (1992) Mass and Energy Transfer during Lactation in a Small Phocid, the Harbor Seal (Phoca vitulina). Physiol. Zool. 65(4), 844-866.
Coltman, D.W., Bowen, W.D. and Boness, D.J. (1995) Does body mass affect aquatic behaviour of harbour seal (Phoca vitulina) males during the mating season? Abstract of the 11th Biennial Conf. on the Biology of Marine Mammals, Orlando, U.S.A., 24.
Corpe, H.M., Thompson, P.M., Mackay, A., Tollit, D.J. and Reid, R.J. (1995) The development of diving in juvenile harbour seals. Abstract of the 11th Biennial Conf. on the Biology of Marine Mammals, Orlando, U.S.A., 25.
Davis, R.W., Williams, T.M. and Kooyman, G.L. (1985) Swimming metabolism of yearling and adult harbor seals Phoca vitulina. Physiol. Zool. 58(5), 590-596.
Eguchi, T. and Harvey, J.T. (1995) Diving behavior and movements of the Pacific Harbor seal (Phoca vitulina richardsi) in Monterey Bay, California. Abstract of the 11 th Biennial Conf. on the Biology of Marine Mammals, Orlando, U.S.A., 34.
Feltz, E.T. and Fay, F.H. (1966) Thermal requirements in vitro of epidermal cells from seals. Cryobiology 3, 261-264.
Fisher, H.D. (1952) The status of the harbour seal in British Columbia, with particular reference to the Skeena River. Bull. Fish. Res. Bd. Canada 93, 58 pp.
Harkonen, T.J. (1987) Seasonal and regional variations in the feeding habits of the harbour seal, Phoca vitulina, in the Skagerrak and the Kattegat. J. Zool. London 213, 1-9.
Harkonen, T. and Heide-Jorgensen, M.-P. (1990) Comparative life histories of East Atlantic and other Harbour seal populations. Ophelia 32(3), 211-235.
Hart, J.S. and Irving, L. (1959) The energetics of harbor seals in air and in water with special consideration of seasonal changes. Can. J. Zool. 37, 443-457.
326

Food consumption of harbour seals
Havinga, B. (1933) Der Seehund (Phoca vitu-lina L.) in den Hollandischen Gewassern. In: Seals, sea lions and walruses (Ed. Scheffer, V.B.), Stanford Univ. Press, 179 pp. Ling, J.K. (1972) Adaptive functions of vertebrate molting cycles. Am. Zool. 12, 77-93.
Ling, J.K. and Bryden, M M . (1981) Southern elephant seal, Mirounga leonina. Handbook of Marine Mammals, Vol. 2 (Eds. Ridgway, S.H. and Harrison, R.J.). Academic Press, London, 297-328.
Payne, P.M. and Selzer, L.A. (1989) The distribution, abundance and selected prey of the harbor seal, Phoca vitulina concolor, in Southern New England. Marine Mammal Science 5(2), 173-192.
Pitcher, K.W. (1986) Variation in blubber thickness of harbor seals in Southern Alaska. J. Wild. Manage. 50(3), 463-466.
Rae, B.B. (1968) The food of seals in Scottish waters. Marine Research 2, 1-23.
Mackay, A., Thompson, P. and Tollit, D.J. (1995) Characteristics of Harbour seal foraging trips. Abstracts 11th Biennial Conf. on the Biology of Marine Mammals, Orlando, U.S.A., 71.
Makhnyr, A.I. and Perlov, A.S. (1988) A study of the effect of the harbour seal on the abundance of the brood stock of pink salmon (Oncorhynchus gorbuscha) off the coast of Sakhalin Is. Can. Translation of Fisheries and Aquatic Sciences, no. 5506, 75- 82.
Markussen, N.H., Ryg, M. and 0ritsland, N.A. (1990) Energy requirements for maintenance and growth of captive harbour seals, Phoca vitulina. Can. J. Zool. 68,423-426.
Rae, B.B. (1973) Further observations of the food of seals. J. Zool. London 169, 287-297.
Reijnders, P.J.H. (1990) Progesterone and oestradiol-17p concentration profiles throughout the reproductive cycle in harbour seals (Phoca vitulina). J. Reprod. Fert. 90, 403-409.
Reilly, J.J. and Fedak, M.A. (1991) Rates of water turnover and energy expenditure of free-living male common seals (Phoca vitulina). J. Zool. London 223, 461-468.
Renouf, D. (1993) Play in a captive breeding colony of harbour seals (Phoca vitulina): constrained by time or by energy? J. Zool. London 231, 351-363.
McLaren, LA. (1993) Growth in pinnipeds. Biol. Rev. 68, 1079.
Miller, K. and Irving, L. (1975) Metabolism and temperature regulation in young harbor seals Phoca vitulina richardi. Amer. J. of Physiol. 229(2), 506-511.
Miller, K., Rosenmann, M. and Morrison, P. (1976) Oxygen uptake and temperature regulation of young harbor seals (Phoca vitulina richardi) in water. Comp. Biochem. Physiol. 54A, 105-107.
Renouf, D. and Noseworthy, E. (1990) Feeding cycles in captive harbour seals (Phoca vitulina): weight gain in spite of reduced food intake and increased thermal demands. Mar. Behav. Physiol. 17, 203-212.
Renouf, D., Almon, M. and Noseworthy, E. (1988) Variations in Feeding and Social Behaviour in a Captive Breeding Group of Harbour Seals (Phoca vitulina). Mar. Behav. Physiol. 6, 287-299.
327

R.A. Kastelein et al.
Riviere, J.E., Engelhardt, F.R. and Solomon, J. (1977) The relationship of thyroxine and Cortisol to the moult of the harbor seal Phoca vitulina. Gen. Comp. Endocr. 31, 398-401.
Scheffer, V.B. (1950) The food of the Alaska fur seal. Wildl. Leafl. 329, U.S. Fish. Wildl. Serv. Washington, D.C.
Scheffer, T.H. and Sperry, C.C. (1931) Food habits of the pacific harbor seal, Phoca richar-dii. J. of Mamm. 12, 214-226.
Sergeant, D.E. (1951) The status of the common seal (Phoca vitulina L.) on the east Anglian coast. J. Mar. Biol. Ass. UK, 29,707- 717.
Spalding, D.J. (1964) Comparative Feeding Habits of the Fur Seal, Sea Lion, and Harbour Seal on the British Columbia Coast. J. Fish. Res. Board Can., Bull. no. 146, 52 pp.
Stutz, S.S. (1967) Moult in the Pacific harbour seal, Phocoa vitulina richardi. J. Fish. Res. Board Can. 24, 435-441.
Thompson, P.M. and Rothery, P. (1987) Age and sex differences in the timing of moult in the common seal, Phoca vitulina. J. Zool. London 212, 597-603.
Thompson, P.M., Fedak, M.A., McConnell, B.J. and Nicholas, K.S. (1989) Seasonal and sex-related variation in the activity patterns of common seals (Phoca vitulina). J. of Applied Ecology 26, 521-535.
Walker, B.G. and Bowen, W.D. (1993) Changes in body mass and feeding behaviour in male harbour seals (Phoca vitulina) in relation to female reproductive status. J. Zool. London 231, 423-436.
Watts, P. (1992) Thermal constraints on hauling out by harbour seals (Phoca vitulina). Can. J. Zool. 70, 553-560.
328

Chapter 3.4
Aquatic Miiiiiiniils l(>XX, 14.1,11 W
Case study of the neonatal period of a Grey Seal pup (Halichoerus grypus) in captivity
R. A. Kastelein and P. R. Wiepkema*
Zeedierenpark Harderwijk (Harderwijk Marine Mammal Park), Strandboulevard-oost 1,3841AB Harderwijk, Holland. * Ethology Section, Department of Animal Husbandry, Agricultural University, P.O. Box 338, 6700 AH Wageningen,
Holland
Summary
On 30 January 1987 a Grey Seal (Halichoerus grypus) cow gave birth to a female pup at the Harderwijk Marine Mammal Park.
Constant observation of mother and pup during the suckling period in undisturbed conditions produced the following details: —Mother and pup usually only came together for
suckling. —After a long total suckling time per day during the
first few days, the total suckling time decreased gradually and then stabilized.
—The duration of a suckling session was independent of the duration of the previous non-suckling interval and was also of no influence on the duration of the following non-suckling interval.
—The duration of the non-suckling intervals and suckling sessions was more or less constant during the whole suckling period.
—The left and right nipple were used equally. —Both the mother's and the pup's activity increased
until the time of weaning. —There was as much suckling at night as during the
day. —The mother's food consumption was low just
before and during labour, and in the suckling period, but increased greatly after the suckling period (i.e. after copulation).
—Moulting started 16 days after birth and finished 6 days later.
Introduction
As far as is known only a small percentage of Grey Seals (Halichoerus grypus) born in the wild survive their first year (Davies, 1949; King, 1964). The main causes of death of young Grey Seals are the following, in order of importance: 1) Starvation, 2) Prenatal problems resulting in still-birth and mortality associated with birth, 3) Injuries caused by other Grey Seals, 4) Infections and 5) Accidents (Coulson & Hickling, 1964).
However, also in zoos the first phase of a Grey Seal's life is often problematic (for example Leslie, 1974). The Harderwijk Marine Mammal Park has a pair of adult Grey Seals. The cow gave birth on 26 January 1985 and on 22 January 1986. Both pups died: the first during a difficult labour, and the second from unknown internal injuries 15 hours after birth. Around the end of January 1987 a third pup was due and several measures were taken to ensure its survival. This was successful and this article will report on the experiences gained. It therefore seems of interest not only to report the procedures used, but also to report in some detail on the interaction between mother and pup until the time of weaning. More knowledge about this neonatal period could contribute to greater chances of survival of young Grey Seal pups in zoos and possibly also to the protection of the species in the wild.
Materials and Methods
At the Harderwijk Marine Mammal Park there are now three Grey Seals: one adult male; born in 1972, found stranded on the Belgian coast in November 1973, and afterwards sent to Harderwijk. One adult female; born in 1973, stranded in Belgium in May 1978 and afterwards also sent to Harderwijk. On 30 January 1987 their (third) pup was born after a pregnancy of 373 days. This report concerns the behaviour of the mother and pup.
The Grey Seals are kept in an outside freshwater pool with a surface area of 560 m2 and a depth of 1.2 m (Fig. 1). In this pool there are also 6 Harbour Seals (Phoca vitulina). Along the embankment a sheltered sandbank was made which slopes down into the water. This sandbank could serve as a pupping area.
To minimize any risks to the pup after birth, measures were taken to move the mother and pup inside if necessary. For that purpose a cage was ready for the mother. The pup could simply be carried.
The space, inside the Park's quarantine area, enabled mother and pup to be kept in peace during
329

R.A. Kastelein and P.R. Wiepkema
• Pupping area
Fence
Sand
10 m Figure 1. The freshwater pool in which Grey Seals and Harbour Seals are kept.
the suckling period. Tv cameras made it possible to watch and listen to the animals constantly. This quarantine area consists of an upper tiled area (2.2 x 3.0 m), which is linked by 3 steps to a lower tiled area (1.4 x 3.0 m). This lower area could be covered with a layer of water, 30 cm deep. The temperature in this area was 10 °C. Once a day the mother was offered a quantity of fish (herring and mackerel). The leftovers were removed later on. This way of feeding barely disturbed the animals and enabled the mother's food consumption to be recorded. The area was hosed down once a day.
The area was artificially lit 24 hours a day, and 2 tv cameras constantly monitored events (which could be observed on screens in an adjacent room). During the day additional daylight was provided through the windows in the ceiling. Through this ceiling photos could be taken of the animals and further filming could be done by means of a video camera.
The behaviour of mother and pup could be followed by means of the tv cameras. This was monitored every quarter of an hour between 0800 and 1800 hours, and every hour between 1800 and 0800 hours (max. recording rate per day 54).
All suckling periods were also monitored (beginning and end). This was possible because the beginning of every suckling session was announced by the pup vocalizing. These sounds served as a warning to the observers, who were continually present in the observation room.
The following parameters were recorded: —Rest or activity —Together or separate (a distance of less than 1 m was considered as being together) —The beginning and end of a suckling session; intervals of less than 1 min were considered as interruptions of one suckling session. The duration between 2 suckling sessions was usually more than 30 min. —Which nipple was suckled —Other observations (such as rate of moulting)
The previously mentioned photos were taken on a daily basis to follow the rate of the pup's growth. The length of the tiles on the floor was used as a point of reference. The pup was weighed a few times. The mother's food consumption was also recorded for some time before the birth and after weaning by the quantity offish taken with each feeding.
Results
The pup was born on 30 January 1987 between 22.15 and 22.30 hours, after the mother had visited the pupping area twice on the two days preceeding birth. One hour after birth it was observed that the pup was lying partially in the water. Because of the severe cold (—8 °C) the mother and pup were immediately taken to the quarantine area. The mother came on heat approximately 17 days after giving birth. She became restless and sometimes rolled over the pup. To avoid risks, the mother was returned to the father in the outside pool. This was on day 24 after birth and resulted in copulation half an hour later. During the 2 days following separation from its mother the pup was force fed on fish. The pup then began to eat fish thrown to her in the water. On 16 March 1987 (aged 45 days) the pup started to eat from the hand. On 9 April 1987 (aged 69 days) the pup was returned fit and healthy to the outside pool.
Sixteen hours after birth the pup vocalised for the first time. This announced the start of the first suckling session. This session and the following ones displayed the following ritual. The pup awoke and after a few minutes started to stretch out and explore its immediate surroundings. It then called its mother a few times. After approximately 3 volcalisations the mother came to the pup, and offered her nipples. Usually the pup started to search around the chest area. At this moment the mother stuck out her pectoral fin and made horizontal scratching movements, that usually gently touched the pup. The pup then found a nipple. After suckling for a few minutes the pup stopped briefly and then proceeded to suckle the other nipple. One or two pauses were usual and changing from one nipple to another could occur more than once. During suckling the mother often seemed to sleep. When the pup was satisfied it rolled away from its mother. The mother then usually rolled towards the pup once or twice to offer her nipples again. These efforts were always refused by
330

Neonatal period of a Grey Seal pup
— — Together including suckling
Suckling
A
No. of days altar b irth
Figure 2. The number of observed occasions per day that mother and pup were found together, and the number of times per day suckling took place during the entire suckling period (max. score per day: 54).
16 18 20 22 24
No. of days attar birth
Figure 3. The total suckling time per day during the entire suckling period.
450'
.* „ j350-
«250
-* E
:150 21 19 17
; 15 13 11 9 7
24 22 20
18 16
14
121 10
1 - 3 4 -6 7-9 10-12 13-15 16-18 19-21 Period (days)
Figure 4. The mean non-suckling interval (A), mean suckling session (B), and the total number of suckling sessions (C) per 3 day interval during the suckling period. The bars indicate the standard deviation.
the pup and it rolled away from its mother once more. The pup and mother then soon fell asleep at a certain distance from one another.
Mother and pup were left to themselves in the quarantine area after the birth. Yet they did not appear to lie next to one another most of the time (Fig. 2). During the first few days mother and pup were relatively often together without any suckling taking place. Of the 176 cases of their being together during the whole suckling period 128 of them were cases of suckling (72.7%). By recording the duration of the separate suckling sessions it was possible to establish the total suckling time per day during the whole suckling period (Fig. 3). This total suckling time increased during the first few days and then gradually decreased towards the end (with the exception of a peak on day 20)
The duration of the separate suckling sessions and the intervals in between appeared to be variable (Fig. 4). In principle this variation opens the question of how a pup's milk consumption is regulated. It may be that the quantity of milk consumed in a suckling session determines the duration of the following
interval, or vice versa, the duration of a non-suckling interval may determine the quantity of milk consumed in the next suckling session (compare for example analogous questions regarding the regulation of food consumption through meals: Le Magnen & Tallon, 1966; Metz, 1975; de Ruiter et at, 1969; de Ruiter et al, 1974). As the quantity of milk consumed during a suckling session cannot be measured directly it was considered to be correlated to the duration of a suckling session. The question was then whether the duration of a suckling session showed a correlation to the duration of the next interval, or whether, on the contrary, the duration of a non-suckling interval was correlated to the duration of the next suckling session. Neither the first (r = 0.03) nor the second correlation (r = 0.02) appeared to be significant. The first 6 days the mean duration of the suckling sessions increased to approximately 12 minutes. Later it decreased and stabilised around 10 minutes. The non-suckling intervals at first decreased greatly and then increased a little. These changes correspond roughly with the course of the number of suckling sessions every 3 days (Fig. 4).
331

R.A. Kastelein and P.R. Wiqjkema
| [ Daytime (08.00-1800hrs.)
P I Nighttime(1800-0800hrs.)
Table 1. Weight and length changes of the pup and the weight of the placenta.
100
90
i 8° £ 70-1 s« I 60 » 2 50
Mother
100i 90
; so
i 7 0
| 60 I 50
Pup
1-3 4 -6 7-9 10-12 13-15 16-18 19-21 Period (days)
Figure 5. The mean percentage of time spent resting by mother and pup (per 3 day period) during the suckling period.
6
i 5
1" I, I * 2
1
li A A l\ \
\v\ 1 V A A I A B T A
lW\
^Y •L Start vttibto 1
* - i oestrus i 1
\ AAA N \ /V \A«««' ' V 1 • \ .copulation 1
1 8 2 0 2 2 2 4 2 6 2 8 3 0 1 3 5 7 9 11 13 15 17 19 21 23 25 27 1 3 5 7
January fabruary march
Dale
Figure 6. The mother's daily food consumption before, during, and after the suckling period.
During these sessions there appeared to be no preference for the left or right nipple, both the mother's nipples were generally suckled during a suckling session.
The mother and pup appeared to rest a great deal both at night and during the day in the beginning of the suckling period (Fig. 5). This changed towards the end of the suckling period in that both animals rested mainly at night and started to develop most of their activities during the day. However, during the whole of the suckling period there were as many suckling sessions during the day as during the night.
The food consumption of the mother showed remarkable changes before, during and after the suckling period (Fig. 6). While in January she consumed on average 3 kg per day, her intake decreased
Time
Birth
Weaning
To pool
Day
1 13 20 24 40 63 69
Weight pup (kg)
17.0 — 59.0 — —
47.0 47.5
Weight placenta
(kg)
2.2
Length (nose-end tail flipper)
(cm)
105 113 120 — 120 — —
to less than 1 kg per day around the time of birth. During the suckling period this intake was still relatively low, but increased considerably in the post-suckling period (after copulation with the male).
During the study period the weight and length of the pup changed as shown in table 1.
When the pup was 16 days old it started to moult on its head and paws. This moulting was complete by day 22.
Discussion and conclusions
During the first four days the mother spent a considerable amount of time, outside the suckling sessions, with her pup. This suggests that the bond between mother and pup is formed in this period. Burton et al (1975) found that physical contact (particularly nose-body contact) between mother and pup during the postnatal period took place particularly during the first 50 minutes.
In undisturbed natural conditions on Orkney (Fogden, 1971), the mothers use a combination of their senses to find and identify their young. The mother first hears the pup, and reacts by sighting and going to the place where the previous suckling session took place. Once she comes to the spot she recognizes her pup by smell. She then visibly smells the pup by mutual nose contact.
In cases of great Grey Seal density, the mother goes into the sea after each suckling session. With low density the mother remains with the pup on land during the whole suckling period. The amount of time spent on land by the mother also depends on the terrain of the colony and the accessibility of the pupping area (Fogden, 1971). In the present study mother and pup appeared to display the same actions in the same order as in a situation in the wild when the mother remains with the pup on land during the whole suckling period (Fogden, 1971). Only the visible smelling of the pup did not take place. Perhaps
332

Neonatal period of a Grey Seal pup
the sense of smell is only used as a means of recognition when there is some doubt about the pup's identity.
The pup was suckled for the first time 16 hours after birth. On Ramsey Island the pups began to suckle 6 hours after birth at the earliest (Davies, 1949). The total suckling time per day increased during the first 4 days, which suggests that the milk production of the mother needs to be stimulated by the pup during the first few days after birth.
On day 19 after its birth, the pup got separated from its mother by lying on the lower level of the observation area. For some reason the mother did not go to the pup. The following day the pup seemed to catch up on the suckling sessions it had missed.
After day 22 and 23 when the pup was once again found to be separated from its mother, it was decided to return the mother to the outside pool on day 24. In Aberdeen Zoo a mother left her pup after 23 days of suckling (Leslie, 1974). On Ramsey Island, the suckling period usually lasted 15-17 days, regardless of the pup's condition (Davies, 1949).
Normally, the pup clearly determined when it wanted milk and how long it suckled for. The pup called out to its mother when it was hungry and the mother reacted every time by rolling towards the pup and offering her nipples. When the pup had had enough milk, it rolled away from its mother although the mother often continued to offer her nipples. Obviously the beginning and end of the suckling session were determined by the pup's appetite. It could be that because of the relatively undisturbed conditions in the present situation there was no correlation between the duration of a suckling session and the preceding non-suckling interval.
Exceptions such as extremely short suckling sessions can often be explained by the fact that sessions were disturbed. Long non-suckling intervals only occurred when the pup could not reach its mother. Often the mother (influenced by an external factor) was responsible for the extremes observed. Under natural conditions disturbances probably occur more frequently. In that case the duration of suckling sessions and non-suckling intervals is often influenced by non-feeding factors. On Orkney it sometimes happened that the pups were disturbed while sleeping, and then started to call out from hunger, which resulted in short non-suckling intervals (Fogden, 1971). On Ramsey Island the pups called out for their mothers and were suckled, with irregular intervals between sessions of 2 to 5 hours. There were no changes in the duration of the non-suckling intervals during the suckling period as was also reported by Davies (1949).
Both nipples were used approximately the same number of times by the pup and from this may be concluded that both nipples gave the same amount of milk.
As the pup grew, the day-night rhythm of activity developed. A similar trend could be seen in the mother. Her activities increased relatively less than those of her pup. This is probably due to the fact that she preserved as much of her energy reserve as possible for her pup. On Orkney the pups were usually asleep, unless they were hungry or disturbed. The pups only moved a few metres during the whole suckling period. As the suckling period is so short in Grey Seals, most of the milk's nutritional value is used for growth and very little for movement. Grey Seal mothers can produce between 1.5 and 2.8 kg milk per day (Fogden, 1971). The milk is 10 times richer than cow's milk, containing approximately 50% fat (Amoroso and Mathews, 1951).
In Aberdeen Zoo (Leslie, 1974) as well as in the wild (Fogden, 1971), the mothers were lethargic and slept for most of the day during the suckling period. In Nova Scotia the mothers had 2 reasons for moving: firstly to make room for the pup to enable it to suckle in peace, and secondly to push the pup back if it had moved too far away. In some colonies in the West Atlantic Ocean the mothers stay on land for 2.5 weeks after giving birth. During this period they only move a few metres. However, in other colonies the mothers return to the sea after each suckling session, but stay close to the shore (Boness & James, 1979).
There appeared to be no daily cycle for suckling. There was as much suckling at night as during the day. On Orkney night-time suckling was observed, but details such as those in this case study could not be compiled for practical reasons (Fogden, 1971).
It was not possible to record the weight changes of the mother in this study. However, her weight loss was easily detectable. At birth she was fat and at weaning she was so slender that her ribs were visible. The energy that the mother passed on to the pup was not immediately compensated for by an increase in her fish intake. After the suckling period in which the mother's fat reserves had decreased greatly, the mother ate a relatively large amount. Even when a pup dies, the food intake of Grey Seal cows remains relatively low for a while. In Aberdeen Zoo a cow did not eat for 19 days after her pup was still-born (Leslie, 1974). The reason for this diminished appetite is still not clear.
The average weight at birth of 74 pups on the Fame Islands was 14.8 kg (Hewer and Backhouse, 1968). According to Fogden (1971) a Grey Seal pup must increase in weight from 13.5 kg to 38 kg within 21 days (an average of 1.2 kg per day) in order to survive. The greater the weight at the time of weaning the better the pup's chances of surviving the first year (Coulson and Hickling, 1964). In Aberdeen Zoo (Leslie, 1974) a pup gained weight at an average rate of 2.1 kg per day during a suckling period of 23 days, while Amoroso et al (1950) reported a weight gain of about 1.5 kg/day during a 15 day suckling period.
333

R.A. Kastelein and P.R. Wiepkema
The increase in weight during the suckling period in this case study was relatively high (an average of 2.1 kg per day). This was possibly due to the fact that there was little disturbance, no rain, and a relatively high and constant temperature of approximately 10 °C. In the wild, suckling periods are often distrubed by aggressive interactions amongst the cows themselves, and between the cows and other cow's pups (Burton et al, 1975).
The increase in the pup's weight during the suckling period was 42 kg. The weight decreased by 20% during the first month after weaning. After that it gradually increased. After weaning, wild Grey Seal pups need to live on their reserves of fat until they are efficient enough at catching and consuming fish (Davies, 1949; Coulson and Hickling, 1964).
The beginning and duration of the moult vary much. The pup in this study still had its full white lanugo fur for the first 15 days of its life. Thereafter it began to moult on its head and paws. Within 6 days the moulting was complete. In Aderdeen Zoo, a pup did not gain its new coat until 29 days after birth (Leslie, 1974). There is often great individual variation in the start and duration of moulting within one breeding site and during the same year (Curry, 1970). The rate of moulting may depend on the pup's degree of activity and the amount of time spent in water. In 30% of the cases on Ramsey Island the moult had already started before birth. Usually moulting started between day 9 and 18 and was completed between 11 and 27 days after birth (Davies, 1949).
Boness & James (1979) speculate about the way in which the males notice that a cow is on heat. In Harderwijk the cow began to scratch restlessly at the fence after day 17 post partum. At the same time the swollen labia could clearly be seen between day 18 and day 24 (the day of mating). In Aberdeen Zoo intercourse was observed once 3 days and once 21 days after the birth ofa pup (Leslie, 1974). In the wild in Nova Scotia mating took place on average 10 days after birth and successful intercourse on average after 15 days. Intercourse can last from 5-50 minutes. Often the cows were mounted before they were in their oestrus period (Boness and James, 1979). Premature attempts at mating were also observed in Harderwijk on 11 January 1986. This was 11 days before the birth of a pup.
Acknowledgements We thank the following members of the animal care department of the Harderwijk Marine Mammal
Park for assisting with the behavior recording: Teun Dokter, Jan Mosterd, Piet Mosterd, Ingrid Timmer, Toinny Lukken, Gert-Jan Foppen, Klaas Dekker, Peter van de Haar, Ron Steen, Bertie Roothaan. We also thank Bea Hilgers and Daisy Hombergen for assisting with behavioral observations and part of the data analysis. We thank Nancy Vaughan for her comments on the English text and Ida Smit for drawing the graphs.
References
Amoroso, E. C , Goffin, A., Halley, G., Mathews, L. H. & Mathews, D. J. (1950) Lactation in the grey seal. J. Physiol. (London) 113.
Boness D. J. & James, H. (1979) Reproductive behaviour of the Grey Seal (Halichoerus grypus) on Sable Island, Nova Scotia. J. Zool., Lond, Vol. 188. pp. 477-500.
Burton, R. W., Anderson, S. S. & Summers, C. F. (1975) Perinatal activities in the Grey Seal (Halichoerusgrypus). J. Zool., Lond. 177,197-201.
Coulson, J. C. & Hickling, C. (1964) The breeding biology of the Grey Seal on the Fame Islands. J. Anim. Ecol. 33, 485-512.
Curry-Lindahl, K. (1970). Breeding biology of the Baltic Grey Seal (Halichoerus grypus). Der Zoologische Garten (NF), Band 38, Heft 1/2.
Davies, J. L. (1949) Observations on the Grey Seal (Halichoerus grypus) at Ramsey Island, Pembrokeshire. Proc. Zool. Soc. Lond. Vol. 119, pp. 673-692.
Davies, J. L. (1956) The Grey Seal at the Isles of Scilly. P.Z.S.L.—127, pp. 161-166.
Fog^en, S. C. L. (1971) Mother-young behaviour at Grey Seal breeding beaches. J. Zool., Lond. Vol. 164, pp. 61-92.
Hewer, H. R. & Backhouse, K. M. (1968) Embryology and foetal growth of the Grey Seal, Halichoerus grypus. J. Zool., Lond. Vol. 155, pp. 507-533.
King, J. E. (1964) Seals of the world. Trustees of the British Museum (Natural History) London, pp. 45-51.
Leslie, G. (1974) Breeding the Grey Seal at Aberdeen Zoo. Int. Zoo Yearbook. Vol. 14, pp. 130-131.
Magnen, J. Le & Tallon, S. (1966) La perioicite de la prise d'aliments ad libitum du rat blanc. J. Phusiol. (Paris) 58, 323-349.
Metz, J. H. M. (1975) Time patterns of feeding and rumination in domestic cattle. Meded. Landbouw Hogeschool Wageningen 75-12.
Ruiter, L. de, Wiepkema, P. R. & Reddingius, J. (1969) Etiological and neurobiological aspects of the regulation of food intake. Ann. N.Y. Acad. Sci. 157,1204-1216.
Ruiter, L. De, Wiepkema, P. R. & Veening, J. G. (1974) Models of behavior and the hypothalamus. Progr. Brain Research. 41,481-507.
334

Chapter 3.5
Aanalic Mammals I 'WO, 16.3, 120 I2K
The suckling period of a Grey seal {Halichoerus grypus) while confined to an outdoor land area
R. A. Kastelein and P. R. Wiepkema*
Zeedierenpark Harderwijk (Harderwijk Marine Mammal Park), Strandboulevard-oost 1,3841 AB Harderwijk, Holland
Summary In January 1988 a Grey seal cow gave birth to a female pup at the Harderwijk Marine Mammal Park. Mother and pup were kept in an outdoor suckling area. As a safety precaution, they were denied access to the nearby pool during the suckling period. Constant observation of mother and pup produced similar detailed information on suckling parameters as was recorded in the previous year when the same cow and her 1987-pup were kept indoors.
In contrast to the latter indoor situation the following was found in the present study: (1) The mother always smelt the pup before offering the nipples; (2) the mother broke off most of the suckling sessions; (3) Daily suckling time was longer and characterized by more and longer suckling sessions a day than in 1987; and (4) a lower growth rate of the pup. This latter aspect was probably due to an increased activity level resulting from disturbances and a higher energy loss caused by the cold and wet outdoor conditions. Differences in disturbances and in climatic conditions were probably the main factors which caused the differences in behaviour of mother and pup between the 1987 and 1988 suckling period.
Key words: Halichoerus, suckling, behaviour, reproduction.
Introduction Many Grey seal pups {Halichoerus grypus) die during the suckling period, both in the wild (Davies, 1949; Coulson & Hickling, 1964; Summers et al., 1975; Anderson et al., 1979; Baker era/., 1980; Baker, 1984) and in zoological parks (Leslie, 1974; Kastelein & Wiepkema, 1988). To determine the causes of this high mortality, the Harderwijk Marine Mammal Park has launched a long term study on the suckling periods of the Grey seals born at the park.
The first step of this study was on the mother and her female pup (born in 1987) which had been moved
*Ethology Section, Department of Animal Husbandry, Agricultural University, P.O. Box 338, 6700 AH Wageningen, Holland.
into a completely undisturbed indoor quarantine area one hour after birth (Kastelein & Wiepkema, 1988). In 1988 a second female pup was born of the same parents, at the same time of year. This pup was suckled in a more natural outdoor environment. This study describes the suckling period of this pup and discusses the influence of the outdoor environment on several suckling parameters.
Materials and Methods
Study animals The Harderwijk Marine Mammal Park houses two adult Grey seals. A male (code: HgZH002); estimated to have been born in 1972, found stranded on the Belgian coast in May 1978, and afterwards sent to Harderwijk, and a female (code: HgZHOOl); born in September 1973, stranded in Belgium in November 1973 and afterwards also sent to Harderwijk. On 23 February 1987 copulation took place and after a gestation period of 334 days, their fourth pup (code: HgZH006) was born on 23 January 1988. This report concerns the behaviour of the mother and this pup during the suckling period.
Study area The Grey seals were kept in an outside freshwater pool with a surface area of 530 m2 and a maximum depth of 1.2 m (Fig. 1). The pool also housed five Harbour seals (Phoca vitulina). Two peninsulas were built so that the pool could easily be divided into two parts by means of a fence. In the dunes a sheltered sandy hollow was dug to serve as a pupping and suckling area. Large stones were placed between this suckling area and the pool to prevent the pup from going into the water.
The isolated sandy area enabled mother and pup to be left in peace during the suckling period. Two TV cameras made it possible to watch and listen to the animals constantly. The area was artificially lit during the night. The images could be observed on monitors in a trailer on the other side of the dunes (Fig. 1). The behaviour of mother and pup was recorded
335

R.A. Kastelein and P.R. Wiepkema
Observation cabin with monitors
I I"
[jDmeje^JSj^
10 m
Figure 1. The pool in which Grey seals and Harbour seals are kept, and which could be divided into two areas by means of a fence and a gate.
every 15 minutes between 08.00 and 18.00 hours, and every hour between 18.00 and 08.00 hours (maximum recording rate per day: 10x4 + 14x 1 = 54). Since the beginning of every suckling session was announced by the pup vocalizing, and since these sounds served as a warning to the observers, who were continually present in the observation room, all suckling sessions could be monitored. The following parameters were recorded: —Rest or activity —Together or separate (a distance of less than 1 m
was counted as being together) —Number and time of vocalizations (barks). —The moment and length of a suckling session (i.e.
time that the mouth of the pup was in contact with the nipple).
—Which animal ended a suckling session by moving away.
—Position of mother and pup. For this purpose the pupping/suckling area was divided into three sections by an imaginary grid (Fig. 1).
—Miscellaneous data (such as rate of moult)
—Four times per day the weather conditions were recorded (air temperature, wind force, wind direction, and precipitation).
During the suckling period the mother was offered a quantity of Herring (Clupea harengus) and Mackerel (Scomber scombrus) once a day, and leftovers were removed later on. This way of feeding scarcely disturbed the animals and enabled the mother's food consumption to be recorded. As is done every day of the year, her food consumption was also recorded for some time before the birth and after weaning. The pup was weighed about every 3 days during the suckling period.
All correlations (r) in this study are based on the Spearman rank correlation procedure (Siegel, 1956).
Results
Because the male started to harass the female 5 days prior to delivery, they were separated. Grey seal males often try to copulate just before birth and thus before oestrus (Boness & James, 1979; Kastelein & Wiepkema, 1988), and it was decided that the female would be under less stress if left alone. Pools A and B were divided by a gate and fence, and the female was placed in pool B with two Harbour seals (Phoca vitulina).
The pup was born on 23 January 1988 between 06.15 and 06.30 hours, on the sand between pool B and the pupping/suckling are (Fig. 1). Within 15 minutes after birth the pup was carried into the suckling area and the mother followed. To prevent them from leaving, a fence was placed between the suckling area and the pool. The mother came on heat 17 days after giving birth. Her labia were swollen and she became restless and began to dig under the fence. On day 18 she stopped suckling her pup. On day 20 the female was allowed to re-enter pools A and B. Copulation with the male began within 5 minutes after this.
Suckling ritual One and a half hours after birth the young started to vocalize and the first suckling session occurred 5 minutes later. The suckling ritual was basically the same as described by Kastelein & Wiepkema (1988). However, some parameters were different: before each session the pup vocalized quite often (average: 59, SD: 51, N: 120), before the mother smelt the pup (Fig. 2) and offered it her nipples (Fig. 3).
Encounters between mother and pup Mother and pup were left to themselves in the suckling area after birth. However, they were only lying next to each other 19% of the times that their behaviour was recorded (Fig. 4). During the first 2 days mother and pup were together relatively often without any suckling taking place. Of the 202 scored
336

The suckling period of a Grey seal
Figure 2. The Cire\ seal mxlhei smelling her pup before :i sucklinc session.
Figure 3. The Grey seal mother and pup during a suckling session. Note the other nipple above the pup's head.
337

R.A. Kastelein and P.R. Wiepkema
Together Including suckling _ Suckling
12 14 16 IS 20 Weaning' 'Separation
No. of days after birth
Figure 4. The number of observed occasions a day that mother and pup were found together, and the number of times a day that suckling took place during the suckling period (maximum possible score per day: 54).
14 16 18 20 Weaning' ' Separation
Figure 6. The total suckling time per day during the suckling period.
No. ol days alter birth
Figure 5. The daily proportion of suckling sessions broken off by the mother and by the pup during the suckling period.
cases of their being together during the whole suckling period, 89 of them were while suckling (44%).
Until day 15 most of the suckling sessions were broken off by the mother (Fig. 5). After day 15 most of the sessions were broken off by the pup.
Suckling parameters By recording the duration of each suckling session it was possible to calculate the total suckling time per day during the whole suckling period (Fig. 6). The total daily suckling time increased steadily during the first 9 days after which it stabilized around 120 min/ day( r=0 .80 ,p<0.01) .
The duration of the separate suckling sessions increased significantly ( r=0.56, p<0.0001) over the whole suckling period from 4 to 24 minutes on average (Fig. 7A). Simultaneously the duration of the intervals between successive suckling sessions decreased significantly (r=—0.40, p<0.0001), from 190 to 140 minutes on average (Fig. 7B). This latter
No. of days after birth
Figure 7. The length of the mean daily suckling session (A), the mean daily non-suckling interval (B) and the total number of suckling sessions per day (C), during the suckling period.
338

The suckling period of a Grey seal
A
95
90-
85-
80
75-
70-
65
60-
55'
Daytime (08.00-18.00 hrs.)
Nighttime (18.00-08.00 hrs) Mother
9-11 12-14 15-17 18-20
3-Day periods after birth
Figure 8. The mean percentage of time spent resting by mother (A) and pup (B), per 3 day period, during the suckling period.
decrease is associated with the increase in the number of suckling sessions per day (Fig. 7C). The length of a non-suckling interval was negatively correlated (r = — 0.21, p<0.05) with the duration of the next suckling session. No significant correlation could be found between the duration of a suckling session and the length of the non-suckling interval immediately following. Finally there was an interesting positive correlation (r = 0.36, p< 0.0001) between the durations of successive non-suckling intervals, indicating that long (or short) non-suckling intervals tended to cluster. Long non-suckling intervals tended to cluster during the night, and short ones during the day.
Activity Both animals spent a lot of time resting. The mother rested a little more during the night than during the day (Fig. 8A). The amount of time spent resting decreased during the suckling period both during the night and in the day time. The mother started to dig more intensively near the fence after each suckling session as weaning approached (i.e. she came noticeably into oestrus, 15 days after she gave birth). The pup spent less time resting than the mother (Fig. 8B), and its activity level was fairly constant during the whole suckling period. Like its mother it rested a little more time during the night than during the day. The high activity level during
3 5 7 9 11 13 15 17 19 21 2p2S 27 29 31 2 4 6 8 1 0 1 2 1 4 1 6 1 8 lanuary Birth february / \ Date
Weaning Separation
Figure 9. The mother's daily food consumption before, during, and after the suckling period.
the night on day 16 was probably caused by the snow that fell that night. In general the pup was more active in periods with rain than in periods without precipitation.
Food consumption of the mother The food consumption of the mother showed strong fluctuations before, during and after the suckling period (Fig. 9). While in January she consumed on average 3.4 kg per day, her intake decreased to zero on the day of birth. During the suckling period her food intake was relatively low, but increased strongly after copulation which occurred immediately after she was allowed to go into the pool with the male.
Use of space During the first 15 days both mother and pup spent almost 90% of their time in area 3, the area closest to the pool (Figs 1 & 10). The mother spent a lot of time lying on the ridge looking towards the pool which contained the male. The pup was very keen on a particular spot in area 3. After a suckling session it almost always returned to or near a specific stone. On day 16 the pup became more interested in its surroundings and spent more time in area 1 and 2. The mother followed to a certain extent, but usually not further from the pool than area 2. She hardly ever went to area 1 (Fig. 10).
Growth of the pup During the study the weight of the pup changed as shown in Table 1. The pup gained 1.3 kg per day on average. Urine was seen a few times, but no faeces were observed during the suckling period. After weaning the pup visibly lost weight (quantity unknown) until it had learned to eat fish. Then it started to gain weight again.
Moult of the pup When the pup was 13 days old it started to moult on its head and paws. Moulting was complete by day 25.
339

R.A. Kastelein and P.R. Wiqykema
^Mother
0 2 4 6 6 ft 12 14 1& ft 20 No. of days after birth
Figure 10. The use of area 3 of the suckling hollow (see Fig. 1) during the suckling period (maximum possible score per day: 54).
Table 1. Weight changes of the pup and the weight of the placenta
Occasion
Birth — — — — — Weaning To sea
Days after birth
0 3 6
10 13 17 18 87
Weight PUP (kg)
16 20 23 29 36 38 — 41.5
Weight Placenta (kg)
1.5
,
Environment The average daily temperature was around 6°C and hardly varied during the suckling period (range: 4 to 9°C). The average daily windforce increased a little towards the end of the suckling period (from 3 to 5 on the Beaufort scale). The recipitation was high, but decreased a little towards the end of the suckling period (it rained every day, on average 20% of each day). January and February 1988 were the wettest months of this century.
Events after weaning In order to monitor the pup's food intake after weaning, it was placed in an indoor quarantine area (which is described in Kastelein & Wiepkema, 1988). The pup was force-fed from day 20 on, and started to eat fish voluntarily from the hand on day 64 after birth. In order to prevent future inbreeding, it was released on April 18,1988 (age: 86 days) on the sand
bank 'Engelse Hoek' in the North Sea (north of Holland). This was possibly the first release of a captive born Grey seal into the wild.
Discussion and conclusions This discussion focuses on the comparison of data from the present study (the '1988 pup') with those of the suckling period of the pup born in 1987 (Kastelein & Wiepkema, 1988). This latter pup spent its suckling period in an undisturbed, dry indoor facility with a constant and relatively high temperature; it will be referred to as the '1987 pup'.
Suckling ritual The fact that the 1988 pup called for its mother much more often than the 1987 pup probably related at least partly to the different surroundings in 1988. The mother often spent time inspecting the environment before she offered her nipples to the pup. The mother always smelt the 1988 pup before suckling; this olfactory identification or 'nosing' was practically absent with the 1987 pup. She seemed to identify the pup in the outside environment not just visibly and acoustically, but also by smell. Maybe this was related to the mother being subjected to a range of outside odours. In the indoor situation, the smell of the pup could have filled the entire space, and might have been the only smell. This suggests that the performance of 'nosing' is modulated by external cues. In the wild, Grey seal mothers always 'nose' their pup before suckling (Davies, 1949; Fogden, 1968, 1971; Burton et at., 1975).
The mother often moved her flipper back and forth when the pup approached to find the nipple. This behaviour has also been observed in young Harbour seals (Phoca vitulina). At the seal rehabilitation centre in Valdez, Alaska, orphaned Harbour seals were seen trying to suckle at each other's nipples. In such occasions the pup that presented its nipples also flippered at its poolmates (Kastelein, 1989; personal observation).
Encounters between mother and pup Like the 1987 pup, the 1988 pup spent a lot of time with its mother during the first couple of days after birth. This could be of importance for the mother-pup bond. In 1988, the mother and pup spent 15% more time per day together than in 1987. This could be due to the disturbances in the outdoor environment, which caused the mother to move around more frequently in the hollow, and thus spent more time (often moving) within a range of 1 metre from the pup.
Until day 15, the mother broke off most suckling sessions, thereafter it was the pup that moved away first. Because the mother came on heat on day 17, the change in the pup's behaviour could be due to a hormonal change in the mother (Engelhardt &
340

The suckling period of a Grey seal
Table 2. Suckling parameters of a Grey seal pup at the National Zoo, Washington D.C. (adapted from Wilson et al., 1985)
Week
1 2 3
Average no. of suckling
sessions per day
5.2 6.1
10.0
Average duration suckling session
(min)
5.5 8.9 9.6
Average non-suckling interval (min)
276 234 144
16
50
Body weight (kg
(birth)
(weaning after 20 days)
Ferguson, 1979) which might have influenced the production and quality of the milk (Iverson & Oftedal, 1989). In 1987, the opposite was seen, since then it was the pup which stopped almost all suckling sessions. No good explanation seems obvious for this difference. Maybe the larger number of disturbances in the outdoor environment made the mother more restless and caused her to stop the sessions before the pup was fully fed. In both years, the mother was prevented from leaving the suckling area. The behaviour of Grey seal mothers during the suckling period varies per region and sometimes per year. In Orkney, U.K., when Grey seal density is high, mothers go into the sea after each suckling session. If the density is low, the mother remains with the pup on land during the entire suckling period (Fogden, 1971). In the Baltic, the female only remains on the ice during the night (Curry-Lindahl, 1970). On Sable Island, Nova Scotia, females stay on land during the entire suckling period and oestrus occurs on average 15 days after birth. The pup is weaned around 17 days after birth (Boness & James, 1979).
Suckling parameters The total daily suckling time of the 1988 pup was on average much longer than that of the 1987 pup. This was the result of a higher average number of suckling sessions per day of, on average, longer duration (Fig. 7). This difference in suckling time could be explained by the fact that the 1988 pup was outside in a cold and wet environment and needed more milk than the 1987 pup, just to keep warm. However, individual metabolic differences between the two pups could also have played a role in the milk requirements.
Wilson et al. (1985) described the suckling period of a Grey seal and her pup in an outdoor facility (recording between 07.00 and 17.00 hrs. They also report that the total daily suckling time increased during the suckling period (Table 2). As in the present study, they found an increase in the number of suckling sessions per day, and an increase in the duration of the suckling sessions during the suckling period.
The non-suckling interval is partially influenced by external factors such as disturbances in the environment of the mother and pup. First of all, when the
pup is woken up by a disturbance, this may increase the tendency to look for the mother and to suckle. Secondly, the mother often offers her nipples to the young after a disturbance. For instance, immediately after the weighing of the pup, the mother often offered her nipples to it. On Orkney it has also been observed that when the pups were disturbed while sleeping, they started to call for the mother, which resulted in short non-suckling intervals (Fogden, 1971).
The negative correlation between the duration of a non-suckling interval and the duration of the immediately following suckling session suggests two possibilities that do not exclude each other. Firstly, a pup may interrupt a non-suckling interval soon after the suckling session because it is for some reason more hungry than at comparable points in time. This could explain the occurrence of an extra long suckling session immediately thereafter. Secondly, some external disturbance may have interrupted an ongoing non-suckling session during which mother and pup calm each other down (a mutual pacifying effect or function of suckling).
The positive correlation between successive non-suckling intervals (separated by one suckling session) indicates either a rhythm or periods in which suckling is characterized by clusters of successive, long non-suckling intervals, alternated with periods with many relatively short intervals. Since there were 13% more suckling sessions during the daytime (between 08.00 and 20.00 hrs) than during the night (between 20.00 and 08.00 hrs) this could explain the correlation found. The 1987 indoor pup showed no daily suckling cycle. Probably disturbances caused by people, seals and birds during the day triggered some more suckling sessions during the daytime in the 1988 outdoor situation. On Orkney night-time suckling was also observed. However, details such as those in the present case study and the 1987 case study could not be compiled for practical reasons (Fogden, 1971).
Activity Both in 1987 and in 1988, the mother spent more time resting than the pup. However, on most days of the
341

R.A. Kastelein and P.R. Wiepkema
suckling period in 1988 both mother and pup spent less time resting that in 1987. This was probably due to disturbances such as wind, rain, and sounds from people and other animals in the park. The relatively large proportion of time spent on active, energy costing behaviour by the 1988 pup may account, at least partially, for the relatively long average daily suckling time.
Food consumption of the mother The food consumption of the mother around, during, and after the suckling period in 1988 is very similar to that in 1987. The mother was very fat at the beginning of the suckling period, and became thinner towards the end. This means that her food intake did not compensate for the energy lost in metabolism and milk transfer. After the pup was weaned her food intake increased dramatically, presumably to compensate for the weight loss that occurred during the suckling period. The similarity in the pattern of food intake in the 1987 and 1988 suckling periods implies that it is regulated by endogenous parameters as suggested by Kastelein et al. (1990). Whether lac-tating females in the wild change their food intake during the suckling period has not yet been studied in detail (Davies, 1956; Curry-Lindahl, 1970). However, they also seem to reduce their food intake, since at North Rona, Scotland, over 80% of the female's energy reserves are used during suckling to feed a pup (Fedak & Anderson, 1982).
Use of space Although mother and pup had more space in 1988 than in 1987, they mainly used only a small portion of the available suckling area (area 3). After day 16 the young started to investigate areas 1 and 2 and was, to some extent, followed by the mother. Around that day the pup started to break off most of the suckling sessions (Fig. 5). Perhaps because it was hungry, the pup stayed awake and started to explore its surroundings. On Orkney the pups were usually asleep, unless they were hungry or disturbed. The pups only moved a few metres during the whole suckling period. As the suckling period is so short in Grey seals, most of the milk's nutritional value is generally used for growth and very little for movement (Fogden, 1971).
Growth of the pup The average weight gained by the 1988 pup was 1.3 kg a day. The 1987 pup gained on average 2.1 kg a day. The weight increase of the 1988 pup resembles more closely the weight increases that are found in field studies (Amoroso et al., 1950; Coulson & Hickling, 1960; Fogden, 1971; Mansfield, 1977). In the wild, there is a positive correlation between growth rate and subsequent survival (Coulson &
Hickling, 1964). The difference in weight gain between the 1987 and 1988 pups could be due to individual metabolic differences, but it seems more likely to be mainly due to the wet and cold environment in which the 1988 pup had to spend more energy to keep its body warm (January and February 1988 were the wettest months of the century). The 1988 pup was also more active than the 1987 pup, which was probably due to the disturbances in its environment. The pup was never observed producing faeces during the suckling period, so the only way it could have lost weight would be by respiration and by urinating. Like the pup in the present study, wild Grey seal pups loose weight after weaning because they need to live on their fat reserves until they are efficient at catching fish (Davies, 1949; Coulson & Hickling, 1964).
Moult of the pup The 1988 pup's moult was fairly similar in rate and period to that of the 1987 pup, and both within the range found in the field. There is often a great individual variation in the start and length of moults within one breeding site and during the same year (Davies, 1949; Curry, 1970).
Recommendations More studies of this kind under a variety of conditions are needed to determine the proportional impact of rain, temperature and disturbances on the pup's suckling behaviour and its growth.
Acknowledgements We thank caretaker Piet Mosterd for his advice and for assisting with weighing. We also thank Rob Kieboom, Astrid van Dongen, Nancy Vaughan, Hans Romberg and Brigitte Slingerland for assisting with behavioural observations and with data analysis. We thank Nancy Vaughan also for her comments on the manuscript, and Ida Smit, Caroline Koopman and Irma Verhoeven for drawing the graphs. We thank the seal rescue centre of Pieterburen for their help in the release of the pup. The photographs were taken by Henk Merjenburgh.
References Amoroso, E. C, Goffin, A., Halley, G., Mathews, L. H.
& Mathews, D. J. (1950) Lactation in the Grey seal. J. Physiol. (London) 113,4-5.
Anderson, S. S., Baker, J. R., Prime, J. H. & Baird, A. (1979) Mortality in Grey seal pups: incidence and causes. J. Zooi, Lond. 189,407-417.
Baker, J. R„ Anderson, S. S., Prime, J. H. & Baird, A. (1980) The pathology of the Grey seal (Halichoerus grypus). I. pups. Br. Vet. J. 136,401-412.
Baker, J. R. (1984) Mortality and morbidity in Grey seal pups (Halichoerus grypus). Studies on its causes, effects of the environment, the nature and sources of infectious
342

The suckling period of a Grey seal
agents and the immunological status of pups. J. Zool., Lond. 203, 23-48.
Boness, D. J. & James, H. (1979) Reproductive behaviour of the Grey seal (Halichoerus grypus) on Sable Island, Nova Scotia. J. Zool., Lond. 188,477-500.
Burton, R. W„ Anderson, S. S. & Summers, C. F. (1976) Perinatal activities in the Grey seal (Halichoerus grypus). J. Zool.. Lond. 177,197-201.
Coulson, J. C. & Hickling, C. (1960) The Grey seal of the Fame Islands. Trans. Nat. Hist. Soc. Northumb. 13, 196-214.
Coulson, J. C. & Hickling, C. (1964) The breeding biology of the Grey seal on the Fame Islands. J. Anim. Ecol. 33, 485-512.
Curry-Lindahl, K. (1970) Breeding biology of the Baltic Grey seal (Halichoerus grypus). Der Zool. Garten, 38(1/ 2), 16-29.
Davies, J. L. (1949) Observations on the Grey seal (Halichoerus grypus) at Ramsey Island, Pembrokeshire. Proc. Zool. Soc, Lond. 119,673-692.
Davies, J. L. (1956) The Grey seal at the Isles of Scilly. Proc. Zool. Soc, Lond. 127,161-166.
Engelhardt, F. R. & Ferguson, J. M. (1979) Adaptive changes in Harp seals, Phoca groenlandica, and Grey seals, Halichoerus grypus, during the post-partum period. Aquatic Mammals, 7(3), 83-92.
Fedak, M. A. & Anderson, S. S. (1982) The energetics of lactation: accurate measurements from a large wild mammal, the Grey seal (Halichoerus grypus). J. Zool., Lond. 198,473-479.
Fogden, S. C. L. (1968) Suckling behaviour in the Grey seal (Halichoerus grypus) and the Northern elephant seal (Mirounga angustirostris). J. Zool, Lond. 154,415-420.
Fogden, S. C. L. (1971) Mother-young behaviour at Grey seal breeding beaches. J. Zool, Lond. 164,61-92.
Iverson, S. J. & Oftedal, O. T. (1989) Can milk fatty acid composition be used to indicate changes in feeding behavior in pinnipeds. Eighth conference on the biology of marine mammals. Pacific Grove.
Kastelein, R. A. & Wiepkema, P. R. (1988) Case study of the neonatal period of a Grey seal pup (Halichoerus grypus) in captivity. Aquatic Mammals, 14(1), 33-83.
Kastelein, R. A., Wiepkema, P. R. & Vaughan, N. (1990) The food consumption of Grey seals (Halichoerus grypus) in human care. Aquatic Mammals, 15(4), 171-180.
Leslie, G. (1974) Breeding the Grey seal at Aberdeen Zoo. Int. Zoo Yearbook, 14,130-131.
Mansfield, A. W. (1977) Growth and longevity of the Grey seal, Halichoerus grypus, in eastern Canada. Marine Mammals Committee CM. 1977/N.6: 1-12.
Siegel, S. (1956) Non-parametric statistics. McGraw-Hill, New York.
Summers, C. F., Burton, R. W. & Anderson, S. S. (1975) Grey seal (Halichoerus grypus) pup production at North Rona: A study of birth and survival statistics collected in 1972. J. Zool, Lond. 175,439^151.
Wilson, S., Miller, L., Hursey, M., Frantz, M. & Gorte, J. (1985) The social development of a captive Grey seal (Halichoerus grypus) pup for the first six months. Aquatic Mammals, 11(3), 89-100.
343

Chapter 3.6
Aquatic Mammals 1991,17.1,42-51
The suckling period of a Grey seal (Halichoerus grypus) while the mother had access to a pool
R. A. Kastelein, P. R. Wiepkema* and N. Vaughan
Zeedierenpark Harderwijk (Harderwijk Marine Mammal Park), Strandboulevard-oost 1,1841AB Harderwijk, Holland
Summary In January 1989 a Grey seal cow gave birth to a female pup at the Harderwijk Marine Mammal Park. Mother and pup were kept in an outdoor suckling area and the mother had free access to a pool. Constant observation of mother and pup provided comparable information on suckling parameters as in 1988 when the mother and her pup were confined to an outdoor suckling area.
In contrast to the 1988 situation the following was found in the present 1989 study:
(1) On average the pup vocalized more often before a suckling session. (2) Mother and pup spent less time together. (3) The mother rested less and spent a great deal of time swimming. (4) On average the suckling sessions were shorter, but the frequency of suckling was similar. This resulted in a shorter total daily suckling time. (5) The pup did not start to move around in the suckling hollow during the last 3 days before weaning. (6) The pup grew faster (2.2 kg/day) than in 1988.
These differences were probably caused by the different weather conditions (the suckling period of 1988 was very wet, that of 1989 was completely dry), and by the different degrees of freedom of the mother.
Keywords: Halichoerus, suckling, reproduction, behaviour.
Introduction Both in the wild (Davies, 1949; Coulson & Hickling, 1960; Gallacher & Waters, 1964; Summers et al, 1975; Anderson etal, 1979; Baker et al, 1980; Baker, 1984 & 1988) and in zoological parks (Leslie, 1974; Kastelein & Wiepkema, 1988) many Grey seal pups {Halichoerus grypus) die soon after birth. To elucidate the factors which determine the chances of survival of the pups, the Harderwijk Marine Mammal
*Ethology Section, Department of Animal Husbandry, Agricultural University, P. O. Box 338, 6700 AH Wageningen, Holland.
Park has launched a long term study programme on the suckling period of Grey seals born at the park.
The first pup studied was a female, born in 1987. Mother and pup were moved to a completely undisturbed indoor quarantine area one hour after birth because the pup had entered the water (Kastelein & Wiepkema, 1988). Research continued in 1988 when another female pup was born, and mother and pup were placed in a specially made outdoor suckling area next to the pool. A fence prevented the animals from leaving this area (Kastelein & Wiepkema, 1990).
In January 1989, another pup was born next to a newly dug suckling area, into which it was placed immediately after delivery. This pup had the same parents, the same sex and was born at the same time of year as the 1988 pup, but this time the mother was free to move in and out of the suckling area, since there was no fence. This study describes the suckling period of this Grey seal pup and discusses the effects of the weather and the mother's liberty on several suckling parameters.
Materials and Methods
Study animals At the Harderwijk Marine Mammal park there are two adult Grey seals: A male (code: HgZH002); estimated to have been born in 1972, found stranded on the Belgian coast in May 1978, and afterwards sent to Harderwijk, and a female (code: HgZHOOl); born in September 1973, stranded in Belgium in November 1973 and also sent to Harderwijk. After a gestation period of 343 days (copulation took place on 12 Febuary 1988) their fifth pup (code: HgZH008) was born on 21 January 1989. This report is concerned with the behaviour of the mother and this pup.
Study area The Grey seals are kept with 4 Harbour seals (Phoca vitulina) in an outdoor freshwater pool system with a total surface area of 530 m2 and a maximum depth of 1.2 m (Fig. 1). This pool can be divided into two pools by means of a fence. In preparation for the
345
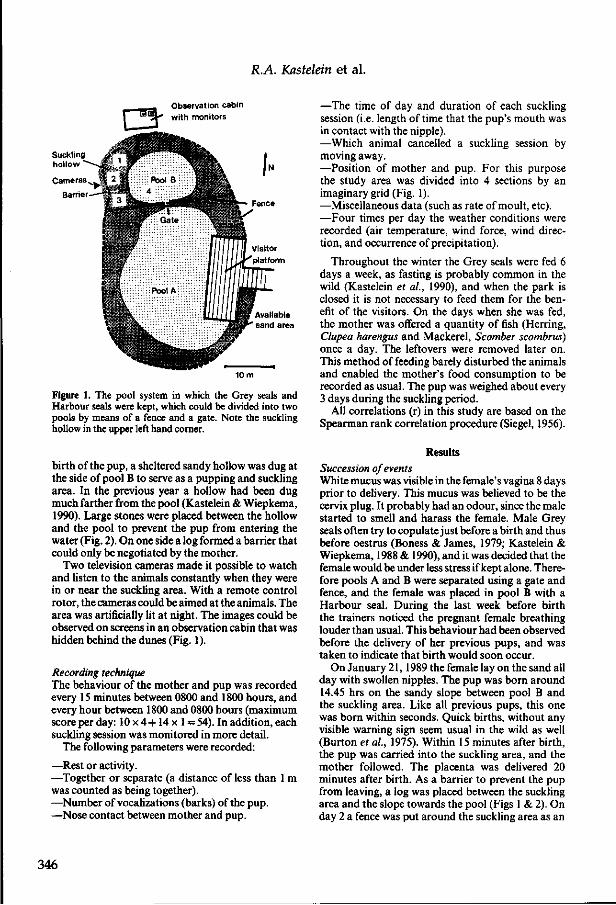
R.A. Kastelein et al.
Observation cabin with monitors
Figure 1. The pool system in which the Grey seals and Harbour seals were kept, which could be divided into two pools by means of a fence and a gate. Note the suckling hollow in the upper left hand corner.
birth of the pup, a sheltered sandy hollow was dug at the side of pool B to serve as a pupping and suckling area. In the previous year a hollow had been dug much farther from the pool (Kastelein & Wiepkema, 1990). Large stones were placed between the hollow and the pool to prevent the pup from entering the water (Fig. 2). On one side a log formed a barrier that could only be negotiated by the mother.
Two television cameras made it possible to watch and listen to the animals constantly when they were in or near the suckling area. With a remote control rotor, the cameras could be aimed at the animals. The area was artificially lit at night. The images could be observed on screens in an observation cabin that was hidden behind the dunes (Fig. 1).
Recording technique The behaviour of the mother and pup was recorded every 15 minutes between 0800 and 1800 hours, and every hour between 1800 and 0800 hours (maximum score per day: 10 x 4+14 x 1 = 54). In addition, each suckling session was monitored in more detail.
The following parameters were recorded:
—Rest or activity. —Together or separate (a distance of less than 1 m was counted as being together). —Number of vocalizations (barks) of the pup. —Nose contact between mother and pup.
—The time of day and duration of each suckling session (i.e. length of time that the pup's mouth was in contact with the nipple). —Which animal cancelled a suckling session by moving away. —Position of mother and pup. For this purpose the study area was divided into 4 sections by an imaginary grid (Fig. 1). —Miscellaneous data (such as rate of moult, etc). —Four times per day the weather conditions were recorded (air temperature, wind force, wind direction, and occurrence of precipitation).
Throughout the winter the Grey seals were fed 6 days a week, as fasting is probably common in the wild (Kastelein et al., 1990), and when the park is closed it is not necessary to feed them for the benefit of the visitors. On the days when she was fed, the mother was offered a quantity of fish (Herring, Clupea harengus and Mackerel, Scomber scombrus) once a day. The leftovers were removed later on. This method of feeding barely disturbed the animals and enabled the mother's food consumption to be recorded as usual. The pup was weighed about every 3 days during the suckling period.
All correlations (r) in this study are based on the Spearman rank correlation procedure (Siegel, 1956).
Results Succession of events White mucus was visible in the female's vagina 8 days prior to delivery. This mucus was believed to be the cervix plug. It probably had an odour, since the male started to smell and harass the female. Male Grey seals often try to copulate just before a birth and thus before oestrus (Boness & James, 1979; Kastelein & Wiepkema, 1988 & 1990), and it was decided that the female would be under less stress if kept alone. Therefore pools A and B were separated using a gate and fence, and the female was placed in pool B with a Harbour seal. During the last week before birth the trainers noticed the pregnant female breathing louder than usual. This behaviour had been observed before the delivery of her previous pups, and was taken to indicate that birth would soon occur.
On January 21,1989 the female lay on the sand all day with swollen nipples. The pup was born around 14.45 hrs on the sandy slope between pool B and the suckling area. Like all previous pups, this one was born within seconds. Quick births, without any visible warning sign seem usual in the wild as well (Burton et al, 1975). Within 15 minutes after birth, the pup was carried into the suckling area, and the mother followed. The placenta was delivered 20 minutes after birth. As a barrier to prevent the pup from leaving, a log was placed between the suckling area and the slope towards the pool (Figs 1 & 2). On day 2 a fence was put around the suckling area as an
346

The suckling period of a grey seal
Figure 2. The hollow in which the Grey seal pup was suckled. Note the barrier which could only be negotiated by the mother (Photo: Ron Kastelein).
Figure 3. The Grey seal mother and pup during flippering, a behaviour often seen just before and during a suckling session (Photo: Henk Merjenburgh).
347

R.A. Kastelein et al.
. Together including suckling Suckling
1—1 14 16 181
Weaning No. of days after birth
Figure 4. The score of observed occasions per day that mother and pup were found together (including suckling), and the number of observed times a day that suckling was taking place (maximum possible score per day: 54, except for day 1 and 19). The arrow indicates day 2, on which it took the mother 19 hours to find the exit of the hollow.
100' 90' 80' 70' 60' 50' 40' 30> 20^ 10-
/Broken off by mother
^Broken off by pup
0 2 sBir th
12 —r— 14
1 16 18 / Weaning
se No. of days after birth
Figure 5. The percentage of suckling sessions broken off by the mother and by the pup during each day of the suckling period.
extra safety measure. It prevented the pup from leaving and only allowed the mother to leave over the barrier. After the fence was put up, the mother stayed in the suckling area for 19 hours before crossing the barrier. The mother came on heat noticeably 17 days later; her labia were swollen, and she became aggressive towards the Harbour seal with which she had had no visible interaction before. On day 19 she stopped suckling her pup and 13 hours later the male was allowed to re-enter pool B. He copulated with the female in the water immediately after the gate was opened.
Suckling ritual The first suckling session occurred 15^ hours after birth. Throughout the suckling period the suckling ritual was basically the same as described
i i i i i i i i i i i 8 10 12 14 16 1 8 /
Weaning No. of days after birth
Figure 6. The total suckling time per day during the suckling period.
16 18 / Weaning
No. of days after b i r th
Figure 7. Duration of the mean suckling session per day (A), the mean non-suckling interval (B), and the total number of suckling sessions per day (C).
by Kastelein & Wiepkema (1990), including flip-pering (Fig. 3). Nose contact between mother and pup was seen near the beginning of each suckling session.
Vocalization The number of vocalizations preceeding a suckling session was very variable (N = 115, average: 15, range:
348
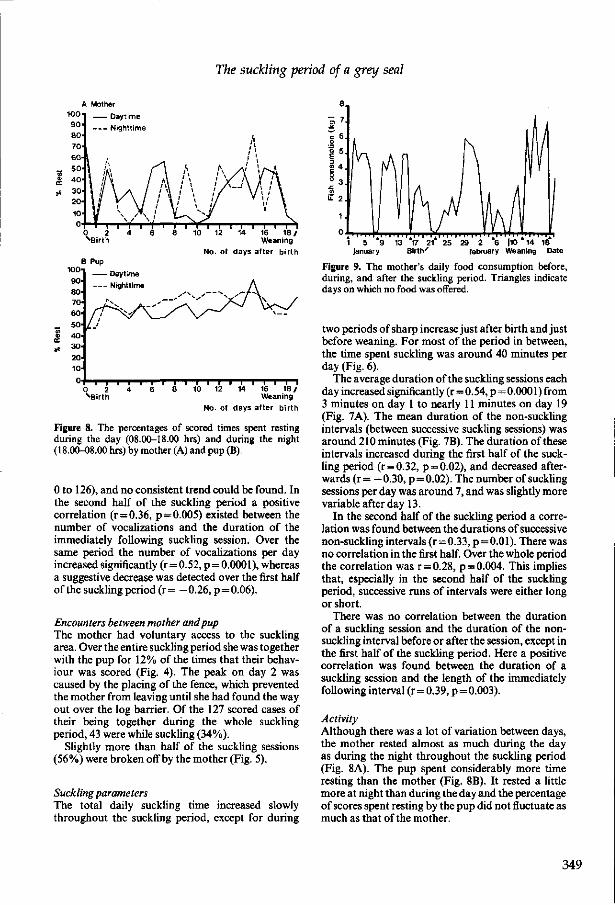
The suckling period of a grey seal
16 18 / Weaning
No. of days after birth
10O 90-80' 70' 60'
_ 50-| 40-„ 3(H
20' 10'
B Pup
Daytime
Nighttime
0 2 sBir th
I I I I I I I I I I 10 12 14 16 18 /
Weaning
No. of days after birth
Figure 8. The percentages of scored times spent resting during the day (08.00-18.00 hrs) and during the night (18.00-08.00 hrs) by mother (A) and pup (B).
0 to 126), and no consistent trend could be found. In the second half of the suckling period a positive correlation (r=0.36, p=0.005) existed between the number of vocalizations and the duration of the immediately following suckling session. Over the same period the number of vocalizations per day increased significantly (r=0.52, p = 0.0001), whereas a suggestive decrease was detected over the first half of the suckling period (r= — 0.26, p=0.06).
Encounters between mother and pup The mother had voluntary access to the suckling area. Over the entire suckling period she was together with the pup for 12% of the times that their behaviour was scored (Fig. 4). The peak on day 2 was caused by the placing of the fence, which prevented the mother from leaving until she had found the way out over the log barrier. Of the 127 scored cases of their being together during the whole suckling period, 43 were while suckling (34%).
Slightly more than half of the suckling sessions (56%) were broken off by the mother (Fig. 5).
Suckling parameters The total daily suckling time increased slowly throughout the suckling period, except for during
1 5 "9 13 *17 21* 25 29 2 '6 |10 * 14 18* January Bir th ' february Weaning Date
Figure 9. The mother's daily food consumption before, during, and after the suckling period. Triangles indicate days on which no food was offered.
two periods of sharp increase just after birth and just before weaning. For most of the period in between, the time spent suckling was around 40 minutes per day (Fig. 6).
The average duration of the suckling sessions each day increased significantly (r=0.54, p=0.0001) from 3 minutes on day 1 to nearly 11 minutes on day 19 (Fig. 7A). The mean duration of the non-suckling intervals (between successive suckling sessions) was around 210 minutes (Fig. 7B). The duration of these intervals increased during the first half of the suckling period (r = 0.32, p = 0.02), and decreased afterwards (r= — 0.30, p = 0.02). The number of suckling sessions per day was around 7, and was slightly more variable after day 13.
In the second half of the suckling period a correlation was found between the durations of successive non-suckling intervals (r=0.33, p=0.01). There was no correlation in the first half. Over the whole period the correlation was r=0.28, p=0.004. This implies that, especially in the second half of the suckling period, successive runs of intervals were either long or short.
There was no correlation between the duration of a suckling session and the duration of the non-suckling interval before or after the session, except in the first half of the suckling period. Here a positive correlation was found between the duration of a suckling session and the length of the immediately following interval (r = 0.39, p = 0.003).
Activity Although there was a lot of variation between days, the mother rested almost as much during the day as during the night throughout the suckling period (Fig. 8A). The pup spent considerably more time resting than the mother (Fig. 8B). It rested a little more at night than during the day and the percentage of scores spent resting by the pup did not fluctuate as much as that of the mother.
349

R.A. Kastelein et al.
>. "O
4)
a 4) 0
> (0 •a
^ ©
u (A
> a> a
s
& o u
35 •
25 • 20 • 15 • 10 • 5 •
60 •
5 0 •
4 0 •
30 •
20 •
10 •
4 0 •
3 0 •
20 •
10 •
( 5 0 •
4 0 •
3 0 •
20 •
10 •
Area 1 ( in hollow)
/ " N i
0 2 4 6 8
Area 2 ( in hollow)
/"V /
*
1 1 1 1 1 r 1 1 3 2 4 6 8
Area 3 (slope)
3 2 4 6 8
Area 4 (water)
A l\ A S
A A A / W \ / / V V '
3 2 4 6 8 sBirth
1 \
/ \ V jf—, J i l l
10 12
A
\ r
10 12
10 12
10 12
No. of
Mother Young
\ -•-' 14 16 18
y'~"~ ...
14 16 18
14 16 18
14 16 18 / Weaning
days after birth
Table 1. Weight changes of the pup and the weight of the placenta
Figure 10. The use of the four parts of the study area (see Fig. 1) by mother and pup (maximum possible score per day: 54, except on day 1 and 19). On day 2 it took the female 19 hours to find the exit of the hollow.
Food consumption of the mother The mother's food consumption fluctuated strongly before, during and after the suckling period (Fig. 9). In January she consumed on average 2.9 kg per day, but her intake was low for a week before birth and only 0.5 kg on the day of birth. During the suckling period her food intake increased until day 8 (29 January) after which it decreased before weaning (to zero for two days, one of which was her usual scheduled weekly fasting day). It increased strongly after copulation, which occurred on the day of weaning; in March she ate on average 6.3 kg per day.
Use of space After day 1 the pup spent most of its time in area 2 of the hollow (Fig. 10). The mother spent very little
Occasion
Days after birth
0 3 6
10 13 17 19 26 37 45 49 60 76
101
Weight pup (kg)
15 17 24 35 43 52 —
48 —
41.3 —
41.8 36.8 —
Weight placenta
(kg)
1.6 Birth
Weaning
Start force-feeding
Start hand-feeding
To sea
time in the hollow except on day 2 before she had discovered the way out over the barrier. She spent most of her time in the water (area 4) or lying on the slope leading to the hollow (area 3).
Growth andmoult of the pup During the study the weight of the pup changed as shown in Table 1. The pup gained on average 2.2 kg a day during the suckling period. No faeces was observed during the suckling period. After weaning the pup lost weight, but as soon as it had learned to eat fish it started to gain weight again. When the pup was 13 days old it started to moult on its head and paws. Moulting was complete by day 20.
Environment The average daily temperature was around 4°C (range: 2 to 7°C). The average daily windforce ranged from 1 to 4 Beaufort during the suckling period. There was no precipitation during the entire suckling period.
Events after weaning In order to monitor the pup's food intake after weaning, it was placed in an indoor quarantine area (described by Kastelein & Wiepkema, 1988). The pup was force-fed from day 37 on, and started to eat fish voluntarily from the hand on day 49 after birth. In April, its first full month on fish, it ate on average 2.6 kg a day.
In order to prevent future inbreeding, the young Grey seal was released on 2 May 1989 (101 days after birth) on the sand bank Engelse Hoek in the Dutch North Sea. Before release it was vaccinated against Phocine Distemper Virus and a tag (no. 2599) was attached to one of the flippers.
350

The suckling period of a grey seal
Discussion and Conclusions This discussion focusses on the comparison of data from the present study (the 1989 pup) with those of the suckling period of the pup born in 1988 which spent its suckling period confined with its mother in a different outdoor land area; it will be referred to as the 1988 pup (Kastelein & Wiepkema, 1990). Some references will be made to the 1987 pup and its mother, which were confined to an undisturbed indoor suckling area (Kastelein & Wiepkema, 1988).
Suckling ritual The mother nosed both the 1988 pup and the 1989 pup before almost every suckling session. Nosing probably serves to identify the pup by smell. In the wild the same behaviour can be seen (Davies, 1949; Fogden, 1968 & 1971; Burton et al, 1975). Fogden (1968) suggested that flippering might be carried out by the mother to direct the pup towards her nipples, but later he observed that the mother also flippers when the pup is in a good feeding position and said that maybe flippering serves as a stimulus for the pup to suck (Fogden, 1971).
The 1989 pup vocalized more before each suckling session than the 1988 pup. This could be a result of the mother spending much of her time swimming outside the hollow, and it might have taken longer for her to get to the pup after it started to call. The vocalizing seems to have at least two functions: it tells the mother that the pup is hungry, and it aids the mother in finding her pup (Davies, 1949). The trainers noticed that the pup stopped vocalizing after weaning, which suggests that this behaviour is evoked under certain circumstances (i.e. with a lactating female in the area) or that it is determined by endogenous factors, and only occurs during the suckling period.
Encounters between mother and pup The total number of scores that the mother and pup were together was much lower in 1989 than in 1988. This probably resulted from the restrictions on the mother's freedom during the 1988 suckling period, and suggests that when given the opportunity, the mother avoided the pup except during the suckling sessions. She spent a large proportion of her time in the water, swimming or watching the hollow. Maybe this behaviour is an adaptation for safety so that the mother would not accidently crush her pup if suddenly alarmed, or perhaps she preferred the water for thermoregulatory purposes.
Both in 1988 and in 1989 the mother ended most suckling sessions (on average 58% and 56% respectively). This is in contrast with the 1987 indoor situation where the pup ended almost all suckling sessions. This could be due to more disturbances in the outdoor situations.
The number of vocalizations produced before each suckling session increased in the second half of the suckling period, and associated with this, the suckling sessions became longer and correlated with the number of proceeding vocalizations. A larger sample size would be needed to investigate whether the number of vocalizations reflect the degree of need for food.
Suckling parameters The total suckling time per day was considerably less (P<0.001, Mann-Whitney U-test) in 1989 (median 40 min) than in 1988 (median 101 min). This was linked to on average shorter suckling sessions in 1989, as the number of sessions per day and the length of the suckling period were similar in both years. So, the 1988 pup seemed to need more milk that the 1989 pup. This could be explained by the very wet weather during the 1988 suckling period, which caused the pup's lanugo coat to be wet most of the time. This suggests that to increase their energy intake, Grey seal pups try to keep the same feeding schedule (rhythm), but increase the length of the suckling bouts. Whether they can adhere to their preferred rhythm depends on the behaviour of the mother, which in turn is probably influenced by the environment.
The positive correlation in the first half of the suckling period between the length of a suckling session and that of the immediately following non-suckling interval suggests that milk intake factors determine the suckling pattern in this period. The longer the pup suckled in one bout, the more it may have taken in, and the longer it could last without a feed. This correlation was not found in the second half of the suckling period, which suggests that for some unknown reason non-feeding factors such as disturbances and the mother's behaviour became more important at this stage
The suckling parameters were influenced by external factors such as disturbances in the environment of the mother and pup. Often, when the pup was woken up by a disturbance, this seemed to increase its tendency to call for the mother and to suckle. Also the mother often offered her nipples to the young after a disturbance, such as the weighing of the pup. Environmental influences have also been observed in the field where the pups were disturbed while sleeping, and started to call for the mother. This resulted in shorter than usual non-suckling intervals (Fogden, 1971).
For some unknown reason, the average length of the non-suckling intervals increased during the first half of the suckling period, but this was compensated for by longer suckling sessions, so that the total suckling time remained constant on the days involved (Fig. 6). In the second half the non-suckling intervals became shorter while the duration of the suckling
351

R.A. Kastelein et al.
sessions increased further. These factors led to a significant increase in total suckling time per day during the second half of the suckling period (Fig. 6). In the whole suckling period there were 10% more suckling sessions during the day (between 0800 and 2000 hrs) than during the night. A similar day and night difference was seen with the 1988 pup. This was thought to be due to disturbances during the day caused by weighing, construction, birds, feeding, etc.
Whether suckling time corresponds with milk transfer in a linear way is not clear, so care must be taken when interpreting the data of this report.
Baker (1990) suggests that the milk composition changes during the suckling period in such a way that the percentage of fat is relatively low during the first 3 days (approximately 42%), and higher thereafter (approximately 53%), while the water content falls correspondingly. This could be an effect of the time required to produce hormones such as thyroxine and Cortisol (Engelhardt & Ferguson, 1979), which mobilize the fat reserves of the mother. A variation in milk composition may have an effect on the suckling parameters mentioned above. Another indication that food composition may influence the feeding pattern is provided by Spotte & Stake (1982). They fed twin Grey seal pups on a varying diet of formula and whole Herring (Clupea harengus). No suckling pattern was evident even when the formula was freely available. The pups grew less than healthy pups fed by their mothers.
Activity In 1988, when the female's movements were restricted by a fence, she spent much of her time resting. In 1989, when she had access to the pool, she spent a large proportion of her time swimming while actively observing the suckling area. There are at least two possible reasons for the female's desire to leave the suckling hollow when given the opportunity: either she had a natural positive desire to swim, or she felt uncomfortable in the artifical suckling hollow and therefore spent less time ashore than she would have in a suckling hollow of her own choice.
The pup was resting for around 65% of the times that its behaviour was scored in both years. This high score shows a natural need to rest, to save energy for growth. In the wild, on Orkney, the pups were also usually asleep, unless they were hungry or disturbed (Fogden, 1971).
Food consumption of the mother The mother's food consumption before, during, and after the suckling period in 1989 was very similar to that in 1987 and 1988. This implies that the pattern of food intake is regulated by endogenous parameters as suggested by Kastelein et al. (1990). In many areas
in the wild, most females remain on land during the entire suckling period. Whether the females that leave the land during the suckling period eat, is not known. They probably eat little or nothing, since their body is set to utilize stored fat by lipolysis, and not to deposit fat (Engelhardt & Ferguson, 1979). At North Rona, Scotland, over 80% of the female's energy reserves are used to feed their pups (Fedak & Anderson, 1982). An endogenously determined reduction in appetite could be an adaptation for the suckling situation in which the females have difficulty in going far to catch fish because they have to stay in the vicinity of the pup. The strong increase in food consumption after copulation is probably necessary to restore the female's condition before the blastocyst which she is carrying is implanted. This occurs between 100 and 160 days after conception (Boyd, 1984).
Use of space Both the 1988 pup and the 1989 pup only used a small part of the area that was available to them. In the wild on Orkney, pups also only moved a few metres during the whole suckling period (Fogden, 1971). This sedentary behaviour has at least two advantages: firstly, most of the milk's nutritional value can be used for growth, and secondly, it is easier for the mother to find her pup after she has been to sea. The latter advantage is especially important for newborn pups which are probably still difficult for the mother to identify (Burton et al., 1975). In the wild, if the pup does not vocalize, the returning mother goes to the spot where she left her calf and searches around (Davies, 1949). If she cannot find her pup, the bond is broken and the pup may starve. This is a major cause of death in Grey seals (Baker et al, 1980).
In contrast to the 1988 pup, the 1989 pup did not move around more on the last few days before weaning than it did on the previous days. Maybe the 1988 pup was avoiding its mother which became a little aggressive towards the end of the suckling period. In the unrestricted situation in 1989 the mother spent less time with the pup and directed her aggression towards the Harbour seal. The difference in the pup's behaviour could also be due to individual variation in the degree of locomotion, as was observed in one colony by Davies (1949).
In 1989 the mother did not spend much time in the hollow, other than during the suckling sessions. In the wild, the mothers haul-out behaviour depends on pup density, time of day, year, and geographical area (Davies, 1956; Fogden, 1971; Curry-Lindahl, 1970; Boness & James, 1979). The artificial suckling area in 1989 was probably not favoured by the mother, since she did not deliver the pup in it. Maybe the hollow was too deep, and did not provide a good view over the immediate surroundings. This could have made the mother eager to leave.
352

The suckling period of a grey seal
Growth of the pup The 1989 pup gained on average 2.2 kg per day through suckling, the 1988 pup 1.3 kg a day. This difference could be due to individual metabolic differences, but was without doubt also due to the different weather conditions. The windforce and temperature did not differ much between the two compared suckling periods, but there was a difference in precipitation; during the 1989 suckling period it did not rain at all, while January and February 1988 were the wettest months of the century. These strongly different weather conditions were not compensated for by the much longer suckling sessions in 1988. The white birth coat (lanugo) lacks an oily texture and is therefore easily waterlogged and flattened. Most of the coat's insulating properties are then lost (Ling & Button, 1975; Blix et al, 1979). Fedak & Anderson (1982), made accurate weather recordings, and found that pups gained on average 1.64 kg/day, while rain fell on 17 of the 27 study days. This growth rate is between that of the 1988 suckling period, in which is rained every day of the suckling period, and that of the completely dry 1989 suckling period. Spotte & Stake (1982) suspected that environmental pressures (such as: substrate, disturbances and weather conditions) are major parameters limiting the growth of Grey seal pups.
At weaning, the sculp weight ( = blubber and skin) constitutes on average 50% of the total body weight compared with only 25% 2 days after birth (Mansfield, 1977). Like the pup in the present study, wild Grey seal pups lose weight after weaning until they are efficient at catching fish (Davies, 1949; Amoroso & Mathews, 1951; Coulson & Hickling, 1964). More than 70% of the post-weaning mass loss in Grey seals is in the reduction of blubber (Worthy & La vigne, 1987). Nordoy & Blix (1985) calculated that around 94% of the energy expended by a pup during the first 4 weeks of the post-weaning fast is derived from subcutaneous fat deposits.
The 1987 pup started to accept fish 45 days after birth. The 1988 pup after 64 days, and the 1989 pup after 49 days. These periods seem to agree with a pup in a zoological park described by Wilson et al. (1985) which acepted fish 59 days after birth. How these periods correspond to what occurs in Grey seals in the wild is not known.
Recommendations Fogdcn (1971) pointed out the differences in suckling behaviour between disturbed and undisturbed suckling areas, and commented on the influence of the seal density and the topography of the suckling areas. More studies of the present kind under a variety of conditions are needed to determine the proportional impact of weather conditions, the suckling area, disturbances, the pup's and the mother's activity, and individual metabolic variation on growth.
Acknowledgements
We thank trainers Piet Mosterd and Jurgen Foortjes for their advice and for assisting with weighing the pup. We also thank Lucie de Beer, Corinne van den Berg, Irma Verhoeven and Hans Romberg for assisting with behavioural observations and with part of the data analysis.
References
Amoroso, E. C. & Mathews, J. H. (1951) The growth of the grey seal (Halichoerus grypus) (Fabricius) from birth to weaning. J. Anat. 85,427-428.
Anderson, S. S., Baker, J. R., Prime, J. H. & Baird, A. (1979) Mortality in Grey seal pups: incidence and causes. J. Zool. Land. 189,407-417.
Baker, J. R., Anderson, S. S., Prime, J. H. & Baird, A. (1980) The pathology of the Grey seal (Halichoerus grypus). I. pups. Br. Vet. J. 136,401-412.
Baker, J. R. (1984) Mortality and morbidity in Grey seal pups (Halichoerus grypus). Studies on its causes, effects of the environment, the nature and sources of infectious agents and the immunological status of pups. J. Zool. Lond. 203,23-48.
Baker, J. R. (1988) Further studies on Grey seal (Halichoerus grypus) pup mortality on North Rona. Br. Vet. J. 144,497-506.
Baker, J. R. (1990) Grey seal (Halichoerus grypus) milk composition and its variation over lactation, Br. Vet. J. 146,233-238.
Blix, A. S., Grav, H. J. & Ronald, K. (1979) Some aspects of temperature regulation in newborn harp seal pups. Am. J. Physiol. 236, R188-R197.
Boness, D. J. & James, H. (1979) Reproductive behavior of the Grey seal (Halichoerus grypus) on Sable Island, Nova Scotia. J. Zool. Lond. 188,477-500.
Boyd, I. L. (1984) The relationship between body condition and the timing of implantation in pregnant Grey seals (Halichoerus grypus). J. Zool. Lond. 203,113-123.
Burton, R. W., Anderson, S. S. & Summers, C. F. (1975) Perinatal activities in the Grey seal (Halichoerus grypus). J. Zool. Lond. 177,197-201.
Coulson, J. C. & Hickling, C. (1960) The Grey seal of the Fame Islands. Trans. Nat. Hist. Soc. Northumb. 13, 196-214.
Coulson, J. C. & Hickling, C. (1964) The breeding biology of the Grey seal on the Fame Islands. J. Anim. Ecol. 33, 485-512.
Curry-Lindahl, K. (1970) Breeding biology of the baltic Grey seal (Halichoerus grypus). Der. Zool. Garten 38(1/ 2), 16-29.
Davies, J. L. (1949) Observations on the Grey seal (Halichoerus grypus) at Ramsey Island, Pembrokeshire. Proc. Zool. Soc. London. 119,673-692.
Davies, J. L. (1956) The Grey seal at the isles of Scilly. Proc. Zool. Soc. Lond. 127,161-166.
Engelhardt, F. R. & Ferguson, J. M. (1979) Adaptive changes in Harp seals, Phoca groenlandica, and Grey seals, Halichoerus grypus, during the post-partum period. Aquatic Mammals 7(3), 83-92.
Fedak, M. A. & Anderson, S. S. (1982) The energetics of lactation: accurate measurements from a large wild
353

R.A. Kastelein et al.
mammal, the Grey seal (Halichoerus grypus). J. Zool. Land. 198,473^*79.
Fogden, S. C. L. (1968) Suckling behaviour in the Grey seal (Halichoerus grypus) and the Northern elephant seal (Mirounga anguslirostris). J. Zool. Lond. 154,415-420.
Fogden, S. C. L. (1971) Mother-young behaviour at Grey seal breeding beaches. J. Zool. Lond. 164,61-92.
Gallacher, J. B. & Waters, W. E. (1964) Pneumonia in Grey seal pups at St Kilda. Proc. Zool. Soc. Lond. 142, 177-180.
Kastelein, R. A. & Wiepkema, P. R. (1988) Case study of the neonatal period of a Grey seal pup (Halichoerus grypus) in captivity. Aquatic Mammals 14(1), 33-38.
Kastelein, R. A., Wiepkema, P. R. & Vaughan, N. (1990) The food consumption of Grey seals (Halichoerus grypus) in human care. Aquatic Mammals 15(4), 171-180.
Kastelein, R. A. & Wiepkema, P. R. (1990) The suckling period of a Grey seal (Halichoerus grypus) while confined to an outdoor land area. Aquatic Mammals 16(3), 120-128.
Leslie, G. (1974) Breeding the Grey seal at Aberdeen Zoo. Int. Zoo Yearbook 14,130-131.
Ling, J. K. & Button, C. E. (1975) The skin and pelage of grey seal pups (Halichoerus grypus Fabricius): with a comparative study of foetal and neonatal moulting in the
Pinnipedia. Rapp. P.-v. Reun. Cons. Int. Explor. Mer 169, 112-132.
Mansfield, A. W. (1977) Growth and longevity of the Grey seal, Halichoerus grypus, in eastern Canada. Marine Mammals Committee CM. 1977/N. 6,1-12.
Nordey, E. S. & Blix, A. S. (1985) Energy sources in fasting grey seal pups evaluated with computed tomography. Am. Jour, of Physiol. 249, R471^»76.
Siegel, S. (1956) Non-parametric statistics. McGraw-Hill. New York.
Spotte, S. & Stake, P. E. (1982) Hand-rearing of twin Grey seals (Halichoerus grypus) from birth to weaning. Mar. Ecol. Prog. Ser. 9,181-189.
Summers, C. F., Burton, R. W. & Anderson, S. S. (1975) Grey seal (Halichoerus grypus) pup production at North Rona: A study of birth and survival statistics collected in 1972. J. Zool. Lond. 175,439-451.
Wilson, S., Miller, L., Hursey, M., Frantz, M. & Gorte, J. (1985) The social development of a captive Grey seal (Halichoerus grypus) pup for the first six months. Aquatic Mammals 11(3), 89-100.
Worthy, G. A. J. & Lavigne, D. M. (1987) Mass loss, metabolic rate, and energy utilization by Harp and Gray seal pups during the postweaning fast. Physiol Zool. 60(3), 352-364.
354

Chapter 3.7
Aquatic Mammals 1994, 20.1, 11-27
Effective mass transfer in a suckling Grey seal (Halichoerus grypus)
R. A. Kastelein, P. R. Wiepkema*, E. Berghout and H. J. Groenenberg
Zeedierenpark Harderwijk (Harderwijk Marine Animal Park), Strandboulevard-oost 1, 3841 AB Harderwijk, Holland
Summary
In January 1990 a male Grey seal pup was born at Harderwijk Marine Animal Park. Mother and pup were kept in a covered enclosure under constant observation. The pupping season of Grey seals at the Harderwijk Park is the same as in the Western Atlantic, the Dutch Wadden Sea and in the Baltic. Food availability and water temperature at the park hardly fluctuate, suggesting that the much earlier breeding of the UK population is due to the relatively warm winter sea surface temperatures there which may result in relatively large near-shore fish stocks.
Almost all suckling sessions were preceded by pup vocalizations. The number of vocalizations before a suckling session was not correlated to the time elapsed since the pup had last suckled. In the mother, flippering seemed to serve as a suckling stimulant, whereas in the pup it seemed to be done in defence. Most sessions were broken off by the pup, indicating that the pup decided the duration of a suckling session. Suckling sessions broken off by the mother were sometimes related to disturbances. During oestrus the mother became restless, her appetite decreased, her labia became swollen and the durations of the suckling sessions and non-suckling intervals became irregular. During the suckling period the pup gained 1.9 kg a day, while the mother lost 3.6 kg of her body weight a day, resulting in an effective mass transfer (R) of 0.53. The pup's moult was complete by day 18 and it started to eat solid food voluntarily on day 27 after birth.
Key words: Halichoerus, suckling, reproduction, behaviour, neonate, lactation.
Introduction
Many Grey seal (Halichoerus grypus) pups die during the suckling period or soon after weaning, both in the wild (Davies, 1949; Coulson & Hickling,
*Ethology Section, Department of Animal Husbandry, Agricultural University, P.O. Box 338, 6700 AH Wageningen, Holland.
1960; Gallacher & Waters, 1964; Summers et al., 1975; Anderson et al, 1979; Baker et al, 1980; Baker, 1984, 1987 & 1988; Carter et al, 1990) and in zoological parks (Leslie, 1974; Kastelein & Wiepkema, 1988). To determine the factors which influence the pups' chances of survival, a long term study program was launched on the suckling period of Grey seal pups born of the same pair at the Harderwijk park.
The first pup studied was a female, born in 1987. Mother and pup were moved to an undisturbed indoor enclosure 1 hour after birth as a safety measure (Kastelein & Wiepkema, 1988). Research continued in 1988 when another female pup was born, and mother and pup where placed in an outdoor area next to the Grey seal pool. A fence prevented the animals from leaving this area (Kastelein & Wiepkema, 1990). In 1989 a third female pup was born outdoors, and the mother was allowed free access to the pool (Kastelein et al, 1991).
In January 1990, a male Grey seal pup was born in the indoor suckling enclosure used by the mother and her pup during the 1987 suckling period. This study describes the 1990 pup's suckling period and compares it with that of the 1987 pup.
Materials and Methods Study animals In 1990 the Harderwijk Marine Animal Park housed 2 adult Grey seals. A male (code HgZH002), estimated to have been born in 1972, found stranded on the Belgian coast in May 1978, and sent to Harderwijk, and a female (code HgZHOOl), born in September 1973, stranded in Belgium in November 1973 and also sent to Harderwijk. Copulation took place on 9 February 1989, and after a gestation period of 348 days, a male pup (code HgZH009) was born on 23 January 1990. This report deals with the behaviour of the mother and this pup.
Study area Because of construction activities around the outdoor seal exhibit, the female Grey seal was moved
355

R.A. Kastelein et al.
Water trough.
Fence.
Doors,
Wooden barrier.
Area 1
Area 2
Wooden board
Steps
Lower part
0 1m Figure 1. The covered enclosure in which the Grey seal mother and pup were kept during the suckling period.
to the indoor suckling area on 6 January 1990. The tiled enclosure consists of an upper part (2.2 x 3.0 m), which is linked by 3 steps to a lower part (1.0 x 3.0 m). Using an imaginary line, the upper part was divided into 2 equal areas (Fig. 1). In area 1, a water trough was placed next to the fence. In area 2, a wooden board was placed on the tiled floor to reduce heat loss from the pup to the substrate. To prevent the pup from sliding into the lower area, a 10 cm high wooden barrier was placed just above the first step. Before and after the suckling period the lower part was filled with about 30 cm of water. During the suckling period the air temperature was on average 15°C. Human activity in and around the enclosure was reduced to the minimum needed for husbandry (cleaning, feeding and weighing the pup). Windows in the ceiling allowed some daylight to enter the study area, but in addition it was lit 24 hours a day. Two television cameras and a microphone, which could be aimed at the animals using a remote control rotor, made it possible to watch and listen to the animals continuously. The images could be observed on 2 screens in a nearby observation room, which was manned 24 hours a day during the entire suckling period.
Recording technique The behaviour of mother and pup was recorded during one second every 15 minutes between 08.00 and 18.00 hours, and every hour between 18.00 and 08.00 hours (maximum score per day for each behavioral parameter: 10x4+14x1=54). The following parameters were recorded:
—Rest or activity —Type of activity: Locomotion, scratching, actively looking at surroundings with raised head, suckling, playing/investigating and waking up (yawning, stretching, etc.). —Together or separate (a distance of less than 1 m was counted as being together). —Position of mother and pup (in area 1 or 2, see Fig. 1). In addition the following parameters were recorded before and during each suckling session: —Time of first vocalization by the pup that introduced a suckling session. —Number of vocalizations. These were divided into those heard during the hour before a suckling session, and those at other times. —Whether or not nose contact (nuzzling) occurred before a suckling session. —Time when the female first offered her nipples to the pup by rolling on her side in front of the pup. —Flippering (moving the foreflippers horizontally) by the mother and pup occurring before, during or after a suckling session. —Time that a suckling session started (first contact of the pup's mouth with the mother's nipple). —Time that a suckling session ended (last contact of the pup's mouth with the mother's nipple, after which they separated). —Number of interruptions (pauses) within a suckling session. —Real suckling time (length of time that the pup's mouth was in contact with the nipple).
356

Effective mass transfer in a suckling Grey seal
Table 1. The number of vocalizations during the first and the last period (set at 60 min) of the non-suckling intervals.
Median duration (min) Range (min) Mean duration (min) No. of periods with vocalizations No. of periods without vocalizations Mean freq. of voc. in that period Mean freq. of vocalizations/hr
First part
146 0-349
150 67 51 7 2.8
Second part
set at 60
— —
116 2
35 35
Total non-suckling interval
206 35^09 205 — — 34 10
—Which of the 2 animals cancelled a suckling session by moving away first. Some miscellaneous parameters were also recorded: —The weight of the washed placenta (water removed). —The swelling of the mother's labia. —The amount of fish (Herring, Clupea harengus and Mackerel, Scomber scombrus) consumed by the female in the 3 feeds of each day. —Occasions that the female drank from the water trough. —The female's weight before and after the suckling period. —The pup's weight (about every 3 days). —The pup's rate of moult. All correlations (r) in this study are based on the Spearman rank correlation procedure (Siegel, 1956).
Results
Birth For a few weeks prior to birth the breathing of the pregnant female became more pronounced. Two days before birth, a white cervix plug, of which 17.8 g could be recovered, was found in the enclosure. On 23 January 1990 (day 0), the male pup was born at around 05.45 hrs. Like all previous pups, this one was born within seconds. The placenta was expelled together with the pup (Table 2). Within 15 minutes after birth, the pup was weighed, sexed and the umbilical cord was treated with an iodine solution to prevent infection. Umbilical infections are a major cause of death in wild Grey seal pups (Baker, 1984 & 1988).
Vocalizations Three hours after birth the pup vocalized for the first time. The mother offered her nipples, but this did not result in a suckling session.
Only 2 of the 118 suckling sessions began without pup vocalizations. The pup vocalized on average 35
times preceding a suckling session, but the number was quite variable (SD = 30.6, range =1-251, N= 116) (Table 1) and no significant trend was seen during the suckling period. There was a positive correlation between the number of vocalizations during the last 60 min of a non-suckling interval, and the duration of that interval (R=0.22, P<0.05); the number of vocalizations was not correlated with the duration of the subsequent suckling session.
In 67 cases the pup vocalized but did not start to suckle within 60 min; in these cases it vocalized on average 7 times (SD = 6.7, range=l-47).
Flippering After the mother had presented her nipples to the pup, he usually approached her chest. The mother then flippered. About 50% of all suckling sessions were preceded by flippering by the mother (Figs 2 & 3A). If the pup stopped suckling for some time, the mother often repositioned herself so she could touch the pup, and flippered. During the sessions she flippered in 39% of all cases, most of which occurred during the first phase of the suckling period (Fig. 3B). About 80% of all sessions were followed by flippering of the mother; this percentage increased a little during the suckling period (Fig. 3C).
While the mother almost always started the flippering, the pup usually only flippered when the mother touched him with her front flippers. The pup flippered less often than his mother prior to, during and after suckling sessions (in 26%, 20% and 40% of all cases). Flippering after a session tended to increase over the suckling period (Figs 4A, B & C).
Nuzzling Nuzzling between mother and pup took place near the beginning of almost every suckling session, and also often during suckling sessions. Only 15.3% of suckling sessions were not preceded by nuzzling.
357

R.A. Kastelein et al.
Figure 2. The Grey seal mother flippering at her 1-day-old pup. The arrows indicate the horizontal movements of the fore flippers. This behaviour occurred when the mother and pup came together before, during and after a suckling session. The mother's head is on the 10 cm high wooden barrier (Photo: Henk Merjenburgh).
Encounters between mother and pup The mother and pup spent 60% of scored time together. The proportion of time spent together increased as the suckling period progressed (Fig. 5). This increase was not due to an increase in actual suckling time, but because the animals lay together more often during other behaviour. Of the 579 scored cases of them being together, only 76 (8%) were while suckling.
Most of the suckling sessions (73%) were broken off by the pup (Fig. 6). Only on 4 days most sessions were broken off by the mother. The duration of the suckling sessions broken off by the mother was an average 440 sec (N=33, SD=191), and those broken off by the pup on average 545 sec (N = 85, SD=207). In 6 cases (18.2%) the sessions were broken off by the mother after she had been disturbed by human activity.
Suckling parameters The first suckling session occurred 4 hrs after birth. The total daily suckling time increased significantly (r=0.88, P=0.0001) throughout the suckling period from around 20min/day to HOmin/day, but decreased just before weaning (Fig. 7A). The mean length of the real suckling time per suckling session increased significantly (r=0.58, i>=0.0001) from 5 minutes on day 0 to nearly 14 minutes on day 16
(Fig. 7B). The average duration of a suckling session (real suckling time and breaks) also increased during the suckling period, and peaked on day 16 (Fig. 7B). The mean duration of the non-suckling intervals (time between successive suckling sessions) decreased significantly (r= -0.48, />=0.0001) from 260 min on day 0 to 100 min on day 18 (Fig. 7C). The number of suckling sessions per day was fairly stable at around 7 (Fig. 7D).
There was a significant negative correlation between the duration of a suckling session and the previous non-suckling interval (r= — 33, P=0.0004). There was also a significant negative correlation between the duration of a suckling session and the following non-suckling interval (r= — 0.31, P=0.0007), and a significant positive correlation exists (r=0.52, P=0.0001) between the durations of the non-suckling intervals before and after a suckling session. In short, an increase in the duration of suckling sessions is associated with a decrease in the duration of non-suckling intervals (Figs 7B & 7C).
Activity The percentage of scores in which the mother was resting varied, but during the daytime it decreased slightly from around 80% on day 0 to around 70% on day 18 (Fig. 8A). She rested on average more
358

Effective mass transfer in a suckling Grey seal
o E CD .c
+<*
CO c o CO CO <D CO
o> c
o
co
'5 •D
c
o •*•*
»*-o 5?
16 18
100i
0 2 Birth Weaning
No. of days after birth
Figure 3. The percentage of suckling sessions before (A), during (B) and after (C) which the mother flippered.
during the night (79%) than during the day (71%). The pup was resting in about 65% of all scores (Fig. 8B).
Food consumption and weight changes of the mother The mother's food consumption fluctuated strongly before, during and after the suckling period (Fig. 9). In January she consumed on average 2.1 kg per day, and her intake was low during the week before birth and for 3 days after birth. After this period her food intake increased to 4.3 kg/day until day 8 (31 January) after which it decreased to 0 kg for the 2 days before weaning. She ate much more after
copulation, in March she consumed on average 5.4 kg per day.
The female's weight changes are shown in Table 2. Assuming that her weight was constant during the last 2 weeks before birth, she lost 91.5 kg during the suckling period. This weight loss was caused by the birth of the pup (20 kg), the weight of the placenta (2.5 kg), the weight of the amnion fluid (estimated at 2 kg), transfer of milk for the pup's growth (it gained 34.7 kg) and maintenance, and the female's own metabolic needs. The mother drank some water from the trough several times each day during the suckling period, but the
359

R.A. Kastelein et al.
•o
a a 16 18
u 3 </)
_ > i
"<5 •o o c
"(5 *-< o
o
8 10 12 14 16 18
100 C 80- After
0 2 Birth
No.
10 12 " 14 16 Weaning
of days after birth
i 18
Figure 4. The percentage of suckling sessions before (A), during (B) and after (C) which the pup fiippered.
amount could not be determined. During the suckling period she lost an average of 3.6 kg a day.
Use of space The lower part of the suckling areas was not used during the suckling period (Fig. 1). The 10 cm bar proved an effective barrier for the pup, while the mother also did not go down. The time the pup spent in area 2 slowly decreased from 100% on day 0 to around 39% on day 18 (Fig. 10). On day 3 the pup started to play with the water in the trough in area 1, and on day 10 it began to drink water. In contrast to the pup, the time spent in area 2 by the mother increased over the suckling period. During
the second half of the suckling period she spent much time near the door in the fence in area 2.
Moulting and weight changes of the pup When the pup was 6 days old it started to moult, beginning with the limbs and the nose, and spreading towards the middle of the trunk. The sides were the last to moult. Moulting was complete by day 18.
The pup's weight changed as shown in Table 2. The pup gained on average 1.9 kg a day during the suckling period. Faeces were observed throughout the suckling period, and the pup was seen urinating on day 1 (he may have urinated more often, but this could not be seen on the black and white monitor screens). Starting on day 10, the pup drank from the
360

Effective mass transfer in a suckling Grey seal
•o
0)
a.
o
50-
45-
40'
35-
30'
25'
20-
15-
10H
Together including suckling
~--,' • — , »
A
i i 0 2 NBirth
n 4 6 8 10 12 14 16 18 2 0 N
Weaning Separation
No. of days after birth Figure 5. The number of scores that mother and pup were found together (including suckling), and the number of scores a day they were found together suckling (maximum possible score per day: 54, except for day 0).
>• CD
•D \ <A C o
'3> V) 0)
</> O)
_c
u 3 (A
o £ "5 o *-»
4-
o
i \ Broken off by pup
Broken off by mother
14 16 18 2 0 N
Weaning Separation
No. of days after birth
Figure 6. The percentage of suckling sessions broken off by the mother and by the pup during each day of the suckling period.
trough a few times a day an undetermined amount of water.
Oestrus The female came into heat noticeably on day 14 after birth; her labia were swollen, and she became
restless and scratched the fence. On day 18 she stopped suckling her pup and on day 20 she was moved to the outdoor seal pool to rejoin the male. The male was sexually excited and aggressive towards his keepers during most of the period that the female was in the indoor suckling area, about 200 m
361

R.A. Kastelein et al.
120n
100-
c E
o 3 CO
£
c
J c o
'35 m CD CO
o> _c 3 o 3 V)
C CO CB
1 14 16 18 20^
Weaning Separation No. of days after birth
30>| 28-26
24.
22
20H
18 16-14-12-
IDS' 6' 4 4 2
B
Duration of suckling session
T -4
1 I I I I I 10 12 14 16 18 20^
Weaning Separation
No. of days after birth
Figure 7. a and b.
away from the outdoor pool. Copulation occurred in the water immediately after the female entered the pool, after which the male calmed down.
Transition to solid food After weaning the pup lost weight until he accepted fish (Table 2). The pup was left in the indoor
362

Effective mass transfer in a suckling Grey seal
0 2 ''Birth
r 16 14 16 18 20N
Weaning Separation
No. of days after birth
V) c o '55 <o d> (A
c
o 3 0)
0)
n E 3 Z
16 18 20 N
Weaning Separation
No. of days after birth
Figure 7. c and d.
Figure 7. The total daily suckling time during the suckling period (A), duration of the average daily suckling session (including breaks) and the daily average of real suckling time per suckling session (B), the average non-suckling interval (C), and the total number of suckling sessions per day (D).
enclosure after weaning so that its food intake could be monitored. The barrier was removed, and the lower part was filled with about 30 cm of water (Fig. 1). He was not force-fed as previous pups had
been. Instead, thawed fish (Herring and Mackerel) were thrown into the water each day. On day 27 after birth (19 February) the pup started to play with the fish and eat bits of it. He started to eat fish
363

A Mother 10Oi
90-
80-
S 70i rr
60-
50-
R.A. Kastelein et al.
Daytime
Nighttime
0 2 NBirth
8 10 12 i i I
14 16 1
18 2 0 s
Weaning Separation
No. of days after birth
B Pup 1 0 0 i
18 20 N
^Birth Weaning Separation
No. of days after birth
Figure 8. The percentages of scores spent resting during the day (08.00-17.45 hrs) and during the night (18.00-07.45 hrs) by mother (A) and pup (B).
fed by hand on day 35 after birth (27 February). In March he ate on average 0.7 kg offish a day, and in April 1.1 kg a day. On April 12, 1990, the pup was judged able to compete for fish with the other seals, and was transported to the outdoor pool to join his parents.
Discussion and conclusions
This discussion focusses on the comparison of data from the present 1990 pup with those from the 1987 pup which was suckled in the same indoor enclosure. The 1987 pup was female and was left almost
364

Effective mass transfer in a suckling Grey seal
1 5 9 January
29 2 6 10 February
14 Date
Copulation Weaning Birth
Figure 9. The mother's daily food consumption before, during, and after the suckling period
Table 2. Weight changes of the mother and pup, and the weight of the placenta.
Occasion
To indoor enclosure Birth — — — — — Weaning Separation Start offering fish Fish eaten from pool floor Fish eaten from hand To outdoor pool
Time relative to birth (days)
- 2 0 0 2 6 9
13 16 18 20 21 27 35 78
Weight mother
(kg)
199.5
108.0
Weight pup (kg)
20 22 30 37 47 55.1 54.7 — — — — 44
Weight placenta
(kg)
2.5
completely undisturbed (Kastelein & Wiepkema, 1988).
Birth season Grey seal distribution is restricted to the North Atlantic and Baltic, and within this area the breeding season differs by up to 5 months. In the UK, Grey seals breed between September and December (King, 1983), but all Grey seal pups at
the Harderwijk Marine Animal Park have been born in the second half of January like the seals which recently inhabited the Dutch Wadden Sea (Peter Reijnders, pers. comm.). The breeding pair at Harderwijk are thought to originate from the UK population. Canadian Grey seals give birth in January (Coulson, 1981) and so do animals in the Baltic (Curry-Lindahl, 1970). Pupping dates are not determined by copulation date, but by the time of
365

R.A. Kastelein et al.
0 2 xBirth
- i — i — • i i i i i i i i 8 10 12 14 16 18 20 N
Weaning Separation
No. of days after birth
Figure 10. The percentage of scores that the mother and pup were in area 2 (see Fig. 1).
blastocyst implantation. This implantation is probably influenced by photoperiod, but also by other factors such as the sea surface temperature (Coulson, 1981; Boyd, 1991). Possibly the climate is of influence as well. If only the photoperiod influences the implantation date, populations living at different latitudes would be expected to give birth in different seasons.
In UK waters the average monthly water surface temperature roughly varies between a winter minimum of 7°C and a summer maximum of 15°C, in the West Atlantic between - 1 and 17°C and in the Dutch Wadden Sea roughly between 4°C and 18°C. The average monthly water surface temperature in the Baltic varies between 0°C and 17°C, while the northern part freezes in winter (Becker et al., 1984; Bruns, 1958; Davies, 1957).
The main difference between the Grey seal distribution areas, is the relatively high winter temperature in UK waters. This could increase food availability in winter, making an autumn breeding season favorable because both males and females need an increased food supply immediately after weaning and copulation (Kastelein et al, 1990), and the pups have to start eating fish.
At the Harderwijk park, where the Grey seal pool water temperature only fluctuates between 8°C in the winter and 10°C in the summer, and where food availability is constant births occur in January. Perhaps when water temperature and food availability are stable, day length becomes the main variable and birth occurs at this time of year.
Vocalizations The number of vocalizations before suckling sessions varied but did not change during the suckling
period, suggesting that the mother offered her nipples equally well during the entire suckling period. The weak positive correlation between the number of vocalizations and the duration of the non-suckling intervals in which they were produced, suggests that the mother did not serve her pup a defined time after the first vocalization, or after a certain number of vocalizations.
Almost all suckling sessions began after the pup had vocalized, which implies that vocalizations are an important part of the suckling ritual. However, no correlation was found between the number of vocalizations and the duration of the subsequent suckling session. Since the duration of most suckling sessions was determined by the pup (Fig. 6) the level of both parameters in the pup is not determined by a simple causal factor, for instance the pup's hunger. It is likely that the duration of suckling sessions is also determined by a 'social contact' factor between mother and pup. The pup occasionally vocalized a few times when no suckling session followed. The function of such vocalizations is not clear.
The 1987 pup vocalized on average around 3 times before each suckling session. In the present study the pup vocalized on average 34 times before it was served, perhaps because the mother served this pup later after it started to call than in 1987.
Flippering The function of flippering is not clear yet. Flippering by the mother could indicate her tendency to suckle and/or to contact her pup. If so, the high incidence of her flippering after a suckling session, most of which were broken off by the pup, could indicate that she often tried to prolong the session.
366

Effective mass transfer in a suckling Grey seal
Whether this was motivated by the fact that she still had milk available or a desire to prolong the contact with her pup is unclear. Since 75% of the sessions broken off by the mother were preceded by her flippering, those suckling sessions were not broken off because of a disturbance, but because the pup stopped suckling.
After the pup had stopped suckling it seemed annoyed when being touched by its mothers front flippers. Flippering by the mother seemed to serve as a stimulant for the pup to suckle, while flippering by the pup seemed to indicate that it wanted a safe distance between itself and the mother, at least to remain out of reach of her sharp-nailed fore flippers. The high incidence of flippering by the pup after a suckling session was perhaps caused by the mother who often repositioned herself and continued to flipper the pup.
Nuzzling Because nuzzling occurred before 84.7% of suckling sessions, it is an important part of the suckling ritual. The 1987 pup also had nose contact with its mother before almost every suckling session. In the wild the same behaviour has been seen (Davies, 1949; Fogden, 1968 & 1971; Burton et al., 1975). Nosing probably allows the cow to identify the pup using tactile and/or olfactory cues.
Encounters between mother and pup The total number of scores that the mother and pup were together was higher in 1990 than in 1987. This was perhaps because in 1990 the female associated the door with returning to the male and spent a good deal of time near it when she came into oestrus. The 1990 pup spent a lot of time playing in the water trough in area 1.
In 1987, around 80% of suckling sessions were ended by the pup, in 1990 around 73%. It could be that the pup stopped suckling as soon as its stomach was full. However, if so, why did suckling sessions vary so much in duration? Did the pup drink with variable intensity? Another possibility is that the pup went on suckling even after it had consumed all the available milk. This suckling increases social contact between mother and pup and it may be that motivation for this contact is stronger in the mother than in the pup. This agrees with the finding that most suckling sessions were broken off by the pup. When the mother broke off a session this was often preceded by human disturbance.
Suckling parameters The increase in total daily suckling time during the suckling period was mainly due to an increase in suckling session duration and could have been caused by; (1) decreased energy content of the milk,
(2) the pup's increased milk requirement, (3) milk production increase over time, (4) increased pup strength allowing longer suckling bouts, or (5) the pup's desire to be with its mother. On the other hand, the increased suckling frequency especially during the last 4 days, causing an increased total daily suckling time may also be a result of insufficient milk production (relative to the pup's potential growth rate, because it grew well compared to wild conspecifics), so that the pup started to suckle more frequently in order to reduce its appetite. In Southern elephant seals (Mirounga leonina), the amount of milk that could be recovered from the glands by milking sedated females after an injection of oxytocin increased until day 7, and then decreased to the low level of day 1 by day 21, around weaning (Bryden, 1968).
Based one a small sample size, Baker (1990) suggests that the milk composition in Grey seals changes during the suckling period so that the fat percentage is relatively low during the first 3 days (approximately 42%), and higher thereafter (approximately 53%). Iverson et al. (1991), investigated the milk composition of Grey seals on Sable Island, Nova Scotia. There the energy content of the milk increased by 37% during mid and late lactation compared to day 1. In Southern elephant seals (Mirounga leonina), the caloric content of the milk on day 14 is 2.5 times that of day 1, and decreases to the day 1 level on day 21 (around weaning; Bryden, 1968). If such energy content changes also occur in Grey seal milk, this would almost certainly affect suckling parameters.
The overall negative correlation between non-suckling intervals and the durations of the immediately preceding or following suckling sessions may simply reflect the finding that during the whole suckling period the intervals decreased while the duration of the suckling sessions increased. A similar explanation may hold for the overall positive correlation between the duration of successive non-suckling intervals.
Activity Both mother and pup rested for a large part of the day. This could mean that the mother expends energy optimally for the metabolism and growth of her pup. Pups rest to conserve energy, but are also active periodically. Boily (1991) showed that sleeping metabolic rate in juvenile Grey seals is on average 17% lower than resting rate, suggesting that sleep may be an important energy conservation strategy. In 1990 the mother and pup rested a little less than in 1987. This could be because they were disturbed more in 1990.
Both in 1987 and 1990 the mother became more active during the second half of the suckling period. This probably indicated the onset of oestrus. Both
367

R.A. Kastelein et al.
Cow Pup
Pvv
Mpup
Figure 11. Effective mass transfer. Cwb=body weight of the mother immediately after birth, Cww=body weight of the cow at weaning, Pwb=body weight of the pup at birth. Pwb=body weight of pup at weaning, Tb=time of birth, Tw=time of weaning. a=Cwb—Cww over the time interval Tb - Tw; b=Pww - Pwb over Tb - Tw, f & d=food and water intake of the mother, Meow=metabolic losses of the mother, Mpup=metabolic losses of the pup, e=mass (milk) transfer from mother to pup.
years she became restless and spent lots of time near the fence (Figs 8A & 10).
The female's food consumption and weight changes The mother's food consumption before, during, and after the suckling period in the present study was very similar to that of the previous 4 suckling periods. The strong increase in food consumption after copulation is probably necessary to restore the female's condition. Most wild lactating Grey seal females probably do not eat at all. They either lie constantly next to their calves, or remain in the water near the coast between suckling sessions (Fogden, 1971). However, in Nova Scotia, some ice-breeding females do continue to feed during lactation (Baker et al, 1991).
In the present study the mother lost on average 3.6 kg of her body weight per day during the suckling period. It would be interesting to know more about the female's digestive efficiency during the suckling period, because her body is geared to convert body fat into milk (Engelhardt & Ferguson, 1979). This type of information could be used to evaluate the effect of food on milk quantity and
quality and on the mother's weight changes during the suckling period.
Energy transfer from mother to pup Suckling is successful if mother and pup are viable after the suckling period. Viability depends partly on the effectiveness of energy transfer from mother to pup. A practical assessment of this effectiveness is the ratio (R) of body weight gain in the pup (b) and the body weight loss in the mother (a) during the suckling period. The ratio of b to a is similar to the efficiency of mass transfer proposed by Kovacs et al. (1991). The term effectiveness of mass transfer accentuates the fact that R, being a ratio of net effects, also depends on the somatic and environmental conditions of the animals involved. Fig. 11 schematizes the elements determining R. Tb and Tw indicate start and finish of the suckling period, or birth and weaning. The actual value of Cww is not only determined by Cwb, but also by summated food and water intake ( I f & d), summated metabolic loss (E Mcow) (faeces, urine, evaporation, heat) and summated milk transfer (X e) over the interval Th - T • a = S f & d - I M„ -X e. In a
368

Effective mass transfer in a suckling Grey seal
similar way b-Z s — Z Mpup. Therefore R also depends on food quality and availability, on the level of rest, and on climatic conditions. In the present study the R value is 1.9/3.6 = 0.53.
In Nova Scotia, Canada, adult females weighed on average 231 kg at the start of lactation, and lost on average 5.6 kg per day during the suckling period, or 60% of their fat reserves in total (Baker et al, 1991). Another study in Nova Scotia reported a linear material weight loss rate of 4.8 kg/ day. Mass loss was correlated with milk output, and the female's initial mass influences pup growth (Iverson et al, 1991). Pups gained on average 1.9 kg/day, resulting in an R value of 1.9/4.8=0.40. On North Rona, UK, over 80% of the females' energy reserves are used to feed the pup. The female's average weight loss was 3.6 kg/ day and pups gained on average 1.6 kg/day, resulting in an R value of 0.46 (Fedak & Anderson, 1982; Anderson & Fedak, 1987).
Amoroso & Matthews (1951) describe a female in human care with a post birth weight of 167 kg. She lost 43 kg during the 15 day lactation period (2.8 kg/day). Her low mass reduction rate compared to wild conspecifics could be due to a warmer environment or the (undetermined) amounts of water she drank. Her pup gained 1.5 kg/day, resulting in an R value of 0.54. This high R value and the value for the present study, indicate favourable lactation conditions compared to lactation in the wild. In captivity, food and water was more readily available, the ambient temperature was higher and the environment was quieter than in the wild.
Use of Space Both the 1990 pup and the previous 3 pups had a favourite location in the available area. This sedentary behaviour allows most of the milk's nutritional value to be used for growth instead for locomotion, and it is adaptive to the wild situation in which the mother has to locate the pup after returning to land. This is especially important for newborn pups which are difficult for the mother to identify (Burton et al, 1975). On Basque Islands, Nova Scotia, the mother remains with her pup for several days after birth, thereafter she goes to sea at regular intervals (Cameron, 1969). The 1990 pup moved rarely just after birth, and later it moved more but usually returned to its resting place. In the wild, if the pup does not vocalize, the returning mother goes to the spot where she left her calf and searches around (Davies, 1949). If she cannot find her pup, the bond is broken and the pup may starve. This is a major cause of death in Grey seals (Baker et al., 1980).
In 1990 the mother had a favourite resting place. However, this spot was possibly determined by the
position of the pup. In general the mother seemed to try to stay as far away from the pup as space allowed, but this tendency decreased over time (Fig. 5).
Moulting and growth of the pup The pup showed the same moulting pattern as wild pups of this species. Perhaps the rapid post-natal moult may be typical of ice-breeding seals of the present or evolutionary past, in order to prepare them quickly for an aquatic life. The primary woolly pelage is only functional as an insulator when dry (Ling & Button, 1975; Blix et al, 1979).
At birth, the 1990 male pup weighed 20 kg, whereas the 1987 female pup weighed 17 kg. In studies with larger sample sizes on Sable Island (Canada), no significant birth mass difference between males and females was found (Bowen et al, 1992), whereas on the Fame Islands (UK), North Rona (UK) and in Nova Scotia (Canada), males are in general heavier at birth than females (Coulson & Hickling, 1960; Coulson, 1960; Anderson & Fedak, 1987; Baker et al, 1991).
The placenta of the 1987 female pup weighed 2.2 kg, whereas that of the 1990 male pup weighed 2.5 kg. A larger sample derived from future studies should show whether a correlation is present between pup weight and placental weight.
The 1990 pup gained on average 1.9 kg per day through suckling, the 1987 pup 2.1 kg a day. This difference may be due to different levels of disturbance between the years or to metabolic differences between the pups. In both years the pup's mass gain was linear. On Sable Island, Canada, no significant difference was found in rate of mass gain between males and females (Bowen et al, 1992), whereas on the Fame Islands (UK), North Rona (UK) and in Nova Scotia (Canada), males grew faster than females during the suckling period (Coulson & Hickling, 1960; Coulson, 1960; Anderson & Fedak, 1987; Baker et al, 1991). The pup's mass gain during the suckling period is important, because it is positively correlated with its survival chance after weaning (Coulson & Hickling, 1964).
Oestrus On day 14, the mother's labia were swollen. It is not clear how much time before this physical sign hormonal changes occurred. On day 16, she became restless and more careless which she showed by frequently climbing over the pup.
In Grey seals males become sexually aroused even when no oestrus females are in the vicinity. Possibly day length and other environmental parameters influence the males' endogenous reproductive cycles.
369

R.A. Kastelein et al.
Transition to solid food The 1987 pup was force-fed shortly after suckling ceased, and started to accept fish voluntarily 45 days after birth. The 1990 pup was not force-fed, and began eating fish at the earlier age of 35 days (Table 2). Surprisingly the 1990 pup started to eat fish sooner when the caretakers waited patiently compared to when they, with good intentions, force-fed the 1987 pup. Possibly the stress involved with force-feeding makes pups less willing to accept fish. How long it takes for Grey seal pups to start to eat in the wild is not known. On the Fame Islands, pups stay on the shore for on average 32 days after birth before leaving for sea (Coulson & Hickling, 1964).
Like the pup in the present study, wild Grey seal pups lose weight after weaning until they can catch fish (Davies, 1949; Amoroso & Matthews, 1951; Coulson & Hickling, 1964). On average, pups on the Fame Islands lost 0.5 kg/day during the 14 days post weaning (Coulson, 1960). On Sable Island, the pups lost 22% of their weaning mass in the first 10 days of fasting (Bowen et al, 1992). During the post weaning fast, discomfort or stress is prevented by a depression of basal metabolic rate and extensive blubber (mainly tryglycerides) catabolism (Norday & Blix, 1985; Nordey et al, 1990). More than 70% of the post-weaning mass loss (and in excess of 90% of the energy) in Grey seals is in the form of blubber (Worthy & Lavigne, 1987). Nord0y & Blix (1985) calculated that around 94% of the energy expended by a pup during the first 4 weeks of the post-weaning fast is derived from subcutaneous fat deposits.
Recommendations Fogden (1971) describes differences in suckling behaviour under different environmental conditions. More studies of the present kind under a variety of conditions are needed to determine the proportional impact of weather conditions, the suckling area, biotic and abiotic disturbances, the pup's and the mother's activity, and individual metabolic rate differences on pup growth and survival.
Acknowledgements
We thank trainer Piet Mosterd for assisting with weighing the pup. We also thank Rob Dijk, Caroline Ritzema van Eck, Nellie Heyligers, Ineke Naaijer and Mirjam Snijdelaar for behavioral observation. Joop Rommets of the Dutch Institute for Sea Research (NIOZ) provided the information on sea temperatures. We thank Hans Romberg for the statistical calculations, Rob Triesscheijn for making some of the graphs and Irma Verhoeven and Nancy Vaughan for their comments on the manuscript.
References
Amoroso, E. C. & Matthews, L. H. (1951) The growth of the grey seal (Halichoerus grypus (Fabricius)) from birth to weaning. J. Anat. 85, 427-428.
Anderson, S. S., Baker, J. R., Prime, J. H. & Baird, A. (1979) Mortality in Grey seal pups: incidence and causes. / Zool, Lond. 189, 407-417.
Anderson, S. S. & Fedak, M. A. (1987) Grey seal (Halichoerus grypus) energetics: females invest more in male offspring. J. Zool, Lond 211, 667-679.
Baker, J. R., Anderson, S. S., Prime, J. H. & Baird, A. (1980) The pathology of the Grey seal (Halichoerus grypus). I. pups. Br. vet. J. 136, 401^112.
Baker, J. R. (1984) Mortality and morbidity in Grey seal pups (Halichoerus grypus). Studies on its causes, effects of the environment, the nature and sources of infectious agents and the immunological status of pups. J. Zool. Lond. 203, 23-48.
Baker, J. R. (1987) Causes of mortality and morbidity in wild juvenile and adult grey seals (Halichoerus grypus). Br. vet. J. 143, 203-220.
Baker, J. R. (1988) Further studies on Grey seal (Halichoerus grypus) pup mortality on North Rona. Br. vet. J. 144, 497-506.
Baker, J. R. (1990) Grey seal (Halichoerus grypus) milk composition and its variation over lactation. Br. vet. J. 146, 233-238.
Baker, S. R., Barrette, C. & Hammill, M. O. (1991) Mass transfer during lactation of an ice-breeding pinniped, the gray seal (Halichoerus grypus), in Nova Scotia, Canada. Ninth Biennial Conf. on the Biol, of Mar. Mamm., Chicago, 111. USA, 4.
Becker, G. A., Frey, H. & Wegner, G. (1984) North Sea surface temperature means 1971 to 1980 and their differences compared with the ICES means (1905-1954). Int. Counc. for the Expl. of the Sea CM. 1984/C1.
Blix, A. S., Grav, H. J. & Ronald, K. (1979) Some aspects of temperature regulation in newborn harp seal pups. Am. J. Physiol. 236, R188-R197.
Boily, P. (1991) Thermoregulation of juvenile female grey seals (Halichoerus grypus). Ninth Biennial Conf. Biol. Marine Mamm. Chicago, 111. USA, 8.
Bowen, W. D., Stobo, W. T. & Smith, S. J. (1992) Mass changes of grey seal (Halichoerus grypus) pups on Sable Island: differential maternal investment reconsidered. J. Zool, Lond. 227, 607-622.
Boyd, I. L. (1991) Environmental and physiological factors controlling the reproductive cycles of pinnipeds. Can. J. Zool. 69, 1135-1148.
Bruns, E. (1958) Kurze hydrologische Charakteristik der Meere des Atlantischen Ozeans. In: Ozeanologie, D.V.W. Berlin.
Bryden, M. M. (1968) Lactation and suckling in relation to early growth of the Southern elephant seal, Mirounga leonina (L.). Aust. J. Zool. 16, 739-748.
Burton, R. W., Anderson, S. S. & Summers, C. F. (1975) Perinatal activities in the Grey seal (Halichoerus grypus). J. Zool, Lond. Ill, 197-201.
Cameron, A. W. (1969) The behavior of adult gray seals (Halichoerus grypus) in the early stages of the breeding season. Can. J. Zool. 47, 229-233.
370

Effective mass transfer in a suckling Grey seal
Carter, S. D., Hughes, D. E. & Baker, J. R. (1990) Characterization and Measurement of Immunoglobulins in the Grey Seal {Halkhoerus grypus). J. Comp. Path. 102, 13-23.
Coulson, J. C. (1960) The growth of grey seal calves on the Fame Islands, Northumberland. Trans. Nat. Hist. Soc. Nor thumb. 13, 86-100.
Coulson, J. C. & Hickling, G. (1960) The Grey seal of the Fame Islands. Trans. Nat. Hist. Soc. Northumb. 13, 196-214.
Coulson, J. C. & Hickling, G. (1964) The breeding biology of the Grey seal (Halkhoerus gryphus) on the Fame Islands. / Anim. Ecol. 33, 485-512.
Coulson, J. C. (1981) A study of the factors influencing the timing of breeding in the Grey seal (Halichoerus grypus). J. Zooi, Lond. 194, 553-571.
Curry-Lindahl, K. (1970) Breeding biology of the baltic Grey seal (Halichoerus grypus). Der Zool. Garten 38(1/2), 16-29.
Davies, J. L. (1949) Observations on the Grey seal (Halichoerus grypus) at Ramsey Island, Pembrokeshire. Proc. Zool. Soc. Lond. 119, 673-692.
Davies, J. L. (1957) The geography of the Gray seal. J. of Mammal. 38(3), 297-310.
Engelhardt, F. R. & Ferguson, J. M. (1979) Adaptive changes in Harp seals, Phoca groenlandica, and Grey seals, Halichoerus grypus, during the post-partum period. Aquatic Mammals 7(3), 83-92.
Fedak, M. A. & Anderson, S. S. (1982) The energetics of lactation: accurate measurements from a large wild mammal, the Grey seal (Halichoerus grypus). J. Zool, Lond. 198, 473^*79.
Fogden, S. C. L. (1968) Suckling behaviour in the Grey seal (Halichoerus grypus) and the Northern elephant seal (Mirounga angustirostris). J. Zool, Lond. 154, 415^120.
Fogden, S. C. L. (1971) Mother-young behaviour at Grey seal breeding beaches. J. Zool, Lond. 164, 61-92.
Gallacher, J. B. & Waters, W. E. (1964) Pneumonia in Grey seal pups at St. Kilda. Proc. Zool. Soc. Lond. 142, 177-180.
Iverson, S. J., Bowen, W. D., Boness, D. J. & Oftedal, O. T. (1991) Milk composition, milk intake and energetics of lactation in grey seals (Halychoerus grypus) on Sable Island, Nova Scotia. Ninth Biennial Conf. on the Biol, of Mar. Mamm., Chicago, 111., USA, 36.
Kastelein, R. A. & Wiepkema, P. R. (1988) Case study of the neonatal period of a Grey seal pup (Halichoerus grypus) in captivity. Aquatic Mammals 14(1), 33-38.
Kastelein, R. A., Wiepkema, P. R. & Vaughan, N. (1990) The food consumption of Grey seals (Halichoerus grypus) in human care. Aquatic Mammals 15(4), 171-180.
Kastelein, R. A. & Wiepkema, P. R. (1990) The suckling period of a Grey seal (Halichoerus grypus) while confined to an outdoor land area. Aquatic Mammals 16(3), 120-128.
Kastelein, R. A., Wiepkema, P. R. & Vaughan, N. (1991) The suckling period of a Grey seal (Halichoerus grypus) while the mother had access to a pool. Aquatic Mammals 17(1), 42-51.
King, J. E. (1983) Seals of the World. Oxford: Oxford Univ. Press.
Kovacs, K. M., Lavigne, D. M. & Innes, S. (1991) Mass transfer efficiency between harp seal (Phoca groenlandica) mothers and their pups during lactation. / Zool, Lond. 223,213-221.
Leslie, G. (1974) Breeding the Grey seal at Aberdeen Zoo. Int. Zoo Yearbook 14, 130-131.
Ling, J. K. & Button, C. E. (1975) The skin and pelage of grey seal pups (Halichoerus grypus Fabricius): with a comparative study of foetal and neonatal moulting in the Pinnipedia. Rapp. P.-v. Reun. Cons. Int. Explor. Mer 169, 112-132.
Nord0y, E. S. & Blix, A. S. (1985) Energy sources in fasting grey seal pups evaluated with computed tomography. Am. Jour, of Physiol. 1A9, R471-476.
Nordoy, E. S., Ingebretsen, O. C. & Blix, A. S. (1990) Depressed metabolism and low protein catabolism in fasting grey seal pups. Acta Physiol. Scand. 139, 361-369.
Siegel, S. (1956) Non-parametric statistics. McGraw-Hill, New York.
Summers, C. F., Burton, R. W. & Anderson, S. S. (1975) Grey seal (Halichoerus grypus) pup production at North Rona: A study of birth and survival statistics collected in 1972. J. Zool, Lond. 175, 439-451.
Worthy, G. A. J. & Lavigne, D. M. (1987) Mass loss, metabolic rate, and energy utilization by Harp and Gray sea pups during the post weaning fast. Physiol Zool. 60(3), 352-364.
371

Chapter 3.8
THE DEVELOPING ZOO WORLD
Int. Zoo Yh. (1995) 34: 186-200 © The Zoological Society of London
Detailed observations of suckling behaviour of a Grey seal Halichoerus grypus
at Harderwijk Marine Mammal Park R. A. KASTELEIN, H. J. GROENENBERG & P. R. WIEPKEMA1
Harderwijk Marine Mammal Park, Strandboulevard-oost 1, 3841 AB Harderwijk and 'Ethology section, Department of Animal Husbandry, Agricultural University, PO Box 338, 6700 AH Wageningen, The Netherlands
In each of the five years, 1987 to 1991, a pair of Grey seals Halichoerus grypus produced a pup. For each birth the mother and pup were kept under constant observation and a variety of suckling parameters were recorded. In January 1991 the pup was born in an indoor suckling enclosure where in 1987 and 1990 other infants had been reared. Most suckling sessions were initiated by the pup vocalizing followed by the mother presenting her nipples. The pup ended 89% of the sessions. Throughout the 17-day suckling period, total daily suckling time, suckling session length and number of pauses in suckling sessions all increased. The length of non-suckling intervals decreased. Even in the absence of vocalizations the mother appeared to be able to judge when the pup wanted to suckle, probably alerted by the waking-up behaviour of the infant. The $ flippered before 43%, during 41%) and after 76%) of all suckling sessions. The pup flippered before 12%, during 13% and after 17% of the suckling sessions. The mother's food intake was low for a few days immediately before and for three days after the birth. After this her food intake increased to 5 kg per day until day 9, then decreased to 0'5 kg one day before weaning. The $ ate more after weaning and copulation than during the suckling period when she lost a mean 3 kg per day. The pup gained a mean 2 kg per day and by day 43 he began to catch live fish. When the pup started to eat thawed marine fish the colour of his mystacial vibrissae started to change and about two weeks later they went from black to transparent. At the age of 120 days the pup was released into the North Sea to join a group of wild Grey seals.
Grey seal Halichoerus grypus pups frequently die during the suckling period or soon after weaning, both in the wild (Davies, 1949; Coulson & Hickling, 1960; Gallacher & Waters, 1964; Summers et al, 1975; Anderson et al, 1979; Baker et al, 1980; Baker, 1984, 1988) and in cap
tivity (Leslie, 1974; Kastelein & Wiep-kema, 1988). To determine the factors which influence chances of survival, a long-term study of Grey seal suckling behaviour was started at Harderwijk Marine Mammal Park, gathering data from pups born to a single pair of seals.
The first pup studied was a $ born in 1987. One hour after birth the mother and pup were moved to an indoor enclosure because the pup had already gone into the pool and this was considered to be too early (Kastelein & Wiepkema, 1988). Research continued in 1988 when another ? was born in an outdoor suckling area which was situated next to the Grey seal pool but separated by a fence (Kastelein & Wiepkema, 1990). In 1989 a third $ was born outdoors and the mother was allowed free access to the pool while a barrier prevented the pup from reaching the water (Kastelein et al, 1991). In 1990 a $ pup was born in the indoor enclosure. Owing to construction work taking place in a nearby area there were more disturbances in 1990 than there had been in 1987 (Kastelein et al, 1994). These studies describe the suckling behaviour in much greater detail than studies that have been carried out in the wild. However, each study concerned only one animal. In order to draw reasonable conclusions of ecological or husbandry importance, more and equally detailed descriptive studies,
373

R.A. Kastelein et al.
under similar and different environmental conditions, are needed.
When in January 1991 a $ pup was born in the indoor enclosure, the suckling behaviour of the mother and pup and their body-weight changes during the suckling period were recorded and are described in this paper.
STUDY ANIMALS Harderwijk Marine Mammal Park houses 1.1 adult Grey seals. The <$ (code HgZH002), estimated to have been born in 1972, was found stranded on the Belgian coast in May 1978 and transported to Harderwijk. The $ (code HgZHOOl), estimated to have been born in September 1973, was stranded on the Belgian coast in November 1973 and transported to Harderwijk. Copulation was observed on 12 February 1990 and after a gestation period of 343 days a $ pup (code HgZHOll) was born on 21 January 1991.
STUDY AREA On 3 January 1991 the pregnant 9 spent a considerable amount of time on land and was aggressive towards the $, which stayed near to her for most of that day. On 4 January she was moved to a tiled indoor enclosure comprising upper (3x2-2 m) and lower (3 x 1 m) sections linked by three steps. An imaginary line divided the upper section into two equal areas (Fig. 1). In area 1 a water trough was positioned next to the fence. Because the thermal conductivity of concrete is high (Perry, 1950) there was a built-in concrete floor element in area 2 which was heated to about 20°C for the first five days after birth to reduce heat loss from the pup to the substrate. To prevent the pup from sliding into the lower section, a 20 cm high wooden barrier was positioned just above the first step. Before and after the suckling period the lower section was filled with c. 30 cm of water but this was drained while the young was being suckled. The air temperature was maintained at a mean 12°C (n = 69, range
Water trough.
Wooden barrier.
X
' Steps
Lower part
Fig. 1. The indoor area where the Grey seal Halicho-erus grypus $ and her pup were housed during the study period. The concrete floor element was heated for the first five days to reduce the heat loss from the pup to the substrate.
8-16°C). To avoid disturbance, human activity in and around the enclosure was reduced to minimum husbandry needs, such as cleaning, feeding and weighing the pup: a fence was placed between the mother and pup and the infant was removed for one minute to be weighed on an electronic balance, accurate to 50 g. After the initial disturbance the mother remained calm. In addition to the natural daylight provided through windows in the ceiling, the enclosure was artificially lit 24 hours a day, although between 1800 and 0700 hours one of the two lamps was switched off. A microphone and two television cameras, which could be pointed at the animals using a remote-control rotor, made it possible to listen to and observe the animals constantly. The images could be seen on two screens in an observation room which was staffed 24 hours a day when a pup was being reared.
DATA COLLECTION A scanning sample of the behaviour of the mother and pup was taken every 15 minutes between 0800 and 1800 hours, and every hour between 1800 and 0800 hours (maximum score per day for each behavioural parameter: (10x4)+ (14x1) = 54). The following parameters were recorded: (1) rest or activity; (2) type of activity, such as locomotion,
374

Detailed observations of suckling behaviour of a Grey seal
scratching, actively looking at surroundings with raised head, suckling, playing/ investigating, waking up (yawning, stretching); (3) spatial proximity, a distance of less than 1 m was recorded as being together; (4) position of mother and pup, that is, in area 1 or 2 (Fig. 1).
Before and during each suckling session the following parameters were recorded: (1) time of the first vocalization made by the pup that initiated suckling. Previous studies showed that non-suckling intervals usually lasted about three hours. It was assumed that vocalizations produced in the two hours after a suckling session did not initiate a new session but served another unknown function. In this study few vocalizations were heard in the two hours following suckling sessions; (2) number of vocalizations by the pup in the 60 minutes before a suckling session; (3) whether or not the mother reacted to the pup's vocalizations; (4) whether or not nose contact (nuzzling) occurred in the few minutes before a suckling session; (5) fiippering (moving fore flippers horizontally) by the mother and pup occurring a few minutes before or during a suckling session or within a few minutes of the pup's last contact with the nipple; (6) time that suckling session started (first contact of the pup's mouth with the nipple); (7) time that suckling session ended (last contact of the pup's mouth with the nipple after which the seals separated); (8) real suckling time (the length of time the pup's mouth was in contact with a nipple); (9) number of pauses during suckling session. A pause is a period during a suckling session when the pup releases the nipple for a short period, usually a few seconds but, by our definition, no longer than 30 minutes. Previous studies showed that if a suckling interruption lasted longer than 30 minutes the pup usually fell asleep. If suckling recommenced, the entire ritual of vocalizations, nuzzling and fiippering would occur; (10) which of the animals ended the session by moving away first.
Some miscellaneous parameters were also recorded: (1) the weight of the washed and drained placenta; (2) the swelling of the $'s labia; (3) the amount of fish, herring Clupea harengus and mackerel Scomber scombrus, consumed by the 2 in three daily feeds; (4) the ?'s weight before and after the suckling period; (5) the pup's weight during and after the suckling period; (6) the pup's rate of moult.
All correlations (r) in this study are based on the Spearman rank correlation procedure (Siegel, 1956).
BIRTH In the weeks prior to parturition the ?'s breathing became laboured. Six days before she gave birth a white cervical plug was found in the enclosure. On 21 January (day 0) the c? pup was born at 1730 hours. The birth was not observed and the pup was found with the membranes still around his head. The membranes were removed quickly, the pup was weighed and sexed, and the umbilical cord was treated with an iodine solution to prevent infection. Umbilical infections are a major cause of death in wild Grey seal pups (Baker, 1984, 1988). The pup had respiratory problems, probably because the membranes adhered to his head for too long and some amniotic fluid may have entered his lungs. One hour after birth a breathing stimulant for neonates, Respirot® (a spray), was administered into the nasal passage and mouth, and 1 ml of a breathing centre stimulant, Lob-elin®, was given intra-muscularly. The ?'s labia were swollen immediately after the birth.
VOCALIZATIONS Fifteen hours after birth the pup vocalized for the first time. The mother offered her nipples but this did not result in a suckling session. The pup suckled for the first time c. 20 hours after birth (i.e. on day 1). For the first four days the pup seldom vocalized but breathed heavily and often
375

R.A. Kastelein et al.
sneezed. In that period the mother often presented her nipples without eliciting suckling. After day 4, nipple presentations occurred only after vocalizations and all elicited suckling. Over the entire suckling period, the pup vocalized a mean 12 times preceding each suckling session but the range was variable (0—46, n=135). No significant trend in the timing or number of vocalizations was seen during the rest of the suckling period. No vocalizations were heard after weaning.
NUZZLING At the beginning of 94% of all suckling sessions, and often during them, the mother and pup nuzzled. Only eight out of 135 sessions were not preceded by nuzzling.
FLIPPERING The ? fiippered in 93% and the pup in 37% of all suckling sessions. The $ fiippered before 43%, during 41% and after 76% of all sessions (Fig. 2a-c). Flippering during sessions only occurred during
pauses and never when the pup was actually suckling. No trends occurred in the frequency of the $'s flippering over the whole suckling period before, during or after suckling sessions. The pup fiippered before 12%, during 13% and after 17% of all sessions (Fig. 3a-c). No trends occurred in the time or frequency of the pup's flippering over the whole suckling period before, during or after suckling sessions.
PROXIMITY OF MOTHER AND PUP Over the entire suckling period the time the mother and pup spent together (a mean 89% of scored events) increased slightly (Fig. 4). Of the 806 scored cases of their being together 74 were while suckling (9%).
Most suckling sessions (89%o) were ended by the pup (Fig. 5).
SUCKLING PARAMETERS The first suckling session occurred 20 hours and 45 minutes after birth. The
100
80'
60'
40-
20-
8 10 12 14 16 18
100-
80-
60-
40'
20-
2 4 6 8 10 12 14 16 18 age (days)
Fig. 2. The percentage of suckling sessions a. before, b. during and c. after which the mother fiippered.
100-80-60-40-20-
6 ' 8 ' 10 12 ' 14 ' 16 18
age (days)
Fig. 3. The percentage of suckling sessions a. before, b. during and c. after which the pup fiippered.
376

Detailed observations of suckling behaviour of a Grey seal
sore/day
Fig. 4. The total number of scores per day that mother and pup were observed together (including suckling) (solid line) and the number of scores per day they were observed suckling (broken line). Maximum possible score per day = 54, except for day 0.
total daily real suckling time increased significantly (r = 0-9, i><0-001) throughout the suckling period, from zero minutes on day of birth to 172 minutes per day on day 16 but there was a decrease immediately before weaning (Fig. 6a). On day 11 the steep decrease was at least partly because the mother pushed the pup into the lower section of the enclosure and they were separated for three hours and 39 minutes. The average non-suckling interval lasts three hours so the pup probably missed one if not two suckling sessions. The mean length of the suckling sessions increased significantly (r = 0-64, i><0-001) from zero minutes on the day of birth to nearly 16 minutes on day 16 (Fig. 6b). The average daily real suckling time increased in a similar way. The number of pauses also increased during the suckling period but especially after day 11 (Fig. 6b). The mean duration of the non-suckling intervals (between successive suckling sessions) decreased significantly (r=-0-67, /><0001) from just under 300 minutes on day 1 to 69 minutes on day 17 (Fig. 6c). The number of suckling sessions per day first increased to
around nine at day 4 and increased further around day 14 (Fig. 6d).
There was a significant (r=— 0-43, P< 0-001) negative correlation between the duration of suckling sessions and the ensuing non-suckling intervals. A significant (r = 0-55, P< 0-001) positive correlation occurred between the duration of successive non-suckling intervals.
A number of isolated observations were recorded: (1) several times after a suckling session the pup had hiccups; (2) on day 12 the ?'s nipples exuded milk between two suckling sessions; (3) on day 16 the pup fell asleep for several seconds during a suckling session and when woken by the mother he continued suckling.
ACTIVITY The percentage of scored occasions that the $ was resting was variable (a mean 79%) but decreased from around 99% on day 1 to about 63% on day 16 (Fig. 7a). She rested almost as much at night as during the day. Almost half of her active time consisted of nipple presentation and suckling the pup, 33% investigation of her surroundings, 12% scratching and 7% locomotion. The pup rested about 64% of all scores both night and day (Fig. 7b). Of his active time, 22% consisted of nipple searching and suckling, 47% playing and investigating, 9% scratching, 9% waking-
Fig. 5. The percentage of suckling sessions broken off by the mother (solid line) and the pup (broken line) for each day of the suckling period.
377

R.A. Kastelein et al.
12 14 16 18 age (days)
t ime (min.) 2 8 i no. pauses
•100
.80
•60
•40
•20
14 16 age (days)
18
no. 14' 13' 12' I V 10' 9-8' 7" 6 ' 5-4-3 ' 2-1 ' 0i
8 10 14 16 18 age (days)
Fig. 6. a. The total daily real suckling time; b. duration of the mean daily suckling session (including breaks) (broken line), the mean real suckling time (solid line) and the mean number of pauses (dotted line) per suckling session; c. the mean daily non-suckling interval; d. the total number of suckling sessions per day during the suckling period.
up behaviour, 8% locomotion and 5% vocalizing.
FOOD CONSUMPTION AND WEIGHT CHANGES IN ADULT The $'s food consumption fluctuated markedly before, during and after the suckling period (Fig. 8). In January she consumed a mean 2-6 kg of fish per day but her intake decreased a few days before
parturition. After the birth her food intake increased to 5 kg per day until day 9 (30 January), then it decreased to 0-5 kg one day before weaning. She drank from the trough a mean four times per day, mostly between days 5 and 11. She ate much more after weaning and copulation than during the suckling period. In the second half of February she consumed
378

Detailed observations of suckling behaviour of a Grey seal
/•rest 100' 90' 80' 70' 60' 50'
8 10 12 14 16 18
100' 90' 80' 70' 60' 50' 40'
0 2 4 6 8 10 12 14 16 18 age (days)
Fig. 7. The percentage of scores (n = 54) spent resting during the day (0800-1800 hours) (solid line) and night (1800-0800 hours) (broken line) by a. the mother and b. the pup.
a mean 8-7 kg per day and in March a mean 7-4 kg per day.
The ?'s body condition changed visibly during the suckling period (Plate 1). Seventeen days before the birth she weighed 201 kg but by weaning and separation she only weighed 125-3 kg. Assuming that her weight was constant during the 17 days before birth, she lost 75-7 kg during the suckling period. This amount can be broken down into the pup's birth weight (19-5 kg), the placenta (2-45 kg), the amniotic fluid (estimated 2 kg) and milk transfer of which the pup converted 34-8 kg to body weight (Table 1). The remaining weight loss was possibly the result of faecal and urinary elimination for both 9 and pup and evaporation from breathing. During the suckling period the $ lost a mean 3 kg per day.
USE OF SPACE During day 1, the pup spent 80% of its time in area 2 (Fig. 9). This decreased to a minimum of around 30% on day 3. On days 12-16 more than 90% of its time was spent in area 2. The $ spent less time in area 2 but she increased her presence there
towards the end of the suckling period. On day 11 the ? pushed the pup over the wooden barrier and into the lower section of the study area. Because the ? did not follow, the pup was replaced in area 2 three hours and 39 minutes later.
MOULTING AND GROWTH When the pup was one day old it started to moult on its nose and paws. Moulting was complete by day 25 (15 February).
At birth the pup weighed 19-5 kg and for the first two days his weight was constant (Table 1). At weaning he weighed 54-3 kg and he had gained a mean 2 kg per day during the suckling period (Plate 1). After weaning the pup lost weight until he started to eat sufficient amounts of fish (Table 1). On day 1 the pup eliminated c. 0-5 kg of black faeces. Defecation was observed 17 times and urination 14 times but both probably occurred more often.
OESTRUS From day 9 onwards the ? became restless and started to scratch the fence, bite the pup's neck and roll over him. This behaviour increased in intensity towards weaning. On day 16 she noticeably came into oestrus; her labia were swollen, she tried to get through the fence and threw her body onto the pup. On day 17 she
Fig. 8. The daily food consumption for the mother, before, during and after the suckling period: B. birth; W. weaning.
379

R.A. Kastelein et al.
Plate 1. The Grey seal Halichoerus grypus +' and her <J pup during suckling sessions at day 2 (top) and day 17 (bottom). Note the weight loss of the mother, as indicated by an increase in the number of wrinkles in her skin, and the weight gain and lanugo hair loss of the pup. The arrow indicates the concrete floor element which was heated during the first five days. Also note the 20 cm high wooden barrier and water trough also shown in Fig. 1. Hunk Mcrjenburgh.
380

Detailed observations of suckling behaviour of a Grey seal
DAYS AFTER WEIGHT MEAN' FOOD
BIRTH OF PUP CONSUMPTION
(kg) OF PUP (kg/day)
To covered enclosure1
Birth:
Weaning and separation'
Start offering live fish Start eating live fish
Start eating thawed fish
To other indoor pool
To North Sea
- 1 7 0 2 4 6 8
10 12 14 16 17 24 31 38 43 45 52 58 59 66 73 80 87 94
101 108 115 120
19-5 19-5 23 28 33-5 391 46-2 50-7 54 54-3 491 46 42-9
41-1 39
36-6 37-3 39-7 41-3 43-3 47 51-7 55-9 54-4 51-1
0-2
2-3
0-2
1 The pregnant $ was moved to the indoor enclosure 17 days before the birth and at this time she weighed 201 kg. - The washed and drained placenta weighed 2-45 kg. 1 At separation the adult $ weighed 125-3 kg.
Table 1. Weight changes and food consumption of a Grey seal Halichoerus grypus pup at Harderwijk Marine Mammal Park.
scratched the fence almost continuously and stopped suckling the pup so she was moved to the outdoor pool to rejoin the cJ. Copulation occurred immediately after she entered the pool (7 February).
TRANSITION TO SOLID FOOD In order to monitor the pup's food intake after weaning he was kept in the indoor enclosure. On 12 February the lower part of the enclosure was filled with water and the barrier was removed. The pup immediately spent most of his time in the pool. He was not force-fed, as previous pups had been, and starting on day 38
(28 February) live freshwater roach Ruti-lus rutilus (15 cm long) were thrown into the water daily. Our previous experience indicated that for the first one or two weeks after weaning pups have a post-weaning fast and they do not show an interest in fish so we did not offer any between days 17 and 38. The pup killed and played with the fish until day 43 (4 March) when he started to eat a few (Table 1). On day 58 (19 March) the pup started to eat thawed marine fish hand-fed to him. Around that time the colour of his mystacial vibrissae started to change and about two weeks later they went from
381

R.A. Kastelein et al.
Zt i 100' 90' 80' 70' 60' 50' 40' 30' 20' 10' 0'
0 2 4 6 8 10 12 14 16 18 age (days)
Fig. 9. The percentage of scores (n = 54) that the mother (solid line) and pup (broken line) were observed in area 2 (see also Fig. 1).
black to transparent. By the end of March the pup ate a mean 0-5 kg of fish per day and in April a mean 2-5 kg per day. After the pup was moved to another indoor pool on 11 May (day 108) his food intake dropped.
RELEASE A yellow identification tag (no. 2733) was attached to the pup's hind flipper and on 23 May he was transported to a sand bank between the islands of Terschelling and Vlieland in the North Sea. The 120-day-old seal was released and he joined a group of wild Grey seals.
DISCUSSION AND CONCLUSIONS This discussion focuses on the comparison of data from the present study with those from the 1987, 1988, 1989 and 1990 pups (Kastelein & Wiepkema, 1988, 1990; Kastelein et al, 1991, 1994). The 1987, 1990 and 1991 pups were all suckled in the same indoor enclosure.
Birth The pregnant $'s heavy breathing and the expulsion of a cervical plug had also been observed in some of the previous years and may be used as indicators of near-term birth. If possible, keepers should be present at birth, in order to remove any membranes covering the pup's respiratory pathways.
Vocalizations For the first four days the pup hardly vocalized which may have been because of the breathing problems associated with the late removal of the membranes from around its head. This study shows that, even in the absence of vocalizations, the mother is able to judge when the pup wanted to suckle, probably alerted by his waking-up behaviour. In situations where seal density is low and mothers remain near to their pups, successful suckling may occur without vocalizations.
Nuzzling As with all Grey seals born at Harderwijk, the pup and mother had nose contact before almost every suckling session. Nuzzling probably serves to help the mother identify her pup by smell and perhaps tactile information is also exchanged. In the wild the same behaviour has been observed (Davies, 1949; Fogden, 1968, 1971; Burton et al, 1975).
Flippering The pup did not flipper often and there was no particular trend in flippering. It occurred at the same level before, during and after suckling sessions. Both in 1990 and 1991 pups flippered much less than the mother which flippered most after the suckling sessions, possibly because she still had milk to offer. This suggests that the pup was able to drink to satiation during most sessions. The level and trends in the mother's flippering were similar in 1990 and 1991. Kastelein et al. (1994) suggest that the mother's flippering serves as a suckling stimulant, whereas the pup's flippering is a reaction to the mother's flippering and may protect the pup from the mother's nails.
Flippering before suckling may have a directional function as the mother and pup usually nuzzle first and the nipples are located at the opposite end of the $'s body.
It is also possible that Grey seals have glands under the fore flippers and flippering may help to spread a scent which
382

Detailed observations of suckling behaviour of a Grey seal
may in turn enable recognition and/or stimulate suckling.
Proximity of mother and pup The total number of scores that mother and pup were observed together was higher in 1991 than in 1987 because in 1991 the ? spent more time in area 2, especially towards the end of the suckling period when she was in oestrus and spent much of her time near the door (Fig. 1). It is possible that she may have learned from previous suckling periods that the door was the route to use to reach the S-
The 1991 pup spent more time in area 1 (playing with the water in the trough) than the 1987 pup but this may have been because the trough was not available in 1987.
The 1990 pup ended 73% and the 1991 pup 89% of all suckling sessions. This could be explained by the lower number of disturbances in 1991, which allowed the pup to drink to satiation and then leave its mother. During disturbances, the mother usually ended suckling sessions possibly to search for or confront the source of disturbance.
Suckling parameters In the 1987, 1988, 1989 and 1990 suckling periods, the mother usually offered her nipples after the pup had vocalized. In 1991 the pup hardly vocalized during its first four days but the mother still offered her nipples at intervals similar to those observed during the first four days for the previous pups. The ? may have been reacting to the waking-up behaviour of the pup which usually preceded each suckling session.
The increase in total daily suckling time during the course of the suckling period was the result of an increase in real suckling time per session and an increase in the number of suckling sessions per day. This could mean a number of things: (1) the pup needed more milk every day during the suckling period and thus increased the frequency and duration of suckling; (2) the mother's milk supply decreased
during the suckling period, making the pup suckle for longer and more frequently as a strategy to obtain enough milk; (3) the quality of the milk changed during the suckling period in such a way that the caloric value decreased over time, forcing the pup to compensate by drinking more milk.
It is difficult to determine which of the above explanations is most accurate because it is not clear whether real suckling time corresponds with milk transfer in a linear way. The steady increase in the pup's weight (which is mainly an increase in adipose tissue) after day 2 makes explanation (1) unlikely. The increase in the number of pauses in the suckling sessions during the last phase of the suckling period would support explanation (2). Explanation (3) is not very likely because the percentage of fat in Grey seal milk is relatively low during the first three days (c. 42%) and higher thereafter (c. 53%), while the water content falls correspondingly (Baker, 1990). Future studies should focus on the correlation between real suckling time and milk transfer.
The pup sometimes fell asleep while feeding which suggests that suckling was not stressful. In fact the milk of many terrestrial mammals contains opioids which have a pacifying effect (Blass, 1991).
The positive correlation between the duration of successive non-suckling intervals means that long intervals follow long intervals and short intervals follow short ones. This did not follow a day/night rhythm. During the entire suckling period 65 suckling sessions occurred during the 11-hour days and 70 during the 13-hour nights. The correlation is probably an overall effect of the gradual but steady decrease in the duration of the non-suckling intervals.
It is possible that the hiccups observed in the 1991 pup may have been caused by drinking his milk too fast.
Activity All the pups born at Harderwijk rested about 65% of the time which is
383

R.A. Kastelein et al.
indicative of a natural need to rest in order to save energy for growth. About half the 1991 pup's active time was spent playing and investigating which would prepare him for an independent life after weaning. The 9 rested more than her pup, probably to save energy for milk production and to keep herself in good physical condition. The decrease in the time the 9 spent resting towards the end of the suckling period was probably her reaction to oestrus.
Food consumption and weight changes of the adult The mother's food consumption before, during and after the suckling period in the present study show similar fluctuations to that of the previous four suckling periods. This confirms suggestions by Kastelein et al. (1990) that the pattern of food intake is regulated by endogenous parameters. An endogenously determined reduction in appetite could be an adaptation for suckling, which is the period when wild 99 have difficulty catching fish because they have to stay close to their pups. Usually 9? stay with their pups and do not feed at all during the suckling period (Fogden, 1971). The strong increase in food consumption after weaning and copulation probably serves to restore the 9's physical condition quickly.
Energy transfer from adult to pup Suckling is successful if mother and pup are healthy at the end of the suckling period. Viability depends partly on the effectiveness of energy transfer from 9 to pup. Kastelein et al. (1994) proposed an effective mass transfer ratio (R) which is the pup's mean weight gain per day divided by the 9's mean weight loss per day during the suckling period. This ratio not only depends on the physical condition of both the 9 and pup but also on food and water quality and availability, the level of rest and climatic conditions. In the present study the R value is 2-^3 = 0-67. This is a high ratio especially considering the pup's
breathing problems during the first four days. In the field lower R values have been reported, such as 0-4 in Nova Scotia, Canada (Iverson et al, 1991), and 0-46 on North Rona, Great Britain (Fedak & Anderson, 1982; Anderson & Fedak, 1987). In captivity Grey seal suckling often yields relatively high R values such as 0-54 (Amoroso & Matthews, 1951) and 0-53 (Kastelein et al., 1994). This is probably because of a higher environmental temperature, easier access to food and water, and fewer disturbances than in the wild. The R value is also influenced by the quality of the milk. Spotte & Stake (1982) describe Grey seal pups which were bottle-fed with an inadequate formula and weight gain was half that of healthy pups in the wild, although the formula was available ad libitum.
Use of space Although the total available area was limited, the 1991 pup had, like the previous four pups, a favourite resting location in the study area. Similar sedentary behaviour was observed in a pup at the National Zoo, Washington (Wilson et al., 1985). From an ecological viewpoint this sedentary behaviour has at least two advantages; first, most of the milk's nutritional value can be used for growth and, second, it is easier for the mother to find her pup after she has been into the sea. The latter is especially important for new-born pups which are probably still difficult for the mother to identify (Burton et al, 1975). In the wild, if the pup does not vocalize the returning mother goes to the spot where she left it and searches around (Davies, 1949). If she cannot find her pup, the bond is broken and the pup may starve. This is another major cause of death in Grey seals (Baker et al., 1980).
Growth The 9 pup in 1987 gained a mean 2-1 kg per day during the suckling period, the 9 pup in 1988 gained 1-3 kg per day, the 9 pup in 1989 gained 2-2 kg per day, the <$ pup in 1990 gained 1-9 kg
384

Detailed observations of suckling behaviour of a Grey seal
per day and the $ pup in 1991 gained 2 kg per day. The 1988 and 1989 pups were suckled outdoors. The low weight gain in 1988 was probably because it rained almost every day of the suckling period, so the pup had to use more energy just to keep warm.
Although the sample size is small (five pups), the data do not suggest growth rate differences between $<$ and ?$. On Sable Island, Canada, no significant difference was found in rate of mass gain between S<S and ?$ (Bowen et al, 1992), whereas on the Fame Islands and North Rona, and in Nova Scotia c?c? grew faster than 99 during the suckling period (Coulson & Hickling, 1960; Anderson & Fedak, 1987; Baker et al, 1991). The pup's weight gain during the suckling period is important because it is positively correlated with its chance of survival after weaning (Coulson & Hickling, 1964).
Oestrus Although the 9's oestrus was apparent on day 16, it would be interesting to know when ovulation actually occurred relative to the swelling of her labia. On day 9 the 9 became restless. We do not know if in the wild this restlessness attracts the attention of the <$<$ or whether their attention is attracted by a $'s scent (or maybe both). The adult $ in the present study seemed excited when the 9 reached oestrus, even though she was indoors and separated from him. The implication is that <$<$ are aroused by factors other than the scent released by 99 in oestrus.
Like the pup in the present study, wild Grey seal pups lose weight after weaning until they are efficient at catching fish (Davies, 1949; Amoroso & Matthews, 1951; Coulson & Hickling, 1964). More than 70% of the post-weaning mass loss in Grey seals is the reduction of blubber (Worthy & Lavigne, 1987). Nordoy & Blix (1985) calculated that around 94% of the energy expended by a pup during the four weeks of the post-weaning fast in the wild is derived from subcutaneous fat deposits.
Pups began to accept fish at day 45 in 1987, day 64 in 1988, day 49 in 1989, day 35 in 1990 and the 1991 pup began to eat live fish on day 43. The pups that were not force-fed (1990 and 1991) started to eat fish sooner than those that were (1987, 1988, 1989). Offering live fish may have made the transition to eating fish easier, although with such a small sample size individual differences may have played a vital role. The vibrations detected by the vibrissae and the movements of the fish probably stimulated the pups to hunt and they often played cat-and-mouse games with fish; releasing the fish after capture and then chasing them again. At Washington NZP a Grey seal pup started to eat dead fish 59 days after birth (Wilson et al, 1985). This is in the same range as the pups at Harderwijk. It is not known at what age wild Grey seal pups start hunting.
The colour change of the vibrissae after the pup started eating fish may be related to either the composition of the fish or the maturation of the pup.
Transition to solid food After weaning the 1991 pup spent most of his time in the water where he was more agile than he was on land. He exercised by investigating his flippers and tail and swim-chasing them. At Washington NZP where a pup had access to water during the entire suckling period, it entered the water for the first time on the day of weaning (Wilson et al, 1985).
RECOMMENDATIONS The five annual studies (1987-1991) of the suckling periods of Grey seal pups born to the same parents have produced detailed data for the entire suckling period. These data are much more complete than field studies where constant observation is difficult. However, more studies are needed to determine how universal some of the parameters discovered
385

R.A. Kastelein et al.
are. The advantages of this series of studies are that the pups were offspring of the same parents and that detailed descriptions of environmental conditions were made. A disadvantage is that the genetic variation in the pups is limited. Fogden (1971) pointed out differences in suckling behaviour in disturbed and undisturbed suckling areas and commented on the influence of seal density and the topography of the suckling areas. More studies of the kind reported here, under a variety of conditions, are needed to determine the proportional impact of genetic differences, weather conditions, the suckling area, disturbances, the physical status and activity of mothers and pups, and individual metabolic variation of both mother and pup on the pup's growth.
ACKNOWLEDGEMENTS
We thank trainer Piet Mosterd for assisting with weighing the pup. We also thank Claudia van de Wouw, Richard de Kruijf and Roland Reuling for assisting with the behavioural observations. We thank Hans Romberg for the statistical calculations and Nancy Vaughan for her comments on the manuscript.
PRODUCTS MENTIONED IN THE TEXT
Lobelin: respiratory stimulant, manufactured by Boehringer Ingelheim. Respirot: respiratory stimulant for neonates, manufactured by Animal Health Division. Vita-Zu mammal tablet: vitamin supplement, Mazuri brand, manufactured by Purina Test Diets, 505 North 4th Street, PO Box 548, Richmond, IN 47375, USA.
REFERENCES AMOROSO, E. C. & MATTHEWS, L. H. (1951): The growth of the grey seal (Halichoerus grypus, (Fabri-cius)) from birth to weaning. J. Anat. 85: 427-428. ANDERSON, S. S. & FEDAK, M. A. (1987): Grey seal, Halichoerus grypus, energetics: females invest more in male offspring. J. Zool, Lond. 211: 667-679. ANDERSON, S. S., BAKER, J. R., PRIME, J. H. & BAIRD, A. (1979): Mortality in grey seal pups: incidence and causes. J. Zool, Lond. 189: 407^417. BAKER, J. R. (1984): Mortality and morbidity in grey seal pups (Halichoerus grypus). Studies on its causes, effects of the environment, the nature and sources of infectious agents and the immunological status of pups. / Zool, Lond. 203: 23-48.
BAKER, J. R. (1988): Further studies on grey seal (Halichoerus grypus) pup mortality on North Rona. Br. vet. J. 144: 497-506. BAKER, J. R. (1990): Grey seal (Halichoerus grypus) milk composition and its variation over lactation. Br. vet. J. 146: 233-238. BAKER, J. R., ANDERSON, S. S., PRIME, J. H. & BAIRD, A. (1980): The pathology of the grey seal (Halichoerus grypus). 1. Pups. Br. vet. J. 136: 401-412. BAKER, S. R., BARRETTE, C. & HAMMILL, M. O. (1991): Mass transfer during lactation of an ice-breeding pinniped, the gray seal (Halichoerus grypus), in Nova Scotia, Canada. Ninth Biennial Conference on the Biology of Marine Mammals, Chicago, IL, USA 4. BLASS, M. (1991): Suckling: opioid and nonopioid processes in mother-infant bonding. In Chemical senses. 4. Appetite and nutrition. Friedman, M. I., Tordoff, M. G. & Kare, M. R. (Eds). New York: Marcel Dekker, Inc. BOWEN, W. D., STOBO, W. T. & SMITH, S. J. (1992): Mass changes of grey seal Halichoerus grypus pups on Sable Island: differential maternal investment reconsidered. J. Zool, Lond. 227: 607-622. BURTON, R. W., ANDERSON, S. S. & SUMMERS, C. F. (1975): Perinatal activities in the grey seal (Halichoerus grypus). J. Zool., Lond. 177: 197-201. COULSON, J. C. & HICKLING, G. (1960): The grey seals of the Fame Islands. Trans, nat. Hist. Soc. Nor-thumb. 13: 196-214. COULSON, J. C. & HICKLING, G. (1964): The breeding biology of the grey seal, Halichoerus grypus (Fab.), on the Fame Islands, Northumberland. J. anim. Ecol. 33: 485-512. DAVIES, J. L. (1949): Observations on the grey seal (Halichoerus grypus) at Ramsey Island, Pembrokeshire. Proc. zool. Soc. Lond. 119: 673-692. FEDAK, M. A. & ANDERSON, S. S. (1982): The energetics of lactation: accurate measurements from a large wild mammal, the grey seal (Halichoerus grypus). J. Zool, Lond. 198: 473-479. FOGDEN, S. C. L. (1968): Suckling behaviour in the grey seal (Halichoerus grypus) and the northern elephant seal (Mirounga angustirostris). J. Zool, Lond. 154: 415^120. FOGDEN, S. C. L. (1971): Mother-young behaviour at grey seal breeding beaches. J. Zool., Lond 164: 61-92. GALLACHER, J. B. & WATERS, W. E. (1964): Pneumonia in grey seal pups at St. Kilda. Proc. zool. Soc. Lond. 142: 177-180. IVERSON, S. J., BOWEN, W. D., BONESS, D. J. & OFTEDAL, O. T. (1991): Milk composition, milk intake and energetics of lactation in grey seals (Halichoerus grypus) on Sable Island, Nova Scotia. Ninth Biennial Conference on the Biology of Marine Mammals, Chicago, IL, USA 36. KASTELEIN, R. A. & WIEPKEMA, P. R. (1988): Case study of the neonatal period of a grey seal pup (Halichoerus grypus) in captivity. Aquatic Mamm. 14: 33-38.
386

Detailed observations of suckling behaviour of a Grey seal
KASTELEIN, R. A. & WIEPKEMA, P. R. (1990): The
suckling period of a grey seal IHalichoerus grypus) while confined to an outdoor land area. Aquatic Mamrn. 16: 120-128. KASTELEIN, R. A., WIEPKEMA, P. R. & VAUGHAN, N.
(1990): The food consumption of grey seals f Halichoerus grypusj in human care. Aquatic Mamm. 15: 171-180. KASTELEIN, R. A., WIEPKEMA, P. R. & VAUGHAN, N.
(1991): The suckling period of a grey seal (Halichoerus grypus) while the mother had access to a pool. Aquatic Mamm. 17: 45-51. KASTELEIN, R. A., WIEPKEMA, P. R., BERGHOUT, E.
& GROENENBERG, H. J. (1994): Effective mass transfer in a suckling grey seal (Halichoerus grypus). Aquatic Mamm. 20: 11-27. LESLIE, G. (1974): Breeding the grey seal Halichoerus grypus at Aberdeen Zoo. Int. Zoo Yb. 14: 130-131. NORD0Y, E. S. & BLIX, A. S. (1985): Energy sources in fasting grey seal pups evaluated with computed tomography. Am. J. Physiol. 249: R471-R476.
PERRY, H. H. (1950): Chemical engineers' handbook (3rd edn). New York: McGraw-Hill. SIEGEL, S. (1956): Nonparametric statistics for the behavioral sciences. New York: McGraw-Hill. SPOTTE, S. & STAKE, P. E. (1982): Hand-rearing of twin gray seals (Halichoerus grypus) from birth to weaning. Mar. Ecol. Progr. Ser. 9: 181-189. SUMMERS, C. F., BURTON, R. W. & ANDERSON, S. S. (1975): Grey seal (Halichoerus grypus) pup production at North Rona: a study of birth and survival statistics collected in 1972. J. Zool, Lond. 175: 439-451. WILSON, S., MILLER, L., HURSEY, M., FRANTZ, M. & GORTE, J. (1985): The social development of a captive grey seal (Halichoerus grypus) pup for the first six months. Aquatic Mamm. 11: 89-100. WORTHY, G. A. J. & LAVIGNE, D. M. (1987): Mass loss, metabolic rate, and energy utilization by harp and gray seal pups during the postweaning fast. Physiol. Zool. 60: 352-364.
Manuscript submitted 24 July 1994
387

Chapter 3.9
The relationship between suckling time and body weight increase in a grey seal (Halichoerus grypus) pup
R.A. Kastelein1, C. Staal1, S.H. Nieuwstraten1 and P.R. Wiepkema2
1 Harderwijk Marine Mammal Park, Strandboulevard Oost 1,3841 AB Harderwijk, The Netherlands
2 Emeritus Professor of Ethology, Wageningen Agricultural University, Stationsweg 1, 6861 EA Oosterbeek, The Netherlands
Summary
In January 1992, an unusually precocious female grey seal pup was born at the Harderwijk Marine Mammal Park. Both pup and mother were kept under close observation in an indoor suckling area, containing a freshwater pool. Body weight of both animals was monitored on a weighing platform. The cervix plug was expelled 26 days before parturition when the female was still in the outdoor pool, on which day the male became sexually aroused. The female was moved to the suckling area 2 days later, and the pup was born 24 days after that. The first suckling session occurred 3 hours after birth. The suckling period lasted for 18 days. The pup suckled an average of 8 times per day, although this increased around oestrus. The average real daily suckling time (time of pauses excluded) was around 40 minutes, and increased around oestrus. The non-suckling interval averaged around 200 minutes until 16 days after birth. Until oestrus, on about day 13, most suckling sessions were terminated by the pup. Thereafter, the cow ended most sessions. Before almost each suckling session, the pup vocalized an average of 20 times. Before 86% of suckling sessions, the cow and pup nuzzled. Flippering occurred most often during and after suckling sessions, the pup 's flippering occurring in response to flippering of the cow. The cow spent an average of 55% of her time resting, the pup 66%. The cow spent 56% of her active time swimming, the pup 20%. Food intake by the cow ceased 2 days before delivery. She was not fed during the suckling period, as few wild females feed during lactation. After weaning and copulation, which occurred immediately after the female was returned to the outdoor pool, her food intake increased strongly. During the suckling period, the body weight of the cow declined by an average of 3.3 kg per day, while the pup gained a daily average of 1.6 kg. Suckling rate was around 35 g/minute. Weight changes were fairly linear, although the rate of weight gain in the pup decreased towards the end of the suckling period, when the female was in oestrus. The pup was kept alone in a small pool after weaning and lost an average of 0.5 kg per day. Thirty-four days after birth, however, she began to eat fish, and could be fed by hand from 42 days after birth. The pup was precocious, moulting began in utero, and was complete by 19 days after birth. In June of the year of birth, the pup was tagged and released in the Dutch Wadden Sea.
Key words: p i nn iped , phocid , r eproduct ion , behaviour , energetics, vocal izat ions, g rowth , neona te
389

R.A. Kastelein et al.
Introduction
Many grey seal pups (Halichoerus grypus) die during the suckling period or soon after weaning, both in the wild (Davies, 1949; Coulson and Hickling, 1960; Gallacher and Waters, 1964; Summers et al, 1975; Anderson et al, 1979; Baker et al, 1980; Baker, 1984 and 1988) and in zoological parks (Leslie, 1974; Kastelein and Wiepkema, 1988). To determine the factors which influence the pups ' chances of survival, the Harderwijk Marine Mammal Park has launched a long-term study of the suckling period of grey seal pups born of one pair of adults at the park.
The first pup studied was a female, born in 1987. Cow and pup were moved from the seal pool to an undisturbed indoor suckling enclosure one hour after the pup was born because she had entered the water (Kastelein and Wiepkema, 1988). Research continued in 1988 when another female pup was born, and cow and pup where placed in a specially made outdoor suckling area next to the seal pool. A fence prevented the animals from leaving dry land (Kastelein and Wiepkema, 1990). In 1989 a third female pup was born outdoors, and the cow was allowed free access to the seal pool, while a barrier prevented the pup from leaving the suckling area (Kastelein et al, 1991). In 1990 and 1991 the fourth and fifth live pups, both male, were born and suckled in the indoor suckling enclosure which had been used in 1987 and in which the animals had no access to a pool during the suckling period (Kastelein et al, 1994 and 1995).
In January 1992, a female grey seal pup was born in the Research and Rehabilitation Centre of the Harderwijk Marine Mammal Park. This was an indoor area with a large freshwater pool. The aim of this study was to
describe the cow's and pup 's behaviour and body weight changes during the suckling period.
Materials and methods
Study animals In 1991, the seal pool at the Harderwijk Marine Mammal Park contained 2 adult grey seals: A male (HgZH002), estimated to have been born in 1972 and found stranded on the Belgian coast in May 1978, and a female (HgZHOOl), born in September 1973, stranded in Belgium in November 1973. They copulated on 7 February 1991, and, after a gestation period of 344 days, a female pup (HgZH012), was born on 17 January 1992. This was the 6th live pup of this male and female. The behaviour and weight changes of the cow and this pup are described and some observations on the male's behaviour.
Study area So that her weight changes could be measured, the pregnant grey seal cow was moved into the indoor suckling area on December 24, 1991 (24 days before she gave birth). The suckling area consisted of an oval freshwater pool (8.6 m x 6.3 m; 1.4 m deep), a surrounding land area and a weighing platform (Mettler KE1500, u p to 600 kg weighing with a 0.1 kg accuracy; Fig. 1). The wooden weighing platform was flush with the surrounding concrete floor. During the suckling period, the air temperature was on average 12.7°C (« = 35, range 9.2-14.3°C) and the water temperature was kept at 12°C. Human activity in and around the enclosure was reduced to the minimum needed for husbandry (mainly cleaning). The female was not fed during the suckling period, as wild lactating females usually do not feed. Windows in the building's walls and ceiling allowed daylight to enter the study area, and it was artificially lit 24 hours a day. The
390

Suckling time - body weight increase in grey seals
— — — Windows A _J»— Observation room
Entrance /Monitor I tntrance * , ^^J^weighing platform display
Fence,
Weighing y platform
0 5m Figure 1. The indoor study area consisting of a pool, a land area, a weighing platform and the observation room.
study area could be watched from the observation room (Fig. 1). A video camera was placed above the weighing platform so that researchers could see when the animals were completely on it; at this moment the weight given was recorded. The images from the video camera could be observed on a monitor in the observation room.
Recording technique The animals were kept under 24 hour surveillance. A scanning sample of the behaviour of both cow and pup was taken every 15 minutes between 0800 and 1800 hours during the day, and every hour between 1800 and 0800 hours at night. Thus the maximum score per 24 hours for each behavioral parameter was 10 x 4 + 14 x 1 = 54. The following parameters were recorded for each animal: - Rest or activity.
- Type of activity: locomotion (including swimming), scratching, waking up (yawning, stretching etc.), actively looking at the surroundings with raised head, suckling, playing and investigating.
- Position (on land or in the water). - Together or separate (a distance of less
than 1 m was counted as being together).
In addition the following parameters were recorded before, during and after each suckling session: - Time of first vocalization by the pup that
introduced a suckling session. The previous studies had shown that non-suckling intervals usually lasted around 3 hours, and that the rare vocalizations produced during the 2 hours after a suckling session did not introduce a new suckling session. These vocalizations were disregarded.
391

R.A. Kastelein et al.
- Number of vocalizations by the pup during the last 60 minutes before a suckling session.
- Whether or not the cow reacted to the vocalizations of the pup.
- Whether or not nose contact (nuzzling) occurred within 5 minutes before a suckling session.
- Flippering (moving the fore flippers horizontally) by the cow and pup occurring within a few minutes before a suckling session, during a suckling session or within a few minutes after the pup 's last contact with a nipple at the end of a suckling session.
- Time that a suckling session started (first contact of the pup 's mouth with the cow's nipple).
- Time that a suckling session ended (last contact of the pup 's mouth with the cow's nipple).
- Number of times that each nipple was used.
- Real suckling time (i.e. length of time that the pup 's mouth was in contact with a nipple during a suckling session).
- Number of pauses during a suckling session. A pause is a short period during a suckling session when the pup releases the nipple (usually only for a few seconds, but by definition no longer than 30 minutes; the previous studies showed that if a suckling interruption lasted longer than 30 minutes, the pup usually fell asleep, and if suckling recommenced, the entire ritual of vocalizations, nuzzling and flippering would occur).
- Which of the 2 animals cancelled a suckling session by moving away first.
The following miscellaneous parameters were also recorded: - The animals' weights were recorded as
often as possible (depending on when they were alone and were resting fully on
the platform). The cow usually came on the platform once a day, but not on day 16 after birth.
- The weight of the washed and drained placenta.
- The degree of swelling of the cow's labia. - The amount of fish (herring, Clupea ha-
rengus and mackerel, Scomber scombrus) consumed by the cow in the 3 feeds of each day before and after the suckling period.
- The pup's rate of moult. - Air (twice a day) and water (once a day)
temperature.
During the study period, the male remained in the seal pool, and was fed 3 times per day. Abnormal behaviour of the male was recorded in the feeding records.
All correlations (r) are based on the Spearman rank correlation procedure (Siegel, 1956).
Results
Birth In the weeks preceding the birth of the pup, the pregnant female's breathing became louder than usual. On December 22,1991 (26 days before she gave birth) the thick white mucous which made up the cervix plug came from the vagina of the pregnant female. That day she spent much time on land and was very aggressive towards the male, who approached her frequently.
On December 24 she was moved into the study area. On 17 January 1992 (day 0), a female pup was born at 1215 hours. The birth was noticed when the hind flippers were protruding from the vagina, and birth then took 2.5 minutes. The placenta was expelled 4 minutes after the pup was born. Within 30 minutes of its birth, the pup had
392

Suckling time - body weight increase in grey seals
Figure 2. The grey seal cow in the water and her 11-day-old pup on land while nuzzling just after the pup had vocalized, but before suckling. Note the weighing platform (Photo: Ron Kastelein).
been weighed, sexed and the umbilical cord had been treated with an iodine solution to prevent infection. Umbilical infections are a major cause of death in wild grey seal pups (Baker, 1984 and 1988).
Suckling ritual Until oestrus, suckling had a ritual similar to that of all previous pups of that cow. The pup would wake, stretch, and yawn, then begin vocalizing, waking up the mother. The mother would approach, nuzzle the pup, and offer her nipples. Both animals would flipper, the pup would suckle from both nipples and retreat. The mother would then move away from the pup, and both animals would fall asleep.
Vocalizations The pup vocalized for the first time 45 minutes after birth, but these vocalizations were
not followed by suckling. After this occasion, the pup's vocalizations initiated suckling sessions. Eight hours after birth the pup's vocalizations were followed for the first time by a suckling session. The pup called on average 20 times before a suckling session, but the number was quite variable (range: 0-190, n = 125). No trend was seen in the number of pup calls preceding a suckling session during the suckling period. The pup never called after weaning.
Nuzzling Nuzzling between cow and pup took place near the beginning of 86% of the suckling sessions and often during the suckling sessions as well (Fig. 2). Only 18 out of 125 suckling sessions were not preceded by nuzzling. These sessions occurred in the beginning (days 0-2) and at the end (days 16-18) of the suckling period.
393

R.A. Kastelein et al.
Birth of pup
12 14 16 18
Number of days after birth
% Birth of pup 12 14 16 18 Number of days after birth
' Birth of pup 12 14 16 18
Number of days after birth
Figure 3. The percentage of suckling sessions before (a), during (b) and after (c) which the cow flippered.
394

Suckling time - body weight increase in grey seals
Birth of pup 10 12 14 16 18
Number of days after birth
* Birth of pup 12 14 16 18
Number of days after birth
12 14 16 18 " Birth of pup Number of days after birth
Figure 4. The percentage of suckling sessions before (a), during (b) and after (c) which the pup flippered.
395

R.A. Kastelein et al.
6 0 i
•o
®
a s o o M
0 2 4 ^ Birth of pup
12 14 16 18
Number of days after birth
Figure 5. The percentage of scores a day that cow and pup were found together (including suckling), and the percentage of scores a day that they were found together suckling (maximum possible score per day: 54, except for day 0 and 18).
Flippering In 83% of all suckling sessions the cow flip-pered and in 68% of the sessions the pup did so. The cow flippered before 21%, during 44%, and after 56% of the suckling sessions (Fig. 3). Within a suckling session flippering only occurred during a pause. No clear trends occurred in the time or frequency of the cow's flippering during the suckling period.
The pup showed flippering before 17%, during 38%, and after 39% of the suckling sessions (Fig. 4). No clear trend occurred in the pup's flippering before the suckling period. The occurrence of flippering during and after suckling sessions increased during the suckling period.
Encounters between cow and pup During the entire suckling period, the cow and pup spent on average 26% of the scored
moments together (Fig. 5). Of the 246 scored cases of the animals being together during the suckling period, 76 were while suckling (31%; Figs. 5 and 6).
Most of the suckling sessions (66%) were broken off by the pup (Fig. 7). Until day 9, each animal cancelled about 50% of the sessions. Between day 9 and 15 the pup broke off most sessions. Thereafter the cow cancelled most sessions.
Suckling parameters The pup did not vocalize before the cow first offered her nipples 15 minutes after birth, and the pup did not respond by suckling. The first suckling session occurred 3 hours after birth and was not preceded by vocalizations of the pup. The total daily real suckling time increased throughout the suckling period from around 16 minutes on day 1 after birth to 166 minutes on day 14, after
396

Suckling time - body weight increase in grey seals
which it decreased to 12 minutes on the day of weaning. The fluctuations in the total daily number of pauses closely follow the fluctuations in the total daily real suckling time (Fig. 8 a).
The daily average suckling session duration increased from 3 minutes on day 0 to nearly 75 minutes on day 16. On day 17 it dropped to 53 minutes (Fig. 8 b). The daily average real suckling time per session also increased from 2.4 minutes on day 0 to 12.5 minutes on day 15. On day 16 the pup suckled only once, but for very long (60.4 minutes). On day 17 it dropped to 15 minutes (Fig. 8 b).
The daily average non-suckling interval is the mean of the non-suckling intervals following the suckling sessions of one day. It fluctuated between 82 and 470 minutes, with an average of 186 minutes. On day 17 it
increased strongly to 470 minutes (Fig. 8 c). The number of suckling sessions per day was around 7 with a peak on day 14 followed by a decrease (Fig. 8 d). The total number of suckling sessions during the night (1800-0800 hours) was similar to that during the day (0800-1800 hours); 61 versus 64. The 2 nipples were used equally often.
While there was no correlation between the real suckling time and the following non-suckling interval, a significant positive correlation was found between the duration of a non-suckling interval and the following real suckling time (r = 0.53, p < 0.01).
Activity The cow was resting during 51 % of all day scores and 61 % of the night scores. The proportion of time the cow was resting increased from around 54% on day 0 to around
Figure 6. The 14-day-old pup while suckling. Note the lean body of the cow after 2 weeks of suckling and fasting (Photo: Ron Kastelein).
397

R.A. Kastelein et al.
™ 100
a. at c o '5 (0 w c
o (0
0
E 3 C
S o
vBirth of pup 10 12 14 16 18
Number of days after birth
Figure 7. The percentages of suckling sessions broken off by the pup during the suckling period.
80% on day 13 after which it dropped until weaning (Fig. 9 a).
The pup was resting for 64% of all scores at night and 68% during the day (Fig. 9 b). The time she spent resting during the day increased during the suckling period.
The cow spent on average 56% of her active time in locomotion (mainly swimming). She swam little on day 13 after birth, but after that day she swam most of the time she was active (Fig. 10 a). She spent on average 22% of here active time actively looking at her surroundings, and 20% suckling. The pup spent on average 20% of her active time in locomotion (Fig. 10 b). Some of the locomotion was swimming (Fig. 11). During the suckling period the pup's time spent on locomotion generally increased. The pup spent on average 18% of her active time actively looking at her surroundings, 24% on
suckling and 23% on playing and investigating.
Use of space The cow spent on average 48% of the time in the water. During the first 13 days after birth, the amount of time she spent in the water fluctuated between 78% and 9%; thereafter this percentage increased to 89% (Fig. 12).
The pup spent on average 6% of her time in the water. She first entered the water on day 6 (Fig. 12). On day 17 she swam more than usual.
Food consumption and weight changes of the cow The cow's food consumption fluctuated much before the suckling period (Fig. 13). In December 1991 she consumed on average 4.4 kg a day until she was moved into the study area on December 24. After the trans-
398

Suckling time - body weight increase in grey seals
fer, she ate very little for a few days. In January she consumed on average 3.3 kg a day until 2 days before giving birth, when she stopped eating. During the suckling period she was not given food. After her return to the pool (4 February), she copulated with the male immediately and began to eat. In February she ate on average 6.9 kg per day and in March 6.7 kg per day.
Ten days before giving birth the cow weighed 190.5 kg (Table 1). She weighed 158.7 kg after giving birth to the pup and 96.7 kg the day after weaning, so she lost an average of 3.3 kg/day (about 0.5 kg per suckling session) during the suckling period. She lost weight at an almost constant rate (Fig. 14).
Weight changes of the pup At birth the pup weighed 16.8 kg (Table 1). She gained on average 1.6 kg a day during the suckling period (around 0.25 kg/suckling session; Fig. 15). The pup was observed to defecate during the suckling period. After weaning the pup lost weight (on average 0.5 kg/day during the first 13 days after weaning) until it had learned to eat fish.
Real suckling time versus body weight changes of the pup Because the cow clearly came into oestrus on day 13, and because many suckling parameters changed thereafter (Fig. 8), the relationship between real suckling time and body weight changes of the pup is shown for the first 13 days (day 0 - day 12) after birth (Fig. 16). The time between body weight measurements varied, and thus the number of suckling sessions occurring in that period, determining the real suckling time. The relationship between real suckling time (Ts in minutes) and body weight changes ( A M in kg) of the pup can be expressed as:
A M = 0.0095Ts - 0.0487 (r2 = 0.657, p < 0.01).
Moulting of the pup The pup's head and flippers had already started to moult in utero. Hair was found in the placenta. Moulting was complete by day 19.
Oestrus and weaning The cow came on heat on day 13 after birth; her labia were swollen and a strong increase in her locomotion was observed on the days thereafter. She swam fast circles, and came out of the water to throw herself on the pup. She often rolled over the floor of the land area. On day 17 she hardly suckled her pup and on day 18 (4 February 1992) she was moved to the seal pool to rejoin the male. Copulation occurred in the water immediately after she entered the pool.
The male Around the pupping and suckling period the pup's father in the outside pool was more active than during the rest of the year and had a strong odour. On January 6, he was very restless and spent much time on land although the female had been moved to the indoor enclosure already 13 days before.
Transition to solid food So that the pup's food intake after weaning could be monitored, she was left in the study area. She was not force-fed as previous pups had been. Instead, fish were thrown into the water each day and removed if not eaten. On day 34 after birth (20 February) she started to play with the fish and eat bits of it. She began to eat fish fed by hand on day 42 after birth (28 February). In March she ate on average 0.9 kg of fish per day, and in April 2.5 kg per day. She was transported to the seal pool to join her parents on 15 April 1992 (her age was 88 days). By that time she was judged to be able to compete with other seals for fish.
399

R.A. Kastelein et al.
Birth of pup Number of days after birth
c I E
B. 90 -
80 -
70
60
50
40- |
30
20
10
0
Average suckling session duration
Average real suckling time per suckling session
V Birth of pup 8 10 12 14 16 18
Number of days after birth
400

Suckling time - body weight increase in grey seals
C. 600
1 500
1 £ 400 c a ~ 300-je
c 200-1
o a 2 5 <
100
'N —i-
8
Birth of pup
10 12 14 16 18 Number of days after birth
CO c p '55 (0 o (0
O 3 (0
O
E
X Birth of pup
10 12 14 16 18
Number of days after birth
Figure 8. The total daily real suckling time and number of pauses per day (a), the daily average suckling session duration and the daily average real suckling time per suckling session (b), the daily average non-suckling interval (c), and the number of suckling sessions per day (d). The bars indicate standard deviations.
401

R.A. Kastelein et al.
at
c 21 w 9 £ o o (0
0 . 2 i ^ Birth of (ftp
10 12 14 16 18
Number of days after birth
B. Pup 100 i
D>
W 9>
c 0) a (0
£ o o (0
2 4
Birth of pup
i 1 1
6
i 1
8 I 1
10 i 1 1 1 1 1 1 1
12 14 16 18
Number of days after birth \
Figure 9. The percentage of scores spent resting during the day (0800-1800 hours) and during the night (1800-0800 hours) by the cow (a) and pup (b).
402

Suckling time - body weight increase in grey seals
o E o u o
c o
2L OT W £ o o CO
% '•§ to
A. Cow 100 i
V 2 3
Birth of pup
i i 1 1 1 1 1 1 1
8 9 10 11 12 13 14 15 16 17 18
Number of days after birth
B. Pup
c o o E o o o
2L V)
£ o o w
> u (0
V 3 4 5 6 7 8 9 10 11 12 13 14 15 16 17 18
'Birth of pup Number of days after birth
Figure 10. The percentage of active scores the cow (a) and pup (b) spent on locomotion during the suckling period.
403

R.A. Kastelein et al.
Release A tag (no. 2734) was attached to the pup's hind flipper. On June 16,1992 she was transported to a sandbar in the Dutch Wadden Sea where a group of grey seals hauled out.
Discussion and conclusions
This discussion focuses on the comparison of data on the present 1992 pup (which was suckled indoors and had access to a pool) with data on the 1989 pup (which was suckled outdoors while the cow had access to a pool; Kastelein et al, 1991). Some references
will be made to the 1987 (indoors; Kastelein and Wiepkema, 1988), 1988 (outdoors; Kastelein and Wiepkema, 1990), 1990 (indoors; Kastelein et al, 1994) and 1991 (indoors; Kastelein et al, 1995) pups.
Birth The white cervix plug, which is released from the vagina during the last weeks before the cow gives birth, probably serves to block the cervix, so that potentially infectious water cannot enter the uterus. When the cervix plug is expelled, birth is imminent. In previous years, the male became clearly aroused
Figure 11. The cow and her 11-day-old pup swimming in the water (Photo: Ron Kastelein).
404

Suckling time - body weight increase in grey seals
1UU •
90-
n 80-4-1
5 70 -c ™ 6 0 -c 0) g. 50 -10
jg 4 0 -o 3 30 -
o 2 0 -
10-
0 -
Cow
1 i 1—
Pup
* " m m
* 1 1 1 1 1 1 1 1 1 1 1
/ J • » / ' »
1 1 1 1 1
V 2 Birth of pup
8 10 12 14 16 18
Number of days after birth
Figure 12. The daily percentages of scores spent in water by cow and pup (see Fig. 1).
>. n O)
C o •£ E 3 </> C o u s 3
£ 2
12
11
10
7 -
6 -
5 -
1 •
Pup weaned
i i i i i i i ' i i i i i i i i
2 4 6 8 10 12 14 16^18 20 22 24 26 28 30 1 i i i i
3 5 7 9 11 13 15 17 January Birth of pup February Date
Figure 13. The cow's daily food consumption before, during, and after the suckling period.
405

R.A. Kastelein et al.
when the cervix plug was expelled in his presence. Amoroso and Mathews (1951) found that the anterior vagina of female grey seal pups was occluded with a plug of mucous. Maybe this plug is always present in female grey seals except during birth and copulation, and acts as a watertight seal.
Vocalizations The pup in the present study vocalized on average 20 times before a suckling session began. This is in the same range as the pups in most previous studies (1989:15,1990: 35; 1991:12 times). In 1988 the pup vocalized on average more frequently (59 times) than the pup in the present study, perhaps because the cow did not respond quickly in 1988. Relatively many disturbances occurred in that year and the cow spent much of her time investigating the environment. In 1988, the
female was less experienced with suckling than in the present study, and more easily disturbed. Wild grey seal first-time breeders are more timid than experienced females (Piatt et al., 1975). Possibly the females react quicker as they gain experience in suckling.
Nuzzling Nuzzling was observed before most suckling sessions in the present study as well as in previous years. Nuzzling probably helps the cow to identify the pup by smell (because the nostrils are wide open) and by mechanoreception (because the vibrissae are erect). In wild grey seals the same behaviour has been seen (Davies, 1949; Fogden, 1968 and 1971; Burton et al, 1975).
Flippering The cow flippered a great deal before the
Table 1. Weight changes of the cow and pup, the weight of the placenta and the timing of major events.
Occasion Days after birth
Weight pup (kg)
Weight cow (kg)
Weight placenta
(kg)
Mucous from vagina To indoor study area
Just after birth Weaning Separation
Start eating fish Start eating from hand
To the outdoor pool Back to indoor pool To the North Sea
-26 -24 -10
0 17 18 19 20 21 24 31 34 42 87 88
133 140
16.8 49.0 47.5 46.7 46.2 45.5 44.2 41.4
--
37.5 -
54.8 54.8
190.5 158.7
-96.7
2.00
406

Suckling time - body weight increase in grey seals
suckling sessions in the first 2 days after birth. At that stage, the pup had to learn how to find the nipples after nuzzling and thus it took her longer to reach them than it did later on. When the pup was searching in her chest area, the cow flippered, perhaps to direct the pup towards the nipples. Later the cow flippered less before each suckling session; the pup moved to the nipples soon after nuzzling. The cow flippered frequently during the pauses in suckling sessions and afterwards. The pup flippered more during the second part of the suckling period than at the start. This appeared to be a reaction to the cow's flippering. The pup never flippered when she was alone. Like in the previous studies, the pup may have flippered in order to protect herself against her mother's flippering.
Encounters between cow and pup The total number of scores that the cow and pup were observed to be together was higher in the present study than in 1989 when the cow suckled her pup outdoors and had access to a pool (Kastelein et al., 1991). In the present indoor study, the cow was less active and spent more time on land next to the pup than she did during the outdoor study. Outdoors, more disturbances may have led to the cow spending more time in the water than she did indoors.
The percentage of suckling sessions ended by the 1987 pup was around 90%, by the 1988 pup 42%, by the 1989 pup 44%, by the 1990 pup 73%, by the 1991 pup 89% and by the present 1992 pup 66%. In general the pup ended a higher proportion of suckling sessions when suckled indoors when the cow had no access to a pool than when suckled outdoors or when a pool was available. This could be due to the high number of disturbances (birds, construction, rain, other seals, etc.) in the outdoor situations (1988 and
1989), which often caused the cow to break off the sessions and move around, apparently to investigate the environment. Also, when a pool was available (in the 1989 and in the present 1992 study) the cow was able to swim after a suckling session.
Suckling parameters On average the pup in the present study suckled every 200 minutes, at similar intervals to grey seal pups in the wild. Pups on ice in the Gulf of St Lawrence are nursed every 2-3 hours based on the haul out pattern of the cows (Lydersen et ah, 1994).
Kovacs (1987) gives the average grey seal suckling bout duration on the Isle of May as 9.9 minutes and Oftedal et al (1987) gives 10.4 minutes for grey seals on Sable Island. Whether these authors mean suckling session duration or real suckling time per session is not clear, but the values given are similar to average suckling duration observed in the present study.
After day 12, both the total daily real suckling time and the number of suckling sessions per day increased. This suggests that, due to a decrease in milk production, the pup drank less milk per suckling session, and had shorter non-suckling intervals. At the very end of the suckling period, the number of sessions decreased, and they became longer. This suggests a further decrease in milk production, and that the pup probably could not satisfy her hunger. She kept suckling until the cow broke off the suckling sessions. This idea is supported by the strong decrease in the pup's growth rate during that phase of the suckling period.
Amoroso and Mathews (1951) report that grey seal milk consists for 52% of fat and 11% of protein. Baker (1990) later suggests that the composition of grey seal milk
407

R.A. Kastelein et al.
°> 140-
'3 S >> •D O m
^ Birth of pup
Figure 14. The body weight of the cow during the suckling period.
i 1 1 1 1
12 14 16 18
Number of days after birth
55-1
-Birth of pup
~i—i—i—i—i—i—i—r—i—i—r—i—i—i i i i i—i i i
10 12 14 16 18 20 22 24 26 28 30 32
Number of days after birth
Figure 15. The daily average body weight of the pup during the suckling period and some weeks after weaning. The numbers indicate the number of measurements on which the average weight is based.
408

Suckling time - body weight increase in grey seals
-0.2 +
-0.4
6 8 10 12 14 16 18 20 22 24 Real suckling time between 2 weight measurements (min)
Figure 16. The relationship between real suckling time (total time the pup's mouth was in contact with the cow's nipple between 2 weight measurements) and body weight changes in the grey seal pup during the first 13 days after her birth (until the cow came into oestrus).
changes during the suckling period in such a way that the percentage of fat is relatively low during the first 3 days (approximately 42%), and higher thereafter (approximately 53%), while the water content falls correspondingly. This trend is seen in the milk of most other seals (Oftedal et ah, 1987). It could be an effect of the time required to get underway the production of hormones such as thyroxine and Cortisol after a pup is born. These hormones mobilize the fat reserves of the cow (Engelhardt and Ferguson, 1979). Changes in milk composition may have affected the suckling parameters mentioned above.
Activity The pup rested for around 64% of the time. This is very similar to the amount of time
spent resting by all previous pups studied at Harderwijk.
The pup in the present study was very precocious. At a young age she climbed fences which pups can usually only negotiate at the age of around 20 days. She had begun to moult in utero. She started swimming at the early age of 6 days and spent some time in the water each day thereafter. She did not swim with her mother. Most pinniped pups (except the walrus) learn to swim independently, without instruction or support from their mothers (Wartzok, 1991). In certain areas in Scotland, some pups frequently go into the water during the suckling period but remain near the coast. They sometimes suckle underwater in the tidal zone (Kaste-lein pers. obs.). The age at which pups enter
409

R.A. Kastelein et al.
the water may depend on the geographic location, the substrate, or on the individual. Most ice-born grey seal pups do not enter the water until they have moulted completely (Curry-Lindahl, 1970). Coulson and Hick-ling (1964) describe how grey seal pups on the Fame Islands, U.K., stayed on land for 32 days on average, before going to sea. Maybe some pups need this period to develop their motor skills (Wartzok, 1991). Most of the play of grey seal pups is not social play, but self oriented or object oriented play (Kovacs, 1987). The post- weaning fast of wild pups on North Rona can vary in duration between 1 to 4 weeks (Fedak and Anderson, 1982). The length of the fast may be related to the developmental stage of the pup at birth. At birth, the precocious pup in the present study seemed to be about 3 weeks more advanced than the 5 previous pups of this cow in her development of motor skills.
The cow rested in the present 1992 study more than in 1989. She seemed at ease indoors where fewer disturbances occurred than outdoors. In both suckling periods in which a pool was available she spent a great deal of time in the water. Ice-breeding grey seal females in the Gulf of St. Lawrence spent on average 72% of the time on the ice, 20% in the water at the surface and 8% diving. They hauled out more during darkness than during the light. When the wind-chill index was high, they spent a great deal of time in the water (Lydersen et al, 1994).
Use of space The pup in the present study rested usually in the corners of the weighing platform on the side of the wall. Fogden (1971) noted that grey seal pups have a tendency to lie against cliff faces or large rocks. This sedentary behaviour has at least 2 advantages: firstly, most of the milk's nutritional value can be used for growth, and secondly, it is easier for
the cow to find her pup after she has been to sea. In the wild, the latter advantage is especially important for newborn pups which are probably still difficult for the cow to identify (Burton et al, 1975). In the wild, if the pup does not vocalize, the returning cow goes to the spot where she left her calf and searches for it (Davies, 1949). If she cannot find her pup, the bond is broken and the pup may starve. This is a major cause of death in grey seals (Baker et al, 1980). Therefore, being precocious, like the pup in the present study, may not be advantageous in the wild. If a pup swims too far, it may become separated from its mother. In the wild, disturbances sometimes cause the cows to flee into the sea, leaving hungry pups to move around attempting to solicit feeding from other cows. These pups may not be found when their mothers return (Fogden, 1971). On the other hand, being precocious would allow a wild pup to move inland to avoid being washed away, which is another major cause of death in grey seal pups (Anderson et al, 1979; Baker, 1984). On average the cow in the present study spent 48% of the time in the water. Ice- breeding grey seal females in the Gulf of St. Lawrence spend on average 28% of their time in the water and, judging from their diving pattern, probably forage during the suckling period (Lydersen et al, 1994).
The cow's food consumption and weight changes The cow was not fed during the suckling period of this study, although she had been in all previous studies. In contrast to in former years when she was fed during the suckling period, her food intake after weaning and copulation increased gradually this time. Maybe this was because her digestive tract had been inactive for 20 days and needed time to become activated. A high food consumption after copulation restores the female's condition.
410

Suckling time - body weight increase in grey seals
During the suckling period in 1990, the cow lost on average 3.6 kg/day, in 1991 3.0 kg/ day and in the present 1992 study 3.3 kg/ day. Because the suckling area in the present study was large and included a pool, one might have expected the cow to lose more weight than in other years. It is unclear how efficient digestion is during the suckling period; maybe food given to the cow during previous years' suckling periods was not digested well. The fact that she did not lose much weight in the present study suggests that she lost little heat to her aquatic surroundings (12°C). In addition she may have drank fresh water from the pool.
Growth of the pup The pup in the present study gained on average 1.6 kg per day, the 1989 pup 2.2 kg per day. This difference could be due to individual metabolic differences, different activity levels or differences in behaviour. The 1989 pup did not swim during the suckling period, whereas the 1992 pup spent 6% of the time in the water (Fig. 11). In the water the pup probably needed more energy for locomotion and to maintain its body temperature than while on land.
Like the pup in the present study, wild grey seal pups lose weight after weaning until they are efficient at catching fish (Davies, 1949; Amoroso and Mathews, 1951; Coulson and Hickling, 1964). More than 70% of the post-weaning mass loss in grey seals is due to the loss of blubber (Worthy and Lavigne, 1987). Nordoy and Blix (1985) calculated that around 94% of the energy expended by a pup during the first 4 weeks of the post-weaning fast is derived from subcutaneous fat deposits. During this post-weaning period, pups have to develop motor skills and learn how to catch fish (Bowen, 1991; Kaste-lein et al., 1995).
Energy transfer from cow to pup Suckling is successful if both cow and pup are viable after the suckling period. Their viability depends partly on the effectiveness of energy transfer from cow to pup. Kaste-lein et al. (1994) proposed an effective mass transfer ratio (R) which is the body weight gain in the pup divided by the cow's weight loss during the suckling period. This ratio depends not only on the physical conditions of the cow and pup, but also on the food and water quality and availability, on the amount of time the animals spend resting and on the climatic conditions. In the present study the R value is 1.6/3.3 = 0.48. This is a relatively low number compared to those of the 2 previous suckling periods of the same cow, in which she and her pups had no access to water (R =1.9/3.6 = 0.53, Kastelein et al. (1994) and R =2.0/3.0 = 0.67, Kastelein et al. (1995)). The difference may be due to the high energy loss by both cow and pup in the present study because they spent so much time in the water (thermoregulation and locomotion). The relatively low mass gain per day of the pup caused the relatively low R value. This seems plausible, as the pup has a relatively large surface to volume ratio, and thus loses relatively more energy to its environment than the cow. Because water conducts heat 25 times better than air, the pup in the present study, which spent time in the water in contrast to the previous pups which stayed on land, lost more energy to the environment. In addition, the pup in the present study was precocious and more active than the pups in the previous studies. In the wild, relatively low average R values occur such as 0.40 in Nova Scotia, Canada (Iverson et al., 1991) and 0.46 on North Rona, U.K. (Fedak and Anderson, 1982; Anderson and Fedak, 1987). The average R value for ice- breeding grey seals in the Gulf of St. Lawrence is 0.42 (Lydersen et al, 1994). Here the cows may have been feeding. Captive
411

R.A. Kastelein et al.
grey seals often have relative high R values such as 0.54 (Amoroso and Mathews, 1951). This is probably due to higher environmental temperatures, more food and water and fewer disturbances in zoos and oceanaria than in the wild. Also, when seals are kept indoors, their fur is dry most of the time, whereas when they are outdoors their fur is often moisturized by rain which reduces its isolation properties. The R value is also influenced by the quality of the milk; low quality milk will lead to poor growth in the pup. Spotte and Stake (1982) describe grey seal pups which were bottle-fed an inadequate formula. The weight gain of those pups was half of that of healthy pups in the wild, although the formula was available to them continuously.
The weight of the adult female grey seal was 10 times that of the pup. At weaning, the weight of the cow was about twice that of the pup. During the suckling period, the weight loss of the cow was linear; thus on average she weighed 6 times as much as the pup. The cow lost 62 kg and the pup gained 30.7 kg. This means that 62-30.7= 31.3 kg was lost by both animals as faeces, urine and evaporation through respiration. Assuming that this weight loss was divided between the cow and pup at a ration of 6 to 1, the cow lost about 26.8 kg and the pup 4.5 kg. Thus during the whole suckling period the pup may have received 30.7 + 4.5 = 35.2 kg of milk from her cow. This amount of milk was suckled in a total suckling time of 1014 minutes which means that the suckling rate was around 35 g/minute.
Real suckling time versus body weight changes of the pup The present study shows the relationship between real suckling time and the weight change of the pup, and thus between real suckling time and milk transfer. This sug
gests that the pup really sucks and ingests milk when it has a nipple in its mouth. When the pup did not suckle she lost weight. This weight loss is due to urination, defecation and evaporation via respiration.
Moulting of the pup The pup in the present study had begun to moult before birth. The 1989 pup started to moult later (on day 13), but moulting was complete when the pup was at the same age (20 days) as the pup in the present study. So the moult was quicker in 1989. The onset, rate and end of moult varies greatly between pups as seen in the previous studies at the Harderwijk Park and in the wild (Davies, 1949; Curry-Lindahl, 1970). Moulting is always complete shortly after weaning.
Oestrus and weaning Like in the previous studies at the Harderwijk Park, the cow's behaviour changed dramatically after she came into oestrus. Whereas before oestrus she was a very protective and caring mother, after oestrus she became careless and even threw herself on the pup. Maybe this is due to the fact that at the Harderwijk Park, the lactating cow never had immediate access to the male. The male and female were only put together after the pup was weaned completely. How wild grey seal cows behave towards their pups after they have come into oestrus is not known. The suckling period in the present study was the same length as the average reported for grey seals on Sable Island (Boness and James, 1979) and the Isle of May (Kovacs, 1987).
The male The male in the seal pool became restless and sexually aroused and had a strongly reduced food intake although the female was far away (100 m) and indoors. This suggests that environmental cues other than be-
412

Suckling time - body weight increase in grey seals
haviour or scent of the females may prepare the males for breeding, or that their sense of smell is extremely acute. The strong odour of the male may have been caused by the facial skin glands which are more active during the breeding season (Hardy et al., 1991). See-ly and Ronald (1991) report of testosterone cycles of captive and wild male grey seals. The levels were highest during the breeding season (October - February). During the breeding season, males eat much less than normal (Kastelein et ah, 1990) and lose weight (Anderson and Fedak, 1987).
Transition to solid food The 1987 pup started to accept fish on day 45 after birth. The 1988 pup on day 64, the 1989 pup on day 49, the 1990 pup on day 27 and the 1991 pup on day 43. The pup in the present study began to eat pieces of fish 34 days after birth. This may have been because the pup was generally precocious. Previous experiences have shown that grey seal pups start eating fish sooner when the caretakers wait patiently then when they, with good intentions, force-feed the pups. During the post-weaning fast, the pups mainly derive energy from their blubber (Worthy and La-vigne, 1987). These authors also found that grey seal pups that fasted in water lost significantly more blubber and exhibited higher specific metabolic rates than those fasting on land. How long it takes before wild grey seal pups start to eat solid food is not known. They probably start with eating slow moving prey such as small crustaceans (Bowen, 1991).
Recommendations Fogden (1971) described differences in suckling behaviour between disturbed and undisturbed suckling areas, and commented on the influence of the seal density and the topography of the suckling areas. The present study was based on only one grey seal
pup. However, it was a more detailed study than would be possible in the field. More studies of the present kind under a variety of conditions could be carried out in order to determine the proportional impact of weather conditions, the suckling area, disturbances, the pup 's and the cow's activity and behaviour, individual metabolic variation on pup growth and on the R value discussed above.
Acknowledgements
We thank the trainers Piet Mosterd and Jo-han van Ardenne for assisting with the study. We thank Liesbeth Berghout, Ma-rieke van Boxsel, Anke Kuhlmann, Jonna Mous and Anita Schokker for assisting with behavioral observations. Anke Kuhlmann helped analyzing the data. We thank Hans Romberg (Wageningen Agricultural University) for the statistical calculations, Rob Triesscheijn for making the graphs and Nancy Vaughan and Eleanor Hayes (University of Bristol, U.K.), Janny Hardeman and Nicole Schooneman for their comments on the manuscript.
References
Amoroso, E.C. and Mathews, J.H. (1951) The growth of the grey seal (Halichoerus grypus, Fabricius) from birth to weaning. J. Anat. 85, 427-428.
Anderson, S.S. and Fedak, M.A. (1987) Grey seal, Halichoerus grypus, energetics: females invest more in male offspring. J. Zool. London, 211, 667-679.
Anderson, S.S., Baker, J.R., Prime, J.H. and Baird, A. (1979) Mortality in Grey seal pups: incidence and causes. J. Zool. London, 189, 407-417.
413

R.A. Kastelein et al.
Baker, J.R. (1984) Mortality and morbidity in Grey seal pups (Halichoerus grypus). Studies on its causes, effects of the environment, the nature and sources of infectious agents and the immunological status of pups. J. Zool. London, 203, 23-48.
Baker, J.R. (1988) Further studies on Grey seal (Halichoerus grypus) pup mortality on North Rona. Br. vet. J. 144, 497-506
Baker, J.R. (1990) Grey seal (Halichoerus grypus) milk composition and its variation over lactation. Br. vet. J. 146, 233-238.
Baker, J.R., Anderson, S.S., Prime, J.H. and Baird, A. (1980) The pathology of the Grey seal (Halichoerus grypus). I. Pups. Br. vet. J. 136, 401-412.
Boness D.J. and James, H. (1979) Reproductive behavior of the Grey seal (Halichoerus grypus) on Sable Island, Nova Scotia. J. Zool. London, 188, 477-500.
Bowen, W.D. (1991) Behavioral ecology of pinniped neonates. In: Behaviour of pinnipeds (Ed. Renouf, D.). Chapman and Hall Ltd., London, 65-127.
Burton, R.W., Anderson, S.S. and Summers, C.F. (1975) Perinatal activities in the Grey seal (Halichoerus grypus). J. Zool. London, 177, 197-201.
Coulson J.C. and Hickling, C. (1960) The Grey seal of the Fame Islands. Trans. Nat. Hist. Soc. Northumb. 13, 196-214.
Coulson J.C. and Hickling, C. (1964) The breeding biology of the Grey seal on the Fame Islands. J. Anim. Ecol. 33, 485-512.
Curry-Lindahl, K. (1970) Breeding biology of the baltic Grey seal (Halichoerus grypus). Der Zool. Garten 38 (1/2), 16-29.
Davies, J.L. (1949) Observations on the Grey seal (Halichoerus grypus) at Ramsey Island, Pembrokeshire. Proc. Zool. Soc. London 119, 673-692.
Engelhardt, F.R. and Ferguson, J.M. (1979) Adaptive changes in Harp seals, Phoca groen-landica, and Grey seals, Halichoerus grypus, during the post-partum period. Aquatic Mammals 7(3), 83-92.
Fedak, M.A. and Anderson, S.S. (1982) The energetics of lactation: accurate measurements from a large wild mammal, the Grey seal (Halichoerus grypus). J. Zool. London 198, 473-479.
Fogden, S.C.L. (1968) Suckling behaviour in the Grey seal (Halichoerus grypus) and the Northern elephant seal (Mirounga angusti-rostris). J. Zool. London 154, 415-420.
Fogden, S.C.L. (1971) Cow-young behaviour at Grey seal breeding beaches. J. Zool. London 164, 61-92.
Gallacher, J.B. and Waters, W.E. (1964) Pneumonia in Grey seal pups at St. Kilda. Proc. Zool. Soc. London 142, 177-180.
Hardy, M.H., Roff, E., Smith, T.G., and Ryg, M. (1991) Facial skin glands of ringed and grey seals, and their possible function as odoriferous organs. Can. J. Zool. 69,189-200.
Iverson, S.J., Bowen, W.D., Boness, D.J. and Oftedal, O.T. (1991) Milk composition, milk intake and energetics of lactation in grey seals (Halychoerus grypus) on Sable Island, Nova Scotia. Ninth Biennial Conf. on the Biol, of Mar. Mamm., Chicago, 111., U.S.A., 36.
414

Suckling time - body weight increase in grey seals
Kastelein, R.A. and Wiepkema, P.R. (1988, chapter 3.4) Case study of the neonatal period of a Grey seal pup (Halichoerus grypus) in captivity. Aquatic Mammals 14(1), 33-38.
Kastelein, R.A. and Wiepkema, P.R. (1990, chapter 3.5) The suckling period of a Grey seal (Halichoerus grypus) while confined to an outdoor land area. Aquatic Mammals 16 (3), 120-128.
Kastelein, R.A., Wiepkema, P.R. and Vaugh-an, N. (1990, chapter 3.2) The food consumption of Grey seals (Halichoerus grypus) in human care. Aquatic Mammals 15(4), 171-180.
Kastelein, R.A., Wiepkema, P.R. and Vaugh-an, N. (1991, chapter 3.6) The suckling period of a Grey seal (Halichoerus grypus) while the cow had access to a pool. Aquatic Mammals 17(1), 42-51.
Lydersen, C., Hammill, M.O. and Kovacs, K.M. (1994) Activity of lactating ice-breeding grey seals, Halichoerus grypus, from the Gulf of St. Lawrence, Canada. Anim. Behav. 48, 1417-1425.
Nordoy, E.S. and Blix, A.S. (1985) Energy sources in fasting grey seal pups evaluated with computed tomography. Am. Jour, of Physiol. 249, R 471-476.
Oftedal, O.T., Boness, D.J. and Tedman, R.A. (1987) The behaviour, physiology, and anatomy of lactation in the pinnipedia. In: Current Mammalogy. Vol. 1. (Ed. Genoways, H.H.). Plenum Publishing Corp., 175-245.
Piatt, N.E., Prime, J.H. and Witthames, S.R. (1975) The age of the grey seal at the Fame Islands. Trans. Nat. Hist. Soc. Northumberland 41(4), 99-106.
Kastelein, R.A., Wiepkema, P.R., Berghout, E. and Groenenberg, H.J. (1994, chapter 3.7) Effective mass transfer in a suckling Grey seal (Halichoerus grypus). Aquatic Mammals 20(1), 11-27.
Kastelein, R.A., Groenenberg, H.J. and Wiepkema, P.R. (1995, chapter 3.8) Detailed observations of suckling behaviour of a Grey seal (Halichoerus grypus) at Harderwijk Marine Mammal Park. Int. Zoo Yearbook 34, 186-200.
Kovacs, K.M. (1987) Maternal behaviour and early behavioral ontogeny of grey seals (Halichoerus grypus) on the Isle of May, UK. J. Zool. London 213, 697-715.
Seely, A.J. and Ronald, K. (1991) Testosterone profiles in male grey seals (Halichoerus grypus). Aquatic Mammals 17(3), 152-155.
Siegel, S. (1956) Non-parametric statistics. McGraw-Hill, New York.
Spotte, S. and Stake, P.E. (1982) Hand-rearing of twin Gray seals (Halichoerus grypus) from birth to weaning. Mar. Ecol. Prog. Ser. 9, 181-189.
Summers, C.F., Burton, R.W. and Anderson, S.S. (1975) Grey seal (Halichoerus grypus) pup production at North Rona: A study of birth and survival statistics collected in 1972. J. Zool. London 175, 439-451.
Leslie, G. (1974) Breeding the Grey seal at Aberdeen Zoo. Int. Zoo Yearbook 14, 130-131.
Wartzok, D. (1991) Physiology of behaviour in pinnipeds. In: Behaviour of pinnipeds (Ed. Renouf, D.). Chapman and Hall Ltd, London, 236-299.
415

R.A. Kastelein et al.
Worthy, G.A.J, and Lavigne, D.M. (1987) Mass loss, metabolic rate, and energy utilization by Harp and Gray seal pups during the postweaning fast. Physiol Zool. 60(3), 352-364.
416

Chapter 3.10
Behaviour and weight changes of a grey seal (Halichoerus grypus) pup before and after weaning
R.A. Kastelein1, C. Staal1, S.H. Nieuwstraten1 and P.R. Wiepkema2
2 Harderwijk Marine Mammal Park, Strandboulevard Oost 1, 3841 AB Harderwijk, The Netherlands
2 Emeritus Professor of Ethology, Wageningen Agricultural University, Stationsweg 1, 6861 EA Oosterbeek, The Netherlands
Summary
In January 1993, a male grey seal pup was born at the Harderwijk Marine Mammal Park. Mother and pup were kept in an indoor suckling area, where constant observation provided detailed information on their behaviour, and on the growth of the pup. Six days before parturition, the cow expelled a cervix plug of thick white mucous. The pup called before 73% of suckling sessions, and seldom otherwise. After weaning, the pup never called. Nuzzling between cow and pup took place before 76% of the suckling sessions, and often during the suckling sessions as well. Flippering occurred most often after suckling sessions, the pup flippering only in response to flippering by the cow. Although the majority of suckling sessions (92%) were broken off by the pup, some were terminated by the mother, soon after delivery, and just before weaning (at which time the female was in oestrus). The pup was suckled for 18 days. The total daily real suckling time (pauses excluded) remained fairly stable until day 15, averaging 48 minutes. Thereafter it increased to 161 minutes on day 17, and fell on the final day of suckling. The average suckling session duration was around 10 minutes until day 16; increasing to 22 minutes on day 17. The mean duration of non-suckling intervals increased initially from 115 minutes on day 0 to around 200 minutes between days 2 and 15, then decreased. The number of suckling sessions per day was fairly stable at around 6 or 7, but peaked on days 16 and 17. The pup gained on average 2.1 kg per day during the suckling period. Between weaning and consumption of his first fish, 9 days later, the pup lost on average 0.68 kg per day. He first accepted fish from the hand 35 days after birth. The pup was seen defecating and urinating throughout the suckling period. When he began to eat fish, his faeces changed from yellow to dark brown. The length of the pup increased by an average of 0.25 cm per day, from 106 cm at birth to 125 cm on day 25. In the first 10 days after birth, girth increased from 63 cm to 101 cm, stabilizing at 112 cm between day 16 and day 20. Daily food intake of the mother dropped to an average of 2.8 kg during the 2 weeks before she gave birth. She was not fed during the suckling period, during which she lost 97 kg (4.1 kg per day). The percentage of scored occasions (54 per day) in which the female was seen resting was fairly stable at around 80%. During the suckling period, the pup rested in 65% of all scores. After weaning, the percentage of time spent resting by the pup during the day decreased from 63% to around 20%. The pup had begun to moult in the uterus, especially on the nose, and moult was complete by day 17. Total estimated weight of the white lanugo hair was 260 g. The female came in oestrus 17 days after parturition. On day 18 she stopped suckling the pup and was moved to the seal pool. Copulation occurred on land 25 minutes after the female entered the pool, and lasted 15 minutes. The pup was released in the Dutch Wadden Sea at 157 days of age.
Key words: pinniped, phocid, growth, suckling, reproduction, neonate, vocalizations
417

R.A. Kastelein et al.
Introduction
Many grey seal pups (Halichoerus grypus) die during the suckling period or soon after weaning, both in the wild (Davies, 1949; Coulson and Hickling, 1960; Gallacher and Waters, 1964; Summers et al, 1975; Anderson et al, 1979; Baker et al, 1980; Baker, 1984, 1987 and 1988; Carter et al, 1990) and in zoological parks (Leslie, 1974; Kastelein and Wiepkema, 1988). To determine the factors which influence the pups' chances of survival, the Harderwijk Marine Mammal Park started a long-term study of the suckling period of grey seal pups born at the park. The pups were born of the same parents, but suckled under various conditions (Table 1).
In January 1993, a male pup was born in the indoor suckling area that was used in 1988, 1990 and 1991 (Kastelein et al, 1988, 1994 and 1995 a). The aim of this study was to describe in detail the cow's and pup's behaviour during the suckling period and to record the pup's weight and body dimension changes at known ages before and after weaning. In most studies on wild grey seal
pups, the ages of pups which were weighed could only be estimated (Fedak and Anderson, 1982).
Materials and methods
Study animals In 1992, the Harderwijk Marine Mammal Park housed 4 grey seals in the outdoor seal pool. Two seals were adults: a male (HgZH002) estimated to have been born in 1972 and found stranded on the Belgian coast in May 1978, and a female (HgZHOOl) estimated to have been born in September 1973 and found stranded in Belgium in November 1973. The adults copulated on 4 February 1992, and after a gestation period of 349 days, their seventh live pup, a male (HgZH013), was born on 18 January 1993. This report deals with the behaviour and weight changes of the adult female and her pup.
Study area The adult female grey seal was moved to the indoor suckling area, approximately 200 m away from the outdoor seal pool, on 5 Janu-
Table 1. The grey seal pups born alive in successive years at the Harderwijk Park of the same parents as the pup in the present study.
Year of birth
1987 1988 1989 1990 1991 1992 1993
Pup code
005 006 008 009 011 012 013
Sex
F F F M M F M
Suckling area
indoors outdoors outdoors indoors indoors indoors indoors
Access to pool Cow
no no yes no no yes no
Pup
no no no no no yes no
Reference
(Kastelein and Wiepkema, 1988) (Kastelein and Wiepkema, 1990) (Kastelein etal., 1991) (Kastelein etal., 1994) (Kastelein etal., 1995) (Kastelein etal., 1998) Present study
418

Behaviour of a grey seal pup before and after weaning
Water trough.
Fence
Doors
Wooden barrier
Area 1
« Steps
Area 2
Lower part
0 1m Figure 1. The indoor suckling enclosure in which the female grey seal and her pup were kept.
ary 1993. The tiled suckling area consists of an upper part (2.2 x 3.0 m), which is linked by 3 steps to a lower part (1.0 x 3.0 m). The upper part was divided into 2 equal areas by an imaginary line (Fig. 1). In area 1, a water trough was placed next to the fence. Area 2 was near the door. To prevent the pup from sliding into the lower part, a 40 cm high wooden barrier was placed just above the first step during the suckling period. Before and after the suckling period the lower part was filled with about 30 cm of water (mean temperature 11.2°C). After weaning, when the cow had been returned to the seal pool, the wooden barrier was removed so that the pup could enter the water. For safety reasons the water was drained each evening. During the suckling period the mean air temperature was 14.9°C (± 1.2°C, n = 36). Human activity near the animals was reduced to the minimum needed to clean the suckling area and weigh and measure the pup. Because a previous study (Kastelein
and Wiepkema, 1990) showed that disturbances soon after a suckling session had less influence on the suckling rhythm than disturbances shortly before a suckling session, the husbandry procedures were always done half an hour after the end of a suckling session.
Windows in the ceiling allowed some daylight to enter the study area, but in addition it was artificially lit 24 hours a day. Two video cameras and a microphone made it possible for observers to watch and listen to the animals constantly. The images could be observed on screens and sounds heard in a nearby observation room, which was manned 24 hours a day during the suckling period, and 8 hours a day until 12 days after weaning.
Recording technique A scanning sample of the behaviour of the cow and pup was taken every 15 minutes
419

R.A. Kastelein et al.
between 0800 and 1800 h, and every hour between 1800 and 0800 h (maximum score per day for each behavioral parameter: 10x4 + 14 x 1 = 54). The following parameters were recorded for each animal: - Rest or activity. - Type of activity: locomotion (including
swimming by the pup after weaning), scratching, actively looking at surroundings with raised head, suckling, playing or investigating, waking up (yawning, stretching, rubbing with front flippers over the face).
- Together or separate (if cow and pup were less than 1 m apart they were counted as being together).
- Position (in area 1 or 2, see figure 1).
In addition the following parameters were recorded before, during and after each suckling session: - Time of the first vocalization by the pup
that introduced a suckling session. The non-suckling intervals of the previous 6 pups had been about 3 hours long, so vocalizations produced occasionally during the 2 hours after a suckling session were considered not to introduce suckling sessions, and were disregarded.
- Number of vocalizations by the pup during the last 60 minutes before a suckling session.
- Whether or not nuzzling (nose contact) occurred in the 5 minutes before a suckling session.
- Flippering (moving the fore flippers horizontally) by the cow and pup occurring within a few minutes before a suckling session, during a suckling session (in a pause) or within a few minutes of the pup 's last contact with a nipple at the end of a suckling session.
- Time of day that a suckling session started (first contact of the pup 's mouth with a nipple).
- Time of day that a suckling session ended (last contact of the pup 's mouth with the cow's nipple, after which they separated).
- Real suckling time (length of time that the pup 's mouth was in contact with a nipple).
- Number of pauses during a suckling session. Pauses occurred when the pup released the nipple, usually for a few seconds, but by definition for no longer than 30 minutes. The previous 6 pups usually fell asleep if a pause lasted longer than 30 minutes; if suckling recommenced, the entire ritual of vocalizations, nuzzling and flippering took place.
- Which of the 2 animals cancelled a suckling session by moving away first.
The following miscellaneous parameters were also recorded: - The weight of the washed and drained
placenta. - The degree of swelling of the female's
labia. - The amount of fish (herring, Clupea ha-
rengus and mackerel, Scomber scombrus) consumed by the cow in 3 feeds each day before and after the suckling period. During the suckling period the cow was not fed, as land-breeding nursing females usually do not feed in the wild (Fogden, 1971; Boness and James, 1979).
- The pup's weight, standard length and axillary girth. These measurements were taken every other day during the suckling period, and approximately every 4 days after weaning. The pup was weighed on a digital weighing machine (TEC AD-FV14-150, T1311, accuracy: 50
g>-- The cow's weight before and after the
suckling period on a weighing platform (Mettler KE1500, up to 600 kg weighing with a 0.1 kg accuracy).
420

Behaviour of a grey seal pup before and after weaning
- The pup 's rate of moult. - Any disturbances. - Urination and defecation by the pup
(when seen).
After he was weaned, the pup was observed between 0900 and 1700 h for 12 days and the following parameters were recorded: - Rest or activity (every 15 minutes). - Type of activity (same parameters as
mentioned above, excluding suckling; every 15 minutes).
- Fish-catching technique (Kastelein et al., 1995 b).
- Fish consumption.
Statistical analysis Mean values are given plus or minus the standard deviation, followed where appropriate by the range between parentheses. Sample sizes are shown as n. All correlations (r) are Spearman rank correlations (Siegel, 1956).
Results
Birth For a few weeks before the female gave birth, her breathing became louder than usual. Six days before she gave birth, part of a cervix plug of thick white mucous was found in the study area; it weighed 8 g. On 18 January 1993 (day 0), male pup 013 was born at around 0945 h. Like all 6 previous pups, 013 was born within a few minutes. The placenta was expelled 115 minutes later and weighed 2.3 kg. Within 90 minutes of birth, the pup had been weighed, sexed and the umbilical cord had been treated with an iodine solution to prevent infection. Umbilical infections are a major cause of death in wild grey seal pups (Baker, 1984 and 1988).
Suckling ritual Until oestrus, suckling had a ritual similar to
that of all previous pups born to this female. The pup would wake, stretch, and yawn, then begin vocalizing, waking up the mother. The mother would approach, nuzzle the pup, and offer her nipples. Both animals would flipper, the pup would suckle from both nipples and retreat. The mother would then move away from the pup, and both animals would fall asleep.
Vocalizations The pup did not call before the first suckling session, which occurred 6.5 h after his birth. Nine and a half hours after birth the pup called for the first time and the cow offered her nipples. This resulted in the second suckling session. The pup called before 73% of suckling sessions, and seldom otherwise. He vocalized on average 6 times (range: 0 -57, n = 132) before a suckling session started. The number of calls per suckling interval was quite variable but no change in number of calls over time was seen. There was a significant correlation between the number of vocalizations and the duration of the non-suckling interval in which they were produced (r = 0.197, p = 0.03, n = 96). There was no correlation between the number of vocalizations and the duration of the real suckling time of the subsequent suckling session (r = 0.00, p > 0.10, n = 96). After weaning, the pup never called.
Nuzzling Nuzzling between cow and pup took place before 76% of suckling sessions, and often during the suckling sessions (Fig. 2). There was no change in occurrence of nuzzling over time.
Flippering The cow flippered before 36% of the suckling sessions (Fig. 3 a), the pup flippered before 18% (Fig. 4 a). During 39% of the suckling sessions the cow flippered (Fig. 3 b)
421

R.A. Kastelein et al.
Figure 2. The female grey seal and her one-day-old pup nuzzling (Photo: Henk Merjenburgh).
and during 25% the pup flippered (Fig. 4 b). The cow flippered after 73% of the suckling sessions (Fig. 3 c), the pup flippered after 44% (Fig. 4 c). There was no trend in the occurrence of flippering over time during the suckling period, and the pup only flippered in response to flippering by the cow.
Encounters between cow and pup On average, over the entire suckling period, the cow and pup spent 42% of the scored moments together. No trend was observed over time (Fig. 5). Of the 392 scored moments when they were together, 60 (15%) were during suckling.
Although the majority of suckling sessions (92%) were broken off by the pup (Fig. 6),
some were terminated by the mother, soon after delivery and just before weaning.
The mean real suckling time per suckling session was significantly longer in suckling sessions broken off by the pup (8.3 ± 3.5 minutes, n = 122) than those broken off by the cow (4.9 ±1.5 minutes, n = 10) (Mann-Whitney U test, U values: 1028 and 192, p = 0.0003).
Suckling parameters The total daily real suckling time remained fairly stable until day 15 (mean = 48 ± 6 minutes; range: 38-58 minutes). Thereafter it increased to 161 minutes on day 17, and fell on the final day of suckling (Fig. 7 a). The mean number of pauses per day until day 16
422

Behaviour of a grey seal pup before and after weaning
was 195 ± 106 (mean per session: 28; range: 17-47). On day 17 the pup paused 956 times (Fig. 7 a). The daily mean real suckling time per session increased from 6 minutes on day 1 to 13 minutes on day 17, after which it decreased. The average suckling session duration was around 10 minutes until day 16; increasing to 22 minutes on day 17 (Fig. 7 b). The mean duration of non-suckling intervals increased initially from 115 minutes on day 0 to around 200 minutes between days 2 and 15, then decreased (Fig. 7 c). The number of suckling sessions per day was fairly stable at around 6 or 7, but peaked on days 16 and 17 (Fig. 7 d).
A positive correlation was found between the number of pauses and real suckling time per session (r = 0.65, p < 0.00001, n = 132; Fig. 7 e). No correlation was found between the real suckling time per suckling session and the previous non-suckling interval (r = -0.04, p > 0.10, n = 130) or following non-suckling interval (r = 0.11, p > 0.10, n = 130).
Activity The percentage of scored occasions on which the female was seen resting was fairly stable at around 80%. She rested on average a little more during the night (86%) than during the day (76%; Fig. 8 a). During the suckling period the pup rested in 65% of all scores. He also rested on average a little more during the night (68%) than during the day (63%, Fig. 8 b).
Use of space The lower part of the study area was not used during the suckling period (Fig. 1). The wooden barrier was not negotiated by the pup, and the cow stayed with him in areas 1 and 2. The pup spent on average 73% of his time in area 2 (Fig. 9). On day 1 he started to play with the water in the trough (area 1), and on day 2 he seemed to drink from it. The
cow usually spent around 12% of her time in area 2. She spent a great deal of time in area 1, and often drank from the water trough. From day 16 onwards she spent more and more time near the door in area 2 (53% of her time on day 18).
Food consumption and weight changes of the cow Before she gave birth, the female was given as much as she wanted to eat 2 or 3 times a day. After she was moved from the seal pool to the indoor study area, daily food intake of the mother dropped to an average of 2.8 kg during the 2 weeks before she gave birth (Fig. 10). She was not fed during the suckling period. After her pup was weaned, the female was reunited with the adult male in the seal pool. From this point onwards the female was given as much as she wanted to eat 3 times a day and in March she consumed on average 8.8 kg per day.
The female's weight changes are shown in table 2. Assuming that the female's weight was constant during the 2 weeks before she gave birth, she lost 97 kg during the suckling period. The weight she lost was made up of the weight of the pup (19.65 kg), the weight of the placenta (2.3 kg), the weight of the amniotic fluid (estimated to be 2 kg), transfer of milk for the growth of the pup (his weight increased by 38.05 kg) and for his metabolism, and for the cow's own metabolic needs. During the suckling period the cow lost on average 4.1 kg per day.
Weight, length and girth changes of the pup During the study the pup's weight changed as shown in table 2 and figure 11a. The pup gained on average 2.1 kg per day during the suckling period. The pup was seen defecating and urinating on day 2 for the first time. The pup's faeces were observed in the study area throughout the suckling period. Between weaning and consumption of his
423

R.A. Kastelein et al.
100
11 to a.
o S5
^ Birth of pup
12 14 16 18
Number of days after birth
3 8
12 14 16 18 Number of days after birth
12 14 16 18 Number of days after birth
Figure 3. The percentage of suckling sessions before (a), during (b) and after (c) which the cow flippered.
424

Behaviour of a grey seal pup before and after weaning
sBirth of pup 12 14 16 18 Number of days after birth
C 100-1
* 70-O t x, 60-Q fl)
g 8. 50-.2 .S-w ^ An . s " 30-c 2 20-u » 10 * o
X. 4 6 8 10 12 14 16 18
- Birth of pup Number of days after birth
Figure 4. The percentage of suckl ing sess ions before (a), dur ing (b) and after (c) wh i ch the p u p f l ippered.
425

R.A. Kastelein et al.
1 0 0 i
90
80-
£ o u CO
•6
7 0 -
6 0 -
5 0 -
4 0 -
3 0 -
20 -
10 -
Suckling
0 y 1 2 3 4 ^ Birth of pup
10 11 12 13 14 15 16 17 18
Number of days after birth
Figure 5. The percentage of scores per day that mother and pup were found together (including suckling), and the number of scores per day in which suckling was taking place.
100-1 >» ra • o
0) Q.
10 c o '55 V)
o> c O 3 (0
>4-
o
90
80
70
60
50
40
30
20 10 -
X, 8 10 12 14 16 18
'Birth of pup Number of days after birth
Figure 6. The percentage of suckling sessions broken off by the pup during each day of the suckling period.
426

Behaviour of a grey seal pup before and after weaning
first fish, 9 days later, the pup lost on average 0.68 kg per day.
The length of the pup increased by an average of 0.25 cm per day, from 106 cm at birth to 125 cm on day 25 (Fig. 11 b). In the first 10 days, girth increased from 63 cm to 101 cm, stabilizing at 112 cm between day 16 and day 20. Thereafter, girth decreased to 102 cm before increasing again.
Moulting of the pup The pup had begun to moult in the uterus, especially on the nose (Fig. 2). He continued to moult around his front and hind limbs and his nose, and later towards the centre of his body. The sides of his body moulted last and moulting was complete by day 17. Lanugo hair, weighing a total of 210 g, was collected from the floor of the study area. This was estimated to be about 80% of all the lanugo hair; the total estimated weight of the lanugo hair was 260 g.
Separation It became clear that the female had come into heat 17 days after parturition; she became restless, scratched the door of area 2 and her labia were swollen. On day 18 she stopped suckling the pup and was moved to the seal pool. Here, the adult male was very alert and active and had behaved aggressively towards keepers and smelled strongly throughout the period in which the female was indoors. Copulation occurred on land 25 minutes after the female entered the pool, and lasted 15 minutes.
Behaviour of the pup after weaning After weaning, the pup spent 8 hours per day in the lower part of the study area. Once he had entered the water he seemed to be unable to negotiate the steps towards areas 1 and 2. After weaning, the percentage of
scores in which he was observed resting during the day decreased from 63% to around 20% (Fig. 12).
Transition to solid food After suckling ceased the pup lost weight until he accepted fish (Fig. 11 a). Because the previous pups which had simply been offered fish (Kastelein et ah, 1995 a and b and 1998), had started eating solid food earlier than those which had been force-fed, this pup was not force-fed. Seven days after he was separated from his mother, the pup was offered thawed herring, but he did not eat. Live freshwater fish (roach, Rutilus rutilus) which were 15-25 cm long were put into the water in the study area between 8 and 12 days after suckling had ceased. On day 26 after birth the pup started to play with a live fish; on day 27 he started to eat bits of one. The development of hunting behaviour in of this pup has been described by Kastelein et al. (1995 b). Later, thawed herring and mackerel were thrown into the water each day. Some were eaten and leftovers were removed at the end of each day.
The pup first accepted fish from the hand 35 days after birth. When he began to eat fish, the colour of his faeces changed from yellow to dark brown. In March he ate on average 1.2 kg of fish per day; in April he ate 2.0 kg per day. On 23 March 1993, the pup was judged able to compete for fish with the other seals, and was transported to the seal pool to join his parents.
Release Having been vaccinated against seal distemper virus and equipped with a flipper tag (no. 2735), the pup was released from a ship between the islands of Terschelling and Vlieland in the Dutch Wadden Sea on 24 June 1993 (age: 157 days).
427

R.A. Kastelein et al.
r 1000
10 12 14 16 18
Number of days after birth
70-
50-
.1 30 -I-
20 -
10 -
Average real suckling time per euclding session
2 4 Birth of pup
10 12 14 16 18 Number of days after birth
* Birth of pup
12 14 16 18
Number of days after birth
428

Behaviour of a grey seal pup before and after weaning
v Birth of pup 12 14 16 18
Number of days after birth
1000 1200 1400 1600
Real suckling time per session (sec)
Figure 7. The total daily real suckling time and the number of pauses per day (a), duration of the average suckling session per day and the average real suckling time per suckling session (b), the average daily non-suckling interval (c), the number of suckling sessions per day (d) and the correlation between real suckling time per session and the number of pauses per session (e). The bars indicate the standard deviation.
Discussion and conclusions
This discussion focuses on the comparison of data from the present study (the 1993 pup) with those of the 1987, 1990 and 1991 pups which were suckled by the same female in the same indoor enclosure (Kaste-lein and Wiepkema, 1988; Kastelein et ah, 1994; 1995 a). Some references will be made to the 1988 (outdoors; Kastelein and Wiepkema, 1990), 1989 (outdoors and the cow had access to a pool; Kastelein et ah, 1991) and 1992 (indoors with a pool; Kastelein et al., 1998) pups of the same cow.
Birth In grey seals, the expulsion of the cervix plug and heavy breathing by the female are indications that birth is imminent (Kastelein et al, 1991; 1994; 1995 a; 1998).
Vocalizations The pup in the present study called on average 6 times before a suckling session began. This is less than in the previous studies (1988: 59, 1989: 15, 1990: 35; 1991: 12; 1992: 20). Maybe the low number of vocalizations in the present study was because the cow habituated to the indoor suckling area and
429

R.A. Kastelein et al.
A. Cow 100
90
O) 80 c % 70 £ ~ 60 q> a m in 9>
5 0 -
£ 40 o
w 30
10
-Night
1 1 1—
2 4 Birth of pup
— i —
10 12 14 16 18
Number of days after b irth
o> c
9
c Q. in in S> o u in
B. Pup 100 T
90 H
80
70
60
50
40
30 - |
20
10
X - 1 —
4 -r-6
Birth of pup
—i 1 1 1 1 1 1 1 1
10 12 14 16 18
Number of days after birth
Figure 8. The percentages of scores spent resting during the day (0800 -1800 hours) and during the night (1800 -0800 hours) by cow (a) and pup (b).
430

Behaviour of a grey seal pup before and after weaning
100
V1 '' Birth of pup
3 4 5 6 8 9 10 11 12 13 14 15 16 17 18
Number of days after birth
The percentage of scores that the cow and pup were in area 2 (Fig. 1).
i i i i i i i i i i i i i i i f i i i i i i i i i i i i i i l i i i 1 3 5 7 9 1113 151719 2123 25 27 29 3 1 2 4 i 6 8 10 12 1416 18 20 22 24 26
January t f f I February Date Cow moved Cervicplug Birth of pup Pup weaned to study area expelled
Figure 10. The cow's daily food consumption before and after the suckling period. She was not fed during the suckling period to mimic the situation usually observed in the wild.
431

R.A. Kastelein et al.
did not have to spend much time investigating the environment after the pup had woken her up. In the wild, experienced female grey seals are more confident mothers than first-time breeders (Piatt et al., 1975).
Nuzzling Nuzzling took place before most suckling sessions as in the previous suckling periods of this cow. It is part of the suckling ritual. It
probably helps the cow to identify the pup by smell (the nostrils are open) or by tactile stimulation (the mystacial vibrissae are erect). In wild grey seals the same behaviour has been observed (Davies, 1949; Fogden, 1968 and 1971; Burton et al, 1975).
Flippering The cow flippered often before the suckling sessions on the first day after birth. During
Table 2. Weight changes of the cow, weight and body dimension changes of the pup, and the weight of the placenta.
Occasion
- To indoor study area - Cervix plug expelled - Just after birth - Suckling period
JI »
i i
i i
i i
i i
n
i»
i
i
i
i
i
» - Weaning/separation - Fasting
»» - 14 February: start eating live fish - 16 February -18 February - 22 February: start eating dead fish - 23 February - 26 February - 3 March - 9 March: to larger indoor pool - 23 March: to seal pool - 22 June: preparation for transport - 24 June: to North Sea
Time relative to birth (days)
-13 -6 0 2 4 6 8
10 12 14 16 18 21 25 27 29 31 35 36 39 44 50 64
155 157
Cow's body
weight (kg)
206 ----------
109 ---------~ --~
Pup's body
weight (kg)
— -
19.65 20.30 24.10 29.75 34.50 40.80 46.50 52.15 56.60 57.70 55.60 52.90
~ 51.35 50.35
-49.30 50.40 52.20 53.10 53.00 56.30
~
Pup's standard
length (cm)
— -
106 106 105
-112 115 117 118 121 120 120 125
-125 124
---
124 124 124
-—
Pup's axillary
girth (cm)
— -
63 67 72 80 89
101 105 109 112 112 112 110
-104 103
-102 103 109 109 103
-~
Weight placenta
(kg)
— -
2.3 ---~ ---— -------------—
432

Behaviour of a grey seal pup before and after weaning
that day, the pup had to learn how to find the nipples after nuzzling and thus it took him longer to find them than it did later in the suckling period. When the pup was searching her chest area, the cow flippered a lot, perhaps to direct the pup towards the nipples. The pup slightly increased his flip-pering after suckling sessions during the second part of the suckling period, perhaps as a reaction to the flippering of the cow. The pup never flippered when he was alone. Like in the previous studies, the pup may have flippered in order to protect himself against the cow's flippering. A similar amount and distribution of flippering was observed in previous years (Kastelein et ah, 1994,1995 a and 1998). The high percentage of flippering by the mother after a suckling session may have served to stimulate the pup to continue to suckle.
Encounters between cow and pup On average, over the entire suckling period, the cow and pup spent 42% of the scored moments together. This is less than in previous years in the same suckling area (1990: 60% and 1991:89%), but more than in another, much larger, indoor suckling area with a pool (1992: 26%). This suggests that the amount of space available to mother and pup did not have a strong influence on them being together or not.
The percentage of suckling sessions ended by the 1987 pup was around 90%, by the 1988 pup 42%, by the 1989 pup 44%, by the 1990 pup 73%, by the 1991 pup 89%, by the 1992 pup 66%, and by the pup in the present (1993) study 92%. In general, pups ended a high proportion of suckling sessions when they were suckled indoors and when the cow had no access to a pool. This could be due to many disturbances (birds, construction, rain, other seals etc.) encountered outdoors (in 1988 and 1989), which usually
caused the cow to break off the sessions and investigate the environment. Also, when a pool was available (in 1989 and 1992), the cow could swim after suckling sessions.
In the present study the cow only broke off some suckling sessions at the start and end of the suckling period. This was also the case in 1992. The cow may break off sessions during the first few days of the suckling period because her milk production is not sufficient to fulfil the pup. This idea is supported by the slow growth of the pup during the first few days. The cow may break off sessions at the end of the suckling period because she is coming into oestrus and has very little milk. The slow growth of the pup during this period supports this idea.
The real suckling time per suckling session was significantly longer in sessions broken off by the pup than in those broken off by the cow. Perhaps in general the pup ended the suckling sessions when he felt satisfied, and his stomach was not completely full when the cow broke off a session.
Suckling parameters The pup in the present study was suckled about once every 3 hours, at similar intervals to grey seal pups in the wild. Pups on ice from the Gulf of St Lawrence are nursed every 2-3 hours (Lydersen et ah, 1994).
The suckling sessions in the present study lasted for about 10 minutes. Kovacs (1987) gives mean suckling duration for grey seals on the Isle of May of 9.9 minutes and Oftedal et al. (1987) give 10.4 minutes for grey seals on Sable Island. Whether they mean with suckling duration suckling session duration or real suckling time per session is not clear.
The present study shows that when at the end of the suckling period the real suckling
433

R.A. Kastelein et al.
0 2 4 6 8 10 12 14 16 18 20 22 24 26 28 30 32 34 36 38 40 42 44
Birth of pup Number of days after birth
130 B.
E <>
a 3 a. a>
<4-
o . £ •e O)
•o c n £ % C
120-
110 -
100-
90-
80-
70-
60-
50
Pup weaned Length
Girth
i i i i i i i i i i i i i i i i i i i i i i i i i i i i i i i i i i i i i i i
0 2 4 6 8 10 12 14 16 18 20 22 24 26 28 30 32 34 36 38 40 42 44
Birth of pup Number of days after birth
Figure 11. Body weight (a) and length and girth (b) changes of the pup before and after weaning.
434

Behaviour of a grey seal pup before and after weaning
time increased, the number of pauses increased relatively more. Maybe the milk production of the cow decreased as she came into oestrus. This may have caused the pup to suckle longer and to change from nipple to nipple more frequently in an attempt to receive more milk.
After day 15 the total daily suckling time increased dramatically. This was due to an increase in the number of suckling sessions and in their mean duration. The increase was probably not due to increased energetic demands of the pup, because he grew gradually and his activity level seemed to be constant. Perhaps the pup needed more time to get the same amount of milk. At the very end of the suckling period, the number of sessions decreased and there was a strong decrease in the pup's growth. This suggests that the milk supply had decreased. Baker (1990) suggests that the milk composition changes during the suckling period. The percentage of fat is relatively low during the first 3 days (approximately 42%), and higher thereafter (approximately 53%, a percentage also reported by Amoroso et ah, 1950), while the water content falls in correspondence to the increase in fat content. This is also seen in the milk of most other seals (Oftedal et ah, 1987). Variation in milk composition may have an effect on the suckling parameters and weight changes.
Activity The cow rested most of the time, and more frequently than the pup. She rested more during the present study (about 80%) in which she could not enter a pool than in previous years when she could (1990: around 30%; 1992: around 55%). Ice-breeding grey seal females in the Gulf of St. Lawrence spend on average 72% of the time on the ice, 20% in the water at the surface and 8% diving. They haul out more in darkness
than in the light. When the wind-chill index is high, they spend a great deal of time in the water (Lydersen et ah, 1994).
The pup's activity level was much higher after weaning than before. Increased activity at this time probably has adaptive value. Grey seal pups use the post-weaning period to develop their motor skills to catch fish (Wartzok, 1991; Kastelein et ah, 1995 b). The post weaning fast of wild pups on North Rona can vary between 1 and 4 weeks (Fe-dak and Anderson, 1982).
Use of space The pup in the present study had a favourite resting place in area 2. Site fidelity allows most of the energy contained in the milk to be used for growth, and makes the pup easier for the cow to find. In the wild, newborn pups are probably still difficult for the cow to identify (Burton et ah, 1975). In the wild, if the pup does not vocalize, the returning cow goes to the spot where she left her calf and searches around (Davies, 1949). If she cannot find her pup, the bond is broken and the pup may starve. This is a major cause of death in grey seals (Baker et ah, 1980).
The cow spent much of her time near the water trough (area 1) during the first part of the suckling period, and much of her time near the door (area 2) in the latter part. She may have remembered from previous suckling periods (1987, 1990 and 1991) in that enclosure that the door was the way towards the male.
Food consumption and weight changes of the cow The female in the present study lost on average 4.1 kg of her body weight per day during the suckling period in which she was not fed. The effect of any water the female consumed on her weight change cannot be evaluated. It would be of interest to evaluate the
435

R.A. Kastelein et al.
effect of food on milk quantity and quality and on the cow's weight changes during the suckling period. The few data on the weight changes of the female show no obvious effect of food consumption: in 1992 when she was not fed she lost 3.3 kg per day. In 1990 and 1991 when she was fed during the suckling period, she lost 3.6 and 3.0 kg per day respectively.
In Nova Scotia, adult females weighed on average 231 kg at the start of lactation, and lost on average 5.6 kg per day during the suckling period. They lost 60% of their fat reserves during lactation (Baker et al., 1991). In another study in Nova Scotia, a linear maternal weight loss rate of 4.8 kg per day was recorded. This mass loss was correlated with milk output (Iverson et al., 1991). The latter authors conclude, that female initial mass influences pup growth. On North Ro-
na, Scotland, over 80% of the females' energy reserves are used to feed the pup. The females' mean weight loss was 3.6 kg per day with a pup mean weight gain of 1.6 kg per day (Fedak and Anderson, 1982). The ice-breeding grey seal females in the Gulf of St. Lawrence lose a mean of 5.7 kg per day. They spent 28% of the suckling period in the water (Lydersen et ah, 1994).
Amoroso and Mathews (1951) report on a captive female with a post birth weight of 167 kg. She lost 43 kg (2.8 kg per day) during the 15 day lactation period. The low mass reduction rate compared to her wild con-specifics could be due to a (possibly) warmer environment, and by the (undetermined) amounts of water she drank. During the suckling period, the female in the present study drank, and was housed indoors. This may partly explain her low weight loss com-
100
26 27 28 29 30
Number of days after birth
Figure 12. The percentage of scores spent resting during the day (0900 - 1700 hours) by the pup after weaning.
436

Behaviour of a grey seal pup before and after weaning
pared to most conspecifics in the wild, although the suckling behaviour of the pup also influenced her weight change.
Suckling is successful if cow and pup are viable after the suckling period. Viability depends partly on the effectiveness of energy transfer from cow to pup. Kastelein et al. (1994) proposed an effective mass transfer ratio (R) which is the average body weight gain in the pup per day divided by the cow's average weight loss per day during the suckling period. This ratio not only depends on the physical conditions of the cow and pup, but also on food quality and availability, water availability, on the level of rest and on climatic conditions. Low values (= < 0.40) generally indicate bad circumstances leading to poor survival rate of cow or pup or both animals. High values (= > 0.40), indicate good reproductive conditions. In the present 1993 study, in which the female was not fed during the suckling period, the R value was 2.1/4.1 = 0.52. This is similar to the value in 2 previous suckling periods of the same female, in which she and her pups had no access to water and the cow was fed (R =1.9/3.6 = 0.53, Kastelein et al. (1994) and R =2.0/3.0 = 0.67, Kastelein et al, 1995 a). In the 1992 study the R value was 0.48 (Kastelein et al., 1998). This relatively low value was probably due to high energy loss by both cow and pup because they both spent much time in the water. The fact that the female was not fed in the 1992 study, may also have played a role in causing the low R value. In the wild, relatively low R values occur such as 0.40 in Nova Scotia, Canada (Iverson et al, 1991), 0.46 on North Rona, U.K. (Fedak and Anderson, 1982; Anderson and Fedak, 1987). In the latter study it rained 17 of the 27 study days, which may have forced pups to use more energy for thermoregulation instead of for growth. The mean R value for ice-breeding grey seals in the
Gulf of St. Lawrence was 0.42 (Lydersen et al., 1994). Here the cows spent on average 28% of the suckling period in the water near the bottom, where they may have been feeding. Grey seals suckling in human care often produce relative high R values such as 0.54 (Amoroso and Mathews, 1951). This is probably due to a higher environmental temperature, more food and water availability and fewer disturbances in the zoos and ocean-aria compared to in the wild. Also, when kept indoors, the fur is dry most of the time, whereas outdoors, rain often wetted the fur, reducing its isolation properties. The R value is also influenced by the quality of the milk; a low quality will cause less growth in the pup. Spotte and Stake (1982) report on grey seal pups which were bottle-fed with an inadequate formula. The weight gain of those pups was half that of healthy pups in the wild, although the formula was constantly available to them.
Growth of the pup The present study shows that the pup 's weight gain mainly increased its girth. The weight and girth curves run almost parallel, whereas the standard body length only changed a little during the suckling period. The pup in the present study gained on average 2.1 kg a day during the suckling period. In the years in which other pups were suckled in the same enclosure, their mass gain was similar; the 1987 pup gained on average 2.1 kg per day, the 1990 pup 1.9 kg and the 1991 pup 2.0 kg. In all years, the pup 's mass gain was linear for most of the suckling period. A wild pup 's mass gain during the suckling period is positively correlated with its survival chance after weaning (Coulson and Hickling, 1964).
Moulting of the pup. The pup in the present study showed the same pattern of hair shedding as observed in
437

R.A. Kastelein et al.
wild grey seals. The rapid post natal moult may be typical of ice-breeding seals and prepares them for an aquatic life. The lanugo hair is only functional as an insulator when dry (Ling and Button, 1975; Blix et al., 1979). The onset, rate and end of moult varies greatly between pups as seen at the Harder-wijk Park and in the wild (Davies, 1949; Cur-ry-Lindahl, 1970). Moulting is always complete around weaning, which enables the pups to enter the water safely.
Weaning In grey seals, the moment of weaning seems to be determined by the cow. In the last few days of the suckling period, she probably produces little milk, which results in many suckling sessions of long duration with many pauses. The pup's decreased growth rate during the last part of the suckling period in the present study supports this hypothesis. Hormones causing oestrus may reduce the production of milk. The suckling period in the present study was the same length as the average suckling period of grey seals on Sable Island (Boness and James, 1979) and on the Isle of May (Kovacs, 1987).
The male The male was sexually excited and aggressive towards his keepers during most of the period that the female was in the indoor suckling area which was about 200 m away from the outdoor seal pool. The male also smelled strongly during that period. Seely and Ronald (1991) report of testosterone cycles of captive and wild male grey seals. The levels were highest during the breeding season (October - February). During the breeding season, males strongly reduce their food intake (Kastelein et al., 1990), and loose weight (Anderson and Fedak, 1987).
Transition to solid food The pup in the present study was seen defe
cating and urinating throughout the suckling period. Between his last suckling session and the consumption of his first fish he lost on average 0.68 kg per day. This weight loss was reflected in a decrease in girth. Like the pup in the present study, wild grey seal pups lose weight after weaning until they are efficient at catching fish (Davies, 1949; Amoroso and Mathews, 1951; Coulson and Hickling, 1964). On average, pups on the Fame Islands lost 0.5 kg per day during the 14 days post weaning (Coulson, 1960). On Sable Island, the pups lost 22% of their weaning mass over the first 10 days of fast (Bowen et al., 1992). During the post weaning fasting, discomfort or stress is prevented by a depression of basal metabolic rate and extensive blubber (mainly triglycerides) ca-tabolism (Nordoy and Blix, 1985; Nord0y et al, 1990). More than 70% of the post-weaning mass loss (and hence > 90% of the energy) in grey seals is in the reduction of blubber (Worthy and Lavigne, 1987). Nordoy and Blix (1985) calculated that around 94% of the energy expended by a pup during the first 4 weeks of the post- weaning fast is derived from subcutaneous fat deposits. Worthy and Lavigne (1987) found that grey seal pups that fasted in water lost significantly more blubber and exhibited higher specific metabolic rates than those fasting on land, probably because the pups used more energy for thermo-regulation.
How long it takes before grey seal pups start to eat in the wild is not known. On the Fame Islands, pups stay on their natal islands for on average 32 days before leaving for sea (Coulson and Hickling, 1964). The pup in the present 1993 study started to eat bits of live fish 27 days after birth (see also Kastelein et al., 1995 a). When the pup started to eat fish, his mystacial vibrissae changed from black to transparent. Also the faeces turned from yellowish to dark brown, and started to
438

Behaviour of a grey seal pup before and after weaning
smell worse to humans. The colour of faeces might be used in the field to determine whether or not a pup has started to consume fish.
Recommendations Grey seal suckling behaviour differs between disturbed and undisturbed suckling areas. Seal density and the topography of the suckling areas also influence the suckling behaviour (Fogden, 1971). The present study was based on only one grey seal. However, it was a much more detailed study than would be possible in the field. More studies of the present kind under a variety of conditions could be carried out in order to determine the proportional impact of weather conditions, the suckling area, food and water availability, disturbances, the pup 's and the cow's activity, and individual metabolic variations on growth and possibly survival chance and reproductive success in grey seals.
Acknowledgements
We thank trainers Piet Mosterd, Johan van Ardenne and Bert van Santen for assisting with weighing and measuring the pup, and Willem Zoetebier for technical assistance. We also thank Hendrik Jan Groeneveld, Sa-brina Labberte, Gabrielle Brouwer, and Jan-ny Hardeman for assisting with behavioral observations. We thank Rob Triesscheijn for making the graphs and Nancy Vaughan and Eleanor Hayes (University of Bristol, U.K.), and Nicole Schooneman for their comments on the manuscript.
References
Amoroso, E.C. and Mathews, L.H. (1951) The growth of the grey seal (Halichoerus gry-pus, Fabricius) from birth to weaning. J. Anat. 85, 427-428.
Amoroso, E.C., Goffin, A., Halley, G., Matthews, L.H. and Mathews, D.J. (1950) Lactation in the grey seal. J. Physiol. London, 113, 4-5.
Anderson, S.S. and Fedak, M.A. (1987) Grey seal, Halichoerus grypus, energetics: females invest more in male offspring. J. Zool. London, 211, 667-679.
Anderson, S.S., Baker, J.R., Prime, J.H. and Baird, A. (1979) Mortality in Grey seal pups: incidence and causes. J. Zool. London, 189, 407-417.
Baker, J.R. (1984) Mortality and morbidity in Grey seal pups {Halichoerus grypus). Studies on its causes, effects of the environment, the nature and sources of infectious agents and the immunological status of pups. J. Zool. London, 203, 23-48.
Baker, J.R. (1987) Causes of mortality and morbidity in wild juvenile and adult grey seals (Halichoerus grypus). Br. vet. J., 143,203-220.
Baker, J.R. (1988) Further studies on Grey seal (Halichoerus grypus) pup mortality on North Rona. Br. vet. J. 144, 497-506.
Baker, J.R. (1990) Grey seal (Halichoerus grypus) milk composition and its variation over lactation. Br. vet. J. 146, 233-238.
Baker, J.R., Anderson, S.S., Prime, J.H. and Baird, A. (1980) The pathology of the Grey seal (Halichoerus grypus). I. pups. Br. vet. J. 136, 401-412.
Baker, S.R., Barrette, C. and Hammill, M.O. (1991) Mass transfer during lactation of an ice-breeding pinniped, the grey seal (Halichoerus grypus), in Nova Scotia, Canada. Ninth Biennial Conf. on the Biol, of Mar. Mamm., Chicago, 111. USA, 4.
439

R.A. Kastelein et al.
Blix, A.S., Grav, H.J. and Ronald, K. (1979) Some aspects of temperature regulation in newborn harp seal pups. Am. J. Physiol. 236, R188-R197.
Boness D.J. and James, H. (1979) Reproductive behavior of the Grey seal (Halichoerus grypus) on Sable Island, Nova Scotia. J. Zool. London, 188, 477-500.
Bowen, W.D., Stobo, W.T. and Smith, S.J. (1992) Mass changes of grey seal (Halichoerus grypus) pups on Sable Island: differential maternal investment reconsidered. J. Zool. London, 227, 607-622.
Burton, R.W., Anderson, S.S. and Summers, C.F. (1975) Perinatal activities in the Grey seal (Halichoerus grypus). J. Zool. London, 177, 197-201.
Carter, S.D., Hughes, D.E. and Baker, J.R. (1990) Characterization and Measurement of Immunoglobulins in the Grey Seal (Halichoerus grypus). J. Comp. Path., 102, 13- 23.
Coulson, J.C. (1960) The growth of grey seal calves on the Fame Islands, Northumberland. Trans. Nat. Hist. Soc. Northumb. 13, 86-100.
Coulson J.C. and Hickling, C. (1960) The Grey seal of the Fame Islands. Trans. Nat. Hist. Soc. Northumb. 13, 196-214.
Coulson J.C. and Hickling, C. (1964) The breeding biology of the Grey seal on the Fame Islands. J. Anim. Ecol., 33, 485-512.
Curry-Lindahl, K. (1970) Breeding biology of the baltic Grey seal (Halichoerus grypus). Der Zool. Garten, 38 (1/2), 16-29.
Davies J.L. (1949) Observations on the Grey seal (Halichoerus grypus) at Ramsey Island, Pembrokeshire. Proc. Zool. Soc. London, 119, 673-692.
Fedak, M.A. and Anderson, S.S. (1982) The energetics of lactation: accurate measurements from a large wild mammal, the Grey seal (Halichoerus grypus). J. Zool. London, 198, 473-479.
Fogden, S.C.L. (1968) Suckling behaviour in the Grey seal (Halichoerus grypus) and the Northern elephant seal (Mirounga angusti-rostris). J. Zool. London, 154, 415-420.
Fogden, S.C.L. (1971) Cow-young behaviour at Grey seal breeding beaches. J. Zool. London, 164, 61-92.
Gallacher, J.B. and Waters, W.E. (1964) Pneumonia in Grey seal pups at St. Kilda. Proc. Zool. Soc. London 142, 177-180.
Iverson, S.J., Bowen, W.D., Boness, D.J. and Oftedal, O.T. (1991) Milk composition, milk intake and energetics of lactation in grey seals (Halychoerus grypus) on Sable Island, Nova Scotia. Ninth Biennial Conf. on the Biol, of Mar. Mamm., Chicago, 111., USA, 36.
Kastelein, R.A. and Wiepkema, P.R. (1988, chapter 3.4) Case study of the neonatal period of a Grey seal pup (Halichoerus grypus) in captivity. Aquatic Mammals, 14(1), 33-38.
Kastelein, R.A. and Wiepkema, P.R. (1990, chapter 3.5) The suckling period of a Grey seal (Halichoerus grypus) while confined to an outdoor land area. Aquatic Mammals 16 (3), 120-128.
440

Behaviour of a grey seal pup before and after weaning
Kastelein, R.A., Wiepkema, P.R. and Vaugh-an, N. (1990, chapter 3.2) The food consumption of Grey seals (Halichoerus grypus) in human care. Aquatic Mammals 15(4), 171-180.
Kastelein, R.A., Wiepkema, P.R. and Vaugh-an, N. (1991, chapter 3.6) The suckling period of a Grey seal (Halichoerus grypus) while the cow had access to a pool. Aquatic Mammals 17(1), 42-51.
Leslie G. (1974) Breeding the Grey seal at Aberdeen Zoo. Int. Zoo Yearbook 14, 130-131.
Ling, J.K. and Button, C.E. (1975) The skin and pelage of grey seal pups (Halichoerus grypus Fabricius): with a comparative study of foetal and neonatal moulting in the Pinni-pedia. Rapp. P.-v. Reun. Cons. Int. Explor. Mer 169, 112-132.
Kastelein, R.A., Wiepkema, P.R., Berghout, E. and Groenenberg, H.J. (1994, chapter 3.7) Effective mass transfer in a suckling Grey seal (Halichoerus grypus). Aquatic Mammals, 20(1), 11-27.
Lydersen, C., Hammill, M.O. and Kovacs, K.M. (1994) Activity of lactating ice-breeding grey seals, Halichoerus grypus, from the Gulf of St. Lawrence, Canada. Anim. Behav. 48, 1417-1425.
Kastelein, R.A., Groenenberg, H.J. and Wiepkema, P.R. (1995 a, chapter 3.8) Detailed observations of suckling behaviour of a Grey seal (Halichoerus grypus) at Harder-wijk Marine Mammal Park. Int. Zoo Yearbook 34, 186-200.
Kastelein, R.A., Staal, C. and Wiepkema, P.R. (1995 b, chapter 3.11) Fishing technique development in a newly weaned Grey seal (Halichoerus grypus). In: Sensory systems of aquatic mammals (Eds. Kastelein, R.A., Thomas, J.A. and Nachtigall, P.E.). De Spil Publishers, Woerden, The Netherlands, 515- 528.
Kastelein, R.A., Staal, C , Nieuwstraten, S.H. and Wiepkema, P.R. (1998, chapter 3.9) The relationship between suckling time and body weight increase in a grey seal (Halichoerus grypus) pup.
Kovacs, K.M. (1987) Maternal behaviour and early behavioural ontogeny of grey seals (Halichoerus grypus) on the Isle of May, UK. J. Zool. London, 213, 697-715.
Nord0y, E.S. and Blix, A.S. (1985) Energy sources in fasting grey seal pups evaluated with computed tomography. Am. Jour, of Physiol. 249, R471-476.
Nord0y, E.S., Ingebretsen, O.C. and Blix, A.S. (1990) Depressed metabolism and low protein catabolism in fasting grey seal pups. Acta Physiol. Scand., 139, 361-369.
Oftedal, O.T., Boness, D.J. and Tedman, R.A. (1987) The behaviour, physiology, and anatomy of lactation in the pinnipedia. In: Current Mammalogy. Vol. 1. (Ed. Genoways, H.H.). Plenum Publishing Corp., 175-245.
Piatt, N.E., Prime, J.H. and Witthames, S.R. (1975) The age of the grey seal at the Fame Islands. Trans. Nat. Hist. Soc. Northumb., 41(4), 99-106.
Seely, A.J. and Ronald, K. (1991) Testosterone profiles in male grey seals (Halichoerus grypus). Aquatic mammals 17(3), 152-155.
Siegel, S. (1956) Non-parametric statistics. McGraw-Hill, New York.
441

R.A. Kastelein et al.
Spotte, S. and Stake, P.E. (1982) Hand-rearing of twin Gray seals (Halichoerus grypus) from birth to weaning. Mar. Ecol. Prog. Ser. 9, 181-189.
Wartzok, D. (1991) Physiology of behaviour in pinnipeds. In: Behaviour of pinnipeds (Ed. Renouf, D.). Chapman and Hall Ltd, London, 236-299.
Summers, C.F., Burton, R.W. and Anderson, S.S. (1975) Grey seal (Halichoerus grypus) pup production at North Rona: A study of birth and survival statistics collected in 1972. J. Zool. London, 175, 439-451.
Worthy, G.A.J, and Lavigne, D.M. (1987) Mass loss, metabolic rate, and energy utilization by Harp and Gray seal pups during the postweaning fast. Physiol. Zool. 60(3), 352-364.
442

Chapter 3.11
Fishing technique development in a newly weaned Grey seal (Halichoerus grypus)
Ronald A. Kastelein1, Carolien Staal1 and Piet R. Wiepkema2
1 Harderwijk Marine Mammal Park, Strandboulevard-oost 1,3841AB Harderwijk, The Netherlands
2 Ethology Section, Department of Animal Husbandry, Agricultural University, P.O. Box 338, 6700 AH Wageningen, The Netherlands
Summary
A Grey seal pup born at Harderwijk Marine Mammal Park was to be released in the Dutch Waddensea, and was habituated to capturing live fish as part of the release programme. Although the pup was kept in an unnatural environment, its fish hunting and capture techniques were studied to obtain insight into fishing technique development. To trigger its hunting behaviour, 14 live freshwater fish were given to the pup one at a time, between 8 and 12 days after weaning. This behaviour was recorded on video from above the pool. Frame by frame analysis showed that the number of times each fish was captured and released gradually decreased. During the study period, the average time the fish was kept in the pup's mouth increased. Captures occurred significantly more often in the corners of the pool than in the other parts of the pool. The fish were sometimes grabbed by the tail, more often by the body, and most often by their head. During the study period, the proportion of head attacks increased, the number of 90 degree attacks slightly decreased, while the number of 45 degree approaches slightly increased. Over time the pup got quicker at killing the fish. Usually only the front quarter of most fish was swallowed, but the proportion of fish swallowed increased progressively. Although the environment was not what Grey seal pups typically experience in the wild, the study shows that newly weaned Grey seals learn quickly. This is very important because the abrupt transition from suckling to capturing and consuming live fish is essential for survival of Grey seal pups.
Key words: Pinniped, suckling, neonate, pups, predation, catch, cognition
Introduction sition to solid food (Coulson and Hickling, 1964; Anderson et al., 1979; Baker, 1984 and
Many Grey seal pups die during their first 1988; Addison and Stobo, 1993). The Grey year(Davies, 1949; King, 1964). Death can be seal's suckling period has been studied in linked to difficult parturition, congenital ab- detail (Kastelein and Wiepkema, 1988 and normalities, diseases, accidents (falling in 1990; Kastelein et al., 1991 and 1995), but holes in rocks, being swept off the beach by little is known about the post weaning peri-waves, trauma), injuries caused by conspe- od. After weaning the pups have to fend for cifics, organochlorine contamination, re- themselves and receive no parental care. The duced milk uptake due to, for instance, a transition period from milk to solid food is failing of the mother-pup bond, or the tran- difficult and weaned pups suffer substantial
Sensory Systems of Aquatic Mammals (1995) R.A. Kastelein, J.A. Thomas and P.E. Nachtigall (editors) De Spil Publishers, Woerden, The Netherlands ISBN 90-72743-05-9
443

R.A. Kastelein et al.
weight loss (Addison and Stobo, 1993). Learning to hunt and capture prey has not been studied.
A Grey seal pup born at Harderwijk Marine Animal Park was to be released in the Dutch Waddensea, and was habituated to capturing live fish as part of the release programme. Although the pup was kept in an unnatural environment, its fish hunting and capture techniques were studied to obtain insight into fishing technique development in Grey seals.
Materials and methods
Study animal A male Grey seal pup (HgZH013) was born on 18 January 1993. Its father (HgZH002), estimated to have been born in 1972, was found stranded on the Belgian coast in May 1978, and sent to Harderwijk. Its mother (HgZHOOl), born in September 1973, was also stranded on Belgian coast in November 1973 and sent to Harderwijk.
The pup had been nursed in an indoor room for 18 days. Details of the suckling period are described by Kastelein et al. (in prep. 2). After weaning, the mother was transported to an outdoor pool. The pup remained in the indoor room, so that its food intake could be monitored.
Study area The rectangular tiled indoor room consisted of an upper part (2.2 x 2.9 m), linked by 3 steps to a lower part (1.0 x 2.9 m). After the suckling period, the lower part was filled with 30 cm of fresh water from 09.00 to 17.00 hours each day. One step was submerged (Fig. 1). At night the room was kept dry. The water temperature varied slightly and was on average 11.2 °C. The average air temperature was 15 °C. Windows in the ceiling
allowed some daylight to enter the room, but it was also artificially lit 24 hours a day. A camera, that was mounted directly over the lower part and which was connected to a video recorder, made it possible to watch and listen to the pup from a nearby observation room, which was manned 8 hours a day.
Feeding After weaning, the pup spent 8 daytime hours in the water. Experience with previous pups had shown that the transition to solid food was accelerated when pups were allowed to start eating fish voluntarily (Kastelein et ah, 1994 and in prep.), so the pup was not force-fed. Because previous pups had not been interested in fish during the first week after weaning, thawed Herring (Clupea harengus) was offered for the first time seven days after weaning. The pup played with it, but did not eat it. To trigger its hunting behaviour, 14 live freshwater fish (Roach, Rutilus rutilus, 15 to 25 cm long; 30 to 60 g) were given to the pup one at a time, between 8 and 12 days after weaning. Before a fish was put in the pool, any remains of previous fish were removed, and the video recorder was started so the pup 's immediate hunting behaviour could be filmed. During filming no observers were present in the room, except during the session with fish no. 12. After the 14 live fish, thawed Herring were offered each day, but it was not until 5 days later that the pup started to consume parts of them. The pup lost weight until 21 days after weaning, at which point in time he had eaten Herring for 4 days.
Analyses Recordings were played back on a digital video player, allowing frame by frame analysis; each frame represented 0.04 sec. The tiles on the floor of the pool served as a grid to calculate distances. The following para-
444

Grey seal fishing technique development
Figure 1. The 28-day-old male Grey seal pup catching a fish by the head. The arrow indicates the shallower part of the pool (Photo: Ron Kastelein).
meters were analysed: - Time between introduction of a live fish
and the first reaction of the pup to it. - Number of captures until the fish died. - How the fish was freed:
* Released by the pup, * The fish escaped from the pup 's mouth; * This was not visible due to the position
of the pup 's head relative to the camera. - Time the fish was held in the pup 's
mouth. - Location in the pool where the fish was
captured. - For each capture, the part of the fish
seized (head, body or tail) - Swimming speed of the fish during the
last second before capture. - Swimming speed of the pup during the
last second before capturing a fish. For each attack, the angle of the pup 's head relative to the body axis of the fish (divided in 5 categories: 0 (0 - 22°), 45 (23-67°), 90 (68 -112°), 135 (113 -157°) and 180 (158 - 180°) degrees, Fig. 2). Time between introduction and death of the fish. Proportion of the fish swallowed (divided in 5 categories: 0, Vi, Vi, % and whole). Time between death of the fish and it being swallowed by the pup. Maximum swimming speed of the fish during each session. Maximum swimming speed of the pup during each session. Total distance swum by the fish between introduction and death.
445

R.A. Kastelein et al.
Figure 2. A schematic drawing showing the angle (a) between the Grey seal pup's head and the fish.
Results
First reaction The pup saw the fish between 1 and 90 seconds after introduction into the pool. No trend was seen in the detection time during the study.
Number of captures The number of times each fish was captured and released gradually decreased from 34 for fish no. 1 to 12 for fish no. 14 (Fig. 3).
In most cases (78%), the fish was released by the pup. In the other cases, the fish escaped from the pup 's mouth. No trend was seen in the number of releases or escapes during the study period.
Time in mouth On average, the fish were in the pup 's mouth for 16 sec after a capture. During the study period, the average time the fish was kept in the pup 's mouth per capture increased from 8 sec in fish no. 1 to 19 sec in fish no. 14 (Fig. 4).
Figure 5 shows that the longer the fish was held in the mouth, the lower the number of
captures per fish (r = -0.69).
Capture location The fish mainly swam near the perimeter of the pool. Captures occured significantly more often in the corners of the pool than in the other parts of the pool (X2 = 24, p < 0.001; Fig. 6). Captures occurred significantly more often in the shallow areas of the pool than in the deeper areas of the pool (X2 = 24.50, p < 0.001).
Part of fish seized Fish were sometimes grabbed by the tail (on average 9% of all captures of all 14 fish), more often by the body (24%), and most often by the head (67%). During the study period the proportion of head attacks increased from 45% in fish no. 1 to 75% in fish no. 14 (Fig. 7).
Swimming speeds during capture The swimming speeds of both pup and fish were low during the last second before a capture (Fig. 8). However, on average over all captures, the swimming speed of the pup (0.14 m / s ) was faster than that of the fish (0.11 m / s ) , a requirement for capture. The high average swimming speed during capture of fish no. 11 was due to the early death of this fish. In other fish, exhaustion reduced the average swimming speed eventually.
The average and maximum swimming speeds of the fish were not correlated to the total distance swum between introduction and death. Figure 9 indicates that when fish survival time increased, total distance swum also increased (r = 0.85).
Angle of attack On average the pup attacked the fish head-on in 3% of the cases, at the angle interval of 45 degrees in 29% of the cases, at the 90 degrees interval in 49% of the cases, at the
446

Grey seal fishing technique development
v» IB £ O s "5 s i o u "5 0
E 3 Z
50 -I
45 40 •
35 30 <
25 •
20 •
15 -10 <
5 •
1 2 3 4 5 6 7 8 9 10 11 12 13 14 Successive fish
1 1 1 1 3 3 3 3 4 4 4 4 5 5 Time (day)
Figure 3. The number of times each fish was captured between introduction to the pool and death. During a 5-day period 14 fish were offered.
A
e
I o o &
% o E c e E v e 5 > <
30 i 28 •
26-24-22 • 20-18 • 16 • 14 • 12 •
10-8 •
6 • 4 •
2 • 0<
1 2 3 4 5 6 7 8 9 10 11 12 13 14 Successive fish
Figure 4. The average time per capture that each fish was kept in the pup's mouth.
447

R.A. Kastelein et al.
35
30 •
• 25
I I 2 0 o o
E 3
15
10
5 10 15 20 25 30 Average time in mouth per capture (sec)
Figure 5. Correlation between the average time the fish was in the mouth per capture and the number of times each fish was captured between its introduction to the pool and death (linear regression: y = - 1.06 x + 33.9; r = - 0.69).
Top view Side view
130 cm
E ^ 2%
10%
I I I I
r
M 2%
j5%
EM 3%
7%
290 cm 30 cm
Figure 6. An overview of the study area, divided into 12 sections by an imaginary grid. The shaded area is the shallow (15 cm deep) part. In each section, the percentage of attacks on live fish is indicated by the columns.
448

Grey seal fishing technique development
U
I "5
1 2 3 4 5 6 7 8 9
Figure 7. The proportion of attacks on the head, body and tail for each fish.
10 11 12 13 14 Successive fish
10 11 12 13 14 Successive fish
Figure 8. The average swimming speeds of both pup and fish during the last second before capture. * The fish died soon and had no chance to become tired and thus slow down.
449

R.A. Kastelein et al.
* • »
E C
> A E
9 O C
2 •o
I • -
220-1
200 •
180 •
160-
140-
120<
100 <
80 •
60 • 4 0 .
20-
at 90° angle
0 5 10 15 20 25 30 35 40 Fish's survival time (min)
Figure 9. Correlation between the time the fish was alive and the total distance swam by the fish (linear regression: y= 5.16 x + 1.53; r = 0.85).
100
90
80
70
60
50
40
30
20
10
0
u
i "5
at 45s angle
i i i i i i i
1 2 3 4 5 6 7 8 9 10 11 12 13 14 Successive fish
Figure 10. The proportions of 90 degree and 45 degree angle attacks for each fish.
450

Grey seal fishing technique development
40
35
30 •?
I25
e > 20 -o
I'M 10 « 5 •
T "
2 3 4 5 8 9 —i—
10 1 2 3 4 5 6
Figure 11. The time between the fish's introduction and death. * The pup was slow
11 12 13 14 Successive fish
135 degrees interval in 18% of the cases, and from behind in 1% of the cases. During the study, the number of 90 degree attacks slightly decreased, while the number of 45 degree approaches slightly increased (Fig. 10). The fish mainly swam about 10 cm away from the pool walls, making head-on and tail attacks difficult for the pup.
Time of death and time of being swallowed During the study the pup got quicker at killing the fish (Fig. 11), and the time between fish death and swallowing decreased sharply from 14 min. in fish no. 1 to zero in fish no. 14. This last fish was swallowed alive (Fig. 12).
Proportion of fish swallowed Usually only the front quarter of the fish was swallowed (Fig. 13), the rest remained on the pool floor and was removed 2 hours later. During the study, the proportion of the fish swallowed increased. The pup did not swal
low fish no. 12 perhaps because he was distracted by people next to the study room. The dead fish therefore remained in the water for too long to remain fresh, and was removed with a net.
Maximum swimming speed of fish and pup Fish no. 1 was the fastest swimmer, reaching 3.4 m / s (Fig. 14). On average (over all trials) the maximum swimming speed of the fish was around 2.2 m / s . The pup's average maximum swimming speed was much slower (0.9 m / s ) , but reached 1.5 m / s while hunting fish no. 5.
Discussion and conclusions
Signs of learning The present study suggests that the pup learned to bite the fish more successfully, because the number of captures per fish decreased over time and the fish died faster. The increase of bites in the head over time
451

R.A. Kastelein et al.
I l
11 12 13 14 Successive fish
Figure 12. The time between death and being swallowed for each fish.
suggests that the pup learned that this was a good strategy for capture and immobilization. During the development of fishing technique, the fish was held in the pup's mouth for longer after each capture. Perhaps the pup became used to the touch and taste of the fish. This is also shown by the decrease in the time between the death of the fish and it being swallowed. The pup's familiarization with fish (Curio, 1976) and his "taste" for it increased, as did his hunger level, as the last suckling session was 8 days before the start and 12 days before the end of the present study. During the 5 day study his total food consumption was about 5 whole fish which constituted about 225 g. This small amount indicates that during the study his appetite was probably never fulfilled, because during the suckling period he
consumed about 350 g of milk during each of around 7 suckling sessions a day (Kastelein et al, in prep. 1).
The angle of attack was usually within the range of 23 -112 degrees, and rarely head- on or from behind. This was perhaps because the fish swum along the sides of the pool, and there was not enough space for 0 and 180 degree attacks. However, the increase in the number of attacks between 23 - 67 degrees, suggests that this is an efficient approach. In this case the fish is swimming towards the pup's mouth. Most pinnipeds swallow fish head first to protect the oesophagus from damage by the fish's spines. When hunting in a school of fish, seals probably have to swallow their prey immediately after capture to catch more fish before the
452

Grey seal fishing technique development
1 n
0.75 -
o o
o c o =E o Q. O
0.5
& 0.25 •
- r 6
i i
12 13 14 Successive fish
Figure 13. The part of each fish that was swallowed. * The fish was killed, but probably not swallowed because the pup was distracted by people in the study area.
school has escaped. In the present study, most fish were caught in the corners of the pool, especially in the shallow part, where there was no vertical escape route for the fish. Whether the pup became aware of this smaller escape possibility and deliberately attacked the fish in the corners, or merely had more success with corner attacks by ac-cidently cornering the fish was not clear.
Ecological significance Most iceborn Grey seal pups do not enter the water before they have completely moulted (Curry-Lindahl, 1970), and pups on the Fame Islands, U.K., stay on land for on average 32 days before going to sea (Coulson and Hickling, 1964). The pup in the present study had completed its moult 17 days after
birth, and the first live fish was offered 26 days after birth (8 days after weaning). This means that the pup was confronted with live prey at around the same age as his wild conspecifics.
Although the environment in the present study was far from what Grey seal pups experience in the wild (for example, a small and shallow pool, fresh and clear water and fresh water fish), the study shows that newly weaned Grey seals can learn quickly. This is very important because the abrupt transition from suckling to capturing and consuming live fish is difficult for Grey seal pups. Whereas many otariid pups gain energy from suckling for over a year, usually until the next pup is born, phocids often lack pa-
453

R.A. Kastelein et al.
4 i
3 • E
3 I2.5H c £ 2i £ * 1.5
O
2 0.5-
i i i i i i
1 2 3 4 5 6 7 8 9 10 11 12 13 14 Successive fish
Figure 14. The maximum swimming speed recorded for both fish and pup during each session.
rental care after the short suckling period. During the post-weaning period, phocid pups lack the protection and guidance of mothers and have to fend for themselves. Fouraging in Grey seal pups is not immediately successful, which is reflected in their decrease in body weight (Addison and Sto-bo, 1993). During the post-weaning fast depression of basal metabolic rate and extensive blubber catabolism enable the Grey seal pups to endure the prolonged fasting without signs of discomfort or stress (Worthy and Lavigne, 1987; Nordoy et al, 1990), but survival of pups depends on their having developed the ability to catch food successfully before stored resources are exhausted.
Bo wen (1991) reports that in all phocid species for which data are available, pups feed on slow moving prey, such as small pelagic crustaceans, until they have fully developed their locomotor skills. Because their orga-
nochlorine residue burden remains fairly constant until the end of the first year, Addison and Stobo (1993) conclude that Grey seal pups feed at a low trophic level. The pup in the present study did not kill and swallow fish quickly, but played with them. Possibly this play with injured (slow) fish allowed the pup to practise hunting skills, without a large chance of loosing his prey. Maybe this learning strategy is also followed in the wild.
Soon after weaning, Grey seal pups in oceanaria and in the wild engage in self- or object-oriented play, possibly to develop lo-comotory and fishing skills (Kovacs, 1987; Kastelein, pers. obs.). They probably learn to dive early on. Bowen (1991) describes 8 to 10-week-old Grey seal pups which drowned in fishing gear at depths of 60 to 120 m. It is unknown when Grey seal pups in the wild start to eat fish. Bowen (1991) suggests that
454

Grey seal fishing technique development
the duration of the post-weaning fast depends on the availability of appropriate food, the ability of pups to capture it, the amount of energy stored during suckling, the amount of energy expended on thermoregulation depending on the ambient temperature and on the pups' activity level.
Few observations of wild seal foraging have been made. Hobson (1966) noticed that most seals and sea lions approach their prey from below. Such a manoeuvre is advantageous for the predator, not only because its prey is viewed against the lighter water surface, but also because the predator is less readily seen in the darker water below. Even at night, the light of the moon and stars create a contrast in light levels. Because pinnipeds have better low-light vision than humans (Walls, 1963; Schusterman, 1972), they may be able to hunt from below even in very dark conditions which not only occur when skies are cloudy, but also in deep water. An attack from below also reduces the vertical escape route of the fish, because the water surface acts as a barrier to fish. In the present study the water was too shallow for the seal to grasp the fish from below. However, the pup probably used vision to locate and approach the fish and mechanoreception with its vi-brissae during the last phase of the attack (Renouf, 1989).
Acknowledgements
We thank Wim Zoetebier for technical assistance. Saskia Nieuwstraten, Hendrik Jan Groeneveld, Sabrina Labberte, Gabrielle Brouwer and Janny Hardeman assisted with behavioral observations. We thank Rob Triesscheijn for making the drawings and Frank Zeiss, Charmaine van der Elst, Saskia Nieuwstraten, Jeanette Thomas, Paul Nach-tigall and Nancy Vaughan for their comments on the manuscript.
References
Addison, R.F. and Stobo, W.T. (1993) Orga-nochlorine residue concentrations and burdens in grey seal (Halichoerus grypus) blubber during the first year of life. J. Zool., Lond. 230, 443-450.
Anderson, S.S., Baker, J.R., Prime, J.H. and Baird, A. (1979) Mortality in Grey seal pups: incidence and causes. J. Zool., Lond. 189, 407-417.
Baker, J.R. (1984) Mortality and morbidity in Grey seal pups (Halichoerus grypus). Studies on its causes, effects of the environment, the nature and sources of infectious agents and the immunological status of pups. J. Zool. Lond., 203, 23-48.
Baker, J.R. (1988) Further studies on Grey seal (Halichoerus grypus) pup mortality on North Rona. Br. vet. J. 144, 497-506
Bowen, W.D. (1991) Behavioural ecology of pinniped neonates. In: Behaviour of pinnipeds. (Ed. D. Renouf). Chapman and Hall, London, 66-117.
Coulson, J.C. and Hickling, G. (1964) The breeding biology of the Grey seal (Halichoerus gryphus) on the Fame Islands. J. Anim. Ecol., 33, 485-512.
Curio, E. (1976) The Ethology of predation, Berlin: Springer-Verlag, 103-107.
Curry-Lindahl, K. (1970) Breeding biology of the Baltic Grey seal (Halichoerus grypus). Der Zool. Garten, 38 (1/2), 16-29.
Davies, J.L. (1949) Observations on the Grey seal (Halichoerus grypus) at Ramsey Island, Pembrokeshire. Proc. Zool. Soc. Lond. 119, 673-692.
455

R.A. Kastelein et al.
Hobson, E.S. (1966) Visual orientation and feeding in seals and sea lions. Nature, 210 (5033), 326-327.
Kastelein, R.A. and Wiepkema, P.R. (1988) Case study of the neonatal period of a Grey seal pup (Halichoerus grypus) in captivity. Aquatic Mammals, 14(1), 33-38.
Kastelein, R.A. and Wiepkema, P.R. (1990) The suckling period of a Grey seal (Halichoerus grypus) while confined to an outdoor land area. Aquatic Mammals 16(3), 120-128.
Kastelein, R.A., Wiepkema, P.R. and Vaugh-an, N. (1991) The suckling period of a Grey seal (Halichoerus grypus) while the mother had access to a pool. Aquatic Mammals 17 (1), 42-51.
Kastelein, R.A., Wiepkema, P.R., Berghout, E. and Groenenberg, H.J. (1994) Effective mass transfer in a suckling Grey seal (Halichoerus grypus). Aquatic Mammals 20(1), 11-27.
Kastelein, R.A., Groenenberg, H.J. and Wiepkema, P.R. (1995) Detailed observations of suckling parameters of a Grey seal (Halichoerus grypus). Int. Zoo. Yearb. 34.
Kastelein, R.A., Nieuwstraten, S.H. and Wiepkema, P.R. The relationship between suckling time and weight increase in a Grey seal (Halichoerus grypus) (in prep. 1).
Kastelein, R.A., Nieuwstraten, S.H., and Wiepkema, P.R.. Weight changes in a Grey seal (Halichoerus grypus) pup before and after weaning (in prep. 2).
King, J.E. (1983) Seals of the world. Oxford Univ. Press.
Kovacs, K.M. (1987) Maternal behaviour
and early behavioural ontogeny of grey seals (Halichoerus grypus) on the Isle of May, U.K. J. Zool., London, 213, 697-715.
Nordoy, E.S., Ingebretsen, O.C. and Blix, A.S. (1990) Depressed metabolism and low protein catabolism in fasting grey seal pups. Acta Physiol. Scand., 139, 361-369.
Renouf, D. (1989) Sensory function in the harbour seal. Sci. Am. 260, 90-95.
Schusterman, R.J. (1972) Visual acuity in pinnipeds. In: Behaviour of marine animals (Eds. Winn, H.E. and Olla, B.L.), Plenum Publishing Corporation, New York, 469-492.
Walls, G.L. (1963) The vertebrate eye. Hafn-er Publishing Co. New York. Chapter 11, 368-451.
Worthy, G.A.J, and Lavigne, D.M. (1987) Mass loss, metabolic rate, and energy utilization by Harp and Gray seal pups during the postweaning fast. Physiol Zool. 60(3), 352-364.
456

Chapter 4
Otariids (sea lions)
457

Chapter 4.1
qualic Mammals 1990, 15.4, 137-144
The food consumption of Steller sea lions {Eumetopias jubatus)
R. A. Kastelein, N. Vaughan and P. R. Wiepkema*
Zeedierenpark Harderwijk (Harderwijk Marine Mammal Park), Strandboulevard-oost 1,3841AB Harderwijk, Holland * Ethology Section, Department of Animal Husbandry, Agricultural University, P.O. Box, 6700 AH Wageningen, Holland
Summary
The food consumption of one male and two female Steller sea lions and their eight offspring at the Harderwijk Marine Mammal Park was measured during several successive years. Food intake changes due to age, sex, time of year, reproductive stage and individuality of each animal are described, and compared to data from field studies.
Introduction
Several authors have studied the stomach contents of Steller sea lions in the wild (Evermann, 1921; Imler and Sarber, 1947; Wilke and Kenyon, 1952; Thorsteinson and Lensink, 1962; Mathisen et a!., 1962; Fiscuss and Baines, 1966; Pitcher, 1981 and Lowry et ai, 1982). Through this research, information about the species taken as prey by Steller sea lions, and the proportions in which they are eaten, has become available. The research showed regional, seasonal and historical changes in the diet of Steller sea lions. Still, very little is known about the amount of food consumed per day, or about the fluctuations or variations in food intake due to the time of year, the female reproductive cycle, or due to the age, sex, or individuality of an animal. Such data can be partially derived from food records of animals kept in marine mammal facilities. Studies on certain parameters influencing the food intake have already been carried out on a few sea lion species, for example by Schusterman and Gentry (1971), who suggested that a cyclic weight change in adult California sea lions (Zalophus californianus) might be hormone-dependent.
Only a few parks keep Steller sea lions because they are much more aggressive than most other sea lion species. However, the Harderwijk Park has had experience in keeping Steller sea lions since 1972. The amount of food offered per day is always determined by how much food the individual animals accept. Therefore, any changes in daily food intake are mainly determined by endogenous factors that regulate the individual's satiety. This paper is concerned with the food consumption of one male and two female Steller sea lions and their offspring during
several successive years. The results may be useful for other marine mammal parks which keep or consider keeping Steller sea lions, for energetic studies, or for the evaluation of the impact of this species on certain fish populations.
Materials and Methods
Study animals The age and sex of 10 Steller sea lions (Eumetopias jubatus) have been given in Table 1. The food consumption of the 3 adult animals will be analysed in more detail.
Study area The animals are kept in an outdoor freshwater pool (28 m x 5 m x 2 m deep). Since 1972, the water temperature has varied between about 0°C and + 14°C, while air temperature varied between approximately - 15°C and +35°C. The Harderwijk Park is located at 5°37' East longitude and 52°20' North latitude.
Feeding The Steller sea lions are fed 3 to 6 times per day on a mixed diet of on average 22% Mackerel {Scomber scombrus), 40% Herring (Clupea harengus), 10% Sprat (Sprattus sprattus), 14% Whiting (Merlangius merlangus), and 14% Squid (Illex spp.), based on weight. Vitamins are added to this diet. During the first or last feed of the day the sea lions are given as much as they want to eat. Feeding is stopped as soon as an animal starts to play with its food instead of consuming it immediately. This is considered a sign of satiety. Since 1972, records have been kept of the amount and type of food consumed by each individual during each feed. For the present analysis daily food intake is used as the basic measurement.
To assess the maximum stomach capacity of the animals in the present study, they were kept without food for one day on January 2,1989 (a month during which the animals eat more than in other months of the year). The next day they were offered as much food as they wanted during the first feeding.
459

R.A. Kastelein et al.
Table 1. The 11 study animals (Eumetopias jubatus) and their affinity
Code
EjZHOOl EJZH002 EJZH003 EJZH004 EJZH005 EJZH006 EJZH007 EJZH008 EJZH009 EjZHOlO EjZHOll
Sex
M F F M F M F M F F M
Date of birth
00-04-1972 00-04-1972 00-04-1972 26-06-1979 17-09-1980 12-07-1981 15-06-1983 31-05-1984 11-06-1985 11-06-1986 09-06-1987
Code father
wild wild wild
EjZHOOl EjZHOOl EjZHOOl EjZHOOl EjZHOOl EjZHOOl EjZHOOl EjZHOOl
Code mother
wild wild wild
EJZH003 EJZH002 EJZH003 EJZH003 EJZH003 EJZH003 EJZH003 EJZH003
Results Age related changes and sexual differences For the last 15 years, the total annual food consumptions of one male and 2 females are compared in Figure 1. Because Steller sea lions usually suckle for about 6 months, age 1 in the figure represents the first calendar year after the year of birth. The male's food intake increased steadily until his 16th year. Both females' food consumption increased until their 7th year. Female 002 gave birth to two pups (during her 8th and 16th year). After her first year with a birth, her food intake, which until then had been almost the same as that of female 003, dropped 35% and became very constant. In the second year with a birth her food intake increased 37%. After her 7th year the food intake of female 003 dropped only 10%, except for her 10th year, a year during which she did not give birth. That year her food intake dropped 35% and reached the level of that of female 002 between her 10th and 15th year (years in which she was not pregnant or lactating). This large drop is probably partly caused by environmental factors, since the food intake of the male also dropped much during the same year. The food intake of female 003 did not drop during her 16th year, a year during which she was not pregnant, but was still suckling her previous year's pup-
Table 2 shows the average daily food intake during the first 5 years of all the available animals. The males generally eat more than the females, but there are marked differences in average daily food consumption between individual animals of the same age in both sexes. At age 1 the males consumed almost as much food as the females did. The following 4 years the males consumed more than the females.
Seasonal changes The food consumption record of male 001 can be divided into 3 periods. During the first 3 years of his life he showed a rather constant monthly food intake
(Fig. 2A). It increased steadily throughout the year as the animal grew, without marked fluctuations. Between his 4th and 7th year the monthly food intake started to fluctuate, but still no specific pattern was apparent (Fig. 2B). The increase in food intake due to growth still dominated the monthly intake pattern. From his 8th year onwards the animal developed a distinct annual cycle in food intake. The deviation (%) of the average monthly food intake over 8 years shows that he consumed less than average between April and September and more than average between November and March (Fig. 2C). The extreme reduction in food intake between May and July coincides with an increase in aggression towards both conspecifics and man.
Female 003 seems to have gone through 2 phases in her food intake. During the first 10 years of her life (Fig. 3A) it did not change according to a regular monthly pattern, but the food intake during each of the first 5 years increased as she grew. From her 11th year onwards she developed a distinct annual cycle in her food intake. The deviation (%) of the average monthly food intake over 5 years shows that the animal always consumed less than average between February and June and more than average between July and December (Fig. 3B).
During her first 10 years, female 002 also showed no monthly pattern in her food intake. This intake steadily increased over the months of the first 5 years as she grew. Later in life, between age 11 and 15 (the same 5 years as shown for female 003 in Figure 3B) the deviation (%) of the average monthly food intake shows a considerably less pronounced annual cycle than that of female 003 (Fig. 4B).
Perinatal changes In the last 5 days before birth, the pregnant females reduced their intake significantly and almost always fasted for at least one day (Fig. 5). However, reductions in average daily food intake also occurred at
460

The food consumption of Steller sea lions
8000 a >> o> J£
0 4P4
a E j in c o o •D o o (0 3 C
7000 •
6000 •
5000 •
4000 -
3000 •
2000 •
1000 •
Male 001
11 13 15 Age (year)
ra a>
£ 6000
T 5000 a 4000
| 3000-1 o ^2000 o •2 1000 w 2 o c <
Female 002
9 11 13 15 Age (year)
S 6000
2 5000-
4000 -
3000-
2000
1000 H
0
Female 003
11 13 15 Age (year)
Figure 1. The annual food intake of one male and two female Steller sea lions. A triangle indicates a year during which birth took place. Age 1 represents the first calendar year after the year of birth.
random throughout the year. They cannot always be related to events such as birth or illness with certainty.
Stomach capacity The maximum food intake, after a day of fasting, is shown in Figure 6. In both sexes, older animals seem to have relative large stomach capacities.
Discussion and Conclusions
Age related changes and sexual differences Some differences in food intake between animals of the same age, when expressed as kg per day, may be partially due to changes in diet composition. Different species of fish can have a different energy content per unit of weight, and 2 fish of the same species can also show a difference in nutritional or calorific value depending on the season and geographical area in which the fish was caught. The diet of Steller sea lions in the wild is not limited to a few prey species. They eat a variety of prey, including relatively shallow water fish (less than 180 m), squid, shellfish and crustaceans, depending on the geographical area and the availability (Mathisen et al, 1962; Fiscus and Baines, 1966).
Unfortunately the weight changes of the animals in this study could not be recorded, because the Steller sea lions' aggressive behaviour makes them difficult to weigh. Fiscus (1961) reported on the total body length and girth measurements (behind the fore flippers) of Steller sea lions taken in Alaska. Bryden (1972) derived growth curves of male and female Steller sea lions by using only the standard length given by Fiscus (1961). These growth curves can be improved by also taking the girth into account. By calculating the surface area of the cross section at the place where the girth was measured and by multiplying this with the body length, a relative volume scale (which corresponds approximately to a relative weight scale) can be derived from these data. Data on the average weight of adult males and females (Calkins and Pitcher, 1982) were included to make this calculated weight scale more realistic (Fig. 7). Although the study was done on only a few specimens, the data show that the males continue to grow steadily up to the age of 12 years. Thorsteinson and Lensink (1962) studied Steller sea lions in Alaska and found that males are sexually mature when 6 or 7 years old, but that they are physically unable to compete successfully for harems until they are approximately 10 years old. Males older than 12 years probably have problems defending their territories because their canine teeth begin to wear out. So in the wild, male Steller sea lions are probably sexually active for only a few years. Between the ages of 4 and 7 the monthly food intake of the male in the
461

R.A. Kastelein et al.
Table 2. The range of average daily food consumption (taken over one year) of a number of Steller sea lions of certain ages. N = the number of animals recorded
Age (yr)
Range average food consumption males
(kg/day)
Range average food consumption females
(kg/day)
4.3-5.8 5.8-10.4
10.7-12.2 12.6-12.8
12.9
4.0-5.8 6.7-7.4 8.1-9.1 8.7-11.3 9.7-11.1
present study started to fluctuate. This corresponds with the age of maturation observed in the field.
Figure 7 shows a large difference in calculated body weight between males and females. The sexual difference in food intake of the present study (Fig. 1) corresponds well with this sexual dimorphism. Although no data is available on the females' weight from their 2nd to their 8th year, it can be said that they stop increasing in weight around their 9th year at the latest (Fig. 7). Spalding (1964) noted no further increase in female body length after their 8th year. Comparison of the food intake of the non-reproducing female 002 with that of the lactating and pregnant female 003 between their 10th and 15th years of age shows a difference in annual food intake of approximately 1000 kg. The annual food consumption of female 003 dropped about 1000 kg during her 10th year when she did not give birth and was not lactating. Her food intake did not drop during her 16th year of age, when she was not pregnant. However, her last pup, although readily consuming whole fish, was still suckling strongly, which he continued to do for eighteen months after he was born. Although based on food records of only two females, it seems clear that reproduction requires an annual food consumption increase of approximately 30%. Keyes (1968) suggested that captive, adult, nonpregnant, non-lactating Steller sea lions require 1.6-3 % of their body weight in food per day, and that growing, pregnant, or lactating sea lions require more food. The present study shows that one cannot generalize between sexes, that only growing females require more food than non-reproducing adult females, and confirms and quantifies an increase in food consumption during pregnancy and lactation in a particular environment.
Seasonal changes The seasonal reduction in food intake of the adult male (EJZH001) coincides with the breeding season, which is between the end of May and the end of July (Mathisen 1962; Pitcher & Calkins, 1981; and Schuslcrman, 1981). Territorial male Steller sea
lions do not leave their territory during the breeding season, in contrast to the females who periodically leave the rookeries and go to sea (Orr & Poulter, 1967). Olesiuk (1987) showed that the male Steller sea lions start to fluctuate in weight during the year when they become sexually mature. He reported an average weight of 750 kg for a number of adult males which were weighed between March and April. The average weight of a number of adult males from the same colony was 493 kg when weighed between October and November, after the breeding season. The food intake of the male in the present study started to fluctuate between his 4th and 7th year, when he became sexually mature. The resulting changes in body weight can only be confirmed by qualitative observation and not by quantitative measurements because the animal could not be weighed. The storage of fat in males seems to have a clear advantage. The longer a male Steller sea lion can go without food to hold his territory, the more females he can impregnate, and the more offspring he can produce. The reduction in food intake in the male Steller sea lion in the present study is associated with an increase in aggressive behaviour. Because the present study shows that the changes in food intake are independent of food availability, and coincide with an increase of aggressive behaviour, it seems likely that this seasonal food intake fluctuation is controlled by an endogenous rhythm in which testosterone is involved.
A similar monthly fluctuation in male food intake and resulting weight changes has been described in two other species of sea lions. Spotte and Adams (1979) report on the food intake and weight change of two 7-year-old male Northern fur seals (Callorhinus ursinus) in human care. They show a reduced food intake during the summer; between M ay and October. This corresponds to breeding activity in the territories between May and August. In the wild, the malesof this species ordinarily fast, and show a visible weight loss during this period. Rand (1959) observed an increase in body weight in South African fur seals (Arctocephalus puxillux) before the breeding season
462

The food consumption of Steller sea lions
20
10
Male 001 A. age 1-3
1 2 3 4 5 6 7 8 9 • 10 11 12
Month
18 •
- 1 6 -U
Dw14' (D
| 1 2
2 1 0 '
fi 6 -
8. 4-5 2. 5 n
- 2 -
D. 1980- 1987
j" 7L-13 4 5 6 7 8 9 10 11 Mo
1 12
nth
Figure 2. The deviation (%) of the average monthly food consumption of male Steller sea lion 001; (A) between age 1-3, (B) between age 4-7, (C) between age 8-15, and (D) the average monthly temperature at the Harderwijk Park between 1980 and 1987.
c 2 0
B 10
1 ° -20
Female 003 A. age 1-10
2 3 4 5 6 7 8 9 ^=6 CO J—*——r 10 11 12 Month
30
c 2 0' •2 10-
B. agel1-15
1 2 3 4 5 6
•TR r r l im
7 8 9 10 11 12 Month
5 o
-20
-30
-40
Figure 3. The deviation (%) of the average monthly food consumption of female Steller sea lion 003; A) between age I-IO, and B) between age 11-15.
= 2 0
•2 10
-20 J
20
o 10
! . : *
.2 0
2-10. 9 8 -20
-30 ••
B. age 11-15
2 3 4 m
10 11 12 Month
HtD 9 10 11 12
Month
Figure 4. The deviation (%) of the average monthly food consumption of female Steller sea lion 002; (A) between age 1-10, and (B) between age 11-15.
and a loss of weight during the breeding season. Schusterman and Gentry (1971) reported on the seasonal fattening of California sea lions (Zalophus californianus) in human care, which increased in weight before the onset of the breeding season when they became mature at 5 years of age. This seasonality became more prominent when the animals reached full maturity. The suggestion is put forward that this cyclic weight change might be hormone-dependent.
463

R.A. Kastelein et al.
c o Q.
E 3 tf> c o o T3 O O
3 a>
I
20-
1 " 18-
O) 1 6 1
*•" 14
12'
10
8'
6'
4.
2
0 Birth
5 Day periods
Figure 5. The average daily food intake over 5 day periods around 7 births of pups from female 003. The vertical bars indicate the minimum and maximum values.
The adult females in this study show a less dramatic monthly food intake fluctuation than the adult male. This might be because females in the wild go to sea during the breeding season and probably feed during that period. Female 003 usually gives birth in June and copulation takes place soon after birth, which is normal in Steller sea lion cows. Also her energy requirements change during the year. Between January and July she carries a growing foetus, while from August to December she carries a very small foetus and also has to suckle her pup. It seems plausible that suckling and simultaneously nourishing a small foetus requires more energy than nourishing a foetus during its last 6 months, when there is no pup suckling.
Apart from hormonal influences and changes in energy requirements due to reproduction, seasonal temperature changes may also influence the food intake of Steller sea lions. In the present study, the male especially eats less when the temperature is high (Fig. 2D). During this season the animal would not require such a well-insulating fat layer to maintain an internal body temperature of 37°C. In the wild, the males lose less energy through conductance during the breeding season, because they spend very little
10 11 12 13 14 15 16 Age (years)
16-15-14 13 12-11
n10 ~ 9 o> 8-1 7
6 5 4-3 2 1-
B. Females
1 2 3 4 5 6 7 8 9 10 11 12 13 14 15 16 17 18 Age (years)
Figure 6. The lines indicate the average daily food requirements (taken over a year) of males (A) and females (B) in the present study.
Circles indicate the maximum food intake after a day of fasting of animals in the present study, and triangles indicate the weight of undigested food found in stomachs of 23 Steller sea lions taken at sea (derived from Fiscus and Baines, 1966).
time in the water, a medium which conducts heat 25 times more efficiently than air.
Perinatal changes The reduction in food intake during the last 5 days pre partum may be due to a hormonal change that, in the wild, urges the female to look for a suitable place to give birth (Sandegren, 1970). The females in the Harderwijk Park started to eat normal amounts of food immediately post partum. This does not occur in the wild, where females stay beside their pup for 5 to 13 days post partum (Sandegren, 1970). Possibly
464

650 600
550
- 450
| 400
* 350 "E 300 m •o 250 a % 200 3 150 O 100
50
The food consumption of Steller sea lions
• male • female
4 5 I I
10 11 I I I I
12 13 14 15 I I I
16 17 18 I I I I I
19 20 21 22 23 Age (year)
Figure 7. The calculated weight of male and female Steller sea lions of different ages (derived from length and girth measurements from Fiscus, 1961 and from average weights of adult males and females from Calkins and Pitcher, 1982).
they stay on land to protect the pup, and to establish a mother-pup bond. These activities can continue without the mother fasting in the Harderwijk Park since the animals are hand fed. Therefore, the post partum fasting, as observed in the wild, may not be determined by endogenous factors.
Stomach capacity The few data of this study seem to indicate that older animals have a relative large stomach volume compared to stomachs of younger animals. This might be related to the fact that the sexually mature animals go through (breeding) periods with a low food intake, and later have to eat much to re-gain their weight.
Fiscus and Baines (1966) report on the stomach contents of 23 Steller sea lions. These animals were taken at sea, so that the food they had consumed was still undigested. The weight (expressed in kg, which is nearly equal to volume in dm3) of the food found in the stomachs of 8 males and 15 females is presented in Figure 6. The amount of food found in the stomachs of the females (Fig. 6B) was roughly one fourth of the average daily food requirement seen in this study (also taken over the whole year). This seems reasonable since the animals in the field study were taken at sea, and this might have taken place when only a portion of their daily feeding time was over. One 2-year-old male, weighing 191 kg, had his stomach filled to near maximum capacity, and it contained 1280 Capelin (Mallotus villosus), weighing 18.05 kg
(Fig. 6A). This was 9.4% of the animal's body weight. Fiscus and Baines (1966) do not report their age determination technique, but comparing the weight of this presumed 2-year-old male with the weight of 2-year-old males in Figure 7, and comparing its stomach capacity with data from the present study, its seems likely that the animal was 3-4 years old instead of 2 years. Two and three year old Stellers are extremely difficult to differentiate on basis of their morphology. Comparison of the stomach capacities found in the present study and in the field, with the mean food consumption per day in this study (taken over the whole year) indicates that older animals can take much more food during one feeding than their daily food requirements. This suggests that, in the wild, these animals may not eat every day, and/or that food is not always abundant enough to fulfil their daily requirements. Few other data on stomach capacities are published. Thorsteinson and Lensink (1962) report on large quantities of stones, up to 10 kg, found in stomachs of Steller sea lions. The reason for the intake of stones in unknown. Wilke and Kenyon (1952) describe a female with 9.1 kg of fish in its stomach in addition to 4 stones. Evermann (1921) reports on a Steller sea lion with 17.5 kg offish in its stomach. Unfortunately the age and sex of the animal were not recorded. However, this agrees with the suggestion that wild Steller sea lions will eat to excess when they find food, since the adult male in the present study eats on average 18 kg per day at the age of 15 years.
465

R.A. Kastelein et al.
Acknowledgements
We thank Teun Dokter, Jan Mosterd and Piet Mosterd for their advice, and Jurgen Foortjes for the collection of the maximum food intake data. We also thank all animal care personnel for recording the food consumption accurately over the years, and Irma Verhoeven for partially analysing the data and for drawing the graphs. The average monthly air temperatures were provided by the Royal Dutch Meteorological Institute (KNMI).
References
Bryden, M. M. (1972). Growth and development of marine mammals. In: Functional Anatomy of Marine Mammals. Vol. I, (Ed. R. J. Harrison), Academic Press, New York and London: 1-80.
Calkins, D. G. & Pitcher, K. W. (1982). Population assessment, ecology and trophic relationships of Steller sea lions in the Gulf of Alaska. U.S. Dept. Commer., NOAA, OCSEAP Final Rep. 19,445-546
Evermann, B. W. (1921). The Ano nuevo Steller sea lion rookery. Journal of Mammology, 2, 16-19.
Fiscus, C. H. (1961). Growth in the Steller Sea Lion. Journal of Mammalogy. 42.2,218-223.
Fiscus, C. H. & Baines, G. A. (1966). Food and feeding behavior of Steller and California sea lions. Journal of Mammology. 47.2, 195-200.
lmlcr, R. H. & Sarber H. R. (1947) Harbor seals and sea lions in Alaska. U.S. Fish and Wild!. Serv. Spec. Sci. Rep. 28,22 p.
Keyes, M. C. (1968). The nutrition of pinnipeds. In: The behavior and physiology of pinnipeds (Eds. R. J. Harrison, R. C. Hubbard, R. S. Peterson, C. E. Rice, and R. J. Schusterman. Appleton-Century-Crofts, New York: 359-399.
Lowry, L. F., Frost, K. J., Calkins, D. G., Swartzman, G. L. & Hills, S. (1982). Feeding habits, food requirements, and status of Bering Sea marine mammals. N. Pac. Fish.
Manage. Council, Anchorage, Alaska, Doc. 19 and 19a 574 pp.
Mathisen, O. A., Baade, R. T. & Lopp, R. J. (1962). Breeding and stomach contents of the Steller sea lion in Alaska. Journal of Mammology, 43.4,469-477.
Olesiuk, P. (1987). Personal communication. Miami, U.S.A.
Orr, R. T. & Poulter, T. C. (1967). Some observations on reproduction, growth, and social behaviour in the Steller sea lion. Proc. oflhe Cal. Ac. of Sci. 35.10, 193-226.
Pitcher, K. W. & Calkins, D. G. (1981) Reproductive biology of Steller sea lions in the Gulf of Alaska. J. Mammal. 62(3), 599-605.
Pitcher, K. W. (1981). Prey of the Steller sea lion, Eumetopias jubatus, in the Gulf of Alaska. U.S. Natl. Mar. Fish. Serv. Fish. Bull. 79(3), 467-472.
Rand, R. W. (1959). The Cape fur seal (Arciocephalus pusillus). Distribution, abundance and feeding habits off the southwestern coast of the Cape Province, Union of South Africa. Invest. Rep. Div. Fish. Dept. Comm. Ind., 34,1-65.
Sandegren, F. E. (1970). Breeding and Maternal Behavior of Steller sea lions (Eumetopias jubatus) in Alaska, M.S. Thesis, University of Alaska, College.
Schusterman, R. J. & Gentry, R. L. (1971). Development of a fatted male phenomenon in California Sea Lions. Developmentalpsychobiology 4(4), 333-338.
Schusterman, R. J. (1981). Steller Sea Lion Eumetopias jubatus (Schreber, 1776). In: Handbook of Marine Mammals. Vol. 1. (Eds. S. Ridgway & Harrison, R) . Academic Press: 119-142.
Spalding, D. J. (1964). Age and growth of female sea lions in British Columbia. J. Fish. Res. Board. Can. 21,415-^117.
Spotte, S. & Adams, G. (1979). Note on the food intake of captive adult male Northern fur seals (Callorhinus ursinus). Aquatic mammals 7.3,65-67.
Thorsteinson, F. V. & Lensink, C. J. (1962). Biological observations of Steller sea lions taken during an experimental harvest. The J. of Wildlife Man. 26.4, 353-359.
Wilke, F. & Kenyon, K. W. (1952) Notes on the food of Fur seal, Sea lion and Harbor porpoise. J. Wildlife Manage. 16,396-397.
466

Chapter 4.2
Aquatic Mammals 1995, 21.1, 43-53
The food consumption of South American sea lions (Otaria flavescens)
R. A. Kastelein, J. Kershaw*, E. Berghout and P. R. Wiepkema**
Harderwijk Marine Mammal Park, Strandboulevard-oost 1, 3841 AB Harderwijk, Holland *Marineland, Avenue Mozart, 06600 Antibes, France
* Ethology Section, Department of Animal Husbandry, Agricultural University, P.O. Box 338, 6700 AH Wageningen, Holland
Summary
This is a study of the food consumption of 4 male and 8 female South American sea lions at Marine-land, Antibes, France. The females' average daily food consumption increased for about 5 years after birth, after which it stabilized at around 5 kg/day. The males' average daily food intake reached a peak of about 12 kg/day during their 8th year after which it dropped and stabilized at around 9 kg/day. Adult males ate on average 3% of their body weight each day, and females ate 4%.
Although the animals were allowed to eat as much as they wanted, their food intake fluctuated seasonally. They ate less during the breeding season which was between June and September at Marine-land. This is 6 months different from this species' breeding season in the wild in the Southern hemisphere. Energetics of this species are compared in human care and in the wild, and the estimation is made that wild adult males may eat 3700 kg of fish per year, and adult females around 1900 kg per year.
Introduction
South American sea lions (Otaria flavescens, Shaw, 1800) live south of Brazil on the east coast, and south of Ecuador on the west coast of South America (Vaz-Ferreira, 1975a; 1981). To assess the impact of this otariid on its prey, information is needed about the size and composition of sea lion populations, their seasonal movements, the composition of their diet and their energetic requirements.
The world population of South American sea lions was roughly estimated to be 300 000 in 1981 (Vas-Ferreira, 1981). Not much is known about the sex and age composition of the different geographical populations. Also very little is known about their seasonal movements (Hamilton, 1939; Ximenez, 1976).
The diet of South American sea lions has been studied by stomach content analysis by Hamilton (1934) Vaz-Ferreira (1950), Boswall (1972), Aguayo & Maturana (1973) and Vaz-Ferreira (1981). This species eats mainly fish, crustaceans and molluscs. More detailed information is needed on the prey species taken in different areas, seasons and years.
Very little is known about the energetic requirements of South American sea lions, the amount of food consumed per day, about food intake changes due to the time of year, the age, the reproductive cycle, or about sex-linked food intake differences. This type of information can be derived to some extent from food records of animals kept in zoological parks. The present study analyses the food records of South American sea lions kept at Marineland in Antibes, France, between 1974 and 1992.
Materials and Methods
Study animals This study concerns the food consumption of 12 South American sea lions (Table 1). The 7 original animals were born in Uruguay, South America. Since 1986 they have produced offspring (Table 2).
Study area Between 1973 and 1990 most of the animals were kept in a rectangular outdoor pool (35 m x 15 m; approx. 2 m deep). After 1990 the young animals (Ob9, OblO and Obll) were housed in a separate pool (5 m x 20 m; approximately 2 m deep). Ob6 and Ob7 were housed next to the dolphin pool in separate enclosures since 1984 and 1991 respectively. All pools contained natural sea water from the Mediterranean. The water temperature varied from 8°C to 25°C, air temperature from - 2°C to 35°C. Adjacent to the pools a land area was available to the animals. Marineland is located 7° 3' East longitude and 43° 30' North latitude.
467

R.A. Kastelein et al.
Table 1. The South American sea lions and their relatedness
Code Sex Birth date, or est. year Arrival date
Code sire
Code dam Origin
ObO Obi Ob2 Ob3 Ob4 Ob5 Ob6 Ob8 Ob7 Ob9 OblO Obll
M F F F F F M M F F M F
1973 1973 1981 1983 1983 1983 1983 1972
10-7-1989 23-6-1991 4-7-1991 8-7-1991
1974 1974
1-1982 28-4-1984 28-4-1984 28-4-1984 28-4-1984 29-1-1988
— — — —
— — — — — — — —
Ob8 Ob8 Ob8 Ob8
— — — — — — — —
Ob2 Ob4 Ob3 Obi
Uruguay Uruguay Uruguay Uruguay Uruguay Uruguay Uruguay
Spain Antibes Antibes Antibes Antibes
Table 2. The ages of the South American sea lions and the years in which the animals were housed together
Male Male Male ObO Ob6 Ob8
Female Obi
Female Ob2
Female Ob3
Female Ob4
Female Ob5
1974 1975 1976 1977 1978 1979 1980 1981 1982 1983 1984 1985 1986 1987 1988 1989 1990 1991 1992
1 2 3 4 5 6 7 8 9
10 11 12 13 14D
1# 2# 3# 4# 5# 6# 7# 8# 9#
16 17 18 19D
1 2 3 4 5 6 7 8 9
10 11 12 13 14 15 16*(Ob8) 17 18*(Ob8) 19
1 2 3 4 5 6 7*(Ob0) 8*(Ob8) 9
10D
2 3 4 5 6 7 8 9*(Ob8)
10
2 3 4*(Ob0) 5 6*(Ob0) 7 8 9*(Ob8)
10
2 3 4*(ObO) 5 6 7 8 9*(Ob8)
10
*=Year in which a pup was produced. (Ob..)=sire of the pup. #=In show pool, not in contact with conspecifics. D=Year of death.
Food The animals were fed twice a day, once in the morning and once in the afternoon. Until 1990 the diet consisted of on average 50% Mackerel (Scomber scombrus) and 50% Herring (Clupea harengus), based on weight. Starting in 1990 the diet consisted of on average 40% Mackerel (Scomber scombrus), 40% Herring (Clupea harengus) and 20% Capelin {Trisopterus minutus capelanus). Vitamins
were added to the fish after it had been defrosted. During the last feed of the day the animals (except Ob6 and Ob7) were given as much as they wanted to eat. Feeding was stopped as soon as the animals started to play with the food instead of consuming it immediately. This was considered a sign of satiety. Ob6 participated in a show from 1984 and Ob7 from 1991, and as a result they were fed less to allow the trainers to control their behaviour.
468

The food consumption of South American sea lions
c o K a £ 3 in C
o
| 5 O TJ 0> O) D 0) > <
13 12 11 10-9 •
8 7 6 5 4 3 2 • 1 •
0
Males
l i i
• * * 0 2 4 6 8 10 12 14 16 18 20
Age (year)
Figure 1. The average annual food intake of 3 male and 8 female South American sea lions at Marineland, Antibes. Age 1 represents the first calendar year after the year of birth. The numbers near the lines indicate the sample size for each age class. The dashed line connects the food intake data of 2 individuals.
Records were kept of the amount and type of food consumed during each feed. These daily food intake data form the basis of the present study.
Results
Influence of age and gender on food intake The food intake data of 3 males which were fed ad lib. are combined in Fig. 1. Until the age of 2 years their average daily food consumption increased slowly, thereafter it increased strongly to reach 12.3 kg/day at the age of 8 years. After the 8th year, the food intake slowly decreased and stabilized at around 9 kg/day. Data from male Ob6 are omitted in this graph, because his food intake was restricted by the training regime and followed the intake of the females closely.
The food intake data of 8 females which were fed ad lib. are also combined in Fig. 1. Up until their third year the females ate similar amounts as the males. Thereafter the females increased their food intake until it stabilized at around 5 kg/day after the age of 4 years.
Looking at individual animals and individual years, no influence of gestation or lactation could be found in the females' average daily food intake.
The pups started to eat fish around the age of 5 months, but often continued to suckle for many months (Table 3).
Age of reproduction Table 2 shows the ages at which and the years in which the males and females were housed together.
Table 3. Age at which South American sea lion pups at Marineland, Antibes began to eat fish (suckling continued for some time)
Animal
Ob7 Ob9 OblO Obll
Sex
F F M F
Birth date
10-7-1989 23-6-1991 4-7-1991 8-7-1991
Age onset eating fish
(months)
5 5* 7 4
"This animal was bottle-fed.
Male ObO first successfully fertilized a female when he was 12 years old. Male Ob6 was not housed with females during the study period, and male Ob8 arrived at the age of 16 years, and immediately mated successfully.
Females Obi, Ob2, Ob3, Ob4 and Ob5 gave birth for the first time at the ages of 16, 7, 9, 4, and 4 years respectively, and first delivered and raised calves at the ages of 16, 8, 9, 6 and 9 years respectively.
Seasonal changes Male ObO's food intake increased each month until he was 4 years old. From the age of 5 his food intake fluctuated so that he ate less than the annual average in the summer (between June and September) and more than the average in the winter period (Fig. 2A). He also ate much less than the
469

R.A. Kastelein et al.
£
Is si <D E
E 3 * § c o 2 P > 0 Q
Male ObO (Age 5-13 years)
10 11 12 Month
B 30 -I Male Ob6 (Age 6 - 9 years)
20
10
-10
-20
-30
-40
10 11 12 Month
> •
£
Is 11 £ 3 o § c o
II a) a
30 -I Male Ob8 (Age 16-18 years)
20
10 11 12 Month
10
0
-10
-20-1
-30
as -40
Figure 2. The average deviation (%) from the annual average monthly food consumption of male South American sea lion ObO between age 5 and 13 years (A), of male Ob6 between age 6 and 9 years (B), and male Ob8 between age 16 and 18 years (C). "low intake due to illnesses during 3 of the 9 years over which the average was taken.
470

The food consumption of South American sea lions
annual average in February, which was due to gastro-intestinal illnesses in February during 3 of the 9 years over which the average monthly food intake was calculated. Male Ob6's food intake started to fluctuate in a similar way at the age of 6 years (Fig. 2B). He ate less than the annual monthly average between February and July. Male Ob8 arrived at the age of 16 years, and immediately showed an annual food intake cycle (Fig. 2C). He ate less than the annual monthly average between June and September. Both male Ob8 and male ObO mated between April and September.
Female Ob2 started to show an annual cycle in her food intake at the age of 4 years while Obi, Ob3, Ob4 and Ob5 showed a cycle at 5 years. They generally ate less than average between March and August, and more than average in the winter months (Fig. 3A-E). The low food intake of female Ob4 in September (Fig. 3D) was due to illness in 1 of the 5 years over which the average was taken.
No obvious moult was detected in the study animals.
Discussion and conclusions
Influence of age and gender on food intake In the wild, male and female pups have slightly different birth weights. Males weigh on average around 14 kg and females around 12 kg (Vaz-Ferreira, 1981; Capozzo et al., 1991). The pups in the present study started to eat fish around the age of 5 months, but often continued to suckle for many more months. In the wild, juveniles are weaned after the new pups are bora. This is usually when the juveniles are 1 year old, but sometimes when they are 2 years old (Vaz-Ferreira, 1981).
Adult male South American sea lions weight about twice as much as adult females (Vaz-Ferreira, 1981; Fig. 4), and the present study shows that the daily intake of adult males is about twice that of adult females. Large sexual differences in food intake after maturation have been observed in other sexually dimorphic pinnipeds such as Grey seals (Halichoerus grypus), Steller sea lions (Eumetopias jubatus), South African fur seals (Arctocephalus pusillus) and Southern elephant seals (Mirounga leonina) (Kastelein et al, 1990a, b & c; 1991).
In the wild, females are sexually mature at the age of 3-4 years, and males at the age of 5 or more years (Vaz-Ferreira, 1981). The present study shows that females' food intake stabilizes at the age of 3 years, which suggests that they become reproductive when they are full-grown. The male in the present study showed a strong food intake increase between his 6th and 10th year. Because his mane started to appear in that period, suggests that it was the time of sexual maturation.
The animals in the present study were never weighed, but Vaz-Ferreira (1981) reports that in the wild adult males weigh around 350 kg in November-December at the beginning of the breeding season and around 250 kg in January, towards the end of the breeding season (which is summer in the southern hemisphere). Assuming that the average weight of an adult male is around 300 kg, and assuming that the adult males in the present study had similar weights as their wild conspecifics, the adult males in the present study ate around 3% of their body weight every day, averaged over the entire year.
Vaz-Ferreira (1981) reports that adult females normally weigh around 120 kg, and reach a maximum of 144 kg between December and January. Assuming that the average annual weight of an adult female is around 125 kg, and assuming that the adult females in the present study had similar weights as their wild conspecifics, the adult females in the present study ate around 4% of their body weight each day, averaged over the whole year.
Vaz-Ferreira (1981) describes a 3-year-old female of 68 kg. Assuming that the females in the present study were around this weight at the age of 3 years, they ate on average 6.7% of their body weight each day.
Vaz-Ferreira (1981) reports that captive South American sea lions consume about 8% of their body weight daily in fish, he does not mention water temperature, the age or the sex of the animals. His data may have been based on animals that were housed in a colder environment, or fed a diet of a lower caloric content than the animals in the present study. Alternatively, the animals he used may have been growing.
Age of reproduction It is not clear why male ObO did not reproduce until he was 12 years old. Up until the age of 8 years, he was housed only with female Obi. Possibly these animals were not compatible, or males of this species need to be surrounded by a certain number of females in order to show mating behaviour. The former is probably true, because when females Ob2, Ob3, Ob4 and Ob5 reached sexual maturity he mated with 3 of them, but still not with Obi. Obi did become pregnant immediately after male Ob8 was introduced. Reproductive incompatability may serve to prevent inbreeding (=improve heterosis).
Seasonal changes in food intake Two fish of the same species can have different nutritional or caloric values depending on the season and geographical area in which the fish were caught. The fish fed at Marineland is caught in different quantities and areas, and sometimes stored
471

R.A. Kastelein et al.
Female Ob2 (Age 4 - 9 years)
10 11 12 Month
£ c
3 £ E 3 O o c o
o o
B 30
20
10
-10
-20
-30 H
-40
Female Obi (Age 5 -19 years)
i_i-u_r 1 2 3 4 5 6 7 8 10 11 12
Month
30 i Female Ob3 (Age 5 - 9 years)
20-L
Figure 3a-c.
472

The food consumption of South American sea lions
30 i
| 20-o c E .2 10 •
o E o. E 3 °
Is-io-| 8 -20 • •
Q -30-
-40-1
E 30 i
> f 20-2 c
ean
nr
mpt
io
3
O
E 3 ° S -10-C O
I 8 "20 ' > * S a -30-
-40 J
Female Ob4 (Age 5 - 9 years)
1 2 3 4 5 6
Female Ob5 (Age 5 - 9 years)
7
|_J_I l_ 1 2 3 4 5 6 7
8 * 9
8 9
10
10
11 12 Month
11 12 Month
Figure 3. The average deviation (%) from the annual average monthly food consumption of South American sea lion female Ob2 after her 4th year (A), and females Obi, Ob3, Ob4 and Ob5 after their 5th year (B-E). *Low intake due to illness during one of the 5 years over which the average was taken.
for several months. Probably, any seasonal or regional differences in caloric value of the fish cancelled each other out over the years, and did not lead to annual fluctuation in food consumption.
During the breeding season in the wild, reproductive males haul out on rookeries, and non-breeding male groups form on hauling grounds (Hamilton, 1939). Reproductive males set up territories and fight with neighbouring males to defend them (Vaz-Ferreira, 1981). Male-male interaction occupies only 2.4% of their time, while most of the time (85%) they spend motionless, avoiding waste of energy (Gatefio, 1991). Fighting is more common at the beginning of the breeding season. In the wild, the breeding season is between December and February, and births peak in mid-January (Vaz-
Ferreira, 1981). The South American sea lions in the present study were kept in the northern hemisphere, which means that they experienced the opposite annual cycle of photo-periods than they would in their natural habitat. As a result, the breeding cycle is shifted by approximately 6 months. Breeding occurs between June and August in the northern hemisphere, and in this period the males of the present study ate less than average and showed sexual behaviour. After the breeding season, wild bulls leave their territories in a generally emaciated condition.
Because annual summer periods with low food intake only occurred after the males had reached the age of 5 years, and because these periods only partially overlapped with the months of the highest
473

R.A. Kastelein et al.
*- -.ST"8*^' **
Figure 4. A mature male South American sea lion (left), a mature female, and 2 pups on Isla Marta, Strait of Magellan. Note the sexual dimorphism, which is pronounced in the heads. The male has a characteristic upturned muzzle (Photo: Steve Leatherwood).
3
Urn
0) a E <D
> 9 c o E 4) O) (0
I Figure 5(A).
air and water temperatures (Figs. 5A & B), the decrease in food consumption cannot be entirely a thermoregulatory adaptation. Because the males in the present study were given as much food as they wanted, it seems plausible that their reduction in appetite between June and September was caused, at least partly, by endogenous factors. The seasonal
fluctuations were the strongest in male Ob8 which was highly sexually active, and less in male ObO which showed little sexual behaviour. Male Ob6, which was separated from females, also showed a smaller seasonal fluctuation in food intake than Ob8. This suggests that male hormones influence food intake.
474

The food consumption of South American sea lions
3
a> Q. E o
o E I
•o
i
30
o I 3 (0 Q-M <D
£• 3 £ «
© <B O) *" a
I
1 5 -
— I 1 1 1 1 1 1 1 1 1 1
7 8 9 10 11 12 1 2 3 4 5 6 Month
Figure 5. (A) The average monthly air temperature at Marineland between 1949 and 1989, (B) The water temperature of the South American sea lion pool at Marineland recorded on the 15th of each month in 1990 and (C) The average minimum and average maximum monthly sea surface temperatures over a 10 year period in the South American sea lions' distribution area (Source: Royal Dutch Meteorological Institute).
Seasonal food intake changes related to the males' reproductive strategy are also found in other pinnipeds. Reproductive males of Steller sea lions (Kastelein et al., 1990a), South African fur seals (Kastelein et al., 1990c), California sea lions {Zalophus californianus) (Schusterman & Gentry, 1971), Northern fur seals (Callorhinus ursinus) (Spotte & Adams, 1979), Atlantic Harp seals (Pagophilus groenlandicus) (Sergeant, 1973), Grey seals, (Kastelein et al., 1990b), Northern elephant seals (Mirounga angustirostris) (Ortiz et al., 1984), and Southern elephant seals (Kastelein et al., 1991)
also reduce their food intake during the breeding period when they haul out and spend most of their time defending their territories or mating.
In the wild, gravid female South American sea lions haul out some days before their pups are born. Most births occur in mid-January, and cows stay near their pups for some weeks, fasting. The females in the present study reduced their food intake during the summer months. This could have one or several causes; it is the warmest period of the year, food intake is reduced by endogenous factors, or the females are so stressed
475

R.A. Kastelein et al.
by the males that they cannot eat the usual amount. Because the decrease in food intake occurred in both sexes, the warm season and/or endogenous factors seem most likely to be the cause.
To what extent wild South American sea lions store fat reserves before the breeding season is not clear. It may be different between individuals, depending on their physical condition and age (immature or mature) before the breeding season. In South American sea lions, body fat has an important role as an energy store during period of low food intake or fasting, as well as it is important for temperature regulation (Irving, 1969), streamlining, protection of the body from shocks, and bouyancy.
In the wild, not all South American sea lions moult at the same time, and various stages can be seen between April and August (winter). In the present study, no clear moult was detected. This may be because moult in this species is an inconspicuous gradual process.
Ecological significance How does the present study relate to South American sea lions in the wild?
There is probably a difference in activity level between animals in the wild and in a pool. In the wild, South American sea lions live either near breeding areas or at feeding areas which are often close to the shore. Here they feed near the surface and often rest (Vaz-Ferreira, 1981). Although limited in space, the animals in the present study swam most of the time. However, they did not have to dive for food, so they probably used less energy than wild conspecifics do.
The mean monthly water temperatures at Marineland (Fig. 5B) are within the range that South American sea lions experience in their distribution area (Fig. 5C). This suggests that, if the animals at Marineland spent a similar amount of time in the water as their wild conspecifics (Vaz-Ferreira (19756) observed that in the wild, haul out behaviour is influenced by weather conditions), the energy loss due to thermal conductance would be similar in both situations. However, because it is not known how deep South American sea lions dive, how long they stay there, and what the water temperatures are at those depths, comparisons should be approached with caution.
When the temperature rises, South American sea lions lie belly up on the ground with extremities extended from the body and one or more flippers raised in the air. A very common position in hot weather is sitting with one hind flipper extended above the body. On warm days they throw cool sand on their body, and in very hot
weather they often take a dive and return to the rookeries (Vaz-Ferreira, 1981). At Marineland only the latter option for cooling was available to the sea lions.
Different species of fish have different energy contents per unit weight (Costa, 1987; Prime and Hammond, 1987). The fish fed to the animals in the present study were not the natural prey of South American sea lions. Although the caloric content of the food eaten by animals at Marineland (50% Herring and 50% Mackerel) was not determined, this diet is probably of a higher energetic content than the natural diet of South American sea lions, which consists of low-calorie crustaceans and molluscs as well as fish (Hamilton, 1934; Vaz-Ferreira, 1950; Aguayo & Maturana, 1973). Penguins are also part of the diet of adult South American sea lions, but to what extent is not known (Boswall, 1972).
In the wild, adult male South American sea lions eat nothing during the 2 month breeding season because they do not leave the breeding grounds, whereas the animals in the present study ate some food during that period, perhaps because they were fed by hand. This may make the total annual food intake of the animals at Marineland higher than that of conspecifics in the wild, unless the animals in the wild eat much more than the animals of the present study after the breeding season in order to replenish lost fat reserves.
Although the food intake data of the present study are difficult to extrapolate directly to wild South American sea lions, the relative differences due to sex and age, and changes due to season and reproductive state are probably comparable to those in the field. These changes were controlled by endogenous factors, because 10 of the 12 animals at Marineland were offered as much as they wanted to eat, so that changes in food intake were not determined by their keepers. Based on the present study, a conservative food fish consumption estimate for South American sea lions in the wild would be 3700 kg/year for adult males and 1900 kg/year for adult females.
Studies of energy requirements should be long term and involve growing and adult individuals of both sexes, and females in different stages of reproduction. The present study indicates that the food intake pattern in South American sea lions is complex. It is risky to use a simple percentage of body weight to calculate the daily food requirement of an entire population of South American sea lions. To assess this requirement reliably, information on the geography, water temperature, climate, season, the diet and its caloric content, the digestive efficiency of the different prey species, and the size, sexual composition and age structure of the population is needed.
476

The food consumption of South American sea lions
Acknowledgements
We thank all animal care personnel at Marineland for recording the food consumption over the years. The mean monthly air temperatures at Antibes were provided by Meteo-France. The mean monthly sea surface temperatures were provided by the Royal Dutch Meteorological Institute. We thank Rob Triesscheijn for making the graphs and Charmaine van der Elst, Saskia Nieuwstraten and Nancy Vaughan for their comments on the manuscript.
References
Aguayo, A. & Maturana, R. (1973) Presencia del lobo marino comun (Olaria fiavescens) en el litoral chileno. Bio. Pesq. Chile, Santiago (Chile) 6, 45-75.
Boswall, J. (1972) The South American sea lion (Otaria hvronia) as a predator on penguins. Bull Br. Ornithol. Cluh 92(5), 129-132.
Cappozzo, H. L., C. Campagna & J. Monserrat. (1991) Sexual dimorphism in newborn southern sea lions. Mar. Mamm. Sci. 7(4), 385-394.
Costa. D. P. (1987) Isotopic methods for quantifying material and energy intake of free-ranging marine mammals. In: Marine Mammal Energetics (Eds. Huntley, A. C , Costa, D. P., Worthy, G. A. J. and Castellini, M. A.) Soc. for Mar. Mamm. Special publ. no. 1, 29-42.
Gateno, D. (1991) Factors affecting the breeding behavior of the South American Sea lion males (Otaria byronia). Ninth Biennial Conference on the Biology of Marine Mammals, Dec. 1991, Chicago, 111., U.S.A.
Hamilton, J. E. (1934) The Southern sea lion (Otaria hvronia) (De Blainville) Discovery Rpts, Cambridge 8, 269-318.
Hamilton, J. E. (1939) A second report on the Southern sea lion (Olaria byronia) (De Blainville). Discovery Rpts. Cambridge 19, 121-164.
living, L. (1969) Temperature regulation in marine mammals. In: Marine Mammals (Ed. H. T. Andersen) Academic Press, New York, 1, 147-174.
Kastelein, R. A., Vaughan, N. & Wiepkema, P. R. (1990a) The food consumption of Steller sea lions (Eumelopias jiihalus). Aquatic Mammals, 15(4), 137-144.
Kastelein, R. A., Wiepkema, P. R. & Vaughan, N. (1990b) The food consumption of Grey seals (Halichoerus gry-piis) in human care. Aquatic Mammals, 15(4), 171-180.
Kastelein, R. A., Verhoeven, I. & Wiepkema, P. R. (1990c) The food consumption of South African fur seals (Arctocephatus pusillus) at the Harderwijk Marine Mammal Park. Int. Zoo Yearb. Vol. 29, 175-179.
Kastelein, R. A., Kershaw, J. & Wiepkema, P. R. (1991) The food consumption of Southern elephant seals (Mirounga leonina). Aquatic Mammals, 17(2), 76-78.
Ortiz, C. L., Le Boeuf, B. J. & Costa, D. P. (1984) Milk intake of elephant seal pups: an index of parental investment. Am. Naturalist 124(3), 416-422.
Prime, J. H. & Hammond, P. S. (1987) Quantitative assessment of Grey seal diet from faecal analysis. In: Marine Mammal Energetics (Eds. A. C. Huntley, D. P. Costa, G. A. J. Worthy & M. A. Castellini) Soc. for Mar. Mamm. Special publ. no 1, 163-181.
Schusterman, R. J. & Gentry, R. L. (1971) Development of a fatted male phenomenon in California sea lions. Developmental psychobiology, 4(4), 333-338.
Sergeant, D. E. (1973) Feeding, growth, and productivity of Northwest Atlantic Harp Seals (Pagophilus groen-landicus). J. Fish Board Can., 30, 17-29.
Spotte, S. & Adams, G. (1979) Note on the food intake of captive adult male Northern fur seals (Callorhinus ursinus). Aquatic Mammals. 7(3), 65-67.
Spotte, S. & Adams, G. (1981) Feeding rate of captive adult female Northern fur seals, Callorhinus ursinus. Fisher. Bull. 79(1), 182-184.
Vaz-Ferreira, R. (1950) Observaciones sobre la Isla de Lobos. Rev. Fac. Hum. Cienc. Montevideo 5, 145-176.
Vaz-Ferreira, R. (1975a) Behavior of the southern sea lion (Otaria fiavescens) (Shaw) in the Uruguayan islands. Rapp. P.-v. Reun. Cons. Int. Explor. Mer 169, 219-227.
Vaz-Ferreira, R. (1975b) Factors affecting numbers of sea lions and fur seals in the Uruguayan islands. Rapp. P.-v. Reun. Cons. Int. Explor. Mer 169, 257-262.
Vaz-Ferreira, R. (1981) South American sea lions (Otaria fiavescens, Shaw, 1800). In: Handbook of Marine Mammals, Vol. 1. The Walrus, Sealions, Fur Seals and Sea Otters (eds. Ridgway, S. H. & Harrison, R. J.). Academic Press, London, New York, Toronto, Sydney, San Francisco, 39-65.
Ximenez, I. (1976) Dinamica de la poblacion de Otaria fiavescens (Shaw) en el area de Peninsula Valdes y zonas adyacentes. Provincia del Chubut, Republica Argentina. Puerto Madryn, Chubut, Argentina, Centro Nacional Patagonico, 1976 (C.N.P. 1.4.1. 1976. Informes Tecnicos).
477

2
3
Chapter 4.3
Food consumption and growth of California sea lions (Zalophus californianus californianus)
R.A.Kastelein1, N.M. Schooneman1, N. Vaughan2 and P.R. Wiepkema3
Harderwijk Marine Mammal Park, Strandboulevard Oost 1, 3841 AB Harderwijk, The Netherlands
School of Biological Sciences, University of Bristol, Woodland Road, Bristol, BS8 1UG, United Kingdom
Emeritus Professor of Ethology, Wageningen Agricultural University, Stationsweg 1, 6861 EA Oosterbeek, The Netherlands
Summary
The daily food consumption of 26 California sea lions at the Harderwijk Marine Mammal Park was recorded. Average annual food consumption of males increased with age to stabilize at around 4000 kg/year by the age of 10 years. Females showed a rapid increase in average annual food consumption until they were 3 years old. Thereafter females housed outdoors averaged 1800 kg/year, and those housed indoors around 1400 kg/year. Between the ages of 4 and 7 years the food intake of males began to fluctuate seasonally; decreasing between May and August. The low food intake in summer was associated with an increase in aggressive behaviour. Seasonal fluctuation in the food intake of non-reproductive females was negligible. Between the ages of 6 and 8 years, many females began to reproduce successfully. Pups were born in May and June. The females' food intake decreased about 3 days before birth to cease the next day. By 2 days after birth, it had usually returned to normal. On average, female intake increased in the year of conception, the year of birth, during which the pup was suckled for 6 months, and the following calender year, during which the pup was weaned. Pups began to eat fish at around 11 months of age, and were fully weaned 2 to 23 days after that. Male weight and body length appeared to increase until around 20 years of age. Females appeared to increase in body length until 6 years and in weight until about 13 years of age. The relationship between standard body length and body weight is given. The heavier an animal, the lower its food intake as a percentage of body weight.
Key words: pinnipeds, energetics, lactation, pup, sexual dimorphism, weaning
Introduction species, and the proportions in which they are taken (Dyche, 1903; Scheffer and Neff,
The California sea lion (Zalophus California- 1948; Daugherty, 1965; Fiscus and Baines, nus californianus; Lesson, 1828) is distributed 1966; Keyes, 1968; Jameson and Kenyon, along the west coast of North America, from 1977; Bowlby, 1981; Everitt et ah, 1981; Jones, Baja California to British Columbia (Odell, 1981; Ainley et ah, 1982; Bailey and Ainley, 1981). The stomach contents and fish otoliths 1982; Antonelis et ah, 1984 and 1990; Au-in the faeces of wild California sea lions have doles et ah, 1984; Roffe and Mate, 1984; Low-been widely studied, providing data on prey ry et ah, 1991). Although regional, seasonal
479

R.A. Kastelein et al.
and annual changes were demonstrated in diet, very little is known about daily food intake, or variations in intake due to time of year, reproductive status, age, sex, or ambient temperature (Bryden, 1972). As, at present, such information is impossible to collect in the field (Beddington et al, 1985), it must be obtained from animals kept in human care.
This paper, therefore, describes the food consumption of California sea lions at the Harderwijk Marine Mammal Park and may be relevant to other institutions which keep California sea lions and for the management of wild populations.
Materials and methods
Study animals Twelve male and 14 female California sea lions of diverse age and origin were maintained in human care (Table 1). The number of animals varied during the study period as some died and, to prevent overpopulation and inbreeding, a number were moved to other zoos. Also, pups were born during the study period. Age 1 is defined as the first calendar year after the year of birth. Male 015 was castrated at the age of 6 years, and male 050 at the age of 5 years.
Study areas The study was carried out at the Harderwijk Park, which lies in the central Netherlands (5°37' E and 52°20' N). The animals were maintained either in an outdoor enclosure with a freshwater pool (21 m x 4 m, 2 m deep), or in an indoor enclosure with a saltwater pool (17 m x 8 m, 2.5 m deep). Most animals were housed in both pools at some time in their live. The average monthly outdoor water temperature varied between 10°C in February and 20°C in July (annual average 14°C), while the average monthly
air temperature varied between -0.3°C in February and 16.8°C in July (annual average 11°C). Indoors, the average monthly water temperature varied between 16°C in January and 21 °C in August (annual average 18°C), and the average monthly air temperature varied between 5°C and 25°C (Fig. 11). In either case, the study animals were exposed to the natural light cycle as the indoor enclosure had many windows.
Feeding The sea lions were fed 3 to 6 times per day on a diet of on average 40% mackerel (Scomber scombrus), 40% herring (Clupea harengus), 15% sprat (Sprattus sprattus) and 5% squid (Illex spp.), based on weight. Multi-vitamins (Seavit ®) were added to this diet after it had been defrosted. During the last feed of the day, feeding continued until the animal began to play with its food instead of consuming it quickly. This was considered a sign of satiety. In February, however, the food intake of those animals used in shows was deliberately reduced by 10 to 20% to facilitate training. The daily food intake of each individual since 1967 was recorded. Only food records of healthy animals were used in this study.
Body measurements The weight and standard body length, the straight line between nose and tail tip, were measured in a number of the study animals.
Statistics The seasonal fluctuations in food intake between years were tested with the Kendall's coefficient of concordance test. The average daily food intake of each month of a year was given a rank number from 1 to 12.
Results
Annual food consumption The annual food consumption of males in-
480

Food consumption of California sea lions
0 JC.
E CD
•D O O
CD TJ O O
0 v-
cp 0 > . c
< to
S
T3 C
c O
(0
u
5
en
H
c O)
o CD to
X CD
CO
co E c <
2 P P P
in t -o o 0 o 1 I N N o o N N
CM CM CM CM CM CO CM O CM ~ O O O
N N N
C M C M C M C M O O C M C M C M
' " o o o o o o o I X I I I I I
O O O _ w —
N N N N N N
•i- i - O O O O I I I J - J _ . ^ J - - ^ . J - - ^ J -N N N - O T 3 - O N N N N N N N N o o o = = = o o o o o o o o
o X
5 & 5 N N N N N N N N
o o o o m c D c o c o o o o o - ^ o o o o o o o o o o o
c
I c c Z3
2 2 2 32 § i 5 I
CO 1 - - i - •>- o ( O N S S C O O) CO O) O) o>
o co co CD in f- o o o o , •A 4 4 4 -A ' O CM CM CM CM
O T - LO O CO 00 CO CO O) O) 0 ) O)
i - • * CM CO , i - O i - O i
' s i n 6 4 ' T - - i - i - CM
O CD " * S C O N 0 ) 0 ) 0
CM O) O , , O O -r-
' N O C O CM CM O
LO O) O)
I CO o
>-< < < < 0 0 0 0 en
T3
c CO CO CD c_ c CO r
en c CO CO
CD 1 _ c co r
c/) • 0 c CO CO
CD !_ C CO r
CO • 0
c CO CO 0
c CO r
- >
O 0 N c O
c CO CO 0 c-
_ l Z *T CO
Q .
;£ 0
"2 m
_ i
z V 1 -CO
j5 0
m
Z
F 3
CO
O "
< O
"-4-» CO
>%
0 0
0
c
c
Q. C11
0 CO
c
c
a. m
Q
0 CO c a
r
- I _ i _ i
z z z .*•" CO
s!
CD m
CO
a.
j5 0 "E m
v" CO
CL
? 0
m O O O O O X X 2 Q Q D X X X
<. u 2 CO •G m CO CO
c m 05
c o c o c o c o c o c o c o c o O o Q . Q . C L Q . Q . Q . Q . Q .
JX. x. x. ^. x. ^ ^ c - * isj
f I I f Fit! e-0 0 0 0 0 0 0 0 0 ' D " D T 3 ' D ' D T 3 " D ' 0 5
- Q - 0 ' ^ ' : - ' : - ' - ' - * : - ' - ' - - 5 = : = C O C O C O C O C O C O C O C O C
5 5 I X X X X X X X <
O O O O CO N S N o a) O) a)
+1 +1 +1
CO CO CO r- i-- t--o> o o)
• 1 1 LO CO CD O O O
^ 1 1 1 O O) CM
+1 CO O CM
N C O O ) O O T - N ^ * 0 0 0 0 0 0 0 ) 0 ) 0 ) 0 ) 0 ) 0 ) o o o o o o o o o
O CM O) LO CD CD eocos cococo o o o) o a> o) ' - T T V T V T o i c o c t V V T V T T T T V h-CDCOLnLOLOCOCDCOCDlOCOLOCDCDCOCDCOCO 0 ) 0 0 0 0 0 0 0 ) 0 ) 0 ) 0 0 0 0 0 0 0 0 0
+1 1-
LL LL LL LL
O CO CO T- O CO CM CO CO O -H -H
LL LL LL
O - i - i - C O C M C O C n - i - C M • H C O O C O O C M I - O O T -
T - p j ' t m c D s c o c B O T - w n ^ i n ^ m o O ' - N c O ' t m t D c o o O O O O O O O O i - i - i - i - i - i - C M C M - < t L O i r ) L O L O l O L O L O L O C O 0 0 0 0 0 0 0 0 0 0 0 0 0 0 0 0 0 0 0 0 0 0 0 0 0 0 X X X X X X X X X X X X X X X X X X X X X X I X X X N N N N N N N N N N N N N N N N N N N N N N N N N N 0 0 0 0 0 0 0 0 0 0 0 0 0 0 0 0 0 0 0 0 0 0 0 0 0 0 N N N N N N N N N N N N N N N N N N N N N N N N N N
481

R.A. Kastelein et al.
18 20 Age (year)
B. Females 4500-1
o Indoors * Outdoors
8 10 12 14 16 18 20 22 24 26 28 30 Age (year)
Figure 1. The annual food consumption of male (a) and female (b) California sea lions housed indoors and outdoors at the Harderwijk Park. Age 1 represents the first calendar year after the year of birth. 1) Year in which the animal was castrated. * Year in which a pup was born and suckled. + Year in which a full-term dead pup was born.
482

Food consumption of California sea lions
B 40 T JC
inta
ke p
er d
ay
OI O
O
I
•a | 2 0 -•o
•g 15 -o
Max
imum
re
O O
I o
•r
• Males A Females
• •
• • •
• • • • • ..-•"' •
• •
A
A A
A A * A
4 • " — - A
* - -
- 1 1 1 1 1 1 1 1 1 1 1 1 1 1 1 1 - 1 1 1 1 1 1 1 1 1 1 1 1
1 3 5 7 9 11 13 15 17 19 21 23 25 27 29 31 Age (year)
Figure 2. The maximum consumption in one day by male and female California sea lions of different ages. The dashed lines are hand-drawn.
creased until around 10 years of age, stabilizing at around 4000 kg/year (Fig. 1 a). The food consumption of the castrated males 015 and 050 remained lower. Intake of males when housed indoors was similar to when housed outdoors. The annual food consumption of females increased until the age of 3 years (Fig. 1 b), and stabilized at around 1800 kg/year for females housed outdoors and at around 1400 kg/year for those housed indoors.
Maximum consumption in one day The maximum consumption by a male was 35.5 kg/day at 16-years of age. The most eaten by a female was 19 kg/day by a 6-year-old animal (Fig. 2).
Seasonal changes Between the age of 4 and 7 years, males
began to show a seasonal fluctuation in food intake. Taking male 006 as a representative example, monthly intake did not vary significantly between the age of 3 and 5 years, showing only a slight decrease in summer (Fig. 3 a; Kendall's coefficient of concordance x? = 13.53, p < 0.001). Between the age of 6 and 17 years, food intake showed a significant seasonal fluctuation, falling generally below average between May and August, and remaining high for the rest of the year, except in February, when his food ration was reduced for training purposes (Fig. 3 b; Kendall's coefficient of concordance Xl =67.58; p < 0.001). The reduction in food intake by adult males (older than 4 years) during the summer was associated with an increase in aggressive behaviour.
The food intake of non-reproductive, adult
483

R.A. Kastelein et al.
females showed little seasonal fluctuation. Female 001, as a representative example, ate on average slightly less during the first half of the year than during the second half between the age of 7 and 31 years (Fig. 4 a; Kendall's coefficient of concordance %J = 57.55; p < 0.001). Again, food intake in February was reduced for training purposes. Food intake of reproducing females, however, fluctuated more strongly. Between the age of 6 and 13 years, female 012, as a representative example, delivered and suckled a pup every year, generally eating less than average between February and July, but more than average between August and January (Fig. 4 b; Kendall's coefficient of concordance i] = 52.8; p < 0.001).
Perinatal changes Between the age of 6 and 8 years, many females began to reproduce successfully (Table 2). Pups were born (Figs. 5 and 6) in May and June (Table 1).
The daily food intake of 5 females was examined for 5 days before and 5 days after parturition (n = 18 births). Food intake usually
began to decrease 3 days before birth, ceasing entirely between 2 days before birth and the day of birth. Feeding generally resumed the day after birth, and by 2 days after birth the daily food intake had returned to normal.
The effects of pregnancy and lactation separately on food intake were investigated separately in 3 cases in which a pup was born and raised by a female not lactating at the time of conception and which did not become impregnated immediately after parturition. On average, females ate 13% more during the calendar year of conception, 6% more during the calendar year of parturition (which included around 6 months of lactation) and 18% more during the following calendar year (during which the pup was suckled for some months, then weaned) than during previous years in which they were not pregnant or lactating.
Transfer to solid food Pups began to eat fish around the age of 11 months (Table 3), and when force-fed, were eating independently within 2 to 23 days. In
Table 2. Ages (in years) at which female California sea lions at Harderwijk Marine Mammal Park gave birth.
Successive pup
First Second Third Fourth Fifth Sixth Seventh Eighth Ninth
ZcZH001
13* 14* 15* 18 ~ — --—
ZcZH003
8* --— — — --~
Female ZcZH005
4* 5* 8 — ~ — --~
ZcZH008
8 12 -— — — -~ ~
ZcZH012
6 7 8 9
10 11 12 13 15
pup born dead
484

Food consumption of California sea lions
one case, when a pup was abandoned by its mother at an early age, the transfer to solid food was expedited by force-feeding fish; this pup (ZcZH054) voluntarily began to eat fish at the age of 6 weeks.
Growth Males appeared to increase in body length until around 20 years of age, while female body length stabilized at the age of about 6 years (Fig. 7 a). Body weight in males increased at least until 20 years of age; in females until 13 years of age, after which it appeared to decrease (Fig. 7 b).
There is a clear positive relationship between standard body length and body weight in both male and female sea lions (Fig. 8).
Daily food intake as a percentage of body weight Average daily food intake as a percentage of body weight shows a clear decrease with body weight (Fig. 9).
Discussion and conclusions
Age related changes and sexual differences California sea lions are highly sexually dimorphic (Lluch-Belda, 1969 a and b; Odell, 1972; McLaren, 1993; Fig. 10), males being much larger than females by the time they are reproductively active, at about 4 years of age (Odell, 1972). The present study shows that until 3-4 years of age, males and females consumed a similar amount of food; thereafter, male consumption was much higher (Fig. 1), except for those castrated. Males in the present study continued to grow for much longer than females. Wild females have been shown to be socially mature at 6-8 years of age, while males do not mature socially until 9 years of age, although both sexes continue to grow somewhat (Lluch-Belda, 1969 a; Spalding, 1964). Although fe
males in the present study were shorter than those of similar age reported by Spalding (1964), this may be due to a different measuring technique (straight line or following the body contour). A linear relationship has been demonstrated between body weight and standard body length for male California sea lions caught in Puget Sound, Washington, between November and June (Gosho et ah, 1995). During those months, however, males gain weight, so such a formula, lacking a girth measurement, may be of little significance. Males in Puget Sound weighed less than animals of similar length in the present study (Fig. 8), although this may be due to the latter being measured at irregular intervals, and not in a particular season such as often occurs in field studies (usually during the mating season when males may already have lost weight).
Food intake of females was lower among those housed indoors; male intake did not vary with housing (Fig. 1). As adult females have a larger surface area to body ratio than males, they would be expected to lose more heat to convection than males and thus require more energy in the colder outdoor enclosure.
Maximum consumption in one day The maximum daily food intake values (Fig. 2) indicate that the stomach capacity of a California sea lion is larger than necessary for the average daily intake calculated over 1 year, indicating that individuals can exploit temporally high prey densities. Adult males ate more than average between September and April, so the large stomach capacity may also be an adaptation to allow accumulation of fat reserves.
Seasonal changes Seasonal fluctuations in food intake are unlikely to have been caused by variations in
485

R.A. Kastelein et al.
A. Male 006 1 3 -5 years
60-
50-
40-
30-
20-
10-
0
•10
-20-
-30-
-40
-50
-60
-70
B. Male 006 7 0 "" 6-17 years 60-
50-
40-
30-
20-
10
0
-10
-20
-30
-40
-50
•60-
-70-
r+
M M N 0 Month
M M N D Month
Figure 3. The deviation (%) in average monthly food consumption of male California sea lion 006. a) Between 3 and 5 years of age (n = 3), and b) between 6 and 17 years of age (n = 12). * Reduced food consumption due to reduced food availability. The bars indicate the standard deviations.
486

Food consumption of California sea lions
A. Non-reproductive female 001 50 n
40-
30-
20-
o 10 -+ J CO
"5 ft -o a 55-10-
-20-
-30-
-40-
-50-
7 - 31 years
*
I l
M M N D Month
B. Reproductive female 012 n 6 - 1 3 years
40 -
30 H
20
1 10
n I ° £ -10
-20-
-30-
-40-
-50
Pupping period
M M N D Month
Figure 4. The deviation (%) in average monthly food consumption of a) non-reproducing female California sea lion 001 between 7 and 31 years of age (n = 25) and b) of female 012 between the age of 6 and 13 years during which she delivered and suckled a pup every year (n = 8). * Reduced food consumption due to reduced food availability. The bars indicate the standard deviations.
487

R.A. Kastelein et al.
Figure 5. A breech delivery of a California sea lion pup (Photo: Henk Merjenburgh).
Figure 6. A California sea lion pup just before its first suckling bout. Note the membrane on the mother's belly and the umbilicus on the pup (Photo: Henk Merjenburgh).
488
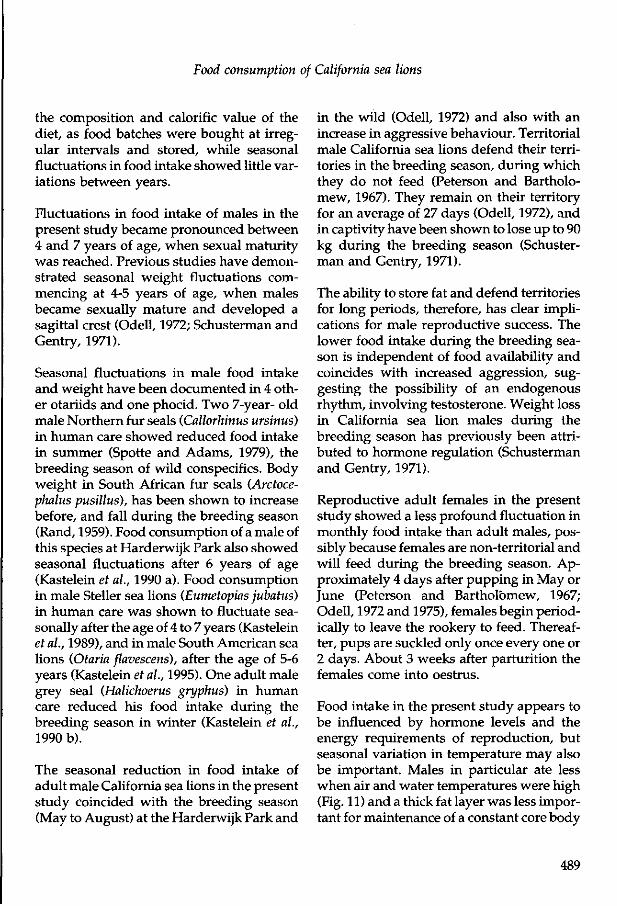
Food consumption of California sea lions
the composition and calorific value of the diet, as food batches were bought at irregular intervals and stored, while seasonal fluctuations in food intake showed little variations between years.
Fluctuations in food intake of males in the present study became pronounced between 4 and 7 years of age, when sexual maturity was reached. Previous studies have demonstrated seasonal weight fluctuations commencing at 4-5 years of age, when males became sexually mature and developed a sagittal crest (Odell, 1972; Schusterman and Gentry, 1971).
Seasonal fluctuations in male food intake and weight have been documented in 4 other otariids and one phocid. Two 7-year- old male Northern fur seals (Callorhinus ursinus) in human care showed reduced food intake in summer (Spotte and Adams, 1979), the breeding season of wild conspecifics. Body weight in South African fur seals (Arctoce-phalus pusillus), has been shown to increase before, and fall during the breeding season (Rand, 1959). Food consumption of a male of this species at Harderwijk Park also showed seasonal fluctuations after 6 years of age (Kastelein et ah, 1990 a). Food consumption in male Steller sea lions (Eumetopias jubatus) in human care was shown to fluctuate seasonally after the age of 4 to 7 years (Kastelein et al., 1989), and in male South American sea lions (Otaria flavescens), after the age of 5-6 years (Kastelein et ah, 1995). One adult male grey seal (Halichoerus gryphus) in human care reduced his food intake during the breeding season in winter (Kastelein et al., 1990 b).
The seasonal reduction in food intake of adult male California sea lions in the present study coincided with the breeding season (May to August) at the Harderwijk Park and
in the wild (Odell, 1972) and also with an increase in aggressive behaviour. Territorial male California sea lions defend their territories in the breeding season, during which they do not feed (Peterson and Bartholomew, 1967). They remain on their territory for an average of 27 days (Odell, 1972), and in captivity have been shown to lose up to 90 kg during the breeding season (Schuster-man and Gentry, 1971).
The ability to store fat and defend territories for long periods, therefore, has clear implications for male reproductive success. The lower food intake during the breeding season is independent of food availability and coincides with increased aggression, suggesting the possibility of an endogenous rhythm, involving testosterone. Weight loss in California sea lion males during the breeding season has previously been attributed to hormone regulation (Schusterman and Gentry, 1971).
Reproductive adult females in the present study showed a less profound fluctuation in monthly food intake than adult males, possibly because females are non-territorial and will feed during the breeding season. Approximately 4 days after pupping in May or June (Peterson and Bartholomew, 1967; Odell, 1972 and 1975), females begin periodically to leave the rookery to feed. Thereafter, pups are suckled only once every one or 2 days. About 3 weeks after parturition the females come into oestrus.
Food intake in the present study appears to be influenced by hormone levels and the energy requirements of reproduction, but seasonal variation in temperature may also be important. Males in particular ate less when air and water temperatures were high (Fig. 11) and a thick fat layer was less important for maintenance of a constant core body
489

R.A. Kastelein et al.
A 250 n
•g-200-
• Males Harderwijk * Females Harderwijk o Males literature * Females literature
O)
o .Q
150
100
I 50H
Males
V...
\ Females
-i—i—i—i—i—i—i—i—i—i—r- • i i i i i i •
6 8 10 12 14 16 18 20 22 24 Age (year)
500-
450-
400-
- . 350-o> * 300-2 £ 250-
>. 200-o m 150-
100-
50-
OJ
t. • Males Harderwijk o Males literature
Males
• •
•
A Females Harderwijk A Females literature
•
•
Females
/
— i — i — i — r — T — i — r — i — i - l — i — i — i
6 8 10 12 14 16 18 20 22 24 Age (year)
Figure 7. Body length (a) and weight (b) of male and female California sea lions from the present study (one measurement per animal) and of wild animals (Odell, 1972; Lluch-Belda, 1969 a and b). The dashed lines are hand-drawn.
490

Food consumption of California sea lions
ouu -
450-
400-
350-
a. 3oo-
Bod
y w
eig
ht
o
o
o
100-
50-
0- -•-»-*&#••*-*
• Males Harderwijk A Females Harderwijk o Males literature A Females literature
A
. -A - -" " "
/
•ft--''
I
0 •'
/
/
i 1 1 r—
•
— i 1 1
60 80 100 120 140 160 180 200 220 240 260
Standard body length (cm)
Figure 8. The relationship between standard body length and body weight of male and female California sea lions from the present study (one measurement per animal) and of wild animals (Odell, 1972; Lluch-Belda, 1969 a and b).
5 o J3
M <0
c o
c o 8 * •o o o
n •a at S 0)
10
9H
8
7 -
6 -
5
4 -
3 -
2
1 H
o
Males Females
i i i i i i i i i i i i i i i i i i i i i i i i i i i i i i i i i i i i i i i i i i i i
40 80 120 160 200 240 280 320 360 400 440
Body weight (kg)
Figure 9. The relationship between body weight and daily food intake as a percentage of body weight in male and female California sea lions housed outdoors at the average Harderwijk Marine Mammal Park. One measurement per animal.
491

R.A. Kastelein et al.
temperature. In addition, conductive heat loss is lower as males spend very little time in water, which conducts heat 25 times more efficiently than air.
The primary breeding range of Califonia sea lions is from the Gulf of California to the
Channel Islands off the coast of Southern California. After breeding, males migrate northward along the coast of California, Oregon, Washington and British Columbia (Mate, 1975). It would be of interest to know whether they begin to feed during migration, or only after arrival at their wintering
Figure 10. A group of California sea lions at Harderwijk Park. The large animal on the right is an adult male, the animal in the centre is a dry adult female and the animal on the left is a wet adult female with her pup. Note the sexual dimorphism (Photo: Henk Merjenburgh).
492

Food consumption of California sea lions
areas. The migratory pattern of females and young is not clear.
Perinatal changes The timing of reproduction in females in the present study did not differ from that in the wild, females maturing at 6 to 8 years of age, and giving birth in May and June (Lluch-Belda, 1969 a; Peterson and Bartholomew, 1967; Odell, 1972 and 1975).
Monitoring of female food intake in May and June can be used to predict the time of birth, as it begins to drop 3 days before birth, only returning to normal 2 days after birth. The peak copulation period for California sea lions is July and the total gestation period is thought to be around 11 months, although implantation may be delayed until mid-October (Odell, 1972). In the present
study, during the first 3 months of real foetal development, females ate 13% extra. During the last 6 months of gestation and the first 6 months of suckling, food intake was 6% higher than usual. In the calendar year after the year of birth, when pups were suckled for about 6 months, females ate 18% more than usual. In theory, 3- to 5-week-old pups (weighing around 12 kg) require 2.4 times as much energy as adult terrestrial mammals of similar body mass (Thompson et ah, 1987). This is probably due to the high energy requirements for both growth and thermoregulation, as pups are poorly insulated. A large proportion of the energy obtained from milk is required for maintenance rather than growth, owing to the high energetic demands of the aquatic environment (Ofte-dal et al., 1987). Consequently, the fat content of California sea lion milk is higher than that
Table 3. The ages at which the California sea lion pups started to eat fish voluntarily. Suckling sometimes continued for some time afterwards.
Animal Sex Age at which first fish was eaten (months)
ZcZH007 ZC-ZH008 ZcZH013 ZcZHOH ZcZH015 ZC-ZH050 ZcZH051 ZCZH052 ZCZH053 ZcZH054 ZcZH055 ZCZH056 ZCZH058
F F F F M M F M M F F F M
15 10.5 13 12 11* 11.5 12.5 13* 11*
•4 * *
10 10
Force-fed after the mother stopped suckling. Independent feeding occurred within 2-23 days. Hand-raised on fish after being suckled for 1 month by its mother. Began to eat fish voluntarily after 14 days of force-feeding.
493

R.A. Kastelein et al.
Indoor
35?
w 30
E
Z 20 H £
I ^ 15
I 10i 2 i
Maximum sea surface
\
/
Indoor
Outdoor
Minimum sea surface
M M N
Figure 11. a) The average monthly outdoor and indoor air temperatures at the Harderwijk Park and b) The average monthly outdoor and indoor water temperatures at the Harderwijk Park and the average minimum and maximum sea surface temperatures in the distribution area of California sea lions in the wild.
494

Food consumption of California sea lions
of terrestrial mammals (47% water, 37% fat, 14% protein in milk drained from mammary glands (Pilson and Kelly, 1962) and 65% water, 15% fat and 19% protein in milk from a pup's stomach (Schroeder and Wedgeforth, 1935)).
Transfer to solid food Pups in the present study began to eat fish at the age of about one year. This is a little later than in the wild, where pups begin to wean themselves at about 6 months of age (Peterson and Bartholomew, 1967; Odell, 1972), possibly stimulated by encounters with live fish. They are, however, capable of digesting fish at a much earlier age: one animal in the present study, which was force-fed fish at an early age, grew to be a similar size as suckled animals of the same age class. It is possible that, in the wild, California sea lions do not eat fish before the age of 6 months because they are not yet sufficiently skilled to catch fish. At the Harderwijk Park, the pups were not provided with live fish. Dead fish was the first solid food they ate.
Ecological significance In order to estimate the food requirements of wild California sea lions it would be necessary to determine the temperatures that wild sea lions are exposed to, their activity levels and the calorific value of the diet in both the present study and in the wild. The diet in the present study consisted mainly of herring and mackerel and may have varied in both composition and calorific value depending on the year, age class and season in which the fish was caught (Geraci, 1975). Wild California sea lions eat a variety of prey, including many species of teleost fish, squid, shellfish and crustaceans, depending on geographical area and annual and seasonal availability (Dyche, 1903; Scheffer and Neff, 1948; Daugherty, 1965; Fiscus and Baines, 1966; Keyes, 1968; Jameson and Kenyon,
1977; Bowlby, 1981; Everitt et ah, 1981; Jones, 1981; Bailey and Ainley, 1982; Antonelis et al., 1984 and 1990; Aurioles et al, 1984; Roffe and Mate, 1984). Lowry et al. (1991) conclude that California sea lions are flexible specialists. They exploit a few resources at a time, but the composition of their diet changes over time, as the sea lions capitalize on the accessible prey.
Food consumption in females in the present study was partly influenced by ambient temperature; this relationship has also been observed in Northern fur seals (Spotte and Adams, 1981). Water temperatures in the present study may reflect those experienced by wild conspecifics, as both indoor and outdoor temperatures lay between the extremes for the distribution area of California sea lions (Fig. 11 b). Wild sea lions, however, experience colder water during dives, the majority of which are less than 80 m in depth (Feldkamp et al., 1989), although dives of up to 275 m have been recorded (Evans and Harmon, 1968; Ridgway, 1972). Dive depth and duration appear to be strongly influenced by the rate of prey encounter (Feldkamp et al., 1989). The haul-out pattern is also influenced by thermoregulation, as sea lions cannot sweat or pant to lose heat, and thus have to go into the water to cool off (Whit-tow et al, 1972 and 1975; Matsuura and Whittow, 1973; Odell, 1974; South et al, 1976).
At sea, California sea lions are active most of the time, and rest for about 3% of the time at the surface (Feldkamp et al., 1989). The animals in the present study were active, but could not make deep dives. In the present study, daily food intake lay between 3 and 9% of body weight, depending on size. A non-lactating female of 76 kg had a daily intake of approximately 5.5% of her body weight, when housed outdoors; during lac-
495

R.A. Kastelein et al.
tation, this increased to around 7%. The daily food intake of lactating wild females of similar size was estimated approximately 11% of their body weight (Costa et al, 1991). The 4% difference in food intake may be due to higher activity in the wild females or the inaccuracy of the estimation. The food consumption data presented in the present study therefore should be used only as a conservative estimate of food intake in wild California sea lions, as wild individuals dive deeper, requiring more energy for locomotion and thermoregulation than those in oceanaria.
Acknowledgements
We thank Teun Dokter, Jan Mosterd, Piet Mosterd and all animal care personnel at the Harderwijk Marine Mammal Park for recording the food consumption over the years. Our thanks also to Caroline Koopman and Danielle van der Laan for analyzing some of the data and Rob Triesscheijn for drawing the graphs. The average monthly air temperatures were provided by the Royal Dutch Meteorological Institute (KNMI). We thank Eleanor Hayes (University of Bristol, U.K.), Carolien Staal and Janny Hardeman for their comments on the manuscript.
References
Ainley, D.G., Huber, H.R. and Bailey, K.M. (1982) Population fluctuations of California sea lions and the Pacific Whiting fishery off central California. Fish. Bull. 80(2), 253-258.
Antonelis, G.A., Jr., Fiscus, C.H. and De-Long, R.L. (1984) Spring and summer prey of California sea lions, Zalophus californianus, at San Miguel Island, California, 1978-79. Fish. Bull. 82(1), 67-76.
Antonelis, G.A., Stewart B.S. and Perryman, W.F. (1990) Foraging characteristics of female northern fur seals (Callorhinus ursinus) and California sea lions (Zalophus california-nus). Can. J. Zool. 68, 150-158.
Aurioles, D., Fox, C , Sinsel, F. and Tanos, G. (1984) Prey of the California sea lion (Zalophus californianus) in the Bay of La Paz, Baja California Sur, Mexico. J. Mamm. 65(3), 519-521.
Bailey, K.M. and Ainley, D.G. (1982) The dynamics of California sea lion predation on Pacific whiting. Fish. Res. (Amst.) 1,163-176.
Beddington, J.R., Beverton, R.J.H. and La-vigne, D.M. (1985) Problems in estimating food consumption. In: Marine mammals and fisheries (Eds. Beddington, J.R., Beverton, R.J.H. and Lavigne, D.M.). George Allen and Unwin, London, 273-275.
Bowlby, C.E. (1981) Feeding behavior of pinnipeds in the Klamath River, northern California. M.A. theses, Humboldt State Univ., Areata, CA, 74 pp.
Bryden, M.M. (1972) Growth and development of marine mammals. In: Functional Anatomy of Marine Mammals. Vol. 1 (Ed. Harrison, R.J.). Academic Press, New York, 1-80.
Costa, D.P., Antonelis, G.A. and DeLong, R.L. (1991) Effects of El Nino on the Foraging Energetics of the California Sea Lion. In: Pinnipeds and El Nino (Eds. Trillmich, F. and Ono, K.A.). Springer-Verlag, Berlin, 156-165.
Daugherty, A.E. (1965) Marine Mammals of California. Cal. Dept. of Fish and Game, Sacramento, California, U.S.A.
496

Food consumption of California sea lions
Dyche, L.L. (1903) Notes on the food habits of California sea-lions (Zalophus california-nus, Lesson). Trans. Kansas Acad. Sci. 18, 179-182.
Evans, W.E. and Harmon, S.R. (1968) Experimenting with trained pinnipeds in the open sea. In: The behavior and physiology of pinnipeds (Eds. Harrison, R.J., Hubbard, R.C., Peterson, R.S., Rice, C.E. and Schusterman, R.J.). Appleton-Century- Crofts, New York, 211-296.
Everitt, R.D., Gearin, P.J., Skidmore, J.S. and DeLong, R.L. (1981) Prey items of harbor seals and California sea lions in Puget Sound, Washington. Murrelet 62, 83-86.
Feldkamp, S.D., DeLong, R.L. and Antone-lis, G.A. (1989) Diving patterns of California sea lions (Zalophus californianus). Can. J. Zool. 67, 872-883.
Kastelein, R.A., Vaughan, N. and Wiepke-ma, P.R. (1989, chapter 4.1) The food consumption of Steller sea lions (Eumetopias ju-batus). Aquatic Mammals 15(4), 137-144.
Kastelein, R.A., Verhoeven, I. and Wiepke-ma, P.R. (1990 a, chapter 4.4) The food consumption of South African fur seals (Arcto-cephalus pusillus) at the Harderwijk Marine Mammal Park. Int. Zoo Yearb. 29, 175-179.
Kastelein, R.A., Wiepkema, P.R. and Vaughan, N. (1990 b, chapter 3.2) the food consumption of Grey seals (Halichoerus grypus) in human care. Aquatic Mammals 15(4), 171-180.
Kastelein, R.A., Kershaw, J., Berghout, E. and Wiepkema, P.R. (1995, chapter 4.2) The food consumption of South American sea lions (Otaria flavescens). Aquatic Mammals 21(1), 43-53.
Fiscus, C.H. and Baines, G.A. (1966) Food and feeding behavior of Steller and California sea lions. J. Mammal. 47(2), 195-200.
Geraci, J.F. (1975) Pinniped nutrition. Rapp. P.-v. Reun. Cons. int. Explor. Mer 169, 312-323.
Gosho, M.E., Gearin, P.J., Jeffries, S.J. and Thomason, J.R. (1995) Size of male California sea lions in Puget Sound, Washington. Abstract of the 11th Biennial Conf. on the Biol, of Mar. Mamm., Orlando, 46.
Jameson, R.J. and Kenyon, K.W. (1977) Prey of sea lions in the Rogue River, Oregon. J. Mammal. 58(4), 672.
Jones, R.E. (1981) Food habits of smaller marine mammals from northern California. Calif. Acad. Sci. Proc. 42 (16), 409-433.
Keyes, M.C. (1968) The nutrition of pinnipeds. In: The behavior and physiology of pinnipeds (Eds. Harrison, R.J., Hubbard, R.C., Peterson, R.S., Rice, C.E. and Schuster-man, R.J.). Appleton-Century- Crofts, New York, 359-399.
Lluch-Belda, D. (1969 a) Cremiento y morta-lidad del lobo marino de California (Zalophus californianus calif ornianus). Ann. Esc. Nac. Cienc. Biol. Mex. 18, 167-189.
Lluch-Belda, D. (1969 b) El lobo marino de California, Zalophus californianus californianus (Lesson, 1828). Allen 1880. Observ-aciones sobre su ecologica y exploitacion. Inst. Mex. de Recursos Naturales Renova-bles, Mexico, D.F.
497

R.A. Kastelein et al.
Lowry, M.S., Stewart, B.S., Heath, C.B., Yo-chem, P.K. and Francis, J.M. (1991) Seasonal and Annual Variability in the Diet of California sea lions (Zalophus californianus) at San Nicolas Island, California, 1981-86. Fish. Bull. U.S. 89, 331-336.
Oftedal, O.T., Iverson S.J. and Boness, D.J. (1987) Milk and energy intakes of suckling California sea lion (Zalophus californianus) pups in relation to sex, growth and predicted maintenance requirements. Physiol. Zool. 60(5), 560-575.
Mate, B.R. (1975) Annual migration of the sea lions Eumetopias jubatus and Zalophus californianus, along the Oregon USA coast. Rapp. P.-v. Reun. Cons. Int. Explor. Mer. 169, 455-461.
Matsuura, D.T. and Whittow, G.C. (1973) Oxygen uptake of the California sea lion and harbor seal during exposure to heat. American Journal of Physiology 225(3), 711-715.
McLaren, I.A. (1993) Growth in pinnipeds. Biol. Rev. 68, 1079.
Odell, D.K. (1972) Studies on the biology of the California sea lion and the northern elephant seal on San Nicolas Island. Ph.D. Dissertation, University of California, Los Angeles.
Odell, D.K. (1974) Behavioral thermoregulation in the California sea lion. Behav. Biol. 10, 231-237.
Odell, D.K. (1975) Breeding biology of the California sea lion, Zalophus californianus. Rapp. P.-v. Reun. Cons. Int. Explor. Mer 169, 374-378.
Odell, D.K. (1981) California Sea Lion Zalophus californianus (Lesson, 1828). In: Handbook of Marine Mammals, Vol. 1. The Walrus, Sea Lions, Fur Seals and Sea Otter (Eds. Ridgway, S.H. and Harrison, R.J.), 67- 97.
Peterson, R.S. and Bartholomew, G.A. (1967) The natural history and behaviour of the California sea lion. Special publ. no. 1. The Amer. Soc. of Mamm. pp 79.
Pilson, M.E.Q. and Kelly, A.L. (1962) Composition of the milk from Zalophus californianus, the California sea lion. Science, 135,104-105.
Rand, R.W. (1959) The Cape fur seal (Arcto-cephalus pusillus). Distribution, abundance and feeding habits off the southwestern coast of the Cape Province, Union of South Africa. Invest. Rep. Div. Fish., Dept. Comm. Ind., 34, 1-65.
Ridgway, S.H. (1972) Mammals of the Sea. Thomas, Springfield, 111.
Roffe, T.J. and Mate, B.R. (1984) Abundances and feeding habits of pinnipeds in the Rogue River, Oregon. J. Wildl. Manage. 48 (4), 1262-1274.
Scheffer, V.B. and Neff, J.A. (1948) Food of California sea lions. J. Mammal. 29(1), 67-68.
Schroeder, C.R. and Wedgeforth, H.M. (1935) The occurrence of gastric ulcers in the sea mammals of the California coast, their aetiology and pathology. J. Am. Vet. Med. Assoc. 87, 333-342.
498

Food consumption of California sea lions
Schusterman, R.J. and R.L. Gentry (1971) Development of a fatted male phenomenon in California sea lions. Developmental Psycho-biology 4(4), 333-338.
South, F.E., Luecke, R.H., Zatzmand M.L. and Shanklin, M.D. (1976) Air temperature and direct partitional calorimetry of the California sea lion (Zalophus californianus). Comp. Biochem. Physiol. 54A, 27-30.
Spalding, D.J. (1964) Age and growth of female sea lions in British Columbia. J. Fish. Res. Board. Can. 21(2), 415-417.
Spotte, S. and G. Adams (1979) Note on the food intake of captive adult male Northern fur seals (Callorhinus ursinus). Aquat. Mamm. 7(3), 65-67.
Spotte, S. and G. Adams (1981) Feeding rate of captive adult female Northern fur seals, Callorhinus ursinus. Fish. Bull. 79(1), 182-184.
Thompson, S.D., K.A. Ono, O.T. Oftedal and D.J. Boness (1987) Thermoregulation and resting metabolic rate of California sea lion (Zalophus californianus) pups. Physiol. Zool. 60(6), 730-736.
Whittow, G.C., Matsuura, D.T. and Lin, Y.C. (1972) Temperature regulation in the California sea lion (Zalophus californianus). Physiol. Zool. 45, 68-77.
Whittow, G.C., Matsuura, D.T. and Ohata, C.A. (1975) Physiological and behavioral temperature regulation in the California sea lion (Zalophus californianus). Rapp. P.- v. Reun. Cons. int. Explor. Mer, 169, 479-480.
499

Chapter 4.4
Int. Zoo Yb. (1990) 29: 175-179 t , The Zoological Society of London
The food consumption of South African fur seals Arctocephalus pusillus
at the Harderwijk Marine Mammal Park
R. A. KASTELEIN1, I. VERHOEVEN1 & P. R. WIEPKEMA2
1 Zeedierenpark Harderwijk (Harderwijk Marine Mammal Park), Strandboulevard-oost 1, 3841 AB Harderwijk, The Netherlands and 2Ethology Section, Department of Animal Husbandry, Agricultural University, PO Box 338, 6700 AH Wageningen, The Netherlands
The few authors that have studied the stomach contents of South African fur seals Arctocephalus pusillus in the wild (Rand, 1959; Warneke & Shaughnessy, 1985) have found that in terms of frequency of occurrence the diet was comprised of 50% fish, 37% cephalopods and 13% crustaceans. Based on volume, this was 70% fish, 20% cephalopods, 2% crustaceans and 8% miscellaneous. In order to get this food, A.pusillus may dive for as long as six minutes and reach depths of 180 m. Most fish are captured and swallowed whole under the water (Kooyman & Gentry, 1986). Rand (1959) reports that A.pusillus can be kept in good health on a daily allowance of 2-7 kg of fish. However, no other published detailed information could be found on the amount of food consumed per day depending on sex, age or time of year. Such data can, to some extent, be derived from food records of animals kept in marine mammal facilities.
In some sealion species, reports on weight changes have shown a marked annual cycle. Schusterman & Gentry (1971) described the seasonal fattening of c? California sealions Zalophus california-nus in captivity, which increased in weight before the onset of the breeding season. This phenomenon became visible at five years of age and was prominent when the animals reached full maturity. During the reproductive period they lost weight. It was suggested that this cyclic weight
change might be hormone dependent. Spotte & Adams (1979) noticed seasonal weight changes in adult $ Northern fur seals Callorhinus ursinus in marine mammal facilities. Kastelein et al. (1990) report on fluctuations in the food consumption of <$ and ? Steller's sealions Eumetopias jubatus that also seem to depend on an endogenous rhythm.
At the Harderwijk Marine Mammal Park food consumption of 1.1 A. pusillus was measured over several successive years. Food intake changes in relation to age, sex and time of year are presented and compared to the data found in similar studies on other otariids.
Other marine mammal parks which already keep or consider keeping this species may find the results presented here useful for energy studies or to evaluate the impact of this species on the fish populations in its distribution range.
STUDY ANIMALS & HOUSING Both animals studied were born in the wild in 1976 and arrived at the park in 1978.
The ? (ApZHOOl) was always kept in indoor enclosures with salt-water pools in which the water temperature ranged from 15-22°C and the air temperature from 5-25°C, though in the second part of her 12th calendar year (June-December) she was kept in an outdoor enclosure with a freshwater pool at the Harderwijk Marine Mammal Park (5°37'E, 52°20'N), in
501

R.A. Kastelein et al.
which the water temperature ranged from 4-14°C, while the air temperature ranged from -10-35DC annually. The J (ApZH002) was kept indoors until his ninth year and thereafter he spent short periods of each year (a few months per year, during different seasons) in outdoor freshwater exhibits. Both animals were subjected to the natural outdoor light cycle through windows in the roof of the buildings. The animals were kept together until the age of five years but after this they had to be separated because of the aggressive mating behaviour of the <J.
FEEDING They were fed three to six times per day on a mixed diet which on average consisted of 37% mackerel Scomber scom-brus, 22% herring Clupea harengus, 21% sprat Sprattus sprattus and 20% squid Illex spp., based on weight. Vitamins were added to the diet when it was thawed. The amount of food eaten per day was always determined by how much food the individual animals accepted. Therefore any changes in daily food intake were mainly determined by other environmental and endogenous factors that may regulate the individual's daily satiety. During the first or last feed of the day they were given as much as they would eat. When the animals started to play with the food instead of consuming it immediately, it was considered a sign of satiety and feeding stopped. From 1978 on, records have been kept of the amount and type of food consumed by each individual during each feed. Daily food intake data form the basis of the present analysis.
Age related changes and sexual differences The cj's annual food intake increased steadily until he reached the age of ten years when he stopped growing. After this he ate a little less and his annual food intake stabilized at c. 3000 kg (Fig. la). During his fifth year food intake was relatively low.
The $'s annual food intake increased at a similar rate to that of the $ until she was
3500-1
3000-
•=• 2500-^ 2 0 0 0 -
2 1500-
on
umpt
> o
Male ^
P__
£ " 2 3 4 5 6 7 8 9 10 11 12 S Age (year)
il fo
od
o
= 1500' < 1000.
500.
B. Female
2 3 4
_
5
[~H r 6 7 8 9 10 11 12
Age (year)
Fig. 1. The annual food intake (kg) of a j (A) and $ (B) South African fur seals Arctocephalus pusillus. Age one represents the first calendar year after the year of birth (according to Rand (1959) pups suckle for approximately eight months after birth).
four years old, when her food intake dropped considerably to a fairly constant level of 1100 kg a year (Fig. lb), although at 12 years old she ate more during the last six months of the year.
Seasonal changes The <J showed little seasonal fluctuation in food intake up to the age of six years (Fig. 2a) but thereafter ate less between May and August and more between October and January (Fig. 2b). The 9 consumed approximately the same amount of food all year round regardless of the month (Fig. 2c).
DISCUSSION AND CONCLUSIONS Although this study was carried out on only 1.1 fur seals, the data resemble those valid for other otariids investigated so far (Schusterman & Gentry, 1971; Spotte & Adams, 1979; Kastelein et al., 1990). Therefore the findings on these two animals may be representative.
Age related changes and sexual differences After their fourth year the food intake of the $ and $ started to differ. The ? had reached her maximum
502

The food consumption of South African fur seals
20'
J 10' .S 0'
1-10' 8 8 -20
A. age 2-6
vr^&-J> • 11 12
Month
60-50-
40-30-
20-
I 1°-1-10-9 8 -20-
-30-
-40--50-
age 7-12
. ,
_ l I—i 5 6 7 8 1 2 3 4 1 9 10 11 12
—I Month
-60J I—I
20 i
.2 1 0 '
1-10-
C. age 2-11
1 U3L-•5 rz 8 1 - '10 11 Mo
12 nth
°--20
Fig. 2. The deviation (%) of the average monthly food consumption of South African fur seals: A. <J between age two and six; B. <J between age seven and 12; C. $ between age two and 11.
size at this age but the c? continued to grow and the sexual dimorphism became apparent. Few pinnipeds have such a marked sexual dimorphism: the weight of adult (J(J may range from 134-363 kg whereas that of adult ?9 may range from 45-122 kg (Bonner, 1981; Warneke & Shaughnessy, 1985). The reduction of food intake during the cJ's fifth year was probably due to constipation, which appeared to be linked to his transportation to another pool. For almost five months paraffin oil was frequently added to the diet to improve the movement of food through his digestive tract.
After her fourth year, the $'s food intake remained relatively stable, probably owing to her non-reproductive state. Non-pregnant, non-lactating adult $ Steller's sealions also show a constant and
relatively low annual food intake (Kaste-lein et ai, 1990). The increase in food intake at 12 years of age was probably due to her transportation to the relatively cold environment of an outside pool (Fig. 2c). Rand (1959) observed that the great size of breeding bulls is maintained for about five summers, after which there is a regression in stature with senility. On the other hand, ?$ have a fairly constant size.
Seasonal changes The $ showed marked seasonal food intake fluctuations after his seventh year. The extreme reduction in food intake of the $ in June is shifted six months as compared with the breeding season in the southern hemisphere where the cJcJ are territorial and usually mate in December (Warneke & Shaughnessy, 1985). The reduction in food consumption of the $ in the present study coincides with the birth period of this species in other marine mammal facilities in the northern hemisphere (Carnio, 1982). This suggests that seasonal factors determine the hormonal changes that control the appetite of adult $<$ of this species. During the c. six-week breeding season in the wild, adult c?6* do not eat; they are occupied with defending their territories and with mating (Rand, 1959). The fact that the <$ in the present study reduced his food intake, despite the availability of food, suggests that this reduction is governed primarily by an endogenous rhythm. The beginning of the marked seasonal fluctuation after his sixth year (Fig. 2b) probably indicated that the animal had reached sexual maturity. Social maturity may occur a few years later. A similar annual food intake fluctuation was seen in Steller's sealions (Kastelein et al, 1990).
The reduction in food intake of the c?c? around June may not only be linked to their social or reproductive situation but also could improve their thermoregulation. Both in the wild and in the present study, the reduction in food intake occurred during a relatively warm period
503

R.A. Kastelein et al.
18 16 H
- 14 £12. I 10 I 8H
6 a E
4
2-1 0 1 2 3 4 5 6 7 8
1 9 10 11 12
Month
Fig. 3. The average monthly outdoor temperature at Harderwijk between 1978 and 1987.
of the year, when the large <$<$ in particular could have problems in cooling their bodies. The fluctuation of the outdoor temperature at the park is shown in Fig. 3. The indoor temperature does not reach the extremes but follows the same pattern of fluctuation. In autumn and winter the <Jo* compensate for the summer weight loss by an increased food intake, acquiring their maximum weight shortly before fasting for two months in the following summer (Rand, 1959).
Comparability limitations Rand (1959) reported on the stomach contents of two mature South African fur seal bulls: one with 10 kg offish and one with 13 kg of octopus. This was probably more than their average daily energy requirement, because South African fur seals go on feeding journeys of five to ten days, followed by a return to land of the same length of time. The average weight of food found in the stomachs of animals of this species was 1 kg. Kooyman & Gentry (1986) suggested a food requirement of 10-20% of the body weight per day for South African fur seals. The <J in the present study was only weighed once, on 19 December 1988, when he weighed 260-8 kg. That month he ate on average 10 kg a day, which means that this particular animal in this particular season and environment, and with the diet described took in 3-8% of his body weight per day. Because December was the month in
which his food intake was highest, and the animal was not yet fully recovered from his fasting during the summer, 3-8% would appear to be a maximum figure. Based on this one (J, a food intake estimate of 10-20% of body weight per day (Kooyman & Gentry, 1986) seems too high, although the animals of the present study did not have to expend much energy on catching fish. Rand (1959) also concluded that South African fur seals eat less than 10% of their body weight daily. However, intake quantities cannot simply be compared on the basis of the wet weight of different food species. Different species of fish can have a different energy content per unit of weight, and two fish of the same species can also show differences in nutritional or caloric values depending on season and geographical area in which the fish were caught.
This study indicates that it is risky to apply a simple percentage of bodyweight to calculate the daily food requirement of a population of South African fur seals. To assess reliably this requirement, one needs information on the climate, season, the diet, its caloric content, the digestive efficiency for different prey species, and the size, age and sexual structure of the fur seal population.
ACKNOWLEDGEMENTS
We thank Teun Dokter and Piet Mosterd for their help. We also thank all animal care personnel for recording the food consumption accurately over the years. The average monthly air temperatures were provided by the Royal Dutch Meteorological Institute (KNMI). We thank Frank Zeiss and Nancy Vaughan for their comments on the manuscript.
REFERENCES
BONNER, W. N. (1981): Southern fur seals Arctocephalus (Geoffroy Saint-Hilaire and Cuvier, 1826). In Handbook of marine mammals 1: The walrus, sea lions, fur seals and sea otter: 161-208. Ridgway, S. H. & Harrison, R. J. (Eds). London, New York: Academic Press. CARNIO, J. (1982): Observations on the mother and young interactions in captive fur seals (Arctocephalus pusillus pusillus). Aquatic Mamm. 9: 50-56. KASTELEIN, R. A., VAUGHAN, N. & WIEPKEMA, P. R. (1990): The food consumption of Steller sea lions
504

The food consumption of South African fur seals
(Eumetopias jubatus). Aquatic Mamm. 15: 137-144. KOOYMAN. G. L. & GENTRY, R. L. (1986): Diving behavior of South African fur seals. In Fur seals: maternal strategies on land and at sea: 142-152. Gentry, R. L. & Kooyman, G. L. (Eds). Princeton: Princeton University Press. RAND, R. W. (1959): The cape fur seal (Aretocephalus pusillus). Distribution, abundance and feeding habits off the southwestern coast of the Cape Province, Union of South Africa. Invest. Rep. Div. Fish., Dept. Comm. & Ind. No. 34: 1-65. Pretoria: The Government Printer. SCHUSTERMAN, R. J. & GENTRY, R. L. (1971): Development of a fatted male phenomenon in
California sea lions. Developmental Psychobiology 4: 333-338. SPOTTE, S. & ADAMS, G. (1979): Note on the food intake of captive adult male northern fur seals (Callorhinus ursinus). Aquatic Mamm. 7: 65-67. WARNEKE, R. M. & SHAUOHNESSY, P. D. (1985): Aretocephalus pusillus, the South African fur seal: taxonomy, evolution, biogeography and life history. In Studies of sea mammals in south latitudes: 53-78. Ling, J. K. & Bryden, M. M. (Eds). South Australian Museum.
Manuscript submitted 4 April 1989
505

Chapter 5
Odobenids (walruses)
507

Chapter 5.1
Food consumption and growth of Pacific walruses (Odobenus rosmarus divergens)
R.A. Kastelein1, N.M. Schooneman1 and P.R. Wiepkema2
1 Harderwijk Marine Mammal Park, Strandboulevard Oost 1, 3841 AB Harderwijk, The Netherlands
2 Emeritus Professor of Ethology, Wageningen Agricultural University, Stationsweg 1, 6861 EA Oosterbeek, The Netherlands
Summary
Food consumption and body weight were recorded for 5 male and 3 female Pacific walruses at the Harderwijk Marine Mammal Park, The Netherlands, between 1975 and 1997. Most pups came from the wild and received formulas during their first year at the park, although one male pup was born at the park, and was suckled. He began to eat fish at the age of 7 months and was fully weaned at the age of 19 months. There were substantial differences in annual food consumption between individuals of the same gender and age. The annual food consumption of 2 animals increased rapidly from around 5500 kg in their second year to 10000 kg in their fourth year, after which it decreased until to around 7500 kg at the age of 13 years. The annual food consumption of 2 other animals increased gradually from 4500 kg at the age of 4 years to around 7000 kg at the age of 12 years. Thereafter, annual food consumption of the 2 animals increased rapidly. In the female, this pronounced increase occurred in the year during which she was pregnant, gave birth, and suckled the pup for the rest of that calendar year and the following year. During gestation, her body weight increased from 750 kg to 1100 kg. The calendar year after delivery, her food intake remained above normal. For the entire lactation period, the mother consumed 91% more food than during similar periods in non-reproductive years. The year after weaning, food intake of the mother decreased below the pre-reproductive level. In the male, the rapid increase in food intake after the age of 12 years coincided with a strong secondary growth spurt, following sexual maturity. The annual food consumption of a third pair increased slowly from 5500 kg at the age of 2 years to around 6000 kg at the age of 4 years. During the first 4 years, the period of rapid growth, food consumption generally increased each month. Thereafter, there were seasonal fluctuations in food intake. These fluctuations appeared to be related to reproduction (February - April in males, and February in females) and moult (June - August). Daily food intake of individual walruses was very variable. Averaged over all available years, each animal had a maximum recorded daily food intake twice as high as the average daily food intake. Males grew from around 60 kg at birth to around 750 kg at the age of 6 years, and to around 1400 kg by the age of 14 years. Females grew from around 60 kg at birth to around 500 kg at the age of 5 years. The body weight of one female stabilized at around 1200 kg, that of another at 750 kg. Between weaning and attaining a body weight of 800 kg, individuals showed a negative relationship between body weight and food intake as a percentage of body weight. Adult walruses consumed between 2 and 3% of body weight per day.
Key words: p i nn iped , energetics, r eproduct ion , b ody weight , suckling, p u p
509

R.A. Kastelein et al.
Introduction
Although the relationship between the Pacific walrus (Odobenus rosmarus divergens) and its prey populations has been estimated within the species range (Fay et al, 1977), the study was based largely on benthic fauna, and little was known about the food requirements of walruses. Food consumption of wild Pacific walruses has previously been investigated only by examination of the stomach contents of dead animals (Nikulin, 1941; Brooks, 1954; Fay et al, 1977 and 1984 a; Lowry et al, 1980; Fay and Lowry, 1981; Fay, 1982; Fay and Stoker, 1982; Fay and Burns, 1988). Prey consumption consists principally of bivalve molluscs, buried in the mud at depths of up to 100 m, although walruses may also sometimes predate on cetaceans and pinnipeds (Brown, 1868; Mansfield, 1958; Loughrey, 1959; Fay, 1982; Lowry and Fay, 1984; Fay et al, 1990). Pits and furrows have been observed in the ocean floor, with discarded shells nearby, apparently caused by foraging walruses (Ray, 1973; Oliver et al, 1983 and 1985; Nelson and Johnson, 1987). Examination of the tracks left in the sediment after foraging, suggested an excavation technique later confirmed in experi
ments with walruses in a pool (Kastelein and Mosterd, 1989).
More specific data, such as total food consumption per day, fluctuations in food intake during the year, and changes in intake due to age, sex or individual differences is difficult to obtain from animals in the wild. With current techniques, this type of data can be obtained only from food records of captive animals. Although walruses in marine mammal parks are usually fed fish, not their natural invertebrate prey (Fay, 1982), changes in food intake in response to specific external and internal factors can be studied. Such records have already been published (Reventlow, 1951; Bridges, 1953; Hagen-beck, 1962; Brown and Asper, 1966; Gehn-rich, 1984; Dittrich, 1987; Fisher et al, 1992), and available information on food intake and growth of hand-raised walrus pups and one suckled animal has been summarized (Kastelein et al, 1998). However, the picture is still incomplete. The Harderwijk Marine Mammal Park has housed Pacific walruses and recorded their food intake since 1974. The aim of this study, therefore, is to describe the food intake and growth of walruses kept at the park.
Table 1. The gender, birth dates, places of origin and study period of the Pacific walruses used in the present study.
Animal
OrZHOOl OrZH002 OZH003 OrZH004 OrZH005 OrZH006 OrZH009 OrZH011*
Gender
M F M F M F M M
Birth date
May 1974 May 1974 1982 1982 June 1978 June 1978 June 1992 June 1995
Origin
Wrangel Island** Wrangel Island Alaska, U.S.A. Alaska, U.S.A. Wrangel Island Wrangel Island East Siberian Sea Harderwijk Park, NL
Study period
1975-1988 1975-1997 1986-1997 1986-1997 1980-1983 1980-1982 1994-1995 1996-1997
* offspring of male 003 and female 004. ** North east of Siberia.
510

Food consumption of Pacific walruses
24 i
o o
0) 3
2 © Q. E iB >» JZ *-» c o E a O) ni 0) > <
20
16
12
8
4
0
-4
-8
-1?
-16
-20 J
Water Harderwijk
\
M M N D Month
Figure 1. Average monthly water and air temperatures in the study area and average monthly air temperatures experienced by Pacific walruses in the wild.
Materials and methods
Study animals The gender, birth date, origin and study period of each of the 5 male and 3 female Pacific walruses used in this study are shown in table 1. The age estimates are considered accurate, as all animals arrived at an early age at the park. Age 1 is defined as the first calendar year after the year of birth. Most animals arrived in groups of 2 (animal 001 with 002, 003 with 004, 005 with 006, 009 with animal 010 which died of a tooth infection shortly after his transition from formula to a fish diet), which were kept together for several years after arrival. The study period for each animal includes only those years in which the individual was healthy. Animal 009 died of an intestine torsion, and animals 001, 005 and 006 from upper canine infections during the year after the end of their study periods (Table 1).
Study area The walruses were kept in an outdoor freshwater pool complex consisting of a main pool (20 m x 12 m) and a side pool (12 m x 9 m), both 4 m deep, and each with an adjacent, partially roofed land area (Kastelein and Wiepkema, 1989). The free chlorine level was maintained between 0.4 and 0.5 ppm and the combined chlorine level at 0.3 ppm. Average monthly water temperature varied between 9 and 19°C, while average monthly air temperature varied between -0.3°C in February and 17.5°C in July (Fig. 1). The Harderwijk Marine Mammal Park is located 5°37' E and 52°20' N.
Food The animals were fed 3 to 6 times per day on a diet averaging 35% herring (Clupea haren-gus), 26% mackerel (Scomber scombrus), 9% sprat (Sprattus sprattus), 2% whiting (Mer-langius merlangus), and 28% squid (Illex
511

R.A. Kastelein et al.
Figure 2. Female 004 and her pup Oil at the Harderwijk Marine Mammal Park (Photo: Henk Merjenburgh).
spp.), by weight. Vitamins were added to this diet. During the last meal of the day, the animals were fed ad libitum. Feeding was terminated as soon as the animals began to play with the food, instead of consuming it immediately: this was considered a sign of satiety. For each animal, the daily amount and type of food consumed was recorded.
Statistics The seasonal fluctuations in food intake between years were tested with the Kendall's
coefficient of concordance test. The average daily food intake of each month of a year was given a rank number from 1 to 12.
Results
Annual food consumption Most pups were obtained from the wild and received formulas during their first year at the park (Kastelein et al., 1998). Food consumption during this year, therefore, is not shown. Only male Oil (Fig. 2) was born at
512

Food consumption of Pacific walruses
the park in June and suckled. He began to eat fish at the age of 7 months, consumed around 1000 kg of fish, in addition to milk, during the first calendar year after birth and 3700 kg during his second year, after which he was fully weaned (Fig. 3).
consumption decreased to around 7500 kg at the age of 13 years. Food intake of female 002 remained stable until her 21st year, but increased during her 22nd year, after which it returned to 7100 kg. Male 001 never bred, or showed any sexual behaviour.
There were substantial differences in annual food consumption between individual animals of the same age and gender (Fig. 3). The animals usually arrived in groups of 2, which were housed together, and are referred to as couples, regardless of their sexual composition.
Male 001 and female 002 were 5 months of age when they arrived at the park. They were fed formula until the second month of their first year, and were on a complete fish diet by the following month. Annual food consumption increased rapidly from around 5500 kg in their second year to 10000 kg by their fourth year (Fig. 3). Thereafter, food
Male 003 and female 004 arrived at the park at the age of 4 years. Their annual food consumption rose gradually from 4500 kg at the age of 4 years to around 7000 kg at the age of 12 years, after which it increased rapidly. In female 004, this increase occurred during the year in which she was pregnant for 5.5 months, gave birth to pup 011 in June and suckled it for the rest of that calendar year and the following year. By January of her 15th year, the pup was completely weaned, and that year the food intake of the female was below the pre-reproductive level. Between his 12th and 14th year, male 003 showed a rapid increase in annual food consumption, from 7500 kg to 13000 kg, al-
14000 -i
3 12000
10000 •
8000
c o a. E 3 (0 c 8 6000 o
Z 4000 n 3 C < 2000
Male 001 Male 003 Male 005 Male 009
Female 002 Female 004 Female 006 Male 011
Birth of pup 011 and suckling
Suckling
Conception and gestation
First time successful breeding
- i — i — i — i — i — i — i — i — i — i — i — i — i — i — i — i — r — i — i — i i i — i — i
2 4 6 8 10 12 14 16 18 20 22 24 Age (year)
Figure 3. Annual food intake of male and female Pacific walruses at Harderwijk Marine Mammal Park. Age one represents the first calendar year after the year of birth.
513

R.A. Kastelein et al.
though it decreased to around 11000 kg in his 15th year. His first successful breeding attempt occurred during his 11th year.
Animals 005 and 006 were 2 months of age on arrival at the park, and were fed formula during a large part of their first full calendar year at the park; male 005 was on an exclusively fish diet by July and female 006 by November. Both animals showed an increase in annual food consumption from 5500 kg at the age of 2 years to around 6000 kg at the age of 4 years.
Male 009 arrived at the park 5 months of age. He was fed formula for part of his first complete calendar year at the park, and was fully weaned by September of that year. His annual food consumption was recorded for only 2 years. Between his second and third year, he showed an increase in annual food consumption similar to that of animals 001 and 002 at the same age, from around 4800 to 6700 kg.
Seasonal changes The food intake of male 001 increased rapidly until the age of 4 years (Fig. 3); a similar increase can also be seen within each year, between the age of 2 and 4 years (Fig. 4 a). The monthly pattern of food intake was similar in each of the 3 years (Kendall's coefficient of concordance test: x? = 20.68; p < 0.05). Moult occurred between June and July. After the age of 4 years, food intake began to show seasonal fluctuations with a similar pattern of monthly food intake in each of the following 9 years (Kendall's coefficient of concordance test: x? = 50.42; p < 0.001). He ate more than average between September and February and less than average during spring and summer (Fig. 4 b). During the study period he did not breed, nor did he show any sexual behaviour. Moult occurred between June and August.
Female 002 showed a similar pattern, with the monthly food intake patterns of all available years falling into 2 distinct periods. Food intake rose rapidly until the age of 4 years (Fig. 3)., with a gradual increase over the course of each year (Fig. 5 a). The monthly pattern of food intake was similar in each of the 3 years (Kendall's coefficient of concordance test: x? = 26.88; p < 0.005). Moult occurred between June and July. After the age of 4 years, food intake began to fluctuate seasonally, with a similar pattern of monthly food intake in each of the subsequent 16 years (Kendall's coefficient of concordance: X? = 72.68; p < 0.001). Food intake was above average between October and January and less than average in spring and summer (Fig. 5 b). The reduction in food intake in February coincided with oestrus and first occurred when she was 6 years of age. Moult took place between June and August.
The monthly food intake patterns of male 003 for all available years, can be divided into 2 periods. During his fourth year food intake showed a general increase as he grew rapidly, but a slight seasonal pattern appeared already (Fig. 6 a). Moult occurred in July. After the age of 4 years, food intake began to show more pronounced seasonal fluctuations, with a similar pattern of monthly food intake in each of the 10 years (Kendall's coefficient of concordance test: X?= 75.52; p < 0.001). Consumption was above average between August and January and less than average from February to June (Fig. 6 b). The mating season usually occurred between February and April, while moult took place between June and August.
Female 004 showed a similar pattern, already apparent when she was 4 years of age. Until the age of 11 years, when she was not pregnant or lactating, food intake fluctuated seasonally. The pattern of monthly food in-
514

Food consumption of Pacific walruses
A. Male 001 6 0 1 Age 2 - 4 years 50-
40-
30
20
o 10 H
Moult
0)
a -10 H
•20
-30-
-40-
-50-
-60-
M M N D
Month
B. Male 60-
50-
40-
30-
20-c . « ' .2 10 -«8 "5 0 -
s s - 1 0 : -20-
-30-
-40-
-50-
-60
t 001 Age 5-13 years
I
Moult I
—I ~\
M M N D
Month
Figure 4. The average percentage deviation in the average monthly food consumption of male walrus 001 between age 2 and 4 years (a) and between age 5 and 13 years (b). The bars indicate the standard deviations.
515

R.A. Kastelein et al.
60
50
40
30
20
I 10-1
A. Female 002 Age 2 - 4 years
Moult
-10-|
-20
-30
-40-
-50-
-60-
M M N D
Month
„„ B. Female 002 ou -
50 -
4 0 -
30-
20 -
o 10 -+•>
> 0 •
5 -io • -20-
-30-
-40-
-50-
-60 J
Age 5 -21 years
I Oestrus
Moult
—I— I —
M M N D
Month
Figure 5, between
. The average percentage deviation in the average monthly food consumption of female walrus 002 age 2 and 4 years (a) and between age 5 and 21 years (b). The bars indicate the standard deviations.
516

Food consumption of Pacific walruses
c o flj
I a
60 A. Male 003 1 Age 4 years
50
40 H
30
20
10
0
-10
-20
-30
-40
-50 H
-60
Moult
TZZI
M M N D
Month
60
50 H
40
30
20-I
B. Male 003 Age 5 -14 years
.2 10 +•» m > 0 «
-20
-30
-40-
-50
-60
Mating season Moult
M M N D Month
Figure 6. The average percentage deviation in the average monthly food consumption of male walrus 003 at the age of 4 years (a) and between age 5 and 14 years (b). The bars indicate the standard deviations.
517

R.A. Kastelein et al.
•a e
T3 O
-a
T3
T3 C 0)
T3
« 01 C . * O "B
.S CH
as 5
.5 g
o « £ 01
r bo
E g
g S3 0) (= '-•-I
H ° . «
« 3! 41 3
3 •§
> — N
g 2 2
• D O £ >% CO Q
<1) -
£J
i - !
CD >. CO <
o o
2
S 5 c | S < a5 o .
a) >. CM <
O O
£ S L J
0
^ o
£ s i j
© >. O) <
o o
3 2 l J
CO O
S o .
2
CD >. CO <
o o
3 2 CD >. T- <
o o
2
>•
. i n ^ i n 1 _ _ _ _ _ _ 1 1 1 1 1 1 1 1 1 1 1 1 l ^ ^ ^ l l l l l l l l l l l l
.CMLOCO i c M C M c o : : : : ! ! : : : : : !
, , , N n ^ ( O U ) ( D < O N C O C O l f i T - ,
* , , , n o ) 0 ) i f l o c o o ) c o ( o o n m . ! ! :c\ic\ic\ic\ieoeoooc\icoco<si-c\i !
o i m r M i j i n m w o o N o o . o> o T - C \ I C \ I C \ I C \ I C \ I C M C \ I C M C \ I C \ I C \ I ! ^~ CM
^ f f l O ) N O ) ( O l f l i - < D C O O ) 0 > l f l . C O T -T - C V J C O - ^ C O C O ^ I - T I - C O C O C O C O ' * ! • * •<*
CO o ^^ l l l l l l l l l l l l l l T~ | | | | | | | | | | | | | |
o o _ _ M l l l l l l l l l l l l l l l T ^ CM l l l l l l l l l l l l l l
CO 00 1 __ ^_ 1 1 1 1 1 1 1 1 1 1 1 1 1 1 ~ T^ 1 1 1 1 1 1 1 1 1 1 1 1 1
co in 1 r\l rf\ l l i i i i 1 i i i i l l l CM t*J i i i i i i i i i i i i i
U) m (D N 1 _ _ ^^— ^^— ^ ^ l l l l l l l l l l l 1 ~ 1 ^ T~ 1— l l l l l l l l l l l
, 1 - m c o T f , , , , I C M C M C M ^ - : ! : : ! : : : : : :
. , , C O ^ ( D ( D ( D N N O i - C O m O .
! ! i O J C O O O O O C N J W C O ' ^ - ' f r C O W C O !
c o i f l n s a j m i n n o j ^ m c v i c j , , , I - C \ I C \ I C \ I C \ I C \ I C \ 1 C \ I C \ I C \ I C \ I C M ! ! !
c o c o o x D o i o w T - w t c o c o o ) , . .
T - C M C ) ^ W ( D N 0 0 0 ) O i - W C 0 < t i n ( D
1 1 1 1 1 1 1 1 1 1 1 1 1 1
1 1 1 1 1 1 1 1 1 1 1 1 1 1
1 1 1 1 1 1 1 1 1 1 1 1 1 1
1 1 1 1 1 1 1 1 1 1 1 1 1 1
o o o o 1 - m o CM C\J CM CM CM CM CM
O) CM CM ^ G> CO O Tf ^ - CO co co -^- ^ t
1 1 1 1 1 1 1
1 1 1 1 1 1 1 1 1 1 1 1 1 1
1 1 1 1 1 1 1 1 1 1 1 1 1 1
1 1 1 1 1 1 1 1 1 1 1 1 1 1
1 1 1 1 1 1 1
1 1 1 1 1 1 1 1 1 1 1 1 1 1
1 1 1 1 1 1 1
1 1 1 1 1 1 1 1 1 1 1 1 1 1
1 1 1 1 1 1 1 1 1 1 1 1 1 1
1 1 1 1 1 1 1 1 1 1 1 1 1 1
1 ^ 00 O) O i - CM CO
.CD JX. O 3 (0 T3 C CO
E o n w co
Q.
Q .
.C O
c
(0
2
518

Food consumption of Pacific walruses
take was similar in each of the 8 years (Kendall's coefficient of concordance test: y% = 44.45; p < 0.001): above average between August and January, and below average from February to July (Fig. 7). The low food intake in February coincided with oestrus, and first occurred when she was 5 years of age.
Maximum food intake in one day Daily food intake of individual walruses appears to be very variable. The average and maximum recorded daily food intake of each animal at each age was noted (Table 2). Averaged over all available years, each animal had a maximum daily food intake approximately twice its average daily food intake.
Influence of reproduction on food intake One pup was born during the study period. In the calendar year of conception, the moth
er (animal 004) ate 7% more than in the previous year (Fig. 3). During the 15 month gestation, food consumption was 30% higher than in a similar period shortly before her pregnancy. During gestation, body weight increased from 750 kg to 1100 kg (Fig. 9 b). In the 5 months before parturition, her monthly food intake was fairly stable (Fig. 8). The day before birth, and the day of birth, daily food intake was 50% lower than in previous weeks, and stopped altogether for 5 days after birth. On the sixth day after birth, the female began to eat fish, and 6 days later her food intake had returned to a normal level. Three weeks after birth, her food intake increased rapidly. Her food intake increased for the first 4 months of lactation, after which it decreased (Fig. 8). During the entire suckling period (which was estimated to be 19 months, based on the moment that the food intake of the mother returned to a pre-repro-
60
50
40
30
20 H
I 10 ra > a
0
-10
-20
-30
-40
-50
-60
Figure 7. lactating
Female 004 Age 4-11 years
Oestrus
Moult I 1
r
M M N D Month
The average percentage deviation in the average monthly food consumption of non-pregnant, non-female walrus 004 between age 4 and 11 years. The bars indicate the standard deviation.
519
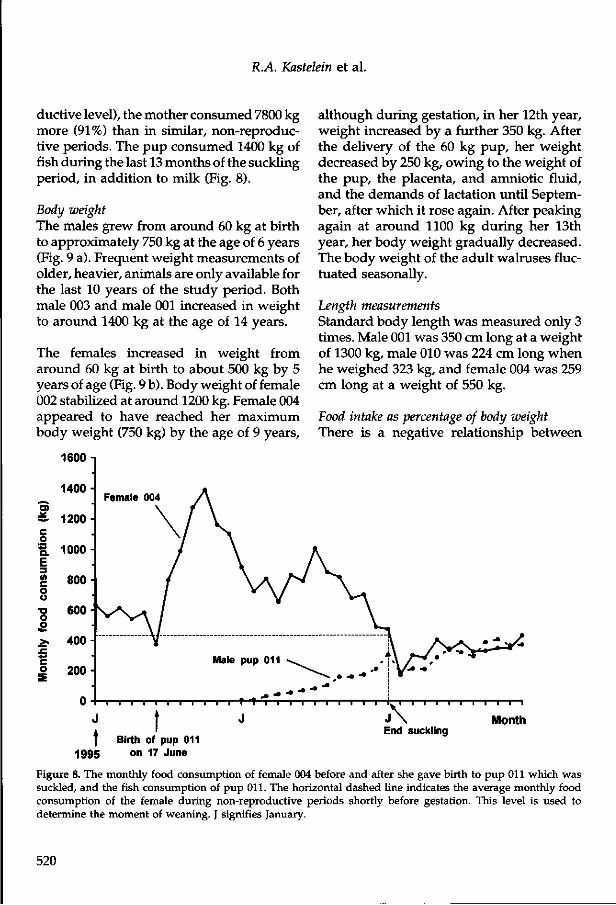
R.A. Kastelein et al.
ductive level), the mother consumed 7800 kg more (91%) than in similar, non-reproductive periods. The pup consumed 1400 kg of fish during the last 13 months of the suckling period, in addition to milk (Fig. 8).
Body weight The males grew from around 60 kg at birth to approximately 750 kg at the age of 6 years (Fig. 9 a). Frequent weight measurements of older, heavier, animals are only available for the last 10 years of the study period. Both male 003 and male 001 increased in weight to around 1400 kg at the age of 14 years.
The females increased in weight from around 60 kg at birth to about 500 kg by 5 years of age (Fig. 9 b). Body weight of female 002 stabilized at around 1200 kg. Female 004 appeared to have reached her maximum body weight (750 kg) by the age of 9 years,
1600
although during gestation, in her 12th year, weight increased by a further 350 kg. After the delivery of the 60 kg pup, her weight decreased by 250 kg, owing to the weight of the pup, the placenta, and amniotic fluid, and the demands of lactation until September, after which it rose again. After peaking again at around 1100 kg during her 13th year, her body weight gradually decreased. The body weight of the adult walruses fluctuated seasonally.
Length measurements Standard body length was measured only 3 times. Male 001 was 350 cm long at a weight of 1300 kg, male 010 was 224 cm long when he weighed 323 kg, and female 004 was 259 cm long at a weight of 550 kg.
Food intake as percentage of body weight There is a negative relationship between
1400 D) ==• 1200 c o * 1000
o o •a o o
c o
800
600
400-
200-
Month
f Birth of pup 011 1995 o n 1? J u n e
Figure 8. The monthly food consumption of female 004 before and after she gave birth to pup 011 which was suckled, and the fish consumption of pup 011. The horizontal dashed line indicates the average monthly food consumption of the female during non-reproductive periods shortly before gestation. This level is used to determine the moment of weaning. J signifies January.
520

Food consumption of Pacific walruses
3 4- i
O)
1 ><
TJ O
GO
1600-
1400-
1200-
1000-
800-
600-
400-
200-
0 -
V. . Male 001 * Male 003 • Male 005 ^ Male 008 + Male 009 -m- Male 010 -a- Male 011
1 1 1 1 1 1 1 1 1 1 T 1 1 1 1 1
8 9 10 11 12 13 14 15 16 Age (year)
B. -o- Female 002 -x- Female 006
Female 004 Female 007
Figure 9. The weight changes of male (a) and female (b) Pacific walruses at Harderwijk Marine Mammal Park. Data points with a long time span in between are connected with dashed lines.
521

R.A. Kastelein et al.
body weight and daily food intake as percentage of body weight up to around 800 kg. In heavier animals, there is no further percentage decline (Fig. 10).
Discussion and conclusions
Age and sex-related differences in food intake and body weight Large differences in annual food intake between individual animals of the same age are apparent until the age of 12 years. During that period, there was little difference in food intake within couples, although in each case, the male tended to eat more than the female. The large differences in food intake between couples 001+002 and 003+004 before the age of 12 years may have been due to the small size of female 004 (Fig. 9 b), or the particularly pronounced decrease in the food intake of male 003 during the breeding
season (Fig. 6), resulting in a low annual food intake.
After the age of 10 years, male 003 showed a rapid increase in food intake. This may have coincided with a secondary growth spurt, related to sexual maturity. He bred successfully for the first time at the age of 11 years, which probably coincided with his maturation, as the females, which mature in the wild at 4 to 8 years of age (Fay, 1982), were of similar age or older. Wild males mature around the age of 10 years (Fay, 1982). A similar food intake increase at around 11 years of age was observed in male Pacific walruses at Marineland, Los Angeles, which first bred successfully at the age of 10 years (Gehnrich, 1984). At Hannover Zoo, the food intake of a male and female Pacific walrus increased at the age of 9 years; that of the male more strongly (Dittrich, 1987). Sexual
° •£. Q. o I * M >•
83
£ &
12 i
11
10
n a) •o a
4
• Male 001 A Male 009 o Female 002
* Male 003 • Male 010 o Female 004
• Male 005 a Male 011 * Female 006
» c o
A
* U
I I I 1 I I I 1 1 1 1 I 1 1 1 1
200 400 600 800 1000 1200 1400 1600
Body weight (kg)
Figure 10. The relationship between body weight and average daily food consumption as a percentage of body weight of Pacific walruses of both sexes at Harderwijk Marine Mammal Park.
522

Food consumption of Pacific walruses
dimorphism in Pacific walruses becomes more pronounced at a relative late stage; males begin their secondary growth spurt around puberty, at 10 to 15 years of age, and reach full physical maturity at about 16 years of age, with an average weight of 1200 kg. Females attain full physical maturity at 12 to 14 years of age, at an average weight of 830 kg (Fay, 1982). Adult males are about 18% longer than adult females (McLaren, 1993). From the food records (Fig. 3), as body weights are scarce for this period (Fig. 9 a), male 003 appears to have reached sexual maturity at around the age of 10 years. After the age of 12 years, his food intake and that of female 004, undergoing reproductivity, increased rapidly. The food intake of non-reproducing female 002 remained fairly constant after the age of 8 years.
The average annual food intake of a male and female Pacific walrus at Hannover Zoo, up to the age of 12 years lay between that of the couples 001+002 and 003+004 in the present study (Dittrich, 1987). At the age of 12 years, the annual food intakes of the animals in the present study and those at Hannover Zoo were similar (around 7500 kg).
When adult, the 2 males in present study were heavier than the 2 females. The body weights of both sexes lie within the range for wild conspecifics at similar ages (Fay, 1982). The weights of the study animals were similar to the weights of a male and female walrus at Hannover Zoo (Dittrich, 1987), which were weighed up to the age of 4.5 years. Walrus body weight fluctuates seasonally.
Seasonal changes Until the age of 4 years, the study animals showed a gradual increase in monthly food intake, which was probably related to growth. After the fourth year, growth rate seemed to decrease, and food intake began
to fluctuate seasonally, with fluctuations being more pronounced in males. The reduction in food intake was a little earlier each year in animals 003 and 004 than in animals 001 and 002.
The seasonal fluctuations in food intake of the animals in the present study resemble those of wild Pacific walruses. In the wild, little food is taken on the northward spring migration (April-June). At the summer (July-September) banks, however, (the Chukchi Sea for females and their calves and the Bering Sea for males), walruses spend much of their time foraging and consumption is high in summer and during the autumn migration (October - December; Fay, 1985). The areas of richest faunal resources for Pacific walruses are crossed during the spring and autumn migrations, and the poorest resources are found in parts of the summer and winter ranges (Fay et al., 1977).
After the age of 4 years, the food consumption of male 003 fell during the mating season. At that time, he whistled frequently (Verboom and Kastelein, 1995), a behaviour also observed in wild males during the mating season (Fay et ah, 1984 b). In the wild, mating occurs mainly in winter (January -March), and sexually mature males are believed to fast during the mating season (Fay, 1982; 1985). At Marineland, Los Angeles, sub adult and adult male Pacific walruses also had the lowest food intake of the year during the breeding season (February-April; Gehnrich, 1984), as did males at Hannover Zoo (Dittrich, 1987). Whereas wild male walruses may need to fast for long periods of time to maintain mobile territories near females in oestrus (Fay et al., 1984 b), male 003 and the sub adult and adult males at Marine-land, Los Angeles, had no such need. Nonetheless, the captive animals decreased their intake dramatically for several months dur-
523

R.A. Kastelein et al.
ing the breeding season, suggesting an underlying endogenous factor. Following the period of reduced intake in spring and early summer, consumption increased steadily until winter. Wild male walruses have also been shown to feed intensively throughout the summer and autumn, and tend to be fattest in early winter (Fay, 1982).
When adult, the females in the present study consumed less than average in February, while they were in oestrus. Female Pacific walruses in the wild ovulate for the first time at 4 to 8 years of age, ovulation occurring in January or February (Fay, 1982). The influence of oestrus and mating on food consumption in wild female walruses is unknown. At Marineland, Los Angeles, however, non-pregnant reproductive mature females stopped eating for about a week in January or February. This was thought to relate to ovulation, as all females mated and became pregnant during these fasts; the males also fasted during this period (Gehn-rich, 1984).
Moult is greatly protracted in both Pacific and Atlantic (Odobenus rosmarus rosmarus) walruses, occurring between March and October (Fay, 1982; Born and Knutsen, 1990). The majority, however, of wild walruses moult during the summer, as did the animals in the present study. The individual moulting period lasts about 14 days, during which the animal hauls out and does not feed (Pederson, 1962). Heating and suffusion of the skin with blood appears to accelerate moult (Salter, 1979; Fay, 1982). In the present study, moult usually occurred between June and August, and coincided with a low food intake. The Pacific walruses at Marineland, Los Angeles, also appeared to consume less during the moult (June - August) than at other times, although a consistent pattern was not evident (Gehnrich,
1984). Both male and female Pacific walruses at Hannover Zoo also reduced their food intake during the moult periods (Dittrich, 1987).
The water temperatures at Harderwijk were much higher than in the foraging areas of wild Pacific walruses. In addition, during the educational shows, most frequent in summer, the animals performed on land. During shows on warm days, the animals were very slow. Both the high water temperature and the time spend on land decrease the thermoregulatory demands of the walruses, possibly causing a reduction in appetite. In addition, the animals often slept in a sheltered area, and thus may not have needed to replenish their blubber layer to the extent of wild walruses after the breeding and moulting seasons. Captive and wild walruses have been shown to spend most of their time in the water, and to refrain from hauling out at high temperatures (Fay and Ray, 1968). It is possible that the metabolic rate of the captive males in their study decreased because they were unable to retreat from the heat to the cooler water. A decreased metabolic rate has been correlated with high environmental temperatures in many animals (Kleiber, 1961).
The data on both wild and captive Pacific walruses suggest that food intake shows pronounced seasonal fluctuations. As a result, the alimentary tract, including the U-shaped stomach (Murie, 1871; Burne, 1909), is probably adapted to periods of high food intake. The present study shows that the stomach of a walrus can process, in one day, at least twice as much as the average daily food intake (taken over a year). This may allow the walrus to eat more during the autumn and early winter. The mean wet weight of the stomach contents (mainly bivalves) of Pacific walruses has been reported
524

Food consumption of Pacific walruses
as between 3.6 and 9.3 kg (Fay et al, 1977). This does not, however, give any insight in the maximum stomach capacity. The largest reported stomach content (bivalve feet and siphons), of around 43 kg in an adult bull Pacific walrus (Brooks, 1954), agrees well with the linear relationship between lean body weight (total body weight - blubber weight) and stomach volume in Atlantic walruses (Knutsen and Born, 1991). The stomach volume of one- year-old animals was about 10 litres, and that of 10-year-old animals, about 40 litres. This suggests that a walrus can obtain its daily energy requirement in one meal if necessary, although gathering a meal composed of small prey items may require prolonged foraging. The alimentary tract of the walrus is that of a carnivore, implying a speedy and frequent digestion (Murie, 1871).
Influence of reproduction on food consumption of females Non-pregnant, non-lactating adult females in the present study had relatively constant levels of food intake. A similar pattern was observed in non-reproductive adult females at Marineland, Los Angeles (Gehnrich, 1984). This corresponds to field observations that the fat levels of females remain comparatively uniform except during pregnancy, during which it increases (Fay and Kelly, 1980; Fay, 1982).
In the wild, female Pacific walruses ovulate for the first time at 4 to 8 years of age. They breed at intervals of 2 years or less often, and are most fecund between the ages of 8 and 15 years. Pregnancy lasts around 15 months (Fay, 1982). The females in the present study became in oestrus for the first time at 5 and 6 years of age.
Female 004 consumed 30% more during gestation than during similar periods in previ
ous years when she did not reproduce. The increase not only served to provide energy for the metabolism and growth of the fetus (Kleiber, 1961), but also to increase the blubber thickness of the female (Fig. 9 b). To some extent, the thicker blubber may have reduced the extra energy required for the growth and metabolism of the fetus by reducing heat loss to the environment.
The pup in the present study was born in mid-June and weighed 60 kg at birth. This agrees with the pupping season and weights of pups in the wild, where births occur mainly between mid-April and mid-June (mean birth date around mid-May) and the average birth weight is 63 kg (Fay, 1982). At Marine-land, Los Angeles, females ate around 40% more than average during pregnancy (Gehnrich, 1984). This is comparable to the increase observed in female 004 during pregnancy.
For several days up to, and including, the day of birth, the food intake of female walruses at Marineland, Los Angeles, decreased (Gehnrich, 1984). After giving birth, intake increased slowly, but did not return to a normal level for several weeks. This agrees with the findings in the present study. Wild female walruses also tend to eat very little when they have newborn calves (Fay, 1982). The decrease in food intake immediately after parturition may result from the need to stay near and tend the pup, to enhance its chances of survival. Also, the pups may not be capable of deep or prolonged feeding dives until they are a few weeks old, thus restricting the mother's feeding activities.
Three weeks after giving birth, the food intake of female 004 increased rapidly, possibly owing to the demands of lactation. The combined energetic needs of the mother and pup rose after delivery, with the pup 's in-
525

R.A. Kastelein et al.
creased energy requirements for thermoregulation, locomotion and growth. Five months after delivery, the food intake of the female began to decrease, although it remained above the level for non-pregnant, non-lactating years until the pup was 19 months of age; this was defined as the moment of weaning. The decrease may have been caused by an increase in the blubber thickness of the pup, reducing heat loss to the environment. Even during the calendar year after birth, the mother's food intake was relatively high, as the pup remained partly dependent on milk. Lactating females at Marineland, Los Angeles, consumed around 50% more during the first year of lactation (May-May) than during non-reproductive years (Gehnrich, 1984). This is comparable to the value obtained in the present study; annual food consumption increased by 66% during the calendar year of birth (January-December, including gestation between January and June). Walruses suckle their young for a relatively long period. A dead pregnant female with a 2-year-old pup has been observed with milk in her glands (Belopolski, 1939), while 16-month-old walruses have been reported with only milk in their stomachs (Perry, 1967). On the basis of the examination of the contents of 11 stomachs, 3-year-old Atlantic walruses have been concluded to consume mostly milk, although some benthic invertebrates were also eaten (Fisher and Stewart, 1997).
In some other mammalian species, lactating females have been found to increase food intake by 100 to 200% relative to non-lactating females of similar body weight (Kleiber, 1961). On that basis, Fay (1982) estimated that pregnant and simultaneously lactating females might consume up to 100-200% more than non-pregnant, non-lactating females. Gehnrich (1984) suggests a 90% increase, while the results from the present
study suggest a 120% increase in food intake for females simultaneously pregnant and lactating.
Food consumption as a percentage of body weight Previous studies, using a small sample size and short time periods, suggested that the food intake of Pacific walruses, expressed as a percentage of body weight, was similar at all ages (Fedoseev, 1976). However, subsequent work (Gehnrich, 1984) and the present study, based on data from more individuals over many years of their lives and during various seasons (thus influencing body weight), showed a range of intakes. The lowest values per unit body weight were the maintenance levels for the adults, while the highest were for growing juveniles. Above a weight of around 800 kg, daily food intake as percentage of body weight stabilized at between 2 and 3% of body weight for non-reproducing animals. Based on food consumption data from captive animals, daily food consumption of adult Pacific walruses in the wild has been estimated to be 4 to 8% of body weight (Fay, 1982). These high estimates, may be due to lack of data for adult animals, or may have been based on the total weight of bivalve molluscs including shells.
A 182 kg, 4-year-old, Atlantic walrus in human care was reported to consume around 10% of its body weight in clams and fish (Ditmars, 1914). Although the animal described was extremely underweight (expected weight around 450 kg), this value agrees fairly well with those for animals of that weight in the present study.
Ecological significance To estimate the food requirements of the Pacific walrus population in the wild from the data presented here, information on the relationship between food consumption of animals in the present study and that of wild
526

Food consumption of Pacific walruses
animals of similar gender, age, and reproductive status is necessary. For such a comparison, data is required on the calorific contents of walrus prey, the water and air temperature wild walruses are subjected to, and their activity level.
The animals in the present study were fed fish, although wild walruses eat mainly bivalve molluscs (Fay, 1982). Fish and the siphons and feet of the clam Mya truncata, a major constituent of the wild diet, have been shown to have approximately the same calorific density (Fisher and Stewart, 1997). A recent study demonstrated that the bodies of molluscs are rapidly digested (Scheffield and Fay, 1995), thus a walrus may eat the entire clam, although only the foot and siphon have been detected in previous investigations of stomach contents. More information is needed on the calorific content and chemical composition of walrus prey to allow the food intake data of the present study to be used to estimate more accurately the amount of prey consumed by wild walruses.
The animals in the present study were kept much further south than wild Pacific walruses, thus encountering much higher water and air temperatures than wild conspecifics. The thermal demands of the study animals, therefore, would be expected to have been less than those of wild conspecifics. However, adult walruses appear to be thermo- neutral in air at temperatures between about -20 and +15°C (Fay and Ray, 1968), suggesting the animals in the present study may sometimes have been under thermal stress while on land during summer.
The present study reports food consumption of walruses in a limited environment. Activity levels, however, may not have been lower than those of wild conspecifics, as the study animals were involved in shows, and
had free access to water, spending a large amount of time swimming (Kastelein and Wiepkema, 1989). Mean travelling speed for Atlantic walruses around Greenland is 4.2 km /h , with a maximum travelling speed of 16.7 k m / h (Born and Knutsen, 1990). Swimming speeds of the animals in the present study lay between 4 and 8 km /h .
The energy expenditure during feeding is likely to be lower for captive animals as they are hand-fed on land, while animals in the wild must dive, search for, excavate, identify and process small prey items (Fay, 1982; Kastelein and van Gaalen, 1988; Kastelein and Mosterd, 1989; Kastelein et al., 1994). Walruses may take more than 6000 prey items in a single meal (Fay, 1981), at a rate of more than 6 clams per minute (Oliver et al., 1983). The aerobic dive limit of walruses is around 10 minutes (Wiig et al., 1993; Now-icki et ah, 1997), although dives usually last between 6 and 9 minutes with 1 minute surface intervals. This would allow 40-60 clams to be consumed per dive, at a feeding ground.
Considerations of dietary, temperature and activity differences suggest that the food intakes values presented in the present study serve only as minimum estimates of food requirements of wild Pacific walruses of similar age, gender and reproductive status.
The most critical food shortages for wild walruses are thought to occur in winter, when males and females are in the same geographical area, unlike the rest of the year (a large proportion of the adult males remains in the Bering Sea throughout the summer, and the females and calves in the Chukchi Sea; Fay, 1982). Segregation has been suggested to result from the different time and energy budgets of the sexes, imposed by the costs of lactation, the need to nurse un-
527

R.A. Kastelein et al.
disturbed for a long period, and differences in food requirements relative to body size (Miller and Boness, 1983). In contrast to the suggestion of Fay (1982), data from walruses in the present study and those at Marine-land, Los Angeles, (Gehnrich, 1984), suggest highest intakes for both adult males and pregnant, lactating females occur during autumn (September - December). At that time, wild males and females appear to be together and the food requirements may be greater than in any other season.
Vibe (1950) reports that in Greenland waters, at a depth of 40 m, the total weight of shellfish prey, including shells, was at least 138 g /m 2 (36 molluscs). The shells are not consumed by walruses (Allan, 1880; Fay, 1982). A small study at Harderwijk showed that 50% of the total wet weight of a 50 g clam (Mya arenaria) consists of shells, while Steimle and Terranova (1985) report shell weights of 9 bivalve mollusc species to be between 30 and 80% of total body weight. This suggests an edible mollusc density of about 69 g /m 2 in Greenland waters. Adult male walruses in the present study consumed 12000 kg of fish annually. Assuming a similar calorific content for fish and the soft parts of bivalve molluscs (Steimle and Terra-nova, 1985; Fisher and Stewart, 1997), an adult male Pacific walrus may consume all the shellfish in at least 174.000 m2 of sea bed per year. The impact, therefore, of the walrus on benthic fauna may be profound (Oliver et al, 1985).
Acknowledgements
We thank Teun Dokter, Jan Mosterd, Piet Mosterd, and all the animal care personnel for record keeping over the years. Our thanks also go to Irma Verhoeven, for partially analyzing the data, and to Rob Triess-cheijn for drawing the graphs. The mean
monthly air temperatures were provided by Meteo Consult B.V. We thank Nancy Vaugh-an and Eleanor Hayes (University of Bristol, U.K.) for their comments on the manuscript.
References
Allan, J. A. (1880) History of North American pinnipeds, a monograph of the walruses, sea-lions, sea-bears and seals of North America. U.S. Geol. Geogr. Surv. Terr., Misc. Publ. 12. 785 pp.
Belopolski, L.O. (1939) On migrations and ecology of reproduction of Pacific Walrus. Zool. Zhur., 18(5). Leningrad (Translation Fisheries Research Board of Canada).
Born, E.W. and Knutsen, L.0. (1990) Satellite tracking and behavioural observations of Atlantic walrus (Odobenus rosmarus rosmarus) in NE Greenland in 1989. Teknisk rap-port-Gronlands Hjemmestyre, Afdelingen for Levende Ressourcer. Nr. 20- October 1990, 1-68.
Bridges, W. (1953) The weighing of Herbert. Animal Kingdom 56(1), 19-21.
Brooks, J.W. (1954) A contribution to the life history and ecology of the Pacific Walrus. Alaska Cooperative Wildlife Research Unit, Univ. of Alaska, Fairbanks. Spec. Rep. No. 1, 103 pp.
Brown, R. (1868) Notes on the history and geographical relations of the Pinnipedia frequenting the Spitzbergen and Greenland seas. Proc. Zool. Soc. London, 1868,405-440.
Brown, D.H. and E.D. Asper (1966) Further observations on the Pacific walrus (Odobenus rosmarus divergens) in captivity. In: International zoo yearbook. Volume 6 (Ed. Jarvis, C ) . Hutchinson, London, 78-82.
528

Food consumption of Pacific walruses
Burne, R.H. (1909) Notes on the viscera of a Walrus (Odobenus rosmarus). Proc. Zool. Soc. No. London, 732-739.
Ditmars, R.L. (1914) Items of Interest - The Walrus. Bull, of New York Zool. Soc. 17, 1071.
Dittrich, L. (1987) Observations on keeping the Pacific Walrus, Odobenus rosmarus diver-gens, at Hanover Zoo. Int. Zoo Yearb. 26, 163-170.
Fay, F.H. and Ray, C. (1968) Influence of climate on the distrubution of Walruses, Odobenus rosmarus (Linnaeus). I. Evidence from thermoregulatory behavior. Zoologica 53(1), 1-14.
Fay, F.H. and Stoker, S.W. (1982) Reproductive success and feeding habits of walruses taken in the 1982 spring harvest, with comparisons from previous years. Final Report, Eskimo Walrus Commission, Nome, Alaska.
Fay, F.H. (1981) Walrus (Odobenus rosmarus). In: Handbook of Marine Mammals (Eds. Ridgway, S.H. and Harrison, R.J.). Academic Press, London, 1-23.
Fay, F.H. (1982) Ecology and biology of the Pacific Walrus, Odobenus rosmarus divergens Illiger. North American Fauna 74. Fish and Wildlife Service, 279 pp.
Fay, F.H. (1985) Mammalian species. Odobenus rosmarus. American Soc. of Mammal-ogists, 238, 1-7.
Fay, F.H. and Burns, J.J. (1988) Maximal feeding depth of walruses. Arctic 41(3), 239-240.
Fay, F.H. and Kelly, B.P. (1980) Mass natural mortality of walruses (Odobenus rosmarus) at St. Lawrence Island, Bering Sea, Autumn 1978. Arctic 33(2), 226-245.
Fay, F.H. and Lowry, L.F. (1981) Seasonal use and feeding habits of walrus in the proposed Bristol Bay clam fishery area. North Pacific Fishery Management Council, Anchorage, Alaska, Doc. No. 18. (Available from the North Pacific Fishery Management Council).
Fay, F.H., Feder, H.M. and Stoker, S.W. (1977) An estimation of the impact of the Pacific Walrus population on its food resources in the Bering sea. U.S. Department of Commerce, National Technical Information Service, Springfield, Va. (Mar. Mamm. Comm. report MMC-75/06 and MMC- 74/ 03).
Fay, F.H., Bukhtiyarov, Y.A., Stoker, S.W. and Shultz, L.M. (1984 a) Foods of the Pacific Walrus in winter and spring in the Bering sea. In: Soviet-American cooperative research on marine mammals. Vol. 1, Pinnipeds (Eds. Fay, F.H. and Fedoseev, G.A.). NOAA Tech. Rep. NMFS 12, 81-88.
Fay, F.H., Ray, G.C. and Kibal'chich, A.A. (1984 b) Time and location of mating and associated behavior of the Pacific walrus (Ododebunus rosmarus rosmarus) Illiger. In: Soviet-American cooperative research on marine mammals (Eds. Fay, F.H. and Fedoseev, G.A.). NOAA Techn. Rep. NMFS 1, 89-99.
Fay, F.H., Sease, J.L. and Merrick, R.L. (1990) Predation on a ringed seal (Phoca hispida) and a black guilemot (Cephus grylle) by a pacific walrus (Odobenus rosmarus divergens). Mar. Mamm. Sci 6(4), 348-350.
529

R.A. Kastelein et al.
Fedoseev, G.A. (1976) Giants of the polar seas. Priroda 1976(8), 76-83. (transl. by F.H. and B.A. Fay, 1983).
Fisher, K.I. and Stewart, R.E.A. (1997) Summer foods of Atlantic walrus, Odobenus ros-marus rostnarus, in northern Foxe Basin, Northwest Territories. Can. J. Zool. 75,1166-1175.
Fisher, K.I., Stewart, R.E.A., Kastelein, R.A. and Campbell, L.D. (1992, chapter 5.3) Apparent digestive efficiency in walruses (Odobenus rostnarus) fed herring (Clupea harengus) and clams (Spisula sp.). Can. J. Zool. 70, 30-36.
Gehnrich, P.H. (1984) Nutritional and behavioral aspects of reproduction in walruses. Masters thesis, University of Alaska, Fairbanks, 147 pp.
Hagenbeck, C.H. (1962) Notes on walruses, Odobenus rostnarus, in captivity. Int. Zoo Yearb., 4, 24-25.
Kastelein, R.A. and Gaalen, M.A. van (1988) The sensitivity of the vibrissae of a Pacific Walrus (Odobenus rostnarus divergens Part 1. Aquatic Mammals 14(3), 123-133.
Kastelein, R.A. and Mosterd, P. (1989) The excavation technique for molluscs of Pacific Walruses (Odobenus rostnarus divergens) under controlled conditions. Aquatic Mammals 15(1), 3-5.
Kastelein, R.A. and Wiepkema, P.R. (1989) A digging trough as occupational therapy for Pacific Walruses (Odobenus rostnarus divergens) in human care. Aquatic Mammals 15 (1), 9-17.
Kastelein, R.A., Muller, M. and Terlouw, A. (1994) Oral suction of a Pacific walrus (Odobenus rostnarus divergens) in air and under water. Z. Saugetierkunde 59, 105-115.
Kastelein, R.A., Klasen, W.J.C., Postma, J., Boer, H. and Wiepkema, P.R. (1998, chapter 5.2) Food consumption, growth and food passage times in Pacific walrus pups (Odobenus rostnarus divergens). Kleiber, M. 1961. The fire of life: an introduction to animal energetics. John Wiley and Sons, New York. 454 pp.
Knutsen, L.O. and Born, E.W. (1991) Growth, body composition and insulative characteristics of Atlantic walruses. Technical report- Greenland Fisheries Research Institute. Tagensvej 135, DK-2200 Copenhagen N, 17 pp.
Loughrey, A.G. (1959) Preliminary investigation of the Atlantic walrus, Odobenus rostnarus rostnarus (Linnaeus). Can. Wildl. Serv. Wildl. Manage. Bull. No. 14 Ser. 1.
Lowry, L.F. and Fay, F.H. (1984) Seal eating by Walruses in the Bering and Chukchi seas. Polar Biol. 3, 11-18.
Lowry, L.F., Frost, K.J. and Burns, J.J. (1980) Feeding of bearded seals in the Bering and Chukchi Seas and trophic interactions with Pacific walruses. Arctic 33, 330-342.
Mansfield, A.W. (1958) The biology of the Atlantic walrus, Odobenus rostnarus rostnarus (Linnaeus) in the eastern Canadian Arctic. Fish. Res. Board Can. Manuscr. Rep. Ser. (Biol.) No. 653.
McLaren, LA. (1993) Growth in pinnipeds. Biol. Rev. 68, 1-79.
530

Food consumption of Pacific walruses
Miller, E.H. and D.J. Boness (1983) Summer behavior of Atlantic Walruses Odobenus ros-marus rosmarus (L.) at Coats Island, N.W.T. (Canada). Z. Saugetierkunde 48,298- 313.
Murie, J. (1871) Researches upon the anatomy of Pinnipedia. Part 1. On the Walrus (Trichechus rosmarus, Linn.) Trans, of Zool. Soc. of London, Vol. 7, Part 6, 411-464.
Nelson, C.H. and Johnson, K.R. (1987) Whales and walruses as tillers of the sea floor. Scientific American 2, 74-81.
Nikulin, P.G. (1941) Chukchi Walrus. Marine Mammals of the far east. Bulletin of the Pacific Scientific Institute of Fisheries and oceanography. Vladivostok (Translation University of Alaska).
Nowicki, S.N., Stirling, I. and Sjare, B. (1997) Duration of stereotyped underwater vocal displays by male Atlantic walruses in relation to aerobic dive limit. Marine Mammal Science, 13(4) 566-575.
Oliver, J.S., Slattery, P.N., O'Connor, E.F. and Lowry, L.F. (1983) Walrus, Odobenus rosmarus, feeding in the Bering sea; a benthic perspective. Fishery Bulletin 81(3), 501-512.
Oliver, J.S., Kvitek, R.G. and Slattery, P.N. (1985) Walrus feeding disturbance: scavenging habits and recolonization of the Bering sea benthos. J. Exp. Biol. Ecol. 91, 233-246.
Pederson, A. (1962) Das Walross. Die neue Brehm-Bucherei, 1-60.
Perry, R. (1967) The world of the Walrus. Cassell, London.
Ray, G.C. (1973) Underwater observation increases understanding of marine mammals. Marine Technol. Soc. J. 7, 16-20.
Reventlow, A. (1951) Observations on the walrus (Odobenus rosmarus) in captivity. Zool. Gart. (NF) 18, 227-234.
Salter, R. (1979) Site utilisation, activity budgets and disturbance responses of Atlantic walruses during terrestrial haul-out. Can. J. Zool. 57, 1169-1180.
Scheffield, G.G and Fay, F.H. (1995) Digestive bias and a re-analysis of Pacific walrus feeding data. Abstract of the 11th biennial conference on the biology of marine mammals. December 1995, Orlando Florida., 104.
Steimle Jr., F.W. and Terranova, R.J. (1985) Energy equivalents of marine organisms from the continental shelf of the temperate northwest Atlantic. J. Northw. Atl. Fish. Sci. 6, 117-124.
Verboom, W.C. and Kastelein, R.A. (1995) Rutting whistles of a male Pacific walrus (Odobenus rosmarus diver gens). In: Sensory Systems of Aquatic Mammals (Eds. Kastelein, R.A., Thomas, J.A. and Nachtigall, P.E.). De Spil Publishers, Woerden, The Netherlands, 287-289.
Vibe, C. (1950) The marine mammals and the marine fauna of the Thule district in 1939-41. Meddelelser om Gronland, 150(6).
Wiig, 0., Gjertz, I, Griffiths, D. and Lydersen, C. (1993) Diving patterns of an Atlantic walrus (Odobenus rosmarus rosmarus) near Sval-bard. Polar Biol. 13, 71- 72.
531

2
3
Chapter 5.2
Food consumption, growth and food passage times in Pacific walrus pups (Odobenus rosmarus divergens)
R.A. Kastelein1, WJ.C. Klasen1, J. Postma1, H. Boer2 and P.R. Wiepkema3
Harderwijk Marine Mammal Park, Strandboulevard Oost 1, 3841 AB Harderwijk, The Netherlands
Wageningen Institute of Animal Science, Department of Animal Nutrition, Wageningen Agricultural University, Marijkeweg 40, 6709 PG, Wageningen, The Netherlands
Emeritus Professor of Ethology, Wageningen Agricultural University, Stationsweg 1, 6861 EA Oosterbeek, The Netherlands
Summary
The growth and food consumption of 5 Pacific walrus pups at Harderwijk Marine Mammal Park were studied. Four animals were raised on formulas and one animal was suckled by its mother. The preparation of one of the formulas is described. The chemical composition and calorific content of one of the formulas and of a sample of walrus milk are given. All 4 walruses which were hand-raised on formula (and all the hand-raised pups reported in the literature) weighed less than the suckled pup at similar ages. The suckled pup grew on average 18 kg per month during the first 6 months after birth. At the age of 13 months, during the period that 2 of the animals made the transfer from the formula to fish, their mystacial vibrissae went through a growth spurt. The median initial passage time of carmine red added to the formula was 12 hours in one pup and 17 hours in another.
Key words: energetics, formula, carmine red, husbandry, milk composition
Introduction dall, 1964; Ruempler, 1976; Dittrich, 1987; Spotte, 1990; Walsh et al., 1990). Over the
In the wild, walrus pups depend on their years, the formula composition has im-mother's milk for at least 15 months (Fay, proved, so that by now most formula-raised 1982). Little is known about the suckling walrus pups survive and do not suffer from period of walruses, because in the wild they dietary deficiencies. However, since the live in remote areas and only few walruses milk transfer and early growth patterns in have been raised by their mothers in human wild walruses are unknown, it remains un-care (Gehnrich, 1984). Most pups in human clear how much hand-raised walrus pups care have been hand-raised (Murie and should be fed. Baird, 1868; Hermes, 1884; Sokolowsky, 1908; Mitchell, 1909; Ditmars, 1914; Schroed- At Harderwijk Marine Mammal Park 4 Pa-er, 1933; Angel, 1935; Alving, 1939; Reven- cific walrus pups {Odobenus rosmarus diver-tlow, 1938 and 1951; Bartlett, 1940; Bridges, gens) were hand-raised on formula and one 1953; Coates and Atz, 1958; Isjumov, 1959; calf was suckled by its mother. The pups Atz, 1961; Pournelle, 1961; Ray, 1961; Brown, were weighed frequently. The aim of this 1962; Coates, 1962; Hagenbeck, 1962; Cran- study was to compare the growth of the
533

R.A. Kastelein et al.
pups raised on formula with that of the pup which was suckled by its mother. When more growth curves of suckled pups become available, the optimum amount of food which should be fed to hand-raised walrus pups can be derived from them.
Materials and methods
Study animals The study was done on 5 Pacific walrus pups at Harderwijk Marine Mammal Park.
A male (OrZH005) and a female (OrZH006) pup were born in June 1978 on Wrangel Island, Russia, and arrived at the park in August 1978. They were hand-raised on formula. The study was done between 21 Au
gust 1978 and 13 January 1979, after which they were not weighed regularly. On arrival both animals were about 2 months old, but differed in weight (005: 63 kg; 006: 49 kg).
Two male pups (OrZH009 and OrZHOlO) were born in the wild in June 1992 in Russia. The animals arrived at the park in November 1992 at the age of 6 months, and were hand-raised on formula. The study was done between 18 November 1992 and 23 November 1993. At the start both animals were about 6 months old, but differed in weight (009: 97 kg; 010: 77 kg). After the study period, it was discovered that animal 010 had Addison's disease (a reduced production of growth hormone by the pituitary gland).
Figure 1. Five-month-old male Pacific walrus pup 011 (Photo: Katja Wijnbergh).
534

Food consumption of Pacific walrus pups
A male pup (OrZHOll) was born at the park on 17 June 1995 (Fig. 1). It weighed 60 kg at birth. The animal was suckled by its mother and weighed frequently.
Study areas Animals 005 and 006, which arrived in 1978, were kept indoors in a salt water pool (8 m x 3 m, depth: 1 m) with an adjacent concrete land area. The water temperature varied between 17 and 22°C and the air temperature between 0 and 25°C.
Animals 009 and 010, which arrived in 1992, were kept together indoors in an oval pool (8.6 m x 6.3 m, depth: 1.4 m) containing fresh water of between 12 and 16°C. The pool was surrounded by a concrete bank. The air temperature varied between 16 and 21 °C.
Animal 011, the pup born at the park, was kept with its mother in an outdoor pool (10 m x 15 m, depth: 4 m) containing brackish water and on an adjacent concrete land area and in a covered area (Kastelein et ah, 1989). The mean monthly water temperature varied between 9 and 19°C, while mean monthly air temperature varied between - 0.3°C in February to 17.5°C in July. The Harderwijk Marine Mammal Park is at 5°37' E and 52°20' N.
Animals 005 and 006 were weighed twice a week in a net suspended from a large spring balance (VERAmetric, with 1.0 kg accuracy). Animals 009,010 and 011 were weighed 1 to 4 times per month on a weighing platform (Mettler KE1500, up to 600 kg weighing with a 0.1 kg accuracy).
Food Animals 005 and 006 were fed formula 4 times a day (at 0900,1200,1400 and 1600 h). The formula consisted of the following ingredients stirred together: 4 kg blended herring (Clupea harengus), 3 litres water, 250 ml
cod liver oil, 200 mg vitamin Bl, 2 calcium tablets, 400 g cows' milk and 2 spoons of fortified milk powder (Protifar®). The formula was prepared at room temperature. Each meal consisted of a fixed amount of this formula, which was increased as the animals grew. Decisions about increases were based on the rate with which the animals drank the formula and whether or not the trough was emptied at the end of each meal. The formula was given to pup 005 when he was between the ages of 2 and 13 months and to pup 006 when she was between the ages of 2 and 16 months, but regular weight records were only kept until both animals were 7 months old. The formula was not analyzed for composition and calorific content.
Animals 009 and 010 were fed formula 3 times a day (at 0930, 1230 and 1545 h). The formula consisted of the following ingredients: 13 litres water, 270 g butter, 540 g oatmeal, 630 g soya flour (Nutrilon-soja®), 900 g milk powder (Multimilk®), and 8 g marine mammal vitamins (Seavit®). The density of the formula was 1.016 g/cm3. The formula was made once a day (at 0800 h). The ingredients were stirred and boiled, after which the formula was stored in a fridge. Before each meal the formula was stirred and heated, then cooled to below 37°C (for the influence of temperature on suckling speed, see Kastelein et ah, 1996). The daily amount fed to the animals was increased weekly as they grew. Decisions about increases were based on the rate with which the animals drank the formula and whether or not the trough was emptied at the end of each meal. The formula was given to pup 009 when he was between the ages of 6 and 15 months and to pup 010 when he was between the ages of 6 and 18 months. Samples of the formula fed to the walrus pups were taken over several months. Each sample was put through a mincer. From this
535

R.A. Kastelein et al.
minced material triplicate subsamples were taken to determine the gross composition, and a subsample was freeze-dried and minced for dry matter and gross energy content determination (Table 1). Dry matter content was determined after drying samples in a vacuum oven at 50°C and a vacuum of 100 torr, using anhydrous calcium chloride as the drying agent. After 16 h, the vacuum was changed to 15 torr and the samples were weighed every 4 h until they obtained constant weight. Nitrogen content was determined in the fresh samples by Kjeldahl analysis according to ISO 5983 (1979). The crude protein was calculated by multiplying the proportion of nitrogen by 6.25. Lipid content was assessed by extraction of freeze-dried samples with petroleum ether and drying the extract at 103°C to a constant weight according to ISO-CD 6492 (1995). Ash was analyzed by burning oven-dried samples in a muffle furnace at 550°C according to ISO 5984 (1978). Gross energy was determined in an anisothermic bomb-calorimeter (IKA C7000).
Food passage time through the gastro-intestinal tract Carmine red was added to the formula giv
en during one of the 3 meals a day to animals 009 and 010 when they were between the ages of 9 and 12 months. Per day only one animal was tested. The dye could only be discovered when the animals defecated on land. However, they usually slept on land during the night and then usually defecated. Each hour the animals were checked, and if the faeces were red, the time was recorded. This is called the initial passage time (IPT).
Descriptive statistics are given as mean ± the standard deviation, n - sample size.
Results
Body weight changes All 4 walruses which were hand-raised on formula (except male 009 after the age of 12 months), weighed less at similar ages than animal 011, who was suckled (Fig. 2). Already on arrival at the park they weighed less than the suckled pup at that age. Animal 011 grew on average 18 kg per month during the first 6 months after birth. Animal 005 had a similar growth rate during the first 4 months after arrival at the park (19 kg/ month). Female 006 had a similar growth rate the first 2 months at the park (18 kg/
Table 1. The gross composition (% of fresh product) and energy content (kj/g fresh product) of the milk of wild walruses (Fay, 1982), the milk of the mother of the pup in the present study, and of the formula fed to animal 009 and 010 in the present study.
Dry matter Crude protein Crude fat Ash Carbohydrates (lactose)
(starch and sugars) Neutral detergent fibre Gross energy
Walrus milk
Fay (1982)*
46-33 5-11
14-32 0.5-0.8 <0.025
-~ 15
At Harderwijk**
59.5 11.2 (Nx 6.38) 44.6 (after hydrolysis) 0.3 3.4 (calculated)
--~
Formula given to
animals 009 and 010
15.6 3.2 6.3 0.6 -4.5 0.3 4.18
mean of milk samples of 4 dead wild adult female walruses taken in May. mixture of milk taken on the first and second day after birth.
536

Food consumption of Pacific walrus pups
month) after which her growth rate dropped to zero when she was ill. She had a bacterial infection which was cured with antibiotics. Male 009 had a high growth rate during the first 6 months after his arrival at the park (27 kg/month) , while male 010 had a relatively low growth rate (16 kg/month) .
Daily food consumption The daily formula consumption of male 005 increased during the first weeks after his arrival at the park to around 6 kg. It remained at this level the following 7 months, except for a slight decrease when he was 4 months old (Fig. 3).
The daily formula consumption of female 006 increased to 6 kg during the first weeks after her arrival at the park. Her food intake was irregular and decreased 2 months after
arrival due to the bacterial infection (Fig. 4).
The formula consumption of male 009 increased from 9 to 15 kg /day during the first 4 months after his arrival at the park (Fig. 5). It began to decrease when he was 12 months old, at which time he began to eat fish as well as formula. At first, small pieces of fish were added to the formula. Later, whole fish were added, and eventually whole fish were offered by hand. At the age of 14 months he was eating only fish.
The formula consumption of male 010 increased from 5 kg /day on his arrival to 12 kg /day at 4 months after his arrival at the park (Fig. 6). At the age of 12 months he began to eat some fish as well as formula. After the age of 13 months, his food intake became irregular. To speed up the transfer to
320
280
240
.5» 160 I •5- 120 o m 80
40
Start transition to fish Completely on fish
Start consuming some Naturally \ suckling male 011
\ . . - - "
^ - '
Completely on fish
Male 010
i i 1 i i i i 1 1 1 i r
10 12 - i 1 1 1 1 1 1
14 16 18 20 Age (months)
Figure 2. The body weight changes of 4 Pacific walrus pups raised on formula, and one raised by suckling at Harderwijk Marine Mammal Park.
537

R.A. Kastelein et al.
9 Male 005
c o to Q. E 3 <n c o o w 3
>.
Q
8 -
7 -
6
5 -
3 4 5 Arrival at park
Figure 3. The daily amount of formula consumed by male walrus 005.
Female 006 9-i
f 3 4 5 Arr ival at park
Figure 4. The daily amount of formula consumed by female walrus 006.
Age (months)
Age (months)
538

Food consumption of Pacific walrus pups
Male 009
* 7 8 Arrival at park
18 19 Age (months)
Figure 5. The daily amount of formula and fish consumed by male walrus 009, and the energy content of the formula consumed while he was on a formula diet.
Male 010 25 -i
7 8
Arrival at park
14 15 1 6 / 1 7
No food given
18 19
Age (months)
Figure 6. The daily amount of formula and fish consumed by male walrus 010, and the energy content of the formula consumed while he was on a formula diet.
539

R.A. Kastelein et al.
a complete diet of fish, the animal was not given any formula for a few days at the age of 17 months. This technique was successful, and the animal only ate fish thereafter. After he had eaten fish for a few weeks, his food intake increased strongly for a short period.
At the age of 13 months, during the period in which animals 009 and 010 made the transfer from the formula to solid food (herring), their mystacial vibrissae went through a growth spurt.
Animal Oil began to eat some fish at the age of 7 months, and was completely weaned at the age of 19 months.
Food passage time The initial passage time of carmine red added to the formula in walrus 009 varied between 7 and 20 h (median: 12 h; Fig. 7 a). In walrus 010 it varied between 8 and 22 h (median: 17 h; Fig. 7 b). No effect of time of day the dye was given could be detected.
Discussion and conclusions
Growth Pup 011, who was to be suckled, weighed 60 kg at birth. This is a normal birth weight for a Pacific walrus pup. In the wild, calves at birth, and for most of the first month after birth, weigh between 45 and 75 kg (Fay, 1982). The present study suggests that the walruses in the present study that were born in the wild, arrived at the park with a growth retardation. Three of the 4 wild-born pups grew at the same rate as animal 011. Only one animal (009) made up his growth retardation by growing faster than all the others. After the age of 12 months his body weight was similar to that of animal 011. The slow growth rate of animal 010 was probably due to his congenital pituitary defect.
Fay (1982) gave growth curves for hand-raised walrus pups from Brown (1962), Pournelle (1961), Brown and Asper (1966) and Ray (1960 and 1961). During the first 4 to 9 months the pups gained weight at rates ranging from 8 kg /month to 17 kg /month (mean: 13 kg/month) . All hand-raised animals described by Fay had slower growth rates than suckled animal 011 in the present study.
Atz (1961) describes a weight gain of on average 9 kg per month over the 15 months that a walrus pup was at a park. This is a lower growth rate than found in any of the animals in the present study. At the time of Atz's study the animal was 17 months old and weighed 220 kg. This is between the weight of animals 009 and 010 at that age (Fig. 2).
Dittrich (1987) described 2 hand-raised animals which weighed 105 kg and 98 kg at the age of 6 months. These are much lower weights than expected for animals of this age group, but they are similar to the weight of animal 006 in the present study. At the age of 12 months, the animals Dittrich described weighed 214 and 224 kg. These values are close to that of animal 009 in the present study (Fig. 2). Ruempler (1976) describes 3 walrus pups that were hand- raised simultaneously. The male increased in weight from 71 kg at the age of 4 months, to 110 kg at the age of 10 months. The females increased from 59 and 68 kg to 127.5 and 144.5 kg respectively between the age of 4 and 10 months (5 meals a day, formula composition: filleted herring, sour cream, cow milk protein concentrate, cod liver oil, chicken eggs, minerals and vitamins). The animals' growth rates were slightly lower than those of the animals in the present study.
Bridges (1953) presents the weight changes of a male Pacific walrus which was raised on
540

Food consumption of Pacific walrus pups
chopped fish, concentrated milk, vegetable oil and cod liver oil. The animal's growth curve was almost identical to that of animal 009 in the present study (Fig. 2). In both animals, growth decreased after their first birthday. In animal 009 this coincided with the start of the gradual transfer to solid food. Bridges does not mention when and how his walrus made the transfer to solid food. Re-ventlow (1951) describes 4 Atlantic walrus (Odobenus rosmarus rosmarus) pups that were hand-raised. All 4 animals had lower growth rates than suckled animal Oil in the present study (Fig. 2). Kibal'chich (1984) gives the mean weight of 2 yearling male Pacific walruses from the wild as 175 kg. This is similar to the weight of male 010 in the present study at that age (Fig. 2). He also reports that the mean weight of 3 yearling females was 138 kg (range 105-170 kg).
Daily food consumption Several authors have reported on the daily amount of formula that was given to their walrus pups. Coates (1962) fed an up to 1-year-old male walrus pup whipped cream and clams blended together. He consumed 8 to 10% of his body weight per day in 3 to 4 meals. After the age of 1 year, fish and whole clams were added to the diet. Walsh et al. (1990) report on 4 walrus pups which consumed between 8.7 and 10.31 of formula per day at the age of 8 months. A 50 to 75 kg calf was offered a total daily amount of 7 to 81 of formula (ground clams, ground fish and water) in 4 to 6 meals. Fay (1982) and Gehnrich (1984) estimate that in their first year, walruses consume 7% of their body weight per day in milk. In each study, a formula with a different composition was used. The formula should probably be as close as possible to the composition of the walrus milk to achieve optimal growth rates. Fay (1982) took 4 milk samples from dead wild walruses in May, and milk samples were ob
tained in the present study on the first and second day after birth. The fat content of walrus milk appears to be low compared to most other pinnipeds (Table 1). However, these figures should be interpreted with caution, as the composition of walrus' milk may change during the suckling period. The fat, protein and gross energy content of one of the formulas used in the present study was much lower than that of the walrus milk analyzed by Fay (1982) and in the present study (Table 1). This suggests that walruses probably need smaller quantities of their mother's milk than they do of the formula used in the present study (see also Kastelein et al, 1996).
The amount of formula that has to be fed to walrus pups depends on the formula's composition, its calorific content, and its digestibility. Therefore the amount of formula has to be adapted to the observed growth rate. Based on the results of the present study and on information from the literature, a growth rate of around 18 kg per month seems to be desirable during a walrus pup 's first year.
Transfer to solid food At the age of around 13 months, at which point the animals made the transfer from the formula to solid food, the mystacial vibris-sae went through a growth spurt. In the wild, walrus pups of around this age probably start to explore the ocean floor, using their vibrissae. Individual variation exists in the timing of weaning in walrus pups. However, in general they are fully dependent on mother's milk for at least the first year after birth, and are gradually weaned during the second year (Loughrey, 1959; Fay, 1982). When in human care, walrus pups should not be weaned before the age of 1 year. Atz (1961) weaned a bottle- raised walrus at the age of 17 months. Brown and Asper (1966) report on 2 walruses in human care which
541

R.A. Kastelein et al.
a> o c
3 O u o
6 A. Male 009
•S 3
c 3 a £
10 11 12
I Median: 12 hours
13 14 15 16 17 18 19 20 21
Initial passage time (h)
B. Male 010 6
o u c E 4 3 O u o •5 3
§•
£ 1 -
7 8 9 10 11 12 13 14 15 16 17 18 19 20 21
/ Initial passage time (h) Median: 17 hours
Figure 7. The initial passage times of carmine red through the digestive tract of walrus pups 009 (a) and 010 (b).
542

Food consumption of Pacific walrus pups
were gradually weaned onto a completely solid diet at the age of 26 months. The present study shows that the walruses had to get used to eating fish. The growth rate of animals 009 and 010 decreased during the transfer period from a formula diet to a fish diet.
Food passage time The initial passage time (IPT) ranges of both animals were similar, but the median IPTs varied by 5 h. This may partly be explained by a difference in body weight between the animals and thus metabolic rate. The animal with the longest median IPT was heavier than the animal with the shortest median IPT. In general in a terrestrial mammal species, the older an animal, the longer the passage time of digesta through its gut, but differences in IPTs can also be due to genetic variability within a species (Warner, 1981). The Addison's disease of animal 010 may also have influenced his IPT.
Bryden et al. (1995) describe IPTs of the solid phase digesta marker titanium oxide of 6.5 ± 4.3 h for 3 Australian sea lions (Neophoca cinerea) and 4.0 ± 3.0 h for 2 New Zealand fur seals (Arctocephalus forsteri). In pinnipeds, passage times are generally short compared to those in terrestrial mammals of similar size. In harbour seals (Phoca vitulina) charcoal, fed in fish, reappeared with the faeces within 6-14 h (Havinga, 1933). These values in sea lions and seals are shorter than those observed in the walrus pups in the present study. There could be species- specific differences in IPTs, but the differences could also be due to the larger size of the animals in the present study compared to the animals mentioned above and to differences in diet.
Passage time through a digestive tract depends on the composition of the material that has to be moved and on the size of the
particles. In general, in mammals, the liquid phase moves through the gut more rapidly than particles, and small particles faster than large particles (Warner, 1981). Passage times of fish in adult Pacific walruses range from 5-9 h (Fisher, 1989).
Significance for husbandry The present study provides the first published growth curve of a suckled walrus pup. If more studies gave similar information, the optimum amount of food, meal size and frequency of feeding (or ad lib.) for hand-raised walruses could be established.
Knowledge of average food passage times in a species may be useful for veterinary surgeons administering oral medication. Some medicines require a long absorbtion time. Records of passage time of individual animals can also be used as a baseline to which the passage time of an animal, when he is suspected of having digestion disorders, can be compared.
Ecological significance The growth rate of the suckled pup in the present study cannot simply be used as a reference for walrus pups suckled in the wild. In the wild, the environmental conditions are more harsh than those experienced by the suckled pup in the present study, which experienced relatively high water and air temperatures, a partly sheltered enclosure and relatively few disturbances (no predators, no direct access by conspecifics) which interfered with the suckling bouts.
Acknowledgements
We thank veterinary surgeon Martin Bakker for his advice on the composition of the formula fed to walrus pups 009 and 010. We thank Piet Mosterd, Bert van Santen, Johan van Ardenne, Ton van Rossum and Hendrik
543

R.A. Kastelein et al.
Jan Groenenberg for their help in feeding and record keeping. Jane-Martine Muijlaert (Wageningen Agricultural University) did the analysis of the formula samples. We thank Rob Triesscheijn for making the graphs and Martin Verstegen (Wageningen Agricultural University), Carolien Staal, Nicole Schooneman and Nancy Vaughan (University of Bristol, UK) for their comments on the manuscript.
References
Alving, T. (1939) Aufzucht und Pflege von Walrossen. Der Zoologische Garten 10, 215-218.
Angel, J. (1935) How "Pee-uk" came to the zoological park. New York Zool. Soc. 38(5), 173-177.
Atz, J.W. (1961). Raising Ookie. Animal Kingdom 64, 13-22.
Bartlett, R.W. (1940) Walrus collecting with Captain Bob. Bull. New York Zool. Soc. 43 (5), 139-143.
Bryden, M.M., Bodley, K. and Mercer, J.R. (1995) Rate of passage of digesta in two species of otariid seals. Abstract of the 11 th biennial conference on the biology of marine mammals. Orlando, Florida, 18.
Coates, C.W. (1962) Walruses and whales in the New York Aquarium. In: Int. Zoo Yearb. 4 (Eds. Jarvic, C. and Morris, D.), Hutchinson, London, 10-12.
Coates, C.W. and Atz, J.W. (1958) Olaf: 1,000 pounds of walrus charm. Animal Kingdom 61, 66-72.
Crandall, L.S. (1964) Management of wild mammals in captivity. Univ. of Chicago Press Chicago, 111. 423-430.
Ditmars, R.L. (1914) Items of Interest - The Walrus. Bull. New York Zool. Soc. 17,1071.
Dittrich, L. (1987) Observations on keeping the Pacific walrus (Odobenus rosmarus diver-gens) at Hanover Zoo. In: Int. Zoo Yearb. 26 (Ed. Olney, P.J.S.). The Zool. Soc. of London, 163-170
Bridges, W. (1953) The weighing of Herbert. Animal Kingdom 56(1), 19-21.
Brown, D.H. (1962) The health problems of walrus calves, and remarks on their general progress in captivity. In: Int. Zoo Yearb. 4 (Eds. Jarvis, C. and Morris, D.). Hutchinson, London, 13-23.
Brown, D.H. and Asper, E.D. (1966) Further observations on the Pacific walrus (Odobenus rosmarus divergens) in captivity. In: Int. Zoo Yearb. 6 (Ed. Jarvis, C ) . Hutchinson, London, 78-82.
Fay, F.H. (1982) Ecology and biology of the Pacific walrus (Odobenus rosmarus divergens) Illiger. North American Fauna, 74, 1-279. Fish and Wilflife Service, Washington, D.C.
Fisher, K.I. (1989) Food habits and digestive efficiency in Walrus, Odobenus rosmarus. M.Sc. Thesis, Univ. of Manitoba, Winnipeg.
Gehnrich, P.H. (1984) Nutritional and behavioral aspects of reproduction in Walruses. Master thesis, University of Alaska, Fairbanks, 147 pp.
544

Food consumption of Pacific walrus pups
Hagenbeck, C.H. (1962) Notes on walruses (Odobenus rosmarus) in captivity. In: Int. Zoo Yearb., Volume 4 (Eds. Jarvis, C. and Morris, D.). Hutchinson, London, 24-25
Havinga, B. (1933) Der Seehund (Phoca vitu-lina L.) in den Hollandischen Gewassern. In: Seals, sea lions and walruses (Ed. Scheffer, V.B.). Stanford Univ. Press, 179 pp.
Hermes, O. (1884) Uber das Walross (Triche-chus rosmarus). Sber. Ges. naturf. Freunde Berlin, 67-70.
Isjumov, G.I. (1959) Einige Angaben iiber Wachstum und Entwicklung des Walrosses im Leningrader Zoologischen Garten. Der Zoologische Garten, 26, 82-95.
Kastelein, R.A., Wiepkema, P.R. and Sleg-tenhorst, C. (1989) The use of molluscs to occupy Pacific Walrusses (Odobenus rosmarus divergens) in human care. Aquatic Mammals 15(1), 6-8.
Kastelein, R.A., Postma, J., van Rossum, T. and Wiepkema, P.R. (1996) Drinking speed of Pacific walrus (Odobenus rosmarus divergens) pups. Aquatic Mammals 22(1), 21-26.
Kibal'chich, A.A. (1984) Some results of Pacific walrus investigations (ZRS "ZYKOVO", 1983), 54-62. In: Research on marine mammals of the northern part of the Pacific Ocean in 1982/83 (Ed. Popov, L.A.). VNIRO, Moscow. 78 pp. (Transl. by F.H. Fay, 1985).
Loughrey, A.G. (1959) Preliminary investigation of the Atlantic walrus (Odobenus rosmarus rosmarus) (Linnaeus). Canadian Wildlife Service, Wildl. Manage. Bull., Ser. 1(14), 1-123.
Mitchell, P.C. (1909) Notes on a young walrus (Odobenus rosmarus) recently living in the Society's Gardens. Proc. Zool. Soc. London 76, 730-732.
Murie, J. and Baird, F.L.S. (1868) On the Morbid Appearances observed in the Walrus lately living in the Society's Gardens. Proc. Zool. Soc. Lond., 67-71.
Pournelle, G.H. (1961) Pacific walrus (Odobenus rosmarus divergens) at the San Diego Zoo. In: Int. Zoo Yearb. 3 (Eds. Jarvis, C. and Morris, D.). Hutchinson, London, 78- 80.
Ray, C. (1960) Background for a baby Walrus. Animal Kingdom 63, 120-124.
Ray, C. (1961) Three Baby Walruses and the Smallest Seal. Animal Kingdom 64, 98-105.
Reventlow, A. (1938) Aufzucht dreier junger Walrosse im Kopenhagener Zoo. Der Zoologische Garten, 10, 50-53.
Reventlow, A. (1951) Observations on the walrus (Odobenus rosmarus) in captivity. Der Zoologische Garten (NF) 18, 227-234.
Ruempler, G. (1976) Probleme bei Haltung von Walrossen. Z. Kolner Zoo (19)4,117-124.
Schroeder, C.R. (1933) Cow's milk protein hypersensitivity in a walrus. Journ. Am. Vet. Med. Ass., Chicago, 83, 810-815.
Sokolowsky, A. (1908) Neues aus der Biol-ogie der Walrosse. Sber. Ges. naturf. Freunde Berlin 9, 237-253.
Spotte, S. (1990) Artificial milks for un-weaned marine mammals. In: Handbook of Marine Mammal Medicine: Health, Disease, and Rehabilitation (Ed. Dierauf, L.A.). CRC Press, Boston, 521-532.
545

R.A. Kastelein et al.
Walsh, M.T., Asper, E.D., Andrews, B. and Warner, A.C.I. (1981) Rate of passage of di-Antrim, J. (1990) Walrus biology and med- gesta through the gut of mammals and icine. Handb. of Mar. Mamm. Medicine: birds. Nutrition Abstracts and Reviews Se-Health, Disease and Rehabilitation. C.R.C. ries 'B' 51(12), 789-820. Press, Boston.
546

Chapter 5.3
Apparent digestive efficiency in walruses (Odobenus rosmarus) fed herring (Clupea harengus) and clams (Spisula sp.)
K. I. FISHER
Department of Fisheries and Oceans, Central and Arctic Region, Box 2310, Yellowknife, N.T., Canada XIA 2P7
R. E. A. STEWART
Department of Fisheries and Oceans, Central and Arctic Region, 501 University Crescent, Winnipeg, Man., Canada R3T 2N6
R. A. KASTELEIN
Harderwijk Marine Mammal Park (Zeedierenpark Harderwijk), Strandboulevard-oost 1, 3841 AB Harderwijk, Holland
AND
L. D. CAMPBELL
Department of Animal Science, University of Manitoba, Winnipeg, Man., Canada R3T 2N2
Received May 3, 1991 Accepted July 23, 1991
FISHER, K. I., STEWART, R. E. A., KASTELEIN, R. A., and CAMPBELL, L. D. 1992. Apparent digestive efficiency in walruses (Odobenus rosmarus) fed herring (Clupea harengus) and clams (Spisula sp.)- Can. J. Zool. 70: 30-36.
The digestive efficiency in 4 captive walruses (2 males, 2 females) was determined. All 4 walruses were fed a diet of herring (Clupea harengus), and the adults (1 male, 1 female) were fed clams (Spisula sp.), for a total of 6 animal—diet combinations. The digestive coefficient for energy was the same for both diets (x ± 1 SD: 92.7 ± 2.1%; n = 6) but significandy (P = 0.02) higher in females (94.4 ± 1.2%, n = 3) than in males (91.0 ± 0.8%, « = 3). No age effects were found. The mean digestive coefficient of protein was 93.8 % ± 1.8 % (n = 6) and did not vary among diets or animals. The digestive coefficient for lipid was lower for the clam diet (73.2 + 0.1%, n = 2) than for the herring diet (94.4 ± 2.3%, n = 4), but this is likely an artifact due to the low lipid content of the clams (5.8 ± 0.7%) and the influence of endogenous lipid loss. The approximate maintenance gross energy requirements for the 1200-kg nonpregnant, nonlactating adult walrus in captivity were 31 350 kcal • day-' (1 kcal = 4.18 kJ) or 155 kcal • kg"075 • day"1.
FISHER, K. I., STEWART, R. E. A., KASTELEIN, R. A., et CAMPBELL, L. D. 1992. Apparent digestive efficiency in walruses (Odobenus rosmarus) fed herring (Clupea harengus) and clams (Spisula sp.). Can. J. Zool. 70 : 30—36.
L'efficacit£ de la digestion a 6t& etudiee chez quatre Morses gardis en captivite' (deux males, deux femelles). Les quatre morses ont 6te nourris de harengs (Clupea harengus) et des adultes (un male, une femelle) ont recu des palourdes (Spisula sp.) en nourriture, selon six combinaisons differentes animal—regime. Le coefficient energetique reli6 i la digestion s'est avere le meme pour les deux regimes (x ± ecart type: 92,7 ± 2,1 %, n = 6), mais significativement plus 6lev6 (P = 0,02) dans le cas de femelles (94,4 ± 1,2%, n = 3) que dans celui des mSles (91,0 ± 0,8%, n = 3). L'age n'avait aucun effet decelable. Le coefficient moyen de digestion des prot6ines 6tait de 93,8 ± 1,8% (n = 6) et ne variait pas d'un regime a I'autre ou d'un animal a l'autre. Le coefficient de digestion des lipides etait plus faible dans le cas du regime de palourdes (73,2 ± 0,1%, n = 2) que dans celui du regime de hareng (94,4 ± 2,3%, n = 4), mais il s'agit sans doute la d'un artefact attribuable au contenu lipidique peu elevg des palourdes (5,8 ± 0,7%) et a l'influence de la perte endogene de lipides. Un morse adulte de 1200 kg en captivity, qui ne porte pas de petit et qui n'allaite pas, a besoin, pour se soutenir, d'environ 31 350 kcal • j - ' , ou 155 kcal • kg"0-75 j ~ ' d'Snergie brute.
[Traduit par la redaction]
Introduction energy budget that has been estimated in captive walruses is Knowledge of the food requirements of walruses (Odobenus gross energy intake. Estimates of the amount of energy
rosmarus) is necessary to understand the role of walruses in required to maintain healthy walruses, thought to weigh the ecosystem and to identify and protect feeding areas from 250-1200 kg, range from 22 500 to 70 300 or from 238 to exploitation by commercial fishery and nonrenewable-resource 531 kcal • kg-0-75 • day - 1 (Fay 1982; Gehnrich 1984). development projects. Examination of the food habits of wal- The objective of the present study was to examine energy ruses is difficult because direct observation of feeding is rarely partitioning in walruses by determining the apparent digestive possible. Analysis of stomach contents can provide informa- efficiency in 4 captive animals. The null hypothesis tested was tion regarding the type of prey eaten, but rarely indicates the that the digestive efficiency of walruses was similar to that daily quantity of food consumed (Bagenel 1978; Beddington reported for other carnivores consuming flesh-based diets. In et al. 1985). addition, maintenance feeding requirements were estimated
An alternative approach is to examine the energy require- for the captive walruses, where maintenance was defined as ments of individual walruses. These energy requirements can that level of food intake at which the animal neither gains nor then be applied to the population, with known parameters such loses mass (Kleiber 1975). as the age structure and sex ratio, to estimate an annual energy budget for the population (Lavigne et al. 1982). There have Materials and methods been few studies on the energy requirements of walruses, Research was conducted at the Harderwijk Marine Mammal Park, primarily because animals are kept at public aquaria where Harderwijk, the Netherlands, during November and December 1988. there is limited scope for research. The only component of the The 4 Pacific walruses (Odobenus rosmarus divergens) used in this
547

Fisher et al.
study had lived in captivity since being stranded as pups on the Siberian and Alaskan coasts. The adult male and female (both 14 years old) were housed separately from the immature male and female (both 5 years old) (Kastelein and Wiepkema 1989). The animals had access to an outdoor freshwater pool with a dry ledge and an indoor covered area. The water and midday air temperatures ranged from 8 to 12 and from - 0 . 5 to 13.0°C, respectively. The photoperiod was natural (latitude 52°20'N).
The walruses were routinely fed a diet of herring {Clupea harengus), mackerel {Scomber scomber), whiting (Merlangius merlangus), and squid (Illex sp.) The two experimental diets were whole herring and clam feet (Spisula sp.). Only the feet of the clams were fed to the walruses to stimulate the natural diet, which consists largely of the siphons and feet of several clam species (Vibe 1950; Fay 1982; Fay et al. 1977; Fisher 1989). The fish and clams were stored at -20°C, and daily rations were thawed in water overnight prior to feeding.
Two feeding experiments were conducted. In the first, both adult and immature walruses were fed herring. In the second, only the adults were fed clams, because of training constraints on the younger animals. Each experiment consisted of a 5-day precollection period and a 5- to 7-day fecal collection period. The precollection period was to allow the marked food to equilibrate in the digestive tract and pass at a uniform rate (Schneider and Flatt 1975). After the herring experiment, there was a 9-day interval to acclimate the adults to clams. The male started eating clams immediately, but the female refused to eat clams for the first 5 days. She then consumed a mixture of clams and herring until she was eating only clams the day before the experiment.
On the herring diet, the animals were fed daily at 09:00, 12:00, and 16:00. On the clam diet they were fed at 10:00, 13:00 and 16:00. In both experiments, one-third of the daily ration was given at each meal with vitamin supplements (Sea Tabs, Pacific Research Laboratories, California; 10 each for adults, 8 each for immatures) and salt supplements (18 g for adults, 12 g for immatures) added to the morning meal.
Feeding levels were set at the estimated maintenance requirement for each walrus, based on historical food intake records for each walrus and recommendations from trainers. The amount of clams was estimated from the mass change of the adult male when fed an average of 25.0 kg of clams per day during the 9-day period between experiments.
Chromium oxide (Cr203) was used as an inert marker (Schneider and Flatt 1975) to determine the digestive coefficients because of total fecal collection was not possible. Cr203 tablets were added to the diet at 0.26% (herring) and 0.25% (clam) of the wet weight of the diet. Tablets were inserted into approximately 30% of the food items, through the opercular opening into the thoracic cavity of the herring and through the proximal opening of the clam feet. The marked portion was then mixed thoroughly with the rest of the meal.
The walruses were weighed to the nearest 0.5 kg in the morning before feeding, using a 1500-kg scale (Mettler ID2, Zurich, Switzerland) on the 1st day of the precollection period and at the beginning and end of the collection period. Mass changes in the 4 walruses on the herring diet were measured only in the collection period, not over the entire experiment, because food intake was adjusted on the 2nd day of the precollection period due to a minor computational error. Food intake on the clam diet was constant throughout the experiment, and mass changes were measured over the entire 10-day period.
Fecal samples were obtained during the collection period when the animals were kept dry in the covered night-resting areas, from approximately 16:00 to 09:00 the next morning. Samples were collected within 30 min of defecation, weighed within 0.1 g, and individually frozen at —20°C for analysis. Each defecation was analyzed and the values pooled for each day to produce a daily digestion coefficient.
To assess diet composition, 10 herring were removed from the meals on days 3 and 8 of the feeding experiment and individually analyzed for proximate composition and energy content. Individual clam feet provided insufficient material for analysis, so samples of 50 clams were taken on days 4 and 8 and analyzed as groups of five,
providing 10 replicates for each calculation. Fecal and diet samples were freeze-dried to a constant weight and
homogenized. The energy content was measured using an adiabatic bomb calorimeter (Parr Instruments, Moline, 111.). Total nitrogen was determined using micro-Kjeldahl procedures and a Kjeltec Auto 1030 Analyser (Teactor, Herdon, Va.; Association of Official Analytical Chemists 1965), and crude protein was calculated as 6.25 x percent nitrogen. The total lipid content of the food was analyzed using the Folch et al. (1957) method. The fecal lipid was analyzed using the Marchello et al. (1971) method, modified by centrifuging the samples and the chloroform:methanol:HCl solution prior to filtering, to reduce chloroform evaporation. The Cr203 in fecal samples and tablets was analyzed according to Williams et al. (1962). The samples were ashed at 550°C for 24 h, but the digestive coefficient of ash was not determined, since the values represent dietary and endogenous ash from Cr203 tablets and vitamin supplements. All analyses were performed in duplicate. Unless otherwise specified, results are expressed on a dry-matter basis and means are reported ± 1 standard deviation.
The apparent digestive efficiency was calculated according to Kleiber (1975). Analysis of variance, used to test for differences between diets and animals, was based on the daily digestive coefficients (replicates) for the 4 walruses on the herring diet and the 2 walruses on the clam diet. Gender and age were treated as blocks and tested against the interaction between treatment, gender, and age. The level of significance was P = 0.05 for all analyses.
Results
The proximate composition and energy density of the herring did not change during the study (Table 1). The lipid and protein content of the clams also remained constant; however, the dry matter and energy content varied significantly. The mean dry matter contents of the two clam samples were 21.1 ± 0.6 and 19.8 + 0 .6%, and calculations of nutrient intake on a dry-matter basis were based on the overall mean of the two samples (20.4%). The mean energy density of the two samples differed by 2%, so the overall mean (4.87 kcal • g _ 1 ) was used to calculate the digestive coefficients of energy. The carbohydrate content of the clams was not measured but is represented in the energy measurements. The lipid content of the clams was only 10.7% of that of the herring, resulting in a 23 .5% lower caloric density in clams.
Only the male walruses provided sufficient data to establish daily defecation patterns during the collection periods (16:00-09:00) . The first defecation each day occurred within 8 h of the evening meal, and subsequent defecations occurred sporadically throughout the day. The C r 2 0 3 concentration in fecal samples varied throughout each day. During the collection period, concentrations ranged from 3.4 to 11.7% on the herring diet and from 7.8 to 13.4% on the clam diet. Daily variation in fecal C r 2 0 3 concentration within an animal averaged 2 . 1% (range 0 - 5 . 3 % ) . The daily samples were pooled to average the effect of this variation.
The daily protein and lipid excretion patterns were not consistent with the C r 2 0 3 excretion patterns. On most days, the lipid excretion pattern in the adult male consuming herring was similar to the C r 2 0 3 excretion pattern; in the immature male, however, the lipid excretion pattern showed the opposite trend to the C r 2 0 3 excretion pattern. Fecal protein patterns showed a trend opposite to C r 2 0 3 excretion patterns with the clam diet, but showed no visible excretion pattern with the herring diet.
Walruses on the herring diet consumed 25 083.2 -40760 .6 kcal • d a y 1 ( 1 2 . 0 - 19 . 5 kg wet weight) and maintained body mass within 0 .5% per day (Tables 2 and 3). On
548

Apparent digestive efficiency in walruses, fed herring and clams
TABLE 1. Proximate composition and energy density of herring and clams fed to walruses
Herring
Clams
No.
1 2
Pooled
1 2
Pooled
n
10 10 20
10" 10° 20
Dry matter
(%)
32.1 + 1.6 33.6±2.7 32.8±2.3
21.1+0.6* 19.8±0.6* 20.4 ±0.9
Protein
(%)
48.1+2.7 46.8 ±4.1 47.5±2.9
75.5 + 1.5 76.6±1.2 76.1±1.4
Total lipid
(%)
49.5 ±4.2 47.7±4.1 49.6±4.1
5.1+0.8 5.5±0.6 5.3±0.7
Ash
(%)
6.2±0.5 6.4+0.4 6.3+0.5
6.2+0.3* 5.3±0.3* 5.8±0.5
Energy (kcal-g"1)
6.36+0.24 6.37±0.27 6.37+0.25
4.81 ±0.03* 4.92±0.05* 4.87 ±0.07
NOTE: Values are given as the mean ± 1 standard deviation. "Ten values, each representing 5 clams. Significant differences between samples (P < 0.05).
TABLE 2. Food and energy intake during the collection period (days 6—11 or 7 — 10) of walruses fed herring and clams, and associated changes in body mass
Walrus
Herring diet Adult male
Adult female
Immature male
Immature female
Clam diet Adult male
Adult female
kg • day ' (wet wt.)
19.5
15.0
12.0
12.0
24.0
18.0
Intake
kcal • kg"1 • day"'
29.7
26.4
31.9
46.1
18.3
15.5
kcal • kg"0 75 • day"1
180.6
155.1
168.7
222.7
109.8
90.5
Day
1 6
11
11
11
11
10
10
Change in
(kg)
1383 1385 1363 1193 1184 1188 794 791 784 550 551 537
1363 1320 1289 1151 1151 1152
kg
nd - 2 2
nd +4
nd - 7
nd - 1 4
- 4 3 - 3 1
0 + 1"
body mass
Change
kg • day"1
nd - 4 . 4
nd +0.8
nd - 1 . 4
nd - 2 . 8
- 7 . 2 -10 .3
0 +0.3
%/day
nd - 0 . 3
nd <0.1
nd - 0 . 2
nd - 0 . 5
- 0 . 5 - 0 . 8
0 0
NOTE: nd, no data; diets adjusted on day 2. "Less than the error in the scale.
the clam diet, the adult male and female walruses consumed 17 873.9 and 23 831.9 kcal day"1 (24.0 and 18.0 kg wet weight), respectively. The adult male lost an average of 0.6% of body mass per day, while the female's mass remained constant. The mean energy intakes for the 2 adult walruses on the clam diet were 42.2% lower than on the herring diet (20 852.9 and 36 057.3 kcal day"1, respectively).
The total maintenance energy requirements on the herring diet were higher in the adult walruses than in the immature animals, but in mass-specific terms, the immature female had the highest daily intake rate. The adult male had a higher mass-specific ingestion rate than the adult female on both the herring and clam diets (Table 2).
The apparent digestive coefficients of energy ranged from 90.4to95.6% (* = 92.7%, n = 6) of the gross energy intake (Table 3). The mean digestive coefficients for the female wal
ruses were significantly greater than for the males (Table 4), but did not differ between diets (Table 5) or age groups.
The protein intake ranged from 1868.6 g dry matter • day"' for the immature walruses to 3729.6 g dry matter • day -1 for the adult male on the clam diet (Table 3). The mean digestive coefficient for protein among all walruses was 93.8% (n = 6) and did not differ between the sexes or diets (Tables 4 and 5). The lipid intake on the herring and clam diets ranged from 1953.2 to 3174.0 and from 195.1 to 260.1 g dry matter-d ay 1 , respectively. The mean lipid intake for the adult walruses was 12.3 times greater on the herring diet (x = 2807.8 g dry matter • day -1, n = 2) than on clam diet (227.6 g dry matter • day"', n = 2) (Table 3). Lipid digestion was significantly higher on the herring diet than on the clam diet. No differences in the lipid digestive coefficients between the sexes were found.
549

Fisher et al.
TABLE 3. Daily gross nutrient and energy intake, and apparent digestion coefficients for walruses fed herring and clams
Adult male Adult female Immature male Immature female
Adult male Adult female Immature male Immature female
Adult male Adult female Immature male Immature female
Adult male Adult female Immature male Immature female
Adult male Adult female Immature male Immature female
Daily intake
40 760.6 31 354.0 25 083.2 25 083.2
6 398.0 4 921.5 3 937.2 3 937.2
3 036.5 2 335.7 1 868.6 1 868.6
3 174.0 2441.6 1 953.2 1 953.2
401.2 308.6 248.7 248.7
Herring
Apparent digestion
coefficient"
(%) Energy (kcal)
90.4±1.7 94.4±2.4 91.8±2.3 95.6±0.4
Dry matter (g) 84.5±2.3 89.4±3.4 87.7±2.6 89.4±1.1
Protein (g)
90.4+2.1 94.6±1.6 93.3 + 1.8 94.3±1.1
Total lipid (g) 92.6±1.8 95.4+2.4 92.3±2.5 97.1+0.4
Ash (g)
— _ — -
Daily intake
23 831.9 17 873.9
—
4 898.4 3 673.8
—
3 729.6 2 797.2
—
260.1 195.1
—
283.1 212.4
— —
Clams
Apparent digestion
coefficient"
(%)
90.7±3.1 93.2±2.1
—
88.1 ±2.9 91.7 + 1.9
—
94.0 + 1.9 95.9+2.3
—
73.2±4.5 73.1+5.4
—
— — — —
"Values are given as the mean ± I standard deviation.
Discussion Maintenance feeding levels, required to make valid compar
isons between diets (National Research Council 1981), should be determined over several weeks to reduce the influence of gut or bladder fullness, changes in the size of the body water pool, or the effect of hormones (Robbins 1983). Sufficient time was not available, as reflected by changes in body mass, to more than approximate maintenance levels for these walruses.
The adult female was the only walrus to maintain constant body mass (absolute change <0.1%) throughout the experiments, although her caloric intake was about 26.4 kcal • kg - 1 • day -1 (155 kcal • k g " 7 5 • day""1) on herring and only 15.5 kcal • kg"1 • d a y 1 (90.5 kcal • kg"075 • day 1 ) on clams. The latter is probably an underestimate of maintenance requirements, reflecting insufficient time to acclimate to the clam diet. The adult male maintained constant body mass on a diet of clams for the 9 days between experiments then lost 43 kg between days I and 7 and 31 kg from days 7 to 10 (7.2 and 10.3 kg day"1, respectively). The female started a pure clam diet only the day before the experiment, which ended 10 days later. She was therefore eating only clams for 5 days less than the time taken to detect mass loss in the male.
The lag in body mass changes associated with reduced energy intake may be due to changes in body composition
(Robbins 1983). If body protein was being catabolized as in several fasting phocids (Worthy and Lavigne 1987), significant quantities of metabolic water would be required for urea excretion (Pike and Brown 1967). The female walrus may have ingested water to eliminate nitrogenous wastes and maintain a positive water balance. Although marine animals do not usually consume water (Pilson 1970; Depocas et al. 1971), drinking and ice-eating have been observed in fasting male otariid seals, common dolphins (Delphinus delphis), and captive harp seals (Gentry 1981; Hui 1981; Renouf et al. 1990). Also, the catabolism of lipid from blubber and core reserves would yield water (1.07 g -g~ ' lipid; Prosser and Brown 1965), which may be used for the elimination of nitrogenous compounds or retained in the total body water pool.
For immature walruses in captivity, previous estimates of energy intake (summarized by Fay 1982 and Gehnrich 1984) were greater than our determinations. However, these authors relied on growth curves for wild walruses to estimate initial body mass, although captive marine mammals tend to be heavier than their wild counterparts (Fay 1982; Lavigne et al. 1982). Previous investigators also were unable to verify a condition of constant body mass because they were unable to weigh the animals while intake was measured. Therefore previous values cannot be used as maintenance levels.
Immature animals require more energy per unit body mass
550
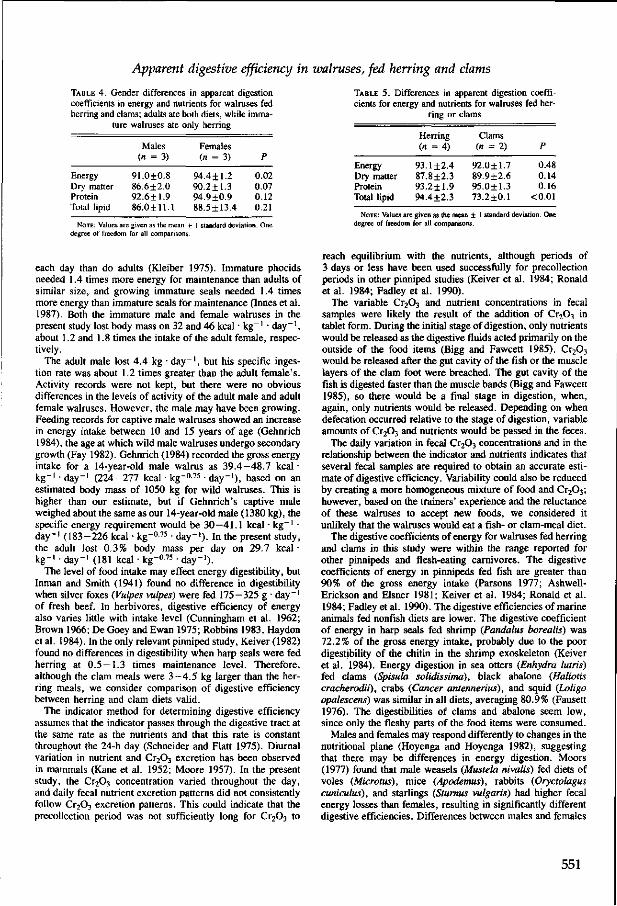
Apparent digestive efficiency in walruses, fed herring and clams
TABLE 4. Gender differences in apparent digestion coefficients in energy and nutrients for walruses fed herring and clams; adults ate both diets, while imma
ture walruses ate only herring
Males Females (n = 3) (n = 3) P
Energy 91.0±0.8 Dry matter 86.6 + 2.0 Protein 92.6 + 1.9 Total lipid 86.0 + 11.1
94.4 ±1.2 0.02 90.2 + 1.3 0.07 94.9+0.9 0.12 88.5 + 13.4 0.21
NOTE: Values are given as the mean ± 1 standard deviation. One degree of freedom for all comparisons.
TABLE 5. Differences in apparent digestion coefficients for energy and nutrients for walruses fed her
ring or clams
Herring Clams (n = 4) (« = 2) P
Energy Dry matter Protein Total lipid
93.1+2.4 87.8±2.3 93.2 + 1.9 94.4+2.3
92.0 + 1.7 89.9+2.6 95.0+1.3 73.2+0.1
0.48 0.14 0.16
<0.01
NOTE: Values are given as the mean ± I standard deviation. One degree of freedom for all comparisons.
each day than do adults (Kleiber 1975). Immature phocids needed 1.4 times more energy for maintenance than adults of similar size, and growing immature seals needed 1.4 times more energy than immature seals for maintenance (Innes et al. 1987). Both the immature male and female walruses in the present study lost body mass on 32 and 46 kcal • kg - 1 • day""1, about 1.2 and 1.8 times the intake of the adult female, respectively.
The adult male lost 4.4 kg • day -1, but his specific ingestion rate was about 1.2 times greater than the adult female's. Activity records were not kept, but there were no obvious differences in the levels of activity of the adult male and adult female walruses. However, the male may have been growing. Feeding records for captive male walruses showed an increase in energy intake between 10 and 15 years of age (Gehnrich 1984), the age at which wild male walruses undergo secondary growth (Fay 1982). Gehnrich (1984) recorded the gross energy intake for a 14-year-old male walrus as 39.4-48.7 kcal • kg - 1 • day"1 (224-277 kcal • kg"075 • day"1), based on an estimated body mass of 1050 kg for wild walruses. This is higher than our estimate, but if Gehnrich's captive male weighed about the same as our 14-year-old male (1380 kg), the specific energy requirement would be 30—41.1 kcal • kg - 1 • day"1 (183-226 kcal • kg""075 • day"1). In the present study, the adult lost 0.3% body mass per day on 29.7 kcal • kg"1 • day"1 (181 kcal • kg"075 • day"1).
The level of food intake may effect energy digestibility, but Inman and Smith (1941) found no difference in digestibility when silver foxes (Vulpes vulpes) were fed 175—325 g • day"' of fresh beef. In herbivores, digestive efficiency of energy also varies little with intake level (Cunningham et al. 1962; Brown 1966; De Goey and Ewan 1975; Robbins 1983, Haydon et al. 1984). In the only relevant pinniped study, Keiver (1982) found no differences in digestibility when harp seals were fed herring at 0.5 — 1.3 times maintenance level. Therefore, although the clam meals were 3 -4 .5 kg larger than the herring meals, we consider comparison of digestive efficiency between herring and clam diets valid.
The indicator method for determining digestive efficiency assumes that the indicator passes through the digestive tract at the same rate as the nutrients and that this rate is constant throughout the 24-h day (Schneider and Flatt 1975). Diurnal variation in nutrient and Cr203 excretion has been observed in mammals (Kane et al. 1952; Moore 1957). In the present study, the Cr203 concentration varied throughout the day, and daily fecal nutrient excretion patterns did not consistently follow Cr203 excretion patterns. This could indicate that the precollection period was not sufficiently long for Cr203 to
reach equilibrium with the nutrients, although periods of 3 days or less have been used successfully for precollection periods in other pinniped studies (Keiver et al. 1984; Ronald et al. 1984; Fadley et al. 1990).
The variable Cr203 and nutrient concentrations in fecal samples were likely the result of the addition of Cr203 in tablet form. During the initial stage of digestion, only nutrients would be released as the digestive fluids acted primarily on the outside of the food items (Bigg and Fawcett 1985). Cr203
would be released after the gut cavity of the fish or the muscle layers of the clam foot were breached. The gut cavity of the fish is digested faster than the muscle bands (Bigg and Fawcett 1985), so there would be a final stage in digestion, when, again, only nutrients would be released. Depending on when defecation occurred relative to the stage of digestion, variable amounts of Cr203 and nutrients would be passed in the feces.
The daily variation in fecal Cr203 concentrations and in the relationship between the indicator and nutrients indicates that several fecal samples are required to obtain an accurate estimate of digestive efficiency. Variability could also be reduced by creating a more homogeneous mixture of food and Cr203; however, based on the trainers' experience and the reluctance of these walruses to accept new foods, we considered it unlikely that the walruses would eat a fish- or clam-meal diet.
The digestive coefficients of energy for walruses fed herring and clams in this study were within the range reported for other pinnipeds and flesh-eating carnivores. The digestive coefficients of energy in pinnipeds fed fish are greater than 90% of the gross energy intake (Parsons 1977; Ashwell-Erickson and Eisner 1981; Keiver et al. 1984; Ronald et al. 1984; Fadley et al. 1990). The digestive efficiencies of marine animals fed nonfish diets are lower. The digestive coefficient of energy in harp seals fed shrimp (Pandalus borealis) was 72.2% of the gross energy intake, probably due to the poor digestibility of the chitin in the shrimp exoskeleton (Keiver et al. 1984). Energy digestion in sea otters (Enhydra lutris) fed clams (Spisula solidissima), black abalone (Haliotis cracherodii), crabs (Cancer antennerius), and squid {Loligo opalescens) was similar in all diets, averaging 80.9% (Fausett 1976). The digestibilities of clams and abalone seem low, since only the fleshy parts of the food items were consumed.
Males and females may respond differently to changes in the nutritional plane (Hoyenga and Hoyenga 1982), suggesting that there may be differences in energy digestion. Moors (1977) found that male weasels (Mustela nivalis) fed diets of voles (Microtus), mice (Apodemus), rabbits (Oryctolagus cuniculus), and starlings (Sturnus vulgaris) had higher fecal energy losses than females, resulting in significantly different digestive efficiencies. Differences between males and females
551

Fisher et al.
in the digestion of energy have not been reported for pinnipeds, largely because studies to date have used animals of the same sex (Keiver et al. 1984; Fadley et al. 1990), or have not indicated that differences between the sexes were tested (Parsons 1977; Ashwell-Erickson and Eisner 1981; Ronald et al. 1984). Our data suggest that the digestive efficiency of male walruses may be lower than that of females, although the small sample size, differences in defecation patterns, and variation in fecal composition prevent definitive conclusions from being drawn. Studies in farm and laboratory animals indicate that males and females digest energy equally well (Skitsko and Bowland 1970; Eggum and Pederson 1983).
The digestive coefficients of protein in walruses fed herring and clams were similar to the values reported for other carnivores. Efficiencies are generally high in carnivores because animal proteins are easily digested (Robbins 1983) and fish flesh, which has small amounts of connective tissue, is particularly digestible (Geraci 1975). Significant differences in protein digestibility were not found between diets in the present study, although apparent digestibility is usually lower in carnivore diets when whole prey items are eaten because of the non-digestible residues, such as bones, teeth, hair, and feathers (Davison et al. 1978). Protein digestibility on the herring diet was not influenced by bones, probably because they were small and quickly digested.
Lipid digestive efficiency in carnivores, studied primarily in commercial fur-bearing species, is high because animal fats in the diet are easily digested (Leoschke 1959). However, some dietary lipid is passed in feces, as are nonlipid extract-soluble materials of food origin and endogenous lipid, such as residues of digestive juices. The apparent lipid digestibility in animals on the herring diet was significantly greater than in those on the clam diet. However, the apparent digestibility measurements include endogenous losses. These losses would be relatively small with the fat-rich herring diet but relatively high with the low-fat clam diet. In animals on the clam diet, small fecal losses of dietary lipid would be inflated by the constant endogenous loss, resulting in a lower apparent digestibility. Similar results have been reported for fishers (Martes pennant!) (Davison et al. 1978).
Overall, energy and nutrient digestive efficiencies in walruses were similar to those of other carnivores, therefore the null hypothesis cannot be rejected. The indicator method using OiO} was useful in determining energy and nutrient digestive coefficients, providing several fecal samples were collected daily to reduce variability. Future studies on the energetic requirements of captive walruses will require a larger sample size to determine if gender differences in digestive efficiency exist.
Acknowledgments The authors thank the staff at the Harderwijk Marine Mammal
Park, especially the walrus trainers, P. Mosterd and J. Foortjes, for their assistance. The Cr203 tablets were prepared by M. Summers, Visiting Professor to the Faculty of Pharmacy, University of Manitoba. Technical assistance was provided by the Department of Animal Science Nutrition Laboratory staff, University of Manitoba, and B. Stewart, Department of Fisheries and Oceans. S. Innes, R. MacArthur. D. Lavigne, and an anonymous reviewer provided useful comments on drafts of this paper. Research was funded by the Department of Fisheries and Oceans and a research grant from the Manitoba Department of Agriculture to the Department of Animal
Science, University of Manitoba. The Mettler Company provided the walrus weighing platform.
Ashwell-Erickson, S. M., and Eisner, R. 1981. The energy cost of free existence for Bering Sea harbor and spotted seals. In Abstracts of the Fourth Biennial Conference on the Biology of Marine Mammals, December 14 — 18, 1981. Society for Marine Mammalogy, San Francisco, Calif. (Abstr.)
Association of Official Analytical Chemists. 1965. Official methods of the Association of Official Analytical Chemists. Association of Official Analytical Chemists, Washington, D.C.
Bagenel, T. 1978. Methods for assessment of fish production in fresh waters. IBP Handb. No. 3. Blackwell Scientific Publications, Oxford.
Beddington, J. R., Beverton, R. J. H., and Lavigne, D. M. 1985. Marine mammals and fisheries. George Allen and Unwin, London.
Bigg, M. A., and Fawcett, I. 1985. Two biases in diet determination of northern fur seals (Callorhinus ursinus). In Marine mammals and fisheries. Edited by J. R. Beddington, R. J. H. Beverton, and D. M. Lavigne. George Allen and Unwin, London, pp. 284—291.
Brown, L. D. 1966. Influence of intake on feed utilization. J. Dairy Sci. 49: 223-230.
Cunningham, H. M., Friend, D. W., and Nicholson, J. W. G. 1962. Efficiency of conversion of protein, energy and carbon in pigs restricted late in the fattening period. Can. J. Anim. Sci. 42: 176-182.
Davison, R. P., Mautz, W. W., Haven, H. H., and James, B. H. 1978. The efficiency of food utilization and energy requirements of captive female fishers. J. Wildl. Manage. 42: 811 — 821.
De Goey, L. W., and Ewan, R. C. 1975. Effect of level of intake and diet deletion on energy metabolism in the young pig. J. Anim. Sci. 40: 1045-1051.
Depocas, F.,Hart, J. S., and Fisher, H. D. 1971. Sea water drinking and water flux in starved and fed Harbor seals, Phoca vitulina. Can. J. Physiol. Pharmacol. 49: 53-62.
Eggum, B. O., and Pederson, B. 1983. The effect of sex on protein utilization in rats. Acta Agric. Scand. 33: 201-203.
Fadley, B. S., Worthy, G. A. J., and Costa, D. P. 1990. Assimilation efficiency of northern fur seals determined using dietary manganese. J. Wildl. Manage. 54: 246—257.
Fausett, L. L. 1976. Assimilation efficiency of captive sea otters Enhydra lutris (Carnivore: Mustelidae). M.A. thesis, California State University, Long Beach.
Fay, F. H. 1982. Ecology and biology of the Pacific walrus. North American Fauna No. 74. U.S. Fish and Wildlife Service, Washington, D.C.
Fay, F. H., Feder, H. M., and Stoker, S. W. 1977. An estimate of the impact of the Pacific walrus population on its food resources in the Bering Sea. U.S. Department of Commerce, National Technical Information Service, Springfield, VA. PB-273-505.
Fisher, K. I. 1989. Food habits and digestive efficiency in walrus, Odobenus rosmarus. M.Sc. thesis, Department of Animal Science, University of Manitoba, Winnipeg, Man.
Folch, J., Lee, M., and Stanley, G. H. S. 1957. A simple method for the isolation and purification of total lipids from animal tissues. J. Biol. Chem. 226: 497-509.
Gehnrich, P. H. 1984. Nutritional and behavioral aspects of reproduction in walruses. M.Sc. thesis, University of Alaska, Fairbanks.
Gentry, R. L. 1981. Sea water drinking in eared seals. Comp. Biochem. Physiol. A, 68: 81-86.
Geraci, J. R. 1975. Pinniped nutrition. Rapp. P.-V. Reun. Cons. Int. Explor. Mer. 169: 312-323.
Haydon, K. D., Knabe, D. A., and Tanksley, T. D., Jr. 1984. Effect of level of feed intake on nitrogen, amino acids and energy digestibilities measured at the end of the small intestine and over the total digestive tract of growing pigs. J. Anim. Sci. 59: 717—724.
Hoyenga, K. B., and Hoyenga, K. T. 1982. Gender and energy balance: sex differences in adaptations for feast and famine. Physiol. Behav. 28: 545-563.
552

Apparent digestive efficiency in walruses, fed herring and clams
Hui, C. A. 1981. Sea water consumption and water flux in the common dolphin Delphinus delphis. Physiol. Zool. 54: 430—440.
lnman, W. R., and Smith, G. E. 1941. Digestibility studies with foxes. I. Effect of plane of nutrition upon the digestibility of meats. Sci. Agric. 22: 18-27.
Innes, S., Lavigne, D. M., Earle, W. M., and Kovacs, K. M. 1987. Feeding rates of seals and whales. J. Anim. Ecol. 56: 115 — 130.
Kane, E. A., Jacobson, W. C , and Moore, L. A. 1952. Diurnal variations in excretion patterns of chromium oxide and lignin. J. Nutr. 47: 263-270.
Kastelein, R. A., and Wiepkema, P. R. 1989. A digging trough as occupational therapy for Pacific walruses (Odobenus rosmarus divergens) in human care. Aquat. Mamm. 15: 9 — 17.
Keiver, K. M. 1982. Apparent digestible and metabolizable energy in harp seals (Phoca groenlandica). M.Sc. thesis, Department of Zoology, University of Guelph, Guelph, Ont.
Keiver, K. M., Ronald, K., and Beamish, F. W. H. 1984. Metabolizable energy requirements for maintenance and faecal and urinary losses of juvenile harp seals (Phoca groenlandica). Can. J. Zool. 62: 769-776.
Kleiber, M. 1975. The fire of life. An introduction to animal energetics. R. E. Krieger Publishing Co., Huntington, N.Y.
Lavigne, D. M., Barchard, W., Innes, S., and0ritsland, N. A. 1982. Pinniped bioenergetics. FAO Fish Ser. 5: 191—235.
Leoschke, W. L. 1959. The digestibility of animal fats and proteins by mink. Am. J. Vet. Res. 20: 1086-1089.
Marchello, J. A., Dryden, F. D., and Hale, W. H. 1971. Bovine serum lipids. I. The influence of added animal fat to the ration. J. Anim. Sci. 32: 1008-1015.
Moore, J. H. 1957. Diurnal variation in the composition of the faeces of pigs on diets containing chromium oxide. Br. J. Nutr. 11: 273-288.
Moors, P. J. 1977. Studies on the metabolism, food consumption and assimilation efficiency of a small carnivore, the weasel (Mustela nivalis L.). Oecologia, 27: 185-202.
National Research Council. 1981. Nutritional energetics of domestic animals and glossary of energy terms. National Academy Press, Washington.
Parsons, J. L. 1977. Metabolic studies on ringed seals (Phoca hispida). M.Sc. thesis, Department of Pathology, University of Guelph, Guelph, Ont.
Pike, R. L., and Brown, F. A., Jr. 1967. Nutrition: an integrated approach. John Wiley and Sons, Inc., New York.
Pilson, M. E. Q. 1970. Water balance in California sea lions. Physiol. Zool. 43: 257-269.
Prosser, C. L. and Brown, F. A., Jr. 1965. Comparative animal physiology. W. B. Saunders, Philadelphia.
Renouf, D., Noseworthy, E., and Scott, M. C. 1990. Daily fresh water consumption by captive harp seals (Phoca groenlandica). Mar. Mammal Sci. 6: 253—257.
Robbins, C. T. 1983. Wildlife nutrition and feeding. Academic Press, New York.
Ronald, K., Keiver, K. M., Beamish, F. W. H., and Frank, R. 1984. Energy requirements for maintenance and faecal and urinary losses of the grey seal (Halichoerus grypus). Can. J. Zool. 62: 1101 — 1105.
Schneider, B. H., and Flatt, W. P. 1975. The evaluation of feeds through digestibility experiments. The University of Georgia Press, Athens.
Skitsko, P. J., and Bowland, J. P. 1970. Energy and nitrogen digestibility and retention by pigs as influenced by diet, sex, breeding group and replicate. Can. J. Anim. Sci. 50: 685—691.
Vibe, C. 1950. The marine mammals and the marine fauna in the Thule district (northwest Greenland) with observations on ice conditions in 1939-41. Medd. Gr0nl. 150: 1-115.
Williams, C. H., David, D. J., and Iisma, O. 1962. The determination of Cr203 in feed and excreta samples by atomic absorption spectrophotometry. J. Agric. Sci. 59: 381—385.
Worthy, G. A. J., and Lavigne, D. M. 1987. Mass loss, metabolic rate, and energy utilization by harp and grey seal pups during the postweaning fast. Physiol. Zool. 60: 352 — 364.
553

Chapter 6
Odontocete overview
555

Chapter 6.1
Parameters determining the food intake of odontocetes (toothed whales): a general discussion
R.A. Kastelein
Harderwijk Marine Mammal Park, Strandboulevard Oost 1,3841 AB Harderwijk, The Netherlands
Introduction
Information on the food consumption of a number of odontocete species in captivity is available (Sergeant, 1969; Hinga, 1979; Innes et ah, 1987). However, most of this data is difficult to evaluate, as the necessary accompanying information such as diet, water temperature, body weight, body size, age, sex, and reproductive status is often incomplete, or the study periods are short, or not reported. Food consumption reports, however, on 9 odontocete species at the Harderwijk Marine Mammal Park and collaborating institutions contain large amounts of data with more complete background information. The study species are, in order of decreasing adult body weight, the killer whale, Orcinus orca (Kastelein and Vaughan, 1989: chapter 2.1; Kastelein et ah, 1998 b and h: chapters 2.3 and 2.2), the beluga, Delphi-napterus leucas (Kastelein et ah, 1994: chapter 2.4), the false killer whale, Pseudorca crassi-dens (Kastelein et ah, 1998 d: chapter 2.5), the bottlenose dolphin, Tursiops truncatus (Kastelein et ah, 1998 f and g: chapters 2.7 and 2.6), the Amazon river dolphin, Inia geoffren-sis (Kastelein et ah, 1998 e: chapter 2.8), the common dolphin, Delphinus delphis (Kastelein et ah, 1998 c: chapter 2.9), the dusky dolphin, Lagenorhynchus obscurus (Kastelein et ah, 1998 a: chapter 2.10), the Commerson's dolphin, Cephalorhynchus commersonii (Kastelein et ah, 1993 a and b; chapters 2.12 and 2.11), and the harbour porpoise, Phocoena phocoena (Kastelein et ah, 1990: chapter 2.17; 1997 a, b, c and d: chapters 2.13, 2.15, 2.14 and 2.16). It should be noted that these food intake and body weight data were not rec
orded for research purposes, but primarily for husbandry purposes. The main information deficit is the calorific contents of the diets, although as the dietary composition for all odontocete species was recorded, the calorific content can be estimated. The basic measure in each of these studies was the daily food intake of individual animals (kg wet weight per day), although data were usually presented as annual or monthly intake, depending on the aim of the study.
The present study compares food intake of the 9 odontocete species at 3 levels:
I) Average daily food consumption (expressed as a percentage of body weight) in relation to body weight. An understanding of the causes of the food intake differences between the 9 species may allow an estimation of the average daily food intakes of other odontocete species.
II) Annual food intake in relation to age in 3 species for which relatively large amounts of data are available. From an understanding of the causes of differences in annual food intake between individuals, predictions of individual differences in other less investigated odontocete species may be possible.
III) Monthly food intakes of individuals, which allows the investigation of the possibility and causes of systematic seasonal (circa-annual) fluctuations in food intake.
557

R.A. Kastelein
I) Comparison of the average daily food intake as a percentage of body weight of 9 odontocete species
Average daily food intake expressed as a percentage of body weight is an approximate indicator of average daily metabolic rate, including standard metabolic rate and the costs of thermoregulation, reproduction, and locomotion. To control for any seasonal fluctuations in food intake, average values were taken over calendar years. Average daily food consumption as a percentage of body weight for 9 odontocete species is shown in figure 1. The food intake of sub-adult animals, adult males and non-lactat-ing females only were used; food intake of animals undergoing the initial growth spurt (up to 2 years old) were omitted, as these
animals require additional energy (Innes et ah, 1987; Worthy, 1990). The data sets are small, as the animals were weighed infrequently due to practical difficulties; in some cases more than one data point per animal was used. Although the number of study animals per species is low (Table 1), and there is variation in food intake of conspecif-ic animals of similar body weight, the combined data of all 9 species show a general negative relationship between body weight and food intake as a percentage of body weight. The same phenomenon has been reported for terrestrial mammals (Kleiner, 1947; Kleiber, 1975). This negative trend was seen in 8 of the 9 species, the exception being the single dusky dolphin, which experienced a decrease in water temperature during the study period (Kastelein et al., 1998 a:
CO CO
14
12
II Q. | 10
§2 8
•2 & n in
o> o.
V
6
4 -
2 -
10
\ D
\ &b° \
\ D
V *> \ °Q
D*V
TV £ >fc o jp
• *Vv ° t \ o + * ^ ^ 8b°
++ \ . • ""o o + + ^ L „ A + ^ * w O
4 +A + » - ^
+ -**i Hfc
• Harbour porpoise • Commerson's dolphin A Dusky dolphin » Common dolphin & Amazon river dolphin + Atlantic bottlenose dolphin o False killer whale • Beluga x Killer whale
X
o X *
X X
^^•*-**o ^ ~ ~ " " " 1 ^ ^ X
• ' • —
• •
100 1000 10000 Body weight (kg)
Figure 1. The relationship between body weight and average daily food consumption as a percentage of body weight in 9 odontocete species (only sub-adults and non-reproducing adult animals are included). The trend line serves only as a tool to compare the species (see also table 1).
558
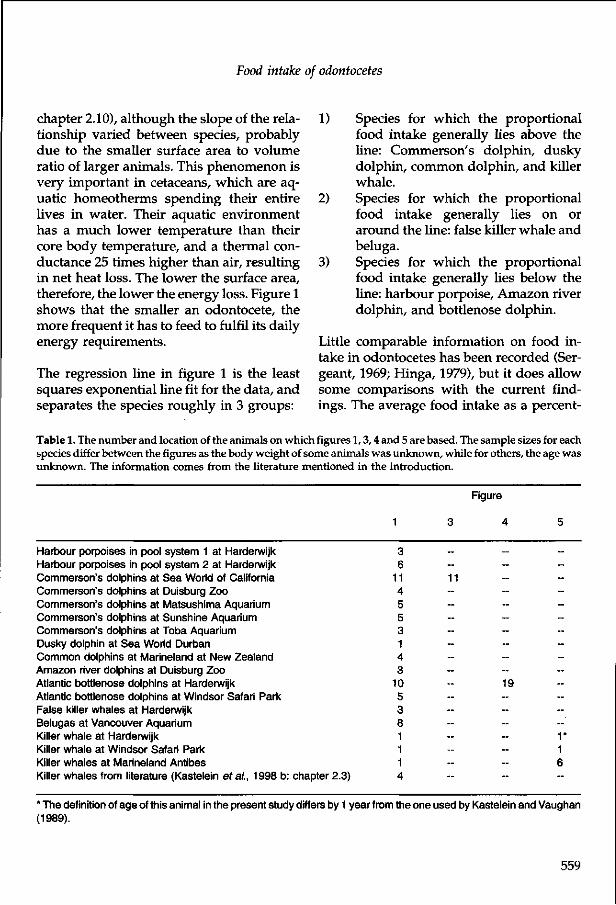
Food intake of odontocetes
chapter 2.10), although the slope of the relationship varied between species, probably due to the smaller surface area to volume ratio of larger animals. This phenomenon is very important in cetaceans, which are aquatic homeotherms spending their entire lives in water. Their aquatic environment has a much lower temperature than their core body temperature, and a thermal conductance 25 times higher than air, resulting in net heat loss. The lower the surface area, therefore, the lower the energy loss. Figure 1 shows that the smaller an odontocete, the more frequent it has to feed to fulfil its daily energy requirements.
The regression line in figure 1 is the least squares exponential line fit for the data, and separates the species roughly in 3 groups:
1) Species for which the proportional food intake generally lies above the line: Commerson's dolphin, dusky dolphin, common dolphin, and killer whale.
2) Species for which the proportional food intake generally lies on or around the line: false killer whale and beluga.
3) Species for which the proportional food intake generally lies below the line: harbour porpoise, Amazon river dolphin, and bottlenose dolphin.
Little comparable information on food intake in odontocetes has been recorded (Sergeant, 1969; Hinga, 1979), but it does allow some comparisons with the current findings. The average food intake as a percent-
Table 1. The number and location of the animals on which figures 1,3,4 and 5 are based. The sample sizes for each species differ between the figures as the body weight of some animals was unknown, while for others, the age was unknown. The information comes from the literature mentioned in the introduction.
Figure
Harbour porpoises in pool system 1 at Harderwijk 3 Harbour porpoises in pool system 2 at Harderwijk 6 Commerson's dolphins at Sea World of California 11 11 Commerson's dolphins at Duisburg Zoo 4 Commerson's dolphins at Matsushima Aquarium 5 Commerson's dolphins at Sunshine Aquarium 5 Commerson's dolphins at Toba Aquarium 3 Dusky dolphin at Sea World Durban 1 Common dolphins at Marineland at New Zealand 4 Amazon river dolphins at Duisburg Zoo 3 Atlantic bottlenose dolphins at Harderwijk 10 - 19 Atlantic bottlenose dolphins at Windsor Safari Park 5 False killer whales at Harderwijk 3 Belugas at Vancouver Aquarium 8 Killer whale at Harderwijk 1 -- - 1 * Killer whale at Windsor Safari Park 1 1 Killer whales at Marineland Antibes 1 -- -- 6 Killer whales from literature (Kastelein era/., 1998 b: chapter 2.3) 4
* The definition of age of this animal in the present study differs by 1 year from the one used by Kastelein and Vaughan (1989).
559

R.A. Kastelein
a o
•a 'S o
£ o
<u 60 a
-a a a
a.
01
OJ
£ 2
5
J3
60 B
C
> 18 0)
J5 H N 01
Xi
H
CO 0 CJ (D Q. CO
0)
0
3
9 o Q 2
3< 0 Q. E o >- & 0 D )
^ CO
5 cr
O)
c
5 9
CO
Q . CO
CM
m P 2 J £ 9
CO CO
ri> c 0
5 E
2> Q.
E CO
2 o. CO
in •g" "3 cr
•s c
•D 3 CT CO
CO Q . CO
^9 O <T-1 - LO
in
c
5
2 Q . CO ^5 O
cvi
•g 3 cr CO
in
If
CO
'E
°& 00 CM
o Q.
2 2 0" 2 ~ ~ m m * m . n m
9
0 0 o o co co
E E m m
D) D ) C C E b 0 0
c c
3 o CO
E a? o CO
o> c
0 o m co .
E e-CO ff-
. in D)CO c
i n co
!2 ^o ^ 3 d^ $v CJ-O in , — _. co m 00 ~ N •*
0 0 sz sz
l_ vP ^O m o x oN
J i n m
£ . t -^ *-- co t b: fc 3 >
co m o 1 - CM
CM O)
0
CO CO
O)
t 3 0 P
Q . 0 O
CO D-0 Q . O w
0 <Q co u w
•*r y CO
o .3 O
l i s CO 3 o
•g • 3 cr
c
±; ±; >9 0 0 E E
Q
^9 in en c
§ 1 1
2 in co _ o._-.E 0
S Q.
JO -« 2 ~S> 0 cn"c* 0)0) C 5 c c
2 0 JO <B
in o co co < co o
0
^9 in
•= o 0 I
o o o o
0 0
o o
N co co •* • 1 - CM 1 - CM
O) O O) CM t CM T— T - T— T— 1—
00 O f- CM
CM CM m
• * CO CM CM O) 1"-
1 ^ CM I - CM CO IV
CM CM
T—
1 - O) CM i v CM CM CM CM i n h- 1 - CM T - CM f - CM
• * T- CM CM O CO CM T - T - 1 - CM 1 -
I I I I I I CO O) CO f- 00 o
§8 9 P
O T -CM CM
I I IV CO
CO 0 ^
I f If «> CO
5 ^
T3
c 0 c CO £
co
c
CO O .
11 i s f .— o e
as -^ c 0 en © a> ^ 3 CO * J CO o> n o x CO u. CO ,
f.|
III
CO (/)
.E o
o Q •O c
-^ CO O 2
p
b c co
E 3 co 3 cr <
P
8 - ^ 3
S l I E O 3 < O Q
0) E E o o
0 3 3 CO Q CO
CO 3
^ E 3
.1 § ^ cr co < co co
S3
co 0 (0 0 a 0 a. 3 0 n
<i> E 0
• 0
^ f m TJ CO
c 0 0
ri CO
2 ^ p CI)
T3 CO
<0 X I
560

Food intake of odontocetes
age of body weight reported by Sergeant (1969) for 8 harbour porpoises is similar to the present values for this species. The reported proportional food intake of 8 bottle-nose dolphins from 3 institutions (Hinga, 1979), are about 1% higher than those in the present study. The former estimates, however, were based on 1 month periods, and the diets were probably of lower calorific density than those in the present study. Previous records of average food intake as a percentage of body weight for 2 Atlantic bottlenose dolphins were similar to the values found in the present study for this species (Sergeant, 1969). The proportional food intake of 6 belugas from 3 institutions were similar to those of belugas in the present study (Hinga, 1979), although values reported for 6 belugas by Sergeant (1969), based on estimated weights, are about 1% above current values for this species. The reported food intake as a percentage of body weight of one false killer whale is similar to values for this species in the present study (Sergeant, 1969). The 2 studies report proportional food intake of 9 and 4 killer whales similar to that found in the present study for this species (Sergeant, 1969; Hinga, 1979). It can, therefore, be concluded that the values found in the present study generally agree with values reported in the literature for animals of similar body weights, supporting the idea that these intakes are typical for the species involved. The deviations from the trend line of the food intake values in 7 of the 9 species in figure 1, may be due to external factors, such as differences in water temperatures, calorific density of their food, or to species specific (biological) characteristics such as body shape, body composition, insulating quality of the blubber or general activity level.
A) External factors
A negative relationship might be expected
between water temperature and food intake, but most of the species were kept in water of similar temperature, between 15 and 20°C (Table 2). The ambient water temperature of only 3 species deviated much from this temperature range: the beluga was kept at 12°C, the Amazon river dolphin at 28°C, and the dusky dolphin at 24CC. The relatively low ambient water temperature of the beluga would be expected to result in a high food intake, but this was not the case. In the dusky dolphin, a low food intake would be expected to result from the relatively high water temperature. Again, this was not the case. Only in the Amazon river dolphin did the fairly low food intake appear to have been caused, in part, by the relatively high water temperature. Animals of all species, however, were probably well adapted to the ambient temperatures, and thus probably were within their thermoneutral zone (Williams et ah, 1992 b). It appears, therefore, that with the possible exception of the Amazon river dolphin, the relative positions of food intake values of the 9 species around the trend line of figure 1 do not depend on differences in water temperature.
The energetic content of food would be expected to show a negative relationship with food intake. Although the calorific density of a fish species can show wide seasonal and geographic variations (Martensson et ah, 1996), the average calorific densities of herring (Clupea harengus), mackerel (Scomber scombrus) and sprat (Sprattus sprattus) are fairly similar when averaged over a large period of time, and the calorific densities of whiting (Merlangius merlangus) and squid (Illex spp.) are usually less than half of that of herring, mackerel and sprat (Ronald et ah, 1984; Perez, 1994; Hutchinson, 1996). Because the diets of 7 of the 9 odontocete species consisted for at least 80% of herring, mackerel or sprat (Table 2), the energy con-
561

R.A. Kastelein
tent of the 7 diets was assumed to be fairly similar, when averaged over a year. The diets of the Amazon river dolphins and the dusky dolphin had a relatively low energy content, the calorific content of trout (Salmo trutta), carp (Cyprinus carpio) and tench (Tinea tinea) being much lower than that of herring, mackerel and sprat (Potsdammer et ah, 1988). The food intake of the Amazon river dolphins would be expected to have been relatively high, but was in fact quite low. The low calorific density of the diet of the single dusky dolphin may have contributed to the relatively high level of food intake, but the intake data must be treated with caution, as it was based on only one animal. Overall, with the possible exception of the dusky dolphin, the relative food intake levels of the species did not appear to be caused by differences in energy content of the diets. It is possible, however, that the effects of high water temperature and low energy content of the food may have counterbalanced each other to some degree in the Amazon river dolphin and dusky dolphin.
B) Biological factors
Since external factors, such as water temper
ature and energy content of the diet, do not appear to be important factors in causing the differences in food intake between similarly sized individuals of different species, species specific characteristics such as body shape, body composition (especially blubber thickness), insulating quality of the blubber (lipid content), and general activity level will be considered, although information on these biological parameters is not complete for all 9 species.
Body shape The optimum shape for reducing conductive heat loss to the environment is a ball, as it minimizes the surface area to volume ratio. Quantitative information on body surface area of odontocetes is available for very few species (Parry, 1949), so a qualitative method, the fineness ratio is used to roughly describe body shape. This ratio stems from hydrodynamic research (Williams, 1987), and is calculated as body length/maximum body diameter. A low fineness ratio per volume unit means a low body surface to volume ratio, a ball having the lowest fineness ratio of 1, and suggests a low energy demand for thermoregulation. The fineness ra-
Table 3. The fineness ratio (body length/maximum body diameter) of adult animals of 9 odontocete species.
Species
T Slender - False killer whale - Amazon river dolphin - Atlantic bottlenose dolphin - Common dolphin - Dusky dolphin - Killer whale - Harbour porpoise - Commerson's dolphin - Beluga 1 Rotund
Fineness ratio
7.3 6.7 5.7 5.6 5.2 5.1 5.0 4.8 4.6
562

Food intake of odontocetes
14
12
o5 10
£ 8
I s 6 o
CO ,
2-
Harbour porpoise Commerson's dolphin Dusky dolphin Common dolphin Amazon river dolphin Atlantic bottlenose dolphin False killer whale Beluga Killer whale
• * • " • % & •
J**A
—i 1 1 1 1 1 1 1 1 1 1 1 1 1 1 1 1 1 1 1
50 100 150 200 250 300 350 400 450 500 550
Body length (cm) Figure 2. The relationship between standard body length and body weight1'3 of individuals of 9 odontocete species.
tio of adult animals in the present study-shows distinct differences between the 9 species (Table 3).
Fineness ratio does not take into account the size of the appendages, although 30% of heat production of a resting marine mammal is lost through the flippers, fins, and flukes. This may increase to 70-80% during moderate exercise (Ryg et al., 1993). Therefore the surface area of the appendages relative to the total body surface area of the species may also affect food intake differences between species. Again, quantitative data is missing for most odontocetes.
Body composition Odontocete species differ in body composition. The proportion of blubber is usually related to the relative thickness of the blubber layer, and thus influences the degree of thermal insulation (Doidge, 1990). A rela
tively high proportion of body fat usually indicates a species living in relatively cold water, as body fat is stored mainly as an insulating blubber layer. As a result, these species are relatively slow swimmers. In contrast, a relatively high percentage of muscle corresponds to a relatively thin blubber layer and implies a generally relatively active species living in warm water.
All animals in the present study were in good physical condition and their blubber layer was assumed to be adapted to the water temperature in which they were kept. In all cases, the animals were maintained at water temperatures encountered by wild conspecifics in their sometimes wide distribution area. Blubber thicknesses, therefore, are considered species specific, although they may vary to some extent between individuals, and have been shown to change over time in bottlenose dolphins (Williams
563

R.A. Kastelein
and Friedl, 1990; Williams et al, 1992 b), pilot whales, Globicephala sp. (Lockyer, 1994), and harbour porpoises (Kastelein et al, 1997 d: chapter 2.16). As marine mammals have similar standard metabolic rates as terrestrial mammals of similar body weight (La-vigne et al, 1986; Innes et al, 1987), they could be expected to reduce heat loss to the environment to levels similar to those experienced by terrestrial mammals. This would mean that the insulation of each species is adapted to the water temperatures encountered in its distribution area.
Body composition data exist for only a few odontocete species, and therefore has to be derived indirectly. This can be done by combining the body length versus body weight relationship with the fineness ratio. The relationship between body length and body weight173 data for all species combined, is recti-linear (Fig. 2), suggesting that a change in length, regardless of shape (a species), results in a predictable weight change. This can only be the case if the average specific density of robust species, for instance the beluga, is lower than that of slender species, such as the false killer whale. Owing to of the recti-linear relationship between body length and body weight173, the fineness ratio is not only an rough indicator of body (trunk) shape, but also an indicator of average specific density. A low average specific density indicates a high proportion of body fat, and thus a relatively thick blubber layer.
Insulating quality of the blubber The insulating quality of the blubber layer depends not only on blubber thickness, but also on the lipid content (Parry, 1949; Worthy, 1990; Worthy and Edwards, 1990). Thermal conductance measurements have been made for only a few odontocetes (Whittow, 1987).
General activity level Activity level co-determines energy expen
diture in cetaceans, as was demonstrated in bottlenose dolphins (Williams et al, 1992 a). Observations of odontocetes in oceanaria and in the wild can produce an impression of the relative general activity level, calculated as swimming speed x proportion of time swimming. The relative activity level of the studied species was based on the experience of the author with the studied captive animals.
Comparison of food intakes between individuals of similar body weight of different species Information on these 4 biological characteristics is incomplete for the 9 odontocete species. To allow a useful comparison of food intake between species with respect to the discussed external and biological factors, pairs of species will be compared, for which there are adults of comparable body weight (Fig. 1). Six such comparisons will be made.
1) Harbour porpoise - Commerson's dolphin The proportional food intake of harbour porpoises is lower than that of Commerson's dolphins of similar weight (Fig. 1). The 2 species have a similar fineness ratio, the Commerson's dolphin being slightly more robust than the harbour porpoise (Table 3). The surface area of fins and flukes relative to total body surface area is similar in both species, suggesting a similar total body surface to volume ratio. The harbour porpoise consists of about 45-50% blubber, depending on age (Parry, 1949; Mohl- Hansen, 1954; Slijper, 1958; Van Utrecht, 1960; Read, 1990; Worthy and Edwards, 1990; Koopman, 1994; Lockyer, 1995; Kastelein et al, 1997 d: chapter 2.16), and has a relatively thick blubber layer, with a consequently low energy demand for thermoregulation. As the fineness ratios of the 2 species are similar, the percentage of blubber content as a percentage of total body mass is probably similar too. While the blubber of the harbour porpoise
564

Food intake of odontocetes
has a high insulating value (Kanwisher and Sundnes, 1965; Worthy and Edwards, 1990), the insulating value of Commerson's dolphin blubber is unknown. The activity level of the Commerson's dolphins was much higher than that of the harbour porpoises (Kastelein et al, 1993 a: chapter 2.12), resulting in a high energy demand. In conclusion, the large difference in activity level between the two species probably was the main cause for the difference in food consumption.
2) Common dolphin - Amazon river dolphin The proportional food intake of common dolphins is much higher than that of Amazon river dolphins of similar weight (Fig. 1).
The Amazon river dolphin is much slenderer than the common dolphin (Table 3), and has a much smaller dorsal fin, although the pectoral fins are larger. The total surface area of the appendages of the 2 species may thus be comparable. Consequently, the total body surface to volume ratio is higher in the Amazon river dolphin than in the common dolphin. The blubber layer of the common dolphin is much thicker than that of the Amazon river dolphin (Bernhard Neurohr, pers. comm.), but no information is available on the insulating properties of the blubber in either species. The common dolphins had a much higher activity level than the Amazon river dolphins. The water temperature in which the Amazon river dolphins were kept was 12°C higher than that of the common dolphins (Table 2). The blubber thickness of the 2 species was probably adapted to the water temperatures they experienced. In conclusion, despite the thicker blubber layer of the common dolphin and the relatively low calorific density of the diet of the Amazon river dolphin, the food intake of the common dolphin was much higher. This was probably due to the much higher activity level of the common dolphin.
3) Amazon river dolphin - bottlenose dolphin The proportional food intake of bottlenose dolphins appears to be higher than that of Amazon river dolphins of similar weight (Fig. 1). The body shape of the Amazon river dolphin is slenderer than that of the bottlenose dolphin (Table 3), although the total surface areas of the appendages may be comparable. The Amazon river dolphin, therefore, has a higher total body surface to volume ratio than the bottlenose dolphin, while the blubber layer is thinner (Bernhard Neurohr, pers. comm.). While the insulating value of bottlenose dolphin blubber has been described (Kanwisher and Sundnes, 1966; Hampton et al, 1971; Williams and Friedl, 1990; Williams et al, 1992 a), that of the Amazon river dolphin blubber is unknown. The bottlenose dolphins had a higher activity level than the Amazon river dolphins, and were maintained in water with a 10°C lower temperature (Table 2). Despite the thinner blubber layer, and the lower calorific density of the diet of the Amazon river dolphin, therefore, the difference in food intake appears to be mainly caused by the lower activity level of the river dolphins, and the much higher water temperature in which they swam.
4) Bottlenose dolphin - false killer whale The proportional food intake of bottlenose dolphins is much lower than that of false killer whales of similar weight (Fig. 1). The false killer whale is much more elongated than the bottlenose dolphin (Table 3), although they have similar sized appendages relative to body size. The false killer whale thus has a much higher total body surface area to volume ratio, and has a thinner blubber layer than the bottlenose dolphin (Kastelein pers. obs.). No information is available on the insulating value of false killer whale blubber. The 2 species had a similar activity level. In conclusion, the higher food intake
565

R.A. Kastelein
of the false killer whale was probably caused mainly by a larger surface area to volume ratio and a thinner blubber layer than those of the bottlenose dolphin.
5) Beluga - false killer whale The proportional food intake of belugas is lower than that of false killer whales of similar weight (Fig. 1). The body of the beluga is much more rotund than that of the false killer whale (Table 3). The beluga has no dorsal fin, although this may be counterbalanced by its large pectoral fins, giving a similar surface area of appendages relative to body size for the 2 species. Total body surface to volume ratio, therefore, is much lower in the beluga than in the false killer whale. The body weight of the beluga has been shown to consist of 43% blubber and flippers, and 16% of muscles, whereas a pilot whale (Globicephala melaena), to which the false killer whale may be compared, of the same body length consisted of 29.1% blubber and flippers, and 34% muscle (Sergeant and Brodie, 1969). The blubber layer of the beluga may, therefore, be assumed to be much thicker than that of the false killer whale. The insulating quality of beluga blubber is high (Kasting et al., 1989; Doidge, 1990), that of the false killer whale is unknown. However, due to the difference in habitat, the beluga inhabiting arctic and subarctic waters, while the false killer whale lives in subtropical waters, the insulating quality would be expected to be lower in false killer whales. The activity level of the belugas was much lower than that of the false killer whales. The higher body surface to volume ratio, the thinner blubber layer, and the higher activity level of the false killer whales, therefore, probably caused the higher food intake as compared to the belugas.
6) Beluga - killer whale The proportional food intake of killer
whales is much higher than that of belugas of similar weight (Fig. 1), although the killer whales were maintained in water 3-8°C higher than that in which the belugas were kept. The beluga is more rotund than the killer whale (Table 3), and has no dorsal fin, while killer whales, especially adult males, possess large dorsal fins. Both species have relatively large pectoral fins. The contribution of the appendages to the total body surface area has been shown to be higher in killer whales than in belugas (Kasting et al., 1989), suggesting that the beluga has a much smaller body surface to volume ratio than the killer whale. The beluga consists of a larger proportion of blubber than the killer whale, and the thermal conductance of its skin and blubber layer is lower than that of the killer whale (Kasting et al, 1989; Doidge, 1990). The belugas had a much lower activity level than the killer whales. Activity levels are related to their foraging methods: belugas eat relatively slow moving prey, while killer whales are active hunters. Moreover, the killer whales continue to grow for at least 20 years of age (Kastelein et al, 1998 b: chapter 2.3), thus requiring extra energy. Although the killer whales were maintained in warmer water than that in which the belugas were kept, the much larger body surface to volume ratio, the thinner blubber layer, the higher activity level, and continued growth of the killer whales probably caused them to consume more than the belugas.
General conclusions about the comparison of average daily food intakes as a percentage of body weight of the 9 odontocete species
The regression line in figure 2 relating the food intakes of the 9 odontocete species to body weight allows a rough prediction of the food intake of unknown species. For a more precise estimate, information is need-
566

Food intake of odontocetes
ed about the environmental conditions, and species specific biological factors, including foraging techniques. However, the information on the biological factors was not complete for the study animals, thus hampering the full understanding of the differences between individuals of species of similar body weight. Quantitative information is needed on activity levels of odontocetes, their body composition, blubber layer thicknesses, and body surface. Especially that of the appendages is important.
II) Comparison of annual food intakes of similarly aged conspecifics
Because the odontocetes of the present study were weighed infrequently, the variation in food consumption within each species is investigated by comparing the annual food intake of individuals of similar ages. The number of animals and years over which food intake data were available varied greatly between species. Therefore a selection of species was made, based on the availability of food intake data for: 1) A relatively large number of animals. 2) A relatively large number of sequen
tial years. 3) Successfully reproducing females,
which suckled their calves.
Based on these 3 criteria, the following 3 species were selected (Table 1):
Commerson's dolphin (Kastelein et al, 1993 b: chapter 2.11) (Fig. 3), Atlantic bottlenose dolphin (Kastelein et al, 1998 f and g: chapters 2.7 and 2.6) (Fig. 4), and Killer whale (Kastelein and Vaughan, 1989: chapter 2.1; Kastelein et al, 1998 b and h: chapters 2.3 and 2.2) (Fig. 5).
In these 3 species it is clear that individuals of the same age can have relatively large
differences in annual food consumption, which may be owing to both external and biological factors.
The external factors, calorific density content of the diet and water temperature, can be largely disregarded (except in a few cases, which will be discussed) as they were similar (15-20°C) in most parks (Table 2). Some variation in food intake between animals will undoubtedly be due to the degree of accuracy of daily record keeping. However, this would be expected to be similar for all animals, and is probably averaged out in annual intake totals. Therefore, the large individual differences are probably not influenced much by external factors. Instead, they are likely to be caused mainly by biological factors related to individuals, such as the weaning process, growth phase, gender, reproductive status, constitutional differences, general activity level, and health.
1) The weaning process Cetaceans depend on milk for the first phase of their life. Calves make the transition from milk to solid food gradually, unless they are orphaned. The age at which the weaning process begins, and the speed of this process may vary between calves, as demonstrated in Commerson's dolphins (Fig. 3; Kastelein et al, 1993 a: chapter 2.12) and Atlantic bottlenose dolphins (Fig. 4; Kastelein et al, 1998 f and g: chapters 2.7 and 2.6). This variation is due to differences in the behavioral and physiological characteristics of mother-calf pairs, and differences in the environmental conditions experienced. No information is available on differences in the weaning process of killer whales, as only one calf was raised (Fig. 5).
In conclusion, the relatively large proportional food intake differences during the first few years of age of odontocetes appear
567

R.A. Kastelein
Commerson's dolphin
c o a. £ 3 </> C o o •a o o
—— Males -»•• Females
Still suckling as well
5 6 7 8 9 10 11 12 Age (year)
Figure 3. The relationship between age and annual food consumption of 11 Commerson's dolphins at Sea World (Table 1). 1) High food intake due to temporary stay in much colder water. * Year in which a calf was suckled. The difference in type of dashed lines used for the females has no biological meaning and only serves to differentiate between females.
10 12 14 16 18 20 22 24 26 28 30 32 34 36 38 Age (year)
Figure 4. The relationship between age and annual food consumption of 19 bottlenose dolphins at Harderwijk Marine Mammal Park, and 10 animals at Windsor Safari Park (Table 1). * Year in which a calf was suckled. The peaks of the males above the upper horizontal line were caused by a different feeding regime during their last year at Windsor. The data points below the lower horizontal line are from growing animals, or from newly arrived animals.
568

Food intake of odontocetes
25000 -I
20000
c o Q. E 3 <A C o u •a o o
n 3 C C <
15000 -
10000
5000-
Killer whale
Still suckling as well
0 4 — i 1 i 1 1 1 1 1 1 1 1 1 1 1 1 i 1 i 1 1
0 1 2 3 4 5 6 7 8 9 10 11 12 13 14 15 16 17 18 19 20
Age (year)
Figure 5. The relationship between age and annual food consumption of 1 female killer whale at Harderwijk Marine Mammal Park, 1 female at Windsor Safari Park/Sea World, and 3 males and 3 females at Marineland Antibes (Table 1). 1) Stillbirth of a full-term calf in March. 2) High food intake due to temporary low water temperature at Sea World. 3) Still birth of a full-term calf in June. 4) Bred successfully for the first time. * Year in which a calf was suckled. The difference in type of dashed lines used for the females has no biological meaning and only serves to differentiate between females.
to be caused by differences in the weaning process. Precocious calves consume relatively large amounts of food during their first years, compared to calves that wean at a later age.
2) Growth phase Commerson's dolphin juveniles consumed similar amounts of food to adults by the age of 1-2 years (Fig. 3), at a body weight about 7 kg less than that of adults. Bottlenose dolphin juveniles reach adult intake levels at 2-3 years of age (Fig. 4), at a weight 100-150 kg less than that of adults. This phenomenon was not observed in killer whales, in which the food intake of animals continued to increase up to at least 20 years of age (Fig. 5), suggesting continued growth. Food intake of the killer whales continued to increase after the first reproduction at 11 years of age in the female, and 15 years of age in the male. Body weights of the 3 odontocete species
were taken infrequently, but more information is available on the harbour porpoise (Kastelein et a\., 1997 a: chapter 2.13), in which annual food intake decreased after physical maturity was attained.
In conclusion, consumption depends not only on the animal's weight, but also on the current growth phase. Not all animals reached adult size at the same age. Growing animals need more food than adults of the same body weight. This phenomenon was not observed in the killer whales, which continued to grow much even after sexual maturity.
3) Gender The sample size of the Commerson's dolphin was very small, but the present study suggests no systematic differences in food intake between the sexes, although differences occurred between individuals and be-
569

R.A. Kastelein
tween years for the same individuals (Fig. 3). This species shows a small or non-existent sexual dimorphism in body weight, males being slightly smaller than females (Lockyer et al, 1988; Kastelein et al, 1993 b: chapter 2.11).
No systematic difference could be detected between the food intake in male and nonpregnant, non-lactating female bottlenose dolphins, although there were differences between individuals and between years for the same individuals (Fig. 4). This species shows only a small sexual dimorphism in body weight, males being slightly larger than females of a similar age (Mead and Potter, 1990).
Although the sample size is small, there appeared to be no systematic difference between food intake of the male and female killer whales of the same age, up to 20 years of age (Fig. 5). This was unexpected, as sexual dimorphism in body weight and shape is substantial in killer whales, adult males (9.5 m) weighing twice as much as females (7 m) (Matkin and Leatherwood, 1986). At the age of 14 years, male killer whales at the Lofoten were generally larger than females, and physical maturity is attained at 20-25 years of age (Christensen, 1984). Dimorphism is present in species in which competition occurs during the breeding season for access to a particular commodity. The small difference in food intake between the males and females at Marineland Antibes was probably due to a marked difference in activity level between the males and females. Females were more active than males, as the calves and juveniles interacted mainly with females. The similar food intake of 2 females at Harderwijk and Windsor and the males at Antibes, might be due to the higher water temperature at Antibes
In conclusion, no systematic differences in the food intake between the 2 sexes was
found in any of the 3 species. However, in the Commerson's dolphin and bottlenose dolphin this is probably due to the similar body weight of adult males and females. In the killer whale, in which a relatively large sexual dimorphism in body weight and shape occurs, the food intake of the females was elevated probably due to higher activity levels than the males.
4) Reproductive status Reproductive odontocete males and females often have reduced food intake for 1-7 days during the mating period, but this was usually compensated for shortly afterwards, as was observed in bottlenose dolphins (Kastelein et al, 1998 f and g: chapters 2.7 and 2.6). In the Commerson's dolphin, annual food intake during lactation increased markedly in one female to above the level of the males and non-reproducing females, and only slightly in the other 2 females (Fig. 3). During the last 6 months of gestation, food intake of Commerson's dolphin females was relatively low, probably owing to an increased blubber layer (Kastelein et al, 1993 b: chapter 2.11). All lactating females consumed much more than usual, for approximately 6 months after parturition (Kastelein et al., 1993 b: chapter 2.11). The decrease in food intake during the last half of gestation, and the increase during lactation counterbalanced each other, giving little change in annual food intake. Commerson's dolphin calves began to eat fish at the age of 4 to 8 months and probably suckled for about 6 to 10 months (Kastelein et al., 1993 a: chapter 2.12).
The annual food intake of bottlenose dolphin females did not increase during gestation, but intake increased markedly during lactation (Fig. 4). The level was far above that of the food intake range of the adult males and non-reproducing females, as in-
570

Food intake of odontocetes
dicated by the horizontal lines in figure 4. The exact levels of annual food intake of the lactating females depend largely on the moment of the year in which the calves were born, and thus the number of months in which they lactated those particular calendar years. Bottlenose dolphin calves began to eat fish between 6 and 19 months of age, and suckled for 14 to 37 months (Kastelein et al, 1998 f and g: chapters 2.7 and 2.6).
The food intake of the killer whale female did not increase during gestation (Fig. 5), but annual food intake during lactation was higher than in previous non-reproductive years. However, whether this increase was due to growth or lactation is not clear, as the annual food intake of adult killer whales continues to increase at least up to 20 years, regardless of reproduction. The calf began to eat fish at 6 months of age and suckled for about 2 years (Kastelein et al, 1998 g: chapter 2.6).
In conclusion, the food intake of the males of the 3 odontocete species decreased only for a few days during the mating period, and the decrease was made up for shortly after it. The food intake of females did not increase during gestation. In the Commerson's dolphin, the annual food intake of the females did not usually show an increase during lactation, as annual food intake is too large a measure to observe the extra energy requirements for lactation. This suggests that in this species, reproduction is a relatively short event, and little energy is invested in reproduction. In contrast, female bottlenose dolphins increase their annual food intake during years of lactation. In the killer whale, lactation was difficult to detect from the food intake of the females, as intake continued to increase annually at least up to the age of 20 years, thus the food increase was maybe due to either growth or lactation.
5) Constitutional differences Individuals of the same species, age, sex and reproductive state, kept under the same environmental conditions and on the same diet, can show differences in annual food intake. In such cases, the differences may be attributed to constitutional differences such as body size or weight and the insulation value of the blubber.
a. Body size In most cases, the body weight of an odontocete is a better indication of food consumption than its age, as individual variation in body size and weight existed between animals of the same age and gender in all species discussed here.
b. Blubber thickness/insulative properties Animals of similar size, age, growth phase, and gender, with similar activity levels, may show substantial differences in food intake in the same environment, due to differences in the insulating value of the blubber. Unfortunately such information is not available for the 3 species discussed in this section. However, this phenomenon was clearly evident in 2 male harbour porpoises, which were almost identical in body length and weight (Kastelein et al., 1997 a: chapter 2.13), but showed a large difference in food intake. These 2 animals had a clear difference in average blubber thickness (Kastelein et al, 1997 d: chapter 2.16); the animal with the thickest blubber layer consumed the least amount of food.
In conclusion, animals of the same age, gender, and reproductive state, under the same environmental conditions and on the same diet, may differ in annual food intakes, owing to constitutional differences in body weight and the insulating value of the blubber layer.
571

R.A. Kastelein
6) Activity level The activity level of an animal may influence its food intake. Unfortunately no quantitative data are available on the activity levels of the animals in the present study, although some well-observed anecdotal information indicates a strong effect of activity level on food intake. A female harbour porpoise which suddenly increased her activity level when she began to catch small live fish in a floating pen, rapidly lost weight, while her daily ration of thawed herring remained the same (Kastelein et al., 1997 a: chapter 2.13).
Trainers are well aware of individual differences in activity level between individuals of the same species. At Windsor Safari Park, one male bottlenose dolphin was much more active than the other animals in the pool. This particular animal consumed much more between his 12th and 18th year than the other animals of similar age and body weight, under the same environmental conditions (Fig. 4; Kastelein et al., 1998 f: chapter 2.7).
In conclusion, although there is no quantitative information for the 3 species discussed in particular, anecdotal information suggests that a positive relationship exists between general activity level and food intake.
7) Health Although the data discussed so far was based on the food intake of healthy animals, illness has been shown to strongly reduce the food intake of killer whales (Kastelein et al., 1998 b: chapter 2.3), Commerson's dolphins (Kastelein et al, 1993 b: chapter 2.11), and Amazon river dolphins (Kastelein et al., 1998 e: chapter 2.8). In most cases, the animals did not compensate for the reduced food intake after they had returned to good health, so the reduction in food intake was visible in the annual totals. Although ani
mals generally lose weight during illness, and thus increase thermo-energetic demands, the total energetic needs during illness may have been reduced due to lethargic behaviour.
Changes in social composition of groups can be shown to influence the food intake of individuals. Food intake fell in a female killer whale, after the introduction and later death of a male companion (Kastelein et ah, 1998 h: chapter 2.2). Intake increased in the female dusky dolphin, after separation from the group of bottlenose dolphins with which she frequently fought (Kastelein et al., 1998 a: chapter 2.10). Intake of a male beluga decreased, when the composition of the group changed, and when he was located next to a killer whale pool (Kastelein et ah, 1994: chapter 2.4).
In conclusion, physical health has a strong effect on food intake, and, although this is difficult to quantify, changes in social situation can also affect food intake. The effect of a change in the social situation may vary substantially between individuals.
General conclusions about the comparison of annual food intakes of similarly aged conspecifics
The differences in annual food intake during the first few years of life in odontocetes appear to be caused by differences in the weaning process. Food consumption depends not only on body weight, but also on the current growth phase. Growing animals require more food than adults of the same body weight. No systematic differences in the food intake between the 2 sexes was found in any of the 3 species discussed, despite a relatively large sexual dimorphism in body weight and shape in the killer whale. In this species the lack of a difference between sex-
572

Food intake of odontocetes
es was probably caused by different activity levels between males and females.
Food intake of males generally decreased only for a few days during the mating period. The food intake of females of the 3 odon-tocete species showed no increase during gestation. In the Commerson's dolphins, annual food intake of the females did not usually appear to increase during lactation, as annual food intake is too crude a measure to reveal extra energy requirements. In the bot-tlenose dolphins, the annual food intake of adult animals reached a plateau, but intake of lactating females rose above this plateau. In the killer whale, however, lactation could not be detected in the food records, as intake of females continues to increase for at least 20 years, although they may begin to reproduce around the age of 10 years.
Animals of the same age, gender, and reproductive state, under the same environmental conditions and on the same diet may have different annual food intakes, resulting from constitutional differences in body weight and insulating value of the blubber layer. Although not quantified in the 3 species discussed in particular, anecdotal information suggests that a positive relationship exists between general activity level and food intake. Health also has a strong effect on food intake, and although difficult to quantify, changes in social situation can affect food intake as well.
Ill) Comparison of monthly food intakes of individual animals
Food consumption may fluctuate during a year, and these fluctuations may be either irregular or systematic.
Irregular fluctuations Irregular fluctuations can be due to illness,
as observed in killer whales (Kastelein et al., 1998 b: chapter 2.3), Commerson's dolphins (Kastelein et al, 1993 b: chapter 2.11), and Amazon river dolphins (Kastelein et ah, 1998 e: chapter 2.8), or to changes in social situation, as observed in killer whales (Kastelein et al, 1998 h: chapter 2.2), a dusky dolphin (Kastelein et al, 1998 a: chapter 2.10), and belugas (Kastelein et al, 1994: chapter 2.4). Non-seasonal changes in the environment may also result in irregular fluctuations, as observed in Atlantic bottlenose dolphins (Kastelein et al, 1998 f: chapter 2.7), a killer whale (Kastelein et al, 1998 h: chapter 2.2), harbour porpoises (Kastelein et al, 1997 a: chapter 2.13), and a dusky dolphin (Kastelein et al, 1998 a: chapter 2.10). These fluctuations will not be discussed further.
Systematic fluctuations Systematic fluctuations can be caused by seasonal external factors such as water temperature or feeding programs, or biological factors, such as rapid growth and reproduction (Table 4). In general, the studied odontocetes showed little, if any, fluctuations in monthly food intake, except in females during years in which they lactated.
A) External factors
Water temperature Seasonal fluctuations in food intake can result from seasonal changes in water temperature (Table 4). This was observed in Commerson's dolphins at those parks where the water temperature fluctuated seasonally (Kastelein et al, 1993 b: chapter 2.11), and in the dusky dolphin (Kastelein et al, 1998 a: chapter 2.10).
The temperature changes experienced by the captive odontocetes in the present study were usually not of the same magnitude as those experienced by wild conspecifics.
573

R.A. Kastelein
Therefore the degree of the food intake flue- which they ate less than average until June, tuations recorded may not reflect that of and more than average thereafter (Kastelein wild odontocetes, although the fluctuations et al., 1998 b: chapter 2.3). This coincided suggest that food consumption can be influ- with additional evening shows after June, enced by changes in water temperature. When food was offered over a longer period
of the day, the animals consumed more than It is difficult to determine the water temper- usual. In most years until 1990, the bottle-ature experienced by cetacean species in the nose dolphins at Harderwijk were offered wild. Sea surface temperatures are not suffi- less food during February than usual, to cient, as cetaceans dive most of the time and gain better control over the animals, and to therefore usually experience colder temper- prepare them for the coming show season, atures at depth than at the surface (Irving, This resulted in a reduction in food intake, 1969). Dive times and dive depth and tern- which may have caused the subsequent fluc-perature information obtained by radio te- tuation in the year, lemetry can provide such information.
B) Biological factors Feeding program The killer whales at Marineland Antibes Growth stage showed a seasonal food intake pattern, in During the first few years after weaning, the
Table 4. Inventory of species in which systematic seasonal fluctuations in food intake occurred, and the proposed cause of the fluctuations.
Species
Harbour porpoise * Commerson's dolphin Dusky dolphin Common dolphin Amazon river dolphin Bottlenose dolphin at Harderwijk Bottlenose dolphin at Windsor False killer whale Beluga Killer whale at Harderwijk Killer whale at Windsor Killer whale at Antibes
Seasonal fluctuations caused by
Water temp.
-X
X
---------
Biological factors
----X
---X
---
Feeding method
-----X**
-----w * * *
Study periods per animal too short, as they were stranded animals which were eventually released. Possibly caused by reduced food availability in February for training purposes. Probably caused by a seasonally increased period of the day over which food is offered (additional evening shows are given after June).
574

Food intake of odontocetes
food consumption of most odontocetes increased gradually: each month consumption was higher than in the previous one. After physical maturity was attained, food consumption was usually more evenly distributed over the year.
Reproduction After sexual maturity, males and females may consume less than usual during the mating season, as they are occupied with mating behaviour rather than feeding. This was observed in the beluga (Kastelein et ah, 1994: chapter 2.4) and the Amazon river dolphin (Kastelein et ah, 1998 e: chapter 2.8). However, in many cases this reduced food intake is compensated for shortly after mating, so the reduction does not show up in the monthly food intake, as was the case in bot-tlenose dolphins (Kastelein et ah, 1998 f and g: chapters 2.7 and 2.6).
Pregnancy in odontocetes does not usually affect food intake. However, after parturition, food intake of the mothers increased dramatically, as the calf has to be suckled. The speed with which the mother's food intake returned to normal depends on the growth of the calf, the age at which the calf began to consume fish, and the age at which it was fully dependent on fish. This differed between individuals within species.
In odontocete species, such as the bottlenose dolphin, mating occurs all year, which may explain the lack of seasonal food intake in this species. Seasonal births are known to occur mainly in those species living in relatively cold water. For those species it is advantageous to give birth when sufficient food is available for the mother, and water temperatures are relatively high, so the energy demands for thermoregulation are lower during the suckling period, when the calf must build up its blubber layer, using fat
obtained from milk. Small odontocetes such as harbour porpoises and Commerson's dolphins are usually born in summer (Kastelein et ah, 1993 a: chapter 2.12). Belugas give birth and suckle the calves initially in shallow, relatively warm estuaries (Sergeant and Bro-dy, 1969; Smith et ah, 1992).
General conclusions about the comparison of monthly food intakes of individual animals
In conclusion, seasonal fluctuations in food intake are not typical for odontocetes. However, they were observed in 5 of the 9 species reported here. In 2 cases, they were caused by a seasonal feeding schedule (bottlenose dolphins and killer whales), and in 2 cases they appeared to be related to seasonal water temperature fluctuations (Commerson's dolphins and the dusky dolphin), which may not reflect temperatures experienced by conspecifics in the wild. In a further 2 cases, the seasonal food intake fluctuations may have been caused by an endogenous rhythm (belugas and Commerson's dolphins). In species living in relatively cold water, calving occurs during periods when the water is relatively warm, and sufficient food is available. The breeding cycle in those species may be controlled by a circa-annual endogenous rhythm.
Acknowledgements
I thank Carolien Staal and Nicole Schoone-man for part of the data analysis, Rob Triess-cheijn for drawing the graphs, Jim McBain (Sea World of California) for providing some of the fineness ratios, and Piet Wiep-kema (Wageningen Agricultural University, The Netherlands), Carolien Staal, Nicole Schooneman, Janny Hardeman, Nancy Vaughan (University of Bristol, U.K.), Eleanor Hayes (University or Bristol, U.K.), and
575

R.A. Kastelein
Ed Keith (NOVA Southeastern University, U.S.A.) for their comments on the manuscript.
References
Christensen, I. (1984) Growth and Reproduction of Killer Whales, Orcinus orca, in Norwegian Coastal Waters. Rep. Int. Whal. Commn., Special Issue 6, 253-258.
Doidge, D.W. (1990) Integumentary heat loss and blubber distribution in the beluga (Delphinapterus leucas), with comparisons to the narwhal (Monodon monoceros). In: Advances in research on the beluga whale (Delphinapterus leucas). (Eds. Smith, T.G., St. Au-bin, D.J. and Geraci, J.R.). Can. Bull. Fish. Aquat. Sci. 224, 129-140.
Hampton, I.F.G., Whittow, G.C., Szekerczes, J. and Rutherford, S. (1971) Heat transfer and body temperature in the Atlantic Bottlenose dolphin (Jursiops truncatus). Int. J. Biomete-or 15(2-4), 247-253.
Hinga, K.R. (1979) The food requirements of whales in the southern hemisphere. Deep-Sea Research, 26A, 569-577.
Hutchinson, J.D. (1996) Fisheries Interactions: The Harbour Porpoise - a Review. In: The conservation of Whales and Dolphins (Eds. Simmons, M.P. and Hutchinson, J.D.). John Wiley & Sons Ltd, 127-165.
Innes, S., Lavigne, D.M., Earle, W.M. and Kovacs, K.M. (1987) Feeding rates of seals and whales. Journal of Animal Ecology 56, 115-130.
Irving, L. (1969) Temperature regulation in marine mammals. In: Marine Mammals, Vol. I. (Ed. Andersen, H.T.). Academic Press, New York, 147-174.
Kanwisher J. and Sundnes, G. (1965) Physiology of a small cetacean. Hvalradets Skrift. 48, 45-53.
Kanwisher J. and Sundnes, G. (1966) Thermal regulation in cetaceans. In: Whales, dolphins and porpoises (Ed. Norris, K.S.). University of California Press, Berkeley, 397-409.
Kastelein, R.A. and Vaughan, N. (1989: chapter 2.1) Food consumption, body measurements and weight changes of a female Killer whale (Orcinus orca). Aquatic Mammals 15(1), 18-21.
Kastelein, R.A., Bakker, M.J. and Dokter, T. (1990: chapter 2.17) The medical treatment of 3 stranded Harbor porpoises (Phocoena pho-coena). Aquatic Mammals 15(4), 181-202.
Kastelein, R.A., McBain, J., Neurohr, B. (1993 a: chapter 2.12) Information on the biology of Commerson's dolphins (Cephalorhynchus commersonii). Aquatic Mammals 19(1), 13-19.
Kastelein, R.A., McBain, J., Neurohr, B., Mohri, M., Saijo, S., Wakabayashi, I. and Wiepkema, P.R. (1993 b: chapter 2.11) The food consumption of Commerson's dolphins (Cephalorhynchus commersonii). Aquatic Mammals 19(2), 99-121.
Kastelein, R.A., Ford, J, Berghout, E., Wiepkema, P.R. and Boxsel, M. van (1994: chapter 2.4) Food consumption, growth and reproduction of Belugas (Delphinapterus leucas) in human care. Aquatic Mammals 20(2), 81-97.
Kastelein, R.A., Hardeman, J. and Boer, H. (1997 a: chapter 2.13) Food consumption and body weight of harbour porpoises (Phocoena phocoena). In: The biology of the harbour porpoise (Eds. Read, A.J., Wiepkema, P.R. and Nachtigall, P.E.). De Spil Publishers, Woer-den, The Netherlands, 217-233.
576

Food intake of odontocetes
Kastelein, R.A., Nieuwstraten, S.H. and Ver-stegen, M.W.A. (1997 b: chapter 2.15) Passage time of carmine red dye through the digestive tract of harbour porpoises (Phocoena phocoena). In: The biology of the harbour porpoise (Eds. Read, A.J., Wiepkema, P.R. and Nachtigall, P.E.). De Spil Publishers, Woerden, The Netherlands, 265-275.
Kastelein, R.A., Schooneman, N.M., Staal, C. and Boer, H. (1997 c: chapter 2.14) A method for tube-feeding juvenile harbour porpoises (Phocoena phocoena). In: The biology of the harbour porpoise (Eds. Read, A.J., Wiepkema, P.R. and Nachtigall, P.E.). De Spil Publishers, Woerden, The Netherlands, 63-83.
Kastelein, R.A., Sijs, S.J. van der, Staal, C. and Nieuwstraten, S.H. (1997 d: chapter 2.16) Blubber thickness in harbour porpoises (Phocoena phocoena). In: The biology of the harbour porpoise (Eds. Read, A.J., Wiepkema, P.R. and Nachtigall, P.E.). De Spil Publishers, Woerden, The Netherlands, 179-199.
Kastelein, R.A., Elst, C.A. van der, Tennant, H.K. and Wiepkema, P.R. (1998 a, chapter 2.10) Food consumption, growth, body dimensions and body temperatures of a female dusky dolphin (Lagenorhynchus obscu-rus).
Kastelein, R.A., Kershaw, J., Berghout, E. and Wiepkema, P.R. (1998 b: chapter 2.3) Food consumption and suckling of killer whales (Orcinus orca).
Kastelein, R.A., Macdonald, G.J. and Wiepkema, P.R. (1998 c: chapter 2.9) Food consumption and growth of common dolphins (Delphinus delphis).
Kastelein, R.A., Mosterd, J., Schooneman, N.M. and Wiepkema, P.R. (1998 d: chapter 2.5) Food consumption, growth, body dimensions and respiration rate of false killer whales (Pseudorca crassidens).
Kastelein, R.A., Neurohr, B., Nieuwstraten, S.H. and Wiepkema, P.R. (1998 e: chapter 2.8) Food consumption and body measurements of Amazon river dolphins (Inia geof-frensis).
Kastelein, R.A., Nieuwstraten, S.H., Walton, S. and Wiepkema, P.R. (1998 f: chapter 2.7) Food consumption, growth of Atlantic bot-tlenose dolphins (Tursiops truncatus).
Kastelein, R.A., Staal, C. and Wiepkema, P.R. (1998 g: chapter 2.6) Food consumption and growth of Atlantic bottlenose dolphins (Tursiops truncatus).
Kastelein, R.A., Walton, S., Odell, D., Nieuwstraten, S.H. and Wiepkema, P.R. (1998 h: chapter 2.2) Food consumption of a female killer whale (Orcinus orca).
Kasting, N.W., Adderley, S.A., Safford, T. and Hewlett, K.G. (1989) Thermoregulation in Beluga (Delphinapterus leucas) and Killer (Orcinus orca) whales. Physiological biol. 62 (3), 687-701.
Kleiber, M. (1975) The fire of life: An introduction to animal energetics. R.E. Kreiger Publishing Co. Ltd., Huntington, New York.
Kleiner, M. (1947) Body size and metabolic rate. Physiological Reviews 27(4), 511-541.
577

R.A. Kastelein
Koopman, H.N. (1994) Topographical distribution and fatty acid composition of blubber in the harbour porpoise, Phocoena phocoena. Univ. of Guelph, Thesis presented to the Faculty of Graduate Studies.
Lavigne, D.M., Innes, S., Worthy, G.A.J., Ko-vacs, K.M., Schmitz, O.J. and Hickie, J.P. (1986) Metabolic rates of seals and whales. Can. J. Zool. 64, 279-284.
Lockyer, C. (1994) Seasonal Changes in Body Fat Condition of Northeast Atlantic Pilot Whales, and their Biological Significance. Rep. Int. Whal. Commn., Special Issue 14, 325-350.
Lockyer, C. (1995) Aspects of the morphology, body fat condition and biology of the Harbour porpoise, Phocoena phocoena, in British waters. In: The biology of the Phocoe-nids (Eds. Bj0rge, A. and Donovan, G.P.). Rep. Int. Whal. Commn. 16, 199-209.
Lockyer, C , Goodall, R.N.P. and Galeazzi, A.R. (1988) Age and Body-length characteristics of Cephalorhynchus commersonii from incidentally-caught specimens off Tierra del Fuego (SC/36/SM4). In: Biology of the Genus Cephalorhynchus (Eds. Brownell, R.L. Jr. and Donovan, G.P.) Rep. of the I.W.C. Special Issue 9, 103-118.
Martensson, P.E., Lager, A.R., Nordoy, E.S. and Blix, A.S. (1996) Seasonal changes in energy density of prey of Northeast Atlantic seals and whales. Mar. Mamm. Sci. 12(4), 635-640.
Matkin, CO. and Leatherwood, S. (1986) General biology of the killer whale, Orcinus orca: a synopsis of knowledge. In: Behavioral Biology of Killer whales (Eds. Kirkevold, B.C. and Lockard, J.C.). Alan R. Liss, Inc., New York, 35-68.
Mead, J.G. and Potter, C.W. (1990) Natural history of Bottlenose dolphins along the central Atlantic coast of the United States. In: The Bottlenose dolphin (Eds. Leatherwood, S. and Reeves, R.R.). Academic Press, Inc. New York. 165-195.
M0hl-Hansen, U. (1954) Investigations on reproduction and growth of the porpoise (Phocoena phocoena (L)) from the Baltic. Vi-densk. Medd. fra. Dansk naturh. Foren. Bd. 166, 369-396.
Parry, D.A. (1949) The structure of whale blubber, and a discussion of its thermal properties. J. Microsc. Sci. 90, 13-25.
Perez, M. (1994) Calorimetry Measurements of Energy Value of Some Alaskan Fishes and Squids. NOAA Techn. Mem. NMFS-AFSC-32. U.S. Dept. of Commerce, pp. 32.
Potsdammer, R., Anstadt, I. and Mertens, E. (1988) Het grote visboek. Van Reemst, Hou-ten, The Netherlands, 240 pp.
Read, A.J. (1990) Estimation of body condition in harbour porpoises, Phocoena phocoena. Can. J. Zool. 68, 1962-1966.
Ronald, K., Keiver, K.M., Beamish, F.W.H. and Frank, R. (1984) Energy requirements for maintenance and faecal and urinary losses of the grey seal (Halichoerus grypus). Can. J. Zool. 62, 1101-1105.
Ryg, M., Lydersen, C , Knutsen, L.0., Bj0rge, A., Smith, T.G. and 0ritsland, N.A. (1993) Scaling of insulation in seals and whales. J. Zool. Lond. 230, 193-206.
Sergeant, D.E. (1969) Feeding rates of Ceta-cea. Fisk. Dir. Skr. Ser. Hav. Unders., 15, 246-258.
578

Food intake of odontocetes
Sergeant, D.E. and Brodie, P.F. (1969) Tagging White Whales in the Canadian Arctic. J. Fish. Res. Bd. of Canada, 25, 2201-2205.
Slijper, E.J. (1958) Organ weights and symmetry problems in porpoises and seals. Archs. neerl. Zool. 13, 97-113.
Smith, T.G., St. Aubin, D.J. and Hammill, M.O. (1992) Rubbing behaviour of beluga, Delphinapterus leucas, in a high Arctic estuary. Can. J. Zool. 70, 2405-2409.
Utrecht, W.L. van (1960) Einige Notizen iib-er Gewicht und Lange von Schweinswalen (Phocoena phocoena) aus der Nord- und Ost-see. Saugetierk. Mitt. 8, 142- 144.
Whittow, G.C. (1987) Thermoregulatory adaptations in marine mammals: interacting effects of exercise and body mass. A review. Mar. Mam. Sci. 3(3), 220-241.
Williams, T. (1987) Approaches for the study of exercise physiology and hydrodynamics in marine mammals. In: Approaches to Marine mammal energetics (Eds. Huntley, A.C., Costa, D.P., Worthy, G.A.J, and Castel-lini, M.A.). Society for Marine Mammalogy. Spec. Publ. no. 1. Allen Press, 127-145.
Williams, T.M. and Friedl, W.A. (1990) Heat flow properties of dolphin blubber: insulating warm bodies in cold water. Amer. Zool. 30(4), 191.
Williams, T.M., Friedl, W.A., Fong, M.L., Ya-mada, R.M., Sedivy, P. and Haun, J.E. (1992 a) Travel at low energetic cost by swimming and wave-riding bottlenose dolphins. Nature 355, 821-823.
Williams, T.M., Haun, J.E., Friedl, W.A., Hall, R.W. and Bivens, L.W. (1992 b) Assessing the thermal limits of bottlenose dolphins: a cooperative study by trainers, scientists, and animals. IMATA Soundings Fall 1992, 16-17.
Worthy, G.A.J. (1990) Nutritional energetics of marine mammals. In: Handbook of Marine Mammal Medicine: Health, Disease and Rehabilitation (Ed. Dierauf, L.A.). CRC Press, Boston, 489-520.
Worthy, G.A.J, and Edwards, E.F. (1990) Morphometric and biochemical factors affecting heat loss in a small temperate cetacean (Phocoena phocoena) and a small tropical cetacean (Stenella attenuata). Phys. Zoology 63(2), 432-442.
579

Chapter 7
Pinniped overview
581

Chapter 7.1
Parameters determining the food intake of pinnipeds: a general discussion
R.A. Kastelein
Harderwijk Marine Mammal Park, Strandboulevard Oost 1,3841 AB Harderwijk, The Netherlands
Introduction
Although the food consumption of captive pinnipeds has been previously studied, most of the published data are difficult to evaluate as the necessary accompanying information, such as diet, water temperature, body weight, blubber thickness, age, sex, and reproductive state is often incomplete. In a number of cases, the periods over which the averages were taken were either short, not reported, or not representative of the annual average, or the study animals were of only one age, sex or reproductive status (Keyes, 1968; Geraci, 1972; Sergeant, 1973; Miller, 1978; Spotte and Adams, 1979 and 1981; Ashwell-Erickson and Eisner, 1981; Ronald et ah, 1984; Lavigne et al., 1985; Innes et al, 1987; Nordoy and Blix, 1988; Renouf and Noseworthy, 1990; Renouf et al, 1988 and 1993; Lager et al, 1994).
More extensive data, however, is available on the food consumption of 8 pinniped species at the Harderwijk Marine Mammal Park, The Netherlands and Marineland An-tibes, France, with more complete background information. The species involved are:
- Phocids (true seals): the Southern elephant seal, Mirounga leonina (Kastelein et al, 1991 a: chapter 3.1), the grey seal, Hal-ichoerus grypus (Kastelein et al, 1990 c: chapter 3.2 and additional data from later years), the harbour seal, Phoca vitulina (Kastelein et al, 1998 f: chapter 3.3);
- Otariids (eared seals): the Steller sea lion, Eumetopias jubatus (Kastelein et al, 1990 a: chapter 4.1 and additional data from later
years), the South American sea lion, Otaria flavescens or byronia (Kastelein et al, 1995 b: chapter 4.2), the California sea lion, Za-lophus californianus (Kastelein et al, 1998 b: chapter 4.3), the South African fur seal (or cape fur seal), Arctocephalus pusillus (Kastelein et al, 1990 b: chapter 4.4), and
- Odobenids (walruses): the Pacific walrus, Odobenus rosmarus divergens (Kastelein et al, 1998 a and c: chapters 5.2 and 5.1).
The food intake and body weight data on which these studies were based were collected for husbandry, rather than research purposes. Consequently, information on the calorific values of the diets is lacking, although this can be estimated from the recorded composition of the diets. Quantitative data on the general activity level and haul-out behaviour (proportion of time spent on land) is also not available. The basic measure in each of these studies was the daily food intake of individual animals (kg wet weight per day), although food intake data were usually presented as totals per month and per year.
The present study compares food intake of the 8 pinniped species at 3 levels, as the previous chapter for 9 odontocetes: I) Species specific differences in food in
take by comparison of the average daily food intake as a percentage of body weight.
II) Differences in annual food intake between conspecific individuals by comparison of these intakes with respect to age.
III) Possibility of seasonal fluctuations, by comparison of the monthly food intake of individual animals.
583

R.A. Kastelein
I) Comparison of the average daily food intake as a percentage of body weight of 8 pinniped species
Average daily food intake as a percentage of body weight is a crude indicator of average daily metabolic rate, including standard metabolic rate and the costs of thermoregulation, activity and reproduction. The average was taken over a calendar year to control for any seasonal fluctuations in food intake. The average daily food consumption of 8 pinniped species is shown in figure 1. Only the food intakes of sub-adults, adult males and adult non-reproductive females were used here; animals undergoing growth spurts (individuals up to 2 years of age and males around puberty) were not included,
as these animals require additional energy (Innes et al., 1987; Worthy, 1990). The data sets are small, as the animals were weighed infrequently due to practical difficulties; weights were recorded at various times of the year, and not in any particular season. The body weight of pinnipeds usually fluctuates seasonally (Schusterman and Gentry, 1971). Although the number of animals per species from which data is available is low (Table 1), and the food intake of conspecific animals of similar body weight differs, there is the general trend across species of decreasing proportional food intake with increasing body weight. The same relationship has been reported for other mammals (Kleiner, 1947; Kleiber, 1975), and a comparable trend was seen within 7 of the 8 species
14
(0
ra
• 2 | > Q. <D
E *
•2 8, >>i3 Tl IS <D 0) ra Q-2 « 3
12-
10
2 -
10
* Southern elephant seal a Grey seal * Harbour seal * Steller sea lion o South American sea lion • California sea lion + South African fur seal * Pacific walrus
r n —
100
i i i i 11
1000 10000 Body weight (kg)
Figure 1. The relationship between body weight and average daily food consumption as a percentage of body weight in 8 pinniped species (only sub-adults and non-reproducing adult animals are included). The trend line serves as a tool to compare the species. The number of animals on which this figure is based and the locations at which they were housed are shown in Table 1. The Y-axis is extended to 14% for easy comparison with the food intake of the odontocetes in figure 1 of the previous chapter.
584

Food intake of pinnipeds
(for the South African fur seal only one data point was available). This may be explained by the smaller surface area to volume ratio of larger objects. This would be expected to be of particular importance in pinnipeds, as they spend a considerable part of their lives in water with a temperature lower than their core body temperature. As the thermal conductance of water is 25 times higher than air, a large surface area to volume ratio would result in high levels of conductive heat loss.
The least squares exponential line fit based on data for all 8 species (Fig. 1) separates the species roughly into 3 groups: 1) Species for which the proportional
food intake generally lies above the line: the Steller sea lion and the California sea lion,
2) Species for which the proportional food intake generally lies on or around the line: the Pacific walrus and the South American sea lion, and
3) Species for which the proportional food intake generally lies below the line: the Southern elephant seal, the grey seal, the harbour seal, and the South African fur seal.
The deviations in food intake of 6 of the 8 species from the trend line may be due to external factors such as water temperature, calorific density of the food, and /o r species specific biological characteristics such as body shape, body composition, insulating quality of the blubber, general activity level, or haul-out behaviour.
A) External factors
The 8 pinniped species were housed at 2 geographically distinct facilities. The grey seals, harbour seals, Steller sea lions, California sea lions, South African fur seals and Pacific walruses were kept at the Harder-wijk Marine Mammal Park, The Netherlands. The annual average air temperature at Harderwijk was 9°C for all species. The annual average water temperature in the seal pools was 8°C and that of the sea lion and walrus pools 14°C (Table 2). Lower water temperatures in the seal pools may have resulted in higher thermal energetic demands than for the sea lions and walruses, but this depends on the thermoneutral zone (the temperature range in which the energy needed for thermoregulation is lowest) of
Table 1. The number of animals on which figure 1 is based. All species were housed at the Harderwijk Marine Mammal Park, except the Southern elephant seals and South American sea lions which were kept at Marineland Antibes. The numbers may be smaller than the ones shown in figures 2-9, as some animals were not weighed.
Species
Phocids - Southern elephant seal - Grey seal - Harbour seal Otariids - Steller sea lion - South American sea lion - California sea lion - South African fur seal Odobenids - Pacific walrus
No. of animals
2 3 8
6 2
10 1
8
585

R.A. Kastelein
<u
T3
J5
.s
bO c
0) a S
2 c o
T3 11!
•a e
Wl S 6
« p
> 0) < 3
JS SP n >
0
b a) o>
E © 0 O) ** c
.!= CO < tr
p 0
3 2 3 5 0 ^
^ CO
CO
u 0 o .
CO
O)
i n
c
^5 p^
in
1 3 o CO E
£ £ CD a>
j * : . * o o CO CO
E E ;£;£ 5? o in in m • * ^~
O) CD O) . £ . £ T3 c - o
*— ^ * c '^ i- i- 3 i- 3 CD CD a - © o -.C £ CO .C CO ^p ^p vP xP vP o^ u* o^ u* <J* o o o o o i n t i - T t - i -
i n O)
h - CO
CO © CO ** c CO
a. a) CD
E ( 0 CD
2 £ SS £ CO
CO CD CO
£ (5
O)
n V O) CO CO
d d
2 Q . CO
O
£ CD
p § • c CO
p ^ p ^ CM • * CM T-
ri> co CZ £
2 a. CO
CD
o • * • * - r -
£ J? E s? o in
6 •<t
CD Q.
o P~-
in o 6 ^ • t o
Q. CO
vP ^P
in -i-i - CM
£
E
o
CD
I O CO
E
S5 CO
CO CO c c -a E 5 t ' 5 o 3 o cr .c ex .c co - „ CO
oo P^ o~ o^ CM O i n CM CM
O) i n O) O)
( ^ CO Is- N
v «y V V CO O) CO CO
d d o
CO
CO 0 CO I— 3 o CO
I
c .2 CO 0 co
. 2 »-•O CD
c o
co 0 co c CO o 0 E <
c
CO 0 CO
£5 c
CO 0 CO
c CO o
fO
n. CO
O)
0 CD ^ P CO
E CO CM
„
O) c ^
TJ 3 CT (0
00 CM
„
u> c
^ : vp i n ^ co CM
O)
co d
~I—
in co CM ••-co •*
CO
t
o CM CO
in CM CO
o CM o
o CM o
a>
O)
2 ® £ £ £
CO 3 o
CO CO
o 3 o
CO
co 2
( 0 CO
2 5 c o O CD
586

Food intake of pinnipeds
the species. Very little is known about the thermoneutral zones of pinnipeds (Whit-tow, 1987). Within species this zone varies with body weight and the thermal conductance of the blubber layer (its thickness and lipid content). However, both air and water temperatures the study animals experienced were similar to those experienced by wild conspecifics, suggesting that the animals were probably within their thermoneutral zones. Only the captive Pacific walrus experienced much higher temperatures than those experienced by wild conspecifics. High summer temperatures may have increased the energy intake of the animals to dump excess heat, or caused them to reduce activity, to reduce heat production.
The Southern elephant seals and the South American sea lions were kept at Marineland Antibes, South of France. As the annual average air (15°C) and water (17CC) temperatures were similar for both species (Table 2), any differences in food intake between the species were not caused by temperature. As the animals at Antibes were maintained at higher temperatures than those at Harder-wijk, less energy might have been expected to be used for thermoregulation. However, if the animals were adapted to the temperatures, they may have been within their thermoneutral zones. Only the captive Southern elephant seals experienced much higher (approximately 10°C) temperatures than those experienced by wild conspecifics. High summer temperatures may have increased the energy intake of the animals to dump excess heat, or caused them to reduce activity to reduce heat production.
With respect to the energetic content of the food, high food intakes would be expected to be associated with diets of low energy density, and vice versa. Although the calorific density of fish species may vary seasonally
(Martensson et ah, 1994) and geographically, the average calorific densities of herring (Clupea harengus), mackerel (Scomber scom-brus), and sprat (Sprattus sprattus) are fairly similar when taken over long periods of time (Ronald et al, 1984; Perez, 1994; Hutchinson, 1996). The calorific densities of whiting (Merlangius merlangus) and squid (Illex spp.) are usually less than half those of herring, mackerel, and sprat (Potsdammer, 1988). The diets of 6 of the 8 pinniped species consisted for at least 80% of herring, mackerel, and sprat (Table 2), and are thus assumed to have had fairly similar energy densities. The diets of the Steller sea lions and Pacific walruses consisted of about 70% herring, sprat or mackerel. The slightly lower energy content of their diet may have increased food intake slightly, relative to the other 6 pinniped species. However, the dietary differences are so small that they will not be considered further.
B) Biological factors
External factors such as air and water temperatures and energy density of the diet are not the only possible causes of differences in food intake between individuals of similar body weight. Species specific characteristics such as body shape, body composition (especially blubber thickness), insulating quality of the blubber (or lipid content), general activity level and haul-out behaviour may also have contributed to the observed differences.
The role of these 5 biological parameters in food intake of pinnipeds will be discussed, although information on these parameters was incomplete.
Body shape Body shape in the 8 pinniped species differs, not only between species, but also between
587

R.A. Kastelein
sexes. The optimum shape for reducing energy loss per unit volume by thermal conduction to the environment is a ball, as the surface area to volume ratio is minimized. Very little quantitative information on the body surface area of pinnipeds is available. Unfortunately, few girth measurements were taken, so the fineness ratio, used in the previous chapter, could not be calculated for the pinnipeds. However, body length/body weight (L/W) ratio was used for adults of the 8 species as an alternative assessment of trunk surface area to body volume ratio (Table 3). The lower the body length/body weight ratio, the lower the body trunk surface/volume ratio and the more rotund the body. This L /W ratio runs parallel with the fineness/body weight ratio used for the odontocetes. Smaller animals tend to have a higher food intake expressed as a percentage of body weight (Fig. 1; Table 4), with small females having a higher proportional food intake than large males within species. The L /W ratio of adult males is always lower than that of conspecific adult females (Table 3), supporting the value of this ratio as an
indication of thermo-regulatory demands, as related to body shape.
Ten to 30% of heat production of a resting marine mammal is lost through the flippers, fins, and flukes, and this may increase to 70-80% during moderate exercise (Ryg et ah, 1993). Therefore, the relative surface area of the appendages to the total body surface area is of considerable importance in the understanding of food intake differences between species. Although data on the surface area of the appendages is incomplete for the 8 species, there is a negative relationship between body mass and surface area of the appendages as a percentage of total surface area. In general, phocids have a relatively small total appendage surface area compared to those of the sea lions and walruses of similar body weight for which the surface area of the appendages may be up to 25% of total body surface area (Ryg et ah, 1993).
Body composition Body composition of pinnipeds differs between species, with the proportion of blub-
Table 3. Average body length/average body weight ratio (L/W) of adult animals of the 8 pinniped species. The lower the ratio, the more rotund the animal, and the higher the ratio, the slenderer the animal. This is a crude method, as body weights change seasonally. The species are ranked according to the ratio of the males. Data are from the literature mentioned in the previous chapters on the specific species.
Male L/W (cm/kg) ratio
Female L/W (cm/kg) ratio
T Slender Harbour seal South African fur seal Grey seal California sea lion South American sea lion Steller sea lion Southern elephant seal Pacific walrus i Rotund
157/ 110 = 1.43 230/ 180 = 1.23 210/ 225 = 0.93 230/ 350 = 0.66 230/ 350 = 0.66 300/ 800 = 0.38 500/1600 = 0.31 310/1400 = 0.22
147/ 90 = 1.63 178/ 72 = 2.47 184/150 = 1.23 180/ 90 = 2.00 144/180 = 0.80 235/250 = 0.94 297/600 = 0.50 260/800 = 0.32
588

Food intake of pinnipeds
T3 60 0 C •B 3
« £ 6 0 ns
2 >
s s &£ 3 ° ^ £ . u "
£ & .SP >>
50 en
> & * 2 ° -8 S oo 4- O spjy '3 "3 £ s
o>
•a is S 3 XI -o
•3 » s-g -a 3 iJ o
•a ^ ;* 0)
SP § g « .M 60 J= C SP'u 01 3 ^
8 ^ o> G
3 £ cs 3 o> T3 60 <S (0 •*< ^ 0 *o 01 Z. C > 5 o <-S 8
. & , O>
3 g * <* s c H 8 o
c o Q.
E 3 CO c
o o T3 o o LL
"D £ 0 o E 't> 3 3 CO T5 C O
8 fe. ^ p £ "-O CD
E g SS-B
Sn> t co
Rep
fe
rn
"D
2 & ® ± CO
Nor
fe
rn
a) CO
.C •c • — 4—• X I ^
a^ -PR 3 0 CD
CD CO 1 E « 5 .2J? ^ ^ ^) ^3 • = _v;
co E
CO CD
' o CD D. CO
* • *
o o o • < *
o o i n CO
O O O CO
o t
r-. c\i II
o o CO o o co
"CO CD CO
_, c CO
a. 0 0 c CI)
3
o
co • i —
o t n h~. T"
o o i n
"
o m CM CM
CO
LO
II o i n T -
IS CM CM
"CO 0 CO
CD SL
O CO
O O CO ,~
o o o T—
o m CM
CO T—
CM
II O CJ>
c5 • ^
T—
To CD CO
3
o •e CO
o lO
o o i n • < *
o o o CO
o o i n CO
o CM
CM CO
II
o i n CM c5 o CO
o CO CD CO I . o
o
o o o CM
o o o CM
o o i n CO
CO
a>
II
o CO
c5 i n CO
c o
co CD CO c CO o
' l _
0
E < 3 o
o m
o i n CM CM
o o i n
"
o o o • *
00
O) CO
II
o O)
c5 i n CO
c
CO 0 CO co
o "CO
* *• I"-
1 CO
i o • o
o o
o o o o T - o 1 - co
o o i n o N- O CM T-
1—
r>- o co
in co CM T-^
II II
CM O h - O
go O O CO O i - < *
"CO 0 CO
3 H—
c CO CO P o - ^
uth
Afr
i ci
fic w
a
o co C0C5IC0C0OC0Q.
CD"D
r j *
o ~i (0
u r TJ CI) CO m 0
o o ^ ni 5 CO 0 CI CI) a. co CO
_c
o CO Q . - 1
o ' k _
CI) n >. • n - i
U) 0 C" '*"' CD c
- I T3
0 C) 1
•a
a C l
2 • ! _ >
o c
• o • n CO 0 o 0 CL CO
Q. co
589

R.A. Kastelein
ber relating to the relative thickness of the blubber layer, thus influencing the degree of thermal insulation. All animals in the present study were in good physical condition and it was assumed that their blubber layer was adapted to the air and water temperatures in which they were kept. In all cases, with the exception of the Southern elephant seal and the Pacific walrus, the animals were kept at water temperatures encountered by wild conspecifics within their sometimes wide distribution area (Irving, 1969). Consequently, average annual blubber thickness was considered to be species specific, although the thickness may vary seasonally and between conspecific individuals. The blubber layer tends to be of maximum thickness just before the breeding season, and at its minimum just after the breeding season, or the subsequent moulting period (Lager et al, 1994; Baker et al., 1994). On average pho-cids have a larger proportion of body fat than otariids and odobenids of similar body weight (Costa, 1991; Lager et al, 1994; Knut-sen and Born, 1994).
As pinnipeds have similar metabolic rates to terrestrial mammals of similar body weight (Lavigne et al, 1986; Innes et al, 1987), heat loss to the environment would be expected to be of a similar magnitude to that of terrestrial mammals. This suggests that the insulation of each species is adapted to the air and water temperatures encountered.
Insulating quality of the blubber The insulating quality of the blubber layer depends not only on blubber thickness, but also on the lipid content (Whittow, 1987). This information is incomplete for the species discussed here.
General activity level Energy expenditure in pinnipeds is affected by activity levels (Davis, et al., 1985; Ponga-
nis et al, 1990; Williams et al, 1991). All study animals had access to a pool, and swam a large part of the day. An impression of the relative general activity level (swimming speed x proportion of time swimming/locomotion on land) can be obtained from observations in oceanaria, and the relative activity levels in the present study were based on the experience of the author with the study animals.
Haul-out behaviour Pinnipeds, unlike odontocetes, have an amphibious life style. In captivity, they need not enter the water to feed, like wild con-specifics. The study animals had free access to both land and water, spending part of each day ashore. Periods during which the animals haul out for a large proportion of time are the breeding and moulting seasons, although they also hauled out at other times of year, usually for shorter periods. The amount of time hauled out may vary between individuals depending on sex, age, reproductive status, health, participation in shows, composition of the group, and type and amount of substrate available, which, in the wild, may depend on the tide (Kastelein and Weltz, 1990 and 1991). Haul-out time may also vary between years (depending on the age and composition of the group, the availability of prey, and meteorological conditions (Salter, 1979)). At Harderwijk, the pinnipeds usually spent long periods in the water on rainy days. During the year, most species haul out to rest, except during the breeding season, when territorial males are very active. Steller sea lions were fairly active on land all year.
Comparison of food intake between similarly sized individuals of different species To allow a useful comparison of differences in food intake between species, as related to the previously discussed external and bi-
590

Food intake of pinnipeds
ological factors, pairs of species will be compared for which there are adults of comparable body weight (Fig. 1). Comparisons sometimes include those between animals of different gender. Five such comparisons will be made.
1) Harbour seal - California sea lion The 2 species experienced the same air temperatures, although the harbour seals were kept in water 6°C lower than the pool temperature of the California sea lions. California sea lion males are more rotund than the harbour seals, while the females are slenderer than those of the harbour seal (Table 3). Owing, however, to the larger surface area of the flippers relative to total body surface in the sea lions, the total body surface area (trunk and appendages) to volume ratio is probably higher in the California sea lion than in a harbour seal of similar body weight. The blubber content of both male and female harbour seals is higher than that of California sea lion females (Costa, 1991), although comparison with the relative blubber content of the adult male California sea lions is difficult, as it varies seasonally (Schusterman and Gentry, 1971). The thermal conductance of the blubber and skin appears to be similar in the 2 species (Whit-tow, 1987), although this may vary during the year.
The California sea lions were more active than the harbour seals. No information is available on the haul-out pattern of the 2 species, but, when hauled out, harbour seals were usually inactive, while California sea lions are frequently active on land.
In conclusion, despite the lower water temperature, harbour seals ate less than California sea lions of similar body weight. This probably resulted from a combination of the higher total body surface to volume ratio, the generally thinner blubber layer, and the
generally higher activity level of the California sea lions.
2) Grey seal - Steller sea lion The 2 species experienced the same air temperatures, but the grey seals were kept in water on average 6°C lower than the pool temperature of the Steller sea lions. The L /W ratio for the trunk is higher in the grey seal (Table 3), but the surface area of the flippers, relative to total body surface, is lower in the grey seal than the Steller sea lion. The total body surface area to volume ratio, therefore, may be similar in individuals of the 2 species of similar weight. The blubber content of grey seal females is higher than that of Steller sea lion females (Costa, 1991), but the relative blubber content of adult males of both species varied seasonally. No information is available on the thermal conductance of the blubber and skin of the 2 species. The general activity level of the Steller sea lions was much higher than that of the grey seals. While no information is available on the haul-out pattern of the 2 species, when hauled out grey seals were usually inactive, whereas Steller sea lions were often active on land. Grey seals were frequently observed to sleep in the water, a behaviour never seen in Steller sea lions.
In conclusion, the average food intake of Steller sea lions was much higher than that of grey seals of similar body weight. This was probably due to the generally thinner blubber layer, and much higher general activity level of the Steller sea lions.
3) California sea lion - Steller sea lion The body trunk surface to volume ratio of both sexes is higher in the California sea lion than in the Steller sea lion (Table 3). The surface area of the flippers, compared to total body surface area, is probably similar for the 2 species. Total body surface area to vol-
591

R.A. Kastelein
ume ratio is, therefore, slightly higher in California sea lions than in Steller sea lions of similar body weight. The average blubber content was probably similar in the 2 species, although this varied seasonally, especially in the males. No information is available on the insulating value of the blubber in Steller sea lions. The Steller sea lions were much more active than the California sea lions, especially on land; the proportion of time hauled out appeared to be similar.
In conclusion, Steller sea lions consumed more than California sea lions of similar body weight, probably mainly due to the much higher general activity level of the Steller sea lions.
Southern elephant seal (Ryg et ah, 1993; Table 3), but has a larger appendage surface area to body mass ratio than seals (Ryg et ah, 1993). The total body surface/body volume ratio of walruses, therefore, is probably similar, or slightly higher than in Southern elephant seals of similar weight. The blubber content of walruses is between 15 and 30% (Ryg et ah, 1993; Knutsen and Born, 1994), compared to 26-33% (Bryden, 1972) in Southern elephant seals. The thermal conductance of the blubber of the 2 species is unknown. The general activity level of the Pacific walruses was much higher than that of the Southern elephant seals, which spent a much larger proportion of time hauled out on land.
4) South American sea lion - California sea lion Males of similar weight have a similar body shape, but female South American sea lions are much more robust than female California sea lions (Table 3). The blubber content was probably similar in the 2 species, but varied seasonally. No information is available on the thermal conductance of the blubber of the South American sea lion. The activity level of the California sea lions was much higher than that of the South American sea lions, which spent a larger proportion of time hauled out and resting.
In conclusion, California sea lions consumed more than South American sea lions of similar body weight. This was probably owing mainly to the higher activity level of the California sea lions which may have been caused by the difference in environmental temperatures between Harderwijk and An-tibes. The high temperatures at Antibes may have made the South American sea lions lethargic.
5) Southern elephant seal - Pacific walrus The walrus is slightly more robust than the
In conclusion, Pacific walruses consumed more than Southern elephant seals of similar body weight, probably owing mainly to their higher general activity level.
General conclusions about the comparison of average daily food intake as a percentage of body weight for the 8 pinniped species
True seals (phocids) generally consume less, as a percentage of body weight, than eared seals (otariids) of similar body weight. The proportional food intake of the Pacific walrus falls between that of the true seals and the eared seals. Because the basal, or standard, metabolic rates of phocids and otariids are similar (Innes et ah, 1987), the differences in food intake (Fig. 1) must be due to other parameters. Information on the parameters which may influence food intake is incomplete, but, in general, true seals have a lower total body surface (trunk and appendages) to volume ratio than the eared seals. Depending on sex, and time of year, the amount of blubber (as a proportion of total body mass) is generally higher in true seals
592

Food intake of pinnipeds
than in eared seals of similar body weight. Eared seals generally have a higher activity level than true seals. It is interesting to note that the difference in food intake between similarly sized animals of different species is relatively small, considering that the animals were free to swim or haul out at will. Pinnipeds are usually more active in water than on land, with the exception of polygy-nous adult males during the breeding season, so that energy requirements in the water for locomotion and possibly thermoregulation are higher.
In general, the food intake range of pinnipeds, expressed as a percentage of body weight, overlaps the intake range of odonto-cetes of similar weight (figure 1 in the previous chapter). The relative food intake of the 2 orders was probably not much influenced by external factors such as diet or environmental temperatures, as the diets were similar and both orders were maintained in water of temperatures encountered by wild conspecifics (except for the Southern elephant seal and the Pacific walrus). These temperatures, therefore, were probably within the thermoneutral zones of the animals.
II) Comparison of annual food intake of conspecific animals of similar age
As the pinnipeds in the present study were weighed infrequently, variation in food consumption of conspecific animals was investigated by comparing the annual food intake of individuals of similar ages (Figs. 2- 9). Within each species, similarly aged individuals showed relatively large differences in annual food consumption, which may be caused by external or biological factors.
The external factors, water and air temper
atures and calorific density of the diet, were similar within each species, as each was kept at only one park. Only some California sea lions at Harderwijk were kept under 2 environmental conditions: some animals were kept indoors for some years. The food intake of females, when kept outdoors, increased (Kastelein et al, 1998 b: chapter 4.3).
Some variation in food intake between animals will undoubtedly be due to variations in the accuracy of daily record keeping. This, however, would be the same for all animals, and is probably averaged out in annual intake totals, so the large observed differences between conspecific individuals discussed below, are probably not due to this. Instead, differences are probably caused mainly by biological factors, such as the weaning process, growth phase, gender, reproductive status, constitutional differences, general activity level and haul-out behaviour.
1) The weaning process Pinnipeds depend on milk for the first phase of their life and differences in food intake between individuals in the first 1-2 years are often related to the weaning process. Weaning in the 3 phocid species is abrupt: after suckling the pup for a number of weeks (about 3 weeks in the Southern elephant seal and grey seal, and 4-6 weeks in the harbour seal), the mother suddenly abandons the pup and, if possible, copulates. The pups then usually fast for some weeks, after which they learn how to catch their prey (Kastelein and Wiepkema, 1988: chapter 3.4; 1990: chapter 3.5; Kastelein et al, 1990 c: chapter 3.2; 1991 b: chapter 3.6; 1994: chapter 3.7; 1995 a and c: chapters 3.8 and 3.11; 1998 d and e: chapters 3.9 and 3.10). This means that phocid pups have a relatively high food intake during the year of birth (Year 0 in Figs. 3 and 4). The pups of the Southern elephant seal were hand-raised, after which
593

R.A. Kastelein
they left the park, so no food intake data are available for the year of birth (Fig. 2).
In otariids, weaning is usually a gradual process, which may last for months. In the case of the South American sea lions and the California sea lions, some pups ate some solid food by the end of the year of birth (Figs. 6 and 7). In most cases, pups were weaned during the first half of the following calendar year. The large differences in annual food intake in the first year between pups, observed in Steller sea lions (Fig. 5), South American sea lions (Fig. 6), and California sea lions (Fig. 7), are due to the timing of weaning. When suckling continued right up to the birth of the next pup the following year, weaning was abrupt. In a few cases, when no pup was born during their first year, pups continued to suckle for another year (Peterson and Bartholomew, 1967). This was observed fairly often in Steller sea lions (Fig. 5) and a few times in California sea lions (Fig. 7). The single walrus pup suckled for 19 months, and thus received both milk and fish up to the age of 2 years (Fig. 9).
In conclusion, differences in food intake of animals 1-2 years of age are often related to the weaning process. The smallest differences are expected in the phocids, where the suckling periods are short and vary little in duration between pups, and weaning is abrupt. In otariids the differences are larger, as weaning is usually a gradual process over a period of several months. In some cases, however, weaning can be abrupt if the pup suckles until the birth of the next pup, which can occur in the first or second full calendar year of the present pup 's life.
The age at which the weaning process begins and ends in otariids and odobenids va
ries between mother-pup pairs, and is probably determined by both mother and pup . For the mother, the determining parameters may include: 1) Milk production (amount and dura
tion). This may depend on the physical condition of the mother at parturition, and her food intake during the suckling period.
2) Composition of the milk. 3) Mother-pup relationship. 4) Moment of delivery of the following
pup.
For pups these parameters may be: 1) Birth weight. 2) Metabolic rate. 3) Rate of accumulation of blubber. 4) Weight at the completion of weaning. 5) Age at which fish consumption begins.
The age at which food consumption begins may depend on the behaviour of the pup, the behaviour of the mother, the behaviour of other nearby animals or on the type of food available.
6) Amount of fish eaten by the pups in addition to suckling.
2) Growth phase The annual food intake of individual animals varied greatly between years in all 8 pinniped species (Figs. 2-9). Rapid increases in intake during the first few years of life coincided with initial growth spurts. In males, these growth spurts can be clearly seen in a grey seal, between birth and 3 years of age (Fig. 3), a Steller sea lion, over the same period (Fig. 5), several California sea lions, between birth and 2 years of age (Fig. 7), and a male Pacific walrus between 2 and 4 years of age (Fig. 9).
Males of polygynous pinniped species generally go through a secondary growth spurt at puberty (Laws, 1956; Payne, 1979; McLa-
594

Food intake of pinnipeds
ren, 1993). This sudden increase in growth was clearly observed in a male Southern elephant seal, between 5 and 6 years of age (Fig. 2), a male Steller sea lion, between 6 and 7 years of age (Fig. 5), a male South American sea lion, between 7 and 8 years of age (Fig. 6), several male California sea lions, between 3 and 7 years of age (Fig. 7), and a male Pacific walrus between the age of 12 and 14 years (Fig. 9). The male South American sea lion which was kept alone, did not show a secondary growth spurt during the study period (Q in Fig. 6). At Marineland Antibes, another male South American sea lion (after the study period), and a male California sea lion were also raised without conspecifics; both had body sizes and food intakes similar to those of similarly aged females. When these animals were later transferred to a group of females, their food intake increased rapidly and they became physically dimorphic. These observations suggest that sexual dimorphism in these 2 species is triggered by the presence of females. Only one male Pacific walrus showed a secondary growth spurt (Fig. 9); it is possible that the other male died before reaching sexual maturity. After males reached physical maturation, their annual food intakes usually decreased and stabilized. The exceptions are one grey seal, which showed an increase in food intake throughout life (Fig. 3), and the California sea lion males, which maintained a high food intake level for many years after becoming sexual mature (Fig. 7).
The females mainly showed large increases in food intake between birth and 2-4 years of age, depending on the individual and species (Figs. 2-9), although both males and females of all species showed large differences in food intake between successive years after the initial and secondary growth spurts. These changes were not related to illness, but the causes require further investigation.
Potential parameters to be monitored in such studies are body weight, social combination, social pattern, environmental conditions such as weather conditions, and the sensory value of food (taste, texture, size, structure and moveability). The analysis of the food intake during the year may help to determine which factors are responsible for the variations in food intake between years.
In conclusion, both male and female pinnipeds show rapid increases in food intake between birth and 2-4 years of age. Males of most territorial (dimorphic) species show a second period of rapid food intake increase, probably related to a secondary growth spurt during puberty. After becoming sexually mature and sexual dimorphic, the males showed reduced and stabilized food intake, with the exception of the grey seal and California sea lion. Both males and females of all species showed large differences in food intake between successive years, after the initial and secondary growth spurts. These changes were not related to illness, and further investigation is needed into the causes of these.
3) Gender Adult male pinnipeds consumed 1.3-2.5 times as much as non-reproductive adult females. The relative food intake of the 2 sexes reflects the degree of sexual dimorphism, in terms of body weight in each species (Figs. 2-9 and tables 3 and 4). Sexual dimorphism in body weight is pronounced in most pinnipeds, except in those species which do not hold territories during the mating season, such as the harbour seal (Table 3; McLaren, 1993). Sexual dimorphism becomes more marked during sexual maturation (McLaren, 1993), when females are close to maximum body size, but males continue to grow (Laws, 1956). In conclusion, differences in annual food intake between
595

R.A. Kastelein
12000 n
10000
c 8000 o '•&
a. E 3 6000 c o u
o 4000 p
3 C C <
2000
Southern elephant seal
- i 1 r- - i 1 r-
10 12 14 16 18 Age (year)
Figure 2. The relationship between age and annual food consumption of 3 Southern elephant seals. * Year in which a pup was born which was bottle-raised. # Period during which the male underwent a secondary growth spurt during puberty.
3000-1
0 2 4 6 8 10 12 14 16 18 20 22 24 26 Age (year)
Figure 3. The relationship between age and annual food consumption of 8 grey seals. * Year in which a pup was born and suckled.
596

Food intake of pinnipeds
1500-1
_ 1300 -O)
.2 1100 D. E 3 c 900 o o •o
I 700 m 3
I 500
300
Harbour seal
Males •-•»-- Females
- I r-
2 - 1 1
10 I 1 1
12 i — i - 1
14
i — i — i
16 i — i — i
18
i — i — i — i — i — i
20 22 24
Age (year)
Figure 4. The relationship between age and annual food consumption of 13 harbour seals. * Year in which a pup was born and suckled. The difference in type of dashed lines serves to differentiate between the females.
< 1000
0 2 4 Weaning
Figure 5. The relationship between age and annual food consumption of 12 Steller sea lions. * Year in which a pup was born and suckled. # Indicates a period during which the male underwent a secondary growth spurt during puberty. The difference in type of dashed lines serves to differentiate between the females.
597

R.A. Kastelein
5000-1 South American sea lion I —— Males • • o • - Females |
18 20
Age (year)
Figure 6. The relationship between age and annual food consumption of 12 South American sea lions. * Year in which a pup was born and suckled, which occurred in 3 females in the box. # Period during which the male underwent a secondary growth spurt during puberty. £2 A male kept without conspecifics.
California sea lion -—Males - o - Females
l. ,'.o
0 *
o- -6* |
"-*
.*, ."."». a.' •°'-.
l V z ' S . * A ••% *••"' " v . . - - o Vtf °* \ A '
-8V
6 8 10 12 14 16 18 20 22 24 26 28 30 Age (year) Weaning
Figure 7. The relationship between age and annual food consumption of 24 California sea lions. * Year in which a pup was born and suckled. • From this year on the female was housed outdoors. The difference in type of dashed lines serves to differentiate between the females.
598

Food intake of pinnipeds
3500-1
3000-
O)
£ 2500 c o a 2000
S 1500 •a o •2 1000
c < 500
South African fur seal
- T -
4 - 1 -
8 —i i 1
10 12 Age (year)
Figure 8. The relationship between age and annual food consumption of 2 South African fur seals (no reproduction occurred).
Figure 9. The relationship between age and annual food consumption of 8 Pacific walruses. * Year in which a pup was born and suckled. + The pup born in the previous year was still suckled. # Period during which the male underwent a secondary growth spurt during puberty.
599

R.A. Kastelein
males and females of each species primarily reflect differences in body weight.
4) Reproductive status All pinniped species reproduced during the study periods, except the South African fur seal, as the male and female were separated during the breeding season, because of the aggressive behaviour of the male towards the female during that period. In the other species, food intake of females did not generally increase during pregnancy (years without an * preceding years with an * in Figs. 2-9), although the walrus showed a small increase. In 6 of the 7 reproducing species, pups were suckled (the Southern elephant seal pups were hand-raised); after parturition, the food intake of the females increased rapidly to support lactation.
In phocids, the annual food intake of females in reproductive years was 14-30% higher than in non-reproductive years (Figs. 2, 3 and 4; Table 4). Although the Southern elephant seal pups were not suckled, the annual food intake of the mother was elevated in the years of parturition; food intake fell around birth and during the month after birth, and increased, to replace lost blubber, towards the end of the year. In otariids, the annual food intake of females in reproductive years was 0-50% higher than in non-reproductive years (Figs. 5,6 and 7; Table 4). Interestingly, female South American sea lions showed no increase in annual food intake in reproductive years. They consumed less than average during the first half of the year, and above average for the second half, during which the pup was suckled. The low food intake during the last 6 months of gestation might be due to an increased blubber layer, which, in the relatively warm environment at Antibes would reduce energetic demands and induce lethargy.
In conclusion, lactating phocid females spend less energy on reproduction than most otariids: only the lactating South American sea lion females showed no increase in annual food intake. This may have been the effect of relatively warm ambient temperatures.
5) Constitutional differences Individuals of the same species, age, sex and reproductive state, kept under the same environmental conditions and on the same diet, can show differences in annual food intake. In such cases, these may be caused by constitutional differences such as body weight and the insulation value of the blubber.
a) Body weight In most cases, the body weight of a pinniped is a better indicator of food consumption than the age of an animal, as body weight varies between animals of the same age and gender (McLaren, 1993). However, sufficient weight data to show such an effect were only available for the Pacific walrus. One female was much smaller than other animals of similar age, and consumed correspondingly less during non-reproductive years (Fig. 9, Kastelein et ah, 1998 c: chapter 5.1).
b) Blubber thickness I insulative properties Animals of similar size, age, gender and activity may show differences in food intake in the same environment. The differences may be due to individual variation in metabolic rate and /o r blubber thickness. However, the blubber thicknesses of the 8 pinniped species were not measured.
In conclusion, individual differences in food intake occur in pinnipeds and may be due to constitutional differences such as body weight and average blubber thickness. Rele-
600

Food intake of pinnipeds
vant information, however, is scarce. In case of blubber measurements, such data should be collected throughout the year, as blubber thickness in most pinnipeds varies seasonally (Schusterman and Gentry, 1971).
6) Activity level Differences in activity between animals probably caused some of the differences in food intake between animals of similar age, gender, body weight, and reproductive status. However, activity levels were not recorded, but this would be a valuable parameter in future studies.
7) Haul-out behaviour Differences in the proportion of time hauled-out may have caused some of the individual differences in food intake between animals of similar age, gender, body weight, and reproductive status. Although water conducts heat 25 times better than air, the animals may have adapted their blubber layer to the temperature, and homeostatic mechanisms may have reduced heat loss in water and allowed heat loss on warm days on land. Unfortunately, haul-out behaviour was not recorded, but should be recorded in future studies. In addition more information is needed about the thermoneutral zones on land and in the water, for animals of various sizes and blubber conditions.
General conclusions about annual food intakes of conspecifics of similar age
The weaning process of phocids differs greatly from those of otariids and odobe-nids. The suckling period of the phocids is short (3-6 weeks), growth rate of the pup during the suckling period high (several k g / day; mainly blubber), the mother does not eat during the suckling period, and weaning is abrupt (Anderson and Fedak, 1987). In the otariids and odobenids, the suckling period
is much longer (at least 6 months), the growth rate of the pup is low (several k g / week), the mother eats during the suckling period, and weaning is usually a gradual process (Bowen, 1991).
Most of the phocids deliver their pups on ice (Irving, 1969), exceptions being the monk seals (Monachus spp.), the harbour seal, sometimes the grey seal, the Northern elephant seal (Mirounga angustirostris) and the Southern elephant seal. Phocid pups do not receive parental care after weaning, by which time they have built up a fat reserve to maintain them until they have developed survival behaviour. During the suckling period, the activity levels of both mother and pup are low, to conserve energy (Kastelein and Wiepkema, 1988: chapter 3.4; 1990: chapter 3.5; Kastelein et ah, 1991 b: chapter 3.6; 1994: chapter 3.7; 1995 a: chapter 3.8; 1998 d and e: chapters 3.9 and 3.10). The advantage of the phocid reproductive strategy for the mother is that she must protect a pup for only 3 weeks, and the thermal energy requirements of the pup are low shortly after birth, due to the rapid development of a thick blubber layer, and the terrestrial lifestyle (and sometimes a lanugo fur). The mother, however, may lose large amounts of body weight during the suckling period, and thus requires a high food intake immediately after weaning to restore her fat reserves.
The otariids breed on land, and generally live at lower latitudes than phocids (Irving, 1969). Sea lion and walrus pups receive maternal care for a much longer period than phocid pups. The activity level of both mother and pup is much higher than in phocids during the suckling period. The advantage of the otariid/odobenid reproductive strategy for the mother is that she loses less weight, can eat during the suckling period
601

R.A. Kastelein
(with the usual exception of about one week immediately after birth) and does not require a high food intake during a short period to restore her blubber layer. She must, however, protect the pup for a longer period of time, during which time the thermal energy requirements of the pup remain high, as it enters the water at an early age, when the blubber layer is still thin, and the body surface area/volume ratio is relatively high.
Sexual dimorphism was most pronounced in those species in which the males are territorial during the breeding season, and becomes more pronounced during puberty, when the males undergo a secondary growth spurt during which food intake increases rapidly. Sexual dimorphism in body weight and food intake was substantial in all species except the harbour seal. The main difference between this seal and the other 7 pinniped species is that the males do not defend territories, and thus the selective pressure for the strongest (often largest) male is less.
In future research, more physical parameters, such as body weight, body dimensions and blubber thickness, and behavioral parameters including activity level and haul-out behaviour, should be quantified to enhance the understanding of differences in food intake between animals of similar age, gender, and reproductive status.
Ill) Comparison of monthly food intakes of individual animals
The food intake of pinnipeds usually fluctuated during the year, either irregularly or systematically. Irregular fluctuations can be due to illness, changes in social situation, and non-seasonal changes in the environment. These will not be discussed further.
Systematic fluctuations Systematic seasonal fluctuations in food intake of pinnipeds can be caused by biological factors, such as rapid growth, reproduction, and moult, or by seasonal external factors, such as water and air temperatures.
A) Biological factors
Growth stage During each of the first few years after weaning, food consumption increased gradually. This was observed in all species (Kastelein pers. obs.), and was demonstrated for the Southern elephant seal (Kastelein et al., 1991 a: chapter 3.1), the Steller sea lion (Kastelein et al., 1990 a: chapter 4.1), and the Pacific walrus (Kastelein et al., 1998 c: chapter 5.1).
Reproduction Seasonal fluctuations in food intake coinciding with reproductive cycles usually began when the animals reached sexual maturity. This was observed in both sexes of Southern elephant seals (Kastelein et al., 1991 a: chapter 3.1), grey seals (Kastelein et al., 1990 c: chapter 3.2), Steller sea lions (Kastelein et al., 1990 a: chapter 4.1), South American sea lions (Kastelein et al., 1995 b: chapter 4.2), California sea lions (Kastelein et ah, 1998 b: chapter 4.3), Pacific walruses (Kastelein et ah, 1998 c: chapter 5.1), and in a male South African fur seal (Kastelein et ah, 1990 b: chapter 4.4) (Figs. 10-11 and 13-17). Insufficient data was available on the food intake of harbour seals until sexual maturity to show a change in monthly pattern. However, when adult, they showed a systematic seasonally fluctuating intake pattern (Kastelein et ah, 1998 f: chapter 3.3; Fig. 12).
The reproductive pinniped males showed a pronounced reduction in food intake during the breeding season during which all, except the harbour seal were territorial. Food intake
602

Food intake of pinnipeds
increased again after the breeding or moult period. The food consumption of the females during lactation varied greatly between species. The reproducing female Southern elephant seal reduced her food intake during the pupping, "suckling" (even though she did not suckle), and moulting periods, and consumed much more than average after moult (Fig. 10b). The reproducing female grey seal showed a reduction in food intake during the pupping and suckling period, after which food intake rose markedly for one month (Fig. 11 b). The reproducing female harbour seal consumed less than average during the last stage of gestation and the month of pupping, but showed increased food intake during the suckling period (Fig. 12 b). Reproducing female Steller sea lions, South American sea lions, California sea lions, and Pacific walrus showed similar seasonal food intakes (Figs. 13 b, 14 b, 15 b, and 17 b). Food intake gradually decreased during the year to a minimum during the pupping season, after which intake increased rapidly, and usually remained above average for the second part of the year.
Moult Moult appeared to reduce the food intake of male phocids and Pacific walruses (Figs. 10 a, 11 a, 12 a, and 17 a). In females, however, the food intake during moult was generally far above average, as moult followed the suckling period, during which the phocid females, except the harbour seal and the female walrus, had not eaten (Figs. 10 b, 11 b, 12 b, and 17 b).
B) External factors
Ambient temperature The influences of ambient temperature and biological factors, especially reproduction, are hard to separate, as reproduction is to
some extent synchronised with season, and the consequent temperature fluctuations and prey availability. However, grey seal males and Pacific walrus males lost weight during relatively cold periods of the year, suggesting that the loss of blubber had no thermoregulatory purpose.
General conclusions about monthly food intake of individual animals
The main annual fluctuations in pinniped food consumption are related to reproduction. Reproductive males showed a large decrease in food intake during the mating period, when all except the harbour seal were territorial. Subsequently, food intake rose. Although not quantified, this pattern was also observed in wild polygynous pinnipeds (Sergeant, 1973). The males in the present study, however, reduced food intake, whereas wild adult territorial males fast during the mating season, which may last up to 3 months.
In polygynous species, adult males show an increase in food consumption before the breeding season and store energy in the form of blubber. Due to high activity and fasting, much weight is lost during the breeding season and is replaced over varying periods of time. The degree of food reduction in male pinnipeds (a measure of endurance) can be expressed as the total voluntary food reduction during the breeding season (or total deviation of average monthly food intake from the annual average of the males during the breeding season, Figs. 10 a-17 a). The degree of sexual dimorphism can be expressed as the average body weight of adult males/the average body weight of adult females (Table 4). The combined data for the 8 pinniped species show a positive relationship between the degree of dimorphism and the degree of voluntary food re-
603
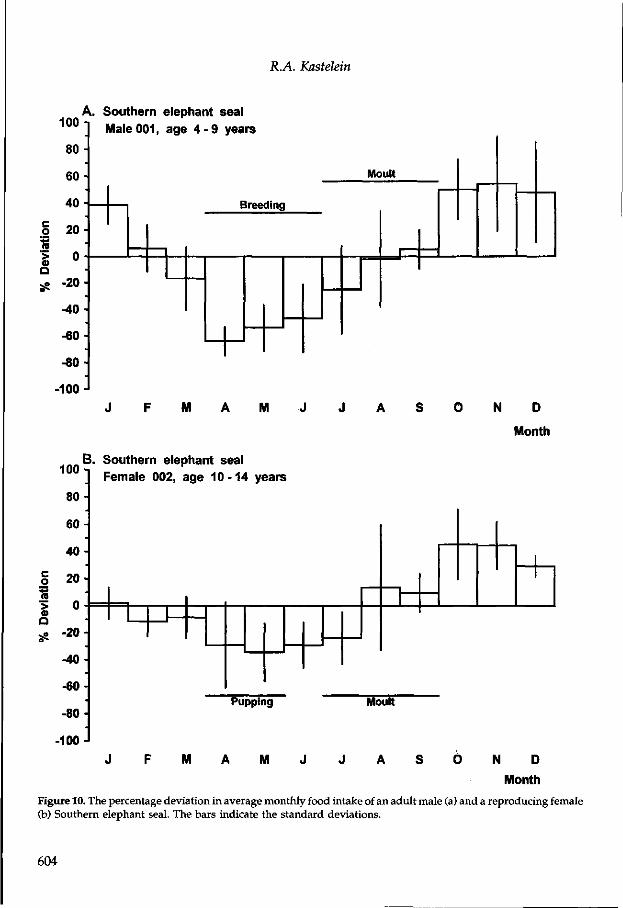
R.A. Kastelein
c o
o a
100
80
60
40
20
A. Southern elephant seal
Male001, age 4 - 9 years
-20
-40
-60 H
-80
-100 J
Moult
Breeding
M M N D
Month
100 B. Southern elephant seal ] Female 002, age 10-14 years
80
60-
40-
§ 20
Q -20-j
-40
-60
-80 H
-100 M
Pupping
M
Moult
N D
Month
Figure 10. The percentage deviation in average monthly food intake of an adult male (a) and a reproducing female (b) Southern elephant seal. The bars indicate the standard deviations.
604

Food intake of pinnipeds
o (0
• > o a
100
80
60 H
40
20
A. Grey seal Male 002, age 12-25 years
-20 i
-40
-60
-80
-100
Moult
Breeding Breeding
M M J A S O N D
Month
100 B. Grey seal 1 Female 001, age 14-22 years
80-
60-
40-
o 20 H
-20-
-40-
-60
-80
-100
Moult
Pupping Suckling
J F M M N D
Month
Figure 11. The percentage deviation in average monthly food intake of an adult male (a) and a reproducing female (b) grey seal. The bars indicate the standard deviations.
605

R.A. Kastelein
o n '1 Q
A. Harbour seal 1 0 0 1 Male 002, age 5 - 22 years
80 -
60
40 -
20-
-20
-40-
-60-
-80-
-100
Breeding Moult
M M N D
Month
Q
100
80
60
40
20
B. Harbour seal Female 018, age 9 - 1 0 years
-20-
-40-
-60-
-80-
-100
Moult
Pupping
M
Suckling
M J A N D
Month
Figure 12. The percentage deviation in average monthly food intake of an adult male (a) and a reproducing female (b) harbour seal. The bars indicate the standard deviations.
606

Food intake of pinnipeds
c o
A. Steller sea lion
~* Male 001, age 8-15 years
80
60
40
20 Breeding
a> Q
-20
-40
-60
-80
-100
M M N D
Month
c o
Q
100
80
60
40
20
0
-20
-40
-60
-80
-100
B. Steller sea lion
Female 003, age 7-13 years
Pupping
Suckling
M M N D
Month
Figure 13. The percentage deviation in average monthly food intake of an adult male (a) and a reproducing female (b) Steller sea lion. The bars indicate the standard deviations.
607

R.A. Kastelein
A. South American sea lion 100 -I
80-
60-
40 -
o 20 -
'3 n . g ° a ss -20-
-40-
-60-
-80-
-100-
Male008, age 17-18 years
i 1 1 '
Breeding
M M N D
Month
B. South American sea lion
c o
a
100 -i
80 -
60 -
4 0 -
20-
-20 -
-40 -
-60-
-80-
100-J
Female 003, age 8 years
•
J F M A M
Puppinj 3
J J A
Suckling
S O N D
Month
Figure 14. The percentage deviation in average monthly food intake of an adult male (a) and a reproducing female (b) South American sea lion. The bars indicate the standard deviations.
608

Food intake of pinnipeds
c o
Q
100
80
60
40
20
0
-20
-40
-60
-80
-100
A. California sea lion
] l\
•
Aale006, i
•
age 6- 17 years
•
•
E ireedinc I
I
M M N D Month
100
80 H
60
40
20
B. California sea lion Female 012, age 6-13 years
® Q
3S "20
-40-
-60--80-
-100-
Pupping
Suckling
M M N D Month
Figure 15. The percentage deviation in average monthly food intake of an adult male (a) and a reproducing female (b) California sea lion. The bars indicate the standard deviations.
609

R.A. Kastelein
c o
1 Q
South African fur seal 100-i Male 002, age 7-12 years
80
60 H
40
20 H
0
-20-
-40-
-60
-80 H
•100 M
Breeding
M J J N D
Month
Figure 16. The percentage deviation in average monthly food intake of an adult male South African fur seal. The bars indicate the standard deviations.
duction (Fig. 18). This suggests that the larger the degree of dimorphism (based on body weight), the more the male can be deprived of food and the more energy can be invested in defending the territory and in mating. Female pinnipeds usually increase their blubber layer during gestation, reducing the thermal energy requirements. This may explain why food intake does not increase during gestation. Females fast for much shorter periods than males, but the breeding patterns differ greatly between the phocids, and the otariids and odobenids.
Phocid females, like the Southern elephant seal and grey seal, do not feed during the 3 week suckling period, when they seldom, if at all, leave the pupping area. Even when fed ad lib., grey seal females have very low food
intake levels during the suckling period (Kastelein and Wiepkema, 1988: chapter 3.4; 1990: chapter 3.5; Kastelein et ah, 1991 b: chapter 3.6; 1994: chapter 3.7; 1995 a: chapter 3.8), and lose large amounts of weight (Kastelein et al.r 1994: chapter 3.7; 1995 a: chapter 3.8). In contrast to lactating Southern elephant seal and grey seal females, harbour seal females forage for most of the 4-6 week suckling period. (Le Boeuf, 1991).
Otariid females and their pups fast intermittently during lactation, although for considerably shorter periods than phocids. Otariid females usually nurse the pups for periods of 2 to 3 days, during which time they do not feed, after which the mother goes to sea to feed for about 4 days, during which time the pup fasts. These alternating periods of feeding and fasting continue throughout the 6-24
610

Food intake of pinnipeds
100
80
60
40
§ 20-| n
A. Pacific walrus Male 003, age 5 -14 years
Breeding Moult
d) O
-20
-40 H
-60
-80 H
-100
M M N D Month
E 100-
80-
60-
40-
S 20 -O *•" (0 •c n -> u a 55 -20-
. -40-
-60-
-80-
-100-
I. Pacific walrus Female 004, age 13 years
J F M A M
Moult
Pupping
J
Su<
J
skiing
A S 0 N
M D
onth
Figure 17. The percentage deviation in average monthly food intake of an adult male (a) and a reproducing female (b) Pacific walrus. The bars indicate the standard deviations.
611

R.A. Kastelein
month nursing period (Boness, 1991). Walrus pups are born on ice floes, and travel on the backs of their mothers immediately after birth. They are probably suckled every day between birth and weaning.
The fluctuations in the food intake discussed here are presumably caused by endogenous circannual rhythms. In contrast to wild con-specifics, which stay on land during the breeding and moult periods and thus cannot catch fish, the animals in the present study were fed ad lib. all year. Despite the readily available food, food intake decreased during the same months as that of wild conspecif ics, suggesting an element of hormonal regulation of food intake.
In captivity, many phocids and odobenids
appear to reduce food intake or stop eating during the moulting period (Keyes, 1968; Lager et ah, 1994), when a large proportion of time is spent ashore. Hauling out increases skin temperature which is believed to increase the speed of moult (Salter, 1979). However, the present study shows that this is not always the case, as reproducing females showed no decrease in food intake during moult. In the present study, moult appeared to have less of an effect on the food intake than expected from observations in the wild. This may be because wild animals remain on land during moult and thus cannot forage, while the captive animals were offered food and continued to eat, although males at a lower level. From these observations, it is not yet clear whether moult is a rhythmic endogenous phenomenon, or sim-
60-
„, 180
$ c .E g 160 _ « g • 140 * • o> *• E 0=5 120 c $ O E B -O 100 TO Q)
St 80 •M (S T3 O)
S8 40 *i « - 20 1°
1.0 1.2 1.4 1.6 1.8 2.0 2.2 2.4 2.6 2.8 3.0 3.2 3.4 3.6 3.8 4.0
Degree of dimorphism (body weight male / body weight female)
Figure 18. The relationship between the degree of dimorphism (expressed as average body weight of adult males/average body weight of adult females) of 8 pinniped species and the total reduction in food intake (expressed as total deviation from the average monthly food intake) of males during the breeding season.
"
•
Grey seal •
•
• Harbour seal 1 i i i i i i i
Southern elephant seal
•Steller sea lion
•South African fur seal
• _ ._ California sea Hon
• Pacific walrus
•South American sea lion
• — i — i — i — i — i — i — i — i — i — i — i — i — i — i — i — i — i — i — i — i — i — i — i
612

Food intake of pinnipeds
ply follows the breeding season. In conclusion, during the breeding season, pinniped energy intake per day is lower than during the rest of the year, although energy expenditure is higher. In males this is mainly owing to locomotion, while in the females the increase in energy expenditure results mainly from lactation. Food intake during the breeding season appears to be controlled by an endogenous rhythm.
Acknowledgements
I would like to thank Carolien Staal and Nicole Schooneman for part of the data analysis, Rob Triesscheijn for drawing the graphs, and Piet Wiepkema, Eleanor Hayes (University of Bristol, UK), Nancy Vaughan (University of Bristol, UK), Ed Keith (NOVA Southeastern University, U.S.A.), Carolien Staal, Nicole Schooneman, and Janny Hardeman for their comments on the manuscript.
References
Anderson, S.S. and Fedak, M.A. (1987) The energetics of sexual success of grey seals and comparison with the costs of reproduction in other pinnipeds. Zool. Symp. 5,319- 341.
Ashwell-Erickson, S. and Eisner, R. (1981) The Energy Cost of Free Existence for Bering Sea Harbor and Spotted Seals. In: The eastern Bering Sea shelf: oceanography and resources. Vol. 2 (Eds. Hood, D. and Calder, J.A.). Univ. of Wash. Press, Seattle, WA, 869-899.
Boeuf, B.J. Le (1991) Pinniped mating systems on land, ice and in the water: Emphasis on the Phocidae. In: Behaviour of pinnipeds (Ed. Renouf, D.). Chapman and Hall Ltd., London, 45-65.
Boness, D.J. (1991) Determinants of mating systems in the Otariidae (Pinnipedia). In: Behaviour of pinnipeds (Ed. Renouf, D.). Chapman and Hall Ltd., London, 1-44.
Bowen, W.D. (1991) Behavioural ecology of pinniped neonates. In: Behaviour of pinnipeds (Ed. Renouf, D.). Chapman and Hall Ltd., London, 67-127.
Bryden, M.M. (1972) Body size and composition of elephant seals (Mirounga leonina): absolute measurements and estimates from bone dimensions. J. Zool., London, 167,265-276.
Costa, D.P. (1991) Reproductive and foraging energetics of pinnipeds: Implications for life history patterns. In: The behaviour of Pinnipeds (Ed. Renouf, D.). Chapman and Hall Ltd., London, 300-344.
Davis, R.W., Williams, T.M. and Kooyman, G.L. (1985) Swimming metabolism of yearling and adult harbor seals Phoca vitulina. Physiol. Zool. 58(5), 590-596.
Geraci, J. (1972) Experimental thiamine deficiency in captive harp seals Pagophilus groen-landicus, induced by eating herring, Clupea harengus, and smelts, Osmerus mordax. Can. J. Zool. 50, 179-195.
Baker, J.D., Fowler, C.W. and Antonelis, G.A. (1994) Mass change in fasting immature male northern fur seals. Can. J. Zool. 72, 326-329.
613

R.A. Kastelein
Hutchinson, J.D. (1996) Fisheries Interactions: The Harbour Porpoise - a Review. In: The conservation of Whales and Dolphins (Eds. Simmons, M.P. and Hutchinson, J.D.). John Wiley & Sons Ltd, 127-165.
Innes, S., Lavigne, D.M., Earle, W.M. and Kovacs, K.M. (1987) Feeding rates of seals and whales. Journal of Animal Ecology 56, 115-130.
Irving, L. (1969) Temperature regulation in marine mammals. In: Marine Mammals. Vol. I. (Ed. H.T. Andersen), Academic Press, New York, 147-174.
Kastelein, R.A. and Weltz, F.C. (1990) Distribution, abundance,reproduction and behaviour of Steller sea lions (Eumetopias jubatus) in Prince William Sound, Alaska. Aquatic Mammals, 15(4), 145-157.
Kastelein, R.A. and Weltz, F.C. (1991) Distribution and behaviour of Steller sea lions (Eumetopias jubatus) in Prince William Sound, Alaska, June 1989. Aquatic Mammals, 17(2), 91-97.
Kastelein, R.A. and Wiepkema, P.R. (1988: chapter 3.4) Case study of the neonatal period of a Grey Seal pup (Halichoerus grypus) in captivity. Aquatic Mammals 14(1), 33-38.
Kastelein, R.A. and Wiepkema, P.R. (1990: chapter 3.5) The suckling period of a Grey seal (Halichoerus grypus) while confined to an outdoor land area. Aquatic Mammals 16 (3), 120-128.
Kastelein, R.A., Vaughan, N. and Wiepkema, P.R. (1990 a: chapter 4.1) The food consumption of Steller sea lions (Eumetopias jubatus). Aquatic Mammals 15(4), 137-144.
Kastelein, R.A., Verhoeven, I. and Wiepkema, P.R. (1990 b: chapter 4.4) The food consumption of South African fur seals (Arcto-cephalus pussilus) in the Harderwijk Marine Mammal Park. Int. Zoo Yearb. 29, 175-179.
Kastelein, R.A., Wiepkema, P.R. and Vaughan, N. (1990 c: chapter 3.2) The food consumption of Grey seals (Halichoerus grypus) in human care. Aquatic Mammals 15(4), 171-180.
Kastelein, R.A., Kershaw, J. and Wiepkema, P.R. (1991 a: chapter 3.1) The food consumption of Southern elephant seals (Mirounga leonina). Aquatic Mammals 17(2), 76-87.
Kastelein, R.A., Wiepkema, P.R. and Vaughan, N. (1991 b: chapter 3.6) The suckling period of a Grey seal (Halichoerus grypus) while the mother had access to a pool. Aquatic Mammals 17(1), 42-51.
Kastelein, R.A., Wiepkema, P.R., Berghout, E. and Groenenberg, H.J. (1994: chapter 3.7) Effective mass transfer in a suckling Grey seal (Halichoerus grypus). Aquatic Mammals 20(1), 11-27.
Kastelein, R.A., Groenenberg, H.J. and Wiepkema, P.R. (1995 a: chapter 3.8) Detailed observations of suckling behaviour of a Grey Seal (Halichoerus grypus) at Harderwijk Marine Mammal Park. Int. Zoo Yearb. 34, 186-200.
Kastelein, R.A., Kershaw, J., Berghout, E. and Wiepkema, P.R. (1995 b: chapter 4.2) The food consumption of South American sea lions (Otaria flavescens). Aquatic Mammals, 21(1), 43-53.
614

Food intake of pinnipeds
Kastelein, R.A., Staal, C. and Wiepkema, P.R. (1995 c: chapter 3.11) Fishing technique development in a newly weaned Grey seal (Halichoerus grypus). In: Sensory Systems of Aquatic Mammals (Eds. Kastelein, R.A., Thomas, J.A. and Nachtigall, P.E.). De Spil Publishers, Woerden, The Netherlands, 515-528.
Kastelein, R.A., Klasen, W.J.C., Postrna, J., Boer, H. and Wiepkema, P.R. (1998 a: chapter 5.2) Food consumption, growth and food passage times in Pacific walrus pups (Odobe-nus rosmarus divergens).
Kastelein, R.A., Schooneman, N.M., Vaugh-an, N. and Wiepkema, P.R. (1998 b: chapter 4.3) Food consumption and growth of California sea lions (Zalophus californianus).
Kastelein, R.A., Schooneman, N.M. and Wiepkema, P.R. (1998 c: chapter 5.1) Food consumption and growth of Pacific walruses (Odobenus rosmarus divergens).
Kastelein, R.A., Staal, C , Nieuwstraten, S.H. and Wiepkema, P.R. (1998 d: chapter 3.9) The relationship between suckling time and weight increase in a grey seal (Halichoerus grypus) pup.
Kastelein, R.A., Staal, C , Nieuwstraten, S.H. and Wiepkema, P.R. (1998 e: chapter 3.10) Behaviour and weight changes of a grey seal (.Halichoerus grypus) pup before and after weaning.
Keyes, M.C. (1968) The Nutrition of Pinnipeds. In: The behavior and physiology of pinnipeds (Eds. Harrison, R.J., Hubbard, R.C., Peterson, R.S., Rice, C.E. and Schuster-man, R.J.). Appleton-Century- Crofts, New York, U.S.A., 374-395.
Kleiber, M. (1975) The fire of life: An introduction to animal energetics. R.E. Kreiger Publishing Co. Ltd., Huntington, New York.
Kleiner, M. (1947) Body size and metabolic rate. Physiological Reviews 27(4), 511-541.
Knutsen, L.0. and Born, E.W. (1994) Body growth in Atlantic walruses (Odobenus rosmarus rosmarus) from Greenland. J. Zool. London 234, 371-385.
Lager, A.R., Nord0y, E.S. and Blix, A.S. (1994) Seasonal changes in food intake of harp seals (Phoca groenlandica) at 69°N. Mar. Mam. Sci. 10(3), 332-341.
Lavigne, D.M., Innes, S., Stewart, R.E.A. and Worthy, G.A.J. (1985) An annual energy budget for north-west Atlantic harp seals. In: Marine mammals and fisheries (Eds. Beddington, J.R., Beverton, R.J.H. and Lavigne, D.M.). George Allen & Unwin Ltd., London, U.K., 319-336.
Lavigne, D.M., Innes, S., Worthy, G.A.J., Ko-vacs, K.M., Schmitz, O.J. and Hickie, J.P. (1986) Metabolic rates of seals and whales. Can. J. Zool. 64, 279-284.
Kastelein, R.A., Staal, C. and Wiepkema, P.R. (1998 f: chapter 3.3) Food consumption and growth of harbour seals (Phoca vitulina).
Laws, R.M. (1956) Growth and sexual maturity in Aquatic mammals. Nature 4526,193-194.
615

R.A. Kastelein
Martensson, P.-E., Nord0y, E.S. and Blix, A.S. (1994) Digestibility of crustaceans and capelin in Harp seals (Phoca groenlandica). Mar. Mam. Sci. 10(3), 325-331.
McLaren, LA. (1993) Growth in pinnipeds. Biol. Rev. 68, 1-79.
Miller, L.K. (1978) Energetics of the northern fur seal in relation to climate and food resources of the Bering Sea. U.S. Marine Mammal Comm., Washington D.C. 20006; report no. MMC-75/08.
Nord0y, E.S. and Blix, A.S. (1988) Sources of error in estimating food requirements of seals. Polar Record 24, 62-64.
Payne, M.R. (1979) Growth in the Antarctic fur seal (Arctocephalus gazella). J. Zool. London 187, 1-20.
Perez, M. (1994) Calorimetry Measurements of Energy Value of Some Alaskan Fishes and Squids. NOAA Techn. Mem. NMFS-AFSC-32. U.S. Dept. of Commerce, 32 pp.
Peterson, R.S. and Bartholomew, G.A. (1967) The natural history of the California sea lion. Am. Soc. Mammal. Spec. Publ. No. 1, 79 pp.
Ponganis, P.J., Ponganis, E.P., Ponganis, K.V., Kooyman, G.L., Gentry, R.L. and Trill-mich, F. (1990) Swimming velocities in otari-ids. Can. J. Zool. 68, 2105-2112.
Potsdammer, R., Anstadt, I. and Mertens, E. (1988) Het grote visboek. Van Reemst, Hou-ten, The Netherlands, 240 pp.
Renouf, D. and Noseworthy, E. (1990) Feeding cycles in captive harbour seals (Phoca vitulina): weight gain in spite of reduced food intake and increased thermal demands. Mar. Behav. Physiol. 17, 203-212.
Renouf, D., Almon, M. and Noseworthy, E. (1988) Variations in feeding and social behavior in a captive breeding group of harbour seals (Phoca vitulina). Mar. Behav. Physiol. 13, 287-299.
Renouf, D., Gales, R. and Noseworthy, E. (1993) Seasonal variation in energy intake and condition of harp seals: Is there a harp seal morph? Problems for bioenergetic modelling. J. Zool. London 230, 513-528.
Ronald, K., Kiever, K.M., Beamish, F.W.H. and Frank, R. (1984) Energy requirements for maintenance and faecal and urinary losses of the grey seal (Halichoerus grypus). Can. J. Zool. 62, 1101-1105.
Ryg, M., Lydersen, C , Knutsen, L.0., Bj0rge, A., Smith, T.G. and 0iitsland, N.A. (1993) Scaling of insulation in seals and whales. J. Zool. London 230, 193-206.
Salter, R. (1979) Site utilisation, activity budgets and disturbance responses of Atlantic walruses during terrestrial haul-out. Can. J. Zool. 57, 1169-1180.
Schusterman, R.J. and Gentry, R.L. (1971) Development of a fatted male phenomenon in California sea lions. Developmental psy-chobiology 4(4), 333-338.
Sergeant, D.E. (1973) Feeding, growth, and productivity of Northwest Atlantic Harp Seals (Pagophilus groenlandicus). J. Fish. Res. Board Can. 30, 17-29.
Spotte, S. and Adams, G. (1979) Note on the food intake of captive adult male Northern fur seals (Callorhinus ursinus). Aquatic Mammals 7(3), 65-67.
616

Food intake of pinnipeds
Spotte, S. and Adams, G. (1981) Feeding rate Worthy, G.A.J. (1990) Nutritional energetics of captive adult female Northern fur seals of marine mammals. In: Handbook of Ma-(Callorhinus ursinus). Fishery Bulletin 79(1), line Mammal Medicine: Health, Disease and 182-184. Rehabilitation (Ed. Dierauf, L.A.). CRC
Press, Boston, 489-520. Whittow, G.C. (1987) Thermoregulatory adaptations in marine mammals: interacting effects of exercise and body mass. A review. Mar. Mam. Sci. 3(3), 220-241.
Williams, T.M., Kooyman, G.L. and Croll, D.A. (1991) The effect of submergence on heart rate and oxygen consumption of swimming seals and sea lions. J. Comp. Physiol. B. 160, 637-644.
617

Chapter 8
Biological, husbandry, and
wildlife aspects
619

Chapter 8.1
Food consumption of marine mammals: biological, husbandry, and wildlife management aspects
R.A. Kastelein
Harderwijk Marine Mammal Park, Strandboulevard Oost 1,3841 AB Harderwijk, The Netherlands
Introduction
Various aspects of food intake and growth data from 9 odontocete and 8 pinniped species were presented and discussed in the previous chapters. In this final chapter the general life histories of the 2 groups are compared to allow seasonal and sexual differences in food intake to be better understood. The use of food records of marine mammals for husbandry in zoos and oceanaria is discussed. Finally, the use of these food records in the development of management plans for marine mammals in the wild is considered.
Biological aspects related to food intake Differences in food intake between odonto-cetes and pinnipeds with respect to seasonality and gender can be better understood when the life histories of the groups are compared. The main ecological difference between odontocetes and pinnipeds, is that odontocetes are completely aquatic, dying from pressure, heat exhaustion, and dehydration within hours of leaving water, whereas pinnipeds lead an amphibious life, and can survive permanently on land when fed artificially. The main anatomical differences associated with their different environments are:
Pinnipeds have 4 appendages and can loco-mote on land, although this is not as well developed anymore as in most terrestrial mammals, whereas odontocetes have no hind limbs, but instead have a well- developed tailfluke for aquatic locomotion. Odontocetes have no hair, other than a few mystacial vibrissae during the suckling period, whereas pinnipeds have a fur pelage.
Both groups have a variable blubber layer to insulate and streamline the body, provide an energy store and improve buoyancy. In the case of both groups, the aquatic environment provides a rich source of food including both fish and invertebrates.
Pinnipeds spend a significant portion of their lives on shore, for breeding (pupping, mating, and suckling), moulting and resting. Because they can only haul out next to water, and suitable substrates are often scarce, competition for these areas may be strong. This condition may have contributed to the evolution of a reproductive strategy in which males are territorial and polygynous (Bartholomew, 1970). In some species, sexual dimorphism is pronounced, and larger males generally have greater reproductive success. A combination of climatic and biological factors, such as food availability and the presence of predators, favours pupping in short specific periods of the year and at appropriate seashore sites. Female pinnipeds, therefore, tend to be monoestrous. When territorial males defend territories and harems, they do not enter the water to feed. Instead, energy is stored before the breeding season in the form of blubber allowing the animals to fast for periods of weeks or months. This causes seasonal fluctuation in food intake and body weight. Similar fluctuations occur in females, which lose body weight during lactation; this is most pronounced in some Phocids, like the Southern elephant seal and grey seal, lactating females of which do not feed for 3 weeks. In other Phocids, the Otariids and the Odobe-nids, however, females eat during the nursing period.
621

R.A. Kastelein
In contrast to pinnipeds, odontocetes spend their entire lives in water, where seasonal temperature changes are less pronounced than in air. As there appear to be no territories or other resources for compete, sexual dimorphism is low in the species studied, except in the killer whale. Probably due to small seasonal differences in prey availability and water temperature, odontocetes, such as the bottlenose dolphin, are polyoes-trus, and ovulate at various times of year. This implies that mating and calving do not have a systematic seasonal effect on food intake.
The average daily food intake as a percentage of body weight of pinnipeds and odontocetes of similar body weight differed little (Kastelein, 1998 a and b, chapters 6.1 and 7.1; Innes et al., 1987), although pinnipeds spend a significant amount of time hauled out. The pinnipeds studied were probably kept within their thermal neutral zone both in air and in water. This implies a higher energy expenditure for swimming in pinnipeds than in odontocetes, which appears to be counterbalanced by a reduced activity level on land.
Significance for husbandry of food consumption records of marine mammals in oceanaria Records of food consumption in captive marine mammals may contribute to the care and well-being of marine mammals in other zoos (Worthy, 1990). Published food intake records may serve as a reference for veterinary and husbandry purposes, when considering the external and biological factors which may influence food consumption. However, as environmental parameters affect food intake, and will differ between parks, the present food intake data should not be treated as standard values for the species described. Moreover, the present data show large individual differences in food intake between animals of similar sex, age,
reproductive status, activity level, housed under the same environmental conditions. It is, therefore, important to establish baseline food intake levels of individual animals. Deviations from these baseline levels can be important indicators of behavioral and physiological state.
Decreases in food intake may indicate a number of different conditions, suggesting various types of husbandry or veterinary actions: - Illness. Increase surveillance, medical in
vestigation. - Social problems. Increase surveillance,
alter group composition - Oestrus. Depending on the reproductive
program, adult males can be introduced or separated from females in oestrus.
- Onset of the breeding season in males. Depending on the reproductive program, adult males can be introduced or separated from females. Males can be separated to prevent fights.
- The approach of birth. Increase surveillance. The social situation may need to be changed, membranes may need to be removed from pups, prepare to disinfect the umbilicus, minimize disturbances.
- The end of lactation. Increase monitoring of the food intake of the pup or calf. Mother and young may be separated.
- Lower activity level. Increase surveillance, as this may indicate early stages of illness.
- Higher proportion of time spent hauled-out. Check the water temperature.
- Increase in water or air temperature. Consider chilling the pool water.
- Increase in calorific density of the diet. Check calorific density of the diet.
Food intake increases may also reflect different conditions: - The beginning of lactation. Prepare for an
even greater increase in food intake.
622

Biological, husbandry, and wildlife management aspects
- Growth spurt, often observed during sexual maturation. Make preparations to prevent excessive fighting. Take measures to alter the social combination, depending on the breeding program.
- The end of the breeding season. Territorial males can soon be reunited.
- Higher activity level. Increase surveillance to discover the cause.
- Larger proportion of time spent in the water. Consider changing the environmental conditions on land: provide shade, or shelter against rain or wind.
- Decrease in water or air temperature. Consider increasing water temperature.
- Decrease in calorific density of the diet. Check calorific density of the diet.
Knowledge of the life history of marine mammals, such as the timing of the reproductive cycle or the approximate age at maturation, is necessary to identify the factors causing changes in food intake, and thus allowing the correct response to be made. Fortunately, most marine mammals in zoos are in training and have daily interactions with the trainers. This means that animals receive individual attention and that the level of cooperation in training sessions or shows is, besides food intake, used as an indicator of well-being.
Significance of food consumption records of marine mammals in oceanaria for wildlife management Agencies responsible for wildlife management require information on the relationships between living organisms at various trophic levels to design multi-species models (Sergeant, 1973; Fay et al., 1977; Condy, 1981; Bailey and Ainley, 1981/1982; Hiby and Harwood, 1985; Lavigne et al., 1985; orit-sland and Markussen, 1990; Overholtz et al., 1991). In such models, the food consumption of marine mammals is an important param
eter, as they are top marine predators, having a large impact on fish and invertebrate populations. Although marine food resources suitable for human consumption appeared limitless until recently, many fish stocks have been depleted by an increase in fishing, as a result of the development of larger fishing boats and nets.
Due to more intensive fishing, man and marine mammals have become competitors (Rae, 1960,1968; Beverton, 1985; Lowry and Frost, 1985; Ferrero and Fritz, 1994; Hutchinson, 1996). To assess potential interactions between marine mammal predators, commercial fisheries, and the species required by both, quantitative information is required on the prey species of marine mammal populations which are important for commercial fisheries, the size/age categories taken by each, and the relevant timing and location (Beddington et ah, 1985). Stocks of fish must also be assessed. However, some marine mammals have been reported to prey on 50 species of fish (Kajimura, 1985), making bio-energetic models very complex.
The amount of fish caught by the fisheries can be estimated from catches landed at ports and fish stocks can be estimated from surveys. Estimation of the amount of fish taken by marine mammals is more difficult and has mostly involved indirect methods, such as the analysis of stomach contents and faeces (in pinnipeds), the measurement of oxygen consumption, isotopic water techniques, or mathematical models. Each of these methods has its limitations for estimating annual population food intake.
Determination of food (energy) requirements from stomach contents (Rae, 1960, 1968; Bigg and Perez, 1985; Murie, 1987; Pierce et al., 1993), or from otolith measurements in the faeces of pinnipeds (Murie and
623

R.A. Kastelein
Lavigne, 1985; Prime and Hammond, 1987), remains inaccurate as it is based on many assumptions, and will, at best only give information on prey species and size (Lowry and Frost, 1981; Lavigne et al., 1982; Bigg and Fawcett, 1985; Murie and Lavigne, 1985). Without adequate reports of annual variation in location and frequency of feeding, average meal size, and calorific density of prey, including information on fasting periods, stomach contents will not provide reliable estimates of annual population food intake, in terms of biomass. Nor will it provide a measure of annual calorific requirements.
Determination of the food intake from oxygen consumption (Worthy et al., 1987), is also an inaccurate method of assessing annual food consumption, as laboratory conditions differ greatly from the natural situation. The behaviours tend to be limited and the measurement periods of short duration, providing an incomplete picture of annual energetic needs.
With injections of isotopic water, energy consumption in the wild can be measured, although the technique requires at least two blood samples, limiting its use to those pinniped species which return to the same haul-out site within a period at which the isotope concentration is still detectable. Furthermore, the method provides only a snapshot of what occurs during an entire year (Castel-lini, 1987; Costa, 1987; Davis, 1987).
Food consumption may also be estimated by reconstructing the energy budget from the metabolic energy requirements, taking into account energy loss associated with faeces, urine, or heat increment of feeding (Nau-mov and Chekunova, 1981; Hiby and Har-wood, 1985; Lavigne et al., 1985; Hokkanen, 1990). Such complex models require many
assumptions, but they can help to direct future research.
The use of anecdotal food intake data from captive animals (Sergeant, 1969; Hinga, 1979) is also an unreliable basis for estimating the food consumption of a population. The conditions in captivity may not reflect those in the wild, and values are often reported for particular days or months, usually for one or a few animals of unknown, or unreported characteristics or history.
Nonetheless, long-term food records of captive animals still provide the best (although rough) estimate of the annual energetic requirements of marine mammal populations (chapters 6.1 and 7.1). Regression lines through all data points of each species are shown for odontocetes (Fig. 1) and pinnipeds (Fig. 2). Due to the large sexual dimorphism, the food intake data in pinnipeds is shown both for males and females of each species. Food intake data of lactating females, when available, are also included. The number of animals per species and the locations where they were housed are shown in tables 1 and 2. The values are probably conservative estimates of consumption by wild conspecifics. A rough estimate of the annual food requirement of a marine mammal population, may be obtained by multiplying the average annual food intake of the species (Figs. 1 and 2) by the number of individuals in the population (as summarized for all pinnipeds by Reijnders et al., 1993). This method is only valid for annual estimates, as, especially in the pinnipeds, food intake may show strong seasonal variations.
When annual food intake requirements are met, this does not necessarily mean that the health and reproductive success of a population is assured. Particular groups within
624

Biological, husbandry, and wildlife management aspects
20000-1
Atlantic bottlenose dolphin Commerson's dolphin Common dolphin Harbour porpoise
35 40 Age (year)
Figure 1. The relationship between age and average annual food consumption per individual in 9 odontocete species (data from both non-reproductive and reproductive animals are included). The number of animals per species this figure is based on is shown in table 1.
14000 -i 1- Pacific walrus 2. Southern elephant seal 3. Steller sea lion
12000 -J 4- California sea lion
5. South American sea lion 6. South African fur seal 7. Grey seal 8. Harbour seal
10 12 14 16 18 20 22 24 26 Age (year)
Figure 2. The relationship between age and average annual food consumption per individual male and female in 8 pinniped species (data from both non-reproductive and reproductive animals are included). The number of animals per species this figure is based on is shown in table 2.
625

R.A. Kastelein
CD S. CO .£
o
e o
• a
o> A
T> C IS
•8
J3
C O
s o o
i 3 c
0
2 3 o
CO
CO E c CO
CD X3
(0 g) o CD a .
CO
CO T- o T - i - T - O T C O C O f ^ W ^ T - C M O O c \ i c \ i c \ i c \ i c \ i c \ i c \ i c \ i c v i c \ i c \ i c \ i
o CD O )^ .c *_ h ~ C O C O 0 O 0 O 0 O 0 O 0 O 0 ) 0 ) 0 ) 0 ) 0 ) 0 ) 0 ) 0 ) 0 ) 0 ) 0 ) 0 ) 0 ) 0 ) 0 ) 0 ) •— ^ ^ ^ ^ ^ ^ ^ ~
« _ . . . > . . . . , . . . C O C O C Q C Q C Q C Q C O C O
1 — " W •*•• * M 4W *-•• •«•* •»•* Q ) < D C 0 O < & V Q > ( D
ctztzccccc CD CD CD CD CD CD CD CD C D C D C D C D C D C D C D C D + - ' + i * - » + - ' + i * - ' ^ - ' + - » C O C O C O C O C O C O C O C O C O C O C O C O C O C O C O C O
• *
O) O)
^ „
CO •4-j Q)
c '5 <D
+ • ; co CO
O) CO O) T_
^ 00 00 0 ) 0 ) 0 )
CO 1 - T ~ > ^ . ^ • o to co c •*- •»— CO CD Q)
c c c CD CD CD CD CD CD *- - * - » * - < CO CO CO CO CO CO
^ ^ v ^ ^ ^ : ^ ^ ^ ^ ^ ^
( D I - I - ^ C O C O W C O O T - T - N
< CO 3
" D CO
II CD ~
SZ CO
CO - r j
>fc CO
CD O
5 co c a) • gw
o. co E r- CD CD
o 5 « co S g N 2 c N 0)
te S 15 p ) ^
CO " O C
IS ^ 55 = 0) • £ CO
? * 1 CD CO
SZ ' = > -P CO CD
- CO *= : * CO aj ' ? »- z
35i co .2 •» -s 3 .3 •5; •= co co c k-
5 * P 5 •« -fe -fe CO CO
I w CO JZ
co Q-CD o
w -S I* Q. jo 3 S o E
• f i E CO o X O
« -Jo CO *~ CD CO CO CO • = O
TJ .E .2- >-^ o ® Q.T3 .> O c *-•a 5 c * E 8 « E « 3 O
CO CO CO CO ®
.£ .£ ^ x: £ to Q. Q . I o o -s
"O "D CO CD CD CO
co co .92 ~ o -
c
o c © ©
o o ID 12
CO
Q O <
.2 JB 5 CD
o o -* 'c c ® c5« « < < U-
3 ^ 1
| I = "E O CO
CO cO CO - c
O) ,_ . 2 CD CD =
CO *
8 c ^ CO
^ " to Is ® CO . Q
._ c C 0 <
m "p. w§ o ® CO . £
p * i CO 1 0 CO © ffl CO CO SI sz 5 3 a> © 2 1
S ^
f « X
A,
T3 0) (A 3 0 01 } - )
01 5 in
"0 5 CA
< TJ 0) CA
Xi CO
(N cu ) H
J3 o 2
0 (A
Si '0 a> a, CA
0)
'2 c 'S. 01
CA
*<3 S s <8
0 l H
01 ^1 E 3
c ft tfl" 01
•J3
< T3 C <0
'C 1 tn
Ol
< ii
$ 3:
J5 u
1 .0
? cu CA
C H! U
'C
s
^ 3
& T3 C !8 CA
"5 01 CA
c
^ p-0> "3 E
3 0
1/3 01
£ 4 _ ,
0> 0
c
•Si 41 01
3 "5 « J! H 2
0 a . co O
CD 2 3 o
CO
w CO E c CO
CD ID E 3
CO
o CD Q.
CO
T- ; CV1 0 0 CO CO 0 0
o _
CO CO C O
CO CD CO •*-* c CO
JZ a. CD
0 ) CD t ffl >:
i - CM CO t • * • * ' • * • < *
CO
CM CM -<t CM i - i - CM
C
o CO CD
m
. _ 13 , 1 - O 00 O) O) O) O O) O) ^ T— ^
• * j —J —-: ca to co
* - » • - •*^ CD CD CD
C C C CD 'CD CD CD CD CD
* - » *-* 4-» W W W CO CO CO ^ ^ *:
o m oo o O) O) O) O) O) O) O) O) T— T— -T— T—
—-: - - — to to co co * - -*^ ^ M * -CD CD CD CD
C C C C CD CD CD 'ffl CD CD CD CD + - + - • • • - • + - « CO CO CO CO CO CO CO CO
^ ^ ^ x.
oo O) O) • < ~
• ^
CO t—1 CD
c 'CD 0 +* CO CO
^
oo
3
® CO
c Z CO
$ c 2 CO M~ ' • CO C CO
<D CO = _, - c w co
co < -I ^ S 3
co (5 I ^ CO CO O CO 2 Q.
o . . . . o ,
626

Biological, husbandry, and wildlife management aspects
a population, such as growing animals or females with calves, may require extra food, in particular seasons. If prey is not readily available in such seasons, owing to natural causes or fisheries, the population may be affected. Catch quota of important prey species may be required to allow for sufficient food for marine mammals during such periods.
Studies on food intake of marine mammals in oceanaria can also play an important role in indicating the factors which may influence food intake. In the wild, environmental parameters such as water temperature and prey species availability probably vary between seasons, years and locations. The interaction, therefore, between marine mammals and their prey may also fluctuate.
The use of food intake data of marine mammals in zoos to estimate food consumption of wild conspecifics has advantages over indirect methods but also has limitations. The advantages are: 1) The number of animals available can be
relatively large. 2) Animals can be studied for a number of
years. 3) Food intake can be monitored in all sea
sons. 4) Environmental data can be recorded or
determined. 5) Fewer assumptions are made than in oth
er indirect methods of estimation of food intake of wild populations.
The limitations are: 1) The environmental conditions, such as
air and water temperatures and water depth, in captivity usually differ from those in the wild.
2) The diet in captivity often differs from that in the wild, although this is not stable in the wild and often differs between animals, years and seasons.
3) The activity level may differ between wild and captive animals, owing to differences in available space, and the lower energy demands of feeding in captivity.
In conclusion, there are many problems associated with the accurate estimation of food consumption by marine mammals, and, ultimately, in the assessment of marine mammal-fishery interactions. So far, the best estimates for marine mammal food intake are based on long-term food intake records of captive animals, although most food intake and body weight data were recorded for husbandry and not for research purposes. Some problems may be overcome by the design of carefully controlled long-term feeding experiments on captive animals. Other questions may be answered by models which identify general principles related to food consumption and predator- prey interactions in marine ecosystems.
Future research International agreements on reduction in fish catch must be based on sound information, as the fishing industry is an important employer. Studies similar to those reported here on 9 odontocete and 8 pinniped species, should, in principle, be conducted on the other 57 odontocete species and 25 pinniped species, although some species, for instance the sperm whale (Physeter macrocephalus) and beaked whales (Ziphiidae), are difficult to keep. The more species studied, the more accurate the food intake can be predicted for species not kept in oceanaria. The present work shows that in order to understand the food intake of marine mammals, the food intake of growing and adult animals of both sexes, of all reproductive stages, must be studied over a long period of time and preferably under several environmental conditions.
627
R.A. Kastelein
The importance of weighing marine mammals at oceanaria cannot be emphasized enough. The value of a single measurement is low, and does not appear to warrant the often considerable effort required to obtain it. However, the present study could have been improved, had more weight measurements been available, so that the relationship between seasonal fluctuations in food intake and changes in body weight could have been studied.
Acknowledgements
I would like to thank Rob Triesscheijn for drawing the graphs, and Piet Wiepkema, Eleanor Hayes (University of Bristol, UK), Ed Keith (NOVA Southeastern University, U.S.A.), Nicole Schooneman, Carolien Staal and Janny Hardeman for their comments on the manuscript.
References
Bailey, K.M. and Ainley, D.G. (1981/1982) The dynamics of California sea lion preda-tion on Pacific Hake. Fish. Res. 1, 163- 176.
Bigg, M.A. and Fawcett, I. (1985) Two biases in diet determination of northern fur seals (Callorhinus ursinus). In: Marine mammals and fisheries (Eds. Beddington, J.R., Bever-ton, R.J.H. and Lavigne, D.M.). George Allen & Unwin Ltd., London, U.K., 284-291.
Bigg, M.A. and Perez, M.A. (1985) Modified volume: a frequency-volume method to assess marine mammal food habits. In: Marine mammals and fisheries (Eds. Beddington, J.R., Beverton, R.J.H. and Lavigne, D.M.). George Allen & Unwin Ltd., London, U.K., 277-283.
Castellini, M.A. (1987) Fuel homeostasis and organ function using single injection tracer techniques in marine mammals. In: Marine Mammal Energetics (Eds. Huntley, A.C., Costa, D.P., Worthy, G.A.J, and Castellini, M.A.). Society for Marine Mammalogy, Lawrence, KS, U.S.A., 1-13.
Condy, P.R. (1981) Annual food consumption, and seasonal fluctuations in biomass of seals at Marion Island. Mammalia 45(1), 21-30.
Bartholomew, G.A. (1970) A model for the evolution of pinniped polygyny. Evolution 24, 546-559.
Beddington, J.R., Beverton, R.J.H. and Lavigne, D.M. (1985) Problems in estimating food consumption. In: Marine mammals and fisheries (Eds. Beddington, J.R., Beverton, R.J.H. and Lavigne, D.M.). George Allen & Unwin Ltd., London, U.K., 273-275.
Beverton, R.J.H. (1985) Analysis of marine mammal-fisheries interaction. In: Marine mammals and fisheries (Eds. Beddington, J.R., Beverton, R.J.H. and Lavigne, D.M.). George Allen & Unwin Ltd., London, U.K., 3-33.
Costa, D.P. (1987) quantifying material free-ranging marine Mammal Energetics Costa, D.P., Worthy, M.A.). Society for Lawrence, KS, U.S.A.
Isotopic methods for and energy intake of mammals. In: Marine (Eds. Huntley, A.C., G.A.J, and Castellini,
Marine Mammalogy, ., 43-66.
Davis, R.W. (1987) Measurement of protein metabolism in naturally fasting phocids. In: Marine Mammal Energetics (Eds. Huntley, A.C., Costa, D.P., Worthy, G.A.J, and Castellini, M.A.). Society for Marine Mammalogy, Lawrence, KS, U.S.A., 15-28.
628

Biological, husbandry, and wildlife management aspects
Fay, F.H., Feder, H.M. and Stoker, S.W. (1977) An estimation of the impact of the Pacific Walrus population on its food resources in the Bering sea. U.S. Department of Commerce, National Technical Information Service, Springfield, Va. (Mar. Mamm. Comm. report MMC-75/06 and MMC- 74/ 03).
Ferrero, R.C. and Fritz, L.W. (1994) Comparisons of Walleye Pollock, Theragra chalco-gramma, Harvest to Steller Sea Lion, Eumeto-pias jubatus, Abundance in the Bering Sea and Gulf of Alaska. NOAA Techn. Mem. NMFS-AFSC-43. U.S. Dept. of Commerce. 25 pp.
Hiby, A.R. and Harwood, J. (1985) The effects of variation in population parameters on the energy requirements of a hypothetical grey seal population. In: Marine mammals and fisheries (Eds. Beddington, J.R., Beverton, R.J.H. and Lavigne, D.M.). George Allen & Unwin Ltd., London, U.K., 337-343.
Hinga, K.R. (1979) The food requirements of whales in the southern hemisphere. Deep-Sea Research, 26A, 569-577.
Hokkanen, J.E.I. (1990) Temperature regulation of marine mammals. J. Theor. Biol. 145, 465-485.
Hutchinson, J.D. (1996) Fisheries Interactions: The Harbour Porpoise- a Review. In: Conservation of Whales and Dolphins (Eds. Simmons, M.P. and Hutchinson, J.D.). John Wiley & Sons Ltd., London, 129-165.
Innes, S., Lavigne, D.M., Earle, W.M. and Kovacs, K.M. (1987) Feeding rates of seals and whales. Journal of Animal Ecology 56, 115-130.
Kastelein, R.A. and Vaughan, N. (1989: chapter 2.1) Food consumption, body measurements and weight changes of a female Killer whale (Orcinus orca). Aquatic Mammals 15(1), 18-21.
Kastelein, R.A., Vaughan, N. and Wiepke-ma, P.R. (1990 a: chapter 4.1) The food consumption of Steller sea lions (Eumetopias jubatus). Aquatic Mammals 15(4), 137-144.
Kastelein, R.A., Verhoeven, I. and Wiepke-ma, P.R. (1990 b: chapter 4.4) The food consumption of South African fur seals (Arcto-cephalus pussilus) in the Harderwijk Marine Mammal Park. Int. Zoo Yearb. 29, 175-179.
Kastelein, R.A., Wiepkema, P.R. and Vaughan, N. (1990 c: chapter 3.2) The food consumption of Grey seals (Halichoerus grypus) in human care. Aquatic Mammals 15(4), 171-180.
Kastelein, R.A., Kershaw, J. and Wiepkema, P.R. (1991: chapter 3.1) The food consumption of Southern elephant seals (Mirounga leonina). Aquatic Mammals 17(2), 76-87.
Kastelein, R.A., McBain, J., Neurohr, B., Mohri, M., Saijo, S., Wakabayashi, I. and Wiepkema, P.R. (1993: chapter 2.11) The food consumption of Commerson's dolphins (Cephalorhynchus commersonii). Aquatic Mammals 19(2), 99-121.
Kastelein, R.A., Ford, J, Berghout, E., Wiepkema, P.R. and Boxsel, M. van (1994: chapter 2.4) Food consumption, growth and reproduction of Belugas (Delphinapterus leucas) in human care. Aquatic Mammals 20(2), 81-97.
629

R.A. Kastelein
Kastelein, R.A., Kershaw, J., Berghout, E. and Wiepkema, P.R. (1995: chapter 4.2) The food consumption of South American sea lions (Otaria flavescens). Aquatic Mammals, 21(1), 43-53.
Kastelein, R.A., Hardeman, J. and Boer, H. (1997: chapter 2.13) Food consumption and body weight of harbour porpoises (Phocoena phocoena). In: The biology of the harbour porpoise (Eds. Read, A.J., Wiepkema, P.R. and Nachtigall, P.E.). De Spil Publishers, Woer-den, The Netherlands, 217-233.
Kastelein, R.A. (1998 a, chapter 6.1) Parameters determining the food intake of odon-tocetes (toothed whales): a general discussion.
Kastelein, R.A. (1998 b, chapter 7.1) Parameters determining the food intake of pinnipeds: a general discussion.
Kastelein, R.A., Elst, C.A. van der, Tennant, H.K. and Wiepkema, P.R. (1998 c, chapter 2.10) Food consumption, growth, body dimensions and body temperatures of a female dusky dolphin (Lagenorhynchus obscu-rus).
Kastelein, R.A., Kershaw, J., Berghout, E. and Wiepkema, P.R. (1998 d: chapter 2.3) Food consumption and suckling of killer whales (Orcinus orca).
Kastelein, R.A., Neurohr, B., Nieuwstraten, S.H. and Wiepkema, P.R. (1998 g: chapter 2.8) Food consumption and body measurements of Amazon river dolphins (Inia geof-frensis).
Kastelein, R.A., Nieuwstraten, S.H., Walton, S. and Wiepkema, P.R. (1998 h: chapter 2.7) Food consumption, growth of Atlantic bot-tlenose dolphins (Tursiops truncatus).
Kastelein, R.A., Schooneman, N.M., Vaugh-an, N. and Wiepkema, P.R. (1998 i: chapter 4.3) Food consumption and growth of California sea lions (Zalophus californianus).
Kastelein, R.A., Schooneman, N.M. and Wiepkema, P.R. (1998 j : chapter 5.1) Food consumption and growth of Pacific walruses (Odobenus rosmarus divergens).
Kastelein, R.A., Staal, C. and Wiepkema, P.R. (1998 k: chapter 2.6) Food consumption and growth of Atlantic bottlenose dolphins (Tursiops truncatus).
Kastelein, R.A., Staal, C. and Wiepkema, P.R. (1998 1: chapter 3.3) Food consumption and growth of harbour seals (Phoca vitulina).
Kastelein, R.A., Walton, S., Odell, D., Nieuwstraten, S.H. and Wiepkema, P.R. (1998 m: chapter 2.2) Food consumption of a female killer whale (Orcinus orca).
Kastelein, R.A., Macdonald, G.J. and Wiepkema, P.R. (1998 e: chapter 2.9) Food consumption and growth of common dolphins (Delphinus delphis).
Kastelein, R.A., Mosterd, J., Schooneman, N.M. and Wiepkema, P.R. (1998 f: chapter 2.5) Food consumption, growth, body dimensions and respiration rate of false killer whales (Pseudorca crassidens).
Kajimura, H. (1985) Opportunistic feeding by the northern fur seal, (Callorhinus ursi-nus). In: Marine mammals and fisheries (Eds. Beddington, J.R., Beverton, R.J.H. and Lavigne, D.M.). George Allen & Unwin Ltd., London, U.K. 300-318.
630

Biological, husbandry, and wildlife management aspects
Lavigne, D.M., Barchard, W.W., Innes, S. and 0ritsland, N.A. (1982) Pinniped bioener-getics. In: Mammals in the seas. Vol. IV. Small cetaceans, seals, sirenians and otters. FAO Fisheries Ser. 5, 191-235.
Lavigne, D.M., Innes, S., Stewart, R.E.A. and Worthy, G.A.J. (1985) An annual energy budget for north-west Atlantic harp seals. In: Marine mammals and fisheries (Eds. Beddington, J.R., Beverton, R.J.H. and Lavigne, D.M.). George Allen & Unwin Ltd, London, 319-336.
Lowry, L.F. and Frost, K.J. (1981) Feeding and trophic relationships of phocid seals and walruses in the eastern Bering Sea. In: The eastern Bering Sea shelf: oceanography and resources. Vol 2. (Eds. Hood, D.W. and Calder, J.A.). University of Washington Press, Seattle, WA, 813-824.
Lowry, L.F. and Frost, K.J. (1985) Biological interactions between marine mammals and commercial fisheries in the Bering Sea. In: Marine mammals and fisheries (Eds. Beddington, J.R., Beverton, R.J.H. and Lavigne, D.M.). George Allen & Unwin Ltd., London, U.K., 41-61.
Murie, D.J. (1987) Experimental approaches to stomach content analyses of piscivorous marine mammals. In: Marine Mammal Energetics (Eds. Huntley, A.C., Costa, D.P., Worthy, G.A.J, and Castellini, M.A.). Society for Marine Mammalogy, Lawrence, KS, U.S.A., 147-163.
Murie, D.J. and Lavigne, D. M. (1985) Digestion and retention of Atlantic herring otoliths in the stomachs of grey seals. In: Marine mammals and fisheries (Eds. Beddington, J.R., Beverton, R.J.H. and Lavigne, D.M.). George Allen & Unwin Ltd., London, U.K., 292-299.
Naumov, A.G. and Chekunova, V.I. (1981) Energy Requirements of Pinnipeds (Pinni-pedia). Oceanology 20(3), 348-350.
0ritsland, N.A. and Markussen, N.H. (1990) Outline of a physiologically based model for population energetics. Ecological Modelling 52, 267-288.
Overholtz, W.J., Murawski, S.A. and Foster, K.L. (1991) Impact of predatory fish, marine mammals, and seabirds on the pelagic fish ecosystem of the northeastern USA. ICES Mar. Sci. Symp., 193, 198-208.
Pierce, G.J., Boyle, P.R., Watt, J. and Grisley, M. (1993) Recent advances in diet analysis of marine mammals. Symp. Zool. Soc. Lond. 66, 241-261.
Prime, J.H. and Hammond, P.S. (1987) Quantitative assessment of gray seal diet from faecal analysis. In: Marine Mammal Energetics (Eds. Huntley, A.C., Costa, D.P., Worthy, G.A.J, and Castellini, M.A.). Society for Marine Mammalogy, Lawrence, KS, U.S.A., 165-181.
Rae, B.B. (1960) Seals and Scottish Fisheries. Mar. Res. 2, 1-39.
Rae, B.B. (1968) The Food of Seals in Scottish Waters. Mar. Res. 2, 1-23.
Reijnders, P., Brasseur, S., Toorn, J. van der, Wolf, P. van der, Boyd, I., Harwood, J., Lavigne, D. and Lowry, L. (1993) Status Survey and Conservation Action Plan. Seals, Fur Seals, Sea Lions, and Walrus. IUCN publication, Gland, Switzerland, 88 pp.
Sergeant, D.E. (1969) Feeding rates of Ceta-cea. Fisk. Dir. Skr. Ser. Hav. Unders., 15, 246-258.
631

R.A. Kastelein
Sergeant, D.E. (1973) Feeding, growth, and productivity of Northwest Atlantic Harp Seals (Pagophilus groenlandicus). J. Fish. Res. Board Can. 30, 17-29.
Worthy, G.A.J. (1990) Nutritional energetics of marine mammals. In: Handbook of Marine Mammal Medicine: Health, Disease and Rehabilitation (Ed. Dierauf, L.A.). CRC Press, Boston, 489-520.
Worthy, G.A.J., Innes, S., Braune, B.M. and Stewart, R.E.A. (1987) Rapid Acclimation of Cetaceans to an Open-System Respirometer. In: Marine Mammal Energetics (Eds. Huntley, A.C., Costa, D.P., Worthy, G.A.J, and Castellini, M.A.). Allen Press, Lawrence, KS, U.S.A., 115-126.
632

Summary
This thesis contains 35 studies on food consumption and growth of captive marine mammals. Seventeen studies concern food intake and growth records of 9 odontocete species (toothed whales), varying in body weight from 30 to 4500 kg: the killer whale, beluga, false killer whale, Atlantic bottle-nose dolphin, Amazon river dolphin, common dolphin, dusky dolphin, Commerson's dolphin, and the harbour porpoise (chapter 2). The other eighteen studies concern 8 pinniped species (true seals, sea lions, and walruses), in which the adult male body weight varied between 110 and 1400 kg, and adult female weight between 70 and 800 kg: the Southern elephant seal, grey seal, harbour seal, Steller sea lion, South American sea lion, California sea lion, South African fur seal, and Pacific walrus (chapters 3,4, and 5). In each study, the results were compared to available information on food consumption and growth of wild and captive conspecif ics, and were considered with respect to the life histories of the species.
In overview chapters on odontocetes (chapter 6) and pinnipeds (chapter 7), food intake of species of the 2 groups are compared at 3 levels: differences in average daily food consumption between species, differences between annual intake of conspecif ic individuals, and monthly fluctuations. In the final chapter, food intake data is considered in the light of the general life histories of pinnipeds and odontocetes, and the value of the food records for husbandry and wildlife management is discussed (chapter 8).
Odontocetes (chapters 2 and 6)
Comparison of average daily food intake between species Factors, such as water temperature and energy content of the diet, did not appear to be the main factors causing differences in aver
age daily food intake between individuals of similar body weight, but different species. Species specific characteristics such as body shape, body composition (especially blubber thickness), insulating quality of the blubber (lipid content), and general activity level also contributed to the observed differences. The role of these parameters is briefly discussed.
The average daily food intake of the 9 odontocete species appears to allow a rough prediction of the average daily food intake of an unstudied species, on the basis of body weight. For a more precise estimate, information is needed on environmental conditions and species specific biological factors, such as foraging techniques, quantified activity levels, body shape, and blubber layer thickness. Measurement of body surface, especially that of the appendages is also important. Information on these biological factors, however, was not complete for the 9 species studied.
Comparison of annual food intake of conspecifics Three species (Commerson's dolphin, Atlantic bottlenose dolphin, and the killer whale) were discussed in some detail (chapters 2.1, 2.2, 2.3, 2.6, 2.7, 2.11, and 2.12). The annual food intake differences during the first few years of life appear to be influenced by differences in the weaning process. Food consumption depends also on the growth phase. Growing animals need more food than adults of the same body weight. No systematic differences in food intake were found between the sexes in any of the 3 species.
Food intake of males decreased for only a few days during the mating period, that of females did not increase during gestation. In Commerson's dolphins, annual food intake of lactating females did not usually appear to increase. However, in this species annual
633

food intake is too crude a measure to allow these extra energy requirements to be observed. In bottlenose dolphins, annual food intake of adults reached a plateau, but intake of lactating females was above this level. In the killer whale, however, lactation was not clearly reflected in annual food records, as food intake in females continued to increase up to 20 years of age.
Animals of the same age, gender, and reproductive state, under the same environmental conditions, and on the same diet, may differ in annual food intake, owing to constitutional differences in body weight and the insulating value of the blubber layer. Anecdotal information indicates a positive relationship between general activity level and food intake. Health had a strong influence on food intake, while changes in social situation may also affect food intake.
Comparison of monthly food intakes of individuals Seasonal fluctuations in food intake are not typical of odontocetes. In 5 of the 9 species in which such a fluctuation was observed, it was in 2 cases (bottlenose dolphins and killer whales) caused by a seasonal feeding schedule and in 2 cases (Commerson's dolphins at some parks and the dusky dolphin) appeared to be related to seasonal water temperature fluctuations. In only 2 cases (belugas and Commerson's dolphins at some parks), seasonal fluctuations appeared to be caused by an endogenous rhythm.
Pinnipeds (chapters 3, 4, 5, and 7)
Comparison of average daily food intake between species True seals (phocids) had a lower food consumption as a percentage of body weight than eared seals (otariids) of similar body weight. The proportional food intake of wal
ruses (odobenids) was intermediate. As the basal metabolic rates of phocids, otariids and odobenids are similar, differences in food intake must be due to characteristics such as the lower total body surface to volume ratio of the true seals, caused by their relatively small appendages. Although also dependent on sex and time of year, the proportion of blubber in the total body mass is generally higher in true seals than in eared seals of similar body weight. Eared seals also have a higher general activity level than true seals.
Comparison of annual food intake ofconspecifics In all pinniped species studied, individuals of the same age showed relatively large differences in annual food consumption. External factors, such as water temperature and calorific density of the diet, were similar within species, as each was only kept at one park. The differences, therefore, were probably caused mainly by factors such as the weaning process, growth phase, gender, reproductive status, constitutional differences, general activity level or haul-out behaviour.
The weaning process of the phocids differs greatly from that of the otariids and odobenids: in phocids, the suckling period is short (3-6 weeks), growth rate of the pup during the suckling period is high (several kg/day, mainly blubber), in most species the mother does not eat during the suckling period, and weaning is abrupt. In the otariids and odobenids, the suckling period is much longer (at least 6 months), the growth rate of the pup is low (several kg/week), the mother eats during the suckling period, and weaning is usually a gradual process.
Phocid pups do not receive any parental care after weaning: instead they develop a fat reserve during the suckling period,
634

Summary
which provides them with energy during the development of independent survival behaviour. During the suckling period, the low activity levels of both mother and pup conserve energy. The advantage of this reproductive strategy is that the mother must protect the pup for only 3-6 weeks, and the pup's thermal energy requirements are low soon after birth, due to the lanugo fur, the rapid development of a thick blubber layer, and the passive terrestrial lifestyle. The mother, however, may lose much body weight during the suckling period and requires large amounts of food immediately after weaning to quickly restore her fat reserves.
Otariid pups and, to a larger degree, walrus pups, receive maternal care for a much longer period than phocid pups. The activity level of both mother and pup is much higher during the suckling period than that in pho-cids. The advantage of this reproductive strategy for the mother is that she loses less weight, as she can eat during most of the suckling period. She must, however, protect her pup for longer than a phocid mother. As otariid and odobenid pups enter the water at an early age, when the blubber layer is still thin, and the body surface area/volume ratio relatively high, the thermal energy requirements of the pups remain high for a long period.
Sexual dimorphism was most pronounced in those species in which the males are territorial during the breeding season, and became more pronounced during puberty, when the males underwent a secondary growth spurt. Rapid increases in food intake coincided with these growth spurts. Sexual dimorphism in body weight and food intake was substantial in all species except the harbour seal, in which males do not defend territories on land.
Comparison of monthly food intakes of individuals In the reproductive period, the food intake of all males showed a large decrease, with the exception of the harbour seal. The animals compensated for this reduced intake by higher intake during the rest of the year. Although not quantified, this pattern is also observed in wild polygynous pinnipeds, although adult males in the present study reduced their food intake, whereas adult wild males fasted during the, sometimes 3 month, mating season. In polygynous species, adult males consume more before the breeding season and store energy in the form of blubber. This energy is required to support the high activity level and fasting during the breeding season. Afterwards, the blubber layer is restored over varying periods of time in the different species. The degree of food reduction in male pinnipeds, was expressed as the total voluntary reduction in food intake during the breeding season. The 8 pinniped species show a positive relationship between the level of dimorphism (based on body weight) and the degree of voluntary food reduction. This suggests that the higher the degree of dimorphism, the more energy the male can invest in mating and defending his territory.
Female pinnipeds usually increase their blubber layer during gestation, reducing thermal energy requirements, which may explain why food intake does not increase during gestation. Female pinnipeds fast, but for much shorter periods than the males. Phocid females of, for instance the Southern elephant seal and the grey seal, do not feed during the 3 week suckling period, when they seldom, or never, leave the suckling area. Even when fed ad lib., grey seal females hardly eat during the suckling period, and lose large amounts of weight. In contrast, harbour seal females forage for most of the
635

4-6 week suckling period. Otariid females and their pups undergo intermittent periods of fasting during lactation, although for considerably shorter periods than phocids. Otariid females usually nurse their pup for periods of 2 to 3 days, during which time they do not feed. The mother then goes to sea to feed for about 4 days, during which time the pup fasts. These alternating periods of feeding and fasting continue throughout the nursing period, which may last for 6 to 24 months. Odobenids eat throughout the suckling period, as the pups swim with their mothers during foraging.
Fluctuations in food intake of the studied pinnipeds are presumably caused by endogenous circannual rhythms. In contrast to wild conspecifics, which stay on land during the breeding period and thus cannot catch fish, the animals in the present study were fed ad lib., all year round. The reduction in food intake, despite the availability of food, occurring during the same months as in wild conspecifics, suggests that the need for food is reduced during that period by endogenous factors.
In captivity, many pinnipeds appear to reduce food intake or stop eating altogether during the moulting period, when they spend a large proportion of time ashore. However, the present study suggests that this is not always the case, as reproducing females showed no decrease in food intake during moult. Moult appeared to have less effect on the food intake than would be expected from observations in the wild. Possibly the time spent on land prevents wild animals from foraging, while, when offered food in captivity, they continued to eat, although the males at a lower level.
Food intake in relation to natural history (chapter 8)
Food intake differences between odonto-cetes and pinnipeds, in terms of seasonality and gender, are closely related to ecological differences between the 2 groups: odonto-cetes are completely aquatic, whereas pinnipeds lead an amphibious life.
Pinnipeds spend a significant portion of time on shore, where they breed (pupping, mating, and suckling), moult, and rest. As they can haul out only next to water, and suitable haul-out sites are often scarce, the probability of intra-specific competition for these limited areas is high. In some species this has resulted in the evolution of large, sexually dimorphic males, with larger males having a higher reproductive success. A combination of climatic and biological factors such as food availability and predation, may have favoured pupping over short and at specific times of year, and at appropriate seashore sites. This is related to the mono-estrous reproduction in pinnipeds. When territorial males defend territories and harems, they do not go to sea to feed. In order to fast for weeks or months, they store energy in the form of blubber before the start of the breeding season. This causes not only their food intake, but also their body weight to fluctuate seasonally. Fluctuations occur also in females, which lose body weight during lactation; this is most pronounced in some phocid females, such as the Southern elephant seal and grey seal, which do not feed for the 3 weeks of lactation. In other phocids, like the harbour seal, the otariids and odobenids, however, females eat during the suckling period.
Odontocetes spend their entire lives in the water, where seasonal temperature changes are less pronounced than in air. Because
636

Summary
there appear to be no seasonally limited resources, the probability of intra-specific competition is low, reducing the pressure for sexual dimorphism which was relatively low in the studied odontocetes, except in the killer whale. Owing probably to the small seasonal differences in prey availability and water temperature, odontocetes such as the bottlenose dolphin are polyoestrus, and ovulate at various times of year. This implies that mating and calving do not result in a systematic seasonal food intake pattern.
In general, the range of food intake of pinnipeds, expressed as a percentage of body weight, overlaps the range for odontocetes of similar weight quite well. In both orders lighter animals consume relatively much in relation to their body weight. In comparison to heavier animals, these animals must eat more often, so require a more constant availability of food and / o r spend more time foraging.
Significance for husbandry (chapter 8)
Food records of marine mammal species in captivity may contribute to their well-being and care. As, however, environmental parameters may differ between parks, the food intake data presented in this thesis should not be treated as standard values for all individuals of a species. Moreover, large differences in food intake are apparent between animals of the same sex, similar age, reproductive status, and activity level, even when kept under the same environmental conditions.
Deviations from their baseline levels of food intake can be important indicators of the behavioral and physiological state of animals. Decreases can be caused by factors such as illness, social problems, oestrus in females, the onset of the breeding season in
males, the approach of birth, or the end of the lactation period. A lower activity level, a higher proportion of time spent hauled-out, an increase in water or air temperature or an increase in calorific density of the diet may also reduce food intake. Increases in food intake may indicate the beginning of lactation, a growth spurt, often observed during sexual maturation, or the end of the breeding season. A higher activity level, a larger proportion of time being spent in the water, a decrease in water or air temperature or a decrease in calorific density of the diet may also cause an increase in food intake.
Significance for wildlife management (chapter 8)
The best estimate of the annual energetic requirements of a marine mammal population can be provided by long-term food records of captive animals, as presented here. These estimates are probably conservative, as applied to wild conspecifics. To obtain a rough estimate of the annual food requirement of a population, it may suffice simply to determine the number of individuals in the group, and multiply this by the average annual food intake for the species shown in this study (chapter 8). This method is only valid for annual estimates, as, especially in the pinnipeds, food intake may show considerable seasonal variation. In pinnipeds, the sexual composition of a population needs to be known as well, as the sexes are often dimorphic, resulting in large differences in annual food intake.
When annual food intake requirements are met, the health and reproductive success of a population is not necessarily assured. Particular groups within a population, especially growing animals and females with calves, may require extra food in a particular season. If prey is not readily available in such
637

periods, through natural causes or the impact of fisheries, the population may be adversely affected. Catch quota of important prey species, therefore, may be required to allow for sufficient food for marine mammals during such periods.
The use of food intake data of captive marine mammals to estimate food consumption of wild conspecifics has advantages over indirect methods, but also has limitations. The advantages are that the number of animals available can be relatively large, the animals can be followed over a number of years, food intake can be monitored during all seasons,
the characteristics of the environment can be recorded/set, and the number of assumptions is much lower than used in other indirect methods to estimate the food intake of a wild marine mammal population. The limitations are that the environmental conditions in captivity usually differ from those in the wild (for example air and water temperatures and water depth), the diet in captivity often differs from that in the wild, and the activity level may differ between wild and captive animals, due to differences in available space, and the less energy demanding way of feeding in captivity.
638

Samenvatting
Dit proefschrift bevat 35 studies over voed-selverbruik en groei van zeezoogdieren in dierentuinen. Zeventien daarvan betreffen 9 soorten odontoceten (tandwalvissen) varie-rend in lichaamsgewicht tussen 30 en 4500 kg, te weten: de orka, de beluga (witte wal-vis), de Atlantische tuimelaar, de Amazone dolfijn, de gewone dolfijn, de donkerges-treepte dolfijn, de Commerson dolfijn en de bruinvis (hoofdstuk 2). Achttien studies gaan over 8 soorten vinpotigen (zeehonden, zeeleeuwen en walrussen) waarvan het lichaamsgewicht van de volwassen man-netjes tussen de soorten varieerde van 110 tot 1400 kg, en dat van volwassen vrouwtjes tussen 70 en 800 kg. De volgende soorten zijn bestudeerd: de Zuidelijke zeeolifant, de grijze zeehond, de gewone zeehond, de Steller zeeleeuw, de Zuid Amerikaanse zee-leeuw, de Californische zeeleeuw, de Zuid Afrikaanse zeebeer en de Pacifische walrus.
Daarnaast zijn de resultaten vergeleken met informatie over het voedselverbruik en de groei van soortgenoten in andere parken en in de natuur. Verder zijn de gegevens in het "natuurhistorisch" perspectief van de soort gezet (hoofdstuk 3, 4 en 5).
In de overzichtshoofdstukken, een over tandwalvissen (hoofdstuk 6) en een over vinpotigen (hoofdstuk 7), wordt het voedselverbruik van de soorten binnen elke groep op 3 niveaus vergeleken: verschillen in gemiddeld dagelijks voedselverbruik tussen soorten, verschillen in jaarlijkse opname tussen soortgenoten van dezelfde leeftijd, en maandelijkse fluctuaties gedurende het jaar per dier. In het laatste hoofdstuk wordt het voedselverbruik van de tandwalvissen en vinpotigen in het perspectief gezet van hun globale "natuurlijke historie". Ook het be-lang van voedsel- en groeigegevens voor de houderij en natuurbeheer wordt hierin be-sproken (hoofdstuk 8).
Odontoceten (hoofdstuk 2 en 6)
Vergelijking van het gemiddeld dagelijks voedselverbruik tussen soorten Factoren zoals watertemperatuur en calo-rische waarde van het dieet, bleken niet de belangrijkste oorzaken te zijn van de verschillen in voedselverbruik tussen indivi-duen van verschillende soorten met een ver-gelijkbaar gewicht. Soortspecifieke eigen-schappen zoals lichaamsvorm, lichaamssa-menstelling (vooral vetdikte), isolerend vermogen van het vet (lipide gehalte) en algemeen activiteitsniveau droegen in be-langrijke mate bij tot de waargenomen verschillen in voedselopname. De invloed van deze eigenschappen is besproken.
Het gemiddelde dagelijkse voedselverbruik van de 9 soorten tandwalvissen maakt het mogelijk om een ruwe schatting te maken van wat een nog niet bestudeerde soort tandwalvis ongeveer dagelijks zou moeten eten, uitgaande van het lichaamsgewicht. Voor een meer nauwkeurige schatting is echter informatie nodig over de omgevings-factoren en de soortspecifieke eigenschappen, zoals foerageertechniek, activiteitsniveau, lichaamsvorm en vetlaagdikte. Ook het lichaamsoppervlak, vooral dat van de extre-miteiten, is belangrijk. Informatie over deze biologische factoren van de 9 bestudeerde soorten was niet compleet.
Vergelijking van jaarlijkse voedselopnames tussen soortgenoten De voedselopnames bij drie soorten tandwalvissen (de Commerson dolfijn, de Atlantische tuimelaar en de orka), zijn in meer detail beschreven in hoofdstuk 2.1, 2.2, 2.3, 2.6, 2.7, 2.11 en 2.12. De verschillen in jaarlijkse voedselopname gedurende de eerste paar jaar van het leven lijken vooral te zijn veroorzaakt door verschillen in het speen-proces. De hoeveelheid die een dier eet
639

hangt verder onder andere af van de groei-fase waarin het zich bevindt. Groeiende die-ren hebben meer voedsel nodig dan volwas-sen dieren met hetzelfde lichaamsgewicht. Er zijn geen systematische verschillen ge-vonden in het voedselverbruik tussen de geslachten in elk van de drie genoemde soorten.
De voedselopname van mannetjes vermin-derde slechts tijdens een paar dagen gedu-rende de paartijd. Dracht had geen invloed op voedselopname van de vrouwtjes. Bij de Commerson dolfijnen nam het jaarlijkse voedselverbruik van de vrouwtjes niet toe in jaren waarin ze jongen zoogden. Jaarop-name is een te grove eenheid om de extra energiebehoefte tijdens lactatie van deze soort zichtbaar te maken. Bij de tuimelaar bereikte de voedselopname van alle volwas-sen dieren een plateau. De jaarlijkse voedselopname van lacterende vrouwtjes lag echter boven dit niveau. Bij de orka werd lactatie niet duidelijk in de jaarlijkse voedselopname weerspiegeld, aangezien het voedselverbruik van orka's jaarlijks toe-neemt tot een leeftijd van minstens 20 jaar.
Dieren van gelijke leeftijd, geslacht, repro-duktieve staat, die onder gelijke omstan-digheden gehuisvest waren en hetzelfde dieet hadden, vertoonden soms sterke verschillen in jaarlijkse voedselopname, als ge-volg van verschillen in gestel, zoals lichaamsgewicht en /of isolatiewaarde van de vetlaag. Anekdotische informatie wijst op een positieve relatie tussen algemeen activ-iteitsniveau en voedselopname. Gezond-heid beinvloedt voedselopname sterk. Daar-naast kunnen veranderingen in de sociale situatie invloed hebben op de voedselopname.
Vergelijking van maandelijkse voedselopnames per dier Seizoensfluctuaties in voedselopname zijn niet typisch voor tandwalvissen. Bij 5 van de 9 soorten waar seizoensfluctuaties zijn waargenomen, werd dit bij twee soorten ve-roorzaakt door het voedingsschema (tuimelaar en orka), bij twee soorten bleek het sa-men te hangen met temperatuurschommel-ingen van het water (Commerson dolfijn en donkergestreepte dolfijn), en in 2 gevallen leken de veranderingen in voedselopname veroorzaakt te worden door een endogeen ritme (beluga en Commerson dolfijn).
Vinpotigen (hoofdstuk 3, 4, 5, en 7)
Vergelijking van het gemiddeld dagelijks voedselverbruik tussen soorten Zeehonden (Phocidae) eten gemiddeld minder voedsel per kg lichaamsgewicht dan zeeleeuwen (Otariidae) van gelijk lichaamsgewicht. De voedselopname van walrussen ligt tussen die van de zeehonden en zeeleeuwen in. Omdat het basaal metabolisme van zeehonden en zeeleeuwen gelijk is, moeten de verschillen in voedselopname door andere factoren veroorzaakt worden. Zeehonden hebben een kleiner lichaamsoppervlak ten opzichte van hun volume dan zeeleeuwen, door hun relatief kleine extremiteiten. Afhankelijk van geslacht en seizoen, is de totale hoeveelheid vet in het lichaam van zeehonden in het algemeen hoger dan bij zeeleeuwen van gelijk gewicht. Zeeleeuwen zijn bovendien beweeglijker dan zeehonden.
Vergelijking van jaarlijks voedselverbruik tussen soortgenoten Tussen individuen van elke soort kwamen relatief grote verschillen voor in de jaarlijkse voedselopname. Omdat iedere diersoort slechts in een park gehouden werd, waren de externe factoren (watertemperatuur en
640

Samenvatting
calorische waarde van het dieet) gelijk per diersoort. De verschillen zijn dus waar-schijnlijk hoofdzakelijk veroorzaakt door biologische factoren, zoals spenen, groei-fase, geslacht, voortplantingsfase, verschillen in lichaamsbouw, algemeen activiteit-sniveau en/of de hoeveelheid tijd die een dier op het land doorbrengt.
Er bestaan grote verschillen in de speenproc-essen van enerzijds zeehonden en ander-zijds zeeleeuwen en walrussen. Bij zeehonden is de zoogperiode kort (3-6 weken) en de zogende jongen groeien zeer snel (enkele kg /dag; voornamelijk vet). Tijdens de zoogperiode eten de moeders niet en het spenen is abrupt. Bij zeeleeuwen en walrussen du-urt de zoogperiode aanzienlijk langer (min-stens 6 maanden) en verloopt de groei van het jong geleidelijk (enkele kg/week). De moeders eten tijdens de zoogperiode en het spenen is een geleidelijk proces.
Jonge zeehonden bouwen tijdens de zoogperiode een vetreserve op, zodat ze tijd heb-ben om onafhankelijk van hun moeders, overlevingsgedrag te ontwikkelen. Tijdens de zoogperiode is het activiteitsniveau van zowel de moeder als het jong laag, hetgeen energie bespaart. Het voordeel van deze voortplantingsstrategie voor de moeder is dat ze slechts enkele weken een jong hoeft te beschermen. Daarbij komt dat energiebe-hoefte voor de warmtehuishouding bij het jong laag is door een lanugo vacht, en de snelle opbouw van een dikke vetlaag en om-dat het op het land leeft tijdens de zoogperiode. Voor de moeder is het nadeel van deze strategie dat ze veel lichaamsgewicht ver-liest tijdens de zoogperiode en daarom on-middellijk na het spenen grote hoeveelhe-den voedsel nodig heeft om haar vetreserves weer aan te vullen.
Jongen van zeeleeuwen en, in grotere mate,
van walrussen worden veel langer door hun moeders verzorgd. Het activiteitsniveau van moeder en pup tijdens de zoogperiode is hoger dan bij zeehonden. Het voordeel van deze voortplantingsstrategie voor de moeder is dat ze minder gewicht verliest omdat ze eet tijdens de zoogperiode, met uitzondering soms van de eerste week na de geboorte. De moeders hebben dus geen grote hoeveelheden voedsel nodig na het spenen om vetreserves weer op te bouwen. Nadeel van deze strategie voor de moeders is dat ze hun jongen gedurende een lange periode moeten beschermen. Bovendien gaan jonge zeeleeuwen en walrussen kort na de geboorte, als de vetlaag nog dun is en de verhouding lichaamsoppervlak/lichaams-volume relatief hoog is, al het water in, waardoor de energiebehoefte van de jongen voor thermoregulatie gedurende een relatief lange periode groot is.
Geslachtelijk dimorfisme in lichaamsgewicht en -grootte was het opvallendst bij die soorten die tijdens het paringsseizoen terri-toriaal gedrag vertonen en komt vooral tot uiting vanaf de puberteit, wanneer de man-netjes een tweede groeispurt doormaken. Tijdens deze tweede groeispurt nam de voedselopname sterk toe. Dit geslachtelijk dimorfisme trad op in alle bestudeerde dier-soorten, behalve de gewone zeehond, waar-van de mannetjes geen territoriaal gedrag op het land vertonen.
Vergelijking van maandelijkse voedselopnames per dier Geslachtsrijpe mannelijke territoriale vinpo-tigen eten aanzienlijk minder gedurende het paringsseizoen. Deze achterstand in voedselopname wordt tijdens het resterende deel van het jaar ingehaald. Dit gedrag is ook waargenomen bij polygame vinpotigen in de natuur. In deze soorten eten volwassen mannetjes meer voor het paringsseizoen om
641

vet op te slaan als energiereserve. Door ver-hoging van het activiteitsniveau en het vas-ten verliezen ze veel gewicht tijdens het pa-ringsseizoen. Daarna vullen de mannetjes hun vetlaag weer aan gedurende een varie-rende periode. De mate waarin tijdelijk minder voedsel wordt opgenomen blijkt positief gecorreleerd te zijn met de mate van ges-lachtelijk dimorfisme (gebaseerd op li-chaamsgewicht). Dit suggereert dat hoe gro-ter de mate van dimorfisme, hoe meer ener-gie het mannetje kan investeren in het be-schermen van zijn territorium en paring.
Vrouwelijke vinpotigen krijgen meestal een dikkere vetlaag tijdens dracht, waardoor hun energiebehoefte voor thermoregulatie lager is. Wellicht neemt hierdoor hun voed-selopname tijdens dracht niet toe. Vrouwelijke vinpotigen vasten eveneens (tijdens de zoogperiode), maar korter dan mannelijke. Vrouwelijke zeehonden, zoals de Zuidelijke zeeolifant en grijze zeehond, eten niet tijdens de 3 weken durende zoogperiode en verlaten het zooggebied zelden of nooit. Zelfs als ze ad lib. gevoerd worden tijdens de zoogperiode, eten ze nauwelijks en verliezen veel gewicht. In tegenstelling tot deze zeehond soorten, foerageren vrouwelijke gewone zeehonden wel tijdens de 4-6 weken durende zoogperiode.
Vrouwelijke zeeleeuwen en hun jongen to-nen onderbroken periodes van vasten gedurende de zoogperiode; deze onderbrekingen zijn aanzienlijk korter dan de vastenperiod-es van zeehonden. Vrouwelijke zeeleeuwen zogen hun jongen gewoonlijk 2-3 dagen ach-ter elkaar, waarbij ze zelf niet eten. De moed-er gaat dan ca. 4 dagen foerageren op zee, terwijl de pup vast. Deze afwisselende periodes van vasten en voeden komen tijdens de hele zoogperiode van 6-24 maanden voor.
De besproken fluctuaties in voedselopname
van vinpotigen worden waarschijnlijk ve-roorzaakt door een endogeen ritme. In tegenstelling tot wilde soortgenoten die op land blijven tijdens het paringsseizoen, en dus geen vis kunnen vangen, kregen de die-ren in dierentuinen zoveel voedsel als ze wilden gedurende het hele jaar. Het feit dat ze, ondanks de beschikbaarheid van voedsel, toch minder voedsel aten dan gemid-deld, suggereert dat de behoef te aan voedsel tijdens deze periode gereduceerd werd door endogene factoren.
De meeste vinpotigen in dierentuinen bren-gen veel tijd door op het land tijdens de verharingsperiode en verminderen dan hun voedselopname of vasten. Reproduktieve vrouwtjes aten echter niet minder tijdens de verharingsperiode. Verharing lijkt dus minder invloed te hebben op de voedselopname dan verwacht naar aanleiding van observ-aties in het wild. Dieren in het wild blijven namelijk op het land tijdens de verharingsperiode en kunnen daarom geen vis vangen; in dierentuinen wordt altijd voedsel aangeboden.
Voedselopname gerelateerd aan natuurlijke historie (hoofdstuk 8)
Verschillen in voedselopname tussen tand-walvissen en vinpotigen, voor zover het sei-zoens- en geslachtsinvloeden betref t, zijn gerelateerd aan de biologie van de 2 groepen. Het belangrijkste ecologische verschil tussen tandwalvissen en vinpotigen is dat tand-walvissen volledig aquatisch leven, terwijl vinpotigen een amfibisch leven leiden.
Vinpotigen brengen een groot deel van hun tijd door op het land waar ze zich voort-planten (baren, paren en zogen), verharen en rusten. Geschikte plaatsen langs het water zijn vaak schaars, waardoor er veel com-petitie is om ruimte. In sommige gevallen
642

Samenvatting
heeft dit geleid tot de ontwikkeling van grote mannetjes die zo hun voortplanting maximaliseren. Een combinatie van klima-tologische en biologische factoren zoals be-schikbaarheid van voedsel en de aanwe-zigheid van roofdieren, heeft de ontwikkeling van het baren op geschikte plaatsen op land in een korte, specifieke tijd van het jaar, bevorderd. Direct hiermee in verband staat het mono- oestrus karakter van de voortplanting van vinpotigen. Als territoriale mannelijke dieren hun territorium en harem verdedigen, gaan ze niet naar zee om te ja-gen op vis. Om lange periodes (weken tot maanden) te kunnen vasten, moet voor het paringsseizoen energie opgeslagen worden in de vorm van vet. Dit veroorzaakt niet alleen seizoensfluctuaties in de voedselop-name, maar ook in het lichaamsgewicht. Dit-zelfde fenomeen komt voor bij vrouwelijke dieren die gewicht verliezen tijdens de zoog-periode; dit is met name opvallend bij som-mige zeehonden, zoals de Zuidelijke zeeoli-fant en de grijze zeehond, waarvan de zo-gende vrouwtjes 3 weken niet eten. Bij an-dere zeehonden, zeeleeuwen en walrussen eten de vrouwtjes echter wel tijdens de zoogperiode.
Tandwalvissen bevinden zich altijd in het water, waar seizoensmatige temperatuur-schommelingen minder groot zijn dan op het land. Omdat er geen seizoensmatige be-perkingen in middelen t.b.v. reproduktie lij-ken te zijn, is de kans op concurrentie tussen soortgenoten klein en de selectiedruk voor geslachtelijk dimorfisme betrekkelijk laag.
Dit lijkt op te gaan voor de besproken tandwalvissen met uitzondering van de orka. Waarschijnlijk omdat de seizoenschommel-ingen in voedselaanbod en watertemperatu-ur klein zijn, zijn tandwalvissen zoals de tuimelaar poly- oestrus, en ovuleren op ver-schillende momenten van het jaar. Dit houdt
in dat de voortplanting niet voor een sys-tematisch voedselopname ritme zorgt.
Over het algemeen overlapt de spreiding van voedselopname als percentage van lichaamsgewicht van vinpotigen die van tandwalvissen van gelijk gewicht zeer goed. Daarbij valt op dat lichtere dieren ten op-zichte van hun lichaamsgewicht relatief veel eten. Deze dieren moeten dus ten opzichte van zwaardere dieren relatief vaak eten, en hebben dus behoefte aan een constant groot aanbod van voedsel, en/of besteden meer tijd aan foerageren.
Belang voor de houderij (hoofdstuk 8)
Voedselgegevens over zeezoogdieren in dierentuinen spelen een belangrijke rol bij hun verzorging en welzijn. Omdat omge-vingsfactoren tussen dierentuinen kunnen verschillen, moeten de huidige gegevens over voedselopname niet worden gezien als de normwaarden voor alle individuen van een soort. Grote verschillen in voedselopname kunnen optreden tussen dieren van hetzelfde geslacht, dezelfde leeftijd, repro-duktieve staat en activiteitsniveau, zelfs als ze onder dezelfde omstandigheden worden gehouden.
Afwijkingen van de individuele gemiddelde niveaus van voedselopname kunnen goede indicatoren zijn van de gedrags- en fysiol-ogische toestand van de dieren. Vermin-derde voedselopname kan worden veroorzaakt door factoren zoals ziekte, sociale problemen, oestrus, het begin van de voort-plantingsperiode, naderende geboorte, en einde van de zoogperiode. Ook een lager activiteitsniveau, toename van de tijd door-gebracht op land, verhoogde water en/of lucht temperatuur, of toename van de calo-rische waarde van het dieet kunnen leiden tot een afname in voedselverbruik. Een toe-
643

name in voedselopname kan duiden op het begin van een zoogperiode, een groeispurt (vaak samenvallend met geslachtsrijp word-en) of het einde van de voortplantingspe-riode. Verhoging in activiteitsniveau, toe-name van de tijd doorgebracht in het water, daling van de water en/of luchttemperatu-ur, of daling van de calorische waarde van het voedsel kunnen ook een stijging in de voedselopname veroorzaken.
Belang voor wildbeheer (hoofdstuk 8)
Een schatting van de jaarlijkse energiebe-hoef te van een populatie zeezoogdieren kan het beste worden gebaseerd op lange termijn gegevens over voedselopname van dieren die in dierentuinen gehouden worden, zoals beschreven in hoofdstuk 8 voor zowel tand-walvissen als vinpotigen. Deze schattingen zijn waarschijnlijk minimale schattingen voor soortgenoten in de naruur. Voor een ruwe schatting van de jaarlijkse voedselbe-hoefte van een populatie is het waarschijnlijk voldoende om het aantal dieren in de populatie te vermenigvuldigen met de ge-middelde jaarlijkse voedselopnames van de soort zoals in deze studie is weergegeven. Deze methode is alleen van toepassing op jaarlijkse schattingen, omdat vooral bij vinpotigen, de voedselopname aanzienlijke systematische seizoensfluctuaties kan verto-nen. Bij vinpotigen is het ook van belang om de geslachtelijke samenstelling van een populatie te weten, omdat in sommige soorten sexueel dimorfisme voorkomt, hetgeen re-sulteert in grote verschillen in jaarlijkse voedselopname.
Als de jaarlijks benodigde hoeveelheid voedsel beschikbaar is, is de gezondheid en het voortplantingssucces van een populatie nog niet veilig gesteld. Bepaalde groepen binnen de populatie, zoals groeiende dieren en vrouwtjes met zogende jongen, kunnen extra energiebehoefte hebben in bepaalde seizoenen. Indien door natuurlijke oorzaken of door invloed van de visserij niet voldoende voedsel aanwezig is, kan de populatie negatief beinvloed worden. Vangst-quota voor de visserij zijn mogelijk nodig om populaties in stand te houden.
Het gebruik van gegevens over voedselopname van in dierentuinen gehouden zeezoogdieren voor schattingen van de hoeveelheid voedsel die wilde soortgenoten eten, heeft voordelen boven het gebruik van indirecte methoden, maar heeft ook zijn be-perkingen. De voordelen zijn dat het aantal dieren dat beschikbaar is relatief groot is, dat de voedselopname over een groot aantal ja-ren, en gedurende alle seizoenen gevolgd kan worden, dat de omgevingsfactoren kunnen worden gemeten of worden bepaald door de onderzoekers, en dat het aantal aan-namen veel lager is dan bij indirecte methoden. De beperkingen zijn dat de omstan-digheden in dierentuinen meestal sterk verschillen met die in de natuur (bijvoorbeeld lucht en water temperaturen en water-diepte), het dieet in dierentuinen vaak af-wijkt van wat soortgenoten eten in de natuur, en door een verschil in beschikbare ruimte en methode om aan voedsel te ko-men, het activiteitsniveau kan verschillen tussen de in dierentuinen gehouden en wilde dieren.
644

Dankwoord
Ook al staat mijn naam op de omslag van de dissertatie, hij is zeker niet alleen door mij gemaakt. Veel mensen hebben er op een zeer prettige wijze aan mee gewerkt. Hen wil ik op deze plaats bedanken. Zonder deadline zou deze prestatie helemaal een feest zijn geweest, maar zonder deadline zou het nu ook nog niet klaar zijn !
Op de eerste plaats wil ik mijn promotor Piet Wiepkema bedanken voor al de tijd die hij in mij heeft gei'nvesteerd. Ik vind het niet van-zelfsprekend dat hij zo veel tijd aan het opleiden van een jongere bioloog besteedt, en ik heb gemerkt dat hij gelijktijdig zelfs meerdere promovendi begeleidde. Piet heeft een geweldig talent om zich bij elk gegeven af te vragen of dat gegeven wel juist is en wat de achterliggende oorzaken er van zijn. Door zijn brede kennis van de biologie van landzoogdieren, vooral landbouwhuis-dieren, kan hij de gegevens van zeezoog-dieren in perspectief zetten. Hij kan enthou-siast worden over fenomenen die ik "for granted" nam en kan dit enthousiasme ook goed overdragen. Ik hoop een deel van zijn kennis en gezichtspunten verder over te dra-gen aan andere studenten, en te introduce-ren in de wetenschappelijke wereld van zee-zoogdieren.
Mijn ouders, Tilly en Ad Kastelein, hebben bijzonder met mij en Bri, mijn echtgenote, meegeleefd tijdens de periode dat ik aan het proefschrift werkte. Zonder het advies van Ad om dit project te beginnen zou deze pro-motie niet tot stand zijn gekomen. Hetzelfde geldt voor mijn directeur Ruud de Clercq, die niet alleen het belang dat hij hechtte aan de promotie duidelijk maakte, maar ook de middelen beschikbaar stelde voor de rea-lisatie er van, en mij heeft toegestaan de laatste jaren mijn aandacht vooral te richten op de bestudering van voedselverbruik en groei van zeezoogdieren.
Meer direct op de werkvloer ben ik veel dank verschuldigd aan mijn assistenten Carolien Staal en Nicole Schooneman, die veel van de voedselgegevens hebben geana-lyseerd, en de teksten hebben nagekeken. Janny Hardeman heeft, naast het nakijken van teksten, juist een zeer grote rol gespeeld in de uiteindelijke vorm van de dissertatie op papier, en het conform maken van de bijna oneindige literatuurlijsten.
Heel speciaal zou ik mijn buurman en vriend Rob Triesscheijn hier willen bedanken, die bijna 1.5 jaar lang, op ongelooflijk onbaatzuchtige wijze, vrijwel dagelijks fi-guren heeft gemaakt voor deze dissertatie, en met veel enthousiasme de vele mutaties daarin heeft doorgevoerd. Ook zijn vrouw Heleen wil ik hier nogmaals bedanken voor de ongeveer 500 keer dat ze de deur voor me heeft geopend in verband met mijn werk-bezoekjes aan Rob.
Nancy Vaughan and Eleanor Hayes, beiden bioloog verbonden aan de Universiteit van Bristol in Engeland, hebben niet alleen het Engels van de studies verbeterd, maar hebben als wetenschappers ook veel opbou-wende kritiek gegeven op de inhoud van de hoofdstukken (wat betekent eigenlijk "rubbish"?). Aangezien het nakijken van het En-gels de laatste stap was, is de tijdsdruk bij hen zeer hoog geweest. Thanks!
Ik wil hierbij ook alle mensen in de vele zeedierenparken over de hele wereld bedanken voor hun medewerking en geduld met mij, omdat ik veelvuldig terug kwam met aanvullende vragen via brief, fax, E- mail en, als ik erge haast had, via de telefoon.
Verder wil ik graag de mensen bedanken die de allerlaatste hand hebben gelegd aan deze dissertatie, namelijk Rijkent Vleeshouwer, de ontwerper van de omslag, Niek en Inge
645

R.A. Kastelein et al.
de Kort van Uitgeverij De Spil, en mede-werkers van Drukkerij Zuidam & Zonen B.V., in het bijzonder Wim Knol.
Veel interesse in de vorderingen van dit proefschrift werd ook getoond door mijn schoonvader Jan Slingerland die, als dieren-arts, het belang van het onderzoek goed kon inschatten. Ook mijn oma, Ans Dusseldorp leefde erg mee met vooral de inspanningen die geleverd werden. Het feit dat beide per-sonen, die me zeer dierbaar waren, in deze speciale fase in mijn leven zijn weggevallen heeft mij de relativiteit van het leven duide-lijk gemaakt. Het spijt me zeer dat ik de voltooiing van dit proefschrift niet met hen kan delen.
Als laatste, maar belangrijkste, wil ik Bri bedanken voor haar steun en liefde tijdens het maken van de dissertatie. Door me te ontlasten van huishoudelijke taken heeft ze er voor gezorgd dat ik tijd had om de hon-derden avonden en weekenden aan het proefschrift te werken. Door haar fijne lach en blijde karakter heeft ze me de energie gegeven om het te volbrengen. Ik beloof hierbij vanaf nu meer tijd vrij te houden om gezamenlijk leuke dingen te ondernemen.
Harderwijk 1998
Ron Kastelein
646

Curriculum vitae
Ronald Aart Kastelein was born on 30 November, 1959, in Dordrecht, The Netherlands. In 1978 he graduated from the Athe-neum-B at the Christelijk Lyceum, Dordrecht. Between September 1978 and 22 May 1984 he studied at the Agricultural University of Wageningen, Holland where he received a Master's Degree in biology, First CI. Honours. Thesis subjects were: 1) Nature conservation and management a) A literature search (6 months). Title: The
importance of aquatic vegetation in brackish water areas in Western Europe for the food supply of migratory birds. Supervisors: Dr. Wim van Vierssen, Dr. Heinz Hafner and Dr. Bob Britton. 1982.
b) Field and laboratory work (6 months: ecology). Title: Diet and feeding ecology of the Little Egret (Egretta garzetta L.) during the breeding season of 1982 in the Camargue, Southern France. Supervisors: Dr. Wim van Vierssen, Dr. Heinz Hafner and Dr. Bob Britton. 1982.
2) Ethology. a) Laboratory work (9 months: literature
survey, ethology, physiology, and acoustics). Title: Behavioral and physiological responses of captive Belukha Whales (Delphinapterus leucas, Pallas) to underwater noise from offshore drilling operations. Supervisors: Prof. Dr. Piet Wiep-kema, Dr. William Evans, Dr. Jeanette Thomas and Dr. Frank Awbrey. 1983.
b) Field work (4 months: ecology, ethology, acoustics, and a literature search). Title: Commerson's Dolphin, Cephalorhynchus commersonii, Lacepede, 1805). Review of published information and report on field research in the Strait of Magellan, Chile, January-February 1984. Supervisors: Prof. Dr. Piet Wiepkema and Stephen Leatherwood. 1984.
After his study at the Agricultural University, he worked at Hubbs Sea World Research Institute, San Diego (California, USA) and Cordova (Alaska) between 1984 and 1986. Field and laboratory work (physiology and ethology). Subject: Sea otter oil spill mitigation study and Sea otter oil spill avoidance study. Since March 1986 he has a permanent research position at the Harderwijk Marine Mammal Park, Holland.
He is first author of 67 scientific publications and co-author of 18 scientific publications on husbandry (5), medical care and rehabilitation (6), physiology (38), anatomy (10), ethology (11), acoustics (12), sensory systems (5), ecology (2), biomechanics (2), and population assessment (4). He is co-editor of 3 books on sensory systems of aquatic mammals: - Sensory Abilities of Cetaceans/Labora
tory and Field Evidence (Eds. Thomas, J.A. and Kastelein, R.A.) (1990). Plenum Press, New York, 710 pp.
- Sensory Systems of Marine Mammals (Eds. Thomas, J.A., Kastelein, R.A. and Supin, A.) (1992). Plenum Press, New York, 773 pp.
- Sensory Systems of Aquatic Mammals (Eds. Kastelein, R.A., Thomas, J.A. and Nachtigall, P.E.) (1995). De Spil Publishers, Woerden, The Netherlands, 588 pp.
647