111 - WUR eDepot
383
111 Proceedings of the First European Congress on the Influence of Air Pollution on Plants and Animals Wageningen, April 22 to 27, 1968 Wageningen Centre for Agricultural Publishing and Documentation 1969
-
Upload
khangminh22 -
Category
Documents
-
view
0 -
download
0
Transcript of 111 - WUR eDepot

111
Proceedings of the First European Congress on the Influence of Air Pollution on Plants and Animals Wageningen, April 22 to 27, 1968
Wageningen Centre for Agricultural Publishing and Documentation 1969

Honorary Committee
Sir Peter Smithers, Secretary-General of the Council of Europe, Strasbourg, France. Mr H. J. van de Poel, Secretary of State, Ministry of Culture, Recreation and Social
Affairs, Rijswijk. Ir J. W. Wellen, Director-General of Agriculture, Ministry of Agriculture and
Fisheries, The Hague. Dr N. J. A. Groen, Inspector-General Public Health and Environmental Hygiene,
Ministry of Social Affairs and Public Health, Leidschendam. Dr G. de Bakker, Director-General, Division of Agriculture Extension and Research,
Ministry of Agriculture and Fisheries, The Hague. Mr R. G. A. Höppener, Chairman, Nature Protection Council, Roermond. Prof. Dr H. W. Julius, Chairman, Central Organization for Applied Scientific Re
search (TNO), The Hague. Ir C. S. Knottnerus, Chairman, Industrial Board of Agriculture ('Landbouwschap'),
The Hague. Prof. Dr J. Lever, Chairman, Biological Council, Royal Netherlands Academy of
Sciences, Amsterdam. Ir A. P. Minderhoud, President of the Board of Governors of the Agricultural Uni
versity of Wageningen. Prof. Dr A. J. P. Oort, Director, Laboratory for Phytopathology, Agricultural Uni
versity, Wageningen. Ir Th. Quené, Director, Government Project Service, The Hague. Prof. Dr J. W. Tesch, Chairman, Health Organization TNO, The Hague. Prof. Dr H. J. Venema, Director, Department of Plant Taxonomy and Plant Geo
graphy, Agricultural University, Wageningen.

Representatives of International Organizations
Ing. H. Hacourt, Council of Europe. Ir H. Eilers, Committee of Experts on Air Pollution of the Council of Europe. Dr K. F. Wentzel, European Committee for the Conservation of Nature and Natural
Resources of the Council of Europe. Mr J. A. Haines, Organization for Economic Co-operation and Development. Dr Ir J. G. P. M. Smeets, Euratom, Brussels. Prof. Dr J. W. Tesch, World Health Organization.

Organizing Committee
Chairman : Dr J. G. ten Houten, Director, Institute of Phytopathological Research (IPO), Wageningen.
Secretary/Treasurer : Mr J. Drijver, International Agricultural Centre, Wageningen.
Members : Dr J. J. Barkman, Biological Station of the Agricultural University Wageningen, Wijster. Ir L. J. Brasser, Head, Department of Air Pollution, Research Institute for Public Health Engineering, Delft. Ir. H. Eilers, Inspectorate of Environmental Hygiene, Ministry of Social Affairs and Public Health, Leidschendam. Prof. Dr M. F. Mörzer Bruyns, Director, State Institute for Nature Conservation Research (RIVON), Zeist. Ir A. Raad, Head, Division of Parks and Cemeteries, Public Works of Rotterdam. Ir A. van Raay, Institute of Phytopathological Research (IPO), Wageningen. Ir F. H. F. G. Spierings, Head, Department of Air Pollution, Institute of Phytopathological Research (IPO), Wageningen. Dr J. Tesink, Director Animal Health Service in the Province of Zeeland, Goes. Prof. Dr V. Westhoff, State Institute for Nature Conservation Research (RIVON), Zeist.


Preface
J. G. ten Houten
Chairman of the Organizing Committee
The European Symposium on the Influence of Air Pollution on Plants and Animals was sponsored by the Netherlands Government and the Council of Europe, whose European Committee for the Conservation of Nature and Natural Resources had expressed its wish for holding such a Symposium in The Netherlands. Originally it was suggested to restrict the programme to influences on wildlife and the wild flora, but since the majority of scientific facts comes from studies carried out on crop plants, forest trees and domestic animals, the Organizing Committee prepaired a preliminary programme including sessions on such plants and animals. After the official approval of the Committee for the Conservation of Nature the final programme consisted of seven sessions.
To stimulate discussions only those actively working on one or more of the subjects mentioned above were invited to participate. In addition officiai representatives were present from the Council of Europe, the Committee of Experts on Air Pollution of the Council of Europe, the European Committee for the Conservation of Nature and Natural Resources of the Council of Europe, the Organization for Economic Cooperation and Development, Euratom and the World Health Organization. Participants were not limited to member countries of the Council of Europe, but also some Eastern European scientists were present.
Two American scientists were invited to give lectures on some aspects of photochemical air pollution, a pollution type new to Europe but increasingly important for this region. One Canadian expert on the influence of air pollution on epiphytes took an active part in the symposium. Altogether there were 102 participants from 16 countries.
Not only the number of participants was restricted but also the number of lectures. In each session one or two introductory papers were followed by at most four short communications. This made it possible to spend about one hour per session on panel discussions.
The President, Vice-President and Organizer-secretary of each session had the difficult task to summarize the discussions, which were all registered in full on tape. These summaries are included in this book. The whole procedure worked out very satisfactorily.
Another advantage of the rather broad programme has been that several research workers from various disciplines, who otherwise would not have met, now got an

Impression of the work going on in related fields. This symposium has therefore led to many lasting contacts. I hope that similar symposia will be held at regular intervals on the same or allied topics which are of rapidly increasing importance for many countries.

Address of welcome
S. H. Visser
President of the Netherlands Council for Air Pollution
In the coming days, the town of Wageningen will be the scene of the European Symposium on the Influences of Air Pollution on Plants and Animals.
The initiative for this Symposium was taken by the European Commission for the Conservation of Nature and Natural Resources of the Council of Europe and The Netherlands willingly undertook the task of its organization. Evidently Wageningen was the most suitable meeting place, being the site of the Agricultural University and a moie than purely national centre of agricultural science.
For the first time, in the coming days, experts from all over Europe will occupy themselves with a subject that increasingly needs and indeed engages the attention of scientists in many countries, even though it covers only the influences of air pollution on plants and animals and not on human life and society.
Both the wild flora and fauna, and the cultivated plants and domestic animals will be considered. In the first cases the damages resulting from air pollution, though obvious, can hardly ever be expressed in financial terms, as scientific and idealistic factors play an important part. For cultivated plants and domestic animals losses can often be calculated.
The damages are so great, and so rapidly increasing ("especially in heavily industrialized regions) that the governments must take action. But such an action must be based on scientific work and data, and this field still shows large gaps.
It is 'expected that in the coming days some of these gaps will be closed and that in other cases measures can be taken to overcome the deficiency in knowledge and understanding.
In these respects I wish you a fruitful conference.

Intervention
H. Hacourt
Représentant du Conseil de l'Europe
J'ai le très grand honneur d'être ici parmi vous aujourd'hui et de représenter au nom du Secrétaire Général le Conseil de l'Europe qui a accordé, avec le Gouvernement des Pay-Bas, son patronage à ce Symposium européen.
Le Secrétaire Général regrette vivement de ne pas avoir pu être présent en personne aujourd'hui, mais je puis vous affirmer qu'il porte un intérêt personnel des plus vifs à la question de la sauvegarde de la nature et des ressources naturelles en Europe, notamment à celle de la pollution de l'air.
C'est aussi une grande joie pour moi de voir réaliser un voeu exprimé par le Comité européen pour la Sauvegarde de la Nature et des Ressources Naturelles du Conseil de l'Europe, à savoir qu'une rencontre internationale ait lieu dans le but de discuter des problèmes concernant l'influence de la pollution de l'air sur les plantes et les animaux. Ce voeu avait été exprimé en novembre 1966 lors de la 5ème Session du Comité européen et voici qu'aujourd'hui nous sommes tous réunis pour examiner ces pioblèmes et essayer d'en tirer des conclusions pratiques afin de sauvegarder cette ressource précieuse et indispensable qu'est l'air.
Dans son Programme intergouvernemental, le Comité des Ministres du Conseil de l'Europe fait une large part à la pollution de l'air. L'importance qu'il y attache est telle que, suite à une recommandation de l'Assemblée Consultative du Conseil de l'Europe, la création d'un Comité d'experts sur la pollution de l'air a été décidée début 1966 et que, depuis cette date, ce Comité a déjà tenu deux sessions annuelles. Nous avons la grande chance d'avoir parmi nous, ici à Wageningen, M. Eilers, Président de ce Comité d'experts.
Le premier objectif de ce Comité a été d'établir une déclaration fixant en termes généraux les principes à suivre en matière de lutte contre la pollution de l'air. Ce projet de déclaration a été adopté par le Comité des Ministres en mars 1968. Le Comité d'experts a établi un programme de travail en tenant compte de l'urgence de certains problèmes et de la possibilité de les régler sur une base internationale. La methode qui préside à ses travaux consiste à comparer les législations nationales actuelles en vue de dégager des bases communes susceptibles de faire l'objet de recommandations aux gouvernements des dix-huit pays membres ou d'accords internationaux.
Une liaison étroite existe entre le Comité d'experts sur la pollution de l'air et le Comité européen pour la Sauvegarde de la Nature et des Ressources Naturelles du

fait que ce dernier s'intéresse vivement à toutes les causes qui peuvent nuire à la végétation et aux animaux. Les recommandations et les conclusions que vous tirerez de ce Symposium européen seront examinées soigneusement par les deux Comités du Conseil de l'Europe.
Pour terminer, laissez-moi remercier nos amis hollandais, organisateurs de ce Symposium et je tiens tout particulièrement à les féliciter d'avoir réuni ici à Wageningen les plus éminents spécialistes sur cette question si délicate que sont les effets de la pollution de l'air sur les plantes et les animaux. Je puis me faire l'interprète des voeux du Secrétaire Général en vous souhaitant une pleine réussite dans vos travaux.
10
Message of greeting
J. W. Tesch
Representative of the World Health Organisation, European Office
I wish to thank the Organizing Committee for inviting the WHO, as it is greatly interested in this symposium. To solve the problems of air pollution demands a large-scale teamwork in which not only WHO and other health agencies are involved. WHO's interest has been mainly focussed on the problems of air quality criteria, on which guidelines for emissions could be based. Such subjects have been the theme of several WHO meetings and reports.
Personally I am convinced that WHO should not restrict its interest to these problems, but should study the whole of the integrated natural and cultural environment as a background for health and wellbeing.
Originally research carried out concerning the influence of air pollution on animals and plants had as its practical goal the protection of farming, horticulture, forestry, livestock, etc. But, as was indicated during the discussions preceding this symposium, research in this connection must also be directed towards extention of our knowledge on the biological (biochemical) mechanisms and their ecological consequences.
There is a difference between the influence of air pollution on, e.g., lichens and human beings, as far as the present knowledge admits. But health is not a state but a struggle. As far a sman is concerned he has to cope with chemicals, pathogenic micro-
• organisms, incompatible relations, drunken car-drivers and cosmic rays. However, we are aware of the fact, that the consequences of human acti\ ities, of which air pollution is only one aspect, can be a danger to the whole environment of which the wise management is a prerequisite of human wellbeing. As one of the practical outcomes of the discussions 1 could think of a better use of landscape biology to prevent the influence of air pollution.
The WHO has been active in the field of air pollution studies since 1957 and is still much concerned with the study of criteria on which measures can be based. Therefore WHO welcomes this symposium and I may express the hope that close multidiscipli-nary collaboration between Public Health and Environmental Management will be resulting in a healthy environment.
11

Section 1 : Inventory of damage due to industrial and urban air pollution
and research done in relation to this pollution

Informations sur les dommages causés par la pollution de l'air aux plantes et aux animaux dans les pays européens
J. Bossavy
Centre National d'études techniques et de recherches technologiques pour l'agriculture, les forêts et l'équipement rural, Saint-Martin-d'Hères, France
Sommaire
L'action des rejets industriels, spécialement SOj et les composés du fluor, sur la végétation forestière se révèle très pernicieuse. Picea abies. Abies alba, Pimis sylvestris qui constituent la quasi totalité des forêts résineuses d'altitude de l'Europe Centrale sont extrêmement sensibles. La superficie globale des forêts européennes menacées, peut être estimée à 400.000 ha. Les cultures bénéficiant de soins plus intensifs, les effets de la pollution se limiteront le plus souvent à des pertes de rendement ou à une diminution partielle de la qualité.
L'action du fluor sur la dentition et le squelette des animaux est bien connue; l'apport d'aliments complémentaires et la distribution d'un condiment minéral approprié permettent d'améliorer leur santé.
En général, les recherches s'orientent vers l'étude de l'absorption des polluants, leur déplacement a interieur du végétal et leurs effets physiologiques. La création de clones d'essences résineuses ou de variétés, en ce qui concerne les plantes cultivées, capables les uns et les autres de supporter des concentrations élevées, semble possible.
Généralités
Les forêts en général, et les essences résineuses en particulier, fournissent un test sur et précis qui a le plus souvent été retenu lorsqu'à été posé le problème des dommages causés à la végétation par la pollution atmosphérique. Le cycle biologique des végétaux annuels se réalisant en quelques mois, les dommages causés sont souvent moins facilement contrôlables et peuvent passer inaperçus. L'absence ou la rareté de plantes pérennes dans les régions de grande culture, rend par ailleurs les effets moins spectaculaires.
A l'exception de certaines espèces dont la sensibilité aux différents polluants est maintenant bien établie, que ce soit Meclicago saliva, ou Anagallis arvensis pour SO2, Gladiolus pour le fluor et ses composés, on peut admettre que pour les cultures les plus répandues, céréales et cultures industrielles (betteraves, pommes de terre), la sensibilité est souvent moins accusée, car ces plantes bénéficient de soins particuliers et se développent en principe dans des conditions optimum de fertilité ce qui contribue à augmenter leur résistance et permet d'obtenir des rendements qui restent rentables.
15

Dommages aux forêts
La fertilité souvent réduite des sols forestiers, la présence fréquente de résineux et la rareté des fertilisations (à l'exception des jeunes plantations) représentent des facteurs qui tendent à accentuer les effets nuisibles et facilitent l'observation des effets d'une pollution, quelle que soit la nature du polluant (SO2 ou H F). Les forestiers de l'Europe centrale sont parfaitement sensibilisés à ces problèmes depuis longtemps, puisque les premiers travaux remontent aux environs de 1850, époque où Stockardt, professeur de chimie et de physique à Chemnitz, dénommait déjà SO2 'le poison spécifique des plantes'. Directeur, ensuite, du Laboratoire de chimie à Tharandt,, ses successeurs Von Schröder, puis Wislicenus ont poursuivi ces études. L'évolution de certains massifs montagneux, en particulier, I'Erzeggebirge, a donc fait l'objet d'observations anciennes.
D'ailleurs les milieux forestiers sont, de tradition, habituée à suivre l'évolution des massifs qui leur sont confiés de façon très régulière, grâce aux inventaires comptages et aménagements dont certains remontent à plus d'un siècle. L'évolution des peuplements a pu ainsi être régulièrement suivie, ce qui a parfois mis en lumière la disparition de certaines essences sur une période d'observation de 50 ans et plus. On comprend donc que, dans la plupart des états européens, les forestiers aient été mieux préparés que les milieux agricoles à relevei certains dépérissements, à en rechercher et à en déceler les causes.
Retenons enfin que la topographie de nombreux terrains forestiers, l'implantation des forêts résineuses en zone de montagne, dans des vallées étroites aux pentes souvent très raides, créent des conditions nettement défavorables à la diffusion et à la dispersion des fumées.
Tout ceci explique largement l'importance que revêt la pollution atmosphérique dans les zones boisées, surtout lorsque celles-ci se trouvent à proximité de grandes concentrations industrielles (par exemple les Monts Métalliques de la Bohème, les usines d'aluminium dans les vallées alpines).
L'incidence économique se révèle donc particulièrement grave pour la communauté européenne, prise dans son sens le plus large. La réduction des accroissements démontrés par Vins et Pollanschutz, les superficies de forêts résineuses gravement atteintes et pratiquement condamnées, chiffrées à près de 200000 ha, aboutissent à une perte de production de matière ligneuse importante. Dans la balance économique cet élément de tiouble est particulièrement inquiétant au cours de la période actuelle, qui se caractérise déjà par une insuffisance de la production de bois résineux.
Il faut également noter que les principales essences résineuses constituant l'ensemble des forêts naturelles sont pratiquement au nombre de trois (Abies, Picea, Pi/tus sylvestris). Elles croissent souvent dans des conditions écologiques si défavorable, que leur substitution est rarement possible sans une réduction considérable de la rentabilité. Enfin, l'implantation d'une autre essence est une oeuvre de longue haleine, les résultats souvent incertains nécessiteront plusieurs dizaines d'années avant d'être reconnus concluants.
Certaines essences ent, par leur structure ou leur cycle végétatif, une résistance plus
16

marquée aux polluants gazeux. Ce sont : Larix decidua et Pinus nigra ssp. nigra, mais elles ne sauraient s'adapter obligatoirement aux mêmes stations que celles où croissent naturellement Abies, Picea et Pinus sylvestris, soit pour Larix decidua par suite de son exigence en lumière et de sa fragilité à l'égard de la concurrence. Le Pinus nigra est moins recommandable pour son mauvais comportement en altitude en face des conditions rigoureuses du climat, de la neige.
Si la substitution d'essences reste aléatoire, un espoir apparaît cependant: la possibilité de créer des variétés ou des clones résistants, en partant de greffons prélevés dans certains massifs, sur des sujets restés exceptionnellement verts. C'est le résultat des premières études faites sur Picea excelsa, en Allemagne, par Rohmeder et Schonborn et, en Amérique, sur Pinus strobus et Pinus ponderosa. II est à craindre que de long ue années ne s'écoulent avant que la multiplication de ces variétés puisse répondreauxs immenses besoins dès maintenant apparus.
Il convient enfin de souligner le rôle social et l'importance qui s'attache actuellement à la notion de forêt récréation. La majorité des massifs aménagés dans cette perspective, situés à proximité ou dans un rayon de l'ordre de 100 km des grandes concentrations urbaines, est constituée, en plaine, par des forêts feuillues ou les Quercus, Fagus, Betula et Carpinus dominent largement. Le résineux, s'il est présent, y est souvent d'origine artificielle; c'est le cas notamment en Belgique, en France et en Hollande. Les arbres feuillus sont plus résistants à une pollution en dépit des nécroses qui apparaissent parfois sur les feuilles en cours de végétation. C'est là, très certainement, un problème non négligeable qu'il apparaît nécessaire de mentionner, mais qui, du fait même de la topographie, ne soulève pas les mêmes inquiétudes; en tout cas une évaluation argent de ces effets apparaît difficilement mesurable.
Avant d'en terminer avec la question des dommages aux forêts nous signalons un fait rarement évoqué, à ce jour; c'est celui de la moindre qualité mécanique des grumes résineuses provenant de peuplements situés dans une zone soumise à une pollution. Les premiers essais, effectués au Centre National de la Recherche Forestière à Nancy, laissent prévoir, en effet, que les coefficients de résistance de grumes ayant poussé en atmosphère fluorée sont significativement inférieurs à ceux enregistrés sur des grumes saines. En est-il de même pour les sujets soumis à une pollution par SO2?
La question se pose enfin, dans quelle mesure de telles forêts offrent la même résistance aux agents extérieurs (insectes, champignons) ou aux facteurs climatiques (gel, sécheresse, vent). Quant aux effets des polluants sur les organes floraux, ils sont couramment admis: rareté des cônes, réduction de leurs dimensions, et proportion nettement plus accusée de graines vaines jouent simultanément pour rendre la régénération naturelle de plus en plus aléatoire. Ce qui associé à tous les autres facteurs represente l'élément le plus inquiétant pour l'avenir de la forêt et le maintien de la couverture végétale en régions accidentées.
L expérimentation dans cette double voie (résistance aux agents extérieurs, effets sur la fructification) est particulièrement difficile à réaliser 'in situ', à l'heure actuelle.
17

Dommages aux culture
Les dommages aux cultures sont apparus plus récemment, soit que certaines cultures aient été irrégulièrement touchés, ou de façon discontinue, soit que les relations de cause à effet n'aient pas été correctement établies. Actuellement de tels dommages sont reconnus et ont suscité de nombreuses recherches ou observations de la part d'instituts ou de laboratoires.
Nous retiendrons en premier lieu les travaux de Guderian, qui ont montré l'extrême sensibilité à SO2 des plantes fourragères et notamment des variétés de Trifolium cultivées en mélange avec d'autres légumineuses ou avec des graminées. On peut extraire de cette étude les enseignements suivants : 1. Selon les associations, et en dépit de la disparition des espèces les plus sensibles dont les feuilles sont très vite nécrosées, certains mélanges (Trifolium, Vicia, Lolium) fournissent des rendements parfois égaux à ceux de la parcelle témoin, du fait d'une meilleure croissance des deux espèces ayant pu se développer plus librement par suite de l'affaiblissement ou de la disparition de la troisième. La composition d'un fourrage pourra alors ne plus être exactement la même que celle recherchée lors du semis, le rendement restant cependant satisfaisant.
2. Le degré de résistance d'un végétal annuel est souvent lié au stade de développement atteint lorsque survient une pointe de concentration, due à des conditions météorologiques défavorables, d'où la nécessité d'échelonner les semis. 3. Le choix des variétés cultivées doit être établi en fonction de l'utilisation prévue: production de fourrage, production de graines, simple protection des sols contre l'érosion.
En Tchéco-Slovaquie, Kozel et Maly ont étudié les effets de SOa et des poussières sur les récoltes et sur la composition minérale des sols. Les résultats de leurs recherches peuvent se résumer comme suit :
Les pertes de rendement s'échelonnaient de 8 à 25 ou 30 % pour les céréales à des distances de 600 m de l'usine et pouvaient atteindre 46% pour des cultures fourragères (Zea, Beta).
L'étude des sols a mis en évidence sur des profondeurs variant de 0 à 20 cm, des modifications du pH et des variations des teneurs en éléments minéraux (K2O, CaO, P2O5). Ainsi est apparu un effet significatif, sans que les conséquences soient obligatoirement défavorables, sauf toutefois si les teneurs en certains microéléments (Cr, Cu, Ti, As) se révélaient à la soi tie des cheminées par trop considérables.
Les assisses supérieures du sol (de 0 à 5 cm) subissent les modifications les plus marquées selon leur situation et la distance qui les sépare de l'usine, le plus souvent inférieure à 1000 m.
La perte de qualité entraînée par les dépôts solides peut avoir un effet prépondérant sur la valeur nutritive des fourrages (Zea, Beta).
L'étude récente de Pesek présente un aspect de la contamination des sols par les éléments lourds divers, présents à l'état de traces, dont l'accumulation pourrait entraîner à longue échéance la stérilité des sols de cultures.
L'auteur a montré également qu'il y avait une absorption préférentielle de certains
18

éléments, dont l'analyse spectrale a décelé la présence dans certaines parties des tissus végétaux (cellules, vaisseaux) à des concentrations différentes de celles existant dans le sol. La contamination est alors interne. Les éléments peuvent également se fixer sur les parties superficielles des produits consommables (souillure de l'épiderme des fruits). Cette contamination externe provoque la formation d'une assisse organo-minérale adhérente susceptible alors de perturber l'action de la lumière, ce qui peut avoir pour conséquence une perte de qualité par altération de la couleur des fruits. Enfin les aérocolloïdes participent également à cette contamination externe.
Les études menées depuis plusieurs années à Lacq (Basses-Pyrénées), autour des usines de traitement de gaz naturel, ont montré que la pollution par SO2 avait un caractère discontinu. Elle se présente sous forme d'accidents affectants des surfaces variables et elle est très étroitement liés aux conditions météorologiques caractérisées par l'absence de vent, un état hygrométrique élevé et la brusque apparition du soleil après dissipation des brouillards. Les cultures fourragères réagissent brutalement à ces pointes de concentration ; en quelques heures les folioles de Trifolium portent des nécroses définitives. On a pu également noter un phénomène de 'parachutage' qui fait apparaître des accidents, dans des périmètres peu étendus, situés parfois à plusieurs kilomètres du noyau principal et sans continuité avec celui-ci.
Le périmètre atteint est irrégulier, variable d'un accident à l'autre, d'une année à l'autre. Les diverticules affectent des formes très diverses, s'étendant parfois à 25 km des sources d'émission. Seul le noyau central, dont le rayon est de quelques kilomètres (5 à 10) conserve une certaine régularité.
Le nombre de communes intéressées (1 à 10) par ces accidents traduit bien l'importance des surfaces touchées. Pour chaque accident les dossiers de réclamations présentent une grande diversité, limités parfois à quelques unités, ils peuvent approcher le chiffre de 400.
Les dommages causés, en particulier aux cultures fourragères, sont étroitement liés au stade de développement de la prairie. C'est ainsi qu'un accident survenu avant la première coupe n'aura pas d'effet sensible sur le rendement des coupes suivantes (2 à 5), sous réserve qu'un nouvel accident n'intervienne pas entre temps.
Pour la vigne, les dommages sont liés à la variété cultivée et en relation avec la date a laquelle survient l'accident. Les effets peuvent se traduire par une perte de rendement ou par une diminution de degré alcoolique (1 ° à 1,5°), ou parfois par les deux phénomènes simultanés, selon le pourcentage des surfaces foliaires nécrosées et la date à laquelle les brûlures sont apparues. Ces dommages ont été attribués à SOa ou à H F émis par une usine d'aluminium du complexe.
Les arbres fruitiers, abricotiers, noyers, pêchers... sont fréquemment touchés par ces deux polluants. Aucun accident au bétail n'a été observé jusqu'à présent. On peut enfin préciser que 60% des indemnités versées par les industriels responsables l'ont ete au titre de dommages causés aux cultures fourragères.
19

Dommages causés aux animaux
Si des dommages directs dûs à l'anhydride sulfureux ont été rarement signalés, on connaît bien, par contre, les manifestations pathologiques du fluor sous le nom de fluorose.
La cause ne doit pas en être recherchée dans une absorption par les voies respiratoires, mais bien dans les hautes teneurs en fluor des fourrages ou de la végétation consommée. Les atteintes à la dentition et au squelette, les pertes de production, la mortalité qui survient parfois ont été observées sur les bovins, ainsi que sur les caprins et les ovins. L'état physiologique du bétail et le mode de nutrition peuvent influer directement l'évolution de cette intoxication.
Ferrando admet que toute une série de mécanisme de défense intervient, ce qui se manifeste dans les excrétions fécale et rénale, le dépôt rapide du fluor dans le squelette, le refus par les animaux des aliments contenant du fluor. On sait, en effet, que le dépôt du fluor dans le squelette peut atteindre 15 à 20000 p.p.m. alors que la teneur considérée comme normale est de 200 à 800 p.p.m.
L'alimentation est bien le facteur principal de l'intoxication: l'analyse des fourrages a montré une carence en phosphore et un déséquilibre du rapport Ca/P, auquel on peut remédier par la distribution d'un condiment minéral. Des résultats encourageants ont été obtenus en Norvège et en France.
Les études de Guilhon sur les abeilles permettent de classer ces insectes comme indirectement très sensibles aux composés du fluor; la disparition des ruchers dans les vallées de montagne soumises à une pollution fluorée est apparue dans de nombreux périmètres. Les effets sur la vie animale sauvage, insectes, oiseaux, mammifères ne semblent pas avoir été démontré de façon suffisante.
Une étude récente dont nous avons eu connaissance, est celle de Novâkovâ sur l'hémogramme des lièvres.1
Sans doute conviendrait-il d'entreprendre avec des moyens appropriés des recherches dans cette voie, malgré les difficultés que peut présenter une telle entreprise.
Inventaire des surfaces
Wentzel a présenté lors de la 19e Assemblée générale de la Confédération européenne de l'Agriculture (1967) un rapport dans lequel il précisait à la suite de l'enquête de 1961 les superficies forestières d'Europe centrae atteintes par des pollutions industrielles:
Bassin de la Ruhr 31000 ha à l'Est (Bitterfeld-Dessau) 55000 ha Erzgebirge (Bohème) 60000 ha Saxe 13500 ha Haute Silésie 35000 ha
1. Journal forestier suisse, janvier 1968.
20

en total environ 200000 ha, dont 60 à 70000 ha, soit 1/3, sont menacés dans leur existence. L'opinion de Wentzel était enfin que, compte tenu de l'extension annuelle des surfaces touchées, le chiffre de 300000 ha droit être considéré en 1967 comme plus près de la vérité. 11 s'agit des surfaces forestières situées autour des quatre grandes zones de concentration industrielle de l'Europe centrale. Or, s'il n'existe pas dans d'autres pays européens d'étendues aussi considérables soumises aux fumées industrielles, les industries y sont également présentes, mais plus dispersées, de telle sorte que chacun des périmètres atteints occupe des surfaces nettement plus réduites, cependant la multiplicité de ces périmètres de faible ou de moyenne étendue fait apparaître, si on les totalise, une superficie globale des plus inquiétante.
Les renseignements de différentes sources fournis à l'occasion de ce Congrès, permettent de compléter l'état présenté plus haut, de la façon suivante, en ce qui concerne uniquement les forêts :
Autriche 30000 ha France 6000 ha Roumanie 15000 ha Suisse 600 ha Suède et Norvège 4000 ha Il apparaît ainsi que la surface totale des forêts (résineuses dans leur majorité)
soumises à une pollution industrielle et plus ou moins gravement menacées de disparition, peut actuellement être estimée assez voisine de 400000 ha.
Ce n'est pas là faire preuve d'un pessimisme excessif, mais le résultat d'observations suivies depuis de nombreuses années dans les vallées industrielles des Alpes, où l'extension du périmètre menacé apparaît exceptionnellement rapide, où enfin l'importance des mortalités est évidente à des distances de 20 à 25 km des sources d'émission.
Le menace se confirme et se précise, ce qui constitue, en région de montagne un élément de trouble qui affectera en premier lieu les conditions de vie des population, et ultérieurement la vie de ces mêmes populations. La disparition de la forêt résineuse en laissant la place à des formations buissonnantes, plus ou moins claires insuffisantes le plus souvent pour assurer la stabilité des versants, pourrait provoquer la reprise des phénomènes érosifs tels que glissements de terrain dont on connaît dans le passé les manifestations brutales et les conséquences catastrophiques.
Il a été question, jusqu'ici, seulement des surfaces forestières, en ce qui concerne les terrains agricoles un inventaire exact n'a pas été dressé avec la même précision, soit que les cultures aient été touchés irrégulièrement ou de façon discontinue rendant difficile une telle estimation, soit que ces périmètres souvent limités aux abords mêmes des usines aient été progressivement abandonnés par la culture à la suite du rachat des terrains par les industries. Quoi qu'il en soit, un tel inventaire apparaît beaucoup plus malaisé à établir et nous ne nous risquerons pas à avancer des chiffres à l'exception de cas particuliers, telles les zones de cultures florales autour de IJm.uid.en, Beverwijk, Heemskerk dans les Pays Bas, la vallée du Rhône dans le Valais Suisse (14 à 15000 ha), et la région de Lacq (15 à 20000 ha).
Signalons de façon particulière l'apparition pour la première fois en Europe (octobre 1965, dans la région de Westland, environs de Vlaardingen, Pays Bas) du
21

Péroxyacethylnitrate (PAN) dont la présence a été attribuée aux réactions photochimiques des rejets industriels et des vapeurs nitreuses au cours d'une période climatique exceptionnelle.
Évaluation des dommages
En matière forestière les études très fouillées de Pollanschutz peuvent être considérées comme un modèle du genre. Elles sont essentiellement axées sur la diminution de l'épaisseur des cernes annuels. Le problème le plus délicat à résoudre est alors celui du choix des parcelles témoins de façon à établir ce qui 'aurait dû être' la production en fonction des conditions climatiques au cours du développement de l'arbre, si la pollution n'avait pas existé.
Une autre notion a été également mise en évidence par Vins. C'est la disparition totale ou partielle de cernes sur une certaine longueur de la tige. Les dommages sont donc à calculer en fonction de ces deux données, mais aussi en tenant compte de la perte de qualité (bois secs au lieu de bois verts) et en retenant enfin les modifications de qualité mécanique des grumes dues aux variations de pourcentage de bois dense à l'intérieur des accroissements annuels et du contraste de densité entre bois de printemps et bois d'été.
Les pertes d'accroissement présentent par ailleurs des différences considérables selon l'essence, l'exposition, l'altitude. Elles peuvent varier de 0,5 à 7 m3/ha/an, correspondant à des pertes financières s'insérant dans une fourchette de 5 à 100 dollars/ha/an. En retenant une réduction de la production moyenne de 4 à 5 m3/ha/an, le volume global correspondant aux 350000 ha touchés par la pollution représenterait annuellement une perte de l'ordre de 2 millions de m3, ce qui paraît déjà énorme et très préoccupant. Pour la région Rhénanie du Nord-Westphalie, le dommage financier subi par les seules forêts a été chiffré à 14 millions de DM, soit environ 3500000 S.
En matière de cultures annuelles, les évaluations seront strictement fonction de la valeur unitaire de la production qui peut varier dans des proportions considérables selon que l'on a affaire à une prairie artificielle, une culture maraîchère, une culture florale ou un verger à fruits.
Une évaluation des dommages est impossible à chiffrer pour l'ensemble des pays européens. On peut néanmoins faire état des données suivantes. En Hollande certains dossiers de dégâts aux cultures florales ont atteint la somme considérable de 1 million de florins (275000 $). Dans la région de Rhénanie du nord-Westphalie, le montant global des dommages a été estimé à 33 M de DM pour les terres cultivées et à 32 M de DM pour les terres de jardinage.
Une évaluation financière des penes en matière d'animaux d'élevage apparaît moins délicate à établir, soit parce qu'il s'agira le plus souvent de quelques unités, soit parce que la valeur unitaire d'une tête de bétail représente une donnée relativement constante dans une région déterminée.
Il conviendrait enfin de faire état des conséquences lointaines que peut avoir sur la valeur agricole des terres l'apport continu et prolongé d'éléments minéraux, souvent étrangers au métabolisme des plantes, dont l'accumulation risque de provoquer
22

l'altération puis la stérilité des terres. L'étude de Pesek ouvre de nouvelles perspectives sur une telle éventualité. 11 serait, sans doute, logique d'en tenir compte, mais alors, dans quelle mesure et sous quelle forme?
Objectifs de la recherche
Il est apparu superflu de présenter la liste des différents Instituts, Laboratoires ou Départements ministériels se préoccuppant de ces problèmes, mais les informations recueillies sur les buts de recherche révèlent une orientation générale qui peut schéma-tiquement être ainsi présentée: 1. Recherches en vue d'acquérir une meilleure connaissance du processus d'intoxication des végétaux, c'est-à-dire modalités d'absorption des polluants, conditions de leur déplacement à travers les cellules du parenchyme, leurs effets sur les différentes fonctions physiologiques, respiration, transpiration..., leurs effets sur l'activité des systèmes enzymatiques, sur les auxines et le métabolisme des plantes. 2. Recherches en vue de sélectionner parmi les végétaux annuels des variétés présentant une moindre sensibilité aux polluants. Poursuite des essais entrepris dans la sélection individuelle et la multiplication par voie végétative de certains conifères, il s'agit en fait de confirmer les résultats déjà obtenus sur Picea et d'étudier l'extension de cette technique à d'autres essences (Abies, Pinus sylvestris) de façon à obtenir des souches plus résistantes dont le besoin se fait cruellement sentir.
3. Mise au point de mesures pratiques en vue de limiter les effets des polluants, d assurer une meilleure croissance des peuplements ou des cultures par la fertilisation ou par le travail du sol et en forêt préciser de nouvelles directives sylvicoles. 4. Etude des effets de polluants encore peu répandus ou non suffisamment contrôlés tels les oxydes d'azote, en vue d'établir les caractéristiques des dégâts sur la végétation. 5. Recherches en laboratoire des valeurs limites d'action des polluants et limites de tolérance sur le terrain. 6. Nous signalerons enfin l'établissement, en cours, par l'Institut National de Botanique appliqué à Hambourg, d'un atlas de tableaux de couleur des dégâts par SO2 aux plantes de cultures, essences forestières, plantes ornementales et arbres fruitiers. 7. Un nouveau procédé de photographie aérienne, à l'aide de film ektachrome infrarouge (fausse couleur) paraît appelé à un grand avenir pour la détection des arbres malades. Récemment mis au point en Amérique par Meyer et French in Minnesota (septembre 1967) et en Allemagne de l'Est (Eberswalde) par Wolf, ce procédé doit permettre de réaliser des inventaires forestiers plus rapides, plus sûrs, et moins coûteux que la reconnaissance au sol. Le facteur principal d'exploitation et de ces nouvelles possibilités ne serait pas tant un manque de connaissance des particularités relatives au temps de pose ou au développement, qu'un problème d'interprétation des photographies.
23

Conclusion
Ce survol rapide peut paraître trop pessimiste. Pour rétablir une certaine équité il convient de mentionner quelques-uns des facteurs qui laissent espérer que la période la plus difficile est sur le point de prendre fin, soit qu'apparaissent à échéance plus ou moins lointaine des signes d'amélioration, soit que certains périmètres soient en voie de stabilisation, soit enfin que l'apparition de nouveaux périmères puisse être considérée dès maintenant comme exceptionnelle. Une enumeration serait la suivante: 1. Certaines techniques récentes, telles que la construction de très hautes cheminées (200 m et plus) permettent, lors de la construction d'usines neuves (centrales thermiques), d'assurer une dilution et une dispersion des fumées limitant les concentrations au sol à des taux non toxiques. 2. Quelques nouvelles installations de dispositifs de captation et d'épuration ont été signalés, notamment à Rouen. On doit à la mise en place de tels dispositifs, une situation moins préoccupante en milieu forestier, les chablis annuels dans les forêts domaniales de cette région ont manifestement diminué depuis 2 ans. 3. L'utilisation de plus en plus généralisée du gaz naturel (Lacq- Hassi R'Mel- Zelten-Groningue...), aussi bien en milieu urbain que dans l'industrie, évitera dans l'avenir une augmentation des teneurs en SO2. La consommation de gaz naturel des pays du Marché Commun chiffrée à 23 millions de TEC en 1965 (TEC = tonne équivalent charbon) doit passer à 53 M de Ten 1970, à 150 M de Ten 1980, soit 13% de la consommation totale d'énergie.
4. Les Sociétés pétrolières fourniront d'ici 1970 ou 1975 des tonnages de plus en plus importants de fuel BTS, par ailleurs la centralisation au sein d'un organisme dénomme CONCAWE de toutes les techniques de captation et dépuration permettra lors de la construction de nouvelles raffineries de limiter les rejets toxiques ou malodorants. 5. Les recherches en cours dans de nombreux pays industriels laissent espérer que la mise au point définitive de procédés efficaces d'élimination du soufre dans les fumées sera réalisée dans quelques années. 6. La création de nouvelles variétés de plantes de cultures annuelles, capables de prospérer dans des sites pollués doit entraîner une diminution des dommages en milieu agricole. 7. En matière d'essences forestières, la création de variétés nouvelles est déjà bien amorcée. On peut cependant craindre que la solution intervienne trop tardivement pour assurer la sauvegarde de nombreux massifs résineux déjà gravement endommagés.
11 n'est pas douteux que la coordination des efforts doit conduire à une atténuation sensible des dommages causés par les polluants de l'air à la population, aux animaux et aux végétaux. Sous réserve que l'industrie poursuive ses recherches, mette en oeuvre les techniques modernes d'épuration, et consente les efforts financiers correspondants. Ce sont toutes des mesures que l'on est en droit d'attendre, sinon d'imposer par voie législative, en vue d'assurer le bien-être des populations urbaine et rurale ainsi que la sauvegarde d'un patrimoine collectif.
24

Summary Damage to plants and animals by air pollution in Europe
All specialists agree on the harmfulness of industrial gaseous and solid wastes in the air from factories. Sulphur dioxide and fluorine compounds are especially important as plant toxins. Stockhardt started investigations on this subject in the Forestry Institute at Tharandt already in 1860.
Picea abies, Abies alba and Pinus sylvestris, by far the most important trees cultivated in Central Europe, are highly susceptible to these two pollutants. The damage caused by them reaches such alarming proportions that in many areas the existence of forests of these species is endangered. The statistics collected in 1961 releaved that a forest area of 200,000 ha was polluted; later on (in 1967) the estimate reached 300,000 ha, excluding industrial areas of Rumania, Switzerland, the northern countries and France. The actual total probably approaches 400,000 ha.
In agriculture the effects are less spectacular because growing conditions are artificially improved in various ways. Also the fact that crops are usually annual restricts the influence of a very unfavourable year to that year.
The influence of fluorine on animal teeth and bones is well known. The effects can be partly averted by adding correct amounts of phosphate and calcium to the ration by supplying feedstuffs containing sufficient minerals, or by feeding on uncontaminated food from othtr areas. Often it is possible to switch from livestock to arble faraming.
Most studies have been on absorption of pollutants, their transport in leaf parenchyma and their effects on assimilation, respiration and other physiological processes.
Studies are in progress on the influence of fluorine pollution on the mechanical properties of softwoods.
High concentrations of fluorine cause necrosis and sometimes kill of certain conifers. Attempts have been made in Germany and the United States to select varieties resistant to such concentrations (they have to be vegetatively multiplied afterwards;. It may be equally important to study the same problems in annual crops.
In the United States and in Germany trials are in progress on the detection of forest areas attached by pollution by infrared aerial photography.
Zusammenfassung Überblick über die Schäden bei Pflanzen und Tieren durch Luftverunreinigung in Europa und ihre Bewertung
Alle Fachleute stimmen darin überein, daß gasförmige und feste Bestandteile der Abluft industrieller Anlagen schädigend Wirken. Als phytotoxische Stoffe sind dabei Schwefeldioxid und Fluorverbindungen besonders wichtig. Stockhardt begann bereits 1860 in der Forstanstalt zu Tharandt mit Untersuchungen auf diesem Gebiete.
Picea abies, Abies alba und Pinus sylvestris, bei weitem die wichtigsten Kulturbäume in Mitteleuropa, sind gegenüber diesen beiden Luftverunreinigungen in hohem Maße empfindlich. Die durch sie verursachten Schäden erreichen solche alarmierenden Ausmaße, daß in vielen Gebieten der Bestand von Wäldern dieser Arten gefährdet ist.
25

Erhebungen aus dem Jahre 1961 wiesen ein Waldgebiet von 200000 ha als immissions-beeinflußt aus; später (1967) ergab die Schätzung 300000 ha, wobei Industriegebiete Rumäniens, der Schweiz, der nordeuropäischen Staaten und Frankreichs noch nicht berücksichtigt sind. Gegenwärtig mag die Gesamtfläche 400000 ha betragen.
In der Landwirtschaft sind die Auswirkungen weniger auffallend, zumal die Wachstumsbedingungen in vielfältiger Weise künstlich verbessert wurden. Auch handelt es sich hier gewöhnlich um einjährige Pflanzen, was die Auswirkungen eines sehr ungünstigen Jahres eben auf dieses Jahr beschränkt.
Die Fluor-Wirkung auf Zähne und Knochen von Tieren ist gut bekannt. Sie kann teilweise durch Zugabe bestimmter Phosphat- und Kalziummengen zum Futter, durch mineralstoffreiche Futtermittel oder durch Umstellung auf einwandfreies Futter aus anderen Gebieten vermieden werden. Oft ist es möglich, von der Viehhaltung auf Ackerbau überzugehen.
Untersuchungen wurden hauptsächlich durchgeführt über die Aufnahme von luftverunreinigenden Stoffen, ihren Transport im Blattparenchym und ihre Wirkung auf Assimilation, Atmung und andere physiologische Prozesse. Auch sind Forschungsarbeiten im Gange über den Einfluß der Luftverunreinigung durch F-verbindungen auf die mechanischen Eigenschaften von WeichhöJzern. Hohe F-Konzentrationen verursachen Nekrosen und lassen manchmal gewisse Koniferen absterben. Es wurden in Deutschland und in den Vereinigten Staaten Versuche unternommen, gegenüber solchen Konzentrationen resistente Varietäten (diese müssen nachher vegetativ vermehrt werden) zu selektionieren. Es mag in gleicher Weise von Bedeutung sein, dieselben Probleme bei einjährigen Nutzpflanzen anzugehen.
In den USA und in Deutschland wird zur Zeit geprüft, inwieweit immissionsbeein-flußte Waldflächen mittels Infrarot-Luftaufnahmen festgestellt werden können.
26

Aluminium plants and conifers in Norway
H. Robak
Forest Research Institute of West-Norway, Stend, Norway
Abstract
Quantities of fluorine from aluminium plants polluting the air vary in Norway from 7-10 to 27-30 kg per hour. In some cases F destroyed Pinus sylvestris forest at 10-13 km distance; visible damage was observed even at 32 km. In Picea abies damage varied considerably, and diseased trees occurred till 10 km; needles showed to contain considerable Quantities of F. Picea sitchensis showed damages, whereas Larix decidua and L. leptolepsis seem to be rather resistant. Abies species vary, other Picea species and Larix sibirica are rather susceptible.
A tentative classification according to their resistance is given for ten conifer species, tested on experimental plots under unfavourable conditions.
Before the second world war damage caused by fluorine in fumes from aluminium plants to forests in Norway has been negligible. But in the years just before and after 1950, the establishment of two larger plants led to the complete destruction of some hundred hectares of natural Scots pine forests (Pinus sylvestris), and only the small size of this forest area prevented losses on a much larger scale.
When, somewhat later, the establishment of another plant was considered in a valley with large areas of productive Norway spruce (Picea abies), the inhabitants
-"protested. This resulted in the establishment of an official committee to study eventual damages caused by this plant, consisting of a specialist in chemical engineering, one in veterinary medicine and the author as a forest botanist. Later on, this committee had to deal with nearly all our aluminium plants, regardless of age and type.
Among the present plants at the moment five have a production over 30,000 tons a year. Their total capacity is just below 400,000 tons. Two use only Soderberg anodes, one only prebaked and two use both types together. In the S0derberg ovens the gas is sucked off just above the bath surface and passes through burners into the filter and scrubber system. In the plant using only prebaked anodes all the gas spreads into the hall atmosphere; on its way upwards it passes through finely meshed structures, is absorbed by water sprays, and then (in a dissolved or suspended condition) passes through chutes into the scrubber system. Instead, in two plants using Soderberg ovens the residual is caught by means of vigorous ventilator systems through which it moves to the filter and scrubber system.
Depending on the plant and the year of observation, the average emission of fluorine varied from about 8-10 to about 27-30 kg per hour. The damage caused by
27

these quantities depends on the situation of the plant: steep and narrow values are unfavourable, open country near the sea is favourable. A moderate to high rainfall (1000-2000 mm a year) decreases the damage; in both respects the largest plant is badly situated (very deep and narrow valley, annual precipitation about 600 mm).
In the environment of five plants (three of them large) natural pine forests (Pinus sylvestris) occur, in the case of another large plant natural spruce forests (Picea abies) are present. Planted conifers (spruce and exotics) occur in the neighbourhood of all plants.
The inspection committee collected samples of leaves, needles, grass, and hay to determine the fluorine contents and, where damage occurred, to identify the type of damage.
The following is based on the results of this work, not on experiments, the only exception being a series of experimental plantations.
Natural pine forest was in all cases noticeably damaged, in three cases even completely destroyed. Depending on the quantity of removed fluor and the configuration of the surroundings, the maximal distance to which visible injury was registered on pine forest varied between 2 and 32 km. It is doubtful, however, whether damage of any importance to pines has ever occurred with a fluorine content of the current year's needles below about 40 p.p.m.
Norway spruce is just as badly off or even worse. In the only case of a spontaneous spruce forest, this forest still showed visible signs of damage at about 10 km from the plant, whereas the scattered stands of Scots pine were hardly affected beyond 4 km. Damage to spruce concerned an area of 100-200 ha within which the fluorine content of the current year's needles always exceeded 15-20 p.p.m. and that of the last year's needles 25-35 p.p.m. But only 10-20 ha were very severely affected, i.e. showed a noticeable percentage of dying trees and a substantial loss in volume increment: this referred to an exposed site about 4 km from the plant. Here, the current year's needles showed 25-45 p.p.m., those of the last years 80-120 p.p.m. of fluorine. The plant in question emitted during the first five years less than 10 kg per hour, whereafter doubling of the production led to a temporary increase. Still this plant emits less fluorine than the other larger works, possibly with the exception of that started in summer 1967. For the latter it is only known that a sitca spruce (Picea sitchensis) plantation in its close vicinity was conspicuously damaged (despite the fact that the situation was favourable: this plant is situated in very open country).
An important question is whether damage even to the most sensitive plant species (among them our most important conifers) is avoided when the emission is brought down to about 8 or even 6 kg per hour. Provided weather and relief conditions are not too unfavourable, the answer is probably in the affirmative as far as the average emission is concerned. But even a temporary raise above this level may cause considerably damage, and such incidental increases due to temporary technical troubles in the filter and scrubber system or even in the routine of the furnace hall work itself can never be avoided.
Though in the most modern plant mentioned above the average emission per hour showed only a negligible variation over the years, the F-content of spruce needles in
28

its surroundings exhibited a noticeable variation. In how far climatic influences are responsible for this variation is not known, but, owing to weather conditions during two successive winters, the consumption of electric energy had to be reduced and 20 to 30 ovens had to be switched off and later on to be restarted. The first year this happened in April, when spruce is still in state of dormancy so that its F-uptake must have been low. In the second year this occurred in May-June, and the F-content in the needles was higher than in any other year until the plant doubled its production three years later. Though this provides no conclusive proof, it indicates that restarting ovens during the growing season may considerably affect the spruce forest.
It may be remarked that the forest, beginning about 3 km from the plant was not visibly damaged in these cases. But street and garden trees in the closer neighbourhood were, already from the start of the plant.
The conclusion is that none of the larger aluminium works in Norway have been able to avoid some damage to the more sensitive conifers in their close vicinity, i.e. (with one exception) within the nearest two kilometers from the smoke outlet. Chances do not seem very great either, that by means of technical measures such damage can be prevented in the near future, except where climatic and relief conditions are very favourable.
Therefore its is necessary to switch over to more resistant tree species. From 10 small experimental plantations established during the years 1958 to 1960 in one of the most exposed valleys, the following preliminary classification can be drawn up:
without any injury: Larixclecklua almost without any injury : Tsuga heterophylla resistant, though almost every needle tip slightly burned: Abies nordmanniana,
A.procera,A.concolor sensitive to very sensitive: Abies alba, Pseudotsuga menziesii, Picea abies, P. engel-
mannii, P. omorica The results conform our field observations: Larix dévalua and L. leptolepis have
aiways remained remarkably free from damage, even under unfavourable exposure conditions.
So far no attemps have been made to select and propagate relatively resistant individuals, although (especially in Picea abies) a remarkable variation exists, as well in Norway as in Central Europe.
Resume Les fabriques d'aluminium et les conifères en Norvège
Actuellement la Novège possède huits fabriques d'aluminium, utilisants différents types de fours, de systèmes d'arrêt et d'épuration des gaz, la moyenne des émissions de fluor variant de 7-10 à 27-30 kg à l'heure.
Cinq fabriques sont situées près des forêts de Pinus sylvestris. Dans deux cas ces forêts ont été détruites presque totalement jusqu'à environ 10 et 13 km et des dommages visibles ont été observés sur les aiguilles à quelques 32 km de distance à la direction principale des courants aériens. Dans les aiguilles visiblement atteintes
29
de l'année en cours on n'a guère trouvé nulle part de valeurs inférieures à 40-50 p.p.m. de F. Dans les autres cas les dommages étaient variables.
La même variabilité a été observée aux plantations de Picea abies, dont la diversité dans le type et dans l'ampleur des dommages étaient encore plus frappantes. Autour de la fabrique dont l'émission de fluor était la plus faible la forêt a été durement atteinte et en points très exposés on a trouvé ça et là des arbres atteints jusqu'à 3} et 10 km, Dans le premier cas les aiguilles de l'année en cours contenaient 25-45 p.p.m. de F et. celles de l'année précédente de 80-120 p.p.m.; dans l'autre cas 15-20 et 25-35 p.p.m.
Aux alentours de la fabrique la plus moderne et très bien placée, les plantations de Picea sitchensis situées à proximité immédiate ont été endommagées.
Larix decidua et L. leptolepis n'ont subi que peu de dommages. Les diverses espèces de sapins ont une résistance variable, et certains espèces d'épicéas, de même que Larix sibirica se sont révélées assez sensibles.
Dix expériences entre 1958 et 1960 dans l'une des zones les plus exposées permettent d'établir provisoirement le classement suivant: très resistant: Larix decidua, Tsuga heterophylla; resistant: Abies nordmanniana, A. procera, A. concolor; sensible: Abies alba, Pseudotsuga menziesii, Picea amorica, P. engelmannii, P. abies.
Aucun système d'arrêt ou d'épuration des gaz a réussi à protéger les conifères sensibles situés à proximité des fabriques. Un relief défavorable permis aux dommages de se produire à plusieurs kilomètres. Les risques sont particulièrement élevés au moment de la mise en route, pendants les périodes de retombées et lors de la remise à feu d'un grand nombre de fours.
Zusammenfassung Die Aluminiumhütten und die Koniferen in Norwegen
Norwegen besitzt derzeit acht Aluminiumhütten mit verschiedenen Ofentypen deren Auswurf an Fluor liegt zwischen 7-10 and 27-30 kg/h (bisweilen wahrscheinlich noch höher).
Fünf von diesen Hütten liegen bei Kiefernwäldern (Pinus sylvestris). In zwei Fällen waren diese Wälder völlig zerstört bis auf eine Entfernung von 10 bis 13 km; einmal wurden sogar Schäden auf 32 km beobachtet in die Richtung der vorherrschenden Winde. Andererseits wurden in entgegengesetzer Richtung in de Nähe der Hütte kaum betroffenen Bäume beobachtet. Bei den sichtbar geschädigten einjährigen Nadeln fänden sich kaum Werte unter 40-50 p.p.m.
Bei Fichte (Picea abies) sind die Unterschiede noch deutlicher. In der Umgebung des Werkes mit dem geringsten Fluorauswurf wurde diese Baumart schwer geschädigt an einem stark exponierten Ort in 3,5 km Entfernung; hier und da fanden sich, je nach Orogranhie und Milieu, noch Schäden bis auf 10 km. Im ersten Falle enthielten die 1-jährigen Nadeln 25 bis 45 p.p.m. Fluor, die 2-jährigen 80-120 p.p.m.; im letzten Falle waren die Zahlen 15-20 p.p.m. und 25-35 p.p.m.
In der Umgebung eines neuen Werkes moderner Ausstattung und günstiger Lage wurde in dessen unmittelbarer Nähe die Pflanzungen von Sitkafichten (Picea sitchensis) geschädigt; der Auswurf an Fluor ist noch nicht bekannt. Bei den anderen exotischen
30

Koniferen haben die Lärchen (Larix decidua und L. leptolepis) nur wenig oder keine Schäden gezeigt. Die verschiedenen Tannenarten {Abies spp.) zeigen eine wechselnde Resistenz und verschiedene Picea-AvXtn, wie auch die sibirische Lärche (Larix sibirica), zeigten sich ziemlich empfindlich.
Die Beobachtungen reichen noch nicht völlig aus, aber folgende Klassierung kann vorläufig aufgestellt werden : sehr resistent : Larix decidua, Tsuga heterophylla; resistent (aber fast alle Nadeln zeigen Spitzenschäden): Abies nordmannia, A. procera, A. concolor; empfindlich bis sehr empfindlich: Abies alba, Pseudotsuga menziesii, Picea omorica, P. engelmannii, P. abies.
Es ist klar, daß kein Reinigungsverfahren die in der nächsten Nachbarschaft großer Werke stehenden Koniferen vor beachtlichen Schäden bewahren kann, wie günstig auch die Boden- oder Reliefverhältnisse sein mögen.
Die Schäden sind besonders hoch bei Inbetriebnahme, bei Störung und bei erneuter Inbetriebnahme einer großen Zahl Öfen.
31
Biochemische Phenomäne im Boden Exhalationsgebiete
F. Pesek
Pedagogickä Fakulta v Üsti nad Labem, Ceskoslovensko
Kurzfassung
Unter Einfluß industrieller Exhalationen treten im Boden Verhältnisse auf die Anlaß geben zu spezifischen qualitativen und quantitativen Änderungen die das Gepräge des umgebenden Industriegebietes tragen. Die Prozesse sind Anfangs chemischer Natur, aber sie geben sofort Anlaß zu Veränderungen in biologischer Hinsicht, speziell durch eine Versäuerung des Bodens.
Das Studium dieser Prozesse und deren biochemischen Folgen soll informatives Grundmaterial liefern für die Lösung weiterer Probleme die zusammenhangen mit physiologischen Pflanzenkrankheiten und Überflüssen an Mikroelementen im Boden. Dabei handelt es sich nicht nur um die Feststellung von Toxizitätsgrenzen sondern auch um Signalisierung, Diagnostik, Prognose und Therapie dieser Exhalationsschädigungen.
Die Problematik der Bodenvergiftungen bezieht sich vor allem auf zwei Aspekte: (1) die biochemische Typologie der verseuchten Böden und (2) ihr geographisches Vorkommen, die Entwicklung ihrer Eigenschaften in der Zukunft, und die Prognose für eine eventuelle Ausbreitung. Für das Studium der mit diesen Aspekten zusammenhangenden Fragen ist das Kenntnis der Konzentrationen der durch den Industrieanlagen produzierten Abfallstoffe notwendig, und in vielen Fällen muß auch die un-genügnende Ausrüstung der Industrie gewiesen werden. Einige Beispiele zeigt Tabelle 1 tur aufgefangene festen Luftverunreinigungen.
Die langfristige Anhäufung mechanischer Wegfiüge verursacht dauernde biochemische Änderungen der Zusammensetzung des Bodens und führt in extremen Fällen zu einer Exhalationsdegradation. Der Gefahr einer solchen Degradation sind vor allem sauere Böden ausgesetzt, besonders wenn es sich handelt um Anhäufung schwerer toxischer Metalle (Pb, Hg, Zn, Sn, Mn, usw.) und Halogene (Cl, F).
Unter dem Einfluß der Exhalationen bilden sich Gebiete mit spezifischen biologischen Bodeneigenschaften welche qualitativ und quantitativ das Gepräge des korrespondierenden Industriegebietes tragen. Durch diesen Prozessen entsteht die Gefahr daß langfristig, das heißt auf Böden auf welche längere Zeit eine hohe Emissionskonzentration einwirkte, eine Herabsetzung der Fruchtbarkeit und physiologische Erkrankungen auftreten durch Überfutterung der Pflanzenkulturen mit Mikroelementen. Die Symptome für den verschiedenen toxischen Stoffe und deren Konzentrationen sind nur noch annährend bekannt.
Die biochemischen Änderungen im Boden sind dadurch kompliziert, daß anfangs
33

É Beschädigung durch Luftverunreinigung von Fichtenwald im Erzgebirge (nordwest Böhmen).
34

Tabelle 1. Feste Luftverunreinigungen im nordwest Böhmen (Region Krusné hory), in Tonnen pro Jahr.
Elektrizitätswerk
Komofany
Ervënice Trmice Us t in .L . Teplice Hrdlovka Staza
Insgesamt rund
Menge
115800 234350 48000 4050 1700 1200
340000
754000
Aufgefangen
46600 152000 20000
550 700
— 293000
512000
Zerstreut
69200 82350 28000 3 500 1000 1200
47000
242000
eine völlige Überdeckung der seltenen Elemente auftritt die in der Vergangenheit der Aufmerksamkeit entgingen (Se, As, Li, Rb, Cs, Be, Ba, Ra, Sc, Ga, Y, Ti, Zr, Hf, Th, Nb, Sb, Ta, Te, V, Po, Re, Ru, Rh, Os, Ge, W, usw.). Für den meisten dieser Elementen ist die physiologische Wirkung für die Vegetation nicht bekannt. Die Tabelle 2 gibt einige Daten. Außerdem wurden im Ruß die folgenden Kohlenhydrate angetroffen : Anthracen, 3,4-Benzpyren, 1,2-Benzantracen, Pyren, Perylen, Coronen, 3,4,9,10-Di-benzpyren, 1,12-Benzperylen, Fluoranthen.
Die Existenz von Arealen vergifteten Böden und ihr allmähliches Anwachsen ist abhängig von der Zeit und von der künftigen Konzentrationen der Schadstoffe in den Exhalationsgebieten. Es tritt eine lokale Anhäufung von Mikroelemente auf die durch die Versäuerung des Bodens durch die Gasbestandteile beschleunigt wird. Die Zahl und die Produktion der einzelnen Exhalationsquellen sind wesentliche Faktoren bei der Entstehung der lokalen biochemischen Bodenerkrankungen. Eine Prognose zu geben ist aber in den meisten Fällen sehr beschwerlich, den dazu braucht man für jede Pflanzenkultur das Kenntnis der physiologischen 'Schwelle', und die Toxizitätsgrenzen der verschiedenen Stoffe exhalativen Ursprungs für die Pflanzen sind nicht genügend bekannt, wie auch im Jahre 1964 auf der Internationalen Konferenz in Straßburg über die verunreinigte Atmosphäre festgestellt wurde.
In allen Industriegebieten sollen die erwähnten Bodenverunreinigungen bestimmt und kartiert werden nach Typen gegründet auf die qualitative und quantitative
Tabelle 2. Durchschnittliche Zusammensetzung der Aerokolloiden in der Region Stadt Prag.
Elemente
Ca, Si, AI
Fe, Br, K, Na, Mg
Zn .T i , P b . A g . C u As, Be, Ge , Co , Mn, Mo, Sn, V
Menge-Anteil (%)
> 1 0 1-10
0.1-1,0 < 0 , 1
Bestandteile
Kiesel S iO,
AUO. FeäOs Alkalimetallen und Mg
Zn, Ti, Pb, Cu, As, Be, Co , Mn
Ag i, Mo, Sn, V
mg /m '
0,090 0,060 0,060 0,045 0,010 0,0005 0,00005
35

Tabelle 3. Übersicht der Kombinationen von Elemente die in Mengen zwischen 0,01 und 1,0° erkrankten Böden in die Region Böhmen angetroffen wurden.
Kombinat ion
Mg Mg.Ti Mg, V Mg, B
Mg, Mn Mg, Mn. V Mg, Mn .T i
Mg, Mn, Cu, Sri Mg, Mn, Cr. Ni Mg, Mn .T i , V Mg, Mn, N i .T i Mg, Mn .T i , Pb Mg, Mn, Co .T i , V Mg, Mn, Cr, Cu, V Mg, Mn, Cr. N i .V Mg, Mn, C r .T i , V Mg, Mn, Ti, V, Ba Mg. Mn, B, Ti, V Mg. Mn, Cr, N i .T i . V
Areal in km2
380 1
32 23
2761 186
5436 150 305 525 261 96
372 51 15
194 26
1156 8
Kombination
Mg, Mn .T i , V . B a . S r Mg, Mn, Cr, N i .T i , V, Ba Mg, Mn. Co, Cr, Cu, Ni, V Mg, Mn, Cu, V
Mg, Mn, Cu ,T i Mg. M n . C o . B Mg, Mn .Zn , V
Fe, Mg, Mn Mg, Mn, As Mg, Mn, C r .T i , Ni
Mg, Mn, Cr Fe, Mg, Mn, Ti Mg, Mn, C r .T i , N i . V . Z n
Mg, Mn, Cr, B Mg, Mn, Ti, Co Mg, Mn, Cr. V. Zn, B Mg, M n . C r . V . C u . Z n , B
Mg, Mn .T i , Cr Mg, Mn, Zn
Areal in km3
32 116 12
236
48 18
24 52 68
32 29 50 48 80 30 16 36
82 190
Zusammensetzung an lösbaren Komponente. Eine Reihe Beispiele gibt Tabelle 3. Derartige Daten bilden das Grundmaterial für die Lösung weiterer Probleme in der
Entstehung und Erscheinung physiologischer Pflanzenerkrankungen hervorgerufen durch einen Überfluß an Mikroelementen im Boden. Das bezieht sich nicht nur auf die Feststellung der Toxizitätsgrenzen und physiologischen Schwellen, sondern auch auf eine erweiterte Signalisierung, Diagnostik, Prognose und Therapie in Exhalationsge-bieten. Die Typologie und Systematik der biochemischen Bodenerkrankungen für die Verhältnisse in der Tschechoslowakei sind bearbeitet und stehen Interessanten zur Verfügung.
Mit der Typologie und Systematik der durch Exhalationen verursachten biochemischen Bodenverunreinigungen hängt die Technik der Signalisierung und Prognose der Modifikationen in der Vegetation zusammen. Es handelt sich bei der Lösung derartiger Probleme um sehr schwierige Fragen.
Als empirische Formel für die Prognose der Sterilität des Bodens der Vegetation gegenüber, oder mindestens zu einer durchgreifenden Herabsetzung der Produktionsfähigkeit des Bodens führend, wird die folgende allgemeine Formel vorgeschlagen:
Fpm - S A + V
Darin ist Kdie anfängliche Konzentration des phytotoxischen Stoffes, A die Konzentrationssteigerung im Bodenprofil im Prozentsatz an phytotoxischen Stoffe für die betreffende Zeilspanne (n Jahre), und Fp„, die Konzentration im Moment worin die physiologische Schwelle (Fp) für eine bestimmte Pflanze auf bestimmtem Boden
36

erreicht wird. Prognosen sollen gemacht werden auf Grund von Signalisierungscharacteristiken,
prozentische Ausgangskonzentrationen der phytotoxischen Stoffe im Wasserextrakt des Bodenprofils des betreffenden Gebietes, und den Konzentrationszuwachs der toxischen Stoffe während bekannte Zeitabschnitte.
Die bisherigen Feststellungen bestätigen, daß die Pflanzen das mikroelementare biochemische Gepräge tragen tragen der Verunreinigungen des Bodens, daß sie aber auch fähig sind, manche Mikroelemente aus der Atmosphäre die nicht in den Boden eindringen konnten, oder die sich in unlöslicher Form im Boden befinden, aufzunehmen. Deshalb ist die Kenntnis der exhalativen biochemischen Bodenverunreinigungen und des Kreislaufes deren Mineralstoffe für die Gesundheit der Pflanzen, Tiere und Menschen sehr bedeutend, insbesondere ihre weitere Ansammlung im Boden.
Summary-Biochemical phenomena in soils in exhalation areas
The continuous long-term action of poisonous dust and gases on the soil causes permanent chemical changes. Even micro-elements accumulate, but about their influence little is known when they occur in combinations.
Investigations in Bohemia have resulted in an empirical formula to calculate when the soil has become entirely sterile (the physiological threshold), or the moment a serious reduction occurs in yield (based on the correlation between qualitative and quantitative composition of the soil and matter toxic to plants). In symbols this formula is :
Fpm = S A + V n
in which V is the initial concentration of the toxic matter, A its annual or periodic increase in the profile as a percentage of the concentration Fpm at the physiological threshold (Fp), which is reached after n years.
The damage to the soil has to be described for the various regions, and then a classification ha? to be devised based on the water-soluble constituents in the soil.
These investigations form the base for the solution of the problems pertaining to physiological diseases caused by excess of micro-elements (diagnosis, symptomatology), the estimation of toxic limits, and even for the solution of more basic problems such as the signalization, the diagnosis, the prognosis and the therapy in exhalation regions.
The accumulation of micro-elements is accelerated by soil acidity from the gaseous and solid exhalations themselves.
Forecasting will remain very difficult, even if the thresholds for the various plants become known.
37

Résumé Phénomènes biochimiques du sol dans les régions d'exhalation
L'accumulation concentrée à long terme des exhalations solides et des gaz délétères dans le sol provoque des transformations biochimiques permanentes. Même les éléments observés dans les émissions en quantités de trace s'accumulent dans le sol. On ne connaît pas encore l'influence de ces éléments sur les plantes quand ils se trouvent dans le sol en combinaisons spécifiques.
Selon les résultats de recherches en Bohême il est possible de poser une formule empirique pour déterminer le moment de la stérilité du sol, éventuellement pour déterminer le moment d'une réduction importante de la production (basée sur la corrélation avec la composition qualitative et quantitative des matières phytotoxiques solubles qui se trouvent dans le profil du sol. En symboles mathématiques le résultat peut être formulé comme suit :
Fpm = S A + V n
Dans cette formule V présente la concentration initiale de la matière toxique, A l'augmentation de la concentration dans le profil du sol comme pourcentage des matériaux phytotoxiques pour l'intervalle relatif (n ans), et Fpm la concentration au moment où elle atteint au seuil physiologique (Fp) d'une certaine plante sur un sol spécifique.
Avant tout, les 'maladies' du sol devraient être différenciées selon le territoire, et alors on devrait composer un système typologique d'après les quantités des constituants hydrosolubles présents dans le sol.
Ces travaux constituent les bases fondamentales d'information pour la solution des problèmes de la formation des maladies physiologiques causées par un excès des microéléments (leur diagnostic, leur Symptomatologie), pour la détermination des limites de toxicité et du seuil physiologique, et même pour la solution des problèmes plus larges de la signalisation, du diagnostic, de la prognose et de la thérapie dans les zones d'exhalation.
Le procès d'augmentation des microéléments dans le sol est accéléré par l'acidité du sol causée par les composants gazeux et solides des exhalations.
Le pronostic du procès susdit est très difficile, même en supposant la connaissance des seuils physiologiques des plantes.
Literatur
Halacka, K., V. Benes und F. Görner. 1965. Ûeskoslovenskâ Hygiena 10: 175-83 Hokes, E. S. 1960. Arsén. VUE(Praha): 1- 70. Kleckovskij. V. M. und I. V. Guljakin. 1958. Pocvovedenije 3: 1-16. Kostâl.J. 1959. Vyzkumnyûkolc. 1,58 102/11. Mafan, B. 1959. Sbornik Rostlinnà vyroba 5: 1347-62. Nëmec, A. 1952. Prâce VU lesnickychÖSR 1 : 167-227. Pesek. F. 1960. Sbornik lesnictviCSAZV6: 365-74. Pesek, F. 1963a. Mykologicky sbornik 40: 97-103. Pesek,F. 1963b. Lesnoi zurnal (Archangelsk) 3: 19-20. Pesek. F. 1964a. Za vysokou urodu 11: 431 - 2 .
38

Pesek, F. 1964b. Ceskâ mykologie 18: 232-3. Pesek, F. 1964c. Mykologicky sbornik41: 50-1. Pesek, F. 1964d. Mykologicky sbornik 41: 75-7. Pesek, F. 1964e. Listy cukrovarnické 80: 49-50. Pesek, F. 1965. Rostlinnà vyroba 11: 837-52. Pesek, F. 1966a. Acta Agron. hung. 15:45-8. Pesek, F. 1966b. Sbornik Pedagogické fakulty v Usti n.L.,fada pfirodovëdnà 8: 113-122. Pesek, F. 1967a. Vyskyt Cu, Cr, Co, Sr, Zn, Ti, Pb, Mn, Ni, V, Sn, Fe, Ba, Mg, As, B v ornicich
vzniklych na zvëtralinovém plâsti a kvartérnich pokryvech v oblasti Ceské vysociny. (Disertacni pràce) Vysokâ skola zemëdëlskà v Praze, agronomickâ fakulta 1-300.
Pesek, F. 1967b. Rostlinnà vyroba 13: 153-4. Pesek, F. 1968a. Friesia (in Druck). Pesek, F. 1968b. Phytopath. Z. 62: 149-68. Pesek, F. und V. Kolsky. 1967. Rostlinnà vyroba 13: 445-62. Pour, B. 1962. Ochrana pfirody 17:4-6. Vorâcek.V. 1962. Studijni informace UVTI MZLVH2: 1-23.
39

Influence des pollutions industrielles sur les communautés animales et l'utilisation des animaux comme bioindicateurs
Eliska Novâkovâ
Institut pour l'aménagement et la conservation du territoire (Üstav pro tvorbu a ochranu krajiny), Ceskoslovenskâ Akademie Vëd, Ricany, Praha-Vychod
Sommaire
Le lièvre commun semble être un animal bien utilisable dans le dépistage de l'aire polluée. Comme bioindicateurs accessoires possible se sont manifestés certain éléments de l'érythrogramme (hémoglobine, hématocrite, event, saturation globulaire), la réaction de l'urine et le coefficient de reproduction.
Dans les communautés d'Arthropodes soumises à des immissions industrielles on assiste à des apprauvrissements quantitatifs et même qualitatifs et à des déplacements dans la dominance des espèces, ou dans l'abondance relative des phytophages et des zoophages.
L'influence des pollutions industrielles sur les communautés animales et l'utilisation des animaux comme bioindicateurs des altérations dans la nature commence à être étudiée seulement dans les derniers temps.
Comme 'cobayes paysagistes' dans la détection des effets des pollutions industrielles dans la nature on choisira les espèces qu'on peut se procurer facilement et qui peuvent servir à des contrôles en séries. Nous avons obtenu de bons résultats avec le lièvre commun.
Notre première attention s'est portée à l'examen du sang, car beaucoup de réactions prépathologiques se manifestent dans l'hémogramme, comme l'ont démontré les recherches sur les éléments sanguins de populations enfantines dans les centres industriels (Symon et al, 1960).
L'analyse effectuée sur un échantillon de 1373 lièvres, abattus au cours des chasses automnales, a avéré l'utilisation possible de certains éléments de l'érythrogramme (hémoglobine, hématocrite, éventuellement saturation globulaire), dont l'étude est simple et facile, comme indicateurs biologiques accessoires dans la détermination spaciale de l'influence nocive des pollutions industrielles ou de certains pesticides, notamment de l'Endrin.
Dans les localités appartenant àl'é cosystème des Fageto-Querceta si les immissions solides dépassent le double ou atteignent le triple de la norme hygiénique de 150 t/km2/ an, elles ont une influence nettement négative : chez les jeunes lièvres la quantité de l'hémoglobine est de 12,5 g% au lieu de 15,3 g%, chez les adultes de 12,4 g% au lieu de 15,6 g %; la valeur de l'hématrocrite est, chez lesjeunes de 45,0% au lieu de 50,4%, chez les adultes de 44,4 % au lieu de 51,2 %, cependant que les pollutions gazeuses de la même intensité produisent un très léger écart positif.
41

Les infestations mixtes plus fortes sont suivies de baisses générales des valeurs de l'hémoglobine et de l'hématocrite. Les femelles semblent avoir une réaction plus prononcée que le mâles : chez les jeunes hases la différence des moyennes par rapport aux valeurs de contrôle est ou positive ou plus faiblement négative que chez les bouquins; par contre, dans la population adulte, la baisse est plus manifeste, comme si on avait affaire à un épuisement des capacités hématopoïétiques. Étant donné la hausse de la quantité de l'hémoglobine dans ces régions polluées d'anhydride sulfureux, on doit se demander si les valeurs données par l'hémoglobinemètre équivalent à la teneur en hémoglobine normale ou si l'on n'y a pas, en plus, affaire à certains dérivés pathologiques, sulfe-hémoglobine par exemple. L'emploi de cette méthode nécessite la détermination des éléments de l'érythrogramme en question séparément pour les principaux écosystèmes, car leur influence s'est montrée très importante (Novâkovâ, 1968; Novâ-kovâetHanzl, 1968).
Quant à l'Endrin, tôt après son application, les valeurs de l'hémoglobine et de l'hématocrite sont nettement plus élevées, par contre, plusieurs semaines après le traitement, elles sont sensiblement plus basses et à écart-type plus important que dans les chasses témoins.
Une autre méthode qui semble promettre un usage commun est l'analyse de l'urine, spécialement de sa réaction. D'après les prélèvements que nous avons faits jusqu'à présent (tableau 1 et 2), le pH oscille avec le type et l'intensité des pollutions et non avec la réaction d'échange dans la couche surperficielle du sol. Les lièvres vivant dans la proximité de cimenteries avaient une urine significativement plus alcaline (de 8,5 %) que ceux des régions de contrôle. Par contre les pollutions riches en anhydride sulfureux produisent un déplacement du pH vers la gauche (réaction plus acide de 3,4 %). Une application de l'Endrin contre les menus rongeurs a une influence analogue, mais moins grande (2,2 %) et moins significative.
On n'a pas pu démontrer un effet néfaste des pollutions industrielles sur le poids de
1806 lièvres adultes. Seulement dans les localités très empestées de poilu-
Tableau 1. Le pH de l'urine et la réaction d'échange dans la couche superficielle du sol.
Réaction
alcaline
du sol
faiblement acide
acide
total
Animaux
juvéniles adultes total juvéniles adultes total juvéniles adultes total
juvéniles adultes total
Pièces contrôlées
162 160 322 31 36 67 74 64
138
267 260 527
pH moyen de l'urine
7.36 7,33 7.35 7,02 7.12 7,07 7,47 7.21 7,35
7.35 7,27 7,31
a
0,66 0.63 0,64 0,71 0,77 0,74 0,79 0,76 0,79
0,71 0,68 0,70
D%
—4,6 —2,8 —3,8 + 1,4 —1.6
0
Signification P
0,01 0.10 0,01
>0.1 >0,1 >0,1
42

Tableau 2. Le pH de l'urine dans les régions polluées et de contrôle.
Réaction du sol Pollutions
alcaline contrôle
solides (ciment)
mixtes (cendres + SO.
pesticides (Endrin)
faiblement acide contrôle
mixtes (cendres + SO.)
pesticides (Endrin)
total contrôle
solides (ciment)
mixtes (cendres + ciment)
pesticides (Endrin)
Animaux
juvéniles adultes total juvéniles adultes total juvéniles adultes total juvéniles adultes total
juvéniles adultes total juvéniles adultes total juvéniles adultes total
juvéniles adultes total juvéniles adultes total juvéniles adultes total juvéniles adultes total
Pièces contrôlées
162 160 322 61 57
118 82 96
178 89
132 221
31 36 67 17 33 50 34 77
111
267 260 527 61 57
118 99
129 228 123 209 332
pH moyen de l'urine
7.36 7.33 7,35 7,94 7,92 7,93 7,06 7,05 7,05 7,25 7,25 7,25
7,02 7,12 7,07 7,15 7,03 7,07 6,94 6,96 6,95
7,35 7,27 7,31 7,94 7,92 7,93 7,08 7,04 7,06 7,16 7,14 7,15
a
0,66 0,63 0,64 0,46 0,56 0,51 0.65 0,81 0.74 0,75 0,81 0,78
0,71 0,77 0,74 0,86 0,96 0,92 1,04 0,93 0,96
0.71 0,68 0,70 0,46 0,56 0,51 0,69 0,85 0,78 0,85 0,85 0.85
D%
+ 7,9 + 8,0 + 7,9
—4.1 —3.8 - 4 . 1 —1,5 —1,1 —1.4
+ 1,8 —1,3
— —1.1 —2,2 —1.7
+ 8,0 + 8,9 + 8,5 —3,7 —3,2 —3,4 —2,6 —1.8 —2,2
Sign.
0,01 0,01 0,01 0,01 0.01 0,01
— — —
— — — — — —
0,01 0,01 0,01 0,01 0,01 0,01 0.05 0,10 0,01
tion mixtes (cendres et anhydride sulfureux) les poids moyens étaient de 1-4% plus bas que dans les contrôles. Cette influence négative devient plus manifeste dans les années a conditions météorologiques défavorables CNovâkovâ et Hanzl, 1966).
Un bon critérium pratique se révèle être le coefficient de reproduction, déterminé d'après l'abondance de lièvres juvéniles et adultes sur les tableaux de chasse en automne. D'après l'examen de 5177 lièvres tirés au hasard, le coefficient de reproduction est de 30% plus bas (0,81) dans les localités souffrant de pollutions mixtes, riches en SO2, que dans les contrôles (1,11). Par contre, dans les contrées empoussiérées de ciment, le coefficient est plus élevé, de 35% (1,41) et seulement des pollutions fortes, dépassant
43

Tableau 3. Abondance des groupes taxonomiaues d'arthropodes dans trois placeaux.'
Ordre
Famille
Isopoda
Oniscidae Armadillidiidae
Proterospermophora Polydesmidae
Opistospermophora Julidae
Li thobiomorpha Lithobiidae
Orthoptera Tetrigidae Acrididae
Dermaptera Forficulidae
Homoptera Callaphididae
Aphididae Hymenoptera
Myrmicidae Formicidae
Coleoptera Carabidae Staphylinidae
Silphidae Histeridae Helodidae Canthar idae Nitidulidae Cryptophagidae Phalacridae
Lathridiidae Coccinellidae
Elateridae Chrysomelidae
Curculionidae
Scarabaeidae
Total
Pollution maxima
total
E
33 50
33 33 50 50
100 100 50
— 67
100 100
33 100 20 80
100 75 61 67 57
50 100 100 50 67 50
100 50
43 60 78
54
33
60
S
20 33
6 6 6 6
50 50 35
— 40 37 37 24 21 25 10 67 9
26 25 33 10
100 100
17
53 50
100 17 29
24 32
22 5
25
spec
E
—
33 33
— — — — — — — — — 17
— 20
— — — 21 21 35 25
100 100
— — 50
100
— — 20
19 13
— 19
le
S
— —
6 6
— — — — — — — — — + — + — — —
2 1 5 5
100 100
— — 50
100
— — 6
13 2
— 1
Pollution moyenne
total
E
67 100
66 66
100 100 100 100 100
100 100 100 100 67
100 80
100 100 100 60 67
39 75
75 67
— —
100 57 40
72 69
67
64
S
40 66
47 47 47 47
23 23 27 17 29 26 26 27 53 28 18 33 19
43 51 39 58
66 17
— _. 60 22 12 38 39
38
35
spec
E
33 50
33 33
— — — — — — — — — 50
— 60
— — — 12 21
4
—
25
— — — 50
— — 11 15
— 13
S
20 33
20 20
— — — — — — — — — + — +
— — —
1 1 7
—
17
— — — 17
— —
9
1
— 1
Pollution minimal
total
E
33
— 100 33 33
100 100 100 100 75
100 67
100
100 33
100 20 80
— 100
60 48
52 75
50 100
50
— 50
100 80 67 64
100
60
S
40
— 100 47 47 47 47
27 27 38
83 31 37
37 49 26 47
72
— 72 31 24 28
32
17
30
50
— 17 49 64 30 39 57
40
spec
E
33
— 100
— — — — — — — — — — — — — — — — — 15 6
22
—
25
33 50
— — 43 20 11 13 33
13
le
S
40
— 100
— — — — — — — — — — — — — — — — —
1
+ 4
— —
8 3
50
— —
3 3 9 1 5
1
Total
esp
A
3 2
1 3 3 2 2 2 2 4
1 3 1 1 6 1 5 5
1 4
148 33
23 4 1 1 4 3
2 3 2
7 5
18 39
3
174
suj
A
5 3 2
15
15 15
15 26 26 51
6 45 51 51
1898 73
1786 260
3 257
2408 1214 282
19
1 1
12 47
2
3 6
8t-33
222 456
21
4729
1. esp = espèces - sui = sujets - spéc = espèces et sujets capturés seulement sur ce placeau - A = abondance totale absolue - E = abondance relative des espèces par rapport au total capturé dans la localité -S = abondance relative des sujets par rapport au total capturé dans la localité — = capture nulle.
44

500 t/km2/an, ont un effet freinant. Cependant dans ces environs des cimenteries on a affaire encore à d'autres facteurs écologiques, cette fois favorables à la reproduction du lièvre (forte densité de refuges naturels, faible emploi de pesticides en agriculture, possibilités de loisirs médiocres) qui atténuent l'effet des pollution. Des observations analogues ont été faites sur les verrils recultivés, même dans le voisinage immédiat des sources d'immission. Le coefficient de reproduction y était de 41 % plus élevé que dans les régions-témoins et de 131 % par rapport aux terrains moins pollués mais pauvres en refuges naturels.
Comme autre facteur limitant la reproduction on peut considérer l'Endrin, car, après son application contre les menus rongeurs, le coefficient de reproduction a diminué de 55 % par rapport aux localités de contrôle.
Jusqu'à présent, du point de vue cénologique, ont été effectuées surtout des analyses qualitatives et quantitatives de certains groupes d'Arthropodes, en premier lieu d'insectes nocifs, dans les forêts soumise à des immissions gazeuses, surtout d'anhydride sulfureux.
Dans l'assossiation des insectes vivant sous l'écorce de l'épicéa assez intoxiqué prévalent les charançons (Pissodes harcyniae, P. scabricollis) et certains Scolytides secondaires (Hylurgops palliatus, Trypodendron lineatum) sur les espèces normalement dominantes (Ips typographic, Ips amitinus, Pityogenes chalcographus) dans les groupes de types forestiers de la région des Monts métalliques (Kudela et Wolf, 1963). Dans la faune sous-corticale des pins à côté des ravageurs habituels (Myelophüus piniperda, Pissodes pini et P. piniphilus) des espèces nocives secondaires tendent à dominer ( Trypodendron lineatum, Hylurgops palliatus, Tetropium castaneum et T. fuscum) (Kudela et Wolf, 1963,1964).
l'Étude comparé des Acarides terricoles a donné des résultats très prometteurs. Dans les pessières empestées leurs communautés ont été nettement appauvries (de 60 % environ), aussi bien au point de vue qualitatif que quantitatif, et leur structure a été visiblement atteinte (Vanëk, 1967). - Tandis que l'effet des solutions du fluor sur les animaux domestiques et de laboratoire a attiré assez d'attention, sa répercussion dans la faune sauvage est peu connue. Certaines recherches sont en cours en Slovaquie centrale sur l'avifaune et l'entomo-faune. Ainsi dans les groupes de types forestiers Fageto-Quercetum et Querceto-Fagetum le sapin héberge comme espèces dominantes la tordeuse Cacoecia murinana dans les houppiers et les scolytides Pityokteines spinidens et P. vorontzowi, éventuellement P. curvidens sous l'écorce, pendant que les pucerons Dreyfusia piceae et D. niisslini n'apparaissent qu'occasionnellement (Noväkovä et Stolina, 1959). Par contre, dans les sapinières polluées de fluorures, on assiste à des pullulations des deux pucerons tandis que les Scolytides et la tordeuse se raréfient (Pfeffer, 1963).
Les immissions solides non toxiques n'ont presque pas soulevé l'intérêt des zoologues. Nous présentons les résultats préliminaires de nos recherches sur les communautés secondaires dans les champs et les forêts pollués de ciment, concernant l'analyse de certains Arthropodes (Isopodes, Diplopodes, Chilopodes, Orthoptères, Aphidoides, Formicoides, Coléoptères) dans une culture de luzerne près de Beroun (Bohême centrale) essais effectués en 1963 d'avril jusqu'à mi-octobre.
45

o. E ë 8 "5 o c • O O -t= o
G a -a o o o u £ Q
i ! 5 5 > . o ö t : ° o £ o £ o c. y o
a in V 1> O
£
r^ f«1
l -O
£ C. 0
è 'E
E O
o
O
C O E
<s o
<s
a o "o O
o
60 x: c. 0
O U
o i r i
aj 4> 0. O
Ja O
•o e o .o
<:

Bien que les différences entre la pulvérulence des trois placeaux d'expérience aient été médiocres (de 20-50 t/km2/an), quelques altérations se sont signalées. Pendant que le nombre des espèces reste assez constant, celui des sujets décroit proportionnellement à l'intensité des pollutions (1,6:1,4:1,0). Les différences dans les groupes taxonomiques sont peu prononcées. L'appauvrissement quantitatif se manifeste presque uniformément dans toutes les catégories, groupées selon le mode de nutrition, de sorte que leur abondance relative change peu d'un placeau à l'autre. On peut cependant suivre un léger déplacement au profit des phytophages dans la zone la plus polluée et au profit des zoophages dans les zones moins pulvérulentes (tableaux 3 et 4).
Conclusion: L'emploi d'animaux-témoins et des changements qualitatifs et quantitatifs dans les communautés animales comme bioindicateurs accessoires dans le dépistage de l'aire polluée est encore au stade de recherches. Il est peu probable que, dans un temps très proche, on arrive à trouver des critériums et à l'élaborer des méthodes aussi pratiques que dans l'évaluation de la pollution des eaux. Cependant, malgrés la complexités des facteurs agissant sur les communautés terrestres (conf. écosystème, pesticides) certains résultats prélimaires montrent que cette faune mérite plus d'attention au point de vue de l'hygiène du milieu ambiant qu'elle n'en a soulevé jusqu'à présent.
Summary The influence of industrial pollution on animal communities and the use of test animais as bio-indicators
Recently favourable results have been reached with hares in studies on the influence of air pollution on animal communities. It has appeared that the distribution of harmful exhalations can be estimated by analizing some elements of the erythro-gramme (haemoglobin, haematocrite, in some cases globular saturation). In general the blood values decrease with the intensity of the pollution, except in a few cases with very high SO-j exhalation. The latter means that, in judging the results of analyses, one has to take into account the providence of the samples.
The pH of the urine varies: in areas where cement is produced it is over 7.0; in SO2-areas it is below 7.0. For practical work in judging the health of the animal polulation, the multiplication coefficient calculated from the number of killed young and full-grown hares is a good indicator. In areas with mixed pollution its value is below 30%, in the area of the cement industry it is over 35 % (except in the case of very high quantities).
The present investigations cover mainly the influence of gaseous exhalations (SO2, HF) on the qualitative and quantitative composition of the arthropoid forest fauna. Some species decrease in number, in other cases a shift in the dominance is observed, sometimes secpies are replaced by harmful insects from outside.
The non-toxic dust is not much interesting from a purely zoological standpoint. The present investigations point to a decrease in number of insect species (without decrease in number of species) with the intensity of the dust pollution. The differences between the various taxonomie groups are only slight, but some decrease in number of phyto-
47

phagous species has been observed in the area of strong pollution and a slight increase of zoophagous species in less dusty areas.
Zusammenfassung Der Einfluß industrieller Verunreinigungen auf Tiergesellschaften und die Verwendung von Testtieren als Bio-Indikatoren
Beim Studium des Einflusses Verunreinigungen auf Tiergesellschaften und die Verwendung von Tieren als Bio-Indikatoren erzielten wir neuerdings gute Ergebnisse mit Feldhasen. Die Analyse einiger Elemente des Erythrogrammes (Hämoglobin, Hämatokrit, eventuell globuläre Sättigung) macht es wahrscheinlich, daß sie gebraucht werden können für Erhebungen über die räumliche Verteilung und den schädlichen Einfluß von industriellen Exhalationen. Im allgemeinen sinken die Blutwerte mit der Intensität der Verunreinigung, mit einigen Ausnahmen in Gebieten mit hoher SO2-Exhalation. Bei der Beurteilung der Analyseresultate muß man also berücksichtigen, aus welchem Gebiet die Proben stammen.
Zur allgemeinen Anwendung ist die pH des Urins geeignet; in Zementdistrikten ist sie über 7,0, in S02-Gebieten unter 7,0. Ein für die Praxis gut geeignetes Kriterium für die Beurteilung der Gesundheit des Tierbestandes ist der Vermehrungskoeffizient, der sich aus der Zahl der jungen und erwachsenen Hasen in der Jagdstrecke ergibt. In Gebieten gemischter Verunreinigung liegt dessen Wert 30% unter normal, im Gebiet der Zementwerke um 35% darüber (es sei denn daß es sich um sehr hohe Ausfallmengen handelt).
Derzeit werden hauptsächlich Untersuchungen über Art und Menge von Arthropoden in von gasförmigen Exhalationen (SO2, HF) betroffenen Wäldern durchgeführt. Man findet dort Rückgänge und Verschiebungen im Vorherrschen gewisser Arten, zuweilen auch das sekundäre Auftreten von anderen schädlichen Insekten. Der nichttoxische Staub ist für den Zoologen von wenig Interesse. Nach unseren vorläufigen Ergebnissen an durch Zement verunreinigten Luzerne-kulturen sinkt die Zahl der Individuen (während der Präsenz der Arten konstant bleibt) mit der Intensität der Verunreinigungen Die Unterschiede zwischen den taxonomischen Gruppen sind wenig ausgeprägt, aber man findet einen leichten Rückgang der Phytophagen in der Zone Verschmutzung und eine geringe Zunahme der Zoophagen in den weniger verstaubten Gebieten.
Littérature
Kudela, M. et R. Wolf. 1963. Sb. lesn. Fak. vSZ6: 157-89. Kudela, M. et R. Wolf, 1964. Lesn. Cas. 19: 1023-36. Novakovâ, E. 1968. J. for. suisse 119:31 -44. Novakovâ, E. et R. Hanzl. 1966. J. for. suisse 117: 118-26. Novâkovà, E. et R. Hanzl. 1968. Lynx 9: 56-65. Novakovâ, E. et M. Stolina. 1960. Acta Symp. evolutione insectorum, Praha 1959: 348-51. Pfeffer, A. 1963. Z. angew. Ent. 51: 203-7. Symon. K., V. Kapalin, O. Absolonovâ et L. Moudra. 1960. Cslky Hyg. 5: 88-100. Vanëk, J. 1967. In: Progress in soil biology, Braunschweig, 331-9.
48

Discussion in Section 1 : Inventory of damage due to industrial and urban air pollution and research done in relation to this pollution
Reporter: M. F. Mörzer Bruyns
Participants: LeBlanc (Chairman), Beran, Bohne, Bossavy, Bovay, Détrie, Kloke, Knabe, Mellanby, Morgan-Huws, Mörzer Bruyns, Miss Novâkovâ, Pollanschütz, Robak, Ruzicka, Stratman, Wassink, Wentzel.
Damage to forests
Evergreen coniferous forests are generally more susceptible to air pollution than deciduous broadleaved stands because deciduous trees change their leaves annually, have more reserves, and regenerate better. The 400000 ha forest damaged by air pollution in Europe consist chiefly of Pinus (in the lowlands), Picea and Abies (in the mountains).
Susceptibility varies from species to species and within species (well-known e.g. for Picea abies) due to genetic differences. Thus selection will be of great value. In addition the ecology of the sites must be considered as generally trees are much more resistant under optimal living conditions than in a less favourable environment.
Larix decidua and L. leptolepis show characteristic differences in resistance to air pollution. In rather badly polluted areas they should not be grown (necrosis of the needles). Perhaps the trees will not die, but their illness will cause a serious reduction in timber production. In less but still distinctly polluted areas, where chronic illness is caused on Picea (e.g. at a greater distance from the source of pollution) both Larix species can be advised for afforestation.
Air pollution due to fluor
The higher a chimney, the larger the area over which harmful gases are spread. Though this results in a lower concentration, the accumulation of pollutants goes on and will, in the course of the years, results in unacceptable damage when no special measures are taken. The development of better constructions and purification techniques (which are on their way everywhere) probably will considerably improve the situation in the near future. The construction of aluminium plants with, e.g., 'air tight' buildings in combination with the application of effective filters will largely Prevent pollution of the environment with fluor gases, which now, especially in old factories, often enter the open not through the chimneys but through windows and doors. The new techniques are expected to give a reduction of 90%, of the present Pollution.
49

Prevention of air pollution and pollution limits
All participants in the discussion agreed that in principle the aim should be to prevent all air pollution (industrial, urban and agricultural). Much is already done, but the technology is not yet perfect and in some cases its application is impossible for economic reasons. The general feeling is, that economic considerations should not dominate too much.
In this connection the attention was drawn to the fact that limits are usually fixed in relation to human health. It was suggested that plants (wild and cultivated) and animals should be taken in consideration as well. Many of them are more susceptible to air pollution than human beings who, in addition, can protect themselves more effectively. Another point to be considered when pollution limits are legally fixed is that industries tend to keep as close as possible to such limits and that they are immediately exceeded when something goes wrong.
Other ways to reduce air pollution are concentration of air polluting industries careful selection of the sites where such industries are allowed to be built, and the establishment of protective plantations at an early stage.
Research and coordination
Much more research on the effects of air pollution is needed, not only in forestry but also in agriculture, dairy farming, horticulture and in the management of natural resources (landscape, wildlife, wild living plants and animals). The latter are of more economic importance than is generally realized.
Maps showing pollution zones will be of great value; in many cases they are indispensable. In making areal photographs for mapping the use of Ental chrome infrared aerofilm may be recommended. The interpretation of the photographs should be carried out with great care.
Researches into the influence of different forms of air pollution on selected groups of organisms, both plants (e.g. tree species) and animals (e..g mammals like hares, or insects) are needed to fill the many gaps in our present knowledge. International 'cooperation and co-ordination in this work should be aimed at.
50

Section 2 : Experimental research
Untersuchungen über die Wirkung von Luftverunreinigungen auf Pflanzen1
M. Buck
Landesanstalt für Immissions- und Bodennutzungsschutz, Essen, Deutsche Bundesrepublik
Kurzfassung
Für einen vorsorglichen Schutz der Vegetation vorder Luftverunreinigung bedarf es Grenzwerte für deren Komponenten und Kontrolle einer über ihre Einhaltung. Grundlage dafür sind die experimentell zu ermittelnden Luftqualitätskriterien.
Daneben besteht die Möglichkeit, die experimentell zu ermittelnden Empfindlichkeit der Pflanzen auszunutzen für eine Anpassung der Nützung an vorhandene Immissionsverhältnisse.
Da durch vorsorgliche Maßnahmen nicht alle Schäden zu verhindern sind, muß untersucht werden, welche Stoffe im speziellen Fall die Schäden verursacht haben und welcher Emissionsquelle diese entstammen. Leider konnten bis jetzt von den Reaktionen, die im Freiland an der Pflanze beobachtet werden können, keine als spezifisch erkannt werden. Untersuchungen zur Auffindung spezifischer Symptome sind daher zur Beurteilung immissionsbedingter Pflanzenschäden äußerst wichtig.
In neuer Zeit gewinnt die Anwendung von Indikatorpflanzen zum Nachweis von Luftverunreinigungskomponenten eine immer größere Bedeutung als Ergänzung der physikalisch-chemischen Luftanalyse.
Die zur Verfügung stehenden Experimentiermöglichkeiten werden diskutiert in bezug au die oben Benannten Probleme.
Bei dem Wissensgebiet 'Wirkungen der Luftverunreinigung auf die Vegetation' handelt es sich um ein Gebiet der angewandten Forschung. Eine sinnvolle Bearbeitung der vorhandenen Probleme ist daher nur möglich, wenn eine Konzeption vorhanden ist, die die Notwendigkeiten der praktischen Luftreinhaltung - in der Bundesrepublik Deutschland als Immissionsschutz bezeichnet - ebenso berücksichtigt, wie den wissenschaftliche Standpunkt. Nur so ist ein rationeller Einsatz von Personal, Material und Zeit als Voraussetzung für die Erarbeitung von Grundlagen für Luftreinhaltungsmaßnahmen zum Schutz der Vegetation vor Immissionswirkungen möglich. Von größter Bedeutung für den Erfolg ist dabei, daß das Arbeitsgebiet 'Wirkungen der Luftverunreinigung auf Pflanzen' nicht isoliert als Aufgabe der Botanik und der Agrar-wissenschaften gesehen wird, sondern daß man um eine intensive Zusammenarbeit der verschiedenen naturwissenschaftlichen und technischen Disziplinen bemüht ist.
Im Mittelpunkt steht nach unserer Konzeption der Zusammenhang zwischen dem Angebot an Luftverunreinigung (Immissionsangebot) und der resultierenden Immis-
'• Die vorgetragenen Ergebnisse und Folgerungen sind gemeinsam mit Dr. Arndt, Dr. Guderian, Dr. van Haut. W. Holte, Dr. Knabe, Dr. Krautscheid, Dr. Scholl und Dr. Schönbeck erarbeitet worden.
53

sionswirkung. Aus der Betrachtung dieses Zusammenhangs von zwei verschiedenen Standpunkten aus ergeben sich zwei große Komplexe, in denen sowohl die Aufgaben als auch die wissenschaftlichen Interessen zusammengefaßt werden können. Einerseits möchte man den Kausalzusammenhang zwischen Immissionsangebot und Immissionswirkung kennen und die Abhängigkeit der Immissionswirkung vom Immissionsangebot quantitativ beschreiben. Bei entsprechenden Experimenten geht man also von einer bekannten Ursache, dem gemessenen Immissionsangebot, aus und sucht nach der entsprechenden Wirkung. Bei der anderen Blickrichtung geht man umgekehrt von einer aufgetretenen, festgestellten Wirkung aus und möchte Rückschlüsse auf die bereits in der Vergangenheit liegende Ursache, nämlich die unbekannte, aber wirksam gewordene Immission ziehen. Die zuerst genannte Blickrichtung ist von größter praktischer Bedeutung, denn die Ermittlung des quantitativen Zusammenhangs zwischen Immissionsangebot und Immissionswirkung für die verschiedenen Immissionskomponenten, also die Ermittlung von Luftqualitätskriterien, ist eine der wichtigsten Voraussetzungen für die Festlegung von Werten zur Begrenzung des Gehaltes an Luftverunreinigungen. Diese Grenzwerte wiederum, in den USA als 'Air Quality Standards', in der Bundesrepublik als 'Immissionsgrenzwerte' bezeichnet, sind ein wichtiges Element der auf vorsorglichen Schutz gerichteten öffentlichen Maßnahmen zur Luftreinhaltung. Sie gewährleisten ein gewisses Maß an generallem Schutz für den Menschen und seine Umwelt, wozu als sehr wesentlicher Bestandteil die Pflanzen gehören.
Bei der Festsetzung derartiger genereller Grenzwerte seitens der Politiker wird aber nicht nur die Schutzwürdigkeit des Menschen und seiner Umwelt berücksichtigt. Es muß auch in Betracht gezogen werden, welche Möglichkeiten zur Emissionsverminderung entsprechend dem Entwicklungsstand der Technik als Voraussetzung für die Einhaltung solcher Grenzwerte vorhanden sind. Weiterhin müssen die mit der Praktizierung solcher Grenzwerte verbundenen volkswirtschaftlichen und sozialen Konsequenzen bedacht werden. Damit bei der Abwägung zwischen diesen z.T. gegenläufigen Interessen das Schutzbedürfnis der Vegetation nicht zu kurz kommt, müssen die Wissenschaftler ausreichende Informationen in Form von Luftqualitätskriterien (in den USA als 'Air Quality Criteria' bezeichnet) bereitstellen, aus denen hervorgeht, welches Schadenrisiko für die verschiedenen Pflanzen und Pflanzengemeinschaften bei einem bestimmten Immissionsangebot besteht und in welchem Maße sich bei Veränderung des Immissionsangebotes dieses Risiko ändert.
Die Luftqualitätskriterien verknüpfen die Immission mit der Immissionswirkung, in dem der qualitative und quantitative Zusammenhang zwischen Immissions- und Wirkungskriterien dargestellt wird. Sie beziehen sich hinsichtlich der Immission auf die einzelnen Immissionskomponenten oder auf Komponenten-Gruppen, wobei zur Kennzeichnung der Immission verschiedene Kriterien geeignet sind. Im Hinblick auf die Wirkung beziehen sich die Luftqualitätskriterien auf die verschiedenen Objektgruppen, wie Mensch, Tiere, Pflanzen und Materialien und innerhalb dieser Gruppen auf Untergruppen, Arten, Sorten, Varietäten und Individuen, wobei auch in diesem Fall verschiedene Wirkungskriterien zur Charakterisierung der Immissionswirkung herangezogen werden können (Bei Pflanzen z.B. die Blattschädigung, Stoffwechsel-Störungen, Senkung des Kornertrages, des Grünmassenertrags, der Fruchtqualität
54

usw.). Berücksichtigt man weiterhin, daß zwischen den und innerhalb der genannten Objektgruppen Empfindlichkeitsunterschiede vorhanden sind, und daß die einem bestimmten Immissionsangebot entsprechende Wirkung von zahlreichen endogenen und äußeren Faktoren beeinflußt wird, so ist sofort einzusehen, daß es bereits für eine einzige Immissionskomponente wie z.B. Fluorwasserstoff, eine Vielzahl von Luftqualitätskriterien gibt. Hinsichtlich der Erfassung der Immissionswirkung kann man zwei Möglichkeiten ausnutzen. Einmal kann man sagen, wieviel Individuen eines Pflanzenkollektivs oder wieviel Pflanzenarten einer Pflanzengemeinschaft bei einem bestimmten Immissionsangebot eine Reaktion gezeigt haben, wobei zur Ermöglichung dieser Ja-Nein-Aussage definiert sein muß, was unter Reaktion zu verstehen ist. Zum anderen kann man den mittleren Ausprägungsgrad der Reaktion eines Pflanzenkollektivs z.B. den Korn- oder Grünmassenertrag auf einer Parzelle ermitteln und als Wirkungskriterium ansetzen. Welche von beiden Möglichkeiten genutzt wird, hängt u.a. von der Nutzungsart der verschiedenen Pflanzen ab.
Eine wichtige Voraussetzung für die Auswertung von Luftqualitätskriterien als Grundlage für Immissionsversuche ist, daß die den Luftqualitätskriterien zu Grunde liegenden Untersuchungen wirklichkeitsnahe durchgeführt werden, daß also die Versuchsbedingungen möglichst weitgehend denjenigen Bedingungen nählich sind, die im Anwendungsbereich der Luftqualitätskriterien, also im Freiland, vorliegen. Da dieser Forderung nur sehr schwer im Experiment zu entsprechen ist, sind die meisten bisherigen Untersuchungen über die Pflanzenschädlichkeit von Immissionen unter Bedingungen erfolgt, die die Brauchbarkeit der erhaltenen Ergebnisse einschränken. Die bisherigen Klimakammerversuche beispielsweise sind so vorgenommen worden, daß bei konstant gehaltener Luftfeuchte, Lufttemperatur, Windgeschwindigheit und Lichteinstrahlung die Immissionskonzentration (z.B. von Schwefeldioxid) künstlich hergestellt und variiert wurde und die beobachtete Schadwirkung mit dem Angebot korreliert wurde. Das erhaltene Ergebnis über den Zusammenhang zwischen Immission und Immissionswirkung ist offensichtlich nicht repräsentativ für die Außenluftverhältnisse, under denen die Pflanzen normalerweise wachsen und genutzt werden, da ja die Verhältnisse in der Außenluft durch eine ständige Variation verschiedener Umweltfaktoren, insbesondere klimatischer Art, gekennzeichnet sind. Man muß also zur Erlangung repräsentativer Unterlagen andere, den natürlichen Verhältnisses besser entsprechende Untersuchungspraktiken anwenden. Dabei muß man sich aber darüber im Klaren sein, daß es nicht möglich ist, alle Faktoren, die die Beziehung zwischen Immission und Immissionswirkung beeinflussen, in ihren verschiedenen natürlichen Kombinationen in den Versuch einzubeziehen. Aus diesem Grunde werden die Luftqualitätskriterien auch immer nur ein mehr oder weniger vollkommenes Abbild der wahren Zusammenhänge sein.
Die im Folgenden näher beschriebene und sich auf die Untersuchung von Pflanzen beziehende Versuchsdurchführung, bei der Eingriff des Experimentators (beispielsweise hinsichtlich des Herausgreifens bestimmter einzelner Klimafaktoren), der ganz entscheidend das Ergebnis eines Versuches beeinflußt, viel geringer ist, als z.B. bei den bisherigen Klimakammerversuchen, ist bereits bei den sogenannten Biersdorfer Naturversuchen zur Ermittlung der Wirkungsweise von Schwefeldioxid auf Pflanzen
55

realisiert worden (Guderian und Stratmann, 1968). Ausgehend davon, daß fur d.e Darstellung quantitativer Zusammenhänge zwischen Angebot und Wirkung von Schwefeldioxid neben geeigneten Immissionskriterien zur Kennze.chnung des S02-Angebotes zweckmäßige Wirkungskriterien zur quantitativen Beschre.bung der Wirkung definiert sein müssen, ist zunächst zu fragen, welche Pflanzenreaktionen für solche Luftqualitätskriterien geeignet sind, die als Grundlage für Imnussionsgrenz-werte dienen sollen. Guderian, van Haut und Stratmann (1960) haben vorgeschlagen, die Pflanzenreaktionen in zwei Kategorien, nämlich in die Kategorie 'Schädigung' und die Kategorie 'Schaden' einzuteilen. Unter 'Schädigung' sollen alle durch Immissionen hervorgerufenen Pflanzenreaktionen verstanden werden, temporäre Herabsetzung der Assimilationsrate ebenso wie reversible Stoffwechselstörungen, Zellschädigungen, Blattnekrosen, Wachstumsdepressionen, vorzeitiger Blattfall, verspäteter Blühtermin, u a. Unter 'Schäden' verstehen wir diejenigen Effekte, die unter Berücksichtigung des jeweiligen Nutzungszweckes der verschiedenen Pflanzen eine Minderung des ideellen, des biozönotischen oder des wirtschaftlichen Nutzungswertes darstellen, z.B. Ertragsdepression, Zuwachsdepression, Qualitätsminderung und Veränderungen von Pflanzengesellschaften. 'Schädigung' und 'Schaden' sind also nach verschiedenen Gesichtspunkten definiert, wobei im ersten Falle allgemein biologische Aspekte und bezüglich des Begriffes 'Schaden' Kriterien aus dem Bereich des praktischen Pflanzenbaues herangezogen worden sind. Eine Schädigung kann, muß daher aber nicht die Vorstufe zu einem Schaden sein. Einige Beispiele mögen den Sachverhalt verdeutlichen.
Bei Zuckerrüben, deren Nutzungszweck die Zuckergewinnung oder die Verfütterung des Rübenkörpers ist, können z.B. durch akute Schwefeldioxid-Einwirkung herbeigeführte Blattnekrosen auftreten (Schädigung). Der hierdurch bedingte, teilweise Ausfall der Assimilationsorgane braucht jedoch nicht zu einer Minderung des wirtscha ftlichen Nutzwertes, nämlich zu einer Verminderung der Zuckerproduktion oder des Rüben-massenertrages, also zu einem Schaden zu führen. Ob eine Blattnekrotisierung einen Schaden nach sich zieht, hängt nämlich entscheidend von dem Einwirkungszeitpunkt der Immissionen im pflanzlichen Wachstum ab. Nekrosen bei einer Futterpflanze dagegen, bei der es ja auf den Grünmassenertrag und die Futterqualität ankommt, stellen als solche bereits einen Schaden dar. Ähnlich sind Nekrosen bei Zierpflanzen zu bewerten, da durch Blattnekrosen unansehnlich gewordene Pflanzen eine erhebliche Minderung im Verkaufswert erfahren können. Je nach Art der gewählten Pflanzenreaktion muß das adäquate Immissionsangebot durch entsprechende Immissionskriterien unterschiedlich gekennzeichnet sein. Wählt man z.B. für Fluorwasserstoff bei Hafer die äußerlich sichtbare Nekrosenbildung an den Blättern als Wirkungskennzeichen, so erhält man in der Regel einen höheren Wert für das wirkungsadäquate Schadstoffangebot als wenn man bei der gleichen Pflanzenart den Getreideertrag als Wirkimgskriterium ansetzen würde. Würde man für Schwefeldioxid bei Fichten einmal die äußerlich sichtbare Nekrosenbildung an den Nadeln als Kriterium heranziehen und zum anderen die Zuwachsdepression, so würde nicht nur die diesen verschiedenen Wirkungen adäquate Schwefeldioxid-Konzentration unterschiedlich sein, sondern auch die Zeitspanne, die erforderlich ist, um diese Wirkungen zu produzieren. Mithin ist also nicht nur die Konzentrationshöhe, sondern auch die Einwirkungszeit zu beachten.
56

Aber auch bei gleicher Schwefeldioxid-Konzentration, gleicher Einwirkungszeit und gleichem Wirkungskriterium ist die quantitative Ausprägung der Wirkung in Abhängigkeit vom Entwicklungsstadium der Pflanzen unterschiedlich. Bei Hafer führt, wie van Haut (1961) nachweisen konnte, eine Schwefeldioxid-Einwirkung zum Zeitpunkt einer 'kritischen Entwicklungsperiode', z.B. kurz vor dem Rispenschieben zu Ertragsdepressionen, während die gleiche Schwefeldioxid-Einwirkung auf den frühen Entwicklungsstadien den am Ende der Vegetationsperiode ermittelten Kornertrag nicht beeinflußte. Aufgrund solcher Befunde könnte man erwägen, das Pflanzen verhalten gegenüber Immissionen während derartiger 'kritischer Entwicklungsperioden' zur Beurteilung der schädlichen Wirkung der betr. Immissionskomponente heranzuziehen und die entsprechenden Luftqualitätskriterien als Grundlage für die Bemessung von Immissionsgrenzwerten zu betrachten. Einerseits sind aber die sogenannten 'kritischen Entwicklungsphasen' unter natürlichen Bedingungen mit underschiedlichen Klimafaktoren kombiniert, wodurch sich die eintretende Schadwirkung an verschiedenen Orten zu verschiedenen Zeiten unterschiedlich ausprägt. Zum anderen können während der kritischen Entwicklungsphasen die für einen Schaden repräsentativen Kenngrößen, wie Ertrag und Qualität, nicht beobachtet werden, sondern man wäre auf indirekte Schlüsse angewiesen. Auch ist es nicht zweckmäßig, als Unterlage von Immissionsgrenzwerten die Ergebnisse solcher Experimente heranzuziehen, bei denen alle Umweltbedingungen so gewählt worden sind, daß die Pflanze in einen Zustand höchster Reaktionsbereitschaft gegenüber Luftverunreinigungen versetzt worden ist. Die geeignete Unterlage für die Bemessung von Immissionsgrenzwerten dürften Luftqualitätskriterien sein, bei denen als Wirkungskriterien solche aus der Kategorie 'Schäden' gewählt werden und bei denen die Schadwirkung unter Berücksichtigung der jeweiligen Nutzungsart der verschiedenen Pflanzen zur pflanzenbaulich richtigen Zeit, also z.B. zur Erntezeit, beobachtet wird. Durch die Wahl von Kriterien aus der Kategorie 'Schäden', wie Ertrag, Qualität, Zuwachs und dergl. ist unmittelbar auch der sinnvolle Versuchszeitraum für die Exposition der Pflanzen gegenüber den direkt wirkenden, hauptsächlich gasförmigen Immissionskomponenten festgelegt, nämlich die jeweilige gesamte Vegetationsperiode, bzw. für blattabwerfende Dauerkulturen die Zeit zwischen Austrieb und Blattfall oder für immergrüne Kulturen ein Zeitraum von 1 Jahr oder dergl. Für Untersuchungen über den indirekten Einfluß von staubförmigen Inimissionskomponenten, wie z.B. Blei- oder Zinkverbindungen, die sich nach Anreicherung im Boden auswirken, können noch längere Expositionszeiträume zweckmäßig sein. Anstelle einer verhältnismäßig kurzen 'kritischen Entwicklungsperiode' wird also ein relativ langer Zeitraum gesetzt, der uns für die natürlichen Verhältnisse repräsentativer erscheint. Dementsprechend muß auch ein Immissionskriterium angesetzt werden, welches die Immissionssituation während dieses relativ langen Zeitraumes optimal beschreibt. Stratmann und Guderian (1968) haben bei den sogenannten 'Biersdorfer Versuchen' zu der Gegenüberstellung von Schwefeldioxid-Angebot und Schwefeldioxid-Wirkung als Wirkungskriterien den Ertrag, die Qualität, die Triebleistung sowie den Dickenzuwachs gewählt. Unter dem Begriff Qualität ist sowohl die äußere Beschaffenheit als auch der Gehalt an wertbestimmenden Inhaltsstoffen sowie die Haltbarkeit und die Eignung des pflanzlichen Erzeugnisses als Saat-
57

bzw. Pflanzgut zu verstehen. Unter Triebleistung wird das gesamte Streckungswachstum, also die Gesamtlänge aller Jahrestriebe verstanden. Der Dicken- oder Stärkenzuwachs schließlich bezieht sich auf die Änderung des Stammdurchmessers. In Abhängigkeit von der unterschiedlich Nutzungsart der in dem genannten Versuch getesteten Pflanzenarten wurde die für jede Kultur zweckmäßige Kombination von Wirkungskriterien gewählt. Für eine Gruppe 'Forstgehölze' wurden die Kriterien: Triebleistung und Dickenzuwachs für die Gruppe der Obstgehölze und Beerensträucher wurden die gleichen Kriterien und zusätzlich Ertrag und Qualität des Erntegutes. Nachdem die Wirkungskriterien und der Expositionszeitraum festgelegt sind, ergibt sich die Frage, mit welcher Art der Versuchstechnik wirklichkeitsgetreue Verhältnisse in Bezug auf das Angebot der in ihrer phytotoxischen Wirkung zu untersuchenden Immissionskomponenten und bezüglich der meteorologischen Verhältnisse geschaffen werden können. In dem Maße, in dem die technische Entwicklung zu Klimakammern führt, in denen die Variationen der Umweltfaktoren für die Pflanzen, insbesondere die klimatischen Faktoren den natürlichen Verhältnissen angenähert erzeugt werden können, erscheint es möglich, derartige Kammern anzuwenden. Besser geeignet ist aber das Naturexperiment in der Umgebung einer geeigneten Emissionsquelle, die die gewünschte Komponente, z.B. Schwefeldioxid oder Fluorwasserstoff oder Chlorwasserstoff emittiert. Indem man die Pflanzenbeobachtungsstationen entfernungsmäßig geschickt abstuft, erhält man die gewünschten Unterschiede in der Höhe und der Häufigkeit des Immissionsangebotes, ohne daß Unterschiede bezüglich der klimatischen Verhältnisse an den verschiedenen Untersuchungsstellen zu befürchten sind. Die Messung des Immissionsangebotes erfolgt mit Hilfe automatischer, registrierender Instrumente, oder mit manuellen Meßverfahren (Strat-mann und Buck, 1967; Thoenes und Guse, 1966) Aus dem Histogramm bzw. aus der Häufigkeitsverteilung der gemessenen Konzentrationen lassen sich die benötigten Immissionskriterien, wie z.B. der arithmetrische Mittelwert oder die Schadstoff-Dosis oder andere Größen entnehmen, die mit Hilfe eines geeigneten Verfahrens der Korre-lationsiechnung mit den beobachteten Nutzwertminderungen, wie z B. Ertragsdepressionen verknüpft werden müssen. Die meteorologischen Faktoren werden beim Naturversuch hinsichtlich ihres Einflusses auf den Zusammenhang zwischen Schadstoff und Wirkung bewußt als ein Komplex gesehen, der sich in Anbetracht der relativ langen Expositionszeit in natürlicher Weise auswirkt, wobei die einzelnen meteorologischen Faktoren, wie Luftfeuchte, Lufttemperatur usw. alle die vielen Kombinationen miteinander bilden, die natürlicherweise entsprechend der herrschenden Jahreszeit (und damit der betreffenden Entwicklungsphase der Pflanzen entsprechend) vorkommen. Klimaunterschiede zwischen den Versuchsjahren können in ihrem Einfluß auf das Versuchsergebnis durch mehrjährige Wiederholung des Versuchs mit Hilfe der Faktorenanalyse (Cattel, 1965) erkannt werden. Hinsichtlich der Exposition der Pflanzen sollte mun sie soweit wie möglich in Parzellen im Freiland anbauen, wobei für Pflanzenarten, die üblicherweise gemischt angebaut werden, diese Kulturmethode gewählt werden sollte (Guderian, 1966a).
58

Zur Erziehung gleicher Bodenverhältnisse an den verschiedenen beobachtungssta-tionen macht man sich im Prinzip das Sorauer'sche Verfahren zu Nutze, welches im Laufe der Zeit verschiedene Variationen erfahren hat, z.B. in unserem Institut von Schönbeck (1968). Die Bodenart sollte so gewählt sein, daß es sich für die jeweiligen Pflanzen um einen Boden mittlerer Qualität handelt. Die zu wählenden Kultivierungsbedingungen, die Verhältnisse hinsichtlich Wasser- und Nährstoffversorgung, bezüglich der Anwendung von Pflanzenschutzmitteln und dergl. sollten im Sinne des Versuchs ohne Eingriff so erfolgen, wie sie im praktischen Pflanzenbau ohnehin üblich sind. Selbstverständlich ist, daß die an den verschiedenen Beobachtungsstellen angebauten Kulturen hinsichtlich ihrer Vorgeschichte, Anzucht und dergl. vergleichbar sein müssen. Die hier dargestellte Versuchsart kann man auch als 'geplanten Schadensfall' bezeichnen. Mit dem Ausdruck 'Schadensfall' soll ausgedrückt werden, daß die gesamte Versuchskonstellation weitgehend Ähnlichkeit hat mit den Verhältnissen bei nicht manipulierten Schadensfällen. Mit dem Ausdruck 'geplant' soll bezeichnet werden, daß bestimmte Randbedingungen gesetzt sind, wie z.B. die Auswahl der Pflanzen, ihre Kultivierung, die Wahl einer optimalen Düngung usw. Hierbei handelt es sich jedoch nur um pflanzenbauliche Eingriffe, die durchaus auch in der Praxis vorkommen können und nicht um Manipulationen, die sich beispielsweise auf das Klima und auf das Immissionsangebot beziehen.
Neben den bis jetzt besprochenen Luftqualitätskriterien, die, was die Charakterisierung der Immission angeht, auf Kenngrößen für das Immissionsangebot in der Luft aufgebaut sind, sind ebenso solche Luftqualitätskriterien möglich und zweckmäßig, bei denen die Kennzeichnung der Immission durch die Immissionsrate erfolgt. Unter Immissionsrate wollen wir denjenigen Anteil verstehen, der von den verschiedenen Objekten, in unserem Fall den verschiedenen Pflanzen, aus dem Immissonsangebot aufgenommen wird. Für die Ermittlung der Beziehung zwischen Immissionsrate und Immissionswirkung gilt hinsichtlich der Durchführung der entsprechenden Versuche das gleiche, was bezüglich der Aufstellung der Zusammenhänge zwischen Immissions-'Jngebot und Immissionswirkung bereits eingehend erörtert worden ist, nämlich, möglichst wirklichkeitsnahe Experimente durchzuführen. Es dürfte in vielen Fällen wegen der engeren Nachbarschaft zwischen Immissionsrate und der Immissionswir-kung in der Kausalkette: Emission-Immissionsangebot-Immissionsrate-Immissionswirkung wahrscheinlich einfacher sein, Zusammenhänge darzustellen, als zwischen dem Immissionsangebot und der biochemisch oder biologisch erfaßbaren Immissionswirkung. Zumindest ist es zweckmäßg, die Immissionsrate für die Aufstellung von Luftqualitätskriterien für solche Immissionskomponenten heranzuziehen, die auch nicht in kleinen Mengen von der Pflanze im Stoffwechsel verarbeitet werden können, wie es beispielsweise bei Fluorwasserstoff, sowie bei den über den Boden auf die Pflanze einwirkenden Blei- und Zink-Immissionen der Fall ist.
Zusammenfassend kann festgestellt werden, daß bei Benutzung zweckmäßiger Im-missions- und Wirkungskriterien und unter Beachtung des Grundsatzes, daß die Versuchsbedingungen den Bedingungen des Anwendungsraumes weitestgehend ähneln müssen, Luftqualitätskriterien aufgestellt werden können, aus denen entnom-
59

men werden kann, welche Gruppen von Pflanzen bei irgendeinem Immissionsangebot oder irgendeiner Immissionsrate mit bestimmten Schäden reagieren bzw. wieviel Individuen eines Pflanzenkollektivs oder welche Pflanzen bzw. Pflanzenarten eines Artenkollektivs ein in bestimmter Weise ausgeprägtes Schadmerkmal aufweisen. Bei den entsprechenden Experimenten werden im Sinnedes Ausdrucks 'geplanter Schadensfall' die Experimente so geplant, daß vernünftige Randbedingungen gesetzt werden in Form zweckmäßiger Immissions- und Wirkungskriterien, in Form der Gruppenbildung von Pflanzen (entweder durch direkte Verwendung von aus verschiedenen Pflanzenarten bestehenden Kollektiven oder durch nachträgliche Gruppierung gleichartig reagierender Pflanzen), in Form der Betrachtung der Variationen der meteorologischen Faktoren als ein über längere Untersuchungszeiten sich auswirkender Klimakomplex usw.
Stellt man sich nun die im Bereich der Pflanzen und die für die anderen Objektgruppen erhaltenen Luftqualitätskriterien tabellarisch zusammengestellt vor, so sollte die Information einer solchen Zusammenstellung darin bestehen, daß das mit einer Immission bestimmter Höhe und Art verbundene Schadensrisiko erkennbar ist. Auf dieser Basis haben die zuständigen Organe die Möglichkeit, sowohl im Einzelfall bei bekannter Emission und daraus berechenbarer Immission das durch eine neue Industrieanlage für die umliegende Vegetation entstehende Schadensrisiko abzuschätzen, als auch generelle Immissionsgrenzwerte festzusetzen. Zum Unterschied von den Luftqualitätskriterien handelt es sich bei den Immissionsgrenzwerten (vergleichbar den in den USA konzipierten 'Air Quality Standards') um gesetzlich fixierte Standardwerte für die Immissionskonzentration von deren Einhaltung nach den deutschen Immissionsschutzrichtlinien beispielsweise die Zulassung von emittierenden Anlagen abhängt. Die Immissionsgrenzwerte geben an, welche Konzentration der betreffenden Immissionskomponente zulässig ist. Gegenwärtig sehen die entsprechenden Immissionsschutzvorschriften in der BRD für jede Immissionskomponente, wie z.B. Schwefeldioxid jeweils nur einen Immissionsgrenzwert für den mittleren Dauerwert und für den Spitzenwert vor. Wenn nun die verschiedenen Objektgruppierungen, abgesehen von einer vorhandenen unterschiedlichen individuellen Empfindlichkeit, innerhalb einzelner Arten, Varietäten usw. unterschiedlich empfindlich sind, so ist klar, daß je nach Lage des Immissionsgrenzwertes mehr oder weniger Objektgruppierungen geschützt sind, mit anderen Worten, daß für die verschiedenen Objektgruppierungen bei ein und demselben Immissionsgrenzwert das Schadensrisiko unterschiedlich hoch ist. Bei dieser Sachlage ist also nur dann ein weitgehender Schutz auch der empfindlich Objektgruppen möglich, wenn der Immissionsgrenzwert entsprechend niedrig angesetzt wird. Je niedriger aber ein Grenzwert konzipiert wird, desto größer müssen die Anstrengungen sowohl technologischer als auch materieller Art sein, um durch geeignete Maßnahmen zur Emissionsbegrenzung zu bewerkstelligen, daß dieser Grenzwert eingehalten wird. Bezüglich der zur Zeit in der Technischen Anleitung zur Reinhaltung der Luft festgelegten Immissionsgrenzwerte ist für die Vegetation von der Höhe der Grenzwerte und von dem Auftreten der betreffenden Immissionskomponente her nur das Grenzwert-Paar für Schwefeldioxid von Bedeutung (Tal, 1964). Es hat
60

sich inzwischen gezeigt, daß der Grenzwert für die Spitzenkonzentration, nämlich der sogenannte I-2-Wert, von 0,75 mg/m3 eine schärfere Begrenzung darstellt als der Grenzwert für die mittlere Konzentration, der h-Wert, von 0,40 mg/m3. Wie nämlich die mehrjährigen Luftüberwachungsmessungen der Landesanstalt für Immissionsund Bodennutzungsschutz in Nordrhein-Westfalen gezeigt haben, korrespondiert ein I2-Wert von 0,75 mg/m3 ungefähr mit einem Ii-Wert von 0,25 mg/m3, wogegen der festgelegte Ii-Wert, wie oben gesagt, 0,40 mg/m3 beträgt (Stratmann und Buck, 1966; Stratmann und Ixfeld, 1967, 1968). Das Gebiet, in dem die gemessenen SO2-Konzentrationen diesen Wert von 0,25 mg/m3 (entsprechend einem mittleren Dauerwert von ca. 0,20 mg/m3 = arithmetischer Mittelwert) überschreiten, beträgt nach den neuesten Meßergebnissen nur ca. 4% des gesamten Überwachungsgebietes (Stratmann und Ixfeld, 1968) und umfaßt Teile der Städte Dortmund, Duisburg und Oberhausen, kleine Teile der Städte Gelsenkirchen, Recklinghausen sowie der Landkreise Recklinghausen und Moers und sehr geringe Flächen der Städte Herne, Essen, Krefeld, Bottrop, Bochum und Castrop-Rauxel. Das gesamte Überwachungsgebiet schließt die Ballungsräume der Industrie und der Bevölkerung ein, in denen z.Zt. die wesentlichen S02-Immissionsprobleme auftreten und in Zukunft zu erwarten sind. Die Ergebnisse des bereits mehrfach erwähnten 'Biersdorfer Naturversuchs', in welchem die Schädlichkeit des Schwefeldioxids für Pflanzen untersucht worden ist, zeigen nun, daß bei mittleren Dauerkonzentrationen von 0,20 mg/m3, wie sie in dem eben erwähnten kleinen Teilgebiet des Meßgebietes vorliegen, an forstlichen Dauerkulturen, wie Fichte, Kiefer, Lärche, Rotbuche und Stieleiche sowie an Obstgehölzen und Beerensträuchern, wie z.B. Stachelbeere, Johannisbeere, Apfel, Schattenmorelle und Süßkirsche S02-bedingte Immissionsschäden zu erwarten sind (Tabelle 1).
Da der S02-Immissionstyp am Versuchsort in Biersdorf, was das Auftreten kurzzeitiger, hoher S02-Immissionen angeht, nicht mit dem Immissionstyp übereinstimmt, wie er im erwähnten Meßgebiet in Nordrhein-Westfalen vorliegt, so ist eine vorsichtige Anwendung der Biersdorfer Versuchsergebnisse auf die S02-Meßwerte aus dem III Ländesmeßprogramm angebracht. Immerhin haben eigene Untersuchungen ergeben, daß im Meßgebiet keine Kiefer- und Fichtenbestände mehr angetroffen werden konnten, an Stellen, an denen die mittlerere S02-Konzentration größer als 0,20 mg/m3
waren (Knabe, in Vorbereitung). Eine Gefährdung der Fichten und Kiefern besteht allerdings bereits bei sehr viel niedrigerem S02-Gehalt der Luft. Dieser Befund aus der Praxis stimmt ebenfalls überein mit den Biersdorfer Versuchsergebnissen, so daß bei allen Einschränkungen, mit denen die Aussagekraft der genannten Befunde, Messungen und Versuchsergebnisse versehen werden müssen, gesagt werden kann, daß ein Teil der Vegetation durch SO2 gefährdet ist, obwohl der zulässige Immissionsgrenzwert eingehalten wird.
Oft sind dem Wissenschaftler von außen her Grenzen finanzieller oder personeller Art gesetzt, die ihn dazu zwingen, einfachere Versuchstechniken zu entwickeln mit denen man sich aber doch den Verhältnissen bei dem geschilderten Naturversuch weitgehend nähert. Eine Möglichkeit hierfür ist die Exposition von in Parzellen angebauten Pflanzen gegenüber Luftverunreinigungen mit Hilfe von Begasungshauben, wie sie in vielen Ländern von verschiedenen Forschern verwandt worden sind (Zahn, 1961).
61

M
6 "M E O Ö o
X o Bi
45
T 3 C xl 4=
"T3
g
V«
< C
X o w <u
U> T3
3
5
^J1 W
S 3 CO - * !
<D X )
e o c .2 « w 2? Ë 3 :£
X O 3
t/1 C <D <D
CO
e <u B 3 CA 1-.
o
tf}
t-
s a* •o 4> t/l c«
'5 x> CU
Ö
T —
£ o V)
'S S u t-U -o •o c u
3 . § 5 O 3 :cS W 05 J
II e. -s
Bi S
3 :3 _
•o o in
-< cfl t^ ^
2 •£ S tü
£ *
13 c S t. o •* 0 3 5 « 5 N -e es g Pi -J Bi w N
2 .g 6 g fe
o
p. <
e o
M -H ' Q
X)
« 'c e ca
"o *->
i - i
X) CU
X! O
05
C
3
3 _*
l-H
O
I « « H Ä K
u <u •£ .E * e ei o : 3 t-C — S •- o
H B S * ^ J Ô I N ^ ^ ^ X
3 .3 - :0 3 -£
'S S 5 5 CA S3 tb O
ê
3 ?
5 ° X en
E E o 1/3
E o H
: 3
J2 O
2 c 3 £ £ *
3 U o c d •53 < M <
•o 5 — *- i> c 3 . 5 » ï S n O n ï .
" c £ .55 <
5 M 3 VH
:3 (H
3 S -J BS
i- E 's 6
3 O
• 5 ^ 1
I 3 1
62

Hierbei handelt es sich um Holz- oder Stahlgerüste, die mit Kunststoff-Folie bespannt sind oder deren Wände und Dächer aus Glas, Plexiglas oder anderem lichtdurchlässigen Material bestehen. Die von uns benutzten Hauben werden während der Begasung der Pflanzen mit dem gewünschten Schadstoff, z.B. Fluorwasserstoff, über den Pflanzenbestand gestülpt (Guderian, 1967). Die Außenluft wird mit Hilfe von Ventilatoren durch die Haube gesaugt. Handelt es sich dabei um bereits verschmutzte Luft, so muß diese mit Hilfe von entsprechenden Filtern gereinigt werden, bevor der entsprechende Schadstoff appliziert wird. Mit Hilfe geeigneter Dosiervorrichtungen und einer entsprechenden Arbeitsweise kann man Dauerkonzentrationen einwirken lassen oder auch Tagesgänge der Schadstoff-Konzentration simulieren. Auch für Begasungen, die im Rahmen der Auslese und Züchtung immissionsresistenter Pflanzen erforderlich sein können, sind die genannten Begasungshauben geeignet. Wir untersuchten zurzeit die Wirkung von Fluorwasserstoff auf Pflanzen in einer solche Anlage von 15 Begasungshauben als Vorstufe für einen Naturversuch. Die vorläufigen Ergebnisse sind in Tabelle 2 zusammengestellt. Sie zeigen, daß zum Schutz der Vegetation geeignete Immissionsgrenzwerte sehr niedrig, also bei ca. 1-2 y.g Fluorwasserstoff/m3 angesetzt werden müssen. (Die vollständigen Ergebnisse werden in Kürze von Guderian, van Haut und Stratmann publiziert.)
Eine andere Versuchstechnik ist von Spierings (1967) entwickelt worden. Hierbei handelt es sich um eine transportable Vorrichtung, bei der die dosierte Schadstoffmenge in die unmittelbare Umgebung der zu untersuchenden Pflanze geblasen wird. Die hier vorhandene Schadstoffkonzentration wird mit einem automatischen Meßgerät registriert. Diese Technik hat den Vorteil gegenüber der Anwendung stationärer Anlagen, daß auch Pflanzen untersucht werden können, die nicht von ihrem natürlichen Standort entfernt werden können, wie z.B. Forstkulturen.
Ein zweiter Grund für Begasungen am natürlichen Standort ist bei Untersuchungen gegeben, die die Grundlage für sogenannte passive pflanzenbauliche Anpassungsmaßnahmen bilden ; denn neben den durch Begrenzung der Emission und der Luftverunreinigungen selbst zu erreichenden Verminderungen oder Verhinderungen nachteiliger Immissionswirkungen muß versucht werden, die Pflanzenschäden dadurch zu verringern, daß man soweit wie möglich eine Anpassung des Pflanzenbaues an vorliegende Immissionsverhältnisse vornimmt. Dies läßt sich dadurch erreichen, daß man unter Berücksichtigung der vorhandenen Agrarstruktur diejenigen Pflanzen bevorzugt anbaut, die gegenüber den vorliegenden Luftverunreinigungskomponenten am widerstandsfähigsten sind bzw. die speziell als relativ immissionsresistent gezüchtet worden sind. Da derartige Anpassungsmaßnahmen meist örtliche Bedeutung haben, sind unter Standardbedingungen z.B. in Klimakammern ermittelte Empfindlichkeitsreihen °ft nicht ausreichend. Zweckmäßige Expositionsversuche müssen daher auf die örtlichen und regionalen Boden- und Klimaverhältnisse sowie auf die ortsübliche Vegetation abgestimmt sein. Hierfür sind offenbar mobile Systeme am besten geeignet. Das gleiche trifft zu für Untersuchungen über den Einfluß von Düngungsmaßnahmen zur Verminderung der Immissionsschäden sowie für Begasungen am jeweiligen natürlichen Pflanzenstandort im Zusammenhang mit der Auslese und Züchtung immissionsresistenter Pflanzen, z.B. Gehölzen.
63

laoelie i.. YVJIKUUB "«"
Pnanzenart xl* zentralem in v-e
Gladiolus Pinus strobus Picea abies Fraxinus excelsior Larix leptolepis Abies nordmanniana Fagus sylvatica Tulipa(14Var.)
Crocus (2 Var.)
Scilla Hyacinthus (2 Var.) Narcissus (3 Var.) Wintergerste Acer platanoides Pinus nigra laricio Vicia sativa Avena sativa Bellis perennis Picea abies Juniperus communis Süßlupinie Felderbse Taxus baccata Lupinus angustifolius
Dianthus caryophyllus
Chrysanthemum Tagetes Antirrhinum 3 Proben gemischter Gräser'
3 Proben gemischter Kleearten8
/m3
1.0 1,3 1,3 1.3 1.3
1,3 1,3 1,5
2.0
2,0 2,0 2,0 3,3 4,2 4,2 4,4 5.1 5 5,4 5,5
10,1 10,1 22,0 25
25
25 25 25
ca. 0.9 1.1 2,8
Einwirkungsdauer in Tage
3 7
10 10 17
17 60 12
11,5
11,5
11,5 11.5 12 7
10 15 15 1
11 14 8 8
10 5
5
5 5 5
16 48 48
0,85 16 1,1 2.8
48 48
Blattschädigung Wuchsdepressionen
Nekrosen an den Blattspitzen
ditto ditto Chlorosen Nekrosen ditto ditto sehr schwache bis starke Nekrosen an den Blattspitzen sehr starke Nekrosen an den Blattspitzen ditto
ditto ditto
+ Chlorosen Nekrosen an den Blattspitzen
+ +
ohne Nekrosen starke Nekrosen an den Blattspitzen schwache Spitzennekrosen
+ • r
sehr schwache Spitzennekrose Chlorosen und schwache Nekrosen an den Blattspitzen schwache Nekrosen an den Blattspitzen schwache Chlorosen ohne ohne 1. Lolium p,;renne. Dactylus glome-rata, Festuca pratensis, Phleum pratense 2. Medicago sativa, Trifolium pratense, T. repens, T. hybridum, T. incarnatum
F-Anrei-
cherung in mg/100 g TS
bis ca. 9
20 60 9
30 130
Der zweite große Aufgabenkomplex neben den Unterlagen für Grenzwerte und Anpassungsmaßnahmen ergibt sich daraus, daß auch bei der Praktizierung sehr strenger genereller Präventmaßnahmen der Luftreinhaltung immer einzelne Schadensfälle von mehr oder weniger großer Bedeutung auftreten werden. Zur öffentlich-recht-
64

liehen und privat-rechtlichen Einleitung von Abhilfe maßnahmen müssen Untersuchungen durchgeführt werden, bei denen erstens der Zusammenhang zwischen den eingetretenen Wirkungen und den wirksam gewordenen Immissionskomponenten und zum anderen der Zusammenhang zwischen den einzelnen Immissionskomponenten und den verursachenden Emissionsquellen zu rekonstruieren ist. Diesen Nachweis zu führen, bereitet dem Gutachter große Schwierigkeiten, da ja die Ursache für den feststellbaren Schaden in der Vergangenheit liegt, somit der Kausalzusammenhang nicht mehr beobachtet werden kann und man auf die Rekonstruktion eines Sachverhalts angewiesen ist. Für den Rückschluß auf die verursachende Immission sind in erster Linie solche Pflanzenreaktionen, wie beispielsweise Blattnekrosen, und solche Schadstoff-Anreicherungen in dei Pflanze geeignet, die in enger Beziehung zu bestimmten Immissionskomponenten stehen oder gar für einzelne Komponenten spezifisch sind. Da bislang kaum derartige spezifische Symptome bekanntgeworden sind, ist der Rückschluß von der eingetretenen Wirkung auf die Ursache sehr schwierig. Die zur Zeit angewandte Methodik zur Analyse von Schadensfällen zielt denn auch darauf ab, durch die biologische und chemische Untersuchung des geschädigten Objekts un der Vegetation in seiner Umgebung möglichst viele, an sich unspezifische Symptome und Reaktionen zu ermitteln und diese differenzialdiagnostisch auszuwerten. In dem Maße, wie biotische Ursachen und abiotische Einflüsse, wie z.B. ein Mangel oder ein Überangebot an Wasser oder Nährstoffen als Schädigungsursache ausgeschlossen werden können, können die zunächst nur vermuteten Beziehungen zu einer bestimmtem Immissionskomponente als Ursache für die Schädigung gesichert werden, umso eher dann, wenn auch luftanalytische Meßwerte zur Verfügung stehen. Dabei handelt es sich um keinen exakten Nachweis, sondern, wie Guderian und Stratmann es treffend formuliert haben (Guderian, 1966) 'mehr um eine logische Schlußfolgerung (Indizienbeweis), die über die Berücksichtigung der Tendenz mehrerer Einzelmerkmale zwingend wird'. Die bei der phytopathologischen Untersuchung der geschädigten Pflanzen aufgekommene Vermutung, daß es sich, beispielsweise bei festgestellten Nekrosen, um die Wirkung einer bestimmten Immissionskomponente gehandelt hat, stützt sich dabei auf die Ergebnisse von Modellexperimenten, bei denen in Abhängigkeit von bekannter Konzentration und Einwirkungsdauer einer Immissionskomponente möglichst viele Effekte, wie z.B. auftretende Nekrosen, ihre Art und Verteilung auf den Blättern, Zellveränderungen, aufgenommene Schadstoffmenge u.a. ermittelt werden. Beobachtet man nun bei einem Schadensfall an der geschädigten Pflanze die gleichen Reaktionen, so folgert man, daß die im Experiment kausal für diese Reaktionen verantwortliche Immissionskomponente auch in diesem Schadensfall wirksam geworden ist. Im Gegensatz zu den erwähnten Naturversuchen zur Ableitung von Luftqualitätskriterien müssen die Experimente zur Ermittlung von Unterlagen für die Erkennung von Immissionsschäden so angelegt sein, daß durch die ständige Beobachtung der Verhaltensweise der getesteten Pflanzen in Abhängigkeit von dem jeweiligen Immissionsangebot und den übrigen Umweltbedingungen sozusagen die 'Feinstruktur' der Immissionswirkung ermittelt werden kann. Unter 'Feinstruktur' soll verstanden werden beispielsweise die Abhängigkeit der Wuchsleistung oder des Nekrotisierungsgrades oder der Stoffwechselstörung oder der Schadstoffanreicherung vom Einwirkungszeitpunkt des
65

Schadstoffes, von der Konzentrationshöhe, von der Einwirkungsdauer, vom Blattalter, von der Tageszeit, von der Nährstoff- und Wasserversorgung, vom Klimazustand usw. Hierher gehören auch Untersuchungen über die Wirkung von Schadstoffgemischen, Untersuchungen über die relative Toxizität der verschiedenen Immissionskomponenten, die Aufdeckung von Mechanismen beim Eindringen der Schadstoffe in die Pflanze sowie bei weiteren Reaktionen, Untersuchungen über den Transport und die Verteilung der aufgenommenen Schadstoffe und ihrer Reaktionsprodukte sowie als Voraussetzung hierfür, die Erarbeitung brauchbarer Verfahren zur Bestimmung der von der Pflanze aufgenommenen Schadstoffmengen. Es würde zu weit führen, alle interessierenden Teilphänomene aufzuzählen. Es wird daher auf das in jüngster Zeit erschienene Buch von Garber (1967) verwiesen. Im folgenden soll auf einige grundlegende Dinge eingegangen werden, die bei der Planung von Experimenten zur Ermittlung dieser Feinstruktur der Immissionswirkungen bei Pflanzen beachtet werden müssen.
Grundsätzlich gibt es 2 Verfahrensweisen, den 'klassischen' Versuch mit Eingriff, der meistens monofaktoriell vorgenommen wird, und den seit einiger Zeit mit Erfolg in der natur- und agrarwissenschaftlichen Forschung angewandten Versuch ohne Eingriff. Der Versuch mit Eingriff ist dadurch gekennzeichnet, daß z.B. in einer Klimakammer die Wirkung eines Faktors, beispielsweise die Schadstoff-Konzentration auf eine Zielgröße, z.B. die Blattschädigung untersucht wird, wobei alle übrigen Einflußfaktoren, die sich unter natürlichen Freilandbedingungen ständig mehr oder weniger stark ändern, bewußt konstant gehalten werden. In der Regel wird bei Versuchen dieser Art auch das Schadstoffangebot nicht so appliziert, daß es den natürlichen Variationen der Schadstoff-Konzentration in der Außenluft entspricht. Hinsichtlich der Exposition der Pflanzen werden ebenfalls Eingriffe vorgenommen (Verwendung von Topfkulturen, Versuchsböden u.a.). Man wählt also aus der Fülle möglicher Faktorenkombinationen eine bestimmte Kombination aus und legt dadurch die Randbedingungen für das Experiment fest. Dabei wird leider häufig übersehen, daß mit dieser Aufstellung des Versuchsmodells auch bereits weitgehend über die Aussagekraft des Versuchsergebnisses vor allen Dingen in Bezug auf seine Gültigkeit für natürliche Freilandverhältnisse entschieden worden ist. Je stärker der Eingriff des Experimentators ist und je leichter das jeweilige Problem dadurch der experimentellen Bearbeitung zugänglich wird, desto beschränkter wird die allgemeine Aussagekraft des Versuchsergebnisses, da mit der Isolierung des polyfaktoriellen Problems auf die Untersuchung einiger weiniger Faktoren auch nur ein Teilaspekt des Gesamtproblems beleuchtet werden kann. Erst aus der allerdings häufig sehr schwierigen Synthese vieler Einzelergebnisse ergibt sich eine Aussage von allgemeiner Bedeutung. Als Beispiel sei die beschränkte Aussagekraft einzelner Klimakammerversuche für die Aufstellung von Luftci'ialitätskriterien und für die Ermittlung des Resistenzverhaltens von Pflanzen gegenüber Luftveiunreinigungen herangezogen. Die meisten dieser Versuche sind von den verschiedenen Experimentatoren zur Bearbeitung eng begrenzter Fragestellungen vorgenommen worden und haben zu durchaus wichtigen Ergebnissen geführt, beispielsweise zur Ermittlung der unterschiedlichen Immissions-Empfindlichkeit von Pflanzen gegenüber Schwefeldioxid in Abhängigkeit vom Entwicklungsstadium oder
66

zur Aufklärung des Tag-/Nach-Verhaltens von Pflanzen gegenüber Schwefeldioxid (van Haut und Stratmann, 1967). Es wäre aber falsch und auch durchaus nicht im Sinne der Versuchsansteller, derartigen Experimenten eine allgemeine Bedeutung zuzumessen, insofern, als man die erhaltenen Ergebnisse als gültigen Ersatz für die Ergebnisse von Versuchen betrachtet, die unter natürlichen Verhältnissen durchgeführt werden müssen, also z.B. solche, welche die Grundlage für Immissionsgrenzwerte oder für Empfehlungen über die Anbaueignung von Pflanzen in Immissionsgebieten sind. Um allgemein gültige Aussagen zu machen, müßte man - wie schon erwähnt - in vielen monofaktoriellen Versuchen viele Faktorenkombinationen, wie sie in der Natur auftreten können, untersuchen. Dieses Verfahren ist allein vom Aufwand her als äußerst problematisch anzusehen, ganz abgesehen davon, daß er nicht leicht ist, eine Synthese der erhaltenen Einzelergebnisse zu machen. Der optimale Anwendungsbereich der monofaktoriellen Versuche mit Eingriff ist die systematische Bearbeitung bestimmter Teilprobleme, wie sie beispielsweise biochemische Reaktionsabläufe u.a. darstellen. Oft stellen diese Versuche die erforderlichen Vorarbeiten für Naturexperimente oder für andere weitergehende Studien über das Verhalten von Pflanzen gegenüber Immissionen dar.
Bei der anderen Möglichkeit der Versuchsanstellung, dem Experiment ohne Eingriff, wird von vornherein gar nicht der Versuch gemacht, das vorliegende polyfaktorielle System, was die Pflanze mit ihrer Umwelt und der Luftverunreinigung (als im vorliegenden Zusammenhang speziellen Teil der Umwelt) darstellt, in einzelne Faktorenkombinationen aufzuspalten und diese getrennt voneinander zu untersuchen. Vielmehr versucht man hierbei, die als Folge eines polyfaktoriellen Geschehens aufgetretene Immissionswirkung nachträglich zu analysieren mit dem Ziel, die dominierenden Zusammenhänge zwischen den verschiedenen Einflußfaktoren zu ermitteln. Der Experimentator, der beim Versuch mit Eingriff in verschiedenster Weise manipulieren muß, ist also lediglich zum Beobachter geworden. Zu einem Beobachter allerdings, der sich modernster naturwissenschaftlicher, technischer und mathematisch-statistischer Methoden bedienen muß, um die, aufgrund natürlicher, nicht vom Experimentator beeinflußter Abläufe, sich von selbst einstellenden zeitlichen Veränderungen möglichtst vieler Faktoren messen und auswerten zu können. Bei den Variabelen handelt es sich neben den auf der Immissions- und Wirkungsseite zu messenden und beobachtenden Größen physikalisch-chemischer und biologischer Art vor allen Dingen um meteorologische Faktoren (Einstrahlung, Luftfeuchte, Lufttemperatur, Regenmenge, Taumenge, Windgeschwindigkeit u.a.), um andere Variable der Pflanzenumwelt, wie z.B. Bodenfeuchte, Nährstoffversorgung u.a., um endogene Faktoren und all die Variablen, die an der Pflanze selbst zu beobachten sind, wie z.B. der Spaltöffnungszustand u.a. Wenn man nur die unter natürlichen Verhältnissen mehr oder weniger stark variierenden meteorologischen Faktoren herausgreift, so ist klar, daß diese Faktoren sich z.B. sowohl auf das Schadstoff-Angebot als auch auf die Disposition der Pflanze für den Angriff des Schadstoffes auswirken. Darüber hinaus beeinflußt nicht jeder meteorologische Faktor unmittelbar den Zusammenhang zwischen Schadstoff-Angebot und Schadstoffwirkung, sondern z.T. erst nach vorhergegangener Beeinflussung anderer Faktoren. Wir haben es also mit auf verschiedenen Stufen wirksamen Einflüssen, also
67

SI
mit Kettenprozessen zu tun. Beispielsweise ist die Lufttemperatur abhängig von der Sonneneinstrahlung. Eine Variierung der Lufttemperatur zieht aber eine Veränderung der X t i v l n Luftfeuchte nach sich. Es ist bekannt, daß alle drei Faktoren das Pflanzenwachstum beeinflussen und somit auch die Ausprägung einer Immiss.onswirkung. Es sind also durchaus Beziehungen zwischen jeden der dre, genannten Klirrfaktoren und der Immissionswirkung möglich, wobei aber unter Berücksichtigung der skizzierten Beeinflussung der drei Faktoren untereinander die Korrelationen unterschiedlich hoch sein werden und zunächst unbekannt ist, bei welchem Zusammenhang es sich um eine Kausalbeziehung handelt. In ähnlicher Weise bestehen ein- oder mehrstufige Zusammenhänge zwischen der Windgeschwindigkeit, dem Schadstoffangebot und der Schadstoffaufnahme oder zwischen verschiedenen endogenen Faktoren, oder pflanzenbaulichen Faktoren, wie Düngung, Wasserversorgung u.a. und der Immissionswirkung Für die eingangs schon erwähnte Analyse solcher polyfaktorieller Systeme sind nun mathematisch-statistisch Verfahren entwickelt worden, die unter der Bezeichnung multivariate Analysenverfahren zusammengefaßt werden können. Hierbei handelt es sich um komplizierte Verfahren der Regressionsrechnung, wie die Faktorenanalyse, die Pfadkoeffizientenmethode, die kanonische Korrelation u.a. Sie erlauben es, die in der Vielzahl der biologischen, physikalisch-chemischen und meteorologischen Daten zunächst verborgene Information herauszuholen. Da ein hoher Rechenaufwand erforderlich ist, ist eine rationelle Datenverarbeitung mit Hilfe von Computern notwendig, wie auch für die Messung und Erfassung der verschiedenen Variablen ein Höchstmaß an Automatisierung zweckmäßig ist. Das Ziel einer faktorenanalytischen Auswertung besteht nun darin, einerseits kausale Zusammenhänge herauszufinden und andererseits Korrelationen aufzufinden und diese so zu klassifizieren, daß Bündel untereinander verwandter Zusammenhänge entstehen. Durch diese Reduzierung der Anzahl der Variablen von zunächst sehr vielen auf schließlich einige wenige dominierende Faktoren, gelingt es, die Struktur des polyfaktoriellen Geschehens zu erkennen. Diese Kenntnis ist von erheblicher Bedeutung für die zweckmäßige Planung und Durchführung von weitgehend naturgetreuen Modellversuchen in entsprechend leistungsfähigen Klimakammern, in denen man die natürlichen Variationen der verschiedenen Faktoren, wie Immissionsangebot, Klimafaktoren usw., die beispielsweise im Verlaufe eines Tages oder eines Jahres auftreten, künstlich nachahmen kann. Auf der Basis einer faktorenanalytischen Auswertung, die keine abgeschlossenen Erkenntnisse bringen soll und kann, lassen sich solche Modellversuche und auch Versuche manofaktorieller Art vorurteilsloser und rationeller ansetzen als wenn man, wie bislang, gezwungen ist, durch mühevolles und zeitraubendes Probieren vieler Faktorenkombinationen die entscheidenden herauszufinden. Die anderen genannten Auswertungsverfahren für polyfaktorielle Versuche erfordern im Vergleich zur Faktorenanalyse bereits mehr Kenntnisse über das jeweilige Phänomen als die Faktorenanalyse, so daß manz. B. die Pfadkoeffizientenmethode für nachfolgende Versuche oder auch aufgrund anderer praktischer Erfahrungen oder theoretischer Überlegungen einsetzen kann.
Bislang ist die Faktorenanalyse zur Untersuchung der Wirkungen von Luftverunreinigungen auf Pflanzen wohl noch nicht eingesetzt worden. Wir haben daher be-
68
gönnen, einen in der Umgebung einer SO-2-emittierenden Erzrösterei durchgeführten Naturversuch faktorenanalytisch auszuwerten. Bei diesem Naturversuch ist die SO2-Konzentration an 6 unterschiedlich mit SO2 belasteten Pflanzenbeobachtungsstationen während mehrere Jahre ständig mit Hilfe automatischer Geräte registriert worden. Außerdem liegen Beobachtungen mehrerer meteorologischer Faktoren, nämlich der Niederschlagsmessungen, der Lufttemperaturen, der Sonnenscheindauer, der relativen Luftfeuchte sowie allgemeine Kennzeichnungen der Wettersituationen vor. Auf der biologischen Seite wurde neben den am Ende der Wachstumsperiode beobachteten Kriterien, wie Ertrag, Qualität, Triebleistung u.a. vom Beginn der Vegetationszeit an in regelmäßigen Abständen das Auftreten und das Ausmaß von Blattschädigungen, wie Blattverformungen, Chlorosen, Nekrosen sowie der Blütenbesatz, der Zeitpunkt und das Ausmaß des Blattfalls, des Fruchtfalls u.a. biologische Kenngrößen beobachtet. Das Ziel der begonnenen Auswertung ist es, aus der Fülle möglicher Zusammenhänge diejenigen herauszufinden, die für die Darstellung des Zusammenhangs zwischen S02-Angebot und SO2-Wirkung von Bedeutung sind.
Zusammengefaßt ergibt sich, daß die je nach Versuchsfrage mono- oder polyfaktoriell und sowohl in leistungsfähigen Klimakammern als auch in Naturversuchen durchzuführenden Experimente letztlich dazu dienen, möglichst viel über die Verhaltensweise der Pflanzen gegenüber den verschiedenen Luftverunreinigungen zu erfahren, um in praktischen Fall aus der aufgetretenen Reaktion auf die wirksam gewordene, aber zunächst noch unbekannte Luftverunreinigungskomponente schließen zu können. Selbstverständlich sind derartige Untersuchungen, weil sie zur Vermehrung des Wissens überhaupt führen, oft die Vorstufe für Untersuchungen zur Ermittlung von Luftqualitätskriterien und zur Feststellung des Resistenzverhaltens von Pflanzen gegenüber Luftverunreinigungen.
Es ist naheliegend, nun aufgrund einer aufgetretenen Pflanzenreaktion nicht nur bei den zufällig auftretenden Schadensfällen Rückschlüsse auf die Luftverunreinigungen zu ziehen, sondern geplant Luftverunreinigungen mit Hilfe von geeigneten höheren und niederen Pflanzen nachzuweisen, sie mit anderen Werten biologisch zu indizieren. Der wichtige Unterschied gegenüber den zufällig auftretenden Schadensfällen ist der; daß bei der Anwendung von Pflanzen als biologische Indikatoren bewußt Standardbedingungen gesetzt werden, ja gesetzt werden müssen, damit die Pflanze sozusagen 'Meßgerät' brauchbar wird. Mit anderen Worten: Aus der Reaktion einer für den Fluorwasserstoff-Nachweis speziell ausgewählten und unter speziellen Bedingungen hinsichtlich des Bodens, der Nährstoff- und Wasserversorgung exponierten Tulpen-Varietät kann nicht unmittelbar auf die schädigende Wirkung des nachgewiesenen Fluorwasserstoffes auf Tulpen allgemein oder auf Zwiebelgewächse geschlossen werden. Um aus den mit Indikatorpflanzen erhaltenen Beobachtungsergebnissen Rückschlüsse auf mögliche Schäden bei anderen, unter den üblichen Bedingungen des Pflanzenbaues kultivierten Pflanzen ziehen zu können, müssen die Korrelationen zwischen Indikatorreaktion und Schäden bei den jeweils zu beurteilenden Pflanzen vorab in ähnlichen Versuchen ermittelt werden, wie sie für die Ermittlung von Grenzwert-Unterlagen geschildert worden sind, nämlich in Naturversuchen. Welche Pflanzenreaktion kommt nun zum Nachweis von Luftverunreinigungskom-
69

ponenten oder von Komponentengruppen in Betracht? Emerze.ts kann die ange-reichë e Menge einer Luftverunreinigungskomponente, z.B. von Fluorwasserstoff au genutzt werden. Weiterhin können äußerlich sichtbare Symptome, wie Nekrosen, ZB in Form der Absterberate bestimmter Flechten herangezogen werden. DnUens •st es wahrscheinlich, daß im Stoffwechsel der Pflanze gebildete Reaktionsprodukte aus den aufgenommenen Luftverunreinigungen brachbare Indikatorreaktionen dar-bellen Kombiniert man diese drei Möglichkeiten mit der art- bzw. Sorten- oder sogar kon-spezifischen Empfindlichkeit der Pflanzen so gelangt man zu v.elfalt.gen Mog-hchkeiten Neben der Anwendung von Indikatorpflanzen in der fre.en Atmosphäre kann man die Indikatorpflanzen auch in geeigneten Expositionssystemen, wie sie etwa Darlev in Riverside oder Hindawi in Cincinnati benutzt haben, anwenden und dadurch die Aussagekraft der Indikatorreaktionen noch steigern. Wir haben eine Plexiglaskammer konstruiert, die aus zwei völlig gleichen Abteilungen besteht. Durchbe.de Kammerteile wird die zu analysierende Außenluft mit gleicher Geschwindigkeit hindurch gesaugt Der eine Kammerteil (die Vergleichskammer) erhält gefilterte Luft, der andere (die Prüfkammer) die Außenluft direkt. Indem man nun wechselweise selektiv auf einzelne Luftverunreinigungskomponenten oder Komponenten-Gruppen wirkende Filter anwendet, kann man aus der Beobachtung der Reaktion der Testpflanzen in der Prüfkammer untereinander und im Vergleich zur Verhaltensweise der gleichen Test-
flanzen in der Vergleichskammer eine Fülle von Rückschlüssen auf vorhandene Luftverunreinigungskomponenten ziehen. Die Indikatorkammern haben gegenüber der Anwendung der Indikatorpflanzen in der freien Atmosphäre den Vorteil, daß sie
Bestatten die über den Boden wirkenden Schadstoffe (z.B. sedimentierende zink-oder bleihaltige Stäube) in ihrem Effekt zu eliminieren. Durch die Anwendung von Indikatorpflanzen-Kombinationen wird es auch möglich sein, in schwierigen Fällen die schädigende Luftverunreinigungskomponente zu ermitteln, nämlich dann, wenn gleichzeitig mehrere Luftverunreinigungskomponenten vorliegen, wie es in industriellen Ballungsräumen meistens der Fall ist. Die biologischen Indikatoren ergänzen somit die physikalisch-chemischen Verfahren der Luftanalyse, indem zunächst qualitative Aussagen gemacht werden können, aufgrund derer abgeschätzt werden kann, ob und wenn ja, welche physikalisch-chemische Verfahrenweise zweckmäßigerweise anzuwenden ist.
Da die Indikatorpflanzen in der Regel nicht während ihrer gesamten Vegetationsperiode brauchbar sind, weil sich z.B. ihre Empfindlichkeit im Verlaufe der Zeit ändert, da die Art der Anzucht eine Rolle spielt, da bestimmte Kulturmedien, eine bestimmte Nährstoffversorgung und dergleichen wichtig sind, sind vorab exakte Versuche erforderlich, um die Standardbedingungen für die Anwendung der Indikatorpflanzen festzulegen. Für die entsprechenden Untersuchungen eignen sich Klimakammern in vorzüglicher Weise.
Nach anseren Erfahrungen, die auf mehrjähriger praktischer Anwendung in Parzellen, in Gefäßen oder auf besonderen Trägern (Flechten) beruhen, eignen sich speziell für die Indizierung von Schwefeldioxid: Rotklee, Weißklee, Schwedenklee, Inkarnatklee, Luzerne, Lupine und Ackerbohne; von Fluorwasserstoff und ähnlich wirkenden gasförmigen Fluorverbindungen : Gladiolen, Tulpen, Monbretien, Krokus, Scilla,
70
Hyazinthe, Narzisse, Begonie (weiß), Steinobst und Weinrebe; von gasförmigen und festen anorganischen Fluorverbindungen: Graskulturen in Gefäßen oder auf Parzellen; von Oxydantien (Ozon): Tabak (Bel W3). Ausserdem wurden verschiedene Pflanzenarten in transportablen Indikatorkammern in gereinigter und ungereinigter Luft nebeneinander an verschiedenen Standorten exponiert, womit bis auf die zu untersuchenden Luftverunreinigungen vergleichbare Umwelt-bedingungen vorliegen. Die spezifische Wirkung einzelner Immissionskomponenten kann dabei sowohl über eine Kombination unterschiedlich anfälliger Testpflanzen als auch über die Ausfilterung bestimmter Verunreinigungen mit entsprechenden Filtersystemen sowie durch die Kombination beider Möglichkeiten erfaßt werden. Eine Auswahl geeigneter Indikatorenpflanzen enthält die nachfolgende Übersicht:
für Schwefeldioxid: Kleearten, Luzerne, Lupine, Ackerbohne ;
für Fluorwasserstoff und ähnlich wirkende gasförmige Fluorverbindungen : Tulpenvarietäten, Monbretien, Ferrarien, Krokus, Scilla, Hyazinthe, Begonie (weiß), Weinrebe (Stecklinge) und Weymouthkiefer (Sämlinge);
für gasförmige und feste anorganische Fluorverbindungen : Graskulturen in Gefäßen ;
für Oxydantien (Ozon) : Tabak (Bel W3), frühe Entwicklungsstadien.
Besonders interessant erscheint uns als Indikator die Flechtenart Parmelia physodes.
Diese Pflanze reagiert nach Transplantation aus ihrer natürlichen Umgebung in eine Meßanordnung unter den von Schönbeck (1969) in unserem Institut ausgearbeiteten Standardbedingungen sowohl auf Fluorwasserstoff als auch auf Schwefeldioxid, wobei die Reaktion, nämlich die Absterberate kaum von klimatischen Schwankungen, wie sie an den einzelnen Untersuchungsstellen vorkommen können, gestört wird.
In vielen Fällen können durch eine zweckmäßige Verteilung der Indikator-Stellen in dem zu analysierenden Gebiet neben Aussagen über die Schadstoffe auch Aussagen über die Herkunft und die Ausbreitung von Luftverunreinigungen gemacht werden.
Summary
Experiments on the effects of air pollution To guarantee general protection of vegetation against air pollution, standards of
air quality are needed for different air pollutants, and air must be monitored. Experimental criteria of air quality, indicating the risk of damage at a certain level of pollutants, form the basis for such standards. Besides limiting air pollution, damage can be decreased by adapting cultivation methods and crop varieties to the pollution conditions by using differences in sensitivity of plants as already known from various trials.
Though general measures may be useful, the full solution to a problem of air pollution requires research into the causal agent and its origin. Unfortunately, none of the
71

reactions observed so far on plants in the field can be considered specific for any pollutant. A search for specific symptoms in plants is therefore important for recognition and evaluation of pollution damage.
Recently indicator plants for the detection of air pollutants and their range of distribution have gained ground as a supplement to physical and chemical analysis of air. Trials in progress are described.
Résumé
Various experimental approaches are discussed. L'examination des effets de la pollution de l'air sur les plantes
Une protection préventive générale de la végétation contre la pollution de l'air exige la connaissance des valeurs-limite des composants des pollutions et un contrôle analytique de l'air. Cettes valeurs-limite, déterminées expérimentalement, doivent être incorporées dans les critères de qualité de l'air.
Outre les mesures pour limiter les immissions, on a la possibilité d'adapter la culture des plantes, en utilisant les différentes sensibilités des végétaux, établies par experiment à certaine mesure adapté aux immissions, afin d'amener une réduction des endom-magements.
On ne peut pas éviter tout endommagement, parce que, par des mesures prévoyantes, il faut examiner, dans chaque cas spécial, quelle substance nuisible a causé les lésions, et on doit connaître la source d'émission pour introduire des remèdes Malheureusement, jusqu'à présent, les réactions, observées sur les plantes en plein air ne suffisent pas pour reconnaître une immission spécifique. Les investigations pour découvrir des symptômes spécifiques sont très importantes: de résultats positifs faciliteront beaucoup l'identification et l'estimation des endommagements causés par l'immission sur les végétaux.
Récemment l'application de plantes indicatrices pour découvrir les composantes de la pollution de l'air a gagné en importance, comme complément de l'analyse physique et chimique de l'air. Les expériences récentes sont rapportées.
Les possibilités disponibles pour poursuivre les recherches sont discutées afin de trouver des formes adéquates pour résoudre les problèmes mentionnés ci-dessus.
Literatur
Bundesministerium des Innern der deutschen Bundesrepublik. 1964. Allgemeine Verwaltungsvor schrift über genehmigungsbedürftige Anlagen nach § 16 der Gewerbeordnung Garber, K. 1967. Luftverunreinigung und ihre Wirkungen. Bornträger Berlin Guderian, R. 1966a. Ber. a.d. LIB 4: 80-100. Guderian, R. 1966b. Z. Pflanzenkrankh. u. Pflanzenschutz 73: 241-65
Guderian. R., H. van Huut und H. Stratmann. 1960. Z. Pflanzenkrankh. u. Pflanzenschutz 67(5) Guderian. R. und H. Stratmann. 1958. Forschungsber. des Landes Nordrhein " l e S ' Haut, H. van. 1961. Staub 21: 2-56. Westfalen 1920. Haut, H. van und H. Stratmann. 1967. SchrReihe Landesanst f i • •
schutzdes Landes Nordrhein-Westfalen H. 7: 50-70 ^m.ss .ons-u. Bodennutzungs-
72

Schönbeck, H. 1968. In: Referate der VI. Internationalen Arbeitstagung forstlicher Rauchschadenssachverständiger, Katowice, 9-14 Sept. 1968.
Schönbeck, H. 1969. Staub 19: 14-8. Spierings, F. 1967. Atmosph. Environm. 1: 205-10. Stratmann, H. und M. Buck. 1966. SchrReihe Landesanst.f.Immissions- u. Bodennutzungsschutz
des Landes Nordrhein-Westfalen H. 3: 7-53. Stratmann, H. und M. Buck. 1967. SchrReihe Landesanst. f. Immissions- u. Bodennutzungsschutz
des Landes Nordrhein-Westfalen H. 7:7-27. Auch in: Lehrgangshandbuch Reinhaltung der Luft. BW 643 (1966).
Stratmann, H. und H. Ixfeld. 1967. SchrReihe Landesanst. f. Immissions- u. Bodennutzungsschutz des Landes Nordrhein-Westfalen H. 8: 7-46.
Stratmann, H. und H. Ixfeld. 1967. SchrReihe Landesanst. f. Immissions- u. Bodennutzungsschutz des Landes Nordrhein-Westfalen H. 13: 7-52.
Thoenes, H. W. und W. Guse. 1966. In: Lehrgangshandbuch Reinhaltung der Luft. BW 638. Zahn. R. 1961. Staub 21: 56-60.
73

Quelques aspects de l'absorption du soufre par les plants soumises à une atmosphère contenant du S0 2
L. de Cormis
Laboratoire de Phytopharmacie C.N.R.A., 78 - Versailles, France
Sommaire
Lorsque l'on soumet des plantes à une atmosphère contenant de l'anhydride sulfureux en quantité faible, on constate une absorption de soufre sensiblement proportionnelle à la quantité proposée. Cette absorption se traduit par un accroissement de la teneur en soufre, suivi d'une métabolisation de celui-ci par la plante.
La plante réagit à une atmosphère contenant du SO. par une émission de H .S lequel provient presque essentiellement du SOs de l'air.
L'auteur conclut en remarquant l'importance de la lumière dans ces phénomènes, ce qui l'incite à penser qu'ils ont sans doute un rapport avec l'activité photosynthétique du végétal traité.
L'anhydride sulfureux est un des polluants de l'atmosphère les plus répandus et les mieux connus à l'heure actuelle. En ce qui nous concerne, depuis 1961, nous suivons les problèmes de pollution atmosphérique posés par les unités de désulfuration du gaz naturel à Lacq (Basses Pyrénées) qui rejettent quotidiennement quelques 400 tonnes de SO2 dans l'atmosphère. Ce polluant, émis dans une zone essentiellement agricole, provoque, chaque année, selon les conditions climatiques, des sinistres dont l'ampleur est variable selon l'espèce végétale atteinte.
A1 a sui te d'un certain nombre d'observations, nous avons été amenés à étudier l'absorption du soufre fourni aux plantes sous forme de SO2 et corrélativement à nous pencher sur les mécanismes de métabolisation du soufre ainsi absorbé. Dans un premier temps, nous avons d'abord étudié l'absorption du soufre d'un point de vue quantitatif. Puis, nous avons suivi la migration du soufre dans la plante et sa métabolisation ultérieure. Dans un second temps, nous avons découvert un mécanisme particulier de la réponse des plantes aux fumigations par l'anhydride sulfureux: la plante traitée réagit en émettant de l'hydrogène sulfuré.
Nous avons du réaliser des atmosphères artificielles contenant du SO2 en quantités variables. Nous avons utilisé soit du SO2 provenant d'un siphon, soit du SO2 radioactif produit par l'action du SO4H2 sur NaaSOa marqué par 35S.
En faisant la part des absorptions parasites de soufre (parois de la cage à fumigation, Pots où sont plantées les plantes etc....) nous avons pu montrer que le soufre fourni à des pieds de Tomate (Lycopersicum esculentum, var. Marmande) sous forme de SO2 atmosphérique, était absorbé proportionnellement à la quantité de SO2 fournie. En effet, en opérant sur des doses croissantes de SO2 et en dressant le bilan du soufre
75

absorbé par I g de matière végétale sèche, puis en le comparant à la quantité de soufre fournie, on trouve un rapport sensiblement constant, de l'ordre de 4% dans nos conditions opératoires.
De plus, cette absorption de soufre se traduit par une augmentation de teneur en soufre du végétal traité. Nous l'avons vérifié pour plusieurs espèces végétales (arbres fruitiers, vignes, végétaux herbacés) à Lacq en 1967 où la pollution atmosphérique par SO2 a sévi très souvent. Si la teneur en soufre des végétaux analysés croît régulièrement au cours de la saison, en revanche après le passage de chaque vague de pollution, cette teneur en soufre augmentait considérablement pour décroître ensuite dans les 48 heures suivantes.
Nous avons ensuite mis en évidence une certaine régulation de la teneur en soufre. En effet, en traitant des pieds de Tomate avec du SO2 radioactif, nous avons constaté que la quantité de soufre absorbée au cours de la fumigation baissait rapidement pour se stabiliser ensuite vers le quatrième jour qui suit la fumigation. D'ailleurs, lorsque ces mêmes plantes ont été cultivées sur milieu liquide, on retrouve du soufre radioactif dans les racines et dans le milieu liquide de culture Ceci tend donc à prouver qu'il y a une circulation du soufre ainsi absorbé et éventuellement une élimination par les racines.
Nous avons répété les mêmes expériences en traitant les plantes à la lumière et à l'obscurité. Cette étude se justifiait par l'observation faite à Lacq où la pollution par SO2 survenant la nuit ne provoque pas de dégâts sur la végétation. Nous avons voulu voir si dans ces conditions, l'absorption du soufre était moindre que lorsque les plantes sont traitées à la lumière.
Ces expériences réalisées sur Tomate ont montré que la quantité de soufre absorbée par gramme de matière sèche était sensiblement la même que les plantes soient traitées à la lumière ou à l'obscurité, à concentration égale de S0 2 dans la cage à fumigation.
Enfin, nous avons voulu rechercher sous quelle forme le soufre ainsi absorbé par les plantes se retrouvait dans le végétal. Pour cette étude, nous avons du utiliser du SO» radioactif. Nous avons déterminé la fraction minérale du soufre (essentiellement des sulfates) et la fraction organique (acides aminés et protéines). La caractérisation des deux fractions se fait aisément par ionophorèse et Chromatographie sur papier
Les résultats de nos expériences font ressortir que, si les plantes sont récoltées immédiatement après traitement, on retrouve le soufie absorbé essentiellement sous forme de sulfate (environ 98%). Au bout de 15 jours, on trouve la répartition suivante: acides aminés soufrés 2,5 % - protéines soufrées 5 % - sulfates 9~> 5 °/
Ceci tend donc à prouver que selon les besoins de la plante traitée, le soufre absorbé sous forme de S0 2 se retrouve sous forme de réserve en soufre ou sous une forme métabohsée. Ces résultats excluent donc l'hypothèse d'une phytotoxicité du SO* par action cumulative. En effet, puisque celui-ci est métabolisé en fonction des besoins de la plante, nen ne permet de penser qu'il puisse être Phytotox ique à basse concentra-tion.
Nous avons découvert que des plantes soumises à une atmosphère contenant du S0 2 dégagent de 1 hydrogène sulfuré. Ce dégagement se produit au bout d'une demi-
76

heure environ, et sa cause est bien le SO2 atmosphérique. En effet, des plantes placées dans les mêmes conditions mais en l'absence de SO2 ne produisent aucune trace de H2S. De même, si l'on remplace le SO2 par un aérosol de SO3 ou des vapeurs de HF, on n'obtient pas davantage de dégagement.
La lumière conditionne la libération de H2S. En effet, des plantes soumises à l'obscurité pendant 15 heures, puis traitées à l'obscurité, ne produisent aucun dégagement ; en revanche, si le traitement a lieu à la lumière, on enregistre un dégagement de H2S (1 à 2 p.p.m. à la lumière et 0,05 p.p.m. à l'obscurité). Si, dans le cas des plantes traitées à l'obscurité, on les maintient un certain temps à l'obscurité, le dégagement de H2S n'a pas lieu ; en revanche, dès qu'on éclaire ces plantes, on obtient alors une production de H2S.
11 était intéressant de savoir si l'hydrogène sulfuré provenait de la plante ou s'il résultait de la réduction par la plante du SO2 atmosphérique. Pour cela, nous avons utilisé du 35S pour marquer soit le SO2 atmosphérique, soit du sulfate.
Dans le premier cas, nous avons marqué le SO2 atmosphérique. Ainsi, en calculant la radioactivité spécifique du soufre dans l'hydrogène sulfuré dégagé, nous avons constaté que H2S provenait essentiellement du SO2 atmosphérique.
Dans le second cas, nous avons fait absorber du sulfate radioactif par la plante. En opérant comme précédemment mais avec du SO2 non marqué, nous avons pu montrer que le H2S dégagé était également radioactif, donc qu'il provenait également du soufre de la plante.
Ces essais réalisés sur Tomate, Haricot, Fève, Maïs et Vigne, plantes dont les exigences en soufre sont assez différentes les unes des autres, ont tous donné des résultats identiques.
La conclusion et que tous les phénomènes décrits sont largement conditionnés par la lumière, ce qui peut nous conduire à penser qu'ils ne sont peut-être pas sans rapport avec l'activité photosynthétique de la plante traitée. Il faudra donc, à l'avenir, poursuivre ces études qui sont rendues délicates par le fait que le métabolisme du soufre chez les végétaux supérieurs est assez peu connu et que d'autre part, ces phénomènes sont certainement sous la dépendance étroite de l'alimentation en soufre de la plante.
Summary Some aspects of the absorption of sulphur by plants subjected to an atmosphere containing SO2
Plants subjected to an atmosphere artificially polluted by SO2 in varying but comparatively small amounts, showed considerable absorption of sulphur, apparently Proportional to the presented quantity.
In nature such a pollution caused a perceptible increase in total S content. With 35S it was possible to follow the absorption in Tomato plants placed in an artificially Polluted atmosphere. Absorption did not depend on light, because results in the dark were nearly equal to those in full light. But in plants taken up immediately after treatment 35S was found in the sulphates, whereas after a certain 'rest period' it showed up
77
in the amino acids and proteins. In plants subjected for a short period to an atmosphere containing SO2, H2S was
given off during the next hour. This discharge came mainly from the SO2 in the atmosphere, but partly also from the sulphur in the plant, because if the plant was made to absorb 35S04 and was then exposed to SO2 without tracer, the tracer was nevertheless found in the H2S. This phenomenon depended on light: if the plants were treated in the dark and later on placed in the light, the discharge of H2S occurred normally.
This led to the assumption that absorption of SO2 and discharge of H2S were connected with photosynthesis. The absence of damages when pollution by SO2 occurs in the dark, and the discharge of H2S taking place only when the plants are illuminated, open new possibilities for the study of the metabolism of sulphur in relation to atmospheric pollution by SO2
Zusammenfassung Betrachtungen über die Absorption des Schwefels durch Pflanzen die einer S02-halti-gen Atmosphäre unterworfen werden
Setzt man Pflanzen einer verhältnismäßig niedrigen, variierten S02-Konzentration in der Luft aus, so findet man eine erhebliche, der vorgegebenden Konzentration entsprechende Aufnahme des Schwefels.
In der Natur fand sich bei starker Luftverunreinigung durch S02 eine merkliche Steigerung des Gesamtschwefels in den Pflanzen. Die Verwendung von markiertem SO2 (35S) erlaubte die Schwefelaufnahme an Tomaten zu verfolgen. Diese Aufnahme wird anscheinend nicht durch Licht beeinflußt, denn eine Begasung im Dunkeln führte nicht zu wesentlich anderen Ergebnissen. Unterschiede hingegen fanden sich, wenn man die Pflanzen sofort nach Begasung oder nach kurzer 'Ruhezeit' erntet- Der radioaktive Schwefel is dann einerseits in Sulfaten, andererseits in schwefelhaltigen Aminosäuten und Proteinen wiederzufinden.
Setzt man Pflanzen für kurze Zeit einer S02-haltigen Atmosphäre aus so läßt sich nach einer Stunde eine H2S-Abgabe feststellen. Letztere rührt aber nicht nur vom SO, der Luft her, sondern zum Teile auch vom Schwefel der Pflanze selbst- Läßt man bei Pflanze markiertes Sulfat (^S04) aufnehmen und unterwirft sie dann einer Begasung mit inaktivem SO2, so findet man doch aktives H2S. Dieses Phänomen wird vom Licht beeinflußt, denn i m Dunkeln wird überhaupt kein HäS abgegeben. Wird die Pflanze nachher dem Licht ausgesetzt, so verläuft die H2S-Abgabe normal
Es läßt sich also vermuten, daß S02-Aufnahme und H2S-Abgabe in keiner Beziehung stehen zur Photosynthese. Es eröffnen sich damit neue Wege zum Studium des Schwe-felstoflwechsels der Pflanze in bezug auf die Verunreinigung der Luft durch SO, denn Begasung in der Nachtzeit verursachte keine SOo-Schäden, Abgabe von H- S erfolgt nur während des Tages.
78

The effect of sulphur dioxide on epiphytic bryophytes1
W. J. Syratt and P. J. Wanstall
Department of Botany, Queen Mary College, London, UK
Abstract
The effect of low concentrations of SO. on chlorophyll breakdown was studied. The gas was supplied over a range of humidities. The breakdown of chlorophyll a appeared to depend on the SO. concentration and the humidity at which it was supplied: the higher the latter, the greater the breakdown. This suggests that S02 acted as sulphurous acid.
The effect of 5 p.p.m. S02 at 100% humidity on respiration rate and SO t! ' accumulation was
studied. Dicranoweisia cirrata was shown to be capable of converting SOB2 ' to S04!" with relatively
high efficiency compared with the other bryophytes. This fact, and the markedly higher chlorophyll a content in Dicranoweisia may enable this moss to withstand higher pollution levels, a possibility supported by its distribution pattern.
Introduction
The effect of atmospheric pollution on epiphytic lichens and bryophytes has long been argued. Horwood 0907.) points out that epiphytes are most actively growing in winter, precisely when pollution levels are highest. Jones (1952) holds the view that smoke causes the disappearance of epiphytes. Rydzak (1959) suggests that a lower humidity in towns and the surrounding areas is responsible Gilbert (1968), however, mentions that in towns the humidity may be 2-8% lower, but on average there is a higher number of rainfall days. He also points out that smoke may reduce light intensity by 5-28% but that bryophytes can tolerate lower light intensities and far greater accumulation of particulate matter on the leaf surface than is ever present in towns. Several authors have put forward the view that sulphur dioxide is the major destructive agent. Skye (1958), Fenton (1960, 1964), Gilbert (1965, 1968), Rao and LeBlanc (1966) and Coker (1967) all hold this view. However, to date little quantitative experimental work has been published.
Rao and LeBlanc (1966), working with lichens, show very definitely that chlorophyll is affected by SO2. Coker (1967) comes to the same conclusion with bryophytes. Both authors put forward the view that SO2 is responsible for chlorophyll degradation by removing the magnesium from chlorophyll a to form phaeophytin a, and that the
1- The nomenclature of liverworts follows J. A. Paton, Census Catalogue of British Liverworts U 965), that of mosses E. F. Warburg : Census Catalogue of British Mosses (1963).
79

higher the humidity, the greater the damage. Gilbert (1968) shows in Grimmia pulvi-nata and other moss species growing in the Newcastle area that there is more total sulphur in the mosses the nearer the centre of Newcastle they grow. Both Gilbert and Coker suggest that it is possible to use epiphytes as indicators of the level of atmospheric pollution.
In the present paper the effects of various SO2 concentrations and humidities on chlorophyll degradation, and the effects of different lengths of exposure to 5 p.p.m. SO2 on respiration and sulphate accumulation are investigated to demonstrate that between various epiphytic species such important differences occur that they can be used as indicators of atmospheric SO2 levels.
Epiphytic bryophytes with different sensitivities, judged by their distribution, have been used, and the results show that at least one species, and probably two, have an effective mechanism for the conversion of SO2 into sulphate, and that these species are the two found growing nearest centres of pollution.
Materials and methods
The following points were investigated:
1. The effect of 0, 1, 5 and 10 p.p.m. SOa at 100% relative humidity on chlorophyll breakdown ;
2. The effect of 5 p.p.m. SO2 at 0, 20, 40, 60, 80 and 100% relative humidity on chlorophyll breakdown ;
3. the effect of 5 p.p.m. SO2 at 100% humidity for various exposure times on respiration and sulphate accumulation.
Six plant species were involved: Dicranoweisia cirrata, Metzgeria furcate, Hypmim cupressiforme var. filiforme, Frullania dilatata, Neckera pumila and Ulota crispa. Only the first three species will be dealt with in detail.
Tree bark discs 1 | " in diameter with the required species were obtained by driving a leather punch into the bark. These discs were held upright in a fumigation chamber using small perspex stands.
Low concentrations of SOa were supplied continuously at the rate of one litre per minute, throughout the duration of the experiment, by means of a calibrated capillary flow system in which the required proportions of 1000 p.p.m. SO, from a cylinder were mixed with an air stream of one liter per minute from a pump. Humidity was controlled by splitting the air stream, saturating one part and drying the other and mixing the two in the required proportions, also by means of a calibrated capillary flow svstem Light was supplied in all experiments by a 500 w Mazda MBTF/u Mercury Vapour lamp suspended approximately 2 feet above the fumigation chamber and cooled by a fan. A continuously flowing water bath between the lamp and the chamber acted as a heat filter.
80

Analytical techniques
For the chlorophyll analysis the pigments were extracted with a 80% acetone/water mixture, transferred to 40/60 petroleum spirit and evaporated under reduced pressure. Separation was carried out by thin layer chromatography on plates coated with 1 mm of silica gel G developed in 60 parts 60/80 petroleum spirit, 35 parts acetone and 5 parts methanol. After separation and elution the pigments were measured in an Optica CF4DR spectophotometer at 663 mu for chlorophyll a and 667 mu. forphaeophytin a. Acetone was used as the spectral solvent because of the ease with which it eluted the pigments from the silicagel. But this proved an unfortunate choice as no adsorption coefficients for these pigments in acetone appear to have been published. Consequently, results were expressed in terms of optical density (O.D.) units, corrected to 100 mg dry weight of material.
Respiration was measured in a Warburg respirometer over a period of 6 hours at 25 °C in total darkness. Results were expressed as ,u.l O2 uptake per hour per 100 mg dry material.
Sulphate was extracted by grinding in 80% acetone and washing with petroleum spirit to remove the chlorophylls and carotenoids. The sulphate was measured in an EEL Nephelometer using the photonephelometric technique of Toennies and Bakay (1953). The sulphate standard was modified to give full scale deflection on the nephel-ometer corresponding to 120 ng of sulphate. Results were expressed as \xg sulphate per 100 mg dry material.
Results and discussion
The results as represented in figures 1 and 2 show that the damage to chlorophyll depends both on the concentration of SO2 and the humidity at which it was supplied. As phaeophytin a is the characteristic breakdown product of chlorophyll a under acid conditions it would appear that SO2 is acting as sulphurous acid. Rao and LeBlanc (1966) and Coker (1967) support this with the detection of magnesium in their plant extracts.
Figure 1 shows that at 10 p.p.m. SO2 degradation of the chlorophyll is severe in all three species, but that at 5 p.p.m. this degradation is greater in Hypnum than in either Dicranoweisia or Metzgeria. Figure 2 shows that at 5 p.p.m. SO2 Dicranoweisia has less chlorophyll degradation than Hypnum, especially at lower humidities; Metzgeria shows an intermediate reaction.
If SO2 is acting as the acid, it is reasonable to assume that reducing the humidity solely means an effective reduction of the concentration of the acid, so that Dicranoweisia shows less damage at the lower concentrations.
Figure 3 shows the effect on respiration of exposure time to 5 p.p.m. SO2 at 100% humidity. Obviously in Dicranoweisia, and more still in Metzgeria, the respiration continues to rise, at least during the experiment, whereas in Hypnum it rises to a peak in about 24 hours and then drops. Figure 4 shows the sulphate accumulation under the same conditions as in figure 3 : Metzgeria and Dicranoweisia accumulate 665 and 521 ^g
81

O.D. ratio
i 6 8 i ö p.p.m.SOj for 24 hours
Fig. 1. The effect of S02 concentration at 100% humidity on chlorophyll breakdown. O.D. ratio = chlorophyl a: phaeophytin a.
80 100
humidity %
Fig. 2. The effect of 5 p.p.m. SO. during 24 hours at various humidity percentages on chlorophyll. O.D. ratio = chlorophyll a: phaeophytin a.
sulphate, whereas Hypmtm accumulates only 106 \±g. It appears that Dicranoweisia and Metzgeria are able to convert sulphite into sulphate in relatively large quantities whereas Hypnum (and indeed all other investigated epiphytes) cannot.
If one considers the distribution of these species it appears that Dicranoweisia is often found in areas where the SO2 level may be as high as 0.03-0.04 p.p.m., although in such areas it is more abundant on sloping trunks, presumably because of a more favourable water regime. Metzgeria is often found in similar areas but it is not as frequent and usually occurs only in sheltered positions where humidity is higher and SO2 levels are lower (see also: Gilbert, 1968). If the relative efficiencies of sulphite conversion are studied (see the table) it can be seen, that Dicranoweisia is the most efficient but that Metzgeria, despite accumulating more sulphate, is no more efficient in converting sulphite than other less tolerant epiphytes, and it appears to accomplish sulphate accumulation by a massive increase in its respiration rate.
When looking at the chlorophyll concentration the most striking is that of chlorophyll a i>, Dicranoweisia. It is possible that such a high concentration enables this plant to survive high concentration bursts of SO2 which it cannot convert into sulphate, and which would degrade a proportion, but not all, of the chlorophyll. This may also explain why Metzgeria occurs only in sheltered places in polluted areas : its chlorophyll a content is only about 1 /5th of that in Dicranoweisia. Hypnum and the other epiphytes, none of which convert sulphite into sulphate in any quantity, and none of which have
82

respiration rate
600
«00
300
200
100 s A - A
„ A ' ~ A - - A - - A
10 20 30 40 50
hours of exposure
Fig. 3. The effect of exposure time to 5 p.p.m. SO. at 100% humidity on respiration rate (u.1 oxygen/ hr/100 mg dry matter).
sulphateaccumulation
600
400
300
12 18 24 30 36 «2
hours of exposure
Fig. 4. The effect of exposure time to 5 p.p.m. SO. at 100% humidity on SO,'- accumulation (ng SOr/100 mg dry matter).
Chlorophyll a content, oxygen uptake, sulphate accumulation and relative efficiencies of various epiphytes.
0 2 calculated Chlorophyll a Maximum O. Sulphate content uptake accumulation O. observed (O.D. units 100 mg) (ngOs/100 mg) (u.g SOs,/100mg)
l>i\ ranoweisia cirrata Metzgeria furcata Hypnum cupressiforme var. filiforme Frullania dilatata Neckera pumila y lota crispa
2.897 0.600
0.761 0.923 1.563 0.485
203.1 618.2
93.0 93.4
103.5 43.9
521.3 664.9
106.5 102.6 109.4 72.4
0.42 0.18
0.19 0.18 0.17 0.18
a chlorophyll a content approaching that of Dicranoweisia, are rarely found in areas where the peak winter SO2 level reaches 0.01 p.p.m.
83
Résumé . Les effets de l'anhydride sulfureux sur les bryophytes epiphyt.ques
Des études de l'effet de faibles concentrations de SOa sur la dégradation chlorophyllienne en fonction du degré d'humidité ont été réalisées sur plusieurs espèces de bryophytes épiphytiques. Les faibles concentrations de S0 2 (0, 1, 5 et 10 p.p.m.) ont été obtenues par la dilution de 1000 p.p.m. de S0 2 , à partir d'un cylindre, avec l'air lavé et passage continu de la solution par l'installation de fumigation, avec un débit d'1 litre par minute. Le contrôle de l'humidité s'effectuait par le réglage de différents volumes d'air humide et sec, le processus de dilution étant utilisé comme point de contrôle de l'humidité.
La séparation et la mesure spectrophotométrique des pigments chlorophylliens de la matière traitée ont permis d'établir un lien quantitatif entre la concentration de l'anhydride sulfureux et le rapport de la chlorophylle « à la phaeophytine a : Chlorophylle a ^ Phaeophytine a + Mg. Ce rapport est d'autant plus bas que les concentrations sont plus élevées.
En outre, les résultats indiquent que l'effet de l'anhydride sulfureux sur la chlorophylle est fonction du degré d'humidité; plus celle-ci est élevée, plus la décomposition de la chlorophylle a est importante.
Les résultats indiquent également l'existence d'une série de tolérances parmi les espèces. L'espèce la plus tolérante, Dicranoweisia cirrata, accuse une décomposition de la chlorophylle à de faibles degrés d'humidité, inférieure à celle que connaissent les espèces qui ne poussent jamais ou qui ne poussent que rarement, à proximité de zones polluées, par exemple l'Ulota crispa, quoique pour une humidité plus forte la décomposition est notable pour l'une et l'autre espèce.
Zusammenfassung Die Wirkung Schwefeldioxids auf epiphytische Bryophyten
Bei verschiedenen Arten epiphytischer Bryophyten wurde bei variierender Luftfeuchtigkeit die Wirkung niedriger Schwefeldioxid-Konzentrationen auf den Chlorophyll-Abbau untersucht. Zur Erzeugung der niedrigen SO-2-Konzentrationen (0, 1,5 und 10 p.p.m.) ging man von einem Luft-SCh-Gemisch mit einer Konzentration von 1000 p.p.m. aus. Die Mischung leitete man mit einem Durchsatz von einem Liter pro Minute durch eine Begasungskammer. Die Luftfeuchtigkeit wurde durch Mischen verschiedener Volumina befeuchteter und trockener Luft eingestellt.
Die Trennung und spektrophometrische Messung der Chlorophyllpigmente des mit Schwefeldioxid begasten Pflanzenmatenals haben gezeigt, daß eine Beziehung zwischen der Schwefeldioxid-Konzentration und dem Verhältnis von Chlorophyll a zu Phäo-phytin a besteht :
Chlorophyll a -> Phäophytin a + Mg Dieses Verhältnis ist am kleinsten bei hohen Konzentrationen.
Ferner zeigen die Ergebnisse, daß die Wirkung von Schwefeldioxid auf Chlorophyll vcn der Luftfeuchtigkeit abhängig ist: je höher die Luftfeuchtigkeit war, desto
84

stärker war auch der Chlorophyll a-Abbau. Die Ergebnisse zeigen weiterhin, dass große Empfindlichkeitsunterschied inner
halb der Bryophyten-Arten vorhanden sind. Bei den am wenigsten empfindlichen Arten, Dicranoweisia cirrata, ist der Chlorophyll-Abbau bei niedriger Luftfeuchtigkeit schwächer als bei denjenigen Arten, die sich selten, wenn überhaupt, in Gebieten mit Luftverunreinigungen vorfinden, wie z.B. Ulota crispa. Bei hohen Feuchtigkeiten wird allerdings bei beiden Arten ein starker Chlorophyll-Abbau beobachtet.
References
Coker, P. D. 1967. Trans. Br. bryol. Soc. 5: 341-7. Fenton. A. F. 1960. Ir. Nat. J. 13: 153-9. Fenton, A. F. 1964. Ir. Nat. J. 14: 237-45. Gilbert, O. L. 1965. In: Ecology and the industrial society. Oxford, p. 35-47. Gilbert, O. L. 1968. New Phytol. 67: 15-30. Horwood, A. R. 1907. J. Bot., Lond. 45: 334-9. Jones, E. W. 1952. Revue bryol. liehen. 21: 96-115. Rao, D. N. and F. LeBlanc. 1966. Bryologist 69: 69-75. Rydzak, J. 1959. Annls Univ. Mariae Curie-Sklodowska, Sect. C, 13: 275-323. Skye, E. 1958. Svensk bot. Tidskr. 20: 352-65. Toennies, G. and B. Bakay. 1953. Analyt. Chem. 25: 160-5.
85

A special type of leaf injury caused by hydrogen fluoride fumigation of narcissus and nerine
F. H. F. G. Spierings1
Department of Air Pollution, Institute of Phytopathological Research, Wageningen, the Netherlands
Abstract
During the past 15 years many species of monocotyledonous ornamental plants have been tested for their susceptibility to HF by artificial fumigation. Most of them are very sensitive, in particular Crocus, Freesia, Gladiolus, Ixia and Tulipa. Following them in decreasing order of susceptibility are Sparaxis, Fritillaria, Chionodoxa, Scilla, Muscari and Galanthus. The injuries are similar in different genera: an ivory-coloured necrosis of the leaf tip or, in Freesia, a mainly marginal necrosis of the same colour. Exceptions are Narcissus and Nerine bowdenii: after the appearance of the ivory-coloured leaf tip the injured part of the leaf slowly extends and a yellow discoloration starts close to the original necrosis. This area may stretch several times further than the injured tip.
For about 15 years injuries to monocotyledonous ornamental flowers growing near a steel factory west of Amsterdam have been studied.
The cultivars of artificially HF fumigated tulips and gladioli had the same order of sensitivity as in the field. The symptoms (yellowish white leaf tip burn with a sharp border between necrotic and healthy tissue) in the field and after HF fumigation were also the same. But sensitivity to SO2 fumigation did not follow the same pattern, nor did it show the same symptoms as those in the fields near the steel factory. So the latter pollutant could be eliminated as a possible source of the damage.
Measurements of the Research Institute for Public Health Engineering, Organization for Applied Scientific Research (TNO), Delft, indicated that only minute to low HF concentrations occur in air at the bulb fields (average value 0.011 p.p.m.). Nevertheless cultivars of tulips and gladioli most susceptible were already seriously damaged. The injuries were not restricted to these species, but many other monocotylous ornamental plants were more or less damaged.
Tests in a fumigation chamber with different concentrations of H F resulted in the following order of decreasing sensitivity: Ixia, Freesia, Crocus, Sparaxis, Fritillaria, Chionodoxa, Scilla, Muscari and Galanthus. All these species showed symptoms similar to those already mentioned for tulips and gladioli: either an ivory-coloured necrosis of the leaf tips, or (in freesias) a mainly marginal necrosis of the same colour.
More recently it was suspected that narcissus could also have been damaged by the
1. The author is greatly indebted to Mr. H. G. Wolting for fumigating the narcissus plants.
87

industrial gases, but the indications for HF injury were not conclusive. In the field the damage to the tips of the leaves was irregularly distributed and only 10% of the leaves were injured. This low percentage may, however, correspond to more severe injury, up to several centimetres back from the leaf tip. More attention was paid to this species when more leaves were injured in the fields near the factory, reaching or exceeding 80%. But injury did not extend much further along the leaf.
Another valuable bulb plant, Nerine (also in the family Amaryllidaceae), grown under glass, was sometimes injured like narcissus. For both species the field observations were checked by artificial fumigation and for narcissus the cultivar Golden Harvest was selected because it is one of the most cultivated narcissus varieties. Fumigation started at the beginning of the flowering stage of the plants. Unlike in freesia's, the injury is not limited to a necrotic area extending some centimetres from the leaf tip downwards or along the leaf margin because, besides these necrotic areas a second symptom starts to appear after the necrosis: a yellow spot, gradually spreads out from the necrotic part, but without touching it. After some time it turns gradually from yellow to brown and the area wilts, but the final difference between the two areas remains obvious.
The results of fumigation are so like the field injury, that it was concluded they have the same origin. The small proportion of leaves injured (8%) after fumigation with traces of H F (0.008 p.p.m. for 6 hours) and the extensive damage to leaves (62%) after fumigation with 0.043 p.p.m. HF for 6 hours, and 98% after fumigation with 0.060 p.p.m. for the same time, point in the same direction.
Résumé Type particulier de nécrose foliaire chez Narcissus et Nérine après fumigation à l'acide fluorhydrique
De nombreuses espèces de plantes d'ornement monocotylédones ont fait l'objet d'expériences destinées à mettre en lumière, par une fumigation artificielle, leur sensibilité à l'acide fluorhydrique. La plupart d'entre elles se sont révélées très sensibles à cet égard. C'est notamment le cas des crocus, des frésias, des glaïeuls et des tulipes. On peut également mentionner, dans l'oidre plus ou moins décroissant de leur sensibilité à H F, les espèces suivantes: ixias, sparaxis, fritillaires, chionodoxes, seules, muscaris, et galanthus. Toutes ces espèces réagissent à la fumigation à l'acide fluorhydrique par des symptômes analogues consistant en une nécrose couleur ivoire du sommet du limbe ou en une nécrose marginale de la même couleur (frésias).
Le narcisse et la nérine, qui appartiennent tous deux aux amaryllidacées, réagissent toutefois différemment. Après l'apparition d'une coloration ivoire au sommet du limbe, ce qui se produit d'ailleurs chez la plupart des autres espèces étudiées, la partie atteinte de la feuille s'étend lentement sous la forme d'une zone de décoloration jaune qui prend naissance près de l'emplacement de la nécrose initiale. La longueur de cette zone jaune peut atteindre plusieurs fois celle du sommet atteint à l'origine.

Zusammenfassung Eine besondere Art der Blattschädigung bei Narcissus und Nerine nach Begasung mit Fluorwasserstoff
Viele Arten monokotyler Gartenpflanzen wurden durch künstlicher Begasung auf ihre Empfindlichkeit gegen HF untersucht. Die meisten von ihnen, besonders Crocus, Fresia, Gladiolus und Tulipa, erwiesen sich als sehr empfindlich. In der Reihenfolge einer mehr oder weniger abnehmenden HF-Empfindlichkeit seien weiterhin folgende Arten erwähnt : Ixia, Sparaxis, Fritillaria, Chionodoxa, Scilla, Muscari und Galant/ms. Alle diese Arten reagieren mit ähnlichen Schadsymptomen auf HF-Begasung; sie bestehen in elfenbeinfarbigen Nekrosen entweder der Blattspitze oder des Blattrandes (Fresia).
Narcissus und Nerine, die beide zu den Amaryllidaceae gehören, reagieren jedoch anders. Nach dem Auftreten der elfenbeinfarbigen Blattspitze, wie es bei den meisten der anderen untersuchten Arten der Fall ist, vergrößert sich der geschädigte Teil des Blattes und es bildet sich eine sich langsam ausdehnende Zone gelber Verfärbung. Diese Verfärbungszone kann die mehrfache Länge der ursprünglich geschädigten Blattspitze erreichen.
89

Beitrag zur Kenntnis der Wasserhaushalt der Pflanzen bei Anwesenheit des Fluors im Substrat
J. Na vara
Üstav Biologie Krajiny, Slovenskej Akademie Vied, Bratislava, CSSR
Kurzfassung
Mit Hilfe in Nährlösung gezogener Pflanzen wurde der Einfluß von NaF im Substrat auf die Wasserhaushalt von (hauptsächlich) Pisum sativum untersucht.
Transpirationsintensität und Quantität des aufgenommenen Wassers wurden gemessen, woraus die Änderung des Wassergehaltes der Pflanze bestimmt werden konnte. In einer Serie mit NaF-Konzentrationen von 0-0,25 g/1 wurde die Transpirationsgeschwindigkeit studiert. Dabei stieg die Transpiration bei niedrigen Konzentrationen bisweilen über der Kontrolle heraus, bei höheren war sie immer mehr oder wenig gehemmt.
Bei der Wasseraufnahme trat im Anfang bei allen Konzentrationen eine Senkung auf, bei den höheren so stark daß die Pflanzen welkten. In den niedrigen aber fand nach einer anfänglichen Senkung eine Anpassung statt wodurch sich wieder ein Gleichgewicht einstellte.
Einleitung
Der Hydratationsgrad der Assimilationsgewebe ist einer der inneren Faktoren, die die Intensität der Photosynthese und damit die Produktion der Pflanzen beeinflussen. Bei der Wasserversorgung des Blattgewebes spielen die Spaltzellen eine wichtige Rolle, entscheidend für die Diffusionsintensität des CO2 und die Permeabilität der Zell-v.ände und des Cytoplasmas für dieses Gas und also direkt oder indirekt auch entscheidend für die Geschwindigkeit der enzymatischen Prozesse in der Photosynthese.
Die Änderungen im Hydratationsgrad der Assimilationsgewebe werden bestimmt durch die Wasserbilanz weil diese die Differenz zwischen Wassereinnahme und Wasserabgabe vertritt. Bei einer aktiven Wasserbilanz kommt es schließlich zu einer Wassersättigung, bei einer passiven Wasserbilanz entsteht ein Wasserdefizit, ein Wassermangel, in den Organen und Zellen der Pflanze.
Ob Wasser aufgenommen oder abgegeben wird hängt sowohl von äußeren als von inneren Faktoren ab. In der letzten Zeit wird es immer deutlicher, daß Bedingungen die mit der Anwesenheit fremder Stoffe in der Atmosphäre zusammenhangen, den Wasserhaushalt der Pflanzen direkt oder indirekt nachteilig beeinflussen können. Es handelt sich dabei vor allem um Verunreinigungen verschiedener chemischen Characters im festen oder gasförmigen Zustand die hauptsächlich von Industrien abgegeben werden.
Dieser Bericht handelt über die Wirkung des im Wasser (im Substrat) gelösten Fluors auf die Wasserbilanz der Pflanzen. Weiteren Daten findet man bei J. Navara und Z. Holub in den 'Biologischen Arbeiten', Bratislava 1967.
91

Versuchsmaterial und Methoden
Die Wasserbilanz der Pflanzen in Anwesenheit des Fluors im Substrat wurde an Pisum sativum var. Senator studiert. Damit des Ausgangsmaterial möglichst homogen sei, wurden die Samen nach Größe und Verfärbung selektiert. Die selektierten Samen wurden in destilliertem Wasser gequollen und später in Jacobson's Keimer bei 25 °C vorgekeimt. Die gekeimten Samen wurden nach der Länge der primären Wurzel visuell ausgelesen und in die Expositionskammern übertragen, wo sie in einer 50 %-igen Nährlösung nach Knopp unter konstanten Bedingungen (Beleuchtung 9000 Lux, Temperatur 26 ± 0,8 C, relative Luftfeuchtigkeit 65 ± 12%) gezüchtet wurden. Die Zufuhr der frischen Luft war konstant (Luftinhaltwechsel in der Kammer zweimal pro Minute). Fluor wurde als NaF angewendet.
Die Methode zur Bestimmung der Transpirationsintensität, der Wasseraufnahme in die Wurzeln, des Wasser- und Fluorgehaltes in den einzelnen Teilen der Versuchspflanzen ist in der oben schon genannten Publikation von Navara und Holub erwähnt
Ergebnisse
Die Beobachtungen über die Wirkung des Fluors im Substrat auf die Pflanzen zeigten, daß dieser Prozeß durch das Welken der oberirdischen Teile der Versuchspflanzen begleitet wird.
Die Senkung des Wassergehaltes in den oberirdischen Pflanzenteilen wurde nachträglich verfolgt durch eine einmalige Hinzufügung von Fluor am Anfang der Kultur. Mehere Arten wurden untersucht; die Resultate sind in Tabelle 1 aufgeführt Sie bezeugen, daß der ungünstige Hydratationszustand der betroffenen Pflanzen ein Ergebnis ist der Veränderung, die sich in der Einnahme- und Abgabekomponente der Wasserbilanz abspielen.
Bei den Versuchen mit Pisum sativum hatte sich nach 20 Stunden Wirkung des Fluors die Wasserabgabe durch Transpiration mit der Konzentration erhöht (Figur 1A), aber bei der höchsten Konzentration (0,25 g/1) w a r der Wassergehalt wieder heruntergegangen und nahezu gleich denen der Kontrolle. Bei den Konzentrationen
Tabelle 1. Abhängigkeit des Wassergehaltes (in %) einiger Kulturpflanzen vom F-Gehalt des Substrats (in %).
F-Konzentration des Substrats in g 1
Ö Öfil oTÎÔ 0.15
89,21'
0,20 0.25
Peluschke 91.03 90,95 90,49
Gerste 90,64 91,37 90,61 «,0.37 89,68' 86^2' Roggen 90,69 90,91 89,88 89,75 89 32' m w . Zuckerhirse 90,86 90,86 90.81 90.41 8660' 8658' Besenhirse 91.55 91.22 91.36 9,.,2 ££>, ^
1. Vertrocknungssymptome (marginale oder apicale Nekrosen). 2. Die Pflanzen lebten sofort nach der Auspflanzung der gekeimten Samen ab.
92

Transpiration ( ) und Wasseraufnahme ( ] m % der Kontrollpflanzen
A=nach 20 Stunden F ,(5
100
90
80
70
60
50
40
30
20
10
1
B=nach UU Stunden F
--o
0.01 0.10 0,20 0.25 _ÖJ
Wassergehalt der Pf lanzen ( in%)
C = nach 68 Stunden F
0,01 0,10 Q20 0,25 0,10 0,20 0,25
83
0 0,01 F-Konzentrat ion in g pro l i t e r
Fig. 1. Wassergehalt (rechts; Stäbchen). Transpiration ( ) und Wasseraufnahme ( ) in Bezug auf Fluorgehalt des Substrates bei Pismn sativum. A : nacht 20 Stunden Einwirkung des Fluors, B : nach 44 Stunden Einwirkung des Fluors, C: nach 68 Stunden Einwirkung des Fluors. x = schwache Symptome, x x —- starke Beschädigung.
0,01, 0,10 und 0,20 übte das Fluor anscheinend eine stimulierende Wirkung aus auf den Wassergehalt der Pflanze (bei 0,01 sogar eine Steigerung von 19%). Die Beobachtungen nach 44 und 68 Stunden zeigten eine sehr deutliche Abnahme der Transpiration mit der F-Konzentration, obwohl sie für die Konzentrationen 0,01 und 0,001 nach nach 44 Stunden noch gering war und vorher in einigen Fällen nochmals eine Steigerung der Transpiration beobachtet wurde wie in Figur IA.
Diese Analyse zeigt, daß die Änderung der Wajserabgabe in drei Phasen verläuft: in der ersten Phase eine Steigerung, in der zweiten eine Abnahme bis auf das Niveau der Kontrollpfianzen, in der dritten Phase eine weitere Senkung. Diese Veränderungen verlaufen schneller bei höheren Konzentrationen.
Daß auch bei sehr niedrigen Konzentrationen der Verlauf ähnlich ist ergab sich aus einen Versuch mit vorgekeimten Bohnen auf einer Nährlösung mit einer F-Konzentration von 3 mg/1. Nach 12 Tagen trat eine Stimulation der Transpirationsintensität zu Tage (Figur 2A); in allen anderen Fällen (auch nach 16 Tagen: Figur 2B) zeigte sich eine Abnahme der Transpiration.
Die Veränderungen in der Wasseraufnahme stimmen nicht überein mit den Ergebnissen die bei der Abgabe beschrieben sind. Der Verlauf der Wasserabgabe wurde
93

Transpiration in % der KontroUpflanzen
100
80
60
(0
3x10⁻⁵ 3x10-' 3x10⁻³
Wassergehalt der Plonzen in %
B 16 Tage
0 3x10⁻⁵ 3x10"' 3x10"3
F-Konzentration in g pro Liter
89
88
Fig. 2. Transpiration (obere Linie) und Wassergehalt (Stäbchen) nach 12 und 16 Tagen bei verschiedenen F-Konzentrationen bei Phaseolus vulgaris. Vertikale Linienstücke: Variation.
Tabelle 2. Akkumulation des Fluors in oberirdischen Teilen und Wurzeln nach 28 Stunden bei Pisum sativum.
Oberirdischer Teil Wurzel
F-Konzentration der Zugabe in g/1 F-Gehalt der Trockensubstanz in mg/g
0 0.002
0.20 0.015
0 0.012
0.20 0.430
Tabelle 3. Abhängigkeit des F-Gehaltes in Wurzeln und oberirdischen Pflanzenteilen (im m/g Trockensubstanz) vom F-Gehalt des Substrats bei Pisum sativum.
F-Konzentration im Substrat in g/1
F-Konzentration in den Wurzeln F-Gehalt in den oberirdischen Pflanzenteilen
0
0.012 0.002
0.01
0.036 0.005
0.10
0.554 0,039
0.2
0.681 0,070
94

Transpiration ( ) und Wasseroufnohme ( ) in % der Kontrollpflanzen
Wassergehalt der Pflanze in %
100
90
70
60
50
40
W \ / \ /
-Kontrollpflanzen
\/
T 1 1 r—-i 1 1 1 1 r 1 2 3 4 5
92
91
- 89
27 28 Zeit in Stunden
Fig: 3. nähme
Wirkung von 0,2 g pro Liter Fluor im Substrat auf Transpiration ( ) und Wasserauf-( ) bei Pisum sativum. Die Stäbchen deuten den Wassergehalt der Pflanzen an.
durch eine Stimulation und darauffolgende Senkung charakterisiert, aber hier ist (wie Figur 1 andeutet) von einer Stimulation keine Rede, und im großen und ganzen gesehen nimmt die Wasseraufnahme ab mit der F-Konzentration und ist immer niedriger als in den Vergleichsversuchen. Zwei Besonderheiten sollen aber erwähnt werden.
Erstens zeigt Figur lc daß bei längerer Einwirkung (68 Stunden) des Fluors in hohen Konzentrationen (0,20 und 0,25 g/1) die Wasseraufnahme auf Null herunter geht, wobei die Pflanzen welken.
Zweitens zeigen die Kurven in den drei Figuren bei den Konzentrationen 0,01 und 0,1 nur einen relativ geringen Abstieg (in zwei Fällen sogar eine Zunahme) was darauf deutet, daß die Pflanzen sich nach ziemlich kurzer Zeit den niedrigen F-Konzentra-tionen anpassen. Es traten aber bei der Konzentration 0,01 leichte, und bei 0,1 starke Beschädigungen der Blattrand auf.
Ein ausführlicher Versuch mit gleichzeitig gemessener Wasseraufnahme und
95

Wasserabgabe bei einer F-Konzentration von 0,20 g/1 im Substrat ist in Figur 3 dar
gestellt. Der Unterschied zwischen Aufnahme und Abgabe war am Anfang deutlich ersicht
lich. Ein Gleichgewicht stellte sich erst ein nach ungefähr 27 Stunden auf einem Niveau von ungefähr 40% der ursprünglichen Transpiration und ungefähr 90% des ursprünglichen Wassergehaltes der Pflanze.
Die Tabellen 2 und 3 zeigen die Akkumulation des Fluors in den oberirdischen Pflanzenteilen und in den Wurzeln. Es zeigt sich wieder, daß eine markante Erhöhung des Gehaltes in den Wurzeln eintritt, während in den oberirdischen Teilen die Akkumulation des Fluors auffallend niedriger ist.
Summary Some data on the water balance in plants in the presence of fluor in the substrate
Young plants of Pisum sativum were cultivated on substrates containing, next to Knopp's solution, various quantities of NaF to study their influence on the water balance. Poisoning always found expression in withering caused by changes both in taking up and giving off water.
At low F-concentrations the transpiration at first rose, than went down reaching the same level as the controls, and ultimately decreased further. At higher concentrations (especially at 0.20-0.25 g/1 such an initial increase did not occur and it was also absent when the plants are exposed to the action of NaF for a longer period (44 or more hours).
The uptake of water did not show such an initial rise, but for low NaF-concentra-tions a new equilibrium was reached (at a lower level). For higher concentrations (0.20 and up) the uptake was soon reduced to zero, causing wilting of the plants. A more extensive experiment with an F-concentration of 0.20 g/1 showed, after an initial difference between uptake and loss of water, and equilibrium after 27 hours at about 40% of the original transpiration and 90% of the original water content of the plants. In the latter case the leaves were distinctly damaged.
The increase in F-cortent was much higher in the roots than in the other parts of
the plants.
Sommaire Quelques informations sur la balance d'eau de végétaux en présence de fluor dans le
substrat
Un nombre de jeunes plantes de Pisum sativum étaient cultivées sur des substrats contenant, à côté de la solution de Knopp, des quantités différentes de NaF afin d'étudier leur influence sur la balance d'eau. L'empoisonnement se manifestait toujours par la flétrissure due aux changements aussi bien dans l'absorption que dans le dégagement de l'eau.
Aux basses concentrations de F, la transpiration augmentait d'abord, puis diminuait jusqu'au niveau des témoins; enfin, elle continuait à décroître. Aux concentra-
96

tions plus élevées (notamment à 0,20-0,25 g/litre), l'augmentation initiale n'avait pas lieu et ne se produisait pas non plus quand les plantes étaient exposées à l'action de NaF pour une période plus longue (44 heures et plus).
L'absorption de l'eau n'accusait pas d'augmentation initiale, mais pour les basses concentrations de NaF un nouvel équilibre était atteint (à un niveau plus bas). Pour les concentrations plus élevées (0,20 et plus), l'absorption ne tardait pas à être réduite à zéro, causant la flétrissure des plantes. Une expérience plus vaste, à une concentration-fluor de 0,20 g/I, a démontré une différence initiale entre l'absorption et la perte de l'eau, puis, après une période de 27 heures, un équilibre à environ 40% de la transpiration originale et à 90% du contenu d'eau original des plantes. Dans le dernier cas, les feuilles étaient nettement endommagées.
L'augmentation de la teneur en F était beaucoup plus forte dans les racines que dans les autres parties des plantes.
97

The effects of air-borne sodium chloride and other salts of marine origin on plants in Wales
R. S. Edwards
University College of Wales, Institute of Rural Science, Penglais, Aberystwyth, Great Britain
Abstract
Wales, situated close to the Atlantic Ocean, is strongly exposed to wind-borne salt. The extent of this pollution, and its effect on plants and animals, have as yet not been extensively studied. Cheap, home-made instruments, protected against rain, have been devised to sample the airstream. They enable a survey of salt contamination over large areas. In Pinus nigra highly significant correlations between the instrument readings and samples from naturally contaminated tree branches and degree of damage have been noted. The Na content of grasses growing in contaminated and relatively uncontaminated environments has been examined. Experiments are in progress with various strains of Lolium perenne showing by nature widely different Na contents. They are treated with salt, applied as a spray on leaves or to the soil.
In coastal areas marine salt is borne by the wind in particles or droplets. This is shown by : a. increased corrosion of metals, e.g. motorcars and galvanized iron roofs (Woodcock, 1950; Ambler and Bain, 1955); b. the effects on sensitive vegetation : blackening of leaves and distortion of growth (Edlin, 1957; Moss, 1940); c. hidden effects such as unidentified reduction in crop yield or minor distortions, especially in trees of which Picea sitchensis and Pinus nigra var. calabrica were studied ; d. advantages, especially in nutrition through Na supply to grasses (Griffith et al., 1965), and the absence of hypomagnesia and of goitre in animals and human beings; nitrogenous scum may accumulate on the sea surface and spray formed from this material may significantly increase the nitrogen supply to plants, as observed in New Zealand (Wilson, 1959). Little is known about the importance of such effects, though Cauer (1938) noted that changes in the method and extent of kelp burning in Brittany affected the iodine contents of the air in central Europe many hundreds of miles away. e. Finally salt particles act as nuclei in the upper atmosphere, inducing rainfall (Woodcock, 1952).
Two aspects of salt drift may be considered. 1. Salt particles in the air result mainly from the bursting of bubbles on the surface of the sea, especially in the surf. Knelman et al. (1954) have shown that the droplets form in two ways: the minute ones by shattering of the bubble's film and the larger drops from the cavity left by bursting bubbles.
99

• • l ' . "4 * » » • 4 J * ' • _ ' - o . • . > • ' • ' .
PSà^^^^fc^^^^i'«;?^8
• ^ [ K n
Fig. 1. Normal growth of pine trees in the shelter of a rock ridge.
Fig. 2. Pine trees damaged by airborne salt.
100

2. The transport of the salt nuclei is influenced by wind force, by the weight of the particles and by the aerodynamic properties of the surface over which such material is being transported. Transport is also influenced by humidity since the nuclei rapidly lose or gain water from the atmosphere to reach a state of equilibrium. This may explain the severity of damage done by spring or summer gales: at low humidity salt concentration in the nuclei increases considerably and their weight per unit of salt is consequently greatly reduced. They can, therefore, be carried further by a wind of given strength. At such times, especially in May, bursting buds and young leaves present a susceptible target. I have seen the windward side of an ash tree completely blackened 7 miles inland near Aberystwyth after a May gale.
The following procedure has been used in the study. To trap the salt nuclei and protect the accumulated salt from rain, targets of filter
paper and lately of nylon mesh have been exposed in a metal tube mounted on a pivot with a vane which causes the tube to face the wind. Accumulated salt is leached by shaking in water and the leachate analysed for sodium with a flame photomater. Herbage or vegetation may be collected after exposure to a gale, provided no rain has fallen. The salt deposited upon it can be assessed in the same way. It is possible to collect the drip-off water from contaminated vegetation and use its salt content as an indication.
In the Aberystwyth area, contamination has been shown to be very high close to the sea, declining rapidly within the first mile. Beyond this distance, contamination may be heavy during gales but the rate of decrease with distance is very small. Nevertheless it is easy to relate the strength of the wind with the quantity of salt deposited 10 miles inland or more.
Contamination can be very much affected by small shelter such as uneven ground or bushes.
To Newborough forest salt level was clearly related to distance from the sea and to height above groundlevel. The quantities of salt measured at various ;ites was also related to height of trees growing there (see also Edlin, 1957).
Recent results at Aberystwyth have shown that losses of collected salt increase with high winds, rain and sea fog (Ekern, 1964). The effects of artificial saliferous contamination by spray droplets on leaves as distinct from absorption from salted soil has been studied in rye-grasses by Na analyses of the plant material.
Gorse (Ulex eitropaeus) and other obstructions to the airflow can intercept large quantities of salt which are subsequently washed off by rain and drip into the soil immediately beneath the bush. This may be an important ecological factor. The expected effects of wind and shelter have substantiated. Obstructions to the airflow increase the quantity of salt in the ground beneath them by adding to the pollution of the runoff. The effect of salt drift may extend many miles inland, though only in exposed areas.
The fact that this kind of pollution of the atmosphere is largely unavoidable and not man-made seems no reason to ignore it completely.
101

Résumé Les effets du chlorure de soude et d'autres sels d'origine marine dans l'air sur les plantes en Pays de Galles
Le Pays de Galles, en bordure de l'Atlantique, se trouve fortement exposé aux vents et au sel déplacé par le vent. L'étendue de la pollution n'a fait l'objet d'aucune étude approfondie et ses effets sur la végétation et les animaux ne sont encore mal connus. Des instruments peu coûteux, protégés contre la pluie, ont été conçus pour installer une cible dans le flux d'air. Le coût réduit a rendu possible une étude de la contamination portant sur de vastes étendues de pays.
La contamination des conifères a été étudiée particulièrement chez Picea sitchensis et Pinus nigra var. calabrica, et des cas de dommages graves ont fait l'objet d'investigations. La lecture des instruments a indiqué un rapport positif avec des échantillons de branches d'arbres naturellement contaminées et du degré de dommage aux arbres.
On a examiné la teneur en Na des graminées poussant en milieu contaminé et en milieu relativement peu contaminé. Des expériences en cours, dans lesquelles différentes variétés deLoliumperenne, dont la teneur en Na diffère sensiblement lorsqu'elles sont cultivées dans un même milieu, sont contaminée artificiellement, le sel étant appliqué aussi bien par pulvérisation qu'au titre de contaminant du sol. La teneur en Na de la matière sèche des plantes est régulièrement vérifiée.
On espère que les résultats aideront à comprendre comment la végétation réagit à la contamination naturelle par le sel, et que les travaux seront étendus, par example à l'étude des effets de la contamination par le Mg des herbages sur la santé des animaux qui y paissent.
Zusammenfassung Untersuchungen über Ausbreitung und Wirkung von Salz-Immissionen maritimen Ursprungs in Mittel-Wales
Wegen ihrer Lage am Atlantischen Ozean sind die Küsten und das Hinterland von Mittel-Wales dem Wind und den in der Luft enthaltenen Salzen stark ausgesetzt. Über das Ausmaß dieser Luftverunreinigung und ihre Wirkung auf Pflanzen und Tiere ist aber noch wenig bekannt.
Für die Untersuchungen auf diesem Gebiet wurden einfache Meßgeräte entwickelt mit einer vor Regen geschütztem Auffangfläche für die anströmende Luft. Damit war es möglich, für große Teile des Landes einen Überblick über die Salzkontimination zu erhalten.
Es wurden Koniferen untersucht (speziell Picea sitchensis und Pinus nigra var. calabrica) bei denen schwere Schäden aufgetreten waren, und deutliche Korrelationen konnten festgestellt werden zwischen den Meßwerten, den Slazablagerungen auf Baumzweigen und dem Schädigungsgrad der Bäume.
Der Na-Gehalt von Gras aus verunreinigten und relativ wenig verunreinigten Gebieten wurde untersucht. Weiterhin sind Experimente mit verschiedenen Rassen von Lolium perenne im Gange. Diese Rassen weisen, auch wenn sie unter übrigens densel-
102
ben ökologischen Verhältnissen angebaut werden, große Unterschiede in Na-Gehalt auf. Die Grasstreifen wurden künstlich mit Salz verunreinigt, entweder mittels eines Sprays oder dem Boden zugesetzt. Der Na-Gehalt der Versuchspflanzen wurde regelmäßig bestimmt.
Die Ergebnisse sollen dazu beitragen um festzustellen, wie die Vegetation auf natürliche Verunreinigung der Luft durch Salz reagiert. Hoffentlich können die Arbeiten ausgedehnt werden mit Untersuchungen über die Beeinträchtigung von Weidevieh durch Gras daß durch Magnesium-Verbindungen verunreinigt ist.
References
Ambler, H. R. and A. A. J. Bain. 1955. J. appl. Chem. 5: 437-67. Cauer, H. 1938. Biochem. Z. 299: 69. Edlin, H. L. 1957. Q. J. For. 51:46-50. Ekern, P. C. 1964. Proc. Soil Sei. Soc. Am. 28:419-21. Griffith, G. ap, D. I. H. Jones and R. J. K. Walters. 1965. J. Sei. Fd. Agric. 16: 94-8. Knelman, F., N. Dombrowski and D. M. Hewitt. 1954. Nature, Lond. 173:261. Moss, A. E. 1940. J. For. 38: 421-5. Wilson, A. T. 1959. Nature, Lond. 184:99-101. Woodcock, A. H. 1950. Proc. Am. Soc. Test. Mater. 30: 1151-60. Woodcock, A. H. 1952. J. Met. 9: 200-12.
103

Discussion in Section 2 : Experimental research
Reporters: J. G. ten Houten and F. H. F. G. Spierings
Participants : Hettche (Chairman), Bohne, Buck, de Cormis, Darley, Edwards, Garber, Guderian, Kloke, Lebbe, Miss Ruzicka, Stratmann, Zahn.
The first question asked was whether the symptoms in Narcissus mentioned by Mr Spierings were specific for F or if they could have been caused by drought ?
In the answer it was brought out that artificial fumigations were considered as a good beginning of the investigations. Symptoms in the field were the same as those caused by artificial fumigation. Leaves of fumigated plants and of those in the field were analysed for F and an elevated level was always present. It was also noted in the field that at low concentrations only a small percentage of the leaves was injured.
Mr Buck was asked if it was possible to produce a humidity of 100%, because Mr Syratt had said that he worked with this humidity?
The answer was that it is relatively easy to operate exposure chambers at 50 to 80 % humidity but it is very difficult to design chambers that give nearly 100%, especially with high light intensities (around 25,000 Lux) resulting in high temperatures. Moreover, at 100% humidity, condensation occurs and the gases dissolve in the condensate.
It was remarked that there is a quantitative relation between F-concentration and injury symptoms. Bulb plants in glasshouses are already damaged by artificial fumigation for several days with 1-1.5 w?/m3. In agricultural crops, the concentrations which cause injury are higher (3 -4 y.g). On the other hand, Loliumperenne, Festuca and clovers are damaged at 0.9 jig during a period of 15 days, some forest trees with 1 [xg.
On the question whether already some experiments on the relationship between yield and grain quality of oats as influenced by HF had been made, the answer was in the negative. But in trials with SO2 on wheat it was found that the grain yield was higher in areas with lower SO2 concentrations, though the baking quality had improved in areas with more SO2.
It is indeed possible to apply results of fumigation experiments in the analysis of injury in the field. The best way is to use good chambers in which the natural environmental variations can be approximated. Statistical evaluation adjusted to polyfactorial analysis such as regression analysis, factorial analysis or the Path coefficient method should be applied. In addition one must distinguish between investigations that aim at obtaining information on air quality and investigations that study plant reactions and symptoms with which it is possible to reconstruct the conditions at the time of injury.
105

Not always specific symptoms or reactions to HF in plants are found so that additional information is needed, e.g. analyses of the air and of leaf tissues. If all information points in the same direction, it can be concluded with reasonable certainty that HF has been the cause of the symptoms. But if the harm is done in the past, all we can do is to make a more or less problematic reconstruction.
For translations, it is necessary to clarify the German words, Schädigung and Schaden. Schädigung is equivalent to injury and refers to all physiological and pathological plant responses. Schaden is equivalent to damage and refers to the economic or aesthetic value of the plant.
Mr de Cormis found no difference in SO2 absorption between day and night. But other work has shown that SO2 absorption is correlated with photosynthesis. The rate is highest in the morning, becomes a little less in the afternoon and at night it is about 1/3 of the morning rate.
The question was asked, if any substances such as amino acids, were found in the plants, which were active and could be demonstrated by paper chromatography or radio auto-chromatography? The answer was, that by the usual extraction techniques, methionine was isolated by paper chromatography and found to be radio-active.
One of the participants wondered, how the H2S is formed. By an instant reaction, or through the amino acids?
The reaction is not direct. There is a transformation of SO2 to sulphite and then to sulphate which is deposited in the roots and later transported to the leaves.
In addition comments were made on two points. The first was that De Cormis worked with tomatoes which are solanaceous plants. This family is characterized by stomata which stay open at night, so that it is an exception to the rule that uptake is higher during the day than during the night.
It was also said that SO2 uptake is almost as low shortly after sunrise and shortly before sunset as during the night.
With a severe leaf injury it is difficult to describe accurately the rates of uptake; in such cases sulphur content of leaves is no reliable indication for rate of absorption.
In connection with Mr Edwards' contribution it was remarked that a storm in the north of Germany carried salt spray from the North Sea to Hamburg, a distance of some 100 kilometers. The needles of fir trees became brown and analysis disclosed a very high sodium chloride content.
In reply Mr. Edwards remarked that the mean quantity of salt deposit probably is not very important, but that the frequency of high levels determines the harm, especially to forests. A high level once in twenty years may seriously damage one years' agricultural crop, but may annul decades of forest growth.
Selenium from ocean spray is suspected to cause a serious disease of the coconut palm in Jamaica. Mr. Edwards told that no analysis were made to prove this. But it remains an interesting topic because selenium deficiency in some soils in Ireland is related to the white muscle disease in sheep.
106

The last question was on the determination of the sodium chloride that falls on the ground. But the author was mainly interested in salt deposited by impingement on articles in the air.
107

Section 3 : The effects of air pollution on plants

Effets de l'anhydride sulfureux et des composés fluorés sur la végétation
E. Bovay
Station Fédérale de Recherches de Chimie Agricole, Liebefeld-Bern, Suisse
Sommaire
L'auteur passe en revue les connaissances actuellement acquises sur les problèmes de la pollution de l'air par l'anhydride sulfureux et les gaz fluorés sur les végétaux. Après avoir rappelé les principales sources émettrices de SO. et de Fluor, il analyse le mode d'action de ces polluants sur les végétaux et décrit les principaux symptômes d'intoxication déterminés sur les tissus ligneux, les feuilles, les fleurs et les fruits. Les méthodes utilisées pour déterminer l'existence et la gravité d'une pollution sont également mentionnées. Il est aussi fait état d'expériences personnelles, particulièrement dans la question des effets du fluor sur les arbres fruitiers.
L'anhydride sulfureux
Sources de SO2
L'anhydride sulfureux constitue l'une des émissions typiques de la combustion des huiles et des charbons, lesquels contiennent tous une certaine proportion de soufre.
Les chauffages domestiques comptent parmi les sources les plus importantes d'émission de SO2, source toutefois souvent assez diffuse et assez dispersée pour ne provoquer que des dommages restreints sur les végétaux les plus sensibles. Les raffineries de pétrole, les centrales thermiques, fonderies et usines métallurgiques, les fabriques d'engrais et d'acide sulfurique restent, en revanche, les centres d'émission de plus fortes concentrations, la quantité de SO2 éjectée dans l'atmosphère par une raffinerie de pétrole brut de moyenne importance pouvant se monter, par exemple, à quelques dizaines de tonnes par jour.
Mode d'action du SO2
Tout comme c'est le cas pour l'anhydride carbonique (CO2), c'est par l'intermédiaire des stomates que l'anhydride sulfureux pénètre à l'intérieur des organes d'assimilation. Toutes les conditions favorables à l'ouverture des stomates facilitent donc également la pénétration du SO2 et accroissent en même temps les possibilités de dégâts. Une luminosité élevée, une température favorable, un bon approvisionnement en eau, une humidité élevée de l'air sont autant de facteurs qui déterminent un accroissement de la turgescence des cellules et l'ouverture subséquente des stomates,
111

/ ^ *-• l.iyi * - "*;
Fig. 1. Nécroses sur pois par l'anhydride sulfureux.
Fig. 2. Nécroses sur tabac par l'anhydride sulfu
112

tandis que la sécheresse, l'obscurité, le froid exercent une action contraire. Il s'en suit que les dommages sous l'effet du SO2 sont plus marqués dans le milieu de la journée, entre 9 et 15 heures, que pendant la nuit ou les périodes hivernales. Zahn a en effet observé que la toxicité du SO2 était environ 4 fois plus faible pendant la nuit que pendant le jour. Il convient toutefois de noter que l'absorption de SO2 par les aiguilles d'épicéa peut se produire même à des températures de ~6°C.
Étant donné que c'est au maximum de l'activité assimilatrice des organes ou des plantes que se produisent les plus fortes absorptions de SO2 et, partant, les dégâts les plus accusés, il s'en suit que les feuilles totalement développées et les arbres d'âge moyen sont également plus sensibles au SO2 que les feuilles ou les sujets plusjeunes ou plus âgés. C'est ainsi que, chez l'épicéa, au printemps, les aiguilles de l'année précédente sont plus sensibles que les jeunes aiguilles de l'année en cours, alors qu'en plein été ce sont ces dernières qui, à leur tour, accusent la plus grande sensibilité à l'égard du SO2.
L'état nutritif des plantes joue également un rôle marqué quant à leur résistance à l'action caustique du SO2. Il a été observé que des apports importants d'engrais azotés augmentaient leur faculté d'auto-défense. La potasse exerce semble-t-il aussi, dans une certaine mesure, un effet identique, ce qui pourrait s'expliquer par l'action de gonflement exercé par cet élément sur les colloïdes du plasma.
C'est, en particulier, à ses capacités réductrices que l'on attribue l'action caustique du SO2. Celui-ci détermine la destruction de la chlorophylle ou sa transformation en phéophytine, de même que des précipitations de tannins.
La métabolisme lui-même peut être perturbé: la respiration est généralement accélérée. Sur trèfle rouge, il a été observé une baisse de la teneur en protéine totale et une diminution de la digestibilité de cette dernière. Les teneurs en sucres et en vitamines peuvent être affectées comme c'est le cas pour la teneur en amidon dans les tubercules de pommes de terre. Chez l'épicéa, on a pu constater une diminution de l'activité de la glucosidase, ainsi qu'une modification qualitative et quantitative des terpènes. Il a été reconnu que l'anhydride sulfureux exerçait aussi une action paralysante sur le mécanisme d'ouverture et de fermeture des stomates. Il en résulte pour 1? plante d'une part une plus forte pénétration du SO2 dans les cellules, d'autre part une transpiration accentuée et ininterrompue conduisant à un dessèchement rapide des tissus.
De nombreux essais de gazage ont mis en lumière le rôle important joué par les fluctuations des concentrations des immissions de SO2 et en particulier le rôle des pointes de concentrations et celui des temps de récupération entre deux vagues successives de polluant. Plus ces temps sont élevés, moins la plante souffre des immissions. Il est clair qu'il ne s'agit pas là d'une processus d'immunisation, mais plutôt d'une décontamination par oxydation physiologique du SO2. Des expériences ont prouvé, par exemple, qu'un gazage effectué pendant 10 jours de suite sur de la luzerne, à raison de 9 heures consécutives et à la concentration de 0,4 p.p.m. de SO2, déterminait des dégâts analogues à un gazage effectué pendant 10 jours de suite également, mais à raison de 9 séances journalières de 15 minutes chacune et à la concentration 4 fois plus élevée de 1,6 p.p.m., mais avec 45 minutes de pause entre chaque fumigation. La capacité de résistance d'une plante s'affaiblit toutefois à la longue et la sensibilité s'accroit par l'irritation chronique. Lorsque les pointes de surconcentration se suivent de près et,
113

surtout, si elles se superposent à une concentration de base déjà élevée, les dégâts déterminés par le SO2 sont alors très marqués.
A côté des phénomènes communs à l'ensemble des végétaux, il est à noter que les effets du SO2 se manifestent de façon très diverse selon les essences qui les subissent, certaines d'entre elles se montrant très sensibles à l'action de ce gaz, alors que d'autres, au contraire, y sont particulièrement résistantes.
Le stade de développement auquel se trouvent les plantes soumises aux immissions de SO2 joue en l'occurrence un rôle primordial. Il a déjà été fait mention de la différence de sensibilité entre les jeunes aiguilles d'épicéa et les aiguilles de l'année précédente. Les chercheurs allemands ont, en particulier, mis en lumière l'existence de 'phases critiques' au cours du développement des cultures. Pendant la germination, les plantes sont généralement protégées par le sol et ne subissent donc pas de dommages. Chez les céréales, le stade 'trois feuilles' s'est révélé particulièrement critique. Une seconde phase critique débute peu avant l'épiaison, pour se terminer à la maturité jaune des grains. Une intoxication des cultures par le SO2 à ce stade de développement provoque un retard d'épiaison. L'influence dépressive du SO2 atteint son maximum quand elle s'exerce en cours de floraison. Par exemple, de l'avoine gazée à ce stade de développement voit son poids de 1000 grains et, par conséquent, son rendement diminuer de 35 % à la récolte, alors que l'effet dépressif n'atteint que 15 % lorsque le gazage s'effectue au stade antérieur de 6 feuilles ou au stade postérieur 'maturité laiteuse'.
L'accroissement de la sensibilité au stade de la floraison s'observe également chez de nombreuses plantes annuelles comme le colza, le pavot, le haricot nain, etc. En général, les organes floraux, pétales, étamines et pistil, ne présentent de symptômes de nécroses que pour des concentrations relativement élevées en SO2. Le plus souvent, on observe un dessèchement du stigmate. Le moment le plus critique en cours de floraison se situe au stade de la germination du pollen sur le stigmate, l'accumulation de SO2 dans le stigmate empêchant une germination normale et déterminant, par conséquent, une diminution de la fécondation, d'où il résulte des diminutions de récoltes tant en qualité qu'en quantité. Chez l'orge et le seigle, il a été observé qu'une destruction totale ou partielle des barbes provoquait une diminution sensible du poids de 1000 grains.
D'une manière générale, on a observé que, chez les monocotylédones, ce sont les feuilles les plus jeunes qui sont d'abord atteintes, tandis que chez les dicotylédones ce sont les feuilles les plus développées qui sont les plus sensibles.
Parmi les plantes forestières, ce sont les conifères qui constituent sans nul doute les associations végétales naturelles les plus sensibles au SO2. Le dommage réside principalement dans le fait que les arbres dépérissent prématurément, c'est à dire avant d'avoir atteint leur développement maximum. Alors que les feuillus sont souvent capables do survivre aux effets d'une immission aiguë, détruisant la totalité de leur feuillage, en formant une nouvelle frondaison, les conifères, dont les aiguilles pérennes sont atteintes, dépérissent dans un cas analogue.
L'action nocive répétée ou chronique du SO2 sur des populations pérennes se traduit également par un vieillissement plus rapide des aiguilles, qui tombent prématurément de l'arbre. Il en résulte une diminution de la capacité d'assimilation et, par voie de
114

conséquence, du développement des arbres. Des différences génétiques individuelles peuvent aussi se manifester au sein d'une
même population, ce qui peut expliquer la survie de certains sujets au milieu de zones soumises à l'influence permanente de concentrations élevées en SO2.
Parmi les plantes les plus sensibles au gaz sulfureux, il convient de citer la luzerne, le haricot nain, l'orge, l'avoine, l'épinard, le radis, le mouron rouge, l'oseille, l'oxalis, la moutarde, le mouron des oiseaux, tandis que la vigne, le fraisier, le groseillier paraissent, en revanche, supporter sans dommages apparents des concentrations importantes en SO2.
Expression des concentrations d'immissions
On a signalé que la quantité de SO2 éjectée par unité de temps par une source d'émission, soit la concentration du polluant dans l'atmosphère, ne constitue pas le seul facteur pouvant conduire à l'apparition de dégâts sur les végétaux. Le durée pendant laquelle s'exerce cette influence caustique, ainsi que la nature propre du végétal et sa résistance spécifique au polluant considéré, jouent également un rôle prépondérant dans ce phénomène. Il convient de rappeler que la plante n'absorbe qu'une fraction du polluant dans l'atmosphère et que toutes les plantes sont capables de neutraliser une certaine proportion de gaz sulfureux par métabolisation au cours des processus d'oxydo-réduction. Le SO2 est lentement oxydé en sulfate, d'où l'augmentation, souvent décelable à l'analyse chimique, de la teneur en soufre total des organes végétaux exposés aux immissions d'anhydride sulfureux. Seules donc, les quantités de polluants dépassant un certain niveau de tolérance exercent une action préjudiciable sur la plante. On peut ainsi déterminer un 'seuil d'irritation', défini comme étant la concentration du polluant sans effet sensible sur les plantes, sous des conditions d'exposition permanente à l'action de concentrations faibles, mais constantes, de gaz caustique. Au cours de recherches expérimentales, O'Gara d'une part et Thomas d'autre part ont établi une relation entre les concentrations de gaz qui déterminent des dégâts sur les cultures et le temps d'exposition, relation qu'ils exprimèrent par la formule: (C- CR) . t = K, dans laquelle CR est égal à la concentration du seuil d'irritation et K une constante. Toutefois, d'autres expériences prouvèrent que le produit de la concentration du polluant (C) par le temps d'exposition (t) ne constitue en fait pas une constante. Van Haut et Stratmann ont, en effet, démontré que le produit (C. t) diminue avec l'augmentation de la concentration, c'est à dire que l'action de fortes concentrations de SO2 agissant dans des temps très courts est plus nocive que celle de faibles concentrations s'exerçant pendant une longue période. Pour tenir compte du plus grand nombre possible de facteurs entrant en ligne pour la détermination d'un dégât sur un végétal, Stratmann propose de calculer le 'seuil critique' (Gefährdungsgrad) en tenant compte de 5 facteurs, soit le rapport entre la concentration du gaz et le temps d'exposition, la valeur arithmétique moyenne des concentrations en SO2, la fréquence des périodes de récupération entre les immissions successives, les variations de concentrations en SO2 et la fréquence des maxima de concentrations (pointes) de SO2.
115

On sait, d'autre part, que l'Association des Ingénieurs allemands (VDI) a proposé en 1961 des normes conventionnelles, qui tiennent compte également de certaines contingences économiques, les 'Concentrations maximales d'immissions' (MIK-Werte). Rappelons que les valeurs semi-horaires moyennes recommandées sont :
pour une exposition permanente: 0,50 mg SCb/m3 d'air (env. 0,2 p.p.m.), pour une exposition de courte durée: 0,75 mg SCh/m3 d'air (env. 0,3 p.p.m.), cette
dernière valeur n'étant toutefois tolérée qu'une seule fois au cours de 2 heures consécutives. En Suisse, la Commission fédérale de l'hygiène de l'air a proposé en 1964 les valeurs maximales admissibles suivantes:
0,2 cm3 S02 /m3 , du 1er mars au 31 octobre, en moyenne journalière 0,3 cm3 SOa/m3, du 1er novembre au 28 février en moyenne journalière les valeurs semi-horaires ne devant pas dépasser: 0,3 cm3/m3 en été et 0,5 cm3/m3 en hiver, ces valeurs-limites ne pouvant, au surplus, être atteintes qu'une seule fois en l'espace
de 2 heures. On doit être conscient que toutes ces valeurs conventionnelles sont trop élevées si
l'on veut assurer une protection totale des végétaux, surtout des espèces les plus sensibles et dans les conditions les plus défavorables. Si elles étaient respectées dans la totalité des cas, elles conduiraient toutefois à une sensible amélioration de la pollution de l'atmosphère dans de nombreuses régions.
Détection et appréciation des dégâts
La reconnaissance et l'évaluation des dommages à la végétation présupposent une définition précise des concepts 'dommages' et 'dégâts'. Il y a 'dégât' lorsque le polluant détermine une réaction quelconque de la plante, que ce soit une nécrose du feuillage, une chute des feuilles, une chlorose, une diminution d'accroissement du tronc ou une réduction passagère de l'activité des fonctions d'assimilation. Il y a 'dommage', au sens juridique du terme, uniquement dans les cas où la perturbation déterminée par le polluant interfère avec l'usage économique prévu pour cette plante. Cette 'valeur d'utilisation' peut être d'ordre idéal, ce qui est le cas pour les plantes d'ornement par exemple, ou d'ordre économique, pour des cultures céréalières ou légumières dont le rendement est diminué par suite des effets du polluant. Elle peut être aussi d'ordre bio-cénotique, lorsque le dommage se produit sur des populations couvrant de larges surfaces, telles les forêts.
Il est certain qu'un dégât de même nature n'a pas la même importance en ce qui concerne le dommage subi. C'est ainsi que des nécroses sur feuilles n'ont pratiquement pas d'importance économique pour des betteraves prêtes à la récolte, pour autant, évidemment, que l'on ne veuille pas utiliser les feuilles pour l'ensilage, par exemple. Pour des plantes d'ornement, en revanche, le dégât constitue pratiquement toujours un dommage (chloroses ou nécroses des fleurs, par exemple).
116

Les méthodes qu'il convient d'utiliser pour administrer la preuve du dommage doivent tenir compte de la multiplicité des formes de dégâts. Il n'existe, en effet, pas de critère unique et il est nécessaire de considérer un faisceau complet de caractéristiques individuelles, aucune de celles-ci ne pouvant constituer, à elle seule, une preuve formelle de dommage.
L'une des méthodes les plus utilisées pour la détermination des dégâts est l'observation des symptômes provoqués par les immissions d'anhydride sulfureux, que ce soit sur des plantes croissant aux environs des sources de polluants ou sur des sujets soumis à une pollution artificielle en enceinte fermée, dans des conditions bien déterminées. Les effets du SO2 se traduisent très souvent par l'apparition de plages chlorotiques ou brun-rouge entre les nervures du limbe, plages qui présentent généralement une aire bien délimitée et ayant tendance à se nécroser. Chez les jeunes feuilles, on observe fréquemment des nécroses marginales avec enroulement du limbe. Chez les graminées, des bandes parallèles transversales peuvent apparaître, par exemple chez Poa annua. Chez les conifères, on observe une décoloration à partir de la pointe, la zone des tissus atteints se séparant nettement de celle des tissus sains. Chez les plantes pérennes se produisent fréquemment des dessèchements des pointes des branches et une chute prématurée des aiguilles, tandis que la restriction du développement détermine une nanisation des sujets. La localisation des nécroses dans les parties apicales et marginales des feuilles peut s'expliquer par l'existence d'un gradient de succion, croissant du centre vers les bords des feuilles, zone où se produit une transpiration d'eau importante.
Tous ces symptômes ne sont toutefois pas spécifiques de l'action du SO2 et peuvent être déterminés également par d'autres causes, telles la sécheresse, le gel et l'excès de chaleur. Toutefois, s'ils n'apparaissent que dans une zone restreinte, aux environs immédiats d'une source d'émission de SO2, ils constituent alors un indice présomptif important.
Les analyses d'air mettent en oeuvre des méthodes chimiques ou des méthodes basées sur les variations de conductibilité résultant de l'effet acidifiant du SO3 obtenu par oxydation du SO2. Les diverses façons de calculer les seuils critiques de SO2 pour la végétation ont été exposées précédemment.
Mentionnons ici les diverses tentatives de surveillance et de contrôle de la pollution atmosphérique de contrées soumises à l'influence d'immissions de SO2. L'utilisation de procédés statiques, tels les postes d'absorption système Leclerc ou Liesegang, permet de multiplier les observations sans grands frais. Toutefois, s'ils peuvent indiquer le sens de modifications lentes et générales de la concentration en SO2 de l'atmosphère d'une région déterminée, en revanche, ils restent absolument insuffisants pour déterminer les variations brusques de concentrations et, particulièrement, les pointes si préjudiciables à la végétation. A titre d'exemple, mentionnons ici les résultats obtenus en Suisse dans la vallée du Rhône, où la pollution de base d'une partie de la vallée a été surveillée au moyen de cloches Leclerc par le Laboratoire cantonal de Lausanne de 1961 à 1967: les quantités de SO2 captées reflètent relativement bien les accroissements de la pollution en SO2 déterminés par l'utilisation des chauffages domestiques en hiver. Ils semblent également indiquer qu'aucune pollution permanente sensible n'est intervenue du fait de la mise en activité dans la région d'une raffinerie en 1964 et d'un premier
117

% ':, : 'Z . '
4
-• Jti
Fig. 3. Appareils d'absorption statique des polluants atmosphériques. À gauche: appareil Leclerc pour l'anhydride sulfureux ; à droite : appareil Harding-Desbaumes pour les composés fluorés.
groupe d'une centrale thermique à fin 1965. Les résultats obtenus par des appareils à enregistrement direct et continu reflètent
évidemment avec beaucoup plus de précision et la pollution de base régnant dans une contrée et les variations de cette pollution. II convient de signaler ici les mensurations systématiques effectuées depuis 1964 en Allemagne, dans le Land de Nordrhein-West-phalen, par la Station de recherches sur les immissions d'Essen, mensurations qui portent sur quelque 5000 km2, à raison d'une mesure par km2. L'analyse statistique des centaines de milliers de résultats ainsi obtenus permet de dresser une carte synoptique de la variation annuelle de la pollution atmosphérique.
L'analyse foliaire a été fréquemment utilisée pour déceler un accroissement éventuel de la 'teneur en soufre des organes d'assimilation sous l'effet des immissions de SO2. Cette méthode peut donner des résultats intéressants dans les zones soumises à une pollution chronique, mais elle reste inefficace dans le cas d'immissions aiguës de courtes durées, car les feuilles sont alors si rapidement anéanties qu'il n'en résulte aucun accroissement notable de leur teneur en soufre. Notons aussi l'observation, faite assez fréquemment, de l'accioissement des teneurs en fer soluble et en silice des organes endommagés par le SO2. Il convient aussi de rappeler la méthode du 'test turbidi-métrique' de Härtel pour les aiguilles d'épicéa. Ce test repose sur le fait que l'extraction de composés lipoïdiques et terpéniques par décoction et le trouble qui en résulte sont plus importants chez les aiguilles nécrosées que chez les aiguilles saines.
118

Tableau 1. Moyennes mensuelles de 23 postes d'observation de la pollution de l'air par SOs (en mg dans 100 ml de solution absorbante) dans la Plaine du Rhône (1961-1967).
Jan. Févr. Mars Avril Mai Juin Juillet Août Sept. Oct. Nov. Dec.
9,39 7.32 5,40 2,47 1.28 0,78 0.61 0,60 0,70 1,32 3,43 6,08
Relevés effectués par le Laboratoire Cantonal de Lausanne.
Tableau 2. Moyennes annuelles de 23 postes d'observation de la pollution de l'air par SO. (en mg dans 100 ml de solution absorbante) dans la Plaine du Rhône (1962-1966).
1962 1963 1964 1965 1966 1962 66
2,69 3,51 3,16 3,95 3,80 3,41
Relevés effectués par le Laboratoire Cantonal de Lausanne.
Les méthodes microscopiques, c'est à dire la recherche dans les tissus palissadiques de modifications anatomiques pathologiques, par exemple des chloroplastes endommagés, présentent également un intérêt certain. Dans le même ordre d'idées, on peut mentionner l'examen des carottes de sonde prélevées sur les plantes pérennes, les forêts et les arbres des forêts, par exemple, et sur lesquelles il est possible de mesurer avec exactitude les variations d'épaisseur des cernes annuels de croissance pour des périodes prolongées.
Citons enfin l'utilisation, simultanément dans des zones polluées et dans des zones non polluées, de plantes-tests sensibles aux effets du SO2 et sur lesquelles il est loisible d'effectuer de manière comparative les observations et mesures mentionnées précédemment. L'établissement de listes de plantes selon leur sensibilité plus ou moins marguée à Faction du SO2 a été entrepris par divers auteurs.
Les composés fluorés Sources de fluor
Les combinaisons fluorées, qui comptent au nombie des polluants les plus toxiques pour les végétaux, ne sont pas des composants ordinaires de l'atmosphère, bien que le fluor soit relativement très répandu dans la croûte terrestre, dont il représente environ le 0,77M en poids. Elles ne s'y trouvent, en effet, qu'en tant que produits d'émissions de certaines activités industrielles, chimiques ou métallurgiques, telles que l'électrolyse de l'aluminium, qui s'effectue en présence de fondants à base de fluor, ou la dissolution des phosphates bruts par des acides forts, lors de la préparation des engrais superphosphatés; ou encore au cours des divers processus de fabrication de l'industrie de la verrerie, de la céramique et des tuileries. Il convient aussi de signaler que les diverses qualités de charbons utilisées pour les besoins des chauffages industriels ou domestiques contiennent de 80 à 300 p.p.m. de fluor.
119

Les combinaisons fluorées se rencontrent dans l'atmosphère soit sous forme gazeuse (HF, SiF4, HaSiFg), soit sous forme d'aérosols ou de poussières (NaF, Na3AlF6 + AIF3). On a également signalé certaines formes organiques du fluor, en particulier le tétrafluorure de carbone (CF4), qui se dégage, pour une très courte durée de temps il est vrai, lorsque se produit 'l'effet anodique' dans les fours de fusion de l'aluminium.
Certains auteurs fixent aux environs de 0,01 p.p.m. la valeur-limite de concentration de fluor dans l'atmosphère pour laquelle apparaissent des symptômes de nécroses sur les végétaux, mais la littérature américaine rapporte aussi que des plantes très sensibles peuvent présenter des symptômes d'intoxication pour des concentrations 100 fois plus faibles, de l'ordre du l/10e de mm3 d'acide fluorhydrique par m3 d'air (-= 0,0001 p.p.m. = 0,1 p.p.b. aux USA). Des fumigations sur glaïeuls, effectuées pendant 5 semaines à cette très faible concentration en HF, ont, en effet, déterminé des nécroses sur les pointes des feuilles et un accroissement des teneurs en fluor de la matière sèche allant jusqu'à 148 p.p.m.
Des mesures de concentrations en acide fluorhydrique dans l'atmosphère de certaines grandes villes américaines ont révélé des valeurs allant de 0,001 à 0,08 p.p.m., alors que l'on signale des valeurs de 0,3 p.p.m. de fluor en Californie. Dans les alentours d'une usine d'aluminium, à Spokane, (Waschington-USA), Adams décèle des concentrations en fluor variant de 0,005 à 0,018 p.p.m., avec des concentrations maximums de 0,147 p.p.m. Les mesures auxquelles nous avons procédé en Suisse, dans la Vallée du Rhône (Valais), ont révélé des concentrations de l'ordre de 0,005 à 0,025 mg F/m3
d'air, la concentration maximum trouvée se situant à 0,190 mg F/m3 pour une durée d'absorption de 75 minutes. Les mesures étaient effectuées dans les environs immédiats d'une usine d'aluminium et incluaient également le fluor provenant des aérosols éventuellement présents dans l'atmosphère.
Des appareils d'absorption, type Harding (papier-filtre imbibé de silice et traité au bicarbonate de soude) donnent également une image assez nette de la pollution de base résultant des immissions fluorées. La concordance des indications de ces appareils avec les teneurs des plantes en fluor est relativement bonne, bien qu'évidemment assez lâche, ainsi qu'en témoignent les mesures du tableau 3 effectuées par Desbaumes en Valais. Selon leur importance, les usines d'aluminium peuvent évacuer dans l'atmosphère entre 10 et 1000 kg de fluor par jour, soit sous forme gazeuse, soit sous forme
Tableau 3. Pollution de l'air par le fluor dans le Valais Central, 1966 (d'après Desbaumes).
Distances du point d'émission Teneurs en fluor des appareils Teneurs en fluor des feuilles km Harding d'abricotiers p.p.m. F dans
mg F.dmVmois matière sèche
0,5 0,416 147.2 1,0 0,217 104.2 1,5 0.109 53.4 5,0 0,050 36,5 7.5 0,036 21.5
23,0 0,021 18,4
120

d'aérosols ou de poussières. A titre comparatif, signalons que les quantités de SOs éliminées par les raffineries de pétrole, par exemple, sont de 100 à 1000 fois plus élevées, de l'ordre de 10 à 1000 tonnes par jour.
Il convient de remarquer que les usines d'aluminium s'efforcent en général de réduire au minimum leurs émissions caustiques, d'une part en supprimant les exutoires superflus et non contrôlés, d'autre part en installant des systèmes d'aspiration et de lavage qui permettent de retenir les gaz et les poussières dans de fortes proportions, pouvant dépasser 95 %. Wöhlbier signale que la teneur en fluor de l'herbe d'une prairie, située à 0,8 km d'une usine d'aluminium, a passé de 123 p.p.m. à 36 p.p.m. après construction d'une installation d'absorption. Cette constatation peut être mise en relation avec les observations que nous avons faites en Valais après la fermeture d'une usine d'aluminium où les teneurs en fluor de feuilles d'abricotiers, de vigne et de pommiers ont passé de 203 p.p.m. en moyenne pour la dernière année d'exploitation à seulement 15 p.p.m. en moyenne l'année qui suivit la fermeture de l'usine.
Les possibilités d'une accumulation de fluor dans les parties aériennes de plantes croissant dans des sols naturellement riches en cet élément ou enrichis en composés fluorés par l'apport d'engrais, par exemple par le fait d'une absorption intensive par les racines, ont été étudiées par divers auteurs, comme Mac Intire, Nömmik, von Fellenberg, Gericke et Kurmies.
Les teneurs des sols en fluor sont extrêmement variables, oscillant entre 10 et 7000 p.p.m., selon la nature de leurs constituants. Les chiffres les plus fréquemment rencontrés se situent entre 50 et 800 p.p.m. Les sols les moins riches en fluor s'avèrent être en général les sols sableux, tandis que, dans les sols argileux, les teneurs en fluor sont sensiblement proportionnelles à la quantité d'argile en présence. Le mode d'extraction utilisé pour la mise en solution du fluor du sol (eau, acide citrique, acides forts) détermine également des différences considérables dans les résultats analytiques, l'extraction par les acides forts dissolvant jusqu'à 20 fois plus de fluor que l'extraction aqueuse. Le tableau 4, emprunté à Nömmik, rend compte des constatations rapportées ci-dessus:
Les teneurs en fluor s'accroissent pour les couches inférieures d'un profil, d'une part du fait de la présence dans ces horizons de formes minérales plus riches en fluor, d'autre part du fait qu'un certain lessivage par les eaux de pluie se produit dans les couches superficielles.
Il convient d'apporter au sol des doses relativement importantes de fluorures
Tableau 4. Solubilité du fluor dans divers milieux d'extraction en rapport avec la teneur en argile (d'après Nömmik).
Teneur du en argile ' O
0- 5 5-15 >15
sol Fluor soluble à l'eau p.p.m.
5,3 9.5
20,3
Fluor soluble à l'acii p.p.m.
26.4 29,2 53,8
de citrique Fluor soluble à HClOi concentré p.p.m.
76,0 189,0 346,0
121

solubles pour déterminer un accroissement sensible de la teneur en fluor des parties aériennes des plantes. De façon générale, les sols argileux exercent à l'égard des fluorures solubles un pouvoir de rétention nettement plus élevé que ce n'est le cas pour les sols sableux ou tourbeux. Il en résulte que la teneur des plantes en fluor n'a généralement que peu de relations avec la teneur du sol en cet élément, d'autant plus que les capacités d'absorption des végétaux pour le fluor sont extrêmement variables ; poussant sur un même sol et dans les mêmes conditions, le trèfle rouge par exemple, est capable d'assimiler 2 fois plus de fluor que le ray-grass d'Italie. Gericke et Kurmies calculent que les apports habituels de superphosphates (lesquels contiennent plus de 1 % de F) sont insuffisants pour déterminer un accroissement de la teneur des plantes en fluor.
Les teneurs habituelles des plantes en cet élément ne dépassent guère 10 à 20 p.p.m. Certaines espèces, en revanche, sont capables d'absorber sans dommages des quantités considérables du fluor du sol. Il en est ainsi pour le thé, par exemple et, dans une mesure moindre, pour les racines de céréales, notamment l'orge.
Si le fluor est présent dans ces espèces sous une forme non toxique, en revanche, certaines espèces d'Afrique du Sud, comme la Dichapetalum cymosum, peuvent contenir jusqu'à 150 p.p.m. de fluor (m.s.) sous forme d'acide monofluoracétique (FCH2. COOH), composé extrêmement toxique, dont le sel de sodium est d'ailleurs utilisé comme rodenticide (en Suisse, Néo-Surux Siegfried).
Citons aussi, comme source externe possible de fluor, l'utilisation, en qualité de fongicide, d'un dérivé fluoré de l'acide phénoxypropionique, le dichlofluanid, vendu sous le nom d'Euparène (Bayer). Ce produit s'élimine, il est vrai, assez rapidement sous l'influence des précipitations. Des dosages de fluor effectués en 1967 sur des feuilles de vigne et de pommier traitées à l'Euparène au Domaine de Changins sur Nyon de la Station fédérale d'essais agricoles de Lausanne ont donné les résultats cités dans le tableau 5, la vigne ayant été traitée 5 fois à l'Euparène 0,2% ( = 0 , 1 % de matière active) et les pommiers 10 fois à la même concentration et à raison d'environ 1000 à 2000 litres/ha. Ces résultats prouvent que les résidus d'Euparène sont éliminés presque totalement quelque 4 semaines après le dernier traitement.
Un certain nombre d'insecticides, d'acaricides, de rodenticides et d'herbicides à base de fluor sont également utilisés dans différents pays d'Europe, mais ne sont pas autorisés en Suisse, exception faite de l'Euparène et du Néo-Surux déjà cités.
Tableau 5. Influence des traitements à l'Euparène sur la teneur en fluor des végétaux (1967).
Traitements
Feuilles de vigne prélevées 6 jours après le 4e traitement Feuilles-témoins non-traitées Feuilles de vigne prélevées 29 jours après le 5e traitement Feuilles-témoins non-traitées Feuilles de pommiers prélevées 22 jours après le 10e traitement Feuilles-témoins non-traitées
Fluor
sans 1;
141,0 18.0 10,0 8,4
35,2 6,8
en p.p.
ivage
m. dans m.s.
après lavage
23,0 19,0 — — — —
Le lavage a été effectué a l'eau déminéralisée, sans adjonction de mouillant.
122
Garber cite enfin le cas d'intoxications par des émanations fluorées provenant de produits à base de fluor (Wolmanites, Fluralsil) utilisés pour la protection des bois (échalas, tuteurs, haras, etc.). Dans le même ordre d'idées, on peut mentionner les dégâts observés parfois dans les serres après emploi d'un produit de nettoyage pour les vitres à base d'acide fluorhydrique.
Dommages visibles déterminés par les combinaisons fluorées
Les lésions aiguës dues à l'action des composés fluorés se présentent souvent sous des formes trèscaractéristiques,mais variables d'uneespèceà l'autre. L'action du fluorprésen-te un caractère cumulatif, c'est-à-dire que les tissus s'enrichissent en fluor avec l'avancement de la saison, sous l'influence de concentrations constantes de l'atmosphère en cet élément. Les stomates constituent l'une des portes d'entrée des composés fluorés gazeux. Un transport semble se produire ensuite à l'intérieur du limbe des feuilles vers les parties marginales et apicales où l'accumulation du fluor conduit alors à des intoxications rapides.
Si des chloroses peuvent apparaître dans certains cas, comme chez le maïs, l'intoxication par le fluor détermine généralement des nécroses marginales et apicales, de teintes variables, allant du brun-clair au brun-rouge, avec une séparation extrêmement bien marquée entre la zone des tissus nécrosés et celle des tissus restés verts. Sur feuilles d'abricotiers, lorsque la brûlure est très récente, on observe une teinte gris-verdâtre des parties atteintes, teinte qui passe au brun-rougeâtre quelques heures plus tard. Il nous a été fréquemment donné d'observer l'apparition de cette zone gris-verdâtre, virant rapidement au brun, sur déjeunes feuilles d'abricotiers qui ne présentaient aucun symptôme quelconque de chlorose ou de nécrose à la récolte, mais qui avaient été transportées au laboratoire dans des sachets en matière plastique. Les nécroses formées pendant le transport pourraient s'expliquer par la concentration du toxique consécutive à la transpiration intensive des feuilles. Il est également possible que les nécroses observées, tout à fait analogues par ailleurs à celles qui ss produisent sur les arbres en plein air, aient été déterminées par la dissolution, dans l'eau provenant de la transpiration de la feuille, du fluor adsorbé à la surface de celle-ci.
Autre constation très fréquente: celle de la formation de bandes de tissus de couleur brun-noirâtre entre les parties vertes et les parties nécrosées. C'est particulièrement le cas chez les prunoïdées, par exemple l'abricotier, le pêcher, le prunier. Au surplus, chez ces espèces, les parties nécrosées se détachent très facilement du reste du limbe, laissant subsister une feuille apparemment saine, mais aux bords tourmentés et cerclés d'une mince bande brun-clair. Chez l'abricotier (figure 4), lorsque les nécroses sont importantes et affectent plus de la moitié de la surface du limbe, la feuille tombe. Il en est de même chez le pêcher, dès que les nécroses atteignent 1/4 du limbe. Sur abricotier, il n'est pas rare d'observer une défoliation des rameaux de l'année portant sur une vingtaine de feuilles, dans le tiers supérieur de la branche, le bouquet terminal pouvant rester indemne si aucune immission à forte concentration ne se produit par la suite.
Sur de très jeunes feuilles, encore au stade de l'enroulement, la nécrose ne se produit généralement qu'à l'extrémité du limbe; en se déroulant par la suite, la feuille prend
123

-V
Fig. 4. Dommages sur abricotier par les gaz fluorés: nécroses sur feuilles, abscission des plages nécrosées et défoliation des rameaux.
alors l'aspect d'une cuillère chez l'abricotier, d'un double rein, chez le poirier. Chez la vigne, la nécrose est marginale et de teinte brun-rouge. Les étapes succes
sives de l'action des composés fluorés se décèlent par l'apparition de plages concentriques centripètes. Les parties nécrosées ne tombent que rarement, mais s'enroulent facilement. La nécrose peut s'étendre à la quasi totalité du limbe, ne laissant qu'une mince zone verte le long des nervures principales.
Chez les plantes à feuilles allongées, les herbages, les résineux, les nécroses sont également situées à la partie apicale de la feuille ou de l'aiguille, avec une ligne de démarcation plus foncée entre les zones vertes et les zones endommagées. L'examen microscopique des tissus nécrosés décèle un collapsus marqué des cellules palissadiques et parenchymateuses, ayant pour conséquence un ratatinement des tissus.
En ce qui concerne les tissus ligneux, il a été observé des nécroses des parties api-cales des jeunes branches chez l'abricotier, le phénomène ne se produisant toutefois que sur des tissus non-encore aoûtés et à la suite d'immissions de fortes concentrations.
Les tissus floraux ne présentent généralement pas de sensibilité particulière. Sur les glaïeuls, dont les feuilles sont en général très sensibles à l'action des combinaisons fluorées, les fleurs restent en principe indemnes. Sur abricotiers, des émissions intempestives provenant d'une fabrique de céramique ont conduit à la destruction totale des fleurs dans un rayon restreint autour de la source.
Pour ce qui est des dommages sur les fruits, les observations faites par de nombreux
124

* • « « • - « - . »
*; » •» ». te
• « • . « * *
Fig. 5. Nécroses superficielles sur abricots en zones fluorées (peut-être en relation avec la distribution de certaines fumures).
*.~*
Wïr-f * 5«.-= *~*
Mm -T-'-y: :llflf!- •. ' , • . , -
Fig. 6. Nécroses de la mouche de la poire en zones fluorées (Valais et Maurienne).
125
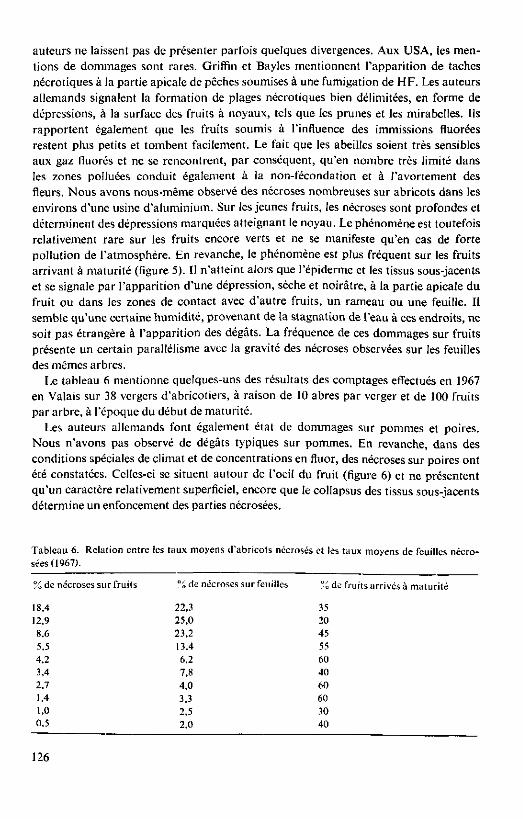
auteurs ne laissent pas de présenter parfois quelques divergences. Aux USA, les mentions de dommages sont rares. Griffin et Bayles mentionnent l'apparition de taches nécrotiques à la partie apicale de pêches soumises à une fumigation de HF. Les auteurs allemands signalent la formation de plages nécrotiques bien délimitées, en forme de dépressions, à la surface des fruits à noyaux, tels que les prunes et les mirabelles. Ils rapportent également que les fruits soumis à l'influence des immissions fluorées restent plus petits et tombent facilement. Le fait que les abeilles soient très sensibles aux gaz fluorés et ne se rencontrent, par conséquent, qu'en nombre très limité dans les zones polluées conduit également à la non-fécondation et à l'avortement des fleurs. Nous avons nous-même observé des nécroses nombreuses sur abricots dans les environs d'une usine d'aluminium. Sur les jeunes fruits, les nécroses sont profondes et déterminent des dépressions marquées atteignant le noyau. Le phénomène est toutefois relativement rare sur les fruits encore verts et ne se manifeste qu'en cas de forte pollution de l'atmosphère. En revanche, le phénomène est plus fréquent sur les fruits arrivant à maturité (figure 5). Il n'atteint alors que l'épiderme et les tissus sous-jacents et se signale par l'apparition d'une dépression, sèche et noirâtre, à la partie apicale du fruit ou dans les zones de contact avec d'autre fruits, un rameau ou une feuille. Il semble qu'une certaine humidité, provenant de la stagnation de l'eau à ces endroits, ne soit pas étrangère à l'apparition des dégâts. La fréquence de ces dommages sur fruits présente un certain parallélisme avec la gravité des nécroses observées sur les feuilles des mêmes arbres.
Le tableau 6 mentionne quelques-uns des résultats des comptages effectués en 1967 en Valais sur 38 vergers d'abricotiers, à raison de 10 abres par verger et de 100 fruits par arbre, à l'époque du début de maturité.
Les auteurs allemands font également état de dommages sur pommes et poires. Nous n'avons pas observé de dégâts typiques sur pommes. En revanche, dans des conditions spéciales de climat et de concentrations en fluor, des nécroses sur poires ont été constatées. Celles-ci se situent autour de l'oeil du fruit (figure 6) et ne présentent qu'un caractère relativement superficiel, encore que le collapsus des tissus sous-jacents détermine un enfoncement des parties nécrosées.
Tableau 6. Relation entre les taux moyens d'abricots nécrosés et les taux moyens de feuilles nécrosées (1967).
% de nécroses sur fruits % de nécroses sur feuilles % de fruits arrivés à maturité
18,4 22,3 35 12,9 25,0 20 8.6 23,2 45 5,5 13,4 55 4,2 6,2 60 3,4 7,8 40 2.7 4,0 60 1,4 3,3 60 1.0 2,5 30 0,5 2,0 40
126

Les écorces des arbres sont capables de fixer des quantités importantes de fluor, la pénétration de cet élément semblant s'effectuer tout au cours de l'année. Garber signale des teneurs en fluor de 1000 p.p.m. pour des écorces de peupliers et de saules, lorsque le prélèvement d'échantillon est pratiqué sur la face du tronc faisant front à la source, et de 550 à 700 p.p.m. pour l'autre face. Sur des peupliers croissant à 50 mètres d'une fabrique de céramiques, nous avons également observé des teneurs en fluor de 2940 p.p.m. pour la face côté usine et de 2350 p.p.m. pour l'autre face. Des observations analogues ont été faites sur des écorces d'abricotiers, lesquelles contenaient 339 p.p.m. de fluor du côte de l'usine et 271 p,pm. sur l'autre face.
Ces teneurs élevées n'ont qu'une influence très limitée sur le taux de fluor du bois sous-jacent. C'est ainsi que le bois de branches de peupliers, dont l'écorce accusait 1008 p.p.m. de fluor, n'en contenait lui-même que 69 p.p.m., la possibilité d'une pollution par contact n'étant, au surplus, pas exclue, étant donné qu'il s'aggissait de matériel desséché, donc difficule à écorcer. Les essais de Garber prouvent toutefois qu'une fraction du fluor de l'écorce peut passer dans le bois sous-jacent, mais en très faible quantité.
De même, des jeunes feuilles repoussant sur des troncs de peupliers, dont le feuillage avait été partiellement détruit au premier printemps par une forte émission de fluor et dont l'écorce accusait des teneurs en fluor supérieures à 2000 p.p.m., ne présentaient aucune nécrose et leur teneur en fluor ne dépassait pas 3 p.p.m., l'usine ayant été arrêtée entre temps.
Il est clair que certaines poussières, contenant des composés fluorés sous une forme peu soluble à l'eau, peuvent s'accumuler sur les parties aériennes des plantes. Les dosages de fluor effectués sur ce matériel, sans qu'il soit procédé à un traitement spécial, indiquent alors la totalité du fluor présent, soit sous forme soluble, soit sous forme plus ou moins insoluble à l'eau. Divers auteurs ont étudié cette question et proposé de soumettre le matériel végétal à un lavage à l'eau distillée, voire à un frottage des feuilles avec de la mousseline trempée dans une solution de mouillant. Pour des plantes croissant aux alentours d'une cimenterie, Garber démontre que les taux de fluor sur les feuilles de diverses essences passent, par lavage, de quelque 130 à 140 p.p.m. à environ 16 à 19 p.p.m. dans la matière sèche, semblant prouver ainsi que la majeure partie du fluor total décelé à l'analyse provenait en fait des cendres volatiles déposées sur les feuilles. Selon d'autres expériences de Garber, portant sur 12 échantillons forestiers, les quantités de fluor provenant de poussières déposées à la surface des feuilles peut ainsi osciller entre 4 et 80% de la quantité totale de fluor décelée dans la feuille. Nos propres essais, portant sur 15 échantillons de feuilles d'arbres fruitiers lavées à l'eau déminéralisée (tableau 7), confirment ces résultats, la quantité moyenne de fluor enlevée par lavage se situant à quelque 20% des teneurs globales.
Toutefois, d'autres auteurs considèrent que le fluor des poussières constitue un toxique 'potentiel', ces poussières pouvant céder peu à peu du fluor, qui passerait ainsi à l'intérieur des tissus et s'y accumulerait, contribuant ainsi à l'accroissement de la teneur en fluor interne jusqu'à un seuil caustique déterminant les brûlures chez la plante en question.
Par ailleurs, ainsi que le relève en particulier Bredemann, le fluor se rencontre dans
127

Tableau 7. Effet du lavage à l'eau déminéralisée sur la teneur en fluor (en p.p.m. dans la matière sèche) des feuilles d'arbres frutiers (s. = sans lavage, a. = avec lavage); 1967.
s./a. s./a. s./a. s./a. s./a. s./a. s./a. s./a. s./a. s./a. s./a.
Abricotier 195/172 176/142 96/89 90/54 88/49 68/46 59/55 55/16 50/42 48/34 31/29 Pommier 576/500 152/144 Cerisier 133/137 Poirier 302/234
Échantillons de feuilles non-nécrosées séparés en deux lots.
les tissus sous des formes plus ou moins solubles à l'eau. On peut en inférer que le lavage des feuilles avec une solution de mouillant (s'il enlève certes la plus grande partie des poussières dans lesquelles le fluor se trouve sous une forme relativement peu soluble) contribue aussi à la diminution de la teneur en fluor interne par solubilisation et lessivage partiel de cet élément. Aux USA, Thomas signale d'ailleurs qu'une partie de l'acide fluorhydrique peut être adsorbée à la surface du limbe et que ce fluor peut être enlevé par lavage, voire par volatilisation. C'est ainsi que 25 à 80% du fluor accumulé dans des feuilles d'abricotiers après une fumigation gazeuse (qui excluait donc la présence de poussières) ont pu être enlevés par lavage avec des solutions de mouillants.
On peut rapprocher les observations ci-dessus des observations que nous avons faites en Valais sur abricotiers, à savoir que les teneurs des feuilles en fluor étaient plus basses en années pluvieuses comparativement aux années sèches, chaudes et ensoleillées, du fait, d'une part de l'entraînement probable par les eaux de pluie des gaz et poussières se trouvant dans l'atmosphère, ce qui contribue à abaisser fortement la concentration de l'air en produits caustiques, d'autre part du lessivage répété des feuilles. Alors qu'en règle générale les parties marginales des feuilles, particulièrement les parties nécrosées, présentent des teneurs en fluor plus élevées que le centre du limbe, il est arrivé, précisément dans les années pluvieuses, que le phénomène inverse se produise, les tissus nécrosés cédant probablement assez facilement leur fluor.
Il convient aussi de signaler l'action de synergisme qui peut se produire lorsque certains éléments, apportés par exemple par les engrais, viennent à interférer avec les composés fluorés se trouvant dans l'atmosphère. Nous avons observé en Valais, sur cultures d'abricotiers, que certains engrais combinés boriques peuvent déterminer sur le feuillage l'apparition de nécroses typiques importantes, tandis que la teneur en fluor de ces mêmes feuilles s'auroît simultanément dans une proportion surprenante, atteignant des valeurs de 300 à 500 p.p.m. dans la matière sèche, alors que les vergers voisins, non touchés, n'accusent que des teneurs normales variant entre 10 et 20 p.p.m.
Ce phénomène fera d'ailleurs l'objet d'un rapport au cours de cette même séance1.
1. A. Bolay, E. Bovay. C. Neury et R. Zuber: Interaction entre la fumure et la cousticité des immissions fluorées.
128

Mode d'action du fluor
Le mode d'action du fluor sur les plantes a fait l'objet de nombreuses études, mais reste toutefois encore relativement mal connu.
D'après les recherches de Mac Nulty et Newmann, le fluor exercerait une action dépressive sur la formation des chlorophylles a et b, ainsi que sur celle de la protochlorophylle. Pilet, travaillant sur des disques de feuilles de vigne et d'abricotiers, démontre que des solutions de NaF 1.10-4 et 1.10-3 M déterminent une diminution du taux de chlorophylle a d'autant plus marquée que la concentration en NaF est plus élevée. Simultanément à l'augmentation de la concentration en NaF, cet auteur observe également un accroissement du coefficient de transparence, donc l'apparition latente d'une chlorose.
Les recherches de Pilet mettent aussi en lumière l'interférence du fluor avec l'acide ß-indolyl-acetique (ABIA). Cette auxine favorise l'entrée du fluor dans la plante d'autant plus fortement que la concentration d'ABIA est plus élevée. Il semble donc que la pénétration du fluor dans les tissus foliaires soit régie par les hormones de croissance. Or, l'état auxinique des feuilles varie considérablement selon l'état physiologique des tissus, et plus particulièrement selon leur âge. Cela explique les différences de concentrations parfois considérables en fluor décelées dans des feuilles semblables placées dans les mêmes conditions extérieures, mais dont l'état auxinique endogène n'est pas identique.
Inversement, le fluor peut exercer une action dépressive sur l'efficacité de l'ABIA, spécialement à fortes doses.
Adams et Emerson signalent que des essais de fumigation au fluor, effectués sur Pinus ponderosa, semblaient provoquer une diminution des teneurs en amidon et en polysaccharides, mais leurs résultats ne sont pas assurés statistiquement.
En ce qui concerne l'influence du fluor sur la respiration, Applegate et Adams démontrent que l'absorption d'oxygène est accélérée par des fumigations au fluor, à condition que les concentrations restent très faibles.
Les travaux de Thomas et Hendrick mettent en évidence le fait qu'il existe pour chaque plante un seuil au-dessous duquel ne se produit aucune interférence avec la photosynthèse, mais au-dessus duquel celle-ci est affectée, même si aucune lésion visible n'apparaît sur les feuilles. Il semble que ce phénomène doive être rangé dans la catégorie des 'dégâts invisibles' dont il a souvent été question dans la littérature à propos des effets toxiques du fluor.
L'état nutritif de la plante constitue un des facteurs qui interfèrent également d'une façon marquée sur l'apparition des nécroses dues au fluor. Adams et Sulzbach ont mis en évidence que la déficience en azote augmentait la susceptibilité des plantules de haricots aux fumigations de fluor. Nous avons maintes fois eu l'occasion de constater que les abricotiers mal alimentés présentaient des nécroses foliaires plus importantes que les arbres en bon état nutritif et que des applications supplémentaires d'engrais azotés permettaient de lutter avec un certain succès contre l'apparition des nécroses.
L'âge des organes joue également un rôle marqué dans la manifestation de nécroses sur les feuilles. Adams et collaborateurs mentionnent que les aiguilles de Pinus ponde-
129

Tableau 8. Teneurs en fluor des feuilles d'abricotiers selon l'avancement de la saison et l'éloignement de la source (1966).
Distance
km
1,0 5,0 8.5
23,0
Teneur en
avril
33,7 21.6 11,3 17,0
fluor (p.p.m.
mai
54,0 23,6 12,2 14,6
dans la
juin
108,6 33,3 18,2 14.5
matière sèche)
juillet
106,2 33,5 11,8 14,7
août
130,3 34.5 21,1 21,8
septembre
150,0 47,4 22,8 26,7
octobre
187,5 87.9 30,0 28,1
rosa sont de moins en moins sensibles au fluor avec l'avancement en âge et que, pour des aiguilles plus âgées, il convenait d'augmenter les concentrations de fumigants pour atteindre le seuil toxique.
Nous avons également constaté sur abricotiers que les teneurs en fluor s'accroissaient avec l'avancement de la saison et l'âge des feuilles. Travaillant en collaboration avec nous en Valais, Desbaumes note les teneurs suivantes sur feuilles d'abricotiers (tableau 8).
Notons encore que les conditions météorologiques et climatiques exercent aussi une influence manifeste sur l'apparition des nécroses. En Valais, sur abricotiers, nous avons souvent observé que de nombreuses nécroses apparaissaient brusquement sur les feuilles après une légère chute de pluie faisant suite à une longue période de sécheresse. Comme déjà indiqué, il est probable que l'humidité sur la feuille facilite la pénétration du fluor et la formation de nécroses. Le relief topographique et orographique peut conduire, pour sa part, à des localisations de polluants. En Valais, nous avons constaté avec le Prof. Lugeon, alors directeur de l'Institut suisse de météorologie, que ces accumulations se manifestaient naturellement aux revers des collines, car c'est en ces lieux que se produit une détente des courants gazeux, par suite de la décélération des courants et de l'apparition de révoiins: il en résulte une surconcentration momentanée des gaz toxiques, alors, qu'au contraire, l'accélération des courants qui se produit à l'avers des collines, par rapport à la direction du vent, détermine une diminution de la concentration de ces courants en composés toxiques.
La propagation quasi linéaire des gaz sur une grande distance, sans diffusion latérale marquée, peut également s'observer dans des vallées étroites soumises au régime alternatif des vents ascendants et descendants, mais avec prédilection pour le sens ascendant, ce qui permet à des effets caustiques de se manifester à des distances parfois importantes du point d'émission.
Plantes sensibles et plantes-tests
L'étude des différences de sensibilité aux composés fluorés des diverses espèces végétales ont fait l'objet de nombreuses recherches. D'une part, des expériences de fumigation ont été effectuées, d'autre part, des observations ont été récoltées sur des plantes annuelles, bisannuelles ou pérennes, appartenant à des espèces tant sauvages
130

que cultivées. En Allemagne, Borsdorf signale entre autres comme espèces particulièrement sen
sibles au fluor Vitis vinifera, Carpinus betulus, Iris germanica, Dactylis glomerata et Arrhenatherum elatius. Cet auteur énumère aussi 54 espèces plus ou moins sensibles ou presqu'insensibles au fluor. Il constate qu'en général les Graminées et les Polygonacées figurent parmi les familles les plus susceptibles.
En France, Bossavy dresse une liste de 76 espèces, herbacées et arbustives naturelles, parmi les plus sensibles desquelles il cite entre autres Acer monspessulanum, Berberis vulgaris, Lonicera alpigena, Colchicum autumnale, Hypericum perforatum et H. macu-latum, Silene inflata, etc.
Aux USA, Thomas, collationnant diverses études, cite entre autres la susceptibilité particulière au fluor des glaïeuls, du pin, de l'abricotier, des azalées, des tulipes, du mélèze, du millepertuis, d'autres espèces étant signalées comme presque aussi sensibles.
Parmi les espèces sauvages et les mauvaises herbes qu'ils proposent d'utiliser comme plantes indicatrices pour les USA, Benedict et Breen signalent parmi les plus sensibles et dans l'ordre Chenopodium murale, Stellaria media, Amaranthus retroflexus, Poa annua, Chenopodium album et Sinapis arvensis.
Observant i 10 varétés de glaïeuls, Hendrix et Hall déterminent que la susceptibilité individuelle de chacune des variétés est extrêmement variable, certaines accusant l'effet
Fig. 7. Nécroses typiques par les gaz fluorés sur Berberis vulgaris.
131

^
\
Fig. 8. Nécroses typiques par les gaz fluorés sur Colchicum atitiwmale.
de faibles concentrations de fluor par la manifestation de nécroses importantes, telles les variétés Bo Peep, Green Light, Peter Pan, Stormy Weather, tandis que d'autres variétés sont beaucoup moins sensibles. Ces auteurs relèvent aussi les différences de susceptibilité marquées se manifestant chez les différentes feuilles, les quatrièmes réagissant le plus fortement. De même, ils observent que les nécroses sont moins importantes sur les variétés pourpres que sur les variétés oranges, les autres teintes se classant entre les deux. Nous avons nous-mêmes pu observer des différences analogues sur 2 variétés de glaïeuls croissant côte à côte dans la même planche : alors que la variété Friendship accusait 70 p.p.m. de fluor et présentait des nécroses importantes s'étendant à plus de la moitié du limbe, la variété Emilia était parfaitement indemne, bien que sa teneur en fluor fût de 93 p.p.m.
En Norvège, Robak mentionne que les dommages sur Pinus silvestris se manifestent lorsque la concentration en fluor pour la masse totale de l'aiguille atteint 60 à 100 p.p.m. dans la matière sèche. Un seuil identique a été déterminé pour Picea abies. Abies alba t* Larix sibirica présentent en moyenne les mêmes réactions que l'épicéa.
Nous avons également dressé, pour les conditions prévalant en Valais, des listes pour 76 espèces plus ou moins sensibles à l'action des gaz fluorés, les plus sensibles devant nous servir par la suite de plantes-tests, indicatrices de la pollution pour de faibles quantités de composés fluorés. Parmi celles-ci figurent un certain nombre de mono-cotylédones, ainsi que des Polygonacées, des Chénopodiacées, des Caryophyllacées,
132

des Berbéridacées, des Rosacées et des Vitacées, tandis que les Crucifères et les Composées s'avèrent généralement très résistantes. C'est ainsi qu'à côté des diverses variétés de lis, d'iris, de tulipes, de narcisses, de glaïeuls, nous utilisons aussi entre autres Colchicumautumnale, Fritillariaimperialis, Muscaricomosum, Convallaria majalis, Berberis vulgaris, Silene cucubalus, Orchis militaris, Millefolium perforatum et M. macu-latum, l'abricotier et la vigne. Un certain nombre de graminées (Arrhenatherum, Dactylis, Festuca, Anthoxanthum) sont également très sensibles à de très faibles concentrations de fluor, mais leur emploi comme plantes-tests est délicat, car ces espèces présentent souvent, et déjà à un stade juvénile de leur développement, un dessèchement des pointes des feuilles dû au climat sec et chaud de la vallée du Rhône.
En nous basant sur l'analyse de 625 échantillons de feuilles, nous avons pu déterminer que des nécroses du limbe pouvaient se manifester chez l'abricotier pour des teneurs en fluor dans la matière sèche de l'ordre de 15 p.p.m. déjà. Sur vigne, la limite se situe à quelque 25 p.p.m. et sur pommier à 70 p.p.m. Sur vigne et sur abricotier, il est rare que les feuilles ne présentent pas de nécroses lorsque la teneur en fluor est supérieure à 100 p.p.m., cette limite s'élevant à 160 p.p.m. pour le pommier. En outre, nous avons observé que la teneur en fluor des feuilles d'abricotiers reste en général assez basse, ne dépassant guère 250 p.p.m., alors que des taux plus élevés se rencontrent fréquemment sur vigne et, surtout, sur pommier, poirier et peuplier.
Rappelons que l'Etat de Californie a fixé à 35 p.p.m. (dans la matière sèche) la quantité de fluor admissible pour les 15 derniers centimètres des feuilles de glaïeuls, cette espèce étant prise comme référence des effets de la pollution par le fluor.
Si les valeurs ci-dessus peuvent présenter quelque intérêt dans l'étude du problème des effets de la pollution fluorée sur les végétaux, il convient toutefois de ne pas les utiliser sans tenir compte de nombreuses interférences qui tendent à modifier la sensibilité des tissus à une concentration extérieure donnée, ces facteurs, tant physiologiques et biochimiques que météorologiques, édaphiques et climatiques, présentant dès lors fréquemment une importance souvent plus grande que la teneur même en fluor des tissus considérés. Il est toutefois clair que l'on ne saurait se passer de la détermination la plus exacte possible de cette valeur lorsque l'on doit expertiser des dommages résultant d'immissions fluorées excessives.
Summary The effects of sulphur dioxide and fluorine compounds on plants
The author reviews the present knowledge on the effects of air pollution by SO2 and gaseous fluorine compounds on plants. He analyses the action of these substances and describes the main intoxication symptoms observed in wood, leaves, flowers and fruit. Methods used in determining presence and strength of pollution are mentioned. New experiments are described, especially on the effect of fluorine on fruit trees.
133

Zusammenfassung Die Auswirkung des Schwefeldioxyds und der Fluorverbindungen auf Pflanzen
Der Autor durchgeht die zurzeit erlangten Kentnisse auf dem Gebiet der Luftverunreinigung durch SO2 und Fluorabgase sowie deren Auswirkung auf Pflanzen. Nach einem Hinweis auf die wichtigsten Emissionsquellen von SO2 und Fluor analysiert er die Art dieser Einwirkung und beschreibt die wichtigsten Vergiftungserscheinungen welche im Holzgewebe, an den Blättern und an den Blüten und Früchten festgestellt worden sind. Ebenfalls dargelegt sind die Methoden die es ermöglichen, sowohl das Vorhandensein als den Schädlichkeitsgrad der Luftverunreinigung zu prüfen. Zudem werden persönliche Erfahrungen, besonders in Fragen der Auswirkung des Fluors auf Fruchtbäume, bekanntgegeben.
Littérature
Adams, D. F. 1956. Am. Med. Ass. Archs ind. Health 14: 229-45. Adams, D. F., H. G. Applegate et J. W. Hendrix. 1957. J. agric. Fd Chem. 5: 108-16. Adams. D. F. et M. T. Emerson. 1961. PI. Physiol. 36: 261-5. Adams, D. F., G. G. Shaw et W. D. YerkesJr. 1956. Phytopathology 46: 587-91. Adams, D. F. et R. A. Solberg. 1956. Am. J. Bot. 43: 755-60. Adams, D. F. et C. W. Sulzbach. 1961. Science 133(3462): 1425-6. Adams, D. F.,ctal. 1956. J. agric. Fd Chem. 4: 64-6. Applegate, H. G. et D. F. Adams. 1960a. Bot. Gaz. 121: 223-7. Applegate, H. G. et D. F. Adams. 1960b. Int. J. Air Pollut. 3: 231-48. Applegate, H. G. et D. F. Adams. 1960c. Phyton 14: 11-120. Applegate, H .G. .D. F. Adamset R. C. Carriker. 1960. Am. J. Bot. 47: 339-45 Barker, K., et al., 1963. Air Pollution. World Health Organization. Genève. Benedict, H. M. et W. H. Breen. 1955. Pr. 3rd natn. Air Pollut. Symp. Berge, H. 1963. Phytotoxische Immissionen. Berlin. Berge, H. 1964. Angew. Bot. 37: 299-311. Bolay, A. et E. Bovay. 1965a. Phytopath. Z. 53: 289-98. Bolay, A. et E. Bovay. 1965b. Agric. romande, IV. Série A (6): 43-6. Bovay, E. 1954. Annu. agric. suisse 55: 915-1047. Bovay, E. 1958. Annu. agric. suisse 59: 541-4. Bovay, E. 1966. Bull. Ass. romande Protection Eaux et Air 3: 42-9. Bovay, E. et A. Bolay. 1965. Agric. romande, IV. Série A (5): 33-6. Borsdorf, W. 1960. Phytopath. Z. 38: 309-15. Bossavy, J. 1965a. Revue for. fr. 3: 205-11. Bossavy.J. 1965b. Revuefor.fr. 12:801-11. Bredemann, G 1956. Biochemie und Physiologie des Fluors. Berlin. Brewer, R. F., F. B. Guillemet et F. H. Southerland. 1964. Clean Air O. 8: 12-15. Commission fédérale de l'hygiène de l'air. 1966. Bull. Schweiz. GesundhAmt. Suppl. B. No. 4. Conseil de l'Europe. 1964. Conférence européenne sur la pollution de l'air, Strasbourg Rapport
national de la Norvège sur le point 2. Desbaumes. P. 1966. Étude des retombées fluorées dans les vergers du Valais central. Dans: Rapport
à la Commission fédérale de l'hygiène de l'air. Eidgenössische landwirtschaftliche Versuchsanstalten Lausanne, Oerlikon und Wadenswil. 1967.
Pflanzenschutzmittel-Verzeichnis. Fortmann, H. 1963. Raucheinwirkungen im Gartenbau. Hiltrup Münster. Garber, K. I960. Angew. Bot. 34: 65-103. Garber, K. 19o2a. Angew. Bot. 36: 127-84.
134

Garber, K. 1962b. Symposium Toxikologie des Fluors, Bern. Garber, K. 1962c. Wiss. Z. tech. Univ. Dresden 11: 549-52. Garber, K. 1962d. Oualitas PI. Mater, veg. 9: 33-43. Garber, K. 1963. Landw. Forsch. 17, Sonderdruck: 20-25. Garber, K. 1966. Landw. Forsch. 20, Sonderheft: 116-8. Gericke, S. et B. Kurmies. 1955. Phosphorsäure 15: 50-63. Gisiger, L. 1966a. Schweiz, landw. Mh. 44: 221-30. Gisiger, L. 1966b. Landw. Forsch. 19: 77-85. Griffin, S. W. et B. B. Bayles. Cités dans : K. Barker et al. Guderian, R. 1966a. IberLandesanst. f. Immissions- u. Bodennutzungsschutz des Landes N.Rhein-
Westfalen 4: 79-100. Guderian, R. 1966b. Z. PflKrankh. PflSchutz 73: 241-65. Guderian, R., H. van Haut et H. Stratmann. 1960. Z. PflKrankh. PflSchutz 67: 257-64. Halbwachs, G. 1963. Flora 153: 33-357. Haut, H. van. 1961. Staub 21: 52-6. Haut, H. van et H. Stratmann. 1960. ForschBer. Landes NRhein-Westf. 884. Heck, W. W., J. A. Dunning et I. J. Hindawi. 1965. 58th A. Mtg APCA. Toronto, Canada. Heck, W. W. et R. A. Taft. 1964. 57th A. Mtg APCA, Houston, USA. Hendrix, J. W. et H. R. Hall. 1958. J. Proc. Am. hort. Soc. 72: 503-10. Holte, W. 1962. Gartenwelt 62: 395-8. Hopp, H. H. 1966. Wein-Wiss. 21: 141-9. Houten, J. G. ten. 1966. Landbouwk. Tijdschr. 78: 3-31. Keller, Th. 1964. Schweiz. Z. Forstw. 4: 228-55. Keller, Th. et E. Bovay. 1966a. Bull. Schweiz. GesundhAmt, Suppl. B, No. 4: 48-56. Keller, Th. et E. Bovay. 1966b. Forêt 12. Kisser, J. et I. Lehnert. 1957. Mikroskopie 12: 243-57. Koelsch, F. et E. Lederer. 1966. Lehrbuch der Arbeitsmedizin. Stuttgart. Leone, I. A., E. Brennan et R. H. Daines. 1965. PI. Dis. Rep. 49: 911-15. Ludewig, R. et K. H. Lohs. 1966. Akute Vergiftungen. Jena. Mclntire, W., J.Thompson et B. Hatcher. 1942. Ind. Engng Chem., int. Edn. 34: 1469-79. McNulty, J. B. et D. W. Newman. 1961. PI. Physiol., Lancaster 36: 385-8. Nömmik, H. 1953. Acta polytech. 127: 1-121. Oelschläger, W. 1965. Staub 25: 528-32. O'Gara, P. J. Cité dans : K. Barker et al. Piiet.'P. E. 1963. Ber. Schweiz, bot. Ges. 73: 58-92. Pilet. P. E. 1964. Ber. Schweiz, bot. Ges. 74: 12-21. Pilet, P. E. et G. Collet. 1964. Ber. Schweiz, bot. Ges. 74: 215-28. Robak, H. Cité dans: Rapport national de la Norvège pour la Conférence européenne sur la
pollution de l'air. Strasbourg, 1964. Spierings, F. H. F. G. 1967a. Neth. J. PI. Path. 73: 25-8. Spierings, F. H. F. G. 1967b. Atmos. Environment 1: 205-10. Stern, A. C. 1962. Air Pollution. New York and London. Stratman, H. 1963. ForschBer. Landes NRhein-Westf. 1184. Stratman, H. et M. Buck. 1966. SchrReihe L.andesAnst. f. Immissions- u. Bodennutzungsschutz
des Landes NRhein-Westf. 3. Stratmann, H. et H. Ixfeld. 1967. SchrReihe LandesAnst. f. Immissions- u. Bodennutzungsschutz
des Landes NRhein-West. 8. Thomas, M. D. et R. H. Hendricks. Cités dans; K. Barker étal. Thomas, M. D. et G. R. Hill. 1961. Cités dans: K. Barker et al. Verein Deutscher Ingenieure. 1961. Veröflf. Nr. 2108. Viel, G. et L. de Cormis. 1965. Pollution atmosph. 7: 381-91. Wöhlbier, W., W. Oelschläger et H. Gießler. 1963. Z. wirtsche.eigener Futter, Sonderh. 1:10. Zahn, R. 1963. Z. PflKrankh. PflSchutz 70: 81-95.
135

The role of photochemical air pollution on vegetation
E. F. Darley
Statewide Air Pollution Research Center, University of California, Riverside Cal., USA
Abstract
Photochemical air pollution.a relatively new phenomenon first described near Los Angeles, is now also present in other parts of the world. It results from atmospheric reactions between nitrogen oxides and certain hydrocarbons ; automobile exhaust ist he principal source. The phytotoxic products are the peroxyacyl nitrates (PAN's), ozone and nitrogen dioxide. Injury symptoms caused by PAN and ozone are characteristic and different. PAN injury is typically confined to the lower leaf surface and appears as a silvering or bronzing; ozone injury is typically confined to the upper leaf surface and appears as a stippling or mottling. Concentrations below those producing visible symptoms may cause reduction in plant growth. Nitrogen dioxide does not cause symptoms at ambient concentrations but may result in growth reduction. Losses due to photochemical air pollution are significant in agriculture.
Photochemical air pollution is a relatively new phenomenon, intimately associated with large population centres. Its effects on plants were first noted in southern California in the early 1940s. It was not until the late 1950s, however, that the real nature of this new phenomenon in air pollution was elucidated. In the early 1940s and the years that followed, Los Angeles was notorious for its smog, and farmers were very concerned about the injury on their crops. As we became more familiar with the air pollution situation in and around Los Angeles, we soon found that the plant injury symptoms were not confined to Los Angeles but were also present in the neighbouring countries to a distance of 80-90 miles, and indeed were present in northern California around San Francisco. Later we found photochemical effects in some 27 other states. What was once, therefore, a local and unique air pollution problem in Los Angeles became evident in many of the larger urban areas of several states in the United States. In fact, it is now present in other continents and some of its symptoms have just recently been reported by Dr. ten Houten in the Netherlands.
The history of the research on photochemical air pollution is briefly as follows. When agriculturists in the Los Angeles area first noted a peculiar silvering on the underside of the leaves of leafy vegetables, the pathologists at Riverside were asked diagnose the trouble. It was very quickly determined that this disorder was not due to the usual pathogens or to viruses but was associated with periods of air pollution. Also, it was quite evident that the symptoms were not those of sulfur dioxide or fluorides, but that some new pollutant in the air was responsible. As a result, it was necessary to establish a very detailed research project and this was done in 1950 by
137

co-operative team work between the University of California, the California Institute of Technology, and the officials of the Los Angeles Air Pollution Control District. Fumigation facilities were established at Cal Tech's laboratories in Pasadena wherein we were able to control temperature, light and humidity, and to filter the air so that we had clean air in which to conduct our experiments. The first experiments were initiated by fumigating plants with all of the chemicals that could be isolated from the atmosphere. This involved some 70 different chemicals and none of them reproduced the symptoms that were typical of Los Angeles smog, namely, the silvering or bronzing of the under leaf surface. Because of the highly oxidative nature of Los Angeles smog and the similarity in odour to that of ozone, experiments were started with the dark-reaction products of ozone and olefinic hydrocarbons. These reactions produced symptoms similar to those seen in the field. However more research proved that these products had a very short half-life and it was not possible to isolate and characterize them.
By 1953 sufficient work had been done at Cal Tech so that other researchers in the United States began to work on the problem. The result was to elucidate the phenomenon we now call photochemical air pollution. It was found that this type of air pollution results from reactions in the atmosphere between oxides of nitrogen and certain hydrocarbons, principally the unsaturated or olefinic hydrocarbons. The phyto-toxic products in photochemical reactions that have been identified to date are the peroxyacyl nitrates, which we refer to as PANs, ozone, and nitrogen dioxide. As the name photochemical implies, the reactions are initiated by the energy of sunlight. The acceptor of this energy is nitrogen dioxide which breaks down into NO and atomic oxygen. From this point one pathway of subsequent reactions is for the atomic oxygen to unite with molecular oxygen to form ozone. Another pathway is for the atomic oxygen to react at the double bond of certain olefinic hydrocarbons and unite with the nitrogen of nitrogen dioxide to form the peroxyacyl nitrates. Thus, the principal toxic materials in photochemical air pollution are secondary pollutants formed in the atmosphere de novo from reactions between contaminants emitted from the primary source. This is in direct contrast to a point-source pollutant such as SOo which is identifiable as SO2 at the source, in the atmosphere and at the affected vegetation. The principal source of the primary reactants in the photochemical process is the automobile, although the combustion of any organic fuel will yield oxides of nitrogen and hydrocarbons. Since the source is mobile and not stationary, there are no identifiable plumes or locally restricted areas of effect; effects are generally noticed over several hundred square miles in the vicinity of large urban areas. In California plant injury has been noted in approximately 11 percent of the state, including the Los Angeles Basin, the San Francisco Bay Area and the Sacramento and San Joaquin valleys.
Except for the unsaturated hydrocarbon ethylene, the primary hydrocarbon contaminants are not injurious to vegetation.
The PANs are composed of a homologous series of materials. The first one, peroxy-acetyl nitrate, or PAN, is the first member of this series and is the most prevalent in photochemical air pollution. The second and third members are peroxypropionyl nitrate, which we abbreviate PPN, and peroxybutryl nitrate, PBN. The phytotoxicity of all three members has been established, but only PAN and PPN have been found
138

in polluted air up to this time. Characteristic injury symptoms of PAN and ozone are quite distinct and this makes
it possible to distinguish the effects of the two pollutants on vegetation. The characteristic acute injury symptom of the PANs is a silvering, bronzing, or otherwise metallic sheen which is typically confined to the lower leaf surface of affected plants. Some of the best indicators of PAN damage are the leafy vegetables and petunias. The silvering symptom is attributed to a dehydration and shrinking of the affected mesophyll cells and a filling of the resulting space with air. Exposure to PAN concentrations of about 0.05 p.p.m. for 4 hours is sufficient to incite symptoms on susceptible plants. The lower threshold level for injury is about 0.02 p.p.m. The other members of this homologous series, PPN and PBN, are successively more toxic. Our air analyses indicate, however, that PPN is present in the atmosphere at about a tenth of the concentration of PAN. It is presumed that most of the damage that we see in the photochemical atmosphere is due to PAN.
Contrasted to the injury of PAN, the characteristic acute injury symptom of ozone is a stippling, mottling or chlorosis which is typically confined to the upper leaf surface. Many researchers have stated that the first tissues affected by ozone are the chlorophyll bearing palisade cells near the upper leaf surface and recent work at Riverside has shown that the first evidence of injury by ozone is to the chloroplasts in these palisade cells. Thus, ozone has a particular affinity for the chlorophyll bearing palisade cells which explains the marking on the upper surfaces. Plant injury is easily produced by an exposure to 0.2 p.p.m. ozone for about 4 hours. The threshold seems to be about 0.1 p.p.m.
Early in the investigations on photochemical air pollution, it was assumed that the primary role of nitrogen dioxide was as an initiator of the photochemical process and that the gas itself was innocuous to plants. Some early work by investigators at Stanford Research Institute had shown that nitrogen dioxide at 20 to 50 p.p.m. could produce injury symptoms on plants, but these levels were several times higher than those found in the atmosphere. Our own work at Riverside indicated that about 4 to 8 p.p.m. NO2 on plants grown in the greenhouse were required, and the resulting symptoms were very similar to those incited by sulfur dioxide. But since these levels were so high, it was assumed that nitrogen dioxide was not important as a phytotoxicant in the photochemical process.
Recent work at Riverside has shown, however, that ambient concentrations of nitrogen dioxide, usually less than 1 p.p.m., do cause growth reduction in plants. In some experiments, the growth of tomatoes was retarded as much as 30 percent over a period of several weeks. I believe that there is also recent work in Germany to substantiate the findings that NO2 is important in growth retardation. My remarks about NO2 have introduced the concept that certain air pollutants retard the growth of plants. This is also true of PAN and ozone. In addition to the acute effects of PAN, mentioned above, subnecrotic or sublethal concentrations of these gases will cause significant retardation of growth and this may be one of the more significant features of economic damage to vegetation. The results of about 5 years' experiments wherein full producing citrus trees were exposed to the ambient concentrations of photochemical
139

pollutants has shown that the ability of the plants to take up water is impaired, the dropping of leaves increases, and the yield of fruit may be reduced by as much as 50 percent.
Much excellent work has been done on the biochemical effects of pollutants on cell systems to show that they interfere with photosynthesis, respiration, enzyme activity, and cell wall permeability. They need not be discussed here.
Losses from photochemical air pollution are a significant factor in agricultural production. In California it has been variously estimated that the direct economic loss approaches $ 10 to $ 12 million dollars per year and that the indirect loss due to growth retardation, delayed maturity, reduced yields, and impaired quality might be ten times this. Actually has yet made any careful economic estimates.
Résumé L'influence de la pollution photochimique de l'air sur la végétation
La pollution photochimique de l'air a été observé pour la première fois à la fin des années 50, après plusieur années de recherches sur le 'smog' (brouillard enfumé) à Los Angeles. Ce qui constituait jadis un phénomène de pollution de l'air particulier à cette ville, se rencontre actuellement dans un grand nombre de zones urbaines dans plusieurs États des USA; certains de ses symptômes viennent d'être constatés aux Pays-Bas.
Cette pollution est le résultat de réactions dans l'atmosphère entre des oxydes d'azote et certains hydrocarbures, notamment les hydrocarbures oléfiniques. Les réactions sont déclenchées par l'énergie solaire. Les produits sont nuisibles à la végétation. Les substances toxiques sont des polluants dérivés formés dans l'atmosphère de novo à partir de réactions entre des contaminants dégagés par une source primaire. La principale source est l'automobile, quoique toutes combustibles organiques produisent des oxydes d'azote et des hydrocarbures. À l'exception de l'éthylène, les contaminants ne sont pas nuisibles à la végétation. Les produits phytotoxiques identifiés sont les nitrates de peroxyacyl, l'ozone et le bioxyde d'azote.
Le nitrate de peroxyacetyl est le premier élément d'une série homologue et prédomine dans la pollution photochimique. Les second et troisième éléments sont le nitrate de peroxypropionyl et le nitrate de peroxybutyryl. La phytotoxicité de tous les trois éléments a été établie, mais on a décelé dans l'air pollué seulement le premier et de deuxième.
Le symptôme caractéristique des nitrates de peroxyacetyl est l'apparition d'un reflet argenté, bronzé ou métallique, typiquement limité à la surface inférieure des feuilles. L'ozone a une affinité particulière pour les cellules chlorophyllifères palissadi-ques, ce qui explique la détérioration de la face supérieure des feuilles. Il est facile de provoquer des dommages aux plantes par une exposition à 0,2 p.p.m. d'ozone.
Des concentrations de bioxyde d'azote, généralement inférieures à 1,0 p.p.m., ne provoquent pas de dommages graves aux plantes; il en faudrait environ 4,0 à 8,0 p.p.m. Les symptômes sont très similaires à ceux que produit l'anhydride sulfureux. Il ressort toutefois de recherches récentes que les concentration basses retardent la
140

croissance des plantes. Outre les effets aigus des nitrates de peroxyacyl et de l'ozone, les concentrations de ces gaz qui ne causent pas encore de taches nécrotiques provoquent un important retard de croissance.
Des études biochimiques ont révélé que les polluants agissent sur la photosynthèse, la respiration et l'activité enzymatique et qu'ils causent des modifications dans la perméabilité des parois cellulaires.
Les pertes dues à la pollution photochimique constituent une préoccupation primordiale pour l'agriculture. On estime en Californie, que les pertes directes atteignent plus de S 10.000.000 par an et que les pertes indirectes pourraient se monter à $120.000.000.
Zusammenfassung Der Einfluß fotochemischer Luftverunreinigung auf die Vegetation
Fotochemische Luftverunreinigung wurde Ende der fünfziger Jahre zum ersten Mal beobachtet nach verschiedenen Jahren Untersuchungen an den Los Angeles 'smog'. Nachher wurden ähnliche Verhältnisse in vielen anderen dicht bevölkerten Staaten der USA und neuerdings auch in Holland gefunden. Diese Luftverunreinigung ist das Resultat von Reaktionen zwischen Nitratoxyden und gewissen (namentlich olefinischen) Kohlwasserstoffe. Wie der Nähme schon andeutet, werden diese Reaktionen im Gang gesetzt vom Sonnenlicht; die Produkte sind also sekundäre Verunreinigungen die in der Atmosphäre neu gebildet werden als Resultat von Reaktionen zwischen Bestandteile der ursprünglichen (primären) Emissionen. Sie sind giftig; mit Ausnahme von Äthylen sind die primären Produkte aber harmloss für die Vegetation. Die bis jetzt identifizierten phytotoxischen Produkte der fotochemischen Reaktionen sind Peroxyacylnitrate, Ozon und Stickstoffdioxid. Von der homologen Reihe deren erstes Glied Peroxyacylnitrat ist überwiegt dieses erste Glied (PAN) bei der fotochemischen Luftverunreinigung. Die zwei folgende (Peroxypropionylnitrat und Peruxybutyrylnitrat, PPN und PBN) sind auch giftig, aber nur PAN und PPN hat man bis jetzt in der Luft angetroffen.
Das Symptom für PAN ist ein metallischer Beschlag auf der Unterseite der Blätter (Dehydratation des Mesophylls). Bei empfindlichen Pflanzen genügt ein Kontakt mit 0,07 p.p.m. PAN während 4 Stunden um es hervor zu rufen. PPN und PBN sind noch wirksamer.
Das Kennzeichen einer akuten Ozonbeschädigung ist das Auftreten von Punkte, Flecken und chlorotischen Stellen an der Blattoberfläche, bei einer Konzentration von 0,2 p.p.m. schon nach 4 Stunden.
Eine Konzentration von 1,0 p.p.m. Stickstoffdioxyd verursacht normalerweise keinen sichtbaren Schaden; Symptome treten erst auf bei 4,0 bis 8,0 p.p.m.; sie sind den S02-Symptome sehr ähnlich. Neuerdings wurde aber gezeigt, daß niedrigere Konzentrationen wohl eine Herabsetzung des Wachstums verursachen. Ähnliche Erscheinungen gibt es bei PAN und Ozon.
Die schädliche Stoffe wirken ein auf Fotosynthese, Atmung und enzymatische Prozesse und sie verursachen Veränderungen in der Durchlässigkeit der Zellmembrane.
141

In Kalifornien wird der direkte jährliche Schaden durch fotochemische Luftverunreinigung an der Vegetation geschätzt auf $10.000.000 bis $12.000.000, der indirekte Schaden (Produktionsverluste) auf das Zehnfache.
Selected references
Darley. E. F. and J. T. Middleton. 1966. A. Rev. Phytopath. 4: 103-18. Darley. E. F., C. W. Nichols and J. T. Middleton. 1966. Calif. Dep. Agric. Bull. 55:11-9. Haagen-Smit, A. J., E. F. Darley. M. Zaitlin. H. Hull and W. Noble. 1952. PI. Physiol.. Lancaster
27:18-34. Houten. J. G. ten. 1966. Landbouwk. Tiidschr., 's-Grav. 78(1): 3-31. Middleton, J. T. 1961. A. Rev. PI. Physiol. 12:431-8. Middleton, J. T. and A. J. Haagen-Smit. 1966. J. Air. Pollut. Control Ass. 11: 129-34. Rich, S. 1964. A. Rev. Phytopath. 2: 253-66. Stephens, E. R., E. F. Darley, O. C. Taylor and W. E. Scott. 1961. Int. J. Air Wat. Pollut. 4: 79-100. Taylor, O. C. and F. M. Eaton. 1966. PI. Physiol., Lancaster41: 132-5.
142

Interaction entre la fumure et la causticité des immissions fluorées1
A. Bolay, E. Bovay, C. Neury et R. Zuber
Station Fédérale de Recherches agronomiques, Lausanne, Suisse Station Fédérale de Recherches de Chimie Agricole, Liebefeld-Berne, Suisse
Sommaire
En 1967, dans des cultures de vignes et d'abricotiers du Valais central (Suisse) exposées aux pollutions atmosphériques de fabriques d'aluminium et d'engrais, il est apparu que la causticité des immissions fluorées et la teneur en fluor du feuillage dépendaient étroitement de la nature de la fumure minérale distribuée. Le mécanisme de cette interaction n'est pas encore connu. Cependant trois hypothèses d'interférences sont possibles : les chlorures, le bore et, éventuellement, une substance non identifiée, spécifique à certains engrais phospho-potassiques.
Le Valais central, de Viège à Vernayaz, est exposé aux gaz fluorés émis par trois usines d'aluminium et une fabrique d'engrais. L'effet des polluants fluorés est notablement aggravé, d'une part, par la diffusion quasi linéaire des vents de cette vallée alpine (Bovay et Bolay, 1965), d'autre part, en raison de l'importance que revêtent pour cette région les cultures d'abricotiers et de vignes, essences extrêmement sensibles au fluor (Bolay et Bovay, 1965a et b). Depuis plus de 15 ans, nous avons été appelés à nous occuper de dommages causés à ces deux cultures par les émissions de l'une ou de l'autre de ces usines (Bovay, 1954, 1958). Au cours des ces différentes enquêtes et expertises, nous avons été frappés par la répartition très irrégulière des dommages causes par la pollution. En effet, on constate, chaque année, sur abricotiers ou sur vignes, de graves nécroses du feuillage dans certaines plantations, alors que les cultures voisines ne présentent que peu ou pas de dommages. Ces manifestations particulières s'observent aussi bien dans des cultures proches des usines que dans des plantations situées à 10 voire 20 km de celles-ci. Sur la figure 1, nous avons reporté les emplacements des sources d'émissions fluorées et les zones où ce phénomène a été constaté.
Dans l'intention de rechercher la cause de cette réaction nettement différenciée de propriétés voisines et apparemment analogues à une pollution relativement uniforme, nous avons entrepris en 1967 une enquête s'étendant à quelque 70 parcelles. Le présent travail a pour but d'en exposer les résultats.
1. Nous remercions la Commission fédérale d'hygiène de l'air pour l'aide financière apportée à la réalisation de ce travail. Nous exprimons aussi notre gratitude à MM. V. Ducrot et B. Jacot, chargés de la récolte des échantillons, à Melles A. Niklaus et H. Richter et MM. A. Chaouch et F. Schär, responsables des analyses, ainsi qu'à M. R. Bonjour, Ing. agr., qui a bien voulu se charger de l'interprétation statistique des résultats.
143

5 Km
& Source de fluor
Fig. 1. Carte du Valais central avec les régions où des cas isolés de brûlures du feuillage par les gaz fluorés ont été constatés durant ces dernières années.
Méthode
Notre enquête poursuivait les buts suivants : a. Établir le plan de chaque parcelle en donnant à chaque arbre ou pied de vigne une note d'évaluation des brûlures. Par la suite, calcul de la note moyenne pour l'ensemble de chaque parcelle. b. Prélever des échantillons de feuilles pour ia détermination du taux de fluor suivant la méthode Oelschläger (1962). c. Prélever des échantillons de sols et sous-sols pour la détermination des teneurs en éléments fertilisants et en fluor. d. Dresser le programme des traitements antiparasitaires effectués ainsi que le plan de la fumure appliquée par chacun des propriétaires.
La taxation des brûlures sur le feuillage s'est effectuée à l'aide des symboles représentés à la figure 2 et selon le barème suivant.
Pour l'abricotier: 0 = aucune brûlure - 1 = quelques faibles brûlures sur les feuilles apicales des pousses annuelles - 2 = fortes brûlures des feuilles aux extrémités des pousses annuelles - 3 = fortes brûlures des feuilles et défoliation des extrémités des
144

BRULURES DU
SrMBOLES
O O (3 d •
FEUILLAGE
NOTES
0
1
2
3
4
Fig. 2. Notes de brûlures du feuillage des abricotiers.
pousses annuelles - 4 = défoliation des pousses annuelles et brûlures sur la moitié des feuilles de la couronne - 5 = brûlures foliaires généralisées atteignant les 3/4 et plus du feuillage.
Pour la vigne: notation de 0 (aucune brûlure) à 5 (de 3/4 à la totalité des feuilles nécrosées).
Relevés topographiques des dégâts
Une représentation schématique des vergers d'abricotiers ou des vignes atteints de nécroses foliaires est donnée pour quelques-unes des parcelles étudiées par les figures 3 à 8. Les abricotiers sont représentés par des cercles dont le rayon est fonction de la grosseur de l'arbre. L'intensité des nécroses foliaires est indiquée suivant le barème de la figure 2. Par parcelle, nous avons fait figurer pour l'abricotier (A) ou pour la vigne (V) la note moyenne des brûlures ainsi que le taux de fluor (F) en p.p.m. décelé dans les feuilles par l'analyse.
Les figures 3 et 4, en provenance de Saxon, illustrent parfaitement le problème que nous rencontrons dans tout le coteau de la rive gauche du Rhône, entre Sion et Mar-tigny, où la culture de l'abricotier prédomine. Dans des zones données, où la majorité des abricotiers est indemne, on rencontre quelques vergers dont le feuillage est fortement nécrosé. L'analyse révèle une teneur en fluor variant entre 200 et 600 p.p.m. dans le feuillage des vergers atteints, alors qu'elle n'est que de 15 p.p.m. dans les parcelles contigiies, indemnes.
Il est intéressant de noter que, dans tous ces cas, seuls les arbres d'un même propriétaire sont atteints de brûlures foliaires, la ligne de démarcation séparant les abricotiers nécrosés des arbres sains suit exactement les 'imites des propriétés. Lorsque, dans une région donnée, un propriétaire possède plusieurs biens fonds séparés, les nécroses foliaires apparaissent dans chacune de ces parcelles, indépendamment de leur position topographique. Dans quelques cas, les brûlures atteignent des parcelles de propriétaires différents, mais cultivées par une même personne. Ces observations semblent indiquer que l'apparition des nécroses foliaires est liée à un mode d'exploitation propre à certains cultivateurs.
Influence du milieu
La dispersion des gaz fluorés en Valais est fonction du régime des vents propre aux vallées alpines (Bovay et Bolay, 1965). La majorité des cultures d'abricotiers et de
145

o o
o o
o o
o O A.00-F.17
o o
O
O
O
O O
o
O
o
O Fig. 3. Saxon, Champ Passé. Cas typique au coteau de Saxon. Les nécroses du feuillage, causées par les gaz fluorés, sont limitées aux abricotiers d'une seule parcelle. A 3,0-F 480 = Abricotier. Note de brûlure du feuillage = 3,0; taux de fluor dans les feuilles = 480p.p.m.
SAXON Sous la Tour
o o OA<0.î-F26
o o Fig. 4. Saxon. Sous la tour. Autre cas typique.
146

vignes est située en amont des usines de Martigny. C'est donc le vent diurne, ascendant et rapide, qui entraîne les polluants fluorés. Le déplacement des masses d'air occupant la Vallée du Rhône sous l'influence de l'appel d'air matinal du Haut-Valais débute d'abord lentement, puis s'accélère en prenant un mouvement ondulatoire dont la propagation est toutefois modifiée par les obstacles naturels que représentent les cônes de déjection et les promontoires qui s'avancent, sur la rive gauche, perpendiculairement à l'axe de la vallée. Il est, en effet, connu que les retombées des gaz entraînés par les courants atmosphériques sont relativement plus faibles sur l'avers de l'obstacle, par suite de l'accélération des vents (effet Venturi), tandis que les dépôts les plus importants se produisent préférentiellement sur le revers, où l'on observe une diminution de la vitesse, une détente et l'apparition de revolins.
Conformément à cette théorie, on a effectivement pu constater que, dans la majorité des cas, les parcelles du coteau, les plus fortement brûlées, sont situées au revers d'une colline ou d'un promontoiie faisant obstacle au vent ascendant. Cependant, le fait d'être au revers ne suffit pas à expliquer pourquoi les brûlures n'atteignent que quelques parcelles bien déterminées alors que les plantations contigiies, situées dans la même situation topographique, restent indemnes de nécroses. Par ailleurs, on trouve aussi des parcelles brûlées à l'avers d'une colline et l'on en rencontre aussi dans la Plaine du Rhône.
Il existe certes des zones plus ou moins exposées au gaz fluorés, mais, dans un secteur donné, le taux de pollution reste relativement uniforme. La propriété foncière en Valais est très morcelée. Les parcelles de moins d'un are ne sont pas rares. Plus les surfaces sont petites, plus grandes sont les chances pour que les conditions du milieu restent identiques d'une parcelle à l'autre.
Les plantations d'abricotiers sont situées sur les cônes de déjection des rivières de la rive gauche du Rhône. Les conditions pédologiques peuvent varier d'un cône de déjection à l'autre, mais, pour un même cône, elles sont relativement très uniformes. Or, sur le même cône, quelques parcelles sont brûlées, alors que les autres sont indemnes.
Dans les sols de la Plaine du Rhône, la nature des alluvions se modifie d'une région à l'autre. Cependant, les variations des conditions pédologiques sont généralement progressives d'une zone à l'autre et leurs limites r.e correspondent jamais à celles des propriétés foncières dont les périmètres sont géométriques.
Les résultats d'une partie des analyses des échantillons de terre, prélevés lors de notre enquête, sont consignés au tableau 1. D'une façon générale, les sols des parcelles examinées présentent une réaction alcaline accentuée. Les vergers de Charrat sont les plus calcaires, le taux de cet élément pouvant atteindre plus de 50 %. En revanche, la réaction des vergers de Cor se rapproche de la neutralité. Les indices de fertilité sont extrêmement variables, en particulier pour l'acide phosphorique. Dans les vergers de Charrat, Saxon, Fey et Cor, les indices sont généralement très élevés, tandis qu'ils sont plus faibles à Martigny, tout en étant encore largement supérieurs au seuil de carence (indice 8). Les taux de potasse sont également presque toujours suffisants (supérieurs à 4 mg %) dans la grande majorité des vergers examinés.
En ce qui concerne les taux en fluor total, ils se situent entre 400 et 800 p.p.m.
147

Tableau 1. Résultats des analyses des sols de quelques parcelles retenues dans
Lieu
Martigny,
La Pointe Bonnes Luites Courvieux
Charrat
Saxon, Champ passé
Fey, Météo
Bieudon
Cor
Salins
Essence
abricotier
abricotier abricotier
abricotier abricotier
abricotier
vigne abricotier
vigne
abricotier abricotier abricotier abricotier
abricotier
abricotier abricotier abricotier abricotier
abricotier
vigne abricotier
vigne abricotier abricotier
abricotier abricotier
abricotier
abricotier
Feuillage
note de brûlures
1,5 1.5 2.0
0,1 2,0
3,1 3,8 0,0 0,0
0,0 3,0 0,0
2,5 0,0
3,4 2,6
0,1 0,7
3,0 2,5 0,0
0,0 2,5 0,0
2,6 0,6
2,4
1,5
p.p.m.
fluor
76,3 64,0 94,5
12,8
362,0 630,0 1
620,0 J 26,4 \
31.6 ƒ
16,8 480,0
16,8 420,0
20,2
419,0 249,0
17,6 11,0
524,0 1 213,0)
38,4 \
54,4 | 268
26,0
127,2 12,0
104,0 159,6
Sol
pH
7,7 7,8 7,7
7,8 7,9
8,0
7,9
7,5 7,8
7,6 7,8
7,7
7,6 7,6 7,3
7,3
7,6
7,7
7,9
8,2
7,2
7,1
8,1 7,8
C a C 0 3 0 / /o
7,0 9,2 7,6
28,5 51,0
50,0
48,0
12,3
17,3 14,0 12,0 6,0
5,0 6,8
8,0 4,0
3,5
3,7
5,0 4,4
tr.
0,2
14,5 16,8
P sO s
indice
60,0 65,0 43,0
102,0 145,0
250,0
182,0
165,0 95,0
110,0 43,0
23,6
145,0 47,0 41,0
580,0
62,0
200,0 90,0
4,7
230,0
200,0
4,2
210,0
l 'enquête.
K 2 0
m g %
21,0 8,0 2,9
12,7 20,0
29,0
19,3
10,4 7,0 5,6
3,8
9,2
21,3 46,5 41,0 15,5
17,0
42,0
19,0
14,0
100,0 4,6
3,7
12,0
fluor total
p .p.m.
690 870 780
660 800
760
790
750 530
450 610
680
580 730
560 810
650
620
870
760
640 720
550
720
Aucune corrélation ne peut être établie entre le taux de fluor dans le sol, d'une part, et l'intensité des brûlures ou la teneur en fluor du feuillage, d'autre part.
Influence du mode de culture
En Valais, la variété Luizet couvre plus de 90 % de la surface plantée en abricotiers. Cette variété est greffée sur franc ou sur porte-greffes myrobolan ou St. Julien. Grâce à l'aspect du tronc et aux repousses du pied, il est facile d'identifier le porte-greffe, ce qui permet d'affirmer qu'il ne joue aucun rôle dans l'apparition du phénomène que nous décrivons.
Très souvent, la vigne est une sous-culture de l'abricotier. Dans ce cas, la réaction
148

o O C5 o o O Cj O Cj O C3 O O O Q O o O Q> O O O d o o
. O Q> O O £ O O O - -, O Q) O O **- O Q> o O
' Q - O O O O 7 O -o o ' • o O v,, O Q> O O
Cs o o - . , O Cï O Q '
- o ? o
^ O t»
f» »
/t 3/. f 630 k3«. f 620
® * / ® <? ^ "1 ' ^
§ § § S i - ^ ^ S "> ** 5- X . " •" "> Z\ brûlures sar
§ ° § ~ ~ - ^ ° ' > > V I u > " ^ ^ •* <N [ zeps de vigne o S o ~ ! " " ~ ~ ^ c s , " ' £» " "> -* £ r » O Q O - p ^ N ^ * ^ c\ sj "3 f f
O Q O O O O O O C J O O Q 0 0 0 r~\ O Q O o o o o c i c a o C i O c i o o w o Q o o O o o O d o o ö C i c . 0
l 9 ° g i ° i § § § 9 ° § § l o Ii§sfif§f§ëii!§ ,. O O «-O o Q - ' A OP-F 13 V Q0 - f 26
Fig. 5. Charrat, Vergers d'abricotiers avec vigne en sous-culture. La parcelle 2, avec fortes nécroses sur les abricotiers et la vigne, a reçu un engrais PKB chloruré borique de formule 10.20.0,35. La parcelle 1 a été fumée avec un engrais NPKMg sulfaté de formule 4.6.10.1. Ces deux parcelles appartiennent au même propriétaire. Le propriétaire de la parc elle 6 a épandu un engrais N PK sulfaté de formule 4.6.12.
de ces deux plantes est identique. En effet, dans les parcelles où les feuilles d'abricotiers sont nécrosées, on observe aussi des brûlures sur le feuillage de la vigne (fig. 5). Il en va de même pour les plantes adventices qui portent également des symptômes de fluorose dans les parcelles où l'abricotier ou la vigne sont atteints de nécroses foliaires. C'est notamment le cas des espèces suivantes: Muscari comosum, Berberis vulgaris, Silene ciiaibalus, Stellaria media et Hypericum spp.
Il ressort de notre enquête que les travaux du sol ne modifient pas la sensibilité des abricotiers oude la vigne au fluor. En ce qui concerne l'abricotier, les brûlures apparaissent aussi bien en sol labouré et travaillé durant l'été que dans des prés herbes.
L'arrosage par aspersion ou par ruissellement est pratiqué dans toutes les cultures du coteau. Dans le cas de l'aspersion par jets tournants, les limites de propriétés ne sont évidemment pas respectées, ce qui exclu toute influence de l'arrosage dans l'apparition du phénomène décrit.
En ce qui concerne les herbicides, qui sont de plus en plus utilisés tant dans les vergers que dans les vignes, on peut mentionner quelques accidents dus à l'emploi inconsidéré de produits à base de dichlorthiobenzamide (Prefix), de diuron ou d'amino-triazol dans certaines plantations. Toutefois, les symptômes déterminés sur le feuillage sont différents de ceux provenant des fluoroses et, d'autre part, les analyses effectuées n'ont pas révélé un taux de fluor différent des parcelles atteintes par rapport aux parcelles saines.
Les traitements antiparasitaires ont tout spécialement retenu notre attention, étant
149
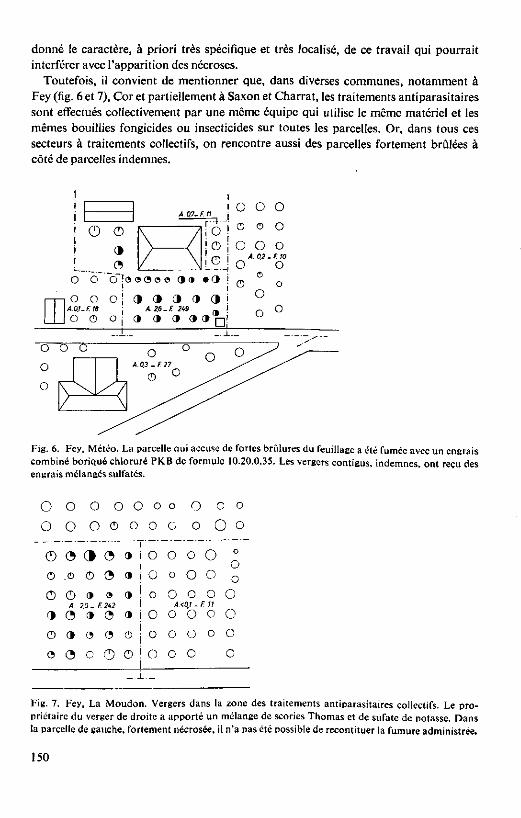
donné le caractère, à priori très spécifique et très localisé, de ce travail qui pourrait interférer avec l'apparition des nécroses.
Toutefois, il convient de mentionner que, dans diverses communes, notamment à Fey (fig. 6 et 7), Cor et partiellement à Saxon et Charrat, les traitements antiparasitaires sont effectués collectivement par une même équipe qui utilise le même matériel et les mêmes bouillies fongicides ou insecticides sur toutes les parcelles. Or, dans tous ces secteurs à traitements collectifs, on rencontre aussi des parcelles fortement brûlées à côté de parcelles indemnes.
i °
o o
A.OJ.
O
O
O F. m O
(!)
O <3
Ö"!a
O | (
oj c — 1 —
1
A. 0,7- F 11 i
\ / / \ ! 9 S 8 3 O
» & 3 » A 2,6 - F 2i9
» » » 9
r i i ü ! j © J iO !
• 3 !
3 !
o o o o O O
A.02.
O O
O O O
o o o
FW
o o
O
Fig. 6. Fey, Météo. La parcelle Qui accuse de fortes brûlures du feuillage a été fumée avec un engrais combiné boriaué chloruré PK.B de formule 10.20.0,35. Les vergers contigus, indemnes, ont reçu des engrais mélangés sulfatés.
O O O O O o o Q c o
O O O O o o o o O o
© < 3 ( | ( 3 » i O O o O ° i o
© . © Q ( 5 » i O o O O 0
0 0 » o c » ! o O O O O A 20- F.2i2 I A.<0J - F. 11
9 0 ' ( » ( 5 < » i © 0 0 0 0 © a o o o i o o o o o
i
<5 O o © © ! O o o o _.x ._
Fig. 7. Fey, La Moudon. Vergers dans la zone des traitements antiparasitaires collectifs. Le propriétaire du verger de droite a apporté un mélange de scories Thomas et de sufate de potasse. Dans la parcelle de gatiche, fortement nécrosée, il n'a pas été possible de recontituer la fumure administrée.
150

Parmi tout l'arsenal des pesticides autorisés en Suisse, le fongicide Euparène, contenant 50% de dichlofluanide, est le seul produit fluoré dont l'utilisation est autorisée en arboriculture et en viticulture. 11 n'est d'ailleurs autorisé que depuis 1965 et son emploi reste encore limité à la vigne, en raison de son prix élevé. Le produit n'ayant pas été commercialisé avant 1966, les brûlures constatées au cours des années précédentes ne sauraient donc lui être imputées. De plus, dans les essais effectués, tant en Valais que dans le Bassin lémanique, FEuparène n'a jamais occasionné de brûlures sur le feuillage des abricotiers ou de la vigne. Il ressort de notre enquête que le produit Euparène n'a été utilisé dans aucune des quelque 70 parcelles examinées. A titre d'information, nous avons procédé à des analyses de la teneur en fluor de feuilles de vigne et de pommiers traités uniquement avec de l'Euparène. Les prélèvements ont été effectués dans les parcelles d'essais de fongicides de la Station fédérale d'essais de Lausanne, au Domaine de Changings sur Nyon, soit dans une zone non polluée par des émissions fluorées. Les résultats de ces dosages, exprimés en mg de fluor par kg de matière sèche (p.p.m.) sont rapportés au tableau 2.
Ces chiffres démontrent que, en dépit de traitements répétés à l'Euparène, la quantité de fluor apportée sur le feuillage de la vigne et des pommiers est bien inférieure aux teneurs trouvées en Valais sur le feuillage des abricotiers ou de la vigne dans les parcelles nécrosées. De plus, ils semblent indiquer que la dégradation des produits est rapide.
Tableau 2. Taux de fluor (en p.p.m.) de feuilles de vignes et de pommiers traitées à l'Euparène.
Traité Témoin
Vigne, prélevée 6 jours après le 4e traitement à l'Euparène 0,2 % Vigne, prélevée 29 jours après le 5e traitement à l'Euparène 0,2 % Pommier, prélevé 22 jours après le 10e traitement à l'Euparène 0,15 %
Influence de la fumure
Assez rapidement, au cours de l'enquête, il s'est avéré que la fumure jouait un rôle déterminant dans l'apparition des dégâts sur feuilles. De toutes les opérations cultu-rales, la fumure est certainement celle qui est la plus spécifique. Au contraire de la lutte antiparasitaire, qui est souvent collective, la tumure est toujours pratiquée individuellement. Dans les sols très perméables du coteau, le fumier de ferme est apporté en automne alors que les engrais chimiques sont distribués au printemps, sitôt après la fonte des neiges. L'épandage de l'engrais est le plus souvent effectué à la main. Il respecte les limites des propriétés, mais manque parfois de régularité dans la distribution au sein même de la parcelle, surtout là où les abricotiers ne sont pas alignés ou sont d'âges différents.
L'importance de la fumure est très bien mise en évidence dans le relevé de Bieudron (fig. 8). Les parcelles 1, 2, 5, 7, 9 et 10, qui sont fortement brûlées (A 2,0 à 3,0; V 2,5) et qui accusent une teneur en fluor élevée (268 à 524 p.p.m.), ont reçu au printemps
151
41,0 10,0 35,2
18,0 8,0 6,8
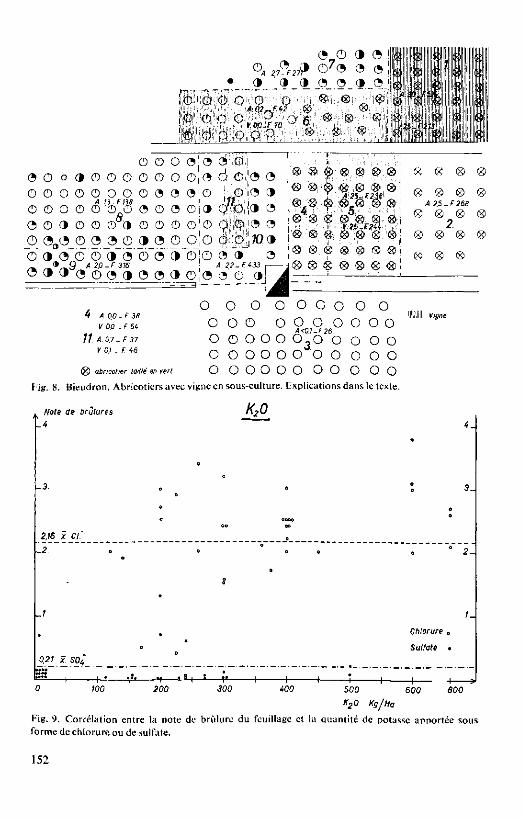
4 21. F 27"
,, „,_-_.„,?_._(l..
e o » » ! O 7 « O © | _<?_.<?_ 1._®J
O
o o © e j » a•0,1 O O o 3 0 0 0 0 0 0 0 , ^ 0 , O'.[(5 (5 o o o o o o o o a o » 1 © L,J®'.I® »
/i » . f u s I 'W • i^. _ O O O O O O O O O » Oi 3 Q " O i ^ ® 0 0 3 0 0 o'ci o o o o ' o c ü r1® ©
0 " 9 9 0 0 9 9 0 ( 5 9 0 ! 0 9 9 O » O A2P-F316 A22-F133
Ö 9 3 9 0 « » 0 ö » 0 9 ( 5 0 »
6;,: '.<S>''
® 9 ® ®
®,® ^4 „
£> ® ® » ( I «'IS-F 13& ™ ®_® ® (
® ® ® I
JST
® ® ® I
® ® ®
« ®
® ®
® ®
» ®
-F 268
® 2
f». A 0,0-F. 38
V 00 -F 54
77 /f 0 ,7- F 37
Y 0.1 . F 46
Fig. 8.
o o o o o c o o o o o o o o o o o o o
A<01-F 26
o o o o o o3o o o o o o o o o o o o o o o o
Ig) air/ccrf/er tol/e m rer( O O O O O O O O O O O Bieudron. Abricotiers avec vigne en sous-culture. Explications dans le texte.
Bill Vigne
Note de brûlures _4
-3 .
2,16 x Cl'
-2. 0
_/
021 x SOt,
lltSÄ 1 f - î ^ l l
• o
•
—*f-
o
0
o
1 « 1 1
e
oo
*
—V—
K20
0
1
o
ooeo oo
0
— i —
o
— 1 — — î
0
3-
0 0
° 2-
1-
Chlorure 0
Sulfate .
1 1 -1 s 100 200 300 400 600 500 600
K20 Kg/Ha
Fig. 9. Corrélation entre la note de brûlure du feuillage et la quantité de potasse apportée sous forme de chlorure ou de sulfate.
152

1967 un engrais composé de formule P.K.B. = 10.20.0,35 à raison de 2000 kg/ha. Les notes de brûlures des abricotiers n'ont pas pu être données à chaque arbre, car une partie d'entre eux avaient déjà été taillés en vert avant notre relevé. Les parcelles 4,6 et 11, qui n'ont reçu que du fumier de ferme, et le verger 3, sans fumure en 1967, sont pratiquement indemnes de brûlures.
Il ressort de notre enquête que l'apparition des nécroses foliaires est liée à un certain type d'engrais composés, dans lesquels la potasse est incorporée sous forme de chlorure. Pour leur part, les formules d'engrais contenant du sulfate de potasse ne provoquent pas d'accident. A la figure 9, nous avons reporté les notes de brûlures de chaque parcelle (abricotier et vigne) en fonction de la qualité d'engrais apportée à l'unité de surface, en séparant les engrais chlorurés des engrais sulfatés. Ce graphique montre que le feuillage des parcelles ayant reçu une fumure potassique chlorurée est dix fois plus nécrosé (note moyenne: 2,16) que celui des cultures où l'engrais potassique a été apporté sous forme de sulfate (note moyenne: 0,21). Une corrélation apparaît aussi entre l'intensité des brûlures foliaires et la quantité de potasse distribuée. Toutefois, cette corrélation n'est pas assurée statistiquement.
Les résultats de l'enquête sur les fumures sont résumés à la figure 10. Les parcelles sont groupées en classes selon le mode de fumure et la quantité de potasse distribuée à l'unité de surface. Pour chacune des classes, nous avons donné, en fonction de la forme de l'engrais potassique et de la nature de la culture, la note moyenne de brûlures (en haut) et la teneur moyenne en fluor (en p.p.m.) dans le feuillage (en bas). Devant chaque colonne, nous indiquons le nombre des parcelles d'abricotiers (A) ou de vigne (V).
Le graphique appelle les remarques suivantes : 1. Les parcelles de vigne ou d'abricotiers non fumées en 1967 ne présentent pas de nécroses foliaires et la teneur en fluor du feuillage est inférieure à 30 p.p.m. 2. La fumure organique sous forme de fumier de ferme ou de guano du Pérou ne provoque pas non plus de brûlures. La dose de fluor dans le feuillage tend toutefois à augmenter dans les échantillons prélevés. 3. Les fumures minérales provoquent des réactions très différentes selon que la potasse est apportée sous forme de chlorure ou de sulfate. Dans le 94% des cas avec potasse sous forme chlorurée, l'engrais a provoqué de fortes nécroses foliaires (note moyenne): 2,16) et le teneur des feuilles en fluor est en moyenne de 253 p.p.m. Les 93 % des parcelles fumées avec un engrais avec potasse sous forme de sulfate ne présentent aucune brûlure ou seulement quelques nécroses insignificantes (note moyenne: 0,21). La teneur moyenne du feuillage en fluor n'est que de 28 p.p.m. 4. L'analyse statistique des résultats montre que les différences obtenues avec les engrais avec potasse sous forme de chlorure ou sous forme de sulfate sont hautement significatives, tant en ce qui concerne la note moyenne de brûlures que la teneur en fluor du feuillage. 5. Les fumures chlorurées distribuées en automne ne provoquent ni brûlures ni augmentation du taux de fluor du feuillage. 6. On note une très bonne correspondance entre les taxations visuelles des brûlures du feuillage et les taux de fluor. Les nécroses sont d'autant plus vives que les teneurs en
153

4 Note de brûlures
3 i l Sans K 1 Sulfate de K
6 nombre de parcelles A- abricotier V. vigne
2,16 moyenne Chlorure 2 r
1
021 moy. Sulfate •
0. 1 6 2 A. V sans
fumure
6 2 A V
8 3 A. V
fumure organique
8 3 A. V.
°:ÏJLJ L 28 X SO^ I f
700.
1 6 4 11 A. A. V. V.
100.200 Kgj'Ha KsO
6 4 11 A. A. V. V.
1
200.
253 XCI'
300 •
,400. PPM fluor dans les le
2 3 A. A.
201-250
2 3 A A.
JU •
4 8 1 A. A. V.
251 . 300
4 3 7 A. A V.
1
. Chlorure de K
-] r i
• 9 2 A V
301 -400
9 2 A V
|
uilles.
2 1 A. A.
401 - 500
2 1 A. A.
•
-J
r i
5 2 A. V.
>5O0
5 2 A. V.
L
2 A.
'umure automne
2 A.
u
-
Fig. 10. Notes de brûlures et teneurs en fluor du feuillage en fonction de la nature de la fumure
distribuée.
154

Tableau 3. Relation entre le type de fumure et les brûlures par le fluor.
Engrais
1 2 3 4 5 6
7 8 9
10 11 12 13 14 15
Formulation
N
-5 -8 7
13
6 -4 4 -4
12 4 3
Sans fumure Engrais
P
10 8
13 8 7
13
13 8 8 7 9 6 6 6 6
organiques
K
20 15 26 18 17 27
11 18 12 12 24 10 20 12 12
seuls
Mg B
_ ---3 --3 -1 -1 ---
0,35 0,3 -------------
Forme du
sel de K
chlorure
sulfate
Nombre de
parcelles
19 11
3 2 2 2 2 2 1 1 1
8 11
Brûlures
(note moyenne)
2,54 1,92 2,70 2,10 0,50 0,0
0,0 0,0 0,3 0,0 0,1 0,0 0,7 0,0 1,3
0,0 0,0
Fluor
(moyenne p.p.m.)
339 136 344 188 29 18
47 16 13 15 11 29 11 26
138
23 35
fluor sont plus élevées. Dans le tableau 3, nous avons rapporté les notes moyennes de brûlures et les
quantités de fluor trouvées à l'analyse en fonction des types d'engrais utilisés. A l'exception des formules 5 et 6 pour les engrais chlorurés et du mélange 15 dans
les préparations sulfatées, il ressort de ce tableau 3 que l'apparition des brûlures est étroitement liée à l'emploi d'engrais composés contenant de la potasse sous forme de chlorure. Notons que les 3 exceptions mentionnées ne concernent que 3 parcelles sur un total de 71 cultures examinées.
Discussion
Les observations recueillies lors de notre enquête semblent bien établir le rôle important joué par la fumure dans les manifestations des immissions fluorées et l'intensité des dommages qu'elles provoquent.
Effectivement, les brûlures observées sur le feuillage ne peuvent être uniquement la conséquence d'une simple intoxication des racines par un excès de sels solubles dans le sol. Certes, les quantités d'engrais distribuées sont souvent exagérées, mais de tels excès se rencontrent aussi bien avec des formulations sulfatées que chlorurées. Par ailleurs, à Bieudron, à proximité des cultures représentées à la fig. 8, des nécroses foliaires sont apparues dans une plantation d'abricotiers, avec vigne en sous-culture, à la suite d'un épandage de 1000 kg/ha de cyanamide calcique. Toutefois, les nécroses du feuillage étaient morphologiquement différentes de celles qui se manifestaient dans les parcelles voisines nécrosées par les gaz fluorés. La teneur en fluor des feuilles des
155

parcelles à cyanamide n'atteignait par ailleurs que 28 p.p.m. pour l'abricotier et 32 p.p.m. pour la vigne.
Les engrais phosphatés sont plus ou moins riches en fluor. Les phosphates bruts en contiennent entre 0,38 et 6, 4% (Bredemann, 1956), suivant les provenances. Après traitement à l'acide sulfurique, les superphosphates récèlent encore entre 1,0 et 2,6% de fluor. De nombreux chercheurs se sont penchés sur le problème de l'assimilation par les plantes du fluor apporté par les engrais phosphatés ou sous forme de fluorures de sodium ou de calcium. Des quelque 30 travaux cités par Bredemann, il apparaît que certaines plantes sont en mesure d'absorber des quantités importantes de fluor lorsque les fumures sont excessivement riches en cet élément. C'est ainsi que l'on est parvenu à augmenter par une fumure à base de fluor la teneur en cet élément de 6,15 p.p.m. à 12,6 p.p.m. chez le cresson, de 4 à 170 p.p.m. dans l'herbe du Soudan et de 2 à 1100 p.p.m. pour le raygrass sans, toutefois, que des symptômes pathologiques n'apparaissent. Les résultats sont néanmoins rarement aussi spectaculaires et sont sujets à d'importantes variations suivant la nature du sol, son pH, sa teneur en Ca, Mg, P et N, ainsi que de la finesse de mouture de l'engrais, des conditions d'humidité et de température, etc.
Dans un essai en vases de végétation utilisant une dose de 0,6 g de fluor sous forme de NaF dans 6 à 7 kg de terre, Gericke et Kurmies (1955), ont provoqué une élévation du taux de fluor de 2,06 à 6,42 p.p.m. chez l'épinard et de 2 à 3 p.p.m. chez la salade. Sur la base de l'essai précédent, ces deux auteurs ont calculé que, pour obtenir une augmentation perceptible de la teneur en fluor des végétaux, il faudrait apporter 200 à 250 kg de fluor par ha (450 à 550 kg/ha de NaF) ce qui représenterait 12500 kg/ha d'un superphosphate dosant 1,6% F. En tenant compte d'un épandage annuel de 400 kg/ha de ce superphosphate, il faudrait attendre plus de 30 ans jusqu'à ce que l'enrichissement du sol en fluor soit de nature à déterminer un accroissement décelable de la teneur des végétaux en cet élément.
Les résultats les plus marquants ont été atteints dans les essais utilisant des apports de fluorures de calcium ou de sodium et non pas de superphosphates. Au surplus, les végétaux utilisés sont des plantes annuelles, alors qu'en Valais le problème se pose principalement pour la vigne et les abricotiers, plantes ligneuses et pérennes. Les concentration de fluor dans les plantes enregistrées lors de ces essais sont, à deux exception près, très inférieures à celles qui ont été mesurées en Valais. Par exemple, Gericke et Kurmies (1955), par une fumure au fluorure de sodium (NaF), ne parviennent à faire monter le taux de fluor dans de la salade que de 2 à 3 p.p.m. À Fey (fig. 6), sur cette même plante, nous avons décelé 1967 p.p.m. de fluor, alors que les feuilles des abricotiers de la même parcelle en contenaient 249 p.p.m.
Il est difficile de tirer une règle générale des travaux analysés par Bredemann (1956). Dans la grande majorité des expériences rapportées et dans les travaux plus récents de Garber (1966) et de Gisiger (1966), les augmentations de la teneur en fluor sont faibles, voire nulles. Dans deux cas seulement, sur herbe du Soudan et sur raygrass, les taux de fluor atteints par l'apport d'un fluorure sont de l'ordre de grandeur de ce que nous trouvons en Valais sur la vigne, l'abricotier ou la salade.
Dans les essais mentionnés ci-dessus, affectués avec du NaF ou du CaFo, les plantes
156

ne présentent pas de symptômes pathologiques, alors qu'en Valais, l'intensité des brûlures sur le feuillage va de pair avec la teneur en fluor de celui-ci.
Dans l'hypothèse d'une absorption notable du fluor par les racines, celle-ci devrait être sensiblement proportionnelle à la quantité d'engrais distribuée. Or, nous avons vu que ni l'intensité des brûlures, ni la teneur en fluor du feuillage ne dépendaient de la quantité d'engrais utilisée. D'autre part, les quantités de fluor décelées dans le sol sont relativement constantes et les variations observées ne sont pas en rapport avec l'intensité des brûlures.
Nous avons vu que, mises à part trois parcelles aberrantes sur un total de 71 cultures examinées, les nécroses foliaires n'apparaissaient que dans les plantations fumées avec un engrais composé contenant de la potasse sous forme de chlorure. Comme première hypothèse d'explication du phénomène, nous pouvons donc retenir l'action éventuelle de l'anion chlorure. On sait, en effet, que le chlore exerce un effet caustique sur un grand nombre de plantes. C'est, par ailleurs, un élément très mobile, qui est rapidement lessivé dans le sol, ce qui expliquerait pourquoi les applications automnales d'engrais à base de chlorure de potasse n'ont pas eu d'influence néfaste sur la végétation. On pourrait supposer que l'apport de fumures chlorurées serait de nature à déterminer certaines modifications du métabolisme conduisant à une fixation accrue du fluor atmosphérique par le feuillage.
Par ailleurs, en examinant le tableau 3, on observe que les formules d'engrais No. 1 et 2, les plus répandues, contiennent chacune un complément borique. En revanche, les formules No. 3 et 4 sont commercialisées avec ou sans adjonction de bore. Lors de notre enquête, les cultivateurs n'ont pas toujours pu nous indiquer si l'engrais qu'ils avaient utilisé contenait ou non du bore. Nous sommes, par contre, certains que tous les engrais à base de sulfate de potasse n'en contenaient pas. L'hypothèse d'une interaction entre le fluor et le bore peut dès lors être envisagée. Rohde (1953) signale d'ailleurs un antagonisme entre ces deux éléments dans le processus d'assimilation de l'acide phosphorique.
Les formules No. 1 à 5, à base de chlorure de potasse, proviennent toutes de la même fabrique, laquelle utilise pour la préparation des ses engrais phospho-potassiques un procédé de fabrication spécial, dit procédé 'Agrindus'. Les phosphates bruts utilisés, tunisiens ou marocains, sont mélangés au chlorure de potasse avant d'être attaqués par l'acide sulfurique. Il se pourrait que ce procédé de fabrication détermine la formation d'une substance non identifiée qui favoriserait l'apparition des nécroses foliaires. Mentionnons à ce propros, qu'au cours de nos essais de fumure sur abricotiers entrepris en 1966 et 1967 à Martigny, les mélanges d'engrais simples à base de sel dépotasse 60 % n'ont pas favorisé l'apparition des nécroses sur le feuillage.
La substance apportée par l'engrais pourrait, par exemple, stimuler les phénomènes de la transpiration ou la guttation du feuillage (Frey-Wyssling, 1949) et favoriser ainsi l'accumulation à la surface du limbe de sels minéraux capables d'absorber les gaz fluorés ou de s'y combiner. Pilet (1963) a démontré que la pénétration du fluor dans la feuille était facilitée par l'acide ß-indolyl-acetique. Par conséquent, toute substance agissant sur le métabolisme auxinique serait en mesure d'aggraver les effets des immissions fluorées. Dans l'état actuel de nos investigations, nous n'avons toutefois pas
157

pu mettre en lumière la nature du composant qui pourrait jouer un tel rôle dans le phénomène étudié.
Quel que soit le mode d'action de l'engrais, celui-ci n'agit qu'en présence de gaz fluorés présents dans l'atmosphère. Les engrais des catégories No. 1 à 5 (tableau 3) ne provoquent en effet aucune brûlure lorsqu'ils sont utilisés en-dehors des zones polluées par les gaz fluorés. En outre, ce phénomène n'est pas spécifique à l'abricotier et à la vigne, mais se manifeste sur toutes les plantes adventices sensibles au fluor et présentes dans la culture.
En résumé, les observations recueillies lors de notre enquête de 1967 en Valais, nous permettent d'affirmer qu'il y a une étroite relation entre la fumure distribuée et l'intensité des dommages déterminés par les immissions fluorées. Le mécanisme de cette action ne nous est pas encore connu. Cependant, nous avons retenu trois hypothèses d'interférences possibles : les chlorures, le bore et, éventuellement, une substance non identifiée, spécifique aux engrais obtenus par le procédé 'Agrindus'. Les recherches se poursuivent activement dans ces trois directions selon un programme d'essais en laboratoire et en plein champ établi en commun par les Stations fédérales de Lausanne et de Liebefeld/Berne.
Summary Interaction between fertilization and the damaging effect of fluorides, especially in apricot orchards
The central Valais region, from Viège to Vernayaz, is exposed to fluorine containing exhausts from three aluminium factories and a fertilizer factory. The question has arisen if the canker on the foliage of apricot trees and vines, as noted on some estates in the neighbourhood is caused by these emissions, although other farms in the same area have shown few or no burns and this phenomenon has been observed in plantations near the factories as well as at distances some ten or even twenty kilometres away.
In certain zones, where the majority of apricot trees are healthy, certain orchards show heavily damaged foliage Cone third to three quarters of the leaves with canker). A chemical analysis has shown a fluorine content in the foliage of affected orchards varying between 200 and 600 p.p.m., whereas it is not higher than 15 to 50 p.p.m. in adjacent unaffected stands. The same phenomenon is found in vines. The perimeters of the burned areas correspond precisely to the limits of the estates.
To find the cause of this outspoken difference in reaction to a relatively uniform pollution, in 1967 soil investigations have been carried out and a comparison has been made between the applied methods of cultivation on 80 plots.
It has been shown that neither the physical nor the chemical composition of the soil (application of fertilizers, lime and fluorine content, pH) nor the use of pesticides has played any part. But investigations on the applied fertilizers has given interesting results : 1. Land with vines or apricot trees to which no fertilizer was applied, or which only received organic manure (from the farm, or guano) showed no canker, and the average fluorine content of the leaves was only 29.8 p.p.m.
158

2. Where mineral fertilizers had been applied in spring, the reaction differed greatly between the addition of potassium in the form of chloride or sulfate. In 94% of the cases where the fertilizer contained potassium chloride, the treatment caused severe canker, and the average fluorine content of the leaves was 253 p.p.m. In 93 % of the area treated with fertilizers containing potassium in the form of sulphate no burning or simply a few insignificant cankers occurred; here the average fluorine content of the foliage was only 28 p.p.m. 3. Potassium chloride containing fertilizers applied in autumn caused no burning. 4. The quantity of fertilizer applied per unit of area was less important than the type of potassium in the fertilizer.
The Federal Laboratories of Lausanne and Liebefeld-Berne are now trying to find an explanation of the interaction between fertilizers and cankers due to fluorine gases.
Zusammenfassung Beziehung zwischen Düngung und Fluorschäden, besonders in Aprikosenanlagen
Das Gebiet des Wallis zwischen Visp und Vernayaz wird von Abgasen dreier Aluminiumwerke und einer Düngemittelfabrik betroffen. Seit einigen Jahren beobachtet man in einigen Aprikosenkulturen und Weingärten schwere Blattnekrosen, während benachbarte Kulturen keine oder nur geringe Schäden aufweisen. Dieses Phänomen wird sowohl nahe am Ort der Emission wie bei solchen in 10 bis 20 km Entfernung beobachtet. Immer ist die Mehrzahl der Aprikosenbäume gesund und nur einige weisen Bäume auf deren Blätter zu 1/3 bis 3/4 nekrotisiert sind. Der Fluorgehalt der Blätter in diesen geschädigten Kulturen ist sehr hoch (zwischen 200 und 600 p.p.m.), wogegen die nichtgeschädigten Parzellen nur 15-50 p.p.m. aufweisen. Das gleiche Phänomen zeigt sich bei den Rebgärten. Die geschädigten Zonen entsprechen Eigentumsgrenzen.
Die in 1967 angefangenen Untersuchungen hatten zum Ziel bei gleichen Schädigungsmöglichkeit die Abhängigkeit der Schädigung vom Besitzstand der Felder zu ermitteln. Es wurden dazu 80 Parzellen untersucht auf physikalische und chemische Eigenschaften des Bodens wie Gehalt an Nährstoffen, Kalk, Fluor, pH, Insektizide, ohne daß sich ein Zusammenhang mit den Nekrosen finden ließ. Im Gegensatz hierzu brachte die Erhebung über die angewendeten Düngerstoffe wichtige Feststellungen : 1. Die 1967 nicht gedüngten Wein- und Aprikosenparzellen oder die nur mit Stallmist oder Guano gedüngten Parzellen zeigten keine Blattschäden; der Fluorgehalt der Blätter war im Mittel 29,8 p.p.m. 2. Wo im Frühjahr Mineraldünger gegeben worden war, so war die Auswirkung sehr verschieden, je nachdem Kali als Chlorid oder Sulfat vorlag. In 94% der Fälle verursachten Kaliumchlorid enthaltende Dünger schwere Blattschädenund einen Fluorgehalt von im Mittel 253 p.p.m. In 93 % der mit Kaliumsulfat enthaltenden Düngern gedüngten Parzellen zeigten sich keine Verbrennungen und nur einige unbedeutende Nekrosen. Der Fluorgehalt war bei 28 p.p.m. 3. Der im Herbst gegebene Kaliumchlorid enthaltende Dünger verursachte keine Blattschäden. 4. Die Menge des pro Flächeneinheit gegebene Düngers ist von geringerer Bedeutung
159

als die Art des Kaliums im Dünger. Gegenwärtig beschäftigen sich die Forschungsanstalten in Lausanne und Liebefeld
mit der Deutung der Zusammenhänge von Art der Düngung und Entstehung der Nekrosen.
Bibliographie
Bolay. A. et E. Bovay. 1965a. Phytopath. Z. 53: 289-98. Bolay, A. et E. Bovay. 1965b. Agric. romande4, Série A: 43-6. Bovay, E. 1954. Annls agric. Suisse 55:915-1047. Bovay, E. 1958. Annls agric. Suisse 59: 541-4. Bovay, E. et A. Bolay. 1965. Agric. romande4, Série A: 33-6. Bredemann, G. 1956. Biochemie und Physiologie des Fluors. Berlin. Frey-Wyssling. A. 1949. Stoffwechsel der Pflanzen. Zürich. Garber, K. 1966. Landw. Forsch. 20, Sonderh.: 116-8. Gericke, S. et B. Kurmies. 1955. Phosphorsäure 15: 50-63. Gisiger, L. 1966. Schweiz, landw. Mh. 44: 221-30. Oelschläger, W. 1962. Z. analyt. Chem. 191: 408-16. Pilet. P.-E. 1963. Ber. Schweiz, bot. Ges. 73: 58-92. Rohde, G. 1953. Dt. Landwirt. 4: 136-8. Réf. dans Bredemann (1956).
160

Biochemical effects of peroxyacetyl nitrate and ozone
J. B. Mudd
Department of Biochemistry and Air Pollution Research Center, University of California, Riverside, California, USA
Abstract
The main reaction of peroxyacetylnitrate with proteins is with the sulf hydryl group of the cysteine residue. Disulfide bonds are relatively unaffected. There is some oxidation of methionine to methionine sulfoxide, but all other amino acids are resistant. Oxidation of amino acids by ozone is much less specific. Cysteine, methionine, tryptophan, histidine, tyrosine, phenylalanine and cystine are all oxidized to a greater or lesser extent. Consequently, some enzymes, such as ribonuclease, are resistant to peroxyacetylnitrate, but susceptible to inactivation by ozone.
The physiological symptoms of plant damage by ozone and by peroxyacetylnitrate, both common in automobile exhausts, are quite different. From anatomical or physiological observations of damage by air pollutants it is rather difficult to know which effects are primary and which are secondary. Since the physiological effects of ozone and peroxyacetylnitrate are so different, one would not expect that their modes of toxicity depend only on oxidation reactions. As an oxidizing compound, ozone is more powerful, but peroxyacetylnitrate has, in addition to its oxidizing property, the capability of acetylation reactions, a consequence of its anhydride structure.
An attempt has been made to find out the difference in the chemical reactivity of ozone and peroxyacetylnitrate with a relatively well defined group of biochemicals, proteins and amino acids. From the results obtained with this relatively well defined chemical system it seems possible to make estimates of the relevance of the observed reactions to the physiological situation.
Methods
Peroxyacetylnitrate was prepared according to the methods of Stephens et al. (1961). It was stored under pressure at 4 C, diluted with nitrogen. The use of peroxyacetylnitrate in the experiments described below depended on bubbling the gas from a capillary tip through the solution tested. The amount of peroxyacetylnitrate which had dissolved in the solution was determined at the end of the reaction period by assaying an aliquot of the solution for nitrite (Snell and Snell, 1936, p. 644), which is one of the degradation products.
Ozone was generated in a silent electric discharge apparatus. Pure oxygen was passed through the apparatus at a flow of 20 ml/min and the concentration of ozone was then
161

controlled by variation in the applied high voltage. The ozone-oxygen mixture was used in the reactions with amino acids and proteins by bubbling the gas through buffered solutions of the test compounds. The concentration of ozone was determined by bubbling the ozone-oxygen mixture through a buffered potassium iodide solution, and measuring the liberation of iodine spectrophotometrically.
Hydrolysis of proteins was at 110° in 6N HCl and assay of amino acids was conducted by ion exchange chromatography. A Beekman 120B amino acid analyzer was used for the separation and quantitative determination of the amino acids.
Results and discussion
Peroxyacetylnitrate
Some of our earlier experiments on the inhibition of enzymes by peroxyacetylnitrate implicated the sulfhydryl group as particularly susceptible to reaction with peroxyacetylnitrate (Mudd, 1963). The circumstantial evidence obtained in this work was followed by a direct study of the reaction of peroxyacetylnitrate with glutathione (Mudd, 1966). This study showed that three -SH groups react per molecule of peroxyacetylnitrate, and that the products of the reaction were disulfide and S-acetylgluta-thione. Thus both the properties of oxidation and of acetylation are manifested in this reaction. However, it is not possible to make the general statement that both oxidation and acetylation always play a role in the reaction of peroxyacetylnitrate with sulfhydryl compounds. Recently we have examined the reaction of peroxyacetylnitrate with coenzyme A. The major product is the coenzyme A disulfide, but no S-acetyl coenzyme A was formed. A number of minor compounds are produced which have not yet been identified. The distribution of products of reaction of coenzyme A with peroxyacetylnitrate, as judged by separation on DEAE cellulose (Moffat and Khorana, 1961), is closely comparable to the distribution of products obtained when coenzyme A is reacted with hydrogen peroxide.
As far as proteins are concerned, it is relatively easy to demonstrate that the sulfhydryl groups react with peroxyacetyl nitrate (Mudd et al., 1966). The sulfhydryl groups of human hemoglobin are differentially accessible to such reagents as p-mer-curibenzoate, depending on the pH of the solution : two sulfhydryl groups are accessible at pH 7 whereas six are accessible at pH 4.5. Exactly the same differential accessibility is observed when peroxyacetylnitrate is used rather than p-mercuribenzoate. Steric considerations would suggest that disulfide formation in human hemoglobin would be unlikely, on the other hand attempts to detect thioesters have also been unsuccessful.
Is the sulfhydryl group the only part of the protein molecule susceptible to oxidation by peroxyacetylnitrate? Amino acid analysis of a protein after treatment with peroxyacetylnitrate shows only a change in the cysteine residue. There is an apparent production of cysteic acid, though in some cases this may have come from cystine rather than cysteine. In the case of ribonuclease, an enzyme which has four disulfide bonds per molecule, and no sulfhydryl groups, no enzyme inactivation was observed even after the treatment of the protein with a three hundred fold molar excess of peroxyacetyl-
162

nitrate (Mudd et al., 1966). It may be concluded that the reactions of peroxyacetyl-nitrate with disulfides is of negligible importance. Only one other amino acid residue may be susceptible to oxidation by peroxyacetylnitrate, and that is methionine. When solutions of methionine are treated with peroxyacetylnitrate, methionine sulfoxide is formed. During the hydrolysis of proteins methionine sulfoxide revents to methionine (Ray and Koshland, 1960). Thus the formation of methionine sulfoxide has not been observed in the cases where proteins have been treated with peroxyacetylnitrate. The possibility can not be eliminated at the moment that some enzyme inactivation by peroxyacetylnitrate is due to oxidation of the methionine residue.
Ozone
The reaction of ozone with amino acids and proteins is much more extensive than the reaction of peroxyacetylnitrate (Mudd, 1967). Cysteine and methionine are readily oxidized by ozone, but in addition tryptophan, histidine, tyrosine, cystine, and phenylalanine are also susceptible. In the case of methionine the oxidation product is exclusively methionine sulfoxide, but in other cases, such as histidine and tryptophan, the products are numerous and not yet characterized. These reaction products can possibly be formed from the free amino acid pools in plants and animals and may be responsible themselves for toxic reactions.
The greater range of reaction of ozone, as compared to peroxyacetylnitrate, is exemplified in the reaction with pancreatic ribonuclease. Whereas pancreatic ribonu-clease is resistant to peroxyacetylnitrate, it is indeed susceptible to inactivation by ozone. Amino acid analysis of the inactivated ribonuclease shows that the inactivation is correlated with the destruction of several amino acids, the most notable being histidine and tyrosine. It has been determined that the histidine residues of pancreatic ribonuclease are lesponsible for the enzymatic activity.
In the case of the protein avidin, the binding of biotin depends on the tryptophan residues of the protein (Green, 1963). Since tryptophan is one of the amino acids susceptible to oxidation by ozone, the inhibition of the ability of ozone treated avidin to bind biotin has been tested. The decrease in biotin binding is correlated with the destruction of the tryptophan residues.
Physiological tests
The incorporation of radioactive acetate into lipids and non-volatile water soluble acids (citric and glutamic acids), catalyzed by spinach chloroplast preparation, was inhibited by peroxyacetyl nitrate (Mudd and Dugger, 1963). The incorporation into lipid was inhibited more than the incorporation into the non-volatile acids. This result is comparable with the observation that classical reagents for sulfhydryl groups have the same preferential inhibition of lipid synthesis (Mudd and McManus, 1964). Thus the suggestion that the mode of toxicity of peroxyacetylnitrate is by reaction with sulfhydryl groups is supported. In recent experiments, the chloroplast system has also been tested with ozone, and again the lipid synthesis was much more susceptible
163

than the synthesis of organic and amino acids. In this case, peroxyacetylnitrate and ozone are not different, so it appears that this semi-physiological test is not adequate for explaining the differences between ozone and peroxyacetylnitrate toxicity.
Résumé Les effets biochimiques du peroxyacetyl nitrate et ae l'ozone
Parmi les polluants atmosphériques oxydants provenant des gaz d'échappement des automobiles, deux des plus communs sont l'ozone et le peroxyacetyl nitrate. Les symptômes habituels des dommages causés aux plantes par ces composés toxiques sont bien attestés et il existe en outre un certain nombre d'études physiologiques à ce sujet. Dans le cas de l'ozone toutefois, les résultats de ces études n'ont pas révélé, de la part du polluant, un point d'attaque prédominant. Les études physiologiques effectuées sur le peroxyacetyl nitrate sont assez avancées pour révéler que le mode de toxicité ne saurait être le même que celui de l'ozone, bien que tous les deux soient des oxydants. En raisons des difficultés qu'il y a à déterminer par les études physiologiques l'effet toxique dominant de l'ozone et du peroxyacetyl nitrate, nous avons décidé d'utiliser une méthode différente. Cette méthode consiste à étudier les réactions de l'ozone et du peroxyacetyl nitrate en présence de composés biochimiques purs, puis à évaluer l'importance physiologique des réactions observées. Les réactions des polluants en présence de protéines ont été particulièrement étudiées puisque les enzymes font partie de ce groupe. Comme les enzymes agissent par catalyse en petite quantité, l'inactivation d'une molécule d'enzyme par l'ozone ou le peroxyacetyl nitrate exercerait sur l'organisme un effet considérablement multiplié.
La réaction du peroxyacetyl nitrate en présence de protéines est relativement simple. La réaction de loin la plus importante est celle qui se produit avec les groupes de sulfhydryl. Avec des composés modèles tels que le glutathione, on peut observer une transformation en bisulfure par oxydation et il se forme en outre du 5-acétyl glutathion. Dans le cas des protéines on mesure aisément la réaction des groupes sulfhydryl en présence de peroxyacetyl nitrate, mais la nature chimique du produit n'a pu encore être déterminée. Le peroxyacetyl nitrate n'affecte pas les bisulfures.
C'est ainsi que les enzymes, qui n'ont pas de groupe sulfhydryl libre mais dont la structure tertiaire se maintient grâce aux bisulfures, résistent parfaitement au peroxyacetyl nitrate. La ribonucléase pancréatique entre dans cette catégorie.
La réaction des protéines en présence d'ozone est beaucoup plus étendue qu'en présence de peroxyacetyl nitrate. Les résidus de cysteine, de methionine, de tryptophan, de tyrosine, d'histidine et de cystine sont tous sensibles à divers degrés. La ribonucléase pancréatique, tout en résistant au peroxyacetyl nitrate, s'oxyde facilement sous l'effet de l'ozone. L'inactivation de la ribonucléase pancréatique par l'ozone est liée à la destruction des résidus d'histidine.
164

Zusammenfassung Biochemische Effekte von Peroxyacetylnitrat und Ozon
Zwei der am meisten vorkommenden oxidierenden Luftverunreinigungen in Automobilabgasen sind Ozon und Peroxyacetylnitrat. Die Symptome der dardurch verursachten Pflanzenschaden sind gut bekannt. Die physiologischen Studiend haben im Falle des Ozons jedoch nicht angegeben, wo genau die Verunreinigung angreift ; beim Peroxyacetylnitrat hat man gezeigt, daß die Giftigkeit von PAN sich in einer anderen Art und Weise auswirkt als die des Ozons, wenn auch beide Stoffe oxydative Wirkung haben.
Wegen der Schwierigkeiten beim Bestimmen eines primären toxischen Effekts des Ozons und des Peroxyacetylnitrats wurde das Problem von einer anderen Seite angefaßt : es wurden die Reaktionen von Ozon und von Peroxyacetylnitrat mit reinen biochemischen Stoffen nachgeprüft und es wurde festgestellt, welche Bestimmung und welchen physiologischen Wert die obengenannten Reaktionen haben. Ins besonderen sind Reaktionen der Verunreinigungen mit Proteinen studiert worden weil Enzyme in dieser Gruppe gehören. Da die Enzymen katalytisch reagieren in geringen Quantitäten, würde Inaktivation eines Enzymmolekuls durch Ozon oder Peroxyacetylnitrat einen weit ausgedehnten Effekt auf den Organismus ausüben.
Die Reaktionen des Peroxyacetylnitrats mit Proteinen sind relativ einfach. Die weitaus wichtigste ist diejenige mit Sulfydrylgruppen. Mit Glutathion, zum Beispiel, kann die Oxydation zu Disulfid beobachtet werden, und weiterhin die Bildung von 5-acefylglutathion. Im Falle der Proteinen, kann die Reaktion der Sulfhydrylgruppen mit Peroxyacetylnitrat leicht gemessen werden; die chemische Natur der Produkte ist aber noch nicht aufgeklärt worden.
Die Disulfiden werden nicht vom Peroxyacetylnitrat angegriffen. Enzyme, welche keine freie Sulfhydrylgruppen haben, aber deren tertiäre Struktur durch Disulfide-bindungen aufrecht erhalten wird, sind daher sehr widerstandsfähig gegen Peroxyacetylnitrat. Ribonuklease aus dem Pankreas gehört zu dieser Art Enzymen.
Die Reaktion der Proteinen mit Ozon ist viel mehr umfassend als die mit Peroxyacetylnitrat. Die Residuen von Cystein, Methionin, Tryptophan, Tyrosin, Histidin und Cystin sind alle in gewissem Maße empfindlich. Ribonuklease aus dem Pankreas ist resistent gegen Peroxyacetylnitrat, dagegen empfindlich für Oxydation durch Ozon. Inaktivation der Ribonuklease aus dem Pankreas durch Ozon geht zusammen mit Abbau der Histidinresiduen.
References
Green. N. M. 1963. Biochem. J. 89: 599. Moffat. J. G. and M. G. Khorana. 1961. J. Am. ehem. Soc. 83: 663. Mudd, J. B. 1963. Archs Biochem. Biophys. 102:59. Mudd, J. B. 1966. J. biol. Chem. 241: 4077. Mudd, J. B. 1967. Proc. int. Congr. Biochem., Tokyo. Mudd, J. B. and W. M. Dugger Jr. Archs Biochem. Biophys. 102: 54. Mudd. J. B.. R. Leavitt and W. H. Kersey. 1966. J. biol. Chem. 241: 4081.
165

Mudd, J. B. andT. T. McManus. 1964. PI. Physiol., Wash. 39: 115. Ray Jr., W. J. and D. E. Koshland. 1960. Brookhaven Symp. Biol. 13: 135. Snell, F. D. and C. T. Snell. 1936. Colorimetric methods of analysis. Princeton, New Jersey. Stephens, E. R., E. F. Darley, O. C. Taylor and W. E. Scott. 1961. J. Air Wat. Pollut. 4: 79.
166

Zur Aufklärung der Schädigungen von Pflanzen durch Teerdämpfe
G. Halbwachs
Botanisches Institut der Hochschule für Bodenkultur, Wien, Österreich
Kurzfassung
Begasungsversuche an Kartoffelpflanzen zeigen, daß aus Teer gewonnene Reinstoffe nur schädigen, wenn sie ein kondensiertes Dreiringsystem in einer Ebene enthalten, wie Acridin, Anthra-cen und Fluoranthen. Die schädigenden Substanzen werden erst unter dem Einfluß von Sonnenlicht gebildet, was auf photochemische Prozesse hinweist. So bildet Anthracen Peroxide oder die entsprechenden Chinone. Trotz sehr ähnlicher chemischer Konstitution schädigen Phenanthren, Acen-aphthen und Chrysen die Pflanzen nicht, da ihre Anregungsmaxima unter 300 nm liegen, ein UV-Bereich, der im Sonnenlicht nicht mehr enthalten ist.
Für die Versprödung teergeschädigter Blätter ist kein Anstieg der osmotischen Zustandsgrößen verantwortlich, sondern die abgestorbene, vertrocknete Epidermis.
Durch Antioxydantien kann die schädigende Wirkung von Teerdämpfen wesentlich herabgesetzt werden.
Gewisse Erfahrungen mit Schädigungen von Pflanzen durch Teerdämpfe sind seit dem Ende des 19. Jahrhunderts bekannt. In einer vorgehenden Veröffentlichung (Halbwachs, 1967) ist die einschlägige ältere Literatur schon berücksichtigt und die Grundlage für weitere Untersuchungen dargestellt worden. Eine kurze Zusammenfassung der gichtigsten Ergebnisse lautet wie folgt : 1. Schädigungen an Pflanzen werden nur durch gasförmige Teerprodukte hervorgerufen; feste Teerprodukte sind unwirksam. 2. Die typischen Symptome einer Teerdampf beschädigung bestehen in graugrünen, braunen und schwarzen Verfärbungen der Blattflächen. Zusätzlich tritt häufig ein auffallender Glanz auf, der als Silber- oder Bronzeglanz beschrieben wird. Teergeschädigte Blätter sind ferner oft besonders spröde. 3. Die Wirkung der Teerdämpfe ist vom Spaltöffnungszustand unabhängig, da es sich um eine Kontaktwirkung der an den Blattoberflächen niedergeschlagenen Tröpfchen handelt, die zu Ätzschädigungen führen. 4. Durch Begasungsversuche mit verschiedenen Fraktionen von Weichpech konnte erwiesen werden, daß der Hauptanteil der schädigenden Substanzen zwischen 100 C und etwa 300 C in die Dampfphase übergeht. 5. Entscheidend dafür, ob Schädigungen an Pflanzen nach Teerbegasungen auftreten, ist die Einwirkung kurzwelliger Strahlen. Im Freiland ist die Intensität der Schädigungen daher stark vom Wetter abhängig. 6. Bei der Einwirkung von Teerdämpfen auf Pflanzen verlaufen bestimmte Teil-
167

reaktionen in fast derselben Weise wie bei der Bildung von 'smog' in den USA. Auf die Verhinderung der schädigenden Wirkung der Teerdämpfe durch Antioxydantien wird hingewiesen.
Weitere experimentelle Untersuchungen, die in Zusammenarbeit mit Frau Dr. H. Hla-watsch durchgeführt wurden, schlössen sich an. Diese dienten erstens der Klärung der bis dahin noch offenen Frage, welche chemischen Bestandteile der Teerdämpfe für die Schädigungen verantwortlich sind. Zweitens sollte erwiesen werden, ob die schädigenden Stoffe schon ursprünglich im Teer vorhanden sind oder erst sekundär unter dem Einfluß von ultravioletter Strahlung entstehen. (Die bisherigen Untersuchungen sprechen für die zweite Möglichkeit, doch sollte dies noch durch entsprechende Versuche erhärtet werden). Drittens wurde näher untersucht, ob der charakteristischen Ver-sprödung teergeschädigter Blätter eine wesentliche Turgorsteigerung zugrunde liegt, oder ob es dafür andere Ursachen gibt. Viertens wurde die Verhinderung oder Ab-schwächung von Teerschädigungen durch Antioxydantien experimentell überprüft.
Da sich Solanum tuberosum, Sedum spectabile und Phaseolus vulgaris als besonders günstige Objekte für Teerbegasungsversuche erwiesen hatten, wurden diese Pflanzen auch zu den meisten Versuchen herangezogen.
Aus Vorversuchen war bekannt, daß der schädigende Bereich von Teerdämpfen zwischen 100 C und 300°C liegt. Im Teer ist aber eine sehr große Anzahl von Kohlenwasserstoffen enthalten, die sich in ihren Schmelz- und Siedepunkten gegenseitig zu beeinflussen vermögen, so daß es durch fraktionierte Destillation nicht möglich war, Reinsubstanzen zu erfassen, da dabei stets mit Vielstoffgemischen zu rechnen war. Es wurden daher verschiedene aus Teer gewonnene Reinstoffe im Hinblick auf ihre pfianzenschädliche Wirkung in Begasungsversuchen getestet.
Die Versuchspflanzen wurden wie die mit Teer begasten Kontrollpflanzen nach der Begasung dem Sonnenlicht ausgesetzt. Folgende Kohlenwasserstoffe wurden verwendet: Acenaphthen, Acridin, Anthracen, Carbazol, Chrysen, Fluoranthen, Fluoren, Naphthalin und Phenanthren. Die besondere Schwierigkeit bei der Begasung mit Reinstoffen liegt darin, daß einige bei Temperaturen um 150 C sublimieren und dann als grosse Kristalle den Blättern lose aufliegen. Sie können in dieser Form nicht mit dem normalen Teer verglichen werden, bei dem mikroskopisch kleine Tröpfchen in unmittelbarem Kontakt mit der Epidermis stehen. Im Glycerin wurde aber eine Substanz mit hohem Siedepunkt gefunden, die für die Pflanzen völlig unschädlich ist, in der sich die Reinstoffe lösten. Gemische von Glycerin und Reinstoffen verhielten sich bei der Verdampfung wie normaler Teer und blieben in Form mikroskopisch kleiner Tröpfchen auf der Blattoberfläche zurück.
Nur Acridin, Anthracen und Fluoranthen erwiesen sich als schädigend. Die Symptome entsprachen den typischen Teerschädigungssymptomen. Diese drei Stoffe sind durch eine sehr ähnliche chemische Konstitution gekennzeichnet, nämlich durch ein kondensiertes Dreiringsystem in einer Ebene.
Auf Grund dieses positiven Versuchsergebnisses wurden noch einige weitere Acene bzw. Anthracenverbindungen auf ihre schädigende Wirkung untersucht, und zwar: Phenazin, Xanthen, 2-Methylanthracen, 9-Methylanthracen und 9,10-Dihydroanthra-cen. Auch diese Substanzen riefen Schädigungen hervor, die allerdings nicht auf die
168

Epidermis beschränkt blieben, sondern oft tief in das Mesophyll hineinreichten. Da mit Ausnahme von Phenazin, Xanthen und 2-Methylanthracen, alle unter
suchten Substanzen nur im Sonnenlicht schädigten, wurde, ausgehend von der sehr ähnlichen chemischen Konstitution dieser Stoffe untersucht, welche chemischen Veränderungen unter UV-Einfluß möglich sind. Damit im Zusammenhang steht aber gleichzeitig die Frage, ob die schädigenden Stoffe von vornherein im Teer enthalten sind oder erst unter dem Einfluß des Sonnenlichtes gebildet werden.
Teerbegaste Pflanzen, die im Glashaus aufgestellt wurden, dessen Wände den UV-Anteil des Sonnenlichtes absorbierten, zeigten niemals Schädigungen. Die auf der Epidermis niedergeschlagenen Tröpfchen konnten im Fluoreszenzmikroskop aber noch bis rund 5 Wochen nach der Begasung beobachtet werden. Wurden die Pflanzen innerhalb dieser Zeitspanne ins Freie gebracht und der Sonne ausgesetzt, dann traten nach kurzer Zeit die typischen Schädigungen auf. Durch diese Versuche war es aber noch nicht klar geworden, ob die schädigenden Stoffe noch an die Teertröpfchen gebunden oder schon in die Blätter diffundiert waren und erst dort unter dem Einfluß des Sonnenlichtes ihre Wirksamkeit erhielten. Es wurden daher von begasten Pflanzen, die bereits 14 Tage im Glashaus aufgestellt waren und keine Schädigungen zeigten, bei einer Reihe von Blättern die Teertröpfchen örtlich durch Abziehen mit einem Klebeband entfernt und dann die Pflanzen im Freien dem Sonnenlicht ausgesetzt. An den Stellen, wo die Tröpfchen entfernt worden waren, blieben jegliche Schädigungen aus, während die übrigen Blattpartien geschädigt waren. Damit ist der Beweis erbracht, daß die schädigenden Stoffe bzw. ihre Vorstufen noch nicht in das Blatt diffundiert waren und daß sie auch in den Tröpfchen selbst noch nicht vorhanden sind, sondern erst under dem Einfluß des direkten Sonnenlichtes entstehen.
Bei der Beobachtung der Tröpfchen im Fluoreszenzmikroskop konnte festgestellt werden, daß unter dem Einfluß von UV-Licht Veränderungen der Tröpfchen hinsichtlich ihres Fluoreszenzverhaltens eintraten. Nun ist aus der chemischen Literatur bekannt, daß Anthracen unter dem Einfluß von Sonnenlicht ein Peroxid zu "bilden vermag (Schönberg, 1958). Auch andere Acene sind befähigt, auf photochemischem Weg Peroxide oder die entsprechenden Chinone zu bilden, wobei diese Reaktionen noch nicht so gut untersucht sind wie die des Anthracen. Überraschend war bei der Prüfung der Reinstoffe, daß manche wie Phenanthren, Acenaphthen und Chrysen, die auf Grund ihrer Struktur ebenfalls zur Peroxid- oder Chinonbildung befähigt erscheinen, keinerlei Schädigungen an Pflanzen hervorriefen.
Eine Erklärung dafür fand sich beim Vergleich der Wellenlängenabsorptionsmaxima der einzelnen Substanzen. Es schädigten nur jene Kohlenwasserstoffe, deren Absorptionsmaxima im Bereich des sichtbaren oder langwelligeren UV-Lichtes liegen. Diese Substanzen konnten daher auch durch den im natürlichen Sonnenlicht enthaltenen UV-Anteil angeregt werden, der bei etwa 300 nm aufhört, da niedrigere Wellenlängen durch die Ozonwolke der höheren Atmosphäre völlig absorbiert werden (Stern, 1962).
Ein typisches Symptom nach Einwirkung von Teerdämpfen auf Blätter ist deren Versprödung. Diese äußert sich z.B. bei Solanum und Sedum derart, daß die Blätter beim Zusammenfalten mit einem knackenden Geräusch brechen. Vergleichende
169
kryoskopische Untersuchungen der osmotischen Zustandsgrößen ungeschädigter und teergeschädigter Blätter von Sedum und Solanum ergaben nun keine Unterschiede in der Größe der osmotischen Werte. Ein Turgoranstieg konnte demnach als Ursache der Sprödigkeit ausgeschieden werden. Mikroskopische Untersuchungen ergaben vielmehr, daß diese Versprödung nur auf die abgestorbene und vertrocknete, dem Mesophyll dicht aufliegende Epidermis zurückzuführen ist. Bei Sedum wird die abgestorbene Epidermis außerdem sehr rasch durch ein Korkgewebe ersetzt, das sich leicht mittels eines aufgeklebten Streifens abziehen läßt. Nach Entfernung des Korkgewebes zeigte das verbleibende saftige Blattgewebe keine Spur der Versprödung mehr und verhielt sich wie in normalen Blättern.
Da, ähnlich wie beim 'smog', auch den Teerschädigungen photochemische Prozesse zugrunde liegen, wares naheliegend, den Einfluß von Antioxydantien auf das Schädigungsausmaß zu untersuchen. Bei den in den USA durchgeführten entsprechenden 'smog'-Versuchen hatten sich Dithiocarbamate, und zwar Mangan- und Zinkäthylen-bisdithiocarbamat (kurz Maneb und Zineb genannt) als sehr wirksam erwiesen (Ordin et al., 1962). Für die eigenen Versuche wurden die gleichen Präparate verwendet, aber nicht rein, sondern in der handelsüblichen Form als Fungicide. Die Präparate Fuclasin Ultra, Maneb und Dithane M45 wurden sowohl als Spray als auch in fester Form aufgebracht. Vergleichende Begasungsversuche mit Bohnen- und Kartoffelpflanzen, bei denen diese Pflanzen teils mit den genannten Antioxydantien besprüht wurden und teils unbehandelt blieben, ergaben einen klaren Schutzeffekt durch die Antioxydantien.
Besonders eindrucksvoll trat die Schutzwirkung dann zu Tage, wenn nur eine Bohnenblatthälfte mit dem Antioxydans behandelt worden war. In diesem Fall zeigte nur die unbehandelte Blatthälfte nach Teerbegasung und Sonnenlichteinwirkung eine typische Schädigung. Wurden Versuchspflanzen erst 10 Tage nach der Besprühung mit einem Antioxydans mit Teer begast, so konnte noch immer eine Schutzwirkung registriert werden. Es steht somit außer Zweifel, daß die schädigende Wirkung von Teerdämpfen durch Behandlung mit Antioxydantien aufgehoben oder zumindest wesentlich abgeschwächt werden kann.
Summary Tar vapours as a cause of injuries to plants
To answer the question which compounds of tar vapours damage plants, and especially potatoes, several of its pure components were tested. Because only vapours evolving between 100 and 300 C cause injuries, the experiments were restricted to ace-naphtene, acridine, anthracene, carbazole, chrysene, fluoranthene, fluorene, naphthalene and phenanthrene. Because evaporation of solvents results in small crystals on the epidermis, these substances were mixed with glycerine forming very small droplets on the surface of the leaves. Injuries occurred only with acridine, anthracene and fluoranthene, but solely when the plants were put in direct sunlight after the fumigation. These three compounds have a very similar chemical constitution in showing a condensed three ring system in one plane. Other acene and anthracene dérivâtes such as phenazine, xanthene, 2-methyl-anthracene, 9-methylanthracene and 9-10-dihydro-
170

anthracene acted in the same manner. Anthracene and other acenes can photochem-ically form peroxides or the corresponding chinones in sunlight. If tar fumigated plants were placed behind glass walls absorbing the UV light, no injuries occurred, though five weeks afterwards the fluorescence microscope still indicated droplets on the leaves. If, on parts of the leaves, the droplets were removed and afterwards the leaves were exposed to sunshine, these areas remained uninjured. This proved that the injuring substances were not present in the droplets, but that their procursors, which were formed under the influence of the direct sunlight, were taken up by the leaves.
In spite of their very similar chemical constitutions, phenanthrene, acenaphtene and chrysene did not injure the plants because their excitation maxima are under 300 nm.
Tar injuries cannot be explained by the increase of the osmotic values in affected leaves. But microscopical investigations have shown that the killed, dried and crisp epidermis, often replaced by cork tissue, is responsible.
The use of antioxidants proves that tar injuries are related to photochemical processes. If half of a bean leaf is sprayed with an antioxidant (Fuclasin ultra, Maneb, Dithane M45) before fumigation, the injury appears only on the untreated part. Thus, the injurious action of tar vapours can significantly be decreased by treatment with antioxidants.
Resume Les effets nuisibles des vapeurs de goudron de houille sur les plantes
Pour répondre à la question, quels composés de vapeur de goudron causent des dégâts aux plantes, et particulièrement aux pommes de terre, plusieurs de ses éléments purs ont été éprouvés. Étant donné que seulement les vapeurs qui se produisent entre 100 et 300 C sont nocives, les expériences ont commencé par l'acénaphtène, l'acridine, l'anthracène, le carbazole, le chrysène, le fluoranthène, le fiuorène, le naphtalène et le phéjianthrène. Parce que l'évaporation de la plupart des dissolvants a pour résultat l'apparition de petits cristaux sur l'épiderme, ils ont été mélangés à la glycérine de façon à laisser de très petites gouttelettes. Nuisibles sont l'acradine, l'anthracène et le fluoranthène, mais seulement quand les plantes sont directement exposées au soleil après la fumigation.
D'autres dérivés d'acène et d'anthracène, comme le phénazine, le xanthène, le méthyl-2-anthracène, le méthyl-9-anthracène et le dihydro-9,10-anthracène produisent le même effet. A l'exception du phénazine, du xanthène et du méthyl-2-anthracène, le soleil est nécessaire pour produire les effets nuisibles. L'anthracène et d'autres acènes, si exposés au soleil, peuvent constituer par voie photochimique des peroxydes ou les quinones correspondants. Quand les plantes fumigées de goudron sont placées sous verre absorbant la lumière UV, elles ne subissent aucun dégât, bien que cinq semaines plus tard le microscope à fluorescence révèle toujours de petites gouttelettes sur les feuilles.
Si les gouttelettes sont enlevées de certaines parties des feuilles avant l'exposition au soleil, ces surfaces restent intactes. Cela prouve que les agents nocifs ne se trouvent pas dans les gouttelettes et que leurs précurseurs sont absorbés par les feuilles et que les
171

agents en question sont constitués ultérieurement sous l'influence du soleil. Malgré leurs compositions sensiblement identiques, le phénanthrène, l'acénaphtène
et le chrysène n'influencent pas les plantes, parce que leurs maxima d'excitation sont au-dessous de 300 nm.
Les effets nuisibles provoqués par le goudron ne s'expliquent pas par l'augmentation de la valeur osmotique dans les feuilles atteintes, mais les examens microscopiques ont montré que l'épiderme tué, séché et fragile, souvent remplacé par un tissu liégieux, est responsable. . L'emploi d'anti-oxydants a prouvé qu'il existe une relation entre les dommages
d'origine goudronneuse et les processus photochimiques. Si un anti-oxydant est pulvérisé sur la moitié d'une feuile de haricot avant la fumigation, seulement la partie non traitée est atteinte. C'est ainsi que les effets nuisibles de vapeurs goudronneuses se trouvent sensiblement réduits par un traitement d'anti-oxydants.
Literatur
Halbwachs, G. 1967. Phytopath. Z. 60: 73-91. Ordin. L., O. Taylor. B. E. Probst and E. A. Cardiff. 1962. Air and Wat. Poll. 6: 223-37. Schönberg, F. 1958. Präparative organische Photochemie. Berlin. Stern, A. 1962. Air Pollution. New York and London.
172

Der Einfluß von Fluorexhalaten auf die Pflanzenwelt in der Umgebung eines Aluminiumwerkes
A. Rippel und J. Janovicovâ
Forschungsinstitut für Hygiene, Bratislava, CSSR
Kurzfassung
Auf Grund von sechsjährigen Untersuchungen der Waldvegetation und der landwirtschaftlichen Kulturen in der Umgebung eines Aluminiumwerkes wurde eine Intoxikation und Beschädigung der Vegetation durch Fluorverbindungen nachgewiesen. Der Grad der Beschädigung war verschieden, je nach der Entfernung vom Betrieb und nach der vorherrschenden Windrichtung. Die Ergebnisse der Untersuchungen wurden als Basis für die Durchführung von landwirtschaftlichen Maßnahmen im verseuchten Gebiet verwendet.
Das Ziel der Arbeit war eine mehrjährige systematische Beobachtung des Fluorgehalts landwirtschaftlicher Produkte die aus der unmittelbaren Nähe eines Aluminiumwerkes stammten, und die Bestimmung des Fluorgehalts in den Blättern von einigen Bäumen aus den umliegenden Wäldern. Bei der Auswahl der Proben wurde Rücksicht darauf genommen, daß die Arten für das untersuchte Gebiet typisch waren. Zu gleicher Zeit und unter gleichen Bedingungen wurden Kontrollproben aus einer Entfernung von 12-22 km vom Werk genommen. Der Fluorgehalt wurde nach der Methode Willard-Winter, modifiziert von Szokolay und Rippel (1959), bestimmt. Da die Oberfläche der Pflanzen stets mit Staub bedeckt war, dessen Menge abhängig von den meteorologischen Verhältnissen stark schwankte, wurden die Analysen erst nach einem Abspülen mit einer Detergentlösung ausgeführt.
Von der in der nächsten Umgebung dominierenden Waldvegetation wurden Blätter von Buche, Eiche, Hainbuche und Akazie und Nadeln von Kiefern gesammelt, sowohl am Anfang als am Ende der Vegetationsperiode. Außerdem wurden eventuell vorkommende äußere Beschädigungen festgestellt.
Die chemischen Analysen zeigten, daß sich in den Baumblättern Fluoride ansammeln, deren Mengen von der Entfernung des Aluminiumwerkes und von der Windrichtung abhängig sind. Die höchsten Werte wurden bei allen fünf Baumarten auf den Abhängen gefunden die unter dem Einfluß der prädominierenden Winde standen. Die maximale Überschreitung des Normalgehalts erreicht hier im sechsjährigen Durchschnitt das SOfache. Dagegen wurden bei den Bäumen aus den Gebieten, die in der entgegengesetzten Richtung lagen, wesentlich niedrigere Fluorgehalte gefunden, maximal höchstens das 6fache von den Kontrollen. Es ist verständlich, daß sich besonders bei Bäumen aus den am stärksten exponierten Gebieten markante Unterschiede der Fluorgehalte zwischen Anfang und Ende der Vegetationsperiode zeigten.
173

mg 9
8
7
6
5
4
3
2
1
F/kg
J j Zwetschen
[Igigj Kopfsalat
| | Kontrolle
CL X ^ : I I l iZL l i 242 It J
1958 19S9 1960 1961 1962 1963
Abb. 1. Durchschnittlicher Fluorgehalt in Pflaumen und Kopfsalat in den meist exponierten Gebieten und im Kontrollgebiet.
Die erhöhte Aufnahme von Fluorverbindungen äußerte sich auch in einer stärkeren Beschädigung von Blättern oder Nadeln. Die Phänomene sind genügend bekannt und in den Arbeiten von vielen Autoren beschrieben (Adams et al., 1957; Brenann et al., 1950; Griffin und Bayles, 1952; Zimmerman, 1952).
In Übereinstimmung mit den Literaturangaben haben sich auch in unserem Fall die Koniferen als die am wenigsten toleranten Arten für Fluorverunreinigungen erwiesen. Die Kiefer reagierten schon bei einer Konzentration von 12 mg % F im Gewebe durch Beschädigung der Nadeln. Die Eiche, die Buche und die Hainbuche kann man zusammen in eine Gruppe nehmen, da sie nur geringe Unterschiede im Fluorgehalt zeigen und ungefähr die gleiche Empfindlichkeit besitzen. Interessant sind die Befunde bei der Akazie, die in dem am meisten verseuchten Gebiet jedes Jahr am Ende der Vegetationsperioden immer die höchsten Werte an Fluor (bis 352 mg%) aufwies wobei aber die Blätter nur unbedeutend deformiert waren.
Im weiteren Teil der Arbeit beschäftigten wir uns ausführlicher mit der Dynamik der Veränderungen des Fluorgehalts in lokalen landwirtschaftlichen Produkten. Dabei wurden drei Gruppen untersucht: Obst, Gemüse und Getreide, mit gleichzeitiger Kontrolluntersuchung von Proben aus einem nicht exponierten Gebiet. Obst und Gemüse wurden in vier Ortschaften in der nächsten Umgebung des Werkes gesammelt. Die Getreideproben stammten von Böden zwischen diesen Dörfern.
Demolé (1963) untersuchte den Fluorgehalt von Obst, Gemüse und einigen Tierprodukten in einer Ortschaft in einer Entfernung von 3 km vom Aluminiumwerk. Unsere Proben wurden größtenteils in einer Entfernung von 0,2-1,0 km von der verunreinigenden Quelle genommen. Beim Vergleich der Kontrollproben von Obst (Pflaumen, Äpfeln, Birnen, Kirschen und Trauben) fanden wir eine verhältnismäßig kleine Spannweite des Fluorgehalts (0,3-0,6 mg F/kg). In der am stärksten exponierten Ortschaft war der Durchschnittsgehalt an Fluor in sechs Jahren bei Pflaumen 4,1, bei
174

mg F/kg 18
L _n n JJ
Hafer
Weizen
H nia II
Roggen
I I Kontrolle
JJ 1956 1957 1958 1959 1960 1961 1962 1963 1964 1965
Abb. 2. Durchschnittlicher Fluorgehalt in Getreide in den meist exponierten Gebieten und im Kontrollgebiet.
Kirschen und Trauben 2,0-2,1, bei Äpfeln und Birnen 1,3-1,5 mg F/kg frischen Gewichts. Daraus ergibt sich, daß Pflaumenfrüchte ein empfindlicherer Indikator für die Verunreinigung sind als die anderen angeführten Obstsorten.
Bei Gemüsesorten wurden die markantesten Unterschiede beim Blattgemüse wie Kopfsalat und Kohl beobachtet in der am stärksten exponierten Ortschaft : 5,0-6,4 mg F/kg gegen 0,6-1 mg F/kg bei den Kontrollproben. Gisiger (1956) fand im Spinat und Kopfsalat 10 mg F/kg. Die kleinsten Unterschiede im Fluorgehalt traten auf bei Kartoffeln ; auch bei Karotten und Zwiebeln waren die Mengen meist niedrig. Paprika, Tomaten und Gurken hatten die niedrigsten Gehalte in den Kontrollen und in der am stärksten exponierten Ortschaft kann man sie in die mäßig kontaminierte Gruppe einteilen. Bei den Kontrollproben von Getreide schwankte der Fluorgehalt um 2 mg F/kg. In dem am stärksten exponierten Gebiet war der Durchschnittswert von 6 Jahren 5,4 mg F/kg.
Während 10 Jahre wurden verschiedene Getreidearten auf derselben Fläche aufgepflanzt, 100 m von den elektrolytischen Hallen in der Richtung der dominierenden Winde. Den höchsten Fluorgehalt im Getreide (Fig. 2) wies Weizen auf: 19,6 mg F/kg, während Roggen 16,4 mg hatte. Auch Fabre et al. (1955) fanden finder Nähe einer Superphosphatfabrik in Nordafrika) im Weizen höhere Werte (22,4 mg F/kg als im Roggen (15,7 mg F/kg). Diese Ergebnisse gehören zu den höchsten die bis jetzt aus der Literatur für Getreide bekannt sind.
Aus unseren Resultaten geht hervor, daß nicht nur die Obstbäume für Fluor empfindlich sind, sondern auch ihre Früchte. Diese Abhängigkeit ist besonders bei Pflaumen deutlich sichtbar, wo sich der natürliche Fluorgehalt um das 12fache erhöht hat. Bei Gemüse hat sich diese Tendenz hauptsächlich beim Kopfsalat und Kohl mit einer Erhöhung um das 6,4 bis 8,3fache offenbart, am allerwenigsten dagegen beim Wurzelgemüse. Bei Getreide ist der Index der Erhöhung im Durchschnitt 2,8 (siehe Tabelle).
175

mg F/kg
5
wenig exponiertes Dorf (Gebiet)
meist exponiertes Dorf (Gebiet)
| 1 Kontrolle
Obst
1 Gemüse 1
ê Abb. 3. Gesamter durchschnittlicher Fluorgehalt in Obst (Äpfel, Birnen, Weintrauben, Kirschen, Pflaumen), Gemüse (Kartoffeln, Möhren, Zwiebel, Paprika, Tomaten, Gurken, Kohl, Kopfsalat) und Getreide (Gerste, Roggen, Weizen).
Durchschnittlicher Fluorgehalt in verschiedenen Gewächsen (1958-1963) in mg F pro kg Rohgewicht.
Äpfel Birnen Weintrauben Kirschen Pflaumen Kartoffeln Möhren Zwiebel Paprika Tomaten Gurken Kohl " Kopfsalat
Gerste Roggen Weizen
Drei Dörfer, Entfernung 2-2,5 km
N
70 48 -
48 72 40 70
--
20 50 46 60
p.p.m. F
0.7 0,5 -0,8 1,0 0,5 0,8
--0.5 0,4 1,0 1.1
Wenig exponiertes Gebiet
10 20 78
2.5 2,4 2.5
Meist exponiertes Dorf(0,2-
N
52 36 36 30 32 30 52 10 6
20 30 40 40
-1,0 km)
p.p.m. F
1,5 1,3 2,1 2.0 4,1 0,6 1,2 1,5 1,4 1.0 0,7 5,0 6,4
Meist exponiertes Gebiet
16 36 86
7,8 4,5 4,0
Kontrolle (12-
N
60 40 32 40 64 40 64 10 6
34 40 50 64
-22 km)
Kontrolle
8 36 66
p.p.m. F
0,3 0.3 0,5 0.6 0,3 0,5 0,6 0,9 0,6 0,4 0,4 0,6 1,0
1,8 1,9 2,0
176
Auf Grund einer sechsjährigen Untersuchung der Waldvegetation und der landwirtschaftlichen Kulturen im Umkreis der Aluminiumwerke sind wir zur Schlußfolgerung gelangt, daß in jenem Gebiet eine Intoxication und eine Beschädigung der Vegetation mit Fluorverbindungen zustandekommt. Die gefundenen Erkenntnisse wurden daher als eine Basis für die Durchführung von entsprechenden landwirtschaftlichen Maßnahmen im betroffenen Gebiet angewendet.
Summary The effect of fluorine exhalâtes on the flora in the surroundings of an aluminium plant
The fluorine exhalâtes which are formed in connection with the production of aluminium have a deleterious effect on the vegetation in the nearest surroundings. In a follow-up study of the fluorine content in the assimilation tissue of five species of trees in different directions and distances from the source of the exhalâtes, increased values were observed. The maxima were 50 times higher than normal. The phytotoxic effects of the exhalâtes were manifest in various degrees of damage to the assimilation surface. Although differences in the sensitivity between plants species were found, the fluorine content was well correlated to the average magnitude of the foliage surface damaged by necrosis.
In addition the fluorine content in three groups of agricultural products was estimated: fruit, vegetables and cereals, with a control in an unexposed region. The determined fluorine content in the fruit was found to be representative for a protracted exposition in a polluted atmosphere and the dependence on the orientation of the habitat in relation to the aluminium plant; 20 fold increased values were observed. Significant differences in the fluorine content were observed in various sorts of vegetables, with an understandable lower content in the roots. In fruits 0.5-5.0 mg F per kg was found, in vegetables 0.5-10.0 mg F per kg and in cereals 1.5-6.5 mg F per kg.
The results show a great sensibility of the plants for fluorine exhalâtes. Very marked were the low tolerance of conifers and the changes in the fluorine content of fruit.
Résumé Les effets des émissions de fluor sur les plantes au voisinage d'une fabrique d'aluminium
Les émissions de fluor qui se forment durant la production d'aluminium ont un effet délétère sur la végétation des environs immédiats. Une étude prolongée, portant sur la teneur en fluor des tissus assimilateurs de cinq espèces de plantes situées à des distances et dans des directions différentes par rapport à la source d'émissions, permit d'observer des augmentations de taux d'importance variable, le maximum atteint étant de cinquante fois supérieur à la normale. Les effets phytotoxiques des émissions se sont manifestés à des degrés divers sur la surface d'assimilation. Bien que l'on ait pu constater une différence de sensibilité entre les différents espèces de plantes, l'analyse a démontré que la teneur moyenne en fluor correspondait bien à la surface foliaire atteinte par la nécrose.
177

Nous avons également étudié la teneur en fluor des produits agricoles dans trois groupes principaux (fruits, légumes et céréales), tandis qu'un contrôle avait lieu au même moment dans une zone non exposée. La teneur des fruits en fluor déterminée à cette occasion, qui reflétait à la fois l'exposition prolongée à une atmosphère polluée et l'orientation du lieu par rapport à la fabrique d'aluminium, correspondait à une augmentation jusqu'à 2000 %. On a observé d'importantes différences dans la teneur en fluor selon les types de légumes, les racines accusant, bien entendu, une teneur inférieure. Nous avons trouvé de 0,5 à 5 mg de F par kg dans les fruits, de 0,5 à 10 mg de F par kg dans les légumes et de 1,5 à 6,5 mg de F dans les céréales.
Les résultats obtenus démontrent la grande sensibilité des plantes aux émissions de fluor. La faible tolérance des conifères et les changements survenus dans la teneur en fluor des fruits sont particulièrement frappants.
Literatur
Adams, D. F., H. G. Applegate and J. W. Hendric. 1957. J. agric. Fd. Chem. 5: 108. Brenann, E. G., I. A. Leone and R. H. Daines. 1950. PI. Physiol., Lancaster Pa. 25: 735-47. Demole, V. Bull. Schweiz. Akad. med. Wiss. 1962: 375-90. Fahre, R., R. Truhaut et A. Rouquette. 1955. C. r. hebd. Seanc. Acad. Sei. 240: 226-8. Gisiger, L. 1956. Mitt. Geb. Lebensmittelunters, u. Hyg. 102: 333-43. Griffin, S. W. and B. Bayles. 1952. Proc. U.S. tech. Conf. Air Pollution New York 9: 105-15. Szokolay, A. und A. Rippel. 1959. Csl. Hyg. 4(7): 410-15. Zimmerman, P. W. 1952. Proc. U.S. tech. Conf. Air Pollution New York 9: 127-39.
178

Discussion in Section 3 : The effects of air pollution on plants
Reporters : A. van Raay and F. H. F. G. Spierings
Participants: Härtel (Chairman), Arndt, Beran, Bolay, Bovay, Buck, De Cornais, Darley, Eilers, Ender, Guderian, Halbwachs, Van Haut, Kloke, Knabe, Lundholm, Mudd, Pollanschiitz, Ruzicka, Wassink.
Though, by definition, photochemical air pollutants do not act in the dark, the question may be asked what 'dark' exactly means. Though the minimum light intensity and the most effective wave length to produce PAN are not yet known, in any case very low quantities are able to produce the harmful substances, as apparent from the fact that the making of one colour photograph is already sufficient to start the process. This photochemical effect is most violent at noon, and less apparent in the morning and in the evening.
That ozone injuries occur at the upper side of the leaves, and damages caused by PAN at the under side, still cannot be sufficiently explained.
Ozone has a very strong affinity to the chloroplasts of the palisade tissue. Thomas stated silvery alterations of the upper leaf epidermis already a few minutes after fumigation with ozone. High O3 concentrations also damage the deeper tissues of the leaves, but always the palisade cells are affected first. Probably the redox potential is influenced, and the small gas exchange (few intercellulars) in the palisade tissue may explain its susceptibility. Damage only occurs where chloroplasts are physiologically active.
SO2 creates a reducing, ozone and PAN an oxidizing atmosphere. No compensation between SO2 and O3 has yet been observed. Also nothing is known about the effect of PAN on the action of the stomata (which is controlled by enzymes) ; in any cass its effect cannot be compared with that of carcinogenic substances such as benzopyrene, for a damaging influence of polycyclic hydrocarbons has never been found.
In experiments with tobacco plants damages by photochemical air pollutants were observed at four places in Germany; the most sensitive varieties were injured in all four places. Filtering the air of the greenhouses avoided damage. NO2 cannot be the direct cause; probably the influence of ozone originating (in light) from nitrogen oxides prevails. The problem is why, far away from industrial concentrations and from motor traffic, O3 occurs in greater quantities. Possibly the light under the hazy layer in and near towns is unfavourable for its production. On the other hand exhaust gases may be cairied by turbulating air into higher atmospheric strata vvhere enough light is present to produce O3, and afterwards such strata may sink to the ground and its ozone may damage plants at distant places. Observations on a hurricane over Florida, two years ago, seem to support this theory. In the Netherlands, 03-concen-trations up to 0.15 mg/m3 occur when west winds (coming from the sea) prevail.
179

Differences in temperature between day and night are supposed to be essential for ozone production.
S02-effects are also known from places far away from industries. In completely non-industrial districts of Sweden the pH of rain-water decreased to 2.8; that of the natural waters also diminished markedly since 1930. The increasing number of oil burning installations in Europe is said to be the cause. The consequences are reduced crop yields in agriculture and forestry.
The primary cellular point of attack by sulphur dioxide and fluorine compounds cannot yet be indicated. Perhaps the conditions causing reduction during photosynthesis are modified, or the phytotoxic compounds are incorporated into amino acids via the Calvin cycle. It was suggested to use the alterations in amino acids for an early diagnosis.
Whether the unvarourable effect of fertilizers containing CI on the F-content and the damaging of apricot trees by F-compounds, as described by Bolay, can be mit-gated by adding nitiogenous substances, is not yet established. In the reported experiments, potassium and phosphorus on the one, nitrogen on the other hand were alternatively added in different years. K-fertilization caused few necroses; SO2-absorption and damage increased when P-fertilizers were used. As a rule well balanced Ca-contents had a favourable effect. The uptake of potassium from the soil was enhanced by SO2, probably by balancing the anion/cation equilibrium.
Fluorine interferes with the water regime of the plants. In the beginning the capacity for absorbing water decreases and the transpiration increases, involving a water deficiency. Later on the transpiration diminishes, and the plants begin to wither. These effects are reversible with a minor F-attack, but higher fluorine concentrations cause irreversible damage. SO2 acts in a similar way on the water permeability of the cells. F-compounds are not only able to penetrate into the plants by way of the stomata, but apparently also through the cuticula.
180

Section 4 : The effects of air pollution on vascular plants

Das Studium der Schäden an Wildpflanzen und Pflanzengesellschaften verursacht durch Luftverunreinigung
J. Hajdük und M. Ruzicka
Institut für Landschaftsbiologie der Slowakischen Akademie der Wissenschaften, Bratislava, CSSR
Kurzfassung
Ein Übersicht wird gegeben der (wenig umfangreichen) Literatur über den Einfluß verschiedener Exhalationen auf Wildpflanzen und auf die Vegetation im ganzen. Solche Studien sind notwendig um den Einfluß toxischer Emissionen neuer Industrien voraus zu sagen, fest zu stellen wo diese Industrien am besten geplannt werden können, und welche Maßnahmen notwendig sind um Schaden einzuschränken. Dabei sollen phytosoziologische Untersuchungen in der Vordergrund stehen. An zweiter Stelle kommen Untersuchungen an den einzelnen Pflanzenarten um deren Resistenz zu prüfen; sie können führen zu Phytoindikatoren die entweder positiv (bleibend) oder negativ (das heißt sehr empfindlich) sind.
Um die Wirkung einer neuen Industrie vorherzusagen sollen sowohl die ungestörte Vegetation als die gestörte studiert werden. Dabei sollen verschiedene Wissenschaftsdiziplinen herangezogen werden und man kann dabei verschiedene Etappen unterscheiden.
Der Einfluß industrieller Exhalationsprodukte auf die Vegetation ist bedingt durch ihre physikalisch-chemischen Eigenschaften, ihre Konzentration und, nicht an letzter Stelle, durch die Gestaltung des betreffenden Gebietes. Der Einfluß industrieller Immissionen auf die Pflanzen wird durch das Assimilationsapparat oder mittels der Wurzelsysteme verwirklicht.
Die Emmissionen verursachen Veränderungen der Phytozönosen durch Herabsetzung der Toleranz einiger Arten oder deren völlige Beseitigung. So kamen z.B. die annährend gleich resistente Silene ciicubalus und Agrostis alba in einer ursprünglichen Phytozönose mit ungefähr gleicher Frequenz vor, während ein vierjähriger Einwirkung der Exhalate sich wesentlich zu Gunsten von Agrostis herausstelle. Diese Art erfaßte die Fläche der ausgestorbenen Arten dank ihrer großen vegetativen und generativen Vermehrungsfähigkeit; Silene erhielt sich im intoxizierten Gebiet nur als eine vereinzelte Art.
Verschiedene Pflanzenarten besitzen laut ihren genetisch-physiologischen Eigenschaften eine verschiedene Resistenz und Toleranz toxischer Emmissionen gegenüber und ihre Vitalität und Verbreitung im kontaminierten Gebiet sind dadurch verschieden. Empfindliche Arten werden selten, zeigen einen niedrigen Frequenz, oder verschwinden. Frequenz und Dominanz ziemlich resistenter Arten können im Anfang anwachsen, aber nach längerer Wirkung der Exhalationsprodukte vermehren sich nur die am meisten resistente Arten. Wenn die Konzentration hoch ist, bleiben nur sehr wenige; man könnte sie als 'positive Phytoindikatoren' bezeichnen. In Gebieten mit
183

niedrigen Konzentrationen wo deren Wirkung erst anfängt, bleiben die empfindliche Arten ('negative Phytoindikatoren'). Die Verbreitung einer bestimmten Pflanzenart um die Exhalationsquelle herum entspricht also einer bestimmten Konzentration eines bestimmten Exhalâtes während einer bestimmten Zeit unter Berücksichtigung der ökologischen Bedingungen des Gebietes.
Zur Bestimmung des Gesamteinflusses einer Industrie soll die ganze Vegetation erfaßt werden, das heißt die Bezieuhng festgestellt werden zwischen qualitative und quantitative Zusammensetzung der Phytozönosen und Konzentration der Ex-halate. Dazu gehört das Studium der Physiologie und Biochemie der durch Immissionen beeinflußten und nicht beeinflußten Pflanzen. Ein solches Studium kann jedoch keine Schlußergebnisse liefern, weil eine überwiegende Mehrheit der Pflanzenarten anders reagiert auf die ökologischen Verhältnisse bei isolierter Züchtung als im natürlichen Biotop.
Die umfangreiche Literatur (siehe Garber, 1960, 1962) behandelt nur relativ selten den Einfluß von Emissionen auf die ganze Vegetation, also auch vom phytozönolo-gischen und synökologischen Gesichtspunkt. Die meisten Arbeiten befassen sich mit der phytopathologischen Seite, mit der Diagnostik und den präventiven oder direkten Maßnahmen zur Schadenverhütung. Weiter gibt es die auf die Erläuterung des Schädigungsmechanismus eingestellten Arbeiten physiologischen Charakters. Die Arbeiten betreffen Waldgehölze, wirtschaftliche Früchte, Obstbäume, Futterpflanzen, Zierpflanzen und nur an letzter Stelle die wildwachsenden Pflanzen.
Den Einfluß industrieller Exhalationsprodukte auch auf wildwachsenden Pflanzen behandelte Stoklasa in seiner damals hervorragenden Arbeit (1923). Er stellte eine Reihenfolge einiger solchen Pflanzen auf nach deren Resistenz auf Grund von Beobachtungen im Gelände. Am resistentesten sollen die Arten der Gattung Equisetum sein. Er führt auch an, daß die Pflanzen mit natürlich hohem Schwefelgehalt auch am widerstandsfähigsten seien; dazu gehören Arten der Liliaceae und Cruciferae. Vor Stoklasa hat schon O'Gara (1922) Kulturpflanzen und wildwachsenden Arten der Resistenz gegen SO2 nach in drei Gruppen eingeteilt. Auch Thomas und Hendricks (1956) führen einige wildwachsenden Pflanzen an, die sie auch in drei Gruppen (empfindlich gegen Fluor, mittelempfindlich und resistent) einteilen.
Benedict und Breen (1955) in den USA stellten einen Atlas zusammen gegründet auf die Reaktion und das Vorkommen von Nekrosen bei !0 Unkräuter, wonach der Verunreinigungsgrad der Atmosphäre zu bestimmen ist. Kendrick et al. (1956) führen Arten (wobei auch Zierpflanzen) aus Los Angeles an, die sie nach Empfindlichkeit gegen 'smog' in empfindliche und resistente einteilen. Bobrov (1955) erwähnt Poa annua als Indikator für 'smog'.
Borsdorf (1960) untersuchte eine größere Anzahl wildwachsender Pflanzen in der Umgebung einer Fluorexhalationsquelle und teilte sie nach Empfindlichkeit in 4 Gruppen ein: die Gramineae- und Polygonaceae-Arten sollen empfindlich sein, die Arten der Labiatae, Compositae, Papilionaceae, Cruciferae und Uwbelliferae widerstandsfähiger.
Gorham und Gordon (1960) untersuchten in der Umgebung eines metallurgischen Werkes in Kanada den Einfluß von SO2 und anderen Emissionen auf die Struktur der
184

Pflanzengesellschaften und sie kamen zum Schluß, daß es zwischen der Konzentration in der Atmosphäre und der qualitativen und quantitativen Zusammensetzung der Phytozönosen eine deutliche Korrelation gibt. Ihr Arbeit beschränkte sich nicht auf die Klassifikation der Pflanzen in resistente und empfindliche, sondern sie betrifft vor allem den Einfluß der Exhalate auf die gesamte Vegetation und auf die Faktoren des Ökotops.
Lux (1960) untersuchte die Waldgesellschaften in der Umgebung von SO2- und C02-haltigen Exhalationsquellen. Es ergab sich, daß CO2 einen positiven Einfluß hat auf die Struktur der Phytozönosen und dies widerspiegelte sich in einer Zunahme der Artenzahl in der Richtung zur Exhalationsquelle, trotz der Beschädigung durch SO2 von einigen Pflanzen. Unter Einfluß des gebildeten CaCOu kam es schließlich zu einer qualitativen Änderung des Waldtyps im günstigem Sinne!
Leitenberger (1949) beobachtete bei der Untersuchung des Einflusses des Torfs auf die beschädigte Vegetation in der Umgebung von Magnesitwerken in Österreich eine ungewöhliche Verbreitung einiger Pflanzen und er nahm einen Einfluß der MgO- und S02-haltigen Emission an.
Antipov (1956) stellte fest, daß einige Arten in Rasenflächen in der Umgebung von Exhalationsquellen in Leningrad nach einem Jahr oder nach zwei Jahren verschwanden und anstatt deren resistente Arten erschienen (wie z.B. Agropyron repens) die auch in einer verunreinigten Atmosphäre wachsen können.
Kulagin (1964) untersuchte außer Waldgehölzen und -sträuchern in der Umgebung von Magnesitexhalationsquellen in der UdSSR hinter dem Ural auch einige wildwachsenden Pflanzen; er stellte ein Schema auf, für die Sukzession der Vegetation im kontaminierten und nichtkontaminierten Gebiet.
Es bleibt aber eine Tatsache, daß von der umfangreichen Literatur über die Exhalate nur ein geringer Teil die wildwachsenden Pflanzen betrifft, und daß noch weniger Arbeiten sich beschaffen mit dem Einfluß der Exhalate auf die Phytozönosen.
Tm Institut für Landschaftsbiologie in Bratislava wurde eine Abteilung für das Studium des Einflusses der Exhalate auf Biozönosen gegründet, wo, außer toxischer Produkte auf einige Modell-Kulturpflanzen unter Laborbedingungen auch den Einfluß der Emissionen auf Phytozönosen untersucht werden, vor allem deren Strukturänderungen verursacht durch Magnesiumoxid, Fluor, Arsen (zusammen mit anderen toxischen Elementen), SO2, Hg und Zementwerken (Hajdûk, 1961, 1966). Die Aufmerksamkeit wird jedoch auf Magnesiumoxide und Fluor konzentriert die, mit Arsen, die gefährlichsten Exhalationskomponente in der Slowakei sind.
Die Zahl der Pflanzenarten in einer Phytozönose ist vor allem durch den Ökotop und dazu nicht an letzter Stelle durch den Einfluß des Menschen bedingt. Diese Anzahl ändert sich mit dem Ökotop: je mehr der Standort ausgeglichen ist, desto weniger variiert die Artenzahl. Die Exhalate können die Anzahl von Pflanzenarten in der Richtung zur Exhalationsquelle reduzieren, wobei die stärkste Abnahme durch Wirkung des Magnesiums auftritt. In den Lokalitäten wo über 30 g pro m2 feste Exhalate pro Monat fallen, verschwinden alle höheren Pflanzen. Magnesiumexhalate enthalten bis zu 89% MgO, das nach dem Ausbrennungsgrad kristallinisches Periklas bildet
185

oder amorph sein kann, unbeständig ist und nach Verbindung mit Wasser den Magnesiumhydroxid oder bei genügend Kohlendioxid das Magnesiumhydrokarbonat bildet, das die Bodenreaktion bis auf pH 9,5 erhöht und den meisten Pflanzenarten das Leben unmöglich macht.
Exhalate die von Eisenerzöfen ausströmten und haupsächlich SOa und Hg enthielten setzten die Anzahl der Pflanzenarten von 30 auf 6 herab. Etwas ähnliches verursachten Fluoremissionen auf Lokalitäten wo die Herabfallmenge einen Durchschnitt von 2359 kg F/km2 pro Jahr erreichte; in einer Atmosphäre mit 108 mg F/m3
hatte sich die Anzahl der Arten von Gefäßpflanzen nach 6 Jahren von 25 auf 10 verringert. Auch feste, durch Verbrennung der Kohle mit hohem As-Gehalt und anderen Spurenelementen entstehenden Exhalate können bei hohen Konzentrationen wesentlich die Anzahl der Pflanzenarten herabsetzen. Bei der Katastrophe in 1966 bedeckten 3 Millionen m3 Arsen und andere Elemente enthaltenden Flugasche die ausgedehnten Flächen des Nitra-Tals. Auf den mit einem dicken Schicht bedeckten Lokalitäten verschwand die Vegetation völlig; auf 2 -3 cm dicke Aschenschichten wuchsen nur noch 4 bis 6 Pflanzenarten (u.a. Agrostis alba, Festuca pratensis und Agropyron repens), aber im Laufe von zwei Jahren vermehrte sich die Zahl auf 10, wobei Chenopodium glaucum eine so hohe Frequenz zeigte daß sie als Phytoindikator der heimgesuchten Orte dienen konnte. In der Umgebung der Zementwerke und Kalkhütten wurde aber keine deutliche Herabsetzung der Anzahl Pflanzenarten unter Einfluß der herabfallenden festen Exhalaten beobachtet.
Die Industrieexhalate verursachen nicht nur die Abnahme der Anzahl von Pflanzenarten, sondern oft auch Veränderungen in Dominanz, Soziabilität oder Vitalität, abhängig von der Entfernung der Exhalationsquelle. Zum Beispiel setzten sich auf Lokalitäten mit hohen Fluorkonzentrationen nach sechs Jahren Pflanzen der Familie Umbelliferae wie Pimpinella saxifraga, Daucus carota, Seseli annuum und Heracleum sphondylium durch. Wo Arsen, Kalziumoxid und Spurenelemente wie Vanadium in die Umwelt gelangt waren, breiteten sich innerhalb drei Jahren Chenopodium glaucum und Agrostis alba aus. In der Umgebung von Eisenerzöfen aus denen SO2 und Hg strömten verringerte sich die Anzahl von Pflanzenarten und gleichzeitig steigerte sich abnormal die Dominanz von Allium montanum, in der bis 0,28 g Hg pro 1000 g Trockensubstanz festgestellt werden konnte (relativ wenig kontaminierten Gebiet entnommenen Pflanzen dieser Art zeigten bei Anwendung der üblichen Methoden kein Quecksilber).
Die qualitative Änderung der Phytozönosen äußert sich am deutlichsten in der Umgebung der Magnesitexhalationsquellen. So erschienen in einem absterbenden Wald, wo die Herabfallmenge bis 60 g/m2 pro Monat erreichte, anstatt der Waldpflanzen Puccinellia distans, Agrostis alba und Agropyron repens, Arten die unter normalen Bedingungen nie im Wald vorkommen. In diesem Falle spielten sie die Rolle resistenter Arten auf intoxiziertem Standort nach Eliminierung der anderen Arten. Ringsum einige Exhalationsquellen stieg die Dominanz der resistenten Arten dermaßen, daß sie ausgedehnte Monozönosen bildeten; unter Einfluß von Fluor geschah das mit Festuca rubra und Agrostis alba, im Wald mit Luzula albida. In der Umgebung von Magnesitexhalationsquellen handelte es sich u.a. um Puccinellia distans, Agrostis alba, Agropyron repens und Cc.rex distans.
186

Die qualitative Änderung der durch Exhalate intoxizierten Phytozönosen hängt vor allem von der Anwesenheit einer genügenden Anzahl potentiell resistenter Arten in der ursprünglichen Flora ab. Wenn in der Umgebung solche Arten fehlen, so kann es zur Bildung eines phytozönologischen oder Vegetationsvakuums kommen. Solche Fälle sind bekannt aus der Slowakei, Österreich und der UdSSR in der Umgebung von Magnesitwerken und teilweise auch wo z.B. F-, SO2-, As- oder Hg-haltige Emissionen ausströmen. Darum soll man sich schon vor dem Aufbau einer Fabrik wobei solche Ausströmungen auftreten werden, bei wildwachsenden Pflanzen auf die Feststellung resistenter Arten richten die als Quelle für die Neubesiedlung intoxizierter Flächen dienen könnten.
In den nicht durch Ausströmungen beeinflußten Gebieten kommt die Variation in den ökologischen Bedingungen zum Ausdruck in eine Differenzierung der Vegetation in mehreren Gesellschaften. Am Beginn einer Intoxikation fängt die Struktur der Phytozönose an sich allmählich quantitativ und qualitativ zu ändern und parallel mit dem Charakter der Emission verläuft eine Sukzession der Pflanzengesellschaften. Bei einer systematischen langjährigen toxischen Wirkung der Emissionen kann das Ergebnis eine Phytozönose sein, die auf Standorten auftritt wo vorher eine reiche Abwechslung verschiedener Gesellschaften zu finden war. Solche Flächen können einige Quadratkilometer bedecken.
Die Untersuchungen über den Einfluß der Exhalate auf Pflanze und Vegetation erreichte bis jetzt in Europa nicht den Umfang und die Intensität die ihr störende Einwirkung auf die Lebensumwelt gebührt. Das war einer der Gründe der zu dessen Forschung in der CSSR führte. In den Jahren 1963 und 1967 wurden breit konzipierte Symposien über Exhalationsproblematik veranstaltet. Deren Hauptziele waren eine gegenseitige Informierung und die Koordination aller wissenschaftlichen Disziplinen und der Praxis bei de Lösung dieses Problems. Die Problematik des Einflusses von Exhalaten auf Vegetation und Fauna spielte dabei eine wichtige Rolle und führte zu einer Intensivierung der Forschung in dieser Richtung. Immer mehr gelang man jedoch zur Ansicht, daß diese Problematik auf alle in die Landschaft eingetragene toxische Stoffe zu erweitern sei. Ähnlich orientierte Forschungen führt man z.B. in die 'Nature Conservancy's Monks Wood Experimental Station' aus, wo sich 'The Toxic Chemicals and Wildlife Division' befindet.
Die störende Einwirkung von toxischen Stoffen auf die Vegetation gewinnt mit der Intensivierung der industriellen und landwirtschaftlichen Produktion einen immer giößeren Umfang. Neben einer Vergrößerung der unproduktiven Flächen kommt es zur Verringerung der Produktivität and anderen Stellen. Im Zusammenhang mit dem Streben nach genügend Eiweißernährung der Menschheit ist es überraschend, daß dieses Problem keinen Platz in das Internationale Biologische Programm gefunden hat. Wenig Verständnis fand es auch in der CSSR. Eine größere Aufmerksamkeit als bisher wäre wünschenswert.
Die Untersuchung des Einflusses von Industrieexhalaten aufpflanze und Vegetation soll als ein Teil der sehr breiten und komplexen Problematik der Erhaltung der Lebensumwelt des Menschen aufgefaßt werden. Deshalb wird es notwendig sein, zuerst
187

die Beziehungen zwischen Exhalaten und Landschaft zu erläutern, wobei zu betonen ist, daß eine Feststellung der Schaden nicht genügt.
Die ganze Problematik teilt sich in drei Grundetappen ein :
1. Einspruch bei der Planung neuer Industrien gegründet auf objektiven Fakten und Erkenntnissen über die Landschaft und namentlich über deren biologischen Komponente.
Bisher kamen bei der Verteilung von Industriewerken überwiegend technisch-ökonomische Kriterien zur Geltung. Für einen erhöhten Einfluß biologischer Kriterien ist es erforderlich daß man an Hand einer ausgezeichnet fundierte Stellungnahme den eingenommenen Standpunkt verteidigen kann. Dazu braucht man eine intensive Forschung jener wissenschaftlichen Disziplinen die sich mit der Landschaft und ihrer Komponenten befassen. Für ein solches Studium ist ein Team von Mitarbeitern aus verschiedenen Disziplinen notwendig. Das Ziel soll sein, eine vollständige Analyse und nachher eine Synthese der Landschaft zu geben. Umfang und Komplexität eines solchen Studiums werden durch das Ziel bestimmt. In der biologischen Grundforschung der Landschaft führt diese Richtung zur Ausarbeitung eines theoretisch-biologischen Landschaftsplan.
In der Tschechoslowakei ist an die Vorbereitung eines solchen Planes begonnen. Das wurde ermöglicht durch eine Konzentration der Kräfte von mehreren Arbeitsstellen für die Zubereitung der Unterlagen die notwendig sind für die präventive Sicherung des Schutzes der Lebensumwelt, namentlich bei Planung und Projektion von Eingriffen und technischen Umwandlungen der Landschaft.
Das Studium des Einflusses der Exhalationsprodukte auf die Landschaft vom biologischen Gesichtspunkt muß unerläßlich auf das Studium der wesentlichen biotischen Komponente, d.h. der Vegetation gerichtet werden. In Anknüpfung an den biologischen Landschaftsplan wird es, nach der Genehmigung der Entwürfe für den Aufbau eines Industrieobjektes das auf jedweder Weise seine Umgebung beeinflussen wird, notwendig sein, eine sehr ausführliche Untersuchung und Kartierung des ursprünglichen Zustandes der Vegetation und der ökologischen Grundfaktoren zu sichern. Parallel damit soll ein geodätisch vermessenes Netz von Dauerflächen gegründet werden, worin regelmäßig Messungen und Beobachtungen der Veränderungen durchgeführt werden könnten. Auf diese Weise werden grundlegende Voraussetzungen für das Landschaftsgroßexperiment beim Studium des Exhalationseinflusses auf die Vegetation gebildet werden.
Es ist der Erwägung wert, den Indikatorenwert der Pflanzen und der Vegetation zur Ergänzung der meteorologischen und Beobachtungsstationen für Messung der Exha-latenkonzentration auszunützen. Dafür ist das bereits erwähnte Netz dauernder Beobachtungsflächen der Vegetation verwendbar, es soll in das System der Beobachtungsstationen eingegliedert werden.
2. Verringerung der Menge ausströmender Exhalate aus den Industrieobjekten ist eine ebenso wichtiges Problem wie der richtige Aufbau einer Fabrik in der Landschaft. Hier ist die Problematik komplizierter, da sie außer ökonomischen Gesichtspunkten
188

auch vom Niveau and der Qualität der verwandten Technologie abhängig ist. Dazu kommen Probleme der Ausnutzung aufgefangender Abfallstoffe. Der ganze Komplex technisch-ökonomischer Maßnahmen, einschließlich die Rechtsnormen, können zur Verringerung des negativen Einflusses der Exhalate auf die Vegetation wesentlich beitragen. Damit kann man auch im gewissen Maß den beträchtlichen Umfang von Schäden an der Vegetation vorbeugen.
3. Feststellung und Verringerung der durch Exhalate verübten Schäden in der Landschaft ist die dritte Etappe bei der Lösung des Problems des Einflusses von Exhalaten auf die Landschaft als ein Anteil der Lebensumwelt des Menschen. In dieser Etappe fällt im vollen Ausmaß die Untersuchung des Exhalationseinflusses auf die Pflanzen und die Vegetation als eine der grundlegenden Voraussetzungen für die Feststellung der Schäden und der Möglichkeiten ihrer Herabsetzung.
Bei der Lösung dieses Problems ist es wichtig, die Gesamtkonzeption der Forschung, namentlich ihrer Zeitanknüpfung zu erklären. Die Untersuchung des Exhalationseinflusses auf Pflanzen und Vegetation sollte in folgenden Richtungen vorgehen : a. In Anknüpfung an die eventuell vor dem Aufbau der Fabrik durchgeführten Forschungen der ursprünglichen Vegetation und Artenverbreitung unter ungestörten Bedingungen sollte eine floristisch-phytogeographische und geobotanische Untersuchung der Vegetationsveränderungen auf dem von Exhalaten beeinflußten Gebiet durchgeführt werden. Die Veränderungen an Pflanzen, ihre Verbreitung in der Vegetation, wären festzustellen und zu beschreiben. Auf Grund dieser Aufnahme könnten die Karten der Vegetationsveränderungen aufgestellt werden. b. Es sollte das Studium der Dynamik und der Ursachen von Vegetationsveränderungen und der Empfindlichkeit, eventuell Resistenz, der Pflanzen gegen Exhalations-produkte folgen. c. Außerdem wäre das Studium der Autökologie der positiven und negativen Phyto-indikatoren im Gelände und unter konstanten Experimentalbedingungen notwendig. d. Das Studium der Synökologie der gestörten Zönosen und deren Degradationsstadien gehört im Arbeitsprogramm. e. Auch die Gründung von Dauerflächen in den natürlichen Zönosen auf dem von Exhalaten nicht beeinflußten Gebiet zum experimentellem Studium der Vegetationsveränderungen und ihrer Synökologie gehört dazu. f. Die erworbenen Ergebnisse sollen bei der Ausarbeitung von Maßnahmen zur Beseitigung der entstehenden Schäden angewendet werden.
Die Forschungsrichtungen sind in der Reihenfolge angeführt in der sie aufeinander folgen sollten. Bei Einhaltung der Zeitfolge einzelner Forschungsrichtungen kann man keinesfalls ohne die erste, die floristisch-phytogeographische und geobotanische Richtung auskommen, während die Entwicklung der anderen Punkte mehr von den Personal- und Materialmöglichkeiten als von der Zeitfolge abhängig sein wird. Die Anwendung der erworbenen Kenntnisse in der Praxis kan jedoch bei allen Richtungen sogleich zur Geltung gebracht werden, wenn geeignete Erkenntnisse zur Verfügung stehen werden.
189

Schlußfolgerungen
1. Der Untersuchungsproblematik des Exhalationseinflusses auf Pflanzen und Vegetation wird nicht die Aufmerksamkeit zugewendet die sie in Hinblick auf ihre Bedeutsamkeit verdient. 2. Es müssen die Probleme, welche mit dem Einfluß der toxischen Stoffe zusammenhängen gelöst werden, da sie eine bedeutende Komponente der Lebensumwelt des Menschen bildet. 3. Durch Prävention bei der industriellen Planung und Entwicklung in der Landschaft kann eine bedeutende Herabsetzung des schädlichen Einflusses der Exhalations-produkte erreicht werden, während gleichzeitig die Forschung der ursprünglichen Vegetationszustandes gesichert ist. 4. Nach Feststellung der toxischen Emissionen und ihrer schädlichen Wirkung ist es unerläßlich, einen Druck auf alle Beteiligten auszuüben, um die Menge der von der Quelle ausströmenden Exhalationsprodukte mittels technologischen, lufttechnischen und Rechtsmaßnahmen zu verringern. 5. Die Untersuchung des Einflusses der Exhalationen auf die Vegetation kann in verschiedenen Richtungen folgen. Deren Grundlage muß aber immer eine ökologisch fundierte floristisch-phytogeografische und geobotanische Forschung sein. 6. Der Umfang und die Intensität der geschädigten Gewächse erfordert eine erhöhte Aufmerksamkeit des Studiums der Produktion und Produktivität der durch die toxischen Stoffe beeinflußten Gewächse, auch im Rahmen des Internationalen Biologischen Programms. Es wird notwendig sein, diese Problematik als einen spezifischen Anteil des IBP, Sektion PT und PP zu betrachten, um damit auch die internationale Zusammenarbeit zu sichern. 7. Offen bleiben die Fragen nach einem großzügigen internationalen Informationsaustausch und eine enge Zusammenarbeit auf dem Gebiet der Dokumentation und der Bibliographie, sowie über die Möglichkeiten eines direkten Austauches von Informationen und Ansichten auf weiter internationaler Grundlage. Es wäre wünschen-wert, eine internationale Organisationsbasis zu schaffen, die gewisse Pflichten in dieser Richtung auf sich nehmen könnte.
Summary The study of damages caused by air pollution on wild plants and plant communities
Toxic exhalations influence both the single species (wild plants and agricultural crops) and the vegetation as a whole. This often results in important changes in the landscape. Relatively little attention has as yet been paid to the wild flora; a survey from literature on this subject is given.
The problem of toxic exhalations is rather complex, as the effects of various substances differ and mixtures often occur. To study these effects, the original, undamaged vegetation should be the starting point. Such a study has to result in predictions on the influence to be expected from newly planned industries and it has to form the base for technical and legal measure restricting the damages as far as possible.
190

Afterwards researches on the effect of exhalations on the vegetation may proceed in various directions; on the plant communities, on the single wild plant species, or on agricultural or horticultural crops. Next to this, increased attention has to be paid to the study of plant production as influenced by toxic substances, within the framework of the International Biological Programme, to be included as a special part of the sections PT and PP to ensure international co-operation.
Better information exchange seems urgent. A closer contact is suggested between documentation bodies' and it is argued that some international organization should be established for this purpose.
Resume L'étude des dommages causés par la pollution de l'air aux plantes agrestes et aux communautés végétaux
L'influence des exhalations toxiques sur les plantes non-cultivées et sur la végétation intégrale n'est pas suffisament observée. Il est nécessaire de résoudre les problèmes alliés en étudiant tous les éléments qui portent au milieu de l'homme, de toute matière toxique qu'elle soit.
On peut attendre une diminution partielle de l'influence nuisible des produits de l'exhalation par une répartition adéquate de l'industrie dans le paysage et au même temps s'assurer que des recherches scientifiques nécessaires sur la végétation soient exécutées.
Après une constatation des émissions toxiques et leur action nuisible, le développement de prescriptions technologiques pour l'industrie est indispensable.
L'investigation de l'influence de l'exhalation sur la végétation peut poursuivre différentes directions qui devraient être en relation chronologique. La base pour toutes ces investigations est la recherche géobotanique et phytogéografique florale. À coté de cela l'étude de la production et la productivité des plantes cultivées par des matières toxiques sera nécessauire, aussi dans le cadre du programme biologique international de l'IBP, sections PT et PP.
L'échangé d'information internationale à grande échelle pourrait jouer son rôle et il serait désirable la création d'une base d'organisation internationale, qui puisse porter certains devoirs dans cette direction.
Literatur
Antipov. V. G. 1956. Sad i ogorod 1: 74. Benedict, H. M. und W. H. Breen. 1955. Proc. 3rd natn. Air Pollut. Symp. 177-90. Bobrov. R. A. 1955. Science 121: 510-1. Borsdorf. W. 1960. Phytopath. Z. 38: 309-15. Gorham, E. und W. Gordon. 1960. Can. J. Bot. 38: 307-12. Hajdük, J. 1961. Biológia. Bratisl. 16: 404-19. Hajdùk, J. 1963a. Sammelschr. Materialien Symp. Problematik der Exhalate in der Slowakei 40-9. Hajdük, J. 1963b. Sammelschr. Materialien Symp. Problematik der Exhalate in der Slowakei 31-9. Hajdük, J. 1966. Biológia, Bratisl. 21: 421-7. Hauskrecht, I. und J. Hajdük, 1966. Biológia, Bratisl. 21: 676-80.
191

Kendrick, J. B. et al. Calif. Agric. 10: 9-10. Kulagin, Ju. Z. 1964. Sb. Ochrona prir. Urala 4: 175-87. Leitenberger, L. 1949. Mitt. ehem. Forschinst. Ind. 3: 1-3. Lux, H. 1964. Arch. Forstw. 13: 1215-23. Navara, J. und Z. Holub. 1967. Biol. Arb. SAW. O'Gara, P. J. 1922. Ind. Engng. Chem. 14: 744. Stoklasa, J. 1923. Die Beschädigung der Vegetation durch Rauchgase und Fabrikexhalationen.
Berlin-Wien. Thomas, M. D. 1961. In: Air Pollution, Geneva. Thomas, M. D. und R. H. Hendricks. 1956. In: Air Pollution handbook. New York.
192

Discussion in Section 4 : The effects of air pollution on vascular plants
Reporter: V. Westhoff
Participants : Noirfalise (Chairman), Edwards, Mellanby, Ruzicka, Wentzel
The question is raised whether it has been investigated in Czechoslovakia if a certain selection of phanerogam strains resistant against air pollution can be found. The answer is that such research has not yet been effectuated; but it seems likely that the pollution effect depends on the ecotype and on the ecological amplitude of the taxon as well as on the edaphic and microbiotic changes in the biotope caused by pollution.
As to the question if the resistance degree is linked to the specific leaf structure of the taxa in question the answer is, that this has not yet been investigated either.
Another group of questions relate to the problems whether the pollution effect on the phytocenose is a direct or an indirect one. In the latter case the effect may be working by physical changes in soil structure and by changes in the nitrification ecosystem. The answer is that both direct and indirect effects are present.
At present, in Czechoslovakia two research groups are working together: one is dealing with the field study of changes in coenoses caused by pollution, the other with physiological and biochemical laboratory investigations. According to this joined research, the character, the degree, and the rate of the effect vary according to the differences in taxa and in the toxines. An example of a direct effect is the inhibition of the uptake of water by roots.
But indirect effects, via the soil microflora, preponderate. They are very different on acid, neutral and alkaline soils. It was observed, that immission of SO2 into the soil decreased the number of fungi and especially that of autochthonous fungi, whereas the Actinomycetes increased. If however the substrate was manured, a rich allochthonous mycoflora replaced the autochthonous one. So the influence of the cultivation of the substrate is obvious. It can be said that soil microflora is a better pollution indicator than phanerogams are.
A last question concerned the micrometeorological research on the speed of the wind, responsible for differences in pollution effect within short distances : strong winds may have a much more pronounced influence than light ones. The answer is that wind velocity certainly exerts a great influence and that its local variation largely depends on the relief of the area. This is a matter of mesoclimate more than of microclimate in a proper sense. Exact direct measurements of this factor have not been yet been carried out by the Czechoslovakian research workers themselves; their results are based on measurements of the Hygienic Service.
193

Section 5 : The effects of air pollution on non-vascular plants

The influence of air pollution on bryophytes and lichens1
J. J. Barkman
Agricultural University, Laboratory for Plant Taxonomy and Geography, Biological Station Wijster, the Netherlands
Abstract
Since only few data are known on damage caused by air pollution to algae and fungi, this paper deals mainly with its effect on bryophytes and lichens, especially epiphytes. The decline of the epiphytic flora and vegetation in the Netherlands during the last hundred years and the formation of 'epiphyte deserts' in and around towns in Europe and America are discussed. Both dryness of town climate and air pollution are to be held responsible, with the latter as the main factor. The physiological basis of the high sensitivity of bryophytes and lichens to air pollutants, as compared with flowering plants, is discussed, as well as the influence of rain on pollution effects. One of the effects of S02, viz. increasing acidity of plants and substratum, is given special attention. Bryophytes and lichens show a wide range of specific sensitivity. Therefore, epiphytic vegetation maps can give an approximate idea of the gradation of pollution levels and their pattern in a certain area. This is elucidated by the example of Belgian Limburg.
Among algae and fungi not a single case is known in the Netherlands of species that have become rare or extinct as a result of air pollution. In literature, as far as known, only one case is mentioned for fungi, viz. the killing of a wheat rust near an oil refinery in Sweden (Skye, 1958). It is possible that some algae and fungi are actually damaged by air pollution in nature, for Leblanc observed visible damage to both components in lichens by fumigation with SO2. It is questionable, however, whether these results may be applied to free-living algae and fungi. Besides, the concentrations he used (5 p.p.m.) are much higher than those occurring even in heavily polluted areas.
Bryophytes and lichens are obviously far more sensitive, especially those living on trees. A number of terrestrial bryophytes and a few terrestrial lichens have disappeared from stations where the other site factors apparently did not change. Epiphytic lichens have suffered to a far greater extent. In the past hundred years the Dutch flora has lost 3.8 % of its flowering plant species, 15 % of the terrestrial bryophytes, 13 % of the epiphytic bryophytes and no less than 27 % of the epiphytic lichens (these figures refer to the situation in 1954, so things may be even worse now.). Both xerophytic species (e.g. Ovthotrichum pumilum, Caloplaca cerina) and hygrophytic species (e.g. Riccanlia palmata, Lobaria pulmonaria, Parmelia vittata) have become extinct ; neutrophytic and nitrophytic species like Caloplaca ferruginea, Physcia ciliata and Ramalina pollinaria as
1. Communication nr 143 of the Biological Station Wüster
197

well as acidophytic-nitrophobous species such as Ulota ludwigit, Pyrenula nitida and no less than eight Usnea species have disappeared from the Netherlands.
Many other species are much rarer nowadays; 28 epiphytes with a total of 438 extinct localities. Their extinction has followed a definite pattern: (1) The sylvatic, hygrophytic, usually acidophilus and nitrophobous epiphytes have 'retreated' to the (North) Veluwe in the centre of the country, which is the largest area of deciduous woods in the Netherlands; (2) The xero- and photophytic, neutrophytic and mostly nitrophytic way-side tree epiphytes have 'retreated' to the sea coast, especially to the islands in the north (Wadden or Frisian islands) and to those in the south (Zeeland).
Often species of one genus behaved quite differently. Caloplaca cerina, for instance, has been reduced from 14 localities to zero, whereas C.phlogina has not suffered at all. Similar differences are observed in 18 pairs of allied species, belonging to 14 genera.
In addition to the number of localities, abundance and vitality often show a marked decline. In 1870, specimens of Usnea spp. of up to 50 cm long have been found in the Netherlands, whereas recent collections never exceed 10 cm. Graphys scripta, in good health in the last century as testified by herbarium specimens, is now almost invariably found covered with the green alga Protococcus viridis. Ar.aptychia ciliaris, before 1925 fertile in 78 % of its Dutch localities, was so in only 15 % of its localities around 1950. Near Tveiten (Oslo) Evernia prunastri was 6 cm long and fertile in 1869, only 3 cm long and sterile in 1930; in the same station Ramalina fraxinea was 17 cm long in 1869, 2.5 cm in 1930; the diametei of its apothecia decreased from 6 to 1 mm (Haugsjâ, 1930). Again, the decrease in frequency and vitality affected both xerophytic and hygrophytic species, both acidiphytic and neutrophytic species.
Air pollution must be considered one of the main causes of this decline and not reclamation or drainage, for 1. a good deal of the extinct species were xerophytic, 2. the epiphytic vegetation also deteriorated in woods and on way-side trees that did not undergo any significant change, 3. after 1850 deforestation in the Netherlands was negligible, afforestation considerable, 4. climate has not become drier in the past hundred years, 5. industrialization in the Netherlands started about 1850 and assumed large proportions since 1900, 6. polulation density and intensity of motorized traffic increased considerably in the last 30 to 40 years, 7. the decline of the epiphytic flora and vegetation was most pronounced near big towns, factories and highways, resulting in the formation of so-called epiphyte deserts.
Amsterdam provides a typical example. The following 55 species of epiphytes, which in 1900 occurred in the town of Amsterdam or within a few miles around it, are now extinct in that area: Bryophytes: Antitrichia curtipendtda, Campylium hispididum var. sommerfeltii, Cryp-haea arborea, Frullunia dilatata, Leucodon sciuroides, Madotheca platyphylla, Ortho-trichum lyeili, obtusifolium, pumilum, schimpen', speciosum, stramineum, striatum and teneUum, Pylaisia polyantha, Radula complanata, Scleropodium caespitosum, Tortida
198

laevipila, latifolia and papulosa, Ulotabruchii, U. phyllantha and Zygodon viridissimus. Lichens: Anaptychia ciliaris, Arthonia lurida and radiata, Arthopyrenia biformis and gemmata, Baeidia hiteola, Buellia canescens, Caloplaca cerina, citrina, ferruginea and pyracea, Collema fragrans and nigrescens, Evernia pnmastri, Opegrapha atra, betulina, cinerea, diaphora, fuscella, publicaris and rufescens, Parmelia caperata and saxatilis, Physcia aipolia, dementi, leptalea and pulvendenta, Ramalina farinacea, fastigiata, fraxinea and pollinaria, and Usnea hirta.
From 1900 to 1968 the population of Amsterdam increased only from 511,000 to 858,000. At present the epiphytes mentioned above are absent even from the environs of towns with far less than half a million inhabitants. The death of these species, therefore, is more likely to be due to increase of industrialization and motorized traffic than to increase of the population only.
Decline of epiphytic vegetation has been examined in various cities in Europe (Berlin, over a period of 15 years; Hamburg 23 years; Stockholm 30 years; Uppsala 35 years; Munich 50 years; Helsinki 84 years; Oslo 90 years). All cities show a considerable growth of their epiphyte desert. These epiphyte deserts often are elliptic with the main axis of the ellipse directed SW-NE and the source of pollution located near the SW end (see fig. 1). This is probably due to the prevailing south-western winds, carrying smoke and toxic gases to areas NE of the cities. Each desert is surrounded by a struggle zone where lichen vegetation is still present on the trees, although distinctly impoverished. Epiphyte deserts have now been mapped and published for 47 towns and villages, mainly in Poland (25), Austria (7) and Germany (6). Outside Europe only Montreal and Caracas have been investigated in this respect.
Epiphyte deserts increase progressively in size with the size and population of the towns. In 1890 Munich had a population of 350.000 inhabitants and a desert of 8 sq.km; in 1956 it had 1,000,000 inhabitants and a desert of 58 sq.km (Mägdefrau, 1960). So the population increased by a factor 3, the desert by a factor 7. In 1962 Hamburg had a population of 1,800,000 and an epiphyte desert of 550 sq.km. (Villwock, 1962). The size of epiphyte deserts increases from 10-20% of the built-up area in medium-sized towns to 40% or even 74% (Hamburg) in big cities. The number of epiphytic lichen species, however, is not necessarily inversely proportional to the size of the towns: Bonn has only 10 species, Vienna 14.
All maps clearly show that parks and woods within the towns have a richer epiphytic vegetation than other areas. In Vienna and Zürich it has been observed that in the city parks and avenues lined with trees possess an epiphytic flora if they are connected with woods outside the town area. On the other hand, they are very poor if isolated from these woods. This seems to indicate that accessibility also plays a role.
The first experimental work was done by Arnold (1891-1901), who transferred epiphytic lichens from rural sites to the city of Munich and observed their death. The experiment was repeated and refined by Brodo (1961) in New York; the lichens were moved from more or less unpolluted areas on Eastern Long Island to a series of stations in a transect towards Brooklyn. He obtained similar results. Leblanc and Rao (1966) transferred bryophytes and lichens to the environs of huge foundries near Sudbury
199

Fig. 1. Epiphytic Vegetation in the Netherlands. Black : big and medium-sized towns and important industrial areas Dotted : epiphyte deserts White: epiphytic vegetation poor to locally subnormal (transitional zone) Single hatched : epiphytic vegetation normal Cross-hatched: epiphytic vegetation rich and luxuriant
200
(Ontario) and noticed considerable damage after one year. These experiments, however useful they may be, cannot clarify the causes of the
adverse effect of towns. In towns light intensity, especially the UV fraction, is often reduced. Climate is much drier and warmer than in the countryside and air pollution far greater. Light intensity is still much higher than the minimum requirement of most epiphytes, so that this factor can be disregarded. However, epiphytes, particularly lichens, are sensitive to both drought (absence of dew and wet fog in towns) and air pollution. The literature on the subject is burdened with vehement disputes on the question whether drought or pollution is responsible. It is quite obvious now that both factors are involved and that air pollution is the main cause of epiphyte deserts. Although Rydzak (n.p.) is quite right when he remarks that in all fumigation experiments with epiphytes so far SOa concentrations have been used largely exceeding actual conditions in towns and highly industrial areas, the influence of air pollution is yet undeniable. It is demonstrated mainly by the following facts. 1. Usnea species are absent even from humid mountain forests, if sulphate concentration of the rain is high (Mrose, 1941 ). 2. Epiphyte deserts are also found around isolated factories outside towns, even in wooded country, for instance in Sweden (Skye, 1958), Bavaria (Schmid, 1956), Dutch and Belgian Limburg (Barkman, 1958, 1963). Such deserts may also occur in humid forests in and near towns, e.g. the Pfennig Berg near Linz (Bortenschlager and Schmid, 1963) and the île des Sœurs, a wooded island in the St. Laurent river within the town of Montreal, an island with a high atmospheric humidity throughout the year (Leblanc, 1960). 3. Within towns industrial areas are often poorer in lichens than residential areas. This has been observed in Oslo, Uppsala, Vienna, Zurich and Caracas. 4. Epiphyte deserts often extend much too far outside towns to be possibly explained by town mesoclimate. The desert around Rotterdam, for instance, is no less than IS km wide and 40 km long (Barkman, 1958). The influence of Birmingham is still visible at 32 km from the city (Jones, 1952). 5. Town deserts are comparatively larger in humid climates (Netherlands, England) than in more continental climates like east Sweden, Poland, Hungary and Austria. If drought were the limiting factor, the opposite would be expected. But this curious fact fits in extremely well with the experimental results obtained independently by Syratt, Leblanc and Coker. All three authors recently found that bryophytes and lichens are more sensitive to SO2 in a humid state than in dry condition, when there is hardly any metabolism and consequently less gas exchange.
The high sensitivity of bryophytes and lichens, as compared with flowering plants, is probably due to the following circumstances. 1. They lack an impermeable cuticula as well as regulable stomata. Gas exchange therefore takes place freely over the entire surface. 2. Most toxic gases in the atmosphere are concentrated in rain water, since they are more soluble than oxygen and nitrogen. Now, bryophytes and lichens absorb rain water directly with their whole surface, vascular plants indirectly, i.e. after it has been filtered through the soil, where it looses much of its toxic properties.
201

3. Most vascular plants are active in summer only, when air pollution level is low, owing to thermic air currents diluting and carrying away the exhaust gases and smoke from chimneys. They either shed their most sensitive organs, the leaves, in autumn, or hibernate underground as seeds, bulbs, or rhizomes. The few evergreen vascular plants, e.g. most conifers and Ericaceae, are on the whole rather sensitive to air pollution. Bryophytes and lichens are evergreen and have a 'drought sleep' during spells of dry weather which are most frequent in summer. They have an active metabolism in autumn and winter, thanks to the humid conditions and to their very low temperature optima for both respiration and photosynthesis. Now, winter is the very season when air pollution is great, owing to heating of the houses, temperature inversion and frequent fogs. Clouds are formed at lower heights in winter and hence more polluted; so is rain. Hoarfrost is even richer in sulphur than snow and rain, since it is formed at ground level. All these facts must affect epiphytes in winter.
Rain has a twofold effect upon epiphytes. It concentrates the toxic gases and at the same time clears the atmosphere. Epiphytes (and epilithes) which are not exposed to rain (underside of big, slanting tree boles; overhanging, dry rock faces) profit by the second effect. Those exposed to rain, get a much greater amount of pollution in a short shower, but it may be washed away by prolonged spells of rain, as was stated experimentally by Me Intire, Hardin and Hester (1952).
On the basis of their data I have made a tentative graph representing the influence of rain on the pollution level of anombrophytic and ombrophytic epiphytes (fig. 2). It shows that the former usually have a lower pollution level, and, what is probably even more important from a biological point of view, they are subject to less variation in pollution level than the latter. Since it are often the sudden changes in conditions that are harmful to plants, it may be assumed that on the whole rain has an adverse effect on epiphytes in polluted areas. Therefore, in such areas it must be of advantage if the epiphytes, exposed to rain, have a greasy, water repellent surface and use water vapour as their main source of water supply. This is the case with strongly sorediose crusta-ceous lichens. It is therefore interesting that in these very areas of high pollution level the non-sorediose lichen Lecanora varia is replaced by the strongly sorediose Lecanora conizaeoides ( = L.pityrea), which, incidentally, is the most toxitolerant lichen anyhow. This lichen is only wetted after some time, when the rain water is probably unpolluted and so the lichen will be washed clean. The very toxitolerant alga Protococcus viridis, too, is only wetted after it has rained for some time. In some other cases town conditions seem to induce sorediosity in species normally lacking soredia, but Rydzak (1957) found that Parmelia physodes, which is normally sorediose, lacks soredia in the centre of Zakopane (Poland). It must also be observed that a number of anombrophytic lichens, such as Ramalina duriaei, Opegrapha spp., Lepraria candelaris, and particularly many Caliciaceae, growing on dry undersides of tree boles, are nevertheless sensitive to air pollution, often as much as ombrophytes, and have disappeared from many localities in the last hundred years.
Very little is known on the specific influence of different pollutants. Research on the influence of HF, NO», CO, ozone and organic peroxides on epiphytes is urgently needed. Experimental research (fumigation) and field measurements (air sample ana-
202
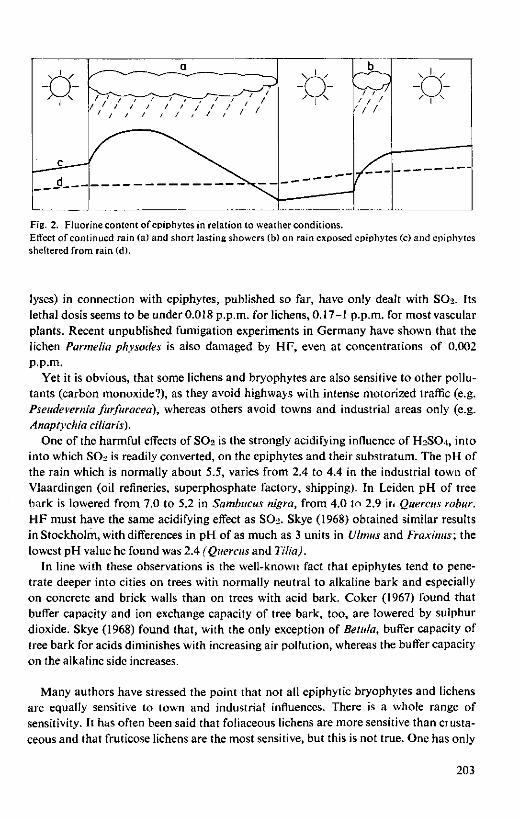
-ö- -Ö: / / I I
•' / /
u
Fig. 2. Fluorine content of epiphytes in relation to weather conditions. Effect of continued rain (a) and short lasting showers (b) on rain exposed epiphytes (c) and epiphytes sheltered from rain (d).
lyses) in connection with epiphytes, published so far, have only dealt with SO2. Its lethal dosis seems to be under 0.018 p.p.m. for lichens, 0.17-1 p.p.m. for most vascular plants. Recent unpublished fumigation experiments in Germany have shown that the lichen Parmelia physodes is also damaged by HF, even at concentrations of 0.002 p.p.m.
Yet it is obvious, that some lichens and bryophytes are also sensitive to other pollutants (carbon monoxide?), as they avoid highways with intense motorized traffic (e.g. Pseudevernia furfuracea), whereas others avoid towns and industrial areas only (e.g. Anaptychia ciliaris).
One of the harmful effects of SO2 is the strongly acidifying influence of H2SO4, into into which SO2 is readily converted, on the epiphytes and their substratum. The pH of the rain which is normally about 5.5, varies from 2.4 to 4.4 in the industrial town of Vlaardingen (oil refineries, superphosphate factory, shipping). In Leiden pH of tree bark is lowered from 7.0 to 5.2 in Sambucus nigra, from 4.0 to 2.9 in Quercus robur. HF must have the same acidifying effect as SO2. Skye (1968) obtained similar results in Stockholm, with differences in pH of as much as 3 units in Ulmus and Fraxinus; the lowest pH value he found was 2.4 (Quercus and Tilia).
In line with these observations is the well-known fact that epiphytes tend to penetrate deeper into cities on trees with normally neutral to alkaline bark and especially on concrete and brick walls than on trees with acid bark. Coker (1967) found that buffer capacity and ion exchange capacity of tree bark, too, are lowered by sulphur dioxide. Skye (1968) found that, with the only exception of Betula, buffer capacity of tree bark for acids diminishes with increasing air pollution, whereas the buffer capacity on the alkaline side increases.
Many authors have stressed the point that not all epiphytic bryophytes and lichens are equally sensitive to town and industrial influences. There is a whole range of sensitivity. It has often been said that foliaceous lichens are more sensitive than crusta-ceous and that fruticose lichens are the most sensitive, but this is not true. One has only
203

to compare the sequence of area limits of epiphyte species near various towns, as summarized by Barkman, 1958, table IX (p. 119). It is also obvious from the list of lichens that have become extinct in and near Amsterdam, more than half of which are crustaceous. That the statement about sensitivity of crustaceous versus foliaceous lichens is not generally true is particularly well illustrated by the work of Skye (1968): among the 107 epiphyte lichen species, previously found in Stockholm and not found by the author, no less than 87 are crustaceous. It is also evident from this publication that at present Parmelia physodes penetrates deep into the city of Stockholm, and Alectoria jubata fairly deep, whereas crustaceous lichens such as Lecanora carpittea avoid the polluted centre or (Bacidia luteola) even the transitional (struggle) zone. Skye also found that species with a high buffer capacity against acids penetrate deeper into Stockholm than those with a low one.
Chemical analysis of air pollution levels in a large area is time-consuming. Concentrations of sulphur dioxide and other pollutants are subject to strong seasonal fluctuations and may change rapidly with weather conditions, activity of factories, intensity of house heating, etc. At each point, therefore, numerous air sample analyses must be made throughout the year. The distribution pattern of the (long-living) epiphyte species in such a region, however, can be regarded as the visualized expression of, among other factors, average pollution levels over a number of years.
Thanks to the great range of sensitivity among epiphytes, a qualitative gradation of pollution levels is possible. Such a gradation, based on epiphytes for the town of Bonn, gave exactly the same results as a map, indicating climatic health zones and drawn up independently on the base of meteorological and medical data (Steiner and Schulze-Horn, 19551.
Similar investigations were carried out by the author in the central part of the province of Limburg, Belgium (Barkman, 1963). In one month the epiphytic vegetation in a region of 1000 sq.km was mapped. It was based upon inventories of 159 evenly distributed stations. In each station all types of habitat (isolated and wayside trees, parks and orchards, forests) and all species of trees present were examined. This yielded a total of 118 species, grouped into ten more or less well developed associations. Vegetation mapping was carried out on a scale of 1:100,000 and included 15 legend units. Often these units do not correspond with associations, but with fragments or association complexes.
Two series of units could be distinguished: a series of the nitrophytic, xerophytic Parmelietum acetabulae and a series of the nitrophobous, mesophytic, acidiphytic Parmelietum furfuraceae, both with their successive degradation phases. The presence of these associations obviously depended on soil, exposure, tree species, and human management, not on degree of air pollution. Both epiphyte communities showed gradual impoverishing towards the sources of pollution in this region, such as towns, coal mines, chemical factories, zinc factories. It proved therefore not true, that in polluted areas nitrophobous epiphytes are replaced by nitrophilous, as often suggested in literature. Skye (1968) arrived at the same conclusion.
Vegetation types 1, 2 and 3, occurring in the most polluted areas, were so much impoverished, that they could not be attributed to either the nitrophytic Parmelietum
204

acetabulae or the nitrophobous Parmelietuin furfuraceae. If a map of the epiphytic vegetation is to be used to give an impression of pollution
pattern, other influences than pollution should be excluded. The method naturally fails in treeless areas or areas with afforestations of alien species, which are unfavourable to epiphytes such as Pinus, Picea, Larix, Pseudotsuga, Robinia, Aesculus, Quercus rubra and Populus canadensis. Also, the map should first be carefully compared with geological, geomorphological, and pedological maps, as well as maps of the terrestrial vegetation (particularly number, size and distribution of woods) and land use maps (difference in epiphytic vegetation on wayside trees in meadows and in arable fields).
If these factors are taken into consideration, a correlation of both epiphytic vegetation and epiphytic flora (numbers of species per area unit) with pollution sources in Limburg is evident, with the exception of a dynamite factory, which had a rich vegetation. This, however, was the only recently built factory in the region! The epiphyte deserts are elliptic with the source located in the SW part. Again with one exception: the zinc factory at Rotem, with the desert not situated around the factory but at 1,5-3 km NE of it. This factory is the only one in the region not situated on a plateau or in a valley, but at the steep, eastern edge of a plateau, dropping 30 m into the Meuse valley. Hence, these 30 meters have to be added to the effective height of the chimneys, when the wind is blowing from the west, the prevailing wind direction. Consequently, the main immission of SO2 is at some distance from the factory. A similar phenomenon has been observed near the blast furnaces of Umuiden (Netherlands), where damage to bulb fields and strawberry cultures is greatest at 2 km distance to the NE. Here the topography is flat, but the chimneys are much higher than at Rotem, namely 60-100 m.
The epiphytic vegetation of Limburg yielded a better correlation with location of pollution sources than the epiphytic flora. A rough impression of pollution levels could be obtained by comparing the vegetation types with those in areas with a known pollution level or a known level of damage to agriculture or human health. It was thus possible to give an advice for the industrial planning of Belgian Limburg. On the basis of the epiphytic vegetation the area was classified into three categories : 1. Areas with little pollution where more factories can still be built. 2. Areas with moderate pollution. Building et' new factories not recommended, but special measures for improving air quality not needed. 3. Areas with heavy pollution. !t is recommended either to remove or close down some of the factories or mines, or to prescribe more stringent measures to reduce emission of pollutants from the chimneys.
Admittedly this method is not very exact, but it may be useful in cases where rapid decisions must be taken on the location of new industries. Much would be gained, however, if we knew the exact limits of SO2 and H F concentrations tolerated by a number of epiphyte species under otherwise natural conditions. If these limits could be determined by fumigation and transplantation experiments, epiphytic vegetation maps could possibly be 'translated' into pollution maps.
205

Résumé L'influence de la pollution de l'air sur les mousses et les lichens
Les bryophytes et les lichens, notamment ceux vivant sur les arbres, sont beaucoup plus sensibles à la pollution atmosphérique que les algues, les champignons et les plantes supérieures. Depuis un siècle, la flore néerlandaise a perdu 3,8% de ses espèces de Phanérogames, 15% de ses bryophytes terrestres, 13% de ses bryophytes epiphytes et 27% de ses lichens epiphytes. Bon nombre d'espèces sont devenues beaucoup plus rares; en général, elles se sont repliées, soit vers le centre du pays (la région la plus vaste de foiêts décidues), soit vers la côte. Beaucoup d'espèces sont à présent mal développées ou sont devenues stériles. Sont atteintes également, les espèces nitrophytes et anitrophytes, hygrophytes et xérophytes. Des espèces étroitement apparentées sont souvent atteintes à un degré fort différent.
La pollution atmosphérique doit être considérée comme une des causes principales, le déclin étant le plus accentué aux alentours des grandes villes, des usines et des routes principales ('déserts epiphytes'); cela vaut également pour d'autres pays européens.
Ces déserts sont souvent de forme elliptique; l'axe principal est pointé en direction SO-NE et la source de pollution située près de l'extrémité SO de l'axe, vu la dominance des vents SO. Ils s'agrandissent progressivement en fonction de la croissance de la population de la ville voisine.
Les premières expériences ont été exécutées par Arnold (1891-1901), qui transférait des lichens epiphytes de sites rurales à la ville de Munich et observait leur destruction. L'autre jour, l'expérience a été répétée à New-York, avec les mêmes résultats.
Cependant, ces expériences n'expliquent pas les causes de l'influence létale des villes. Probablement, l'intensité réduite de la lumière, la sécheresse et la pollution atmosphérique jouent un rôle semblable.
Toutes les expériences de fumigation ont été exécutées avec des concentrations SO2 dépassant largement les conditions de la ville. Cependant, les faits suivants montrent indéniablement l'influence de la pollution atmosphérique: 1. Les Usnées sont absentes, même dans les forêts humides de la montagne, dès que la teneur en sulfate de la pluie est élevée. 2. Les déserts epiphytes se trouvent également aux alentours des usines isolées. 3. Dans les quartiers industriels des villes, les lichens sont souvent plus rares que dans les quartiers résidentiels. 4. Les déserts epiphytes s'étendent souvent trop loin en dehors des villes pour pouvoir être expliqués par le mésoclimat urbain. 5. Les déserts urbains sont plus vastes dans les climats humides, comparés aux climats plus continentaux. Si la sécheresse y était pour quelque chose, on pourrait s'attendre au contraire. Cependant, ce fait s'accorde tout à fait avec les résultats obtenus par plusieurs auteurs, qui ont constaté récemment que les bryophytes et lichens en état humide sont plus sensibles à SO2 qu'en état sec.
L'un des effets nuisibles de SO2 est son influence très acidifiante sur le substrat, car les epiphytes ont la tendance de pénétrer davantage dans les villes sur les arbres à
206

l'écorce neutre ou alcaline (et surtout sur les murs en béton ou en briques) que sur les arbres à l'écorce acide.
La base physiologique de la grande sensibilité de bryophytes et de lichens, en comparaison avec les plantes vasculaires, est examinée.
L'influence spécifique des différents polluants sur les cryptogames est très peu connue. Il faut faire d'urgence des recherches sur HF , NO2, CO et les peroxydes organiques. Les expériences et les mesures sur le terrain en rapport avec des epiphytes n'ont été exécutées que sur SO2. Cependant, il est évident que certains lichens sont également sensibles aux autres polluants, parce qu'ils évitent les routes principales (par ex. Parmelia furfuracea), tandis que d'autres n'évitent que les villes et les régions industrielles (par ex. Anaptychia ciliaris). La dose létale de SO2 semble être au-dessous de 0,018 p.p.m. pour tous les lichens et de 0,17 à 1 p.p.m. pour les plantes vasculaires.
On fait souvent ressortir les différences spécifiques en 'poleotolérance' (probablement sensibilité SO2) entre les bryophytes epiphytes et les lichens, propriétés qui les rendent utilisables comme indicateurs de la pollution atmosphérique. Ainsi, en dressant la carte de la végétation epiphyte, on obtient une vue d'ensemble de la pollution atmosphérique sur une vaste région. Une telle carte, dressée pour la ville de Bonn, s'est avérée donner exactement les mêmes résultats qu'une carte indiquant les zones de santé climatique. L'auteur a dressé la carte de la végétation epiphyte dans la partie centrale du Limbourg belge et ceci dans le délai d'un mois. Cependant, de telles méthodes rapides ne reflètent que la distribution qualitative de la pollution atmosphérique.
La comparaison entre les communautés epiphytes examinées et celles des régions dont le niveau de pollution est connu, permettra de tirer quelques conclusions sur les mesures éventuelles à prendre en faveur de la santé publique ou de l'agriculture. C'est particulièrement important au cas où des décisions urgentes doivent être prises en vue de l'implantation d'industries nouvelles.
Zusammenfassung Der Einfluß der Luftverunreinigung auf Bryophyten und Flechten
Moose und Flechten, besonders die an Bäumen wachsen, sind weit empfindlicher gegenüber Luftverunreinigungen als Algen, Pilze und höhere Pflanzen. In den vergangenen hundert Jahren hat die holländische Flora 3,8 % ihrer Blütenpflanzen-Arten, 15% der terrestrischen und 13% der epiphytischen Bryophyten sowie 27% ihrer Flechten-Epiphyten verloren. Viele Arten sind bedeutend seltener geworden; in der Regel haben sie sich entweder in das Landesinnere (das Gebiet der größten Laubwälder) zurückgezogen oder zur Küste hin. Viele Arten kümmern oder sind heute steril. Es handelt sich im nitrophile und stickstoffmeidende, hygrophile und xerophile Arten. Nahe verwandte Arten werden oft in ganz unterschiedlichem Maße beeinflußt.
Die Luftverunreinigung muß als eine der Hauptursachen hierfür angesehen werden, da der Rückgang am deutlichsten ist im Bereich großer Städte, Fabriken und Hauptverkehrsstraßen ('Epiphyten-Wüsten'). Dies gilt auch für andere europäische Länder.
Diese epiphytenfreien bzw. -armen Zonen sind oft elliptisch, mit einer Hauptachse
207

von SW nach NO (entsprechend der Hauptwindrichtung) und einer Lage der Emittenten am Südwestende. Ihre Fläche nimmt progressiv zu mit de Einwohnerzahl der benachbarten Stadt.
Erste experimentelle Untersuchungen führte Arnold (1891-1901) durch. Er brachte epiphytische Flechten vom Lande nach München und beobachtete ihr Absterben. Vor kurzem wurde der Versuch in New York mit ähnlichen Ergebnissen wiederholt. Solche Unternehmungen lassen aber noch nicht die Ursachen des tödlichen Einflusses der Städte erkennen. Herabgesetzte Lichtintensität, Trockenheit und Luftverunreinigung können in gleicher Weise hierfür verantwortlich sein.
Begasungsexperimente wurden bisher mit SOa-Konzentrationen durchgeführt die zumeist die in den Städten vorhandenen übertrafen. Daß der Einfluß der Luftverunreinigung jedoch nicht zu leugen ist, mag man aus folgenden Tatsachen erkennen: 1. Usnea kommt nicht vor, auch nicht in feuchten Bergwäldern, wenn die Sulfat-Konzentration im Regen hoch ist. 2. 'Epiphyten-Wüsten' findet man auch um isoliert liegende industrielle Anlagen. 3. Innerhalb von Städten sind die Industrieviertel oft ärmer an Flechten als die Wohnbezirke. 4. Epiphytenfreie bzw. epiphytenarme Gebiete dehnen sich oft viel zu weit außerhalb der Städten aus, um möglicherweise mit dem städtischen Mesoklima erklärt werden zu können. 5. 'Epiphyten-Wüsten' im Bereich der Städte sind vergleichsweise größer in Gebieten mit humiden Klima als in solchen mit einem mehr kontinentalen. Wäre mangelnde Feuchtigkeit der begrenzende Faktor, so hätte man das Gegenteil erwarten müssen. Doch paßt dieser Sachverhalt gut zu den Ergebnissen verschiedener Autoren, die vor einiger Zeit herausfanden, daß Moose und Flechten im feuchten Zustand gegenüber SO2 empfindlicher sind als im trockenen.
Einer der schädlichen Einflüße des SO2 ist die Ansäuerung des Substrates, da Epiphyten die Neigung besitzen, eher auf Bäumen mit neutraler oder alkalisch reagierender Rinde (und besonders auf Mauern aus Beton und Backsteinen) in die Städte vorzudringen als auf saurer Baumrinde.
Die physiologischen Voraussetzungen der hohen Empfindlichkeit der Moose und Flechten im Vergleich zu den Blutenpflanzen werden erörtert.
Über die spezifische Wirkung verschiedener luftverunrtinigender Stoffe auf Kryp-togamen ist nur sehr wenig bekannt. Eine diesbezügliche Überprüfung von HF, NO2, CO und organischer Peroxide ist dringend notwendig. Experimente und Messungen im Zusammenhang mit Epiphyten sind bisher nur für SO2 durchgeführt worden. Doch ist es offensichtlich, daß einige Flechten auch gegenüber anderen luftverunreinigenden Stoffen empfindlich sind; so meiden einige (z.B. Parmelia furfuracea) Hauptverkehrsstraßen, während andere nur in Städten und Industriegebieten nicht zu finden sind (z.B. Anaptychia ciliaris). Die letale S02-Dosis scheint für alle Flechten unter 0,018 p.p.m., für die Gefäßpflanzen zwischen 0,17 p.p.m. und 1 p.p.m. zu liegen.
Es wird oft betont, daß die epiphytischen Moose und Flechten beträchtliche spezifische Unterschiede einer 'poleotolerance' (vermutlich S02-Sensibilität) zeigen, so daß sie als Indikatoren der Luftverunreinigung gebraucht werden können. Durch eine
208

Kartierung der Epiphyten-Vegetation kann so ein Überblick über die Luftverunreinigung in einem großen Gebiet erhalten werden. Eine bereits für das Stadtgebiet von Bonn angefertigte Karte scheint genau die gleichen Aussagen zu machen wie eine solche bioklimatischer Zonierung. Der Autor hat selbst die Epiphyten-Vegetation im mittleren Teil von Belgisch-Limburg in einem Monat erfaßt. Eine solche Schnellmethode gibt aber nur ein qualitatives Bild der Verbreitung der Luftverunreinigung. Ein Vergleich der Epiphyten-Gesellschaften mit denjenigen in Gebieten bekannter Beaufschlagung wird einige Schlüsse zulassen, wenn es um Maßnahmen geht im Hinblick auf den Schutz der Bevölkerung und der Landwirtschaft. Dies ist besonders wichtig im Falle notwendiger rascher Entscheidungen, z.B. bei der Ansiedlung neuer Industrien.
References
For complete references see Excerpta Botanica, Sectio B. Sociologica, vol. IV, 1: 59-87 and vol. VII, 1:5-18. See also Skye (1968).
Arnold, F. 1891-1901. Zur Lichenflora von München. Barkman, J. J. 1958. Phytosociology and ecology of cryptogamic epiphytes. Van Gorcum, Assen. Barkman, J. J. 1963. Verh. K. ned. Akad. Wet., afdeling Natuurkunde, 2e reeks 54(4): 3-46. Bortenschlager, S. und H. Schmidt. 1963. Ber. naturw.-med. Ver. Innsbruck 53: 23-7. Brodo, I. M. 1961. Ecology 42(4): 838-41. Coker, P. D. 1957. Trans. Br. bryol. Soc. 5: 341-7. Haugsjâ, P. K. 1930. Nyt Mag. Naturvid. 68: 1-116. Jones, E. W. 1952. Revue bryol. lichen. 21(1/2): 96-115. Leblanc, F. 1960. Écologie et phytosociologie des epiphytes corticoles du sud du Québec. Diss.
Montréal (mimeographed). Leblanc, F. and D. N. Rao. 1966. Bryologist 69(3): 338-46. Mägdefrau, K. 1960. Naturw. Rdsch. 6: 210-4. Mclntire, W. H., L. J. Hardin and W. Hester. 1952. Ind. Engng Chem. 44(1): 1365-70. Mrose, H. 1941. Bioklim. Beibl. 8: 58-60. Rydzak, J. 1957. Annls Univ. Mariae Curie-Sklodowska C 10(7): 157-75, 10(141:321-98. Schmid, A. B. 1956. Die epixyle Flechtenvegetation von München. Diss. München (mimeographed). Skye, E. 1958. Svensk bot. Tidskr. 52(1): 133-90. Skye, E. 1968. Acta phytogeogr. suec. 52. Steiner, M. und D. Schulze-Horn. 1955. Decheniana 108(1): 1-16. Villwock, I. 1962. Abh. Verh. naturw. Ver. Hamburg, N.F. 6.
209
Epiphytes and air pollution1
F. LeBlanc
Department of Biology, University of Ottawa, Canada
Abstract
The influence of two sintering plants on the epiphytic vegetation has been investigated. Epiphytic lichens and mosses are far more sensitive to S02 than most flowering plants. In large cities and in the vicinity of factories lichens and mosses are almost completely absent; they reappear little by little as one moves away from those pollution centers.
Epiphytes are good indicator species and can be used to determine the long-range effect of pollution in a region.
The sensitivity of epiphytes to atmospheric pollutants has been investigated by several workers. Barkman (1958) and De Sloover and LeBlanc (1968) have reviewed most of the pertinent literature. My research in this field has been mainly ecological and centered in three areas : Wawa and Sudbury in Ontario (in collaboration with my student D. N. Rao), and Montreal (with Prof. J. De Sloover of Louvain University, Belgium). Parts of these studies have already been published; only the most pertinent conclusions will be briefly outlined here. Those interested in our methods and results should consult the following publications: LeBlanc (1961), LeBlanc and Rao (1966), i*.ao and LeBlanc (1966 and 1967), De Sloover and LeBlanc (1968) and LeBlanc and De Sloover (1969).
Researches in the Wawa area
Wawa is located at the southern limits of the boreal forest at latitude 48 °N and longitude 85 "W, at an elevation of 210 m. The air pollution source is an iron sintering plant and the pollutants, mostly SO2, are carried from the point of origin by moisture-laden winds blowing off Lake Superior mostly towards the NE. Between 1957 and 1960 some 350 square miles of forest were destroyed by pollution in this region. Transects were made in all directions from the source of pollution and the following conclusions have been established : 1. In the vicinity of the sinter plant there exists severe damage to the forest vegetation,
1. This work was supported by a grant from the National Research Council of Canada. The author wishes to thank Professor J. Motyka and Dr I. Brodo who identified critical lichen specimens, and Mr B. R. Dreisinger who provided the pollution data.
211

a large epiphyte 'desert', a higher concentration of SO2 in the atmosphere and a significant increase in the acidity and sulfate concentration in surface-waters, soils and plant materials. On moving away from the stacks there is a gradual improvement in the epiphytic vegetation (both in coverage and frequency of species), a decrease in the concentration of SO2 in the atmosphere, and a decrease in the acidity and sulfate concentration in surface-waters, soils, and plant materials. 2. Appreciable SCh-concentrations have been found in the atmosphere at points up to 50 km NE of the sinter plant, the fequentcy of SO>-visitations in this area being governed by the topography and the persistence of prevailing SW winds. The incidence of high concentrations of the pollutant especially during the night and early morning hours is associated with the presence of fog, low wind velocity, high humidity and the absence of a temperature gradient. 3. Data obtained from lead peroxide-candles show a large decrease in average and maximum SCh-concentrations with distance, especially in the region of 16 to 54 km NE of Wawa (Fig. 1). The magnitude of concentrations found in the region are noticeably different and various pollution zones could be conveniently distinguished. 4. Vegetation damage is mainly concentrated NE of the sinter plant where no trees are present for a distance of 12 km; beyond this zone of severe damage, trees start coming up and gradually their number and crown density increase until the vegetation becomes characteristic of the region at a distance of 56 km. The plant species most tolerant to SO» are: Betula papyrifera, Populus tremuloides', Primus pensylvanica, Sambucus pubens, Pyrus decora, Salix humilis, Almts rugosa, Polygonum eilinode, Maianthemum canadense and Aster macrophyllum. 5. Some terricolous lichens and bryophytes are toxitolerant, and species such as Dicranella heteromalla, Pohlia nutans, Cladonia coniocraea, C. deformis and C. fioerkeana can grow on highly polluted soils (pH 3.4, sulfate-concentration 4.3 meq/ 100 g). 6. Epiphytes are absent within 16 km NE and 2.5 km N, NNE, ENE and ESE of the sinter plant. Beyond this epiphyte 'desert' corticolous lichens and bryophytes gradually appear, first on the bases of trees and then on the trunks. Nearest to the sinter plant, Bacidia chlorococca, Mycoblastus sanguinarius, Cladonia coniocraea and Parmelia sulcata are the only species and, apparently, these are the most toxitolerant epiphytes. Further away from the source of pollution the epiphytic flora gradually increases in richness. For example a transect made north of the sinter plant showed that the number of epiphytic species were 0, 3, 13, 15 and 16 on Betula papyrifera and 0, 1,3,3, and 11 on Pyrus decora at distances of 0.8, 4.0, 6.5, 11.2 and 24.2 km respectively. 7. A comparison of the degree of toxiphoby or sensitivity to pollution of various epiphytic species appearing on the trunk of trees on the line-transect NNE of the sinter plant reveals that species such as Usnea hirta, Cetraria oakesiana, Parmeliopsis aleurites, Paraleucobryum longifolium, Pertusaria multipuncta, Viola crispa and Usnea
2. Although Betula papyrifera and Populus tremuloides are very sensitive to SO= and their leaves will show necrosis ind bleaching of margins or intercostal areas, they are quite hardy and will resist fumigation longer than other trees, especially conifers.
212

20--25
16--20
O o
8--I0
2 -
0--0
— SQJ (meq/IOOg) in plants: L Pholio. 2. Betulo. 3. Cladonio
SO|(meq/l) in water
• S0|(meq/I00g) in soil
SOjtppm) in the atmosphere
— - Number of epiphytes
•50
.45--45
.40--40
35--35
.30- -30 s»
3- .25 r\J
O 05
05-
o-o
25 ^
ä> .o E
.20--20
I0--I0
O NE- 20 30 k m
40 50 60
Figure 1. Correlation between number of epiphytes and sulfate concentrations in surface-waters, soils, vegetations and concentration of S02 in the atmosphere along a NE transect from the source of pollution in Wawa, Ontario.
dasypoga are highly toxiphobous and the absence of these species can serve as an indicator of SOs-pollution. 8. The number of epiphytes as well as their coverage (percentages) are inversely proportional to the degree of pollution. In the area studied, five zones were arbitrarily
213

circumscribed based on the number of epiphytic species and the concentration of soil sulfate.
Zone 1. Sulfate concentration everywhere more than 1.4 meq/100 g; epiphytes absent.
Zone 2. Sulfate concentration between 0.9 and 1.4 meq/100 g; number of epiphytic species at any site ranges from 1 to 5. Bacidia chlorococca had the highest frequency on the trunks of trees and Cladonia coniocraea on the bases. A total of 14 species were found in this zone.
Zone 3. Sulfate concentration between 0.9 and 0.7 meq/100 g; number of epiphyte species at any site ranging from 5 to 15. Bacidia chlorococca and Hypogymnia physodes had the highest frequency on the trunks and again Cladonia coniocraea had the highest frequency on the bases of trees. A total of 60 species were found in this zone.
Zone 4. Sulfate concentration between 0.4 and 0.7 meq/100 g; number of epiphytic species at any one site ranging from 15 to 30. Alectoria scabra, Bacidia chlorococca, Cetraria pinastri, Evernia mesomorpha, Hypogymnia physodes, Parmeliospsis ambigua and Usnea variolosa had the highest frequency on the trunks while Cetraria pinastri, Cladonia coniocraea, and Ptilidium pulcherrimum had the highest frequency on the bases of trees. A total of 80 species were found in this zone.
Zone 5. Sulfate concentrations less than 0.4 meq/100 g. The number of epiphytic species at any site exceeds 30. Alectoria glabra, Bacidia chlorococca, Cetraria ci/iaris, Evernia mesomorpha, Hypogymnia physodes, Parmelia sulcata, Parmeliopsis hyperopia, Ptilidium pulcherrimum, Usnea dasypoga, U. subfusca, U. variolosa had the highest frequency on the trunks while Cetraria pinastri, Cladonia chlorophaea, C. coniocarea, Hypnum pallescens, Hypogymnia physodes, Mnium cuspidatum, Ptilidium pulcherrimum had the highest frequency on the bases of trees. A total of 79 species was collected in this zone. However, because zone 5 seemed to be completely outside the polluted area, no attempt was made to collect all the epiphytic species present in that area.
Researches in the Sudbury area
Sudbury is an important nickel mining center located in Ontario at latitude 40°N and longitude 81 °W. Iron and copper pyrites containing nickel sulfide are treated in three immense smelters on mutual distances of approximately 15 km. Although the smelter fumes, along with considerable amounts of SOa, are now emitted through large stacks 200 m high (this has not always been the case!), the pollution problem is still serious. The climax vegetation has been destroyed over a large area and injury to vegetation has been noted to occur as far as 40 km from the smelters.
Twelve years ago the Ontario Department of Mines established ten automatic SO2 Thomas recorders in strategic locations in this area and Dreisinger and McGovern (1966) have compiled the ground-level documentation, concentrations and duration of SO2 emanating from the three nickel smelters. This has lead to the following conclusions. 9. Within a radius of 10 km from the smelters, no epiphytes occur for the simple reason that all trees have been destroyed. Beyond this area trees exist but are widely
214

dispersed. Populus balsamifera is common and planted everywhere; it is the only tree species that seems to withstand the SO2 conditions present in this area. In general, Populus is not a genus whose species support a diversified epiphytic flora; Populus balsamifera less so than some of the others. Nevertheless, I have examined carefully at least 20 large individual poplars growing in the vicinity of the ten automatic SO2 recorders and at seven intermediate stations and found that the number of epiphytes at each station was inversely proportional to the quantity of SO2 recorded. In zone 1 where polution has been 'heavy' over the last 12 years (0.030 p.p.m. and higher) two species were present ; in zone 2 where pollution was considered as 'medium' (0.020-0.030 p.p.m.) three species were collected; in zone 3 where pollution was 'light' (0.010-
Epiphytes on Populus balsamifera in the Sudbury area.1
Affected area in square miles
Pollution conditions
12-year average S 0 2 in p .p.m.
Bacidia chlorococca Protococcus viridis Parmelia sulctata Cladonia coniocraea
Cetraria ciliaris Lecidea symmicta Amblystegium serpens
Hypogymnia physodes Ptilidium pulcherrimum Ramalina sp. Brachythecium refiexum Buellia stillingiana Caloplaca cerina Candelariella xanthostigma
Catillaria griffithii Cetraria pinàstri Drepanocladus uncinatus
Evernia mesomorpha Heterophyllium haldanianum Lecania cyrtella Leskea polycarpa
Parmelia caperata
Parmelia trabeculata Pertusaria sp.
Physcia aipolia Physcia grisea Physcia stellaris Rinodina halei Usnea variolosa Total number of species
1. 1 : rare, 2 : occasional, 3 : frequent, 4
Zone
I 135
heavy 0.030 +
2
1
2
: abundant .
II 403
medium
0.020-0.030
2 1 1
3
III 1026
light 0.010-0.020
4 3
3 2 2
1
1 1 1
1
1
1
12
IV
806
very light 0.005-0.010
27
215

0.020 p.p.m.) 12 species were present; and in zone 4 where pollution was 'very light' (0.005-0.010 p.p.m.) there were 28 species (see table).
Poplar and other tree species situated in an unpolluted area and on which epiphytes were growing abundantly were perforated with a hole-saw and 4.8 cm cores were plucked out. These cores (with their epiphytes) were transplanted onto trees in Sudbury in the vicinity of the SO2 recorders. A macro- and microscopic examination of these lichens and mosses after exposure to the influence of SO2 for one year, revealed the following changes: 10. Slight to severe damages to most of the epiphytes and especially marked reduction in the thickness of the thallus in Parmelia caperata and P. sulcata. 11. Formation of a thin layer of a whitish, crystalline and water-insoluble compound (perhaps a fatty substance) on the surface of the lichens thallus. The presence of such a hydrophobic substance on the surface could be a barrier to water absorption and gradually upset the moisture conditions of the thallus. 12. Incipient to total plasmolysis in Trebouxia cells, the algal symbiont. 13. Chloroplast injury in the algal cells ranging from sporadic brown spots on the surface to complete disappearance of the green pigment. The chloroplast damage of the algal symbiont in the transplanted thalli suggest hampering of the photosynthetic activity and consequently, a gradual emaciation of the thallus was observed. 14. Presence of oil-globules in Trebouxia cells. Perhaps the presence of oil in the algal symbiont enables the cells to resist desiccation, or maybe it is simply another manifestation of damage to the cell in an unfavorable environment. 15. Formation of chlamydospore-like bodies by the fungal symbiont especially in the lower cortex. It is assumed that such spores in the free-living fungi are formed in response to the onset of unfavorable conditions, such as a limitation of nutrients and desiccation. In the transplanted thalli, factors like desiccation, nutrient poor condition, and presence of SO2 could simultaneously affect sporulation.
Researches in the Montreal area
Although there exist no experimental proofs that the contaminated atmosphere of large cities has exerted any influence on the depauperization of the lichen flora it is a fact that this vegetation has completely disappeared from the center part of most of these cities and that its presence, degree of coverage and luxuriance in the outer parts appear, on the whole, related to its remoteness from industrial and heavily populated zones.
Unlike Sudbury or Wawa, it is not easy to pinpoint the source of atmospheric pollution in a large city like Montreal because contaminants are emitted into the atmosphere at hundreds of point-sources simultaneously. Professor De Sloover and I have mapped the long-range effect of phytotoxic air pollutants on the epiphytic vegetation of a large part of metropolitan Montreal and the following conclusions could be made: 16. In Montreal there exists a direct relation between the quality of the epiphytic vegetation and the location of heavy industries and residential centers. Five arbitrary zones
216

were delineated on the basis of the quality of the epiphytic vegetation at 349 stations. 17. The percentage of frequency of epiphytes in the mapped area is greater and greater as one moves from zone I to the outer zones, that is from the most polluted to the least polluted zones. In zone I, there were 12 species, most of which were located in one or two stations only; in zone II there were 25, in zone III, 44, in zone IV, 68, and in zone V there were 74. The mean number of lichens at each station in the five zones was 1,3,2.7,6.5, 11.6, and 17.1. 18. Fertility also seems to be affected by pollution. For example apothecia were not found on Physcia millegrana in zones I and II but were present in 5, 39, and 77 percent of the stations in zones III, IV, and V respectively. Leskea polycarpa (Fig. 2) was found sterile in zones I and II but in zones III, IV, and V it had capsules in 21, 60, and 76 percent of the stations. 19. There was also, in most cases, a gradual increase in coverage of the species as one moved away from the center of the city. For example the coverage (scale 1 to 5) for the following species gradually increased from zone I to zone V in the following manner: Leakea polycarpa 1, 1, 1.4, 2.2, 2.7; Physcia adscendens 1, 1.2, 1.8, 2.3, 3.3; and Xanthoriafallax 1, 1.5, 2., 2.8, 3.8.
Figure 2. Distribution of Leskea polycarpa in the Montreal area.
217

Laboratory experiments
An attempts has been made to determine the nature of the damage to lichen thalli exposed to 5 p.p.m. SO2 under varying moisture conditions for one hour. A morphological and chemical investigation of the algal symbiont presented the following features : 20. Abnormalities appeared, such as bleaching of the chlorophyll; permanent plas-molysis of the cells; and sporadic brown dots on the chloroplast, the latter most conspicuous in specimens exposed to SO2 at high humidities. These abnormal morphological features give evidence of cellular injury as a result of exposure to SO2. 21. Sulfurous acid, S04~", and Mg++ were present in the extracts of the SO2 exposed thalli. Sulfurous acid is an efficient bleaching agent and its presence in the thallus could be responsible for the loss of color in algal cells. The presence of SO3" and SO4 ~ in the thallus may produce a higher osmotic concentration outside the algal cells and thus cause plasmolysis. The acidic ions would presumably denature proteins of the algal cells, thus preventing deplasmolysis. 22. Sulfate concentration in the thallus is directly related to the relative humidity prevalent at the time of exposure of the thallus to SO2. At higher humidities, an increase in sulfate-concentration in the thallus implies a higher rate of absorption of SO2 and consequently, greater absorbed acidity and increased H+ concentration. 23. Presence of Mg++ in the thallus extract and brown dots on the chloroplast suggest that Mg++ has been removed from chlorophyll-a, converting it to phaeophytin-a. This conclusion is corroborated by the similarity of the absorption spectrum of chlorophyll extracted from the S02-exposed thalli to that of phaeophytin-a, with a maximum absorption at 667 mjj.. The acidic condition existing in the thallus perhaps causes this degradation by increasing the concentration of H f . These would displace the Mg atom from the chlorophyll molecule, transforming it to phaeophytin.
Sulfur dioxide causes significant and spectacular damages, both externally and internally to epiphytes, and thus the epiphytic vegetation is a good indicator of the degree of pollution by this gas. In the case of lichens, the algal symbiont appears to be highly vulnerable to SO2 and this probably explains why these organisms rank among the plants most sensitive to polluted atmospheres. Precise autoecological and experimental studies will be necessary to determine the threshold concentration of SO2 that the epiphytes can tolerate without being damaged, and to differentiate between the damaging effects of sulfur dioxide and ozone which may be created in the lower atmosphere as a byproduct of the photochemical oxidation of SO2 to H2SO4. Ecological surveys like the ones described in this paper or bioassays using native or cultivated plants for field monitoring to ascertain the presence or relative intensity of specific pollutants will always be useful in studying areas affected by pollution.
218
Résumé Les epiphytes et la pollution de l'air
Il semble qu'en général, les bryophytes et surtout les lichens épiphytiques soient plus sensibles aux pollutions atmosphériques que les plantes vasculaires.
Sudbury et Wawa sont deux localités en Ontario, Canada, où l'anhydride sulfureux a causé d'immenses dommages à la végétation. Une fonderie de fer est responsable de la pollution à Wawa. On a observé, sur un transect de plus de 60 km, une corrélation d'une part entre (a) la quantité de SO2 présente dans l'air, (b) la quantité de sulfate présente dans l'eau des lacs, le sol et la végétation, (c) le pH de l'eau, du sol, et de la végétation et d'autre part, entre le nombre, la couverture, la vitalité et la fréquence des epiphytes. En tenant compte de la quantité de sulfate dans le sol et du nombre d'espèces d'épi-phytes, cette partie de forêt boréale a été divisée en cinq zones.
Sudbury est un centre minier où l'on traite depuis longtemps de grandes quantités de minerai de cuivre. Les dommages causés à la végétation par le SO2 dans cette région sont immenses. Depuis 12 ans, dix automètres Thomas enregistrent les retombées d'anhydride sulfureux autour des trois fonderies. Nous avons étudié la végétation épiphytique de nombreux Populus balsamifera (le seul arbre qui résiste bien à la pollution dans cette région) situés près des automètres, et nous avons observé que le nombre, la vitalité et la couverture des espèces étaient indirectement proportionnels à la quantité de SO2 enregistrée par les automètres. Nous avons également 'transplanté' sur Populus près de 3 automètres, 42 morceaux d'écorce (provenant d'un endroit non pollué) sur lesquels poussaient une vingtaine d'espèces de mousses et de lichens. Après 4 mois, la plupart de ces plantes avaient déjà subi des dommages et après un an presque toutes étaient mortes.
Beaucoup d'écologistes ont observé que les epiphytes deviennent de plus en plus rares à mesures que l'on s'approche des grandes villes. Il nous semble certain que ce soit là un résultat de la pollution atmosphérique. Montréal est une ville où la pollution est particulièrement sérieuse. Même s'il est impossible d'établir une correlation entre une industrie spécifique et la végétation épiphytique d'une station, nous avons néanmoins pu constater qu'il y avait une correlation entre la localisation des industries ou des centres de densité des populations et la richesse ou la pauvreté des végétations épiphytiques.
Au laboratoire, nous avons exposé des thalles de lichens à 5 p.p.m. de SO2 durant 24 heures à différents degrés d'humidité. Les dommages subis par l'algue symbionte ont été considérables, surtout chez les spécimens exposés à de hauts degrés d'humidité.
Zusammenfassung Epiphyten und Luftverunreinigung
Epiphytische Moose und Flechten scheinen Phytotoxika gegenüber empfindlicher zu sein als die meisten höheren Pflanzen. In Ontario, Canada, haben zwei Ortschaften (Sudbury und Wawa) ungewöhnlich große Verunreinigungsprobleme, die hauptsächlich auf Schwefeldioxid zurückzuführen sind.
219

In Wawa rührt die Verunreinigung von einer Eisensinteranlage her. Die Ausbreitung von SO2 in jener Gegend sowie der pH-Wert und der Schwefelgehalt des Oberflächenwassers, des Bodens und der Vegetation wurden bestimmt. Der SOa-Gehalt in den Niederschlägen und die chemischen Angaben (pH-Wert und SO4) über Wasser und Boden wurden mit der epiphytischen Vegetation in Korrelation gebracht. Bei einem Ansteigen der SCh-Konzentration in der Luft und des Schwefelgehaltes im Wasser und im Boden wurde eine beachtliche Verminderung der Epiphyten sowohl in der Menge selber als auch in der Anzahl der Arten festgestellt. Mit zunehmender Entfernung vom Verunreinigungsherd verringerte sich auch deutlich der Schwefelgehalt der Vegetation. Gemäß der Verteilung der Verunreinigungen wurde die epiphytische Vegetation in fünf Zonen abgegrenzt.
In Sudbury, eines der bedeutensten Nickelzentren der Welt, ensteht die Verunreinigung durch drei gewaltige Schmelzhütten, die hauptsächlich Eisen- und Kupferpyrite verarbeiten, die Nickelsulfid enthalten. Bäumen an einer Landstrasse wurden 42 runde Rindenpfropfen von 4,8 cm Durchmesser entnommen, die 19 Arten Flechten und Moose aufwiesen. Im Sommer 1964 wurden diese Pfropfen auf Bäume in Sudbury transplantiert. Im Oktober 1965 war der größte Teil abgestorben oder beträchtlich beschädigt. Baeidia chlorocoeca und Parmelia sulcata zeigten sich aber sehr tolerant. Die Thalli der Parmelia, die solchen Scheiben entnommen waren, zeigten abnormale Formen unter dem Mikroskop, z.B. ; 1. Bermerkenswerte Verringerungen in der Dicke der Thallophyten. 2. Bildung einer dünnen Schicht von einer ins Weiße gehenden, kristallinen, wasserunlöslichen und in Azeton auflösbaren Substanz auf der oberen Fläche der Thallophyten. 3. Plasmolyse, Beschädigung der Chloroplasten und Bildung von Ölkügelchen in den Trebouxia-ZxW&n, dem Algen-Symbiont. 4. Bildung von Chlamdydosporen-ähnlichen Körpern durch den Pilzsymbionten besonders im unteren Kortex der Thallophyten.
Die Wirkung der Verunreinigung auf das Wachstum von Flechten und Moosen ist von vielen Ökologen in großen Städten beobachtet worden. Wegen der zahlreichen Quellen der Verunreinigung in solchen Großstädten ist es nicht einfach, genau die Quelle (bzw. Quellen) ausfindig zu machen, die für das Absterben dieser Pflanzen verantwortlich sind. Eine weitreichende Einwirkung der verunreinigten Luft auf Epiphyten konnte jedoch in der Stadt Montreal kartographisch aufgezeichnet worden. Wir glauben, daß diese Karten Hinweise darüber liefern, wo die Verunreinigung in den Jahren am stärksten aufgetreten ist.
Im Labor wurden Xanthoria, Parmelia und Physcia 24 Stunden unter verschiedenartigen Feuchtigkeitsbedingungen einer Konzentration von 5 p.p.m. SO2 ausgesetzt. Abnormaliiäten wie Ausbleichen des Chlorophylls, permanente Plasmolyse und das Auftreten von braunen Flecken auf den Chloroplasten konnte an den Algenzellen beobachtet werden. Schweflige Säure und Mg' h wurden in dem Extract der SO2 exponierten Thallophyten nachgewiesen. Bei zunehmender Feuchtigkeit stieg die Schwefelkonzentration in den dem SO2 ausgesetzten Thalli an. Das Absorptionsspektrum vom Chlorophyll, das aus den exponierten Thallophyten extrahiert wurde, zeigte ein
220

Absorptionsmaximum bei 667 rtifj., was für Phaeophytin charakteristisch ist und was auf den Abbau von Chlorophyll-a zu Phaeophytin-a bei S02-Einwirkung schließen läßt.
References
Barkman, J. J. 1958. Phytosociology and ecology of cryptogamic epiphytes. Assen. De Sloover, J. and F. LeBlanc. 1968. Mapping of atmospheric pollution on the basis of lichen
sensitivity. Proc. Symp. Recent Adv. trop. Ecol.. part I: 42-56, Varanasi, India. Dreisinger, B. R. and P. C. McGovern. 1966. Sulphur dioxide levels and resultant injury to vegeta
tion in the Sudbury area during the 1965 season. Mimeographed report, Ontario Department of Mines, Sudbury.
LeBlanc. F. 1961. Revue can. Biol. 20: 823-7. LeBlanc, F. and J. De Sloover. 1968. Can. J. Bot. (to be published soon). LeBlanc, F. and D. N. Rao. 1966. Bryologist 69: 338-46. Rao, F. N. and F. LeBlanc. 1966. Bryologist 69: 69-75. Rao, D. N. and F. LeBlanc. 1967. Bryologist 70: 141-57.
221

The effect of S0 2 on lichens and bryophytes around Newcastle upon Tyne
O. L. Gilbert
The University, Department of Botany, Newcastle upon Tyne, UK
Abstract
Deterioration of lichens and bryophytes on trees, asbestos roofs, sandstone wall tops and in grassland has been investigated. The first sign of pollution damage is a reduction in luxuriance; increasing pollution causes progressive decline in species diversity and total weight; ultimately, at an annual average of SOä above 0.016 p.p.m., an area of very low species diversity is reached. Definied thus, a desert of about 500 sq. miles is centered on the Newcastle Coalfield. It can be limited very precisely by mapping Grimmia puhinata or Parmelia saxatilis.
Two environmental factors (shelter and high pH) can alleviate the effect of SOs pollution. The former by causing a reduction in SO. levels, the latter by influencing the degree of ionization and rate of oxidation of sulphite.
Experimental evidence suggests that the accumulation of sulphur in the thalli of lichens is an active biological process.
Newcastle upon Tyne, the largest conurbation in north-east England, is a highly suitable area for studying the effect of urban pollution on lichens and bryophytes.
The district has a long history of air pollution - as early as 1710 visitors were complaining that the air smelt strongly of sulphur. So over most of the area the vegetation is in equilibrium with the pollution in a way which it would not be round a new town
, or factory. A second advantage is that most of the local industries are constructional, i.e. light engineering, shipbuilding and repairing, so that pollution is derived almost entirely from the combustion products of coal which are well known and easily measured. To the west and north-west of the city, which is also the direction of the prevailing wind, (Fig. 4) there is a sharp boundary with open country and there are no large towns for over 160 km, so round a ninety degree arc of its circumference Newcastle has a very simple pollution pattern. Another convenient feature is a lack of climatic gradients in the study area: it is flat and windy, with an average rainfall of 70 cm falling on 128 days of the year.
To discover the general response of lichens and bryophytes to conditions of increasing pollution they were examined along a 32 km (20 mile) belt transect, stretching from an area of pure air where fruticose epiphytes abound to the city centre (Fig. 4). Readings from several standard volumetric gauges (Warren Spring Laboratory, 1966) on or near to the transect indeed reveals the presence of a very steep gradient of SO2 pollution. City centre, annual average SO^ 200 [xg/m3;1 inner suburb (2.5 km) 160
1. Divide by 2860 to convert to parts per million.
223

jjLg/m3; outer suburb (8 km) 90 fi.g/m3; windward edge (12 km) c. 65 [xg/m3; small group of buildings at 19 km (lead dioxide method) c. 40 u.g/m3.
Process of decline
The decline of more than thirty bryophytes and fifty lichens was followed by examining standard habitats along the transect. Despite the variety of growth forms encountered, the process of extenction was found to be strikingly similar. Diminishing luxuriance is followed sooner (Parmelia sulcata, larger pleurocarps) or later (Xanthoria parietina, Grimmia pulvinata) by a depression of fruiting. At their inner limit all species are sterile, compact, and colonies tend to be small with a low cover. The trend appears to be towards presenting the smallest surface area to the atmosphere at the lowest possible elevation. One difference between the two groups is that near to their extinction point lichens invariably have a greater cover and are represented by much
15
À * 1 4 13
Fig. 1. Typical specimens of Evernia prunastri collected from ash trees at sites successively nearer to Central Newcastle. Decreasing luxuriance between 30 and 13 km due to pollution; increase beyond 30 km probably due to higher rainfall.
224

larger and older specimens than are bryophytes. The behaviour of Evernia prunastri, a rather sensitive epiphytic lichen, and Lecanora
conizaeoides, a markedly resistant one, have been followed in detail down the transect. Both were examined on the trunks of mature, vertical, free standing ash trees (Fraxinus excelsior) at a hight of between 1-2 m.
The results for Evernia, illustrated in Fig. 1 and summarized in Fig. 2, show how luxuriance, biomass and percentage cover start to decrease long before the species is eliminated. At 27 km west of the city values become settled, so it appears that this is the distance at which pollution ceases to be of much significance. It was not possible to take the transect further west as beyond 32 km the picture becomes complicated by higher rainfall.
The resistant species Lecanora conizaeoides is highly distinctive in that it increases in abundance and vigour as the town is approached. Where the last sensitive lichen on ash trees becomes eliminated it reaches its maximum cover of over 90 %, a value which it maintains right into the suburbs. Along this stretch the thallus is thicker and more luxuriant than at any other point on the transect. Under heavier and more prolonged pollution however it starts to decline till in the city centre it occurs only on the base of trees in slightly sheltered sites. Laundon (1967) found a similar situation in London. As up to 25 % of a tree trunk is bare at the rural end of the transect where the lichen is becoming scarce, this remarkable distribution would not appear to be entirely an effect of competition from more vigorous but more sensitive species.
A similar distribution is shown by the bryophytes Ceratodon purpureas, Bryum
weight in g per 0.1 m2(w) % cover(c)
100
50
E(w)
Lcon(c) 0 — — —
10 16
15 2i
20miles 32km
-distance in miles trom city centre
Fig. 2. Some changes in the lichen cover of ash trees moving away from Newcastle to the west. E(w) = biomass (weight) of Evernia prunastri; TSL(c) = combined cover of all sensitive lichens; Etc) ---- cover of Evernia prunastri; Leon, (c) -= cover of Lecanora conizaeoides.
225

argenteum, Fimaria hygrometrica and Leplobryum pyriforme in that they increase in abundance and vigour as the town is approached. There is no direct evidence that any of these resistant species are stimulated by pollution, though Wehner (in Katz, 1949) found that photosynthesis in a moss (Fontinalis sp.) can be stimulated by sulphurous acid at a concentration of 5 X 10~5to5 x 10 6 per cent.
As over 90 % of the bryophytes studied and over 95 % of the lichens follow the pattern described for Evemia there is a gradual reduction in species diversity as one approaches Newcastle from the west, till the central area is a 'desert' in which few species can survive. Fig. 3 illustrates this. When the data from Fig. 3, which were collected from carefully selected ash trees, stone walls, asbestos roofs and grassland is plotted against the distance from the city centre, several distinct correlations between survival and habitat emerge. These are, the persistence of species growing on basic substrata and in terricolous situations. That this enhanced survival is a product of the habitat rather than innate in the species is indicated by i.e., Physcia tenetla, Xanthoria parietina and Lecanora dispersa coming in 10, 11 and 13 km further on asbestos than ash trees and Eurhynchium praelongum and Brachythecium rutabulum which behave as resistant species in grassland but are rather sensitive in other habitats. Any theory attempting to explain lichen or bryophyte distributions round Newcastle must account for these situations.
0 1 2 3 t 5 B 7
MILES FROM CITY CENTRE
Fig. 3. Transect results showinu how the number of bryophytes plus lichens growing on various substrates increase when moving from Newcastle to the west. The transect line is shown in Fig. 4.
226

Resistant species
The middle of the desert has very few species. The only common lichens are Lecanora conizaeoides, L. dispersa, Candelariella aurelia and Lecania erysibe f. sorediata, while bryophytes are represented (in order of decreasing abundance) by Ceratodon purpureas, Bryum argenteum, Funaria hygrometrica, Tortula muralis, Bryum capillare, Eurhyn-chium praelongum, Brachythecium rutabulum, Dicranella heteromalla, Leptobryum pyriforme and a few others which are extremely rare (Gilbert, 1968). These species are mainly concentrated into terricolous and basic habitats which means that certain substrata, such as acid stone and tree trunks, may remain uncolonized.
In ecological systems diversity is thought to produce stability (Odum, 1963) so that, where these cryptogamic communities undergo large-scale simplification in response to increasing pollution, one might expect to see signs of disorganization as possibilities for adaption fall. For this reason it is of interest that pure communities of Lecanora conizaeoides round Newcastle repeatedly suffer from fungal attack of epidemic proportions. In certain years the basidiomycete Corticium centrifugum kills over 50 % of the Lecanorea conizaeoides cover on trees in sheltered sites while the imperfect fungus Lichenoconium lecanoracearum infects many of the remaining apothecia, turning them black (Gilbert, 1966). Broadhead (1958) has shown that psocids can also cause extensive damage to pure stands of Lecanora conizaeoides. So air pollution, by causing extreme simplification of these cryptogamic communities, can upset the balance of nature with unexpected results.
Use as indicators of air pollution
After an analysis of the transect results several indicator species and assemblages were selected for detailed mapping to discover the size and shape of the area affected by pollution. Ideally indicator species should be widespread, easy to recognize and between them show as wide a range of sensitivity as possible. Eventually the inner limits of the following assemblages were mapped. 1. Parmelia saxatilis plus sterile white crustaceous lichens on free standing sandstone walls. 2. A combination of two foliose (or squamulose) lichens on asbestos roofs. 3. Buellia punctata plus a Parmelia sp. plus one other sensitive lichen occurring above 1 m (3 feet) on vertical trunks of free standing ash trees. 4. Grimmia pulvinata on free standing mortared sandstone walls.
This mapping was a lengthy business, but eventually the situation shown in Fig. 4 emerged (a dot map for Grimmia pulvinata can be found in Gilbert, 1968). The Newcastle coalfield is seen to be surrounded by a series of concentric deserts, the outline of which are consistent with the theory that air pollution, or more correctly a certain component of the air pollution, is causal. The author (1965, 1968) has mentioned three lines of investigation pointing to SO2 (rather than smoke, fluorine or vehicle exhaust) as being the toxic pollutant.
For several years SO2 has been measured by a 24 hour volumetric sampling method
227

IVER WANSBECK
R.WEAR
"^f Limit of lichen desert on ash trees.
W " " " " sandstone. ~A ti » « •' ii asbestos. • *' "Gr<'mmia pulvinata on sstn .
Fig. 4. Map of Lower Tyne Valley and adjacent areas showing the transect line and the continuously built up area (grey) surrounded by concentric deserts. Windstar for Newcastle, 1960-64.
SMILES (8km.)
228

at about thirty stations in the area (DSIR, 1958-67) so it is possible to quote an approximate level of tolerance for each of the assemblages mentioned above. From the results of an experiment in which a number of branches covered with Parmelia physodes were brought into Newcastle and, at intervals, samples were returned to the original habitat and kept under observation there, it appears that the lichen-bryophyte deserts round large urban conglomerations reflect average annual concentration of SO2. The following values represent average annual levels of SOa above which the assemblages are most unlikely to be found in the stated habitat. Grimmia pulvinata, Hypnum cupressiforme or Camptothecium sericeum on exposed mortared sandstone walls 45 |j.g/m3 (0.016 p.p.m.), Parmelia saxatilis or P. fuliginosa plus sterile white crustaceous lichens on exposed sandstone walls 60 ng/m3. (0.02 p.p.m.), two foliose or squamulose lichens on asbestos roofs 130 (xg/m3 (0.045 p.p.m.), three sensitive species between 1 and 2 m on trunks of vertical ash trees in exposed situations ? 35 H-g/m3
(70.011 p.p.m.). From the literature it appears that in areas where the average annual concentration
of SO2 exceeds c. 100 ^g/m3, the productivity of certain higher plants is adversely affected and it was possible to advise landscape designers to be cautious when planting conifers inside the Parmelia saxatilis desert This covers a total of 1,025 km2 (400 miles2) in north-east England.
The effect of shelter and pH
Certain habitats such as sheltered valleys, dense woodland, long grassland and walls overhung by trees regularly carry sensitive species to well inside their normal limit of distribution. This suggests that shelter may have a relatively large effect in reducing SO2 levels. To investigate this, a series of portable pollution gauges was operated for 10 weeks during the winter of 1966/67. Typical of the result obtained (more fully reported in 1968) was a 76% reduction of SO2 in short grassland at an exposed, windy site (compared to readings at 1.3, 0.6 and 0.15 m above groundlevel). A sheltered valley showed SO2 reductions of 60 % at 2 m and 92 % at ground level compared to the surrounding area sampled at 2 m. Smoke levels were much less affected. SO2 reductions of this order easily explain the persistence of sensitive species in sheltered niches. Less easily explained is the mechanism of reduction. At the moment it is considered that the modifying effect of shelter, especially when provided by dense vegetation, may be partly produced by a 'scrubbing' effect as air readily deposits its strongly polar SO2 molecules onto surfaces of all kinds (Table 1).
Many field observations have indicated that a high pH also reduces the effects of pollution. For example Laundon (1967) found that 66% of the total lichen flora of London grew on calcareous stone. Around Newcastle many normally wide ranging wall top species behave as strict calcicoles at their inner limit of distribution i.e. Tortula muralis, Grimmia pulvinata, Amblystegium serpens, Hypnum cupressiforme, Candelarielia vitellina. Epiphytes disappear last from tree bases, nutrient streaks and dust impregnated sloping or horizontal surfaces, as these sites usually have higher pH's than the rest of the trunk.
229

Table 1. Total sulphur content of bryophytes and lichens from different parts of the Tyne Valley, in p.p.m.
Distance west of town centre, in km
in centre 10 11 13 21 34
225 Parmelia saxatilis 3290(670) 2870 1420(560) 659 Grimmia puhinata 3460(780) 3310(620) 1650(270) Ceratodon purpureas 4100(810) 2500(500) 1880(481)
Replicated, washed, 500 mg air-dry samples. Bryophyte material all collected on same day, lichen material on two separate occasions. Figures in parentheses refer to the amount of sulphur in p.p.m. removed by shaking for 1 hour in deionized water.
100
75
2 50 3
o o
M—
o S? 2 5
s o f \
1 H S 0 i ^ \
L^X^
H2
S 0 3 /
8 6 4 2 0 pH
Fig. 5. Distribution of various constituents of sulphurous acid at different pH values (after Vass and Ingram, 1949).
230

The explanation for this effect is illustrated by figure 5, taken from Vass & Ingram (1949). It shows how the degree of ionization of sulphurous acid varies with pH. Food chemists who use SO2 as a preservative to inhibit micro-organisms have known for a long time that its preservative value is greatly influenced by pH, the lower the pH the more toxic it is. An experiment was designed to investigate the effect of presenting very dilute sulphurous acid buffered at several pH's to a variety of bryophytes growing on agar. The experiment (Gilbert, 1968) clearly showed that neither S042~ nor SCh2^ (H2SO3 at pH 6.6) were toxic to the bryophytes tested, even at the relatively high concentration of 600 p.p.m. In contrast, bisulphite ions (H2SO3 at pH 4.2) are moderately toxic while at pH 3.2, when undissociated H2SO3 is present, the solution is at its most toxic. No protonema survived 20 p.p.m. at pH 3.2, the lowest concentration used. Even the gametophytes of Ceratodon and Bryum argenteum could only stand between 40 and 70 p.p.m. for 48 hours. Control experiments showed that it was not the low pH per se which was toxic.
Why lichens and bryophytes ?
It has been widely assumed that the highly efficient mechanism which lichens (Smith, 1962) and bryophytes (Shacklette, 1965) possess for accumulating a wide range of substances from very dilute solutions is, at least partly, responsible for their acute sensitivity to atmospheric SO2 which is concentrated until present in toxic amounts. Many examples of non-selective accumulation by lichens are quoted in Hale (1967) while Tamm (1964), Gorham (1959) and Shacklette (1965) have demonstrated the same phenomenon in bryophytes. Most of these workers have found that, although the majority of mineral elements are concentrated, not all ions are taken up at a high rate. Lounamma (1956) reports lichens as having less boron and manganese than expected and Shacklette (1965) also found unexpectedly small amounts of these two (among others) in bryophytes. Consequently it seems necessary to show that sulphur is one of the elements which is concentrated beyond expectable needs.
The total sulphur content of various species growing at different distances up the transect was measured.2 The results (Table 1) show that species from the edge of the heavily polluted area do contain much larger amounts of sulphur, both in and on their thalli, than specimens collected further afield.
A simple experiment was set up to discover to what extent uptake is a mechanical or a metabolic process. Half a large sample of Usnea filipendula was exposed to a large dose of gamma radiation from a cobalt source (>106 rads) and tested in a Warburg respirometer to ensure it had been killed. Replicated 10 g samples of live and dead Usnea were enclosed in coarse mesh nylon hair nets, exposed for eight weeks in a suburban smoke control area and then 0.5 g samples taken from the outside layer were
2. For this purpose the point quadrat technique used by Kershaw (1964) was applied. A frame with 10 pins spaced at 2 cm intervals was placed horizontally on a tree at 1.8. 1.6, 1.4 and 1.2 m and the number of pins in contact with each species was recorded. At each site 5 trees were investigated, so the final cover values at any site were derived from 200 points.
231

Table 2. Sulphur content of various materials before and after 8 weeks exposure to Newcastle air (means of 3 to 5 replicates).
Glass wool Cotton wool Usnea (dead) Usnea (Uvc)
Sulphur content im p.p.m.
20/5/1966
0 281
1420 1420
15/7,1966
342 529
1567 2430
increase
342 248
147 1010
analysed for total sulphur. Nets containing cotton wool and glass wool were exposed alongside the Usnea and analysed in the same way.3
The results (Table 2) indicate that sulphur can accumulate in a purely mechanical fashion on a variety of surfaces and to surprisingly high levels, considering the daily concentration of SO2 in the air during the experiment was rarely above 0.05 p.p.m. However the living Usnea, though having a surface area no bigger than the dead sample (which throughout the experiment retained the physiognomy of living thalli) accumulated sulphur over six times as fast and, considering that it was slowly being poisoned, must during the first four weeks have been concentrating it even faster.
Discussion
It appears that lichens and bryophytes mapped either as assemblages or individuals can form useful indicators of SO2 pollution. This is illustrated by the way in which the boundaries of the various deserts delimited in Fig. 4 run parallel to each other. To obtain accurate maps it is important to standardize the habitats examined as certain environmental factors can alleviate the effect of pollution. The most important of these are shelter, which causes a reduction in SO2 levels, and a high pH, which influences the degree of ionization and rate of oxidation (Gilbert, 1968) of sulphite so as to favour survival. Laundon (1967J has shown that in certain areas age of substratum can also be important. Working on limestone memorials in London he recognized Cahplacetum heppianae as having persisted for over sixty years in an area where rising levels of air pollution made it impossible for it to colonize new surfaces. This phenomenon of relict lichen communities has been observed round the edge of the Newcastle desert on sandstone walls and old asbestos roofs. They also occur on trees, but there the situation is complicated by physical and chemical changes which accompany the aging of bark. The observable but less spectacular restriction of bryophytes to old habitats at their inner limit is probably connected with the shorter lifespan of their colonies.
3. For the determination of sulphur 0.5 g dry material was analysed by the method of Cunningham (1962). With one deviation: the washed barium sulphate precipitate was estimated by a gravimetric and not by 1 photometric method. The three samples quoted from Gilbert (1965) were analysed by a slightly different method
232

It is of interest that the experiments with very dilute sulphurous acid showed protonema as being considerably more sensitive to sulphite than mature gametophytes. From this it can be argued that the establishment stages of the life cycle are the most sensitive to SO2, and there is a certain amount of field evidence that at their inner limit species are perpetuating themselves by irregular vegetative reproduction during those summers when unstable air keeps SO2 levels unusually low.
Though repeatedly looked for, no correlation could be found between the survival of common corticolous or saxicolous species and the humidity of the habitat. Certain niches with humid microclimates were found to carry species inside their normal range (dense woodland), but in every case there were alternative more plausible explanations. In contrast to the 'drought hypothesis' for explaining lichen deserts, several workers have recently obtained experimental evidence (see Syratt, Barkman, this volume) that these plants are more sensitive to SO2 when in a wet than a dry state. If this is true for field conditions (the experimental work was carried out at rather high levels of SO2) it is likely that the toxic atmospheric level of SO2 for any species will be lower in an atlantic than in a continental climate.
From this work it has been possible to produce a simple biological scale for estimating annual average levels of SO2 pollution. But in its wider aspect, the study of plants and animals in urban environments is of increasing importance to conservationists and planners in view of the rapid urbanization of Western Europe. The species diversity of natural communities usually fails to adapt itself to the new environment so communities poor in species predominate in towns. In ecological systems diversity is thought to produce stability, and important principles can be learnt from studying simple communities subject to great changes in species structure, organic structure and energy flow.
Résumé I.es effets du SO2 sur les lichens et les bryophytes autour de Newcastle upon Tyne
La détérioration des lichens et des bryophytes poussant sur les arbres, les toits d'amiante, les rebords de murs en grès, et dans les prés, a été examinée. Le premier indice de dommage par la pollution est une diminution de la luxuriance des espèces plus sensibles; une pollution croissante provoque un déclin progressif dans la diversité des espèces et leur poid total, pour aboutir à une zone de diversité très réduite des espèces lorsque la moyenne hivernale de SO2 est supérieure à 50 ng/m3 environ. Line zone désertique d'environ 1300 km2 est ainsi située sur le Bassin houiller de Newcastle. Elle peut être délimitée avec précision en repérant la mousse Grimmia pulvinata ou le lichen Parmelia saxalitis.
Deux facteurs ambiants (lieu abrité et pH élevé) sont susceptibles d'atténuer les effets de la pollution par le S0 2 ; dans le premier cas en provoquant une réduction des niveaux de SO2, dans le second en agissant sur le degré d'ionisation et le taux d'oxydation du sulfite de façon à favoriser la survivance.
Au stade de protonema, les bryophytes apparaissent beaucoup plus sensibles au SO2 que les gametophytes parvenus à maturité.
233

L'accumulation de soufre dans les thalles des lichens apparaît comme un processus biologique actif. Les résultats obtenus jusqu'à présent donnent à penser que les espèces résistantes accumulent du soufre aussi rapidement ou plus rapidement que les espèces sensibles.
Environ 30 lichens et 30 bryophytes peuvent à présent être placés dans un ordre approximatif de sensibilité au SO2 pour chacun des substrats étudiés. Certains groupes écologiques sont plus résistants que d'autres.
Zusammenfassung Die Wirkung von SO2 auf Flechten und Bryophyten in der Umgebung von Newcastle upon Tyne
Die Deterioration bei Flechten und Bryophyten die auf Bäumen, Asbestdächern, Sandsteinmaueroberflächen und in Wiesen wachsen, ist untersucht worden. Das erste Anzeichen eines Verunreinigungsschadens ist ein Geringerwerden des Wachstums bei empfindlicheren Arten; eine zunehmende Verunreinigung verursacht einen progressiven Rückgang in der Artenmannigfaltigkeit und im Gesamtgewicht, bis ein sehr geringer Artenmannigfaltigkeit erreicht wird bei einem Winterdurchschnittswert des SO2 über ungefähr 50 fxg/m3. Eine so definierte Wüste von etwa 1300 km2 hat das Kohlenrevier von Newcastle zum Mittelpunkt. Durch Kartographierung des Mooses Grimmiapulvinata und der Flechte Parmelia saxatilis lässt sich dieses Gebiet sehr genau abgrenzen.
Zwei Umweltfaktoren, Schutz und hoher pH-Wert, können die Einwirkung des Schwefeldioxides mindern. Der erstere verursacht Herabsetzung des SCh-Niveaus und der letztere beeinflußt zu Gunsten des Überlebens den Grad der Ionisierung und Oxidation von Sulfit.
Die Protonema der Bryophyten scheinen auf SO2 weit mehr anzusprechen als die voll entwickelten Gametophyten.
Die Aufspeicherung von Schwefel in den Thalli der Flechten scheint ein aktiver biologischer Prozess zu sein. Die bisher erhaltenen Ergebnisse weisen darauf hin, daß resistente Arten Schwefel ebenso schnell oder schneller aufspeichern als empfindlichere Arten.
Ungefähr 30 Flechten und 30 Bryophyten kann man jetzt für jedes untersuchte Substrat annähernd in Empfindlichkeitsreihen gegenüber SO2 anordnen. Gewisse ökologische Gruppen sind resistenter als andere.
References
Broadhead, E. 1958. J. Anim. Ecol. 27: 217. Cunningham, R. K. 1962. Chemy Ind. 2120. Department of'Scientific and Industrial Research. 1958-67. Atmosphere Pollut. Bull., all sections.
Warren Spring Laboratory. Department of Scientific and Industrial Research. 1966. National survey of smoke and sulphur
dioxide: Instruction Manual. Warren Spring Laboratory.
234

Gilbert, O. L. 1965. Lichens as indicators of air pollution in the Tyne valley. In: G. T. Goodman, R. W. Edwards and J. M. Lambert, eds, pp. 35-47. Oxford.
Gilbert, O. L. 1966. Lichenologist 3(2) : 275. Gilbert, O. L. 1968. New Phytol. 67: 15. Gorham, E. 1959. Can. J. Bot. 37: 327. Hale, E. 1967. The biology of lichens. Arnold, London. Katz, M. 1949. Ind. Engng Chem. 41: 2450. Kershaw, K. A. 1964. Lichenologist 2(3) : 263. Laundon, J. R. 1967. Lichenologist 3(3): 227. Lounamaa, J. 1956. Suomal. eläin- ja kasvit. Seur. van. Tiedon. 39. Odum. E. P. 1963. Ecology. Modern Biology Series; Holt, Rinehart, Winston. Shacklette, T. H. 1965. Bull. U.S. geol. Surv. 1198-D. Smith. D. C. 1962. Biol. Rev. 37: 537. Tamm, C. O. 1964. Bryologist 67: 623. Vass, K. and M. Ingram. 1949. Fd Mf. 24: 414.
235

Discussion in Section 5 : The effects of air pollution on non-vascular plants
Reporters : J. J. Barkman, F. Rose and V. Westhoff
Participants: Rose (Chairman), Barkman, Buck, Coker, Fenton, Gilbert, Laundon, Leblanc, Morgan-Huws, Noirfalise, Ranwell, Robak, Schönbeck, Skye, Syratt, Wanstall, Wassink.
According to Mr. Schönbeck pattern and degree of air pollution in the Ruhr Region is being studied (1) by measuring SO2- and HF-content of the air, (2) by using the lichen Parmelia physocles as a biological indicator. All specimens used for the definitive experiments were collected in the same station, but preliminary experiments had shown that material from a wide range of sites did not differ in response to air pollution or other factors.
Cores of bark with the lichen were attached to vertical wooden frames on poles facing north. No differences in response were observed with transplants to trees. The samples were exposed in 26 localities, with ten replicates at each site. The stations covered all types of topographic situation both in polluted and unpolluted areas and twelve types of local climates from lowland (Rhine valley) to 1000 m altitude (Sauer-land). Data of the Federal Meteorological Service were used to study correlation with climate at each test site.
In more or less unpolluted areas the transplanted lichens were still in good health after £ - ï year. Both in a town (SO2) and near an aluminium plant (HF) Parmelia physodes died within a few weeks. As a rule, however, it was impossible to separate the influence of these two gases in field experiments, since nearly all polluted stations were affected by a mixture of HF and SO2. Nevertheless the Parmelia can be used very well as a general indicator of the total emission.
Damage was visible as yellowish marks on the thallus and recorded quantitatively by a combination of infra-red photography and subsequent planimetrie measuring. Even normal photographs taken under standard conditions and visual estimation of the relative size of the damaged thallus area proved to be very useful.
Specimens of Parmelia were transplanted to a site near an iron smeltering plant before and after it ceased to operate. The latter did not suffer from the experiment. This proves that the original absence of the species was not caused by climatic factors. Recolonization ofthat area with lichens is now being studied.
The influence of wind direction was studied by setting up experiments at different sides and distances from a factory and recording wind directions during exposure. Destruction of the lichens at any given site occurred whenever the wind brought pollution to that particular station, but ceased to increase as soon as the wind changed.
In addition, fumigation experiments with HF and SO2 were set up under as natural conditions of temperature, illumination and air humidity as possible. Parmelia physodes
237

was strongly damaged by both pollutants. The morphological changes were similar, but the degree of sensitivity appeared to be different: after four days of exposure SO2 concentrations of 0.018 p.p.m. (and higher) caused significant damage, as well as H F concentrations of as low as 0.002 p.p.m. (and higher)1.
1. Mr. Schönbeck's contribution had the character of a full lecture and contained so many original and fundamental observations that it seemed justified to be dealt with more elaborately.
Some information was given on air pollution damage to fungi. In England Juniperus communis is now attacked on a large scale by Lophodermium juniperinum, except in an area with moderate SO2 pollution near London. Rhytisma acerinum, formerly absent from Acer pseudoplatanus in the outskirts of the Sheffield industrial area, recently appeared there for the first time in this century, just after SO2 concentration had fallen. Diplocarpon rosae, a fungus causing blackspot on roses, is as sensitive to air pollution as some lichens. In Stockholm the distribution of Hysterium pulicare, a bark saprophyte, is very similar to that of e.g. Hypnum cupressiforme among the mosses and Xanthoria parietina among the lichens. The disappearance of other tree fungi from polluted areas has been stated by Schaeffer and Hedgcock. It is also well known that SO2 may kill autochthonous microfungi in the soil. As so HF, it has been observed that the birch leaf rust, Melampsoridium betulinum, was absent from birches around a large aluminium plant in Norway, even in 1964 when the disease was widespread over Western Norway.
These data refer mainly to Ascomycetes and parasitic fungi. Obviously, no harmful effect on terrestrial macrofungi has so far been observed.
Very little is known about the physiological mechanism of SO2 damage to either Iichenized or non-lichenized fungi. In leaves of Brassica oleracea var. botrytis SO2 is incorporated as an integral part of the glucobrassicin molecule. Some of the degradation products of the thioglucosides are known for their fungicidal effect. They may therefore be responsible for killing the parasitic fungus of Brassica. A similar process might possibly take place in fungi in lichens through assimilation of SO2 by the algal component.
No visible effect of air pollution on free living algae has so far been observed. Only Prasiola crispa, although penetrating even such large industrial cities as Rotterdam, may be absent from heavily polluted areas. The absence from towns of Trentepohlia umbrina, which requires a high air humidity, may just as well be explained by the dryness of town mesoclimate. There is also no indication that lichens with Chlorophyta respond any differently to air pollution from those with Cyanophyceae. In fumigation experiments with lichens, however, the visible damage is most obvious in the alga. It seems that in lichens air pollution acts primarily on the delicate symbiotic equilibrium between the two components, which seem to be more sensitive when growing together than in a free state.
Naturally, the discussion centred mainly around epiphytic lichens and bryophytes. It was emphasized, however, that terrestrial bryophytes and lichens should not be
238
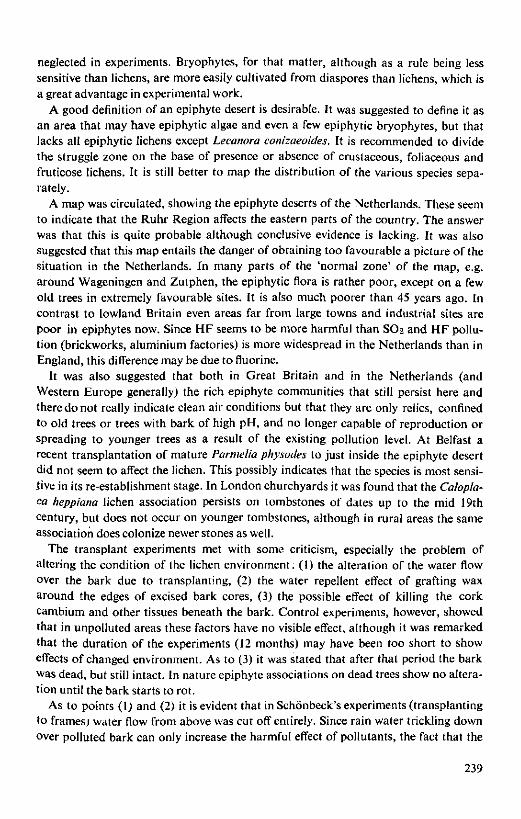
neglected in experiments. Bryophytes, for that matter, although as a rule being less sensitive than lichens, are more easily cultivated from diaspores than lichens, which is a great advantage in experimental work.
A good definition of an epiphyte desert is desirable. It was suggested to define it as an area that may have epiphytic algae and even a few epiphytic bryophytes, but that lacks all epiphytic lichens except Lecanora conizaeoides. It is recommended to divide the struggle zone on the base of presence or absence of crustaceous, foliaceous and fruticose lichens. It is still better to map the distribution of the various species separately.
A map was circulated, showing the epiphyte deserts of the Netherlands. These seem to indicate that the Ruhr Region affects the eastern parts of the country. The answer was that this is quite probable although conclusive evidence is lacking. It was also suggested that this map entails the danger of obtaining too favourable a picture of the situation in the Netherlands. In many parts of the 'normal zone' of the map, e.g. around Wageningen and Zutphen, the epiphytic flora is rather poor, except on a few old trees in extremely favourable sites. It is also much poorer than 45 years ago. In contrast to lowland Britain even areas far from large towns and industrial sites are poor in epiphytes now. Since HF seems to be more harmful than SO2 and HF pollution (brickworks, aluminium factories) is more widespread in the Netherlands than in England, this difference may be due to fluorine.
It was also suggested that both in Great Britain and in the Netherlands (and Western Europe generally) the rich epiphyte communities that still persist here and there do not really indicate clean air conditions but that they are only relics, confined to old trees or trees with bark of high pH, and no longer capable of reproduction or spreading to younger trees as a result of the existing pollution level. At Belfast a recent transplantation of mature Parmelia physodes to just inside the epiphyte desert did not seem to affect the lichen. This possibly indicates that the species is most sensitive in its re-establishment stage. In London churchyards it was found that the Calopla-ca heppiana lichen association persists on tombstones of dates up to the mid 19th century, but does not occur on younger tombstones, although in rural areas the same association does colonize newer stones as well.
The transplant experiments met with some criticism, especially the problem of altering the condition of the lichen environment. (1) the alteration of the water flow over the bark due to transplanting, (2) the water repellent effect of grafting wax around the edges of excised bark cores, (3) the possible effect of killing the cork cambium and other tissues beneath the bark. Control experiments, however, showed that in unpolluted areas these factors have no visible effect, although it was remarked that the duration of the experiments (12 months) may have been too short to show effects of changed environment. As to (3) it was stated that after that period the bark was dead, but still intact. In nature epiphyte associations on dead trees show no alteration until the bark starts to rot.
As to points (1) and (2) it is evident that in Schönbeck's experiments (transplanting to frames; water flow from above was cut off entirely. Since rain water trickling down over polluted bark can only increase the harmful effect of pollutants, the fact that the
239

lichens on the frames were damaged, makes this experiment only more convincing. It was observed indeed that lichens on frames, sheltered from rain, were less affected than those exposed to rain. It was also a matter of general observation that parts of trees without rain supply from higher parts of the bole (such as horizontal branches) use to bear a much richer epiphytic vegetation in polluted areas than vertical trunks. On vertical trunks the rain tracks may be even completely devoid of epiphytes in such areas. It was suggested that this might well account for the decrease of Zygodon forsten, a species confined to rain tracks, in polluted areas.
Another problem is the source of the test material and its variability. In Gilbert's work sample variability of the lichens in SO2 tolerance did not exceed 10%. It was emphasized, however, that, although Mr. Schönbeck's material of Parmelia physodes happened to be uniform, this species is very polymorphous. In addition, the frequent differentiation of lichens into chemical races each with its own geographical range may well run parallel with physiological differences ; this might explain the difference in sensitivity between the same set of lichen species in Canada and Europe, as observed by Leblanc. It was objected, however, that the climate near Montreal and in Ontario is continental and quite different from that in Western Europe. In Europe, the order in which epiphyte species disappear from rural sites to town areas, is about the same in England and the Netherlands and it is also the same in continental regions like E. Sweden, S. Finland, Poland and Hungary, but it is different there from the situation in Western Europe. Hence the continentality of the macroclimate might also be involved.
The effect of SO2 on lichens and bryophytes was also discussed. In N.E. England it causes the soredia of Parmelia physodes to turn snowwhite, whereas in the Ruhr region only the thallus is affected, changing in colour to yellowish.
In Hypnum cupressiforme and Ramalina farinacea transplanting to a polluted area resulted in a an immediately starting break-down of chlorophyll : after 10 weeks less than 10% was left. Respiration stayed constant or increased slightly for the first few weeks and then fell rapidly. It is not clear whether the two processes are linked. In Parmelia caperata a progressive bleaching of the thallus margins was observed. In mosses elution of Mg++ ions from the chloroplasts was observed by colorimetric methods. The quantity of Mg++ released was proportional to the degree of SO2-pollution.
The primary effect of SO2, being an acid, is to break down chlorophyll a. Resistent moss species accumulate much more sulphate than sensitive species, probably because they have a more effective mechanism to neutralize sulphurous and sulphuric acid. As a secondary effect SO2 bleaches all pigments by a reduction process, contrary to HF which acts only as an acid. In the more resistent moss species respiration continues to rise even after 42 hours exposure to 5 p.p.m. SO2; in more sensitive species respiration decreases after an initial rise in the first 24 hours.
With regard to other pollutants than SO2 and HF the question was asked whether Parmelia furfuracea is really an indicator of motor vehicle exhaust. In Britain it seems to disappear from roadside trees only if alkaline dust is impregnating the bark, which
240

is obviously harmful for this acidophilous species. Near Newcastle it occurs along roads with heavy motorized traffic. In the Netherlands both factors are involved: where motor traffic is not intensive and dust impregnation considerable, Parmelia furfuracea is replaced by nitrophytic species such as Parmelia acetabulum and P. subrudecta, but where there is intensive motor traffic and no dust impregnation (asphalt roads through meadows), the species disappears as well.
Finally, fumigation experiments of bryophytes with ethylene were reported. No effects on chloroplasts were observed. Species without anthocyanin showed no change in physiology, whereas a species containing anthocyanin (Frullania dilatata) showed an increased respiration rate. This is in line with the well known effect of ethylene on carnation flowers, which also contain anthocyanin.
It was felt that the discussion had clarified some problems and, above all, opened perspectives for future research. It also demonstrated the extreme usefulness of bryophytes and lichens in the field of air pollution research. It is of fundamental importance to preserve areas with an unpolluted atmosphere and a rich epiphyte vegetation, both for the conservation of nature and as a reference for future pollution research.
The following resolution was passed: the conference proposes that cryptogamic epiphytes should be strongly recommended for general use as biological pollution indicators, because (1) they are so easy to handle, (2) they show a vast range of specific sensitivity to air pollutants greatly exceeding that of most higher plants.
241

Section 6 : The effects of air pollution on animals

The effect of air pollution on animals
F. Ender
Department of Biochemistry, Veterinary College of Norway, Oslo 4, Norway
Abstract
The author gives a short description of various industrial airborne pollutants harmful to animals. The injurious effect of smoke containing small amounts of F, S, Se, Mo, Be, Mn, Mg, Zn, Cu, Pb, and As in addition to toxic organic compounds is discussed. The fluorosis problem based on experience from the international literature, supported by the author's own studies, is treated in detail. Environmental factors, such as the geographic location of the smoke-emitting industry and the topography of the surrounding landscape, are of major importance. Various methods to combat the outlet of noxious pollutants to the atmosphere are discussed, along with efforts to reduce air pollution in general.
Air pollution, especially in heavily industrialized and smoke-infested regions, is today a serious problem which arises great inteiest not only among research workers, but also among the general public. The great diversity of conditions under which air pollution may occur gives rise to serious problems and requires studies of the medical, veterinary, chemical, botanical, technical, meteorological and last (but not least) juridical and economical aspects. " Closely associated with investigations on the detrimental effect of gas, smoke, dust, and aerosols, caused by various industrial activities, is the work aimed at reducing the damaging effect of a great number of harmful pollutants which are discharged into the atmosphere.
The main problem today is how to combat air pollution caused either by expanding industries or by house heating, garbage incineration, and diesel and other petroleum-fuelled engines. The atmosphere is, next to seawater, the greatest recipient of man's waste products. The air pollution problem is actually a matter that concerns human society as a whole.
The aim of this contribution is to give a general review of the damage done to various species of animals, especially domestic animals, when exposed to noxious pollutants from manufacturing industries.
Noxious and harmful waste substances created by manufacturing processes may be taken up by animals in various ways. The animal may consume forage contaminated by smoke, dust, etc. from a nearby industry. This has led to serious disorders in domestic animals as will be reported in the following.
Inhalation of noxious industrial gases as a direct cause of illness in domestic animals
245
is generally of no practical importance. Pollutants especially harmful to animals when emitted into the atmosphere by in
dustries are: fluorine and fluoride compounds, metal dust (including oxides and other iron compounds), molybdenum, beryllium, manganese, magnesium, lead, copper, and zinc, but also non-metallic elements such as sulphur, selenium, arsenic, besides various toxic organic substances, provided their concentration in smoke or dust is high enough.
Some years ago research workers paid special attention to penta- and hexachloro-naphtalene derivatives, which were used for wood impregnation, as these substances are highly toxic to cattle. Inhalation of traces of these volatile toxic compounds caused the outbreak of a formerly mysterious disease called X-disease, which in many countries has led to great economic losses.
Stockinger (1962, p. 282) has given an excellent review of the papers dealing with studies on the effects of air pollution on animals. He mentions that harm to wildlife has been reported from England. Reference is made to effects of air pollution on the health of birds in the London Zoo and of ewes and hares consuming vegetation damaged by smoke. It appears from the Donora Report that, among birds living in captivity, the canary is the most susceptible to toxic inhalants and anoxia.
Studies have indicated that particulates in engine exhaust are carcinogenic to rodents both in the lungs and on superficial areas of the body. In this connection the question of occurrence of airborne nitrosamines is of interest, as these substances are strongly carcinogenic to a large number of animal species. Interest should also be devoted to air pollution caused by the use of insecticides, such as DDT, aldrine, and various mercury compounds which, when sprayed on vegetation, reach lakes, rivers, and sea water where they cause poisoning of fish. Abnormally high levels of mercury have been found in dead fresh-water and salt-water fishes.
Stockinger (1962) gives a survey of the toxic effects of various airborne pollutants affecting poultry, laboratory animals, and insects. The toxic pollutants include various sulphur compounds, peroxides, carbon monoxide, ozone and peroxide mixtures, aromatic hydrocarbons, and oxides of nitrogen. Of historical interest is the statement that characteristic symptoms of fluorosis have been noted in fossil animal bones in Iceland, caused by volcanic eruptions thousands of years ago.
The most important problem concerning damage to animals by air pollution is, no doubt, the poisoning of domestic animals caused by fluorine in smoke, gas, or dust from various industries; industrial fluorosis in livestock is today a disorder well known by veterinarians in all industrialized countries.
Industrial fluorosis
Fluorosis has been observed in the vicinity of aluminium works, superphosphate factories, steel works, brick works, enamel works, and also near places where fluorine-containing coal is used as a fuel. The literature on the subject is voluminous; only a few references will be given here.
The Medical Research Council (1949) has investigated fluorosis near Fort William in Scotland. The problems in livestock production have been discussed by Phillips et al.
246
(1955). A more detailed list of references is given by Flatla and Ender (1966). It will not be necessary to outline the symptomatology of fluorosis, as this subject
will be treated in various contributions. A few comments, based on studies from Norway, on some important conditioning factors in evaluating the risk of raising domestic animals near an aluminium factory will be sufficient.
Fluorosis was practically unknown to veterinarians in Norway before the Second World War, although the first case had been described already in 1934 by Slagsvold near a small aluminium factory. In his pioneering work he proved that the disorder was caused by fluorine contamination of grass and hay by the neighbouring aluminium industry.
Fluorosis in livestock showed a tremendous rise after the Second World War in the fiord districts of western Norway where new plants were built, and others were expanded, and the aluminium production was at the end of 1968 estimated at 500,000 tons per year. Over a few years cases of fluorine poisoning developed on a large scale, as was reported by the author to the European Conference on Air Pollution in Strasbourg in 1964.
The total quantity of fluorine in the escaping gases of an aluminium plant is roughly 20 kg per ton aluminium produced. This gives an idea of the great amounts of fluorine which, if not being removed by filtering, will escape into the atmosphere.
The damaging effect is not only due to fluorine. Emitted with the smoke are such compounds as gaseous hydrofluoric acid and fluosilicic acid, dust-containing cryolite, and aluminium and calcium containing fluorides. But the condition is, to a high degree, worsened by the geographical location of these factories in U-shaped, narrow river valleys surrounded by mountains up to 5000 feet high. These mountains, on both sides of the river, force the smoke from the factories to travel along the bottom of the valley, leaving no possibility for the smoke to escape.
In 1950 investigations started on the fodder of affected farms near an aluminium factory where the local veterinary surgeon supposed that animals were suffering from fluorine poisoning. During 15 years' study I had the opportunity to get a picture of the wide variation in fluorine content of herbage in agricultural districts near aluminium works in the south-western coastal region of Norway. The aim was to relate the annual as well as the seasonal fluctuations from a large number of sites, located throughout the area, to the geographical location, the topographical conditions, and the distance from the factory. Many analyses in bones, teeth, urine, and organs from slaughtered animals were made to help the local practicing veterinarian in his diagnosis and treatment of fluorosis in livestock. By combining these studies with the daily observations from nearby meteorological field stations, it was possible to get an insight into the ever changing influences of wind direction, temperature, humidity, and precipitation on the ever changing contaminations of the herbage.
Annual and seasonal variation of fluorine in grass
The wide variation of fluorine contamination of grass near three aluminium factories was treated in detail in a report to the European Conference on Air Pollution in
247

Table 1. Levels of fluorine in grass and hay during a four year period (1959-1962') from five farms located in the most exposed area near factories A. B and C.
Factory A
Factory B
Factory C
Farm
number
1 2 3 4 5 average 1 2 3 4 5 average 1 2 3 4 5 average
Distance from factory
(in miles)
0.5 0.9 1.1 1.6 2.0
1.9 2.5 3.1 6.9 6.9
0.8 0.9 1.0 1.1 1.8
Fluorine levels i
June
237 154 117 130 87
145 103 39 69 37 29 55 20 39 27 30 21 27
July
252 159 141 170 138 172 49 43 52 37 31 42 20 24 21 19 31 23
in p.p.m. in dry matter
August
382 212 201 222 156 235
47 72 29 59 52 15 16 12 13 21 15
September
509 286 262 250 202 302
45 58 19 32 39 28 5
37 5
48 25
1. The average values of the samples collected near factory C do not give a completely correct picture, as sampling each year was not carried out regularly during the season.
Strasbourg (1964). Table 1 gives a survey of a four-year study (1959-1962). It shows, in the first place, that dry grass from uncontaminated areas contains small amounts of fluorine, generally between 2 and 8 p.p.m. Furthermore, it gives the average fluorine levels in grass and hay from five farms located in the most exposed areas near the three factories A, B, and C. The highest levels in grass were generally found in the autumn near Factory A. The difference in fluorine contamination of herbage from the neighbourhoods of Factories A and B are noteworthy, as these factories belong to the same aluminium company. The high fluorine level near Factory A, with single values up to 800 p.p.m., is strange, considering the efforts by the industry to achieve effective smoke purification. Whereas Factory A is located in a dry district, the climate near Factory B is rather wet. The differences in fluorine contamination of herbage in these locations should not only be attributed to weather conditions, topography, and distance from the factories, but should also be judegd in relation to the production capacity, the number of aluminium furnaces, and general factory management.
Influence of geographical location and topographical conditions near aluminium factories
As stated before, the geographical location as well as the topographical conditions near the aluminium factories have a striking influence on the fluorine contamination of the soil and the vegetation in the surroundings. By locating the plants at the bottom
248

of deep, narrow, U-shaped valleys the risk of fluorine injuries in the neighbouring valley districts is far greater than will be the case if the factories are placed on rather open, unsheltered ground.
One may get an even better picture of the dimensions of the damaging effect of the fluorine gases from the fact that, some years ago, symptoms of dental fluorosis in cattle were observed at a distance of 38 km from Factory B. The management of this factory stated that they were able to remove about 98-99 % of F in the smoke, but the amount of fluorine expelled unfiltered into the atmosphere - a fact of vital importance for the understanding of the injurious effect on the surroundings of the factory - was not disclosed. The difficulties are generally, to a high degree, worsened because it is impossible to prevent completely the escape of gases through doors, ducts and windows in the electrolysis halls, despite the installation of gas purification procedures using gas-washing systems of complex construction. Gas, smoke, and dust filtration may, as known, be carried out by the use of scrubbers or a great variety of dust, sack, or bag filters, cyclone filters, electrostatic filters, etc.
The smoke problem caused by factories located in deep valleys is of major interest, not only in relation to aluminium plants, but also for other industrial activities in Norway. The frequent occurrence of pneumonia in people living near an electro-metallurgic plant where ferromanganese and silicomanganese are produced has attracted much interest, as it is said to be caused by manganese-containing smoke.
Practical measures designed to reduce fluorosis
The damaging effects of feeding fluorine-contaminated grass and hay to ruminants can, to some extent, be reduced by improved nutrition or in substituting the contaminated fodder by concentrates produced outside the fluorine-contaminated area. Mineral mixtures rich in calcium phosphates may be used. Another method, which has been practiced in Norway, is to raise beef cattle instead of dairy cows. Beef cattle is generally slaughtered when young, before symptoms of fluorosis in the skeleton have markedly developed.
Various substances, especially aluminium compounds, have been tested on their antidotal effect in cattle and sheep. In Scotland aluminium sulphate has been investigated by Boddie (1955) as a fluorine alleviator, in Holland by Tesink (1954), and in England by Allcroft C1959). Various aluminium compounds have also been tried in Norway by Ender et al. (1962) and by Flatla and Ender (1966). Whereas aluminium hydroxides show no preventive effect against fluorosis, aluminium sulphate and aluminium lactate have shown promising results in experiments of short duration. Aluminium lactate is more palatable and is better tolerated in greater quantities than aluminium sulphate. Administration of great quantities of aluminium lactate to sheep reduced the fluorine output in urine to about one fifth, and faecal fluorine levels were higher in the control group without the fluorine alleviator.
Though it is possible in experiments of short duration to reduce the daily fluorine absorption considerably, as shown in fluorine balance studies, the bone fluorine content of animals given aluminium lactate after a five-year experimental period
249

showed levels corresponding to about 40 per cent of the bone fluorine content in the control group. It seems reasonable to assume that long-term feeding with aluminium compounds as an antidote to fluorine intoxication is of limited importance, as the use of aluminium lactate, especially in large quantities, rapidly reduces the serum phosphorus levels, despite the fact that this reaction disappears some time after dosing with aluminium lactate.
Defluorination of forage
As the prevention of fluorosis by the use of alleviators has only relatively little effect when the fluorine content of the fodder is high, laboratory experiments were carried out to reduce the fluorine content of grass and hay by the following methods.
Washing of contaminated grass with ordinary tap water removed only small amounts of fluorine. Elimination of larger quantities was secured by ensiling the grass in accordance with the A.I.V.-method, by which the grass is treated with a mixture of diluted sulphuric and hydrochloric acid, or by using formic acid. The minimum time for ensiling was, in most cases, 24 hours, after which the silage was washed in running water for about 18 hours. Both processes resulted in the elimination of most of the fluorine.
The best results, however, were obtained by treating the grass as prescribed for the A.I.V.-method. The results obtained with this procedure are shown in Table 2. They demonstrate that it is possible to remove practically all toxic amounts of fluorine by a cheap and simple method. The method used in the laboratory in Oslo for determination of fluorine is described in detail in the report to the European Conference on Air Pollution (1964).
Feeding experiments with cattle and sheep using defluorinated grass revealed that these species willingly consumed considerable amounts of it. A daily ration of 25 kg washed grass silage was well tolerated by cattle during a feeding period of about 3-4 weeks. Likewise, sheep consumed about 4 kg a day during the same period. It should be noted that these experiments only indicate the possibility of using such defluorinated fodder for raising cattle and sheep in a fluorine contaminated area. Treatment by this procedure greatly reduces the mineral content of the grass, especially for calcium and phosphorus, although the loss of protein is relatively small. This may, of course, be corrected by supplementing the daily rations with a special mineral mixture.
Table 2. Elimination of fluorine in contaminated forage.
Mean F content in herbage, p.p.m. in dry matter
24 hours treatment with A.I.V. fluid 48 hours treatment with A.I.V. fluid 24 hours treatment with formic acid 48 hours treatment with formic acid
250
before treatment
251 214 209 214
after treatment
12 12 15 21

Occurrence of poisoning of livestock by trace elements
Complaints of livestock poisoning in a district in western Norway caused by the emission of smoke and dust from a nearby zinc factory led to the analysis of 32 samples of hay for cattle and horses during the years 1930-1940 (Annual Report, Department of Biochemistry, 1948). Hay from the near vicinity of the factory contained, on an average, 3100 p.p.m. zinc, 116 p.p.m. copper, and 700 p.p.m. lead. Six samples of hay from districts where trace-element poisoning could be excluded contained, on an average, only 38 p.p.m. zinc, 6.5 p.p.m. copper, and less than 2 p.p.m. lead. Table 3 gives a survey of the study of trace-element contamination in all samples from the areas tested.
The high levels of contaminants in the herbage give, no doubt, an explanation of the poisonous effects of these trace elements. Determination of zinc, copper, and lead in the grass was carried out by the dithizon method. Recovery studies revealed that the actual analytical error was less than ± 1-2 %.
Table 3. Concentration of Zn, Cu and Pb in dry hay samples collected from grassland in the neighbourhood of a zinc factory
p.p.m. Zn p.p.m. Cu p.p.m. Pb
max. mean min. max. mean min. max. mean mm.
32 samples close to factory 9300 3100 1000 370 116 19 1680 700 75 32 samples outside most toxic area but in vicinity of factory 1450 670 280 27.4 16.9 11.4 120 57 17 6 samples from districts where
trace poisoning is excluded 74 38 26 7.5 6.5 6.0 < 2 ' < 2 < 2
1. The analytical method did not permit exact determination of low levels of Pb.
Poisoning by airborne molybdenum, lead, copper, and arsenic
Hupka (1955) in Germany described illness in grazing cattle and horses within a distance of 5 kilometers from two lead and zinc foundries ; high levels of both elements were found in dust near these factories. Airborne arsenic poisoning in sheep grazing 15 miles from a copper smelter was reported by Stockinger (1962). The occurrence of industrial molybdenosis in grazing cattle in Sweden was reported by Hallgren et al. (1954) and by Gardener and Hall-Patch (1962) in Great Britain. Affected cattle had molybdenum levels in their blood higher than normal. Administration of copper to diseased animals was very effective. A report on industrial molybdenosis in grazing cattle is given in this symposium by Verwey.
Air pollution control in Norway
The growth of the aluminium industry and the accompanying detrimental effects, not only on domestic animals but also in vegetation, farmlands and forests, led the
251

Norwegian authorities in 1956 to nominate a special body, the Smoke Control Committee, with the task of investigating all possible measures for preventing industrial smoke, gases, and dust from causing health injuries and other damages. The report of this committee concluded with a recommendation for the establishment of a Smoke Control Council. This was done in 1961, and the Council now supervises all efforts to reduce industrial smoke, gas, and dust injuries as well as air pollution in general.
A special research institute to take care of all aspects of air pollution problems in Norway is now being established in Oslo.
Résumé Les effets de la pollution atmosphérique sur les animaux
Le présent document traite des maladies animales dues aux polluants émis dans l'atmosphère par un nombre d'industries ou par l'intermédiaire d'autres activités de la société moderne. Des polluants toxiques, entraînés par l'air, peuvent atteindre les animaux, d'une part par la voie de leur consommation de fourrage ou d'eau, contaminés par la fumée, la poussière ou les déchets d'une industrie voisine, d'autre part par l'inhalation de la fumée industrielle. L'inhalation de gaz nuisibles n'a généralement pas d'effet immédiat sur les animaux domestiques.
Les composés organiques, tels que les dérivés de penta- et de hexachloronaphtalène, sont hautement toxiques pour le bétail. On a rapporté de l'Angleterre que la pollution atmosphérique est préjudiciable au gibier. Les effets nuisibles de la pollution atmosphérique sur la santé des oiseaux, des brebis et des lièvres sont également mentionnés dans le livre de Marsh. Des oiseaux vivant en captivité, le canari semble être le plus sensible à l'anoxie et aux substances toxiques volatiles dans les régions infectées de fumée. Les particules contenues dans les gaz d'échappement sont carcinogènes pour les rongeurs. A l'origine de la pollution atmosphérique sont également les insecticides pulvérisés à partir de l'avion, qui peuvent atteindre les lacs, fleuves et mers et nuire à la vie des poissons.
Les polluants chimiques qui sont particulièrement nuisible pour les animaux après leur dispersion dans l'atmosphère sont: les composés de fluor, les poussières métalliques (surtout les oxydes et les autres composés contenant le fer, le molybdène, le béryllium, le manganèse, le magnésium, le plomb, le cuivre et le zinc), les métalloïdes tels que le soufre, le sélénium et l'arsenic, ainsi que des substances organiques toxiques.
Ces dernières années, on s'est penché notamment sur la 'fluorose industrielle', observée aux alentours d'usines d'aluminium, d'usines de superfosfate, d'aciéries, de briqueteries, d'émailleries et également dans les régions où l'on utilise le charbon fluorifère comme combustible. Le phénomène de la fluorose en rapport avec l'industrie d'aluminium n'est pas seulement influencé par de grandes quantités de fluor et de poussières entraînées par la fumée, mais en Norvège la situation est encore plus défavorable à cause de l'implantation des usines dans les vallées de forme U, aux montagnes raides et élevées des deux côtés, constituant ainsi de véritables pièges de fumée.
Le présent document donne une vue d'ensemble de quinze ans d'étude de variations
252

saisonnières et annuelles de la contamination fluor des herbes aux alentours de trois usines d'aluminium dans le Sud du Norvège, compte tenu de la situation géographique, de la topographie et de la distance des usines. La topographie paraît être de la plus haute importance.
On donne ensuite une description des expériences visant à réduire les effets nuisibles de la contamination fluor par le biais d'une nutrition améliorée ou par l'application de plusieurs correctifs agissant sur le fluor. En outre, on explique la réduction de la teneur en fluor des herbes par un procédé de défluorisation mis au point dans le laboratoire de l'auteur.
Ensuite, une brève description est donnée des maladies des animaux domestiques causées par les fumées et les poussières industrielles. Plus détaillé est l'exposé sur l'empoisonnement de bétail par des oligo-éléments aux alentours d'une usine de zinc. Plusieurs techniques de purification de fumée sont examinées.
En conclusion, quelques observations au sujet de l'organisation de la lutte contre la pollution atmosphérique en Norvège.
Zusammenfassung Die Auswirkung von Luftverunreinigung auf Tiere
Dieses Referat befaßt sich mit tierischen Erkrankungen durch Luftverunreinigende Stoffe aus industriellen Anlagen oder anderen Quellen. Toxische Stäube können nicht nur durch verschmutzte Nahrung oder Trinkwasser in das Tier gelangen, sondern auch durch Inhalation. Die Einatmung schädlicher Gase durch Nutztiere ist im allgemeinen aber ohne Bedeutung.
Organische Verbindungen wie Derivate des Penta- und Hexachloronaphthalins sind für das Vieh sehr giftig. Aus England ist bekannt, daß Luftverunreinigung auch das Wild beeinträchtigt. Marsh erwähnt nachteilige Folgen für die Gesundheit von Vögeln, Mutterschafen und Hasen. Von den in Gefangenschaft lebenden Vögeln scheint der Kanarienvogel in besonderem Maße empfindlich zu sein. Substanzen im Abgase von Kraftfahrzeugen erweisen sich als krebserzeugend bei Nagetieren. Die Luft wird auch verunreinigt durch von Flugzeugen versprühte Insektizide; wo sie in Flüsse und Seen gelangen, können sie auch für Fische schädlich sein.
Als Emissionen sind für Tiere besonders bedeutsam : Fluor-Verbindungen, Metallstäube (besonders Oxide und andere Verbindungen des Eisens, Molybdäns, Berylliums, Mangans, Magnesiums, Bleis, Kupfers und Zinks), nichtmetallische Elemente (Schwefel, Selen und Arsen) und toxische organische Substanzen.
In den vergangenen Jahren hat man der 'industriebedingte Fluorose' große Aufmerksamkeit geschenkt. Sie wurde nicht nur in der Nähe von Aluminium-Hütten, Superphosphat-Fabriken, Stahlwerken, Ziegeleien und Emaillier-Werken beobachtet, sondern auch in Gebieten wo F-haltige Kohle als Brennstoff diente. Das Auftreten der Fluorose hängt auch ab von der Lage der Anlagen. So befinden sie sich in Norwegen in U-förmigen Tälern mit beiderseitige steil ansteigenden hohen Bergen, die ein Entweichen der Abgase verhindern. Dies verschlechtert die Situation sehr.
Bei der über fünfzehn Jahre durchgeführten Untersuchung betreffend die Jahres-
253

zeitlichen und jährlichen Schwankungen der F-Kontamination von Weidegras in der Nachbarschaft von drei Aluminium-Hütten im südlichen Teil Norwegens wurde den Einfluß der geographischen und örtlichen Lage sowie die Rolle der Entfernung von den Hütten beurteilt. Die geographischen Verhältnisse erwiesen sich als sehr wichtig.
Bei den Experimenten um die schädlichen Auswirkungen der F-Kontamination zu verringern handelte es sich um eine allgemeine Verbesserung der Ernährung, die Zugabe von verschiedenen Stoffen zum fluorhaltigen Futter, sowie um Methoden den F-Gehalt des Weidegrases durch ein Entfluorierungs-Verfahren, das im Laboratorium des Autors entwickelt wurde, zu senken.
Erkrankungen von Nutztieren durch industrielle Emissionen, werden kurz beschrieben. Ferner wird ein mehr in Einzelheiten gehender Bericht über das Vorkommen von Spurenelementen gegeben, die den Viehbestand in der Nähe einer Zinkhütte vergiftet. Verschiedene Verfahren zur Abgasreinigung werden erwähnt.
Abschließend wird auf die Durchführung von Maßnahmen zur Reinhaltung der Luft in Norwegen kurz eingegangen.
References
Allcroft, Ruth. 1959. In: W. B. Yapp (Ed.): The effects of pollution on living material. Symp. Inst. Biol. London 8: 95-102.
Annual Report. 1948. Dept. Biochem., Vet. College, Norway. Boddie. G. F. 1955. Vet. Rec. 67: 827. Ender. F.. J. L. Flatla & M. Aas Hansen. 1962. 9th Nord. Vet. Congr. Sect. A. 14: 181. Copenhagen. Flatla, J. L. & F. Ender. 1967. IV. Tagung der Weltgesellschaft für Buiatrik. Zürich 1966: 45-58. Gardener, A. W. & P. K. Hall-Patch. 1962. Vet. Rec. 74: 113. Hallgren, W.. N. Karlsson & G. Wramby. 1954. Nord, veter. Med. 6: 469. Hupka, E. 1955. Wien, tierärtzl. Mschr. 42: 763. Medical Research Council, London. 1949. Memorandum 22. Phillips, P. H., D. A. Greenwood, C. S. Hobbs & C. F. Huffman. 1955. Nat. Acad. Sei., Nat. Res.
Council, USA, Publ. 381. Slagsvold, L. 1934. Norsk veter. Tidsskr. 44: 2. Stockinger, H. E. 1962. In : I. Stern (Ed.) : Air Pollution, Vol. I. Academic Press, New York, London. Tesink, J. 1954. Fluorosis in cattle, therapeutic influence of aluminium sulphate. Thesis, Utrecht.
254

Problems of air pollution in Yugoslavia
S. Stamatovic and D. Milic
Institute of Pathology and Therapeutics of Domestic Animals, Beograd, Yugoslavia
Abstract
The expansion of the nitrogen and phosphate fertilizer industries has caused an increase in fluor emission. Measures to decrease it were not completely successful. Damages depend on the geographic situation of the plant; under normal conditions they are restricted to a distance of about 5 km.
A foundry for lead has created the problem of lead accumulation in soil, water and animals, particularly in ruminants. Poisoning has occurred in lambs but so far not in sheep. The milk contained on the average 132 Y/100 g, a much larger quantity than in other districts. This causes various illnesses. In cattle no lead poisoning been observed, though in cow milk the concentration may approximate that in sheep milk.
To increase agricultural production in Yugoslavia, particularly of cereals, a wider application of artificial fertilizers is necessary. This led to the expansion of the industry producing nitrogen and phosphate fertilizers. The techniques applied in the manufacturing of superphosphate have gradually caused an increase in the emission of fluor, endangering the life of plants and domestic animals.
The first cases of fluorosis were recorded one year after a factory of superphosphate m'the north-eastern part of Serbia was put in operation, as reported in 1965. The measures taken in the factory to decrease the emission of fluor indeed had positive results on the intensity of fluorosis, but the problem could not be completely solved. During recent years two other factories of superphosphates were put in operation, one in the northwest, the other in the southern part of Serbia (in the autonomous District of Kosovo and Metihija).
The intensity of fluorosis is very different and depends on the geographic position, the climate and the species and concentration of animals in the various districts. While m the vicinity of one factory fluorosis is only a minor problem, in other districts fluorosis occurs not only in cattle and horses but also in sheep. According to the observations up to now available, at a distance of over 5 km from the factories damages greatly decrease, but in some years they may occur even at a distance of 10 km, though only in the direction of the prevailing winds.
In the affected areas symptoms of fluorosis have been observed in horses, cattle, sheep and goats, but not in pigs. This is due to differences in housing and the kind of nutritives the animals receive.
In addition to the well-known general symptoms of chronic fluor poisoning (parti-
255

cularly in teeth and bones), changes have been noticed in the wool as well as in the horn substance of paws, hoofs and horns. The wool, hairs and horns lose their normal lustre and elasticity and they become dry and brittle.
An analysis of nutritives can explain why fluorosis occurs in domestic animals (pigs excepted) in the affected area (table 1).
The quantities of fluor in the bones of both cattle and swine vary considerably, as shown by table 2. Obviously for pigs the F content increases with the time they spent in an affected area, but the quantities are too low to cause fluorosis.
The presence of foundries for lead in the vicinity of the Trepca mines (Kosovo and Metohija) has created the problem of lead cumulation in soil, water and animals. This cumulation has a more or less distinct effect on domestic animals, particularly on ruminants. The work with galenite (PbS) caused some years ago an emission of SO2, but its damaging effect decreased when the plants started producing sulphuric acid. The fact that these foundries were situated in a river valley surrounded by mountains restricted lead poisoning to small ruminants in the valley, and pastures in the mountains remained unaffected. How far the air pollution penetrates the hills depends on the frequency and strength of the wind in the course of a year, especially in spring. Lead poisoning has been observed in lambs, but as yet not in sheep. The milk of sheep contained, on the average, about 132 y per 100 g lead, a much larger quantity than in the other districts. Lambs showed paralysis of extremities and tongue, temporary diarrhoea, anaemia and general weakness. In cattle no marked lead poisonings were observed, although their milk in this area showed about the same concentration as that of sheep.
The occurrence of clinical symptoms of lead poisoning in lambs and their absence in calves, in spite of a larger concentration of lead in the milk of cows, demands an explanation. It is a well known that sheep, unlike cattle, are not very susceptible to lead. No doubt, in both cases lead is introduced into the organisms of young animals via milk, but it is necessary to point out that the analyses have shown that the concentration of lead appearing in milk in the course of a year varies about 50 % from the given average values. This variability is probably caused by the mobilization of lead from the bones of the mother, and the latter depends on the quality of her diet. Sheep in this area lamb in the period January-March, during which time they feed on hay
Table 1. Fluor in various nutritive substances (in mg( 100 g)
Hay Corn straw Grains of maize Grains of wheat Sunflower seed Straw
21.6-298.0 26.2-102.6 0.35-5.5 0.69-0.72 0.62-0.78 54.22-89.1
Table 2. Quantities of fluor in bones of various animals (in mg;100 g)
Fullgrown cattle Young cattle Young pigs Young sows (gilts) Fullgrown sows
489.7-1098.8 564.8-989.0 24.3-51.8 38.9-47.9 42.8-90.5
256

and other nourishment containing much phosphorus and organic acids that cause a subclinical state of osteomalacia. This does not occur to cows. Such circumstances are favourable for the excretion of lead in abnormally large quantities at lambing time and causes relatively high concentrations in the lambs.
It may be interesting to add that by regular nutrition with sufficient quantities of calcium at the time of pregnancy and after lambing, the percentage of affected lambs showed to be very low. Application of vitamin mixtures had an even more favourable effect. This suggests the possibility of prophylactic measures to prevent lead poisoning.
Résumé Problèmes de la pollution atmosphérique dans une région de Yougoslavie
Afin d'augmenter la production agricole, notament celle des céréales, on a de plus en plus recours aux engrais artificiels, ce qui entraîne une extension de l'industrie des engrais azotés et phosphatés, posant la problème de l'émission de fluor et de ses effets sur les plantes et les animaux domestiques.
Les premiers cas de fluorose ont été enregistrés un an après la mise en route d'une fabrique de superphosphates située dans le nord-est de la Serbie. Les mesures prises en vue de réduire les immissions fluorées n'ont pas été entièrement satisfaisantes.
La fluorose est conditionnée par la situation géographique, le climat, ainsi que le type et la concentration des animaux. Alors qu'au voisinage d'une des fabriques la fluorose se pose que peu de problèmes, elle frappe dans l'autre région, non seulement les bovins et les chevaux, mais également les ovins. Mais le problème est beaucoup moins aigu dès que les animaux se trouvent à plus de cinq kilomètres de la fabrique.
L'existence d'une fonderie de plomb au voisinage des mines Trepca (Kosovo et Metohija) a provoqué une accumulation de plomb dans le sol, dans l'eau et dans le corps des animaux, en particulier sur des ruminants. L'exploitation de la galène (PbS) à provoqué il y a quelques années des émissions de SO2, mais la mise en service d'installations pour la production d'acide sulfurique a réduit considérablement les effets de ce gaz sur les êtres vivants. La situation, dans une vallée entourée de montagnes, de la fonderie explique que les intoxications des petits ruminants se produisent uniquement dans la vallée.
Les intoxications par le plomb sont très prononcées chez les agneaux, mais l'on en n'a pas constaté jusqu'ici chez les moutons adultes. On a trouvé en moyenne dans le lait de brebis 132 y/100 g de plomb, ce qui est beaucoup plus que dans les autres régions. On observe chez les agneaux la paralysie des extrémités et de la langue, des diarrhées temporaires, de l'anémie et une faiblesse générale. On n'a pas constaté d'intoxication par le plomb chez les bovins bien que dans cette région la concentration dans le lait soit à peu près la même que dans le lait de brebis.
257

Zusammenfassung Probleme der Luftverunreinigung in einem Teil Jugoslawiens
Um die landwirtschaftliche Produktion, besonders von Getreide, zu erhöhen ist eine erweiterte Anwendung von Düngemittlen notwendig. Dies führt zur Expansion von Fabriken die Stickstoff und Phosphat erzeugen. Es ist dieselbe Industrie, die in zunehmendem Maße Fluor (Verbindungen) emittiert und dadurch Pflanzen und Nutztiere gefährdet.
Die ersten Fluorose-Fälle wurden ein Jahr nach Inbetriebnahme einer Superphos-phat-Fabrik im nordöstlichen Teil Serbiens bekannt. Maßnahmen zur Verminderung der Fluor-Emission hatten nicht den erwünschten Erfolg. Hinzu kommt, daß vor einigen Jahren zwei weitere Superphosphat-Fabriken die Produktion aufnahmen.
Das Vorkommen der Fluorose hängt von der Topographie, dem Klima sowie von der Art der Tiere und ihrer Entfernung vom Emittenten ab. So ist es nicht überraschend, daß in einem Gebiet die Fluorose kein Problem darstellt, wogegen sie in anderen Teilen des Landes nicht nur bei Rind und Pferd sondern auch beim Schaf vorkommt. Unter normalen Verhältnissen sind Schäden nur bis zu einer Entfernung von etwa 5 km vom Emittenten zu erwarten.
Eine in der Nähe der Trepca-Minen befindliche Bleihütte hat das Problem der Blei-Anreicherung in Boden, Wasser und Tieren, besonders bei Wiederkäuern, akut werden lassen. Die kürzlich aufgenommene Schwefelsäure-Produktion hat die Gefahr jedoch verringert. Auch liegt die Hütte im Tal, so daß die Bergwiesen nicht beeinflußt werden.
Ein Bleivergiftung ist bisher nur bei Lämmern beobachtet. Die Schafsmilch im Durchschnitt etwa 0,132 mg% Blei, eine viel größere Menge als in anderen Gebieten. Dies führte zu einer Lähmung der Extremitäten und der Zunge, zeitweiligem Durchfall, Anämie und allgemeiner Schwäche bei den Lämmern. Beim Rindvieh wurde keine Vergiftung durch Blei festgestellt, obwohl in diesem Gebiet die Anreicherung in der Kuhmilch der bei den Schafen ermittelten nahekommen dürfte.
258

Verunreinigungen von Kulturpflanzen mit Blei aus Kraftfahrzeugabgasen
A. Kloke und H.-O. Leh
Biologische Bundesanstalt für Land- und Forstwirtschaft, Institut für nichtparasitäre Pflanzenkrankheiten, Berlin-Dahlem
Kurzfassung
Pflanzenproben aus verkehrsnahen und verkehrsfernen Gebieten der Bundesrepublik Deutschland und West-Berlins wurden auf Blei analysiert. Die Ergebnisse zeigen, daß der Bleigehalt der oberirdisch wachsenden Pflanzenteile mit der Annäherung des Standorts an Autobahnen und verkehrsreiche Straßen erheblich ansteigt. Unterirdisch gewachsene und innere Pflanzenteile weisen auch in der Nähe der Fahrbahnen keine Erhöhung der Bleigehalte auf. Ein Teil des den Blättern anhaftenden Bleies ist abwaschbar. In Futterpflanzen aus Verkehrsnähe liegt der Bleigehalt weit über 10 p.p.m., also über der Menge, die die Futtermittelrechtskommission der Europäischen Wirtschaftsgemeinschaft als duldbare Höchstmenge festgelegt hat. Zur Abwendung von Gefahren sollte man den Anbau von Nahrungs- und Futterpflanzen nahe der Fahrbahnen aufgeben, oder den Zusatz von Bleitetraäthyl zu Kraftstoffen verbieten.
Das in Europa und den USA verwendete Bleibenzin enthält 0,02 bis 0,06 Vol. % Bleitetraäthyl, d.h. ein Liter Benzin für Kraftfahrzeuge enthält 200-600 mg Blei, im Mittel zirka 400 mg. Von diesem Blei wird mit den Auspuffgasen 50-70%, vornehmlich als Sulfat, aber auch in Form von Halogeniden, Oxid und unvollständig verbranntem Bieitetraäthyl ausgestoßen ; der Rest verbleibt in den Motor- und Auspuffanlagen, tin Auto, das auf 100 km etwa 10 Liter Benzin verbraucht, gibt also auf einer Fahrstrecke von 100 km mit den Auspuffgasen 2-3 g Blei an die Luft ab. Bei einer angenommenen • Verkehrsdichte von 3000 Autos pro Stunde, wie sie auf stark befahrenen Autobahnen tagsüber häufig erreicht wird, ergibt dies eine Bleimenge von 60 bis 90 g je km und Stunde. Dies sei nur erwähnt, um eine Vorstellung zu geben von den Bleimengen, die infolge des Kraftfahrzeugverkehrs in die Luft gelangen. Das im Auspuff niedergeschlagene Blei wird bei hohen Geschwindigkeiten in Form größerer Partikel teilweise auch ausgestoßen und gelangt so in den Straßenstaub, so daß die insgesamt ausgestoßene Menge noch um 30-50 % höher liegt.
Unsere Untersuchungen beschäftigten sich mit der Frage, in welchem Maße die für die menschliche und tierische Ernährung bestimmten Kulturpflanzen dieses Blei aus der Luft bzw. aus dem Boden aufnehmen.
Einleitend zu diesen Untersuchungen wurden an verschiedenen Plätzen in Berlin Grasproben genommen. Wie aus Abb. 1 hervorgeht, bestehen hinsichtlich des Bleigehaltes der Proben eindeutige Beziehungen zur Verkehrsdichte.
Die auffallend hohen Anteile abwaschbaren Bleis, vor allem bei den stark kontaminierten Proben von verkehrsreichen Orten, deuten eine starke Adsorption an der
259

p.p.m.Pb in der Trockensubstanz
50
25
N 3 ^ .3
Verkehrs- 75m von 11000 23000 32000 fern Hauptstra|« Kfz in 12 Stunden
Abb. 1. Bleikontamination von Gras in Abhängigkeit von der Verkehrslage (Berlin, August 1963): links ungewaschen, rechts gewaschen.
Blattoberfläche an und lassen vermuten, daß nur ein relativ geringer Abtransport in das Pflanzeninnere erfolgt. Diese Vermutung bestätigte sich in Gefäßversuchen, in denen den Versuchspflanzen Blei z.T. als Nitrat über den Boden (100-400 mg Pb/kg Boden), z.T. als ionogenes (Pb-210) über die Blätter gegeben wurde (Abb. 2 und Abb. 3).
Sowohl bei Tomaten als auch bei Kartoffeln wurden sehr hohe Bleigehalte in den gewaschenen Wurzeln gefunden. Dies bedeutet, daß das Blei zum größten Teil bereits in oder an der Wurzel festgelegt wird und nur ein sehr geringer Teil in die übrigen Pflanzenteile gelangt. Die Bleigehalte der Stengel, Blätter und Früchte bzw. Knollen der untersuchten Pflanzen zeigen bei steigenden Bleigaben nach anfänglichem leichtem Anstieg keine wesentliche Erhöhung.
Besonders interessant ist, daß die Kartoffelknolle auch bei sehr hohem Bleigehalt des Bodens ihren eigenen Bleigehalt kaum erhöht. Der Grund dürfte wohl darin liegen, daß es sich bei der Kartoffelknolle um ein morphologisch dem Sproß zugehöriges Speicherorgan handelt. Andererseits ist, wie Tabelle 1 zeigt, die Aufnahme von Blei durch die Blätter hoch, der Transport in das Pflanzeninnere aber gering.
Die Abwaschbarkeit des auf das Blatt aufgebrachten Bleis verringert sich mit steigender Kontaktzeit: Eine Stunde nach dem Aufbringen ist etwa 80%, nach zwei
260

P.P.iTvPb in der Trockensubstanz
p.p.m.Pb in der P.P.m. Pb in der Trockensubstanz Trockensubstanz der Wurzel
5)3 -
100
•Früchte
4000
- 2000
«00
300 400 mg Pb/kg Soden
IOOO
200
p.p.m.Pb in der Trockensubstanz der Wurzel
8000
- 4000
300 400 mg Pb/kg Boden
Abb. 2. Aufnahme und Verteilung von Blei in Abb. 3. Aufnahme und Verteilung von Blei in Tomatenpflanzen in Abhängigkeit vom Bleige- Kartoffelpflanzen in Abhängigkeit vom Bleigehalt halt des Bodens (mg Pb/kp). des Bodens.
Tabelle 1. Aufnahme und Verteilung des über das Blatt zugeführten Bleis.
Von der zugeführten Menge (10 u-8 ""Pb) wurden in %gefunden
nach 48 Stunden nach 14 Tagen
Tomate betropftes Blatt übrige Blätter Stengel Früchte Wurzeln
Kartoffel betropftes Blatt übrige Blätter Knollen Wurzeln
81 0,2 0.03
<0,01 0,01
83 0.04
<0,01 0.03
61 5 0,2 0,04 0,01
59 0,02 0,02
261

Tagen noch 20 bis 40% abwaschbar. Der weitaus größte Teil des aufgenommenen Bleis wird am Aufgabeort festgelegt; nur bei längeren Kontaktzeiten findet ein geringfügiger Transport in das Innere der Pflanze statt.
Versuche über die Aufnahme von Blei aus dem Boden durch Weidelgras und über die Blätter angebotenen radioaktiven Bleis durch Sonnenblumen lieferten prinzipiell die gleichen Ergebnisse.
Die weiteren Untersuchungen galten der Erfassung der durch den Autoverkehr auf die Pflanze gelangten Bleimengen. Dazu wurden im Berliner Stadtgebiet Gefäße mit praktisch bleifreiem Boden und Weidelgras als Versuchspflanze an verkehrsreichen und zur Kontrolle auch an verkehrsfernen Orten vom 28. April bis zum 24. Juli aufgestellt. Aus der Darstellung in Abb. 4 geht wiederum hervor, daß die Bleikontamination der dem Verkehr besonders ausgesetzten Proben beträchtlich höher liegt als diejenige der Proben, die an verkehrsfernen Orten gewachsen waren.
In einer weiteren Versuchsreihe haben wir an verschiedenen Verkehrsstrecken der Bundesrepublik und in West-Berlin Proben von Gras, Kartoffeln, Rüben und Gemüse entnommen, um einen Überblick über die allgemeine Bleikontamination der Pflanzen in verkehrsreichen sowie in verkehrsfernen Gebieten zu bekommen. In Abb. 5 ist der Bleigehalt von Gras in Abhängigkeit von der Lage der Probenahmestelle zur Autobahn aufgetragen. Die zu den mit (R) bezeichneten Säulen gehörenden Proben sind alle am Ruhr-Schnellweg entnommen worden. Es zeigt sich zunächst, daß der Bleigehalt dieser Proben weitaus höher liegt als derjenige der anderen Proben, die ebenfalls
p p.m. Pb in der Trockensubstanz 30 r
20
1.2. Schnitt
? 1.2
verkehrsfern
12.
1.2.
jeweils ca 30000 Kfz. in 12 Std.
Abb. 4. Bleikontamination von Weidelgras in Abhängigkeit von der Verkehrslage (Gefäßversuch. Berlin 1964).
[ ,; m Pb in der Trockensubstanz
ÜL.JL of 100 30 4-5 1-2 M M 1-2 4-5 af
Entfernung von der Autobahn inrn
Abb. 5. Bleigehalt von ungewaschenem Gras in Abhängigkeit von der Lage zur Autobahn (BRD, September 1964); af = autobahnfern, M — Mittelstreifen; R = Proben aus dem Ruhrgebiet.
262

aus der Nähe von Bundesautobahnen, aber in weiterer Entfernung vom Ruhrgebiet stammen. So wurden z.B. in zwei in der Nähe von Hannover 100 m von der Autobahn entfernt genommenen Grasproben 9,9 bzw. 10,2 p.p.m. Blei gefunden, während eine im Ruhrgebiet bei Dortmund 300 m vom Ruhr-Schnellweg entfernt genommene Probe, deren Standort noch durch eine Anhöhe gegen die Straße geschützt war, 16,1 p.p.m. und eine andere Probe aus der Nähe von Neviges, 50 m von einer mäßig befahrenen Landstraße genommen, 20,5 p.p.m. enthielt.
Der Bleigehalt von Pflanzen, die nicht der unmittelbaren Verkehrseinwirkung ausgesetzt sind, ist nach unseren Feststellungen im Ruhrgebiet ganz allgemein etwa doppelt so hoch wie in anderen Gebieten. Ob hieran nur der im Ruhrgebiet besondere starke Kraftfahrzeugverkehr schuld ist, oder ob auch bleihaltige Emissionen von Industriewerken beteiligt sind, wurde nicht näher untersucht.
Aus der Darstellung geht ferner hervor, daß der Bleigehalt des Grases mit der Annäherung an stark befahrenen Autobahnen zunimmt. Während Proben aus verkehrsfernen Lagen ca. 10 p.p.m. Blei in der Trockensubstanz enthalten, steigt der mittlere Bleigehalt auf ca. 65 p.p.m. unmittelbar seitlich der Autobahn und bis über 100 p.p.m. in den auf dem Mittelstreifen entnommenen Proben. Im Ruhrgebiet liegt der Bleigehalt der Proben aus verkehrsfernen Lagen bei ca. 20 p.p.m., seitlich der Autobahn in ein bis zwei Metern Entfernung bei 110-120 p.p.m. (also bereits höher als auf dem Mittelstreifen der Autobahnen außerhalb des Ruhrgebietes) und steigt auf dem Mittelstreifen bis zu einem mittleren Gehalt von ca. 180 p.p.m. an, wobei wir im Extrem in einer Probe aus dem Raum Dortmund sogar 228 p.p.m. gefunden haben.
Abb. 6 zeigt die Mittelwerte der Bleigehalte von Zucker- und Futterrüben, die in verschiedenen Entfernungen von Autobahnen geerntet wurden. Auch hier zeigt sich wieder ein Ansteigen der Bleigehalte der Blätter rm> abnehmender Entfernung von der Autobahn, während der Bleigehalt der Rübe selbst auch bei hohem Bleigehalt der Blätter auf einem praktisch konstant niedrigen Niveau bleibt.
Das gleiche Bild ergab sich bei Kartoffeln (Abb. 7) : Im Kraut eine Zunahme des Bleigehaltes mit der Annäherung des Standortes an stark befahrenen Autobahnen und Straßen bei allgemein höheren Bleigehalten der Pioben aus dem Ruhrgebiet, während der Bleigehalt der Knollen konstant niedrig bleibt, vom Bleigehalt der Blätter also Praktisch unabhängig ist.
Diese bei Rüben und Kartoffeln gemachten Feststellungen, daß nämlich auch bei starker Bleikontamination der Blätter die unterirdisch gewachsenen Pflanzenteile nur geringe Bleimengen enthalten, decken sich voll und ganz mit den vorhin kurz dargestellten Ergebnissen unserer Gefäßversuche mit 2 10Pb.
Untersuchungen von Gemüsepflanzen auf ihren Bleigehalt bestätigten dies ebenfalls: Im linken Teil der Abb. 8 sind die von uns gefundenen Bleigehalte der zum Verzehr bestimmten Teile verschiedener Gemüsepflanzen (von verkehrsfernen Standorten!) zusammengefaßt, aufgeteilt nach oberirdisch (A), teilweise unterirdisch (B) und ganz unterirdisch (C) gewachsenen Pflanzenteilen. Die Bleigehalte sind bei den oberirdisch gewachsenen Teilen am höchsten, bei den teilweise unterirdisch gewachsenen deutlich niedriger und bei ganz unterirdisch gewachsenen Früchten am geringsten.
263

p.p.m.Pb in der Trockensubstanz 75 r-
25
Blatter ung. gew.
R
Blätter Rüben Blätter Rüben ung. gew. gew. ung. 'gew. gew.
p.p.m.Pb ,n der Trockensubstanz 100 r
Kraut
Kraut
c v 3 cn
50
Rüben gew.
R
iL verkehrsfern 50m 2-5m
von der Autobahn
c «> 3 O»
C V 3 C7I
?S
rfi m £ verkehrtem 50km vd.
Autobahn 10 km v.d.
Autobahn 5 m v.d. Autobahn
Abb. 6. Bleigehalt von Futter- und Zuckerrüben in der BRD, September 1964; ung. = ungewaschen, gew. = gewaschen; R = Proben aus dem Ruhrgebiet.
Abb. 7. Bleigehalt von Kartoffeln in der BRD, September 1964; ung. =• ungewaschen; gew. = gewaschen; gesch. = geschält, R = Proben aus Ruhrgebiet.
Im rechten Teil der Darstellung sind die Bleigehalte gewaschener Proben von Sellerieknollen und von Porree noch einmal in Abhängigkeit von der Verkehrslage dargestellt.
Es hat sich weiterhin gezeigt, daß auch die Windrichtung eine wesentliche Rolle hinsichtlich des Ausmaßes der Kontamination der Pflanzen mit Blei spielt. So fanden wir in Grasproben, die auf der der vorherrschenden Windrichtung zugewandten Seite der Autobahn im Abstand bis zu 5 m genommen wurden, einen mittleren Bleigehalt von 64,3 p.p.m., während auf der der Hauptwindrichtung abgewandten Seite im Mittel 89,6 p.p.m. Blei, d.h. ca. 40% mehr gefunden wurden (Abb. 9). Hinsichtlich der Bleigehalte von Kartoffelkraut und Rübenblättern waren noch erheblich größere Differenzen in Abhängigkeit von der Hauptwindrichtung festzustellen.
Schließlich haben wir eine Reihe von Getreideproben genommen und ebenfalls auf ihren Bleigehalt untersucht. Wegen des an den verschiedenen Probenahmestellen z.T. sehr unterschiedlichen Reifezustandes des Getreides mußten wir in den meisten Fällen darauf verzichten, eine Trennung in Körner und Spreu durchzuführen, so daß die ermittelten Bleigehalte sich jeweils auf die ganze Ähre beziehen. Erfreulicherweise hat sich gezeigt, daß die Bleigehalte in Getreideähren keine hohen Werte erreichen,
264

p.p.m. Pb in der Trockensubstanz
Sel ler ieknollen
100
vf vf Vf vf vf 7m vf vf 7m
Abb. 8. Bleigehalte zum Verzehr bestimmter Teile von Gemüsepflanzen (BRD und September 1964). R = Proben aus dem Ruhrgebiet. A = Kopfkohl, Grünkohl, Kohlrabi, salat, grüne Bohnen, Porree; B = Kohlrüben, Sellerie; C = Möhren; vf = verkehrsfern. Pm.Pb in der c MQ Pb/
roc^onsubstonz Gras TS Ähre
I * 2
Berlin. Kopf-
50
Gras
Rüben-b l i l te r
Rübtn-blitter
Ï
15
10
b
Wetzen Gers te
3 V Q.
C O
12.9 p.p.m.
3.b ppm.
Ol
o.
c o
pp.m.
3.4 p p m
Roggen
3
a.
c o :*:
118 pp.m.
4.8 pp.m.
a.
c o X.
20 5 pp.m.
5.2 p.p.r
verkehrsfern Verkehrs- 2m von der fern Autobahn
entgegen mit der vorherrschenden Windrichtung
A b b . 9. Bleigehalte von Pflanzen aus Abständen Abb. 10. Verteilung von Blei in Getreideähren. b |s zu 5 m von der Autobahn in Abhängigkeit von d e r Hauptwindrichtung.
265

Tabelle 2. Bleigehalte von Getreideähren in p.p.m. Pb in der Trockensubstanz in Abhängigkeit von der Verkehrslage.
Entfernung des Standorts von der Autobahn
50 m und > 20 m 10 m 5 m und <
Roggen (B1 bei Unna) 7,1 9,3 10,8 12,0 Roggen (Autobahn bei Helmstedt) 6,0 9,4 Roggen (Autobahn bei Wesseling) 9,5 12,3 Gerste (Autobahn bei Wesseling) 7,6 13,0 13,7
auch dann nicht, wenn die Proben in unmittelbarer Nähe der Autobahn entnommen worden waren. Ganz allgemein lagen die Bleigehalte des Roggens höher als diejenigen der Gerste und die der Gerste etwas höher als die des Weizens.
Auch beim Getreide ließ sich aber trotz der allgemein niedrigen Bleigehalte der Einfluß des Kraftfahrzeugverkehrs deutlich erkennen (Tabelle 2). So stieg auf einem Roggenschlag der mittlere Bleigehalt der Ähren von 7,1 p.p.m. (in einer Entfernung von 50 m und darüber) auf 12,0 p.p.m. in unmittelbarer Straßennähe an; auf einem Gerstenschlag an der Autobahn Köln-Bonn lag der mittlere Bleigehalt der Ähren in 50 m Entfernung und darüber bei 7,6 p.p.m., während er in 5 m Entfernung von der Autobahn auf 13,7 p.p.m. angestiegen war. Weitere Untersuchungen haben gezeigt, daß (bezogen auf 1 g Trockensubstanz) die Spelzen und Grannen erheblich höhere Bleigehalte aufweisen als die Körner, daß aber wegen des gewichtsmäßig weit überwiegenden Anteils der Körner an der Gesamtähre der absolute Bleigehalt der Körner denjenigen der Spreu übersteigt. Abb. 10 zeigt die Verteilung des Bleis auf Körner und Spreu bei Weizen und Gerste aus verkehrsarmer Lage sowie bei Roggenproben, die einmal in verkehrsarmer Lage, zum anderen in unmittelbarer Nähe der Autobahn genommen wurden. Der höhere Bleigehalt der Ähren aus Autobahnnähe beruht zur Hauptsache auf dem höheren Gehalt der Spelzen und Grannen, während der Bleigehalt der Körner nur geringfügig erhöht ist.
Der Bleigehalt der Pflanzen ist von folgenden Faktoren abhängig: 1. der Verkehrsdichte (Kfz./Tag) 2. der Entfernung der Pflanze von der Fahrbahn (m) 3. der Expositionszeit des Pflanzenorgans (t) 4. der Oberflächenbeschaffenheit des Blattes (glatt, rauh, gewellt, behaart) 5. der Stellung des Blattes (senkrecht, waagerecht) 6. der Menge und Verteilung der Niederschläge 7. der Windstärke und Windrichtung
Der Ble.gehalt pflanzlicher Nahrung ist abhängig von folgenden Faktoren : 1. der Herkunft des Pfianzenmaterials (verkehrsnah, verkehrsfern) 2. der Art der zum Verzehr kommenden Pflanzenteile (Wurzel, Knolle, Rübe, Zwiebel, innere oder äußere Pflanzenteile, ober- oder unterirdisch gewachsen) 3. gewaschener oder ungewaschener Verzehr von rohem Pfianzenmaterial 4. der Art der Zubereitung zum Verzehr (geschält, ungeschält) 5. Verzehr roh oder gekocht
266

Es erhebt sich nun die Frage, ob die von uns festgestellten Bleigehalte in den Pflanzen bereits eine Gefahr für die menschliche und tierische Gesundheit darstellen.
Diese Frage ist für den Menschen nicht eindeutig zu beantworten, da keine fundierten Angaben darüber zu erhalten sind, welche Bleimengen vom menschlichen Organismus auf die Dauer ohne Beeinträchtigung der Gesundheit vertragen werden. Das Bundesgesundheitsamt hat uns auf eine diesbezügliche Anfrage die Auskunft erteilt, daß hinsichtlich eines gesundheitlich noch vertretbaren oberen Grenzwertes von 1 mg Blei bei täglicher Aufnahme durch den erwachsenen Menschen die Meinungen auseinandergingen, daß aber nach Ansicht verschiedener Autoritäten diese Menge bereits mit einer Gesundheitsschädigung, zumindest jedoch mit einem Risiko verbunden sei. Auf Grund der Ergebnisse unserer Untersuchungen können wir bisher nur abschätzen, daß der erwachsenen Mensch bei einem angenommenen täglichen Verzehr von 400 g Kartoffeln, je 200 g Gemüse und Obst sowie 400 g Brot und anderen Mehlprodukten bereits etwa 1,4 mg Blei täglich aufnimmt. Wenn man berücksichtigt, daß dazu noch eine (wenn auch geringe) Bleiaufnahme mit den übrigen Nahrungsund Genußmitteln sowie mit dem Trinkwasser kommt und daß außerdem eine gewisse Menge Blei mit der Atemluft, besonders in den Großstädten, aufgenommen wird, so dürfte die Bleibelastung des Menschen schon heute etwa das Doppelte des genannten Toleranzwertes von 1 mg pro Tag betragen. Dieser Überschlagsrechnung liegen (das sei noch besonders herausgestellt) nur die mittleren Bleigehalte zugrunde, die wir in verkehrsfern gewachsenen Pflanzenproben festgestellt haben. In dem Maße, in dem der Mensch Nahrungsmittel pflanzlicher Herkunft aufnimmt, die in der Nähe von Autostraßen gewachsen sind, steigt auch die Bleiaufnahme an.
Hinsichtlich der tierischen Ernährung liegen die Verhältnisse weit ungünstiger, da das Vieh mit dem Futter auch das oberflächlich anhaftende Blei aufnimmt. Die Futtermittelrechtskommission der EWG hat, wie aus dem Bericht über die Sitzung der Fachgruppe Futtermitteluntersuchung am 5. Mai 1965 in Bad Kreuznach hervorgeht, als duldbare Höchstmenge für Blei 10 p.p.m. im Gesamtfutter, ausgedrückt in Trockensubstanz, vorgeschlagen. Die von uns festgestellten Bleigehalte von ungewaschenem Gras liegen aber schon an verkehrsfernen Standorten im Mittel bei 8 p.p.m. in der Trockensubstanz, im Ruhrgebiet sogar bei 20 p.p.m., und steigen in unmittelbarer Nähe von Autobahnen auf (im Mittel) 65 p.p.m., im Ruhrgebiet sogar bis (im Mittel) H8 p.p.m. an! Bei Rübenblättern ermittelten wir in verkehrsfernen Lagen (im Mittel) !2 p.p.m., in Autobahnnähe 29 p.p.m. Blei; im Ruhrgebiet lagen die entsprechenden mittleren Bleigehalte bei 20 bzw. 67 p.p.m. Wenn auch in der vorgeschlagenen tolerablen Grenzkonzentration von 10 p.p.m. ein größerer Sicherheitsfaktor enthalten sein dürfte, so geben doch die von uns ermittelten Bleigehalte zu sehr großen Bedenken Anlaß, zumal ja anzunehmen ist, daß mit der immer weiter zunehmenden Verkehrsdichte auf unseren Straßen auch die Kontamination der Pflanzen mit Blei weiter ansteigen wird.
267

Summary Pollution of cultivated plants with lead from auto exhaust
Several hundreds of plant samples have been analysed for their lead content. They came from various parts of Western Germany, in the neighbourhood of areas with dense traffic or far remote from them.
It appears that considerable quantities of lead, originating from tetraethyllead containing gasoline as used by motorcars, settle on plants growing in the neighbourhood of highways. Part of the lead can be washed off, but after some time most of it sticks so firmly to the green parts that it becomes impossible to remove it with water.
Leaves of beet plants growing in the vicinity of highways contain 25-32 p.p.m. lead, which is far above the safe minimum the Food Inspection Department of the European Economic Community has proposed (10 p.p.m. in the dry matter of the diet).
Analysis of grass collected in the neighbourhood of highways has yielded 35-50 p.p.m. lead in the dry matter. Further away from them the lead content decreases, and at a distance of 100 m the normal quantity of 6-10 p.p.m. has been found in unwashed grass.
In general, higher contents are found in the industrial centres along the Ruhr than at a greater distance from these conglomerates.
Résumé La pollution des plantes de cultures par le plomb du gas d'échappement des véhicules
Plusieurs centaines d'échantillons de plantes, venant des périféries proches et éloignées du trafique dans la République Fédéral d'Allemagne et de l'ouest de Berlin, ont été analysées en matière de plomb. Les résultats montrent, que, par consequence de l'expulsion de plomb par les dispositifs d'échappement des véhicules actionnés par essence avec tetraéthyle de plomb, les plantes proches aux routes sont atteintes par des remarcables quantités de plomb. Une partie du quel peut être lavé; par un plus long temps de contact se fixe la plus grande parti du plomb sur les parties aériennes des plantes, qu'un lavage des produits de moisson ne peut pas le séparer. Nous avons constaté de 25 à 32 p.p.m. de plomb sur les feuilles de raves aux proximités des autostrades (Le Comité de décrets pour fourrages de la CEE à proposé 10 p.p.m. de plomb comme toléable, dans la substance sèche du fourrage total). Les données constatées dans la substance sèche des herbes proches aux autostrades se trouve entre 35 et 50 p.p.m.
En augmentant la distance s'abaisse le contenu et à partir d'environ 100 m du trafique atteignent les valeurs normales de 6 à 10 p.p.m., pour les herbes non lavées. En général dans la Region du Ruhr on a constaté des contenus plus élevés, que plus loin des centres d'accumulation.
268

Industrial molybdenosis in grazing cattle Preliminary communication
J. H. P. Verwey
Gezondheidsdienst voor dieren in Gelderland, Rozendaal (Gld.), the Netherlands
Abstract
Cows grazing pastures near a molybdenum oxide plant with 16 p.p.m. Cu in fresh grass (dry matter) developed hypocuprosis (diarrhoea, lower milk yield, dry skin, retarded growth, depigmentation). Copper in blood was very low (14-20 Y'100 CC). Fresh grass contained 29-80 p.p.m. Mo in dry matter. The symptoms, first diarrhoea, disappeared soon after treatment with CuSO,.
Towards the end of August, 1967, a disease manifested itself in a herd of young cattle grazing in a pasture along the banks of the Rhine; the animals were 18 months old at the time. The symptoms displayed were diarrhoea, dry skin, retarded growth, and depigmentation of the black hair around the eyes and elsewhere on the animals' bodies.
The clinical picture gave rise to the suspicion of copper deficiency, and indeed, when the animals' blood was tested on the 1st of September, 1967, the copper ratios found were very low (14-20 y/100 cc). This result was rather surprising, since the pasture on the river banks is as a rule rich in copper. In addition it was striking, that the -four cows that had been put out to pasture on this field only a fortnight before, showed a copper content of the blood amounting to 50, 66, 82 and 85 y/100 cc. Soil analyses of the pasture indeed revealed a very high copper content, namely 80 p.p.m., whereas the fresh grass contained 18 p.p.m. copper on dry matter basis. Obviously we had to do with a case of conditioned copper deficiency of the type described, among others, by Cunningham (1949).
At the beginning of October, another farmer from the area called in his veterinarian to look at his dairy herd. The animals were in poor condition, they had severe diarrhoea, and their milk yield was much lower than usual. Again blood samples were tested for copper; the contents once more proved to be very low (between 14 and 19 Y/100 cc). Some cows showed distinct depigmentation of the hair around the eyes and 'n one case the coat had completely faded into a dusty colour. Later on it appeared that the symptoms already had occurred at least six weeks before the veterinarian was called in.
The two cases taken together gave rise to the suspicion that air pollution was to blame, since both farms were situated in the immediate vicinity of an industrial site suspected to produce the responsible agent.
Cases of industrial molybdenosis described by Parker and Rose (1955), by Buxton
269

- '•••k-t 'i.-*&'*<**;&mmfS!mvEr
and Allcrofi (Iv55i and by Gaultier and 1 full-Patch tl'-ihtH conliimed this suspicion, ns ihe symptoms were identical.
An analysis of the i'resh herbage from three pa-turcs of the PAO farms proved thai molybdenum was indeed icsponsihle lor the disease. The molybdenum content in ihe-dry mailer of' the grass was ?*), 3X and NO p.p.m., respectively. Ml animals in ubieh hypocuprosts «as diagnosed almost immedta'.ely responded to treatment with OiS< > ; particularly as regititied the symptoms i.f man boen.
The iaeioty responsible for the mohInk-mini pollution v.as identified Ma :i new-»-paper in which was adveiiiscd lor ivorknieu in .< piatit prodneinu molybdenum uside.
Uecetit research has proved shut cast ufihe factoid the molvhdcnuin content of the herbage was u>o high up 10 a distance <•! 6 km. lh<s is m neemdance vsitlt the domt-naiinj? ••"'esi-winds in this teuton. At the south and M HI :b •.•.(,%! suies ol the fut.lory too high m<'.;: hdcitum contents m Ihe heiKiec wete <v\ly I'. .und up to a di-aance ol'about I its 2 km ixruusoea'.ii-ViiihK are radier raie,
'Î he herbaye samples taken in the he-mniiiuy oi the month of \pril. Ivf»s, contained much less molybdenum than those collected in Jam.tuiv «.>ti plots v.here site old herbage contained So '<0 p.p.in. molybdenum ;n the dry matter in January, "S 10 p.p.m. weie lo-.-tuI in the ukine heibae,e. 's hielt seems to prove ibai (he fueiot;, novv looses no or -.-in-iderably less molybdenum
270

271

;'I».a"'.*îi«,M.(J5,,Y;,»4i(,»;,»ll|.B
WX^mmmM^M *&&*
scchc, ftiard dans la croissance ci depigmentation des poils noirs autour des >cu\ et d'autre* panics du corps, l.c uihleuu clinique tit penser a une déficience de euiuv. et en ellei. lorsqu'on examina le sane, ties animaux, <>n constata de.s propoi lions de un \ re 1res faibles ('14 a 20 v'100 ce). Vîais cela parût improbable, k's paturaues suué* -,ur les bords du ileme étant en uéneral tiche-, cti ce metal.
('oititalatuin l'rappantc, cinq >,:ielic"> que- ('on a'.a.s fait puiirc dans ce champ pendant une seule quin/ame, aecioaiviit une lonetn en eniva dn ",ane, de M), l*. >»2 ci H5 7'I(K) ce. L'analvse du sol t'a apparaître la .res foi te proportion de «,UH:Ï de 80 p.p.m., tandis que l'herhe fraîche contenait a i'etai sec IX p.p m., fi s'aejssaii dune d'un eus de déficience de cuivo.' conditionnée da type décrit meaitimcm JVK ( uiiniiiü-hamf ll->:!l>i.
Au del/, i d'octobre, un titiice tfoupeau laitier -.oull'raii d'une («save diairhée et leui rendement en (ail était beaucoup plus iadïle qu'a S • 'rdmaire i a jenem en cuivre dans le sang variait eiiire seulement 14 ci \') v MM* ce, Oueiques vache-, accusaient une depigmentation ties poils aut'iui des mss , et la robe de S'eae d e'les axait oris une couleur tuppelei'l ta pouwiue.
Les deus cas doiinaieiu a penset qu'il laîlau mcnmiiter (a pollution atmosphérique, parce que (es .Uric ténue,', se irosiuticiit .m wismasic .mmediai d'iniv domaine indus-
27.!

tiïel, et il était possible que le molybdène fût l'agent responsable. Ces soupçons se trouvaient confirmés par les cas de molybdénose décrits en literature.
Les analyses de l'herbe fraiche ont démontré la justesse de cette supposition: la teneur en molybdène à l'état sec était respectivement de 29, 38 et 80 p.p.m.
Tous les animaux chez qui on avait diagnostiqué l'hypocuprose ont très bien réagi au traitement au CuSO.1.
L'usine responsable de la pollution a été identifiée.
Zusammenfassung Erkrankungen von Weidevieh durch Immissionen von Molybdän
Ende August 1967 traten in eine Herde von 18-Monate alten Rindern auf einer Weide am Niederrhein Erkrankungen auf. Die Symptome waren : Durchfälle, trockene Haut, Wachstumsverzögerungen, Entfärbung der schwarzen Haare im Bereich der Augen und an anderen Körpergebieten. Das klinische Bild deutete auf Kupfermangel, der sich durch den niedrigen Cu-Gehalt von nur 14-20 y/100 cc Blut bestätigte. Dies erschien zunächst unwahrscheinlich, da die Weiden am Flußufer im allgemeinen reich an Kupfer sind. Auffallend war, daß 5 Kühe, die nur 14 Tage in diesem Gebiet auf der Weide waren, nur 50, 66, 82 und 85 yCu/100 cc Blut aufwiesen. Der Boden enthielt 80 p.p.m. Cu, das frische Gras 18 p.p.m. in der Trockenmasse. Es handelte sich also um einen bedingten Kupfermangel, wie ihn 1949 Cunningham beschrieben hat.
Anfang Oktober litt eine weitere Gruppe Milchvieh an Durchfällen bei starker Herabsetzung des Milchertrages. Die Bluttwerte lagen zwischen 14 und 19 yCu/100 cc. Einige Kühe zeigten eine Depigmentierung im Bereich der Augen, das Fell einer Kuh sah verstaubt aus. Diese beiden Fälle ließen an eine Luftverunreinigung denken, da die beiden Höfe in der unmittelbaren Nähe eines Industriebetriebes lagen und es wäre möglich, daß Molybdän das verantwortliche Agens darstellte. Dieser Verdacht wurde bestätigt durch die aus dem Schrifttum bekanntgewordene Molybdänose Die Richtigkeit der Annahme ergab die Analyse verschiedener Gräsern, die 29, 38, und 80 p.p.m. Molybdän in der Trockenmasse zeigten.
Alle Tieren mit Zeichen eines Kupfermangels haben gut auf die Behandlung mit Cu-Sulfat reagiert. Die für die Verunreinigung verantwortliche Fabrik konnte ermittelt werden.
References
Buxton, J. C. and Ruth Allcroft. 1955. Vei. Rec. 67: 273. Cunningham, J. J. 1949. Rep. intern, vet. Congr. London, Vol. 3: 48. Gardner. A. W. and P. K. Hall-Patch. 1960. Vet. Rec. 74: 113. Hallgren, W., H. Karlsson and G. Wramby. 1954. Nord. Vet Med. 6: 469. Ogura, Yonemura, Homma, Fujita. Shimada and Hamada. 1965. Natn. Inst. Anim. Hlth. Q-. Tokyo
5(2)112. Parker, W. H. and T. H. Rose. 1955. Vet. Rec. 67: 276.
273

Der Einfluß von Fluorexhalaten auf die Tiere in der Umgebung einer Aluminiumfabrik
G. Baläzoväund E. Hluchân
Forschungsinstitut für Hygiene, Bratislava, Tsechoslovakei
Kurzfassung
In der Umgebung eines Aluminiumbetriebes wurde das Vorkommen von Fluor in der Atmosphäre, im Staubniederschlag, sowie in den Organen von Spatzen, Fröschen und Tauben untersucht. Gleichzeitig wurde auch der Fluorgehalt in Milch und Eiern, die in der unmittelbaren Nähe produziert wurden, verfolgt. In der Mehrzahl der Proben wurde eine bedeutende Erhöhung des Fluorgehaltes, allerdings in verschiedenem Grade, festgestellt. Auf Grund der erhaltenen Ergebnisse wurden preventive Vorkehrungen zum Gesundheitschutz der Bevölkerung und für den Umbau des Lebensmilieus getroffen.
Das Vorkommen der Fluorose ist hauptsächlich in den Ländern mit einer hochentwickelten Aluminiumindustrie bekannt, da bis heute die Abscheidung und insbesondere die Unschädlichmachung der Fluorexhalate, die bei der Aluminiumherstellung entstehen, nicht vollkommen gelöst ist.
Durch die Errichtung einer Aluminiumfabrik tauchte auch in der Tschechoslovakei das Problem einer fortschreitenden Verseuchung des umliegenden Gebietes und somit der jieeinflussung des Gesundheitszustandes der dortigen Bevölkerung durch die Fluorexhalate auf. Aus diesem Grunde sind langjährige Beobachtungen sowohl der hygienisch bedeutsamen Faktore det Atmosphäre, als auch des Gehaltes an Fluorverbindungen in den gasförmigen und festen Partikeln der Atmosphäre und im Staubniederschlag angestellt worden. Es ist bekannt, daß sich das Fluor in bestimmten Geweben anhäuft. Deswegen haben wir oen Einfluß der besagten Faktore auf das Vorkommen des Fluors in den Organen von Fröschen, Spatzen und Tauben verfolgt. Außerdem wurden Milch und Eier aus der Umgebung der Aluminiumfabrik auf den Fluorgehalt untersacht. Schließlich wurden Experimente an Versuchstieren welche Fluorwasserstoff einatmen, durchgeführt.
Die Ergebnisse zeigen, daß in der Umgebung der Aluminiumfabrik Windstille überwiegt (30,5% der Zeit), wodurch sich die Konzentration der Exhalate in der Atmosphäre stark erhöht. Die durchschnittlichen Gesamtwerte der Fluorveibindungen in der Atmosphäre im Verlauf von 8 Jahren (1958-1965) schwankten zwischen 0,02 und 0,14 mg F/m3 (Abb. 1). Das Fluor im Staubniederschlag des kontaminierten Gebietes erreichte einen Höchstwert von 7340 kg F/km2 im Jahr, während der Höchstwert lrn Kontrollgebiete nur 140 kg F/km2 im Jahr betrug (Abb. 2). Die Werte aus dem Kontrollgebiete bewegen sich innerhalb der Grenzen von 30 und 137 kf F/km2 im
275

x N ^ ^ ^
• 2B
Abb. 1. Durchschnittlicher Gehalt an Fluorverbindungen (in ng F m3) in der Atmosphäre in der Umgebung der Aluminiumfabrik.
Jahr bei einem Durchschnitt von 82 kg F/km-. Dieser durchschnittliche Wert darf als normal angenommen werden.
Die Luftproben aus der Umgebung der Fabrik zeichnen sich durch einen hohen Gehalt an Fluorverbindungen im Staubniederschlag aus; sie sind das 44-fache des durchschnittlichen Wertes von 82 kg F/km2; die Höchstwerte erreichen sogar das 90-fache.
Das erste Zeichen einer schädlichen Wirkung der Fluorverbindungen war die Fluorose des Viehbestandes. Die erhöhte Fluoreinnahme hatte ihren Ursprung hauptsächlich im Staubniederschlag auf dem Gras und im Fluorgehalt des Futters (Gras und andere Pflanzen mit bis 133 mg F auf 100 g Trockengewicht). Bei der Untersuchung der inneren Organe und Knochen von Rindern aus dem von Fluorverbindungen verseuchten Gebiet ergab sich, daß die Zähne das 3- bis 7-fache der normalen Fluormenge enthielten, die Rippen das 3- bis 5-fache, während die Muskeln und parenchymatösen Organe (Lunge, Leber, Milz und Nieren) nur eine geringfügig erhöhte Menge von Fluor aufwiesen. In der Milch wurde durchschnittlich 0,6 mg F/kg, gefunden gegen-
276

• 142
•99
„ \ \ •214 > \
\ v • 146
• 196
\ v \ \ \ ^ \ . > 6 o : X X \ \»461
• 167
190
kgF/km2/Jahi
| | 0 - 2 5 0
250-500
• 170
• 219
263»
•175
Abb. 2. Durchschnittliche Gesamtwerte (kg F/km2) von Fluorverbindungen im Staubniederschlag in der Umgebung der Aluminiumfabrik.
über nur 0,3 mg F/kg im Kontrollort. Die Eier hatten 1,2 mg F/kg (im Kontrollort nur l,0mgF/kg).
Der Einfluß der Fluorexhalate zeigte sich auch im Gehalt an Fluoriden in den Knochen von Fröschen aus der Umgebung der Fabrik. Da betrugen sie 85,2 bis 788 mg F auf 100 g Aschengewicht, wobei der niedrigste Wert in der Umgebung der Siedlung nördlich vom Betrieb und der höchste Wert in der südlichen Gegend nahe dem Betrieb gefunden wurde. Dagegen schwankte im Kontrollgebiet der Gehalt zwischen 39 und 107 mg F. Der Gehalt an Fluorverbindungen kann das Zehnfache erreichen im Vergleich mit dem Kontrollgebiet. In Pfützen, in der Nähe des Betriebes in südlicher Richtung, wurde sogar 11 mg F/pro Liter festgestellt ; auch die Oberschichten der Erde enthielten hier erhöhte Fluor-Konzentrationen: bis auf 91 mg F auf 100 g Erde.
In den Knochen von Spatzen aus dem exponierten Gebiet wurde 101 bis 353 mg F in 100 g Asche festgestellt, während das Kontrollgebiet Werte zwischen 8 und 56 mg aufwies. Der Durchschnittgehalt an Fluor war in der exponierten Gruppe 230,5 mg, in der Kontrollgruppe 26,8 mg F/100 g Asche. Der fast zehnfache Wert aus dem ver-
277

seuchten Gebiet läßt sich erklären, durch die relativ seßhafte Lebensweise der Spatzen während sie sich das ganze Jahr in einer maximal verschmutzten Atmosphäre aufhalten.
In den Knochen von Tauben aus dem untersuchten Gebiet wurde keine Erhöhung des Fluorgehaltes festgestellt, vermutlich weil die Tiere ausschließlich Korn fressen, das auch im exponierten Gebiet immer die zulässige Menge von 0,6 bis 0,8 mg % Fluor enthält.
Analoge Ergebnisse wurden bei Ratten gefunden, welche in einer Versuchskammer während 90 bis 270 Stunden Luft mit einem Gehalt von 9 bis 12 ptg F pro Liter inhalierten. Die Knochen dieser Tiere enthielten 33 bis 504 mg F/100 g Trockensubstanz, in der Kontrollgruppe nur 17 bis 239 mg F/100 g. Ähnlich wurde in den Zähnen der exponierten Tiere 53 bis 314 mg F/100 g und in der Kontrollgruppe 15 bis 191 mg F/100 g Trockensubstanz gefunden. Im Harn dieser Tiere konnte eine 7- bis 50-fach höhere Fluormenge gegenüber der Kontrollgruppe festgestellt werden.
Mit diesem Experiment wurde bestätigt, daß bei der Inhalation von Fluorverbindungen dieselben Veränderungen im Organismus wis nach der peroralen Einnahme auftreten. Das in der Lunge absorbierte Fluor wurde sehr schnell im Harn ausgeschieden, wobei die Ausscheidung von Fluoriden eine steigende Tendenz abhängig von der Expositionslänge zeigte. Nach der Bilanz wurde ein Drittel der gesammten eingeatmeten Fluormenge im Harn ausgeschieden.
Auf Grund aller vorhergehenden Feststellungen war es möglich, preventive Maßnahmen für den Gesundheitschutz der Bevölkerung und den Umbau des Lebensmilieus zu treffen.
Summary The effect of fluorine exhalâtes on animals in the surroundings of an aluminium plant
During 8 years the atmospheric conditions, the fluorine contents of the air and the quantities of fall-out dust were measured in the surroundings of an aluminium plant. The effect of these factors on the fluorine content of the bones of animals, in milk and in eggs was studied by comparing the data with those from non contaminated areas in the neighbourhood.
The results showed that calm wheather in the surroundings of the plant (prevailing during 30,5 % of the year) resulted in a high concentration of exhalâtes in the atmosphere. The fluorine content varied between 0.02 and 0.14 mg F per m3; in dust the highest concentration was 7.34 tons F per km2 per year.
The fluorine content of the bones of sparrows, frogs and rats was 2 to 14 times as high in the experimental area as compared with the other areas. In the milk the amount was twice as high. On the other hand in the bones of pidgeons and in the eggs of hens no significant differences between the exposed and the control areas were found.
278

Résumé L'effet d'exhalations de fluor sur les animaux aux alentours d'une usine d'aluminium
Pendant 8 ans, les conditions atmosphériques, la teneur en fluor de l'air et les quantités de retombées ont été mesurées aux alentours d'une usine d'aluminium. L'effet de ces facteurs sur la teneur en fluor des os d'animaux, du lait et des oeufs, a été étudié en comparant les résultats avec ceux des régions adjacentes non contaminées.
Les résultats ont montré qu'un temps calme aux alentours de l'usine (dominant pendant 30,5% de l'année) causait une concentration élevée d'exhalations dans l'atmosphère. La teneur en fluor variait entre 0,02 et 0,14 mg F/m3; la concentration la plus élevée dans les retombées était de 7,34 tonnes de F/km2/an.
La teneur en fluor des os de moineaux, de grenouilles et de rats était 2 à 14 fois plus élevée dans la région exposée comparée avec les autres régions. La teneur du lait était deux fois plus élevée. Par contre, en ce qui concerne la teneur des os de pigeons et des oeufs de poule, on n'a pas constaté de différences significantes entre les régions exposées et les régions témoins.
279

Discussion in Section 6: The effects of air pollution on animals
Reporter: J. Tesink
Participants: Ender (Chairman), Berge, Bouley, Hartmans, Hettche, Kloke, Lebbe, Lloyd, Lundholm, Scholl, Stamatovic
Influence of lead
Investigations carried out in the Netherlands on lead contamination in the direct neighbourhood of highways resulted in the following data :
Soil: grass berm in centre of road grass berm on side of road
Plants: Petunia Tobacco grass in centre of road grass from berm at side of road
Ditch water:
130 p.p.m. 400 p.p.m. 60 p.p.m. 50 p.p.m.
500-600 p.p.m. 135-150 p.p.m. normal
Lead content of milk from cows grazing directly alongside the highway had not noticeably increased.
The participants of the discussion considered it necessary that a thorough investigation be undertaken to ascertain whether it is dangerous to man and animals to drink milkjrom cows grazing near highways.
The lowest quantity of lead causing illness is not exactly known, but 10 mg per kg dry matter is generally accepted for animals. It was mentioned that the lead, taken up with the food, is partly converted into PbS and excreted with the faeces. The uptake of lead by the blood from the intestines is promoted by a shift in the Ca/P ratio in favour of the phosphorus.
As it is difficult to remove lead from the surface of fodder it was suggested to ensile the lead contaminated food with e.g. non-contaminated beet foliage, adding an acid for conservation. It was supposed that the lead would be bound by the acid and discharged together with the waste liquids.
Organic lead compounds are much more poisonous for animals than inorganic lead compounds; so are easily soluable lead compounds. Lead taken up by breathing is easier absorbed by the blood than that taken up from the food (perhaps 10 times easier). It was pointed out furthermore, that part of the lead taken up with the air remains on the mucuous membrane in the nose and the bronchial tract, especially the Particles over 0.005 mm in diameter, later on entering the stomach.
The most important lead compound in the exhaust from cars is PbSO,»; PbO and pbCl2 also occur; about 10% is present in organic compounds. It was found that
281

during dry weather a close correlation exists between the CO and the Pb contents of the air in the parts of the big cities with much traffic. It was also proved that during the night the Pb content of the air is much lower than during daytime (2y and 24y per m3, respectively).
In general plant growth is not interferred with when the lead content of the soil remains below 500 p.p.m.
Mr. Lebbe supplied some data on the Pb content of air samples from Paris and along the main road trom Paris to the south (Barbizon):
Morning Afternoon Morning + afternoon Daytime Night
Lead in ng/m3
Paris 5,3 4.8 5,0 - 3.5 main road to the south - - - 1,6 1,5
The figures show that in Paris the Pb content is slightly higher in the morning than in the afternoon, whereas during the night it is considerably lower. The diffeience between Paris and the open country is obvious, though négligeable when compared with that for pyrene (see below).
The lead content of the roots ot plants growing in soil containing lead is very much higher than that of stem and leaves.
Polycyclic aromatic carbon hydrogen compounds
These compounds (e.g. benzpyrene) have a carcinogenic effect in animals. It was pointed out that the benzpyrene does not exclusively originates from the exhaust of cars but also from industrial gases and from house heating. Lettuce grown in industrial areas has a significantly higher benzpyrene content than that grown in the country.
Mr. Lebbe was again able to supply some additional data referring to benzo-3,4 pyrene in the air in Paris and along the main road to the south:
Morning Afternoon Morning + afternoon Daytime Night
Benzo-3,4 pyrene in ng/m3
Paris 0.70 0.46 0.58 - 0.30 main road to the south - - - 0.004 0.006
Obviously the air pollution in Paris is strongest in the morning and decreases in the afternoon and at night. Along the main route outside Paris it is only a fraction of that in Paris (compare the data for lead cited above).
It was asked if the exhaust from cars also contains nitrogeneous amines. Determining these substances is very difficult, however, as they occur only in small quantities. Nevertheless Professor Drückrey in Freiburg (Germany) has carried out investigations
282

to ascertain their presence in the atmosphere in connection with their possible carcinogenic action.
Carbon monoxide
In investigations with rats and mice which had to breathe air with 50 p.p.m. CO during some weeks, it was observed with the help of electrocardiograms that the unfavourable influence on the heart muscle, which occurred in the beginning, was ultimately overcome. Or in other words: the body adapted itself.
Fluorine
Treating fluorine containing food with acids strongly decreases the percentage. But this treatment also causes a decrease of the calcium, the phosphorus and the protein content. In such cases extra calcium, phosphorous and protein have to be added to the rations.
It was pointed out that continuous fluorine contamination of pastures will lead to the disappearance of the better grasses, ultimately resulting in a lower milk production.
On the question if the fluorine content of milk from cows suffering fiom fluorosis will increase to a percentage that may be dangerous for the consumer, the answer was in the negative. The same applies to meat.
283

Section 7 : Measuring air pollution in vascular plants

Die Messung der Luftverunreinigungen und die Aufstellung von Kriterien für die Beurteilung der Luftqualität
H. Stratmann
Landesanstalt für Immissions- und Bodennutzungsschutz des Landes Nordrhein-Westfalen, Essen-Bredeney, Deutsche Bundesrepublik
Kurzfassung
Für die Aufstellung von Kriterien zur Kennzeichnung der Luftqualität wird eine den Immissionswirkungen adäquate Beschreibungsform des Luftverunreinigungszustandes benötigt. Anhand eines Modelies wird dargelegt, wie mit Hilfe der Probitanalyse zwischen geeigneten Immissionskriterien und entsprechenden Wirkungskriterien eine Beziehung aufgestellt werden kann, welche das durchschnittliche Verhalten verschiedener Objektgruppen wiedergibt, eine Abschätzung des Schadensrisikos ermöglicht und als Basis für die Festsetzung von [mmissionsgrenzwerten dienen sollte. Die Einhaltung solcher Grenzwerte muß aber kontrollierbar sein. Daher sind sowohl meßtechnische als auch statistische Gesichtspunkte bei der Aufstellung von Immissionsgrenzwerten zu berücksichtigen.
In den Ländern, die sich intensiv mit der Luftreinhaltung beschäftigen, hat sich wohl überwiegend die Auffassung durchgesetzt, daß für eine sinnvolle und wirksame Luft-i'einhaltepolitik die Aufstellung von Kriterien für die Luftqualität eine unerläßliche Voraussetzung ist. Um aber Luftqualitäts-Kriterien aufstellen zu können, ist zuvor eine den Auswirkungen der Luftverunreinigungen auf Mensch, Tier, Pflanze und Sachgut adäquate Beschreibungsform des Luftverunreinigungszustandes zu finden, hieraus entsteht eine der wichtigsten Aufgaben für die Technik der Messung von Luftverunreinigungen.
Aufgabenstellung und Begriffserläuterungen
Zur Präzisierung der Aufgabenstellung sollen vorab einige Begriffe erläutert werden. Luftverunreinigungen werden von ihren Quellen durch die Atmosphäre in den Lebensraum der zu schützenden Lebewesen transportiert. Die sich hieraus ergebenden Einwirkungsmöglichkeiten auf die Lebewesen und ihre Umwelt bezeichnet man in Deutschland mit dem aus der römischen Rechtsprechung entlehnten Begriff 'Immission'. In welchem Maße es aber zu Immissionswirkungen kommt, hängt von der Höhe der Immission und von der Reaktion der Objekte ab. Alle in der Atmosphäre auftretenden Einflüsse auf die Luftbewegung wirken sich auf die Immission und ihre Höhe aus. Dies ist ein wichtiger Gesichtspunkt für die Messung von Luftverunreinigungen.
Für die Kennzeichnung der Immissionen, die bestimmte Wirkungen hervorrufen, wird der Begriff 'Luftqualität' herangezogen. Luftqualitätskriterien haben daher be-
287
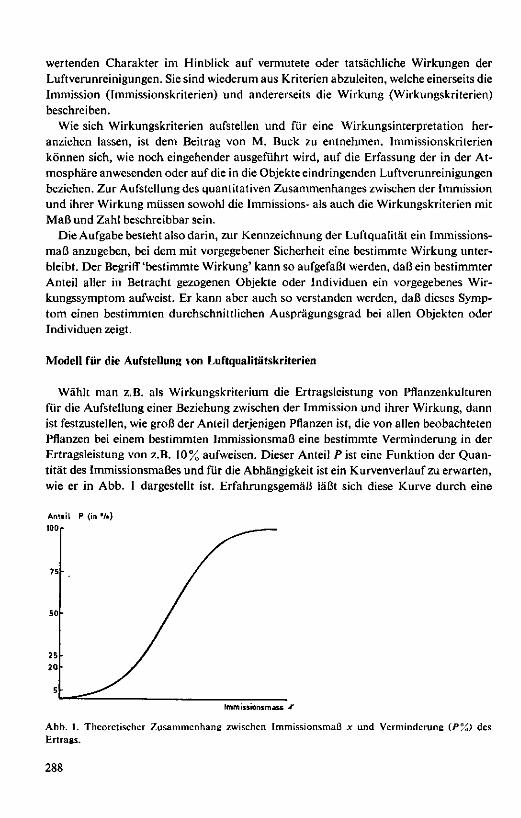
wertenden Charakter im Hinblick auf vermutete oder tatsächliche Wirkungen der Luftverunreinigungen. Sie sind wiederum aus Kriterien abzuleiten, welche einerseits die Immission (Immissionskriterien) und andererseits die Wirkung (Wirkungskriterien) beschreiben.
Wie sich Wirkungskriterien aufstellen und für eine Wirkungsinterpretation heranziehen lassen, ist dem Beitrag von M. Buck zu entnehmen. Immissionskriterien können sich, wie noch eingehender ausgeführt wird, auf die Erfassung der in der Atmosphäre anwesenden oder auf die in die Objekte eindringenden Luftverunreinigungen beziehen. Zur Aufstellung des quantitativen Zusammenhanges zwischen der Immission und ihrer Wirkung müssen sowohl die Immissions- als auch die Wirkungskriterien mit Maß und Zahl beschreibbar sein.
Die Aufgabe besteht also darin, zur Kennzeichnung der Luftqualität ein Immissionsmaß anzugeben, bei dem mit vorgegebener Sicherheit eine bestimmte Wirkung unterbleibt. Der Begriff 'bestimmte Wirkung' kann so aufgefaßt werden, daß ein bestimmter Anteil aller in Betracht gezogenen Objekte oder Individuen ein vorgegebenes Wirkungssymptom aufweist. Er kann aber auch so verstanden werden, daß dieses Symptom einen bestimmten durchschnittlichen Ausprägungsgrad bei allen Objekten oder Individuen zeigt.
Modell für die Aufstellung \on Luftqualitätskriterien
Wählt man z.B. als Wirkungskriterium die Ertragsleistung von Pflanzenkulturen für die Aufstellung einer Beziehung zwischen der Immission und ihrer Wirkung, dann ist festzustellen, wie groß der Anteil derjenigen Pflanzen ist, die von allen beobachteten Pflanzen bei einem bestimmten Immissionsmaß eine bestimmte Verminderung in der Ertragsleistung von z.B. 10% aufweisen. Dieser Anteil P ist eine Funktion der Quantität des Immissionsmaßes und für die Abhängigkeit ist ein Kurvenverlauf zu erwarten, wie er in Abb. 1 dargestellt ist. Erfahrungsgemäß läßt sich diese Kurve durch eine
Anteil P (in •/.)
100r
Immissionsmass Jf
Abb. 1. Theoretischer Zusammenhang zwischen Immissionsmaß x und Verminderung (P%) des Ertrags.
288

geeignete Transformation in die Verteilungsfunktion der Normalverteilung überführen, also in
x (x- n)2
P = 1 ƒ,
ff V2 K _,
2 ff2
e clx, CSD
wobei x hier bereits für eine geeignete Transformation des Immissionsmaßes steht. Diese mit Hilfe der Probitanalyse aufgestellte Beziehung zwischen der Immission
und einer bestimmten Immissionswirkung stellt ein 'Schätzproblem' dar, bei dem mit statistischen Mitteln Wahrscheinlichkeitsaussagen gemacht werden können. Dies dürfte ein erfolgversprechender Ansatz für ein Grundmodell zur Ableitung von Qualitäts-Kriterien für die Begrenzung von Luftverunreinigungen sein.
Die Kurve in Abbildung 1 ist davon abhängig, welchen Ausprägungsgrad eines Wirkungssymptoms, welches Wirkungskriterium und welche Pflanzen bzw. andere Objekte man heranzieht. Für alle diese Fälle können eigene Kurven aufgestellt werden, wodurch eine Kurvenschar entsteht, die aber, und das ist sehr wichtig, alle Untersuchungsergebnisse in einer übersichtlichen Form wiedergibt. Alle Ergebnisse können miteinander verglichen und in ihrer Bedeutung abgewogen werden (s. Abbildung 2). Bei einem bestimmten Wert x' für das Immissionsmaß reagiert die Pflanze A mit einem Anteil P\ und eine andere Pflanze B mit einem Anteil P'B. Liegen die Kurven für alle anderen Pflanzen oder für ausgewählte Gruppen zwischen den beiden Grenzkurven (für die Pflanzen A und B), so gibt die normierte Summe aller Kurven direkt die durchschnittliche Reaktion aller Pflanzen auf die Einwirkung einer Immission mit dem Wert x' an. Zum gleichen Ergebnis gelangt man, wenn der Anteil der reagierenden Individuen z.B. in Begasungsexperimenten direkt ohne Rücksicht auf Zugehörigkeit zu bestimmten Pflanzenarten ausgezählt wird. Auf diese Art und Weise läßt sich eine ganze Pflanzengemeinschaft erfassen und das durchschnittliche Reaktionsverhalten
Anteil P ( in' / . )
100
Immissionsmass
Abb. 2. Theoretische Zusammenhänge zwischen Immissionsmaß x und Ausprägungsgrad eines wirkungssymptoms bei den Pflanzenarten A und B.
289

Luftqualitäts-Kriterien für die Einwirkung von Schwefeldioxid auf eine bestimmte Pflanze.
Schadensrisiko Sicherheitsmaß Immissionsmaß PCÄ) für das Ausbleiben
des Schadens 100-/>(%)
arithmetischer Mittelwert 95 %-Summenhäufigkeitswert (mg SO. m1) (mg SOj.'m')
0,1 1.0 5,0
99,9 99.0 95.0
0,05 0,07 0,20
0,15 0,20 0.70
Wirkungskriterium für den Schaden: Wuchsleistung. Ausprägungsgrad des Schadens (Wuchsdepression): etwa 10%. Für die Ableitung der Immissionsmaße ist ein Meßwerte-Kollektiv herangezogen worden, das aus 30-Minuten-Werten kontinuierlich gemessener SCX-Konzentrationen besteht.
aller Individuen dieser Gemeinschaft darstellen. Auch verschiedene Wirkungskriterien können in dieser Form zusammengefaßt werden.
Man kann also davon ausgehen, daß man sich bei der Abschätzung des Schadensrisikos auf eine Kurve gemäß der Darstellung in Abbildung 1 stützen darf, die entweder aus der in Abbildung 2 angedeuteten Kurvenschar ausgewählt wurde oder die das durchschnittliche Verhalten aller Individuen einer ganzen Pflanzengemeinschaft wiedergibt. Diese Kurve stellt dann letztlich das dar, was wir unter einem Maßstab für die Luftqualität verstehen. Zur Zeit sind nur einzelne Wertepaare von P und x bekannt ; sie werden als Luftqualitäts-Kriterien bezeichnet.
In der beigefügten Tabelle sind einige Luftqualitäts-Kriterien für die Einwirkung von Schwefeldioxid auf eine bestimmte Pflanzengemeinschaft zusammengestellt, wobei die eingetragenen Zahlenwerte als erläuternde Beispiele aufzufassen sind. Es wird daraus ersichtlich, daß Luftqualitäts-Kriterien ohne gleichzeitige Angabe des Risikooder Sicherheitsmaßes kaum etwas aussagen.
Immissionskriterien und Immissionsmaße
Bei der Erläuterung des Grundmodelles für die Aufstellung von Luftqualitäts-Kriterien wurde zunächst unterstellt, daß für die Beschreibung des Zusammenhanges zwischen Immission und Wirkung bereits ein geeignetes Immissionsmaß gefunden sei. Ob dies tatsächlich der Fall ist, läßt sich mit objektiven Verfahren prüfen. Im Rahmen des erläuterten Grundmodelles bieten sich dafür je nach Fragestellung zwei verschiedene Verfahren zur Auswahl an, und zwar sollen bei Darstellung zusammengehörender Wertepaare von P und dem ausgewählten Immissionsmaß x im Wahrscheinlichkeitsnetz (siehe Abb. 3) (1) die Summen der quadratischen Differenzen zwischen beobachteten und den sich aus der Probitanalyse ergebenden Schätzwerten möglichst gering sein, oder (2) die sich aus der Probitanalyse ergebenden Regressionsgeraden möglichst parallel sein f Abb. 4).
290
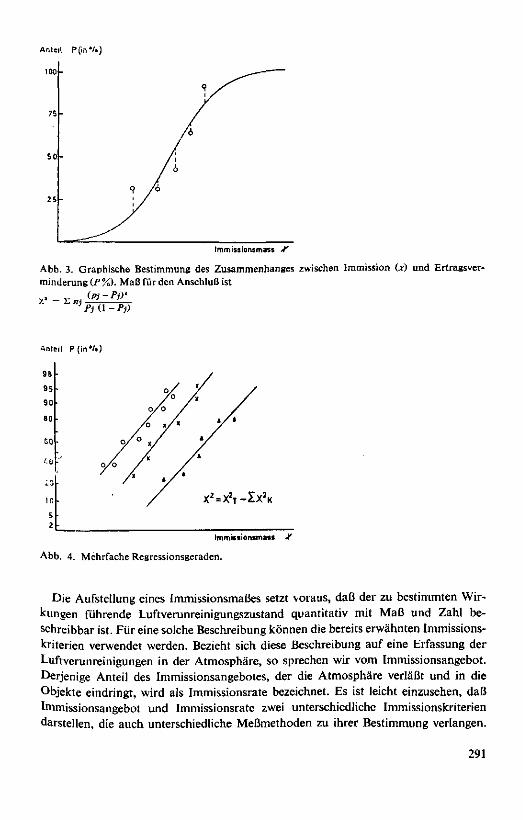
Anteil P(inV.)
100 -
75
Immissfonsmass V
Abb. 3. Graphische Bestimmung des Zusammenhanges zwischen Immission (x) und Ertragsverminderung (P%). Maß für den Anschluß ist
P)(\-Pj)
Anteil P(in*/o)
-lK\
Imm'mionimati Jf
Abb. 4. Mehrfache Regressionsgeraden.
Die Aufstellung eines Immissionsmaßes setzt voraus, daß der zu bestimmten Wirkungen führende Luftverunreinigungszustand quantitativ mit Maß und Zahl beschreibbar ist. Für eine solche Beschreibung können die bereits erwähnten Immissionskriterien verwendet werden. Bezieht sich diese Beschreibung auf eine Erfassung der Luftverunreinigungen in der Atmosphäre, so sprechen wir vom Immissionsangebot. Derjenige Anteil des Immissionsangebotes, der die Atmosphäre verläßt und in die Objekte eindringt, wird als Immissionsrate bezeichnet. Es ist leicht einzusehen, daß Immissionsangebot und Immissionsrate zwei unterschiedliche Immissionskriterien darstellen, die auch unterschiedliche Meßmethoden zu ihrer Bestimmung verlangen.
291

So wird beispielsweise mit der Konzentrationsmessung einer Luftverunreinigung in der Atmosphäre das Immissionsangebot bestimmt, während sich die Bestimmung des Staubniederschlages oder des Fluorgehaltes in Pflanzen auf die Erfassung der Immissionsrate bezieht. In diesem Zusammenhang sei ausdrücklich darauf hingewiesen, daß die in der Rauchschadensdiagnostik häufig herangezogene Schadstoffanalyse in der Pflanze kein Wirkungskriterium sondern ein Immissionskriterium liefert.
Aus den angeführten Beispielen ist ersichtlich, daß man bei der Immissionsrate noch zwischen der allgemeinen (nicht auf bestimmte Objekte bezogenen) und der speziellen (auf bestimmte Objekte bezogenen) unterscheiden muß. Während die von einer bestimmten Pflanze aus der Luft aufgenommene Fluormenge eine spezielle Immissionsrate darstellt, muß der durch die Auffangfläche eines Meßgerätes ermittelte Staubniederschlag als allgemeine Immissionsrate angesehen werden. Die allgemeine Immissionsrate ist nur abhängig vom Immissionsangebot und dem durch das Meßverfahren vorgegebenen Normierungsmaß; sie ist unabhängig vom Vorhandensein bestimmter Objekte und ihrer Verteilung. Auch bei der speziellen Immissionsrate kann eine gewisse Normierung eingeführt werden, indem man beispielsweise die Reaktionen biologischer Indikatoren oder bestimmter Materialien wie ein Meßverfahren einsetzt, welches dann stellvertretend für eine ganze Objektgruppe die Immissionsrate ermittelt. In diesem Zusammenhang soll auch die Messung der Flechtenreaktion, die Elastizitätsminderung von Latex oder die Bestimmung der Resorption von Aerosolen durch den Menschen mit Hilfe eines den Atemvorgang nachahmenden Mechanis-musses nicht unerwähnt bleiben.
Die Immissionsrate hat in zweifacher Hinsicht eine besondere Bedeutung. Erstens besteht zwischen der Immissionsrate und den Wirkungskritcrien im allgemeinen eine strengere Korrelation als zwischen dem Immissionsangebot und den Wirkungskriterien. Zweitens können durch die Bestimmung der Immissionsrate gleichzeitig mehrere Verunreinigungskomponenten der Luft erfaßt werden. Hierdurch wird ein Weg für die Beurteilung kombinierter oder synergistischer Wirkungen aller in einem bestimmten Gebiet auftretenden Luftverunreinigungen eröffnet. Diese Möglichkeit ist bisher noch weitgehend verschlossen geblieben. Es ist wohl kaum zu bezweifeln, daß von Ausnahmefällen abgesehen, die bei Mensch, Tier, Pflanze oder Sachgütern beobachteten Auswirkungen der Luftverunreinigungen auf den kombinierten Einfluß mehrerer Verunreinigungskomponenten zurückzuführen sind. Es ist deshalb anzustreben, Immissionskriterien so auszuwählen, daß auch das Schadensrisiko kombinierter Wirkungen abschätzbar wird.
Zieht man als Immissionskriterium das Immissionsangebot heran, so muß man sich darüber im Klaren sein, daß die Erfassung dieses Phänomens Schwierigkeiten bereitet, die bisher kaum gewürdigt wurden.
Unter dem Immissionsangebot kann man die Menge einer luftverunreinigenden Substanz verstehen, die pro Zeitenheit durch eine Flächeneinheit transportiert wird, ausgedrückt z.B. in mg pro m2 und Stunde. Bisher war as üblich, zur Kennzeichnung der Immissionen z.B. die Masse einer luftverunreinigenden Substanz pro m3 Luftvolumen heranzuziehen. Solche Immissionskonzentrationen sind zwar mit anderen Größen ein brauchbares, aber im allgemeinen allein kein hinreichendes Maß für die
292

Kennzeichnung des Immissionsangebotes. Multipliziert man aber die Immissionskonzentration (mg/m3) mit der Transportgeschwindigkeit der luftverunreinigenden Substanzen z.B. unter Heranziehung der Windgeschwindigkeit (m/sec), so erhält man mit mg/m3 m/sec = mg irr2 sec x das oben angegebene Maß des Immissionsangebotes.
In letzter Zeit ist insbesondere von amerikanischer Seite auch schon einige Male der Vorschlag gemacht worden, das Immissionsangebot durch einen Dosiswert zu kennzeichnen, der sich aus Multiplikation der Immissionskonzentration mit der Zeitdauer des Auftretens dieser Konzentration ergibt, z.B. in mg m~3. min. Beide Kennzeichnungen des Immissionsangebotes sind sinnvoll; sie können getrennt, aber auch kombiniert angewandt werden.
Sicherlich ist mit diesen Vorstellungen noch keine perfekte Lösung für die Raum-Zeit-Funktionen zur Beschreibung des Phänomens Luftverunreinigung gegeben. Die größte Schwierigkeit bereitet zur Zeit noch die Überführung der gemessenen Immissionskonzentration in den physikalisch exakt definierten Begriff der Raumdichte. Alle Überlegungen und Experimente haben nämlich gezeigt, daß die bisher gemessenen Konzentrationen einer Luftverunreinigung keine räumliche Fixierung der gefundenen Masse erlauben und die ermittelten Meßwerte somit physikalisch nicht ausreichend definiert sind. Die Konzentrationen könnten dann als Raumdichte definiert werden, wenn das Probevolumen angenähert spontan der Atmosphäre entnommen wird, worauf leider bei der bisherigen Entwicklung unserer Meßgeräte nicht geachtet wurde. Damit verbunden ist auch die Schwierigkeit, das Auftreten von Luftverunreinigungen als räumlich-zeitliche Ereignisse zu definieren, etwa wie das Auftreten von Schädlingen m einem Pflanzenbestand. Erst wenn dies gelungen ist, können wir über eine mathematische Feldbeschreibung die Flußdichte der Luftverunreinigungen erfassen und die grundlegenden Raum-Zeit-Funktionen des Phänomens Luftverunreinigung aufstellen. Dies ist auch für die Entwicklung eines wirklich geeigneten physikalischen Modells zur Berechnung der Ausbreitung und Verteilung von Luftverunreinigungen in der Atmosphäre eine unerläßliche Voraussetzung.
Für die weiteren Überlegungen soll hier unterstellt werden, daß es gelingt, die Immissionskonzentration als Maß der Raumdichte einer Luftverunreinigung heranzuziehen.
In bestimmten Fällen kann in Abweichung von den vorgenannten Forderungen die Immissionskonzentration als hinreichendes Maß zur Kennzeichnung des Immissionsangebotes angesehen werden, so z.B. wenn die durch die Atmung bedingte Immissionsrate beim Menschen zu bestimmen ist. Wählt man für die Atmung als Maß Liter pro Sekunde und multipliziert diese Größe mit dem Maß der Immissionskonzentration, so erhält man ausgedrückt in Masse pro Zeiteinheit das Angebot, welches sich direkt auf das Einzelobjekt bezieht. In entsprechender Weise könnte man bei einzelnen Pflanzen vorgehen, wenn der Gaswechsel pro Zeiteinheit bekannt wäre.
293

Bedeutung und Aufstellung von Immissionsgrenzwerten
Geeignete Immissionskriterien sind sowohl für die Ableitung von Luftqualitäts-Kriterien als auch für die Festsetzung von Standards bzw. Immissionsgrenswerten eine wichtige Voraussetzung. Luftqualitäts-Kriterien und Immissionsgrenzwerte dürfen aber nicht miteinander verwechselt werden. Qualitäts-Kriterien geben die Zusammenhänge zwischen Wirkungs- und Immissions-Kriterien wieder. Die Möglichkeiten, daraus einen Qualitäts-Richtwert als Maßstab für die Aufstellung eines Immissionsgrenzwertes zu entnehmen, sind unendlich groß. Schon aus diesem Grunde sind bei der Abwägung eines tragbaren Schadensrisikos in den einzelnen Ländern unterschiedliche Konventionen unvermeidlich. Bei der Festsetzung eines Immissionsgrenzwertes ist aber außerdem noch darauf zu achten, daß (1) seine Anwendung aufgrund gegebener technischer und wirtschaftlicher Möglichkeiten gesetzlich durchsetzbar, (2) seine Einhaltung mit meßtechnischen Mitteln kontrollierbar und (3) seine Überschreitung auf die Quelle der Immission rückführbar ist.
Diese Bedingungen haben in fast allen Ländern dazu geführt, daß Immissionsgrenzwerte oder Standards völlig anders definiert worden sind als Qualitäts-Kriterien. In den meisten Fällen ist somit aus der Einhaltung eines Immissionsgrenzwertes das verbleibende Schadenrisiko nicht mehr abschätzbar. Bestrebungen, die Definitionen für Immissionsgrenzwerte und Qualitäts-Kriterien einander auszugleichen oder zumindest Beziehungen zwischen diesen Werten aufzustellen, sollten deshalb unbedingt unterstützt werden.
Immissionsgrenzwerte bzw. Standards können sich sowohl auf das Immissionsangebot als auch auf die Immissionsrate beziehen. Bisher hat man aber nur in zwei Fällen davon Gebrauch gemacht, die Immissionsrate für eine Grenzwertfestsetzung heranzuziehen. Einmal ist dies beim Staubniederschlag und zum anderen für die Fluoraufnahme durch Futterpflanzen geschehen. In allen anderen Fällen beziehen sich die Immissionsgrenzwerte bzw. Standards auf das Immissionsangebot.
Damit soll keineswegs die Bedeutung der auf das Immissionsangebot abgestimmten Immissionsgrenzwerte herabgesetzt werden. Man sollte sich aber klare Vorstellungen darüber verschaffen, was sie bedeuten und wo die Grenzen ihrer Aussagemöglichkeiten liegen. Es ist auch durchaus sinnvoll, Grenzwerte nur Vermeidung bestimmter Immissionswirkungen für das Immissionsangebot festzulegen, jedoch ist darauf zu achten, die Definitionen solcher Grenzwerte auf eine den Immissionswirkungen adäquate Beschreibungsform des Luftverunreinigungszustandes abzustimmen. In einer unzureichenden Definition vieler Grenzwerte ist auch die Ursache mancher Mißverständnisse zu suchen. Dies wird besonders deutlich, wenn man den Versuch unternimmt, die in den einzelnen Ländern aufgestellten Immissionsgrenzwerte, Standards oder MIK-Werte miteinander zu vergleichen. Dabei sind Fehlinterpretationen unvermeidlich, denn jedes Gremium, das Grenzwerte festsetzt, beschreitet seine eigenen Wege, und nachträglich ist kaum noch festzustellen, was beabsichtigt war und was eigentlich begrenzt werden sollte. Übrig bleibt häufig ein Zahlenwert, meist in Konzentrationsmaßen angegeben, dem man nicht mehr ansehen kann, wie er in der Praxis zu handhaben ist.
294

Anwendung der Meßtechnik zur Inimissionskontrolle
Die das Immissionsangebot bestimmden Maßzahlen weisen an einem Ort in der zeitlichen Folge immer mehr oder weniger große Schwankungen auf. Es sollen hier aber nur die Konzentrationsschwankungen betrachtet werden, weil dies die am hänfigsten gemessene Größe ist. Unterschiede treten nicht nur von Tag zu Tag und von Stunde zu Stunde, sondern sogar von Minute zu Minute auf. Im allgemeinen beträgt das Verhältnis zwischen den höchsten und den niedrigsten Werten an einem Ort 100:1. So schwanken z.B. die SOs-Konzentrationen etwa zwischen 0,02 und 2,0 mg/m3 Luft. Der erfaßte Schwankungsbereich hängt naturgemäß vom Auflösungsvermögen der benutzten Meßverfahren ab. Je größer dieses Auflösungsvermögen ist, um so größer ist auch das gefundene Verhältnis zwischen den höchsten und den niedrigsten Werten. Bei extrem hoher Auflösung, z.B. für Zeitintervalle von 1 sec, kann das Verhältnis sogar auf 1000:1 ansteigen.
Um vergleichbare Meßwerte für die Bestimmung der in der zeitlichen Folge wechselnden Konzentrationen zu erhalten, muß daher durch eine Konvention vorgegeben werden, für welche Zeitintervalle die Konzentrationsschwankungen aufgelöst werden sollen. Diese Zeitintervalle werden als Meßzeitintervalle bezeichnet; sie betragen in der Regel 10 bis 30 Minuten. Die innerhalb dieser Meßzeitintervalle auftretenden, unterschiedlichen Konzentrationen werden integriert und als mittlere Konzentration im zugrundegelegten Meßzeitintervall erfaßt. Diese für bestimmte Meßzeitintervalle angegebenen (mittleren) Konzentrationen werden im allgemeinen als Einzelwerte des Immissionsangebotes bezeichnet. Sie schwanken sowohl an jedem einzelnen Ort in der zeitlichen Folge als auch von Ort zu Ort.
Einzelwerte des Immissionsangebotes sind daher kaum für die Aufstellung einer Beziehung zwischen den Immissions- und Wirkungskriterien geeignet. Es bleibt kein anderer Weg, als die durch eine Vielzahl von Einzelwerten repräsentierte Information über unterschiedliche Konstellationen des Immissionsangebotes durch eine geeignete Reduzierung auf eine oder einige wenige Kenngrößen wenigstens angenähert wiederzugeben. So kann man z.B. alle Einzelwerte zu einer Häufigkeitsverteilung zusammenfassen, woraus mit Hilfe mathematisch-statistischer Methoden Kenngrößen für das Auftreten der häufigsten Werte, für die Überschreitungshäufigkeit bestimmter Werte u.a. berechnet werden können.
Wie auch immer die Einzelwerte des Immissionsangebotes zusammengefaßt und durch Kenngrößen wiedergegeben werden, auf jeden Fall ist ein Informationsverlust 'n Kauf zu nehmen, da die ursprüngliche Immissionskonstellation nicht mehr reproduzierbar ist. Dafür wird es aber möglich sein, unterschiedliche Konstellationen des Immissionsangebotes durch eine einzige oder durch einige wenige Kenngrößen zu beschreiben, was eine Voraussetzung für die Aufstellung einer Korrelation zwischen dem Immissionsangebot und den Wirkungskriterien ist.
In Abbildung 5 sind die Stundenmittelwerte gemessener S02-Konzentrationen wiedergegeben. Die daraus ermittelte Häufigkeitsverteilung kann sehr unterschiedliche Formen annehmen. In den meisten Fällen weist sie eine linksseitige Schiefe auf. Trotz vielfacher Bemühungen ist es bis heute noch nicht gelungen, diese empirischen
295

• / . ) si (v.: 100
- 80
Sf
f
^ - « - I - . I . . A » A » 1 _
0 0,20 0,40 0,60 0,80 1,00 1,20 1,40
mg S 0 2 / m 3
Abb. 5. Gemessenes SO.-Kollektiv für 1 Jahr mit 1730 Einzelwerten
Abb. 6. Erfassung des Konzentrationsbereiches oberhalb des arithmetischen Mittelwertes x durch die empirische Kenngröße s0.
296
Verteilungen direkt oder nach geeigneten Maßstabstransformationen durch theoretisch begründete Verteilungsfunktionen mit der gewünschten Übereinstimmung zu beschreiben. Man ist deshalb noch auf eine empirische Beschreibung angewiesen, die sich in der Bundesrepublik Deutschland auf den arithmetischen Mittelwert und auf eine empirische Kenngröße zur Erfassung aller Einzelwerte oberhalb des arithmetischen Mittelwertes stützt. Wie die Ableitung der letztgenannten Kenngröße erfolgt, ist in Abbildung 6 dargestellt.
Es sollte nun unbedingt angestrebt werden, nicht nur die vorerwähnten Immissionsmaße für die Aufstellung einer Beziehung zwischen den Immissions- und Wirkungskriterien sondern auch die Immissionsgrenzwerte bzw. Standards von solchen, die Immissionskonstellationen kennzeichnenden Parametern abzuleiten. Nur dann kann der Meßtechnik auch der notwendige Spielraum für die Übernahme einer Kontrollfunktion bei der Prüfung auf Einhaltung der Immissionsgrenzwerte bzw. Standards gegeben werden.
Bei der Anwendung der Meßtechniek zur Luftkontrolle haben wir zwei wichtige Fakten zu beachten. Einmal weist jedes Meßverfahren eine mehr oder weniger große Präzision in der Erfassung des Meßobjektes auf, und zum anderen ändert sich die Quantität des Meßobjektes ständig von Messung zu Messung. Die Präzision einer Messung ergibt sich aus den systematischen und unsystematischen Einflüssen des Meßverfahrens selbst sowie des Untersuchungsgutes. Systematische Abweichungen vom wahren Meßwert ergeben sich meist aus einer unzureichenden Selektivität des Meßverfahrens. Die dadurch bedingte Richtigkeit einer Messung ist kaum abschätzbar. Demgegenüber können die unsystematischen Abweichungen vom wahren Meßwert in der Reproduzierbarkeit eines Meßverfahrens erfaßt werden. Als Maß für die Reproduzierbarkeit dient die Standardabweichung eines Meßverfahrens, die hier mit Gx bezeichnet werden soll. Für die unabhängig vom angewandten Meßverfahren bestehende und als zufällig angenommene Änderung des Meßobjektes wird als Maß die Standardabweichung ax gesetzt. Das Maß für die zufällige Änderung der Beobachtungswerte ergibt sich dann aus a = \fai2 + <Sy2. Damit in den beobachteten Meßwerten ausschließlich die Variabilität des Meßobjektes zum Ausdruck kommt, sollte o*2 < < ay2 sein. Dies ist im allgemeinen auch der Fall, so daß ax bei der Ermittlung von a y aus einem Meßwertekollektiv vernachlässigt werden kann.
Die Größen ax und ay sind nun entscheidend wichtig für jede Grenzwert-Definition bzw. für entsprechende Prüfvorschriften. Immissionsgrenzwerte bzw. Standards, die ohne Rücksicht darauf festgesetzt wurden, sind nicht eindeutig und somit auch nicht Praktikabel.
Wie unsinnig einige der bisherigen Grenzwert-Definitionen sind, soll an einem Beispiel erläutert werden. So wird häufig für die Begrenzung der Spitzenkonzentrationen ein Grenzwert festgestezt, der nicht überschritten werden darf. Es sei auch noch unterstellt, daß vorgeschrieben ist, aufweiche Zeitdauer sich die geforderte Einhaltung des Grenzwertes bezieht und in welchen Meßzeitintervallen die Einzelwerte zu ermitteln sind, die unterhalb des Grenzwertes bleiben sollen. Versucht nun ein Meßtechniker, aus einem gemessenen Meßwertekollektiv abzulesen, ob der Grenzwert angehalten wurde, so kann er dabei zwei verschiedene Wege beschreiten. Liegt eine
297

zeitlich lückenlose Meßwertreihe vor, so kann er prüfen, ob jeder einzelne Meßwert unterhalb des Grenzwertes bleibt. Für diese Prüfung spielt die Standardabweichung G,J des Meßobjektes keine Rolle, wohl aber die Standardabweichung ax des Meßverfahrens, da die Prüfung an Einzelwerten vorgenommen wird. Setzten wir für ax
den Schätzwert sx ein, so bleibt jeder einzelne gemessene Wert xi (dessen wahrer Wert dem Grenzwert entspricht) nur dann mit einer bestimmten statistischen Sicherheit unterhalb des Grenzwertes, wenn die Bedingung
Xi < Grenzwert - t. sx
erfüllt ist. Der Faktor t der Studentverteilung (hier anstelle des Integrals der Normalverteilung) ist dabei in Abhängigkeit von der gewählten statistischen Sicherheit für die Einhaltung des Grenzwertes einzusetzen. Er nimmt bei einer Sicherheit von etwa 95 % den Wert 2,0 und bei einer Sicherheit von etwa 99,8% den Wert 3,0 an. Bedenkt man nun, daß die mittleren Standardabweichungen sx unserer besten Meßverfahren kaum unter ± 5 % rel. liegen, so mussen bei einer statistischen Sicherheit von 95 % alle Einzelwerte mindestens um 10% unter dem Grenzwert bleiben. Da die Standardabweichung sx vom Meßverfahren abhängt, wird es für diejenigen, für die sich aus einer Grenzwertüberschreitung Konsequenzen ergeben, also für die Betreiber von Industrieanlagen, nicht gleichgültig sein, welches Meßverfahren für die Immissionskontrolle eingesetzt wird. Andererseits ist es für die zu schützenden Objekte völlig gleichgültig, ob man für die Immissionskontroile ein Meßverfahren mit einer größeren oder geringeren Standardabweichung einsetzt, da durch das Produkt / . sx das verbleibende Risiko für eine dennoch vorliegende Grenzwertüberschreitung unabhängig vom Meßverfahren wird.
In den meisten Fällen kann die Einhaltung von Grenzwerten aber nicht durch eine zeitlich lückenlose Messung überprüft werden, weil der Aufwand zu groß ist oder weil es für bestimmte Messungen noch keine automatischen Meßgeräte gibt. Das ermittelte Meßwertekollektiv besteht dann aus einer Stichprobe, in der nur zufällig die höchsten oder der höchste Einzelwert der Grundgesamtheit enthalten sein kann. Die Prüfung auf Einhaltung eines Grenzwertes kann jetzt nicht mehr auf Einzelwerte abgestimmt werden; vielmehr ist das gesamte Werte-Kollektiv für eine solche Prüfung heranzuziehen. Aus einem solchen Werte-Kollektiv ist aber die Standardabweichung i als Schätzmaß für ax, also für die Streuung des Meßobjektes berechenbar. Die darin enthaltene Standardabweichung des Meßverfahrens kann dabei, wie bereits erwähnt, als unbedeutend vernachläßigt werden. Ist x das arithmetische Mittel aus allen gemessenen Einzelwerten xi, so läßt sich mit x + t. s für eine im /-Wert zu berücksichtigende Vertrauensgrenze angeben, die mit einer kalkulierbaren statistischen Sicherheit von einem bestimmten Anteil aller auch in der Grundgesamtheit vorkommenden *,-Werte eingehalten wird. Die statistische Sicherheit ist aber nur für eine Vertrauensgrenze kalkulierbar, die nicht alle Einzelwerte einschließt. Sie kann zwar für 99,99 %, aber niemals für 100% aller Einzelwerte berechnet werden, weil aus theoretischen Gründen die 100%-Grenze im Unendlichen liegt, etwa wie der 0-Wert auf einem logarithmisch transformierten Zahlenstrahl. Es ist daher auch unsinnig zu foidern, daß alle Einzelwerte ohne Ausnahme unterhalb eines Grenzwertes bleiben müssen, weil es hierfür keine Prüfmethode gibt.
298

Die hier an einem Beispiel erläuterte Bedeutung der Größen ax und <sy bleibt auch für andere Immissionsgrenzwerte bzw. Standards bestehen, die sich nicht auf Spitzenkonzentrationen sondern auf Jahresmittelwerte, Monatsmittelwert oder andere beziehen. In der Bundesrepublik Deutschland stützt sich die Prüfvorschrift über die Einhaltung der Immissionsgrenzwerte ausschließlich auf eine Berücksichtigung der Größe G, wobei für die Schätzgröße sx die in Abbildung 6 abgeleitete empirische Kenngröße s0 eingesetzt wird.
Mit den vorgetragenen Modellvorstellungen und den Ausführungen über sinnvolle und praktikable Prüfungsvorschriften für die Immissionskontrolle sollen die Bemühungen um eine Aufdeckung der Zusammenhänge zwischen den Immissionen und ihren Wirkungen sowie um die Aufstellung von Luftqualitätskriterien und Immissionsgrenzwerten gefördert werden. Der Erfolg wird davon abhängen, ob es gelingt, die letztlich entscheidenden Grenzwertdefinitionen auf eine den Immissionswirkungen adäquate Beschreibungsform des Luftverunreinigungszustandes abzustimmen und eindeutige Prüfungsvorschriften für die meßtechnische Kontrolle über die Einhaltung der Immissionsgrenzwerte aufzustellen.
Summary Measurement of air pollution and establishment of criteria for the evaluation of air quality
To define the substances causing air pollution, they have to be separated from those necessary for life. Accordingly, the definition for poison, the characteristic of a Pollutant, is the dosis injurious for man, animals and plants.
Air pollutants can cause immediate injuries, and they can have a longe-range effect. This has to be taken into consideration in measuring air pollutants and in establishing criteria for air quality. As a transport medium the atmosphere is intermediate between sources and acceptors of air pollutants. We use the terms 'emission' and 'immission' to describe the complex comprising generation, transport, and effects. They characterize boundary situations and are defined unilaterial. Displacements between them can be associated with both. As long as we want to describe only the transport of air pollutants through the atmosphere, the use of the term emission is sufficient, as common in several countries. But to describe the situations associated with the effects of air pollution (no matter where in the atmosphere) another term is needed. Circumscriptions like ground level concentration' confirm the lack of a suitable term.
Nevertheless it seems advisable to maintain the term 'immission'. A workable definition is given and criteria for the evaluation of the air quality are established which can be quantitatively described. It is shown how relationships can be established between immission criteria and their effects.
Among the immission criteria the 'immission offer' and the 'immission rate' are the most important. They are both measured as the amount of polluting substance per unit area and per unit time, e.g. in mg nrr2 d-1. Action per volume, such as mg/m3 or P-P.m. can also be used, but in general this is not advisable.
The immission rate is the active part of the immisson ; it is more strongly correlated
299

with the effect criteria than the immission offer is. Immission rate may have a general meaning, or it may refer to certain specified
objects. The common immission rate depends only on the immission offer, not on damaged objects; it is determined e.g. in measuring quantities of dust, whereas e.g. measuring the uptake of fluorine by a certain plant species (per unit area and per unit time) has to be classified under special immission rate.
The knowledge of immission rates is needed to draw up immission criteria. But until now this has been possible only in exceptional cases. Limiting values estimated in this way should be related to the immission rate.
At present we depend nearly always on estimates of the immission offer. For this purpose several countries have established limiting values (standards, MIK-values).
Emission varies with time, and from site to site. This leads to the question, how the immission offer is to be determined, and how these constellations can be adequately described. The meaning of such criteria as measuring interval, reproducibility, or accuracy, are thoroughly investigated.
The most important characteristics to describe the constellation of the immission offer are discussed. It appears that the information on the various constellations in the immission offer can be represented by one or a few indices with the aid of appropriate mathematical statistical procedures. The importance of such indices in limiting the immission offer is discussed.
Résumé Le mesure de la pollution et la formulation des critères pour le jugement de la qualité d'air
Pour la description des substances causant une pollution d'air, nous avons besoin d'une définition, qui les distingue de les éléments qu'on a besoin pour vivre. La marque significative est la possibilité d'un dommage pour l'homme, l'animal, et la plante.
Les pollutions d'air peuvent provoquer des dommages à la longue et des dommages immédiats. Pour mesurer les pollutions d'air, et pour la formulation des critères d'évalution de la pollution d'air, il nous faut tenir compte de cet état de choses. L'atmosphère, en qualité de milieu de distribution, se place entre les sources et les accepteurs. Pour décrire le total complex de l'origine, du transport, et de l'effet des pollutions d'air, nous appliquons les conceptes 'émission' et 'immission'. Ceux-ci caractérient les situation-limites et ils sont defines donc unilatéralement. Les transferts entre elles peuvent se rapporter à l'une ou à l'autre. Tant que nous ne voulons que décrire le transport des pollutions d'air par l'atmosphère, la notion de l'émission est suffisante, comme c'est l'usage en plusieurs pays. Mais pour la description des situations limites cohérant de la pollution d'air, nous avons besoin encore d'une conception de plus.
Malgré des doutes nous voulons gardez la notion 'immission'. On a donné une définition utilisable pour la notion 'immission' et on a établi des critères quantitatifs pour la 'qualité d'air'. On explique la manière à laquelle on peut établir des relations entre les critères d'immission et ses effets.
300

Il faut regarder 'l'offre d'immission' et 'le degré d'immission' comme les concepts les plus praticables pour décrire les quantités d'une substance nuisible par l'unité de surface et par l'unité de temps, par exemple, en mg rrr2 d^1. Les mesures de la concentration comme mg/m3 ou p.p.m. sont aussi utilisable, mais des exemples montrent qu'ils ne sont pas toujours sufficant.
Le degré d'immission marque la portion active de l'offre d'immission; ainsi il-y-a une corrélation plus forte entre cet degré et les critères d'effet, qu'entre cet degré et l'offre d'immission.
Chez le degré d'immission on distingue encore entre un sens général (non référant à des objets) et un sens spécial (référant au objets fixes). Le degré d'immission général n'est qu'en fonction de l'offre d'immission et il est indépendent de la présence d'objets, par exemple en mesurant le dépôt de la poussière, tandis que, par exemple, la quantité de fluor assimilée par certaines plantes est un cas 'special' d'immission.
La connaissance du degré d'immission est indispensable pour établir des critères d'immission. Mais, malheureusement, ce n'est possible qu'en des exceptions et à Présent il est nécessaire de nous restreindre à la détermination de l'offre d'immission. La signification des valeurs limites ('standards', MIK-valeurs, etc.) de l'offre d'immission établies dans des pays divers est sujet à discussion.
L'immission montre des fluctuations sur un lieu dans la suite de temps, et d'un lieu à un autre. Cela évoque la question, comment qu'on puisse déterminer les constellations d'offre d'immission par des méthodes de mesure appropriées, et, comment cettes methodes peuvent d'être décrirées en formes mathématiques. On doit aussi examiner l'importance des critères comme la mesure d'intervalle de temps, la reproducibilication, °u la justesse.
Pour la formulation de la relation entre les critères d'immission et leurs effets, les caractéristiques les plus importantes sont discutées. Probablement il sera possible de condenser, avec l'aide des méthodes mathématiques, les informations sur les constellations différentes de l'offre d'immission, contenant dans un grand nombre des valeurs Particulières, et les représenter par une, ou par un petit nombre de valeurs caractéristiques. On discusse l'importance de telles valeurs pour la limitation des dommages.
301


The National Survey of Air Pollution in the United Kingdom
Marjorie Clifton1
Warren Spring Laboratory, Stevenage, Herts., UK
Abstract
The form of the United Kingdom National Survey was determined by the importance of pollutants which, although almost universally present, are insidious and therefore underestimated. 24-hourly measurements of fine suspended particles (smoke) and of sulphur dioxide are made at nearly 1300 sites by means of simple, inexpensive equipment owned and operated by 450 local communities. Every type of community is represented, and instruments are placed in residential, industrial and commercial districts. Rural districts are also studied. The Survey is co-ordinated and supervised by the Warren Spring Laboratory of the Ministry of Technology. The Laboratory has developed several 'nstruments based on the original National Survey sampling apparatus, including one which takes 24-hourly samples for a week without attention, a portable instrument with time controls, and a directional sampler with which wind speed and direction can be recorded on tape.
When the United Kingdom National Survey of Air Pollution was inaugurated in I960, it was decided that the important pollutants need not be those which advertised their presence by overt and demonstrable deposits or smells, but could very well be those which, although almost universally present, were insidious and therefore underestimated. Only when extremely high concentrations occurred was the existence of smoke (or fine suspended particles) and sulphur dioxide perceived by the citizens, and the fact that a very large proportion of both these pollutants resulted from their own domestic combustion of coal on open grates was certainly not appreciated (Fig. 1). Another important consideration was that measurements which were made on a monthly basis were entirely inadequate for providing information about short-term Peak levels of pollution. In addition, the two measurements made on this basis, that is, the measurement of deposited matter and the use of lead dioxide paste to determine the accumulation of sulphur compounds, were both incapable of providing results in the form of a concentration of pollution. On the other hand, the claim that the only type of instrument worth considering was the type which made continuous recordings was not felt to be justified. The expense of such instruments, and the necessity for them to be supervised by highly qualified technical staff, would limit the Survey to a small number of places.
'• Originally to be presented by Dr. S. R. Craxford.
303

lir h
• il.,;- • • . j • ) •
-.,!',-• i'.
t ! ••'•'.
\, •.•:••.'• ' • . J . .

F W / I V A ^
FILTER CLAMP IN SCREW-TYPE HOLDER
Pig. 2. Schematic arrangement of standard 24-hourly sampling apparatus for smoke and sulphur dioxide. Smoke (fine suspended particles) is collected on a cellulose filter; sulphur dioxide is absorbed lr> dilute hydrogen peroxide solution.
from industrial processes and would only occur in known locations ; more serious was the disadvantage that alkaline gases could neutralize the acidity of the solution and fine alkaline particles on the filter could absorb sulphur dioxide before it reached the bubbler. This was accepted, but it was felt that the latter form of interference would be important at only a small number of sites, and where the presence of ammonia was suspected there were fairly simple methods of detecting it, so it would not go unchecked. The great advantage to be set against these drawbacks is that the simplicity and cheapness of the apparatus enables it to be employed almost anywhere (Fig. 3). The low cost means that all but the very smallest communities can afford their own equipment and the simplicity means that, with some training and supervision, anyone with a modicum of commonsense can obtain valid results. Thus, local communities can own and operate their own apparatus, gaining knowledge of local environmental conditions to guide their own policy while at the same time contributing to a national project unique of its kind; they also receive information about all the other measurements made with the same apparatus throughout the country so that their own results can be evaluated in the national context.
The one essential step before the National Survey could be said to be truly national was to ensure that knowledge was obtained about pollution conditions in every type
305

• % Ä i f e i »
«•


NATIONAL SURVEY OF SMOKE & SO2
Surveys round power stations
1 or more instruments in use
O 20 40"'l<t
N
• •
• •
Fig. 5. Map showing most of the places where pollution sampling is undertaken, usually by the local Public Health Department, for the United Kingdom National Survey. There are further sites in Scotland and Northern Ireland.
308

•' =;'- > .-. \ : ! .V . - ; . ; : i ' ^ ^ *' =• * •:'• : -:= :--'. UM . - ; ' { ' - ^ - ' "~ ---- ; : - - -!- ' - - f - U i : - • ' ; ?-:- : : .;= * \
' - - _ : : , . ' • . - l.l'. - . • : - • ! . ' . ' ; - .•. ;hO . : ! ( . . ; ---; -.M::-..- . J ' , : : , - ! ^- . ; - . . ! i : - . ; • •!•<'.:'vi'.
»*•-];:-. :'h: '.'• :. -=-• ;.I...M .1 ; h i : h-.ii - c,- . . ••J>--,\ '••••'.•.• l'-~ •' i i L . u- •-.'. •,•'.:•:• I'- •:-. • " '
- =- : • . : • • - :_ \ - : ; •>: ' : ; r -i , : . ; ; , ; . i , - , ! • • ui- i:i-. -'•.• .:-. . . Il « i i l'.:-,: ._- 'V-i •--••: ;• ' . : ; - ; ; ; : • • :
; - ; • ; ' ! :- .( ;- -.= : > - >;;: : :-. - ; ,•;._'--•!<:..•.• i-i: . . - - ; - ; L ^ • : • ! • . : • '.•.„> - M- I..' : : ~
• ; u . - . : . ' • • • i. • ; - ' . - . ü i ! ! . • - . . ; =.'. -. <•••••.. •.-'- \ --;>. ; \ . ' - • . . . . ' . • ! . ! MS i = - ; : ! ' . • - - !-.-!. '-. i j :i= M! < ; i !
'">-. - ! '•• : ; t -i i-pp.i-' . -'- . ' " : ' - : " - l-.i • • : : • - . • ' - -M - . • •.•.•-.t'.i •'!• ;-.'• , : ; ; . ! -.;!i.-> . - • -.-; -.-•;
" - .-"-.- v.-.-.. - • • {•-.. . : - - - . , . i i . .ü- ! i - : • - . - • - . . - . : . . . •_ .---. ;?;,• ..].. - . ; . . \ . i \ , i ; : : ••-I , . :-•-.•
''•>i,'i\: ' • 1' - - : • ; , • : • • :' -I • • =• • : •• • ; • ' • . : ! • - . : < .•-. ' i ' . ' '.'. Mi -.X - s . i:~. i . ' ' : ; : - _ ; . ; ! - - . '
' ' v - : - , ; >;" -• - - - ; ! • ' : • . V* . V ' *-. -.. <-•.'. ' • ..\ P ' '.:•_ „ J '- _'_ i H ;c* -: .; i v Î •. ' -. P- ' : ',
'• --'•<•• -• '•-„ ; j. -.-•) - ' ; I : \ Î : ; - '.:' ' . . . . ' ' - >. • : • . ' . : - ' ' i . • i ! ! « , : . ' ' : ' : : < i ' • - • . ' »
H,-»- v, , , . : - , . . , ! - : - • . • ' - . . . - . - _ : . . < - • = - ; ! : • ; - . " : - . : : -=! \ : : - ^ . - . ••:••• . : : ' . ! . > . : t :
' - - : . ; - • - . - ; . . - . :t,v -.,-. ' f . . ' - : - - : • • - - • . r::-i- • ; . . - : ^ . ^ : . --K- =-'•.'•<-.;' ."•• H : : • - •-, >.'. •• .i . -
- ; : • - , . - - , ; , - : M.. .•-• ;• . ; . . . , - , ; : : ; . . ; i.-. : • . . . : . ; , - • - .< i •• • -.it k;;- • - ' • • ' : . - ' ; - . : , : : . • . ; . - . .
« ! ; . L ; - . . ; = - . - : ! . , . U ! - - ; C ; i : f
. , : ! > . . . " . ! t v. - i :

A

wind from a certain source. The second instrument, only recently developed, is a more sophisticated piece of apparatus. It is designed to collect in separate filter-and-bubbler units the pollution arriving at the site from different directions (Fig. 8). This directional sampler can be set up to sample whichever sectors of the surroundings may be of interest. Up to four separate sectors can be sampled; another unit collects pollution when the wind is too light to operate the wind vane, so that the direction is uncertain. The instrument incorporates a data-logging system which records on tape the wind speed and direction thoughout the sampling period, thus the results can be evaluated with respect to both the duration and the strength of winds from each of the sectors, and to periods of relative calm. Details of these instruments and of the method of estimation will be supplied if a request is made to the Director, Warren Spring Laboratory, Stevenage, Hertfordshire.
Warren Spring Laboratory publishes the results of National Survey measurements first as monthly summaries and later as annual summaries with seasonal and yearly means. Daily concentrations are filed and are accessible for research purposes. Organizations all over the world receive these results, and also the monthly publication of abstracts of the literature on air pollution, on request. The Air Pollution Division also advises research workers in many fields and interested persons from a wide variety of spheres on the data available and its proper evaluation and interpretation. The emphasis on proper evaluation and interpretation is important because misconceptions are all too common. Someone who feels sure that only industrial cities create smoke pollution will fail to obtain the true pattern of relationships between smoke and whatever he happens to be studying; he needs to know that smoke in the United Kingdom is largely of domestic origin, and that it is unlikely to be serious where the local coal is 'hard' or smokeless, or where alternative fuels are being substituted for coal. Similarly, it must be appreciated that sulphur dioxide concentrations are related to the sulphur content of the fuel and can vary widely in otherwise similar districts in different parts of the country.
Already some extremely interesting papers have been published on the pattern of pollution in relation to the growth of lichens and of mosses, and to the distribution of melanic forms of certain insects. Other studies are being carried out and we at Warren Spring Laboratory are very glad of the opportunity to collaborate with those concerned with the effects of pollution, for unless these are understood it is impossible to formulate sensible policies for the future.
Résumé L'Enquête nationale sur la pollution atmosphérique au Royaume-Uni
La forme de l'enquête nationale au Royaume Uni a été déterminée par l'importance des polluants qu'on trouve à peu près partout mais qui sont insidieux et donc sous-estimés. Les moyennes quotidiennes de fumées noires et d'anhydride sulfureux sont déterminées à près de 1300 emplacements au moyen d'un appareillage de prélèvement simple et de prix modeste ; les appareils appartiennent aux 450 municipalités qui effectuent les mesures. Chaque type de commune est représenté, et des appareils sont in-
312

stalles dans des quartiers résidentiels, industriels et commerciaux. On étudie aussi les régions de campagne. L'enquête est coordinée et dirigée par le Warren Spring Laboratory du Ministère de la Technologie. Le laboratoire a développé plusieurs appareils basés sur l'appareillage original de l'enquête nationale, y compris un appareil pour dosage quotidien mais à relevé hebdomadaire, un appareil portatif incorporant une minuterie, et un appareil directionel, c'est à dire qui distingue entre les pollutions apportées par des vents de directions différentes et avec lequel on peut en outre enregistrer la vitesse et la direction du vent sur bande magnétique.
Zusammenfassung Der Nationale Überwachungsdienst für Luftverunreinigung in Großbritanien
Die Art der gesamtstaatlichen Untersuchung über Luftverunreinigung im Vereinigten Königreich ist von der Wichtigkeit der Verunreinigungsstoffe abhängig, die trotz ihres universellen Vorkommens verborgen sind und daher unterschätzt werden. Jede 24 Stunden werden auf beinahe 1300 Stellen Messungen von Schwebeteilchen (Rauch) und Schwefeldioxid vorgenommen, mittels einfacher, billiger Geräte die das Eigentum von 450 örtlichen Gemeinden sind und durch sie bedient werden. Jede Art von Gemeinde ist vertreten, und die Geräte sind in Wohn-, Industrie- und Geschäfts-Bezirken aufgestellt. Auch ländliche Bezirke unterliegen dieser Studie, die durch das Warren Spring Laboratorium des Ministeriums für Technologie koordiniert und geleitet wird. Das Laboratorium hat, auf der Grundlage des ursprünglichen Probenahmegerätes der gesamtstaatlichen Untersuchung, verschiedene Instrumente entwickelt, z.B. ein Instrument das eine Woche lang ohne Wartung jede 24 Stunden eine Probe nimmt, ein tragbares Instrument mit Zeitkontrollen, und ein Richtungs-Probenahmegerät das die Richtung und Geschwindigkeit des Windes auf einem Band aufzeichnet.
313


Discussion in Section 7 : Measuring air pollution in vascular plants
Reporter: L. J. Brasser
Participants: DétrieCChairman), Joosting, Pollanschütz, Wassink, Zahn
The first part of the discussions referred to units and measuring techniques. During the symposium the intensity of air pollution was expressed in several ways, mostly as the concentration of the pollutants in parts per million (p.p.m.), milligrams per cubic metre (mg/m3), etc. The use of so many units, especially as this happens all over the world, is confusing and may lead to mistakes. It would be very useful if international organizations like the Council of Europe and the Organisation for Economic Cooperation and Development would try to establish international agreement on this subject.
A striking fact in the symposium was that only in a few cases the concentration of the pollutant and the damage to plants were compared with the production of the Pollutant by neighbouring factories. It would give a better and more complete view if this would be done more often.
It is understood that the measuring method used to determine the concentration of pollution influences the precision of the measuring result and in that way indirectly the confidence limits in statistical evaluation.
The second group of subjects coming up for discussion was that of air pollution criteria and the statistical operation of measuring results. When setting standards, reality should not be lost sight of. It has no sense to prescribe very low maximum concentrations without allowing for the incidental occurrence of peak concentrations. But the frequency with which such peaks occur is very important. So it is possible to set a maximum to, for instance, the arithmetic mean of the concentrations, combined with a maximum concentration that may not be exceeded in, for instance, 98 % of the measurements.
There are different ways to describe reality. The presentation of the measured concentrations as a log-normal frequency distribution is one of them. It is widely used, though on several occasions there were large discrepancies between the theoretical curve and the data. But other ways are also possible, for instance by not using the concentration of the pollutant in the air as an index but the effect of the pollution on Plants, materials, etc. The difficulty that different plants have different dose-effect relationships can be overcome by using the economic loss as an effect and not such characteristics as lower harvest, leaf damage, and damage to flowers. But even then variations in place and moment of damage may ask for special ways of approach of the problem. Biological indicators, combined with or instead of measurements might
315

be useful. A special difficulty is that very high peaks in the concentration of a pollutant cannot
be dealt with in a mathematical model. Moreover there is a difference in reaction to different ways of exposition. As an example may be given the case in which a plant species was exposed to a long lasting constant concentration and another species to changing concentrations (with periods of low pollution). The first species was heavily damaged, the second only slightly. In another experiment the outcome was the reverse. Such a behaviour cannot be dealth with in a mathematical model, which means that the effect of air pollution on plants has to be studied under realistic conditions.
In the course of the discussions on this subject, several speakers mentioned the report G 300 'Sulfurdioxide, to which level is it acceptable?' by Brasser, Joosting and Van Zuilen, of the Research Institute for Public Health Engineering TNO in Delft, the Netherlands.
At the conclusion of the discussions, the chairman remarked that obviously enough material is available in this field to have a special symposium on measuring techniques, statistical operation of the measuring results and setting of standards.
316

Section 8 : Measuring air pollution in non-vascular plants


The use of indicator plants to estimate air pollution by S0 2 and HF
A. van Raay1
Institute of Phytopathological Research, Wageningen, the Netherlands
Abstract
Indicator plants can be used in the estimation of damage to crops by air pollution, although they can never give an absolute measure. They must be able to indicate the presence of an air pollutant even in extreme dilution. A difficulty is the non-specificity of injury symptoms in indicator plants.
S02 or H F pollution may be detected with plants that accumulate the contaminant (especially HF) or with simple measuring apparatus. Both symptoms and chemical analysis must be used to trace the source, the rate and the extent of contamination.
Indicator plants with a different reaction to SO, and HF allow distinction in areas where both Pollutants occur. In the Netherlands endive, lucerne, clover, buckwheat and barley are used to detect SO. and gladioli and freesias for HF. Advantages are: low cost, immediate and easy use. clear definition of the contaminated area.
Gladioli are being studied for a possible correlation between F content of leaves or tipburn injury and F concentration of exposed sticky papers.
An accurate measurement of air pollution with indicator plants will never be Possible: the factors influencing a living organism are too numerous. They can only give an assessment of the type of pollution.
An indicator plant must be sensitive to a certain contaminant, and it has to react with clearly visible specific symptoms, preferably at low concentrations. The injury Pattern of SO2 and NO2 damage in e.g. clover does not satisfy this requirement, as drought and wind, normal senescence and fungal diseases may indice the same symptoms. Neither does the damage depend solely on the type of agent but also on the duration of its action.
Though it may not be safe to rely solely upon the visible symptoms, they will be helpful in certain cases; but a check remains necessary. For this purpose e.g. a chem-'cal analysis of leaves may be used; there are certain plants particularly helpful in this respect, though the pollutant may soon disappear in the plant, or it may accumulate °ver a long period.
Despite all such disadvantages, indicator plants may be useful if we define them as Plants sensitive to an extremely dilute air pollution with causing more or less specific
•Originally Professor Baldacci should treat this subject. The present author could partly base his contribution on Professor Baldacci previously submitted summary.
319

visible symptoms. Besides there may be other plants that indicate accumulated pollution ; perhaps certain clones are more suitable for this purpose.
In literature lists of plants sensitive to SO2 or H F are given. Among them are wild species, so that the wild flora can also indicate the kind of contamination. Lucerne, barley and clover are sensitive to SO2 and almost resistant to HF ; gladioli, freesias, tulips and some other bulbs are much more sensitive to H F than to SO2. So both categories of plants may be used side by side.
As to pollution by SO2, since 1954 Spierings carried out investigations around a nitrogen-fertilizer factory and coking works in the south of the Netherlands. With lucerne and gladioli as test plants and simple Leclerc measuring apparatus placed near the trial plots he could indicate kind and source of pollution. The table shows that the measurements and the damage to the plants are indeed strongly correlated. This means that, if no meters had been used, the right conclusion would have been reached with lucerne and gladiolus.
It must be admitted, however, that the relation between sulphur content in the leaves and the rate of injury is not always so pronounced as in this case. Perhaps this close correlation occurs especially when the SO2 concentration is high and when the time between the pollution of the air and the moment of collecting the plants is not too long.
Indeed, on another occasion, discrepancies between these values were found, perhaps owing to losses of sulphur in the leaves. Therefore the injury rate should be used rather as an indicator than as a definite estimate of the sulphur concentration.
Certain measures may minimize losses of SO2, such as using the same soil type in all plots, frequent inspection o f the plants and collecting of plants for chemical analysis immediately after the pollution took place. However, it is not always possible to control disturbing factors completely and the interpretation of the sulphur concentration in the plant remains disputable.
As another example of the application of indicator plants, freesias can be mentioned. They are used in the Westland, the area north of the Nieuwe Waterweg near Rotterdam (east of Delft), an area important for its glass crops. Figure 1 shows the position of the Freesia trial plots. In 1961 freesias were badly damaged there by air pollution. The
Comparison between sulfur contents in plants and S02 measurements in the air with Leclerc's meter, in the neighbourhood of a nitrogen fertilizer plant.
Sulfur content of the air (mg S02 per day)
Lucerne
Gladiolus
Damage
heavily damaged ob\ iously damaged obviously damaged slightly damaged not damaged considerably damaged not damaged not damaged
Sulfur contents of plants as a percent
5.6 4.0 3.3 2.4 2.5 2.5 1.6 1.0
in dry matter Sulfi (mg
10.1 6.2 6.3 5.6 4.2 5.2 3.5 2.8
320
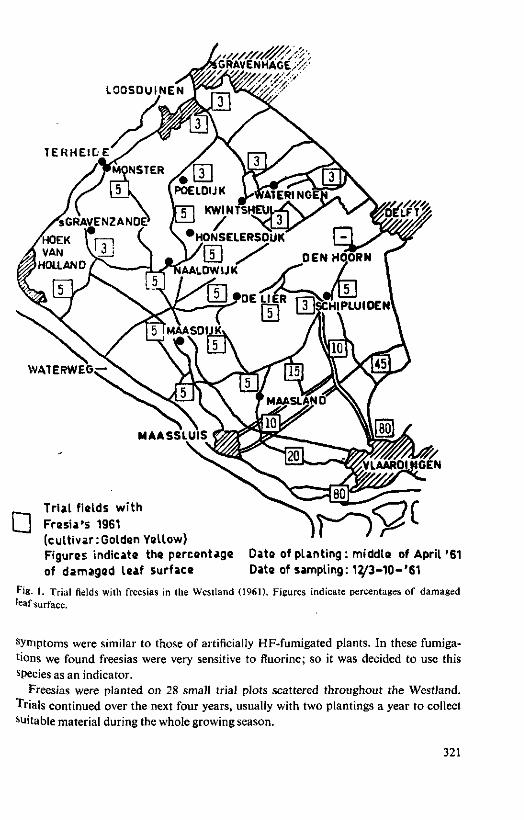
>///////Z4'A, CRAVEN HAGE /'//
TERHEILE
WATERWEGc-
VLAAROIKGEN
Trial fields with Fresia's 1961 (cultivar: Golden Yellow) Figures indicate the percentage Date of planting: middle of April '61 of damaged leaf surface Date of sampling: 1^3-10-'61
Fig. 1. Trial fields with freesias in the Westland (1961). Figures indicate percentages of damaged 'eaf surface.
D
symptoms were similar to those of artificially HF-fumigated plants. In these fumigations we found freesias were very sensitive to fluorine; so it was decided to use this species as an indicator.
Freesias were planted on 28 small trial plots scattered throughout the Westland. Trials continued over the next four years, usually with two plantings a year to collect suitable material during the whole growing season.
321

Estimates by three persons of visual percentage of damaged leaf area where chosen as a measure of injury. Fluorine analysis of leaf samples were added. The values on the map indicate percentages of damaged leaf surface.
The highest value (80%,) was found near the industrial centre of Vlaardingen. Up to 6 -7 km north and north-north-west and up to 5-6 km west and west-north-west of this place values were over 20. An injury rate of about 10% occurred once or twice within 12 km of this place and between it and Delft, in 1961 values in other places were 5 or less; in the other years only a few exceptions to this rule were noticed. The conclusion was that the source of pollution should be sought for in Vlaardingen.
Another example is the Rotterdam district. Here many industries are concentrated, of which the oil refineries and chemical plants near Perm's might cause much of the air pollution. Indeed damage to fruit and vegetables have often been reported near Pernis. Spierings and his colleagues made a frequent use of indicator plants to trace the causes of these injuries.
Of course in such regions, where many known and unknown sources of contamination lie close together, it is very difficult to trace the real agent and the source of pollution, especially because of the possible cumulation or interaction of contaminants. Corresponding systematic investigations by artificial fumigation trials have as yet not been carried out. But it is not unreasonable to presume, for instance, that apple-trees may be more sensitive to SO2 contamination if H F pollution is also present.
Near Pernis, permanent plots were laid out with enidve, lucerne, clover, buckwheat, barley, gladiolus and freesia. The sudden appearance of damage in the leaves of apple-trees, followed by a heavy leaf and fruit drop in association with a heavy injury on SO2 sensitive plants such as buckwheat, clover, lucerne and little damage to fluorine-sensitive indicator plants made it most probable, that the principal cause of the injury was a heavy pollution with SO2. The establishment of other trial plots in this area led to the detection of the source.
As a last example the F contamination in the surroundings of a superphosphate industry in the south-west of the Netherlands can be mentioned. Here cattle breeders and fruit growers have been complaining for several years. A special committee was able to supply a reasonable solution for the economic side of the problem for the cattle breeders but the claims of the fruit growers appeared sometimes unfounded. Moreover the management of the industry wanted to know the effect of a newly built scrubber.
Here researches started with the simultaneous application of limed paper boxes and an indicator plant, in this case gladiolus cultivar Snow Princess, which is very sensitive to fluorine. The measuring boxes, each with 6 limed filter papers, were placed next to the plots with gladioli which were evenly distributed over the area. The cultivar Man-soer, a resistant gladiolus variety, was used for the chemical analysis of 7.5 cm leaf tips. In addition grass samples were collected every six weeks from pastures 800 to 5000 m north-east of the factory.
After two years of investigation the following results were obtained : 1. The newly established scrubber had substantially reduced the pollution: an area between 2.5 and 5 km north-east of the factory had become innocuous to cattle.
322

Expected units(ppmF) 1965 1967 1900
1800
1700
1600
1500
«00
1300
1200
1100
1000
900
800
700
600
500
(00
300
200
100
n
; s(itp) •
m
X
<*>
f i rs t yield second yield m.points in orchards
x
* ; • • •
M
® ®
1 1
K
®
X
1
X
®
*
*
: 1 i
•
®
« 0 500 D [ i m F in 7.5cmM3nsnrr-t ip
Fig. 2. Relation between observed F content and theoretically expected F concentration for gladiolus (c.v. Mansoer).
2. A second source of F was found. 3. Grass proved a good indicator of accumulation if intervals between sampling are short and they are taken from the same plants, and the soil is uniform between trial plots.
If the limed paper method could be abondoned and indicator plants were completely reliable much money could be saved. This would be possible if there were a high correlation between the data of the two detecting methods.
Our research was not planned around the search for such a correlation, so that several precautions necessary for a good trial were omitted. The trial plots did not belong to the same soil type, the samples, which were collected twice in 1966 and 1967 just before flowering and 4 weeks later were in orchards surrounded by windbreaks to compare any injury in fruit crops, so that the air circulation, especially in the measuring boxes, was much lower than elsewhere.
Figure 2 shows the relation between the observed F content in 'Mansoer' and a theoretically expected F concentration. The latter values were calculated as follows.
If there is a positive correlation of F uptake with leaf area (1), exposure time (t) and F concentration in the air (F), then the increases in the amount of F in the leaves during each interval is proportional to the product of these three factors. The unknown constant of the relation is the amount of fluorine (in p.p.m.) picked ud from the air by a unit of leaf surface in a unit of time indicated by one p.p.m. F/day in the limed
323

Expected units (p.p.m.F) 1966 1967
, , , - . . v. f i r s t yield 2600 r Z ( l t F ) . * second yield
fs, ra m.points in orchards 2500(- W W
2400
23001-
2200
2100
2000
1900
1800
1700
1600
1500
1400
1300-
1200
1100
1000
900
800
700
600
500
400
300
200
100
x
® „ "®
* ®
ÎH) '<&
1 2 3 4 5 6 7 8 9 T lp-burn(cm)in Snowprincess
Fig. 3. Relation between observed tipburn and theoretically expected F concentration in gladiolus
(cv. Snow Princess).
324

paper. The amount of fluorine laken up during the whole growing period is the sum of the calculated amounts of fluorine taken up during each interval.
In the graph the small dots and crosses refer to samples taken just before flowering, the heavy dots and crosses to the samples after flowering, dots and crosses in a circle refer to values from limed paper boxes in the orchards. The latter do not agree well with the others, because in the orchards the papers took up less F than in the gladiolus plots.
If the two points at the extreme left in the figure are included (they are the result of a positive selection at the first sampling) it is obvious that most points are close to a straight line.
Figure 3 shows the relation between the observed tipburn in Snow Princess and the same theoretically expected F content. Here the tendency of the dots and crosses to group along a straight line is not so evident. For the 1966 results (small and large dots) there might be such a relation, but for the 1967 results there is little or no support for such a supposition, though the fat crosses (second group of samples) tend to shift to the left in comparison with the light crosses (first group of samples), as indicated by arrows.
After the first sampling tipburn hardly extended in the gladioli. The arrows pointing to the extreme left indicate positive selection at the first sampling. The cause of this discrepancy between the two years is unknown.
x f i rst yield „ second yield (g m.points in orchards
SOOr-
500
400
300
200
100 -
®
®
* K ®,i *i x '
® \
®
®
•JTip-burn(cm)in 0 1 2 3 4 5 6 7 8 9Snowprincess
Fig. 4. Relation between tipburn of Snow Princess and F concentration in 'Mansoer' leaves.
325
We can establish from both graphs this shift to the left of the points for the second sample.
The tentative conclusion is that it is not advisable to evaluate the plants after the initial flowering stage because at that moment they are sensitive and more liable to losses of F from leaves.
Figure 4 shows the relation between tipburn of Snow Princess and F concentration in 'Mansoer' leaves. In this case the linearity of the correlation is somewhat clearer.
To make a long story short: the results point to a linear correlation. This is fairly logical, as F uptake occurs not only through the stomata, but over the whole leaf surface and thus is comparable with the uptake by filter paper. But the conclusions are still very tentative. The whole investigation must be repeated with precautions for the next two or three years.
To conclude this introduction, we may say that the use of indicator plants for SO2 and HF can play an important role in tracing the kind and the source of a pollution. By using such plants on many small plots it is possible to mark the polluted area. The advantages of this method are : low cost, immediate and easy indication of the type of pollution. The disadvantages are: the possible non-specificity of symptoms (especially for SO2) and liability to losses of the pollutant. Therefore, especially with SO2, it will be safer to combine the use of simple instruments though this will cost more.
However, for HF, our investigations suggest a positive correlation between indicator plants and measuring devices.
If this correlation could be proved, we can abandon the paper measurings and use the indicator plants only to estimate the rate of pollution.
Résumé Application d'espèces de plantes indicatrices pour évaluer la pollution atmosphérique attribuée à SO2 et à HF
Les plantes indicatrices peuvent jouer un grand rôle dans l'évaluation des dégâts causés aux plantes cultivées par la pollution atmosphérique et en vue de l'établissement de règlements visant à éviter la pollution. Il est évident que ces plantes ne peuvent pas mesurer. la pollution atmosphérique de façon absolue, mais seulement de façon relative.
Pour pouvoir servir d'indicatrice, une plante doit être suffisamment sensible aux basses concentrations et, dans la mesure du possible, révéler des symptômes spécifiques pour le polluant.
Il est parfois difficile de déterminer si les symptômes que montrent les plantes sont typiques pour un polluant spécial ou si d'autres facteurs sont entrés en jeu. La réponse symptomatique dépend de la durée d'exposition et de la concentration du polluant ainsi que d'autres facteurs du milieu. De tels éléments restrictifs remettent en question l'aptitude d'une plante d'essai spécifique à indiquer tel ou tel polluant.
Pour toutes cettes raisons, il vaut mieux ne pas se borner au remède des plantes indicatrices, mais appliquer parallèlement les analyses symptomatiques des feuilles.
326

L'utilisation de plantes indicatrices spécifiques, soit pour la pollution SO2, soit pour la pollution HF, est recommandée malgré les désadvantages liés à l'application de telles plantes. Elles sont particulièrement utiles lorsqu'on les applique à différents endroits autour d'une région industrielle, de façon à localiser la source du polluant et la région où des plantes sensibles pourraient subir des dégâts.
On est d'avis que les plantes d'essai sont également utilisables en cas de polluants mixtes. A cet effet, on doit disposer de plantes dont les réactions vis-à-vis de SO2 et de HF sont différentes. Quelques spécimens ou variétés qui se prêtent à ce but sont suggérés. Quelques exemples de l'application de plantes d'essai sont cités.
Dans la plupart des cas, on fait mention de l'application d'instruments de mesure simples ainsi que de plantes d'essai.
Grâce à cette double méthode d'avertissement, on pourrait entre autres déterminer le taux et l'étendue de la pollution aux environs des industries.
Les avantages qu'offre l'application de piantes d'essai sont : frais réduits, indication assez rapide et facile, possibilité de délimiter nettement l'étendue de la région où les végétaux sont menacés par la pollution atmosphérique.
Dans les régions où le fluor est le seul polluant, on pourrait envisager l'application de certaines variétés de glaïeculs comme plantes d'essai. Cette possibilité est examinée, et si les résultats des expériences s'avéraient favorables, l'application de ces plantes d'essai dans de pareils cas en serait stimulée.
Zusammenfassung Die Anwendung von Indikatorpflanzen zur Abschätzung der Luftverunreinigung durch SO2 und HF
In landwirtschaftlichen Kulturen können Indikatorpflanzen eine wichtige Rolle spielen'bei der Beurteilung von Schäden durch Luftverunreinigungen und deren Vorbeugung, obwohl sie niemals einen absoluten Maßstab für die Luftverunreinigung geben. Eine gute Indikatorpflanze soll empfindlich gegenüber niedrigen Konzentrationen sein und, wenn möglich, Symptome zeigen, die für den betreffenden luftverunreinigenden Stoff characteristisch sind.
Ob die Symptome für eine spezielle verunreinigende Substanz typisch sind, oder durch irgendeinen anderen Faktor verursacht werden, ist manchmal schwer zu entscheiden. Die Reaktion der Pflanze hängt von der Einwirkungsdauer, der Konzentration des veiunreinigenden Stoffes und anderen Bedingungen ab.
Est ist nicht ratsam, Indikatorpflanzen allein einzusetzen; es empfiehlt sich, symptomatische Erhebungen und chemische Analysen der Blätter zu kombinieren.
Der Gebrauch von Indikatorpflanzen zum Nachweis von SO2 oder HF wird, trotz der damit verbundenen Schwierigkeiten, befürwortet, sind diese doch besonders geeignet zur Einkreisung von Quellen phytotoxischer Stoffe in Industriegebieten und zur Ermittlung von Zonen, wo empfindliche Pflanzen Schäden erleiden könnten.
Für die Identifizierung von Luftverunreinigungsgemischen müssen Pflanzen mit einer unterschiedlichen Reaktion gegenüber SO2 und HF zur Verfügung stehen. Einige Arten und Varietäten werden vorgeschlagen. Ebenso werden Beispiele von Test-
327

pflanzen (in den meisten Fällen unter gleichzeitiger Angabe einfacher Meßinstrumente) genannt. Die kombinierte Überwachungsmethode ermöglicht u.a. eine Ermittlung des Grades und der Verbreitung der Luftverunreinigung in der Umgebung von Industrien.
Die Vorteile einer Verwendung von Testpflanzen sind: niedrige Kosten, ziemlich rasche und leicht erkennbare Reaktion sowie die Möglichkeit das Gebiet, in dem Nutzpflanzen durch Luftverunreinigungen gefährdet sind, klar abzugrenzen.
In Gebieten wo nur Verunreinigungen durch Fluorverbindungen vorkommen könnte man vielleicht gewisse Gladiolenvarietäten als Indikatorpflanzen einsetzen.
328

Plants as indicators of the air pollutants ozone and PAN1
H. E. Heggestad
Crops Research Division, Agricultural Research Service, U.S. Department of Agriculture, Beltsville, Maryland, U.S.A.
E. F. Darley
Air Pollution Research Center, University of California, Riverside, California, U.S.A.
Abstract
Plants are useful indicators of the presence of photochemical air pollutants. Young pinto bean Plants are suggested to determine the possible presence of both ozone and peroxyacetyl nitrate (PAN). Ozone causes a small fleck or dark stipple on the upper leaf surface, and PAN, silvering, glazing, or metallic sheen on the lower surface. To indicate the presence and obtain some information on level of ozone, the tobacco varieties Bel-B (resistant), Bel-C (sensitive) and Bel-W3 (supersensitive) are suggested. Information is provided on the sensitivity of a few other plant species and on factors which should be taken into account when using indicator plants. References are made to published information on the use of pinto bean and tobacco in air pollution surveys.
The silvering on the lower surface of the leaves of leafy vegetables and petunias, observed for the first time in California in the early 1940's (and in the following 20 years in many other parts of the United States), indicates the presence of what now is recognized as photochemical, or 'oxidant' air pollution. The term 'oxidant' is often used synonymously with 'photochemical' because one of the characteristic features of photochemical air pollution is its highly oxidative nature. It is only about 10 years ago that oxone and peroxycyl nitrates have been demonstrated to be the primary toxic agents. Details have been given on the formation and symptomology of these two pollutants in a paper presented by Darley earlier in this symposium.
Chemical and physical methods are now available for the measurement of PAN and ozone. The identification of the pollutants is best accomplished by the combined use of suitable indicator plants and analytical methods. Where analytical methods cannot be applied, the indicator plants continue to serve a very useful purpose in determining the identification and distribution of these two pollutants.
Trained observers can easily distinguish injury from ozone and PAN. Ozone typically causes a small fleck or dark stipple on the upper surface of recently mature, fully expanded leaves of a susceptible species. PAN typically causes silvering, glazing, or metallic sheen on the lower surface of susceptible plants. In a few cases, a plant may detect more than one toxicant simultaneously. Symptoms of ozone and PAN may occur on the same pinto bean leaf when plants are exposed to these pollutants simultaneously.
1. Grateful acknowledgment is made to H. A. Menser for data in Table 1.
329

Annual bluegrass does not distinguish between ozone and PAN, as each pollutant produces the same stipple or bleach symptom. Nevertheless, annual bluegrass is an extremely useful indicator of photochemical air pollution in general. Because they have been used in so many experimental fumigations, much is known about the response of tobacco to ozone and of pinto beans to PAN, thus making them also useful as indicator plants. Other plants sensitive to ozone are spinach, radish, tomato, a white-flowered variety of petunia (cv. White Cascade) and white pine. Plants sensitive to PAN are romaine lettuce, swiss chard, spinach and petunia. Varieties of a single species that vary in sensitivity to a pollutant assist the observer to evaluate levels of the toxicant as well as to indicate that the toxicant is present. As indicators of ozone, the following varieties of cigar-wrapper type tobacco are useful : Bel-B (resistant), Bel-C (sensitive) and Bel-W3 (supersensitive). As shown in Table 1, with low dosage of ozone, Bel-B was not visibly injured, but at the highest dosage, all varieties were injured about in the same degree. With repeated exposure to a relatively low concentration of ozone in ambient air, the response of these varieties may be about the same as shown in Table 1 for the medium dosage of ozone.
Conditions which promote optimum growth of plants, such as high soil moisture, high humidity, balanced nutrition, and moderate or high temperatures, favour increased plant injury.
Plant injury surveys, wherein the researcher examines native stands of pines, commercial plantings of sensitive crops such as spinach and romaine lettuce, as well as ornamental plants, have proven useful in determining presence of ozone or PAN, the distribution over the survey area, and an estimate of the level of pollution. In California, these techniques helped to establish the existence of photochemical air pollution in the areas surrounding the major urban centers. The method used was to distribute IBM sense mark cards to various observers throughout the State. They regularly returned these cards, indicating whether or not specific types of injury were observed on a number of crops. A compilation of the information revealed that photochemical air pollution was present in plant damaging levels in about 11 percent of the area of the
Table 1. Response of tobacco varieties to ozone.1
Ozone dosage Amount of. ozone Hours of exposure
Variety: Be-W3 Bel-C Bel-B
low 0.08-0.1 p.p.m. 4
% injured leaves
41 13 0
1. Ozone: parts per million
extend of leaf injury (0-100)
8 1 0
by potassium
medium 0.2 p.p.m. 2
% injured leaves
54 41 13
iodide.
extend of leaf injury (0-100)
44 13 2
high 0.42 p.p.m. 3s
% injured leaves
98 77 83
extend of leaf injury (0-100)
75 43 50
2. Plants tested had 9 leaves. In low and medium tests plants were younger, having 6 leaves.
330

-r
Rg. 1. The presence of plant damage from photochemical air pollution (diagonal shading) within the principal California airsheds (vertical shading) is shown by cross-hatching.
State as indicated on the map (Figure 1). In addition to observing injury on sensitive commercial crops growing under good
conditions, it is often helpful to look at native plant species such as certain weeds. There may be some limitations, however, due to the possible absence of a susceptible species, such as annual bluegrass, or due to low soil moisture, a significant factor in reducing the sensitivity of the plant to the pollutant.
Another survey technique used rather early by the Los Angeles Air Pollution Control
331
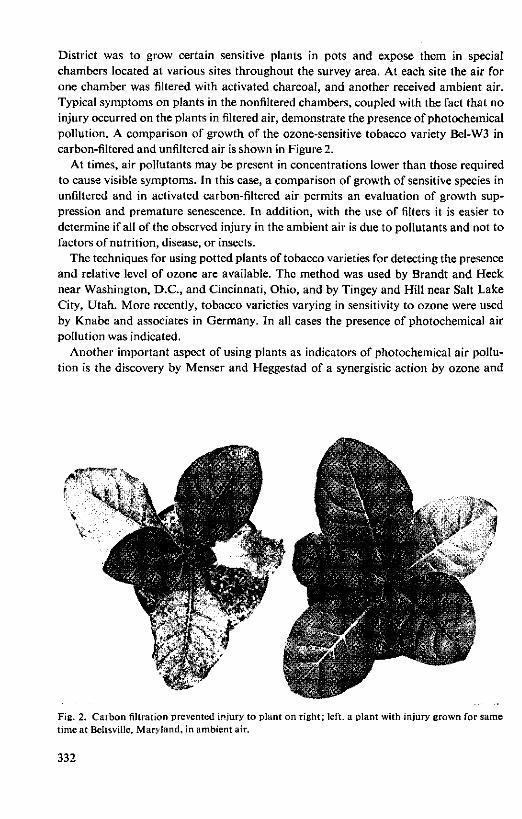
District was to grow certain sensitive plants in pots and expose them in special chambers located at various sites throughout the survey area. At each site the air for one chamber was filtered with activated charcoal, and another received ambient air. Typical symptoms on plants in the nonfiltered chambers, coupled with the fact that no injury occurred on the plants in filtered air, demonstrate the presence of photochemical pollution. A comparison of growth of the ozone-sensitive tobacco variety Bel-W3 in carbon-filtered and unfiltered air is shown in Figure 2.
At times, air pollutants may be present in concentrations lower than those required to cause visible symptoms. In this case, a comparison of growth of sensitive species in unfiltered and in activated carbon-filtered air permits an evaluation of growth suppression and premature senescence. In addition, with the use of filters it is easier to determine if all of the observed injury in the ambient air is due to pollutants and not to factors of nutrition, disease, or insects.
The techniques for using potted plants of tobacco varieties for detecting the presence and relative level of ozone are available. The method was used by Brandt and Heck near Washington, D.C., and Cincinnati, Ohio, and by Tingey and Hill near Salt Lake City, Utah. More recently, tobacco varieties varying in sensitivity to ozone were used by Knabe and associates in Germany. In all cases the presence of photochemical air pollution was indicated.
Another important aspect of using plants as indicators of photochemical air pollution is the discovery by Menser and Heggestad of a synergistic action by ozone and
A - - \- At \ V i
v - \ * vvC~"/
• y â **,•. ?
sw ƒ
X
/-ft if A .< "VIM* ;jjj0*\
S Fig. 2. Carbon filtration prevented injury to plant on right; left, a plant with injury grown for same time at Beltsville, Maryland, in ambient air.
332

Table 2. Injury to tobacco leaves by fumigation with dilute mixtures of ozone and sulfur dioxide (each value is the average of four experiments (total of 18 plants; 7 leaves per plant scored).
Durat ion of
fumigation in hours
2 2 2 4 4 4
Toxicant
in p.p.m. o , SO ,
0.03 -0.24
0.027 0.24 0.031 -
0.26 0.028 0.28
Number of damaged leaves
Bel-W3
0 0
38 0 0
75
From : Menser and Heggestad (1966).
Each value is the
Consolation Bel-B
0 0 0 0
37 25 0 0 0 0
76 48
Damaged leaf area in
Bel-W3
0 0
15 0 0
41
Consolation
0 0
12 0 0
43
average of 4 experiments (total of 18 p lants ; 7 leaves per plant scored).
/ o
Bel-B
0 0 9 0 0
23
sulfur dioxide (Table 2). It is possible for vegetation injury to develop when these pollutants are present at concentrations too low to produce injury as an individual pollutant. The injury on tobacco resembled that caused by ozone in early tests with a mixture of these pollutants. The significance of the discovery is that the concentration of ozone may be too low to cause plant injury, but if SO2 is present, also at sublethal level, the plant injury suggests presence of a toxic level of ozone in the atmosphere. In areas where sulfut dioxide is known to be present, the level of ozone required to cause injury will be reduced considerably.
Zusammenfassung Pflanzen als Indikatoren für die Luftverunreinigungen Ozon und Peroxyacetylnitrat
In Industriebezirken waren Schädigungssymptome and der Vegetation das erste Anzeichen für eine verunreinigte Atmosphäre. Besonders deutlich war das anfangs 1940 in Kalifornien, wo Schäden an der Blattunterseite von Blattgemüsen und Petunien die ersten Anzeichen für was heute als 'photochemische' oder 'oxidierende' Luftverunreinigung anerkannt wird. In den folgenden 20 Jahren konnte aufgrund Schädigungssymptome die Anwesenheit oxidierender Verunreinigungen in vielen Teilen der USA und in neuester Zeit auch in den Niederlanden nachgewiesen werden. Erst vor kurz wurde es klar, daß es sich dabei um Ozon und Peroxyacetylnitrat (PAN) handelt.
Der Nachweis dieser Verunreinigungen wird am ehesten durch kombinierte Anwendung geeigneter Pflanzen und analytischer Verfahren erreicht. Das Schadbild ist spezifisch und erlaubt einem geübten Beobachter den eindeutigen Nachweis der Verunreinigungen. Bei empfindlichen Pflanzen verursacht Ozon typische Flecken oder Pünktchen auf der Blattoberseite gerade ausgewachsener Blätter, PAN erzeugt einen silberigen, glasigen oder metallischen Glanz auf der Blattunterseite.
Tabak hat gezeigt eine brauchbare Indikatorpflanzen für Ozon zu sein, während Pinto-Bohnen gut brauchbar sind für PAN. Ozonempfindlich sind Spinat, Rettich, Tomate, weißblühende Petunien, Weymouthkiefer und Ponderosakiefer. Für PAN
333

empfindliche Arten sind römischer Kopfsalat, Kürbis, Spinat, Poa compressa und Petunie. Often sind es spezielle Varietäten die empfindlich sind. Als Ozon-Indikatoren werden die Tabak-Varietäten Bel-B (widerstandsfähig), Bel-C (empfindlich) und Bel-W3 (hochempfindlich) vorgeschlagen. Die allgemein angebaute Pinto-Varietät 'Certified 111' ist sowohl als Indikatorpflanze für Ozon als für PAN zu empfehlen. Die Tabakpflanze ist gegenüber PAN weniger empfindlich als die Pintobohne.
Rasch wachsende Pflanzen pflegen äußerst empfindlich zu sein. Hohe Boden- und Luftfeuchtigkeit, ausgewogene Ernährung und mäßige bis hohe Temperaturen begünstigen Schäden.
Die Information durch natürlich vorkommenden Pflanzen ist beschränkt weil sie nicht überall wachsen und schlechte Wachstumsbedingungen ihren Wert herabsetzen.
Die ausgesuchten Pflanzen werden in Töpfen gezogen und der Außenluft unter einheitlichen Bedingungen ausgesetzt, z.B. in besonderen Kammern.
Bei Verunreinigungs-Konzentrationen zu niedrig für die Auslösung sichtbarer Symptome, kann ein Vergleich des Wachstums empfindlicher Pflanzen in ungefilteter und mit Aktivkohle gefilteter Luft Auskunft geben. Dabei kann auch festgestellt werden, ob eine Schädigung eine Folge der Verunreinigungen oder auf andere Faktoren zurückzuführen ist.
Neuere Forschungsarbeiten haben gezeigt, daß Ozon und Schwefeldioxid synergetisch einwirken können. Die Schädigung ähnelt dann diejenige durch Ozon allein.
Résumé Les plantes comme indicateurs de pollutions atmosphériques avec l'ozone et le peroxy-acétyl nitrate
Ce sont les symptômes observés sur les végétaux dans les zones industrielles qui ont pour la première fois indiqué une atmosphère polluée. Ce phénomène s'est notamment vérifié au début des années '40 en Californie, où des dommages sur la surface inférieure des feuilles de légumes et de pétunias ont pour la première fois révélé la présence d'une pollution atmosphérique 'photochimique' ou 'oxydante'. Au cours des vingt années qui ont suivi, des symptômes de dégradation ont démontré la présence d'une telle pollution dans un grand nombre d'autres régions des États Unis et, plus récemment, aussi aux Pays-Bas. Ce n'est toutefois qu'au cours de la dernière décennie qu'il est apparu que les agents toxiques étaient l'ozone et le peroxyacétyl nitrate (PAN).
La meilleure façon d'identifier ces polluants est d'utiliser à la fois les plantes appropriées et les méthodes d'analyse. L'image de la lésion produite est caractéristique et permet à l'observateur entraîné d'identifier aisément les polluants. L'ozone se caractérise pai la petite tâche qu'il provoque sur la surface supérieure des feuilles des espèces sensibles lorsqu'elles viennent d'atteindre leur dimension maximum; le PAN se caractérise par une teinte argentée, vitreuse ou métallique sur la surface inférieure des plantes.
La réaction du tabac à l'ozone et celle du haricot pinto à PAN permettent de les utiliser avec profit comme plantes indicatrices. Parmi les autres végétaux sensibles à l'ozone sont l'épinard, le radis, la tomate, certaines pétunias à fleurs blanches, Pinus
334

strobus et P. ponderosa. Les plantes sensibles à PAN sont la laitue romaine, la bette poirée, l'épinard, Poa compressa et le pétunia. En outre, il y a des variétés d'une même espèce dont la sensibilité à un polluant diffère.
On propose corne indicateurs d'ozone les variétés de tabac suivantes : Bel-B (résistant), Bel-C (sensible) et Bel-W3 (hypersensible). 'Certified 111', variété couramment cultivée de haricot pinto, est recommandé comme indicateur tant de l'ozone que de PAN. Le tabac est moins sensible à PAN que le haricot pinto.
Les plantes à croissance rapide sont généralement les plus sensibles. Un sol très humide, une forte humidité atmosphérique, une nutrition équilibrée et une température modérée ou élevée favorisent la maladie.
L'observation des espèces indigènes a des limites dues à l'absence éventuelle d'espèces sensibles ou aux conditions peu favorables à leur croissance.
Les plantes sélectionnées ont été cultivées en pots et exposées à l'air ambiant dans des conditions uniformes dans des chambres spéciales.
Il arrive que les polluants se présentent sous forme de concentrations trop faibles pour provoquer des symptômes visibles. Une comparaison portant sur la croissance d'espèces non sensibles dans un air non filtré et dans un air activé filtré au charbon permet d'évaluer l'arrêt de la croissance et la sénescence prémature. De cette manière c'est aussi possible de déterminer si les dommages observés sont dus à d'autres facteurs.
Des recherches récentes ont montré que l'ozone et l'anhydride sulfureux agissent par synergie. Les dégâts rappellent ceux qui sont provoqués par l'ozone seul.
References
Darley, E. F. 1960. J. Air Pollut. Control Ass. 10: 198-9. Darley, E. F., C. W. Nichols and J. T. Middleton. 1966. Bull. Calif. Dep. Agric. 55: 11-9. Heck.W. W. 1966. Int. J. Air Wat. Pollut. 10:99-111. Heck, W' W., and J. A. Dunning. 1967. J. Air Pollut. Control Ass. 17: 112-4. Heck. W. W., F. L. Fox, C. S. Brandt and J. A. Dunning. 1968. Paper 68-192 presented at 61th
Annual Meeting of Air Pollution Control Association, St. Paul, Minn. Heggestad, H. E. and H. A. Menser. 1962. Phytopathology 52: 735 (Abst.). Heggestad, H. E.. F. R. Burleson, J. T. Middleton and E. F. Darley. 1964. Int. J. Air Wat. Pollut.
8: 1-10. Menser, H. A. and H. E. Heggestad. 1966. Science. N.Y. 153(3734)424-5. Middleton, J. T., J. B. Kendrick Jr. and H. W. Schwalm. 1950. Calif. Agric. 4(11) 7-10. Middleton, J. T. and A. O. Paulus. 1956. A.M.A. Archs ind. Hlth 14: 526-32. Tingey, D. and A. C. Hill. 1967. Utah Acad. Sei. 44 (Pt. 1).
335


Die Beeinflussung des Gesamtschwefelgehaltes von Fichtennadeln durch Düngung
K. Stefan
Institut für Forstschutz, Abteilung Forstchemie und Rauchschaden, Forstliche Bundesversuchanstalt, Wien.
Kurzfassung
Um den Einfluß einer gezielten Volldüngung auf den Schwefelgehalt der Nadeln, der u.a. für die Diagnose chronischer Rauchschadensfälle verwendet wird, festzustellen, wurden einjährige Nadeln vom dritten Ouirl von gedüngten und ungedüngten Parzellen von sechs Fichtendüngungsversuchs-flächen in fünf aufeinanderfolgenden Jahren untersucht.
Auf allen Versuchsflächen wirkte sich eine zweimalige Düngung in einer Senkung des Gesamtschwefelgehaltes aus; das Resultat war jedoch verschieden, was standortsbeeinflußt gewesen sein dürfte.
In Schwefeldioxyd-Rauchschadensfällen am Wald wird von der Forstlichen Bundesversuchsanstalt in Wien neben anderen Methoden auch die Bestimmung des Schadstoffes in den Nadeln für Diagnosezwecke verwendet, obwohl eine Reihe von Autoren hinsichtlich ihrer Bedeutung Bedenken äußerte, weil durch Umweltseinflüsse und den Zeitpunkt der Probenahme auch ohne Immissionseinwirkungen Unterschiede im Schwefelgehalt auftreten könnten.
Um tue Immissionsdiagnose mit Hilfe der Nadelanalyse präziser erstellen zu können, wurde daher vorerst an Nadelmaterial, das auf den Nullparzellen von sechs Düngungsversuchsflächen gewonnen worden war, untersucht, in welchem Bereich der natürliche Gesamtschwefelgehalt von einjährigen Fichtennadeln bei der verwendeten Analysenmethode liegt, ob er sich von Jahr zu Jahr ändert, in welchem Ausmaß der Schwefelgehalt von Einzelbäumen schwankt, welche Differenzen zwischen den Einzelbäumen auf einer Fläche auftreten und ob der Schwefelgehalt durch den Standort wesentlich beeinflußt wird.
Der vorliegende Beitrag befaßt sich mit einem weiteren Einwand gegen die Anwendung der Nadelanalyse, daß nämlich der Schwefelgehalt der Nadeln durch die Verwendung von Sulfatdüngern erhöht wird, während gleichzeitig eine Verbesserung der Widerstandsfähigkeit gegenüber Schwefeldioxyd festzustellen ist.
Von den sechs Flächen befanden sich zwei in der Steiermark, zwei in Tirol und zwei in Oberösterreich. Bis auf eine Fläche in Tirol, wo zeitweilig Immissionen durch ein Zementwerk auftraten, lagen die Flächen in immissionsfreien Gebieten.
Auf den Versuchsflächen, die mit dreifacher Wiederholung angelegt worden waren, erfolgte die Festlegung der Probebäume in der Weise, daß von einem in die Teilflächen eingemessenen Raster zwei Punkte je Teilfläche ausgelost wurden, in deren unmittel-
337

barer Umgebung die zwei Bäume für die Probenahme ausgewählt wurden. Die Proben wurden seit 1962 jährlich im Oktober vom dritten Quirl entnommen und ein-zelstammweise untersucht. Die Nadeln wurden unter Zusatz von Kalziumazetat verascht und der Schwefelgehalt gravimetrisch als Bariumsulfat ermittelt. Über die Grenzen, die dieser Methode gesetzt sind, wurde von Buck (Landw. Forsch. 1962 (15) 135-45) berichtet.
Im Frühjahr 1963 erfolgte auf den sechs Flächen eine Düngung, wobei die Düngergaben auf Grund von Boden- und Nadelanalysen bemessen worden waren. Im Frühjahr 1965 wurde die Stickstoffdüngung wiederholt.
Bei der gezielten Düngung erfolgte auf allen Flächen eine Sulfatzufuhr in Form von Patentkali. Auf der Fläche 11 erfolgte eine weitere Schwefelzufuhr durch die Anwendung von Superphosphat und Ammonsulfat. Bei der Stickstoffdüngung im Jahre 1965 wurde nur auf der Fläche 11 ein Sulfatdünger verwendet.
In der Abbildung ist die Absenkung des Schwefelgehaltes der gedüngten Proben gegenüber den Nullproben unter Berücksichtigung der 1962 bestehenden Differenzen dargestellt. Nach der Düngung trat der stärkste Abfall des Schwefelgehaltes auf den gedüngten Parzellen der Flächen 12 und 16 auf, wo nur 300 kg Patentkali pro Hektar zur Anwendung gelangt waren. Auf der Fläche 11, wo 600 kg Patentkali, 900 kg Ammonsulfat und 700 kg Superphosphat pro Hektar gedüngt worden waren, trat die geringste Abnahme auf. Die Abnahme auf Fläche 15 entspricht 23 Prozent des Nullwertes, auf den Flächen 12 und 16, 30 beziehungsweise 33 Prozent. Die Abnahme auf den
I Düngung Düngung
Durch Düngung erfolgte Abnahme des Schwefelgehaltes in einjährigen Fichtennadeln.
338

restlichen drei Flächen betrug 11 Prozent des Nullwertes. Im darauffolgenden Jahr verringerte sich der Unterschied zwischen den gedüngten
und ungedüngten Teilflächen mit einer Ausnahme wieder. Die auf der Fläche 13 auftretende Differenz erhöhte sich von 11 auf 15 Prozent des Nullwertes.
Nach der zweiten Düngung trat auf allen Flächen wieder eine Absenkung auf, die zwischen 10 und 36 Prozent des Nullwertes lag. Die geringere Abnahme auf der Fläche 16 könnte auf Immissionen der bereits erwähnten Zementfabrik beruhen. Auf der Fläche 15 war die aufgewendete Stickstoffmenge geringer als auf den übrigen Flächen. Auch auf der Fläche 11 trat diesmal ein stärkerer Abfall im Schwefelgehalt ein, obwohl wiederum Ammonsulfat zur Anwendung gelangte.
Auf allen sechs Versuchsflächen wirkte sich somit die zweimalige Düngung in einer Senkung des Gesamtschwefelgehaltes aus. Der Verlauf der Absenkung war jedoch auf den einzelnen Flächen verschieden und dürfte standortsbeeinflußt sein. Bei drei Flächen (10, 11, 12) sank der Schwefelgehalt nach den Düngungen, um im darauffolgenden Jahr wieder anzusteigen. Bei zwei Flächen (15, 16) - wovon die Fläche 16 in der Nähe der Zementfabrik lag - trat nur nach dem ersten Düngungseffekt ein Anstieg auf, während der Schwefelgehalt der gedüngten Proben von Fläche 13 ständig sank.
Selbst durch die ausschließliche Verwendung von Sulfatdüngern wie auf der Fläche 11 konnte an den Mittelwerten keine Erhöhung des Schwefelgehaltes in den Nadeln festgestellt werden. Die positive Wirkung der Düngung in Rauchschadensfällen dürfte auf Grund der mitgeteilten Ergebnisse somit zum Teil auch durch einen Verdün-nungseflekt, der den Schwefelgehalt unter den normalen absinken läßt, bewirkt werden.
Summary The influence of fertilization on the total sulphur content of spruce needles
DuriiTg five successive years samples from fertilized and unfertilized parcels in six experimental plots were analysed to establish the influence of systematically applied complete fertilization on the sulphur content of spruce needles. Six plots were established, on different sites.
Each year, in October, the one year old needles were gathered from the third whorl and from the same quadrant. The samples from each tree were separately analysed. The total sulphur content in the needles was determined according to the method of König.
The result of the fertilization, which had been applied twice, was a lowering of the total sulphur percentage in the dry weight. The course of the total sulphur content, however, was not identical on the various plots. This might have been caused by differences in the other ecological circumstances.
Resume L'influence de la fertilisation sur la teneur totale en soufre des aiguilles de sapin
Afin d'établir l'influence de l'application d'une fertilisation complète sur la teneur en soufre des aiguilles, des échantillons provenant de parcelles fertilisées et non fertili-
339

sées dans des plantations expérimentales situées sur des endroits différents en Autriche ont été analysées pendant cinq années consécutives.
Chaque année, en octobre, les aiguilles d'un an ont été recauillies au niveau de la troisième verticelle et du même quadrant. Les échantillons de chaque arbre ont été conservés et analysés séparément. La teneur totale en soufre a été déterminée suivant la méthode de König.
La fertilisation a été appliquée deux fois. Le résultat était un abaissement de la teneur totale en soufre au poids sec. Toutefois le cours de la teneur n'était pas identique pour les différentes plantations et peut être influencée par les autres circonstances écologiques.
340

Sulphate contents of tree leaves as an indicator of S0 2 air pollution in industrial areas
D. Lihnell
National Institute for Plant Protection, Solna 7, Sweden
Abstract
Sulphate was estimated in leaf samples (mainly from birch) by turbidometrical measurement of the density of precipitated barium sulphate to map SOs pollution around SOs emitting industries in Sweden. Diagrams based on 'sulphate values' obtained in one of the areas indicate the pollution at different distances from its source, its connection with wind condition, variation from year to year, the influence of changes in the industrial activity and the interaction between several associated sources of pollution.
Analysis of birch and apple leaves, and spruce needles on the whole gave results in accord. The sulphate diagrams from birch leaves and the diagrams on growth reduction in conifers are similar in form. Altogether the results support the assumption that, at least under certain conditions, sulphate analysis in tree leaves gives a reliable picture of SO. pollution.
This paper is not so much the result of systematic research as a report of practical experience over almost twenty years. Most of this experience is acquired in the strongly S02-polluted area around the shale-oil works at Kvarntorp in Sweden, about 150 km west of Stockholm.
The'oil works were built in 1942 for production of petrol from the large deposits of bituminous shale which occur in these parts of the country. The activity stopped in 1966. The petrol was obtained by means of pyrolysis of the shale and during that process considerable amounts of sulphur, mainly in the form of sulphur dioxide, were released into the atmosphere through two stacks about 100 m high. The total amounts of sulphur emitted in this way rose successively to 120 metric tons in 24 hours or 240 tons of sulphur dioxide. Unmeasured amounts of sulphur dioxide were also emitted from the rapidly growing tip of ashes and shale coke close to the oil works.
The oil works were not the only source of air pollution in the area. Two or three kilometres south-west of Kvarntorp some limestone quarries and lime works, as well as a plant for manufacturing porous concrete, al! emitt sulphur dioxide, but the amounts were, even counted together, not comparable to those from Kvarntorp but undoubtedly of local significance interacting with the Kvarntorp emissions.
The Kvarntorp area is a plain with good agricultural land interspersed with productive coniferous or mixed forests.
From the start of the oil works severe damage to wild and cultivated vegetation had been caused by the sulphur dioxide. The sometimes rather intricate phytopathological problems ensuing gave grounds for a general survey of the air pollution in the differ-
341

KVARNTORP 1949
Km 10 5 5 10 15 20Km Fig. 1. Diagrams indicating variation in sulphate content of birch leaves SW.-NE., NW.-SE. and
N.-S from factory K (Es = colorimeter reading x 100) in July (broken line) and September (solid
line). Black triangles indicate position of other industries.
10 Km
Fig. 2. Comparison between highest sulphate values found in NE., and the data for SW. (thin line) from Figure 1.
NW., SE., N. and S. (fat line)
ent parts of the area to be used as a background for specific decisions. Therefore, in 1948, a series of sulphate analyses of leaf extracts started to find out if the wanted information could be obtained in that way. A simple and rapid method of analysis based on turbidometric determination of the precipitated sulphate was tested. It was not a very accurate method but exact enough for the purpose.
The first series of analyses in 1948 gave such encouraging results that further series were carried out in 1949 and then, in 1953, 1954, 1960 and 1967. With the exception of 1967, two series of leaf samples were collected each year, one at the end of June or beginning of July, the other early in September. Birch was always tested; in the first two years apple was also analysed. Samples were collected from about 100 fixed sites in each series and from two trees at each site.
For the presentation of the results of the sulphate analysis the area under investigation was divided into 6 sectors with the oil works in the centre. These sectors were
342

used as entities when drawing up diagrams of various kinds, as will be seen in the fol-iowing.
The vertical diagrams from September 1949 (Fig. 1) show the variation in sulphate contents in relation to the distance from Kvarntorp. The graphs are drawn as if all sampling stations were situated along the median line of the corresponding sector. The relative sulphate contents are given as colorimeter readings multiplied by 100.
As could be expected, the highest values in the July series as well as in the September series are found near the oil works while from there the graphs descend irregularly.
Sulphate determinations in clean areas have mostly shown values between zero and 10. In the Kvarntorp area, therefore, values of 10 are taken as a practical outer limit of the polluted area. This limit is reached at different distances from Kvarntorp in different sectors; this will be more clearly demonstrated in some of the following 'horizontal' diagrams or 'maps'
The south-western sector differs markedly from all others in the very irregular course of the graphs. Obviously this is due to the other air-polluting industries mentioned. Their position is incidated by the black triangles on the horizontal axis of the diagram.
In Figure 2, based on the south-western part of Figure 1, the fat line represents for each distance the highest sulphate value found in any of the other five sectors while the thin line shows the corresponding values of the south-western sector. The hatched area indicates that part of the total air pollution which could be imputed to the minor industries. Such an 'excess' air pollution in the vicinity of the minor industries appeared in all series.
Maps of the type shown in Figure 3. have been derived from vertical diagrams as that in Figure I. On such sulphate maps the solid lines are isarithms, or contours of sulpha-
KVARNTORP Sept. 1949
Fig. 3. Sulphate contents of birch leaves presented as isarithms (concentration contours) around factory K. for September 1949. Dotted line: inverted wind diagram.
343

KVARNTORP 1953
10 5
Fig. 4. As Figure 1 but for 1953
20 Km
KVARNTORP 1954
Fig. 5.
344
| • I • i 1 | r i i i
10 5
As Figure 1 but for 1954.
20Km

te concentration. From one isarithm to the next there is a difference in sulphate value of 10.
All together the isarithms gave a picture of the variation in the sulphate content of the birch leaves which is supposed to be also a picture of the 'accumulated' air pollution in the area at the time the leaves were collected. Due to the method of construction this picture is admittedly simplified and somewhat distorted but, in my opinion, broadly correct. The dotted line in figure 3 represents the inverted wind diagram of the growing season, showing the relative frequency of winds blowing not from but to a certain quarter. The similarity in shape of this diagram and the sulphate isarithms is obvious and supports the correctness of the map as to the configuration of the polluted area.
In the period 1949-53 part of the oil plant was rebuilt and its oil-producing capacity considerably increased. The sulphur emissions increased in the same proportion, as the diagrams from 1953 in Figure 4 indicate. The graphs have risen since 1949 and the sulphate values are much higher in the centre of the area. This trend was still more pronounced in 1954 (Fig. 5), when the changes in the oil-production process had taken full effect. The top values are now about 190, against 100-110 in 1949, and values of 10 or less are not found anywhere in the investigated area.
In Figures 6 and 7 from the same years the increase of sulphur emission manifests itself in an increased number of densly lying isarithms in the centre and a moving of the 10-isarithm further away from the source of pollution. As to the general shape of the polluted area and its agreement with the wind diagrams the Figures are only variations on the theme of Figure 3.
From 1954 on, more attention was paid by the oil works to the control of sulphur emissions and especially the huge ashtip was better controlled by sprinkling and covering with non-combustible material. In that way the situation gradually improved and in 1960 the top values were considerably lower than in 1949 (Fig. 8). It is remarkable that the graphs go down more slowly at the edges and never reach such low values as in 1949. This may be due to the fact that much of the forests near the oil works, formerly serving as shelterbelts, were killed by the sulphur dioxide or cleared to give space for the expanding shale mining. The same is obvious from Figure 9 (1960): the isarithms are fewer in number and wider apart, but the outer limit of the polluted area is still as far away from the source as before and the total polluted area remains the same.
In 1967 (Fig. 10), one year after oil production stopped, no sulphur was emitted through the stacks but there remained some air pollution originating from the ashtip at Kvarntorp, again burning and emitting clouds of sulphur dioxide. The sulphate values were lower than in 1960; the graphs are receding and in some sectors nearly touch zero not far from Kvarntorp. In the south-western sector the industrial activity was the same as before.
The corresponding 'map' in Figure 11 shows something new: the polluted area is much reduced and it has taken a peculiar pearshaped form. Without information about the local wind conditions that year it is hard to say to what extent this form is a result of the winds during the growing season. It may be important, however, that
345

KVARNTORP Sept. 1953
Ù 5 lOKm
Fig. 6. As Figure 3 but for September 1953.
KVARNTORP ,, Sept. 1954 /
0 5 10Km
Fig. 7. As Figure 3 but for September 1954.
the sulphur dioxide emitted from the ashtip moves mainly near the ground and cannot penetrate very tar into the surrounding forest. The eastern and northern parts of the 'pear', therefore, are in broad outline similar in form to that of the open, unwooded area immediately around the oil works. As soon as the tip has ceased burning the polluted area will probably be reduced to mainly a small ellipse around the still active industries in the south-western sector.
As already mentioned, during 1948-49 parallel series of apple leaves and birch
346

KVARNTORP 1960
10 Km T
Fig. 8. As Figure 1 but for the year 1960.
15 Km
KVARNTORP Sept. 1960
Ó 5 10Km
Fig. 9. As Figure 3 but for September 1960.
leaves were analysed. The results were not fully identical but they differed very little in the main features and from a practical point of view either species could have been used. As birch is more regularly available later analyses were on birch only. The analysis of spruce needles (Pettersson & Lönn, 1951) gave results very similar to those of birch (Fig. 12). It thus seems as if the species was not decisive as an index of air pollution.
It is important to remember that the information obtained from the sulphate ana-
347

KVARNTORP 1967
Km 10 5
Fig. 10. As Figure 1 but for September 1967
20 Km
KVARNTORP Sept. 1967,
f 5 10Km
Fig. 11. As Figure 3 but for September 1967.
lyses refers only to air pollution, not to plant damage. But a high correlation between air pollution and plant damage may be expected. Figure 13 (September 1948) may serve as an illustration: all verified cases of acute smoke damage in horticultural and agricultural plants this year (black dots) were found within the sulphate isarithm 50 and all known or supposed cases of chronic damage (circles) were well inside the sulphate isarithm 30.
The sulphate diagrams and the diagrams representing the reduction in growth of forest trees in the Kvarntorp area are also strikingly similar. Figure 14, derived from data of the Forestry Research Institute, (Östlin, 1958) show the percentage growth reduction in the period 1954-58 in the various zones. The broken lines represent the sulphate isarithms 50 and 10, respectively, from the 1953 analysis of birch leaves.
Lichens react in a similar manner as birches. This is demonstrated in Figure 15 for Xanthoria parietina in the Kvarntorp area. The open circles, indicating absence of the lichen, as well as the crossed circles, indicating that the lichen is present but damaged (data from Skye, 1958), are well within the sulphate isarithm 50 from birch 1953.
348

10 Km
Fig. 12. As Figure 3 but for spruce from November 1950 to February 1951 (from Pettersson and Lönn. 1951).
KVARNTORR^ 1948 ' ^
+ N
• H ~ ^ T~ 10
Fig. 13. Plant damage in relation to intensity of Fig. 14. Lines of equal growth reduction (%) in air pollution; otherwise as Figure 3 but for 1948; conifers around factory K. for 1958 (from östlin, black dots: aucte smoke damage, circles: chronic 1959). Broken lines: isarithms of sulphate values damage in horticultural and agricultural plants. 50 and 110, respectively, for birch 1953.
349

10 Km
Fig. 15. The influence of air pollution on the presence (black dots) and absence (open circles) of Xanthoria parietina; crossed circles: lichen present but damaged (data from Skye, 1958. Broken line: isarithm of sulphate value 50 for birch, 1953.
A good agreement can also be demonstrated between the shape of the zones of different intensity of metal corrosion in the area and the shape of the air-pollution zones derived from the sulphate contents in birch leaves.
In conclusion there is good circumstantial evidence that sulphate analysis gives a generally correct and reliable representation of the SOo-pollution in the Kvarntorp area. It may be that conditions there have been exceptionally favourable in this respect, and that the method is not applicable in every SO2 polluted area. But it may be added that the same method of analysis has also been tried out in some other areas with good results, in one area series of analyses have been carried out annually for seven consecutive years. In these other areas there was no opportunity to check the results against those of other investigators but the sulphate contents of the birch leaves varied in the expected way with the distance to the pollution source, with prevailing winds and with other local circumstances.
Résumé La teneur en sulfate des feuilles d'arbres comme indicateur de la pollution atmosphérique par SO2 des zones industrielles
L'accumulation de sulfate dans les feuilles exposées à SO2 en concentrations sublétales peut être réputée en gros proportionnelle aux quantités de SO2 absorbées par la plante ou, en d'autres termes, au degré de pollution atmosphérique par SO2. En conséquence, on peut déterminer le degré de pollution atmosphérique par la teneur en sulfate des feuilles d'arbres.
Au cours de l'étude en Suède aux zones polluées au voisinage de quelques importantes usines dégageant du SO2, la détermination du taux de sulfate dans les échantillons de feuilles, principalement de bouleaux, ont servi pour dresser la carte de la pollution par SO2. Le sulfate fur déterminé par une méthode simple et rapide: mensuration par turbi-dimétrie de la densité du précipité de sulfate de barium. Cette méthode ne donne que
350
des valeurs approximatives mais elles sont suffisemment exacte pour le but recherché. De la plupart des points répartis sur la zone étudiée deux échantillons ont été ana
lysés chaque année pendant la période de végétation. Les diagrammes démontrent la dépendance de la pollution de la distance de la source de pollution, son rapport avec la direction des vents, les fluctuations d'une année à l'autre et l'influence des changements dans l'activité industrielle. On a également pu démontrer l'association de plusieurs sources de pollution situées à peu de distance les unes des autres.
Des séries parallèles d'analyses de feuilles de bouleaux, de pommiers et des aiguilles de sapins ont donné des résultats comparables qui semblent indiquer que l'espèce botanique ne joue pas une rôle décisif dans la méthode dévelopée ici.
Les diagrammes du sulfate et ceux fondés sur la reduction de la croissance des arbres conifères, ainsi que sur une étude de la corrosion des métaux, sont également concordants, ce qui renforce encore l'hypothèse selon laquelle, tout au moins dans certaines conditions, l'analyse du sulfate contenue dans les feuilles donne une image fidèle de la pollution par SO2.
Zusammenfassung Der Sulfatgehalt von Baumblättern als Indikator für Luftverunreinigung durch SO2 in Industriegebieten
Mann kann annehmen, daß die Anreicherung von Sulfaten in Blättern die subletalen Konzentrationen von SO2 ausgesetzt sind, ungefähr der S02-Menge die von der Pflanze aufgenommen wird und den Grad der Luftverunreinigung proportional ist. Dementsprechend ist der Sulfatgehalt der Blätter ein Indikator für den Grad der Luftverunreinigung.
In den Untersuchungen über die Luftverunreinigung in der Umgebung einiger SO2-Großsemittenten in Schweden wurde für die Bestimmung des Sulfatspiegels in Blattproben zur Kartierung der S02-Belastung hauptsächlich die Birke angewandt. Für die Analysen wurde eine einfache und schnelle Methode entwickelt die sich der Trübungsmessung von gefälltem Bariumsulfat bedient. Dieses Verfahren ergibt nur Näherungswerte, ist aber hier hinreichend genau.
Von den meisten Punkten im Untersuchungsgebiet wurden zweimal in der Vegetationsperiode Blattproben entnommen. Die Diagramme mit den 'Sulfat-Werten' zeigen die Abhängigkeit der SCh-Belastung von der Entfernung der Emittenten, den Zusam menhang mit den Windverhältnissen, die Schwankungen von Jahr zu Jahr und den Einfluß von Änderungen in der industriellen Produktivität. Auch war es möglich, den kombinierten Einfluß mehrerer nicht weit von einander entfernten Quellen nachzuweisen.
Paralleluntersuchungen des Sulfatgehaltes von Birken- und Apfelblättern sowie von Fichtennadeln ergaben gut übereinstimmende Resultate, was bedeutet, daß die Pflanzenart nicht von ausschlaggebender Bedeutung ist bei der Kartierung der SCh-Belas-tung.
Diagramme der Sulfatwerte und die der Zuwachshemmung von Nadelbäumen sowie die einer Untersuchung der Korrosion bei Metallen wiesen parallele Resultate
351

auf. Das unterstützt die Ansicht daß, zumindest unter gewissen Bedingungen, Sulfatanalysen von Baumblättern ein zuverlässiges Bild der Luftverunreinigung durch S02
geben.
Literatur
Pettersson, J. & E. Löhn, 1951. Sulfatanalyser pâ granbarr i Kvarntorpsomrâdet (Sulphate analyses of spruce needles in the Kvarntorp area). Stencil.
Skye, E.. 1958. Luftfororeningarnas inverkan pâ busk- och bladlavfloran kring skiffereol.ieveiket i Nerikes Kvarntorp (The influence of air pollution on the fruticolous and foliaceous lichen flora around the shale-oil works at Kvarntorp in the province of Nerike; Summary, p. 170). Sv. bot. Tidskr. 52:133-190.
Östlin, E., 1959. Redogörelse för undersökning av skador pâ skogen i Kvarntorp, Örebro län, enligt verkställd omtaxering âr 1958 (Report on an investigation of damage to forest trees at Kvarntorp, Orebro county, according to assessment in 1958). Stencil.
352

Discussion in Section 8: Measuring air pollution in non-vascular plants
Reporter: A. van Raay
Participants: Lihnell (Chairman), Bossavy, Darley, Knabe, Lebbe, Wassink.
On a question concerning the diagrams in the contribution of Van Raay it was pointed out that the Dutch investigations on gladioli as indicator plants for HF versus the paper analysis method were only in their beginning and that another two to three years' experience were necessary before a final conclusion could be drawn.
While on deciduous trees symptoms caused by PAN are found on the lower side of the leaf, those due to ozone are present on the upper side. It is hard to say, beforehand, how the needles of e.g. Pinus ponderosa, with no clear difference between upper end lower side, would react to PAN. So far, only damage caused by ozone has been observed on pine : speckles occur at any surface of the needles where stomata are present.
On plants sensitive to smog, such as tobacco, differences in sensitivity between leaves of various ages are observed. This means that, when a plant has been exposed to a high concentration of smog, the most sensitive leaves are damaged or killed and the less sensitive remain so that the plant as a whole has lost much of its ability to serve as an indicator plant. This can be overcome by a regular exchange of indicator plants, e.g. each day or each week.
The 'difficult problem of how to dosage ozone and SO2 simultaneously is described by Heggestad (Science, 1966, 153:424-5). According to earlier work in California there is no reaction between both.
During burning of wood and agricultural waste, the same types of hydrocarbons are set free as in the use of petrol for automobiles, but, when calculated on the same weight, petrol produces 10 times as much as wood. Actually (in view of the great number of automobiles) the ratio in California is 360:1. In this region all kinds of air pollution sources are now under control and burning of agricultural waste is now permitted only on days without temperature inversions or strongly turbulent air.
The role of the often very extensive accidental forest fires in air pollution has not yet been investigated, but intentional forest fires will now be studied from an air pollution point of view.
353

Section 9 : Resistance of plants to air pollution


Empfindlichkeit und Resistenzunterschiede der Pflanzen gegenüber Luftverunreinigung
K. F. Wentzel
Hessisches Ministerium für Landwirtschaft und Forsten, Wiesbaden, Deutschland
Kurzfassung
Für SO. nahm man bis 1940 die Durchschnittskonzentration in der Luft, die über eine lange Zeitdauer gemessen als Konzentrationsschwelle für den Beginn der Schädlichkeit auf Pflanzen angesehen werden kann, mit 2 p.p.m. an. Bei Freilandversuchen in verschiedenen Schadgebieten wurde jüngst erkannt, daß diese bei ungefähr 0,02 p.p.m. liegt, für HF sogar noch erheblich tiefer. Besser zur Charakterisierung eines Luftverunreinigungsgrades als die Durchschnittskonzentration ist aber die Angabe der Überschreitungsdauer und -häufigkeit bestimmter kritischer Konzentrationsschwellen.
Die Resistenz der Pflanzen variiert mit Immissionstyp, Wuchsbedingungen, Pflanzenentwicklungsphase und Exposition.
Es muß unterschieden werden zwischen 'experimenteller Resistenz' (nach Blattempfindlichkeit gemessen) und 'Freilandresistenz' (nach Ausharrevermögen oder Ertrag). Eine allgemein gültige Folge der Pflanzen kann nicht aufgestellt werden; für ihre Einstufung in drei Gruppen wird ein Schema gegeben. Die allgemeine Gefährdung der Bodenbenutzung steigt in der Folge: Landwirtschaftlicher Pflanzenbau - Laubwald - Garten- und Obstbau - Feldfutterbau - Zierpflanzenbau -Nadelwald.
Die Erforschung der Empfindlichkeit der Pflanzen gegen Luftverunreinigung und ihrer Resistenzunterschiede unter verschiedenartiger Einwirkung von unterschiedlichen Immissionstypen hat erkennen lassen, daß diese Materie zu den kompliziertesten Problemen der Biologie zählt. Nichtsdestoweniger aber ist die Illusion weit verbreitet, sie leichthin und einfach beurteilen zu können. Millionen Menschen leben in den luftverunreinigten Ballungsräumen. Sie können beobachten, ob ihre Blumen, Gemüsepflanzen, Obstbäume oder Koniferen in den Vorgärten gedeihen, erkranken oder gar sterben. Viele Leute glauben danach, etwas über die Pflanzenresistenz gegen Abgase und Staub zu wissen. Aber sie wissen nichts, da sie keine Vorstellung von dem tatsächlichen Charakter der Immission haben, die konkreten Beziehungen nicht kennen und die vielfältigen Zusammenhänge nicht durchschauen.
Illusionen machen sich jedoch nicht nur Laien. Illusionen machen sich auch manche verdiente Spezialisten unter den Immissionsforschern. Es dürfte zweckmäßig sein, hiervon auszugehen.
357

i »u- i ; , ; : ; r ; - -• t : ; ' . ;v; i : , : , - k i ' i , . . : -J- . i . i< j ! i •':• a r . . -•• / ;:!•;•.•!;--.< <•_ k : K : , M k .-. •.'.:.•>. i i - . - H».-.:-
-,', : i / i ï : i ; ' - . ! .-.':.• ;.-:: :.'vj: 1 ' i ' ü ' / t i " - - - i ! / i : : ; : : i - . ; >-iU !i .'." . / s . ( : •';;•••.-! . h .•: - . I - ' . ; ! >ï:v i i i i - . i i j i
• . ' - i V : • ! • : ; • ! • • . . ; ••• ' : - . -• , . - . ' - : i - i " *-_". i . . ^ . i i d i i i ï ; \ ï ; v n . ' \ - V - . .;• :'.'i ;•.';• n - k . -„:>, .:*--•: î ïi-. -' =
•J .:!• '.• •: - : : : : : i . ' : . : . - . ' ; !'. i ' M . i i K : ' . ' \ ; , - ' , . - - ; i ' : f ! . i -•--; = - i l iC .'.!•- ! ! ' : . ' i ' i - " ; . : , - . . ; : i-:n Ü , r ;? ;; - ; . ta : •
•"-..'; »: '..-,. i : i - i - . ' . >: V i ! . , il;.- -M i - i r,]--, t i ; f!--.. -. ••,•:' Ï ! ,A---. I-.. ••;,- - • ; ' ' - i ; • : . . ' - i <~,<J': c v - u - ' . l
iV* :••:[•••:. ; ' » . - ; i
1 * .-". ; : . . !'..h i \ . •. • ; - . , • : ! ; ; • , . - ' i l - , ' ! . . :'..i : ' : i f..!-- _!:? ; : i i U' ! ' - ) : / : . i ' / " - J r. U:'.. i. H.-'i i k I ; U'ifil.-
: / ' . - • - . ' .• ' . ' .••• i r . ,ï :-i-t ;.-=,!v :.= !•, k e v - u ; i . ',.••;. r - . cn^ J I - j - u i v . i v ; ; v ' - ' : Ü U ; Â ' . - I I . - . ' . : , : ,
! '- '•. j - - .rü.1 . v - -c i , - . ' ! , - . .J ! f••-.:;.!"• , - : - . ; ; Ü . : i i ; , ^ i ! ! K ; ! " : :•( . ! » -m S J - i , ! ' , . . ü ü . î ' ^ ' . ^ ! . \ - . i -
: ' - : ; t , ; : - l i l •.•--•.'•. ' ; ';;-•>.;-- : - ; :• ' , ; . ! : ! . ' . ! u : ; ' • , ; ; • k i ^ - i : M : .k , .= • : ~ : ; : i . . •••..•• . . ! •.)!•.. i =•_!>';• C H K ;
- Iv i •-. : i '5.: . ! i : i : i i c ï . •-•-!. ; , ; . - ï ! - ! i ' j i '.ü:-.i i i ' ! ' . ! < • ; • : i : i . ; - : : : ' ' i - ! ; ! ' ! - . - l ; ..•','•. A i> \ '_; . , ; ! . a ; ] . - ; ; :
! : ; ! " i - i ••! • .1 '•-!>.'!; •!!•-. i'>;..::-.-«i!»:_,-.i-S; • •:>•_•;..: - i i i u i i - . . ' i iMi î, I - --- ; i : >! := - •_ . 1 :'•• . " i ' • . ; , , -.-•
i.•=.-!'• : . ! M i ! = / l i ; - . i ' . : : ! hr'.v. M i i i - i ::->->i! i-'i! •:!-•-.•;: : . ; •"•-- .= .'-.•;. - . . / . M : , . ;•.. M j - o= . - i ; - •
] ' ; • i~ i - ; i :H:y : n - i n , . ; - u ; ;:' __ii!i;«.u; i..i v u - , i u I k r - i i / . ; . ' I , . ••:•._• -•••:•'• •-.- •• i ; K .• I'._.-.!*..;, h= !:
'•-.' , ' ^ . ;=v; i - . - . i ' ..> .a-i ' . i ! ! ' . i f . . i ! k - : : ; . - : i : , ; a i v . i ; : i - - J i ' •; >.[.
a ^ Ä & f c „

Die rauchhärtesten Exemplare halten nach den Erfahrungen im Freiland (Wentzel, 1963) bis zu 20 Jahre länger aus als die gewöhnliche Population und bleiben dabei zuwachskräftig. Man sollte jedoch nicht übersehen, daß es trotz Selektion Nadelbäume mit geringem Regenerationsvermögen bleiben. Deshalb ist es ausgeschlossen, daß sie das Ausharrvermögen der Laubbäume im Freiland erreichen können. Selbst wenn die Züchtungsarbeiten erheblich intensiviert würden, dürften Jahrzehnte vergehen, bis fühlbare Hilfe erwartet werden kann. Es ist eine Illusion, in nächster Zeit von der Züchtung eine wesentliche Entlastung der Forstwirtschaft anzunehmen. Näheres zu diesem Thema ist einem Vortrag auf der 1U FRO-Tagung 1967 in München zu entnehmen (Wentzel, 1967a).
Unser Wissen über die Empfindlichkeitsgrenzen
Eine besonders aktuelle Illusion betrifft die Schwellenwerte der Pflanzenempfindlichkeit. Die Forschungsmethoden haben sich während des Jahrhunderts zwischen 1868, als Stöckhardt (1870) seine ersten Begasungsversuche unternahm, und heute gewaltig verbessert. Wie die erste Flugmaschine der Gebrüder Wright von den modernen Düsenclippern, so unterscheiden sich die Laborausstattungen des alten Institutes für Pflanzenchemie der Forstlichen Hochschule Tharandt und der heutigen Im-missionsforschungs-Institute. Sämtliche Begasungsexperimente mit SO2 der letzten drei Jahrzehnte seit Katz (1949), ob in der neuen oder der alten Welt, stellten die Empfindlichkeit der sensibelsten Testpflanzen gegenüber SO2 übereinstimmend auf etwa 0,2 p.p.m. fest. Das ist genau eine Zehnerpotenz tiefer als die frühen Forscher bis Wislicenus (1914) zwischen 1870 und 1920 gefunden hatten.
Wer einmal unzweifelhaft tödliche S02-Einwirkungen auf 20 und 30 km Entfernung von den Abgasquellen z.B. in den Erzgebirgswäldern gesehen hat, wer die Ausdehnung der Nadelwaldschäden durch Abgase im Ruhrrevier oder im Raum Bitterfeld/ Dessau immissionsökologisch und ertragskundlich abzugrenzen versuchte, der hat immer an diesen Daten aus Begasungstesten gezweifelt. In diesen Tagen sind nun die Ergebnisse der Biersdorfer Freilandversuche in eine:' dritten Veröffentlichung von Guderian and Stratmann (1968) vorgelegt worden.
Als oberer Grenzwert für SO-2-Konzentrationen, die nicht nur Erkrankung, sondern schon Schäden verursachen, wurden im arithmetischen Mittelwert der Meßdauer 0,02 p.p.m. gefunden. Diese Durchschnittskonzentration bewirkte erfaßbare Schäden an Stachelbeere {Ribes uva-crispa), Stieleiche (Quercus robur), Rotbuche {Fagus sylva-tica), Fichte (Picea abies), Kiefer (Piniis sylvestris) und Spinat (Spinaceae oleracea). Sie liegt also um eine weitere Zehnerpotenz tiefer, als bisher angenommen wurde.
Vergleichbare Ergebnisse fanden Materna (1966) im Erzgebirge sowie Lux (1965) in der Dübener Heide. Materna schreibt: 'Schwere Beschädigung der Bestände und das Absterben von älteren Wäldern wird durch solche Schwefeldioxid-Konzentrationen hervorgerufen, die nur sehr selten und auch was die Höhe anbelangt unbedeutend 0,5 mg S02/'m3 Luft überschreiten.' Nach Flemming (1967) treten erste Schäden in der Dübener Heide bei etwa 0,03 mg/m3 langfristigem SOa-Gehalt auf, sehr starke Schäden bereits bei Immissionsdurchschnitts-Konzentrationen über 0,1 mg/m3. Dies alles
359

sind aus exakter Gegenüberstellung von biologischen und luftanalytischen Meßdaten gewonnene Erkentnisse, die nunmehr die Reichweite der schon so lange bekannten und ertragskundlich-ökologisch festgestellten Schäden in den Wäldern Mitteleuropas auch luftanalytisch ausreichend erklären.
Bei diesen Daten wird auch klar, wovon die Landschaftsökologie längst überzeugt ist, daß ein völliger Schutz der so empfindlichen Forstwirtschaft gegen Abgase mit dem Betrieb gewisser Großindustrie-Etablissements in der Nachbarschaft ohne wirksame Absorbtionsvorkehrungen nicht vereinbar ist. Hohe Schornsteine allein helfen nicht. Es ist eine Illusion, das für möglich zu halten. Hier einen die Interessen und Leistungen beider Kulturträger (Industrie und Bodenbewirtschaftung) berücksichtigenden Ausgleich zu finden (Wentzel, 1966), ist die große Aufgabe der staatlichen Legislative und Exekutive.
Es war somit auch eine Illusion, aus den Ergebnissen von Kabinentesten allein die Schwellenwerte zur Auslösung von Erkrankungen und Schäden bei 0,5 mg SCh/m3
Luft zu suchen. Gewiß ist nach den vielfältigen Begasungsversuchen, daß der Schwellenwert für HF noch um zwei Zehnerpotenzen unterhalb dieser bisher für SO2 angenommenen Konzentration liegt, nämlich bei 1 Mikrogramm, also 0,001 mg/m3. (Thomas und Altherr, 1966; Garber, 1967). Ein Einfluß von 5 Mikrogramm pro Kubikmeter einige Stunden lang bedroht bereits alle Pflanzen. Entscheidend ist auch hier, wie häufig innerhalb kurzer Zeitdauer diese Toleranzgrenze überschritten wird und wie hoch die Konzentrationsspitzen innerhalb des Meßintegrals auflaufen. Daß Freilanduntersuchungen auch für Fluorwasserstoff, insbesondere bei den langlebigen empfindlichen Koniferen, auf noch tiefere Werte kommen, ist demnach nicht nur nicht ausgeschlossen, sondern zu erwarten.
Auf die Empfindlichkeit gegenüber Chlor und Chlorverbindungen, Stickstoffverbindungen, bestimmten organischen Stoffen, 'smog', Ozon und Stäube soll hier nicht eingegangen werden. Diese Emissionen treten seltener auf und bedürfen in der Regel höherer Konzentrationen als SO2 oder HF um Erkrankungen zu verursachen.
Ältere Koniferenbestände: empfindlichste Landschaftskörper gegen die Luftverunreinigung
Als eine Begründung für die genannte Erwartung tieferer Werte kann die sehr unterschiedliche Empfindlichkeit der Altersstadien der Nadelwälder genannt werden. Sie kann in Begasungsversuchen nicht erfaßt werden, ist aber, wie jeder Forstmann weiß, außerordentlich bedeutungsvoll. Ein Beispiel soll dies darlegen.
Im Bergland südlich Hannover wurden in den Jahren 1961 bis 1964 die Auswirkungen der Fluorwasserstoff-Emisionen einer neu gebauten Ziegelei ermittelt. Das Werk wurde mitten in Fichtenwäldern eines Berghanges errichtet, der mit der Hauptwindrichtung von SW nach NO anstieg. Dies war übrigens eine raumordnerisch völlig verfehlte Entscheidung. In solcher orographischen Situation ist bei einheitlichem Pflanzenbestand eine Ausdehnung des Schadenbereiches nach dem Bilde der Windfrequenz über das Gelände zu erwarten, wobei sich die stärksten Schäden nahe dem Werk, die schwächsten an der Peripherie finden und konzentrische Zonen etwa glei-
360

chen Einwirkungsgrades (an Intensität von innen nach außen abfallend) ausgeschieden werden können.
Dem gegenüber zeigten sich die Erkrankungsgrade des Waldes weniger von der Entfernung als vom Alter der Fichtenbestände abhängig: sie waren völlig unregelmäßig über das Schadengebiet verteilt. An jungen Beständen waren 62,5 ha erkrankt und wiesen Zuwachsschäden auf. Obwohl sie direkt an die Abgasequelle heranreichten, waren davon nur 1,7 ha Kulturen oder Dickungen in unmittelbarer Nähe der Tunnelöfen abgestorben. In Stangenhölzern und altern Fichtenbeständen waren dagegen größere Sterbeflächen (Abb. 2) im gesamten Schadenbereich zu finden, sowohl
Abb. 2. Verteilung der Sterbeflächen (schraffiert) in einem Schadengebiet, abhängig vom Alter der Fichtenbestände, weniger aber von der Entfernung zur Emissionsquelle.
361


in der Nähe der Rauchquelle wie auch an seiner äußeren Peripherie auf der Berglcuppe in 1,4 km Entfernung. Diese Verteilung überraschte im gegebenen Fall um so mehr, als der immissionsbeladene Luftstrom von der Ziegelei über die Kronen der jüngeren Fichtendickungen (Abb. 3) bergaufwärts hinstreichen mußte, um die Altbestände in weiterer Entfernung überhaupt zu erreichen.
Junge Koniferen besitzen somit einen erheblich höheren Resistenzgrad als ältere. Deshalb bin ich der Überzeugung, daß alle die vielen bisherigen Begasungsversuche mit 'Nadelbaum-Kindern' ungeeignet sind zur Festlegung von Grenzkonzentrationen der Empfindlichkeit gegen toxische Abgase. Die Anfälligkeit der Nadelwälder kann nicht nach dem Verhalten der jungen Exemplare beurteilt werden. Dies führt zu falschen Ergebnissen.
Da der Wald unter dem Einfluß einer planvollen Forstwirtschaft in Mitteleuropa selbst auf kleinem Raum kein einheitliches Alter hat, sondern in buntem Wechsel aus jungen Kulturen, Dickungen, mittelalten Stangenhölzern und älteren Baumbeständen zusammengesetzt ist, wird das Verteilungsbild des Erkrankungsgrades durch die Luftverunreinigung stets auch von der unterschiedlichen Anfälligkeit der Altersstadien mitgeprägt. Wenn junge Fichten unter einem bestimmten Luftverunreinigungsgrad keine Erkrankungen oder Schäden aufweisen, so ist das kein Nachweis, daß sie im Alter ebenfalls davon verschont bleiben. Aus den älteren Immissionsarealen ist bekannt, (Wentzel, 1963), daß das Lebensalter der Wälder (Umtriebszeit) durch fortdauernden Abgaseinfluß beträchtlich verkürzt ist. Ältere Koniferenbestände sind die empfindlichsten Landschaftskörper gegen die in Mitteleuropa vorherrschende Luftverunreinigung. Ihr Gesundheitszustand (in alten Industriegebieten: ihr Vorhandensein oder der Zeitraum ihres Aussterbens) sind ein ausgezeichneter biologischer Indikator der Immissionseinflüsse.
Maßstäbe zur Beurteilung der Immissionsresistenz
Da die genannten Konzentrations-Schwellenwerte in Industrienähe an zahlreichen Orten, stellenweise sogar in ganzen Landesteilen, in der Tat vielfach überschritten werden, stehen wir seit 150 Jahren vor sehr ernsten Gesundheits- und Schadenproblemen. Die zweifelsfreie Feststellung einer Unterschiedlichkeit im Resistenzgrad der Arten war eine der ersten grundlegenden Erkenntnisse der frühen klassischen Rauchschadenforschung. Seit einem Jahrhundert baut sich darauf das wichtigste pflanzenbauliche Vorbeugungsmittel gegen die Immission auf: der Übergang zu immissionshärteren Gewächsen. Einzelne Arten, und innerhalb derselben auch einzelne Individuen, erkranken früher und reagieren deutlicher als andere. Typische Erkrankungssymptome an Blattorganen oder im Habitus mancher Gehölze treten erst auf, wenn andere schon schwer leiden oder gar abgestorben sind.
Dies mag erklären, daß die Pflanzenresistenz die für die Praxis der Landeskultur bedeutungsvollste Frage der ganzen Aerosologie ist. Aber so sehr unsere Erkenntnisse über die Schwellenwerte im Laufe der 100 Jahre Rauchschadenforschung sich verfeinert haben, über die Resistenz wissen wir heute nicht viel mehr als schon 1880 bekannt war. Damit soll nichts gegen die neue Forschung gesagt sein, sondern die
363

Beispiele: Es gibt kritische Wuchsphasen. Die unterschiedliche Anfälligkeit der Altersklassen der Nadelholzwälder wurde bereits dargelegt. Das Getreide leidet besonders im 3-Blattstadium seines Wachstums (Van Haut, 1961). Die verschiedenen Nadeljahrgänge der Koniferen sind je nach Entwicklung unterschiedlich anfällig. Im Winter sind Einwirkungen weniger bedeutsam als im Sommer, dies jedoch wiederum je nach Pflanzenart unterschiedlich. Gesunde Pflanzen sind widerstandsfähiger als von Parasiten befallene.
3. Wuchsbedingungen, Standort, gekennzeichnet durch Klima, Boden, besondere Witterungsextreme und Ernährungsverhältnisse, soziologische Stellung im Bestand oder in der Pfianzengemeinschaft.
Beispiele: Im allgemeinen hält jede Pflanze den Immissionsangriffen dort am besten stand, wo sie in ihrem standörtlichen Optimum wächst und nicht zu stark von Konkurrenz bedrängt wird. Die Buche ist auf Kalkböden erheblich resistenter als auf armen Sandböden. Die Ulme gilt im Auewald als einer der härtesten, auf ungeeignetem Standort als einer der anfälligsten Laubbäume. Dagegen zeigt sich die Schwarzkiefer auf trockenen wie nassen, armen wie reichen Standorten als die relativ härteste der ausreichend erprobten Koniferen (Wentzel, 1963) sowohl gegen SO2 wie HF, Salzaerosole und Staub. Neben physiologischen dürften auch morphologische Eigenschaften bestimmend für das Maß der Rauchhärte sein. Gezielte Düngung (Zahn, 1963; Lampadius und Häußler, 1962) verbessert die Widerstandsfähigkeit. Harte Winter- und Spätfröste dagegen mindern die Resistenz der Koniferen gegen Immissionen (Wentzel, 1965).
4. Orographische Situation, gekennzeichnet durch die besondere Exposition im Gelände.
Erklärung: Für die Anbaueignung der Pflanze im luftverunreinigten Freiland ist von großer Bedeutung, inwieweit eine Pflanze überhaupt den Immissionen ausgesetzt ist. Kurzlebige, tief am Boden stehende Pflanzen und langlebige, hoch in den Luftraum ragende Gewächse sind den Immissionsangriffen in ganz anderer Weise preisgegeben und dürfen daher nicht in eine Vergleichsreihe miteinander gestopft werden. Hier stellt sich das Problem der Scheinresistenz in durch Schutzpflanzungen oder Geländekomplexe abgeschirmten oder von der Luftzirkulation kaum berührten Geländepartien, die nicht mit echter Resistenz verwechselt werden darf.
Aus der Fülle der vorstehend genannten Bestimmungsfaktoren wird klar, daß alle Einzelfeststellungen nur für die speziellen lmmissions-, Standorts-, Pflanzenent-wicklungs-, und Expositionsbedingungen gelten können, für die sie im Kabinentest oder im Freilandobjekt ermittelt sind. Die Immissionsresistenz ist von der jeweils im konkreten Einzelfall vorliegenden multifaktoriellen Konstellation abhängig und verschiebt sich je nach dem Gewicht einzelner Faktoren gegeneinader, d.h. in einem konkreten Falle z.B. kann die Lärche härter sein als die Fichte, im anderen Falle umgekehrt. Deshalb kann die Immissionsresistenz schlechthin nicht auf eine einfache Formel gebracht werden.
366

Arteigene Mittelwerte der Immissionsresistenz; Gefährdungsgrad der Pflanzenbauzweige
Nach dem heutigen Stand unseres Wissens ist es irreführend, Resistenzfolgereihen aufzustellen, in die alle Pflanzen gemeinsam für alle Standorte eingeordnet werden und die für alle Immissionstypen gelten sollen. Wissenschaftlich vertretbar und praktisch brauchbar ist lediglich eine grobe Eingliederung der Pflanzenarten nach den arteigenen Mittelwerten der Immissionsresistenz in höchstens drei Gruppen (sehr empfindlich, anfällig, relativ hart), und zwar getrennt nach Immissionstypen für kurzlebige und langlebige Pflanzen, und bei letzteren abermals getrennt für Laubgehölze und Koniferen.
In den Tabellen 1 und 2 findet man (unter den dargelegten Vorbehalten) eine Aufgliederung für SO2 und HF in Gruppen vergleichbarer Resistenzmittelwerte, wobei in die Spalten einige Leitpflanzen der Empfindlichkeit (ohne Vollständigkeit) eingetragen sind. Die Spalten sind im Resistenzgrad nicht gegeneinander vergleichbar.
Tabelle 1. Resistenzgrad gegen SO..
Sehr empfindlich Anfällig
Relativ fiart
Kurzlebige Pflanzen
landwirtschaftlich und gärtnerisch genutzte Pflanzen
Klee-Arten, Luzerne, Spinat Erbsen, Bohnen, Salat, Getreide
Kohl, Möhren, Rüben, Raps
Zierpflanzen Wildpflanzen
Lupinen, Wicken, Rosen verschiedene Wiesen- u. Waldgräser
Heidekraut, Aira Carex-Arten
Langlebige Pflanzen (Gehölze)
Laubgehölze
keine
Linde, Esche, Hainbuche, Buche Kirsche, Pflaume Pappel, Erle, Eiche, Ahorn, Holunder, Birne, Apfel
Koniferen
Tanne. Fichte, Douglasie Kiefer, Lärche, Strobe
Schwarzkiefer, Thuja, Eibe
Tabelle 2. Resistenzgrad gegen HF.
Kurzlebige Pflanzen
landwirtschaftlich Zierpflanzen und gärtnerisch ge- Wildpflanzen nutzte Pflanzen
Langlebige Pflanzen (Gehölze)
Laubgehölze Koniferen
Sehr empfindlich Anfällig
Relativ hart
Mais, Weinrebe. Gladiolen, Tulpen, Hainbuche, Buche, Lärche, Fichte, Zwiebel Klee-Arten, Getreide
Kohl, Rüben, Tomaten, Tabak, Kartoffeln
Maiglöckchen Rosen, Dahlien, Wiesengräser
Chrysanthemen, Heidekraut, Brennessel
Linde, Pfirsich Ahorn, Birke, Esche, Holunder, Apfel, Birne Weide, Erle, Eiche, Roteiche, Robinie
Tanne, Douglasie Kiefer, Strobe
Schwarzkiefer, Eibe, Thuja, Wacholder
367

Eindringlich sei davor gewarnt, Resistenzunterschiede in der Praxis überzubewerten. Sie sind in der Regel (Ausnahme Laubbaum: Nadelbaum) nicht so erheblich, daß wesentliche Erleichterung durch einen Übergang auf andere Arten erzielt werden kann.
Der Gefährdungsgrad der verschiedenen Zweige der Bodennutzung kann zusammenfassend folgendermaßen beurteilt werden: 1. Reichweite der Schäden noch weit über die eigentlichen Industriegebiete hinaus. Besonders gefährdet durch Immissionen ist die Forstwirtschaft, sofern sie aus Standorts- und Rentabilitätsgründen Nadelbäume anbauen muß, um lebensfähig zu bleiben. Das Immissionsproblem ist in Mitteleuropa auf 400000 ha ein ausgesprochenes Koniferen-Anbauproblem, während Laubholz hier nur geringfügig Schaden nimmt. Nadelholzwälder leiden nachweislich noch auf 10 bis 30 km Entfernung von bestimmten Großrauchquellen so nachhaltig, daß ihr Anbau eingestellt werden muß. Für Forstbetriebe, die vom Ertrag des Waldes leben müssen, bedeutet dies den wirtschaftlichen Ruin (Wentzel, 1967). 2. Schäden innerhalb der Industriegebiete. Sehr gefährdet ist hier der Zierpfianzenbau wegen der beonderen Empfindlichkeit seiner Zwiebelgewächse gegen HF. In zweiter Linie betroffen sind Feldfutterbau (Guderian, 1966) und die Viehwirtschaft, da Dauerkulturen (Klee, Luzerne, Weidegras, Gemenge) unter SO2 stärker leiden und bei HF-Einwirkung z.T. soviel F inkorporieren können, daß Fluorose beim Weidevieh auftritt. Zu nennen sind hier auch der Gartenbau, der in Immissionsgebieten Ertragsminderungen gewisser Obstsorten und Gemüsepflanzen erleidet, sowie Laubholzwälder, deren Zuwachs und Erholungsfunktion zwar gemindert werden können, die aber nur selten in der Existenz bedroht werden und bei vorwiegend landeskultureller (nicht wirtschaftlicher) Funktion keine Holzrendite erwirtschaften brauchen. 3. Schäden nur in nächster Nähe großer Immissionsquellen. Am wenigsten betroffen ist von den großen Kultur zweigen der landwirtschaftliche Pflanzenbau in seinem schnellen Umtrieb von Getreide, Hackfrüchten usw. Diese Kulturen leiden in der Regel nur in der unmittelbaren Umgebung bestimmter Industriebetriebe (Holte, 1960) und bleiben daher im größten Teil der Industriegebiete unbehelligt.
Schlußwort
Im ältesten Buch über die Natur, der berühmten Historia Naturalis des älteren Plinius (23 bis 79 n.Ch.), steht im Abschnitt 18,2 das geflügelte Wort: 'Oculus domini fertilissimus in agro', d.h. wörtlich übersetzt 'Am fruchtbarsten für den Acker ist die Aufmerksamkeit des Besitzers'. Für die Immissionsökologie abgewandelt möchte ich sagen : 'Am besten für den Schutz und die Gesunderhaltung unseres Lebensraumes ist das Auge, das die komplexen Zusammenhänge sieht.' Wenn wir diese zu erkennen suchen, werden wir auch vor Illusionen bei der Beurteilung der Immissionswirkungen und vor unzulässigen Folgerungen bewahrt bleiben.
368

Summary Resistance of plants to air pollution
Until 1940, 2 p.p.m. SO2 in the air has been supposed to be the maximum quantity acceptable for long range pollution. But recent field experiments in various areas have shown, that the limit has to be reduced to 0.02 p.p.m., for HF even considerably lower. It is advisable to use, instead of the average concentration, a criterium in which various concentrations are combined with different exposure periods, or the number of times a certain concentration limit is exceeded.
In a fumigation chamber visible leaf damage is the only criterium for measuring the effect of a pollutant. In addition field observations are necessary, as the endurance of the plant may be of greater importance than occasional damage, especially in woody plants.
Lists of plants in an order of decreasing susceptibility suggest reliability, but they are only correct under the special circumstances prevailing during fumigation or during observation in the field. Even when combining all available data it is hardly possible to draw up more than the three classes: very susceptible, susceptible and rather resistant.
Résumé La résistance des plantes à la pollution atmosphérique
Jusqu'à 1940, on a jugé une concentration de 2 p.p.m. dans l'atmosphère le maximum acceptable pour une pollution prolongée. Mais des expériences récentes, dans plusieurs régions, ont montré, que la limite doit être réduite à 0,02 p.p.m., pour le HF à une valeur encore plus bas. On fera bien d'employer, au lieu de la concentration moyenne, un critère dans lequel des concentrations différentes seront combinées avec plusieurs périodes d'exposition.
Dans l'espace limitée d'une chambre de fumigation, les dégâts visibles causés aux feuilles sont le seul moyen de mesurer les concentrations critiques de pollunta. Les résultats obtenus ne constituent qu'une seule indication de la façon dont la plante se comportera sur le terrain. Ainsi, les observations sur le terrain sont également nécessaires, étant donné que, dans plusieurs cas, la résistance de la plante peut bien être d'une plus haute importance que les dégâts occasionels causé aux feuilles. Ceci est surtout vrai en ce qui concerne les plantes forestières.
Beaucoup d'auteurs ont établi des listes de plantes par ordere de sensibilité diminuante. De telles listes suggèrent une sûreté absolue, mais elles ne sont valables que dans les conditions spéciales de la fumigation ou pendant l'observation sur le terrain. Les résultats n'ont qu'une valeur pratique lorsqu'on réunit toutes les données en quelques groupes : très sensible, sensible et assez résistant.
369

Literatur
Flemming, G. 1967. Wiss. Z. techn. Univ. Dresden 16: 1603-10. Garber, K. 1967. Luftverunreinigung und ihre Wirkungen. Berlin. Grohmann, Th. 1910. Erfahrungen und Anschauungen über Rauchschäden im Wald und deren
Bekämpfung. Heft 6 der Sammlung von Abhandlungen über Abgase und Rauchschäden. Parey, Berlin.
Guderian, R. 1966. Schriftenreihe der Landesanstalt für Immissions- und Bodennutzungsschutz in Nordrhein-Westfalen 4: 80-100.
Guderian, R. und H. Stratmann. 1962. ForschBer NRhein-Westf. 1118. Guderian, R. und H. Stratmann. 1968. ForschBer. NRhein-Westf. 1920. Haut, H. van. 1961. Staub 21: 52-6. Holte, H. 1960. Ber. Landesanst. Bodennutzungsschutz 1:43-62. Katz. M. 1949. Ind. Engng. Chem. 2450-65. Lampadius, F. und D. Häußler. 1962. Wiss. Z. techn. Univ. Dresden 11: 1417-24. Lux, H. 1965. Z. techn. Univ. Dresden 14: 433-42. Materna, J. 1966. Vortrag 5. Internationale Tagung forstlicher Rauchschadensachverständiger,
Janské Lâzné, 11.-14. Okt. : 14-30. Pelz, E. und J. Materna. 1964. Arch. Forstw. 13: 144-210. Rohmeder, E. und A. von Schönborn. 1965. Forstwiss. ZentBl. 84: 1-68. Schröder, J. von und C. Reuß. 1883. Die Beschädigung der Vegetation durch Rauch und die Ober
harzer Hüttenrauchschäden. Berlin. Stöckhardt, A. 1871. Tharandt. forstl. Jb. 21: 218-54. Thomas, M. D. 1961. Auswirkungen der Luftverunreinigung auf Pflanzen. In: Air Pollution (Deut
sche Ausgabe, Weinheim 1964): 229-77. Thomas, M. D. und E. W. Altherr. 1966. Handbuch der experimentellen Pharmakologie. Berlin,
Heidelberg, New York : 231 - 306. Wentzel, K. F. 1963. Allg. Forstz. 18: 101-6. Wentzel, K. F. 1964. Forstarchiv 35: 49-51. Wentzel, K. F. 1965a. Staub25: 121-5. Wentzel, K. F. 1965b. Forstarchiv 36: 49-59. Wentzel, K. F. 1966. Angew. Bot. 40: 1-11. Wentzel, K. F. 1967a. IUFRO Paper, XIV. Kongreß, München Bd. V. Sektion 24: 536-55. Wentzel, K. F. 1967b. Forst- u. Holzwirt 22: 241-6. Auch: Pubis Conféd. eur. Agric. 184-97. Wislicenus, H. und F. W. Neger. 1914. Sammlung von Abhandlungen über Abgase und Rauch
schäden Heft 10, Parey, Berlin. Zahn, R. 1963. Z. PflKrankh. u. PflSchutz 70: 81-95.
370

Beobachtungen über die Empfindlichkeit verschiedener Baumarten gegenüber Immissionen von S02 , HF und Magnesitstaub
J. Pollanschütz
Forstliche Bundesversuchsanstalt, Institut für Ertrag und Betriebswirtschaft, Wien
Kurzfassung
Die Untersuchungen erstreckten sich auf ein Gebiet mit gleichzeitigen S02- und Magnesitstaubimmissionen, ein Gebiet mit HF- und SO „-Immissionen und ein Gebiet mit alleinigen HF-Immissionen. Mittels Bohrkernproben wurden Zuwachsverluste bestimmt, oder/und das Ausharrevermögen festgestellt. Für S0 2 + Mg war die Rangfolge der Arten (mit steigender Empfindlichkeit): Lärche (wenig empfindlich), Weißkiefer, Fichte, Tanne; die Buche zeigte ein überraschend eigentümliches Verhalten. Für HF + S0 2 : Aspe, Esche, Buche + Ahorn, Fichte + Weißkiefer, Europäische Lärche. Für HF: Weißkiefer, Fichte + Tanne. Schadsymptome lassen nicht unbedingt den Schluß auf Zuwachsverluste zu; es können aber, insbesondere an Nadelbaumarten, auch Zuwachsverluste ohne gleichzeitiges Auftreten von makroskopisch erkennbaren Schadsymptomen auftreten. Infolge Immissionseinwirkung kümmernde Restbestände sollen zum Schutz der Neuaufforstungen belassen werden.
Schäden dutch Magnesitstaub in der Umgebung von Magnesitwerken sind in Österreich zwar keine Seltenkeit, doch die Möglichkeit, die Entstehung und Entwicklung eines Rauchschadensgebietes in der Umgebung eines solchen Werkes zu studieren, bietet sich nicht oft (siehe Stefan und Pollanschütz, 1967). Es handelt sich hier um das Magnesitwerk 'Hochfilzen' auf der Paßhöhe eines Südost-West verlaufenden Talzuges in 968 m Seehöhe. Vom Sattel zweigen zwei Nebentäler nach Nordnordwest und Nordost ab. Das Haupttal bildet gleichzeitig die Grenze zwischen kalkreichem Grundgestein (vor allem Wetterstein Dolomit) und kalkarmen Werfener Schichten im Süden.
An Bodenbildungen findet man auf Dolomit vorwiegend Rendsinen, auf Werfener Schichten hingegen Ranker und Rohböden, mit einer unmittelbar auf dem Grundgestein liegenden Humusschicht. Vereinzelt haben sich Gleye und Moore gebildet. Auf kalkreichem Grundgestein stocken Fichten-Bestände mit eingesprengten Tannen und Lärchen, soweit der Oberboden eine gewisse Mächtigkeit aufweist und der Standort als mäßig frisch anzusprechen ist. Auf den mäßig gründigen und seichtgründigen, trockenen Standorten überwiegen Kiefernbestände mit Fichten- und Buchenbeimischungen. Auf den frischen und sehr frischen bis feuchten Standorten über kalkarmen Werfener Schichten findet man Fichten-Tannen-Bestände mit einzelnen Lärchen.
Im Einflußbereich dieses in einer gebirgigen Tallandschaft eingebeteten Magnesitwerkes wurden mehrere Jahre lang auf zahlreichen Dauerprobeflächen eingehende
371

Beobachtungen über Art und Intensität der Inimissionen durchgeführt. Bei dieser Untersuchung mußte neben dem Magnesitstaub auch das Schwefeldioxyd, das durch die Verwendung schwefelhaltiger Brenn- und Zusatzstoffe bedingt ist, berücksichtigt werden. Fünf Vegetationsperioden nach Inbetriebnahme des Werkes wurden Jahrring- und Zuwachsuntersuchungen angestellt.
Die Untersuchungsergebnisse waren charakteristisch für einen durch SO2 verursachten chronischen Schädigungsverlauf, der durch kontinuierliche Zunahme der an den verschiedenen Nadelbaumarten festgestellten jährlichen Zuwachsdepressionen gekennzeichnet war. Im Bereich intensiver Immissionen führten die Wachstumshemmungen im Verlauf mehrerer Jahre letztlich zum Absterben einer je nach Standortsverhältnissen unterschiedlichen Anzahl von Einzelbäumen oder Baumgruppen.
Bezüglich der Magnesitstaub-Immissionen konnten aus den Untersuchungsergebnissen und den bisherigen Beobachtungen keine für die Waldbäume in entscheidendem Maße nachteilige Folgen abgeleitet werden. Der beobachtete maximale Magnesiumstaubniederschlag betrug 6 bis 8 g pro m2 und Monat. Im Vergleich zu älteren Werken, die ohne entsprechende Filteranlagen arbeiten (z.B. in der CSSR), sind diese Mengen als sehr niedrig anzusprechen.
Bei den Fichtenproben wurden mehr oder weniger starke Zuwachsdepressionen durch verminderte Jahrringbreitenbildung bereits ab 1960 offenkundig. Unterschiedlicher S02-Ausstoß, Unterschiede in der Windhäufigkeit und sonstige Witterungsgegebenheiten und ihre Nachwirkungen verursachten in den einzelnen Jahren für jede Probe schädigende Auswirkungen verschiedenen Ausmaßes. Zunehmender Verlust an Nadelmasse (Verringerung der gesamten Assimilationsmasse) spielten in bezug auf ein im Laufe der Jahre zunehmendes Ausmaß der Zuwachsdepressionen eine stark mitbestimmende Rolle.
Bei der Fichte prägten sich im Laufe der Jahre immer deutlicher individuelle Resistenzunterschiede in Bezug auf S02-Immissionen heraus, wobei außerdem die Einflüsse verschiedener Standortsfaktoren, insbesondere der Wasser- und Nährstoffversorgung, auf die Widerstandskraft und das Ausharrevermögen der Pflanzen sehr deutlich zum Ausdruck kamen.
Die in der Regel auf gut mit Wasser versorgten Standorten stockende Tanne reagierte auf die SCh-Einwirkungen ähnliche wie die Fichte, aber im allgemeinen verringerten sich die Jahrringbreiten stärker, was mit der allgemeinen Kenntnis, daß die Tanne gegenüber SO2 empfindlicher ist, gut übereinstimmt. Die geringere Resistenz der Tanne wurde in den letzten Jahren auch dadurch bestätigt, daß unter gleich ungünstigen Standortsbedingungen relativ mehr Tannen als Fichten abgestorben sind.
An Weißkiefer wurden die geringsten Zuwachsverluste festgestellt. Lediglich starke S02-Immissionen bewirkten ähnliche Verringerungen der Jahrringbreiten wie bei Fichte. Auf schwächere Immissionen einzelner Jahre und günstigere Witterungsbedingungen reagierte die Kiefer rascher und kräftiger mit gesteigertem Holzzuwachs als die Fichte. Insbesondere machte sich dieser Umstand im Jahre 1964 auf relativ trockenen Standorten bemerkbar.
Die Resistenz der Kiefer kommt somit einerseits durch grössere Widerstandsfähigkeit gegen SO2 und durch längeres Ausharrevermögen, andererseits durch eine
372

raschere Erholung zum Ausdruck. Diese letztere Fähigkeit könnte mit der Tatsache zusammenhangen, daß die Kiefer gegenüber der Fichte mit weniger Nadeljahrgängen ausgestattet ist.
Bei Lärche konnten, neben frühzeitiger Nadelverfärbung auf der dem Werk zugewandten Seite im Bereich relativ intensiver Immissionseinwirkung, nur unbedeutende Zu wachs Verluste festgestellt werden. Dies deckt sich mit den Beobachtungen die im Bereich eines anderen seit Jahrzehnten im Betrieb stehenden Magnesitwerken in St. Jakob gemacht werden konnten. Dort stocken in unmittelbarer Nähe des Werkes mittelalte und alte Lärchen (Reste eines Fichten-Lärchen-Bestandes) die infolge sehr starker Immissionseinwirkungen wohl Zuwachsverluste aufweisen, jedoch keinerlei Neigungen zum Absterben zeigen. Analoges Verhalten zeigt die europäische Lärche im Einflußbereich verschiedenster SC>2-Emittenten.
Eine große Überraschung demgegenüber bescherten die an Buche im Rauchschadensgebiet 'Hochfilzen' durchgeführten Zuwachsuntersuchungen. In allen Fällen konnte dort innerhalb des Einflußgebietes der SO2- und Magnesitstaub-Immissionen, und im Gegensatz zu den Nadelbaumarten, ab 1960 abrupte Zuwachssteigerungen nachgewiesen werden! Diese standen in klarer Beziehung zur Intensität der Immissionen, insbesondere zur Stärke der Verstaubung. Das in Bereichen intensiver SC>2-Einwirkungen an Buche und anderen Laubbaumarten zur gleichen Zeit Blattschädigungen auftraten (vornehmlich Blattrandschäden), stand augenscheinlich in Widerspruch zu den Zuwachsgewinnen. Zur Erklärung kann mit hoher Wahrscheinlichkeit angenommen werden, daß das Magnesium in Form der leicht wasserlöslichen Magnesiumsulfates einen Blattdüngungseffekt auszulösen vermochte. Dafür sprechen folgende Tatsachen.
Magnesium ist ein wesentlicher Baustein des Chlorophylls. Das satte Grün der Blätter der im Immissionsgebiet stockenden Buchen spricht für eine verstärkte Chlorophyllbildung. Außerdem sind für zahlreiche enzymatische Vorgänge Mg++-Ionen 'notwendig. Weiters ist bekannt, daß Mg die Phosphataufnahme und den Phosphattransport beeinflußt und auf Phosphorylierungsprozesse aktivierend wirkt.
Obzwar in Bereichen intensiver S02-Einwirkung an den Laubbaumarten Blattrandschäden festgestellt wurden, scheinen die aktiv gebliebenen Blatteile mehr organische Stoffe gebildet zu haben als die vollkommen gesunden Blätter der nicht durch die kombinierte SO2- und Magnesitstaub-Immissionen beeinflußten Bäume. Dies infolge der Aufhebung der bisher, durch festgestellte zu hohe pH-Werte in den oberen Bodenhorizonten auf den Dolomit- und Kalkstandorten bedingte, ungünstige Magnesiumversorgung. Dieses überrachende (wissenschaftlich zwar interessante, wirtschaftlich jedoch wenig bedeutungsvolle) Untersuchungsergebnis wurde von Pollan-schütz ( 1966), ausführlich behandelt.
Daß nun die auf Dolomit- und Kalkstandorten stockenden Buchen, trotz genügendem Mg-Angebotes, bisher unter einem gewissen Mg-Mangel gelitten haben könnten, würde darin seine Erklärung finden, daß (nämlich bei hohen pH-Werten) die Ca-Ionen die Aufnahme von Mg-Ionen hemmen. Die vor Inbetriebnahme des Magnesitwerkes im Oberboden festgestellten pH-Werte lagen zwischen 6,2 und 7,1. Demgegenüber könnte erst bei pH-Werten um 5,0 eine ausgeglichene Aufnahme von Ca- und Mg-Ionen aus dem Boden angenommen werden.
373

Wie lange sich die bei Buche festgestellte Blattdüngung oder die ausgewogene Nährstoffversorgung positiv auswirken wird, und ob sie auch den übrigen im Untersuchungsgebiet vorkommenden Baumarten wie Ahorn, Esche, Ulme und Erle zugute kommen, kann aus den bisherigen Untersuchungen noch nicht abgeschätzt werden.
Als nächstes sei über Beobachtungen in einem Rauchschadensgebiet berichtet, in dem neben Immissionen von SO2 seit 1961 auch von HF den verschiedenen Baumarten zum Nachteil gereichen. Die SOa-Immissionen entstammen einer Bleihütte, der 1951 eine Schwefelsäurefabrik angegliedert ist; das HF entstammt einer 1961 errichteten Superphosphatfabrik.
Nadelanalysen bei Fichten und Kiefern ergaben, daß die SC>2-Emissionen in den Jahren vor und nach 1961 annährend die gleiche Stärke hatten. Demgegenüber machten sich, insbesonders die in den Jahren 1961 und 1962, zusätzlich emittierten erheblichen Mengen an Fluor durch einen wesentlich verstärkten Zuwachsrückgang bemerkbar. Dieser erreichte, selbst bei vollkommen gesund aussehenden Fichten und Kiefern, erhebliche Ausmaße. Begünstigt durch den äußerst strengen Winter 1962/63, der durch seine lang anhaltenden Fröste überdies Trockenschäden an den Fichten und Kiefern verursachte, dehnte sich die Rauchschadenblöße bedeutend aus.
Es konnte hier bisher hinsichtlich des Ausharrevermögens und der Beeinträchtigung der Zuwachsleistung keine Unterschiede zwischen Fichte und Kiefer festgestellt werden. Dies im Gegensatz zu Gebieten, wo SO2 oder HF allein als Schadkomponenten vorkommen.
Bei der Kiefer konnten keine nennenswerten individuellen Resistenzunterschiede beobachtet werden. Ganz anders benahm sich die Fichte: inmitten der Rauch-schädensblöße, etwa 1,3 km vom Werksgelände entfernt, trotz eine bis zum heutigen Tage vital aussehende rund 60-jährige Fichte den SO2- und HF-Immissionen. Es handelte sich bei diesem Exemplar um eine im unteren Stammdrittel grobkorkige Bürstenfichte mit grober, derber Benadelung und tiefreichender Beastung. Die durch Nadelanalysen festgestellten Schwefel- und Fluorwerte erfuhren nach Wegfall des nachbarlichen Schutzes eine Erhöhung, die ab 1962 auch in plötzlich auftretenden Zuwachsdepressionen ihren Ausdruck fanden.
In den einjährigen Nadeln dieses Baumes und den wenigen unter annähernd gleichen Bedingungen noch überlebenden anderen Fichten lagen die Schwefelwerte der letzten Jahre zwischen 700 und 900 mg% H2SO4, die Fluorwerte zwischen 5,0 und 7,0 mg% HF. Die analogen Werte der dreijährigen Nadeln lagen zwischen 1200-1600 mg% H2SO4 und bei 6,0-9,0 mg% HF.
In der oberen Kronenhälfte der oben erwähnten Fichte wechselte die Zahl der Nadeljahrgänge von Jahr zu Jahr zwischen drei und vier, in der unteren Kronenhälfte zwischen vier und fünf.
Unweit dieser Fichte trotzt eine etwa 100-jährige Kammfichte mit normaler, nicht derber Benadelung und einer Kronenlänge von nur ein Drittel der Baumhöhe unter gleichen Immissionsbedingungen, seit 1962 des nachbarlichen Schutzes beraubt, in gleicher Weise den schädigenden Einflüssen.
Diese Beobachtungen führen zur Vermutung, daß neben eventuellen anatomischen,
374

vor allem physiologische Ursachen diese gegenüber Artgenossen hervortretende Widerstandsfähigkeit gegenüber SO2- und HF-Immissionen bedingen, während morphologische Unterschiede vielleicht nur in bescheidenem Maße von Bedeutung sind.
Die auch anderorts vielfach beobachteten individuelle Resistenzunterschiede eröffnen zwar bescheidene aber hoffnungsvolle Ausblicke für eine Auslese und Züchtung resistenterer Rassen dieser wirtschaftlich äußerst wertvollen aber sehr stark gefährdeten Baumart.
Vor allem Rohmeder in Deutschland, aber auch Forscher in der CSSR haben sich seit mehr als zehn Jahren die Aufgabe gesetzt, resistente Individuen weiter zu züchten. In der Deutschen Demokratischen Republik dagegen befaßt man sich seit Jahren vor allem mit der ebenfalls aussichtsreichen Massenselektion. In Österreich werden seit 1966 Pfropfungen der resistenten Fichten durchgeführt.
Bei den vorhin beschreibenen Fichten ist überdies bemerkenswert, daß selbst Buchen und Ahorn in ihrer unmittelbaren Nähe nur kümmernden Wuchs zeigen oder bereits abgestorben sind. Im Bereich diese Rauchschadensgebietes trotzen in Werksnähe unter extremsten Immissionsbedingungen vor allem Aspen, im Wuchs gehemmte Eschen und im Wuchs stark gehemmte Buchen den zeitweilig geballt zugewehten Rauchgasfahnen.
Zuletzt sei auf ein Beispiel für unterschiedliche Resistenz von Holzgewächsen fluor-haltigen Verbindungen (hauptsächlich HF) gegenüber hingewiesen. Es handelt sich um das Einflußareal des in der Literatur bereits wohlbekannten Aluminiumwerkes Ranshofen (siehe Kisser, 1966; Nikifeld, 1967) und um Nadelholzbestände mit Fichte und Weißkiefer.
Im Bereich einer zentralen Schadenfläche, die ursprünglich eine Rauchschadenblöße darstellte, wachsen heute Krüppelsträucher von Salix caprea, Betula verrucosa und Ulmus carpinifolia. Aufgeforstet wurde zusätzlich mit Weiden. Im schwer betroffenen Teil der Blöße kümmern einige zwergförmige, rund 20-jährige Fichten- und Birkenpflanzen in Form von dem Boden aufliegenden Büschen, über die Halbwachs und Kisser (1967) ausführlich berichteten; ihre Existenz verdanken sie vor allem der abschirmenden Wirkung der sie umgebenden Kräuter vegetation.
Kisser und Jung gelang es, die werksfernen Teile der Blöße erfolgreich mit Weiden, Schwarzerlen und Birken aufzuforsten. Sie wird heute von einem dichten Saalweiden-vorgehölz umsäumt, das der dahinterliegenden Schwarzerlen-Weißerlen-Aufforstung Schutz gewährt. Hinter diesem Schutzriegel wurden Aufforstungen mit japanischer Lärche und Weymouthskiefer angelegt, die jedoch relativ stark unter den Fluor-Immissionen leiden. Soweit diese Aufforstungen jedoch im Windschatten von zwar höheren aber stark kümmernden Kiefernaltbeständen stocken, weisen sie nur in geringem Maße Schadsymptome auf. (Es sei nebenbei bemerkt, daß die Kiefern dieser Restbestände vorzeitig ihr Höhenwachstum eingestellt haben, dies als Folge der Immissionen).
Aus dieser Beobachtung sollte der Schluß gezogen werden, daß man kümmernde Restbestände keinesfalls entfernen, sondern unbedingt belassen sollte um dahinterliegenden Aufforstungen Schutz zu gewähren.
Im Bereich dieses Schadensgebietes erhofft man sich künftig Erfolge mit Schwarz-
375
kiefern-Aufforstungen. Innerhalb dieses Fluor-Immissionsgebietes erwiesen sich von den Altbäumen die
Weißkiefern widerstandsfähiger als die Fichten. Einzelne in den Beständen eingesprengte Tannen scheinen den Fichten in der Jugendphase bis zur Kulmination des Höhenzuwachses gleichwertig, vielleicht sogar überlegen zu sein.
Die mit den Schadkomponenten variierenden artspezifischen Resistenzunterschiede scheinen wie die Beispiele zeigen, durch standortsbedingte Einflüsse eine (zwar geringfügige) Modifikation zu erfahren; von größerer praktischen Bedeutung sind aber die individuellen Resistenzunterschiede. Trotz der Langwierigkeit ist, in Anbetracht der Zunahme der immissionsbelasteten Gebiete Europas, der Resistenzzüchtung erhöhtes Augenmerk zu schenken.
Es ist von Bedeutung bei der Untersuchung der individuellen Resistenz künftig auch der Widerstandsfähigkeit verschiedener Herkünfte Aufmerksamkeit zu schenken. Neben der Vermehrung ausgelesener Kiefern ist vor allem die Selektion widerstandsfähiger Fichtenrassen unbedingt erforderlich, denn gerade die Fichte ist die tragende Säule der europäischen Forstwirtschaft.
Neben der Vermehrung durch Pfropfung kommt der Massenselektion entscheidende Bedeutung zu. Eine wesentliche Beschleunigung der Vermehrung widerstandsfähiger Fichten scheint sich durch den von Prof. Rüden eingeschlagenen Weg der Stecklingsvermehrung zu eröffnen.
Summary The susceptibility of various tree species to SO2, HF and magnesite dust pollutions
The investigations covered an area in which occurred pollutions with SO2 and magnesite, with SO2 and HF, and with HF. With the aid of an increment borer the growth of the trees was measured ; in other cases the power of endurance was estimated.
In the environment of magnesite works, magnesite dust and an important SO2 pollution caused growth reduction (in decreasing order) in Abies alba, Picea abies and Pinus sylvestris, whereas Larix decidua appeared to be by far the most resistant against both pollutants. Fagus syhatica still showed a growth increase though leaf burn symptoms were present; this might be due to fertilization with MgSC>4 through the leaves.
When polluted with both SO2 and HF, the (increasing) order was : Populus tremula, Fraxinus excelsior, Fagus + Acer, Picea + Pinus, Larix. Though no differences between Pinus and Picea was found here, it was striking that in the latter species the variation in susceptibility was much greater than in Pinus, which may be important for future selection work.
In an atmosphere polluted solely with HF Pinus showed a greater resistance than Picea and Abies, as already known for SO2 immissions. But it seemed that in its youth Abies was at least as resistant as Picea.
Symptoms do not always correspond with growth reduction and yield losses, and an important growth reduction may occur before any clear symptoms can be observed (especially in conifers).
376

In polluted areas it is advised to leave the remainder of an attacked stand as it forms a good protection of the next forest generation.
Breeding for resistance should be encouraged, especially in spruce.
Résumé La sensibilité de quelques espèces d'arbres aux pollutions de SO2, de HF et la de poussière de magnésite
Les recherches se portaient sur une région où ont eu lieu les pollutions de SO2 et de magnésite, de SO2 et de HF, ainsi que de HF. A l'aide d'une jauge de croissance on a mesuré la croissance des arbres; en d'autres cas, l'endurance a été évaluée.
Aux environs d'une usine traitant la magnésite, la poussière de magnésite et une pollution importante de SO2 ont causé une réduction de croissance (par ordre décroissant) en Abies alba, Picea abies et Pinus sylvestris, tandis que Larix decidua s'est révélé être de loin le plus résistant aux deux polluants. Fagus sylvatica a montré une augmentation de croissance, quoique des symptômes de brûlures de feuille se soient manifestés; ceci est peut-être dû à une fertilisation au MgSÛ4 à travers les feuilles.
La pollution par les deux agents SO2 et HF donnait ordre d'augmentation suivant: Populus tremula, Fraxinus excelsior, Fagus + Acer, Picea + Pinus, Larix. Bien qu'aucune différence entre Pinus et Picea ait été constaté, on était frappé par le fait que la dernière espèce montrait une variation de sensibilité beaucoup plus grande que Pinus. Cela pourrait être intéressant pour les sélections futures.
Dans une atmosphère polluée par le seul agent HF, Pinus montrait une résistance plus élevée que Picea et Abies, comme c'était déjà le cas pour l'émission de SO2. Cependant, il semblait que dans sa jeunesse Abies était au moins aussi résistant que Picea.
Les symptômes ne correspondent pas toujours à une réduction de croissance et à des pertes de rapport. Une réduction de croissance importante peut avoir lieu avant que des symptômes évidents soient observés (surtout en conifères).
Dans les régions polluées, il est conseillé de garder le restant d'une futai atteinte, parce qu'il constitue une bonne protection en faveur de la génération forestière suivante.
La sélection pour la résistance devrait être encouragée, surtout en ce qui concerne le sapin.
Literatur
Halbwachs, G. und J. Kisser. 1967. Zentbl. ges. Forstw. 84: 156-73. Kisser. J. 1966. Mitt, forstl. BundVersAnst. Mariabrunn 73: 7-46. Niklfeld, H. 1967. Zentbl. ges. Forstw. 84: 318-29. Pollanschiitz, J. 1966. Mitt, forstl. BundVersAnst. Mariabrunn 73: 129-91. Stefan, K. und J. Pollanschiitz. 1967. Allg. Forstz. 78. Folge 3.
377


Discussion in Section 9 : Resistance of plants to air pollution
Reporter: A. Raad
Participants: Mellanby (Chairman), Arndt, Knabe, Prinz, Stratmann, Zahn.
It is not yet possible to give limits for SO2 below which even the most sensitive plants are not damaged. The fumigation experiments at Höchst with agricultural and horticultural crops and young forest plants gave results that dit not confirm those in the open air at Biersdorf, in which 0.02 p.p.m. SO2 was determined as the harmful limit.
The meaning of average values and occasional peak concentrations was discussed. Next to the mean value during the measuring time, the average value during immission, which generally is only a part of the measuring time, must be considered.
The sensibility of a plant species cannot be judged by the most sensitive or most resistant individuals but only by the mean value characteristic for the species. It should be considered, however, that in forest stands this mean resistance tends to rise by selection of the strongest individuals by nature or by thinning (Pinus : from 8000 to 160 trees per acre within 100 years).
Resistance is always relative, never absolute, so that practical work is always based on comparisons.
It was proposed to investigate the genetic base of the resistance, which might lead to interesting results.
379


Section 10 : Shelteibelts for air purification


Die Bedeutung von Schutzpflanzungen gegen Luftverunreinigungen
A. Bernatzky
Wilhelm Beerweg 161, Frankfurt a.M., Deutsche Bundesrepublik
Kurzfassung
Schutzpflanzungen sichern 1. die Reduzierung des Gehaltes der Luft an festen Verunreinigungen, 2. die Reduzierung des Gehaltes der Luft an festen und gasförmigen radioaktiven Substanzen, 3. die Bindung von CO., 4. die Minderung des Lärmes, und 5. vor allem führen sie zur ganzheitlichen Verbesserung des Kleinklimas der Städte und der gesamten Lebensumwelt der Menschen in den Ballungsgebieten des Wohnens und der Industrie.
Um diese Wirkungen zu erreichen bedarf es aber einer sehr sorgfältigen Planung unter Berücksichtigung der vielen einschlägigen Einzeldisziplinen.
Der SO.-Gehalt der Luft kann im allgemeinen durch Schutzpflanzungen nicht reduziert werden.
Die Schwierigkeiten bei der Beantwortung der Frage, in wie weit Schutzpflanzungen die Herabsetzung von Luftverunreinigungen fördern, hängen zusammen mit der Vielseitigkeit dieser Aufgabe. Mit kurzzeitigen Messungen allein ist diesem Problem nur schwer beizukommen : es muß nach integralen Methoden der Erfassung gesucht werden. Auch müssen u.a. meteorologische Modellüberlegungen mit angestellt werden, ohne die solche Messungen kaum richtig interpretiert werden können (Flemming, 1967a).
Die frühesten Untersuchungen zu diesem Thema bezogen sich in der Hauptsache auf die Auswirkung von Waldflächen auf die Luftverunreinigung. Sie wurden besonders in Tharandt durchgeführt. Erst später trat, im Zusammenhang mit Problemen des Windschutzes, die Frage nach der Wirksamkeit besonderer Schutzpflanzungen für die Luftreinigung in das Blickfeld (Hennebo, 1955).
Großflächige Wälder unterscheiden sich in ihrer Wirksamkeit wesentlich von Schutzpflanzungen, deren Umfang meistens bedeutend kleiner ist. 'Relative Luftreinheit ist mit locker und stufig gegliederten, durchblasbaren, möglichst hohen Waldstreifen oder gestaffelten Baumreihen hintereinander besser zu erreichen als mit dem kompakten Strömungshindernis Wald' (Wentzel, 1960; Hennebo, 1955; u.a.).
Bei der Auswertung von Arbeiten über die Schutzwirkung von Wäldern muß berücksichtigt werden, daß die betreffenden Untersuchungen zum Schutz des Waldes selbst angestellt wurden. Es war nicht beabsichtigt, ihre Schutzwirkung für die Bevölkerung der Ballungsgebiete zu untersuchen.
Gegen welche Arten von Luftverunreinigungen nun sind Schutzpflanzungen wirk-
383

sam? Auf welche Art und Weise vollzieht sich dabei eine Luftreinigung? Welches sind die Ergebnisse? Das sind die entscheidenden Fragen.
Reinigung der Luft von festen Bestandteilen
Die in den letzten Dezennien immer wieder angestellten Untersuchungen über die Wirksamkeit von Schutzpflanzungen auf feste Bestandteile (Stäube, Kerne) haben dieses Problem gründlich erforscht (Lampadius, 1963). Einen guten Überblick über die hierbei anzuwendenden Meßmethoden, das Aerosolspektrum und die Ergebnisse gibt Neuwirth (1965).
Jeder Mensch atmet täglich etwa 12 m3 Luft ein und nimmt hierbei in den Großstädten (bei einem Gehalt von bis zu 200000 Kernen je cm3 Luft und einer Durchschnittsgröße der Teilchen von 1/100000 cm) 10 mm3 oder 20 mg fester Bestandteilen auf (Linke, 1940), bei schwerer Arbeit sogar bis das Zehnfache. Es ist unverständlich, daß die Auswirkung von solchen Mengen auf die Gesundheit immer wieder bagatellisiert wird.
Weickmann und Ungeheuer (1952) weisen auf die starke Zunahme der Sekundärionen (besonders der Groß- und Ultragroßionen) in verunreinigter Stadtluft hin, als deren Folge bei verringerter elektrischer Leitfähigkeit das elektrische Potentialgefälle der Luft durchschnittlich höhere Absolutwerte und eine größere Feldunruhe zeigt. Diese Feststellung erhält ihr Gewicht durch die von De Rudder (1952) u.a. vertretene Auffassung, daß die Luftelektrizität von großem Einfluß auf die menschliche Gesundheit ist.
Eindeutig betont Amelung (1952) die gesundheitsschädigende Bedeutung der Luftbeimengungen. Nach ihm sind die Fremdstoffe der Luft, von Staub bis zu den Kernen, biologisch beachtenswerter als vielfach angenommen. Als Träger von Schmutzpartikeln und hautreizenden Stoffen können sie für die menschliche Haut bedeutsam werden und auch deren pH-Gehalt beeinflußen. Viel wirksamer sind aber die eingeatmeten Luftfremdstoffe. Es ist bekannt, daß schon die Einatmung geringer Mengen Pollen bei Allergikern schwere Überempfindlichkeitsreaktionen auslösen kann. Die größeren Staubbeimengungen werden in den oberen Luftwegen zurückgehalten, wo sie chronische Katarrhe erzeugen können. Die Beimengungen in der Größe der Kondensationskerne können bis in die Lunge gelangen. Staubkörnchen von mehr als 5 Mikron Durchmesser werden bereits in der Nase ausgefiltert, solche zwischen 3 und 0,03 Mikron dringen bis in die Lunge vor... Für den Retentionskoeffizienten ist das Größenspektrum der Kerne mit entscheidend. Durch die Kernform ist eine große aktive Oberfläche gegeben, und eine direkte Aufnahme der Kerne durch die Alveolar-wand in die Blutbahn ist möglich... Nicht nur für die Therapie, sondern auch für die Genese und Auslösung mancher Krankheiten ist das Kernproblem interessant. -Zusammenfassend muß den Kondensationskernen als Trägern chemisch-physikalischer, pharmakologischer Stoffe, als Elektrizitätsträgern und auch wegen ihrer Zahl und ihres Aggregatzustandes eine besondere Bedeutung für den Organismus zugewiesen werden'.
Schutzpflanzungen stellen im Kampf gegen Luftverunreinigungen aber kein Allheil-
384

mittel dar; vielmehr muß mit allem Nachdruck gefordert werden, daß die Erzeuger die Verunreinigungen selbst beseitigen. Jedoch sind Anpflanzungen sehr wirksame Hilfsmittel in der Abwehr, wenn sie richtig vorgenommen werden (Bernatzky, 1958 bis 1967). Man unterscheidet dabei (Hennebo, 1955):
Staubminderung in Anpflanzungen: Die Anpflanzungen liefern selbst keinen Staub und in sie eingewehter Staub wird durch den Bewuchs weitgehend festgelegt;
Staubminderung durch Anpflanzungen: Als Folge der durch die Anpflanzungen bewirkten Windabschwächung sedimentieren die Luftfremdstoffe.
Im zweiten Fall verhalten sich lockere, durchblasbare Pflanzungen anders als dichte, und im offenen Gelände sind die Verhältnisse wieder anders. Bei dichten Pflanzungen sinken die Staubwerte nach hohen Werten an der Luvseite innerhalb der Bestände rasch ab und erreichen an der Leeseite ihr Minimum; dann aber steigen sie wieder langsam an. Im freien Lande sinken die Staubwerte mehr oder wenig gleichmäßig ab mit der Entfernung von der Staubquelle. Bei lockeren, durchblasbaren Pflanzungen aber liegen die höchsten Staubwerte unmittelbar hinter der Pflanzung und zeigen von dort einen regelmäßigen Abfall mit der Entfernung von der Staubquelle.
Bei dichten Pflanzungen werden, infolge der erhöhten Windgeschwindigkeit beim Überströmen der als Hindernis wirkenden Pflanzung, die mitgeführten Luftbeimengungen mitgerissen und zum Teil über das Hindernis hinweggeführt, bis sie im Lee mit der Verlangsamung der Strömungsgeschwindigkeit wieder absinken. In der durchblasbaren Pflanzung dagegen dringt die Luftströmung samt ihren Fremdbestandteilen in die Pflanzung ein und sedimentiert in oder dicht hinter der Pflanzung. Jedoch tritt auch bei dichten Pflanzungen durch Verwirbelungen eine Ausfällung von Luftverunreini-nigungen ein, wenngleich nicht in dem Maße wie bei lockeren Pflanzungen.
Je kleiner und leichter die Teile (Kerne) des Aerosols, desto leichter folgen sie den Luftströmungen die sie über Hindernisse hinwegführen. Um hier auf längere Strecken eine spürbare Wirkung mit künstlichen Strömungsbarrieren zu erzielen, '-»ollen diese in bestimmten Abständen, entsprechend ihrer Höhe, angelegt werden. Auf diese Weise ließe sich dann eine wirksame Verbauung gegenüber den Fremdstoffen der Luft einrichten, die eine Ausfilterung (besonders der Stäube; und eine Fernhaltung der Kerne durch dauerndes Emporheben und Ableiten der Luftströmungen erreicht.
Genaue Daten sind leider nicht zu geben denn es fehlen exakte, vergleichbare Aerosol-Messungen. Vielleicht sind sie wegen der verschiedenen Ausgangslagen, meteorologischen Verhältnisse, topografischen und sonstigen Bedingungen schwer durchzuführen. Deshalb können nur vergleichbare Windschutzmessungen im Freiland (Nägeli, 1941, 1943, 1954) und im Windkanal (Kreutz and Walter, 1960) herangezogen werden. Daraus ergibt sich als Faustregel, daß eine Windabschwächung um wenigstens 10% etwa im Bereich der 5-fachen Höhe der Pflanzung vor und der 25-fachen Höhe hinter der Pflanzung erzielt wird. Bei einer Durchlässigkeit der Pflanzung von 40 % werden die besten Wirkungen erzielt. Im Winter zeigen entlaubte Pflanzungen 60% der sommerlichen Wirkung.
Die Ergebnisse im Windkanal stimmen mit denen der Freilanduntersuchungen überein, was die Reichweite der Schutzpflanzungen anbelangt. Sie zeigen ferner, daß
385

Entstaubende Wirkung von Anpflanzungen in Frankfurt/Main
(Vergleichswerte).
Hauptbahnhof Stadtzentrum Baumfreie Straße Baumbestandene Straße Park Nach Lamp, 1947.
Teilchen
früh
16.8 15,1 12,9 3,9 3,3
pro Luftquantum
mittags
18,3 13.2 10,2 3,0
1.2
abends
17,6 18,4 11.5 3,8
3.1
eine zu dichte Staffelung der Pflanzungen keinen weite, en Nutzeffekt gegenüber der Schutzwirkung eines einzigen Pflanzstreifens bewirkt.
Als Gradmesser für die entstaubende Wirkung von Anpflanzungen mögen die Vergleichswerte von Messungen in Frankfurt/Main an einem windschwachen Tag dienen (Lamp, 1947; Tabelle).
Wenn man die vorgehenden Feststellungen zur Anwendung bringt bei der Planung und Anlage von Schutzpflanzungen, erhält man folgende Richtlinien:
Anpflanzungen wirken als Staubfilter, besonders wenn sie senkrecht zur Hauptwindrichtung liegen ;
Wo möglich sind lockere, durchblasbare Pflanzungen mit solchen, die als Strömungshindernis wirken, zu koppeln;
Konzentrische Anpflanzungen bieten, zusammen mit grünen Radialverbindungen, einen allseitigen Staubschutz der umschlossenen Bezirke ;
Anpflanzungen von Industriebetrieben und -bezirken bedeuten nur ein zusätzliches, aber bei richtiger Lage, Aufbau und Zusammensetzung immer noch ein wirksames Mittel zur Staubfilterung;
Erholungsgebiete (Grünanlagen, Bäder) gehören nicht in die Emissionsgebiete von Industrieanlagen und sonstigen Staubquellen, auch wenn diese abgepflanzt sind.
Der Einfluß von Schutzpflanzungen auf gasförmige I uflVerunreinigungen
Die Frage, ob Wälder oder Schutzpflanzungen Gase, insbesondere SO2 ausfiltern wird von vielen bejaht. Lampadius (1963, 1968) weist darauf hin, daß gezielte Luftuntersuchungen auf breiter Basis darüber noch nicht angestellt sind. Er bestreitet aber, daß Laubwald eine wesentliche S02-filternde Wirkung besitzt. Eine ähnliche Auffassung vertritt auch Materna (1963). Der Grund ist, daß Waldbestände das Eindringen der Immissionen ins Innere nicht nennenswert verhindern; im Bestandesin-nern bedarf das Abklingen erhöhter SCh-Konzentrationen sogar längerer Zeit als im Freiland. Lampadius hält Schutzpflanzungen aber für 'unentbehrlich zur Abwehr schädigender Kümaelemente, durch die die Disposition der Waldbäume gegenüber der S02-Schädigung erfahrungsgemäß merklich gesteigert werden.'
Nähere Einzelheiten über die Frage nach der Verminderung der Rauchgaskonzen-
386

tration durch Waldstreifen führt Flemming (1967a) an : 'Bei der Einwirkung von Waldstreifen und Waldrändern auf die Rauchgasverteilung und die Rauchgasschädigung sind 4 Effekte zu unterscheiden :
die verringerte Windgeschwindigkeit ; die erhöhte Turbulenz, deren Wirkung auch noch jenseits des Leerandes erhalten
bleibt ; die - meist geringe - echte Filterung durch die Pflanzen; und die physiologische Entlastung der Pflanzen infolge des Windschutzes. Die Rauchgaskonzentration kann durch Waldstreifen nur in sehr seltenen Fällen
verringert werden, wenn sie mit wachsender Höhe über der Erdoberfläche deutlich abnimmt, z.B. bei Standorten oberhalb des ursprünglichen Rauchausbreitungsniveaus. Größere praktische Bedeutung hat der vierte Effekt (Windschutz)...'
Im Einzelnen führt Flemming weiter aus: 'Der Windeinfluß ohne Berücksichtigung der Turbulenz: Die Stromlinien fächern sich im Stammraum auf, die Strömung wird insgesamt vom Boden abgehoben. Im Stammraum herrschen im stationären Fall Konzentrationen, wie sie vor dem Waldstreifen in der bodennächsten Schicht auftreten. Bei ursprünglicher Konzentrationszunahme mit wachsender Höhe (Flachland) wird die Konzentration im Stammraum also insgesamt etwas absinken, bei ursprünglicher Konzentrationsabnahme mit wachsender Höhe (Standorte oberhalb des anfänglichen Ausbreitungsniveaus der Rauchfahnenachse) etwas ansteigen. Die durch den Luvrand hervorgerufenen Änderungen werden jenseits des Leerandes weitgehend wieder rückgängig gemacht, allerdings erst in verhältnismäßig großer Entfernung.'
'Der Turbulenzeinfluß : Die erhöhte Turbulenz des Waldstreifens insgesamt, besonders des luvseitigen Waldrandes, verstärkt die Rauchgasverwirbelung. Nimmt die Konzentration mit wachsender Höhe zu (Flachland), wird die entsprechende Normalverteilung abgeflacht. Bei gleichbleibender Gesamtrauchmenge muß die Konzentration am Boden etwas ansteigen, d.h. es wird zusätzlich Rauchgas von oben nach unten gewirbelt. Bei Konzentrationsabnahme mit wachsender Höhe (Standorte oberhalb des anfänglichen Ausbreitungsniveaus der Rauchfahnenachse, z.B. Oberhänge und Ge-birgskämme) liegt die Bodenoberfläche im Scheitelbereich der Normalverteilung, die erhöhte Turbulenz läßt die Konzentration in Bodennähe sinken. Das Rauchgas wird nach oben gewirbelt. Am Leerand wird die Wirkung des Luvrandes nicht wieder rückgängig gemacht.'
'Die echte Filterung von Rauchgasen: Eine Anlagerung von Rauchgasen an Pflanzen oder Pflanzenteile im Zusammenhang mit physiologischen Vorgängen ist zwar vorhanden, wird aber oft überschätzt. Insbesondere für Schwefeldioxyd ist die echte Filterung gering und kann meist vernachlässigt werden. Bei anderen Gasen können andere Verhältnisse vorliegen.'
'Windschutz als Rauchschutz: Die im Bereich von Waldbeständen und Waldstreifen verringerte Windgeschwindigkeit wirkt auf indirektem Wege günstig. Für Pflanzen sind zu hohe Windgeschwindigkeiten nachteilig und steigern die Gefährdung gegenüber Rauch. Windschutz bedeutet eine physiologische Entlastung der Pflanzen. Von allen vier Effekten ist dieser zahlenmäßig wohl am bedeutendsten. Die Gaskonzentration ändert er aber nicht. Besonders an windexponierten Standorten sind entsprechen-
387

de Schutzmaßnahmen (Schutzriegel) u.U. sinnvoll und wirksam.' Zum Schluß beantwortet Flemming die Frage nach der Verringerung der Rauch
gaskonzentration durch Wald wie folgt : 'Zwei Bedingungen müssen erfüllt sein, damit durch einen Waldstreifen die Rauchgaskonzentration verringert werden kann. Erstens muß die Rauchgaskonzentration mit der Höhe abnehmen. Der Waldstreifen muß höher liegen als das anfängliche Ausbreitungsniveau der Rauchfahnenachse. Das kann z.B. realisiert sein, wenn sich die Rauchquelle im Tal befindet, der Waldstreifen auf einem Oberhang, auf einem Bergrücken oder auf einer Hochfläche. Im Flachland nimmt die Rauchgaskonzentration mit wachsender Höhe nur bei Rauchquellen in unmittelbarer Bodennähe ab (evt. bei Abraumhalden). Zweitens darf der Abstand des Waldstreifens von der Rauchquelle nicht zu groß sein. Je größer der Abstand ist, desto geringer wird infolge der allgemein vorhandenen turbulenten Verwirbelung die Änderung der Rauchgaskonzentrationsverteilung mit der Höhe. Bei großem Abstand ist das Höhenprofil schon so abgeflacht und verbreitert, daß die zusätzliche Verwirbelung durch die Waldstreifen kaum noch ins Gewicht fällt. Die Wirkung von Waldstreifen ist umso deutlicher, je näher sie an der Rauchquelle liegen.'
Das von Wentzel (1962) angeführte Beispiel für die positive Auswirkung eines Waldstreifens führt Flemming darauf zurück, daß die beiden Bedingungen in diesem Fall vorhanden waren.
Besonders interessant sind die Untersuchungs- Ergebnisse von Herbst (1965, 1968) in Bezug auf die Reduktion radioaktiver Substanzen in fester wie in gasförmiger Form durch Anpflanzungen. Das Laub der untersuchten Bäume zeigte auf der Wetterseite bis zu vier mal höhere Gesamtradioaktivität als auf der wetterabgewandten Seite. Futter- und Nahrungspflanzen im Windschatten von Waldstreifen wiesen nur 1/5 des radioaktiven Befalls gegenüber den Pflanzen auf der wetterzugewandten Seite auf; in Einzelfällen stieg die Reduktion bis auf 1/20. Selbst in wenig durchgrünten Stadtteilen wurde nur 6 0 - 7 5 % des radioaktiven fall-outs gemessen gegenüber nicht durchgrünten Stadtteilen.
Beim flüchtigen Radiojod zeigte sich, daß bei schwacher Luftbewegung 1 kg Blattmasse innerhalb von Tagen bis 1 Curie Radiojod aufgenommen hatte, bei kürzerer Zeit und stärkerer Luftbewegung weniger. Dabei hing 2/3 des Radiojod den Blättern oberflächlich an während 1/3 eingedrungen war (wohl durch die Spaltöffnungen). 'Herabminderungen des Zuflugs radioaktiven Materials beispielsweise nur um 30 oder 60%, wie sie im Schutz von Wäldern möglich sind, können unter Umständen bereits dazu beitragen, Gesundheit und Leben zu erhalten. Im Falle einer Strahlenbelastung des ganzen Körpers mit etwa 600 Dosiseinheiten (rad) und einer Sterblichkeitsrate von fast 100% würde beispielsweise eine Minderung der Strahlenbelastung um nur 1/3 die Sterblichkeit auf etwa 50% und um 2/3 auf nahezu Null senken' (Herbst, 1965). Schutzpflanzungen 'verändern also das Verteilungsmuster radioaktiven Materials, aber sie vernichten die Radioaktivitäten nicht.'
In Bezug auf die quantitativen Beziehungen zwischen dem Umfang des bei der Humuszersetzung, durch Hausbrand und Industriefeuerungen frei werdenden Kohlendioxyd und dessen Verbrauch durch Bäume und andere Pflanzen fehlen spezielle Untersuchungen. Die rechnerischen Erfassungen dieser Zusammenhänge aber als speku-
388

lativ abzuwerten (Lampadius, 1963), scheint den Verhältnissen aber auch nicht gerecht zu werden, zumal ja die Bäume selbst eine integrale Aussage machen: Bei einer Höhe von 25 m und einem Kronendurchmesser von 15 m besitzt eine völlig frei aufgewachsene Buche im Alter von 100 Jahren mit der Masse ihrer Wurzeln, dem Stamm, den Ästen und Zweigen einen Rauminhalt von rund 15 m3 Trockensubstanz, die je Kubikmeter 800 kg wiegt. Dies ergibt für den gesamten Baum 12000 kg; die Hälfte davon ist Kohlenstoff. Da jeder Kubikmeter Luft 0,15 g C oder 0,5 g CO2 enthält, stammt der im Baum festgelegte Kohlenstoff aus dem Kohlendioxyd von 40 Millionen m3
Luft, das ist der Inhalt von rund 80000 Einfamilienhäusern von je 500 Kubikmetern umbauten Raumes. Demnach hat die Buche statistisch pro Jahr das Kohlendioxyd von 800 Häusern umgesetzt (Bernatzky, 1967).
Schutzpflanzungen und Lärm
Eine 'Luftverunreinigung' besonderer Art stellt der Lärm dar. Untersuchungen und Überlegungen über die lärmsenkende Wirkung von Schutzpflanzungen sind zwar öfters angestellt worden, sie sind aber besonders schwierig, weil zu viele Faktoren beachtet müssen. Mancher Beitrag zu diesem Thema beruht auf allgemeinen Überlegungen, ohne auf die spezifischen Fragen der bezüglichen Pflanzenarten einzugehen. Beck (1965, 1967) hat den Versuch unternommen, das artspezifische Lärmminderungsvermögen (den A L-Wert) der verwendeten Arten festzustellen. Er kam zu folgenden Ergebnissen :
1. Maximal beläuft sich die Lärmminderung durch Pflanzen auf etwa 10 dB bzw. rund 10 DIN-Phon, und zwar besonders im Frequenzbereich von mehr als 1000 Hz bis zu 11 200 Hz (Maximum meistens bei 8000 Hz). Sie erreicht demnach nicht den Wirkungsgrad von Mauern und Wällen. 2. Das'Lärmminderungsvermögen von Gehölzen ist artspezifisch. Beck stellte Wertgruppen auf, die die Eignung für die Herabsetzung von Lärm angeben. Davon sind vier in diesem Zusammenhang interessant: Wertgruppe III: Lärmminderung um 4-6 dB:
Juniperus chinensis cv. Pfitzeriana Lonicera maackii Betula verrucosa Crataegus x prunifolia Alnus incana Lonicera ledebourii Cornus sanguinea Acer negundo Cornus alba Populus canadensis-Hybriden Pterocarya fraxinifolia Cory lus a vel la na Forsythia x intermedia Tilia cordata Sambucus nigra
Wertgruppe IV: Lärmminderung um 6-8 dB: Philadelphus pubescens Hex aquifolium Carpinus betulus Ribes divaricatum Syringa vulgaris Quercus robur Fagus sylvatica Rhododendron
389

Wertgruppe V: Lärmminderung um 8-10 dB: Populus X berolinensis Viburnum rhytidophyllum Viburnum lantana Tilia platyphyllos
Wertgruppe VI: Lärmminderung um 10-12 dB: Acer pseudoplatanus Entscheidend für die Herabsetzung des Lärms sind folgende Gesichtspunkte :
a. Die Pflanzen müssen möglichst große Blätter mit starker und harter Struktur besitzen. b. Die Blätter sollen möglichst senkrecht gegen die Einfallsrichtung des Schalles angeordnet sein und sich überlappen. c. Die Pflanzung muß eine hohe Belaubungsdichte auch im Innern des Wuchsraumes besitzen. d. Gehölze deren Laub im tiocken Zustand den Winter über hängen bleibt (Hainbuche, Eiche) sind während dieser Jahreszeit wirksamer als solche die ihre Blätter völlig verlieren. e. Die landläufig als geeignet erscheinenden immergrünen Nadelholzarten 'bewirken allgemein nur geringe Effekte' (Beck, 1967, S. 93). f. Die meisten der in unseren Breiten kultivierbaren immergrünen Laubgehölze kommen in der Bewertung etwas besser weg da 'ihre blattspezifische Wirkung teilweise sehr gut ist' (ibid., S. 93). Das gilt besonders für Viburnum rhytidophyllum und Rhododendron- Arten. g. Schutzpflanzen gegen Lärm müssen von unten her dicht belaubt sein, besonders in ihrer der Schallquelle zugewandten Seite. h. Parallel hintereinander gestaffelte Pflanzenwände verstärken die Schutzwirkung. Über die 'Tiefenwirksamkeit' fehlen aber konkrete Angaben.
Einen systematischen Aufbau vorausgesetzt geben Schutzpflanzungen ein wertvolles Hilfsmittel zur Lärmminderung.
Gesamtwirkung von Schutzpflanzungen im Hinblick auf die Verbesserung der Umweltsbedingungen
Bisher wurden einzelne Faktoren im Blick auf die Wirksamkeit von Schutzpflanzungen betrachtet. In Wirklichkeit treten sie aber nie isoliert auf, sondern in gegenseitigem Wechselspiel, sich teils verstärkend, teils abschwächend. Deshalb sei zum Schluß eine sozusagen 'integrale' Betrachtung gestattet.
Die Wirksamkeit von Schutzpflanzungen erschöpft sich nicht in der Reduzierung von Luftverunreinigungen. Sie greifen vielmehr, selbst wenn es sich nur um Einzelbäume handelt, wesentlich in die kleinklimatischen Verhältnissen innerhalb der dicht bebauten Industrie- und Wirtschaftszentren ein (Bernatzky, 1966). Die Anhäufung von Gebäuden, Straßen usw. verstärken die Wärmespeicherung, während die Herabsetzung der Entwärmungsmöglichkeiten, insbesondere durch das Fehlen der Vegetation, zu einer deutlichen Überwärmung der Siedlungszentren dem freien Land gegenüber führt. Bei vergleichende Messungen in Frankfurt/Main (Bernatzky, 1960) ergab sich, daß Anpflanzungen von 50-100 m Breite die Temperatur klar herabsetzten,
390

An windschwachen Strahlungstagen, die durch das Vorhandensein einer zonalen Hochdruckbrücke gekennzeichnet waren, wurden Temperaturerniedrigungen in den Anpflanzungen bis zu 3,5 °C gemessen. Dies entspricht theoretisch einer Höherlegung dieser Anpflanzungen um 700 m (entsprechend der Temperaturabnahme um etwa 1 °C je 200 m Höhenanstieg). Diese Temperaturabsenkung muß als sehr beträchtlich angesehen werden. Sie trat noch ein, obwohl dauernd kühle Anlagenluft nach beiden Seiten in das anschließende bebaute und überhitzte Stadtgebiet abfloß (Figur 1).
Da die erwärmte Luft über dem Stadtkern nach oben steigt, wird in das dabei entstehende 'Vakuum' von allen Seiten Luft angesaugt. So entsteht ein eignes Windsystem der 'Flurwind', der eine Depression oder Zyklone im Kleinen bedeutet (Figur 2). Nach Berg (1943, 1947) verlangt die Entstehung eines eignen Windsystems 5°C Temperaturunterschied und nur 0,07 mb Druckdifferenz, Beträge, die offenbar an heißen Sommertagen gegeben sind. Dann kann ein Wind von 3,3 m/s entstehen, das sind rund 12 km/Stunde. Bei diesem Wind wird eine Großstadt in einer Stunde entlüftet. Gleichzeitig heben Anpflanzungen die relative Luftfeuchtigkeit wieder an, sodaß die extreme Trockenheit der Stadtluft im Sommer abgemildert wird (Bernatzky, 1960).
In diesem Zusammenhang muß die Anpflanzung von Bäumen und Sträuchern in dicht bebauten Gebieten gesehen werden. Die Temperaturunterschiede zwischen den bebauten Gebieten und den dazwischen liegenden Grünflächen, zwischen baumlosen und baumbestandenen Straßen, rufen kleine und kleinste Luftkreisläufe der oben beschriebenen Art hervor, bei denen sich die kühlere unter die wärmere Luft schiebt. Diese Kreisläufe bewirken dabei einen Luftaustausch auf kleinstem Raum. Je größer flächenmäßig die Anpflanzungen sind, umso günstiger ist die Auswirkung auf die Umgebung. Gleichzeitig wird die in das Siedlungszentrum nachströmende Luft bei ihrem Durchgang durch die Pflanzungen von den mitgeführten Teilchen befreit, gefiltert (Figuren 4 und 5).
Im Zusammenhang mit der temperatursenkenden Wirkung stellen solche Anpflanzungen das einzige natürliche Mittel dar, das denaturierte Klima unserer Städte und Industrieanlagen auf das des freien Landes zurückzuführen und es für die dort wohnenden Menschen wieder zuträglich zu machen.
W/4% y&f s 'iA\ S WV. ^-~~~~
_J2—-—t-
M - V - —
33,5* C
' •
^%7>
- " X
- ^
nW J Y-/y/
UM Fig. 1. Auswirkung einer ringförmigen Anpflanzung von Bäumen und Sträuchern auf die Temperatur (offene Pfeile: zunehmende Erwärmung: schwarze Pfeile: aus der Pflanzung abfließende kühle Luft).
391

Auswirkung von Schutzpflanzungen bei windstillem Wetter
Fig. 2. Entstehung des 'Flurwindes' und des 'Dunstdomes' als Folge einer Zyklone.
Fig. 3. Allseitige ständige Zunahme der Luftverunreinigungen zum Zentrum hin.
Fig. 4. Unterbrechung der Zunahme der Luftverunreinigungen ; Luftfilterung durch Schutzpflanzungen.
30.3 S=0 ft?r-°-^i
33.« C 30.3 r
Fig. 5. Unterbrechung der Temperaturzunahme, Abkühlung der Luft durch Schutzpflanzungen, Versorgung der anschließenden Gebiete mit kühler sauberer Luft.
Fig. 6. Schema des Temperaturausgleiches zwischen Anpflanzungen und der Umgebung .-Reinigung der absinkenden Luft durch die Bäume, Abfließen der kühlen (und sauberen) Luft in die anschließenden Flächen.
Auswirkung von Schutzpflanzen bei windigem Wetter
Fig. 7. Verschmutzung der Stadt von der Hauptwindrichtung her. Schematischer Verlauf der Luftströmung.
Fig. 8. Filterung und Entstaubung der Luft als Folge der Schutzpflanzung.
392

Zur Praxis der Begründung von Schutzpflanzungen
Die Planung von Schutzpflanzungen ist eine komplizierte Sache, denn sie setzt genaue Kenntnisse der Zusammenhänge zwischen einer Reihe Faktoren verschiedener Disziplinen voraus (Meteorologie, Bioklimatologie, Bodenkunde, Physiologie, usw.). Die Pflanzung selbst bringt nachher die geringsten Sorgen mit sich.
In Deutschland existiert seit über drei Jahrzehnten eine entsprechende Planer-Ausbildung; andere Länder haben ähnliche Studien- und Ausbildungsgänge, deren aller Ziel die Integration der von den einzelnen Disziplinen zur Verfügung gestellten Forschungsergebnisse ist. Nur wenn alle bisher bekannten Forschungsresultate in die Planungen mit einfließen, werden Schutzpflanzungen erstellt werden können, die den Erwartungen entsprechen.
Summary The importance of protective plantations in lowering air pollution
Protective plantations cannot solve the problem of air pollution alone but they can substantially assist (1) if the right resistant plants are used, (2) if the plantations are established in the right manner, and (3) if the meteorologie and topographic conditions are taken into account.
Air pollution may be caused by solid particles that have to be filtered out, or by gases that have to be dispersed by derecting the polluted air in a direction where it can do no harm, which usually means upwards.
Filtering can be carried out by planting of open stands of trees or shrubs in which the velocity of the wind decreases and the particles settle. But to stop gases, dense stands are needed. The area on which the latter act are at most 5 times the height of the stand at the windward side, 25 times at the leeward side.
In protective plantations the longitudinal axes have to run across the prevailing direction of wind. In areas without wind (e.g. in towns) the hot air ascends and relatively cold air pours in from all sides, leading to the accumulation of polluted air in the centre that has to be filtered by concentric plantations, (at least theoretically; this is hardly ever practical).
Especially where several factories emitting both kinds of pollutants occur in the same urban area, planning protective plantations is a complicated procedure. But it should be remembered that all forests and plantations are favourable by lowering the temperature, by increasing the relative air humidity and by creating local air-circulation areas in which the air may be considerably purified.
Resume L'intérêt des plantations protectrices pour la lutte contre la pollution atmosphérique
Les plantations protectices ne peuvent pas résoudre le problème de la pollution atmosphérique, mais elles peuvent contribuer largement à sa solution, à conditions : 1. qu'on emploie les dégétaux résistants appropriés,
393

2. que les végétaux soient plantés correctement. 3. qu'on tienne compte des conditions météorologiques.
La pollution atmosphérique peut être due aux particules solides, qui doivent être enlevées par filtration, ou aux gaz, qui doivent être dispersés; à cet effet, on envoie l'air pollué dans une direction où il n'a plus d'effets nuisibles et cela veut dire, dans la plupart des cas, vers le haut.
Pour filtrer les particules solides, on peut planter des futaies ouvertes d'arbres ou de buissons qui diminuent la vitesse du vent, de sorte que les particules sont fixées. Cependant, pour retenir les gaz il faut des futaies serrées. La superficie où s'étend l'influence de ces dernières est, au maximum, 5 fois la hauteur de la futaie du côté du vent et 25 fois cette hauteur du côté sous le vent.
Dans les plantations protectrices, l'axe longitudinal doit s'allonger perpendiculairement à la directions des vents dominants. Dans les régions sans vent (par ex. dans les villes), l'air chaud monte et est remplacé par de l'air relativement froid venant de tous côtés, de sorte qu'au centre s'accumule de l'air pollué qui doit être filtré au moyen de plantations concentriques (en théorie, au moins; en pratique, cette idée n'est guère réalisable).
Surtout dans le cas où plusieurs usines émettant les deux sortes de pollutants se trouvent dans la même région urbaine, le planning relatif aux plantations protectrices est une procédure compliquée. Mais il ne faudrait pas oublier que toutes les forêts exercent une influence favorable en baissant la température, en augmentant l'humidité relative et en créant à plusieurs endroits des régions de circulation d'air où peut s'effectuer une purification importante de l'atmosphère.
Literatur
Amelung. W. und H. Vogt. 1952. Einführungen in die Balneologie und medizinische Klimatologie. Berlin, Göttingen, Heidelberg.
Beck, G. 1965. Untersuchung über Planungsgrundlagen für eine Lärmbekämpfung im Freiraum mit Experimenten zum artspezifischen Lärmverminderungsvermögen verschiedener Baum- und Straucharten. Diss. Technische Hochschule Berlin.
Beck, G. 1967. Pflanzen als Mittel zur Lärmbekämpfung. Hannover, Berlin. Berg, H. 1943. Bioklim. Beibl. 10: 65-70. Berg, H. 1947. Einführung in die Bioklimatologie. Bonn. Bernatzky, A. 1949. Garten u. Landschaft 59: 20. Bernatzky, A. 1955. Gartenamt 4: 29-32. Bernatzky, A. 1958. Städtehygiene 10: 191-5.
Bernatzky, A. 1960. Von der mittelalterlichen Stadtbefestigung zu den Wallgrünflächen von heute. Berlin, Hannover. Bernatzky, A. 1963. Die Regeneration der Städte und das Grün (unveröffentlichtes Manuskript). Bernatzky, A. 1964. offen«. Wirtsch. 13: 170-8. Bernatzky, A. 1966. Anthos 5: 29-34. Bernatzky, A. 1967. Baumzeitung 1: 3-5. Flemming, G. 1967a. Luft- u. Kältetech. 6: 255-8. Flemming, G. 1967b. Atmosph. Environm. 1: 239-52. Goldmerstein, J. und K. Stodiek. 1931. Wie atmet die Stadt? Berlin. Hennebo, D. 1955. Staubfilterung durch Grünanlagen. Berlin. Herbst, W. 1965. Forst- u. Holzwirt 20: 216-9.
394

Herbst, W. 1968. VDI Nachr. 22:1-2. Kahl, H., W. Muschter, D. Paun und F. Vollbrecht. 1963. Angew. Met. 4: 318-9. Kratzer, A. 1956. Das Stadtklima. Braunschweig. Kreutz, W. und W. Walter. 1960. SchrReihe Inst. Naturschutz Darmstadt 5: 83-103. Lamp, W. 1947. Untersuchungen über den Staubgehalt einer vom Krieg teilweise zerstörten Groß
stadt. Dipl. Arbeit Technischen Hochschule Darmstadt. Lampadius, F. 1963. Angew. Met. 4: 248-9. Lampadius, F. 1968. Wiss. Z. tech. Univ. Dresden 17: 503-11. Linke, F. 1940. In: Biologie der Großstadt: 75-90. Materna, J. 1963. Tagungsber. III. Bioklimatischer Konferenz über Fragen der Luftverunreinigun
gen. Prag: 156-70. Nägeli, W. 1941. Schweiz. Z. Forstwes. 11: 265-80. Nägeli, W. 1943. Mitt. Schweiz. Anst. forstl. Vers Wesen 23: 223-76. Nägeli, W. 1954. Ber. 11. Kongr. Int. Verb, forstl. ForschAnst. : 240-6. Neuwirth, R. 1965. Forst- u. Holzwirt 20: 220-3. Rudder, B. de. 1952. In : Klima-Wetter-Mensch .Heidelberg. S. 91-169. Weickmann, L. und H. Ungeheuer. 1952. In: Klima-Wetter-Mensch. Heidelberg. S. 11-90. Wentzel, K. F. 1960. Landwirtschaft-Angew. Wiss. 107: 140-68. Wentzel, K. F. 1962. Wiss. Z. tech. Hochsch. Dresden 40: Wentzel, K. F. 1966. Angew. Bot. 40. Zieger, E. 1956. Wiss. Z. tech. Univ. Dresden 6: 777-87.
395

Discussion in Section 10 : Shelterbelts for air purification
Reporter: A. Raad
Participants: Bossavy (Chairman), Halbwachs, Mathé, Miss Novâkovâ, Stephan, Wentzel.
The great importance of protective plantations, especially for the population in the industrial conglomerates, is accentuated. This does not refer only to dust and exhaust gases, but also to all kinds of noises and odours. The conditions under which they grow and the structure of these shelter belts have been discussed. Their efficiency depends on their extent, for which a minimum has to be determined depending on the object to be protected and other circumstances. Sometimes it is sufficient to plant relatively narrow forest strips, say up to 300 m wide.
Careful planning and planting are necessary because 20 to 30 years will pass before the required height has been obtained. Permanent care of the stands is necessary.
To establish protective plantations (belts of trees and shrubs) a good co-operation between various scientific branches and the planning departments of cities, counties, factories, etc. is needed.
Special reference has been made to the fact that protective plantations and forests render harmless radioactive substances. It has been confirmed that this is due to their filtering effect though, of course, the half-life of the involved elements cannot be changed.
Several participants reported on protective plantations already established, among them some for experimental purposes.
397


Epilogue
H. Eilers
Chairman of the Committee of Experts on Air Pollution of the Council of Europe
At this last sitting of the Symposium on the Effects of Air Pollution on Plants and Animals, I wish to express my thanks to the Committee for the Conservation of Nature and Natural Resources of the Council of Europe and to the Government of the Netherlands for organizing this meeting.
Conferences like these afford us, I believe, one of the most fruitful possibilities of international collaboration in the study of problems such as this one. Not only are comparisons of the results achieved in the various countries bound to enrich the studies of all those engaged in research, but the discussion of difficulties and problems that have not yet been overcome can be extremely helpful to them, too. Of great importance is making personal acquaintance with colleagues working on similar problems.
The problems created by air pollution are not confined by political frontiers. They arise in all countries where industrialization is rapid and especially in those of the temperate zone. The organizers of this meeting were right not to limit their invitations to specialists in Council of Europe's member states, but to seek also the collaboration from scientists of other countries confronted with similar difficulties.
The-Czechoslovak contributions, made by Mr J. Hajduk and Mr. M. Ruzicka, by Mrs E. Novâkovâ and by Mrs G. Balazovä and Mr E. Hluchân provided valuable information on the effects of air pollution on natural flora and fauna, while the lectures, given by representatives from the USA, Mr E. F. Darley and Professor J. B. Mudd, United States, dealt with photochemical pollution.
A few government officials and industrialists on whom falls the responsibility of taking legal and technical measures to combat the effects of air pollution, were also invited to attent. One of their duties is or will be to devise methods of assessing the degree of pollution in threatened areas. The working papers presented by Mr H. Stratmann and Mrs M. Clifton have shown us the principles underlying the action taken in the matter by the Federal Republic of Germany and the United Kingdom.
In the German paper, attention was concentrated on important principles such as temporal variations of immissions at a given point in the environment, on variations in the sensitivity of plants of different species, or different varieties within the same species, and on the bearing of these principles on the criteria to be adopted for thresholds of harmfulness. A discussion of graphs of these variations (Stratmann, Mr P. E. Joosting, Mr R. Zahn) revealed fairly wide differences in the methods employed for appraisal.
401

Mr M. Buck discussed the conditions necessary for experiments designed to ascertain the effects of air pollution on crops. Experiments in artificial atmospheres must be so conducted as to yield results comparable with those which would be obtained in real circumstances; in other words, the periods of exposure and the concentrations of toxic matter must be comparable with those outside. Field trials must be so organized as to yield precise data on the pollutant in question. Consequently, it is often necessary, in the threatened places, to study in the threatened places reactions of plants which are very sensitive to a particular contaminant ; some of the papers (Mr A. van Raay, Darley) gave us useful information about selection of these indicator plants and on the limitations of the method.
The working papers and the discussions have shown that there is an essential difference between studies of the effects of air pollution on plants and studies of the effects on animals. In the case of plants, interest is focused on the direct and acute effects of air pollution from substances such a sulphur dioxide, hydrofluoric acid, ozone or photochemical smog; only some studies deal with chronic effects, such as those caused by acidification of the soil, by accumulation in the soil of substances harmful to crops (Mr T. Pesek, Hajdük and Ruzicka) or on the weaking of trees as a result of prolonged exposure to a polluted atmosphere (Mr K. F. Wentzel, Mr J. Pol-lanschiitz).
In the animal kingdom, it is mainly the indirect and chronic effect of ingested pollutants (e.g. fodder polluted by fluorides, lead or other substances) that have been studied, but animals are, like human beings, also directly threatened by inhalation of heavily polluted air, as was proved by the sudden death of many cattle at Olympia Hall during the London fog in 1952. Keeping small birds (canaries) in workshops prone to heavy concentrations of carbon dioxide is an ancient custom: as long as the bird does not show any signs of asphyxia, the human being does not have to worry. Experiments have also been carried out on animals (e.g. mice, rats, dogs) to study the effects of air pollution on man.
Nearly all the working papers deal with air pollution caused by human activity. Only that of Mr R. S. Edwards deals with a natural pollution, that is, pollution caused by sea salt which is often carried inland over some distance by the wind and which damages vegetation, particularly conifers. This problem arises also in the coastal dunes of the Netherlands.
The damage done to vegetation by air pollution is mainly due (Mr J. Bossavy) to a small number of compounds of which the principal ones are sulphur dioxide, hydrofluoric acid and its derivatives and to substances present in an oxidizing atmosphere, namely ozone and the peroxyacyl nitrates (PAN).
Sulphur dioxide is the most widespread of these substances because it is formed during the combustion of nearly all fuels and also because it occurs in the gases emitted by some chemical and metallurgical industries. Its action on bryophytes and lichens has been thoroughly discussed (Mr W. J. Syratt, Professor F. LeBlanc, Mr J. J. Bark-man, Mr O. L. Gilbert). Epiphytic lichens are extremely sensitive to SO2. Gilbert has found that many species disappear where the mean winter concentration of SO2 exceeds 50 microgrammes per cubic metre. The occurrence of lichens at a certain
402

place can be regarded, therefore, as evidence that the air is not heavily polluted by SO2. One of the effects of SO2 on bryophytes and lichens is the decomposition of chlo
rophyll and the formation of phaeophytin (Syratt, LeBlanc); This phenomenon has already been described in the case of phanerogams by Mr Katz. Anatomic deformation in lichens have also been observed (LeBlanc).
Whereas the symptoms of SO2 action on phanerogams well are known, knowledge on the chemistry of this action and its 'detoxification', when present in low concentrations, failed. Mr L. de Cormis has described his research on this question. The sulphur from the absorbed SO2 can be found soon afterwards in the organic compounds of leaves, such as amino acids and proteins. The SO2 is 'detoxified' not only through the formation of neutral sulphates remaining in the leaf, but also through its transformation into hydrogen sulphide which is exhaled; light being necessary for this process.
Mr K. Stefan has demonstrated that the degree of injury caused by SO2 to leaves of conifers is influenced by the fertilizers used.
The damage caused by hydrofluoric acid was the subject of various working papers presented at this Symposium (Bossavy, Professor H. Robak, Mr F. H. J. G. Spierings, Mr A. Rippel, Mr A. Bovay, Mr A. Bolay, Van Raay). In many of the papers the effects studied are those caused by pollution due to the manufacture of aluminium and steel, in which fluorides are used to lower the melting point of the ores.
Other cases of damage can be attributed to the action of gases which are released when earths containing fluorides are treated in acids (manufacture of superphosphates, phosphoric acid, glasswork and ceramics).
The sensitivity of plants to this pollutant varies widely with the species. I hope that Bolay's research on the influence of different kinds of fertilizers on the severity of the damage caused to apricot trees and vines in the Canton of Valais will also open ways to limit losses in other branches of horticulture, including bulb growing in the Netherlands.-
Mr G. Halbwachs' paper provided us with information on the effects of tar on the green parts of plants. He has identified the harmful constituents of tar and has shown the importance of ultraviolet radiation for the occurrence of this damage.
Oxidizing atmospheres, such as Los Angeles smog, were the subject of two very interesting United States papers (Darley, Mudd). Darley described the markings of ozone and of the peroxyacyl nitrates (PAN) on leaves, while Mudd told us about the biochemical reactions caused by ozone and PAN in the plant cells.
In October 1965, vegetables (salad, spinach, chicory) and other plants at the West-land horticultural district, situated between The Hague, Rotterdam and the sea, suffered rather severe damage of the type caused by PAN. Later on, on some autumn and spring days rather high concentrations of ozone (up to 700 microgrammes per cubic metre) occurred at noon, while a light mist with a marked smell was noticeable. These phenomena, which point of the possibility o*" photochemical reactions, leading to 'Los Angeles smog' in a country with the latitude of the Netherlands, may have been produced by the following factors : 1. in this area the pure air blown in from the sea often contains fairly heavy concentration of ozone (e.g. 100 microgrammes/m3) ;
403

2. there is very heavy motor traffic in this area (The Hague, Rotterdam, Vlaardingen, Schiedam and Delft, as well as in the industrial zone which runs for 30 km along the southern border of the horticultural district) ; 3. this industrial zone is one of the world's largest centres of mineral oil refining and petrochemical industry and has also a heavy output of organic chemical products (solvents, plastics).
The sensitivity to air pollution varies widely between plants. This fact allows us to choose certain plants for the detection of different types of pollution as well as to select for commercial cultivation in industrial areas species or even varieties of plants which are rather resistant. A great deal of information on this subject was provided in papers such as those by Van Raay, Darley, Robak, Wentzel, Pollanschiitz and Dr. A. Bernatzky.
The discussions also dealt with the effects of air pollution on animals. General information on this question was provided by Bossavy; other papers described the effects of pollution on particular species or from particular toxic substances.
Mrs Novâkovâ described the physiological effect on hares of a rather weak pollution which did not give rise to pathological symptoms. Mrs Balâzovâ discussed the effects of pollution by fluorine compounds on frogs, sparrows, pigeons and poultry. Fluorosis in cattle was discussed by Bossavy, Professor S. Stamatovic and Professor F. Ender. Professor Ender also mentioned ways of eliminating fluorine from fodder.
Other forms of air pollution endangering the health of animals, for example those due to lead compounds of industrial origin (Stamatovic), or from exhausts of motor traffic (Dr A. Kloke) and to compounds of molybdenum (Mr J. H. P. Verwey), were also discussed.
No summary of a week's Symposium can be complete. In my selection of questions mentioned here, I was largely influenced by those with which I am concerned in my daily work at the Dutch Ministry of Health. I trust that omissions will be forgiven. Another rapporteur might have made a different selection and emphasized other points.
In the course of the discussions the following points were raised, which, in the opinion of speakers, call for closer international collaboration and international agreements. These include: 1. international adoption of uniform units of measurement for concentrations and deposits of pollutants; 2. standardization of the mathematical processing of large numbers of measurements made at a given place and of data on harmful effects, obtained from a series of experiments with variations in duration of exposure and in concentration of the pollutant; 3. standardization of sampling and analysing methods for the various pollutants; 4. development of a system of warning against critical meteorological conditions; 5. use of cryptogamous epiphytes for the detection of air pollution (because they are easy to handle and because the range of their specific sensitivity to polluting agents
404

in the atmosphere is much wider than that of vascular plants). I think we can lay these recommendations before the Council of Europa and that
it will then be possible for its Committee for the Conservation of Nature and its Committee of Experts on Air Pollution to advise the Committee of Ministers how further consideration might be given to these questions. For example, small symposia might be convened or, to avoid duplication, some other international organization, such as OECD, WMO or WHO, might be invited to take up one or more of these questions.
I would draw your attention to the formation of an international phytopathological association, already mentioned by Dr ten Houten which will hold a meeting in London in the summer, at which the damage caused to plants by air pollution will also be discussed.
The Symposium has been of great benefit to us all and we shall long remember these pleasant, though often arduous, days.
I wish, therefore, to thank all those who have contributed to the success of the Symposium and, above all, colleagues on the Organizing Committee, especially its Chairman, Dr J. G. ten Houten and its Secretary, Mr J. Drijver, for their work in organizing the Symposium and the excursion and for making arrangements to receive participants.
I should like also to express the thanks of all of us to the Dutch Ministry of Agriculture for making available the Staring Building and its splendid facilities, to the Government of the Netherlands, the Koninklijke Nederlandse Hoogovens en Staalfabrieken and to Esso Nederland for the receptions they gave us.
In closing, I thank the translators and all those who have assisted us.
405

List of participants
Austria F. Beran, Bundesanstalt für Pflanzenschütz, Trunnerstraße 5, 1020 Wien. G. Halbwachs, Gregor Mendelstraße 33, A-1180 Wien. O. Härtel, Institut für Anatomie und Physiologie der Pflanzen, Schubertstraße 51,
Graz. J. Pollanschütz, Institut für Ertrags- und Betriebswirtschaft, Forstliche Bundesanstalt,
A-1131 Wien. K. Stefan, Institut für Forstschutz, Forstliche Bundesanstalt, A-1131 Wien.
Belgium J. Bouquiaux, Institut d'Hygiène et d'Epidémologie, 14 Rue Juliette Wytsman,
Bruxelles 5. R. Impens, Faculté des Sciences agronomiques de l'État, Gembloux. A. Noirfalise, Faculté des Sciences agronomiques de l'État, Gembloux.
Canada Mlle. Gilberte Comeau, Département de Biologie, Université d'Ottawa. F. LeBlanc, Département de Biologie, Université d'Ottawa.
Czechoslovakia Mme Gabriela Baläzova, Institut für Hygiene, ul. Cs. armädy 40, Bratislava. Mme Eliska Novâkovâ, Académie des Sciences tchécoslovaque, Kar. Svetlé 10,
Praha 1. F. Pesek, Pedagogickä fakulta v Üsti n.L., Ceské mlädeze 8, Praha. A. Rippel, Institut für Hygiene, ul. Cs, armädy 40, Bratislava. M. Ruzicka, Üstav Biologie Krajiny, Slovenskej akadémie vied, Sienkiewiczova 1,
Bratislava.
Denmark H. Sand, National Health Service, St. Kongensgade 1, 1264 Copenhagen.
407
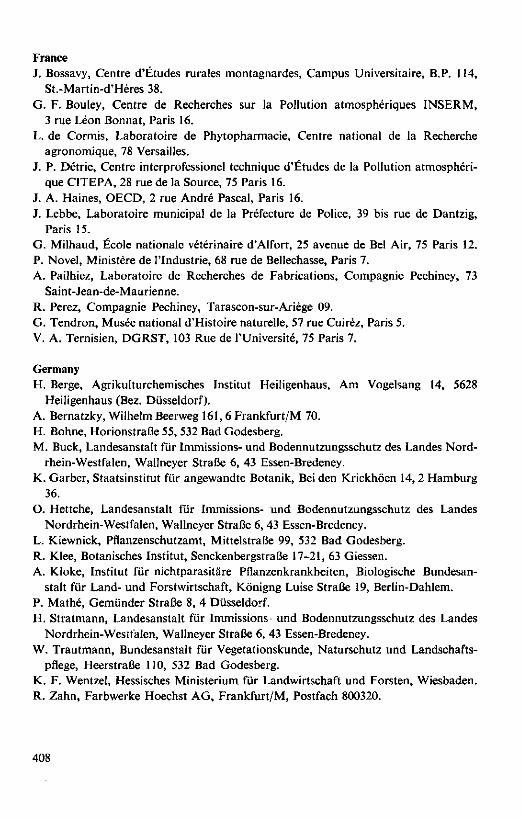
France J. Bossavy, Centre d'Études rurales montagnardes, Campus Universitaire, B.P. 114,
St.-Martin-d'Hères 38. G. F. Bouley, Centre de Recherches sur la Pollution atmosphériques INSERM,
3 rue Léon Bonnat, Paris 16. L. de Cormis, Laboratoire de Phytopharmacie, Centre national de la Recherche
agronomique, 78 Versailles. J. P. Détrie, Centre interprofessionel technique d'Études de la Pollution atmosphéri
que C1TEPA, 28 rue de la Source, 75 Paris 16. J. A. Haines, OECD, 2 rue André Pascal, Paris 16. J. Lebbe, Laboratoire municipal de la Préfecture de Police, 39 bis rue de Dantzig,
Paris 15. G. Milhaud, École nationale vétérinaire d'Alfort, 25 avenue de Bel Air, 75 Paris 12. P. Novel, Ministère de l'Industrie, 68 rue de Bellechasse, Paris 7. A. Pailhiez, Laboratoire de Recherches de Fabrications, Compagnie Pechiney, 73
Saint-Jean-de-Maurienne. R. Perez, Compagnie Pechiney, Tarascon-sur-Ariège 09. G. Tendron, Musée national d'Histoire naturelle, 57 rue Cuirez, Paris 5. V. A. Ternisien, DGRST, 103 Rue de l'Université, 75 Paris 7.
Germany H. Berge, Agrikulturchemisches Institut Heiligenhaus, Am Vogelsang 14, 5628
Heiligenhaus (Bez. Düsseldorf). A. Bernatzky, Wilhelm Beerweg 161, 6 Frankfurt/M 70. H. Bohne, Horionstraße 55, 532 Bad Godesberg. M. Buck, Landesanstalt für lmmissions- und Bodennutzungsschutz des Landes Nord
rhein-Westfalen, Wallneyer Straße 6, 43 Essen-Bredeney. K. Garber, Staatsinstitut für angewandte Botanik, Bei den Krickhöen 14, 2 Hamburg
36. O. Hettche, Landesanstalt für lmmissions- und Bodennutzungsschutz des Landes
Nordrhein-Westfalen, Wallneyer Straße 6, 43 Essen-Bredeney. L. Kiewnick, Pflanzenschutzamt, Mittelstraße 99, 532 Bad Godesberg. R. Klee, Botanisches Institut, Senckenbergstraße 17-21, 63 Giessen. A. Kloke, Institut für nichtparasitäre Pflanzenkrankheiten, Biologische Bundesan
stalt für Land- und Forstwirtschaft, Königng Luise Straße 19, Berlin-Dahlem. P. Mathé, Gemünder Straße 8, 4 Düsseldorf. H. Stratmann, Landesanstalt für lmmissions- und Bodennutzungsschutz des Landes
Nordrhein-Westlaien, Wallneyer Straße 6, 43 Essen-Bredeney. W. Trautmann, Bundesanstalt für Vegetationskunde, Naturschutz und Landschafts
pflege, Heerstraße 110, 532 Bad Godesberg. K. F. Wentzel, Hessisches Ministerium für Landwirtschaft und Forsten, Wiesbaden. R. Zahn, Farbwerke Hoechst AG, Frankfurt/M, Postfach 800320.
408

Italy G. Govi, Institut de Pathologie végétale, Université de Bologna, Via Filippo Re,
8 Bologna 40116. G. Govi, Institut de Pathologie végétale, Université de Bologna, Via Filippo Re, 8
Bologna 40126.
Netherlands J. J. Barkman, Biologisch Station, Wijster. P. C. Blokker, Stichting CONCAWE, Gevers Deynootplein 5, Den Haag. L. J. Brasser, Schoemakerstraat 97, Delft. H. J. van Ebbenhorst Tengbergen, Directoraat Generaal van de Arbeid, Postbus
3069, Voorburg. H. Eilers, Inspectorate of Environmental Hygiene, Ministry of Social Affairs and
Public Health, Dr. Reyerstraat 8, Leidschendam. H. van Genderen, Institute for Veterinary Pharmacology and Toxicology, Biltstraat
172, Utrecht. J. G. ten Houten, Institute of Phytopathological Research, Binnenhaven 12, Wage
ningen. K. B. Kroon, Department of Landscaping, Royal Dutch Touring Club ANWB,
Wassenaarseweg 220, Den Haag. M. B. van Lennep, Central Organization for Applied Scientific Research TNO,
P. O. Box, 297, Den Haag. M. F. Mörzer Bruyns, Institute for Nature Conservation Research RIVON, Laan
van Beek en Royen 40-41, Zeist. A. Raad, Afd. Plantsoenen en Begraafplaatsen, Veemarkt 2, Rotterdam. A. van Raay, Department of Air Pollution, Institute of Phytopathological Research,
Binnenhaven 12, Wageningen. W. van Soest, Proefstation voor de Groenten- en Fruitteelt onder Glas, Zuidweg 38,
Naaldwijk. F. Spierings, Department of Air Pollution, Institute of Phytopathological Research,
Binnenhaven 12, Wageningen. M. Stenvert KNHS, Centraal Laboratorium I, Dmuiden. J. Tesink, Animal Health Service in the Province of Zealand, Evertsenstraat 15, Goes. M. C. A. Velds, Royal Netherlands Meteorological Institute, De Bilt. M. Verkroost, Laboratory of Plant Physiological Reserach of the Agricultural Uni
versity, Generaal Foulkesweg 72, Wageningen. J. H. P. Verwey, Ringallee 28, Rozendaal. E. C. Wassink, Laboratory of Plant Physiological Research of the Agricultural Uni
versity, General Foulkesweg 72, Wageningen. J. H. P. G. A. de Weille, Royal Netherlands Meteorological Institute, De Bilt. V. Westhoff, Department of Botany, Catholic University, Driehuizerweg 200, Nij
megen.
409

Norway F. Ender, Veterinary College, Department of Biochemistry, Ulleväsvn. 72, Oslo 4. H. Robak, Forest Research Institute of West-Norway, Stend. R. Vollan, Director of Veterinary Services, Ministry of Agriculture, Oslo.
Sweden D. Lihnell, Plant Pathology Department, National Institute for Plant Protection,
Solna 7. B. Lundholm, Royal Commission on Natural Resources, Englundavägen 8, 3 tr.,
Solna. E. Skye, Växtbiologiska Institutionen, Villavägen 14, Uppsala. B. Wedin, Director of Research FOA 1, Sundbyberg 4.
Switzerland A. Bolay, Station fédérale d'Essais agricoles, Château de Changins, 1260 Nyon. E. Bovay, Station fédérale de Chimie agricole, Liebefeld/Berne. J. Käch, Landwirtschaftliche Schule, 5630 Muri. T. Keller, Eidg. Anstalt für das forstliche Versuchswesen, 8903 Birmensdorf.
United Kingdom Mrs Majorie Clifton, Warren Spring Laboratory, Gunnels Wood Road, Stevenage,
Hertsfordshire. P. Coker, Department of Geography, King's College, Strand, London W.C.2. G. B. Courtier, Scientific Branch, Greater London Council, The County Hall, Lon
don S.E.1. W. Dermott, National Agricultural Advisory Service, Olantigh Road, Wye, Ashford,
Kent. R. S. Edwards, Institute of Rural Science, Department of Crop Husbandry, Penglais,
Aberystwyth, Wales. A. F. G. Fenton, Coolamber, Ardcumber, Cookstown, Co. Tyrone, Northern Ireland. O. L. Gilbert, Department of Botany, The University, Newcastle upon Tyne 1. G. E. Jones, Geography Department, Llandinam Building, Aberystwyth, Wales. J. R. Laundon, Department of Botany, British Museum (Natural History), Cromwell
Road, London S.W.7. M. K. Lloyd, Central Veterinary Laboratory, New Haw, Weybridge, Surrey. K. Mellanby, Monks Wood Experimental Station, Abbots Ripton, Huntingdon. D. I. Morgan-Huws, Department of Biological Sciences, Portsmouth College of
Technology, Hampshire Terrace, Porthmouth. D. S. Ranwell, Coastal Ecology Section, Furzebrook Research Station, Wareham,
Dorset. F. Rose, King's College, Strand, London W.C.2. W. J. Syratt, Department of Botany, Queen Mary College, Mile End Road, London
E.l.
410

P. J. Wanstall, Queen Mary College, University of London, Mile End Road, London E.l.
C. C. Webster, Agricultural Research Council, 15 Regent Street, London.
United States of North America E. F. Darley, Air Pollution Research Center, University of California, California
92502. J. B. Mudd, University of California, Riverside, California. Mrs. D. B. Stallman, 618 Eleventh Avenue, Huntington, West Virginia.
Yugoslavia S. Stamatovic, Université Beograd, Veterinarski Fakultet, Bui. JA 18, Beograd.
International Organizations Ph. Bourdeau, Centre commun de Recherche, Euratom, Ispra, Italia. J. Smeets, Euratom, 51 rue Belliard, Bruxelles, Belgique. E. van der Stricht, Direction de la Protection sanitaire, Euratom, 45 rue Belliard,
Bruxelles, Belgique. J. W. Tesch, World Health Organization, c/o Gezondheidsorganisatie TNO, Delft,
Netherlands.
411

Contents
Preface by J. G. ten Houten, Chairman of the Organizing Committee 5 Address of welcome by S. H. Visser, President of the Netherlands Council for Air
Pollution 7 Intervention par H. Hacourt, Représentant du Conseil de l'Europe 9 Message of greeting by J. W. Tesch, Representative of the World Health Organisa
tion, European Office 11
Section 1 : Inventory of damage due to industrial and urban air pollution and research done in relation to this pollution J. Bossavy: Informations sur les dommages causé par la pollution de l'air aux
plan tes et aux animaux dans les pay s européens 15 H. Robak: Aluminium plants and conifers in Norway 27 F. Pesek: Biochemische Phenomäne im Boden Exhalationsgebiete 33 Eliska Novâkovâ: Influences des pollutions industrielles sur les communautés
animales et l'utilisation des animaux comme bio-indicateurs 41 Discussion in Section 1 51
Section 2: Experimental research M. Buck: Untersuchungen über die Wirkung von Luftverunreinigungen auf
Pflanzen 53 L. de Cormis : Quelques aspects de l'absorption du soufre par les plantes soumises
à une atmosphère contenant du SO2 75 W. J. Syratt and P. J. Wanstall : The effect of sulphur dioxide on epiphytic bryo-
phytes 79 F. H. F. G. Spierings : A special type of leaf injury caused by hydrogen fluoride
fumigation of narcissus and nerine 87 J. Navara : Beitrag zur Kenntnis der Wasserhaushalt der Pflanzen bei Anwesen
heit des Fluors in Substrat 91 R. S. Edwards: The effects of air-borne sodium chloride and other salts of marine
origin on plants in Wales 99 Discussion in Section 2 105
413

Section 3 : The effects of air pollution on plants E. Bovay : Effets de l'anhydride sulfureux et des composés fluorés sur la végétation 111 E. F. Darley: The role of photochemical air pollution on vegetation 137 A. Bolay, E. Bovay, C. Neury et R. Zuber: Interaction entre la fumure et la
causticité des immissions fluorées 143 J. B. Mudd: Biochemical effects of peroxyacetyl nitrate and ozone 161 G. Halbwachs : Zur Aufklärung der Schädigungen von Pflanzen durch Teerdämpfe 167 A. Rippel und J. Janicovâ: Der Einfluß von Fluorexhalaten auf die Pflanzenwelt
in der Umgebung eines Aluminiumwerkes 173 Discussion in Section 3 179
Section 4: The effects of air pollution on vascular plants J. Hajdük und M. Ruzicka: Das Studium der Schäden an Wildpflanzen und
Pflanzengesellschaften verursacht durch Luftverunreinigung 183 Discussion in Section 4 193
Section 5 : The effects of air pollution on non-vascular plants J. J. Barkman: The influence of air pollution on bryophy tes and lichens 197 F. LeBlanc: Epiphytes and air pollution 211 O. L. Gilbert : The effect of SO2 on lichens and bryophytes around Newcastle upon
Tyne 223 Discussion in Section 5 237
Section 6 : The effects of air pollution on animals F. Ender: The effects of air pollution on animals 245 S. Stamatovic and D. Milic: Problems of air pollution in Yugoslavia 255 A. Kloke und H.-O. Leh: Verunreinigungen von Kulturpflanzen mit Blei aus
Kraftfahrzeugabgasen 259 J. H. P. Verwey : Industrial molybdenosis in grazing cattle 269 G. Balâzovâ und E. Hluchân : Der Einfluß von Fluorexhalaten auf die Tiere in der
Umgebung einer Aluminiumfabrik 275 Discussion in Section 6 281
Section 7: Measuring air pollution in vascular plants H. Stratmann : Die Messung der Luftverunreinigungen und die Aufstellung von
Kriterien für die Beurteilung der Luftqualität 287 Marjorie Clifton : The National Survey of Air Pollution in the United Kingdom . 303 Discussion in Section 7 315
Section 8: Measuring air pollution in non-vascular plants A. van Raay : The use of indicator plants to estimate air pollution by SO2 and HF. 319 H. E. Heggestad and E. F. Darley : Plants as indicators of the air pollutants ozone
and PAN 329
414

K. Stefan: Die Beeinflussung des Gesamtschwefelgehaltes von Fichtennadeln durch Düngung 337
D. Lihnell : Sulphate contents of three leaves as an indicator of SO2 air pollution in industrial areas 341
Discussion in Section 8 353
Section 9 : Resistance of plants to air pollution K. F. Wentzel: Empfindlichkeit und Resistenzunterschiede der Pflanzen gegen
über Luftverunreinigung 357 J. Pollanschütz: Beobachtungen über die Empfindlichkeit verschiedener Baumar
ten gegenüber Immissionen von SO2, HF und Magnesitstaub 371 Discussion in Section 9 379
Section 10: Shelterbelts for air purfication A. Bernatzky : Die Bedeutung von Schutzpflanzungen gegen Luftverunreinigungen 383 Discussion in Section 10 397
Closing session H. Eilers: Evaluation of the Symposium 401
List of participants 407
415