ab-dlo - WUR eDepot
45
Protocol for input and output data of the simulation models NTEGRATE, GRASMOD and the Dairy Farming Model J.G.Conijn &G.W.J, van de Ven ab-dlo Report 81, Wageningen July 1997
-
Upload
khangminh22 -
Category
Documents
-
view
0 -
download
0
Transcript of ab-dlo - WUR eDepot

Protocol for input and output data of the simulation models NTEGRATE, GRASMOD and the Dairy Farming Model
J.G. Conijn & G.W.J, van de Ven
ab-dlo
Report 81, Wageningen
July 1997

The Research Institute for Agrobiology and Soil Fertility (AB-DLO) is part of the Agricultural Research Department (DLO) of the Dutch Ministry of Agriculture, Nature Management and Fisheries (LNV).
DLO's remit is to generate new knowledge and develop the expertise needed by that Ministry to develop and implement policy for promoting primary agriculture and agribusiness, planning and managing rural areas, and protecting wildlife and the environment.
AB-DLO carries out both fundamental strategic and application-oriented research. It is positioned between the fundamental basic research carried out by universities and the practically-oriented research done by research stations.
AB-DLO's research is targeted at: promoting the sustainability and quality of crop production; the sustainable use of land, water and energy; the development of agricultural systems within the framework of multifunctional land use.
This research contributes to the solution of problems concerning the efficient management of substance and energy flows in agro-production chains, the ecologisation of primary production, the regional and global provision of food, and the multifunctional use of rural areas.
The research is divided among three themes: Quality: the quality of crop production and crop products. Environment: minimisation of the environmental effects of agricultural activities in soil, air and water. Sustainable agriculture: development of farming systems within frameworks of multifunctional land use.
AB-DLO's core fields of expertise are plant physiology, soil biology, soil chemistry and soil physics, nutrient management, crop and weed ecology, grassland science and agrosystems research.
Addresses Wageningen location P.O. Box 14, 6700 AA Wageningen tel: +31 317-475700 fax: +31317-423110 e-mail: [email protected]
Haren location P.O. Box 129, 9750 AC Haren tel: +31 50-5337777 fax: +31 50-5337291 e-mail: [email protected]
Internet: http://www.ab.dlo.nl

Table of Contents page
1. Introduction 1
2. Use of modelling in the COGANOG project 3 2.1. Relation between the models 3 2.2. Timing of data supply 4
3. NTEGRATE 5 3.1. Description of the model 5 3.2. Input requirements of NTEGRATE 6 3.3. Output of NTEGRATE 6
4. The Dairy Farming Model 7 4.1. Description of the model 7
4.1.1. The Dairy Farming Model 7 4.1.2. GRASMOD, a TCG for grassland management 7
4.2. Input requirements of the Dairy Farming Model 10 4.2.1. Input requirements for GRASMOD 10 4.2.2. Input requirements for the IMGLP model 10
4.3. Output of the Dairy Farming Model 10 4.3.1. Output of TCG GRASMOD 10 4.3.2. Output of the IMGLP model 11
References 12
Appendix I: Input requirements of NTEGRATE 6 pp.
Appendix II: Output of NTEGRATE 2 pp.
Appendix III: Input requirements for GRASMOD 8 pp.
Appendix IV: List of indices used in the IMGLP model 3 pp.
Appendix V: Input requirements of the IMGLP model 6 pp.
Appendix VI: Results of GRASMOD 3 p p .

1. Introduction
In the COGANOG project (Controlling Gaseous /Vitrogen Oxide emissions from Grassland Farming Systems) a number of European research institutes cooperate in improving our understanding of the controlling factors of the N2O and NOx emissions from grassland farming systems in Europe (Anonymous, 1997). Field measurements will be combined wi th simulation techniques to achieve this goal. Models are used in the COGANOG project (1) to increase our knowledge of the relative importance of the different processes that determine the emissions of N2O and NOx and (2) to provide information on the risks of N2O and NOx emissions as a function of site characteristics and management practices. The field measurements wil l be used for parameterisation and validation of the assumptions underlying the model simulations. With the results of the simulations, sustainable management options can be identified with minimal N2O and NOx emissions.
AB-DLO is responsible for modelling the N20 and NOx emissions from managed grassland systems in the COGANOG-project. Two models will be used: NTEGRATE for the simulation of the emissions at the field scale and the Dairy Farming Model for the simulation of the emissions at the farm level. At the first meeting of the COGANOG-project (Haren, 7-8 February 1997) it has been agreed that AB-DLO wil l provide a protocol for the collection of additional grassland data based on the input/output data of the models. This report gives the input requirements and the output data of NTEGRATE and the Dairy Farming Model. This protocol of input and output data is based on the model version of NTEGRATE described by Vellinga etal. (1997) and on the model version of the Dairy Farming Model described by Van de Ven (1996). Specific information on the input/output of N2O and NOx emissions are not described in this report, because the models, in their present state, have not yet been adapted to calculate these emissions. This will be done during the course of the project.


Use of modelling in the COGANOG
project
2.1. Relation between the models
NTEGRATE is a dynamic model that calculates daily changes in the major state variables of a managed grassland system at the field scale. Daily weather data, detailed soil characteristics, attributes of grass and animal species, and information on management practices are required. The Dairy Farming Model is an optimisation model to achieve both environmental and economic goals at a satisfactory level. By an iterative procedure the 'best' production technique at the farm level is identified for a given set of goals and constraints. The inputs for the Dairy Farming Model are mean annual data on crop/animal production techniques together with some economic and technical data. The data on the production techniques are calculated by technical coefficient generators (TCG), of which GRASMOD provides the input/output relations of grassland farming systems. The input for GRASMOD consists of empirical relations of annual data, which apply to a specific site in an average year. Examples are average annual dry matter yield as a function of nitrogen supply and average annual denitrification as a function of nitrate leaching. GRASMOD and the Dairy Farming Model can only be used for management decisions that are being made over a period of one or more years, whereas NTEGRATE can be used for daily management, e.g. by taking account of daily weather conditions.
Input for NTEGRATE
NTEGRATE
Output of NTEGRATE
Input for GRASMOD , Input from other sources
GRASMOD
Output of GRASMOD a
Input for DF model
DAIRY FARMING MODEL
, Input from other sources
Figure 1. Relationship between NTEGRATE, GRASMOD and the Dairy Farming Model as used in the COGANOG project

In the COGANOG project annual values will be derived from calculations wi th NTEGRATE and these will be used as input for GRASMOD and subsequently the Dairy Farming Model (see Figure 1). Calculations wi th NTEGRATE are necessary because up to now GRASMOD and the Dairy Farming Model are only parameterised for sandy soils in The Netherlands with an average groundwater table and because empirical relations between N2O and NOx emissions and site characteristics and management practices have not yet been established. Multiple runs wi th NTEGRATE are needed to determine the empirical relations for GRASMOD. E.g. to f ind the relation between average annual dry matter yield and annual nitrogen supply for a given site and management, many combinations of year and nitrogen fertilisation level are necessary. Not all input requirements for GRASMOD can be provided by NTEGRATE, which means that some data must still be derived from other sources.
2.2. Timing of data supply
For the simulations in the COGANOG project data are needed to provide input data for the models and to test the simulation results. Default values for the input data, which apply to all situations, can not be used due to large differences in climate, soil type, management and economic conditions of the countries participating in the project. Furthermore, the relative importance of the input data for the emissions of N2O and NOx cannot be given at this moment because the calculations concerning N2O and NOx are not yet included in the models and the sensitivity of the model to its inputs is not constant. It varies wi th the site characteristics, which differ among the various countries participating in the project. To simulate the emissions of N2O and NOx at the field scale and at the farm level wi th adequate accuracy, all data should be determined by each participant for each site, production technique and grassland farming system under consideration in the COGANOG project. For the use of NTEGRATE some of these data may be collected in the field, additionally to the measurements on N2O and NOx (Corré, 1997). The other data should be gathered by using other sources, such as literature, expert knowledge, etc. For the Dairy Farming Model data collection consists of farm surveys, literature, expert knowledge and other sources.
In the technical annex of the COGANOG project a time table is given of all tasks during the whole project which determines the timing of the data supply for the simulations (see Figure 1 on page 29 of the technical annex). Testing NTEGRATE against the field measurements of the monitoring experiments starts in autumn 1997. All relevant data at the field scale, available at that time, should be supplied by September 1997 by the participants involved in these measurements (task 1.2), including the data set from The Netherlands. The monitoring experiments continue until the last year of the project and an update of the field data every 3 months is sufficient for the simulations with NTEGRATE. Measurements that are related to the field campaigns (task 1.3), the stable isotopes compositions (task 2) and the factors controlling N2O and NOx (task 3) can be supplied as soon as they become available after experimentation. These data wil l be used to verify specific assumptions underlying the calculations wi th NTEGRATE. In the summer of 1998 NTEGRATE wil l be used to provide input for GRASMOD and the Dairy Farming Model for eight well-defined European grassland farming systems. The data required for these calculations should be supplied in April 1998, including those related to the Dairy Farming Model and GRASMOD.

3. NTEGRATE
3.1. Description of the model
NTEGRATE describes the water, carbon and nitrogen balance of a soil-grass vegetation system under conditions of cutting and grazing. It has been developed by a number of Dutch research institutes involved in N cycling and grassland management. A technical document (in Dutch) will be published in the 2"<* half of 1997 (Vellinga et al., 1997).
Basically, NTEGRATE consists of 5 submodels which communicate through a main programme (see Figure 2). Input data are supplied by filling in a questionnaire (via a user interface) and by a number of databases. The grassland management module (1) consists of a number of algorithms related to the grazing system and the nitrogen and carbon economy of dairy cows. Excretion of carbon and nitrogen by faeces and urine is calculated and urine patches are simulated separately with respect to grass growth and nitrogen balance in the soil. A fertiliser recommendation module (2), which is not yet implemented, will calculate a recommendation for the nitrogen fertiliser application based on the expected supply and the demand for mineral nitrogen in a growing period. Risks of excessive loss of nitrogen to the environment due to high fertilisation and (too) low grass production at low fertilisation will be calculated and can be weighed to determine the recommendation. The soil water balance module (3) describes the one-dimensional saturated and unsaturated soil moisture flow in a heterogeneous soil profile. The unsaturated flow is modelled based upon Darcy's law and the continuity equation. The terms of the water balance considered are: actual évapotranspiration, actual infiltration (precipitation minus interception and runoff), lateral transport of water to or from the soil profile and transport of water through the bottom layer of the soil profile. The distribution of soil temperature with depth is also calculated. The soil nitrogen balance module (4) simulates the carbon and nitrogen turnover processes in the soil. The most important transformation processes are: decomposition of soil organic matter, mineralisation/ immobilisation, nitrification and denitrification. Losses of nitrogen from the soil profile occur by leaching of mineral nitrogen and dissolved organic matter to ground and surface waters, denitrification and NH3 volatilisation. In NTEGRATE denitrification covers both N2 and N2O production, but the ratio of N2 to N2O (and NOJ is not yet calculated. The grass growth module (5) describes the carbon and nitrogen dynamics of a grass sward. Total dry matter production and nitrogen uptake is calculated and partitioned among roots, leaves and stems/sheaths. A distinction is made between stubble and harvestable parts in the above-ground biomass. Furthermore, the turnover rates of all plant compartments are calculated and the dead plant material is transferred to the pool of organic matter in the soil.
Results of a simulation run are presented in balance sheets, which contain the values of the main rate variables accumulated per growing period, and by creating a number of files with the results on a daily basis.

MAIN PROGRAM
f (Central Data, Communication, etc.)
calculation sequence
Input of Data Output of Results
Figure 2. Outline of the modules used in NTEGRATE and the calculation sequence (adapted from the
technical document, Vellinga et ai, 1997)
3.2. Input requirements of NTEGRATE
A list with the input requirements is given in Appendix I. Most input data are supplied through a questionnaire (in Dutch) and via a number of databases. It is difficult at this stage to provide a ranking of the input data with respect to their relevance to the COGANOG project (as explained in 2.2). It is therefore proposed that each participant in the project examines the list of input requirements and determines the values of all the necessary input data for each site under consideration in the project in their country. A selection of these can be measured in the course of the project in combination with the measurements on N2O and NOx. More information on these input requirements is given in the protocol "Uniform and Standardised Recording of Soil, Crop and Climate Data within the COGANOG Project" (Corré, 1997).
3.3. Output of NTEGRATE
For each day state and rate variables of the modelled processes can be printed to an output file. A summary of the calculated results is also given by balance sheets which provide the main components of the nitrogen and carbon balance in the animals and the vegetation and the soil nitrogen and soil water balance, accumulated per growing period. The variables listed in Appendix II are a selection of all possible variables and comprise the most important data to test the results of NTEGRATE with field measurements. Again, a selection of them can be measured during the project in combination with the N2O and NOx measurements and information on these output variables is given in the protocol of Corré (1997).
4. The Dairy Farming Model
4.1. Description of the model
4.1.1. The Dairy Farming Model
The Dairy Farming Model was developed to explore development options and identify promising techniques in dairy farming from both the environmental and economic point of view in the context of integrated dairy farming.
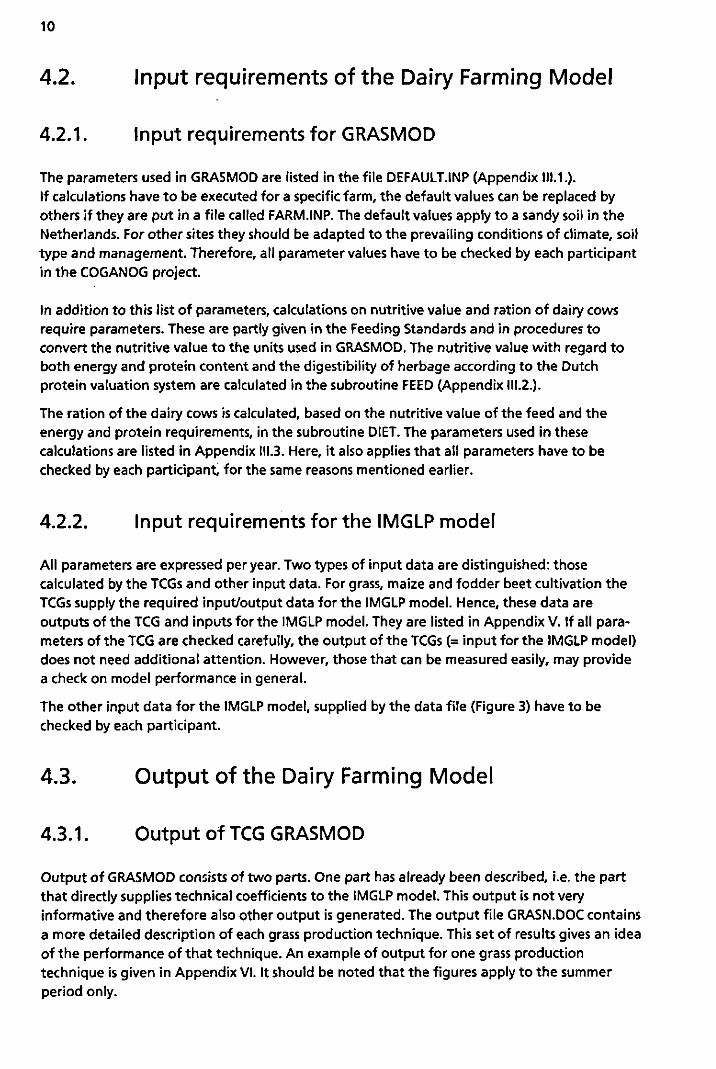
On a dairy farm several crops are grown, such as grass, maize and fodder beet. Grass can be cultivated in many ways, which can be characterised by input-output coefficients. It depends on the goals to be optimised which characteristics need to be quantified. The characteristics of the production techniques for grass are listed in the first column of Figure 3. They represent the essential elements for development of environmentally-sound dairy farming. For each of these characteristics several values can be set by the user of the model.
The input-output table for grass production techniques should be quantified consistently for the whole range of possibilities. Therefore, technical coefficient generators (TCG models) have been developed. The values of inputs and outputs for a production technique are called technical coefficients. GRASMOD is a TCG that calculates inputs and outputs for a wide range of grass production and utilisation techniques. Inputs ( '+ ' in the input-output table) are land and fertiliser for instance and outputs ( '-' in the input-output table) are forage and nitrate leaching (Figure 3). Other crops such as maize and fodder beet can also be included, but are of minor importance in this phase of the COGANOG project. The structure of the TCG and the data used in the model are explained below.
In addition to the input-output table for crop production techniques, some other technical and economic data are required. These are supplied to the model by means of a data f i le (Figure 3). Inputs and outputs for cattle are taken into account partly in GRASMOD and partly in the data file. For cattle, forage is an input and milk and meat are outputs. As optimisation technique /nteractive Multiple Goal l inear Programming is chosen. The IMGLP model integrates the input-output table of the production techniques and the data file in one optimisation matrix. The matrix includes the goals, i.e. economic, production-oriented and environmental, and constraints that the dairy farming system has to meet.
In successive optimisation rounds the restrictions on the goals are tightened and the set of feasible dairy farming systems is reduced step by step.
4.1.2. GRASMOD, a TCG for grassland management
GRASMOD calculates the influence of grassland management on nutrient utilisation and emission to the environment. It is an empirical model, based on data from experiments, literature and experts. Inputs and outputs of a range of grassland management systems are quantified systematically and they form the basis for optimisation applied to dairy farming in a later stage.

£ a >> o c
a. o _ i ~ CD 5? 2 22
• " . » • » ; . . .
BM \
co
Q c o • a • o
UJ _ j
u.
5 s § < ~ -o a o . "
ca
ta a> 3 .f
CO o 1 a»
.K- o 3 ~a o o 3 'S
"5 £ S .y Ö « o B> C
ï o » " o o
>
ra o t -O)
• o •o
<£•
r -3
ca O)
S » £ O) o — c o. \ r
3
O .g g E c
"O / <u / e
CU
ca co 3 "O
0) 3 CT C
y» o •S S » c i l O O CO 3
m ~° ra O
o a
Y
a> co k_ c
s
o
o. CD
Z
Y
(Tl Q.
T ï O
Y T3 O
cu
E "? c
fe-ü co tt ca M <0 h=
a i 3
Y ? » >. o. o.
en
£
• \ / •
Y
E -S w 3
co o
y Y Y Y Y Y Y
c • o u 5 2 Q
z c
c
> 3
O
CC
T Î O
.C O) h e o
(0
"5. D . a
&
.">
c a> F u cc o 1— cc N
'•f Ä
C0 0>
> ra œ
CU • o • o
o co
a o o
£ O
O
3
« Q.
E CU
Dl c 'Ë f0
m T3 »*-O c o
o
•o
CU •a o
en c
m O 0) .c H-O c o
c eu */» eu k . Q. _u "•p CO E CU .c u 1/1
eu 3 Ol

Starting points * All calculations are executed per unit land area (not per farm) on an annual basis. * It is valid for grassland on well-drained sandy soils, with an average water holding
capacity. * It is assumed that all operations belonging to a well-managed grassland are executed,
although those are not explicitly defined in this model.
Inputs and outputs for a wide range of grass production techniques can be calculated. GRASMOD covers the following characteristics (Figure 3): * grassland utilisation method (day and night grazing, day grazing only wi th the supply of
maize silage, zero grazing wi th or without maize silage, cutting for conservation); * animal type (dairy cow, calf or yearling); * N fertiliser application. In GRASMOD it is assumed that all N is applied as chemical
fertiliser. Later on, in the optimisation procedure this can partly be replaced by animal manure;
* herbage supply level (herbage intake as a fraction of the maximum herbage intake; the maximum herbage intake is a physiological maximum determined by milk production level. At a herbage supply level of 1.0, the diet is based on roughage. A t a lower value, part of the roughage is replaced by concentrates. At high milk production levels some concentrates have to be supplied anyway to realise the required energy intake. A herbage supply level of 1.0 implies the highest possible roughage intake under the prevailing circumstances;
* annual milk production level per cow.
These systems vary in grazing losses and application of urine and faeces by grazing dairy cows and thus in net herbage production and nutrient losses to the environment. The user of the model can compose a grass production technique by selecting one value for each characteristic. The technical coefficients for that technique are calculated by running the model. First, herbage yield is derived from N application level and grassland utilisation method. Next, the stocking rate is calculated in dependence of milk production level per cow, herbage yield and additional feed supplies, such as concentrates and maize silage.
Nitrogen The basic relation for the calculations is that between gross dry matter production and N uptake. This is influenced by the grazing/cutting regime. N taken up by the grass originates from various sources: deposition, decomposition of organic matter, fertilisers (both organic and chemical) and when grazing takes place, from urine. It is assumed that N in faeces is present in an organic form, which only becomes available for plant uptake slowly. It is not considered a separate source, but included in the soil organic N.
From experimental data was derived that N uptake from mineralisation and deposition on permanent grassland on sandy soils is about 150 kg ha-1 y H . The remainder of the N uptake should be covered by fertilisation, either slurry or chemical fertilisers.
Nitrate leaching depends on fertiliser level and is derived from field experiments. Denitri-fication has not been modelled yet, but was set at a percentage of the nitrate losses in the rooted zone, depending on the depth of the groundwater table.
The P and K cycle were also modelled but in a less detailed way.
10
4.2. Input requirements of the Dairy Farming Model
4.2.1. Input requirements for GRASMOD
The parameters used in GRASMOD are listed in the file DEFAULT.INP (Appendix III.1.). If calculations have to be executed for a specific farm, the default values can be replaced by others if they are put in a file called FARM.INP. The default values apply to a sandy soil in the Netherlands. For other sites they should be adapted to the prevailing conditions of climate, soil type and management. Therefore, all parameter values have to be checked by each participant in the COGANOG project.
In addition to this list of parameters, calculations on nutritive value and ration of dairy cows require parameters. These are partly given in the Feeding Standards and in procedures to convert the nutritive value to the units used in GRASMOD. The nutritive value with regard to both energy and protein content and the digestibility of herbage according to the Dutch protein valuation system are calculated in the subroutine FEED (Appendix III.2.).
The ration of the dairy cows is calculated, based on the nutritive value of the feed and the energy and protein requirements, in the subroutine DIET. The parameters used in these calculations are listed in Appendix III.3. Here, it also applies that all parameters have to be checked by each participant, for the same reasons mentioned earlier.
4.2.2. Input requirements for the IMGLP model
All parameters are expressed per year. Two types of input data are distinguished: those calculated by the TCGs and other input data. For grass, maize and fodder beet cultivation the TCGs supply the required input/output data for the IMGLP model. Hence, these data are outputs of the TCG and inputs for the IMGLP model. They are listed in Appendix V. If all parameters of the TCG are checked carefully, the output of the TCGs (= input for the IMGLP model) does not need additional attention. However, those that can be measured easily, may provide a check on model performance in general.
The other input data for the IMGLP model, supplied by the data file (Figure 3) have to be checked by each participant.
4.3. Output of the Dairy Farming Model
4.3.1. Output of TCG GRASMOD
Output of GRASMOD consists of two parts. One part has already been described, i.e. the part that directly supplies technical coefficients to the IMGLP model. This output is not very informative and therefore also other output is generated. The output file GRASN.DOC contains a more detailed description of each grass production technique. This set of results gives an idea of the performance of that technique. An example of output for one grass production technique is given in Appendix VI. It should be noted that the figures apply to the summer period only.

11
4.3.2. Output of the IMGLP model
The IMGLP model gives the optimal dairy farming system according to the goals that are optimised. An example of output is given in Table 1. Other characteristics of the dairy farming system can be calculated on request. The results presented do not refer to the grass production technique presented in Appendix VI. It should be noted that GRASMOD applies to grassland in summer only and the Dairy Farming Model to a complete farming system.
Table 1. Optimisation results for maximum labour income and minimum nitrate leaching with no restrictions, in units per ha per year in the region. All figures pertain to an average ha in the region, except N application rate, which pertains to one ha grassland.
Characteristics
production system
Goal
Labour income
N03-leaching
NH3-volatilisation
Land use
Gra$s frçshly fed
Area
N application
Grassland utilisation
cows
yearlings
calves
Herbage supply level
Grass conserved
Area
N application
Product
Landscape area
Slurry
Total production
Grass, injection
Grass, surface application
Others
Stocking rate
Milk production
Labour input
Concentrates
N fertiliser
N surplus
P surplus
Labour income pe r t milk
Unit
Dfl
k gN
kgN
%
kg
%
kg
%
m3
m3
rr.3
cows
kg
h
kg
kg
kg
kg
Dfl r 1
Maximum labour income
5.250
56
178
65
410
zero grazing no maize
zero grazing
zero grazing
0,80
35
440
silage
0
102
34
68
3.29
26.300
122
13.130
240
395
29
200
Minimum nitrate
leaching
3.440
14
128
62
100
zero grazing no maize
zero grazing
zero grazing
0,80
33
100
silage
5
63
7
56 '
2.47
19.770
92
10.260
0
170
31
174

13
References
Anonymous, 1997. Technical Annex of Project PL 1920. COGANOG, Controlling Gaseous Nitrogen Oxide Emissions from Grassland Farming Systems in Europe.
Boons-Prins, E.R. & G.W.J, van de Ven, 1993. Uitbreiding van het graslandbeheersmodel GRASMOD: invloed van de opfok van jongvee voor de melkveehouderij op stikstofstromen in grasland. Verslag 171, CABO-DLO, Wageningen, 38 p.
Corré, W., 1997. Uniform and Standardised Recording of Soil, Crop and Climate Data within the COGANOG Project.
G.W.J, van de Ven, 1992. GRASMOD, a grassland management model to calculate nitrogen losses from grassland. Verslag 158, CABO-DLO, Wageningen, 109 p.
G.W.J, van de Ven, 1996. A mathematical approach to comparing environmental and economic goals in dairy farming on sandy soils in the Netherlands. PhD Thesis Landbouwuniversiteit
Wageningen, 239 p. Vellinga, Th.V., J.G. Conijn, J. Roelsma & J.G. Wesseling, 1997. Technical document of
NTEGRATE (in press; in Dutch).

1-1
Appendix I:
Input requirements of NTEGRATE
1.1. General
Unit - general information of the location of the field :
latitude degrees
1.2. Weather
- for each day standard meteorological data :
daily total of solar radiation (shortwave) j j rrr2 d*1
daily minimum temperature °C daily maximum temperature °C early morning vapour pressure kPa daily average wind speed m S-1 daily precipitation m m QM
Precipitation should be measured at the field, whereas the other data can be obtained from the nearby weather station(s).
1.3. Management
- for each cut or grazing period :
target grass yield kg DM ha-1 maximum number of growing days until harvesting d duration of grazing periods d
number of days between cutting and removing cut grass d amount of grass lost at harvesting kg Q M ha-1 amount of grass left after harvesting (stubble) kg DM ha-1 occurrence of a cleaning cut in case of grazing? yes or no removal of cut grass of a cleaning cut? yes or no amount and timing of nitrogen fertilisation kg N ha-1
By means of the max. no. of growing days a known harvesting calendar can be used as input ; otherwise the target grass yields are used to determine the dates at which harvesting is simulated.

1-2
animal data : number of animals per grazing period milk/meat production number of hours spent in the field dry matter intake of grass and supplements nitrogen concentration of milk/meat and supplements carbon concentration of milk/meat and supplements ratio of digestible to indigestible nitrogen for grass and supplements carbon to nitrogen ratio in faeces carbon to nitrogen ratio in urine area of an urine patch urine volume per urination total urine volume as a function of excreted urinary N
animal ha-1 kg (animal)-i y H hd-1 kg DM (animal)-i d-1 g N (g DM)-1 g C (g DM)-1
g C (g N)-i g C (g N)-i m-2
kg kg (animal)-i d_1
I.4. Grass growth
light interception and production parameters : scattering coefficient of leaves for PAR extinction coefficient for PAR
light use efficiency as function of temperature, transpiration ratio and leaf nitrogen concentration g DM (MJ PAR)-
PAR is the photosynthetically active radiation (kJ m-2 d-1) and equals approximately half of the total daily shortwave radiation. Transpiration ratio equals the quotient between actual and potential transpiration of the grass crop.
- dry matter partitioning : dry matter partitioning coefficients for leaves (laminae), sheaths, stems and roots under potential production conditions increase in root dry matter partitioning coefficient as function of the transpiration ratio and the nitrogen concentration in new leaves maximum carbohydrate reserve level in stem/sheath maximum relative remobilisation rate of carbohydrate reserves d-1 carbon fraction in plant biomass g C (g DM)-1
leaf and root dynamics : specific leaf area as function of days after harvesting relative leaf decrease rate as function of leaf area index increase in leaf decrease rate as function of transpiration ratio and leaf nitrogen concentration
rooting depth as function of root biomass or soil conditions relative root decrease rate as function of air temperature
m2 (g DM)-1 d-1
d-1 m d-1

1-3
- nitrogen : maximum nitrogen concentrations of leaves, stems/sheaths and roots as function of leaf area index g N (g DM)-1 minimum nitrogen concentrations of leaves, stems/sheaths and roots g N (g DM)-1 maximum nitrogen relocation fractions before abscission of plant parts threshold parameter to calculate the effect of nitrogen demand on actual nitrogen relocation fractions g N nr2 d-1 t ime coefficient for calculating a delay in the uptake of nitrogen as function of the nitrogen demand d
Nitrogen demand is defined as the difference between maximum and actual nitrogen content in the plant divided by the t ime step of integration.
- harvesting : amount of harvestable shoot biomass as function total shoot
biomass g DM rrr2
stubble leaf area index at harvesting as function of harvested biomass m2 nrr2
leaf fraction of the grass biomass intake at grazing stubble leaf nitrogen concentration at harvesting as function of the leaf area index before and after harvesting g N (g DM)-1
- initial values leaf, stem/sheath and root biomass g DM nv2
amount of carbohydrate reserves in the stem/sheath g CH2O rrr2
amount of nitrogen in leaves, stems/sheaths and roots g N nr2
leaf area index m2 leaf (m ground)2
1.5. Soil water
The soil profile is described by a number of so/7 layers, which are defined by their soil moisture retention and hydraulic conductivity curves and other chemical/physical characteristics (see also sections on soil temperature and soil nitrogen). Each so/7 layer may contain a number of so/7 compartments w i th equal soil chemical/physical characteristics. A soil compartment is the smallest discretisation unit of the soil profile with a thickness varying from 1 to 5 cm at the top of the profile to 20 cm at the bottom.
- for each soil layer : depth of lower boundary dm relation between pressure head (cm) and hydraulic conductivity cm d"1
relation between soil moisture content (cm* cm-3) and pressure head (= soil moisture retention or pF curve) cm occurrence of hysteresis in the retention curve yes or no trigger value for a reversal in the hysteresis scanning curves cm occurrence of preferential paths for water transport (i.e. cracks) yes or no parameters to calculate preferential water transport

1-4
- parameters related to the top boundary condition : crop factors to relate ET of the reference crop to ET of grass extinction coefficient for shortwave radiation reduction of transpiration as function of pressure head and atmospheric demand relation between leaf area index and interception of precipitation cm d"1
surface storage capacity (ponding) cm
f f i s évapotranspiration of the soil-vegetation system (mm d"1)
- parameters related to the bottom boundary condition : groundwater level (cm) or flux density (cm d"1) through the bottom boundary or pressure head (cm) in bottom compartment as function of day of the year
- definition of surface water system for drainage/infiltration : distance between drainage media m depth of drainage media cm wet perimeter of drainage media cm base of the aquifer m open water level as function of day of the year (if drainage medium = ditch) cm horizontal saturated hydraulic conductivity cm d"1
shape factor of groundwater level
- initial values : groundwater level cm
1.6. Soil temperature
- for each soil layer : relation between soil moisture content and thermal capacity J m-3 "C1
relation between soil moisture content and thermal conductivity W nr1 "C1
1.7. Soil nitrogen
parameters for turnover processes : fraction of fresh organic matter that dissolves at decomposition assimilation efficiency of the microbes fraction heterotrophic biomass of total microbial biomass average relative decomposition rate of dissolved organic matter yH average relative decomposition rate of humus yr1
average relative nitrification and denitrification rate yH nitrogen fraction in humus kg N (kg humus)-1
reduction on average turnover rates as function of soil temperature, pH, moisture content and O2

1-5
In the soil a number of fresh organic matter classes are distinguished. Each OM class is characterised by a nitrogen concentration and a relative decomposition rate.
nitrogen concentration of each OM class kg N (kg DM)-1 average relative decomposition rate of each OM class yi~i
- material characterisation :
A number of materials can be added to the soil, e.g. chemical and organic fertiliser, urine, faeces, plant residues, etc. The organic part of each material is distributed among the OM classes and further divided into fresh organic matter and dissolved organic matter.
fraction of organic matter in each material fraction of mineral NH4-N and NO3-N in each material fraction of the organic part of each material which corresponds with a OM class fraction of the organic part of each material which goes into solution
- parameters related to deposition and other inputs to the soil profile : atmospheric dry deposition of NH4-N and NO3-N kg N ha-1 y H concentration of NH4-N and NO3-N in the precipitation kg N m-3 concentration of NH4-N and NO3-N in the sprinkling water kg N m-3 concentration of NH4-N and NO3-N in the infiltrating drain water kg N m-3 concentration of NH4-N and NO3-N in the seepage water kg N m-3 concentration of dissolved organic matter in the infiltr.
drain water kg m-3 concentration of dissolved organic nitrogen in the infiltr.
drain water kg N m-3 concentration of dissolved organic matter in the seepage water kg m-3 concentration of dissolved organic nitrogen in the seepage water kg N m-3
- parameters related to nitrogen uptake : diffusion coefficients for nitrate and ammonium uptake d"1
selectivity factors for nitrate and ammonium uptake by mass f low -
- chemical/physical characteristics for each soil laver :
dry bulk density kg m-3
pH-KCI two parameters to calculate the diffusion of oxygen in the airfilled part of the soil adsorption constant for linear sorption of NH4-N m3 kg-1

1-6
- initial values for each soil compartment: concentration of NH4-N and NO3-N in the soil solution kg N m-3 concentration of dissolved organic matter in the soil solution kg m-3 concentration of dissolved organic nitrogen in the soil solution kg N m-3 amount of humus kg m-2 amount of fresh organic matter of each OM class kg m-2

11-1
Appendix II :
Output of NTEGRATE
11.1. Grass growth
• terms of the grass balance total gross dry matter production total gross nitrogen uptake by the plant roots amount of dry matter, carbon and nitrogen removed by harvesting amount of dry matter, carbon and nitrogen lost at harvesting amount of dry matter, carbon and nitrogen incorporated into the soil due senescence of leaves, stems and roots
state variables amount of dry matter, carbon and nitrogen in live and dead leaves.
Frequency
continuously continuously
continuously continuously
continuously
stems, sheaths and roots green and dead leaf area index rooting depth
(two-)weekly (two-)weekly (two-)weekly
I.2. Soil water
• terms of the water balance : actual evaporation /transpiration actual infiltration through the soil surface amount of drainage or subsurface infiltration water amount of percolation or seepage through the bottom of the
soil profile
state variables soil moisture contents and pressure heads distributed over depth and time groundwater level
continuously continuously continuously
continuously
weekly weekly
NTEGRATE calculates the changes in the state variables of each soil compartment in the soil profile. For Dutch soils a profile with a standard depth of 4 m has been chosen and 38 soil compartments are used for simulating the soil water balance.
11-2
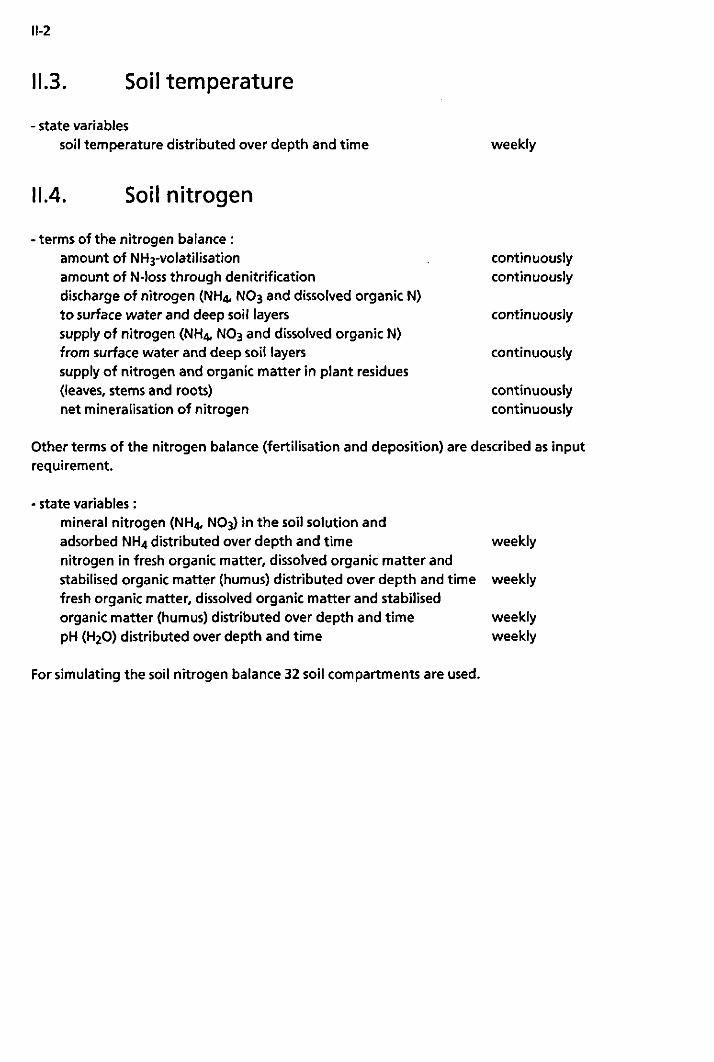
1.3. Soil temperature
• state variables soil temperature distributed over depth and time weekly
11.4. Soil nitrogen
- terms of the nitrogen balance : amount of NH3-volatilisation amount of N-loss through denitrification discharge of nitrogen (NH4, NO3 and dissolved organic N) to surface water and deep soil layers supply of nitrogen (NH4, NO3 and dissolved organic N) from surface water and deep soil layers supply of nitrogen and organic matter in plant residues (leaves, stems and roots) net mineralisation of nitrogen
continuously continuously
continuously
continuously
continuously continuously
Other terms of the nitrogen balance (fertilisation and deposition) are described as input requirement.
- state variables : mineral nitrogen (NH4, NO3) in the soil solution and adsorbed NH4 distributed over depth and time weekly nitrogen in fresh organic matter, dissolved organic matter and stabilised organic matter (humus) distributed over depth and time weekly fresh organic matter, dissolved organic matter and stabilised organic matter (humus) distributed over depth and time weekly pH (H2O) distributed over depth and time weekly
For simulating the soil nitrogen balance 32 soil compartments are used.

111-1
Appendix III:
Input requirements for GRASMOD
Hl.1. Default values of parameters used in GRASMOD
* For more detailed information on the parameters is referred to * CABO-report 158, 1992 (G.W.J, van de Ven)
The name of the farm listed in the output file of GRASMOD FARM = 'DEFAULT'
* number of N application levels, optional IN = 8
* N fertiliser application [kg N/ha/yr]
NFERTD = 100., 150., 200., 250., 300., 350., 400., 450.
* Number of herbage supply levels (explained in text)
IC = 3
* herbage supply level (explained in text)
HSD = 1.0, 0.9, 0.8
* number of milk production levels
IM = 4
* annual milk production level per cow [kg/cow/yr]
MILKD =
0., 5000., 6500., 8000.

111-2
* the number of grassland utilisation methods IG = 8
parameters depending on the grassland utilisation method G: 1: zero grazing dairy cows, no supply maize silage 2: zero grazing dairy cows, supply maize silage 3: zero grazing calves 4: zero grazing yearlings 5: day and night grazing dairy cows (no supply of maize silage) 6: day grazing only dairy cows (supply of maize silage) 7: day and night grazing calves 8: day and night grazing yearlings
* AREAF * AREAU * COI * CONCEP
* D * ENRS
* ENRYS
* FLDMG
* FSYS
* GF
* GHLDMG
* GROWTH * MAIDC * MF * AK/AP
: area of a faeces patch [ha ha-1] : area of a urine patch [ha ha-1] : daily concentrate intake by calves [kg d-1] : amount of N incorporated in embryo in a pregnant yearling [kg
N] : duration of the grazing season [d] : energy requirements as determined by grazing system only
[MJ cow-1 d-1] : energy requirements [MJ animal-1 yr-1] : feeding losses of grass consumed fresh as a fraction of the
amount produced [-] : correction factor for maximum roughage intake depending
ongrazing system [-] : part of the day cows are grazing fresh as a fraction of the
amount produced [-] : grazing and harvest losses of grass [-] : growth of young stock in grazing season [kg animal-1 d-1] : daily intake of maize silage [kg cow-1 d-1] : part of the day animals are not in milking stable [-] : parameters calculation K and P fertilisation, depending on
grassland utilisation method [kg K ha-1, kg P ha-1]
AREAF 000008 000008 000004 000006 000008 000008 000004 000006
AREAU .000068 .000068 .000035 .000050 .000068 .000068 .000035 .000050
COI CONCEP .0 .0 .85 .0 .0 .0 .85 .0
.0
.0
.0
.323
.0
.0
.0
.323
D 184. 184. 129. 184. 184. 184. 129. 184.
ENRS 1.59 1.59 0. 0. 7.32 6.42 0. 0.
ENRYS 0. 0.
3371. 8185.
0. 0.
3756. 9276.
FLDMG .05 .05 .05 .05 .0 .0 .0 .0
FSYS 0.87 0.87
.00
.00
1.00 0.90
.00
.00
GF .0
.0
.0 1. 0.5 1.0 1.0
111-3
GHLDMG GROWTH MAIDC MF AK AP .07 .07 .07 .07 .20 .14 .18 .18
.0
.0
.850
.625
.0
.0
.850
.625
0. 4.5 0. 0. 0. 4.5 0. 0.
0.8333 0.8333 1.0 1.0 0.8333 0.8333 1.0 1.0
0. 0. 0. 0.
60. 150.
60. 60.
0 0 0 0 0
30 0 0
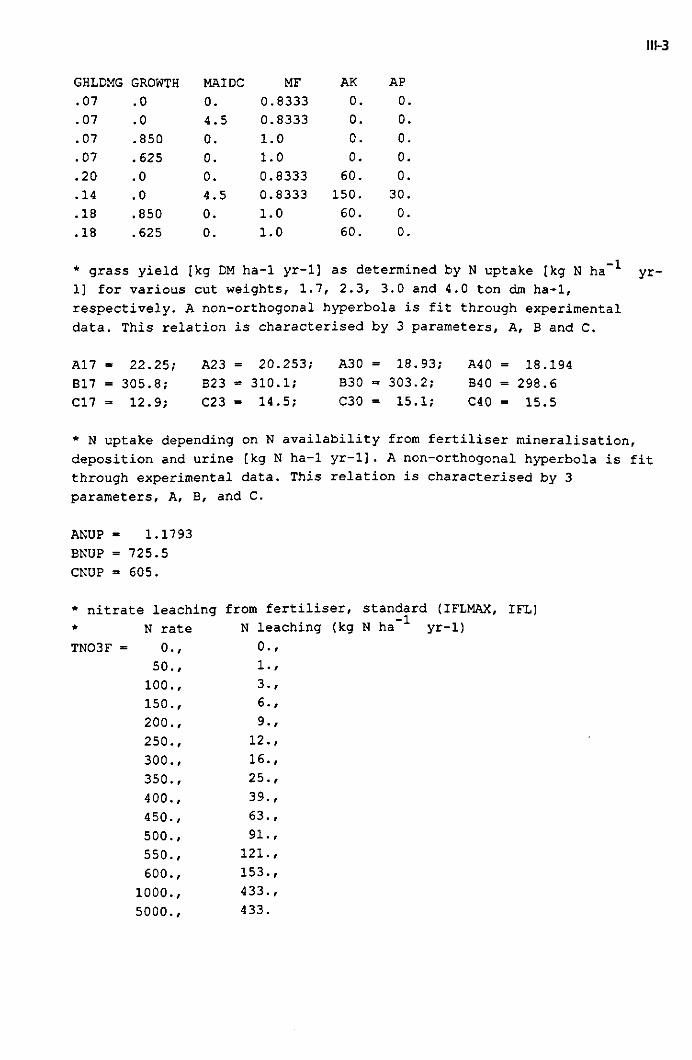
* grass yield [kg DM ha-1 yr-1] as determined by N uptake [kg N ha yr-1] for various cut weights, 1.7, 2.3, 3.0 and 4.0 ton dm ha-1, respectively. A non-orthogonal hyperbola is fit through experimental data. This relation is characterised by 3 parameters, A, B and C.
A17 = 22.25; A23 = 20.253; A30 = 18.93; A40 = 18.194 B17 = 305.8; B23 = 310.1; B30 = 303.2; B40 = 298.6 C17 = 12.9; C23 = 14.5; C30 = 15.1; C40 = 15.5
* N uptake depending on N availability from fertiliser mineralisation, deposition and urine [kg N ha-1 yr-1]. A non-orthogonal hyperbola is fit through experimental data. This relation is characterised by 3 parameters, A, B, and C.
ANUP = 1.1793 BNUP = 725.5 CNUP = 605.
* nitrate leaching from fertiliser, standard (IFLMAX, IFL)
* N rate N leaching (kg N ha yr-1)
TN03F = 0., 0., 50., I-,
100., 3., 150., 6., 200., 9., 250., 12., 300., 16., 350., 25., 400., 39., 450., 63., 500., 91., 550., 121., 600., 153.,
1000., 433., 5000., 433.

111-4
* P content in grass as determined by N content (both in kg kg-1), (IPNMAX, * IPN) * N P CPG = 0.008, 0.0018,
0.016, 0.0028, 0.024, 0.0036, 0.032, 0.0042, 0.040, 0.0048, 0.048, 0.0051
* number of grass products distinguished: * 1: Hay, cut at 4 t DM * 2: Silage cut at 4 t DM * 3: Silage cut at 3 t DM * 4: artificially dried grass cut at 3 t DM * 5: fresh grass cut at 2.3 t DM * 6: fresh grass grazed at 1.7 t DM IE = 6
* Parameters used to calculate the feeding value of grass and harvest * losses of cut grass as determined by harvesting stage (IEMAX,IE) * CASHA/B : regression parameters to calculate crude ash from N content * CF : crude fibre content grass [g kg-] * CFAT : crude fat content grass [g kg-1] * D : average number of growing days after 1 april [d] * FP : fermentation products grass [g kg-1] * FDCASH : fraction digestible crude ash [fraction] * HLDMC : harvest losses conserved grass [fraction]
CAS HA 1.15
15 15 18 97 14
CASHB 78. 78. 78. 95. 63. 59.
CF CFAT 275. 35. 260. 240. 240. 215. 205.
40. 40. 30. 40. 40.
DAY 91. 91. 76. 76.
106. 106.
FP 0.
47. 47.
0. 0. 0.
FDCASH 50. 50. 50. 35. 50. 50.
HLDMC .35 .15 .15 .05 .0 .0
* protein digestibility [fraction] of maize as determined by N concentration [kg kg-1] (IMAMAX,IMA) * N content digestiblity PDCMT = . 0 1 0 0 ,
. 0 1 0 5 ,
. 0 120 ,
. 0 1 2 5 ,
. 0 130 ,
. 0 140 ,
. 0 1 4 5 ,
0 . 3 6 , 0 . 3 9 , 0 . 4 7 ,
0 . 4 9 , 0 . 5 0 , 0 . 5 4 ,
0 . 5 5

III-5
* fraction of N in urine that volatilises and the fraction N not accounted * for in urine patches as determined by N application rate * [kg N ha-1 yr-1](IBUMAX, IBU)
*
TFNH3U»
+
TFNBLU=
N appl. rate
0., 550., 600.,
N appl. rate
o., 550., 600.,
NH3 loss
0.02, 0.13, 0.13
N not accounted for
0 0 0
in urine patches .38, .27, .27
* K uptake from fertiliser, [kg K ha~ * K rate K uptake TKUPF = 0., 0.,
280., 930., 930.
* Number of concentrate types available IT = 4
yr-1] (IKMAX, IK)
0., 400.,
3000., 5000.,
data relating to concentrate type C:
* CN * CP * DVEC * FDCP * OEBC
N content [kg kg-1] P content [kg kg-1] DVE content [g kg-1] fraction digestible crude protein [-] rumen degradable protein balance [g kg-1]
CN .0147 ,0230 ,0230 0220
CP .0032 .0050 ,0055 ,0055
DVEC 65.
100. 100.
65.
FDCP 0.65 0.75 0.65 0.70
OEBC -21. -11. -20.
20.
* number of periods distinguished in summer. The ration of dairy cows is calculated in dependence of milk production. To be able to calculate a realistic ration, the lactation period is divided in four periods. The fifth period in the year are the months the cows are not milked. 2 of these 5 periods are in summer. IP = 2

111-6
* data relating to summer periods 1 and 2 DVERC ENRC MILKPR PERIOD R
daily DVE requirement for conception products [g cow-1 d-1] : daily energy requirement for conception products [MJ cow-1 d-1] : fraction of the annual milk production produced in period P [-] : number of days in period P : reduction factor herbage intake depending on lactation stage [-]
DVERC 0.
13.
ENRC 0.25 1.35
MILKPR 0.269 0.266
PERIOD 77.
107.
R 1.00 0.95
* replacement rate of forage by concentrates [kg forage kg-1 concentrates] RC « 0.3, 0.5, 0.7
* reduction factor energy intake in first period in summer, compensated in * following periods [-] * milk corr. factor PRFCT = 4500., 0.975,
8000., 0.925, 10000., 0.900, 15000., 0.850
* single values BK = 14 0.
CK 70.
DK BP CP C2 C3 CKMEAT CKMILK CNMEAT CNMILK CKM CKCON CPMAI CPMILK
CPMEAT DM DVEMAI DVERM ENRG FLDMC FKUR FNH3
= = =
= -= = -= = = = -
= =
=
= = =
= =
100. 45. 20. 2300. 3000. 0.0020 0.0016 0.025 0.0053 0.017
0.015 0.0022 0.0009 0.0080 450. 47. 121. 1.28 0.05 0.9 6.
! BK, CK, DK parameters for calculation of K fertiliser
! application in dependence of grassland utilisation method according to the recommendations [kg K] BP, CP idem P [kg P]
cut weight at zero grazing [kg DM ha-1] cut weight at cutting for silage [kg DM ha-1] K content meat [kg kg-1] K content milk [kg kg-1] N content meat [kg kg-1] N content milk [kg kg-1] K content concentrates [kg kg-1] K content maize silage [kg kg-1] P content maize silage [kg kg-1] P content milk [kg kg-1] P content meat [kg kg-] DM content pre-wilted silage [g kg-1] DVE content maize silage [g kg-1] DVE requirement for maintenance [g cow-1 d-1] energy requirements for growth [MJ cow-1 d-1] feeding losses of conserved herbage [-] fraction of K excreted in urine [-] NH3 fraction in pre-wilted silage

111-7
FNH3F FNH3G FUPSEA
GE KDP KNA
KNB KNC KURINE KRECI
KUPSL LWCOW MAXDP
MAXNOM
MAXNUS
MEATPR
MJCON MJMAIS NDP NH3FRC NORM
= = =
= = —
= =
= =
= =
=
=
-
=
»
= = =
=
0.13 0.03 0.65
18410. 9. 47.75
1.582 1.4 0.9 0.70
175. 600. 0.70
0.95
0.6
60.
7.21 6.23 45. 0.09725 1.00
NRECI =0.85
N030M =13.
NOM = 153.
NRFE NRUE OEBMAI = PDEP SUMMLK =
SWG SWM
12. 12. -16. 0.9 0.535
0.55 0.65
fraction of N in faeces that volatilises [-] fraction N in dead herbage that volatilises [-] part of the growing season that N is taken up by the crop [-] gross energy content of herbage fkJ kg-1] K deposition [kg ha-1 yr-1] regression parameter for calculating the K content in grass from the N content [kg K/kg N] idem [kg K kg-1 DM] desired K/N ratio in grass fraction of the excreted K in urine [-] K recovery from fertiliser [kg K taken up/kg K applied] K uptake from soil reserves [kg ha-1 yr-1] liveweight cows [kg cow-1] maximum fraction of K and N deposited annually available to plants in the growing season [-]
! maximum fraction of N mineralised available to plants [-]
! maximum fraction of N in urine available to plants [-]
! annual meat production per cow (incl. calf) [kg cow-1] energy value of concentrates [MJ kg-1 DM] energy value of maize silage [MJ kg-1 DM] N deposition [kg N ha-1 yr-1] N volatilised from stables [-] deviation from the feeding standard (if farmers indicate they feed above or below the norm) [-]
! initial N recovery, i.e. Ntaken up from mineralised N, deposited N and low N application levels[-]
! nitrate loss from unfertilised fields [kg N ha-1 yr-1]
! net N mineralisation in the soil [kg N ha-1 yr-1]] number of faeces excretions per cow per day number of urine excretions per cow per day OEB value of maize silage [g kg-1] P deposition [kg P ha-1 yr-1] fraction of the annual milk yield produced in summer [-]
! structure value of grass [-] ! structure value of maize silage [-]

111-8
.2. Parameters required to calculate the nutritive
value of herbage
The energy value of herbage [MJ kg-1 DM] depends on: * digestible organic matter content [g kg-1] * digestible crude protein content [g kg-1] * gross energy content [MJ kg-1 DM] The DVE (protein digested in the small intestine, g kg-1) and the OEB (degraded protein balance, g kg-1] depend on: * digestible crude protein content [g kg-1] * digestible organic matter content [g kg-1] * crude fat content [g kg*1] * undegraded starch [g kg-1] * fermented organic matter [g kg-1] * end products of fermentation in ensiled feeds (fraction NH3)[g kg-1]
.3. Parameters required to calculate the ration of the
animals
total energy requirements [MJ cow 1 d"1] are composed of: * requirement for maintenance, depending on liveweight; * requirements for milk production, depending on milk production level; * requirement for growth. During the first two years a liveweight increases from 520 to
600 kg; * requirements depending on the grazing system. Day and night grazing requires a
higher energy input than zero grazing; * requirements for growth of conception products; * additional requirements due to an inevitable energy shortage in the first period of
milk production. This is a fraction of the total energy requirement in that period. Maximum dry matter intake from roughage depends on energy content of the roughage, milk production level and grazing system [kg DM cow 1 d*1]. herbage can be replaced by maize silage, depending on the energy content of both feeds and maximum DM intake [kg herbage kg-1 maize silage]. Concentrates replace roughage depending on the amount that has to be supplied to meet the energy requirements [kg roughage/kg concentrates].

IV-1
Appendix IV: List of indices used in the IMGLP model
The indices refer to the characteristics of the production techniques (first column Figure 3). Note that the index G in GRASMOD is split into B and Y in the IMGLP model. For the indices M, N and S the standard values are given, but these can easily be changed. The values for N are defined in the file DEFAULT.INP for GRASMOD and the values are transported automatically to the input for the IMGLP model. For the others this still has to be done by hand at this moment.
Indices: A: method to apply slurry
B: grassland utilisation method
C: herbage supply
F: conserved grass, consumed in winter
G: number of crop types
L: treatment of fodder beet leaves
M: milk production levels
1. deep injection 2. injection wi th open slits/ploughing after
application 3. surface spreading
1. zero grazing, no supply of maize silage 2. zero grazing, supply of maize silage 3. day-and-night grazing 4. day grazing, supply of maize silage
1. maximum herbage intake 2. 90% of the maximum herbage intake, extra
concentrates 3. 80% of maximum herbage intake, extra
concentrates
1. hay, harvested at 4000 kg dm ha"1
2. grass silage, harvested at 4000 kg dm ha-1
3. grass silage, harvested at 3000 kg dm ha-1
4. artificially dried grass, harvested at 3000 kg dm ha"1
1. grass consumed fresh in summer 2. conserved grass, consumed in winter 3. maize 4. fodder beet
1. leaves are left in the field 2. leaves are harvested
1. no milk (young stock) 2. 5000 kg per cow per year 3. 6500 kg per cow per year 4. 8000 kg per cow per year

IV-2
N: fertiliser application rates
grass kg N ha-1 y H
maize + fodder beet % inorganic N fertiliser
N1
N2
N3
N4
N5
N6
N7
N8
100
150
200
250
300
350
400
450
100 75 50 0
P: periods in a year
Q: type of maize products
R: method of fertilisation
1. summer 2. winter
1. silage maize 2. ground ear silage
1. broadcasting both inorganic fertiliser and slurry 2. banded placement of inorganic fertiliser 3. banded placement of slurry 4. banded placement of both inorganic fertiliser
and slurry
S: production level and product quality
S maize
dm yield
t ha-1 yr-1
1 14,3 2 13,7 3 12,7
T: concentrate type
1. 2. 3.
4. 5. 6.
N content
gkg-1
13 12 11
protein poor standard moderately protein poor protein rich very protein rich Ppoor
W: catch crop under maize in winter time 1. 2.
g N kg-14,7
23 20
32 64 23
no
fodder beet
dm yield
t ha-1 yr-1
22 --
1 g P kg-1 3,2 5,0 5,0
5,5 12,2 3,5
catch crop growing a catch crop
N uptake
kg ha-1
265 --

IV-3
Y: type of cattle 1. dairy cows (> 2 years) 2. calves (0-1 year old) 3. yearlings (1-2 year old)
Z: type of stable and storage 1. current type 2. storage covered, stable adapted to low ammonia
emissions

IV-4

V-1
Appendix V:
Input requirements of the IMGLP-
model
The meaning and Standard values of the indices are given in Appendix IV
V.1. Data supplied to the IMGLP-model by GRASMOD
N and P flows BLON(Y,B,N,CM) BLONF(F.N) BLPF(F.N) BLPG(Y,B,N,C.M) N20U(Y,B,N,C.M)
NH3F(F,N) NH3G(Y,B,N,C,M) NH3ANL(YfB,N,C,M) NLOSSF(F.N) NLOSSG(Y,B,N,C,M) PNW(Y,M) PPW(Y,M) SLN(Y,B,N#C,M)
SLP(Y.B,N,QM)
Nutrient requirement FKI(F.N) FNI(F,N) GKI(Y,B.N,C,M) GNI(Y,B,N,C,M)
feeding value FCN(F.N) FCP(F,N) FDVE(F.N) FES(F.N) FOEB(F.N) FPDC(F.N)
Animals DMMX(Y,M)
DVEI(Y#M) EI(Y,M) PREQM(Y,M)
RC(Y,M)
organic N balance of grass production techniques organic N balance of forage production techniques P balance of forage production techniques P balance of grass production techniques balance loss from urine patches (chemo-denitrification) NH3 loss from forage production techniques NH3 loss from grass production techniques NH3 loss from stable and storage in summer N loss from rooted zone for forage production techniques N loss from rooted zone for grass production techniques N in milk and meat in wintert ime P in milk and meat in winter time N collected in slurry in summer P collected in slurry in summer
fertiliser K requirement of forage production techniques fertiliser N requirement of forage production techniques fertiliser K requirement of grass production techniques fertiliser N requirement of grass production techniques
N content of cut grass P content of forage DVE content of cut grass energy content of cut grass OEB content of cut grass fraction protein digestibility of conserved grass
maximum dry matter intake from roughage in winter DVE requirement animals in the winter period energy requirement cattle in winter time P requirements in winter replacement rate of roughage by concentrates
[kg N.ha-1] [kg N.ha-1]
[kgPha-i ] [kg P ha-1] [kg N ha-1] [kg N.ha-1] [kg N.ha-i]
[kg N head-1] ; [kg N.ha-1]
[kg N.ha-1] [kg N head-1] [kg P head-1]
[kg N.ha-1] [kg P.ha-1]
[kg K ha-1] [kg N.ha-1] [kg K.ha-1] [kg N.ha-1]
[kg N.kg-1] [kg P.kg ds]
[kg dve.kg-i] [MJ.kg-1]
[kg.kg-i DM]
[-]
[kg cow-1]
[kg dve.ha-1] [MJ.ha-1]
[kg P head-i]
[kg kg-1]
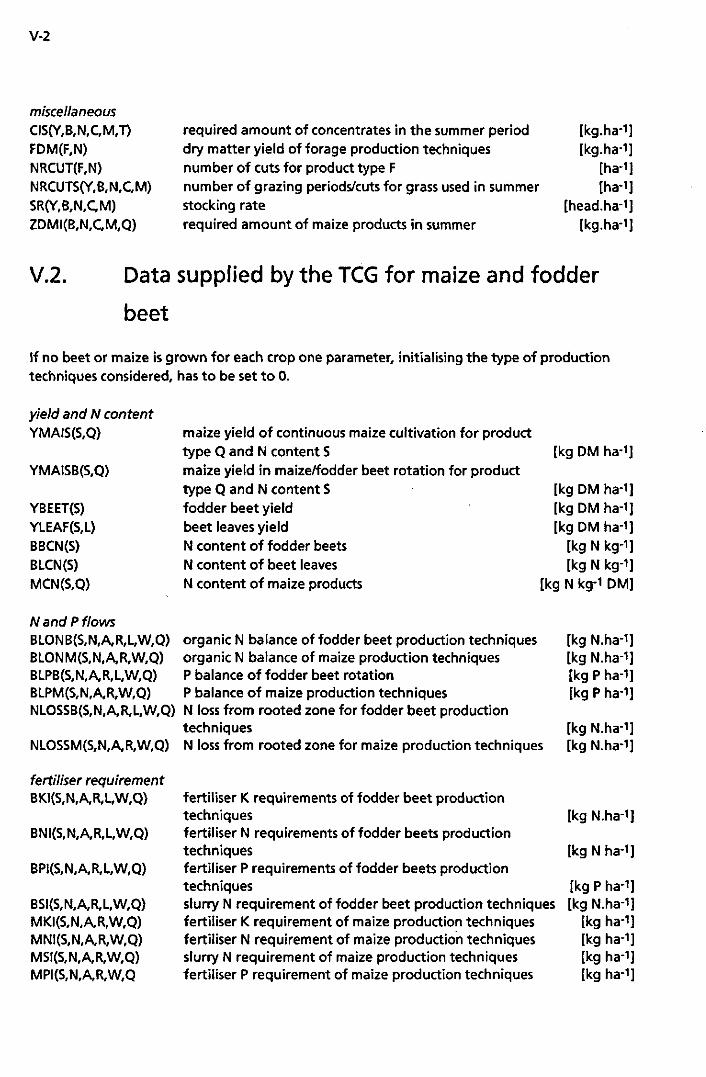
V-2
miscellaneous CIS(Y,B.N,C,M,T) FDM(F,N) NRCUT(F,N) NRCUTS(Y,B,N,C,M)
SR(Y,B,N,C,M) ZDMI(B,N,C,M,Q)
required amount of concentrates in the summer period dry matter yield of forage production techniques number of cuts for product type F number of grazing periods/cuts for grass used in summer stocking rate required amount of maize products in summer
[kg.ha-i [kg.ha-1
[ha-1
[ha-1
[head.ha-1
[kg.ha-i
V.2. Data supplied by the TCG for maize and fodder
beet
If no beet or maize is grown for each crop one parameter, initialising the type of production techniques considered, has to be set to 0.
yield and N content YMAIS(S.Q)
YMAISB(S,Q)
YBEET(S) YLEAF(S,L) BBCN(S) BLCN(S) MCN(S,Q)
Nand P flows BLONB(S,N,A,R,L,W,Q) BLONM(S,N,A,R,W,Q) BLPB(S,N,A,R,L,W,Q) BLPM(S,N,A,R,W,Q)
maize yield of continuous maize cultivation for product type Q and N content S maize yield in maize/fodder beet rotation for product type Q and N content S fodder beet yield beet leaves yield N content of fodder beets N content of beet leaves
[kg DM ha-1]
[kg DM ha-1] [kg DM ha-1] [kg DM ha-1]
[kg N kg-1] [kg N kg-1]
N content of maize products [kg N kg-1 DM]
organic N balance of fodder beet production techniques organic N balance of maize production techniques P balance of fodder beet rotation P balance of maize production techniques
NLOSSB(S,N,A,R,L,W,Q) N loss from rooted zone for fodder beet production
NLOSSM(S,N,A,R,W,Q)
fertiliser requirement BKI(S,N,A,R,L,W,Q)
BNI(S.NfA,RfL,W,Q)
BPI(S,N,A,R,L,W,Q)
BSI(S,N,A,R,L,W,Q) MKI(S,N,A,R,W,Q) MNI(S,NfA,R,W,Q) MSI(S,N,A,R,W,Q) MPI(S,N,A,R,W,Q
techniques N loss from rooted zone for maize production techniques
fertiliser K requirements of fodder beet production techniques fertiliser N requirements of fodder beets production techniques fertiliser P requirements of fodder beets production techniques
[kg N.ha-1] [kg N.ha-1] [kg P ha-1] [kg P ha-1]
[kg N.ha-1] [kg N.ha-1]
[kg N.ha-1]
[kg N ha-1]
[kg P ha-1] slurry N requirement of fodder beet production techniques [kg N.ha-1] fertiliser K requirement of maize production techniques fertiliser N requirement of maize production techniques slurry N requirement of maize production techniques fertiliser P requirement of maize production techniques
[kg ha-1] [kg ha-1] [kg ha-1] [kg ha-1]

V-3
V.3. Additional data
Parameters describing the boundaries of the system: RHO total area available [ha] RHSGR grassland area [ha] RHSMA maize area [ha] RHSQ2 area harvested as ground ear silage [ha] RHSBT fodder beet area [ha] RLS area reserved for landscape purposes (wooded banks) [ha] RHIRR maximum area irrigated [ha] RLB labour availability [h ha-1] LSCB(G) additional area required for landscape development related to
beet cultivation [ha.ha-1] LSCF(G) additional area required for landscape development related to
the area used for grass conservation [ha ha-1] LSCG(G) additional area required for landscape development related to
the area under grazing [ha ha-1] LSCM(G) additional area required for landscape development related to
maize cultivation [ha ha-1] RLA minimum number of animals outside summer for landscape
purposes [head] MILK(M) milk production level per cow [kg koe-1] RMI lower bound on milk production [kg ha-1] BNDMK upper bound on milk production [kg] FRMA fraction of maize/fodder beet rotation harvested as MKS [-] BNDSL(A,G) bound on slurry application method A for crop type G [kg N] RNI maximum nitrate leaching loss [kg N ha-1] RAM maximum ammonia volatilisation [kg N ha-1] RDE maximum denitrification loss [kg N ha"1] RGL minimum fraction of stables meeting green label norms [-] RNO maximum N surplus [kg N ha-1] RPO maximum P surplus [kg P ha-1] RIL minimum net income [fl ha-1] RIN minimum labour income [fl ha-1]
purchases RHSPR(E) upper bound on purchase of roughage type E FRCP fraction of concentrates purchased RHSP(Y) number purchased animals per animal type RHCMX upper bound on amount concentrates purchased RHCMN lower bound on amount of concentrates purchased BNDPS upper bound on purchase of slurry RHSPS lower bound on purchased slurry
[kg]
[-] [head head-1]
[kg] [kg]
[kgN] [kgN]

V-4
sales BNDSM(S.Q) BNDSF(F.N)
BNDSS RHSSS
upper bound on sale of maize type Q with N content S bound on sale of conserved herbage type F wi th N fertiliser level N upper bound on sale of slurry lower bound on sale of slurry
tkg]
[kg] [kgN] [kgN]
additional data for crop production techniques: MINC(Y)
DEN GRSMIN
LBB LBL LC LF(F) LM(Q) LR SILF(F) SILM(Q) SLMAX
minimum ratio of the grass cut and grazed (grazed grassland has to be cut at least once a year, e.g. wi th 5 cuts a year MINC is 0.20) fraction of the nitrate loss from the rooted zone that denitrifies N available after breaking up grass to maize and fodder beet after 3 years grass conservation and feeding losses fodder beet conservation and feeding losses beet leaves conservation and feeding losses concentrates conservation and feeding losses conserved grass type F conservation and feeding losses maize product type Q conservation and feeding losses purchased roughages criteria for ensiling forage or not criteria for ensiling maize or not maximum amount of slurry to be applied, based on potassium
[ha ha-v
I-
[kg N yr-1 [kg kg-1 [kg kg-i [kg kg-i [kg kg-1 [kg kg-1 [kg kg-1
[-[-
[kg N.ha-i
Animal production techniques BTM(Y) maximum amount of fodder beet in winter for cows (Y=1) [kg cow-1 d-1 RYSTC00 ratio number of cows/number of young animals (fixed) [head.head-1 DMCON concentrates for calves first period [kgcalf-i DMGS grass silage for calves first period [kgcalf-i DMH hay for calves first period [kg calf-1
ST part of the diet that consists of structural material [-
Parameters describing N and P flows RHSNS amount of N sold with fodder [kg N ha-1 AVS(Z) factor for NH3 volatilisation from stable+storage type Z in summer [-AVW(Z) fraction of N in slurry volatilised from stable + storage type Z in
winter [kg N kg N GLN green label norm from stable and storage [kg N cow-1 KNR K/N-ratio of slurry [kg K kg-1 N LSCACC nitrogen accumulation in landscape elements [kg N ha-1
NLOSSL nitrate loss from not cultivated land (landscape, nature) [kg N ha-1
ONSL(A) organic N in slurry added to the soil [kg N kg-1 N NCMI N content milk [kg.kg-1
NC(Y) N content per head of cattle type Y [kg N head-1 NDEP N deposition [kg N ha-i NH3A(A,G) NH3 volatilisation associated with slurry application method A
and crop type G [kg N kg-1 N PC(Y) P content of animal type Y [kg P head-1 PCMI P content milk [kg P.kg milk-1 PDEP P deposition [kg P ha-1 PNR P/N ratio in slurry [kg P kg-1 N RNS(A,G) recovery N slurry [kg N kg-1 N

V-5
Economie data prices PNOV PPOV RNHEF RPHEF PMILK PNFER PPFER SALE(Y) PB PF(F) PCONC(T) PADG(F) PAN(Y) PANP(Y) PKFER PLAB PPSL PSSL VCSTR(Y.B)
levy on N surplus levy on P surplus levy free N surplus levy free P surplus price milk price N fertiliser price P fertiliser price for sale of animals per animal type price sale fodder beet price sale forage per product type F price concentrates type C costs of artificially drying grass price animals produced surplus price purchased animals price of K fertiliser costs of labour costs of purchased slurry price of slurry sold price of straw and sawdust for animals
[fl kg-1] [fl kg-1]
[kg N ha-1] [kg Pha-1]
[fl.kg-1] [fl.kg-1] [fl kg-1]
[fl head-1] [fl kg-1] [fl kg-1] tfl.kg-i]
[fl kg-1 DM] [fl.head-1] [fl.head-1]
[fl kg-1] [fl h-1]
[f I kg-1 N] [fl kg-1 N] [fl head-1]
variable costs VCB VCGF VCM(Q,W)
VCSIL VCY(Y)
variable costs beet cultivation [fl ha-1] variable costs grass cultivation [fl ha-1] variable costs maize cultivation depending on crop type Q and with/without a catch crop [f I ha-1] variable costs storing silage [f l kg-1] variable costs of animals [fl head-1]
contract labour CCLB CCLF(F) CCLG CCLM(Q,W) CCLSA(A,G)
fixed costs FIXF(F) FIXG(B) FIXGY(Y,B) FIXL FIXY(Y) FIXZ(Y,Z)
FXFDBB FXFDBL FXFDC FXFDF(F) FXFDM FXGRIR FXMAIR(S)
costs of contract labour fodderbeet [fl ha-1] costs of contract labour forage [fl ha-i] costs of contract labour grass [fl ha-1] costs of contract labour maize [fl ha-1] costs of slurry application in contract labour [gld.kg-1 N]
fixed costs for forage type F [fl.ha-1]] fixed costs for grassland utilisation method B [fl ha-1] fixed costs for manure storage depending on amount produced [fl head-1] fixed cost for rent of land [fl ha-1] fixed costs per animal type [fl head-i] fixed additional costs emission poor stable related to the number of d a i ry cows [f I cow-1 ] mechanisation costs for feeding fodder beet [f I ton-1 DM] mechanisation costs for feeding beet leaves [fl ton-i DM] mechanisation costs for feeding concentrates [fI ton-1 DM] mechanisation costs for feeding conserved grass products [f I ton-1 DM] maize products [fl ton-1 DM] costs for irrigation of grass 4x [fl ha-iyi~i] costs for irrigation of maize 1x [fl ha-iyr-i]

V-6
labour requirements for: LABT cultivating, harvesting and conservation of fodder beet LACLS(Y,B) cleaning stable and collecting animals in summer LACLW(Y) cleaning stable and collecting animals in summer LAF(F) growing grass for conservation wi th product type F LAFRT fertiliser application LAG(B) grass LAGEN additional labour required for general farm practises LAGF grass fertiliser K, Mg, spraying LAMLK(Y) milking in summer/winter of dairy cows LATBB feeding fodder beet LATC feeding concentrates LATF(F) feeding conserved grass products type F LATBL feeding fodder beet leaves LATM feeding maize LATR(E) feeding purchased roughages type E LAGRIR irrigation grass LAMAIR(S) irrigation maize
[h i head i head
ha-1] 1-1] 1]
ha-1] 1]
ha-1] ha-1]
[h [h
[h [h ha-1 t ime
[h cut-1 [h
[h ha-1
[h [h ton-1 [h ton-i [h ton-i [h ton-i [h ton-1 [h ton-1 [h ha-1 yr. [h ha-1 yr
y r 1 ] i head-1]
DM] DM] DM] DM] DM] DM]
-1]
Feeding value of various feeds RCN(E) N content in purchased roughage type E RCP(E) P content in purchased roughage type E RDVE(E) DVE content in purchased roughage type E RES(E) energy content in purchased roughage type E ROEB(E) OEB content in purchased roughage type E RST(E) structure value of purchased roughage type E PROUG(E) price purchased roughage type E CCN(T) N content of concentrate type C CCP(T) P content of concentrates type C CDVECO DVE content of purchased concentrates type C CES(T) energy content of purchased concentrates type C COEBCT) OEB content of concentrates type C BBCP P content in fodder beet BLCP P content in beet leaves BBDVE DVE content of fodder beet BBES energy content of fodder beet BBOEB OEB content of fodder beet BLDVE DVE content of beet leaves BLES energy content of beet leaves BLOEB OEB content of beet leaves BLST structural value of beet leaf FST(F) structural value of cut grass MCP(Q) P content of maize product Q MDVE(S,Q) DVE content of maize product Q MES(Q) energy content of maize product Q MKS(T) MKS can substitute for concentrate type 1 MOEB(S.Q) OEB content of maize products MST(Q) structural material content maize products
[kg N kg-i DM] [kg P kg-i DM]
[kg DVE kg-1 DM] [MJ kg-
[kg OEB kg-1 DM] [-
[fl kg-1] [kg N.kg-1 DM] [kg P.kg-1 DM]
[kg DVE kg-1 DM] [MJ.kg-i DM]
[kg OEB kg-1 DM] [kg P kg-1 DM] [kg P kg-1 DM]
[kg DVE.kg-1 DM] [MJ.kg-1 DM]
[kg OEB.kg-1 DM] [kgDVE.kg-1 [MJ.kg-1 DM]
[kg OEB.kg-1 DM]
[-[-]
[kg P kg-1 DM] [kg DVE kg-1 DM]
[MJ kg-1 DM] [-
[kg OEB kg-1 DM]
[-

VI-1
Appendix VI:
Results of GRASMOD
INPUTS to the model Farm/location - grassland management - N fertiliser rate (kg N ha-1) - cutting percentage (%) - milk production per cow (kg cow-1) - type of concentrate - herbage supply (-)
DEFAULT day and night grazing (no supply of maize silage) 250. 100. 6500.
1.00
GRASSLAND total dm gross (kg ha-1) 11667.
nett (kg ha-1) N uptake (kg N ha-1) N content (%) K uptake (kg K ha-1) K content (%) desired K content (%) nitrate loss (kg N ha-1) volatilisation (kg N ha-1) utilisation urine-N (%) utilisation u+f K (%) N fertiliser (kg N ha-1) K fertiliser (kg K ha-1) P fertiliser (kg P ha-1) stocking rate (head ha-1)
DAIRY COWS total
milk production 8478. weight gain 74. intake per day (kg) 15.8 energy (MJ) 107.12 nitrogen (kg) .528
N BALANCE GRASSLAND u
9484. 379.
349.
45. 15.
22.9 31.2 250. 166.
0.
(kg ha-ptake
total herbage mineralisation 153.
35. deposition 45. fertiliser 250. urine 116. faeces 42. grazing/harvesting 72.
losses total
124.
27. 203.
27.
379.
fresh 8667. 6934.
grass
15.5 104.74
.523
i y r i )
293. 3.39 270. 3.11 3.20
2.44
silage 3000. 2550.
86. 2.87
79. 2.63 2.95
maize concentrates
.0 .00
.000
nitrate loss volatil, balance N03-N
13
12 20
45
I NH3-N loss
8. 38. 5. 2.
15. 38.
.3 2.37 .005
organic Nsoil
37. 70.
107.
immobil. (inorg.N)
36. 23.
93.

VI-2
N BALANCE SOIL (kg ha-1 y r i ) INORGANIC N mineralisation deposition fertiliser urine total
ORGANIC N immobilisation faeces
in 153. 45.
250. 70.
518.
in 93. 37.
uptake herbage nitrate loss immobilisation
total
mineralisation surplus
out 379. 45. 93.
518.
out 153. 47.
grazing/harvesting 70. losses
total 200. total 200.
N BALANCE ANIMALS (kg ha-1 y r l ) total grass maize concentrates
intake 237. 235. 0. 2. total urine faeces milk/meat
excretion 237. 140. 50. 47. field 158. 116. 42. stable 32. 23. 8.
type (%N) 1.47
INPUT/OUTPUT TABLE N (kg ha-1 yr-1) INPUT deposition 45. mineralisation 153. fertiliser 250. maize+concentrates 2.
total 450.
OUTPUT milk+meat 47. leaching 45. volatilisation 15. balance loss 38. slurry 32. silage 73. organic N pool 200. total 450.
P BALANCE ANIMALS (kg ha-1 y r i )
intake
excretion field stable
total 30.6
total 30.6 18.6 3.7
grass 30.1
manure
INPUT/OUTPUT TABLE P INPUT deposition fertiliser maize concentrates total
.9
.0 0. .5
1.4
22.3
maize concentrates .0
milk/meat 8.2
OUTPUT milk+meat slurry silage accumulation total
.5
8.2 3.7
10.1 -20.6
1.4

VI-3
DETAILS OF URINE AND FAECES PATCHES
UOFO
U0F1
U0F2
U1F0
U1F1
U1F2
U2F0
U2F1
U2F2
REST
av.
part .7111 .0255 .0005 .2169 .0078 .0001 .0331 .0012 .0000 .0038
1.0000
dry matter 11480. 11480. 11480. 12173. 12173. 12173. 12394. 12394. 12394. 12511. 11667.
N urine
0. 0. 0.
382. 382. 382. 763. 763. 763.
1172. 116.
N faeces
0. 1171. 2342.
0. 1171. 2342.
0. 1171. 2342.
48. 42.
N upt. 353. 353. 353. 446. 446. 446. 513. 513. 513. 556. 379.
% N 3.20 3.20 3.20 3.80 3.80 3.80 4.30 4.30 4.30 4.61 3.39
N0 3
25. 25. 25. 81. 81. 81. 13.
213. 213. 370. 45.
K urine
0. 0. 0.
502. 502. 502. 004.
1004. 1004. 1541.
153.
K faeces
0. 474. 948.
0. 474. 948.
0. 474. 948.
20. 17.
K upt. 296. 467. 494. 471. 537. 603. 541. 606. 672. 618. 349.
desired % K 2.68 4.23 4.48 4.01 4.58 5.14 4.53 5.08 5.63 5.12 3.11
%K 3.11 3.11 3.11 3.40 3.40 3.40 3.63 3.63 3.63 3.78 3.20