Bingzhen Du - WUR eDepot
203
Effects of land-use change on grassland ecosystem services in Inner Mongolia and their implications for livelihoods and sustainable management Bingzhen Du Effects of land-use change on grassland ecosystem services in Inner Mongolia and their implications for livelihoods and sustainable management Bingzhen Du
-
Upload
khangminh22 -
Category
Documents
-
view
0 -
download
0
Transcript of Bingzhen Du - WUR eDepot

Effects of land-use change on grassland
ecosystem services in Inner Mongolia
and their implications for livelihoods
and sustainable management
Bingzhen Du
Effects o
f land
-use
chan
ge o
n grasslan
d e
cosystem
service
s in In
ne
r Mo
ngo
lia and
the
ir imp
lication
s for live
liho
od
s and
sustain
able
man
agem
en
t
Bin
gzh
en D
u

Propositions
1. Changing diets is an important option for more sustainable water use in arid and
semi-arid regions.
(this thesis)
2. Appropriate grassland-utilization patterns enhance the supply of ecosystem services
and reduce negative effects on both household livelihoods and the environment.
(this thesis)
3. Livelihood analysis can provide new perspectives on resource and ecosystem
management, especially when micro-level household livelihood responses are linked to
macro-level policies.
4. Properly accounting for ecosystem service values in economic policy is critical to human
well-being and stimulates strategies for sustainable natural resource use.
5. The essence of natural resources management is balancing interests.
6. PhD research is challenging, because new ideas and skills continuously have to be
developed.
7. Deadlines are a primary condition for getting a PhD done.
Propositions belonging to the thesis, entitled
Effects of land-use change on grassland ecosystem services in Inner Mongolia and their
implications for livelihoods and sustainable management
Bingzhen Du
Wageningen, 30 January 2019
Effects of land-use change on grassland
ecosystem services in Inner Mongolia and their
implications for livelihoods and sustainable
management
Bingzhen Du
Thesis committee
Promotor
Prof. Dr R. Leemans
Professor of Environmental Systems Analysis
Wageningen University & Research
Co-promotors
Dr R.S. de Groot
Associate Professor, Environmental Systems Analysis Group
Wageningen University & Research
Prof. Dr L. Zhen
Professor, Institute of Geographic Sciences and Natural Resources Research
Chinese Academy of Sciences, Beijing, People‘s Republic of China
Other members
Prof. Dr P.F.M. Opdam, Wageningen University & Research
Dr H.J. König, Leibniz Centre for Agricultural Landscape Research, Germany
Dr J. de Vente, Spanish National Research Council, CEBAS-CSIC, Spain
Dr L.L. Willemen, ITC, University of Twente, Enschede
This research was conducted under the auspices of the Graduate School for
Socio-Economic and Natural Sciences of the Environment (SENSE)
Effects of land-use change on grassland ecosystem
services in Inner Mongolia and their implications for
livelihoods and sustainable management
Bingzhen Du
Thesis
submitted in fulfilment of the requirements for the degree of doctor
at Wageningen University
by the authority of the Rector Magnificus,
Prof. Dr A.P.J. Mol,
in the presence of the
Thesis committee appointed by the Academic Board
to be defended in public
on Wednesday 30 January 2019
at 1.30 p.m. in the Aula.

Bingzhen Du
Effects of land-use change on grassland ecosystem services in Inner Mongolia and
their implications for livelihoods and sustainable management,
201 pages
PhD thesis, Wageningen University, Wageningen, the Netherlands (2019)
With references, with summary in English
ISBN 978-94-6343-398-3
DOI https://doi.org/10.18174/466451

谨以此书献给我的老师、父母和亲友们
To my dearest teachers, family and friends


i
Table of Contents
Table of Contents .............................................................................................................................. i
List of tables ................................................................................................................................... iii
List of figures .................................................................................................................................. iv
Chapter 1: General introduction ....................................................................................................... 1
1.1 Background......................................................................................................................... 3
1.2 The study area: the Inner Mongolia Autonomous Region .................................................. 3
1.3 Changes in National Land-use Policies in the study area ................................................... 5
1.4 Changes in the local socio-ecological systems in the study area ........................................ 8
1.5 Problem statement .............................................................................................................. 9
1.6 Research objectives and research questions ..................................................................... 10
1.7 Research concepts and framework ................................................................................... 10
1.8 Methodology..................................................................................................................... 13
1.9 Data collection and fieldwork ........................................................................................... 17
1.10 Outline of the thesis ........................................................................................................ 18
Chapter 2: Changing patterns of basic household consumption: policy-oriented adaptive
changes in the use of grasslands ..................................................................................................... 21
2.1 Introduction ...................................................................................................................... 23
2.2 Materials and methods ...................................................................................................... 24
2.3 Results .............................................................................................................................. 27
2.4 Discussion......................................................................................................................... 35
2.5 Summary and conclusions ................................................................................................ 38
Chapter 3: Changing Food Consumption Patterns and Impact on Water Resources in fragile
grasslands ....................................................................................................................................... 41
3.1 Introduction ................................................................................................................. 43
3.2 Material and methods .................................................................................................. 44
3.3 Results and discussion ................................................................................................. 49
3.4 Conclusion and suggestions to management ............................................................... 57
Chapter 4: Effects of Grassland Conservation Policy on Household Livelihoods and
Dependence on Grasslands ............................................................................................................. 59
4.1 Introduction ...................................................................................................................... 61
4.2 Description of the study area ............................................................................................ 63
4.3 Materials and methods ...................................................................................................... 64
4.4. Results and discussion ..................................................................................................... 67
4.5 Conclusions ...................................................................................................................... 76

ii
Chapter 5: Comparison of ecosystem services provided by grasslands with different
utilization patterns .......................................................................................................................... 79
5.1 Introduction ...................................................................................................................... 81
5.2 Study area ......................................................................................................................... 82
5.3 Materials and methods ...................................................................................................... 83
5.4 Results and discussion ...................................................................................................... 88
5.5 Conclusions ...................................................................................................................... 94
Chapter 6: Herders‘ willingness to accept versus the public sector‘s willingness to pay for
grassland restoration ....................................................................................................................... 95
6.1 Introduction ...................................................................................................................... 97
6.2 PES programs implemented in the Xilin Gol League grassland of the Inner Mongolia
Autonomous Region ............................................................................................................... 99
6.3 Data and methodology .................................................................................................... 101
6.4 Results and discussion .................................................................................................... 105
6.5. Conclusions ................................................................................................................... 116
Chapter 7: Synthesis, discussion and conclusions ........................................................................ 119
7.1 Introduction .................................................................................................................... 121
7.2 Discussion and conclusions of main findings ................................................................. 121
7.3 Discussion of research methods and comparison with literature .................................... 135
7.4 Synthesis and management recommendations ............................................................... 136
7.5 Future research directions ............................................................................................... 138
Appendixes ................................................................................................................................... 141
References .................................................................................................................................... 161
Summary ...................................................................................................................................... 181
Acknowledgement ........................................................................................................................ 185
About the author ........................................................................................................................... 186
List of publications ....................................................................................................................... 187

iii
List of tables
Table 1.1 Development of National land-use policies in the Inner Mongolia Autonomous
since 1978….……………….…………….……………….………………………………….6
Table 1.2 Major uses of dry-land ecosystem services identified in the literature …………15
Table 2.1 Household characteristics of survey…………………………………………… 29
Table 2.2 Consumption classifications and patterns in 2010 ………………………………30
Table 2.3 Variations in annual food, fuel, and water consumption per capita………………31
Table 3.1 Land-use patterns in the study sites………………………………………………47
Table 3.2The Characteristics of the households that participated in the survey……………50
Table 3.3 The variation of food consumption per capita per year…………………………52
Table 3.4 Indirect water consumption from major food consumption items………………54
Table 4.1 Selection of indicators for livelihood assessment ………………………………66
Table 4.2 Results of the livelihood analysis for the three banners in the Inner Mongolia
Autonomous Region………………………………………………………………………70
Table 4.3 The per capita fuel and food consumption in the three banners of the Inner
Mongolia Autonomous Region……………………………………………………………74
Table 4.4 Changes in household dependence on local grasslands from 1995 to 2010……77
Table 5.1 Characteristics of the five grassland utilization patterns in the Inner Mongolia
Autonomous Region...………………………………………………………………………84
Table 5.2 Proposed indicators for assessing ecosystem services under the different grassland
utilization patterns…………………………………………………………………………86
Table 5.3 Basic characteristic of the study plots……………………………………………87
Table 5.4 Household consumption of provisioning services………………………………89
Table 5.5 Scores for ranking ecosystem services in the three parts of the study area as a
function of the grassland utilization patterns (intensities). …………………………………90
Table 5.6 Differences in soil properties and habitant qualities among the study area………92
Table 6.1 Demographic information for the study region.…………………………………97
Table 6.2 Proportion of total land resources accounted for by converted sloping land and the
area in which grazing is prohibited………………………………………………………101
Table 6.3 Responses to questions designed to reveal the awareness and attitudes of the
interviewees.………………………………………………………………………………107
Table 6.4 Comparison of the income structure of respondents before and after the payment
for ecosystem services programs………..………..………..……….………..………..….108
Table 6.5 The relationship between the bid amount and the proportion of the households that
were willing to accept (WTA) that amount for the conservation of grassland in Inner
Mongolia………………………………………………………………………………….112
Table 6.6 The relationship between the bid amount and the proportion of the government
officials willing to pay (WTP) that amount for the conservation of grassland in Inner
Mongolia………..………………………………………………………………………….112
Table 6.7 Responses to questions designed to reveal the perceptions of payment for
ecological services (PES): herders versus officials………………………………………114
Table 7.1 Scores for ranking ecosystem services in the study areas as a function of the
grassland utilization patterns……….……………………………….…………………….133
iv
List of figures Figure 1.1 The location of the study areas in the Inner Mongolia Autonomous Region……4
Figure 1.2 The pathway from ecosystem structure and processes to human well-being……11
Figure 1.3 The conceptual framework for socio-ecosystem interaction……………………12
Figure 1.4 Research framework and steps…………………………………………………13
Figure 2.1 Location map of study sizes in the Inner Mongolia Autonomous……….………25
Figure 2.2 Changes in food consumption patterns by number of households………………32
Figure 2.3 Changes in fuel consumption patterns by number of households……………..32
Figure 3.1 The geographic location and coverage rate of grassland in the Inner Mongolia
Autonomous Region.………………………………………………………………………45
Figure 3.2 Water requirement per unit of land area for producing consumable items……56
Figure 4.1 Maps of the land coverage types and locations of the survey sites in the Inner
Mongolia Autonomous Region……………………………………………………………64
Figure 4.2 Main components of herders‘ livelihood in the study area.……………………65
Figure 4.3 Household perceptions…………………………………………………………68
Figure 5.1 Location of the study area and map of the study sites…………………………83
Figure 6.1 Location of the survey sites in Xilin Gol of the Inner Mongolia Autonomous
Region…………………………………………………………………………………….100
Figure 6.2 Functional relationships between the bid amount and the associated WTA
consensus rate and probability density.……………………………………………………110
Figure 6.3 Functional relationships between the bid amount and the associated WTP
consensus rate and probability density.……………………………………………………112
Figure 7.1 Change of habitat quality in Inner Mongolian grasslands…………………….124
Figure 7.2 The producing places for purchasing food products………………………….128

1
CHAPTER 1
Chapter 1: General introduction

2

3
1.1 Background
Grasslands are among the ecosystems with high species richness in the world (Wilson
et al. 2012) and they provide a wide range of ecosystem services. Grasslands play an
important role in the global carbon cycle. As most of their biomass is belowground,
carbon accumulation rates are high and decomposition of organic material is slow
(Gibson 2009). Grasslands are the main forage resource for livestock. They facilitate
infiltration of water into the soil and thus to the maintenance of hydrological cycles.
Grasslands also contribute to the landscape beauty of many regions. They are thus
multi-functional systems that are important for human well-being. Simultaneously
they are exposed to unsustainable use and conflicting interests. Widespread grassland
degradation occurs around the world. This results in a loss of ecosystem functions,
biodiversity and economic potential (Sala et al. 2000).
Grasslands in China cover almost half of its land area and nearly 80% occurs in arid
and semiarid regions (Ren et al. 2008). Many types of grassland are degraded during
the past decades and this reduced their productivity and biodiversity, and led to
sandstorms and desertification. This is now a substantial environmental problem in
northern China (Akiyama and Kawamura 2007). Grassland degradation and
desertification are defined as processes of retrogressive grassland succession resulting
from human activities (e.g. overgrazing, reclamation) and unfavourable natural
conditions (Zhang et al. 2013).
Regional land-use changes are triggered by several land conservation policies that
were introduced by the Chinese government. Such policies include wind and sand-
source control around Beijing and the Tianjin project. Both focused on afforestation
and grassland maintenance (Xu et al. 2011). The sloping land conversion program
(SLCP), which was initiated in 2000, converts arable land to grasslands or forests in
the agro-pasture zone (Yin and Yin 2010; König et al. 2012) and the grazing
prohibition policy, that was implemented in 1987, requires livestock fencing and bans
livestock from degraded areas (Li et al. 2007; Li & Huntsinger 2011). The
government recently excluded herders from vast areas of land and attempted to move
them into ‗minority villages‘, where these herders are expected to survive by
producing milk for the dairy industry using a limited and fixed grassland area. These
land-conservation policies resulted in abandoning nomadic pastoralism in favour of
individual farming with fenced herding and increasing herd densities (Wu & Du
2008). All these changes in grassland ecosystems have fundamentally changed their
use.
Grasslands degradation and their consequences need to not only be analysed locally
by focusing on specific degradation processes, but also at landscape, regional and
coarser scales. Various methods, including remote sensing, plot-based measurements,
experiments, expert knowledge and assessment of stakeholder experience (Reed et al.
2009) should be used. My research aims to better understand the dynamics of
degraded grassland and to mitigate degradation processes and facilitate restoration.
1.2 The study area: the Inner Mongolia Autonomous Region
The grassland extent of the Inner Mongolia Autonomous Region (IMAR) is the
largest in China. It covers a total of 7.9 million km2, which is two-third of IMAR‘s
total territory (Figure 1.1). Most Chinese grassland types are found in IMAR. The
major ones are ‗typical steppe‘ (35%), ‗semi-desert and desert steppe‘ (21%) and
‗meadow steppe‘ (10%) (Zhao et al. 2007). IMAR‘s grasslands are used for livestock
4
husbandry and crop farming. These activities currently shift from individual farms to
larger operations as the population that is engaged in husbandry and farming, has
substantially decreased over the last fifteen years (Cheng et al. 2001).
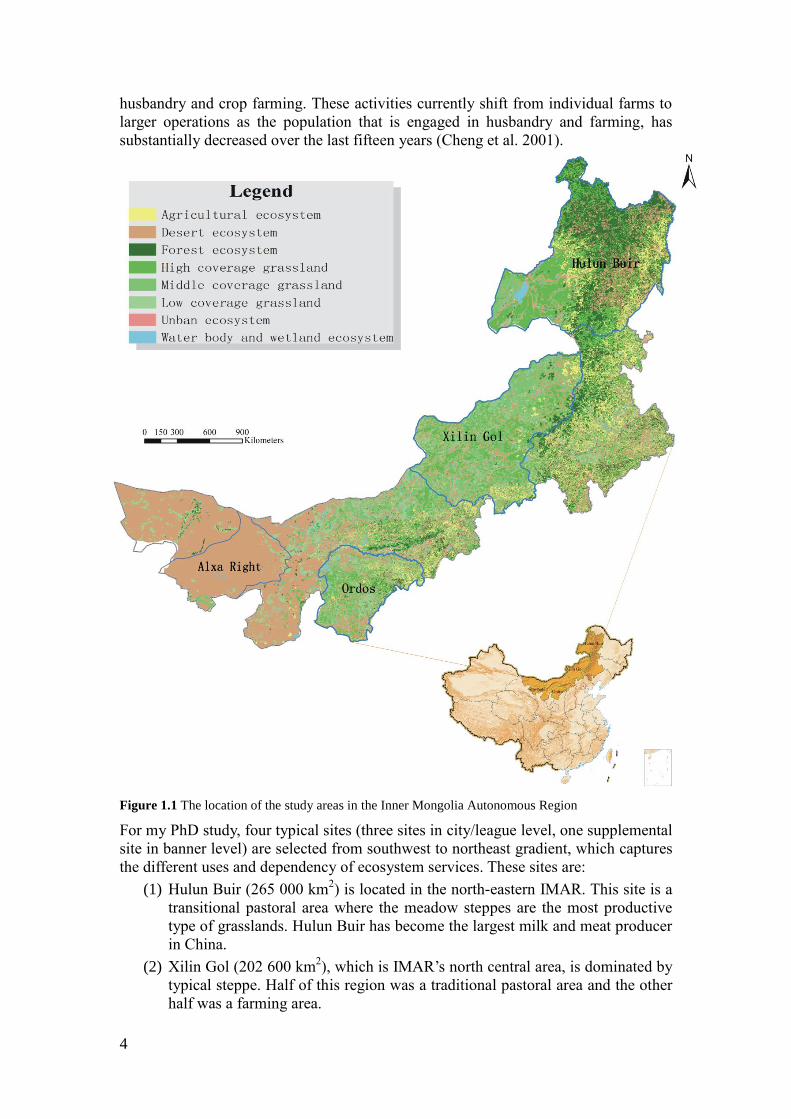
Figure 1.1 The location of the study areas in the Inner Mongolia Autonomous Region
For my PhD study, four typical sites (three sites in city/league level, one supplemental
site in banner level) are selected from southwest to northeast gradient, which captures
the different uses and dependency of ecosystem services. These sites are:
(1) Hulun Buir (265 000 km2) is located in the north-eastern IMAR. This site is a
transitional pastoral area where the meadow steppes are the most productive
type of grasslands. Hulun Buir has become the largest milk and meat producer
in China.
(2) Xilin Gol (202 600 km2), which is IMAR‘s north central area, is dominated by
typical steppe. Half of this region was a traditional pastoral area and the other
half was a farming area.

5
(3) Ordos, (86 800 km2), which is located in IMAR‘s south-western area, is
dominated by semi-desert steppe and has the most arid ecosystem with the
lower biomass than Hulun Buir and Xilin Gol. Ordos leads the economic
development due to the rapid development of mining.
(4) Alxa Right (banner level) in western of Ordos (72 600 km2) was selected as
supplemental site to capture the herder‘s adaptive strategy in extreme dry
climate condition (only in chapter 4). Alxa Righ is bounded by the Baba Jilin
desert to the north, is covered by desert steppe and desert, and has an arid
climate. Traditionally, local herders were described as the people who live on
the back of camels, but most of them no longer raise camels but only raise a
few cattle, goats and sheep. Besides small gardens for household use, no
significant agriculture exists.
1.3 Changes in National Land-use Policies in the study area
The development of China's land-conservation policies can be divided into four
stages: (1) the start-up period after the founding of New China (October 1949 to
September 1956), (2) the all-round construction period (September 1956 to May
1966), (3) the Cultural Revolution period (May 1966 to October 1976) and (4) the
stagnation period (November 1976 to November 1978) (Jiang 2003). Starting from
the land reform in 1950, the development of China's land policies has gone through
the collective land-ownership period and the peoples‘ commune period. From the
1950s to the 1970s, afforestation and dam construction projects were limited to a few
places. After adopting the reform and accessibility policies in 1970, the government
put forward the land-reclamation, farmland-construction, ecological restoration and
agricultural development-acceleration policies. In 1978, the State Council approved
the Three North Shelterbelt Project, which aimed to increase forest cover. In June
1986, the rural household responsibility system, which should halt ecosystem
degradation, was formally established for the whole of China.
Intensive land reclamation and utilization resulted in land degradation. This
intensified the conflicts between land use and environmental protection. To protect
farmland and promote sustainable agriculture, the State Council announced in July
1994 a national policy on demarcation, protection and supervision of farmland for the
whole of China. In August 1998, the local governments in, for example, Inner
Mongolia, Gansu, Shanxi and Sichuan, should restore reclaimed lands (including
cultivated land), which had adverse environmental effects, back to forests and
grasslands. In 2000, the conversion of degraded farm land into forests (and
grasslands) was approved by the central Chinese government for most of China (i.e.
the so-called ‗Sloping land conversion program‘). In September 2006, the State
Council furthermore set a goal that all arable land extent should be kept at ≥120
million ha for food security (i.e. 93.8% of the total arable land in 2000). Table 1.1
summarizes major national milestones in evolution of China's land policies since
1978.
IMAR‘S grasslands have had a unique role in the evolution of China‘s land policy
over the last half century. Due to unfavourable natural conditions (e.g. drought and
sand storms) and human impacts (e.g. deforestation, overgrazing and land
reclamation), the severity of environmental problems, such as soil erosion, land
degradation and alkalization, particularly increased in IMAR. Although several major
land policies have been implemented in this region, the region‘s most influential
6
program is the Returning Grazing Land to Grassland (RGLGP). This is detailed
below.
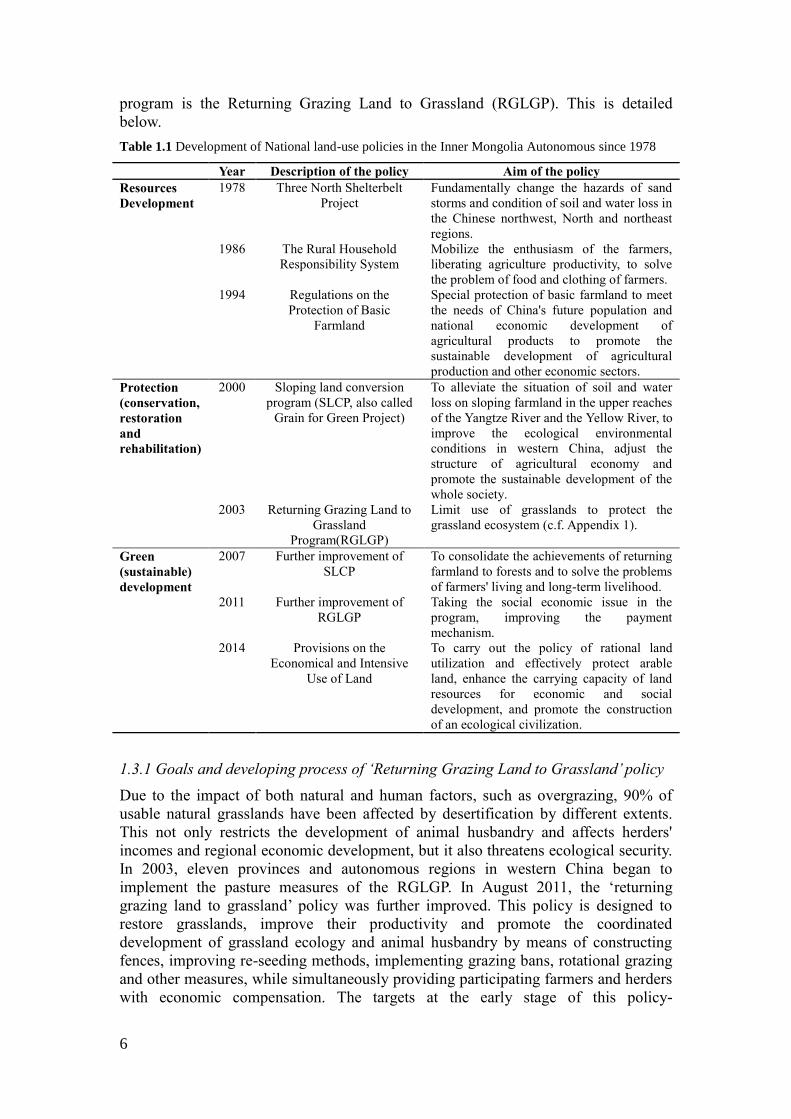
Table 1.1 Development of National land-use policies in the Inner Mongolia Autonomous since 1978
Year Description of the policy Aim of the policy
Resources
Development
1978 Three North Shelterbelt
Project
Fundamentally change the hazards of sand
storms and condition of soil and water loss in
the Chinese northwest, North and northeast
regions.
1986 The Rural Household
Responsibility System
Mobilize the enthusiasm of the farmers,
liberating agriculture productivity, to solve
the problem of food and clothing of farmers. 1994 Regulations on the
Protection of Basic
Farmland
Special protection of basic farmland to meet
the needs of China's future population and
national economic development of
agricultural products to promote the
sustainable development of agricultural
production and other economic sectors.
Protection
(conservation,
restoration
and
rehabilitation)
2000 Sloping land conversion
program (SLCP, also called
Grain for Green Project)
To alleviate the situation of soil and water
loss on sloping farmland in the upper reaches
of the Yangtze River and the Yellow River, to
improve the ecological environmental
conditions in western China, adjust the
structure of agricultural economy and
promote the sustainable development of the
whole society.
2003 Returning Grazing Land to
Grassland
Program(RGLGP)
Limit use of grasslands to protect the
grassland ecosystem (c.f. Appendix 1).
Green
(sustainable)
development
2007 Further improvement of
SLCP
To consolidate the achievements of returning
farmland to forests and to solve the problems
of farmers' living and long-term livelihood.
2011 Further improvement of
RGLGP
Taking the social economic issue in the
program, improving the payment
mechanism.
2014 Provisions on the
Economical and Intensive
Use of Land
To carry out the policy of rational land
utilization and effectively protect arable
land, enhance the carrying capacity of land
resources for economic and social
development, and promote the construction
of an ecological civilization.
1.3.1 Goals and developing process of ‘Returning Grazing Land to Grassland’ policy
Due to the impact of both natural and human factors, such as overgrazing, 90% of
usable natural grasslands have been affected by desertification by different extents.
This not only restricts the development of animal husbandry and affects herders'
incomes and regional economic development, but it also threatens ecological security.
In 2003, eleven provinces and autonomous regions in western China began to
implement the pasture measures of the RGLGP. In August 2011, the ‗returning
grazing land to grassland‘ policy was further improved. This policy is designed to
restore grasslands, improve their productivity and promote the coordinated
development of grassland ecology and animal husbandry by means of constructing
fences, improving re-seeding methods, implementing grazing bans, rotational grazing
and other measures, while simultaneously providing participating farmers and herders
with economic compensation. The targets at the early stage of this policy-

7
implementation process are to restore degraded grasslands and prairies, further
improve the household grassland-restoration responsibility system, establish grassland
protection, forage-livestock balance and rotational grazing systems, guide farmers and
herders to change production methods, improve livestock species and raise and
stabilize farmers' income.
1.3.2 Main measures and scope of implementation of ‘Returning Grazing Land to
Grassland’ policy
In 2003, the State Council issued measures to return grazing land to grassland. In
2011, the council proposed a new initiative to improve the ‘Returning Grazing Land
to Grassland‘ policy. Grazing bans and rotational grazing are the main used measures
and most areas in IMAR have implemented the program but Xilin Gol and Ordos are
the most advanced (Appendix 1).
With grassland restoration, soil erosion by wind and water was reduced and biological
diversity significantly increased (Wang 2006). From 2000 to 2010, the vegetation
cover in Ordos grasslands increased from 30% to over 75%, the forage yield of
mountain ridge grassland and sandy grassland increased by 30% and the grassland
community structure significantly improved (Liu 2010). On the social-economic
aspect, Gao et al. (2013) studied the villages (gacha) Uxin Banner and Ordos City and
showed that animal husbandry still mainly provides income to herder families. Their
income rose from 1998 to 2010 and slightly decreased after 2005. Fodder shortage
caused by grazing bans and grassland protection resulted in a rise in feed costs (e.g.
feed purchase price, transportation costs and the amount of labour). For herders, who
depend solely on forage offered by the state, maintaining the original livestock
numbers was impossible and thus their income decreased (Bao 2006; Li et al. 2005).
Other surveys found that the proportion of income from other herding services in the
total income of herder families increased by 8% and the proportion of animal-
husbandry income fell by 14%. This indicates the diversification of the income
structure of herder families (Tian 2011).
1.3.3 Shortcomings of the ‘Returning Grazing Land to Grassland’ policy
This section is based on previous studies (e.g. Bao 2006; Zhen et al. 2010a), which show
that some problems emerged when implementing the RGLGP. These problems are
summarized below.
First, the compensation standards are arbitrary and subsidy regulations are inflexible
(Nie 2008). For example, in IMAR‘s relatively underdeveloped western pastoral areas,
the capacity of herders to invest in grassland restoration is very limited because the
current subsidies do not support needed income levels. Without economic benefits,
mobilizing herders to participate in the program is difficult (Fan 2003). Many different
grassland types under this program have different degradation severities and carrying
capacities, so subsidy standards should be better differentiated.
Second, the Program fails to properly resettle affected people. So far, no systematic and
effective resettlement program is formulated. Unsolved problems include how herders in
banned-grazing areas shall be transferred; whereto they are resettled or migrated; how
their living allowance are calculated; whether their living allowances increase with
increasing price levels; and how to provide them with housing and medical insurances.
These problems have hindered the effective implementation of the Program (Hanguan et
al. 2003).

8
Third, appropriate measures to restore degraded grassland ecosystems should be
regional specific and cover both the extent and the causes of degradation (Jun et al.
2007), but the program does not provide such diversified grassland restoration methods.
In addition to the required measures, grassland improvement, desertification control and
rodent and pest control should also be included (Xu et al. 2014).
Finally, several social issues are also emerging. The program directly and immediately
affects the herders‘ income level. Some herders allow their livestock to graze areas
where grazing is prohibited, and some herders do not like this. This creates conflicts
between the management personnel and herders, and likely result in social unrest (Li et
al. 2005). The program also changed traditional production methods and living habits of
herders. The government should thus pay attention to these social and emotional
problems (Bao 2006).
1.4 Changes in the local socio-ecological systems in the study area
As the changes of policy intervention coincide with other divers (e.g. social
development and urbanization), the local social system has adapted to manage
household practices to effectively deal with the ecosystem dynamics based on
ecological knowledge. Primary social (human) systems involve property rights, use of
land and natural resources, and world views and ethics concerning the environment
and resources (Appendix 2). Ecological systems refer to the ecosystems and their
environments (Ostrom 2009). When these systems are combined, socio-ecological
systems emerge. In IMAR, such socio-ecological systems are rapidly transformed
from traditional self-sufficiency systems in the 1950s to important milk and mutton
producing systems now. The will be detailed below.
1.4.1 The socio-ecological system in 1950s
In the 1950s, IMAR‘s local people depend mainly on husbandry (Appendix 3a). The
local grassland ecosystems supplied most forage needed for their households and thus
support the local livelihoods and their primarily nomadic way of life. Their whole
economic system was rather closed with limited trading (i.e. only leather products
were traded). They mainly consumed meat and milk. Horses and camels were the
main transportation means and they were also used for their ‗free choice grazing‘ and
regular moving activities (Zhen et al. 2010a). Because of the region‘s low population
density, local ecosystems were stable and people lived within the natural boundaries.
1.4.2 The socio-ecological system in 1995
Similar to other regions in the world, increased human demand on natural resources
rapidly led to more intensive land uses, such as intensive grazing and farming and
more urban areas (Appendix 3b). This has led to overgrazing, deforestation since 1990
(Lu et al. 2011). Grassland degradation created many problems, such as soil erosion,
water scarcity (both for agricultural and ecological water needs), reduced soil
nutrients and loss of productive soils (Kang et al. 2007). IMAR‘s ecosystems are frail
with a thin layer of loose sand that are easily blown by the strong spring and autumn
winds (e.g. Zhang 1998), and increased erosion risks when the soil is exposed. As the
government implemented the ‗Protection of Basic Farmland‘ policy in 1994, the local
people also have reclaimed grasslands for plant cultivation. Their market-trade system
was facilitated by the improved transportation systems. This stimulated the local
people to produce more meat, milk products, leather or wool and enhance their
incomes.
9
1.4.3 The socio-ecological system in 2010
Since ecosystem degradation adversely affects the productivity and human well-being,
local, provincial and state governments urgently want to control this trend (Chen
2005). To alleviate ecosystem degradation and protect the Inner Mongolian
grasslands, the Chinese government started to implement ecological rehabilitation
projects around 1998 (Yin and Yin 2010; König et al. 2014a). During this grassland-
restoration process, the economic systems totally changed. Trading increased incomes
and satisfied the increased daily household consumption. Local people stop traditional
nomadic grazing and start settling and modernized their lives. In addition, artificial
landscapes were developed for tourism (Appendix 3c). Since, IMAR has rapidly
become a well-known tourist attraction.
1.5 Problem statement
Ecological problems that are caused by ecosystem degradation, are serious in IMAR‘s
grasslands (Abubakar 1997; Wang and Cheng 1999; Gu et al. 2008; Benjamin 2012).
The main problems include soil desertification (Hoffmann et al. 2008; Li et al. 2003),
decline in the water balance (Ohte et al. 2003; Chaolun et al. 2008; Yue et al. 2008;
Wilske et al. 2009; Qiu et al. 2011), changes in vegetation (Katoh et al. 1998; Zhao et
al. 2004; Chen et al. 2005; Bai et al. 2010; Dong et al. 2011; Zhao et al. 2011; Yan et
al. 2012) and climate change (Li et al. 2012; Shi et al. 2012; Barthold et al. 2013). All
the studies on these problems show that burgeoning water demands and the limited
availability of clean fresh water are a major consequence of IMAR‘s ecosystem
degradation and could well aggravate the degradation. Until 2010, the total area of
degraded grasslands in IMAR has increased to 25 million ha. This covers more than a
quarter of the total useable grasslands. As a result, 400 million people are likely
affected directly or indirectly and many wildlife species have moved to other areas or
have become extinct. The direct annual economic losses are estimated at CNY 54
billion (7.8 billion US$).
The degradation of the IMAR‘s grasslands and its ecosystem services thus regionally
constrain further social and economic development and human well-being. IMAR‘s
grassland ecosystems supply almost all the fodder needed for livestock production and
support the region‘s herders and their primarily nomadic lifestyle in many ways (Zhen
et al. 2010a).
The Chinese government has been implementing ecological rehabilitation projects in
the area since 1998 (Yin and Yin 2010; Li et al. 2007; Li and Huntsinger 2011;
Hoffmann et al. 2011; König et al. 2014a), but these projects often focus on single
environmental issues (i.e. desertification, afforestation and grazing) and neglect the
needs of local communities. Local herdsmen, for example, often refuse to change their
lifestyle and continue using the land and its ecosystem services in traditional ways. To
analyse these complex circumstances, a research project of Chinese Academy of
Sciences (CAS) started in 2011 to address the ―Use Patterns of Ecosystem Services
and its Environmental-Effects Assessment.‖ This CAS project initially focussed on a
case study in the Inner Mongolian grasslands and aimed to: (1) analyse the utilization
patterns of ecosystem services and their spatial and temporal evolution; to (2) reveal
the environmental effects of human exploitation of selected ecosystem services; and
to (3) develop a computer model (i.e. a simulation platform) to analyse environmental
impacts based on different ecosystem utilization patterns to support policy making.
10
This PhD research is part of this overall CAS project and addresses several important
problems: the environmental protection programs that are implemented in the Inner
Mongolian grasslands, need to be more integrated. Their social, economic and
environmental effects (costs and benefits) should be more clearly identified and
quantified, and trade-offs between the ecosystem services and other management
goals (including conservation) should be better understood. Also, stakeholder
perceptions of rangeland management and Payments for Ecosystem Services (PES)
have thus far not been studied. This makes developing more sustainable livelihood
and management strategies difficult.
1.6 Research objectives and research questions
In accordance with the above described issues and challenges, my PhD study aims to
analyse the interactions between the people and the ecosystems in IMAR in an
integrated manner. The study especially focuses on analysing the different utilization
patterns of ecosystem services and the livelihood dependence of local herders and
other stakeholders in four selected study sites (Figure 1.1). Based on these field
studies, I explore how the resulting insights can be used to develop more sustainable
management practices of the Inner Mongolian grasslands.
To achieve this objective, the following research questions (RQs) will be addressed
and investigated for the three study sites:
RQ1 What are the spatial and temporal variations of land-cover changes since
1998, when the restoration program started, and what are the effects on
habitat quality?
RQ2 a) How have basic household consumption patterns changed under different
management regimes in the selected study sites?
b) What are the main factors affecting current household consumption?
RQ3 What are impacts of changing food consumption patterns on water resources
conservation?
RQ4 How has people‘s livelihood dependence on local ecosystems and their
utilization patterns changed in the last 15 years?
RQ5 What are the trade-offs between selected ecosystems services as a
consequence of the changing grassland utilization patterns?
RQ6 What recommendation can be given to design feasible strategies and
incentives for sustainable management of IMAR‘s grassland ecosystems?
The ultimate goal of my PhD study on ecosystem services use in IMAR is to
contribute to improved management of the ecosystems and the development of a truly
coupled human and ecological system. An effective management framework should
have a broad spatial coverage extending from sites to landscapes, biomes and
continents, and include active participation of inhabitants, their knowledge and
technical know-how, since their input is crucial for effective ecosystem conservation
and management.
1.7 Research concepts and framework
For my research, I used the Ecosystem Approach (CBD 2000; de Groot et al. 2002)
and the concept of Ecosystem Services (Millennium Ecosystem Assessment 2005;
TEEB 2010) as the main elements of a comprehensive framework to investigate the
effects of land-use change on ecosystem services and peoples‘ livelihood.

11
1.7.1 Conceptualizing socio-ecosystem interaction
People interact with natural components of ecosystems in coupled socio-ecological
systems (Liu et al. 2007). Ecosystems, which are self-organized and functional units
of the natural world, provide a variety of services that are important to maintaining
human livelihoods (Millennium Ecosystem Assessment 2003). A core component in
socio-ecological systems is human utilization of ecosystem services. With population
growth and increasing demands for ecosystem services, ecosystems are increasingly
pressurized and this has led to loss and degradation of two-thirds of the world‘s
ecosystems services (Millennium Ecosystem Assessment 2005). This growing
demand can no longer be met by tapping unexploited resources (Ayensu et al. 1999).
The total use of ecosystem services is estimated to increase with population increase
and a large-scale ecosystem collapse this century within 60 years is likely if current
global use levels are not halved (IPBES 2018).
Ecosystem-Services Analysis can be divided into three main parts in general. The first
part focuses on the natural parts of ecosystems by analysing the interactions between
ecosystem elements, such as water, soil, plants and animals. Many chemical and
physical ecological processes are described and their interrelations explored (Schultz
et al. 2007; Benjamin et al. 2012). The second part of ecosystem-services studies
involves their valuation. This requires an interdisciplinary research that combines both
of ecological, social and economic approaches. The resulting findings are relevant for
both scientists and decision makers, and indicate the importance of ecosystem
services and can inform on better management actions (Costanza et al. 1998; de Groot
and Hein 2007; Bagstad et al. 2013).
Figure 1.2 The pathway from ecosystem structure and processes to human well-being (Adapted from
de Groot et al. 2010)
The last part analyses interactions between humans and ecosystem services. Although
some scholars have studied coupled socio-ecological systems as complex adaptive
systems (Levin 1999; Gunderson and Holling 2001), most of the previous studies

12
focused on either ecological variables (e.g. landscape patterns, wildlife habitat and
biodiversity) or human variables (e.g. socio-economic processes, social networks,
agents and governance) (Schultz et al. 2007). The links are partly discussed but only a
few are actually quantified (Worm et al. 2006; Nelson et al. 2009; Braat and de Groot
et al. 2012; Bagstad et al. 2013). Although an increasing number of interdisciplinary
programs have integrated ecological and social sciences to study coupled socio-
ecological systems (Liu et al. 2007), variables that link natural and human
components (e.g. use of ecosystem services), are insufficiently studied. TEEB (2010)
developed a framework of human well-being dependencies and uses of ecosystem
services and benefits for improving human understanding of interrelations between
ecosystems and human consumption (Figure 1.2). Such a framework provides a
scientific basis for decision making on human impact on ecological system, and aims
to solve the conflict between conservation and livelihoods.
Figure 1.3 The conceptual framework for socio-ecosystem interaction
The conceptual framework of my thesis is developed (Figure 1.3) to analyse
interactions between provisioning ecosystem services, use of ecosystem services and
management of ecosystem services. For analysis of human use of and reliance on
ecosystem services in a specific area, identifying site specific categories of ecosystem
services first is essential. This should include all the different services. Key socio-
economic factors that drive human use of ecosystem services, include access to
ecosystem services, income level, education level, policy intervention and
institutional settings, stakeholders‘ behaviour and perceptions, their preferences and
willingness to pay (WTP) for use of ecosystem services (or willingness to accept
(WTA) for losses of use of ES) and technical and cultural difference (Loomis et al.
2000; Zhen et al. 2014).
1.7.2 Research framework
Despite the essential role of ecosystem services in sustaining all human activities in
IMAR, they are often ignored in the consumer‘ choice in allocating the natural
resources, even in methods that should encourage sustainability. Therefore, my PhD
study is based on the first hand data from householder surveys. I start from the basic
Ecological and Social Development Indicators that describe the influence of human
Ecosystem
structure and
processes
Biophysical
drivers
Social-economic
drivers
Provision of ES
Use of ES
Rational social
choice and action
Policy and financing
instrument Patterns of
interactions
Goals: Human well-being
/Optimal use /Fair
distribution/Efficient
Stakeholder
participation
Management
13
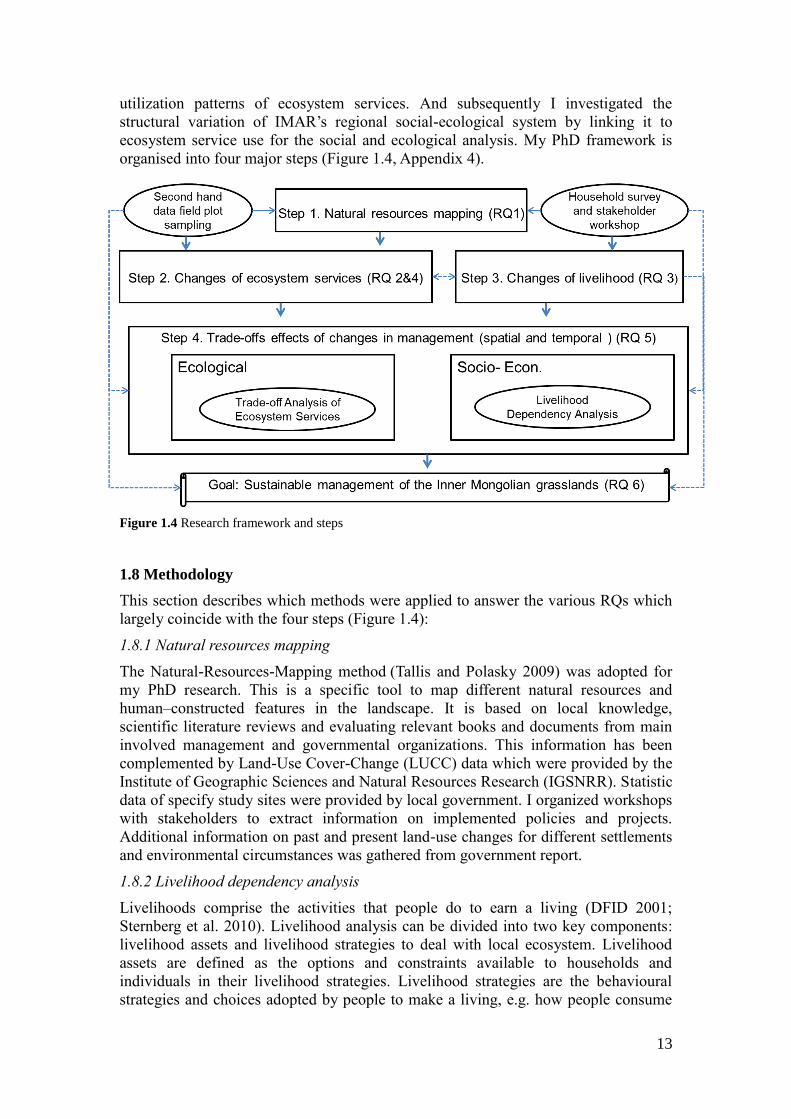
utilization patterns of ecosystem services. And subsequently I investigated the
structural variation of IMAR‘s regional social-ecological system by linking it to
ecosystem service use for the social and ecological analysis. My PhD framework is
organised into four major steps (Figure 1.4, Appendix 4).
Figure 1.4 Research framework and steps
1.8 Methodology
This section describes which methods were applied to answer the various RQs which
largely coincide with the four steps (Figure 1.4):
1.8.1 Natural resources mapping
The Natural-Resources-Mapping method (Tallis and Polasky 2009) was adopted for
my PhD research. This is a specific tool to map different natural resources and
human–constructed features in the landscape. It is based on local knowledge,
scientific literature reviews and evaluating relevant books and documents from main
involved management and governmental organizations. This information has been
complemented by Land-Use Cover-Change (LUCC) data which were provided by the
Institute of Geographic Sciences and Natural Resources Research (IGSNRR). Statistic
data of specify study sites were provided by local government. I organized workshops
with stakeholders to extract information on implemented policies and projects.
Additional information on past and present land-use changes for different settlements
and environmental circumstances was gathered from government report.
1.8.2 Livelihood dependency analysis
Livelihoods comprise the activities that people do to earn a living (DFID 2001;
Sternberg et al. 2010). Livelihood analysis can be divided into two key components:
livelihood assets and livelihood strategies to deal with local ecosystem. Livelihood
assets are defined as the options and constraints available to households and
individuals in their livelihood strategies. Livelihood strategies are the behavioural
strategies and choices adopted by people to make a living, e.g. how people consume

14
and preserve ecosystem services and goods to satisfy their needs. I concentrated in
particular on the use of ecosystem goods (provisioning service) to illustrate livelihood
dependence on local ecosystem. The main analysis focuses on five main parts: (1)
Changing of cultivation activities (alternatives of livestock husbandry and crop
farming activities); (2) Changing of asset compositions and source of income (job,
agriculture or others); (3) Changing of diet; (4) Changing of fuel consumption
(alternative of dung-based bio-fuel, coal, gas and electricity); and (5) Usage of water
resources. In addition, the main divers (e.g. ecological condition, policy, climate or
others), changing household‘s behaviour and perspectives of herds were also
interpreted.
Household-dependency analysis was used for this researh to identify and evaluate the
potential socio-economic and cultural impacts of a proposed development on the lives
of people, their families and their communities. In the past, many studies focused only
on direct biophysical impacts of proposed developments on society and economic
activities (i.e. impacts on water, air, land, flora and fauna). The indirect impacts were
often ignored. I have used household-dependency analysis method for my research to
analyse effects of developments and influences on human well being in the past
fifteen years in IMAR (before and after the implementation of restoration policies that
started in 1998). The assessment process relies heavily on involving community
members who may be affected by the development, so stakeholder interviews are an
important part of the assessment.
1.8.3 Ecosystem-services analysis
Ecosystem-services analysis involves the translation of information on complex
ecological structures and processes into a limited number of ecosystem functions and
services. Ecosystem services are defined as ―the contribution of ecosystems to human
well-being‖ (TEEB 2010). Based on reports of The Economics of Ecosystems and
Biodiversity (TEEB 2010) and the Millennium Ecosystem Assessment ((Millennium
Ecosystem Assessment 2005), ecosystem services can be classified into four main
categories: provisioning services, regulating services, supporting services and cultural
& amenity services.
Ecosystem management depends on spatial and temporal fluctuation in the use of
ecosystem services (Zhen et al. 2008; Liu et al. 2007). The function model below is
formulated to express factors influencing the use of ecosystem services in a specific
region:
Eu = Edu + Eidu (Eq. 1.1)
Where, Eu is total use of ecosystem service, Edu is direct use of ecosystem service
and Eidu is indirect use of ecosystem service.
Classifying of direct and indirect use of ecosystem services (Table 1.2) always
delivers a relative added value as it depends on the consumers‘ selection of the
services. For example, wood or timber from the forestry would not be available to
provide other services once they are consumed as products. Meanwhile, direct and
indirect use of services is sometimes interrelated with each other. In Wolong natural
reserve in China, the households‘ use of fuelwood affects panda habitat (Liu et al.
2007), implying that direct use of ecosystem services (fuelwood) is affects an indirect
use (e.g. biodiversity) of a specific region. Moreover, interrelations between direct
and indirect use also lie in conversion of the services. For instance, converting of a
forest into agricultural land can increases food supply, decreases wood and timber
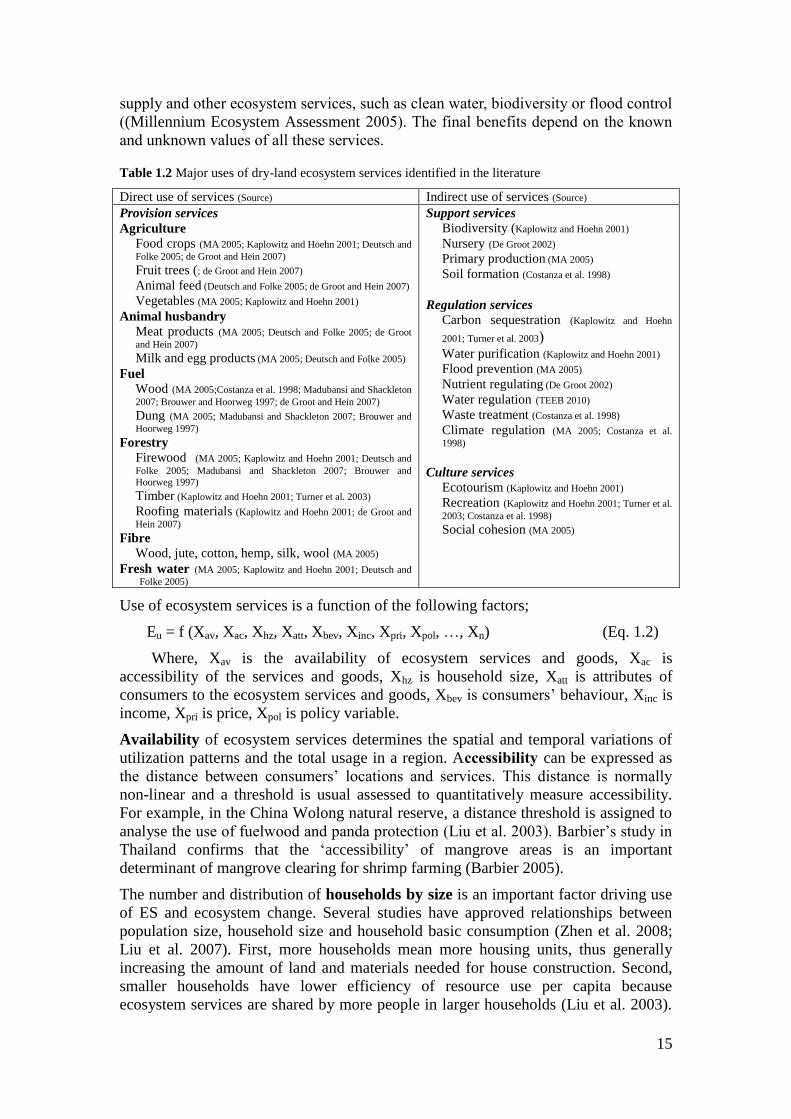
15
supply and other ecosystem services, such as clean water, biodiversity or flood control
((Millennium Ecosystem Assessment 2005). The final benefits depend on the known
and unknown values of all these services.
Table 1.2 Major uses of dry-land ecosystem services identified in the literature
Direct use of services (Source) Indirect use of services (Source)
Provision services
Agriculture
Food crops (MA 2005; Kaplowitz and Hoehn 2001; Deutsch and
Folke 2005; de Groot and Hein 2007) Fruit trees (; de Groot and Hein 2007)
Animal feed (Deutsch and Folke 2005; de Groot and Hein 2007)
Vegetables (MA 2005; Kaplowitz and Hoehn 2001)
Animal husbandry
Meat products (MA 2005; Deutsch and Folke 2005; de Groot
and Hein 2007) Milk and egg products
(MA 2005; Deutsch and Folke 2005)
Fuel
Wood (MA 2005;Costanza et al. 1998; Madubansi and Shackleton
2007; Brouwer and Hoorweg 1997; de Groot and Hein 2007) Dung (MA 2005; Madubansi and Shackleton 2007; Brouwer and
Hoorweg 1997) Forestry
Firewood (MA 2005; Kaplowitz and Hoehn 2001; Deutsch and
Folke 2005; Madubansi and Shackleton 2007; Brouwer and
Hoorweg 1997) Timber (Kaplowitz and Hoehn 2001; Turner et al. 2003)
Roofing materials (Kaplowitz and Hoehn 2001; de Groot and
Hein 2007) Fibre
Wood, jute, cotton, hemp, silk, wool (MA 2005)
Fresh water (MA 2005; Kaplowitz and Hoehn 2001; Deutsch and
Folke 2005)
Support services
Biodiversity (Kaplowitz and Hoehn 2001)
Nursery (De Groot 2002)
Primary production (MA 2005)
Soil formation (Costanza et al. 1998)
Regulation services
Carbon sequestration (Kaplowitz and Hoehn
2001; Turner et al. 2003)
Water purification (Kaplowitz and Hoehn 2001)
Flood prevention (MA 2005)
Nutrient regulating (De Groot 2002)
Water regulation (TEEB 2010)
Waste treatment (Costanza et al. 1998)
Climate regulation (MA 2005; Costanza et al.
1998)
Culture services
Ecotourism (Kaplowitz and Hoehn 2001)
Recreation (Kaplowitz and Hoehn 2001; Turner et al.
2003; Costanza et al. 1998) Social cohesion (MA 2005)
Use of ecosystem services is a function of the following factors;
Eu = f (Xav, Xac, Xhz, Xatt, Xbev, Xinc, Xpri, Xpol, …, Xn) (Eq. 1.2)
Where, Xav is the availability of ecosystem services and goods, Xac is
accessibility of the services and goods, Xhz is household size, Xatt is attributes of
consumers to the ecosystem services and goods, Xbev is consumers‘ behaviour, Xinc is
income, Xpri is price, Xpol is policy variable.
Availability of ecosystem services determines the spatial and temporal variations of
utilization patterns and the total usage in a region. Accessibility can be expressed as
the distance between consumers‘ locations and services. This distance is normally
non-linear and a threshold is usual assessed to quantitatively measure accessibility.
For example, in the China Wolong natural reserve, a distance threshold is assigned to
analyse the use of fuelwood and panda protection (Liu et al. 2003). Barbier‘s study in
Thailand confirms that the ‗accessibility‘ of mangrove areas is an important
determinant of mangrove clearing for shrimp farming (Barbier 2005).
The number and distribution of households by size is an important factor driving use
of ES and ecosystem change. Several studies have approved relationships between
population size, household size and household basic consumption (Zhen et al. 2008;
Liu et al. 2007). First, more households mean more housing units, thus generally
increasing the amount of land and materials needed for house construction. Second,
smaller households have lower efficiency of resource use per capita because
ecosystem services are shared by more people in larger households (Liu et al. 2003).
16
Policy could be a factor affecting household size. For instance, Natural forest
conservation program in Wolong of China led to a large number of new households in
2001 because many households decided to split into smaller ones to more effectively
capture subsidies (20% to 25% of the average household income) given to households
as part of the program, that probably causing increased demand for fuelwood and land
for house construction (Liu et al. 2001).
Income level affects the purchasing power, and the consumers‘ WTP and WTA. The
Millennium Ecosystem Assessment (2005) concluded that wealthier populations
normally consume more ecosystem services than poorer ones. They also control more
ecosystem services than poor people. For instance, the rich can buy a service from
elsewhere if it is not available locally. Income also influences demand for and the
structure of the ecosystem services. A study in middle-income developing countries
found that rising incomes will probably lead to increased demand for protein in
human diets (Robertson and Swinton 2005). The resulting change in price will have
strong impacts on utilization patterns. Similarly, Xu et al. (2006a) found that the price
of electricity affected consumer‘s use of fuel wood in the Wolong natural reserve.
Consumer behaviour can be predicted using consumer preferences (i.e. consumer
choices and limitations) and the possibility of use of ecosystem services.
1.8.4 Trade-off analysis
To analyse trade-offs I organised workshops in the study area in 2012 and 2013,
provisioning services, regulating services and supporting service habitat service were
perceived to be of high importance compared with all of other ecosystem services. My
research therefore mainly focus on (1) provisioning services, including food, water,
fuel (such as dung-based bio-fuel, electricity and gas and coal) and other raw
materials derived from Net Primary Productivity (NPP); (2) regulation services
(nutrition regulation, including maintenance of the N, K & P flows through the
ecological process from soil to vegetation, then to animal and human); (3) supporting
services (habitat services, including importance for biodiversity protection and
ecosystem functional types of organisms and their traits; soil retention services (soil
type, soil water content and soil bulk density) and bio-mass supporting services for
fodders of livestock).
To analyse the trade-offs between the selected ecosystems services in terms of the
effects of utilization patterns in the study area, I carried out annual field visits to take
plot samples (of soil and vegetation) and conduct interviews with local communities
and experts. To analyse the provisioning services, first-hand data of household basic
consumption were collected by questionnaire. Plot sample data (e.g. soil water
content, soil nutrition and soil bulk density) was measured for the analysis of
supporting and regulation services. A series of interviews with local communities and
experts were conducted to gather the information of habitat and biodiversity, this
interview data together with plot sample data of vegetation (e.g. types and amounts)
accounted for the analysis of habitat services (part of supporting services). Moreover,
data from national statistical offices was used to support the whole analysis process,
especially for the analysis of changes over time.
1.8.5 Investigating stakeholders’ WTP and WTA
Contingent valuation method (CVM) was used to quantify each household‘s WTA and
each government official‘s WTP for grassland conservation. To mitigate the
hypothetical bias, stakeholder surveys (in 2008 and 2012) and follow-up questions
17
were used to determine the potential WTA and WTP for grassland conservation for the
herders and the government officials respectively. The formal survey started with a
description of the purpose of the survey to participants, continued with gathering of
basic demographic data, and concluded with questions intended to reveal the
participant‘s WTA for not overgrazing or not grazing in specific plots, based on the
expected annual bid values (10, 20, 40, 80, 120, 160, 200 and 240 US$ ha-1
). The
expected bids were determined based on the income losses that resulted from land
conservation. In each questionnaire, the respondent was asked a follow-up question
such as the following: ―If grazing activities are restricted to conserve grasslands and
your financial losses should be compensated, would you be willing to accept/pay
[amount] for the economic loss/conservation to meet this end? (yes/no).‖ Respondents
who answered ‗yes‘ to the question were then asked to indicate their willingness by
choosing either yes or no in response to the corresponding bid value. For the analysis
of WTA, a logit model (Hanemann 1984) was applied to reveal the relationship
between the respondent‘s willingness to accept a bid (‗yes‘ or ‗no‘) and the
corresponding bid value (based on data from the preliminary surveys). The standard
form of the model is as follows:
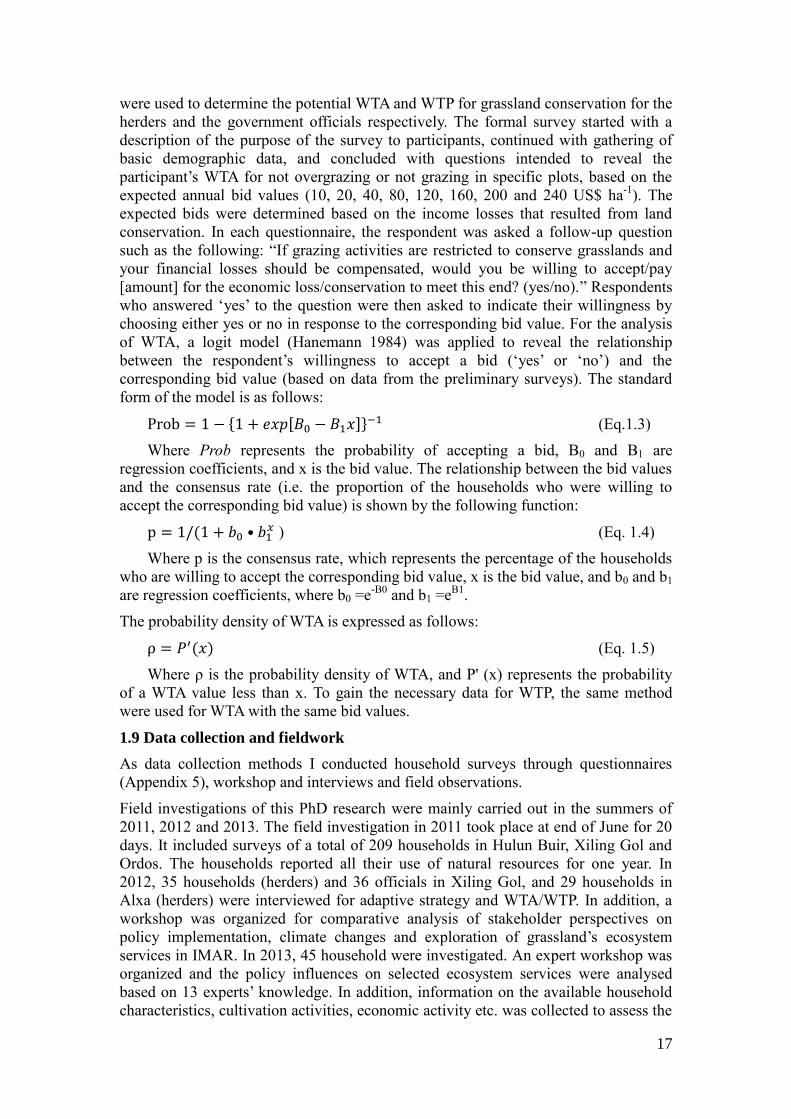
Prob = 1 − *1 + 𝑒𝑥𝑝,𝐵0 − 𝐵1𝑥-+−1 (Eq.1.3)
Where Prob represents the probability of accepting a bid, B0 and B1 are
regression coefficients, and x is the bid value. The relationship between the bid values
and the consensus rate (i.e. the proportion of the households who were willing to
accept the corresponding bid value) is shown by the following function:
p = 1/(1 + 𝑏0 • 𝑏1𝑥 ) (Eq. 1.4)
Where p is the consensus rate, which represents the percentage of the households
who are willing to accept the corresponding bid value, x is the bid value, and b0 and b1
are regression coefficients, where b0 =e-B0
and b1 =eB1
.
The probability density of WTA is expressed as follows:
ρ = 𝑃′(𝑥) (Eq. 1.5)
Where ρ is the probability density of WTA, and P' (x) represents the probability
of a WTA value less than x. To gain the necessary data for WTP, the same method
were used for WTA with the same bid values.
1.9 Data collection and fieldwork
As data collection methods I conducted household surveys through questionnaires
(Appendix 5), workshop and interviews and field observations.
Field investigations of this PhD research were mainly carried out in the summers of
2011, 2012 and 2013. The field investigation in 2011 took place at end of June for 20
days. It included surveys of a total of 209 households in Hulun Buir, Xiling Gol and
Ordos. The households reported all their use of natural resources for one year. In
2012, 35 households (herders) and 36 officials in Xiling Gol, and 29 households in
Alxa (herders) were interviewed for adaptive strategy and WTA/WTP. In addition, a
workshop was organized for comparative analysis of stakeholder perspectives on
policy implementation, climate changes and exploration of grassland‘s ecosystem
services in IMAR. In 2013, 45 household were investigated. An expert workshop was
organized and the policy influences on selected ecosystem services were analysed
based on 13 experts‘ knowledge. In addition, information on the available household
characteristics, cultivation activities, economic activity etc. was collected to assess the

18
total use of natural resources per household. The main part of the fieldwork is
designed to identify variations in householders' basic use of natural resources (food,
water and fuel consumption for humans) and householders‘ productive use of natural
resources (e.g. livestock cultivation, mining and tourism) under different spatial and
temporal situations in IMAR. The satisfaction about income and production mode, the
perspectives on future grassland use and expectations about the living conditions of
the next generation were also investigated during the interviews.
The data from 16 sample sites (over 60 plots) was collected on soil water content, soil
nutrition and soil bulk density and grassland-cover ratio, biomass and plant diversity
under different land-use intensity.
1.10 Outline of the thesis
In order to address the researchs objective and the research questions, I implemented
serveral sequential steps (Figure 1.4). These steps structure this thesis and each
chapter addresses a different research question.
Chapter 2 describes the restoration policy-oriented adaptive changes to basic
household utilization patterns of food, fuel and water, and their spatial distribution by
grassland types in the region. Direct household consumption data were collected in
the meadow steppe (Hulun Buir), typical steppe (Xilin Gol) and semi-desert steppe
(Ordos) ecosystems using structured questionnaires administered to 209 herders and
farmers. In this chapter, I describe the changing changes in local circumstances to
satisfy their needs, and to review the grassland-use policy changes and how policies
influence livelihoods and household adaptive strategies.
Chapter 3 aims to present householders‘ total water use, including direct domestic
water use like human drinking, cooking and washing and indirect water use for
production of food items consumed. To investigate the spatial and temporal
distribution of total water use at the household level across different grassland types
(meadow steppe, typical steppe and semi-desert steppe) along the grassland transect in
the IMAR. This process is threefold: firstly, the basic food consumption patterns of
the households were investigated, using household questionnaire surveys and
statistical analysis; secondly, the direct and indirect water use behind the food
consumption patterns were analysed, and its spatial and temporal variations were
explored, using the Virtual Water Content (VWC) approach; thirdly, direct use of
water resources and direct water regulating services will be traced based on the water
use analysis.
Chapter 4 addresses the effects on household dependence on local grasslands of
IMAR and on perceptions of the future of grassland use were analysed in this chapter.
The main contents of this chapter are: (1) indicators of changes in the livelihoods of
residents of our study area in Inner Mongolia; (2) the dynamics of household
livelihoods in response to changes in access to natural assets and in their agricultural
activities; (3) the financial adjustments of households to changes in their dependence
on local grasslands; and (4) their perceptions of careers for the next generation of their
family.
Chapter 5 aims to evaluation of the ecosystem servicers and trade-offs between
livelihoods and grasslands ecosystem services of IMAR. In this chapter, four
ecosystem services were selected. These are food and raw material provision service,
habitat service, soil retention service and soil nutrition regulation service. The analysis
based on field survey of quadrats-sampling plots for soil and vegetation at 16
sampling sites including semi- desert stepper, typical stepper and meadow stepper
19
grassland ecosystems in the Inner Mongolia at key growth periods of vegetation, and
traced the trade-off process between land-use degree (non-used, light used, moderate
used, severe used and recovery sites) on household level and their effects on
ecosystem services. In this chapter, measuring quantifiable vegetation traits and soil
properties during the trade-off process have been identified across a range of abiotic
and biotic conditions, and their connection with ecosystem services has been assessed
under different conditions. Also the feasible management for this trade-off process
was discussed.
Chapter 6 analysis the impacts of a top-down PES program designed by China‘s
central government on the livelihood of herders in the IMAR. Their preferences for
key elements of the PES program design were examined, including payment type,
amount and means. The WTA of the herders and WTP of the relevant government
agencies were estimated for two local PES programs (SLCP and RGLGP). The goal
of this chapter is analysing proposed WTA and WTP were to compare WTA with the
actual payments to learn whether these payments are satisfactory, and to compare
WTA with WTP to learn whether the government recognizes dissatisfaction among
program participants and is willing (budget permitting) to improve their situation.
These factors will have important consequences for the long-term effectiveness of the
programs and for grassland management.
Chapter 7 provides a general synthesis and discussion of the main findings and key
conclusions. The synthesis of all my findings from previous chapters answers the
research questions (Chapter 1). These answers are also placed in a broader context and
they are reflected upon. This reflection helps to draft recommendations to better
design feasible strategies to sustainably manage IMAR‘s grasslands. This chapter also
highlights the major contributions, strengths and limitation of this thesis and provides
specific recommendations for future research.

20

21
CHAPTER 2
Chapter 2: Changing patterns of basic household consumption:
policy-oriented adaptive changes in the use of grasslands
Based on:
Du B., Zhen L., de Groot R., Goulden C.E., Long X., Cao X., Wu R., Sun C. 2014.
Changing patterns of basic household consumption in the Inner Mongolian grasslands
a case study of policy-oriented adoptive changes in the use of grasslands. The
Rangeland Journal 36(5): 505-517.
22
Abstract:
Grassland ecosystems, as the basic natural resources in the Inner Mongolia
Autonomous Region, are becoming increasingly sensitive to human intervention,
leading to deterioration in fragile ecosystems. The goal of this chapter was to describe
the restoration policy-oriented adaptive changes to basic household consumption
patterns of food, fuel, and water, and their spatial distribution by grassland types in
the region. Basic household consumption data were collected in the meadow steppe
(Hulun Buir), typical steppe (Xilin Gol) and semi-desert steppe (Ordos) ecosystems
using structured questionnaires administered to 209 herders and farmers. In 2010, the
householders‘ intake comprised a low amount of agri-crops, including staple foods,
vegetables and fruit with a high amount of meat, which still dominated the patterns of
food consumption. However, the number of households preferring this pattern is
decreasing and higher amounts of agri-crop and lower amounts of meat consumption
pattern is increasing. From1995 to 2010, fuel consumption patterns changed from
being dominated by bio-fuels (dung) to being dominated mainly by electricity and
gas. However, bio-fuel remains a major energy source for daily life in the meadow
steppe ecosystem. In all three surveyed grassland types, the use of coal, electricity and
gas increased from 1995 to 2010. The source of domestic water in all three surveyed
areas is from groundwater, with an increasing trend to use tap water from a public
supply rather than from privately owned wells.
Keywords: consumption patterns, food, fuel, grassland, household, restoration policy,
water.
23
2.1 Introduction
The world faces enormous challenges from destruction of ecosystems (Millennium
Ecosystem Assessment 2005). This ongoing phenomenon threatens the availability
and quality of natural resources, such as arable land, grasslands, fresh water and
undeveloped natural areas (Food and Agriculture Organization 2003; World Wildlife
Fund 2007; Haftay et al. 2013). Studies on natural resources and ecosystem services
have shown that the collapse of ecosystems is caused by over-consumption as
populations increase and shift towards more affluent basic consumption patterns that
challenge fragile ecosystems (Food and Agriculture Organization 2003; Hoekstra and
Chapagain 2008).
Inner Mongolia Autonomous Region (IMAR) has a long tradition of nomadic
pastoralism. Since 1990, increasing trends of household basic consumption and
population growth have been associated with a transition to intensive grazing,
increased crop cultivation and mining activities (Zhen et al. 2010a; König et al.
2014b). These activities have put significant pressure on local ecosystems, as the
natural environment is vulnerable to low levels of precipitation with thin soil layers
and low soil fertility (Li et al. 2003, 2008; Zhang et al. 2007). The grassland in IMAR
acts as an ecological barrier in China separating different eco-zones and the
degradation of the grasslands has also negatively influenced the productivity and well-
being of human populations throughout eastern China and East Asia (Zhang et al.
2007). Therefore, a basket of restoration policy measures for these grasslands have
been enforced in the last decade to reverse grassland deterioration (Li et al. 2007; Yin
and Yin 2010; Li and Huntsinger 2011), such as rotational grazing, seasonal grazing,
grazing prohibition, livestock movement, and control of livestock rearing. However,
these newly introduced grassland management policies exert great stress on local
households‘ livelihood by fundamentally changing their lifestyles (Xie et al. 2006;
Dong et al. 2007; König et al. 2014b) and reshaping the patterns of basic consumption
by households.
Previous studies of the grassland ecosystems in IMAR have focused on climate
change and its environmental consequences (Bolortsetseg and Tuvaansuren 1996;
Dulam 2005; Dong et al. 2013; Liu et al. 2013; Xiao et al. 2013) or on the conflict
between agrarian communities and nomads (e.g. Zhang et al. 2007), and most
research in this region frequently addressed soil properties, soil erosion, vegetation
changes, and the interaction between vegetation changes and soil degradation (Cao et
al. 2002; Feng and Zhao 2011; Hoffmann et al. 2011; Li et al. 2011). There have been
few socio-economic studies, and most of them have focused on regional land-use
preferences, rural reforms, primary production or grassland policy (e.g. Brogaard and
Xueyong 2002; Brogaard et al. 2005; Li and Huntsinger 2011; König et al. 2014b).
General research on basic household consumption in IMAR has shown that the
pressure on degraded ecosystems has increased as the population has increased and
that it results in an unbalanced consumption of ecosystem services (Zhen et al.
2010a). Receveur et al. (1997) indicated that diet varied according to sex, age and
community. Gerbens-Leenes and Nonhebel (2002) reported that even small changes in
food consumption patterns can trigger large impacts on ecosystems due to the
agricultural area required to produce this food. For example, a slight increase in the
consumption of meat (one mouthful or 10 g capita-1
day-1
) will require the increased
intensive use of an additional area of 103m2 household
_1 year
_1 of the alpine meadow
steppe area. Previous research on fuel consumption (e.g. Bhatt and Sachan 2004;

24
Madubansi and Shackleton 2007) showed that the most widely used form of biomass
for fuel was forest trees; however, in areas where trees are scarce due to natural
factors or are an unsustainable human consumption practice, dried dung is used as the
primary fuel source. Most studies on food, fuel and water consumption describe
changes in a qualitative way (e.g. Fogel and Helmchen 2002; Zhang 2004; Gerbens-
Leenes and Nonhebel 2002; Sun et al. 2014) and do not partition patterns according to
consumption quantities and types. Additionally, of what little research has been done
in IMAR, most has focused on food and fuel security (e.g. Liu et al. 1998; Wang
2011).
To help fill this research gap, this chapter performed a study designed to reveal the
changing patterns of basic household consumption and how the populace adapts to
policy changes and changes in local circumstances to satisfy their needs. The purposes
of this chapter were to estimate basic household consumption of food, fuel and water;
to estimate the spatial and temporal distribution of consumption at the household level
over different grassland types (meadow steppe, typical steppe, and semi-desert steppe)
in IMAR; and to review the grassland-use policy changes and the process of policy
influencing livelihoods and household adaptive strategies. This chapter also aims to
provide a better understanding of the changing patterns of consumption of the
populace of IMAR who share a similar culture and customs, and who could contribute
to the sustainable use of natural resources.
2.2 Materials and methods
2.2.1 Background of study area
Located in the southern part of the Mongolian Plateau (37o01‘–03
o 02‘ N and 95
o
02‘–123 o 37‘E), IMAR covers 11.8 million km
2, and it is the third largest province in
China. The region is characterized by an arid to semi-arid continental climate (Yu et
al. 2003) with strong climatic gradients and supports varied land-use practices (Figure
2.1). Annual precipitation ranges from 100mm to 500m and decreases from north-east
to south-west. The annual mean, minimum and maximum temperatures in the
temperate grasslands are 1.68 o C, -18.3
o C and 18.7
o C, respectively (Yu et al. 2003).
Hulun Buir, in the northeast of IMAR, is a transitional zone where the meadow
steppes meet the Greater Hingaan Mountains. The meadow steppes are the most
productive type of grasslands (Yu et al. 2003) and develop in areas with moist fertile
soils that are rich in organic matter (Kang et al. 2007). The north central area of
IMAR, Xilin Gol, borders the semi-desert and is dominated by typical steppe (Ji et al.
2009). Typical steppe land is drought-tolerant with multiple vegetation species. The
south-western area of IMAR, Ordos, is dominated by semi-desert steppe and is the
most arid ecosystem with the least biomass (Yu et al. 2003). Typical steppe and
meadow steppe are the predominant grassland ecosystems and are commonly used for
grazing and animal production (Kang et al. 2007). The local populace depends mainly
on husbandry and the grassland ecosystems to supply almost all of the forage needed
for their livestock and to support the livelihood of the region‘s herders (Zhen et al.
2010a). IMAR is mainly a self-sufficient region, but certain foods need to be
purchased, such as rice, flour and fruit. It is also an energy rich region, especially rich
in coal. In June 2007, the proven reserves of coal were estimated to be 685.3 billion
tons, ranking first of all Chinese provinces (Liu et al. 2012).
The socio-economic situation from north-east to south-west in the study area varies
greatly. The north-east (Hulun Buir), a traditional pastoral area, has become the largest
milk and meat producer in China. Half of the north central region (Xilin Gol) was a
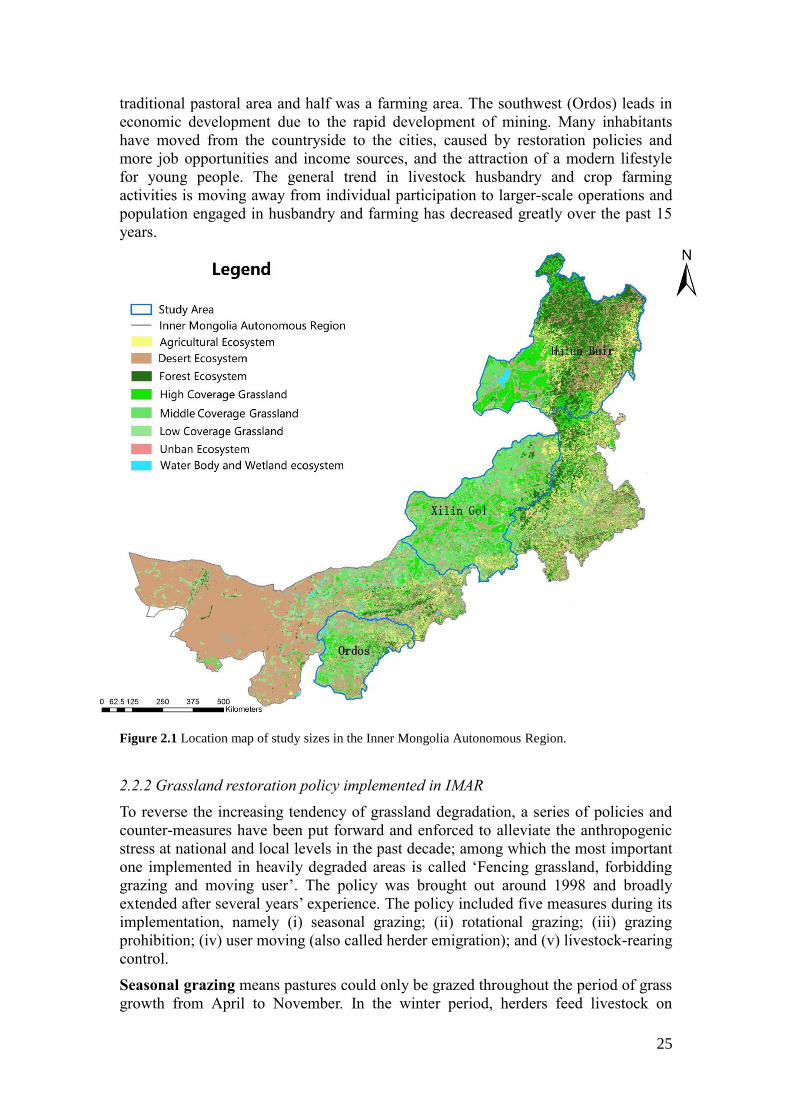
25
traditional pastoral area and half was a farming area. The southwest (Ordos) leads in
economic development due to the rapid development of mining. Many inhabitants
have moved from the countryside to the cities, caused by restoration policies and
more job opportunities and income sources, and the attraction of a modern lifestyle
for young people. The general trend in livestock husbandry and crop farming
activities is moving away from individual participation to larger-scale operations and
population engaged in husbandry and farming has decreased greatly over the past 15
years.
Figure 2.1 Location map of study sizes in the Inner Mongolia Autonomous Region.
2.2.2 Grassland restoration policy implemented in IMAR
To reverse the increasing tendency of grassland degradation, a series of policies and
counter-measures have been put forward and enforced to alleviate the anthropogenic
stress at national and local levels in the past decade; among which the most important
one implemented in heavily degraded areas is called ‗Fencing grassland, forbidding
grazing and moving user‘. The policy was brought out around 1998 and broadly
extended after several years‘ experience. The policy included five measures during its
implementation, namely (i) seasonal grazing; (ii) rotational grazing; (iii) grazing
prohibition; (iv) user moving (also called herder emigration); and (v) livestock-rearing
control.
Seasonal grazing means pastures could only be grazed throughout the period of grass
growth from April to November. In the winter period, herders feed livestock on

26
conserved forage indoors. These policy measures were broadly implemented across
grasslands in IMAR, especially in the slightly degraded grassland, such as Hulun
Buir, that could be restored by management intervention.
Rotational grazing was implemented in slightly and moderately degraded grassland
during the summer grazing period to control grazing intensity. The grassland was
fenced and divided into paddocks and then used in rotation.
Grazing prohibition was mainly carried out in severely degraded grassland, such as
in the Xilin Gol and Ordos areas. Grazing was forbidden and the objective was to
encourage grassland recovery.
User moving (migration) was imposed on severely degraded grassland (e.g. Ordos
area), with the aim of improving the living conditions of local residents through
migrating to a more favourable area and running more profitable enterprises.
Livestock-rearing control refers to the farming area in the farming-pastoral zone,
where limited numbers of livestock could be grazed by the administrative authority,
and the objective of the policy was to lower the impact of grazing. Xilin Gol is the
typical area influenced by this measure. The number of livestock is limited according
to the carrying capacity of local grassland, and nomadism is prohibited and replaced
by rearing indoors.
2.2.3 Research design and data collection
A survey of 209 households was conducted from June to July 2010. Three typical
areas were selected in IMAR on a transect from north-east to south-west (Figure 2.1).
Criteria for selection of the areas included (1) representativeness of grassland types,
which included meadow steppe (Hulun Buir), typical steppe (Xilin Gol) and semi-
desert steppe (Ordos); (2) grassland restoration policies having been implemented;
and (3) representing the typical production activities of each of the areas. In Hulun
Buir, the principal activity is traditional animal husbandry, with livestock rearing as
the main land use with 89% of the population involved in livestock rearing, and arable
land accounts for only 0.9% of the total land area (Hulun Buir Statistics Bureau
2012). In Xilin Gol, 39% of the population lives on the steppe and arable farming and
animal husbandry are predominant. Arable land accounts for only 2.2% of the total
area but produces food for ~43% of the total population (Xilin Gol Statistics Bureau
2012). In Ordos, there is a combination of arable farming, animal husbandry with a
range of grassland types, and mining with 15% and 18% of the surveyed populations
relying on animal husbandry and arable farming, respectively, and over 31% of the
population working in the mining industry and related services (e.g. transportation)
(Ordos Statistics Bureau 2011a; 2011b).
Using a stratified random sampling method (Weber and Tiwari 1992), 10 villages
were selected as the survey units, three in Hulun Buir, two in Xilin Gol, and five in
Ordos to trace the basic consumption patterns of households. In each of the villages,
we selected households randomly for interviews to obtain answers for our
questionnaire. Over 65% of total households of each village was investigated as
appropriate sample sizes based on the suggestion of Tabachnick and Fidell (2007) that
a sample should be over 50% when the total households of the survey unit group are
lower than 100. Because the survey was carried out using face-to-face interviewing of
the respondents or having the respondents complete the questionnaires under the
research group members‘ guidance, a high response rate of 90.5% was obtained.
27
Prior to the formal surveys, test surveys were conducted by using individual
interviews and family group discussions with herders and other key informants, and
the information collected in the test surveys guided the development of the formal
questionnaire. The formal survey contained questions designed to obtain information
regarding: (a) background information of households (information on available
household characteristics, cultivation activities and other economic activities); (b) the
consumption of food (agricultural crops and meat), fuel and water during the year
prior (2010); and (c) the consumption of food (agricultural crops and meat), fuel and
water around the year 1995 before the implementation of the grassland restoration
policy (as recalled by the respondents). The respondents reported the variety and
quantity for each category.
Quantities eaten included food from the respondent‘s own production and food
purchased at markets. Out-of-home meals were not taken into consideration, as this
survey was conducted in rural and underdeveloped areas where the occasional out of-
home meal happens infrequently, perhaps one or two times per year on special
occasions. Additionally, quantifying the amounts for out-of-home meals is very
difficult due to the uncertainties in the amounts of materials used for a dish.
The same method was applied to estimate annual water and fuel consumption per
capita. The survey collected the total cost or kilograms of water and fuel (e.g. bio-fuel,
coal, electricity and gas) bought or gathered in a year for cooking, heating and other
domestic uses, as estimated by respondents of each household. For each household
visited, we asked the head of each household or a family member who was familiar
with the household to answer the questions. The survey revealed that households
could accurately recall their consumptions in the year before the survey and the main
consumption patterns in 1995. We primarily used closed-ended questions, but added
open-ended questions where there was an opportunity to expand on the topics during
the interview.
2.2.4 Data analyses
The statistics software SPSS, Version 17.0 (SPSS Inc., Chicago, IL, USA) was used
for data analysis. Specifically, the results of this chapter applied SPSS functions of
frequency analysis and descriptive analysis, including mean values and percentages,
for resource consumption and perceptions; used one-way ANOVA to examine
significance levels between the three areas; and used ‗independent-sample t-tests‘ to
identify significant differences of consumption between 1995 and 2010. Cluster
analysis is the task of grouping a set of objects in such a way that objects in the same
group (clusters) are more similar to each other than to those in other groups. Such
analysis is a main task in exploratory data mining and a common technique for
statistical data analysis that is used in many fields. In our research, the K-means
clustering method was adopted to classify food consumption patterns in 1995 and
2010. For food, water and fuel consumption, We took the weight per capita as an
approximation of unit for the sake of simplicity, which increases the comparability
and recognition of trends in consumption.
2.3 Results
2.3.1 Basic respondent information
The respondents of the household survey questionnaire were predominantly male
(Hulun Buir 76%; Xilin Gol 68%; Ordos 69%). The average household size of three
adult equivalents is consistent with the national average in China reported by NSBC
28
(2006). The average age of all respondents was 51 years. Herders in Hulun Buir, Xilin
Gol and Ordos had average ages of 43.2, 55.8 and 54.6 years, respectively. The
average age of farmers and herders in Xilin Gol was the highest, with 57% of
respondents older than 50 years. This is likely explained by the fact that the
government was converting most farmland to grassland and forest, and nomadic
grazing was strictly forbidden in Xilin Gol due to the serious degradation of the
typical steppe (Zhang et al. 2007). As the farmers and herdsman lose their capital
goods, the younger people start new lives in the cities, whereas the older people
remain at home.
The herders in Hulun Buir own abundant grassland and most no longer follow a
nomadic lifestyle, instead settling near their land and cultivating small parcels of farm
land to grow potatoes and vegetables during the spring and summer. In Xilin Gol in
2010, the total land owned was less than half that in Hulun Buir. In Ordos, the
inhabitants have the lowest land ownership (Table 2.1). In the past, some farmers and
herders in Ordos also owned severely degraded grassland and mineral land, but it has
been expropriated by the government for protection or released to individual
companies for mining.
The three regions showed significantly different livestock ownership numbers per
household (Table 2.1). In Hulun Buir, rearing of sheep and cattle was the major
economic activity, whereas lower numbers of cattle and sheep were seen in Xilin Gol
due to the implementation of the livestock-rearing control measure. In Ordos, few
cattle and sheep are raised. The decision in Ordos to raise more small animals, such as
chickens, seems to be a pragmatic response to local government initiatives that have
restricted the use of ecosystems for grazing to prevent the continued degradation of
the local desert steppe.
The overall annual income of the surveyed households in 2010 was RMB 62 359
(US$9896), 6% of which came from crop production, 38% from livestock herding and
56% from non-agricultural income (e.g. migrant jobs, subsidies and remuneration
after land expropriation). The average annual household income in Ordos was highest
at RMB 66 944 (US$10 630) followed by Hulun Buir at RMB60 110 (US$9545) and
Xilin Gol at RMB59 800 (US$9496). In our sample, livestock herding was the most
important source of income in Hulun Buir, accounting for 72% of total income
followed by non-agricultural income at 28%. Only 1% of household income came
from crop production. In Xilin Gol, income from livestock rearing showed a
significant decrease compared to the level of 1995 (53%), accounting for only 38% of
total, but the income from crop products and non-agriculture work increased from
18% and 29%, respectively, to 14% and 47%, respectively. In Ordos, the incomes
from crop production and livestock herding accounted in 2010 for only 1% and 3%,
respectively, of total household income with the remaining 96% of income originating
from off-farm sources. And in 1995, the off-farm income accounted for 35% of the
total income in Ordos. An important component of off-farm income in Ordos was
from compensation for land expropriation by the government for the grassland
restoration policy or from companies of the mining industry, which accounted for
almost 79% of total income. The income results may indicate that the typical steppe
and semi-desert steppe ecosystem cannot provide the basic products to meet
household needs and, as such, the herders and farmers are beginning to find new
sources of income, such as employment in other areas.
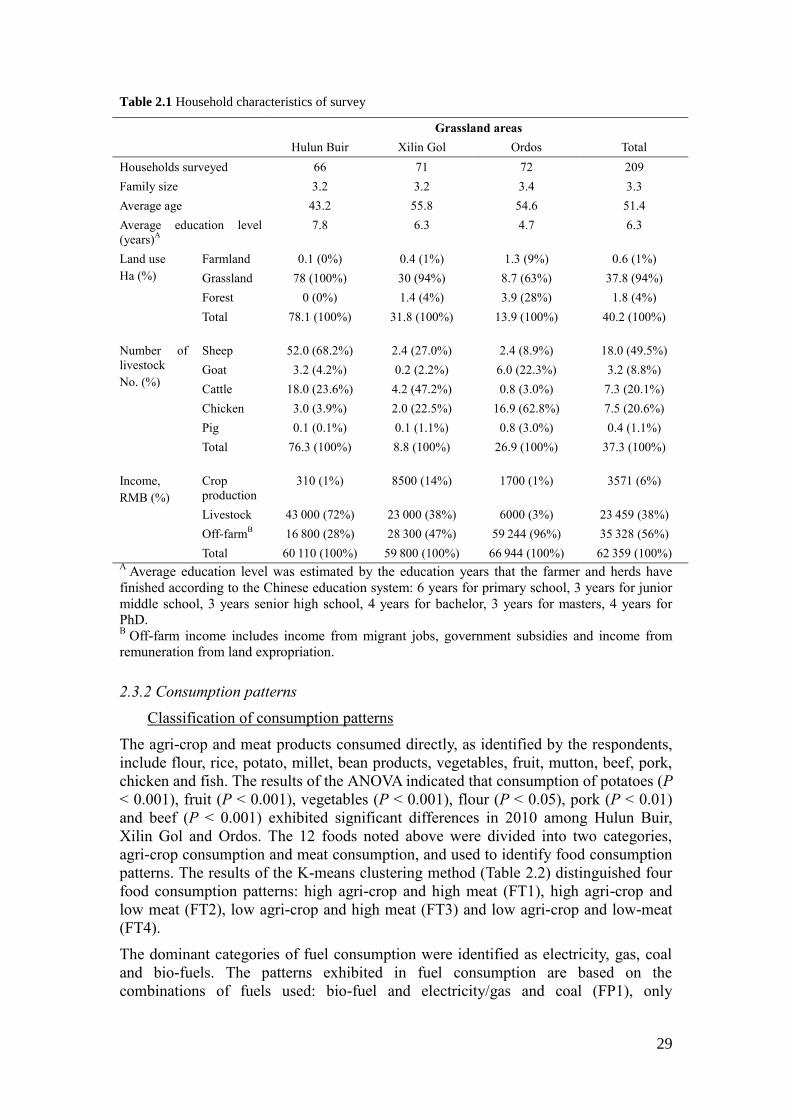
29
Table 2.1 Household characteristics of survey
Grassland areas
Hulun Buir Xilin Gol Ordos Total
Households surveyed 66 71 72 209
Family size 3.2 3.2 3.4 3.3
Average age 43.2 55.8 54.6 51.4
Average education level
(years)A
7.8 6.3 4.7 6.3
Land use
Ha (%)
Farmland 0.1 (0%) 0.4 (1%) 1.3 (9%) 0.6 (1%)
Grassland 78 (100%) 30 (94%) 8.7 (63%) 37.8 (94%)
Forest 0 (0%) 1.4 (4%) 3.9 (28%) 1.8 (4%)
Total 78.1 (100%) 31.8 (100%) 13.9 (100%) 40.2 (100%)
Number of
livestock
No. (%)
Sheep 52.0 (68.2%) 2.4 (27.0%) 2.4 (8.9%) 18.0 (49.5%)
Goat 3.2 (4.2%) 0.2 (2.2%) 6.0 (22.3%) 3.2 (8.8%)
Cattle 18.0 (23.6%) 4.2 (47.2%) 0.8 (3.0%) 7.3 (20.1%)
Chicken 3.0 (3.9%) 2.0 (22.5%) 16.9 (62.8%) 7.5 (20.6%)
Pig 0.1 (0.1%) 0.1 (1.1%) 0.8 (3.0%) 0.4 (1.1%)
Total 76.3 (100%) 8.8 (100%) 26.9 (100%) 37.3 (100%)
Income,
RMB (%)
Crop
production
310 (1%) 8500 (14%) 1700 (1%) 3571 (6%)
Livestock 43 000 (72%) 23 000 (38%) 6000 (3%) 23 459 (38%)
Off-farmB 16 800 (28%) 28 300 (47%) 59 244 (96%) 35 328 (56%)
Total 60 110 (100%) 59 800 (100%) 66 944 (100%) 62 359 (100%) A
Average education level was estimated by the education years that the farmer and herds have
finished according to the Chinese education system: 6 years for primary school, 3 years for junior
middle school, 3 years senior high school, 4 years for bachelor, 3 years for masters, 4 years for
PhD. B
Off-farm income includes income from migrant jobs, government subsidies and income from
remuneration from land expropriation.
2.3.2 Consumption patterns
Classification of consumption patterns
The agri-crop and meat products consumed directly, as identified by the respondents,
include flour, rice, potato, millet, bean products, vegetables, fruit, mutton, beef, pork,
chicken and fish. The results of the ANOVA indicated that consumption of potatoes (P
< 0.001), fruit (P < 0.001), vegetables (P < 0.001), flour (P < 0.05), pork (P < 0.01)
and beef (P < 0.001) exhibited significant differences in 2010 among Hulun Buir,
Xilin Gol and Ordos. The 12 foods noted above were divided into two categories,
agri-crop consumption and meat consumption, and used to identify food consumption
patterns. The results of the K-means clustering method (Table 2.2) distinguished four
food consumption patterns: high agri-crop and high meat (FT1), high agri-crop and
low meat (FT2), low agri-crop and high meat (FT3) and low agri-crop and low-meat
(FT4).
The dominant categories of fuel consumption were identified as electricity, gas, coal
and bio-fuels. The patterns exhibited in fuel consumption are based on the
combinations of fuels used: bio-fuel and electricity/gas and coal (FP1), only

30
electricity/gas (FP2), electricity/gas and coal (FP3) and only bio-fuel (FP4) (Table
2.2).
Table 2.2 Consumption classifications and patterns in 2010
Patterns Abbr. N (%) Amount (kg capita–1
year–1
) Classification
references Mean S.E. Range
High agri-crop A (1)
+ high meat B (2)
FT1 22 (10.5%) (1): 486,
(2): 122
28.7,
5.9
393–546,
105–153
K-means
clustering
method
High agri-crop (1) +
low meat (2)
FT2 68 (32.5%) (1): 480,
(2): 71
30.6,
3.3
395–527,
58–101
Low agri-crop (1) +
high meat (2)
FT3 79 (37.8%) (1): 335,
(2): 129
20.1,
7.8
227–383,
105–188,
Low agri-crop (1) +
low-meat (2)
FT4 40 (19.1%) (1): 315,
(2): 72
21.0 219–384,
48–100
Bio-fuel (1) + E/GD
(2) + Coal (3)
FP1 127 (60.8%) (1): 2236,
(2): RMB 72,
(3): 1415
247.2,
8.3
179.8
294–4688,
25–191
313–2500
Categories of
fuels
Only E/G FP2 22 (10.5%) RMB 508 34.3 353–635
E/G (1) + Coal (2) FP3 60 (28.7%) (1): RMB 199,
(2): 1140
19.4
197.4
141–281
625–2059
Wells WT1 153 (73.2%) 13.76 m3 0.7 9.9–17.6 Water supply
Tap WT2 56 (26.8%) 12.66 m3 0.7 9.1–18.9
AAgri-crop: flour, rice, potato, vegetable, fruit, millet and beans.
BMeat: mutton, beef, pork, chicken and fish.
CBio-fuel: dung, core-wood and straw.
DElectricity/Gas.
S.E.: Standard error of mean
N: No. of households
There were no differences in the sources of domestic water consumption, no
significant differences according to the spatial t-test, and only small discrepancies in
the amounts of water consumed in the surveyed sites. The sources of water were
mainly classified according to where the water was obtained: private wells (well water
– WT1) or public water supply system from taps (tap water – WT2).
Food consumption patterns
In 2010, large differences could be seen in food consumption patterns (Tables 2.2 and
2.3) between locations associated with each unique ecosystem and culture. Our results
showed that FT3 was the dominant consumption pattern in 2010, with 37.8% of total
surveyed households exhibiting this pattern. The FT3 pattern was exhibited in 64.5%,
20.3%, and 15.2% of the households in Hulun Buir, Xilin Gol and Ordos, respectively
(Table 2.2).

31
Table 2.3 Variations in annual food, fuel and water consumption per capita (kg) (1995–2010)A
AMean values.
BStaple food: flour, rice, beans and millet.
COther meat: pork, chicken and fish.
Grassland areas
Hulun Buir Xilin Gol Ordos Overall
1995/2010 Level of
significance
1995/2010 Level of
significance
1995/2010 Level of
significance
1995/2010 Level of
significance
Agri-crop Staple foodB 169.1/208.3 P = 0.164 209.2/211 P = 0.685 180.4/134.3 P < 0.001 186.6/183.7 P = 0.615
(kg year-1
) Vegetable-Fruit 101.7/157.4 P < 0.001 95.3/126.3 P < 0.01 258.9/328 P < 0.01 153.7/205.6 P < 0.01
Total agri-crop 270.8/365.7 P < 0.05 304.5/337.3 P < 0.05 439.3/462.3 P < 0.05 340.3/389.3 P < 0.05
Meat Mutton-Beef 75.7/97.2 P < 0.05 82.8/65.6 P < 0.01 51.6/35.7 P < 0.01 69.8/65.3 P < 0.01
(kg year-1
) Other meatC 20.4/30.1 P < 0.001 11.8/13.9 P = 0.287 45.6/54.7 P = 0.128 26.2/33.1 P = 0.079
Total meat 96.1/127.3 P < 0.01 94.6/79.5 P < 0.05 97.2/90.4 P = 0.358 96/98.3 P = 0.265
Total food (kg year-1
) 366.9/493 P < 0.01 399.1/416.8 P = 0.684 536.5/552.7 P < 0.05 436.3/487.7 P < 0.006
Bio-fuel (kg year-1
) 3248.8/2878.6 0.317 3673.6/1265.2 P < 0.001 1626.9/199.4 P < 0.001 2834.4/1407.5 P < 0.01
Coal (kg year-1
) 1049.1/20633 P < 0.001 287.5/690.6 P < 0.001 1482.5/922.4 P < 0.01 939.7/1203.9 P < 0.01
Gas (RMB year-1
) 23.4(6)/126.3(33) - 0/70.3(7) - 0/191.8(17) - 23.4(6)/139.0(57) -
Electricity (RMB year-1
) 40.6/84.4 P < 0.001 54.7/135.9 P < 0.001 56.8/215 P < 0.001 51/146.9 P < 0.001
Domestic
water
(m3 year
-1)
Well 15.7/14 - 15.3/12.2(45) - 13.7/14.0(42) - 14.9/13.7(153) -
Tap - - 0/12.7(26) - 0/12.5(30) - 0/12.6(56) -
Total Water 15.7/14 - 15.3/12.5 - 13.7/13.2 - 14.9/13.2 -

32
Households in Hulun Buir had the greatest FT3 consumption and households
consumed more meat products than other two sites (127.3kg capita-1
year-1
in Hulun
Buir, 79.5kg capita-1
year-1
in Xilin Gol and 90.4kg capita-1
year-1
in Ordos) (Table
2.3).
Figure 2.2 Changes in food consumption patterns by number of households (1995–2010)
Figure 2.3 Changes in fuel consumption patterns by number of households (1995–2010)

33
The second largest food consumption pattern in 2010 was FT2 (32.5% of households).
Of the households in Ordos, Xilin Gol and Hulun Buir, 55.9%, 41.2% and 2.9%,
respectively, exhibited the FT2 pattern of consumption. Ordos exhibited over half of
the FT2 pattern and consumed higher amounts of agri-crop products (462.3kg capita-1
year-1
) than the residents of Hulun Buir (365.7kg capita-1
year-1
) and Xilin Gol
(337.3kg capita-1
year-1
) in 2010 (Table 2.3).
For the other consumption patterns in 2010, 10.5% exhibited the FT1 pattern and
19.1% exhibited the FT4 pattern. Of surveyed households exhibiting the FT1 pattern,
50% were in Ordos (Figure 2.2). In Ordos, daily consumption of vegetables and fruit
was higher (328kg capita–1
year–1
) than in Hulun Buir (157.4kg capita-1
year-1
) or
Xilin Gol (126.3kg capita-1
year-1
). Additionally, less mutton and beef were consumed
in Ordos (35.7kg capita-1
year-1
) than in Hulun Buir (97.2kg capita-1
year-1
) or Xilin
Gol (65.6kg capita-1
year-1
) in 2010. Other variations in the consumption of specific
food items were also noted. Ordos had a lower consumption of staple foods (134.3kg
capita-1
year-1
) than Hulun Buir (208.3kg capita-1
year-1
) or Xilin Gol (211kg capita-1
year-1
). Also, in 2010, the consumption of other meat (e.g. fish, pork and chicken) was
much higher in Ordos (54.7kg capita-1
year-1
) than in Hulun Buir (30.1kg capita-1
year-
1) or Xilin Gol (13.9kg capita
–1 year
–1) (Table 2.3). Of those exhibiting the FT4
consumption pattern, 57.5% were in Xilin Gol (Figure 2.2). The consumption of
staple foods in Xilin Gol was extremely high (211kg capita-1
year-1
in 2010).
The patterns of food consumption shifted gradually from 1995 to 2010. The FT3
consumption pattern was prevalent for 60% of households in 1995, but declined to
40% of households in 2010. The FT2 consumption pattern increased from 20% of
households in 1995 to 33% in 2010 (Figure 2.2). The consumption of vegetables and
fruit increased significantly (P < 0.01) and mutton and beef consumption declined
significantly (P < 0.01) during the period from 1995 to 2010 (Table 2.3). The diet of
Hulun Buir remained mainly FT3 with high meat consumption, which showed an
increase to 127.2kg capita-1
year-1
in 2010 compared to 96.1kg capita–1
year–1
in 1995.
The greatest decline in consumption pattern was that of FT3 in Xilin Gol, where 62%
(44 households) of households exhibited the FT3 food consumption pattern in 1995,
but only 23% (16 households) exhibited this pattern in 2010 (Figure 2.2). In Xilin
Gol, consumption of mutton and beef decreased from 82.8kg capita-1
year-1
in 1995 to
65.6kg capita-1
year-1
in 2010; whereas vegetable and fruit consumption increased
greatly from 95.3kg capita-1
year-1
in 1995 to 126.3kg capita-1
year-1
in 2010; and
staple foods remained similar (Table 2.3). As a result, there was an increase in the FT2
pattern in Xilin Gol. Our results (Figure 2.2) also show a small decrease in the FT4
consumption from 1995 to 2010.
In Ordos, the consumption for each item of food changed dramatically (Table 2.3). By
2010, the consumption of staple foods dropped significantly from 180.4kg capita-1
year-1
in 1995 to 134.3kg capita-1
year-1
in 2010. Although vegetables and fruit showed
an increase from 258.9kg capita-1
year-1
in 1995 to 328kg capita-1
year-1
in 2010,
within the category of meat, consumption of other meat has risen slightly, but the
consumption of beef and mutton has decreased from 51.6kg capita-1
year-1
in 1995 to
35.7kg capita-1
year-1
in 2010 (Table 2.3).
Fuel consumption patterns
The three study areas showed large differences in the types and amounts of fuel
consumed in 2010. The diverse fuel consumption pattern, FP1, that uses bio-fuel, coal
and electricity/gas, was predominant in the three areas, with 61% of all households

34
exhibiting this pattern. In Hulun Buir, 100% of households exhibited the FP1 fuel
consumption pattern, followed by 46.5% in Xilin Gol and 38.9% in Ordos (Figure
2.3). Herders in Hulun Buir used an average of 2879kg capita-1
year-1
of biofuel to
support daily needs, including cooking and heating. In addition to bio-fuel, coal
consumption was also extremely high in Hulun Buir (2063kg capita-1
year-1
), with
most used for heating in the long, cold winters (Table 2.3). The second largest fuel
consumption pattern was FP3 (electricity/gas and coal). Of those households
exhibiting the FP3 pattern in 2010, 63.3% were in Xilin Gol and 36.7% were in
Ordos, utilization of the newer forms of energy, electricity and gas, resulting in a
significant reduction in the use of bio-fuels and coal.
The households in Ordos showed a more complex range of fuel consumption patterns
in 2010 (Figure 2.3). The fuel consumption pattern using only electricity/gas (FP2)
increased in recent years with 30.6% of households in Ordos using gas and electricity
for cooking and boiling water in 2010. As a consequence of the significantly higher
gas and electricity consumption in Ordos than in other survey sites, predominantly
electricity consumption was RMB 215 capita-1
year-1
(US$30.5) in Ordos versus RMB
135.9 capita-1
year-1
(US$21.6) in Xilin Gol and RMB 84.4 capita-1
year-1
(US$13.4)
in Xilin Gol, respectively (Table 2.3). Ordos households used the lowest amount of
bio-fuels (435kg capita-1
year-1
; mainly dry land willow (Salix matsudana).
Compared to 1995, the fuel consumption pattern changed significantly by 2010 (P <
0.05) except for bio-fuel consumption in Hulun Buir (Table 2.3). Three main changes
to the patterns of fuel consumption were noted. First, in 1995, 42.4% of households in
Hulun Buir were using only bio-fuel (fuel consumption pattern FP4). By 2010 the FP4
consumption pattern had disappeared from Hulun Buir and was replaced by the more
diverse fuel consumption pattern, FP1. Second, there has been an increase in the use
of electricity/gas (consumption patterns FP2 and FP3). For instance, 83% of
households used bio-fuel in Xilin Gol in 1995; however, by 2010, 31% of households
in Xilin Gol had stopped using bio-fuel and switched to electricity, gas and coal
consumption. Third, in 1995 there was no consumption pattern using only electric/gas
(FP2) and only 18% of the surveyed households exhibited the FP3 pattern of
consumption. By 2010, however, 10.5% of households used only electricity/gas, and
29% of households exhibited the FP3 fuel consumption pattern (Figure 2.3).
Domestic water consumption patterns
All domestic water consumed came from groundwater. In 2010, the surveyed
households in Hulun Buir consumed more water (14m3 capita
-1 year
-1) than those in
Xilin Gol (12.5m3 capita
-1 year
-1) and Ordos (13.2m
3 capita
-1 year
-1). Decreasing
trends in the amounts of water consumed were exhibited in all survey sites. In Xilin
Gol this trend was more apparent, where water consumption decreased from 15.3m3
capita-1
year-1
in 1995 to 12.5m3 capita
-1 year
-1 in 2010. Overall, the average domestic
water consumed was 13.2m3 capita
-1 year
-1 in 2010 versus 14.9m
3 capita
-1 year
-1 in
1995 (Table 2.3).
In 1995, all households surveyed reported that they did not have public water service
(tap water) in their household and had to fetch water from privately owned wells or
sources outside the home. The surveyed households in Hulun Buir consumed more
water (14m3 capita
–1 year
–1) than those in Xilin Gol (12.5m
3 capita
–1 year
–1) and
Ordos (13.2m3 capita
–1 year
–1). In 2005, a rural water supply construction project was
implemented by the government in some parts of IMAR. The project involved drilling
public wells and installing pipelines and taps to ensure the water supply. As a result

35
the use of water from a public supply increased from 0% in both Xilin Gol and Ordos
in 1995 to 37% and 42% of households, respectively, in 2010. The project did not
cover the area of Hulun Buir, and 100% of households still acquired water from
privately owned wells in 2010. In Xilin Gol, 63% of households obtained their water
from privately owned wells and had an average consumption of 12.2m3 capita
–1year
–1,
which was a lower use per capita than those on the tap water supply (12.7m3
capita–1
year-1
). In Ordos, however, the average water consumption in 2010 was 14m3
capita–1
year–1
among the 58% of households using water from privately owned wells, which
was higher than the households using tap water (12.5m3 capita
–1 year
–1).
2.4 Discussion
Food consumption patterns
Households in Hulun Buir had the greatest consumption of the FT3 pattern of foods,
similar to that found by Liu et al. (2012) who found that IMAR had 124.6% higher
meat consumption than the Chinese average and 79.8% of China‘s average vegetable
consumption. Consumer preferences in this location were still meat-based to satisfy
daily protein and energy consumption requirements. Hulun Buir retained high meat
consumption patterns due to the higher land ownership in the meadow steppe and
higher livestock ownership, both of which greatly exceed the average levels in IMAR
(Table 2.1). Feng and Shi (2006) reported that the meat consumption per household in
pastoral areas of IMAR was 2.3 times higher than that in the arable farming areas.
Ordos exhibited over 50% of the FT2 pattern, due to the inhabitants in Ordos
consuming higher amounts of agri-crop products than the residents of the other two
areas. In Ordos vegetable and fruit consumption of 328kg capita–1
year–1
exceeded the
Chinese national standard of 320kg capita–1
year–1
(Feng and Shi 2006). In Ordos, due
to the desert and semi-desert grassland conditions, improved transportation and the
implementing of policy measures to prohibit grazing and movement (returning the
farmland to forest and grassland, and fenced grazing areas), most herdsmen and
farmers no longer rely on the land for their food consumption. Their consumption
depends more on purchased food. In the markets, vegetables and fruits are cheaper
than meat, resulting in the higher consumption following the FT2 pattern.
The FT1 pattern was high in Ordos because of the high daily consumption of
vegetables and fruit, and low consumption of staple foods. In addition, less mutton
and beef were consumed, and the consumption of other meats (e.g. fish, pork and
chicken) was high. From a nutritional perspective, fish, pork and chicken have less
protein than beef and mutton. Beef contains 19.9g of protein 100g–1
whereas pork
contains 14.5g of protein 100g` (Wang 2010). Although the amount of meat
consumption is higher than average, the protein intake is similar. In households with
the FT1 consumption pattern, the average annual income (RMB 70 150 or UD$1110)
was higher than the average of all surveyed households (RMB 62 359 or US$980)
(Table 2.3). Research has shown that the amounts and categories of food consumption
tend to increase as the income level increases (e.g. Mennell et al. 1992; Babatunde
and Qaim 2010). Of those exhibiting the FT4consumption pattern, 57.5% were in
Xilin Gol, and these consumed more staple foods, especially flour. This is likely a
result of the low income of those with the FT4 consumption pattern and a lack of
funds to purchase more diverse meats, vegetables and fruit. Compared to other foods,
staple foods were inexpensive and high in carbohydrates that satisfy daily energy
requirements. From a nutritional perspective, IMAR does not have undernourishment,
even for those with the FT4 consumption pattern. The amounts of food consumed

36
under all the food consumption patterns met the energy and protein requirements as
recommended by the Chinese Nutrition Society (Chinese Nutrition Society 2010)
(Table 2.3).
The increase in the FT2 pattern and decrease in the FT3 pattern indicates that meat
products were replaced with agri-crop foods. The socio-economic statistics for rural
areas in IMAR also indicated that meat consumption in 2010 decreased by 21% and
vegetable consumption increased by 45% compared to the levels of 1995 (Inner
Mongolia Statistics Bureau 1996, 2011). This is likely because of the large reductions
in livestock rearing due to the degradation of the local rangelands and implementation
of restoration policies. Feng and Shi (2006) showed that the initial preference for
human food consumption is home-produced food from family owned land or local
ecosystems (i.e. self-sufficiency). When changing conditions result in insufficient
home-produced food, the populace begins to alter the ways food is acquired, including
purchasing. For instance in Xilin Gol, the number of livestock is controlled by the
carrying capacity of local grasslands (1 sheep unit per 1.67 ha grassland). To confront
this livestock-rearing control policy measure, the herders/farmers increase cattle
rearing to compensate for the loss of goat/sheep grazing due to the control policy, and
for having to change from nomadic grazing to stall-rearing. First, cattle can produce
milk products, which produce a higher income from selling such products than from
goat/sheep rearing. Second, the local government assisted in the introduction of cattle
breeds, which improved the profitability of cattle rearing, which encouraged cattle
breeding. This change in pattern requires herders and farmers to buy food from
markets, and they tend to buy vegetables and fruit, as these are less expensive than
mutton and beef.
The internal supply of food affects food consumption patterns according to the results
of our survey. When the food accessibility was increased by improvements in
transport, the amount of staple foods, fruit and certain vegetables increased
significantly. Consequently, the present food consumption patterns rely less on the
local ecosystems and are more affected by market trading. Although IMAR was
mainly a self-sufficiency region, the herder/farmers now buy food (staple foods,
vegetable and fruit) from outside IMAR because (1) the numbers of livestock
managed by herders has decreased due to the policy restrictions; (2) the market price
of meat is becoming more expensive, and the herders prefer to sell their livestock to
get money to increase their expenditure on children‘s education, housing and medical
treatment; (3) a more diverse food consumption pattern has become more popular due
to economic development, establishment of a trading market, and transformation of
consumption consciousness. Over 85% of investigated households indicated that they
purchase agri-crops in the markets of towns every 1 or 2 weeks.
A moderate increase in the pattern of FT1 consumption and a decrease in the pattern
of FT4 consumption from 1995 to 2010 may be due to the higher annual income
levels found in 2010 (US$1982) as compared to those in 1995 (US$1670). Food
consumption tended to increase both in amount and variety, as the income level
increased. This was confirmed through comparisons between the three sites. From the
perspective of consumption, Gerbens-Leenes and Nonhebel (2002) indicated that the
economic situation can affect food consumption, and growth of income causes a shift
with greater meat consumption than agri-crop consumption. This research showed the
opposite trend with meat consumption decreasing greatly, and the consumption of
agri-crops increasing when the original income structure of the area of livestock
rearing was seriously affected by the grassland restoration policy, such as in Xilin Gol
37
(decreased in meat consumption by 15.1kg capita–1
year–1
). However, the results of
this research also indicated that the food consumption types moved towards
diversification when the income increased to a certain level and people started to care
about their health to reduce the amount of meat consumption, such as in Ordos.
Fuel consumption patterns
In Hulun Buir, the pattern of fuel consumption was dominated by pattern FP1 and
dried dung from livestock was an important and widely used bio-fuel. The high
consumption of dried dung can be attributed to the higher numbers of cattle. In Xilin
Gol, the use of bio-fuels decreased from 3673kg capita–1
year–1
in 1995 to 1265kg
capita–1
year–1
in 2010 resulting in a decrease in the FP3 pattern. The decrease in the
use of bio-fuels in Xilin Gol can be attributed to the large reductions in number of
livestock and intensive crop cultivation. As a result, the dry dung could not satisfy the
demands of households. Many households switched to the use of straw for heating
(953kg capita–1
year–1
).
Ordos‘s households used the lowest amount of bio-fuels; most respondents reported
that they collected only dying or dead wood due to regulations that prohibit the
cutting of live trees. Ordos is under the grazing prohibition and user moving policy
measures. The livelihoods fundamentally changed from livestock rearing to becoming
employees in retail or freight businesses, which caused a great increase in the FP2
pattern with expanding use of gas and electricity consumption. This result is similar to
the results of Sun et al. (2014) who reported that the pattern of household energy use
has been influenced greatly by income growth and urbanization.
Usage of coal, gas and electricity by farmers and herdsmen increased in all three area
compared to fuel usage in 1995. This may be the result of rapid economic
development and government initiatives. The decreasing numbers of livestock and
higher energy needs (especially for the fuel consumption for heating; from the reports
of respondents, over 60% households extending the heating period from ‗Nov. to next
Mar.‘ to ‗Oct. to next Apr.‘) are also reasons that less dung was used for basic
household consumption. From a health perspective, the smoke (CO, CO2, NO and
suspended particles) from burning dung may be causes of respiratory and ocular
diseases. Although more costly, people preferred to use gas and electricity, as these
are more convenient, clean and efficient. IMAR is a demonstration area for wind
energy application, and 53% of electricity is produced by wind in IMAR based on the
statistics in the yearbook of 2010 for IMAR (Inner Mongolia Statistics Bureau 2011).
The loss of the FP4 consumption pattern in the Hulun Buir area may have resulted
from house construction that occurred after the herdsmen had adopted a less nomadic
lifestyle and began using more electricity and coal. These dramatic changes were
caused by decreases in the numbers of livestock to protect locally degraded grassland
ecosystems, which forced people to abandon farming and move to urban areas.
Domestic water consumption patterns
The decrease in water consumption may be caused by drought. Drought for most of
the local populace was more serious in 2010 than in 1995 (Dai et al. 2009; Hu et al.
2012). The relatively dry weather in 2010 and prior years may have caused a decrease
in water consumption at all three sites. In 1995, the herders did not experience
problems with domestic water consumption from groundwater sources but, by 2010,
some households reported that they needed to store water in dry periods or extreme
weather (such as spring and winter). Moreover, land-use changes could have been the
38
other trigger for droughts. From the statistics of IMAR in 2008, the region‘s total
water resources amount to 412.1 billion m3, which was a decrease of 5% compared to
the average over many years. The region‘s total water consumption was 175.8
billionm3 m
3, with water use for agriculture irrigation accounting for 70.2% (123.4
billion m3) of total water consumption. All water consumed came from groundwater,
so higher water consumption is likely to have resulted in a lowering of the
groundwater table due to land-use changes. For instance, research of Zhao et al.
(1999) has indicated that the intensive crop cultivation and grazing may be the drivers
that resulted in a lowering of the groundwater table by 0.5–1.3m from the 1980s to the
1990s.
The surveyed households in Hulun Buir consumed more water than those in Xilin Gol
and Ordos, which may also indicate that the local water resources were relatively
more plentiful in Hulun Buir. In Xilin Gol, households obtained their water from
privately owned wells, which had a lower consumption rate than those on the tap
water supply. However, the reverse trend was shown at the Ordos site. This
discrepancy may have been caused by water costs, as the water from privately owned
wells was free at all three sites, but some charges existed for tap water. In Xilin Gol,
the households using tap water were required only to pay RMB 5 per month with no
limits on the amount of water used, whereas inhabitants at the Ordos site were
required to pay for water consumption based on the actual quantity of water used
(RMB 2.6m–3
). This led to a reduction in the use of water and suggests that the market
price of water can reduce water consumption.
2.5 Summary and conclusions
Ecosystem degradation, rapid economic growth, and enforcement of restoration
policy have greatly impacted on rural life and the basic consumption patterns of
households in IMAR. This chapter analysed these patterns, using the main
consumption patterns of food, fuel and water as indicators, with spatial and temporal
differences as variables for analysis. A household survey was used to acquire first-
hand data to estimate actual daily consumption. The consumption patterns were
constructed using statistics based on a field-level survey of the study areas.
We compared resources of food, fuel and water consumption patterns for three types
of grassland ecosystems and described the temporal trends. The interplay of grassland
natural condition, economic development and restoration policy measures have
affected basic household consumption patterns. Four conclusions can be drawn from
the results of the survey:
(1) The overall food consumption pattern in IMAR was a low consumption of agri-
crops and a high meat consumption due mainly to the lagging effects of the historic
nomadic grazing culture. There was, however, significant spatial variation due to
differing economic level, restoration policy measures and ecosystem types and
variations in ecosystem services provided by the meadow steppe (Hulun Buir), typical
steppe (Xilin Gol) and semi-desert steppe (Ordos) areas. A high percentage of the
surveyed households in Hulun Buir retained the low agri-food with high meat
consumption pattern. Approximately half of the households in Xilin Gol preferred a
low agri-crop with high meat consumption pattern, whereas the other half preferred
the low agri-crop with low meat consumption pattern in 2010. Approximately 53% of
the surveyed households in Ordos exhibited the high agri-food with low meat
consumption pattern in 2010.
39
(2) Large temporal differences were seen in per-capita food consumption both in
types and amounts, with consumption of specific foods changing greatly from 1995 to
2010. Consumption of vegetables and fruit increased significantly, and mutton and
beef consumption declined significantly from 1995 to 2010. Although the total
amount food consumed increased gradually in general from 1995 to 2010, the number
of households exhibiting the low agri-crop and high meat consumption pattern
decreased, whereas those households exhibiting the high agri-crop and low meat
consumption pattern increased.
(3) Fuel consumption patterns changed from being dominated by the use of bio-fuel in
1995 to being dominated by electricity/gas in 2010. However, dried dung is still a
major energy source for daily life in Hulun Buir, with coal being the second most
predominant fuel. Trends of coal and electricity/gas consumption showed increases at
all three sites, especially for Xilin Gol and Ordos, where livestock rearing is not as
prevalent as in Hulun Buir.
(4) Groundwater was the sole domestic water source in the surveyed areas. Some
households have begun to use the public water supply instead of privately owned
wells as a water source, and may need to begin paying for water consumption in the
near future.
(5) Beside the influences of different natural environment conditions and economic
development, the grassland restoration policy measures deeply changed pastoral
tradition and basic household consumption patterns. Grazing activity was less affected
by policy measures of seasonal grazing and rotational grazing than the other policy
measures, thus more herders preferred to maintain most of their basic consumption
patterns (e.g. in Hulun Buir). However, in the context of grazing prohibition, user
moving and livestock rearing control policy measures (e.g. in Xilin Gol and Ordos),
the basic household consumption patterns (especially food and fuel) fundamentally
changed.
The method of partitioning patterns according to consumption quantities and types is
useful in explaining the effects of policy changes on household livelihoods and in
providing guidelines for sustainable grassland management, and provides a new
viewpoint to resource/ecosystem adaptive management, especially in linking micro-
level livelihood responses to macro level policy procedures, which facilitates the
further review of policies and enables policy adjustment and amendment by the
feedback from livelihood outcomes.

40
41
CHAPTER 3
Chapter 3: Changing Food Consumption Patterns and Impact
on Water Resources in fragile grasslands
Based on:
Du B., Zhen L., de Groot R., Long X., Cao X., Wu R. 2015. Changing Food
Consumption Patterns and Impact on Water Resources in the Fragile Grasslands of
Northern China, Sustainability 7(5): 5628-5647.
42
Abstract:
A burgeoning population, pressing development needs and increasing household
consumption are rapidly accelerating water use in direct and indirect ways.
Increasingly, regions around the world face growing pressure on sustainable use of
their water resources especially in arid and semi-arid regions, such as Northern China.
The aim of this research is to obtain an overview of the cumulative water requirement
for direct (domestic) water use and indirect water use for the basic food consumption
of the households in Inner Mongolia Autonomous Region (IMAR), in order to reduce
the pressure on grassland of Western China by encouraging sustainable water
consumption. For indirect water use, we use the Virtual Water Content (VWC)
analysis theory to analyse the total consumption package of 15 basic food types that
were identified and quantified based on the household survey in 2011. In this survey,
domestic water consumption data and food consumption data were collected from 209
representative households with spatial variation across three sub-regions (including
meadow steppe in Hulun Buir, typical steppe in Xilin Gol and semi-desert steppe in
Ordos) and temporal variation from 1995 to 2010. The results show that the total
amounts of food consumption per capita in three sub-regions all show an increasing
trend, especially in Hulun Buir and Ordos. Compared to the direct water consumption,
the indirect water consumption behind food production made up a major portion of
total water consumption, which is affected (1) geographic locations (grassland types);
(2) economic development levels and (3) grassland use policy measures. From 1995
to 2010, indirect water consumption displays a decreasing trend in Xilin Gol and
Ordos due to the decrease of meat consumption and increase of fruit and vegetable
consumption. When considering the amount of land per household, the grassland in
Ordos still faces the great threat of high water consumption pressure. Such water
consumption may affect water conservation services and productivity of grassland.
Therefore, changing diet behaviour and reducing the population can be considered
options for sustainable use of water.
Key words: Virtual Water Content; Water use; Household survey, Food consumption
pattern; Grassland; Adaptive management

43
3.1 Introduction
Humans depend on the integrity of ecosystems to provide the ecosystem services they
need for survival (Millennium Ecosystem Assessment 2003). In many parts of the
world, the limited availability of clean and fresh water is a major constraint to further
social and economic development, especially in arid and semi-arid regions, such as
Northern China Yan et al. 2014). Drought is a matter of vital importance to the
grassland of Inner Mongolia Autonomous Region (IMAR), Northern China. A
burgeoning population, pressing development needs and increasing household
consumption are rapidly increasing the amount of water use (Yan et al. 2014). From
previous research (Zhao et al. 2010), limited water resources and overuse of water for
grazing/cultivation are the main reasons for grassland degradation in IMAR. To
reverse the increasing tendency of water stress and grassland degradation, suitable
water consumption in an efficient way needs to be put forward to alleviate
anthropogenic stress at national level. Household water use is a combination of both
direct water consumption (e.g. domestic water consumption for drinking, washing,
flushing and cooking) and the indirect water consumption behind the food production
system. Producing food involves large amounts of fresh water use in the processes of
plant transpiration, interception loss from vegetation canopies, soil evaporation and
channel evaporation in irrigated systems (Zhang et al. 2010). Therefore, humans‘
consumption of food items is coupled with intensive use of water resources in indirect
ways. Increasingly, regions around the world face growing pressures on their water
resources. Great concerns have been raised on this issue, especially in the agricultural
sector, which accounts for about 70% of human water use (Molden et al. 2007).
Several scientists have described the complex links between sustainable water
consumption and the limited availability of water resources (Yan et al. 2014).
Accessible fresh water is scarce and an essential input for many societal, economic
and natural systems. For example, China uses 7% of accessible freshwater to feed
22% of the global population, and this quantity likely will decrease in many regions
with overconsumption due to the reduced water conservation function of ecosystems
(FAO 2003; Hoekstra and Chapagain 2008). While demand increases, supplies of
clean water are limited and diminishing (WWF 2007). These trends are leading to an
escalating competition over water in both rural and urban areas. Particularly important
will be the challenge of simultaneously meeting the food demands of a growing
human population and expectations for an improved standard of living that requires
clean water to support domestic and industrial uses (Millennium Ecosystem
Assessment 2005; Cavaliere et al. 2014).
Previous studies showed that even small changes in food consumption patterns can
have large impacts on the ecosystem due to the water required to produce this food
(Zhen et al. 2010b). For example, in the Netherlands, a hot meal mostly includes some
meat, potatoes, noodle and vegetables. Gerbens-Leenes and Nonhebel (2002) reported
that even small changes in food-consumption patterns can trigger large impacts on
ecosystems due to the agricultural area required to produce this food. For example, a
slight increase in the consumption of meat (10 g capita-1
day-1
or one mouthful) will
require the increased use of water of 73 m3
household-1
year-1
, whereas the same
increase of potato consumption will result in an increase of water use only 0.5m3
capita-1
year-1
. The previous researches indicated that changing diet behaviour can be
considered as an option to reduce total water use. Changing consumption patterns
from non-meat-dominant to meat-dominant patterns in many countries will lead to
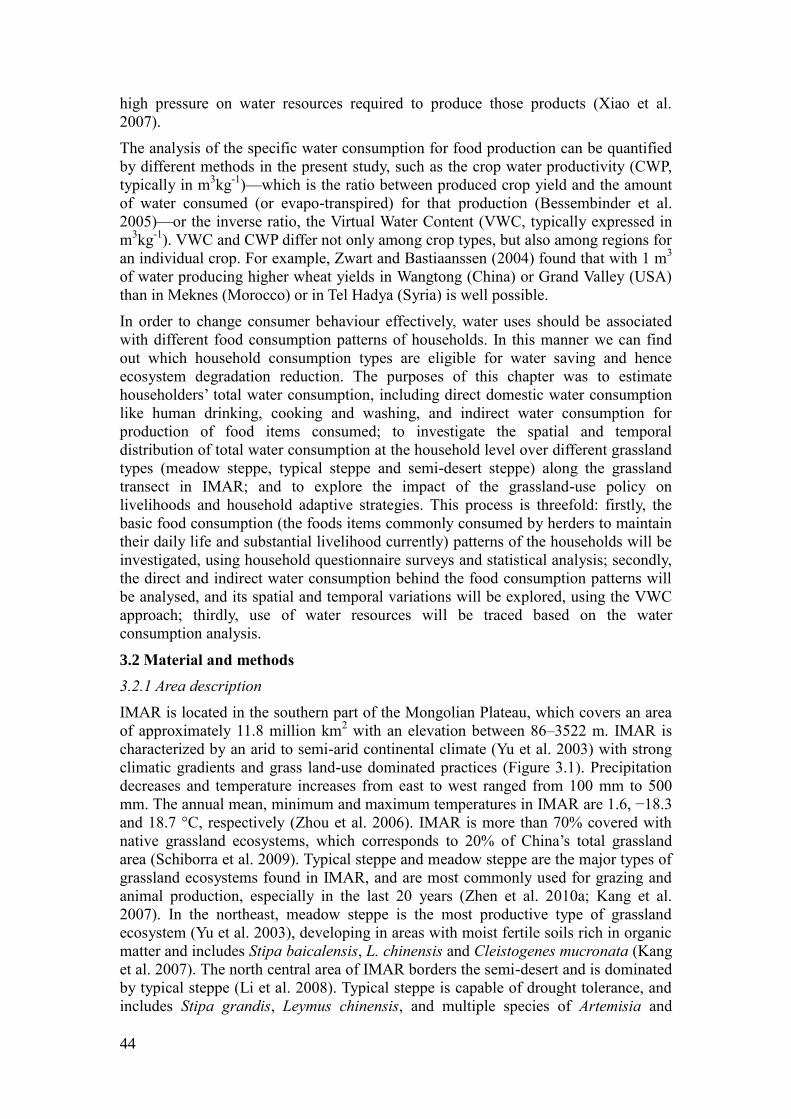
44
high pressure on water resources required to produce those products (Xiao et al.
2007).
The analysis of the specific water consumption for food production can be quantified
by different methods in the present study, such as the crop water productivity (CWP,
typically in m3kg
-1)—which is the ratio between produced crop yield and the amount
of water consumed (or evapo-transpired) for that production (Bessembinder et al.
2005)—or the inverse ratio, the Virtual Water Content (VWC, typically expressed in
m3kg
-1). VWC and CWP differ not only among crop types, but also among regions for
an individual crop. For example, Zwart and Bastiaanssen (2004) found that with 1 m3
of water producing higher wheat yields in Wangtong (China) or Grand Valley (USA)
than in Meknes (Morocco) or in Tel Hadya (Syria) is well possible.
In order to change consumer behaviour effectively, water uses should be associated
with different food consumption patterns of households. In this manner we can find
out which household consumption types are eligible for water saving and hence
ecosystem degradation reduction. The purposes of this chapter was to estimate
householders‘ total water consumption, including direct domestic water consumption
like human drinking, cooking and washing, and indirect water consumption for
production of food items consumed; to investigate the spatial and temporal
distribution of total water consumption at the household level over different grassland
types (meadow steppe, typical steppe and semi-desert steppe) along the grassland
transect in IMAR; and to explore the impact of the grassland-use policy on
livelihoods and household adaptive strategies. This process is threefold: firstly, the
basic food consumption (the foods items commonly consumed by herders to maintain
their daily life and substantial livelihood currently) patterns of the households will be
investigated, using household questionnaire surveys and statistical analysis; secondly,
the direct and indirect water consumption behind the food consumption patterns will
be analysed, and its spatial and temporal variations will be explored, using the VWC
approach; thirdly, use of water resources will be traced based on the water
consumption analysis.
3.2 Material and methods
3.2.1 Area description
IMAR is located in the southern part of the Mongolian Plateau, which covers an area
of approximately 11.8 million km2 with an elevation between 86–3522 m. IMAR is
characterized by an arid to semi-arid continental climate (Yu et al. 2003) with strong
climatic gradients and grass land-use dominated practices (Figure 3.1). Precipitation
decreases and temperature increases from east to west ranged from 100 mm to 500
mm. The annual mean, minimum and maximum temperatures in IMAR are 1.6, −18.3
and 18.7 °C, respectively (Zhou et al. 2006). IMAR is more than 70% covered with
native grassland ecosystems, which corresponds to 20% of China‘s total grassland
area (Schiborra et al. 2009). Typical steppe and meadow steppe are the major types of
grassland ecosystems found in IMAR, and are most commonly used for grazing and
animal production, especially in the last 20 years (Zhen et al. 2010a; Kang et al.
2007). In the northeast, meadow steppe is the most productive type of grassland
ecosystem (Yu et al. 2003), developing in areas with moist fertile soils rich in organic
matter and includes Stipa baicalensis, L. chinensis and Cleistogenes mucronata (Kang
et al. 2007). The north central area of IMAR borders the semi-desert and is dominated
by typical steppe (Li et al. 2008). Typical steppe is capable of drought tolerance, and
includes Stipa grandis, Leymus chinensis, and multiple species of Artemisia and

45
Festuca. The south-western area is dominated by semi-desert steppe, in which is the
most arid ecosystem, with the least biomass (Yu et al. 2003). Some of the species
found include perennials such as Stipa krylovii, Stipa bungeana and Artemisia
ordosica (Yu et al. 2003).
Figure 3.1 The geographic location and cover of grassland in the Inner Mongolia Autonomous Region
Grassland degradation is a widely observed problem, and estimates for IMAR‘s
grassland reported 30%–50% to be degraded (Li et al. 2008). In a semi-arid region
like IMAR, available water through the hydrological process undoubtedly plays a key
role in the functioning of the grassland ecosystems. The effects of water use
mechanisms are extremely important to grassland degradation. For example, water
shortages affect water transport through changing the soil physical structure and
energy balance of the soil, affecting the performances of plant species and root
architecture, with consequences for degradation (Zhao et al. 2010; Ji et al. 2009). To
reverse the increasing tendency toward water stress and grassland degradation, a
series of policies and countermeasures have been put forward and enforced to
alleviate the anthropogenic stress at national to household levels in the last decade, the
most important of which implemented in badly degraded areas is called the
―Returning Grazing Land to Grassland Program‖ (König et al. 2014a). The grassland
restoration policy was brought out around 1998 and broadly extended after several
years of experimentation, and the herders‘ livelihood has been significantly affected
through the implementation of the policy. The main measures of this policy are
seasonal grazing and rotational grazing (e.g. in Hulun Buir), grazing prohibition and
limiting the number of livestock according to the carrying capacity of degraded
grassland (e.g. in Xilin Gol and Ordos).

46
Increase of agriculture water consumption for food provision will increase the water
stress on the grassland ecosystems. From the statistics in 2010 and 1995, IMAR‘s
total water resources amounted to 412.1 billion m3, with a decrease of 24.5% from the
level in 1995 (513 billion m3). The region‘s total water consumption in 2010 was
175.8 billion m3, including agriculture irrigation water to 70.2% (123.4 billion m
3);
next was industrial water consumption and urban domestic water consumption, which
were 11.7% (20.5 billion m3) and 4.8% (8.5 billion m
3); the ecological water
consumption (water used directly for physiological processes of the ecosystem) was
only 3.7% (6.5 billion m3). Compared to the level in 1995, water consumption for
agriculture increased significantly, three times higher (43.1 billion m3 in 1995) in
2010. Three typical sub-regions were selected from southwest to northeast in IMAR
to capture gradient discrepancies in water resource consumption, including
Dongsheng District and Ejin Horo Banner (in Ordos), located in the south-west of
IMAR and mainly characterized by semi-desert steppe, Zhangxiangbai Banner (in
Xilin Gol) located in the central IMAR and characterized by typical steppe, and
Evenk Banner (in Hulun Buir) located northeast of IMAR and characterized by
meadow steppe (Figure 3.1). The spatial distribution of water resources is different. In
Hulun Buir has abundant water resources, but utilization is extremely low and about
60%–80% of total annual precipitation falls between June and September; Ordos has
serious problems with water shortages due to the dry climate. In Xilin Gol, the
proportion of agricultural water (agriculture water includes three parts: (1) irrigation
water (rainfall, artificial watering); (2) water use for animal husbandry (animal
drinking water, animal and manure cleaning); and (3) cleaning water for agricultural
product processing.) is large, in which leads to issues from excessive extraction of
groundwater for most cities and rural areas (Xiao et al. 2014). Therefore, water
resource stress is serious, especially in the central and western areas of IMAR.
Major land-use types include grassland, arable land, forest and others (including
unban area, water body and wetland) (Figure 3.1 and Table 3.1). The percentages of
land-use in the three sub-regions are distributed differently and statistical data of
invested banners or districts were explored to distinguish the differences between land
uses. In Evenk Banner, the grassland and forest are the majority of land-use and
occupied 56.8% and 34.6% of total land. The arable land only accounts 0.9% of total
land. Evenk Banner is a traditional pastoral area and is famous for livestock and
poultry cultivation. The Hulun Buir has become the largest milk and meat export
centre in China. In Zhengxiangbai Banner, the grassland dominates 94% of total land,
and the percentage of arable land is larger than Evenk Banner (accounts 2.2%); more
than half of them grow grains. The forest area in Zhengxiangbai Banner has a lowest
percentage, only 1.5%. Half of Zhengxingbai Banner is a traditional pastoral area and
half is a farming area. In recent years, the scale of cultivation has been greatly
increased, from livestock husbandry from traditional farming to modern cultivation.
Dongsheng District and Ejin Horo Banner in Ordos were investigated; grassland was
still the dominant land-use, 67.4% and 60.7%, respectively. The second largest area
was forest, 27.1% in Dongsheng District and 33.1% in Ejin Horo Banner. Dongsheng
District and Ejin Horo Banner take the leading role for booming economic
development with the rapid development of mining. The general trend in livestock
husbandry and crop farming activities is moving away from individual participation to
larger-scale operations, and the population engaged in husbandry and farming has
decreased greatly over the last 15 years.
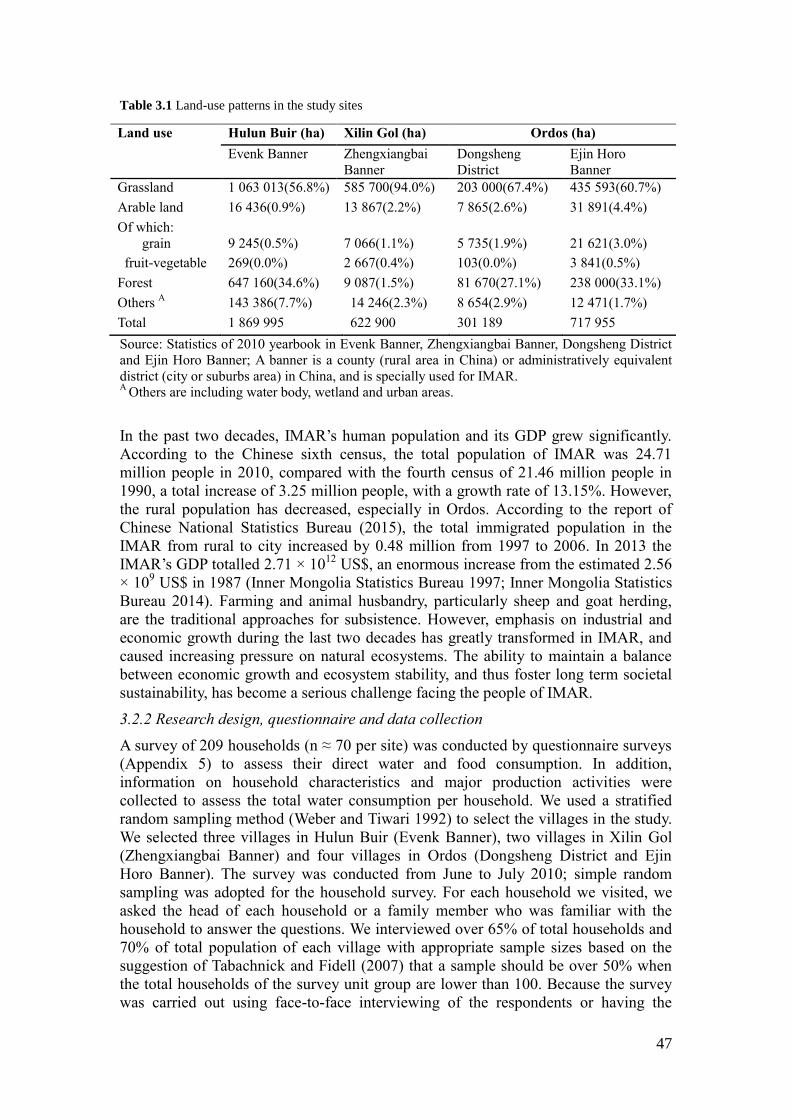
47
Table 3.1 Land-use patterns in the study sites
Land use Hulun Buir (ha) Xilin Gol (ha) Ordos (ha)
Evenk Banner Zhengxiangbai
Banner
Dongsheng
District
Ejin Horo
Banner
Grassland 1 063 013(56.8%) 585 700(94.0%) 203 000(67.4%) 435 593(60.7%)
Arable land 16 436(0.9%) 13 867(2.2%) 7 865(2.6%) 31 891(4.4%)
Of which:
grain
9 245(0.5%)
7 066(1.1%)
5 735(1.9%)
21 621(3.0%)
fruit-vegetable 269(0.0%) 2 667(0.4%) 103(0.0%) 3 841(0.5%)
Forest 647 160(34.6%) 9 087(1.5%) 81 670(27.1%) 238 000(33.1%)
Others A 143 386(7.7%) 14 246(2.3%) 8 654(2.9%) 12 471(1.7%)
Total 1 869 995 622 900 301 189 717 955
Source: Statistics of 2010 yearbook in Evenk Banner, Zhengxiangbai Banner, Dongsheng District
and Ejin Horo Banner; A banner is a county (rural area in China) or administratively equivalent
district (city or suburbs area) in China, and is specially used for IMAR. A
Others are including water body, wetland and urban areas.
In the past two decades, IMAR‘s human population and its GDP grew significantly.
According to the Chinese sixth census, the total population of IMAR was 24.71
million people in 2010, compared with the fourth census of 21.46 million people in
1990, a total increase of 3.25 million people, with a growth rate of 13.15%. However,
the rural population has decreased, especially in Ordos. According to the report of
Chinese National Statistics Bureau (2015), the total immigrated population in the
IMAR from rural to city increased by 0.48 million from 1997 to 2006. In 2013 the
IMAR‘s GDP totalled 2.71 × 10¹²
US$, an enormous increase from the estimated 2.56
× 109 US$ in 1987 (Inner Mongolia Statistics Bureau 1997; Inner Mongolia Statistics
Bureau 2014). Farming and animal husbandry, particularly sheep and goat herding,
are the traditional approaches for subsistence. However, emphasis on industrial and
economic growth during the last two decades has greatly transformed in IMAR, and
caused increasing pressure on natural ecosystems. The ability to maintain a balance
between economic growth and ecosystem stability, and thus foster long term societal
sustainability, has become a serious challenge facing the people of IMAR.
3.2.2 Research design, questionnaire and data collection
A survey of 209 households (n ≈ 70 per site) was conducted by questionnaire surveys
(Appendix 5) to assess their direct water and food consumption. In addition,
information on household characteristics and major production activities were
collected to assess the total water consumption per household. We used a stratified
random sampling method (Weber and Tiwari 1992) to select the villages in the study.
We selected three villages in Hulun Buir (Evenk Banner), two villages in Xilin Gol
(Zhengxiangbai Banner) and four villages in Ordos (Dongsheng District and Ejin
Horo Banner). The survey was conducted from June to July 2010; simple random
sampling was adopted for the household survey. For each household we visited, we
asked the head of each household or a family member who was familiar with the
household to answer the questions. We interviewed over 65% of total households and
70% of total population of each village with appropriate sample sizes based on the
suggestion of Tabachnick and Fidell (2007) that a sample should be over 50% when
the total households of the survey unit group are lower than 100. Because the survey
was carried out using face-to-face interviewing of the respondents or having the
48
respondents complete the questionnaires under the research group members‘
guidance, a high response rate of 90.5% was obtained.
Prior to the formal surveys, we conducted test surveys using individual interviews and
family group discussions with herders and other key informants, and the information
collected in the test surveys guided the development of the formal questionnaire.
Closed-ended questions were primarily applied for a formal survey, which included
questions in the following areas: (a) demographics, land characteristics, financial
conditions and the socioeconomic characteristics of the households related to
household composition, levels of education, livestock owned, the area cultivated and
crops grown; (b) their consumption of domestic water and food in 2010; (c) their
consumption of domestic water and food around the year 1995 (as recalled by the
respondents). Because a series of policies and counter-measures of grassland
restoration have been put forward and enforced around 1998, this intervention may
cause great changes in the use of natural recourses and its subsequent issues. In China,
many data are updated every 5 years. This is why 1995 (before restoration policy) and
2010 (recent, after restoration policy) have been chosen to make comparisons. In the
survey, we asked the households to categorize and quantify the foods they had
consumed in the year prior to the survey (2010) and 15 years ago (1995). In this case,
15 foods as basic food types for consumption have identified according quantities of
household food consumption for the analysis, namely wheat, rice, glutinous millet,
potatoes, vegetables, fruit, cooking oil, bean products, mutton, beef, pork, chicken,
fish, milk products and eggs. The respondents reported the variety and quantity of the
consumed foods. These 15 foods were further grouped into seven categories based on
clarification of Chinese dietary guidelines (2007), namely staple foods (wheat, rice
and glutinous millet), potatoes, vegetable-fruit, mutton-beef, other meats (pork,
chicken and fish), oil-bean products and milk-eggs. Quantities of consumed food
include home grown food and purchased. The survey revealed that households could
accurately recall their consumptions in the year prior to the survey and the main
consumption patterns in 1995.
3.2.3 Calculation of water consumption
Specific water requirement per food (crop or meat) type
The direct water consumption of a household is defined by the domestic water
required for drinking, flushing, washing and cooking. The indirect water consumption
of a household is defined by the water required to produce all the food products
included in this study. To calculate the cumulative indirect water consumption per
capita (Windirect), we used data generated from the VWC method (Zimmer and Renault
2003) and measured data of Specific Water Demand (SWD) per food (crop) item
consumed by taking into consideration variations in the elevation, precipitation,
temperature and economic development level from east to west of the study sites, and
by using site-specific SWD for each of the sites under study (Xiao et al. 2007; Li and
Wu 2008; Xu et al. 2003). The total water consumption is the sum of the direct and
indirect water consumption.
In our study, we first determined the direct water consumption according to the results
from the questionnaire survey, which was provided by household respondents in unite
of tons per capita per year. Next, we determined the indirect water consumption for
producing the specific food items that consumed by the households. The 15 basic food
types are collected to estimate the indirect water consumption (Windirect) in the
household survey by using the following Equation (3.1):

49
𝑊𝑖𝑛𝑑𝑖𝑟𝑒𝑐𝑡 = ∑ (𝑆𝑊𝐷𝑖 • 𝑆𝑖15𝑖=1 ) (Eq. 3.1)
Where SWDi is specific water demand (m3
kg-1
) of a specific type of food (i); and
Si is the quantities of food consumption in categories (i) (kg capita-1
year-1
). For
indirect water consumption derived from meat consumption, we defined it as total
amount of water consumed from the beginning of life to the end of its life period,
including the daily drinking water and water contained within the feed (fodder) for
livestock. The indirect water consumption of feed (fodder) includes water
consumption during the period per specific fodder (grass fodder and crop fodder)
growing processing. Indirect water consumption of different animal products (e.g.
meat, milk and eggs) is based on the distribution ratio containing the water
consumption in the animal products. The calculation method of fodder water
requirement (in m3
ha-1
) is same as the crop water requirement.
Pressure of total water consumption on their land
For this purpose, I hypothesize that all the water consumed is from the local
ecosystems, and the pressure index of total water consumption on their unit land is
express by water consumption per capita.
𝑃𝑖𝑛𝑑𝑒𝑥 = 𝑊𝑡𝑜𝑡𝑎𝑙/𝐴𝑙𝑎𝑛𝑑 (Eq. 3.2)
Where W total is the reference the total consumption of domestic water
consumption and indirect water consumption from food production items, Aland is the
area of total land ownership (farmland, grass and forest) per capita (ha capita-1
).
3.3 Results and discussion
3.3.1 Background information of the respondents
The average household size of three adult equivalents (AE) is consistent with the
national average in China reported by the National Bureau of Statistics, China
(NBSC) (NBSC 2006). Table 3.2 indicates that the average age of all respondents was
approximately at 51, in which herders in Hulun Buir, Xilin Gol and Ordos had
average ages of 43.2, 55.8 and 54.6 respectively. The average age of farmers and
herders in Xilin Gol were the oldest with an average age of 55.8; 57% of the
respondents were older than fifty. This can probably be explained by the fact that
since the grassland in Xilin Gol was seriously degraded, the basic daily consumption
needs cannot be relied upon from the land only, and the sub-regions do not have
industries like mining that herders and farmers can work for, so more young people
immigrated to the city to find jobs while older people without special work abilities
had to stay at home. Another reason accelerated the immigration: the government
established a policy of converting most farmland to grassland and forest, and nomadic
grazing was strictly forbidden in Xilin Gol.
Herders in Hulun Buir own the use-right of farmland and grassland, with per capita
ownership of 0.03 and 24.4 ha, respectively. Most of their land is covered by meadow
steppe; only small pieces of land in their back yards are used to grow potatoes and
vegetables during the spring and summer. However, in Xilin Gol, the total amount of
land owned is less than Hulun Buir, only 9.9ha per capita in overall, including 9.4ha
(94%) grassland, 0.4ha (4%) forest and 0.1ha (1%) farmland. The inhabitants of Xilin
Gol rural area are a combination of one-half herders and one-half farmers settled in
different villages. In Ordos, the inhabitants have more diverse land-use of grassland,
forest and farmland, with per capita ownership of 2.6ha (63%), 1.1ha (28%) and 0.4ha
(9%), respectively.

50
Table 3.2 The Characteristics of the households that participated in the survey
Study Area Hulun Buir
(N = 66)
Xilin Gol
(N = 71)
Ordos
(N = 72)
Total
(N = 209)
Family size 3.2 3.2 3.4 3.3
Average age 43.2 54.6 55.3 51.4
Average education level 7.8 6.3 4.7 6.3
Lan
d u
se
A1 (%) A1 (%) A1 (%) A1 (%)
Farmland 0.0 (0) 0.1 (1) 0.4 (9) 0.2 (1)
Grassland 24.4 (100) 9.4 (94) 2.6 (63) 11.5 (94)
Forest 0 (0) 0.4 (4) 1.1 (28) 0.5 (4)
Total land area 24.4(100) 9.9 (100) 4.1 (100) 12.2 (100)
Inco
me
A2 (%) A2 (%) A2 (%) A2 (%)
Crop production 97 (1) 2656 (14) 500 (1) 1082 (6)
Livestock 13,438 (72) 7188 (38) 1765 (3) 7109 (38)
Non-agriculture 1 5250 (28) 8844 (47) 17,425 (96) 10,705 (57)
Total income 18,784 (100) 18,688 (100) 19,690 (100) 18,896 (100) 1Non-agriculture includes income from migrant job, subsidies and land expropriation;
A1: Average area of land per capita in unite of ha;
A2: Average amount of income per capita in unite of CNY.
Total annual income per capita in the research area is 18 896 CNY (approximately
3000 US$) per capita over all income sources, including 6% from crop production,
38% from livestock herding, 33% from migrant jobs, 7% from subsidies and 17%
from land expropriation for mining and forest planting (ecological corridor
construction project). Results show that per capita income in Ordos is highest with
average per capita of 19 690 CNY (approximately 3126 US$); followed by Hulun
Buir (18 784 CNY, approximately 2983 US$); the lowest is Xilin Gol with 18 688
CNY (approximately 2967 US$). In our samples, livestock herding still is the most
important source of income in Hulun Buir, accounting for 72% of total income.
Comparing to Hunlun Buir, the most significant difference in Xilin Gol is the income
from livestock has decreased to 38% of total, but the income from crop products, non-
agriculture works has increased to 14% and 47%, respectively. The income from
migrant labour increased greatly, occupying 37% of total income. This may indicate
that the inhabitants in Xilin Gol do not strongly rely on their grassland due to the
degradation and herders and farmers are beginning to find new sources of income,
such as the income from employment. In Ordos, off-farm income accounts for 96% of
this total. A significant component of income is land expropriation, which makes up
almost 79% of total income.
3.3.2 Spatial and temporal variation of food consumption
Results have shown significant spatial variations in consumption. In Hulun Buir, the
households consume more meat products, especially mutton and beef which represent
over 76% of total meat consumption, accounting for an annual average per capita of
53.9kg and 43.3kg, respectively in 2010 (Table 3.3). This is due to the fact that Hulun
Buir dominated with a high cover of meadow steppe and that average size of

51
grassland per household in Hulun Buir is the highest (24.4ha in 2010), which greatly
exceeds the average level of 11.5ha of the three sub-regions. In addition, in Hulun
Buir, herders rear significantly more sheep and goats than herders in Xilin Gol, and
hence consume more mutton (43.3kg capita-1
year-1
) than the rest in 2010. Although
Hulun Buir herders raise significantly more cattle (18 vs. 4.2) than those in Xilin Gol,
they use the cattle primarily to earn income from selling milk rather than for meat
production and consumption; as a result, their consumption of beef did not differ
significantly from that in Xilin Gol in 2010 (per capita totals of 53.9 and 46.4kg year-
1, respectively). Compared to Hunlun Buir and Ordos, herders and farmers in Xilin
Gol consumed more staple foods, especially flour in 2010 (102.7kg capita-1
year-1
in
Hulun Buir; 108.1kg capita-1
year-1
in Xilin Gol and 62.1kg capita-1
year-1
in Ordos).
Ordos shows a significant difference in food consumption from Hulun Buir and Xilin
Gol. The inhabitants in Ordos consume more potatoes (70.9kg capita-1
year-1
in Hulun
Buir; 50.6kg capita-1
year-1
in Xilin Gol and 168.4kg capita-1
year-1
in Ordos),
vegetables (66.7kg capita-1
year-1
in Hulun Buir; 50.2kg capita-1
year-1
in Xilin Gol
and 119kg capita-1
year-1
in Ordos) and fruits (19.8kg capita-1
year-1
in Hulun Buir;
25.5kg capita-1
year-1
in Xilin Gol and 40.6kg capita-1
year-1
in Ordos) instead of staple
foods (183.2kg capita-1
year-1
in Hulun Buir; 184.4kg capita-1
year-1
in Xilin Gol and
111.8kg capita-1
year-1
in Ordos) and milk products in 2010 (96.9kg capita-1
year-1
in
Hulun Buir; 88.8kg capita-1
year-1
in Xilin Gol and 27.2kg capita-1
year-1
in Ordos).
This discrepancy towards the consumption of foods is associated with what they
produced or cultivated locally. However, in Ordos, most of the farmers and herders
were liberated from their land due to degrading ecosystems and the restoration policy
for returning the farmland to forest and grassland (implementation of grazing
prohibition). Their livelihood is not to rely on the land, and their consumption
depends more on market trading.
We found that the consumption patterns of foods have changed in Hulun Buir, Xilin
Gol and Ordos from 1995 to 2010. The diet of Hulun Buir still involves high meat
consumption, with an amount of 127.2kg capita-1
year-1
in 2010 compared to 96.1 kg
capita-1
year-1
in 1995. Although the pastoralists turn to settlement away from nomadic
grazing, the livelihoods of herders still relies on livestock products and large numbers
of livestock. However, in Xilin Gol, consumption of mutton and beef decreased from
82.8kg capita-1
year-1
in 1995 to 65.6kg capita-1
year-1
in 2010; whilst vegetable and
fruit consumption increased greatly from 95.3kg capita-1
year-1
in 1995 to 126.3kg
capita-1
year-1
in 2010; and staple foods remained similar. This is caused by a great
reduction in livestock grazing due to implementation of a restoration policy measures
of limiting the number of livestock based on the land carrying capacity (one sheep
unite per 40 mu, equal 2.7 sheep unite per hector); a household in Xilin Gol on
average consumes approximately 25 sheep (equal to five cattle). In Ordos, the
consumption for each item of food changed dramatically (Table 3.3). By 2010, the
consumption of staple food in Ordos dropped significantly, especially flour and rice
from 90.6kg capita-1
year-1
in 1995 to 62.1kg capita-1
year-1
in 2010 and from 56kg
capita-1
year-1
in 1995 to 36.8kg capita-1
year-1
in 2010, respectively; Meanwhile,
vegetables, fruits, eggs and milk maintained an increasing trend, in which from
40.1kg capita-1
year-1
in 1995 to 119kg capita-1
year-1
in 2010, from 16.6kg capita-1
year-1
in 1995 to 40.6kg capita-1
year-1
in 2010, from 8.1kg capita-1
year-1
in 1995 to
11kg capita-1
year-1
in 2010, from 14kg capita-1
year-1
in 1995 to 27.2kg capita-1
year-1
in 2010, respectively; Within the category of meat, consumption of pork (from 36.6kg
capita-1
year-1
in 1995 to 41.2kg capita-1
year-1
in 2010), chicken (from 7.8kg capita-
1year
-1 in 1995 to 8.1kg capita
-1 year
-1 in 2010) and fish (from1.2kg capita
-1year
-1 in
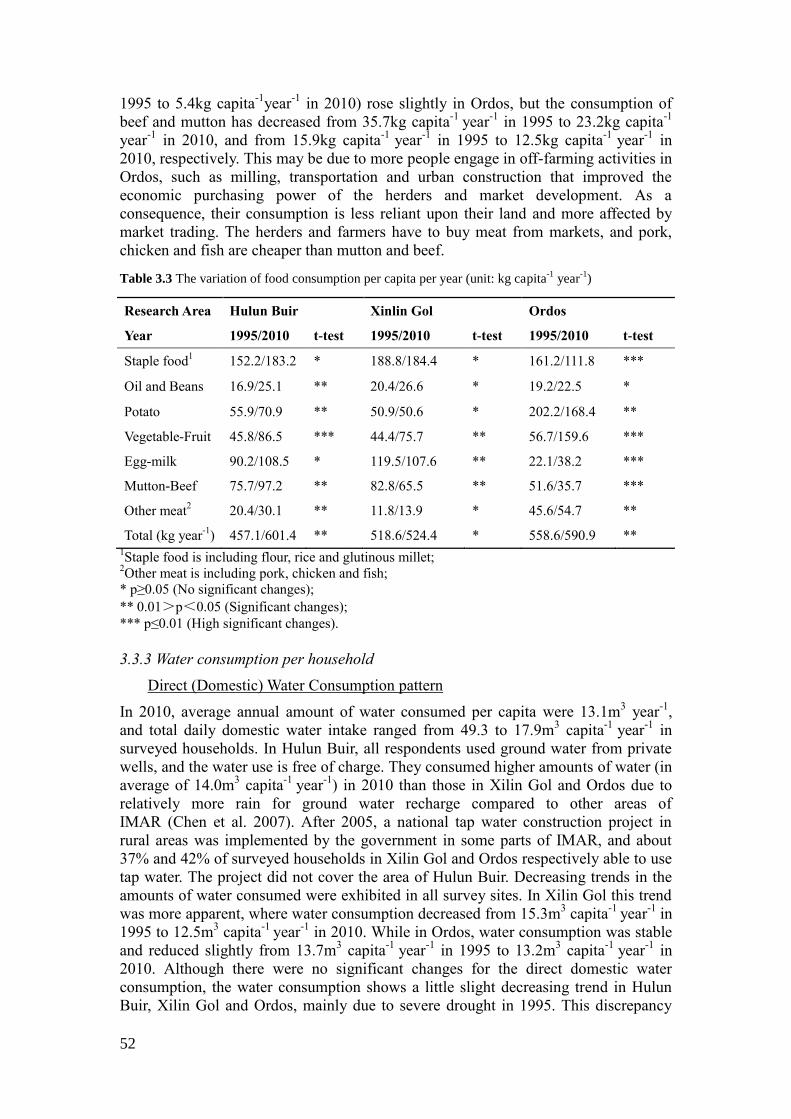
52
1995 to 5.4kg capita-1
year-1
in 2010) rose slightly in Ordos, but the consumption of
beef and mutton has decreased from 35.7kg capita-1
year-1
in 1995 to 23.2kg capita-1
year-1
in 2010, and from 15.9kg capita-1
year-1
in 1995 to 12.5kg capita-1
year-1
in
2010, respectively. This may be due to more people engage in off-farming activities in
Ordos, such as milling, transportation and urban construction that improved the
economic purchasing power of the herders and market development. As a
consequence, their consumption is less reliant upon their land and more affected by
market trading. The herders and farmers have to buy meat from markets, and pork,
chicken and fish are cheaper than mutton and beef.
Table 3.3 The variation of food consumption per capita per year (unit: kg capita-1
year-1
)
Research Area Hulun Buir Xinlin Gol Ordos
Year 1995/2010 t-test 1995/2010 t-test 1995/2010 t-test
Staple food1 152.2/183.2 * 188.8/184.4 * 161.2/111.8 ***
Oil and Beans 16.9/25.1 ** 20.4/26.6 * 19.2/22.5 *
Potato 55.9/70.9 ** 50.9/50.6 * 202.2/168.4 **
Vegetable-Fruit 45.8/86.5 *** 44.4/75.7 ** 56.7/159.6 ***
Egg-milk 90.2/108.5 * 119.5/107.6 ** 22.1/38.2 ***
Mutton-Beef 75.7/97.2 ** 82.8/65.5 ** 51.6/35.7 ***
Other meat2 20.4/30.1 ** 11.8/13.9 * 45.6/54.7 **
Total (kg year-1
) 457.1/601.4 ** 518.6/524.4 * 558.6/590.9 ** 1Staple food is including flour, rice and glutinous millet;
2Other meat is including pork, chicken and fish;
* p≥0.05 (No significant changes);
** 0.01>p<0.05 (Significant changes);
*** p≤0.01 (High significant changes).
3.3.3 Water consumption per household
Direct (Domestic) Water Consumption pattern
In 2010, average annual amount of water consumed per capita were 13.1m3 year
-1,
and total daily domestic water intake ranged from 49.3 to 17.9m3 capita
-1 year
-1 in
surveyed households. In Hulun Buir, all respondents used ground water from private
wells, and the water use is free of charge. They consumed higher amounts of water (in
average of 14.0m3 capita
-1 year
-1) in 2010 than those in Xilin Gol and Ordos due to
relatively more rain for ground water recharge compared to other areas of
IMAR (Chen et al. 2007). After 2005, a national tap water construction project in
rural areas was implemented by the government in some parts of IMAR, and about
37% and 42% of surveyed households in Xilin Gol and Ordos respectively able to use
tap water. The project did not cover the area of Hulun Buir. Decreasing trends in the
amounts of water consumed were exhibited in all survey sites. In Xilin Gol this trend
was more apparent, where water consumption decreased from 15.3m3 capita
-1 year
-1 in
1995 to 12.5m3 capita
-1 year
-1 in 2010. While in Ordos, water consumption was stable
and reduced slightly from 13.7m3 capita
-1 year
-1 in 1995 to 13.2m
3 capita
-1 year
-1 in
2010. Although there were no significant changes for the direct domestic water
consumption, the water consumption shows a little slight decreasing trend in Hulun
Buir, Xilin Gol and Ordos, mainly due to severe drought in 1995. This discrepancy

53
may also be caused by the water payment mechanism for using the tap water. In 2010,
water from privately-owned wells was totally free in all three sub-regions, but tap
water must be paid for according to the actual quantity of water they consume (water
price is 2.6 CNY m-3
) which results in households saving the water on their own
initiative. This phenomenon suggests that the market price of water can reduce water
consumption.
Indirect Water Consumption from food (crop) consumption
The calculation results show that the discrepancy of indirect water consumption for
specific food consumption was large. The spatial variations of SWD in three sub-
regions of Hulun Buir, Xilin Gol and Ordos have been identified according to
previous research (Xiao et al. 2007; Li and Wu 2008; Xu et al. 2003). The top five
foods for SWD are beef, mutton, oil produce, marine products and pork, and the
bottom five foods for water demand are vegetables, potatoes, flour, fruit and rice
(Table 3.4). With accumulation of indirect water consumption for annual total food
consumption, the results show that the herders in Hulun Buir consumed the highest
amount of indirect water for food production, 2307.3m3
capita-1
year-1
in 2010. The
Ordos consumed the lowest indirect water with amount of 1553.8 m3
capita-1
year-1
in
2010. Compared to the level of 1995, the indirect water consumption shows a
decreasing trend in both Xilin Gol (2377.7m3
capita-1
year-1
in 1995 and 2054.3m3
capita-1
year-1
in 2010) and Ordos (1838.5m3
capita-1
year-1
in 1995 and 1553.8m3
capita-1
year-1
in 2010) (Table 3.4). The main reason is the changes in food patterns
from 1995 to 2010 leading to more vegetable and fruit consumption instead of meat
consumption, and meat consumption switching from a combination of mutton and
beef to more diverse meat consumption including fish, chicken and pork.
Although the amount of vegetable and fruit consumption in all three sub-regions
shows a high significant increasing trend when comparing the food consumption in
1995 and 2010, due to the SWD of vegetable and fruit being relative low (in average
0.1 for vegetable and 1.2 for fruit), the indirect water from agri-food production item
remains at a relatively low level. The changes in indirect water consumption driven by
mutton and beef are significant in all three sub-regions in large proportion (Table 3.4).
In Hulun Buir, the total indirect water consumption increased 31.2% from 1758.8m3
capita-1
year-1
in 1995 to 2307.3m3
capita-1
year-1
in 2010, for which the contribution
from beef is the highest (469.6m3
capita-1
year-1
) among total variations, and indirect
water from mutton contributed negatively (−87.6m3
capita-1
year-1
) to total changes.
In Xilin Gol, the indirect water consumption from beef and mutton products has
decreased 446.6m3
capita-1
year-1
(21.5% of the level of 1995) from 1995 to 2010. In
Ordos, the mutton and beef consumption both declined comparing to 1995, which
contributed −225.0m3
capita-1
year-1
and −68m3
capita-1
year-1
of total indirect water
consumption changes. Therefore, changing diet behaviour and reducing the population
can be considered an option for sustainable use of water.
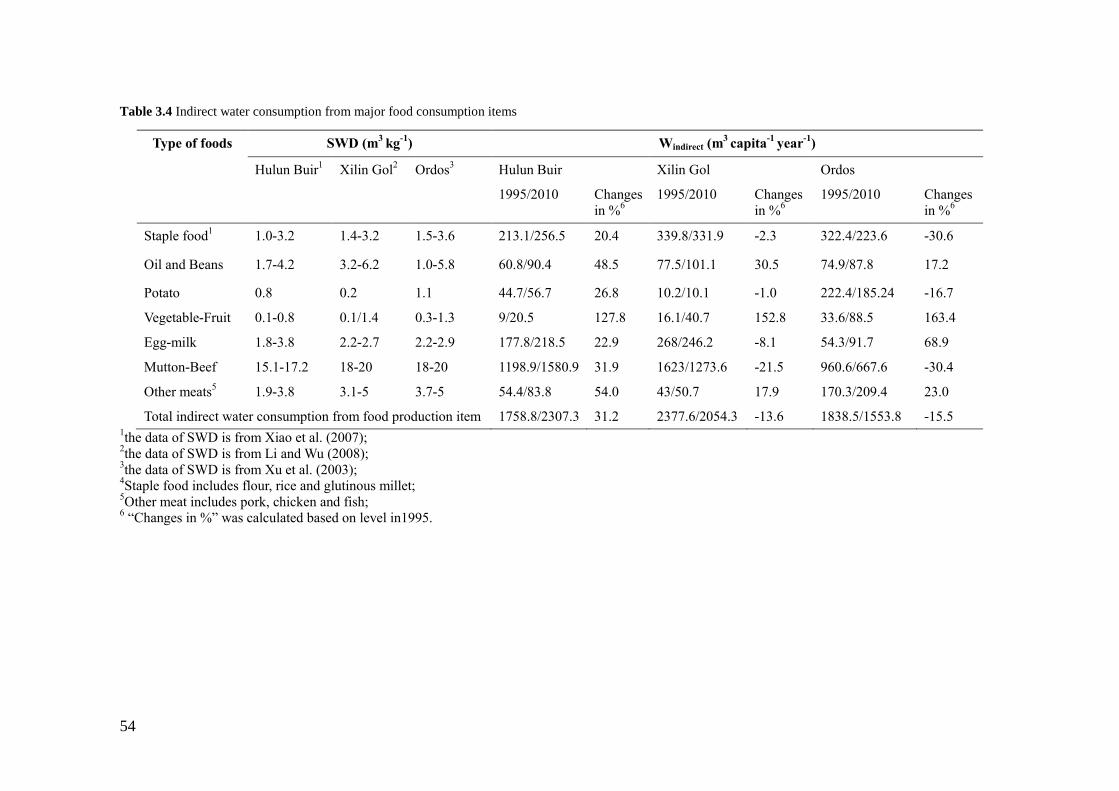
54
Table 3.4 Indirect water consumption from major food consumption items
Type of foods SWD (m3
kg-1
) Windirect (m3
capita-1
year-1
)
Hulun Buir1 Xilin Gol
2 Ordos
3 Hulun Buir Xilin Gol Ordos
1995/2010 Changes
in %6
1995/2010 Changes
in %6
1995/2010 Changes
in %6
Staple food1 1.0-3.2 1.4-3.2 1.5-3.6 213.1/256.5 20.4 339.8/331.9 -2.3 322.4/223.6 -30.6
Oil and Beans 1.7-4.2 3.2-6.2 1.0-5.8 60.8/90.4 48.5 77.5/101.1 30.5 74.9/87.8 17.2
Potato 0.8 0.2 1.1 44.7/56.7 26.8 10.2/10.1 -1.0 222.4/185.24 -16.7
Vegetable-Fruit 0.1-0.8 0.1/1.4 0.3-1.3 9/20.5 127.8 16.1/40.7 152.8 33.6/88.5 163.4
Egg-milk 1.8-3.8 2.2-2.7 2.2-2.9 177.8/218.5 22.9 268/246.2 -8.1 54.3/91.7 68.9
Mutton-Beef 15.1-17.2 18-20 18-20 1198.9/1580.9 31.9 1623/1273.6 -21.5 960.6/667.6 -30.4
Other meats5 1.9-3.8 3.1-5 3.7-5 54.4/83.8 54.0 43/50.7 17.9 170.3/209.4 23.0
Total indirect water consumption from food production item 1758.8/2307.3 31.2 2377.6/2054.3 -13.6 1838.5/1553.8 -15.5 1the data of SWD is from Xiao et al. (2007);
2the data of SWD is from Li and Wu (2008);
3the data of SWD is from Xu et al. (2003);
4Staple food includes flour, rice and glutinous millet;
5Other meat includes pork, chicken and fish;
6 ―Changes in %‖ was calculated based on level in1995.

55
3.3.4 Water consumption pressure for grassland ecosystems
In IMAR, grassland is the dominant ecosystem; it is one of the most important
terrestrial ecosystems on the earth, provides fundamental ecosystem services for
humans such as internal nutrient cycling, soil protection, biodiversity conservation,
climatic regulation and water supply (König et al. 2014b; Xiao et al. 2013). Many
studies have pointed out that water is treated as a service provided by ecosystems as
well as a system (inland waters) (Li et al. 2015; Dudley and Stolton 2003). Therefore,
the sustainable use of water can be critical issue for grassland. Overuse of water
resources can be one of the main drivers for grassland degradation, because of water
expressed as a comprehensive regulation through various hydrological processes of
the grassland ecosystem, including canopy interception, stem flow, litter interception,
water storage in soil and permeability, runoff and vaporization (Zhang et al. 2010).
The water conserved in the local ecosystem is the main source for the human‘s direct
and indirect water consumption. The pressure index of grassland can be estimated by
accounting total water consumption per hector in ecosystems to identify areas that are
critical to human well-being as well as those that require particular attention in
designing strategies for sustainable grassland management.
In this research, the degree of intensive consumption of water resources can be
measured by the amount of water intake from local grassland ecosystems in the land
unit to indicate the pressure for local grassland. Figure 3.2 shows the results for water
consumption intake from grassland ecosystems per hectare. In Hulun Buir, humans
took in 95.1 m3 ha
-1year
-1 of water in 2010 and 72.7 m
3 ha
-1year
-1 in 1995 from local
grassland ecosystems, which was the lowest comparing to Xilin Gol and Ordos.
Although Hulun Buir has the highest total water consumption per capita, the herder
has abundant grassland resources, which results in low pressure from water
consumption on their grassland. On the contrary, Xilin Gol and Ordos have higher
degrees of water consumption per land unit which creates high pressure on their
grassland. Such high water consumption pressure may affect water conservation
services and productivity of grassland ecosystems and the grassland will be exposed
to degradation.
Due to the changes of food consumption patterns recently, the water consumption per
unit area shows a decreasing trend in 1995–2010 in Xilin Gol and Ordos from
241.7m3 ha
-1 year
-1 to 208.8m
3 ha
-1 year
-1, and 451.8m
3 ha
-1 year
-1 to 382.2m
3 ha
-1 year
-
1, respectively. Since the 1980s, the economic development of IMAR was so fast that
the total water requirement increased greatly due to increased meat consumption (Dai
et al. 2009). With the subsequent issue of overuse of grassland, ecosystems degraded
seriously in IMAR in the 1990s. In 2010, the water shortage issue limited their
farming and grazing, and the grassland ecosystems in IMAR could not support the
needs of inhabitants, which meant people started to purchase food from outside of the
ecosystem to reduce dependency on local ecosystems (Du et al. 2014; Renault and
Wallender 2000). The purchase activities resulted in diversified consumption,
especially increased vegetable and fruit consumption, but purchased food highly
depended on economic levels. Better economic income improved purchase power of
herders and market development, such as in Ordos, and high income level causes
diversified food consumption patterns. Beside the influences of different natural
environment conditions and economic development, the grassland restoration policy
measures have deeply changed pastoral tradition and basic household consumption
patterns. Grazing activity was less affected by policy measures of seasonal grazing
and rotational grazing than the other policy measures, thus more herders preferred to

56
maintain most of their food/water consumption patterns (e.g. in Hulun Buir).
However, in the context of grazing prohibitions and limited number of livestock-
rearing policy measures (e.g. in Xilin Gol and Ordos), the food/water consumption
patterns changed greatly. Therefore, the implementations of grassland ecosystem
restoration policy aggravated the herders and farmers in IMAR, who changed their
diet by reducing their meat consumption and starting to purchase food to reduce
indirect water consumption for conservation of the local grassland.
Figure 3.2 Water requirement per unit of land area for producing consumable items
3.3.5 Advantage, uncertainties and future improvements
The method for estimating the total water consumption in direct and indirect ways
according to quantities and types of household food consumption can be widely
applied for many cases, which is useful in explaining the effects of household
consumption and livelihoods on grassland‘s water conservation services, improving
herder awareness of the environmental effects from their daily consumption activities,
and in providing guidelines for sustainable grassland management, and it provides a
viewpoint on ecosystem adaptive management at a household level, especially in
linking micro-level livelihood (alternative diets) responses to macro-level
environmental/policy procedures, which facilitates the further review of policies and
enables policy adjustment and amendment through feedback from livelihood
outcomes.
The realistic total water consumption is difficult to estimate, due to the complexity of
ecological processes in our world. This approach tries to show the actually total water
use of humans, but it is still a partial estimate; the water use for fuel consumption is
not included. Many steps of the calculation are general estimates, for instance of (1)
selection of data of SWD per food (crop); it still needs more field experiment data to
establish accurate results; (2) the data on direct water consumption and indirect water
consumption for 1995 and 2010 was gathered in one survey of 2011 (recalled by the
respondents); although the herders were able to recall the situation in 1995 and

57
answered the questions properly, there are is still the possibility of overestimates or
underestimates because of consumed foods did not actually weighed.
Most areas of the world show economic development results increased purchasing
power, causing increased demand for meat products (FAO 2009; Grigg 1995; Popkin
2002), especially in developing countries like Brazil and China; populations continue
to increase, and combined with economic growth, demand for animal products is
predicted to increase and would require more water consumption. These show
different trend with our results, which may be because most food consumption
research is on the national or global scale, based on statistics or trading data, while the
results of this chapter are based on the household level of consumption in a specific
pastoral area under different circumstances. Making real comparisons, however, is
hard. Moreover, understanding the likely structure and trends of the water
consumption from food consumption can give policymakers a better picture of
sustainable water management. Therefore, future research is highly encouraged to
assess how diet composition will change with household level under different cultural
backgrounds and constraint conditions.
3.4 Conclusion and suggestions to management
Because at least 99% of the total water consumption of households consists of indirect
water consumption behind food production, the large differences between the specific
water requirements of the various foods (crop) types for consumption indicate that the
total water consumption can be reduced if we change our food consumption patterns.
The results show that beside the influences of different natural environment
conditions and economic development, the grassland restoration policy measures
deeply changed pastoral tradition and food consumption patterns. When comparing
the food and water consumption in 2010 to 1995, although the amount of vegetables
and fruits in all three sub-regions show a highly significant increasing trend when
compared to food consumption in 1995 and 2010, the water consumption behind the
food production displays a decreasing trend in Xilin Gol and Ordos due to the
decrease of meat consumption and increase in fruit and vegetable consumption.
The changes for mutton and beef are significant in all three sub-regions, which
contribute the large proportion of variation in indirect water consumption. In Hulun
Buir, total indirect water consumption has increased over 31.2% by comparing the
level 1995, in which beef-mutton contributes the highest proportion. In Xilin Gol, the
indirect water consumption from beef-mutton has decreased 21.5% of the level of
1995. In Ordos, the mutton-beef consumption all declined greatly (30.4%) comparing
to 1995, which beef and mutton contributed 79% and 23.9% of total decreased
indirect water consumption. In Hulun Buir, the pressure of local grassland was lowest
comparing to Xilin Gol and Ordos. Although Hulun Buir has highest total water
consumption per capita, the herder has abundant land resources which mean a low
amount of water intake from local ecosystems. On the contrary, Xilin Gol and Ordos
have high pressure on grassland due to a higher degree of water consumption per land
unit. However, due to the changes in food consumption patterns recently, the water
consumption per unit area shows a decreasing trend in Xilin Gol and Ordos from 1995
to 2010.
Compared to direct water consumption, indirect water consumption from food
production made up the major part of total water consumption, which is affected by
(1) geographic location (grassland types), (2) economic development level and (3)
grassland-use policy measures. The grassland ecosystem degradation in IMAR leads

58
to a shortage of meat production that result in people starting to purchase food from
outside of the ecosystem to reduce dependency on local ecosystems. These purchase
activities resulted in diversified consumption, especially increased vegetable and fruit
consumption, but purchased food highly depends on the economic level. In Ordos,
high income level causes a reduction in direct water consumption through adoption of
diversified food consumption patterns. In addition, the grassland restoration policy
measures deeply changed pastoral tradition and basic household consumption
patterns. In the context of grazing prohibitions and limited number livestock-rearing
policy measures (e.g. in Xilin Gol and Ordos), the food/water consumption patterns
changed greatly from meat-dominated consumption to more diverse staple and
vegetable consumption patterns.
The reductions in indirect water consumption can reduce the pressure on local
grassland, and grassland conservation can be achieved by changing food consumption
patterns. Under the current scale of restoration policy, subsequent policy measures
need to increase livelihood diversity and mitigate livelihood dependence on grassland
ecosystems. A variety of strategies need to be employed, such as provided off-farm
works, skill training, establishment of food trading market and education on healthy
diets. Therefore, accounting for direct and indirect water consumption is critical to
human well-being and requires particular attention in designing strategies for
sustainable development of natural resources.

59
CHAPTER 4
Chapter 4: Effects of Grassland Conservation Policy on
Household Livelihoods and Dependence on Grasslands
Based on:
Du B., Zhen L., Yan H., de Groot R. 2016. Effects of government grassland
conservation policy on household livelihoods and dependence on local grasslands:
evidence from Inner Mongolia, China. Sustainability 8(12): 1314.
60
Abstract:
Grassland degradation intensifies human-environment conflicts and adversely affects
local residents‘ livelihoods. To reduce grassland degradation in Inner Mongolia,
China, the government has enforced (since 1998) a series of grassland conservation
and management policies that restrict the use of grasslands. To ease the impact on
the residents‘ livelihoods, the national and regional governments have offered a
series of top-down arrangements to stimulate sustainable use of the grasslands.
Simultaneously, local households spontaneously developed bottom-up
countermeasures. To determine the effects of these processes, the members of 135
households were interviewed by using a mix of qualitative and quantitative methods.
We analysed the effects on household dependence on local grasslands and on
perceptions of the future of grassland use. Our findings show that the
implementation of the grassland conservation policies significantly affected
household livelihoods, which in turn affected household use of natural assets
(primarily the land), their agricultural assets (farming and grazing activities) and
their financial assets (income and consumption), resulting in fundamental
transformation of their lifestyles. The households developed adaptation measures to
account for the dependence of their livelihood on local ecosystems by initializing
strategies, such as seeking off-farm work, leasing pasture land, increasing purchases
of fodder for stall-fed animals and altering their diet and fuel consumption to
compensate for their changing livelihoods.
Keywords: Livelihood Analysis; Dependence; Conservation Policy; Grassland
Management

61
4.1 Introduction
Grasslands are among the largest and most important ecosystems in the world, and
human populations derive a variety of crucial benefits from the ecosystem services
that grasslands provide. The livelihoods of pastoral communities are strongly linked
to the health of the grasslands on which the majority of these communities rely
(Pricope et al. 2013). However, grasslands in many regions of the world are showing
alarming signs of degradation (Xie et al. 2010; Werger and van Staalduinen 2010).
Increasing demand on pasture resources, especially in arid and semi-arid regions, has
led to extensive and sometimes irreversible damage to the grassland environment,
while simultaneously compromising the livelihoods of residents (Dong et al. 2007;
Schiborra et al. 2009).
For the purposes of this chapter, livelihood refers to a person‘s ―means of securing the
basic necessities—food, water, shelter, fuel and clothing—of life‖ (Carney 1998).
This definition comprises the set of activities required to obtain these necessities by
working either individually or in groups to sustainably meet individual and household
requirements. In practice, the definition of ―livelihood‖ differs among countries based
on differences in their economic levels, social relationships and environmental
conditions (Ellis 1998; Dai et al. 2009). In China, there is no standard definition, but
for rural residents, the term generally refers to income-generating activities both on
and off their farm (Liu and Lan 2015). The concept of livelihood has gained wide
acceptance as a valuable means to analyse the factors that influence human living,
well-being and impacts on the ecosystems that sustain them, particularly in the most
impoverished and ecologically fragile areas in the developing world (Ellis 2000), such
as Inner Mongolia, in northern China.
The analysis of livelihoods normally links the micro-level of individual livelihoods
with macro-level policy development and implementation and thereby provides
support for policy development and poverty alleviation (Cinner and Bodin 2010;
Sievanen et al. 2005). This is especially useful when policies are examined from the
perspective of the sustainable use of human, natural, financial, social and physical
capital to reveal the influence of the policy on these important aspects of livelihoods
(Qu et al. 2011). Most current research has focused on the construction of a
conceptual framework for livelihood and the application of the framework in different
contexts, as well as on identifying policy intervention mechanisms in natural resource
management to reveal the effects of local ecosystems (Lim et al. 2005; Allison and
Horemans 2006; Pahl-Wostl 2009). Several studies for adaptive management have
investigated the vulnerability of ecosystems and of communities and nations that
depend on the exploitation of natural resources against the background of global
climatic change (Dai et al. 2009; Lim et al. 2005). In previous research, the analysis of
the household dependence on natural resources simply referred to the economic aspect,
such as the actual household income or its proportional change over time. However,
until recently, the implications of interventions (e.g. government policy, urbanization)
on the livelihoods of resource users and changes in household dependence on natural
resources at local scales have been less well explored (Xu et al. 2012; König et al.
2014a). In addition, there has been insufficient attention to the changing background
of ecological management and the adoption of new livelihoods in response to changes
in government policy, especially in regions with a vulnerable environment (e.g. Inner
Mongolia), where policies to balance regional socio-economic development with
ecological conservation have had important effects on household livelihoods (Jiang et
al. 2006).

62
The grasslands of Inner Mongolia have been experiencing degradation for decades,
resulting in decreased primary production and frequent forage shortages, especially in
the spring (Li et al. 2008). The degradation appears to have been caused by
unsustainable use of the natural resources provided by these grasslands (Zhang et al.
2013). However, Inner Mongolia is inherently an ecologically-vulnerable area, and
this degradation directly threatens both the environment and the sustainability of
regional socioeconomic development. To solve the problem, national and local
governments have implemented a series of grassland management policies. The
implementation of these policies began in limited parts of Inner Mongolia in 1998,
and the policies were expanded to all of Inner Mongolia after several years‘
experience. The overall policy included five main measures (NDRC 2014):
(1) Seasonal grazing, in which pastures could only be grazed throughout the period of
grass growth from April to November, was broadly implemented in the slightly
degraded grassland, and pastoralists received an annual compensation payment of
22.5 CNY ha-1
(US$ 3.46 ha-1
based on the exchange rate of 6.50 CNY/US$ on 10
January 2016).
(2) Rotational grazing, in which the grassland was divided into paddocks that could
only be used at 25- to 50-day intervals, depending on the type of grassland: 25 to
30 days for meadow, 30 to 35 days for steppes and 40 to 45 days for desert
steppes. This policy was implemented in slightly to moderately degraded
grasslands, and pastoralists received an annual compensation payment of 22.5
CNY ha-1
(US$3.46 ha-1
).
(3) Grazing prohibition, which was mainly carried out in severely-degraded grassland,
eliminated all grazing in an area until it recovered to near its original condition,
and pastoralists received an annual compensation of 90 CNY ha-1
(US$13.85 ha-1
).
(4) Control of livestock rearing, in which the number of livestock was limited
according to the carrying capacity of the local grassland, and nomadism was
prohibited and replaced by indoor rearing. To implement this measure, fences
were constructed throughout the grassland, and pastoralists received a single
compensation payment of 300 CNY ha-1
(US$46.15 ha-1
).
(5) Offering jobs in the cities let residents change their employment from animal
husbandry or farming to urban employment, thereby reducing household
dependence on local grasslands. This policy was mainly implemented in severely-
degraded grassland. The government provided assistance for job training,
employment opportunities and social benefits, such as medical insurance and
education for their children.
Unfortunately, these policies created great stresses on households by fundamentally
changing their lifestyles (Zhen et al. 2010a; Li and Huntsinger 2011) and drastically
reshaping the patterns of grassland use that had existed for millennia in Inner
Mongolia (Du et al. 2014). In recent years, rural livelihoods in Inner Mongolia have
increasingly shifted from subsistence agriculture and animal husbandry to include
non-agricultural, off-farm work for wages and government subsidies (König et al.
2014a; Li et al. 2011). Adapting to these changes has required households to take
risks and look for new opportunities, leading to continuous transformation of rural
landscapes, land uses and livelihoods by changing the dependence of these
households on local grasslands.
In the chapter, I had the following main goals: to identify indicators of changes in the
livelihoods of residents of the study area in Inner Mongolia; to reveal the dynamics of
63
household livelihoods in response to changes in access to natural assets and in their
agricultural activities; to quantify the financial adjustments of households to changes
in their dependence on local grasslands; and to investigate their perceptions of careers
for the next generation of their family. This chapter also aims to provide a better
understanding of the grassland use policy changes and the process of policy
influencing livelihoods and household adoptive strategies and to contribute to the
sustainable use of natural resources.
4.2 Description of the study area
We selected China‘s Inner Mongolia Autonomous Region for the case study. This
region has an arid to semi-arid continental climate (Yu et al. 2003) with strong
climatic gradients and grassland as the dominant land-use (Figure 4.1). Inner
Mongolia is China‘s third-largest province, covering an area of approximately 1.18 ×
106 km
2 (National Statistics Bureau 2015). The population amounted to 25.05 × 10
6
people in 2014 (National Statistics Bureau 2015). Typical steppes, meadows and
semi-desert and desert steppes are the major grassland types (Zhou et al. 2006).
Grasslands were traditionally used for grazing and animal production before 1995
(König et al. 2015). Frequent drought was the major natural disaster, although severe
winter weather was also a frequent problem (Xiao et al. 2013); Inner Mongolia has
suffered from decades of climate fluctuation that have exacerbated the effects of
human disturbance (e.g. over-grazing, excessive reclamation of grasslands for
agriculture), so grassland degradation is a widely-observed problem. Zhang et al.
(2013) found that both degradation and improvement of the grasslands have occurred
since the 1980s, but that grassland degradation was the major trend. The area of
degraded grassland increased from 18.08 × 10⁴ km
2 in the 1980s to 22.47 × 10
4 km
2 in
the 2010s, and its distribution shifted from the central-eastern to the western parts of
Inner Mongolia, from mainly in the Hulun Buir and Xilin Gol grasslands in the 1980s
to mainly in the Ordos and Alxa grasslands in the 2010s.
We chose three regions of Inner Mongolia as county-level study sites: The West
Ujimqin Banner, the Zhengxiangbai Banner and the Alxa Right Banner. These areas
are representative of three typical and fragile grassland areas. The West Ujimqin
Banner has a continental temperate semi-arid climate; the mean monthly temperatures
range from a minimum of –19.5°C in January to a maximum of 19.5°C in July, and the
growing season is from April to September. The annual precipitation decreases from
400mm in the northeast to less than 300mm in the southwest and occurs mostly (68%)
during the summer (from June to August). The main vegetation type is a typical
steppe, and over 96% of the total area is grassland, which has high drought tolerance.
The rural residents live mainly by grazing their animals in grasslands and by livestock
rearing. The West Ujimqin Banner is one of the most important animal husbandry
regions in China. The area of cultivated land accounts for only 0.2% of the total area
(WURBSB 2010).
The Zhengxiangbai Banner is located in north-central Inner Mongolia and is
dominated by semi-desert steppe, with annual rainfall ranging from 100mm to 350mm,
of which 67% falls between June and August. The pan mean annual temperature
averages 1.9°C, but mean monthly temperatures range from a minimum of −19.1°C in
January to a maximum of 17.6°C in July. The area of cultivated land (2.2%) is
proportionally larger than in the West Ujimqin Banner, and more than half of the land
is used to grow grains; most of the other half grows oil plants, fruits, vegetables and
other crops (ZBSB 2010). The trend for animal husbandry and agriculture has been
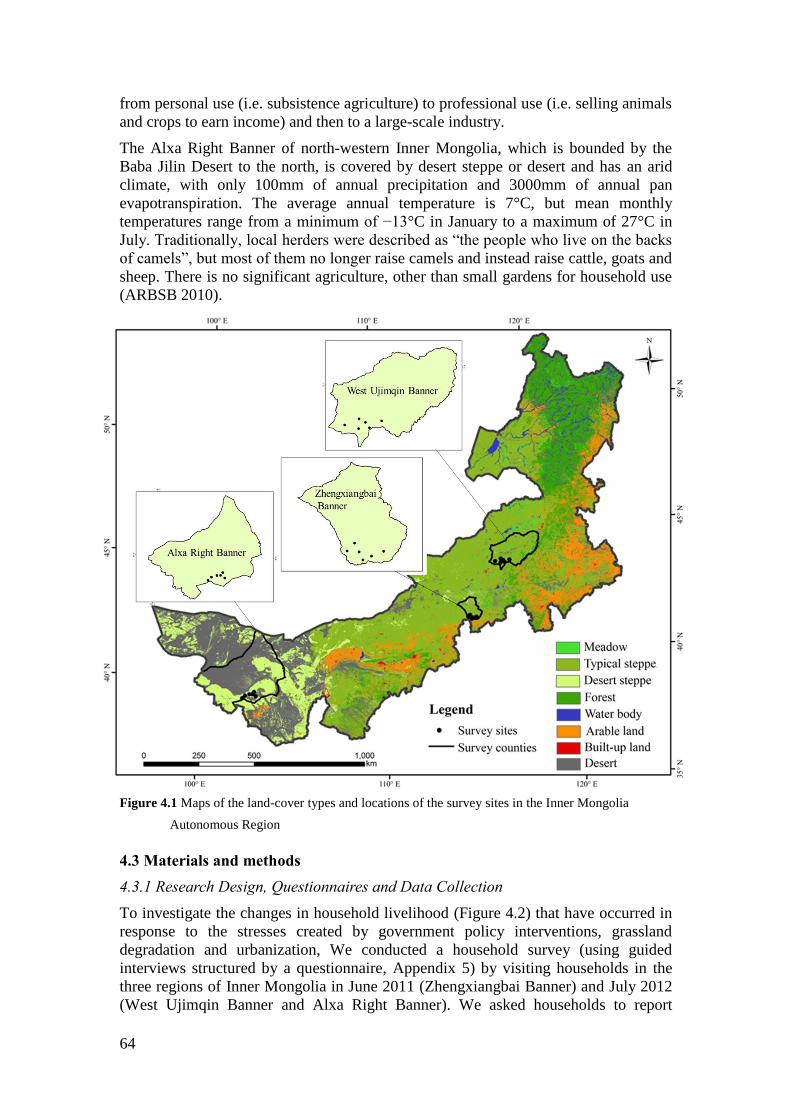
64
from personal use (i.e. subsistence agriculture) to professional use (i.e. selling animals
and crops to earn income) and then to a large-scale industry.
The Alxa Right Banner of north-western Inner Mongolia, which is bounded by the
Baba Jilin Desert to the north, is covered by desert steppe or desert and has an arid
climate, with only 100mm of annual precipitation and 3000mm of annual pan
evapotranspiration. The average annual temperature is 7°C, but mean monthly
temperatures range from a minimum of −13°C in January to a maximum of 27°C in
July. Traditionally, local herders were described as ―the people who live on the backs
of camels‖, but most of them no longer raise camels and instead raise cattle, goats and
sheep. There is no significant agriculture, other than small gardens for household use
(ARBSB 2010).
Figure 4.1 Maps of the land-cover types and locations of the survey sites in the Inner Mongolia
Autonomous Region
4.3 Materials and methods
4.3.1 Research Design, Questionnaires and Data Collection
To investigate the changes in household livelihood (Figure 4.2) that have occurred in
response to the stresses created by government policy interventions, grassland
degradation and urbanization, We conducted a household survey (using guided
interviews structured by a questionnaire, Appendix 5) by visiting households in the
three regions of Inner Mongolia in June 2011 (Zhengxiangbai Banner) and July 2012
(West Ujimqin Banner and Alxa Right Banner). We asked households to report

65
changes in their circumstances between 1995 (before the government ecological
policies were implemented) and 2010. A total of 135 households was interviewed, at a
total of 18 survey sites (each of survey site represents a smaller community) in 6
villages, with the survey frequency proportional to the population size of each village.
In selecting villages, we specifically included two or three villages in each banner that
differed in characteristics, such as the proportions of various economic activities and
ecological characteristics. We surveyed a total of 35 respondents in the West Ujimqin
Banner, 71 in the Zhengxiangbai Banner and 29 in the Alxa Right Banner. Based on
our survey, most respondents performed both animal husbandry and farming rather
than only one of these activities. Prior to the formal surveys, we conducted a re-visit
in July 2014 to monitor the changes of their animal husbandry activities and
household income and employment situations.
Figure 4.2 Main components of herders‘ livelihood in the study area
We selected the three banners beforehand and then used stratified random sampling to
select the villages within each category (i.e. dominant activity or environment) in each
banner. We used simple random sampling to select households for the survey in each
village. We considered a sample size that included more than 70% of the total
households in each village to be appropriate based on the recommendation of
Tabachnick and Fidell (2007) that a sample should account for more than 50% of the
households when the total number of households is less than 100. Because the survey
was carried out in person by interviews or by having the respondents complete the
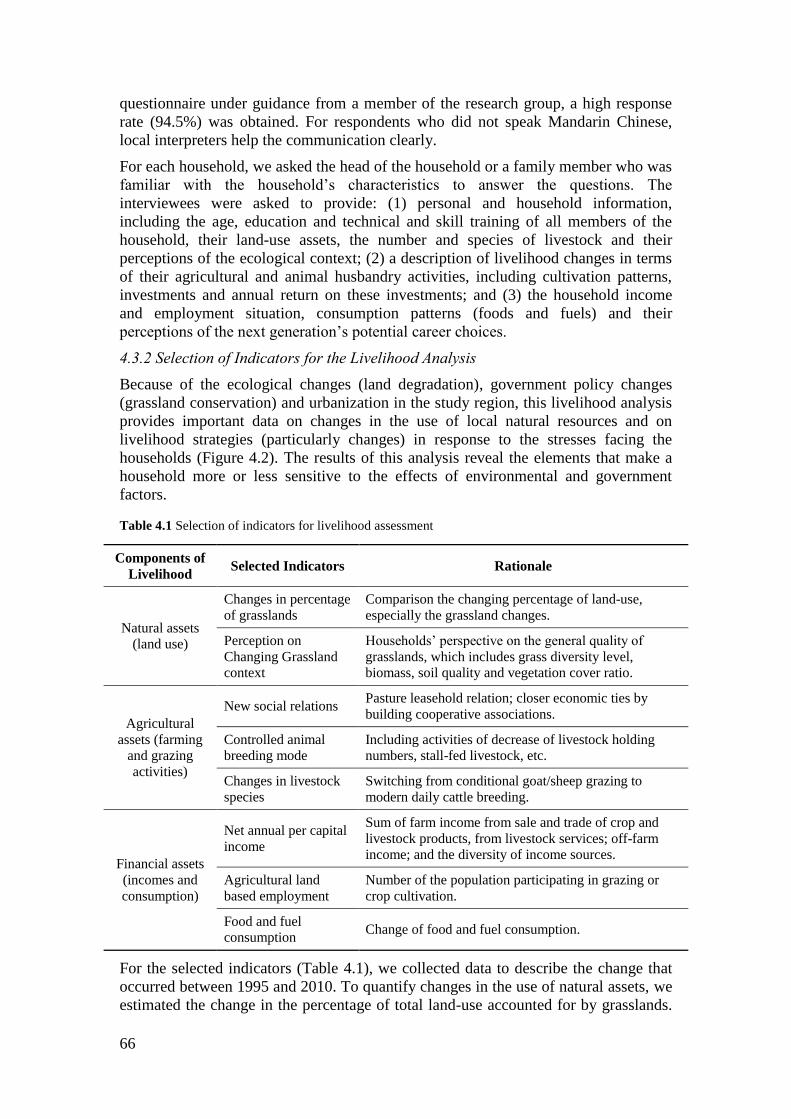
66
questionnaire under guidance from a member of the research group, a high response
rate (94.5%) was obtained. For respondents who did not speak Mandarin Chinese,
local interpreters help the communication clearly.
For each household, we asked the head of the household or a family member who was
familiar with the household‘s characteristics to answer the questions. The
interviewees were asked to provide: (1) personal and household information,
including the age, education and technical and skill training of all members of the
household, their land-use assets, the number and species of livestock and their
perceptions of the ecological context; (2) a description of livelihood changes in terms
of their agricultural and animal husbandry activities, including cultivation patterns,
investments and annual return on these investments; and (3) the household income
and employment situation, consumption patterns (foods and fuels) and their
perceptions of the next generation‘s potential career choices.
4.3.2 Selection of Indicators for the Livelihood Analysis
Because of the ecological changes (land degradation), government policy changes
(grassland conservation) and urbanization in the study region, this livelihood analysis
provides important data on changes in the use of local natural resources and on
livelihood strategies (particularly changes) in response to the stresses facing the
households (Figure 4.2). The results of this analysis reveal the elements that make a
household more or less sensitive to the effects of environmental and government
factors.
Table 4.1 Selection of indicators for livelihood assessment
Components of
Livelihood Selected Indicators Rationale
Natural assets
(land use)
Changes in percentage
of grasslands
Comparison the changing percentage of land-use,
especially the grassland changes.
Perception on
Changing Grassland
context
Households‘ perspective on the general quality of
grasslands, which includes grass diversity level,
biomass, soil quality and vegetation cover ratio.
Agricultural
assets (farming
and grazing
activities)
New social relations Pasture leasehold relation; closer economic ties by
building cooperative associations.
Controlled animal
breeding mode
Including activities of decrease of livestock holding
numbers, stall-fed livestock, etc.
Changes in livestock
species
Switching from conditional goat/sheep grazing to
modern daily cattle breeding.
Financial assets
(incomes and
consumption)
Net annual per capital
income
Sum of farm income from sale and trade of crop and
livestock products, from livestock services; off-farm
income; and the diversity of income sources.
Agricultural land
based employment
Number of the population participating in grazing or
crop cultivation.
Food and fuel
consumption Change of food and fuel consumption.
For the selected indicators (Table 4.1), we collected data to describe the change that
occurred between 1995 and 2010. To quantify changes in the use of natural assets, we
estimated the change in the percentage of total land-use accounted for by grasslands.

67
To investigate the change in agricultural assets, we obtained data on the number and
type of livestock and how they were fed, as well as the extent to which households
formed cooperative associations. We then determined the dependence of household
income on agriculture, and the food (locally produced and purchased) and fuel
consumption (based on the quantity of each major fuel that was consumed).
4.3.3 Calculation of Household Dependence on Local Grasslands Based on Income
and Employment
To determine changes in household dependence on grassland, we divided all sources
of income into income derived from agriculture and income derived from other
sources (non-farm income). We then calculated a dependence ratio as follows:
Income dependence ratio = Farm income/Total household income (Eq. 4.1)
Where the value of this ratio ranged between 0 and 1, with greater values
representing greater dependence on farming and raising of livestock.
We also assessed the dependence of households on off-farm labour by calculating an
employment dependence ratio, as follows:
Employment dependence ratio = On-farm employment/Total labour force (Eq. 4.2)
Where the total labour force excluded children in school or those who could not
work (the disabled, the elderly and very young children). In this calculation,
household survey data for on- and off-farm employment were obtained and reported
by herders or farmers from each household. These data accounted for the number of
hours of each form of employment by an individual as a proportion of their total
number of hours of work.
4.4. Results and discussion
4.4.1. Use of Natural Assets and Changing Ecological Context
Inner Mongolia has a low economic development level, and household livelihoods
rely heavily on the exploitation of the local natural resources. The use of natural
resources reflects the changing land-use patterns. Table 4.2 summarizes the changes
in these uses from 1995 to 2010. Grassland occupied the largest proportion of the total
area in 2010, with areas of 1.97 × 10⁶, 0.59 × 10
6 and 4.23 × 10
6 ha in the West Ujimqin
Banner, the Zhengxiangbai Banner and the Alxa Right Banner, respectively (WURBSB
2010; ZBSB 2010; ARBSB 2010). The changes in land-use were consistent among the
three banners: the forest and grassland area increased significantly (by an average of
9.4% and 2.5%, respectively), and the area of cultivated land decreased greatly (by an
average of 21%) from 1995 to 2010 (Table 4.2). The main reason for this trend was
the implementation of the government conservation policy. Our survey suggested that
grazing prohibition and control of livestock rearing were most responsible for the
increasing area of grassland. The analysis showed that herders increasingly (23% of
respondents in 1995 and 78% in 2010) grew vegetables in a home garden. This may
have resulted from the implementation of the controlled livestock rearing policy to
limit the number of animals raised annually; about 82% of the herders and farmers
reported reduced meat consumption and increased vegetable consumption. Table 4.2
shows that the area of land cultivated for fruit and vegetable consumption increased
greatly, which supports the self-reported data.
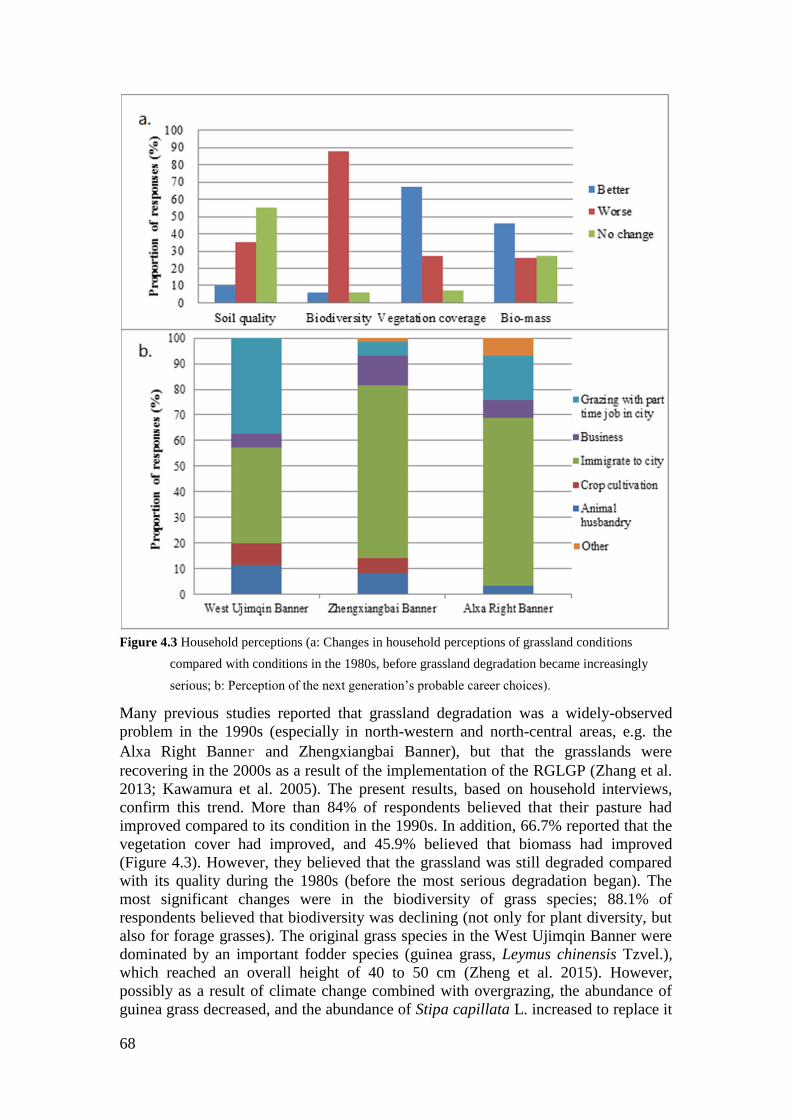
68
Figure 4.3 Household perceptions (a: Changes in household perceptions of grassland conditions
compared with conditions in the 1980s, before grassland degradation became increasingly
serious; b: Perception of the next generation‘s probable career choices).
Many previous studies reported that grassland degradation was a widely-observed
problem in the 1990s (especially in north-western and north-central areas, e.g. the
Alxa Right Banner and Zhengxiangbai Banner), but that the grasslands were
recovering in the 2000s as a result of the implementation of the RGLGP (Zhang et al.
2013; Kawamura et al. 2005). The present results, based on household interviews,
confirm this trend. More than 84% of respondents believed that their pasture had
improved compared to its condition in the 1990s. In addition, 66.7% reported that the
vegetation cover had improved, and 45.9% believed that biomass had improved
(Figure 4.3). However, they believed that the grassland was still degraded compared
with its quality during the 1980s (before the most serious degradation began). The
most significant changes were in the biodiversity of grass species; 88.1% of
respondents believed that biodiversity was declining (not only for plant diversity, but
also for forage grasses). The original grass species in the West Ujimqin Banner were
dominated by an important fodder species (guinea grass, Leymus chinensis Tzvel.),
which reached an overall height of 40 to 50 cm (Zheng et al. 2015). However,
possibly as a result of climate change combined with overgrazing, the abundance of
guinea grass decreased, and the abundance of Stipa capillata L. increased to replace it

69
(Bai et al. 2004). Stipa capillata reaches an overall height of 60 to 70 cm. This height
difference explains the biomass increase (Figure 4.3), but this increase may be
deceptive. A serious problem resulting from this species change is that the mature seeds
of Stipa capillata are sharp and hurt the mouths and skin of the livestock, potentially
leading to lost production or even mortality of the animals. In addition, 54.8% of
respondents reported no improvements in soil quality (Figure 4.3) and believed that
such changes would require a long time.
Despite the severity of grassland degradation and the changes in their lifestyle, more
than 80% of the herders and farmers did not want to move to the city, for three main
reasons: lack of suitable skills, low education and a desire to preserve their culture.
Even herders and farmers with high levels of education and skills training felt strong
ties to their local social network and culture. However, herder and farmer perceptions
of the next generation‘s career choices (Figure 4.2) showed different results, and these
can be used to predict the degree of the next generation‘s dependence on the local
grasslands. Of the six career choices they identified (animal husbandry, crop
cultivation, immigrate to city, establish a business, grazing combined with obtaining a
part-time job in the city and ―other‖), the most likely career for the next generation
was moving to the city to obtain a stable job (37.1% in the West Ujimqin Banner, 67.6%
the Zhengxiangbai Banner and 65.5% in the Alxa Right Banner). The next most
common choice was grazing combined with obtaining part-time work in a city in the
West Ujimqin Banner (37.1%), starting a business in the Zhengxiangbai Banner
(11.3%) and grazing with part-time work in a city in the Alxa Right Banner (17.2%).
Respondents in all three banners believed that crop cultivation (<3%) and animal
husbandry (<10%) were the least likely careers. Because the respondents believed that
the natural conditions greatly influenced crop planting and animal husbandry, they felt
that the basic needs of these careers could not be guaranteed under the current poor
environmental conditions and unstable climate. They reported a high willingness to
help their children free themselves from the grasslands: about 84% of the respondents
thought it would be good to send their children to a big city to improve their education
and employment options.
4.4.2 Changes in Agricultural Production Activities
Controlled Animal Husbandry: From Traditional Grazing of Goats and Sheep to
Modern Raising of Dairy Cattle
To comply with the grassland conservation policy, households decreased the total
number of livestock per household from an average of 261.6 in 1995 to 88 in 2010
(Table 4.2), a 66.7% decrease. More than 60.0% of respondents reported that their
number of livestock had decreased by more than half from the 1995 level. Because of
the continually implementing of the grassland conservation policy, the result of a re-
visit in 2014 shows the number of livestock per household kept the same level of 2010.
The number of animals varied among the three banners in 2010, with the highest
mean being 197 in the West Ujimqin Banner, followed by 34 in the Zhengxiangbai
Banner and 32 in the Alxa Right Banner. These results were strongly related to the
natural conditions in each banner and particularly the per capita land ownership: 17.6,
9.9 and 9.2ha, respectively, in the West Ujimqin Banner, the Zhengxiangbai Banner
and the Alxa Right Banner.

70
Table 4.2 Results of the livelihood analysis for the three banners in the Inner Mongolia Autonomous Region. All households were asked to provide data from 2010, even
though the surveys were conducted in different years.
Year
West Ujimqin Banner Zhengxiangbai Banner Alxa Right Banner Average
1995 2010 Change
(%) 1995 2010
Change
(%) 1995 2010
Change
(%) 1995 2010
Change
(%)
Land use a
(ha)
Grassland 1 896 600 1 968 700 3.8 567 774 585 700 3.2 4 210 450 4 231 133 0.5 2 224 941 2 261 844 2.5
Cultivated land 4150 3267 −21.3 21,432 13,867 −35.3 2140 2000 −6.5 9241 6378 −21.0
Grain production 3670 2280 −37.9 18,664 9066 −51.4 1700 1016 −40.2 8011 4121 −43.2
Fruit and vegetable 480 987 105.6 2768 4801 73.5 440 984 123.6 1229 2257 100.9
Forest 74 500 81 540 9.5 8125 9087 11.8 302 340 323 133 6.9 128,322 137 920 9.4
Livestock
numberb
Sheep 325 162 −50.2 139 21 −84.9 88 18 −79.6 184 67 −71.5
Goats 50 21 −58.0 125 4 −96.8 20 6 −70.0 65 10 −74.9
Cattle 7 13 85.7 10 8 −20.0 5 7 40.0 7.3 9 35.2
Horses and camels 3 1 −66.7 9 1 −88.9 4 1 −75.0 5.3 1 −76.9
Total livestock 385 197 −48.8 283 34 −88.00 117 32 −72.7 261.6 87 −69.8
Employmentc
Land-based 1.3 1.2 −11.4 1.8 1.6 −11.4 1.1 0.6 −47.8 1.4 1.1 −23.5
Non-land-based 0.9 0.9 4.6 0.5 0.6 23.1 1.2 1.6 30.6 0.9 1.1 19.4
Total workforce 2.2 2.1 −5.0 2.4 2.3 −3.8 2.3 2.2 −6.9 2.3 2.2 −5.2
Employment-based
dependence ratio 0.6 0.6 −6.7 0.8 0.7 −7.7 0.5 0.3 −43.8 0.6 0.5 −19.4
Per capita net
income (CNY
year-1)d
Land-based 3759 8000 112.8 3275 5046 54.1 3086 4681 51.7 3373 5909 72.9
Non-land-based 1061 6695 531.0 1134 7054 522.1 1662 6736 305.3 1286 6828 452.8
Total income 4820 14 695 204.9 4409 12 100 174.4 4748 11 417 140.5 4659 12 737 173.3
Income-based
dependence ratio 0.8 0.5 −30.8 0.7 0.4 −43.2 0.7 0.4 −36.9 0.7 0.5 −37.0
a The area of cultivated land is including the areas of Grain production and Fruit and vegetable, source: WURBSB 2010, ZBSB 2010, ARBSB 2010;
b
source: field survey data from the present study, in units of No. per household on average; c land-based-employment is the number of people who
participated in grazing or crop cultivation on average per household; non-land-based employment includes all work outside the household‘s farming
activities; source: field survey data from the present study; d land-based net income includes all agricultural activities. Non-land-based net income comes
from non-agricultural activities, such as non-land-based employment, subsidies and government fees paid as compensation for land expropriation; source:
field survey data from the present study.
71
The livestock most commonly domesticated in the surveyed villages was dairy and beef
cattle, sheep, goats, horses, camels, donkeys and poultry. Most respondents increased cattle
rearing to compensate for decreased grazing of goats and sheep and replacement of this
grazing by stall rearing of cattle. The herders usually chose the livestock species most
appropriate for their local environment and raised the species that produced the most
income to compensate for their loss of income caused by the grazing restrictions. Herders
traditionally raised cattle, goats and sheep to produce meat and milk; horses, camels and
donkeys were retained as traditional ―vehicles‖ or to support domestic needs, such as the
production of skins and blankets (e.g. camel wool, leather) and ploughing the land.
However, horses, camels and donkeys were increasingly replaced by cars, motorbikes and
tractors, so most households retained only one or two horses and camels, mostly for tourist
purposes. Goats and sheep produce less profit than cattle, because the cattle provide larger
amounts of meat and produce milk. Therefore, replacing goats and sheep by cattle mitigates
the loss of agricultural income caused by the government policies. In addition, raising cattle
both increased and symbolizes wealth.
For the household-level variables, we used the proportion of stall-fed livestock and the
proportion of seasonally-grazed livestock as indicators of the livestock strategies of the
herders. About 60% of the households used only stall feeding, and the others adopted a
combination of stall feeding in winter (November to March) and local grazing in summer
(April to October). When grazing is restricted in the local grasslands, herders must purchase
fodder from outside their area to feed their animals. In traditional animal husbandry, daily
fodder was obtained from each household‘s grassland. However, at present, the major
components of livestock fodder are crop residues, leaves from fodder plants and herbaceous
plants from adjacent forests, and this indicates that grasslands are no longer the only
sources of fodder. This change increased costs for the purchase and storage of forage,
which is one of the frequently-reported adaptation strategies in Inner Mongolia. More than
74.8% of respondents reported a need to purchase or store forage.
Since the implementation of the conservation polices, the household dependence on local
grasslands has decreased based on both the employment and income dependence ratios: the
employment ratio decreased by an average of 19.4% and the income ratio by 37.0% (Table
4.2). This has resulted from replacement of traditional animal husbandry (grazing of goats
and sheep) by intensive modern animal husbandry (raising dairy and beef cattle), especially
for emigrants from severely-degraded grassland areas. These emigrants were resettled in
dairy cattle villages in peri-urban areas, where they adopted modern dairy cattle production
techniques to raise income from the sales of meat, milk and leather. In addition to using
grassland as their basic capital goods, the emigrants received technical and financial
assistance from the local government to support dairy production. The government offers
loan guarantees so households can access low-interest loans from local banks to alleviate
the financial burden and invest in the establishment of dairy cattle facilities, such as
milking centres. The combined business plus household system provides ongoing income
for the emigrants. Modern raising of dairy cattle permits more sustainable use of the
grasslands and has also reduced the grassland damage caused by overgrazing, including the
loss of ground flora, depletion of soil nutrients and impaired regeneration of the dominant
grass species. On the other hand, this new mode of animal husbandry has increased the
household resilience in terms of their ability to adapt to and mitigate the impacts of climatic
disasters, such as drought, freezing rain and snow, which historically led to serious
consequences for households, including famine.

72
Improved Socio-Economic Relations: Leasing of Land and Development of
Cooperative Associations
To lower the ecological risk of grazing and stabilize income sources, about 23.7% of the
respondents ceased grazing and leased their grassland to others who wanted to expand their
access to pasture. In this way, leaseholders could earn greater profits because they could
support larger herds with the extra pasture. Additionally, the leasers could engage in non-
farm businesses, such as working outside the community or running a home business, and
even some households moved to peri-urban or urban areas to find other opportunities (Jun
et al. 2007). Thus, as we noted earlier, grasslands were no longer the only basic capital
goods used to guarantee their livelihood; their degree of dependence on the grasslands has
decreased. On the other hand, about 34.3% of the households in the West Ujimqin Banner,
versus 23.9% in the Zhengxiangbai Banner and 17.2% in the Alxa Right Banner, leased
pasture from others. Those who leased pastures became more dependent on the local
grasslands; animal husbandry both provided their livelihood and provided income to pay
for the leasing of grassland. In theory, decreasing the number of households who live in
grasslands can reduce the pressure on this land, allowing ecological improvement, but we
lack the data to support this hypothesis because leasing of pasture is too recent for clear
trends to have emerged.
To mitigate the effects of the government policy, climate hazards and fluctuations in the
prices of livestock products, many herders in all three banners have created or joined a
cooperative association: this accounted for 45.7% of households in the West Ujimqin
Banner, 28.2% of households in the Zhengxiangbai Banner and 69.0% of households in the
Alxa Right Banner. The goals of these cooperatives were to support market-oriented
activities, such as pooling pastures for grazing, unified management of livestock and selling
production together to establish a ―brand‖ reputation for quality. The cooperatives appear to
have increased the income and efficiency of rangeland utilization and have accelerated the
adoption of technologies, such as communal storage of fodder to prevent food shortages
during certain times of the year that decrease the risk of starvation and disease. The
government has provided skill training and technology transfer to promote the adoption of
more efficient methods. The formation of cooperatives has somewhat restored the
traditional cooperation among nomadic households that was lost when they were forced to
relocate to permanent villages (Du et al. 2015).
4.4.3. Household Dependence on Grasslands Based on Income and Consumption
Behaviours
Diversification of Income Sources and Reduction of Land-Based Employment
The proportion of total income accounted for by non-agricultural income increased greatly
between 1995 and 2010: by 531.0%, 522.1% and 305.3%, respectively, in the West
Ujimqin Banner, the Zhengxiangbai Banner and the Alxa Right Banner (Table 4.2). In
contrast, agricultural income increased only slightly. As a result of these changes, the
proportions of total income accounted for by agriculture decreased from 78.0%, 74.3% and
65.0%, respectively, in the West Ujimqin Banner, the Zhengxiangbai Banner and the Alxa
Right Banner in 1995 to 54.4%, 41.7% and 41.0%, respectively, in 2010. These changes
resulted mainly from the reduction in the number of livestock and the increased cost for
grazing and purchases of fodder. Based on the results of the re-visit in 2014, the non-
agricultural income still kept the increasing trend, and the agricultural income maintained
the same level of 2010.
Employment showed similar trends. In 1995, land-based employment was the dominant
form, especially Zhengxiangbai Banner, employing two- to three-times the number of
73
people who were employed in non-land-based employment. With the increase of the urban
process and controlled use of grasslands (grassland management policies) at all research
sites from 1995 to 2010, the total workforce decreased slightly in the West Ujimqin Banner,
the Zhengxiangbai Banner and the Alxa Right Banner (by −5.0%, −3.8% and −6.9%,
respectively). However, the non-land-based employment increased more dramatically, by
4.6%, 23.1% and 30.6%, respectively, in the West Ujimqin Banner, the Zhengxiangbai
Banner and the Alxa Right Banner. This can be explained by the combined effects of the
grassland conservation policy and an urbanization process that encouraged herders and
farmers, and especially young adults, to move to towns and cities to seek employment in
off-farm businesses, thereby decreasing the human pressure on the grasslands.
Between 1995 and 2010, the mean income-based dependence ratio decreased from 0.7 to
0.5, and the employment-based dependence ratio decreased from 0.6 to 0.5. This indicated
that although the land remained the main source of capital for daily life, the dependence on
grasslands has gradually decreased. The main reason for these decreases is that the area of
grassland used for animal husbandry has decreased. The macro-level policy changes and
micro-level livelihood adjustments by the affected households have caused large changes in
the land-use asset structure. For instance, herders who lost the right to access grassland
were more severely affected than those who retained access to pastures under the grassland
conservation policy. Because these changes were implemented rapidly, herders who lost
access to pasture were forced to sell most or all of their livestock, although the government
provided partial compensation for this loss. On the plus side, this decreased their
dependence on grasslands and increased the rate of business operation and employment in
non-agricultural economic activities.
Simultaneous with the process of urbanization, the herders and farmers acquired new skills
and new opportunities to earn money, so their income and employment were less
constrained by their former dependence on the land. Comparing the income and
employment situations among the three banners provides insights into the dependence of
livelihoods on the local grassland. The Zhengxiangbai Banner had the largest proportional
decrease in the income-based dependence ratios (−43.2%), followed by the Alxa Right
Banner (−36.9%) and the West Ujimqin Banner (−30.8%). One of the most important
reasons for this difference is that the Zhengxiangbai Banner is close to many megacities,
including Beijing, Hohhot and Tianjin, so residents have more opportunities to seek high
income with urban employment. Alxa Right Banner had the largest proportional decrease in
the employment-based dependence ratios (−43.2%), followed by the Zhengxiangbai Banner
(−7.7%) and West Ujimqin Banner (−6.7%). This is because Alxa Right Banner has the
most venerable grassland type (desert steppe or semi-desert steppe), which has been
severely influenced by ecosystem degradation (Zhang et al. 2013). The herders in Alax
Right Banner have to give up their land and are engaged in non-land-based employment.
Our survey revealed that about 77.1% of respondents in the West Ujimqin Banner, 91.5%
of respondents in the Zhengxiangbai Banner and 89.7% of respondents in the Alxa Right
Banner believed that finding urban employment was the best way to increase their income
and that diversification of income sources would play a crucial role in securing their
household livelihood. Especially in poorly-developed areas, off-farm employment and
activities could increase cash income and improve household risk resilience by increasing
their capacity to cope with shocks.
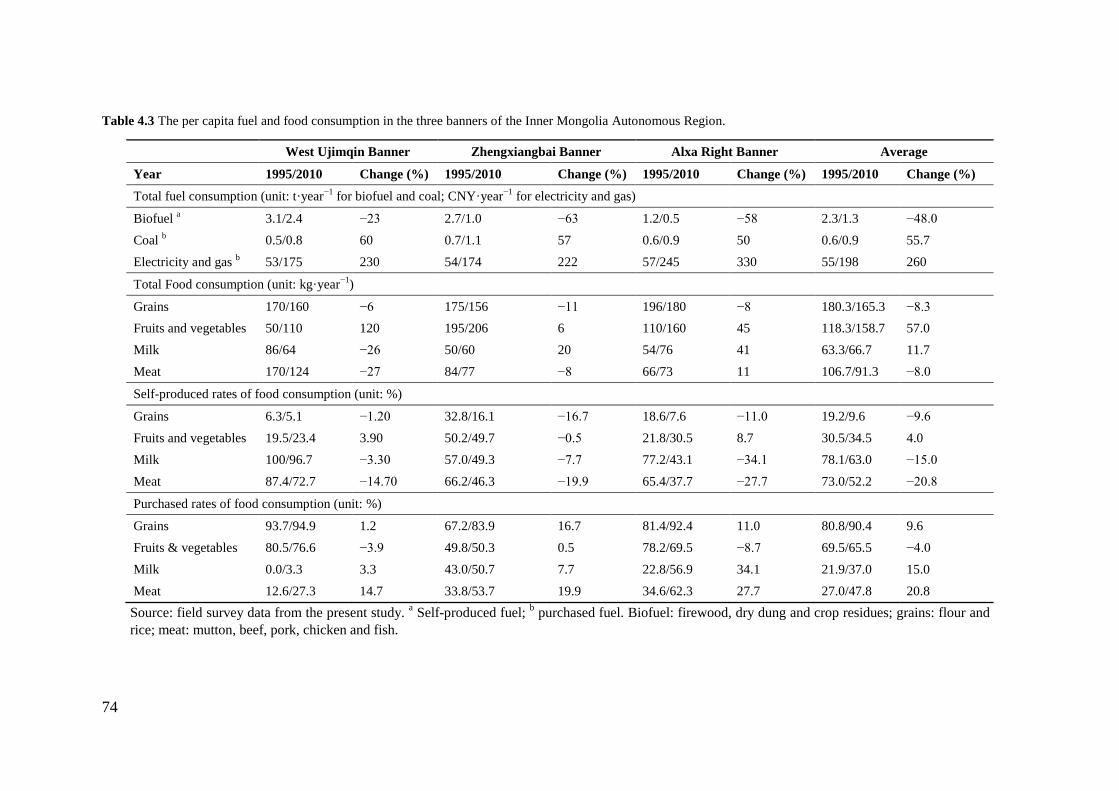
74
Table 4.3 The per capita fuel and food consumption in the three banners of the Inner Mongolia Autonomous Region.
West Ujimqin Banner Zhengxiangbai Banner Alxa Right Banner Average
Year 1995/2010 Change (%) 1995/2010 Change (%) 1995/2010 Change (%) 1995/2010 Change (%)
Total fuel consumption (unit: t·year−1
for biofuel and coal; CNY·year−1
for electricity and gas)
Biofuel a 3.1/2.4 −23 2.7/1.0 −63 1.2/0.5 −58 2.3/1.3 −48.0
Coal b 0.5/0.8 60 0.7/1.1 57 0.6/0.9 50 0.6/0.9 55.7
Electricity and gas b 53/175 230 54/174 222 57/245 330 55/198 260
Total Food consumption (unit: kg·year−1
)
Grains 170/160 −6 175/156 −11 196/180 −8 180.3/165.3 −8.3
Fruits and vegetables 50/110 120 195/206 6 110/160 45 118.3/158.7 57.0
Milk 86/64 −26 50/60 20 54/76 41 63.3/66.7 11.7
Meat 170/124 −27 84/77 −8 66/73 11 106.7/91.3 −8.0
Self-produced rates of food consumption (unit: %)
Grains 6.3/5.1 −1.20 32.8/16.1 −16.7 18.6/7.6 −11.0 19.2/9.6 −9.6
Fruits and vegetables 19.5/23.4 3.90 50.2/49.7 −0.5 21.8/30.5 8.7 30.5/34.5 4.0
Milk 100/96.7 −3.30 57.0/49.3 −7.7 77.2/43.1 −34.1 78.1/63.0 −15.0
Meat 87.4/72.7 −14.70 66.2/46.3 −19.9 65.4/37.7 −27.7 73.0/52.2 −20.8
Purchased rates of food consumption (unit: %)
Grains 93.7/94.9 1.2 67.2/83.9 16.7 81.4/92.4 11.0 80.8/90.4 9.6
Fruits & vegetables 80.5/76.6 −3.9 49.8/50.3 0.5 78.2/69.5 −8.7 69.5/65.5 −4.0
Milk 0.0/3.3 3.3 43.0/50.7 7.7 22.8/56.9 34.1 21.9/37.0 15.0
Meat 12.6/27.3 14.7 33.8/53.7 19.9 34.6/62.3 27.7 27.0/47.8 20.8
Source: field survey data from the present study. a Self-produced fuel;
b purchased fuel. Biofuel: firewood, dry dung and crop residues; grains: flour and
rice; meat: mutton, beef, pork, chicken and fish.

75
Household Food and Fuel Consumption
In the three banners, most of the pasture area (95%) was fenced; 37% of the pasture
area was totally protected from grazing in the past five or 10 years. Thus, the former
livelihoods of herders changed fundamentally, causing them to shift their activities to
raising dairy cattle in stalls, cooperative activities, such as the sales and transportation
of livestock, or milling of grains. Moreover, as household income changed, this
directly affected consumption patterns, especially in terms of the dietary structure and
fuel consumption. We defined the food (including grains, fruits, vegetables, milk and
meat) and fuel (biofuels, such as firewood, dry dung and crop residues) as the main
household biological products, which are consumed by the local population.
Additionally, household consumption into self-produced and purchased food and fuel
has been separated (Table 4.3).
Based on the results of the food and fuel analysis, the total annual per capita bio-fuel
and meat consumption decreased during the study period, from 2.3t·year−1
and
180.3kg·year−1
in 1995 to 1.3ton year−1
and 165.3kg·year−1
in 2010 and mainly
comprised consumption from grasslands (Table 4.2). The main reason for the
decreases was the grassland conservation policy, which substantially decreased the
number of livestock (Table 4.2). Dried dung from livestock and firewood collected
from forests and bush vegetation communities were traditionally important biofuels
and were widely used in Inner Mongolia. The types and amounts of fuel consumed
changed significantly during our study period. Usage of coal, gas and electricity
increased in all three banners and increased particularly rapidly for electricity and gas
(Table 4.3).
The government statistics of Inner Mongolia reported that annual electricity
consumption in the rural area kept an increasing rate (by 14.5% in average) during
2010 to 2015 (Inner Mongolia Statistics Bureau 2015a). This may have resulted from
rapid economic development and government initiatives to provide cleaner sources of
power to residents of the study area. Although cleaner energy, such as gas and
electricity, is more costly, people prefer it because it is more convenient and efficient.
The amount of biofuel consumed decreased because livestock numbers decreased
(providing insufficient amounts of dry dung), the protection of forests increased
(thereby decreasing the availability of firewood) and the availability of alternative
fuels increased. Our survey revealed that up to 74.8% of the respondents sharply
decreased their consumption of meat from cattle, sheep and goats and consumed more
fruits and vegetables (Table 4.3). This represents a large change from their traditional
nomadic diet; when the number of livestock was constrained under the government
policy, more of the animals were kept to sell rather than for eating. The decreased
consumption of meat from cattle, sheep and goats was compensated for by increased
consumption of pork, poultry, fruits and vegetables from the market.
In additional, the meat and milk consumption from self-produced products decreased
from 73.0% in 1995 to 52.2% in 2010 and 78.1% in 1995 to 63.0% in 2010,
respectively (Table 4.3). Most of the consumed grain foods came from for purchased
products, and this proportion increased from an average of 80.8% in 1995 to 90.4% in
2010. The total self-produced meat consumption decreased significantly (by 20.8%)
between 1995 and 2010, especially in the Alxa Right Banner, because grassland in
this banner is vulnerable and had sustained the most serious degradation, followed by
grasslands in the Zhengxiangbai Banner and the West Ujimqin Banner. The West
Ujimqin Banner maintained the highest self-produced rates of milk and meat
76
consumption in 2010, at 96.7% and 72.7%, because this banner has high quality
grassland and still maintains the traditional animal husbandry with the largest number
of livestock (Table 4.3). The ecological conditions were also better than those in the
Zhengxiangbai Banner and Alxa Right Banner. In contrast, the West Ujimqin Banner
had the lowest self-produced rate of gain and fruits and vegetables consumption in
2010, at only 5.1% and 23.4%, respectively (Table 4.3). The decreased self-produced
rate from meat and milk consumption indicated that the local herders and farmers
relied less on their grasslands for food consumption, but this was achieved by placing
some of the pressure of their food consumption on other areas that supplied imports of
food and other materials. Therefore, household food consumption began to depend
less on the available land and more on market factors. From a nutritional perspective,
residents of Inner Mongolia are generally well nourished, even for low-income
families (Xie et al. 2006). The food being consumed is also becoming more diverse,
and this can encourage both grassland conservation and human health.
4.5 Conclusions
Ecosystem degradation, urbanization and the enforcement of the restoration policy
have greatly impacted rural life and the use of grasslands. Three main conclusions can
be drawn from the results of the survey:
(1) The analysis of household livelihoods and dependence on grasslands revealed
that the implementation of grassland conservation policies had a strong impact on the
livelihoods and security of households in three banners of Inner Mongolia. Both
household-initiated adaptation and government-guided adaptation helped households
to cope with the changes they were forced to endure. The main responses involved
leasing of pasture, decreasing the number of livestock, adopting seasonal grazing
supplemented by fodder purchases, increasing the intensity of livestock production,
forming cooperative associations, seeking non-farming income sources and changing
food and fuel consumption patterns. Table 4.4 summarizes the changes and household
responses.
(2) This chapter analysed the dependence of household livelihoods on local
grasslands and found that grasslands still provide vital functions. The annual
household income and employment based on agricultural land still depended heavily
on local grasslands, and most households owned some livestock, which they raised to
sell for income or for personal consumption, especially in the West Ujimqin Banner
and the Zhengxiangbai Banner. However, from 1995 to 2010 (before and after the
implementation of the grassland conservation policy), the household dependence on
local grasslands generally decreased, indicating a transition from traditional pastoral
grazing to controlled grazing, modern raising of dairy cattle (intensive animal
husbandry), diversification of income sources and decreases in land-based
employment and in the household food and fuel consumption from grasslands. These
changes increased the diversity of livelihoods and increased both household resilience
and environmental sustainability.
(3) Despite this diversification, neither the government-stimulated adjustments
nor household-initiated adaptations have liberated households from their dependence
on the grasslands. However, most respondents reported a strong willingness for their
family‘s next generation to move to a city to improve their education and employment
opportunities.

77
Table 4.4 Changes in household dependence on local grasslands from 1995 to 2010
Indicators Sub-Indicators
Change
from 1995
to 2010
Explanations
Improved
social
relations
Leasing of
pasture ↑↓
Leasing allows the owners of the grassland to
decrease their dependence on the land, while
increasing the leaseholder‘s dependence on the
land.
Formation of
cooperative
associations ↑
Social connections were enhanced by the
formation of cooperative associations.
Controlled
animal
husbandry
Number of
livestock ↓
The decreased number of livestock per
household led to decreased pressure on the
grasslands to provide forage or fodder.
Changes in
species ↓
Herders and farmers decreased the number of
goats and sheep and increased the number of
cattle. Because modern raising of dairy cattle
can produce a more diverse and stable income
by making both meat and milk products
available, it represents a more cost-effective
use of the grasslands.
Stall-fed
livestock ↓
Stall feeding increased fodder purchases and
the utilization of crop residues to replace grass
fodder.
Income- and
employment-
based
dependence
ratios
Income (farm
vs. non-farm
income) ↓
Diversified income sources indicated the
increased flexibility of livelihoods, and
grasslands were no longer the only resources
that provided income.
Employment
(land-based vs.
non-land based) ↓
Increased labour engaged in non-land-based
employment decreased the dependence on the
grasslands.
Food and
fuel
consumption
Food
consumption ↓
The transition from a diet dominated by meat
to a more diverse diet was accompanied by
purchasing more food from markets, thereby
decreasing the meat consumption with less
intensive use of the grasslands, but shifted
some of this ecological footprint to other areas.
Fuel
consumption ↓
Fuel consumption patterns changed, with
decreased use of biofuels (dried dung,
firewood) and increased use of coal, electricity
and gas; thus, the fuel consumption was mostly
placed on mining or wind power generation
plants that provided these resources.
Our findings raise new concerns. For example, as increasing numbers of residents
abandon the grasslands, there may come a time when nobody remains to use or
manage the grasslands. Since the grasslands have coevolved with nomadic herders for
millennia, this could lead to significant negative ecological effects; although
vegetation communities are likely to recover in response to reduced human pressure,
they may not recover to something that resembles their original state. Thus, future
grassland management will need to emphasize sustainable use of grasslands.
78
Within Inner Mongolia, basic management of most natural resources is weak and
needs to be improved before sustainable management will be possible at the village or
household level. Our results show how livelihood analysis provides a new perspective
on resource and ecosystem management, especially in terms of linking micro-level
household livelihood responses to macro-level policies. This approach provides
insight into how new resource management strategies may differentially affect
households. Further research will be required to fully understand the impacts of the
policy-induced changes, with special attention to expanding livelihood diversity,
enhancing resilience against environmental and economic stresses and advancing the
urbanization process to improve the quality of life of grassland residents and reverse
grassland degradation.

79
CHAPTER 5
Chapter 5: Comparison of ecosystem services provided by
grasslands with different utilization patterns
Based on:
Du B., Zhen L., Hu Y., Yan H., De Groot R., Leemans R. Comparison of ecosystem
services provided by grasslands with different utilization patterns in China‘s Inner
Mongolia Autonomous Region. Journal of Geographical Sciences 28(10): 1398-1414

80
Abstract:
Although several previous studies in Inner Mongolia Autonomous Region (IMAR)
examined the effects of ecological conservation on the delivery of ecosystem services,
they were often limited in scope (few ecosystem services were assessed) and often
suffered from confounding by spatial variation. In this chapter, the impact of
conservation measures (changes in grassland utilization patterns) on the provision of
selected ecosystem services was examined at three study sites in IMAR (Hulun Buir,
Xilin Gol and Ordos). Five utilization patterns were examined in this chapter: no use
(natural grasslands), light use, moderate use, intensive use, and recovery sites
(degraded sites protected from further use). Through household surveys and
vegetation and soil surveys, the differences in ecosystem services among the different
grassland utilization patterns were measured. We also identified spatial factors that
confounded the quantification of ecosystem services in the different types of
grasslands (meadow steppe, typical steppe and semi-desert steppe). The results of this
chapter show light use generally provided higher levels of ecosystem services than
intensive use and no use, with the main differences in the supporting ecosystem
services. Surprisingly, we found no consistently positive impacts of strict
conservation activities across the sites, since the results varied spatially and with
respect to differences in the land-use patterns. Our result suggests that appropriate
grassland utilization patterns can enhance the supply of ecosystem services and reduce
negative effects on both household livelihoods and the environment.
Keywords: Ecosystem Services, Grasslands Utilization Pattern, Natural Resource
Management, Soil, Vegetation, Household Livelihoods

81
5.1 Introduction
Ecosystem services are the benefits that people derive from ecosystems, and represent
the conditions and processes through which ecosystems and the species they contain
sustain and satisfy the needs of human life (Daily 1997; Deng et al. 2016). The rapid
economic growth that has occurred since the 1950s has led to serious environmental
threats caused by humans, as we have consumed the services provided by natural
ecosystems more rapidly and extensively than in any comparable period of human
history. As a result of this unsustainable use, the Millennium Ecosystem Assessment
(2003) reported that 15 of the world‘s 24 ecosystem services are declining. As these
services are essential for human well-being, understanding the interactions between
humans and their ecological environment is increasingly urgent. (Du et al. 2014; Liu
et al. 2007). Such interactions result from the consumption and utilization of
ecosystem services.
The analysis of ecosystem services has become an important source of data that
support policy development and the management of natural resources (Crossman et al.
2013). The analysis of ecosystem services commonly focuses on the supply of
immediate, direct benefits to humans, such as provisioning services (Millennium
Ecosystem Assessment 2005), and decision-making therefore ignores the regulating
and supporting services that permit these provisioning sources to exist (Abson &
Termansen 2011). However, shifts in management philosophy towards maintaining
the regulating and supporting services are increasingly advocated given the threats
these services pose to the continued supply of provisioning services as a result of
climate change and human interventions. This increasing understanding of the
interdependencies among services have led managers to understand the need to seek
compromises for the trade-offs among the different services (Prober et al. 2012).
A key element for the maintenance of multiple ecosystem services is to identify and
account for changes in the intensity of land-use patterns (e.g. plant cultivation,
forestry, livestock activities) in the policy development process. Indeed, these patterns
depend on several services (Power 2010). However, the changes associated with the
development of these patterns often have important negative impacts on ecosystem
services in the medium and long term that impair the land‘s ability to continue
sustaining such activities (Kareiva et al. 2011; Raudsepp-Hearne et al. 2010; Swinton
et al. 2007). To maintain multiple ecosystem services, it‘s necessary to seek an
optimal spatial allocation of human activities that will minimize their negative
environmental impacts. Growing recognition of the need for such analyses has led to
the incorporation of ecosystem analysis as a mandatory component of ecosystem
management in many countries (Pan et al. 2013). In addition, there is also a critical
need for new studies that reveal the simultaneous changes in provision of multiple
services so that managers can better understand the trade-offs involved in the delivery
of ecosystem services and look for solutions and synergies (Bennett et al. 2009).
Unfortunately, analyses of multiple ecosystem services are problematic. For instance,
researchers are typically constrained in the number and range of services they can
analyse due to a lack of available datasets at relevant scales. Focusing on only two or
three indicators (such as remote-sensing data for net primary productivity) runs the
risk of creating an incomplete or distorted picture of the full range of services that
different ecosystems or land-use types provide. Most research has been theoretical,
which results in excessive reliance on imperfect proxies for ecosystem services; for
example, soil carbon stocks are often used as a proxy for climate regulation services.
82
This approach limits and constrains the findings (Castro et al. 2015). In current
research, a lack of focus on supporting services has made it especially difficult to
compare different utilization patterns due to a mismatch of the scales of analysis for
different services.
To solve some of these problems and improve the support for developing resource-
management policy in the grasslands of Inner Mongolia Autonomous Region (IMAR),
this chapter aimed to reduce the bias that results from focusing on too few services.
To do so, we analysed these grasslands, which are highly vulnerable to human
activities, to provide a more comprehensive understanding of the relationships
between natural resource conservation actions (which result in different land
utilization patterns) and the resulting impacts on ecosystem services. a household
survey was performed to understand the context for residents of this region,
performed vegetation and soil surveys, and obtained expert opinions to (1) identify the
major ecosystem services provided by IMAR‘s grassland ecosystem; (2) classify the
grassland utilization patterns; and (3) assess the ecosystem services and their
variations among grasslands in different geographic locations and with different
utilization patterns. The analysis of this chapter included both sites that are managed
for nature conservation and sites with a range of utilization intensities in three parts of
IMAR with different geographic characteristics. The results of our research will
improve grassland management in the study area by accounting for both ecological
conservation and the livelihoods of residents of the region.
5.2 Study area
Typical steppe and meadow steppe are the major types of grassland ecosystem in
IMAR, and are most commonly used for grazing and animal production (Kang et al.
2007). The local people depend mainly on animal husbandry, and the grassland
ecosystems supply almost all of the forage needed for their livestock‘s consumption;
thus, these vegetation types support the dominant livelihood of the region‘s residents
(Zhen et al. 2010a). However, the grasslands of IMAR have been experiencing
degradation for decades that is directly threatening both the environment and the
sustainability of regional socioeconomic development. To reverse the increasing
tendency toward grassland degradation, national and local governments have
implemented a series of ecosystem conservation policies and countermeasures to
alleviate the anthropogenic stresses on the ecosystems.
The most important of these measures, which has been implemented in heavily
degraded areas, aims to return pastures to grassland. The policy was implemented in
1998 and extended throughout the region after several years‘ experience. The policy
included four measures (NDRC 2014):
1. Seasonal grazing allows grazing of pastures only during a certain season (e.g.
summer), typically throughout the period of grass growth from April to November.
During the winter, herders feed livestock indoors using conserved forage. This
approach has been broadly implemented, but especially in slightly degraded
grassland, such as that in Hulun Buir.
2. Rotational grazing has been implemented in slightly and moderately degraded
grassland, mostly in Xilin Gol but also on a small scale in Hulun Buir. In this
measure, the grassland is fenced and divided into paddocks that are then used in
rotation, with the goal of leaving time for vegetation recovery.

83
3. Grazing prohibition is mainly carried out in intensely degraded grassland,
especially in Ordos, to encourage grassland recovery. Because grazing prohibition
could cause high economic losses by reducing the number of livestock a resident can
support and can lead to a requirement for high economic inputs due to the need to
purchase fodder, a fourth measure was implemented.
4. Livestock-rearing control has the objective of lowering the impact on pastures
by limiting the number of livestock allowed to graze in an area. Xilin Gol has been
strongly influenced by this last measure. The number of livestock is defined based on
the carrying capacity of local grasslands, and nomadic grazing is prohibited and
replaced by indoor rearing. To implement this measure, grassland fencing has been
widely performed.
Figure 5.1 Location of the study area and map of the study sites. (Grassland types: high-cover,
vegetation cover >50%; medium-cover, vegetation cover between 25% and 50%; low-cover,
vegetation cover <25%. Numbers in the inset maps refer to the study plot numbers.)
5.3 Materials and methods
5.3.1 Identifying grassland utilization patterns
Ecosystems may change their state in response to geographic variation, the degree of
grassland utilization, and indirect impacts via management responses such as changed
grazing regimes. By considering these factors, five grassland utilization patterns have
been defined: no use, light use, moderate use, intensive use and recovery. Multiple
methods were used to identify the grassland utilization patterns (Table 5.1):
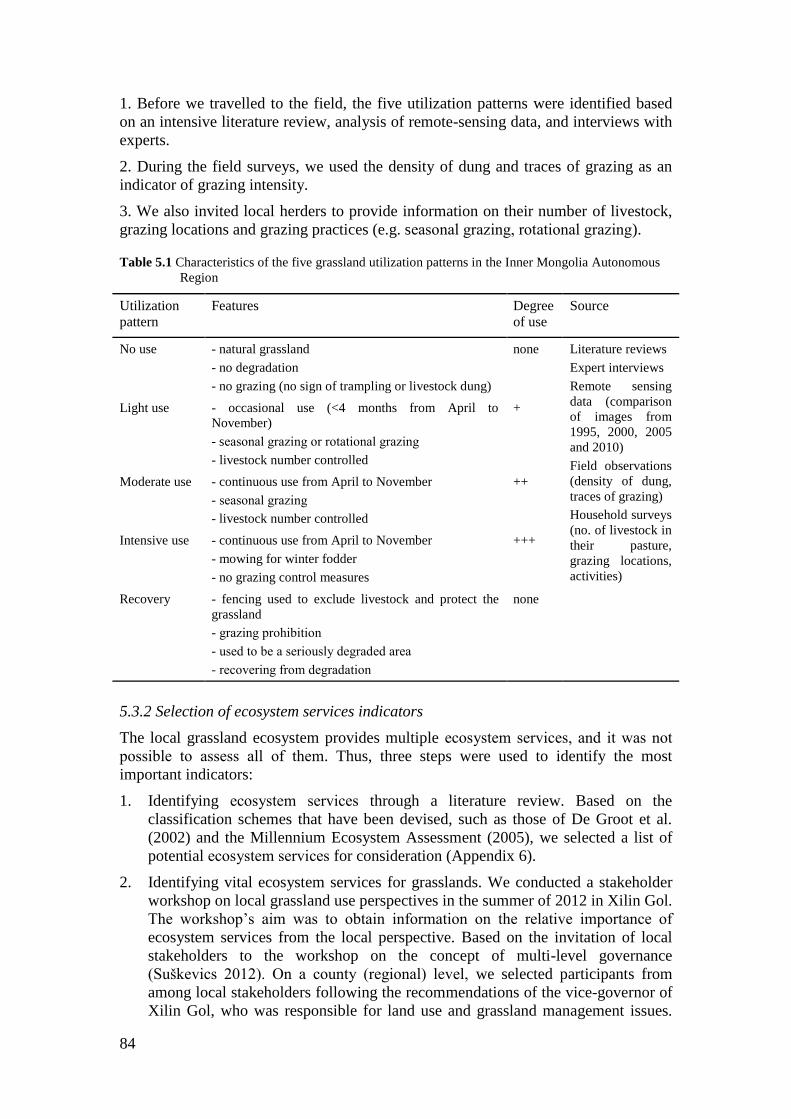
84
1. Before we travelled to the field, the five utilization patterns were identified based
on an intensive literature review, analysis of remote-sensing data, and interviews with
experts.
2. During the field surveys, we used the density of dung and traces of grazing as an
indicator of grazing intensity.
3. We also invited local herders to provide information on their number of livestock,
grazing locations and grazing practices (e.g. seasonal grazing, rotational grazing).
Table 5.1 Characteristics of the five grassland utilization patterns in the Inner Mongolia Autonomous
Region
Utilization
pattern
Features Degree
of use
Source
No use - natural grassland
- no degradation
- no grazing (no sign of trampling or livestock dung)
none Literature reviews
Expert interviews
Remote sensing
data (comparison
of images from
1995, 2000, 2005
and 2010)
Field observations
(density of dung,
traces of grazing)
Household surveys
(no. of livestock in
their pasture,
grazing locations,
activities)
Light use - occasional use (<4 months from April to
November)
- seasonal grazing or rotational grazing
- livestock number controlled
+
Moderate use - continuous use from April to November
- seasonal grazing
- livestock number controlled
++
Intensive use - continuous use from April to November
- mowing for winter fodder
- no grazing control measures
+++
Recovery - fencing used to exclude livestock and protect the
grassland
- grazing prohibition
- used to be a seriously degraded area
- recovering from degradation
none
5.3.2 Selection of ecosystem services indicators
The local grassland ecosystem provides multiple ecosystem services, and it was not
possible to assess all of them. Thus, three steps were used to identify the most
important indicators:
1. Identifying ecosystem services through a literature review. Based on the
classification schemes that have been devised, such as those of De Groot et al.
(2002) and the Millennium Ecosystem Assessment (2005), we selected a list of
potential ecosystem services for consideration (Appendix 6).
2. Identifying vital ecosystem services for grasslands. We conducted a stakeholder
workshop on local grassland use perspectives in the summer of 2012 in Xilin Gol.
The workshop‘s aim was to obtain information on the relative importance of
ecosystem services from the local perspective. Based on the invitation of local
stakeholders to the workshop on the concept of multi-level governance
(Suškevics 2012). On a county (regional) level, we selected participants from
among local stakeholders following the recommendations of the vice-governor of
Xilin Gol, who was responsible for land use and grassland management issues.
85
On a village (local) level, we asked the village headmen if they were interested in
joining the workshop during a household survey in Xilin Gol that occurred
shortly before the workshop. The final group of invitees included a mixed group
of 10 participants (three village headmen and seven county officers). Based on
the list of ecosystem services identified in step 1, we asked the stakeholders to
assign weights that represented the perceived importance of each ecosystem
service (very important, important and less important). Based on the results of
this workshop, seven key ecosystem services were identified: three provisioning
services (food, raw materials including fodder and fuel), two regulating services
(soil retention and soil nutrients), and two supporting services (primary
production and habitat). These were selected based on their high importance to
sustain rural socioeconomic activities and to prevent negative environmental
impacts on the local grasslands.
3. Selecting indices for assessing the ecosystem services identified in step 2. Meat is
the major food provisioning service provided by the grassland ecosystem, and can
be represented based on the number of livestock per household. Beef and mutton
were the two major types of meat produced in the study area. The raw material
provisioning service can be quantified as the amount of fodder consumed by local
livestock. The fuel provisioning service was based on the fact that the livestock
produced dung, which was dried and used as a traditional local fuel source.
Regulating services represent benefits obtained from regulation of the
environment and ecosystem processes. In this category, soils are considered the
primary element (Millennium Ecosystem Assessment 2005). Many studies have
indicated that extensive degradation of IMAR‘s grasslands has been accompanied
by decreased regulating services, such as loss of soil nutrients and increased soil
erosion and desertification (e.g. Zhang et al. 2013). We chose soil bulk density,
soil water content and soil nutrient contents as the site-specific indicators of the
regulating services. Supporting services were defined as services necessary for
the production of ecosystem functions. The most important product of IMAR‘s
grasslands in is livestock, and two main factors control the number of livestock:
primary production and habitat. To avoid the bias that can result from using a
single indicator, we divided primary production into aboveground biomass and
the proportion of this biomass that is edible. Similarly, because grasses are the
dominant vegetation type in the grasslands, we used three biodiversity indicators
to quantify the habitat characteristics: the Margalef, Shannon-Wiener and Pielou
indices, which represent species richness, diversity and evenness, respectively.
These indices are detailed in Section 5.3.3 and Table 5.2 summarizes the results
of this selection process.
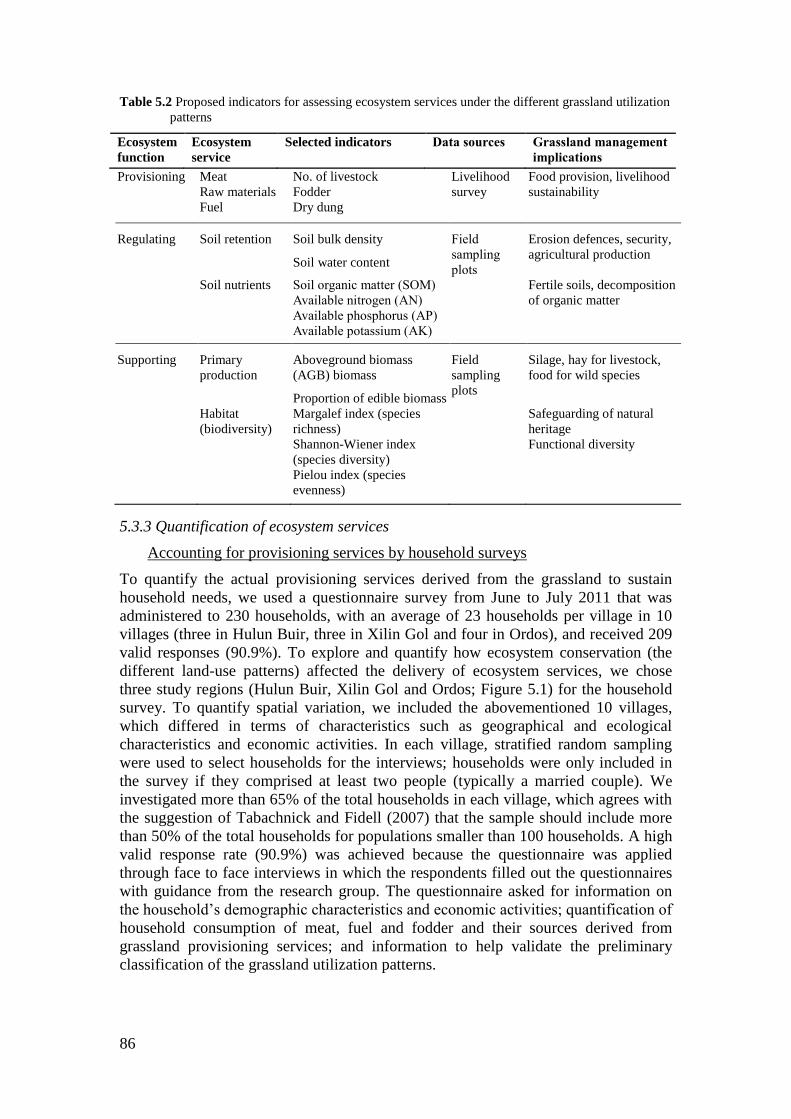
86
Table 5.2 Proposed indicators for assessing ecosystem services under the different grassland utilization
patterns
Ecosystem
function
Ecosystem
service
Selected indicators Data sources Grassland management
implications
Provisioning Meat No. of livestock Livelihood
survey
Food provision, livelihood
sustainability Raw materials Fodder
Fuel Dry dung
Regulating Soil retention Soil bulk density
Soil water content
Field
sampling
plots
Erosion defences, security,
agricultural production
Soil nutrients Soil organic matter (SOM)
Available nitrogen (AN)
Available phosphorus (AP)
Available potassium (AK)
Fertile soils, decomposition
of organic matter
Supporting Primary
production
Aboveground biomass
(AGB) biomass
Proportion of edible biomass
Field
sampling
plots
Silage, hay for livestock,
food for wild species
Habitat
(biodiversity)
Margalef index (species
richness)
Shannon-Wiener index
(species diversity)
Pielou index (species
evenness)
Safeguarding of natural
heritage
Functional diversity
5.3.3 Quantification of ecosystem services
Accounting for provisioning services by household surveys
To quantify the actual provisioning services derived from the grassland to sustain
household needs, we used a questionnaire survey from June to July 2011 that was
administered to 230 households, with an average of 23 households per village in 10
villages (three in Hulun Buir, three in Xilin Gol and four in Ordos), and received 209
valid responses (90.9%). To explore and quantify how ecosystem conservation (the
different land-use patterns) affected the delivery of ecosystem services, we chose
three study regions (Hulun Buir, Xilin Gol and Ordos; Figure 5.1) for the household
survey. To quantify spatial variation, we included the abovementioned 10 villages,
which differed in terms of characteristics such as geographical and ecological
characteristics and economic activities. In each village, stratified random sampling
were used to select households for the interviews; households were only included in
the survey if they comprised at least two people (typically a married couple). We
investigated more than 65% of the total households in each village, which agrees with
the suggestion of Tabachnick and Fidell (2007) that the sample should include more
than 50% of the total households for populations smaller than 100 households. A high
valid response rate (90.9%) was achieved because the questionnaire was applied
through face to face interviews in which the respondents filled out the questionnaires
with guidance from the research group. The questionnaire asked for information on
the household‘s demographic characteristics and economic activities; quantification of
household consumption of meat, fuel and fodder and their sources derived from
grassland provisioning services; and information to help validate the preliminary
classification of the grassland utilization patterns.

87
Assessing regulating services by investigating soil properties
We quantified regulating and supporting services by means of a vegetation and soil
survey in June and July 2011, at the same time as the household survey. We
established sampling plots at 16 sampling sites (Table 5.3) to provide an estimate of
the spatial variation in soil and vegetation characteristics; these included plots in
semi-desert steppe (at 5 locations in Ordos), typical steppe (at 4 locations in Xilin Gol)
and meadow steppe (at 7 locations in Hulun Buir). The vegetation surveys in June and
July were conducted during the key growth period for the local vegetation. There
were five no use sites, three light use sites, two moderate use sites, two intensive use
sites (due to regional policy, only in Hulun Buir) and four recovery sites.
At each site, soil samples were collected from three soil profiles to determine soil
properties to a depth of 30cm. Soil samples were carefully cleaned to remove plant
materials and organic matter, then were air-dried and sieved through a 2-mm mesh to
extract coarse materials. The three replicates were then carefully mixed to produce a
single bulked sample. Analysis of soil properties was then conducted at the Chinese
Academy of Sciences physics and chemistry laboratory in Beijing. Each mixed soil
sample was divided into two parts. One sub-sample was oven-dried at 105°C to
constant weight to measure the bulk density and gravimetric soil water content. The
other sub-sample was ground to a final size of 1 mm in a ball mill before analysis of
the soil organic matter (SOM), available phosphorus (AP), available potassium (AK)
and available nitrogen (AN) contents. Soil properties were determined following
standard protocols (Bao 2000; Brown 1993).
Table 5.3 Basic characteristic of the study plots
Location Plota
number
Longitud
e (°N)
Latitud
e (°E) Tb (℃) Pc (mm)
No. of
species Type of grassland Soil type
Utilization
intensity
Hulun Buir 101 119.8 48.89 -1 329.5 22 Meadow steppe medium /light loam None
102 119.81 48.82 -0.9 334.0 17 Meadow steppe medium /light loam Intensive
103 119.77 48.77 -0.8 336.5 44 Meadow steppe medium/light loam Moderate
201 119.71 48.72 -0.7 338.3 32 Meadow steppe medium/heavy loam None
202 119.68 48.72 -0.7 337.5 33 Meadow steppe heavy/medium loam None
203 119.79 48.8 -0.8 334.9 16 Meadow steppe light/sandy loam Intensive
204 119.74 48.81 -0.9 333.3 42 Meadow steppe medium/light loam Light
Xilin Gol 301 115.14 42.33 3.3 217.0 23 Typical steppe sandy loam Light
401 114.88 42.21 3.4 210.2 10 Typical steppe light/sandy loam Recovery
402 114.95 42.22 3.4 210.9 15 Typical steppe light/sandy loam, Moderate
403 115.12 42.23 3.3 217.6 24 Typical steppe light loam None
Ordos 501 109.79 39.84 7.1 248.1 20 Semi-desert steppe light loam None
502 109.32 39.92 7.2 219.8 19 Semi-desert steppe sandy loam Recovery
503 109.92 39.36 7.1 230.1 20 Semi-desert steppe dense sand, sandy loam Recovery
504 109.72 39.34 7.1 225.6 26 Semi-desert steppe sandy loam, dense sand Light
505 109.87 39.69 7.1 247.5 17 Semi-desert steppe light loam, sandy loam Recovery
a Locations of the plots are shown in Figure 5.1.
b T is the annual average temperature (°C), were obtained from meteorological stations in IMAR
in 2011 c P is the annual average precipitation (mm), were obtained from meteorological stations in IMAR
in 2011
88
Assessing supporting services based on vegetation traits
To quantify the vegetation characteristics, the aboveground biomass (AGB) was
harvested in three sub-plots (each 1×1m) at each plot, with similar topography and
exposure to sunlight and with the sub-plots separated by every 10 m. All living
vascular plants in each quadrat were sorted according to species. Subsequently, the
plant height, vegetation cover, number of individuals and density (no. individuals per
m2) were determined. AGB was determined by clipping the plants at ground level, and
was measured after oven-drying at 65±5°C for 48h. The proportion of edible biomass
was determined based on knowledge of the local species that could be consumed by
the local livestock; this proportion equalled AGB for all edible species divided by
total AGB.
The grassland production data (AGB and the proportion of edible biomass) were used
directly to indicate supporting services for primary production. In addition, three
diversity indices were calculated to represent the habitat ecosystem service:
The Shannon-Wiener index (H) was calculated as follows (Bakelaar and Odum
1978):
𝐻 = −∑ (𝑃𝑖ln𝑃𝑖)𝑠𝑖=1 (Eq. 5.1)
Where S is the number of species and Pi is the relative importance of species i (its
proportion of the total number of species). The relative importance of species is
calculated as follows:
𝑃𝑖 = 𝑖 ⁄ (Eq. 5.2)
Where Ni is the number of individuals of species i, and N is the total number of
individuals of all species in the quadrat.
The Margalef index (D) was calculated as follows:
( 1) / lnD S N (Eq. 5.3)
The Pielou index (E) was calculated as follows:
ln( )
HE
S (Eq. 5.4)
5.4 Results and discussion
5.4.1 Provisioning services that support herder livelihoods
Grasslands produce three main products that sustain the livelihood of herders: meat
(mutton and beef), fodder (grass) and biofuel (dry dung). All three goods are directly
related to the number of livestock, and the results therefore differed greatly among the
three areas due to the different numbers of livestock per household (Table 5.4). In
Hulun Buir, herding of sheep (an average of 52 per household) and cattle (18 per
household) was the major economic activity. A smaller number of cattle (an average
of 4.2 per household) and sheep (2.4 per household) dominated economic activity in
Xilin Gol. The productivity for livestock production per household in Xinlin Gol was
only around 10% of Hunlun Buir (76.3 per household vs. 8.8 per household). In
Ordos, a few cattle (an average of 0.8 per household) and sheep (2.4 per household)
are raised, primarily for breeding. In Ordos, households chose to raise many smaller
animals than in the other areas, such as goats (an average of 6.0 per household) and

89
chickens (16.9 per household). This seems to be a pragmatic response to government
initiatives that greatly reduce the consumption of fodder from ecosystems to prevent
further degradation of the semi-desert steppe.
Table 5.4 Household consumption of provisioning services
Consumptions Study site a
Hulun Buir
(n=66)
Xilin Gol
(n=71)
Ordos
(n=72)
Overall
(n=209)
Livestock (no. per household, % of total)
Sheep 52.0 (68.2) 2.4 (27.0) 2.4 (8.9) 18.0 (49.5)
Goats 3.2 (4.2) 0.2 (2.2) 6.0 (22.3) 3.2 (8.8)
Cattle 18.0 (23.6) 4.2 (47.2) 0.8 (3.0) 7.3 (20.1)
Chickens 3.0 (3.9) 2.0 (22.5) 16.9 (62.8) 7.5 (20.6)
Pigs 0.1 (0.1) 0.1 (1.1) 0.8 (3.0) 0.4 (1.1)
Total livestock 76.3 (100) 8.8 (100) 26.9 (100) 37.3 (100)
Meat (kg per capita per year, % of total)
Mutton-Beef 97.2 (76.3) 65.6 (82.5) 35.7 (39.5) 65.3 (66.4)
Other Meat b 30.1 (23.6) 13.9 (17.5) 54.7 (60.5) 33.1 (33.6)
Total meat 127.3 (100) 79.5 (100) 90.4 (100) 98.4 (100)
Fuel (per capita per year)
Dry dung (kg) 2878.6 265.2 199.4 1407.5
Coal (kg) 2063.6 690.6 922.4 1203.9
Electricity (CNY) 84.4 135.9 215.0 146.9 a n represents the number of households surveyed.
b Other meat includes pork, chicken and fish.
The results of household survey show that dry dung from livestock was an important
biofuel; it was widely used in all three areas, but especially in Hulun Buir, where the
annual per capita consumption was 2878.6 kg. The high consumption of dried dung
can be attributed to the higher numbers of sheep and cattle. Herders used biofuel to
support the needs of daily life, including cooking, heating and heating bath water. Due
to the great reduction in the number of livestock in response to government policies to
reduce grazing pressure on the ecosystem, with especially severe reductions in Xilin
Gol and Ordos, dry dung cannot satisfy the household demand so households use
more new forms of energy (e.g. coal, electricity) instead of dung. Table 5.5 shows
how the ecosystem services differed among the three regions and changed as a
function of the intensity of grassland use. Due to the government‘s conservation
policies, the no use and recovery grassland utilization patterns have totally lost their
provisioning services to herders. The intensive use pattern has the highest value of
provisioning services, followed by the moderate use and light use patterns.

90
Table 5.5 Scores for ranking ecosystem services in the three parts of the study area as a function of the grassland utilization patterns (intensities)
Ecological service
function
Ecosystem service Selected indicator Utilization patterns in Hulun Buir Utilization patterns in Xilin Gol Utilization patterns in Ordos
No use Light use Moderate use Intensive use No use Light use Moderate use Recovery No use Light use Recovery
Provisioning Food
Fuel
Raw materials
No. of livestock
Fuel
Fodder
NA (0)
NA (0)
NA (0)
+ (1)
+ (1)
+ (1)
+ + (2)
+ + (2)
+ + (2)
+ + + (3)
+ + + (3)
+ + + (3)
NA (0)
NA (0)
NA (0)
+ (1)
+ (1)
+ (1)
+ + (2)
+ + (2)
+ + (2)
NA (0)
NA (0)
NA (0)
NA (0)
NA (0)
NA (0)
+ (1)
+ (1)
+ (1)
NA (0)
NA (0)
NA (0)
Average score for provisioning services 0 1 2 3 0 1 2 0 0 1 0
Supporting Primary production AGB (g/m2)
Edible biomass (%)
164.4 (3)
100.0 (4)
130.7 (2)
99.5 (3)
178.0 (4)
83.1 (2)
61.8 (1)
37.2 (1)
129.3 (3)
99.7 (4)
210.9 (4)
65.1 (3)
101.4 (2)
42.4 (2)
81.8 (1)
23.0 (1)
95.0 (3)
96.8 (3)
81.0(2)
76.5(2)
129.4 (1)
44.4 (1)
Average score for primary production services 3.5 2.5 3 1 3.5 3.5 2 1 3 2 1
Habitat (biodiversity) Margalef index
Shannon-Wiener index
Pielou index
2.14 (2)
1.37 (2)
0.51 (2)
6.18 (4)
2.73 (3)
0.79 (3)
5.88 (3)
2.76 (4)
0.80 (4)
1.81 (1)
0.52 (1)
0.20 (1)
2.49 (2)
1.12 (1)
0.41 (1)
2.82 (3)
1.49 (3)
0.54 (3)
3.16 (4)
1.41 (2)
0.50 (2)
1.83 (1)
1.59 (4)
0.69 (4)
1.97 (2)
1.16 (2)
0.48 (1)
1.95(1)
1.21(3)
0.52(2)
2.03 (3)
1.10 (1)
0.62 (3)
Average score for habitat services 2 3.33 3.67 1 1.33 3 2.67 3 1.67 2 2.33
Regulating Soil retention Soil bulk density (g/kg)
Soil water content (%)
3.1 (4)
12.4 (4)
3.9 (1)
9.1 (2)
3.5 (3)
9.9 (3)
3.8 (2)
7.0 (1)
3.9 (4)
7.8 (4)
4.0 (3)
5.0 (2)
4.5 (1)
3.1 (1)
4.9 (2)
5.1 (3)
4.4 (3)
5.8 (3)
4.7(2)
3.6(1)
4.9 (1)
4.4 (2)
Average score for soil retention services 4 1.5 3 1.5 4 2.5 1 2.5 3 1.5 1.5
Soil nutrients SOM (g/kg)
AN (mg/kg)
AP (mg/kg)
AK (mg/kg)
40.2 (4)
136.6 (4)
4.8 (4)
162.4 (4)
20.3 (3)
114.0 (2)
3.6 (3)
128.0 (3)
15.7 (2)
98.1 (3)
3.04 (2)
101.6 (2)
9.0 (1)
92.3 (1)
2.9 (1)
97.5 (1)
38.4 (4)
103.0 (4)
3.7 (4)
21.1 (1)
27.9 (3)
57.7 (1)
2.5 (1)
78.0 (3)
26.8 (2)
60.1 (2)
2.6 (2)
74.6 (2)
12.9 (1)
76.7 (3)
3.1 (3)
87.7 (4)
13.7 (2)
19.6 (2)
3.6 (3)
41.3 (2)
8.8(1)
14.4(1)
2.5(1)
8.5(1)
14.3 (3)
31.5 (3)
3.4 (2)
57.8 (3)
Average score for soil nutrient services 4 2.75 2.25 1 3.25 2 2 2.75 2.25 1 2.75
Sum of rank scores for all services * 13.5 11.08 13.92 7.5 12.08 12 9.67 9.25 9.92 7.5 7.58
a NA means that the grassland is not used to provide the specified ecosystem services due to policy interventions or limitations of accessibility (Du et al. 2014).
Values in brackets represent the rank score for each service for the amount of ecosystem services provided: + low, ++ medium, +++ high. The scores are based on the
ranking of ecosystem services, and higher scores represent higher provision of services.
91
5.4.2 Regulating services in the different grassland utilization patterns
Soil retention
Along the transect from northeast to southwest, soil bulk density increased
(representing greater compaction), and SOM and the soil water content decreased
(Table 5.6), indicating a decreasing ecological service for soil retention. Soil bulk
density was lowest in Hulun Buir and highest in Ordos. Soil water content was
highest in Hulun Buir (meadow steppe) and lowest in Ordos (semi-desert steppe),
with a significant decreasing trend (P ≤ 0.05) along with decrease of precipitation and
incease of temperature (Table 5.3). In Hulun Buir, the no use pattern had the highest
soil water content (12%), and the intensive use pattern had the lowest soil water
content (7%). As in the case of Hulun Buir, soil water content decreased with
increasing intensity of grassland use. The soil water content also increased at the
recovery sites compared with the used sites (Table 5.5, Appendix 7).
Previous research in Xilin Gol (Yu et al. 2003) indicated that soil retention services
were and correlated with decreased desertification and ecosystem degradation, and
that increased soil retention services may have been responsible for a higher soil water
content. IMAR is characterized by an arid to semi-arid continental climate and
strongly imfluenced by tempreture and precipitaition. Thus, water shortages are
widely observed. From 2014 statistics, the region's total water resources were
412.1×10⁹ m
3, and have decreased at an average rate of 5% per year since the 1990s
(Inner Mongolia Statistics Bureau 2015b). Chinese statistics suggest that
desertification caused by drought is the most frequent meteorological disaster in the
study area (Inner Mongolia Statistics Bureau 2013). The drought mainly occurs
between May and September, the most inportant period for grass growth.
Soil nutrients
Soil nutrient contents (SOM, AN, AP and AK) represented nutrient regulation
services. AK and AN were highest in Hulun Buir and lowest in Ordos, and showed a
significant decreasing trend (P ≤ 0.05) along this transect (Table 5.6). SOM and AP
also decreased along this transect, but the trend was not significant (P ≥ 0.05). As was
the case for soil retention services, the soil nutrient regulating service decreased in
strength with increasing intensity of grassland use (Table 5.5). SOM, AN, AP and AK
were highest with no use in all three regions, but showed little difference between the
light and moderate use patterns in Xilin Gol. Ordos had fewer grassland use patterns,
and the highest SOM, AN, AP and AK values were achieved under the no use or
recovery patterns. This may be because Ordos is one of earliest demonstration sites
for the grassland restoration project in IMAR, which started around 2000.
Grazing intensity is one of the factors that most strongly influences the regulating
services as a result of the changes it causes in soil properties. Trampling by grazing
animals increases soil bulk density and the mechanical resistance to penetration, and
therefore decreases porosity, water infiltration, and aggregate stability (Evans et al.
2012). Zhou et al. (2010) reported that grazing and trampling by livestock caused
deterioration of soil physical properties (e.g. soil bulk density) and increased soil
vulnerability to erosion. The results for regulating services show that soil properties
(water content, SOM and available nutrients) improve with decreasing intensity of
grassland use. These results confirm that maintaining grazer densities at or below the
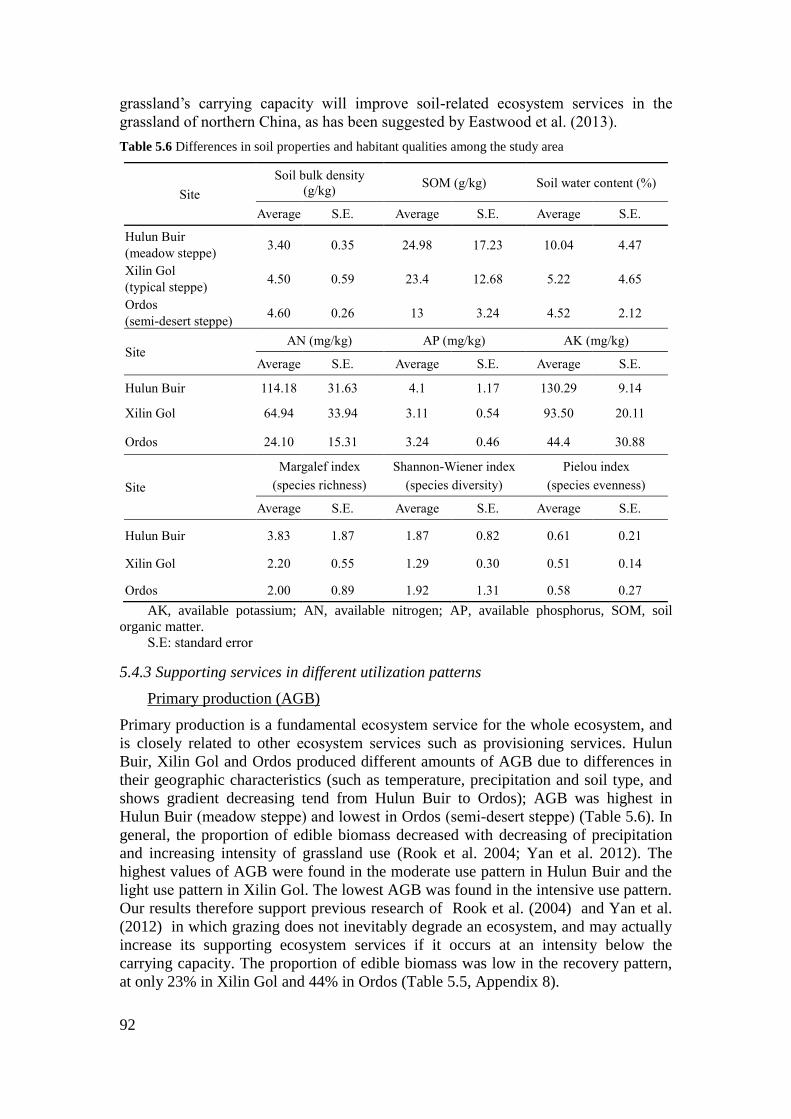
92
grassland‘s carrying capacity will improve soil-related ecosystem services in the
grassland of northern China, as has been suggested by Eastwood et al. (2013).
Table 5.6 Differences in soil properties and habitant qualities among the study area
Site
Soil bulk density
(g/kg) SOM (g/kg) Soil water content (%)
Average S.E. Average S.E. Average S.E.
Hulun Buir
(meadow steppe) 3.40 0.35 24.98 17.23 10.04 4.47
Xilin Gol
(typical steppe) 4.50 0.59 23.4 12.68 5.22 4.65
Ordos
(semi-desert steppe) 4.60 0.26 13 3.24 4.52 2.12
Site AN (mg/kg) AP (mg/kg) AK (mg/kg)
Average S.E. Average S.E. Average S.E.
Hulun Buir 114.18 31.63 4.1 1.17 130.29 9.14
Xilin Gol 64.94 33.94 3.11 0.54 93.50 20.11
Ordos 24.10 15.31 3.24 0.46 44.4 30.88
Site
Margalef index
(species richness)
Shannon-Wiener index
(species diversity)
Pielou index
(species evenness)
Average S.E. Average S.E. Average S.E.
Hulun Buir 3.83 1.87 1.87 0.82 0.61 0.21
Xilin Gol 2.20 0.55 1.29 0.30 0.51 0.14
Ordos 2.00 0.89 1.92 1.31 0.58 0.27
AK, available potassium; AN, available nitrogen; AP, available phosphorus, SOM, soil
organic matter.
S.E: standard error
5.4.3 Supporting services in different utilization patterns
Primary production (AGB)
Primary production is a fundamental ecosystem service for the whole ecosystem, and
is closely related to other ecosystem services such as provisioning services. Hulun
Buir, Xilin Gol and Ordos produced different amounts of AGB due to differences in
their geographic characteristics (such as temperature, precipitation and soil type, and
shows gradient decreasing tend from Hulun Buir to Ordos); AGB was highest in
Hulun Buir (meadow steppe) and lowest in Ordos (semi-desert steppe) (Table 5.6). In
general, the proportion of edible biomass decreased with decreasing of precipitation
and increasing intensity of grassland use (Rook et al. 2004; Yan et al. 2012). The
highest values of AGB were found in the moderate use pattern in Hulun Buir and the
light use pattern in Xilin Gol. The lowest AGB was found in the intensive use pattern.
Our results therefore support previous research of Rook et al. (2004) and Yan et al.
(2012) in which grazing does not inevitably degrade an ecosystem, and may actually
increase its supporting ecosystem services if it occurs at an intensity below the
carrying capacity. The proportion of edible biomass was low in the recovery pattern,
at only 23% in Xilin Gol and 44% in Ordos (Table 5.5, Appendix 8).
93
Habitat
Table 5.6 shows that habitat services were greater in the meadow steppe (Hulun Buir)
than in the typical steppe (Xilin Gol) and semi-desert steppe (Ordos). One of the most
important restrict factor is the geographic condition (e.g. Temperature and
precipitation) beside of the utilization patterns of grasslands.
Under the different grassland utilization patterns, diversity in Hulun Buir was highest
under light use, followed by moderate use, and then decreased sharply with
increasingly intensive use (Table 5.5, Appendix 8). However, the species richness
(Margalef index) and evenness (Pielou index) in Hulun Buir were both highest in the
moderate use pattern, with values slightly higher than those in the light use pattern.
Unlike in Hulun Buir, the species diversity and evenness of grassland in Xilin Gol
decreased with utilization intensity increasing from light to moderate use. This means
that the typical steppe (Xilin Gol) is more vulnerable than the meadow steppe to
intensive use of the grassland. In Ordos, grazing was restricted more than in the other
areas, so there was little difference in diversity among the different intensities of
grassland use.
In summary, the supporting services in Hulun Buir decreased with increasing
utilization intensity, which agrees with the results of Medina-Roldan et al. (2012),
who found that grassland biomass production and biodiversity decreased in grazing
areas because of overgrazing. In the present study, the proportion of edible biomass
was relatively low at the recovery sites, although the diversity and evenness of the
grassland were enhanced by conservation activities. Our results show that AGB and
the three diversity indicators did not always follow a gradient of increasing intensity
of grassland use in IMAR. For instance, the highest values of AGB and the Shannon
index were observed in the moderate use pattern in Hulun Buir and the light use
pattern in Xilin Gol. Xu et al. (2013) found that moderate grazing had positive effects
on seedling recruitment and vegetation diversity, but that heavy gazing may alter
community succession by affecting recruitment patterns.
5.4.4 Ranking of ecosystem services under different grassland utilization patterns
The results of ranking of ecosystem services under different grassland utilization
patterns (Table 5.5) show large spatial variation among the three areas. In Hulun Buir,
the moderate use pattern had the highest total score (i.e. the highest sum of the scores
for provisioning, regulating and supporting services), followed by the no use pattern;
these use patterns therefore provided the highest overall ecosystem services values.
The lowest values were for intensive use. In Xilin Gol, the no use pattern had the
highest total score, followed by the light use pattern, and these patterns therefore
provided the highest overall service values; the recovery pattern produced the lowest
rank score, and thus the lowest services. In contrast, the rank score in Ordos was
highest for no use, followed by recovery, but the scores did not differ greatly among
the three patterns.
Our data suggests that natural conservation (non-use) of grasslands should be
encouraged because it helps to deliver the greatest quantity of ecosystem services.
However, the evidence for this argument is weaker than might be expected, and is
sometimes equivocal. For example, the agricultural provisioning services (food, fuel
and fodder) tended to decrease with decreasing intensity of grassland use in IMAR.
Eigenbrod et al. (2010) also found that protected areas in England have high levels of
biodiversity and carbon storage, but low levels of recreation and agriculture services.

94
At a European scale, Burkhard et al. (2012) looked at the association between the
demand for ecosystem services and different CORINE land cover classes
(http://ec.europa.eu/agriculture/publi/landscape/about.htm), and found that habitat
classes that were important for conservation, such as peat bogs and natural grassland,
ranked highly for their supply of regulating services, but ranked low in terms of their
provisioning services. Our results also indicate that suitable use of grasslands can be
achieved by considering differences in the resilience and capacities of the different
grassland types, thereby offering more effective ways to protect the grassland
ecosystems. For instance, the meadow steppe has high resilience and tolerance of
human activities, so the moderate use pattern can be applied in this region. In contrast,
fragile ecosystems such as the semi-desert steppe in Ordos should be protected against
anything more than light use.
5.5 Conclusions
For sustainable management of ecosystems to provide services, analysing both the
ecological and socioeconomic elements of the ecosystem is necessary, since complex
interdependencies between humans and ecosystems strongly affect the provision of
ecosystem services. The analysis of this chapter shows how quantitatively accounting
for a greater number of ecosystem services than in many previous studies provided
important insights into differences among ecosystems in their ability (such as
precipitation, temperature and soil type) to tolerate human disturbance (different
degree of grassland utilization patterns) and still provide ecosystem services.
The results of this chapter demonstrate the value of a more holistic approach to the
management of grasslands such as those of IMAR. Specifically, they reveal that the
optimal utilization intensity differs among the regions, with the Hulun Buir grasslands
being able to tolerate a higher level of disturbance from human activities (moderate
use of grassland) than the other grasslands (light use or no use) and the Ordos
grasslands being able to tolerate the least disturbance (no use or recovery). Our results
also show how grassland utilization for livestock grazing had significant ecological
consequences (decrease of ecosystem services), but that there was an important
interaction between the geographic condition, grassland type and utilization intensity.
There were also trade-offs that must be carefully considered. For example, in the
Hulun Buir grassland, the ability (e.g. highest precipitation of over 300mm year-1
comparing with other areas of around 200mm year-1
) to tolerate a higher grazing
intensity before ecosystem services decreased allows the grassland to provide a
greater quantity of provisioning services but at the cost of decreased regulating and
supporting services. In future research, it will be necessary to find ways to identify the
key factors that determine these trade-offs so that managers can focus on optimizing
those factors.
95
CHAPTER 6
Chapter 6: Herders‘ willingness to accept versus the public
sector‘s willingness to pay for grassland restoration
Based on:
Zhen L., Li F., Yan H., Liu G., Liu J., Zhang H., Du B., Wu R., Sun C., Wang C. 2014.
Herders‘ willingness to accept versus the public sector‘s willingness to pay for
grassland restoration. Environmental research letters 9(4): 045003

96
Abstract:
This chapter describes two payments for ecosystem services (PES) programs to
restore grassland ecosystems in Inner Mongolia in Northern China. A key challenge is
to sustain the livelihood of local residents, who earn most of their income from
traditional animal husbandry. Total of 240 herders and 36 government representatives
was surveyed in 2 years. Contingent valuation and logistic regression were used to
analyse the resulting data. Since the PES implementation, income from cultivation
and animal grazing decreased, whereas income from compensation and off-farm
activities increased. The herders preferred an annual payment of 625 Chinese Yuan
(CNY) ha-1
for participating in conservation activities, but the government prefers to
provide 528 CNY ha-1
, resulting in an annual gap of 97 CNY ha-1
. The current too low
payments may lead some herders to expand their grazing into restricted grassland or
increase their number of animals, particularly if either payment program ends. The
herders were most concerned about their economic loss, whereas the government
considered both grassland restoration and income protection to be important. To
create an improved and sustainable PES scheme, this chapter recommend solutions
that will let the herders sustain their livelihood while conserving the grasslands. The
findings of this chapter will help to establish more effective PES schemes for the
grasslands of Inner Mongolia and similar regions.
Keywords: Eco-Compensation, Willingness To Accept, Willingness To Pay,
Contingent Valuation

97
6.1 Introduction
Grasslands located in arid and semi-arid areas are often characterized by high
ecological fragility and thus, high vulnerability to disturbance. There is growing
agreement that many ecosystem services in such grasslands are undergoing rapid
degradation due to overuse and misuse, and as a result of this trend, grassland
degradation and desertification are increasing (MEA 2005). In China, about 54% of
the natural grasslands in the arid north are experiencing at least moderate levels of
degradation due to the rapid socioeconomic development and population growth that
began in the 1980s, and the area of degraded or decertified land has expanded at an
annual rate of 2 × 10⁶ ha (Zhao et al. 2006). Because of the resulting decrease in
ecosystem services, this has also hindered regional economic development,
jeopardized the livelihoods of residents of the region, and endangered regional
ecosystems.
China‘s Inner Mongolia Autonomous Region (IMAR) is an important base for animal
husbandry and an important ecological barrier that conserves water and soil, stabilizes
the region‘s sandy soils against wind erosion, and preserves biodiversity (Yao et al.
2007). Between 1980 and 2000, IMAR‘s population increased by 26%, from 18.76 ×
106 to 23.72 × 10
6 (Table 6.1), while the number of livestock almost doubled, from
12.6 million to 24.2 million animals, mainly sheep. (Unless otherwise noted, all
statistics presented in this chapter were provided by the Statistical Bureau of the
IMAR) The available area of grassland per sheep unit decreased from 6.80 ha in 1950
to 1.27 ha in 2000, and the proportion of degraded grassland now ranges from 19 to
79%. The worst of the degraded grassland areas can be found in the region‘s Xilin Gol
League, where the population increased by 19%, from 764 000 in 1980 to 909 000 in
2000 (Table 6.1); during the same period, the number of livestock increased by 177%,
but the grassland productivity decreased by 30%, and the percentage of degraded
grassland increased from 48.6% in 1984 to 64% in 2000, of which about 27.5% is
severely degraded grasslands (Li et al. 2008; Bao 2009). In addition, natural disasters
such as heavy snowfall, drought, wind erosion, and insects damaged the already
vulnerable grasslands.
Table 6.1 Demographic information for the study region
Population (×104)
1980 1985 1990 1995 2000 2005 2010 2012
Xilin Gol 76.4 82.5 88.9 90.6 90.9 100.6 102.9 103.6
Inner Mongolia 1876.5 2015.9 2162.6 2284.4 2372 2403 2472.2 2481.7
This worsening situation has significantly affected the livelihood of local peoples,
who have started to look for alternative means to support their living. Damage to the
production of economic value and hence material welfare in the form of ecosystem
services is widely believed to results from a lack of institutions to guide the supply
and demand for ecosystem services (Costanza et al. 1997; Balmford et al. 2002). In
addition, institutional settings play a key role in shaping land cover and land use
(Prishchepov et al. 2012), which can also influence the provision of ecosystem
services. Payment for ecosystem services (PES) has been widely considered to be one
useful measure to deal with this problem (CCICED 2007).
98
To solve these problems and conserve the vast grasslands in its northern territory, the
Chinese government has adopted several measures, including PES. This form of eco-
compensation payment can be defined as ‗a type of institutional arrangement to
protect and sustainably use ecosystem services, and to adjust the distribution of costs
and benefits between different actors and stakeholders, mainly through economic
measures‘ (CCICED 2007). PES programs internalize the benefits associated with
enhancing or maintaining ecosystem services to ensure that land managers and other
providers of ecosystem services have incentives that agree with the interests of the
users of these ecosystem services (Arrow et al. 2000; Pagiola et al. 2005; van
Noordwijk and Leimona 2010). There has been an increasing number of publications
that describe China‘s PES program, but most of them focus on the sloping land
conversion program (SLCP)—the largest land retirement and reforestation program in
the world (e.g. Bennett 2008; König et al. 2014a; Zhen et al. 2013) SLCP uses a
public payment scheme that directly engages millions of rural households as core
agents of the project‘s implementation. Although PES schemes assume that
participation is voluntary, and that participants can negotiate a price that is acceptable
to them, this is not how the program has been implemented in practice; participation
is mandatory. Thus, as Bennett (2008) reported, some participants are likely to be
undercompensated (i.e. paid less than they would request if they had freedom to
negotiate the bid price). Any gap between the actual payments and what participants
would bid if they were free to choose would reveal an important problem with the
current approach, since voluntary participation requires what the participants consider
to be a fair payment. Xu et al. (2010) revealed that the program could have significant
implications for China‘s forests and remaining natural ecosystems, potentially
representing a 10–20% increase in the current national forest area, a roughly 10%
decrease in China‘s cultivated area, and a significantly positive impact on participant
income due to the program‘s payments. However, it seems likely that the program‘s
cost-effectiveness could be improved by targeting sites with the highest
environmental benefits and allowing payments to reflect the heterogeneous
opportunity costs faced by residents of the region, while also preventing farmers from
reconverting their land to cultivation.
The PES approach has been applied increasingly in both developed and developing
countries. Increasing attention has been paid to (1) the concepts, theory and
framework of PES (e.g. Wunder 2005, 2008; CCICED 2007; Engel et al. 2008; Zhen
and Zhang 2011); (2) assessments of the environmental impacts of PES programs
(Thornley 1998; Xu et al. 2006b; Munkhtsetseg et al. 2007; Wu et al. 2012); (3)
institutional and policy aspects that affect how to determine compensation schemes
(Ren et al. 2006; Wang et al. 2006); and (4) the stakeholders‘ willingness to pay
(WTP) for the PES scheme. In the latter case, examples include WTP for pollution
reduction (e.g. Zhen et al. 2011a); for protection of the Tapanti National Park and
forestry ecosystems in Costa Rica based on surveys of local residents, tourists and
companies (Bernard et al. 2009); and for environmental management while
developing the economy of China‘s Tianjin City (Zhai and Suzuki 2008). In addition,
researchers have studied (5) the impact of the conservation programs on local peoples,
such as the impacts of the presence of working land programs on land retirement in an
important agricultural region of the United States (e.g. Kling et al. 2005), on
biodiversity and conservation programs in Europe (e.g. Hawksworth and Bull 2008),
on urbanization and agricultural land-use in the Netherlands (Vermaat et al. 2008),
and on sedentarization and nomadic culture in China‘s Xinjiang Uyghur Autonomous
Region (Fan et al. 2013) and IMAR (Bao 2009). However, little attention has been
99
given to the people who are most likely to be affected by a policy‘s implementation in
China in terms of their preferences, perceptions and willingness to accept (WTA) a
PES scheme for protecting grasslands, as well as the public sector‘s WTP to
compensate those affected by PES projects based on the actual changes in their
livelihood caused by the project (e.g. Li and Li 2010; Wu et al. 2012).
In this chapter, the impacts of a top-down PES program designed by China‘s central
government on the livelihood of herders in IMAR, and examined their preferences for
key elements of the PES program design, including the payment type, amount and
means. The WTA of the herders and WTP of the relevant government agencies for
two local PES programs were also estimated. First, this chapter describes the PES
programs that have been implemented in the region. Next, the impact of these
programs on the income structure of the herders was assessed based on a survey of
households in the regions affected by the program, and the factors that influence this
structure and the WTP of local officials. Finally, this chapter discusses the main
conclusions that arise from the results and propose recommendations for an improved
PES design.
Once the Chinese government has designated land for protection under a PES
program, participation in the program became notably mandatory. Thus, analysis in
this chapter does not consider a hypothetical situation in which residents of the study
region have the option of not participating. Instead, the goals of WTA and WTP
analysis in this chapter were to compare WTA with the actual payments to learn
whether these payments are satisfactory, and to compare WTA with WTP to learn
whether the government recognizes dissatisfaction among program participants and is
willing (budget permitting) to improve their situation. These factors will have
important consequences for the long-term effectiveness of the programs.
6.2 PES programs implemented in the Xilin Gol League grassland of the Inner
Mongolia Autonomous Region
For this chapter, IMAR‘s Xilin Gol League was selected for a case study (Figure 6.1).
IMAR‘s population amounted to 24.871 million people in 2012. Agriculture, which is
currently the main land-use in the Xilin Gol League, is characterized by small scale
mixed subsistence farming systems with livestock production as an integral part
(Zhang et al. 2007; Zhen et al. 2010a). Grassland is the main land cover type in this
region, accounting for 86% of the total land area. In addition to agriculture, mining
and related industries are gaining in economic importance. In terms of land
ownership, China‘s land reform began in 1987 and the grasslands in Xilin Gol were
allocated under contract to collectives (haote in the local language) that consisted of
three to eight families, who shared the contracted grasslands for their grazing. In
1997, the grasslands were contracted to individual families based on the nearness of
the land to their settlements, and each family received usage rights for the lands that
were defined in a contract signed with the local government. To increase their income
and make best use of the grasslands, each family then increased the number of
animals they owned; during this period, the total number of sheep increased by 41.4%
in Xilin Gol, from 1727 in 1989 to 2442 in 1999 (Bao 2009). To prevent the animals
of other families from entering the contracted grasslands, each individual family built
fences around their land, leading to segmentation of the grasslands and
sedentarization of the herder families. As a result of the increased pressure on the
grassland ecosystem, degradation of the grasslands has been increasing seriously
since then (Bao 2009).
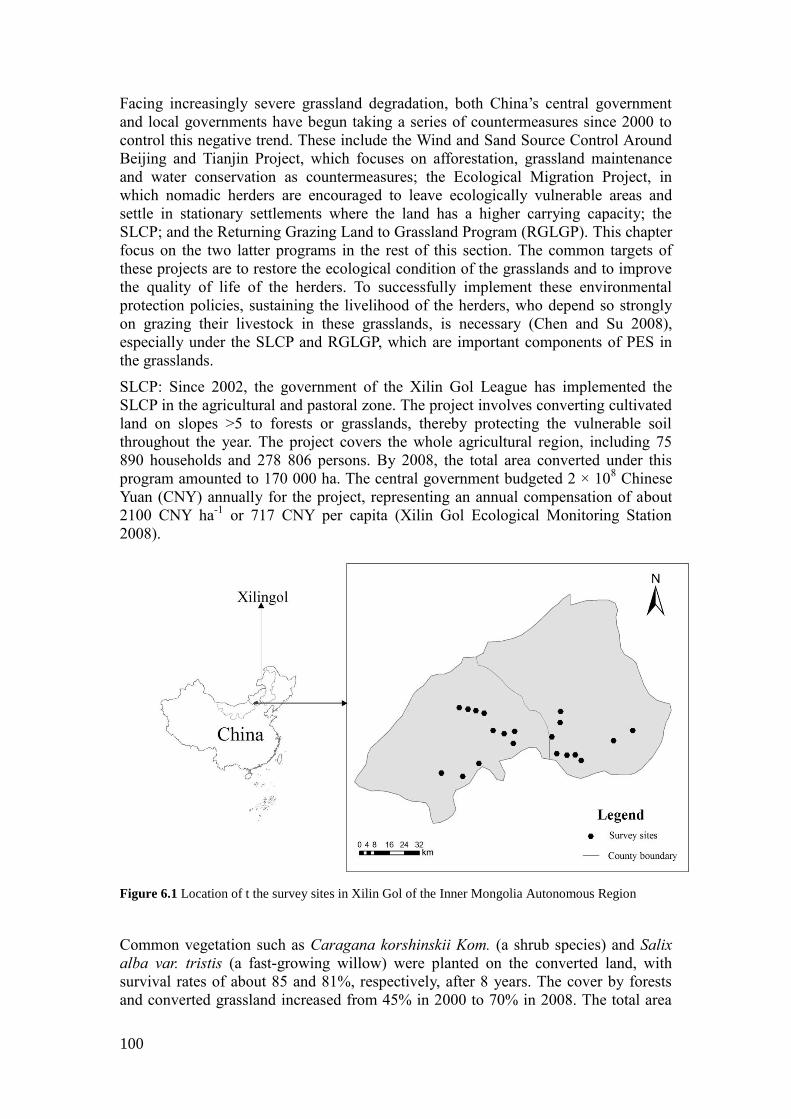
100
Facing increasingly severe grassland degradation, both China‘s central government
and local governments have begun taking a series of countermeasures since 2000 to
control this negative trend. These include the Wind and Sand Source Control Around
Beijing and Tianjin Project, which focuses on afforestation, grassland maintenance
and water conservation as countermeasures; the Ecological Migration Project, in
which nomadic herders are encouraged to leave ecologically vulnerable areas and
settle in stationary settlements where the land has a higher carrying capacity; the
SLCP; and the Returning Grazing Land to Grassland Program (RGLGP). This chapter
focus on the two latter programs in the rest of this section. The common targets of
these projects are to restore the ecological condition of the grasslands and to improve
the quality of life of the herders. To successfully implement these environmental
protection policies, sustaining the livelihood of the herders, who depend so strongly
on grazing their livestock in these grasslands, is necessary (Chen and Su 2008),
especially under the SLCP and RGLGP, which are important components of PES in
the grasslands.
SLCP: Since 2002, the government of the Xilin Gol League has implemented the
SLCP in the agricultural and pastoral zone. The project involves converting cultivated
land on slopes >5 to forests or grasslands, thereby protecting the vulnerable soil
throughout the year. The project covers the whole agricultural region, including 75
890 households and 278 806 persons. By 2008, the total area converted under this
program amounted to 170 000 ha. The central government budgeted 2 × 10⁸ Chinese
Yuan (CNY) annually for the project, representing an annual compensation of about
2100 CNY ha-1
or 717 CNY per capita (Xilin Gol Ecological Monitoring Station
2008).
Figure 6.1 Location of t the survey sites in Xilin Gol of the Inner Mongolia Autonomous Region
Common vegetation such as Caragana korshinskii Kom. (a shrub species) and Salix
alba var. tristis (a fast-growing willow) were planted on the converted land, with
survival rates of about 85 and 81%, respectively, after 8 years. The cover by forests
and converted grassland increased from 45% in 2000 to 70% in 2008. The total area

101
converted to forests amounted to 160 000 ha, of which 75% were ecological
restoration forests.
RGLGP: China‘s central government launched this project to optimize the utilization
of grassland resources. The project area covered 10.351×10⁶ ha, which amounts to
54% of the total grassland in the Xilin Gol League. The project had a budget of 1.59
×108 CNY from 2002 to 2007, and covered 56 towns and 582 villages, with a total of
56 228 households. The project includes three sub-measures: grazing prohibition,
seasonal grazing and rotational grazing. Grazing prohibition requires the installation
of livestock fencing and bans livestock from badly degraded areas for long periods to
allow recovery of the vegetation. Resting of the grazing land means breeding the
livestock indoors or in a fenced pasture for at least 40–60 days during the spring
season to prevent grazing of the grass plumules, thereby allowing them to recover.
Rotational grazing is a livestock production system in which livestock graze in one
portion of a pasture that has been divided into several paddocks. Livestock are
systematically moved from one paddock to another based on the growth of the forage.
By integrated both central and local government payment, the current annual
compensation awarded to herders is about 90-95 CNY ha-1
under grazing prohibition,
about 22.5 CNY ha-1
for seasonal grazing and rotational grazing, about 25 CNY ha-1
for having fewer animals per ha than the amount defined locally (i.e. 1.7 ha for one
sheep unit) to avoid overgrazing, and 150 CNY ha-1
for using improved grass species
to improve local fodder production. Thus, the current maximum amount paid to the
RGLGP herders is about 270 CNY ha-1
(because the 22.5 CNY ha-1 for seasonal
grazing and rotational grazing cannot be received simultaneously with the 90-95 CNY
ha-1
for grazing prohibition). This is far lower than the standard SLCP payment, in
part because the area of grassland is much larger than the area of sloping land that is
owned by the herders (Table 6.2).
Table 6.2 Proportion of total land resources accounted for by converted sloping land and the area in
which grazing is prohibited
Programs No. of
households
Area (ha/household)
Before project After project Land area affected
Cultivated
land Grassland
Cultivated
land Grassland Converted Grassland
Returning
Grazing Land
to Grassland
Program
79 0.20 89.3 0.20 53.6 0 35.7
Sloping land
conversion
program
105 1.18 17.1 0.47 17.1 0.71 0
Both projects 56 1.08 98.3 0.73 78.2 0.35 20.1
6.3 Data and methodology
The information from both secondary and primary sources was obtained. Secondary
information was derived from national and local statistical yearbooks and documents
provided by various government agencies such as the Statistics Bureau, Bureau of
Agriculture and Animal Husbandry, Bureau of Land Resources, Bureau of Forestry
and Monitoring Station of Grassland Ecosystem. Primary information was collected
through household surveys at the sites shown in figure 6.1. Selection criteria for these

102
sites included the dominance of livestock and agriculture production in local
economic development, location in a potential sandstorm source area that affects
Beijing (China‘s capital), and location in a region where both the SLCP and the
RGLGP have been implemented.
6.3.1. Surveys
Household survey
Based on these criteria, stratified random sampling (Weber and Tiwari 1992) was used
to select the villages in this study. In this process, villages that differed in terms of
characteristics such as income levels, number of animals raised (primarily sheep and
cows), and the distances to the nearest main road and to the capital city of the county
were specifically included. Total of 20 survey sites in 10 villages from 7 townships
(Figure 6.1) were selected. Then, simple random sampling (Weber and Tiwari 1992)
was used to select 240 households (ranging from 21 to 35 per village) to answer the
questionnaire, which amounted to a total of 135 herding households and 105 farming
households. These families represented 68–82% of the households in the selected
villages. The surveys were conducted from October to November 2008, and from July
to August 2012. The visited villages were loose collections of households, scattered
through a large area of pasture. The head of each household or a family member who
was familiar with the household were asked to answer the questions. To ensure correct
understanding of the questions, two to three local people (from the Mongolian ethnic
group) were hired to help us translate during the interviews. Completion of a
questionnaire required 1.0 to 1.5h.
Prior to the formal surveys, an informal preliminary survey was conducted by using
individual interviews and group discussions with herders and key informants to test
the designed questions and increase the validity of the results. The interviews included
questions in the following areas: (a) the socioeconomic characteristics of the
households, which related to the household composition, levels of education, land and
livestock owned, and income structure. (b) Their WTA compensation for grassland
conservation, and the preferences for key elements of the PES programs such as how
to determine the standard payment, the source of the payment funds and the means of
payment. Closed-ended questions were primarily used, but added open-ended
questions where there was an opportunity to expand on certain topics during the
interview.
Government survey
In China, PES projects are initiated by the government. The representatives of local
government agencies involved in grassland conservation were interviewed by using
pre-prepared questionnaires to learn about their WTP for grassland protection. The
questions were designed to determine how much they believed that households should
be paid for protection of grassland resources through grazing prohibition and
rotational grazing, with the goal of maintaining the household‘s livelihood. In
addition, the surveys gathered information about the standard payment rate, source of
the payment funds, means of payment and their perceptions of the current payment
schemes.
All relevant local government agencies were selected for the survey: the Xilin Gol
Development and Reform Commission, Xilin Gol County Council, Statistics Bureau,
Bureau of Agriculture and Animal Husbandry, Bureau of Land Resources, Bureau of
Forestry, Xilin Gol Grassland Monitoring Station, Ecological Management Office,

103
Station of Forest Management, Bureau of Environmental Protection, Bureau of Water
Resources, Inner Mongolian Grassland Monitoring Station and Inner Mongolian
Normal University. Altogether, total of 36 officials from 13 government departments
was interviewed. Each questionnaire took about 40 min to complete.
Statistical analysis
The impact of PES on the income structure of the households affected by the projects,
and their knowledge, perceptions and WTA were analysed, using version 16.0 of the
SPSS software (SPSS Inc., Chicago, IL). Specifically, descriptive statistics (mean
values, standard deviations and percentages for land-use and perceptions) were
calculated and independent-sample t-tests was used to identify significant differences
between groups. The multinomial logistic regression was also used to analyse the
relationships between WTA and household characteristics. Similar analyses were
performed for the WTP of government officials.
6.3.2. Calculation of WTA and WTP
Willingness to accept (WTA) represents the minimum amount that a person is willing
to accept to abandon a good or to tolerate something negative, such as pollution. In
this study, WTA represented the amount a respondent was willing to accept to limit
grazing and in exchange for an improvement in environmental quality (e.g.
conservation of grasslands, water and soil, and reduced grassland degradation)
through the PES programs. Willingness to pay (WTP) represents the maximum
amount that an individual is willing to sacrifice to procure a good or avoid something
undesirable. A government official‘s WTP represents the amount they believe would
represent a fair payment, which may differ from the amount they are actually able to
pay based on the budget they have available. Combining WTA with WTP is
particularly useful when the goal of a study is to determine whether those who pay
and those who accept the payments have reached a satisfactory compromise that
meets both of their needs.
The contingent valuation method (CVM) was used to quantify each household‘s WTA
and each government official‘s WTP for grassland conservation. CVM is a kind of
stated reference approach that employs a hypothetical market system to extract WTA
or WTP values for environmental goods (Hadker et al. 1997; Carson 2000). CVM has
become one of the most widely used valuation techniques due to its flexibility and its
ability to estimate total values (e.g. Hanemann 1984, 1989, 1994; Spash and Hanley
1995; Bjornstad and Kahn 1996; Liu and Zhen 2007; Spash et al. 2009). Existing
methods for estimating WTA or WTP include continuous CVM (represented by open-
ended questions) and discrete CVM (represented by dichotomous-choice questions).
In continuous CVM, the interviewees are free to answer the open-ended questions by
defining the maximum amount they are willing to pay. This also facilitates analysis of
the data. The disadvantage is that giving the appropriate answer to the interviewees is
sometimes difficult when they don‘t have enough background information about the
research subject or when they are actually not sure of the maximum amount they are
able to offer or the minimum amount they are willing to accept when they have to do
so Loomis and Walsh 1997. In contrast, discrete CV lets the interviewees express their
WTP or WTA by choosing either ‗yes‘ or ‗no‘; thus, they don‘t need to indicate the
specific amount, and this can avoid the problem of inconsistency between the stated
and actual values (Hoehn and Randall 1987).
104
The most persistently troubling empirical result in the CVM literature is hypothetical
bias, the tendency for the hypothetical WTP to overestimate the real WTP (Cummings
et al. 1995, 1997; Blumenschein et al. 1997). Critics of CVM often claim that
responses about WTP or WTA will be different for hypothetical versus real choices,
and that, for instance, respondents will actually pay less (Whitehead and Cherry
2007). A meta-analysis by Murphy et al. (2005) found a median difference of 35%
between the hypothetical and actual WTA or WTP, and this difference may relate to
how respondents define the value of the good or service (Murphy et al. 2010). Many
studies have addressed ways of overcoming the biases created by this phenomenon.
For example, the dissonance-minimization techniques proposed by Blamey et al.
(1999) and Loomis et al. (1999) allow the respondent to choose an option such as ‗I
support the [program]… but it is not worth [value] to me‘. This is likely to be
effective if the bias is predominantly caused by management of the impressions of the
respondents. On the other hand, the popular cheap-talk and budget-reminder
technique (Whitehead and Cherry 2007) may encourage the respondent to think twice,
which may be more effective in alleviating the bias than dissonance-minimization
approaches, which proved to be more effective than dissonance-minimization
approaches in alleviating the bias for a reforestation program (Krawczyk 2012).
Whitehead and Cherry (2007) found that both ex-ante and ex-post approaches can
successfully mitigate and even eliminate hypothetical bias because they addressed the
bias in the survey using one or more follow-up questions. In a recent study, Kim et al.
(2012) examined how accounting for the hypothetical bias affects the WTP for
preservation of an endangered species from two different samples of respondents who
were separated by distance (and costs) from the species‘ location. Mjelde et al. (2012)
noted that four factors may be related to the bias: income, environmental awareness,
age and familiarity with a good. Increasing any of these factors will reduce the
potential bias.
To gain the data required for WTA and WTP, a single-bounded dichotomous CVM
method was used. To mitigate the hypothetical bias, preliminary surveys and follow-
up questions were used to determine the potential WTA and WTP for grassland
conservation for the herders and the government officials respectively. The ranges for
WTA and WTP were obtained from the preliminary surveys, and the questionnaire to
mitigate this bias was revised during the formal survey. The formal survey started
with a description of the purpose of the survey to participants, continued with
gathering of basic demographic data, and concluded with questions intended to reveal
the participant‘s WTA for not overgrazing or not grazing in specific plots, based on
the expected annual bid values (75, 150, 300, 450, 750, 1050, 1350 and 1500 CNY ha-
1; 1US$ = 6.3417 CNY in April 2013). The expected bids were determined based on a
preliminary survey of the income losses that resulted from land conservation and
based on pre-interviews with local people and government officials. In each
questionnaire, the respondent was asked a follow-up question such as the following:
‗If grazing activities are restricted to conserve grasslands and your financial losses
should be compensated, would you be willing to accept/pay [amount] for the
economic loss/conservation to meet this end? (yes/no)‘. Respondents who answered
‗yes‘ to the question were then asked to indicate their willingness by choosing either
yes or no in response to the corresponding bid value. Because the bid values were
based on the direct income loss from grazing restrictions and estimates by government
officials, the hypothetical responses would be close to the real choices. However, this
hypothesis should be tested in future research.

105
For analysis of WTA in this chapter, a logit model (Hanemann 1984) was applied to
reveal the relationship between the respondent‘s willingness to accept a bid (‗yes‘ or
‗no‘) and the corresponding bid value (based on data from the preliminary surveys).
The standard form of the model is as follows:
Prob = 1 − *1 + 𝑒𝑥𝑝,𝐵0 − 𝐵1𝑥-+−1 (Eq. 6.1)
Where Prob represents the probability of accepting a bid, B0 and B1 are
regression coefficients, and x is the bid value. The relationship between the bid values
and the consensus rate (i.e. the proportion of the households who were willing to
accept the corresponding bid value) is shown by the following function:
p = 1/(1 + 𝑏0 • 𝑏1𝑥) (Eq. 6.2)
Where P is the consensus rate, which represents the percentage of the households
who are willing to accept the corresponding bid value, x is the bid value, and b0 and
b1 are regression coefficients, where b0 =e-B0
and b1 =eB1
.
The probability density of WTA is expressed as follows:
ρ = 𝑃′(𝑥) (Eq. 6.3)
Where ρ is the probability density of WTA, and 𝑃′(𝑥) represents the probability
of a WTA value less than x.
To gain the necessary data for WTP, the same method was used for WTA, with the
same bid values, which were also determined based on preliminary survey data from
pre-interviews with local officials. The interviewees indicated no in response to the
corresponding bid value, which can help to avoid the problem of inconsistency
between the stated WTP and the actual amount they are able to pay (Hoehn and
Randall 1987). The equations (6.1)–(6.3) were also used to calculate WTP, but with
WTA replaced by WTP and with the household replaced by the government
department in each equation.
The possible factors that influenced the herders‘ willingness to accept PES schemes
(equation (6.4)) were analysed by using multinomial logistic regression, with
significance at P <0.05, and the Wald test was used to determine whether the partial
regression coefficients of the independent variables equalled zero. The resulting
equation was:
y = −0.475 + 0.126𝑥1 + 0.226𝑥2 + 0.231𝑥3– 0.025𝑥4 − 0.069𝑥5 − 0.406𝑥6 +0.107𝑥7 + 0.151𝑥8 + 0.876𝑥9 − 0.049𝑥10 (Eq. 6.4)
Where y is the WTA for the PES scheme, and 𝑥𝑎 − 𝑥10 are the independent
variables listed in Table 6.3.
6.4 Results and discussion
6.4.1. Characteristics of the respondents
The proportion of male respondents (67%) was higher than that of female respondents
(33%), as men are the dominant partner in most of the local families. About 41% of
the respondents belonged to the Mongolian ethnic group, and the remaining 59%
belonged to the Han ethnic group. Most of the respondents (62.1%) were middle-aged
(35–45), and only 6.3% were older than 65 years. The family size averaged about
three persons, generally representing two parents and a child. More than half of the
respondents (61.3%) were illiterate or had only attended primary school due to

106
difficulty of access to the nearest school and low family income, and only 8% of
respondents had a high school education. The average household owned 0.20, 0.47,
and 0.73 ha of cultivated land for the households that participated in the RGLGP, the
SLCP, and both programs, respectively, versus 53.6, 17.1 and 78.2ha of grassland,
respectively.
Among the interviewed 240 respondents, 79 were involved in the RGLGP, 105 were
involved in the SLCP, and 56 were involved in both programs simultaneously (Table
6.2). For each group, the change in land resources was analysed as a result of the
RGLGP and the SLCP. In the RGLGP group, RGLGP affected 39.9% of the original
grassland area (an average of 35. ha per household), as the available grassland
decreased from 89.3 to 53.6ha. In the SLCP group, about 60% of the cultivated land
was returned to natural grassland or artificial forest, with an average area affected of
about 0.71ha per household; that is, the area changed from 1.18ha per household
before the project to 0.47 ha after the project; this made farming difficult, as the land‘s
productivity is very low due to poor soil conditions. The grassland resource of about
17ha per household that remained after implementation of the PES programs is able to
support 10 sheep or 1 cow according to the local standard of 1.7ha of grassland per
sheep unit. In the group that participated in both programs, the available grassland
decreased from 98.3 to 78.2ha, and the area in which grazing was prohibited totalled
20.1 ha (20.4% of the original grassland area); thus, about 0.35ha of cultivated land
per household was converted into natural grassland, and the area of cultivated land per
household decreased by 32.4%, from 1.08 to 0.73ha.
In terms of income, the implementation of the SLCP and of the RGLGP has changed
how the respondents earn their living, which is reflected in the local income structure.
Comparing the income structure before and after implementation of the two projects
(Table 6.4), the results of this chapter found that the SLCP group depended on
traditional crop cultivation, with a relatively low productivity due to the dry weather
and impoverished soils. The income from cultivation before implementation of the
SLCP was 1025 CNY annually, accounting for 31.4% of the total income.
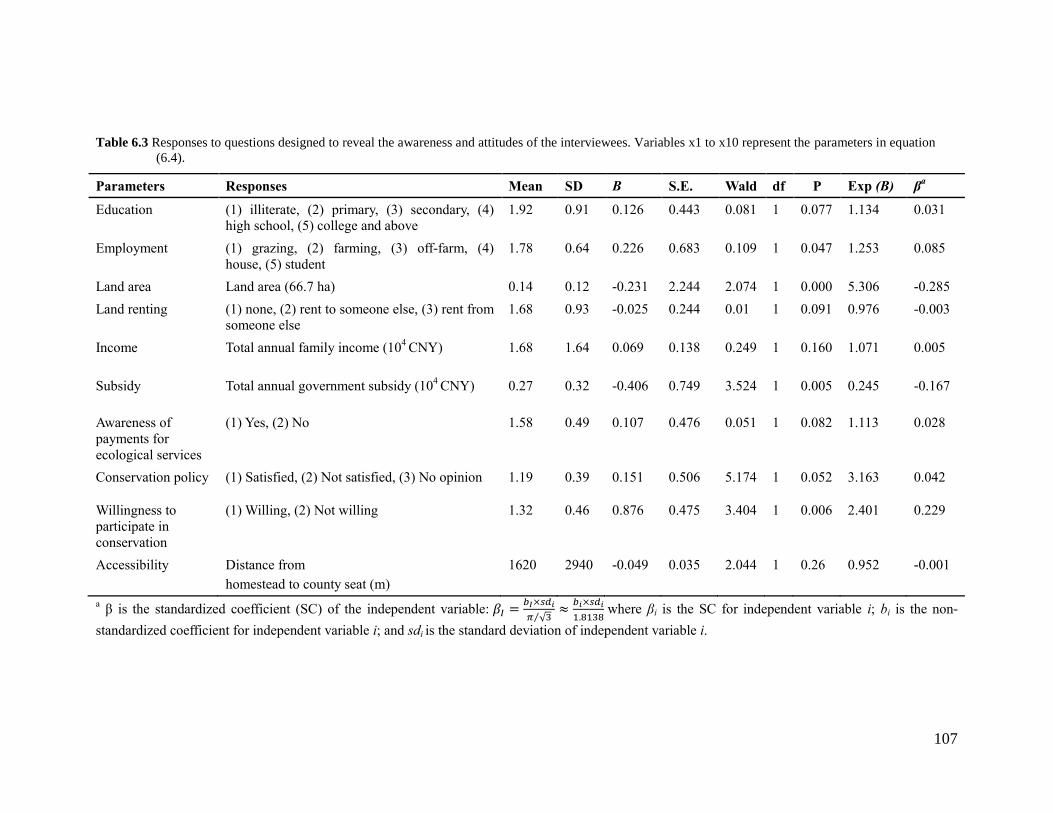
107
Table 6.3 Responses to questions designed to reveal the awareness and attitudes of the interviewees. Variables x1 to x10 represent the parameters in equation
(6.4).
Parameters Responses Mean SD B S.E. Wald df P Exp (B) βa
Education (1) illiterate, (2) primary, (3) secondary, (4)
high school, (5) college and above
1.92 0.91 0.126 0.443 0.081 1 0.077 1.134 0.031
Employment (1) grazing, (2) farming, (3) off-farm, (4)
house, (5) student
1.78 0.64 0.226 0.683 0.109 1 0.047 1.253 0.085
Land area Land area (66.7 ha) 0.14 0.12 -0.231 2.244 2.074 1 0.000 5.306 -0.285
Land renting (1) none, (2) rent to someone else, (3) rent from
someone else
1.68 0.93 -0.025 0.244 0.01 1 0.091 0.976 -0.003
Income Total annual family income (104 CNY) 1.68 1.64 0.069 0.138 0.249 1 0.160 1.071 0.005
Subsidy Total annual government subsidy (104 CNY) 0.27 0.32 -0.406 0.749 3.524 1 0.005 0.245 -0.167
Awareness of
payments for
ecological services
(1) Yes, (2) No 1.58 0.49 0.107 0.476 0.051 1 0.082 1.113 0.028
Conservation policy (1) Satisfied, (2) Not satisfied, (3) No opinion 1.19 0.39 0.151 0.506 5.174 1 0.052 3.163 0.042
Willingness to
participate in
conservation
(1) Willing, (2) Not willing 1.32 0.46 0.876 0.475 3.404 1 0.006 2.401 0.229
Accessibility Distance from
homestead to county seat (m)
1620 2940 -0.049 0.035 2.044 1 0.26 0.952 -0.001
a β is the standardized coefficient (SC) of the independent variable: 𝛽𝐼 =
𝑏𝐼×𝑠𝑑𝑖
𝜋 √3⁄≈𝑏𝑖×𝑠𝑑𝑖
1.8138 where βi is the SC for independent variable i; bi is the non-
standardized coefficient for independent variable i; and sdi is the standard deviation of independent variable i.
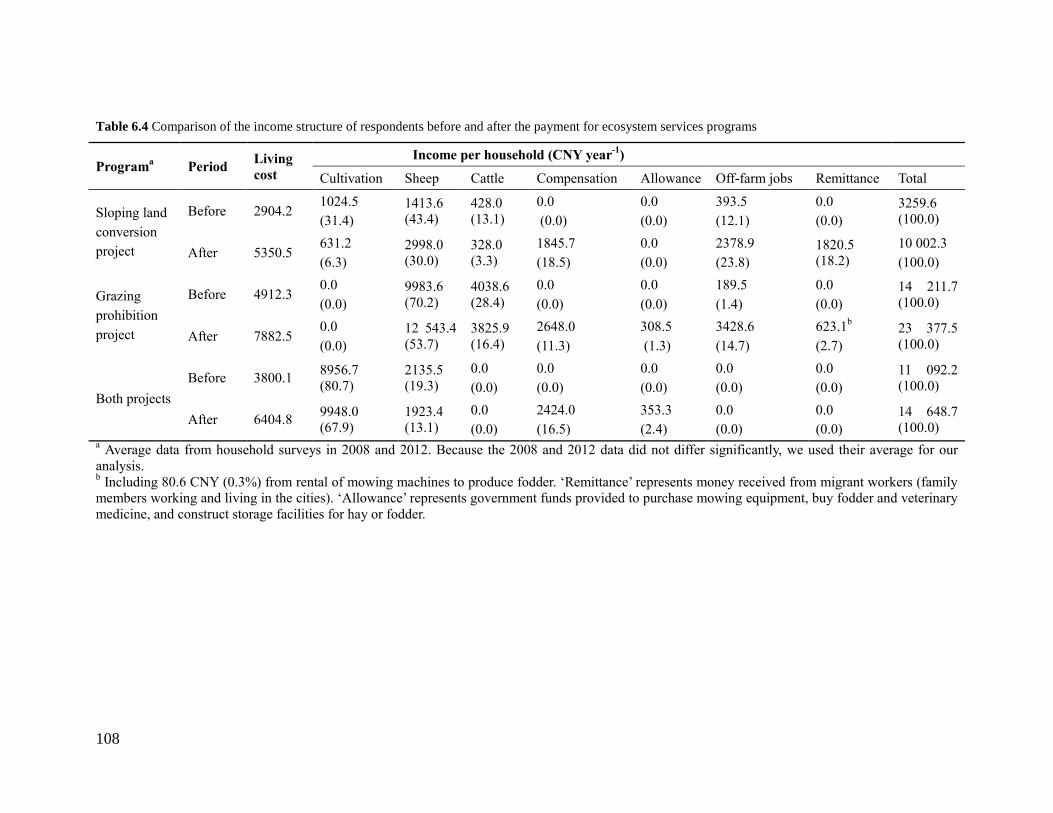
108
Table 6.4 Comparison of the income structure of respondents before and after the payment for ecosystem services programs
Programa Period
Living
cost
Income per household (CNY year-1
)
Cultivation Sheep Cattle Compensation Allowance Off-farm jobs Remittance Total
Sloping land
conversion
project
Before 2904.2 1024.5
(31.4)
1413.6
(43.4)
428.0
(13.1)
0.0
(0.0)
0.0
(0.0)
393.5
(12.1)
0.0
(0.0)
3259.6
(100.0)
After 5350.5 631.2
(6.3)
2998.0
(30.0)
328.0
(3.3)
1845.7
(18.5)
0.0
(0.0)
2378.9
(23.8)
1820.5
(18.2)
10 002.3
(100.0)
Grazing
prohibition
project
Before 4912.3 0.0
(0.0)
9983.6
(70.2)
4038.6
(28.4)
0.0
(0.0)
0.0
(0.0)
189.5
(1.4)
0.0
(0.0)
14 211.7
(100.0)
After 7882.5 0.0
(0.0)
12 543.4
(53.7)
3825.9
(16.4)
2648.0
(11.3)
308.5
(1.3)
3428.6
(14.7)
623.1b
(2.7)
23 377.5
(100.0)
Both projects
Before 3800.1 8956.7
(80.7)
2135.5
(19.3)
0.0
(0.0)
0.0
(0.0)
0.0
(0.0)
0.0
(0.0)
0.0
(0.0)
11 092.2
(100.0)
After 6404.8 9948.0
(67.9)
1923.4
(13.1)
0.0
(0.0)
2424.0
(16.5)
353.3
(2.4)
0.0
(0.0)
0.0
(0.0)
14 648.7
(100.0) a Average data from household surveys in 2008 and 2012. Because the 2008 and 2012 data did not differ significantly, we used their average for our
analysis. b Including 80.6 CNY (0.3%) from rental of mowing machines to produce fodder. ‗Remittance‘ represents money received from migrant workers (family
members working and living in the cities). ‗Allowance‘ represents government funds provided to purchase mowing equipment, buy fodder and veterinary
medicine, and construct storage facilities for hay or fodder.

109
The most important income source was small scale animal husbandry, including 30–
40 sheep per household and 1–2 cows; these animals accounted for 56.5% of the farm
income (1842 CNY annually). After the SLCP, the available cultivated land decreased,
and the income from cultivation decreased by nearly half, to 631 CNY in 2012, which
accounted for only 6.3% of annual income; income from animal husbandry nearly
doubled, but decreased to 33.3% of the total annual income. Compensation provided
by the government accounted for 18.5% of the total income, and was intended to
compensate farmers for their losses caused by limitations on farming and grazing.
Many farmers found off-farm jobs in construction, processing of agricultural
products, and services in nearby cities or towns, and income from these off-farm jobs
accounted for 23.8% of the total; money received from migrant workers (family
members working and living in the cities) who sent money back to their parents or
relatives at the end of the year or to celebrate a festival (‗remittance‘) also reached
18.2% of the total income.
Total annual income of herders who participated in the RGLGP (Table 6.4) increased
by 65%, from 14 212 CNY to 23 378 CNY, as they have been receiving 2648 CNY
annually from the government, which is equivalent to 11.3% of their total income, in
the form of compensation payments and an allowance of 309 CNY to purchase
production equipment (e.g. mowing equipment), buy fodder and veterinary medicine,
build storage rooms for hay or fodder, and so on. This can be seen by the decreased
share of total income accounted for by animal husbandry, which decreased from
98.6% of the total to 70.1%, representing a decrease of 28.5% points. Labourers
released from grazing work (an average of about 0.75 persons per household) could
find off-farm jobs, so the share of off-farm income contributed by these jobs increased
to about 10 times its original proportion (from 1.4% to 14.7% of total income).
Those who participated in both programs were mostly involved in cultivation
activities, although their total income has increased by 32% since the implementation
of the two programs; however, the proportion of total income contributed by farming
and grazing of sheep decreased from 80.7% to 67.9% and from 19.3% to 13.1%,
respectively, and compensation payments (16.5% of total income) and a production
allowance (2.4% of total income) have become important and stable income sources
for the farmers.
This analysis shows that the household income rose compared with their income
before the programs. Especially for RGLGP households, the income (23 377 CNY)
was higher than that of the average household (farmers and herders) in Xilin Gol (18
459 CNY; XLGLDRC 2011) because the compensation payment was higher and the
grassland area was larger than was the case for households that participated in the
SLCP or in both programs. In contrast, the annual incomes of households that
participated in the SLCP (10 002 CNY) and in both programs (14 648 CNY) were
both lower than the region‘s average. Although this is an imperfect comparison (i.e.
the mean Xilin Gol income statistics available from the government include families
that participated in the two PES programs), it was not possible to obtain separate
income statistics for households that did not participate in either program.
Since the implementation of the programs, the grassland conditions have improved
and net primary production increased by 20% (Yang 2007), which had positive effects
for the households in terms of better grazing and farming conditions; in addition, the
price of agricultural and livestock products has increased in recent years, therefore the
income per household from farming and grazing has increased by about 1091, 2347
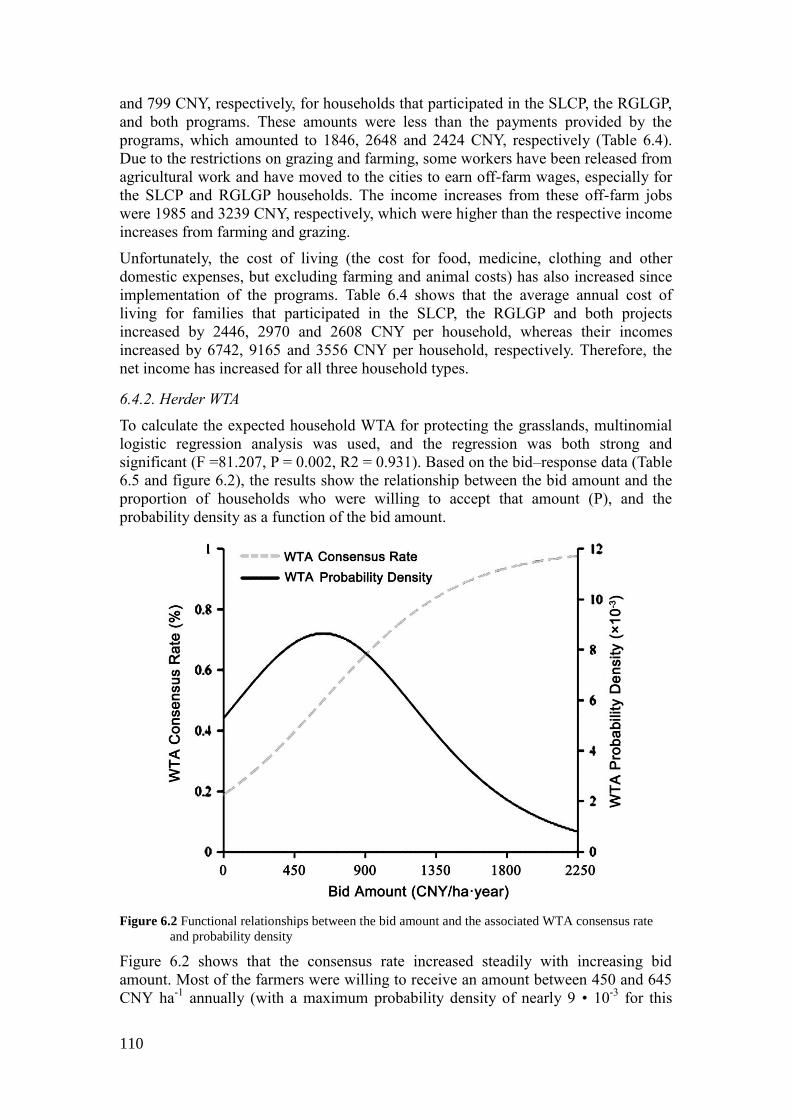
110
and 799 CNY, respectively, for households that participated in the SLCP, the RGLGP,
and both programs. These amounts were less than the payments provided by the
programs, which amounted to 1846, 2648 and 2424 CNY, respectively (Table 6.4).
Due to the restrictions on grazing and farming, some workers have been released from
agricultural work and have moved to the cities to earn off-farm wages, especially for
the SLCP and RGLGP households. The income increases from these off-farm jobs
were 1985 and 3239 CNY, respectively, which were higher than the respective income
increases from farming and grazing.
Unfortunately, the cost of living (the cost for food, medicine, clothing and other
domestic expenses, but excluding farming and animal costs) has also increased since
implementation of the programs. Table 6.4 shows that the average annual cost of
living for families that participated in the SLCP, the RGLGP and both projects
increased by 2446, 2970 and 2608 CNY per household, whereas their incomes
increased by 6742, 9165 and 3556 CNY per household, respectively. Therefore, the
net income has increased for all three household types.
6.4.2. Herder WTA
To calculate the expected household WTA for protecting the grasslands, multinomial
logistic regression analysis was used, and the regression was both strong and
significant (F =81.207, P = 0.002, R2 = 0.931). Based on the bid–response data (Table
6.5 and figure 6.2), the results show the relationship between the bid amount and the
proportion of households who were willing to accept that amount (P), and the
probability density as a function of the bid amount.
Figure 6.2 Functional relationships between the bid amount and the associated WTA consensus rate
and probability density
Figure 6.2 shows that the consensus rate increased steadily with increasing bid
amount. Most of the farmers were willing to receive an amount between 450 and 645
CNY ha-1
annually (with a maximum probability density of nearly 9 • 10-3
for this

111
range of values), and the average annual WTA per household was 625 CNY ha-1
(versus a current maximum payment of about 270 CNY ha-1
). In the Xilin Gol
League, the total area of grassland affected by RGLGP was 9.84 •105 ha in 2012, thus
the total WTA for the study area ranged between 443 × 106 and 635 • 10
6 CNY year
-1.
This result can be used as a reference value to design a PES scheme and determine the
total funding required to promote conservation measures in IMAR‘s grasslands.
Most of the herders (about 86%) determined their WTA based on the economic loss
that resulted RGLGP and the average cost required to maintain their basic standard of
living (e.g. the costs for food and fuel). About 78% of the herders would like to use
the compensation provided for grassland protection to build fences to keep their
animals in a field and to purchase fodder; about 25% would like to hire local herders
to graze their animals in grasslands where grazing is still permitted and prevent
animals from damaging the degrading grasslands, about 14% would purchase
equipment needed to produce fodder (e.g. water tanks, fodder silos, grass mowers),
and about 13% would like to invest in supporting tourism activities. The following
additional information was found, that provides insights into how to modify the PES
schemes:
Employment activities: About 83% of farmers had a high willingness to
implement PES because they were aware of the benefits of the resulting
environmental improvement, and the production and benefits from their small
area of farmland were too little to sustain their livelihood. About 76.1% of the
herders who performed off-farm work as migrant workers also had strong
willingness to participate in PES, because by so doing, they could earn more
income from their grasslands that they no longer used for grazing due to a
shortage of workers. This result is similar to what has been found previously in a
forestry PES program, where the decreased reliance on forest resources and the
high proportion of off-farm income (about 32%) led to high WTA (4950 CNY ha-
1 annually) for forest protection (Li and Li 2010).
Area of grassland: The total grassland area owned by a family significantly
affected WTA. Among those who owned more than 200 ha of grassland, only
36% were willing to accept the payment scheme. However, those who owned less
grassland were more interested in the payment scheme; for instance, 68% of those
who owned less than 67 ha of grassland agreed to accept the payment scheme.
This result suggests that the willingness to participate in the payment scheme was
strongly determined by the herders‘ reliance on the grassland for grazing; those
who owned the most grassland normally depended more on their livestock for
their income and livelihood, and did not wish to reduce their number of animals.
However, owners of a small area of land could normally choose either grazing or
off-farm activities to supplement their income, and were therefore more willing to
accept some payment to limit their grazing and to support other activities.
Willingness of the herders to participate in conservation: Among those herders
(89.7%) who were willing to participate in grassland conservation, 65.6% wanted
to continue the PES scheme because they have realized the significance of
grassland degradation and reduced production for grazing; for example, grassland
productivity decreased from 2.26 kg ha-1
in 2000 to 1.39 kg ha-1
in 2007 in
unprotected grassland in the study area (Yang 2007). The herders were willing to
continue their participation because they could obtain subsidies from the
government‘s PES program, and they could use this money to support their

112
grassland protection activities, while also supporting their family despite the
income loss caused by limited grazing.
Table 6.5 The relationship between the bid amount and the proportion of the households that were
willing to accept (WTA) that amount for the conservation of grassland in Inner Mongolia.
Annual bid amount (CNY ha-1
) 75 150 300 450 750 1050 1350 1500
Proportion of households
willing to accept (%) 10.0 24.0 46.0 52.0 63.0 69.0 78.0 89.0
Table 6.6 The relationship between the bid amount and the proportion of the government officials
willing to pay (WTP) that amount for the conservation of grassland in Inner Mongolia.
Annual bid amount (CNY ha-1
) 75 150 300 450 750 1050 1350 1500
Proportion of households
willing to accept (%) 91.0 72.0 69.0 40.0 32.0 26.0 18 11.0
6.4.3. Government WTP
We calculated the expected amount the government respondents were willing to pay
to the herders to protect the grasslands (Table 6.6) using logistic regression analysis,
and the regression was both strong and significant (F = 67.317, P = 0.003, R2 =
0.943). Figure 6.3 shows the relationship between the bid amount and the proportion
of the officials who were willing to pay that amount (PWTP), as well as the
probability density for WTP.
Figure 6.3 Functional relationships between the bid amount and the associated WTP consensus rate
and probability density
Most of the officials were willing to pay between 375 and 600 CNY ha-1
annually,
with a high probability density of nearly 9.6 × 10⁻³
for this range of values. The
expected WTP can be estimated using equations (6.3) and (6.4), which predict an

113
average annual WTP of 528 CNY ha-1
. The total area of grassland in which grazing is
prohibited was 9.84 × 10⁵ ha in 2012, thus the total payment would be between 369 ×
106 and 590 × 10
6 CNY year
-1. The current maximum payment standard is 270 CNY
ha-1
annually, which is less than the WTP of the local governments but far below the
herder WTA for conserving the grassland.
6.4.4. Stakeholder awareness and considerations for PES: herders versus officials
The herders and the representatives from relevant local government agencies told us
about their awareness of the impact of the RGLGP and SLCP on the livelihood of
herders, and this provided important background information for designing a locally
acceptable and practical payment scheme that would fairly compensate the herders for
their income losses caused by grassland conservation activities. The results (Table
6.7) show that most of the respondents (56% of herders and 52% of officials) believe
that the grassland conservation and restoration programs have affected the herders‘
livelihood by decreasing their net income and increasing the difficulty of their lives.
Some (33% of herders and 26% of officials) nonetheless thought that the programs
had a positive impact on the herders because of the improved grassland conditions and
reduced sandstorm frequency compared to the time before the programs were
implemented. However, the proportions who thought there was no impact from the
programs differed between the two groups (11% of the herders and 22% of the
officials), and the difference was marginally significant (P = 0.0627) because these
officials thought the herders were adequately compensated for their losses and
therefore were not forced to change their standard of living.
In general, the respondents welcomed the programs and considered them good
because they received payments from the programs, because some of the workers
released from the hard work of cultivation and grazing were able to earn wages from
off-farm jobs in the cities (which also exposed them to new ideas from the outside
world), and because the grassland conditions improved. They were also willing to
participate in the program as long as the program payments continued, or if the
program encouraged farmers to shift into activities that could provide income even if
the program payments ended. All of the respondents were concerned about whether
the programs would continue and for how long, and they noted that if the government
ended the payments in the future, they would return to grazing in their grasslands. The
other most important concerns were the growing conditions for grass (50% of the
respondents), water availability (50%), vegetation cover (36%) and the number of
animals they could own (11%).
Some also raised concerns about grass species (7.1% of the respondents), biomass
(3.6%), and soil conditions (3.6%). The agricultural and pastoral families perceived
the programs as affecting their livelihoods through a direct impact on their way of life,
including by increased income from the program payments and wages, reduced
grazing area (nearly half of the pastoral areas had grazing prohibited), the reduced
number of animals (the number of goats was especially decreased, by 17%), the
reduced percentage share of their total income from sheep (by 16.5%) and cattle (by
12.0%) for RGLGP families, and the 25.1% reduction in the proportion of total
income from cultivation for SLCP families due to restrictions on grazing and
cultivation (Table 6.4), the increased cost for purchasing animal fodder and feed (from
8636 CNY in 1995 to 23 339 CNY in 2010), less dependence on biofuels (e.g. animal
dung, dried grass, shrubs) but more dependence on coal, gas and electricity, and
increasing reliance on food imported from other regions.

114
Table 6.7 shows that most of the herders (58%) wanted to have the compensation
amount calculated based on their general loss of income from grazing and farming,
followed by compensation based on their cost of living (13.6%) and the cost of the
grassland protection activities (10.0%). Although the government officials also
prioritized the loss of income (22.1%) and cost of living (23.3%), they placed a much
lower priority on income losses (by 36% points), and the difference was significant;
they also placed a much higher priority on the cost of environmental protection
(17.4%), although the difference between the two groups was not significant. The
government officials also placed a much higher importance on the cost of managing
the RGLGP and SLCP lands (16.3%, which was 12% points higher than for the
herders, and the difference was significant). These results suggest that the government
officials considered the compensation from several angles, and tried to balance the
economic and ecological aspects.
Table 6.7 Responses to questions designed to reveal the perceptions of payment for ecological services
(PES): herders versus officials. (Note: Percentages represent the proportion of the
respondents who agreed with the statement.)
PES perceptions Herders
(%)
Officials (%) t-test (P level) for the
difference
Impact of the Grazing Prohibition Project on herders‘ livelihood
Loss 56.4 51.9 0.5627
Gain 32.6 25.9 0.1376
No impact 11.0 22.2 0.0627a
PES standard payment should be set based on:
Income from grazing and farming 58.0 22.1 <0.001c
Loss from natural disasters 5.0 10.5 0.5307
Cost for environmental protection 10.0 17.4 0.2304
Cost for managing lands under the
Returning Grazing Land to
Grassland Program and the Sloping
Land Conversion program
4.0 16.3 0.0019b
Living cost 13.6 23.3 0.1730
Other 6.4 10.5 0.3017
Source of PES funds
Central government 62.6 56.6 0.1045
Provincial government 22.8 28.3 0.5114
County government 9.3 7.5 0.8663
Levies from herders 1.2 3.8 0.4528
Others (e.g. mining companies) 0.041 0.038 0.7226
Means of compensation
Cash 74.2 62.8 0.0850a
Grain 10.0 12.3 0.8371
Employment opportunities and
skills training
15.8 24.9 0.1815
a Significance level P <0.10.
b Significance level P <0.01.
c Significance level P <0.001.
Table 6.7 shows considerable agreement between the two groups about who should
pay for the programs. Most of the respondents (62.6% of herders and 56.6% of
officials) believed that China‘s central government should pay the costs, and lower but

115
similar proportions believed that the provincial government should pay (22.8 and
28.3%, respectively). Very few of the respondents (1.2% of herders and 3.8% of
officials) believed that the herders should bear the cost. Table 6.7 also shows
considerable agreement about the form of the payment. Most of the herders (74.2%)
and most of the officials (62.8%) believed that the payments should be in cash.
Relatively few (<13%) believed that payment in grain, as has been done under
China‘s SLCP, was a good option. More government officials (24.9%) than herders
(15.8%) considered that job and related training to increase employment opportunities
was a good option, but the difference was not significant.
During the survey, both the households and the officials were able to choose their
WTA or WTP according to their real willingness, because they have been involved in
the program implementation for many years, have experienced the improvement of
the grasslands, and want to have better grassland conditions. The households also
realized their economic loss from limited grazing, and the amount they wanted to
receive from the government (their WTA) was comparable to their loss from the
limitations on their activities. This agrees with the findings in other studies (Li 2010;
Zhen et al. 2011a), in which the WTA of farmers was determined by their direct
income loss from decreased production. The WTP of officials was also based to at
least some extent on the income loss of the households that resulted from grazing
limitations. The households are receiving compensation from the government for their
participation in the two programs, and they can use this amount to support their
family, but workers released from working on the land could also find off-farm jobs in
the nearby cities, which is becoming an important income source for the households.
The average household annual income in Xilin Gol was 5186 CNY in 1995, before
the RGLGP and SLCP programs were implemented, but increased to 19 635 CNY in
2012, after the programs had been implemented. The SLCP group‘s income before the
programs (3260 CNY) was lower than the regional average income level in Xilin Gol,
but its income after the programs (10 002 CNY) was higher than the regional average
because the decrease in the income from cultivation activities (mostly grains and
potatoes) was much lower than the increase in the income from sheep and from the
SLCP compensation payments, which amounted to 18.5% of total income (Table 6.4).
For the RGLGP group, average household income was 14 212 CNY before the
program and 23 378 CNY after the program, and both were higher than the region‘s
respective averages; this was because the RGLGP households depended on animal
grazing for income, and this activity accounted for 98.6 and 70.1% of total income
before and after the program, respectively. This difference is because the prices of
meat, milk, and other animal products are much higher than those for the region‘s
crops. For the households that participated in both programs, their average annual
income was 11 092 CNY (higher than the region‘s average) and 14 649 CNY (lower
than the region‘s average) before and after the programs, respectively. The mixture of
cultivation (mostly greenhouse vegetables with higher prices than grains) and grazing
activities contributed to the income changes for these households.
China‘s PES schemes have brought mostly positive effects to the participants. A
typical example that was reported recently (Zheng et al. 2013), suggested that
participation in a program to convert paddy land to dry land in Beijing, with the goal
of improving the availability of water for other purposes and the quality of the
available water, changed the distribution of household livelihoods and their
production and consumption activities. Incomes doubled for both participants and
nonparticipants, even though the income that participants earned from agriculture

116
decreased, because they relied more on off-farm income. The income gap between
participants and nonparticipants was 3554 CNY in favour of the participants, which
was similar to the mean payment; this suggests that the payment standard was
determined by the direct income loss from land conversion. The participants changed
their production and consumption behaviours by increasing spending on production
inputs, material assets and education, which improved the livelihood effects of the
program.
However, despite the overall promising results of this chapter, an alarming number of
herders (88%) and farmers (90%) may return their retired land to grazing or farming
activities if the program payments end. If the program encourages herders and farmers
to shift into activities that can provide income even after the program payments end,
there will likely be less pressure to return the retired land to grazing or cultivation.
Because this is a common concern in other parts of the country (Uchida et al. 2005;
Zhen and Zhang 2011), governments must not end payments under these programs
without providing participants with alternative ways to earn a living.
6.5. Conclusions
This chapter combined government statistics with the results of interviews of
households and government officials to quantify each household‘s WTA and the
government officials‘ WTP for grassland conservation, and to reveal the factors that
influenced these choices. The land-use and income changes that resulted from the
government‘s PES projects, were also analysed. The following main conclusions were
obtained from the analysis:
(1) Major PES projects implemented in the Xilin Gol League included the SLCP and
the RGLGP. After implementation of these projects, the areas of cultivated land
and grazing land both decreased. As a result, herder income from cultivation and
animal husbandry decreased, although income from sheep increased under the
RGLGP because the high compensation payments allowed herders to purchase
enough fodder to maintain large herds. In contrast, income from government
compensation payments and off-farm activities increased, and became an
important and stable income source for the herders.
(2) Most of the herders want to continue the PES projects to improve grassland
conditions, and they were willing to accept PES to mitigate their economic losses.
The average WTA of the herders was about 625 CNY ha-1
, which is much higher
than the current maximum amount they receive (about 270 CNY ha-1
). On the
other hand, government officials had a WTP of about 528 CNY ha-1
annually to
the herders. Although this amount is much higher than the current annual payment
of 270 CNY ha-1
, it is still less than the herder WTA. The gap between the herder
WTA and government WTP is about 97 CNY ha-1
.
Hypothetical bias is likely to exist for the specific levels of WTA and WTP that we
determined because the answers to the questions had no real consequences;
respondents who stated that they would accept compensation for grazing restrictions
or who stated that they would pay for grassland conservation were not required to
actually do so. Some respondents may have stated that they would agree with some
amount of money, but they could actually accept an amount less than their expressed
WTA; similarly, some government officials may have stated that they would pay a
certain amount, when, in fact, they would pay less (e.g. due to constraints on their
budget) if placed in the real situation.

117
However, because the respondents were familiar with the subject of the questions
after more than ten years of involvement in the PES programs and because the
hypothetical choices (bids) were based on the preliminary surveys, and thus closely
mirrored the potential real choices for the residents of IMAR‘s grasslands, the results
are likely to be realistic. Thus, the results could reflect the gap between WTA and
WTP to some extent. Perhaps most importantly, the WTA values were very similar to
the economic losses of participants, which suggests that any hypothetical bias was
relatively small. However, more research will be necessary to quantify the bias and its
causes.
The government officials considered the PES from both economic and ecological
perspectives, whereas the herders emphasized their income losses and basic cost of
living; thus, they related their compensation standard to their reliance on grasslands
and their willingness to continue PES projects. Most of the herders and officials
believed that China‘s central government and provinces should take responsibility for
the compensation payments, and believed that the payments should be paid in cash
rather than in grain or training to obtain skills that would enhance their off-farm
income or permit additional farm activities such as the production of greenhouse
vegetables. The findings have significant implications for designing an operational
PES scheme for study area. The herders have clearly been experiencing economic
losses from conservation activities, but although they wanted to participate in
conservation activities, they also expected sufficient compensation payments to
mitigate their losses. Unfortunately, they want more money than the government is
willing to provide, and the gap between WTA and WTP, as well as the current very
low payments, may lead some herders to expand grazing into restricted grassland or
increase their number of animals. The result of chapter confirms Bennett‘s (2008)
results: some participants may resist the RGLGP and SLCP because they feel they are
not compensated enough to participate, and will have no incentive to continue
participating if the payments end. This potentially jeopardizes the success of the
RGLGP and SLCP.

118
119
CHAPTER 7
Chapter 7: Synthesis, discussion and conclusions

120
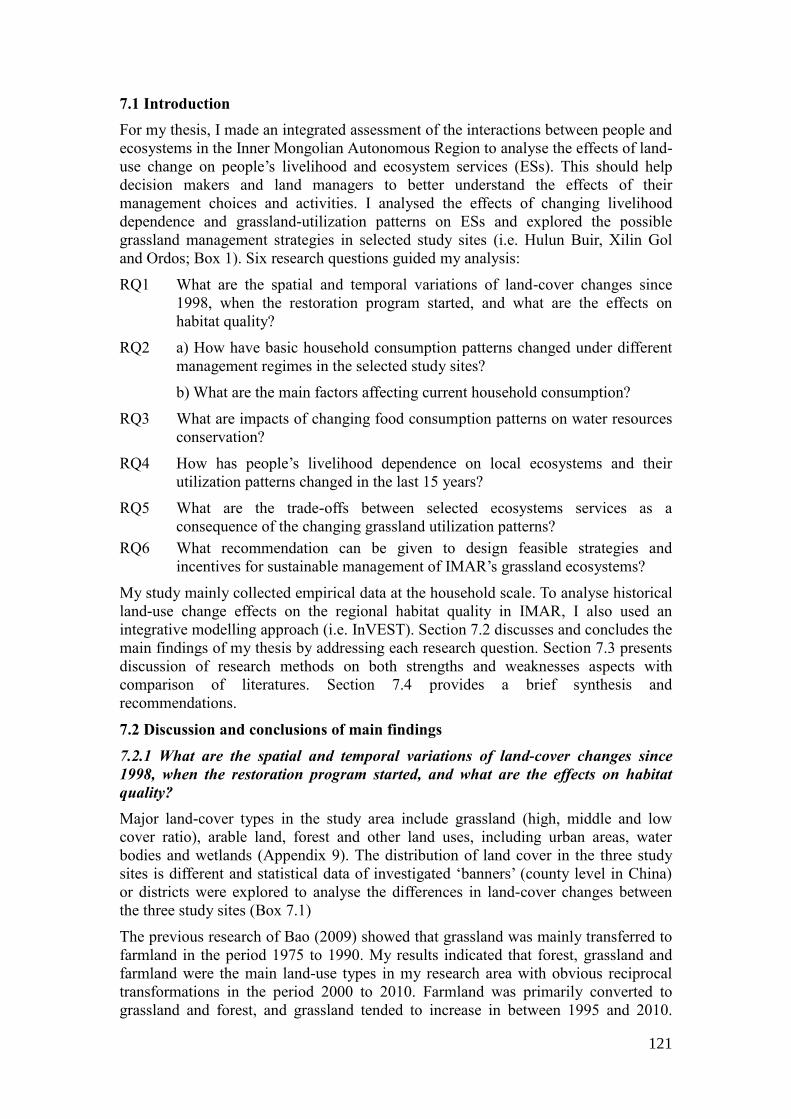
121
7.1 Introduction
For my thesis, I made an integrated assessment of the interactions between people and
ecosystems in the Inner Mongolian Autonomous Region to analyse the effects of land-
use change on people‘s livelihood and ecosystem services (ESs). This should help
decision makers and land managers to better understand the effects of their
management choices and activities. I analysed the effects of changing livelihood
dependence and grassland-utilization patterns on ESs and explored the possible
grassland management strategies in selected study sites (i.e. Hulun Buir, Xilin Gol
and Ordos; Box 1). Six research questions guided my analysis:
RQ1 What are the spatial and temporal variations of land-cover changes since
1998, when the restoration program started, and what are the effects on
habitat quality?
RQ2 a) How have basic household consumption patterns changed under different
management regimes in the selected study sites?
b) What are the main factors affecting current household consumption?
RQ3 What are impacts of changing food consumption patterns on water resources
conservation?
RQ4 How has people‘s livelihood dependence on local ecosystems and their
utilization patterns changed in the last 15 years?
RQ5 What are the trade-offs between selected ecosystems services as a
consequence of the changing grassland utilization patterns?
RQ6 What recommendation can be given to design feasible strategies and
incentives for sustainable management of IMAR‘s grassland ecosystems?
My study mainly collected empirical data at the household scale. To analyse historical
land-use change effects on the regional habitat quality in IMAR, I also used an
integrative modelling approach (i.e. InVEST). Section 7.2 discusses and concludes the
main findings of my thesis by addressing each research question. Section 7.3 presents
discussion of research methods on both strengths and weaknesses aspects with
comparison of literatures. Section 7.4 provides a brief synthesis and
recommendations.
7.2 Discussion and conclusions of main findings
7.2.1 What are the spatial and temporal variations of land-cover changes since
1998, when the restoration program started, and what are the effects on habitat
quality?
Major land-cover types in the study area include grassland (high, middle and low
cover ratio), arable land, forest and other land uses, including urban areas, water
bodies and wetlands (Appendix 9). The distribution of land cover in the three study
sites is different and statistical data of investigated ‗banners‘ (county level in China)
or districts were explored to analyse the differences in land-cover changes between
the three study sites (Box 7.1)
The previous research of Bao (2009) showed that grassland was mainly transferred to
farmland in the period 1975 to 1990. My results indicated that forest, grassland and
farmland were the main land-use types in my research area with obvious reciprocal
transformations in the period 2000 to 2010. Farmland was primarily converted to
grassland and forest, and grassland tended to increase in between 1995 and 2010.
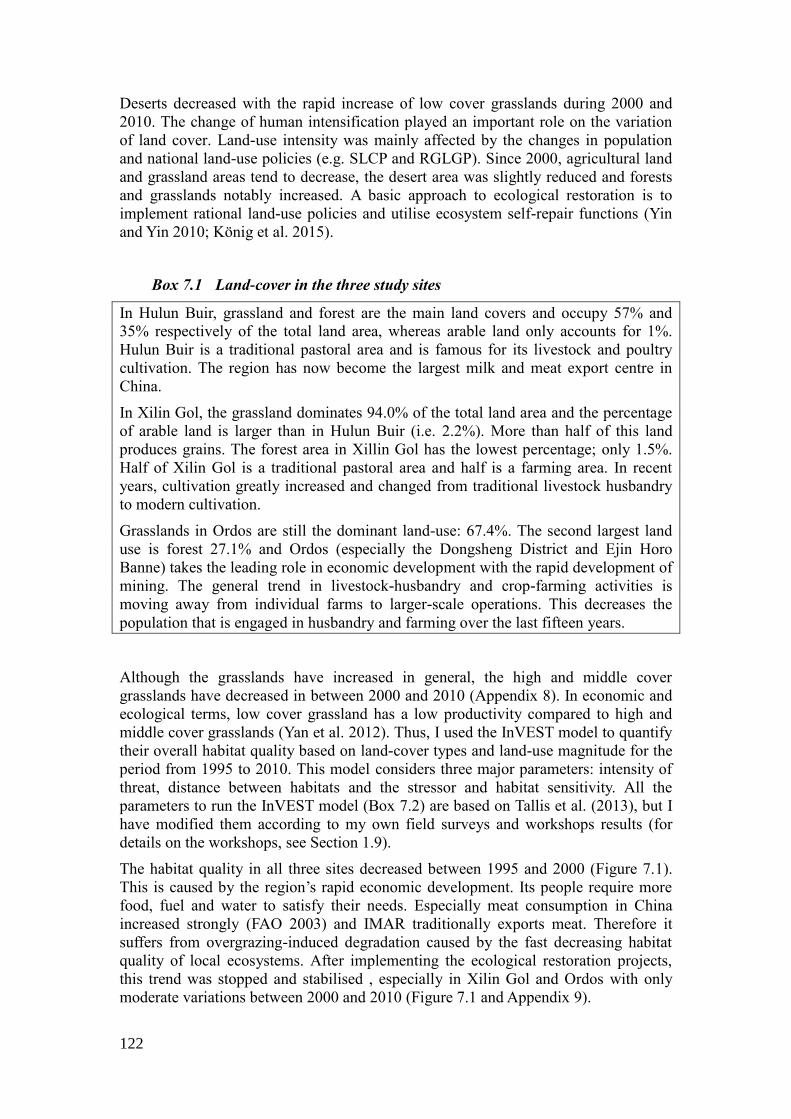
122
Deserts decreased with the rapid increase of low cover grasslands during 2000 and
2010. The change of human intensification played an important role on the variation
of land cover. Land-use intensity was mainly affected by the changes in population
and national land-use policies (e.g. SLCP and RGLGP). Since 2000, agricultural land
and grassland areas tend to decrease, the desert area was slightly reduced and forests
and grasslands notably increased. A basic approach to ecological restoration is to
implement rational land-use policies and utilise ecosystem self-repair functions (Yin
and Yin 2010; König et al. 2015).
Box 7.1 Land-cover in the three study sites
In Hulun Buir, grassland and forest are the main land covers and occupy 57% and
35% respectively of the total land area, whereas arable land only accounts for 1%.
Hulun Buir is a traditional pastoral area and is famous for its livestock and poultry
cultivation. The region has now become the largest milk and meat export centre in
China.
In Xilin Gol, the grassland dominates 94.0% of the total land area and the percentage
of arable land is larger than in Hulun Buir (i.e. 2.2%). More than half of this land
produces grains. The forest area in Xillin Gol has the lowest percentage; only 1.5%.
Half of Xilin Gol is a traditional pastoral area and half is a farming area. In recent
years, cultivation greatly increased and changed from traditional livestock husbandry
to modern cultivation.
Grasslands in Ordos are still the dominant land-use: 67.4%. The second largest land
use is forest 27.1% and Ordos (especially the Dongsheng District and Ejin Horo
Banne) takes the leading role in economic development with the rapid development of
mining. The general trend in livestock-husbandry and crop-farming activities is
moving away from individual farms to larger-scale operations. This decreases the
population that is engaged in husbandry and farming over the last fifteen years.
Although the grasslands have increased in general, the high and middle cover
grasslands have decreased in between 2000 and 2010 (Appendix 8). In economic and
ecological terms, low cover grassland has a low productivity compared to high and
middle cover grasslands (Yan et al. 2012). Thus, I used the InVEST model to quantify
their overall habitat quality based on land-cover types and land-use magnitude for the
period from 1995 to 2010. This model considers three major parameters: intensity of
threat, distance between habitats and the stressor and habitat sensitivity. All the
parameters to run the InVEST model (Box 7.2) are based on Tallis et al. (2013), but I
have modified them according to my own field surveys and workshops results (for
details on the workshops, see Section 1.9).
The habitat quality in all three sites decreased between 1995 and 2000 (Figure 7.1).
This is caused by the region‘s rapid economic development. Its people require more
food, fuel and water to satisfy their needs. Especially meat consumption in China
increased strongly (FAO 2003) and IMAR traditionally exports meat. Therefore it
suffers from overgrazing-induced degradation caused by the fast decreasing habitat
quality of local ecosystems. After implementing the ecological restoration projects,
this trend was stopped and stabilised , especially in Xilin Gol and Ordos with only
moderate variations between 2000 and 2010 (Figure 7.1 and Appendix 9).

123
Box 7.2 Identifying the parameters of the InVEST model to assess habitat
quality
Intensity of relative threat: Human activities are classified in the InVEST model as
activities related to roads, residential activities and agricultural production. In the
land-use maps that I modified during the field surveys, I classified human activities as
transportation activities (on both paved and unpaved roads), residential activities (on
residential land) and cultivation activities (both crop production on cultivated land and
vegetable gardening). Each type of threat affected an activity‘s habitat quality with a
different (threat intensity). In the InVEST model, these were defined on a scale of 0-1
with higher scores representing more intense stress. Based on field surveys, I
quantified the threat intensity scores as 0.8 for residential land, 0.6 for transportation
land and 0.4 for cultivated land.
Influence of distance between habitat and the threat source: The influence of the
distance between threat source and habitat was obtained from literature, the InVEST
model database and my own observations on Inner Mongolia grasslands. I chose a
maximum impact distance of 200m (Carney and Sydeman 1999) for paved roads and
a maximum impact distance of 100m for unpaved rural roads because most
transportation occurred on paved roads, whereas unpaved roads served as branch
roads and had much less traffic. The InVEST model assumes that residential areas
have at least twice or triple as much impact on habitat quality than traffic (Tallis et al.
2013). Thus, I set a 600m impact range for the rural residents and used this as a buffer
for the maximum distance of the threats to the habitats. Agricultural land had an
impact range that was similar to road traffic (Tallis et al. 2013). I therefore defined the
impact range for agricultural land (including cultivated land and aquaculture) as
200m.
Habitat sensitivity to the threat sources: In the InVEST model, habitat sensitivity is
defined for each combination of habitat and threat source. Its values are defined
between 0 and 1. Higher scores represent greater sensitivity. From my survey, habitats
were more sensitive to cover ratio of grassland activities and paved roads. Low cover
grasslands therefore are given a sensitivity value greater than 0.6. The habitats were
less sensitive to high cover grasslands with a sensitivity value less than 0.2. The
middle covere grasslands have on average a sensitivity value of 0.4.
Hulun Buir‘s habitat quality, however, sharply dropped after 2005 (from 0.82 to 0.75;
Figure 7.1). This is caused by the increases of urban and residential areas and road
construction, and continued intensive grazing activities in Hulun Buir. Its livestock
rearing was also less affected by the grassland restoration policy. Because high-quality
(high cover) meadow steppes are the dominant vegetation in Hulun Buir, many animal
husbandry enterprises and milk processing enterprises moved here and invested in
Hunlun Buir (Gao 2013). This rapid development of agriculture mainly caused the
reduction of local habitat quality.

124
Figure 7.1 Change of habitat quality in Inner Mongolian grasslands
7.2.2 How have basic household consumption patterns changed under different
management regimes in the selected study sites and what are the main factors
affecting current household consumption? (RQ2)
(a) How have basic household consumption patterns changed?
To reverse grassland deterioration in Inner Mongolia, a basket of grassland restoration
policy measures have been enforced in the last decade (Li et al. 2007; Yin and Yin
2010; Li and Huntsinger 2011). These measures include rotational grazing, seasonal
grazing, grazing prohibition, livestock movement and control of livestock rearing.
However, these grassland management policies exert great stress on local households‘
livelihood by fundamentally changing their lifestyles (Xie et al. 2006; Dong et al.
2007; König et al. 2014) and reshaping the basic household consumption patterns.
I used a household survey by using face-to-face interviewing of the 209 respondents
to acquire first-hand data to estimate actual daily consumption. The consumption
patterns were constructed using statistics based on a field-level survey of the three
study areas. From the responses, large differences could be seen in food, fuel and
domestic water consumption patterns between the three study sites.
Food consumption: IMAR‘s historic food-consumption consists of few agricultural
crops and high meat consumption. This is mainly due to the lagging effects of the
traditional nomadic grazing culture. There is, however, considerable spatial variation
between the three study sites due to different economic developments, restoration-
policy measures, ecosystem types and variations in ESs provided by the meadow
steppe (Hulun Buir), typical steppe (Xilin Gol) and semi-desert steppe (Ordos) areas.
Hulun Buir retained the low agricultural crops with high meat-consumption pattern.
Approximately half of the households in Xilin Gol and Ordos shifted their dietary
patterns and now follow a high consumption of agricultural crops with lower meat
consumption.
0.50
0.60
0.70
0.80
0.90
1.00
1995 2000 2005 2010
Hulun Buir
Xilin Gol
Ordos
Years
Index of habitat quality

125
Fuel consumption: Dried dung from livestock and firewood collected from forests
and scrublands were traditionally important fuels and were widely used in IMAR. The
types and amounts of fuel consumed changed significantly during my study period.
Fuel consumption patterns changed from using mainly bio-fuels in 1995 to mainly
electricity or gas in 2010. However, dried dung is still a major energy source for daily
life in Hulun Buir with coal being the second most important fuel. Trends of coal and
electricity or gas consumption showed increases at all three study sites, especially in
Xilin Gol and Ordos, where livestock rearing is not as prevalent as in Hulun Buir.
Domestic water consumption: Groundwater was and still is the sole domestic water
source in all three study sites. Some households have begun to use public water
supply (tap water) instead of privately owned wells as their water source.
(b) What are main factors affecting current household consumption?
Economic development stimulated more diverse food-consumption patterns and
established trading markets and changed consumption consciousness. My survey
results also showed that the market supply of food also affects food-consumption
patterns . When the food accessibility increased through improved transport (Zhang et
al. 2014) because a comprehensive transportation system was developed in Inner
Mongolia. This has supported the rapid economic development in the past 22 years,
especially after 2003. Staple foods, fruit and vegetables became less expensive than
mutton and beef. Consequently, the consumption of these crops increased
substantially.
Another important factor that affects current household-consumption patterns is
changes in land-use type or land assets. My results show that herders in Hulun Buir
own abundant grasslands and most herders no longer follow a nomadic lifestyle.
Instead, they settle near their land and cultivate small parcels of farm land to grow
potatoes and vegetables in the spring and the summer. In Xilin Gol, the total land
owned in 2010 was less than half than that in Hulun Buir. The grassland degradation
in Xilin Gol led to a shortage of meat production and this resulted in people starting to
purchase food from outside the region. This reduced their dependency on local
ecosystems. In Ordos, the inhabitants have the lowest land ownership. In the past,
some Ordos‘ farmers and herders also owned severely degraded grasslands and
mineral lands, but these lands have been expropriated by the government for
protection or released to individual companies for mining (Li et al. 2014; Zhao et al.
2014). Fast economic development caused by mining stimulated these changes in
food consumption structure from simplified to diversified food consumption patterns.
In addition to influences of economic development and different environmental
conditions, the grassland-restoration policies deeply changed pastoral tradition and
basic household-consumption patterns. In the past twenty years, Inner Mongolia was
not perceived as an economic priority area focusing, for example, on agricultural
production or mining. It was rather classified as a ‗priority-ecological zone‘ aiming at
sand-storm prevention and soil-erosion mitigation to rehabilitate grassland ecosystems
(National Development and Reform Commission 2014). The implementation of
grassland-conservation policies (i.e. seasonal grazing and rotational grazing) affected
grazing activities less of than other measures. Thus, more herders preferred to
maintain most of their basic consumption patterns (e.g. in Hulun Buir). However, in
the context of grazing prohibition, emigration and livestock rearing control-policy
measures (e.g. in Xilin Gol and Ordos), the consumption of agricultural crops has
increased and meat and bio-fuel consumption has decreased substantially.
126
(c) Discussion on food consumption behaviour and link to nutrition requirements
Similar to my survey, the socio-economic statistics for rural areas in IMAR also
indicated that meat consumption in the period from 1995 to 2010 decreased by 21%
and vegetable consumption increased by 45% (Inner Mongolia Statistics Bureau 1996,
2011). Feng and Shi (2006) showed that the initial preference for human food
consumption is home-produced food from family owned land or local ecosystems (i.e.
self-sufficiency). However, when the changing conditions result in insufficient home-
produced food, the people start to alter their food acquisition, including purchasing.
For instance, in Xilin Gol, the number of livestock is controlled by the carrying
capacity of local grasslands (1 sheep unit per 1.67ha grassland). To confront this
livestock-rearing control policy measure, the herders and farmers increase cattle
rearing to compensate for the loss of goat/sheep grazing due to the control policy.
Cattle can produce milk products. This produces higher incomes than just selling their
meat. This change requires herders and farmers to buy food from external markets and
they tend to buy vegetables and fruit, as these are less expensive than mutton and
beef.
From a nutritional perspective, IMAR had a 2.2 times higher meat consumption than
the Chinese average and 1.9 times China‘s average vegetable consumption (Feng and
Shi 2006, Liu et al. 2012). And in IMAR, the meat consumption per household in
pastoral areas was the 230% of arable farming areas in 2010. Consumer preferences in
my research areas were still meat-based. This satisfied daily protein and energy-
consumption requirements (Chinese Nutrition Society 2010). Therefore, a decrease of
meat consumption does not cause undernourishment.
7.2.3 What are the implications of changing food consumption patterns on water
resources conservation (RQ 3)?
Based on the literature review, household questionnaires and stakeholder workshops,
the limited clean fresh water availability strongly constrains further social and
economic development in IMAR (Dai et al. 2009, Hu et al. 2012). A burgeoning
population, pressing development needs and increasing household consumption are
rapidly increasing the amount of water used. Increasing water consumption is leading
to water stress and grassland degradation. Household-water use is a combination of
both direct water consumption (e.g. domestic water consumption for drinking,
washing, flushing and cooking) and the indirect water consumption to produce food.
The specific water requirement per unit food (crop or meat) in my study sites was
identified from the Virtual Water Content (VWC) method (Bessembinder et al. 2005;
Xiao et al. 2007).
(a) Changes in the amount of indirect water use
My results show that indirect water use from food consumption represents 99% of the
total household-water consumption in the study sites. The herders in Hulun Buir
consumed the highest amount of indirect water for food production in 2010 and Ordos
the lowest amount. Compared to 1995, the indirect water consumption increased in
Hulun Buir and decreased in both Xilin Gol and Ordos. The main reason for these
trends is the changes in food patterns from 1995 to 2010 that shift away from meat
consumption towards more vegetable and fruit consumption. Meat consumption also
switched from a combination of mutton and beef to more diverse meat consumption

127
including fish, chicken and pork. Changing diet behaviour and reducing the
population pressure therefore likely influence the sustainable use of water.
Although the amount of vegetable and fruit consumption in all three study sites
increased substantially between 1995 and 2010 because the Specific Water Demands
(SWD) of vegetables and fruits are relative low (on average 0.1m3
kg-1
for vegetables
and 1.2m3
kg-1
for fruits), the indirect water use from agricultural food production
remains relatively low. The changes in indirect water consumption, which are driven
by mutton and beef, are substantial in all three sites. In Hulun Buir, the total indirect
annual water consumption increased by 30% between 1995 and 2010. The annual
indirect water use from beef is the highest (470m3 per capita) and annual indirect
water use from mutton decreased (i.e. −88m3
per capita). In Xilin Gol and Ordos, the
indirect water consumption from beef and mutton products decreased (22% and 30%
of the level of 1995 respectively) between 1995 and 2010.
(b) Implications for water resource conservation
My results confirmed that the livelihoods of pastoral communities are strongly linked
to the health of the grasslands that the majority of these communities rely on (Pricope
et al. 2013). The reductions in indirect water consumption can reduce the pressure on
local grassland and grassland conservation can probably be achieved by changing
food-consumption patterns. The large differences between the SWD of the various
food (or crop) types for consumption indicate that the total water consumption can be
reduced if food-consumption patterns change.
Economic development (e.g. purchasing ability) and grassland-use policy measures
are identified by my researches as the most efficient ways to switch food-consumption
patterns with lower indirect water consumption in IMAR. Most developing countries
of the world that economically develop, show increased purchasing power, which
increase demand for meat products (FAO 2009; Grigg 1995; Popkin 2002). Their
populations grow and, combined with economic growth, meat demand increases. This
requires more water. Interestingly, my results for the study areas in Inner Mongolia
show a different trend. The increasing purchasing power, which differed in the three
sites (c.f. Figure 7.2), reduced indirect water consumption through adaption of
diversified food-consumption patterns (especially increased vegetable and fruit
consumption). The reason of this difference with other developing countries is my
focus on household consumption in specific pastoral areas with under different
economic and environmental circumstances.
The results from RQ2 (Section 7.2.2) showed that the implementations of grassland-
restoration policies in IMAR aggravated the situation for the herders and farmers.
They changed their diets by reducing their meat consumption and started to purchase
food. This reduced indirect water consumption and conserved the local grasslands.
Moreover, studies on structure and trends of water and food-consumption patterns
(e.g. Hu et al. 2015) likely allow policymakers to better manage water and land
sustainably by implementing grassland ecosystem-restoration policies. The current
restoration policies need additional policy measures to increase livelihood diversity
and mitigate the livelihood dependence on grassland ecosystems. Various strategies,
such as provided off-farm works, skill training, establishment of food trading market
and education on healthy diets, need to be employed. Therefore, quantifying direct
and indirect water consumption is critical to design strategies for water conservation
and, consequently, sustainable grassland management.
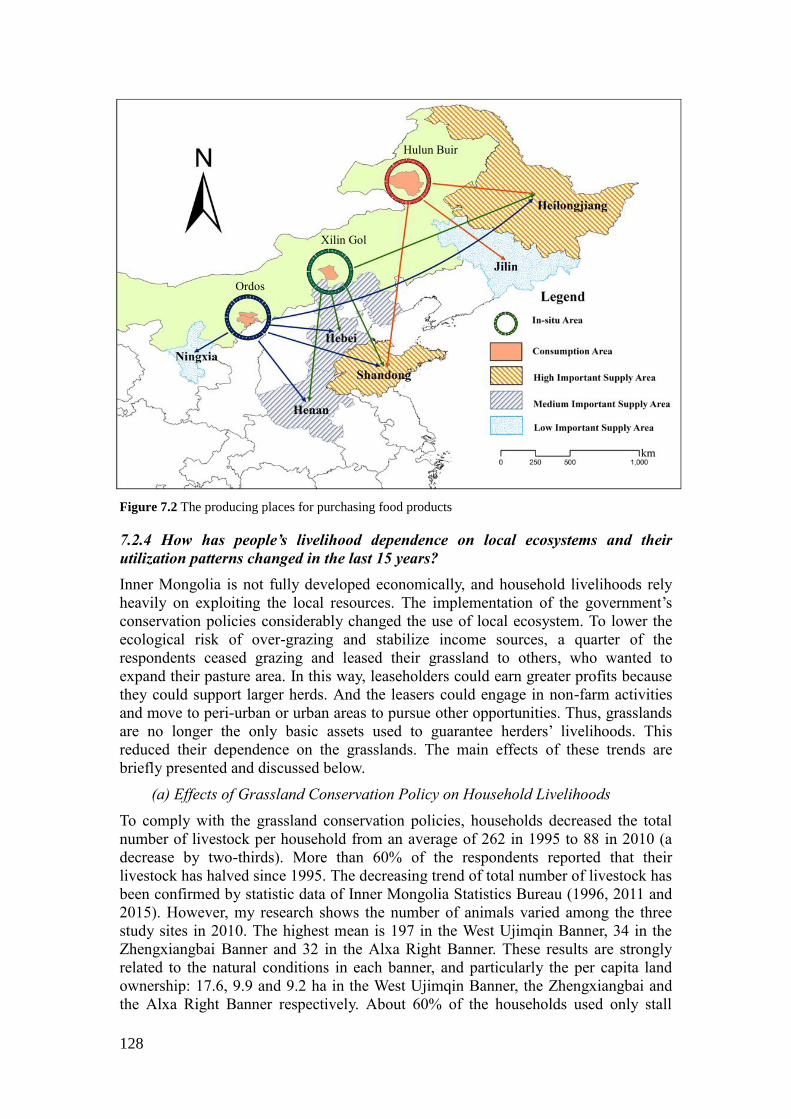
128
Figure 7.2 The producing places for purchasing food products
7.2.4 How has people’s livelihood dependence on local ecosystems and their
utilization patterns changed in the last 15 years?
Inner Mongolia is not fully developed economically, and household livelihoods rely
heavily on exploiting the local resources. The implementation of the government‘s
conservation policies considerably changed the use of local ecosystem. To lower the
ecological risk of over-grazing and stabilize income sources, a quarter of the
respondents ceased grazing and leased their grassland to others, who wanted to
expand their pasture area. In this way, leaseholders could earn greater profits because
they could support larger herds. And the leasers could engage in non-farm activities
and move to peri-urban or urban areas to pursue other opportunities. Thus, grasslands
are no longer the only basic assets used to guarantee herders‘ livelihoods. This
reduced their dependence on the grasslands. The main effects of these trends are
briefly presented and discussed below.
(a) Effects of Grassland Conservation Policy on Household Livelihoods
To comply with the grassland conservation policies, households decreased the total
number of livestock per household from an average of 262 in 1995 to 88 in 2010 (a
decrease by two-thirds). More than 60% of the respondents reported that their
livestock has halved since 1995. The decreasing trend of total number of livestock has
been confirmed by statistic data of Inner Mongolia Statistics Bureau (1996, 2011 and
2015). However, my research shows the number of animals varied among the three
study sites in 2010. The highest mean is 197 in the West Ujimqin Banner, 34 in the
Zhengxiangbai Banner and 32 in the Alxa Right Banner. These results are strongly
related to the natural conditions in each banner, and particularly the per capita land
ownership: 17.6, 9.9 and 9.2 ha in the West Ujimqin Banner, the Zhengxiangbai and
the Alxa Right Banner respectively. About 60% of the households used only stall
Hulun Buir
Xilin Gol
Ordos

129
feeding, and the others combined stall feeding in winter (November to March) and
local grazing in summer (April to October). More than 75% of respondents reported a
need to purchase or store forage.
The proportions of total income accounted for by agriculture decreased from 78%,
74% and 65% in these Banners respectively in 1995 to 54%, 42% and 41%
respectively in 2010. These changes resulted mainly from the reduced numbers of
livestock and the increased cost for grazing and fodder purchases. Between 1995 and
2010, the mean shares of agriculture-based income in the three banners decreased
from 72% to 46% and the share of employment-based income decreased from 65% to
60%.
(b) Effects of decrease in household dependence on local grasslands
From 1995 to 2010 (before and after implementation of the grassland conservation
policies), the household dependence on local grasslands generally decreased. This
indicates (1) a transition from traditional pastoral grazing to controlled grazing and
intensive animal husbandry; (2) diversification of income sources and decreases in
land-based employment; and (3) reductions of household food and bio-fuel
consumption, which is derived from local grasslands. These changes increased the
diversity of livelihoods and increased environmental sustainability. For instance, when
grazing is restricted to the local grasslands, herders must purchase fodder from outside
their area to feed their animals. In traditional animal husbandry, daily fodder was
obtained from each household‘s grassland. The traditional adaptation to fodder
shortage is to move to other pastures and is called ‗Otor‘ in Mongolian (Wang 2009).
However, at present the major components of livestock fodder are crop residues,
leaves from fodder plants and herbaceous plants from adjacent forests. The research
of Zhang and Wang (2012) also reported that many herders could not find pastures to
rent and had to buy forage or use crop residues directly in 2010. This indicates that
grasslands are no longer the only fodder sources. This change increased costs to
purchase and store forage, but it probably also avoids or alleviates the fodder crisis
caused by climate extremes (e.g. droughts and snow storms) and ecosystem
degradation (Dong et al. 2007; Wang and Zhang 2012).
Another aspect of increasing of household resilience is the diversification of income
sources. Similar to the results of Wan et al. (2008), rural livelihoods in Inner
Mongolia have increasingly shifted from subsistence agriculture and animal
husbandry to include non-agricultural, off-farm work for wages and government
subsidies in recent years. The proportion of total income accounted for by non-
agricultural income increased greatly. This is likely explained by the decreasing area
of grassland used for animal husbandry. The macro-level policy changes and micro-
level livelihood adjustments largely changed the land-use asset structure. For instance,
herders, who lost the right to access grassland, were more severely affected than those
who retained access to pastures under the grassland-conservation policy. Because
these changes were implemented rapidly, herders, who lost access to pasture, were
forced to sell most or all their livestock, although the government partially
compensated for this loss. On the positive side, this decreased their dependence on
grasslands and increased the rate of business operation and employment in non-
agricultural economic activities. Over 80% of the respondents in the three Banners
believed that finding urban employment was the best way to increase their income and
that diversification of income sources is crucial in securing their household
livelihoods. Especially in poorly-developed areas, off-farm employment and activities

130
could increase cash income and improve household resilience by increasing their
capacity (including acquired new skills and new opportunities) to earn money to cope
with possible shocks.
(c) Effects of changed livelihood dependence on perceptions of the future of
grassland use
Despite the severity of grassland degradation and the changes in their lifestyle, more
than 80% of the herders and farmers did not want to move to the city, for three main
reasons: lack of suitable skills, low education and a desire to preserve their culture.
Even herders and farmers with high levels of education and skills training felt strong
ties to their local social network and culture. However, herder and farmer perceptions
of the next generation‘s career choices showed different results and these differences
can be used to predict the next generation‘s dependence on the local grasslands. Of the
six career choices that they identified (animal husbandry, crop cultivation, migrate to
cities, establish a business, combine grazing with a part-time city job and other
opportunities), the most likely career choice for the next generation is moving to the
city to obtain a secure job. A common choice was also to start a business or combine
grazing with a part-time city job. Respondents in all three banners believed that crop
cultivation (<3%) and animal husbandry (<10%) were the least likely careers.
Because the respondents believed that the natural conditions greatly influenced crop
planting and animal husbandry, they felt that these careers could not guaranteed their
basic needs under the current poor environmental conditions and unstable climate.
They reported a high willingness to help their children free themselves from the
grasslands as 84% of the respondents thought sending their children to a big city to
improve their education and employment options would be good.
This raises new concerns. For example, as more people abandon the grasslands,
eventually too few remain to use or manage the grasslands. Since the grasslands have
coevolved with nomadic herders for millennia, this could lead to considerable
negative ecological effects. Although ecosystems are likely to recover in response to
reduced human pressure (Hoffmann et al. 2011), they may not recover to their original
state (König et al. 2015). Thus, grassland management needs to emphasize sustainable
use of grasslands.
7.2.5 What are the trade-offs between selected ecosystem services as a consequence
of the changing grassland utilization patterns? (RQ 5)
In order to analyse trade-offs between provisioning services (livelihoods based
consumption) with other ESs (vegetation and soil-trait based), a household
questionnaire survey and a quadrats-sampling plot survey were used to assess soil and
vegetation at sixteen sampling sites (including semi- desert steppe (five in Ordos),
typical steppe (four in Xilin Gol) and meadow steppe (seven in Hulun Buir)) to trace
the trade-offs between ecosystem state (i.e. functioning) and ESs under different
utilization patterns (i.e. non-use, light use, moderate use, intensive use and recovery)
of the IMAR grasslands.
(a) Effects of changes in grassland utilization on individual ecosystem services in
the three study sites
Provisioning services: the main production of grasslands for the herders‘ livelihoods
can be distinguished into three main commodities, which are meat (mutton and beef),
fodder (grass fodder) and bio-fuel (dry dung). All these commodities directly related
to the number of livestock and the results showed significantly different numbers of

131
livestock per household in the three areas. In Hulun Buir, herding of sheep (average of
52 sheep per household) and cattle (18) was the major breeding activity, whereas
herding of a smaller numbers of cattle (average of 4.2 per household) and sheep (2.4)
dominated household activity in Xilin Gol. In Ordos a few cattle (average of 0.8 per
household) and sheep (2.4) are raised for breeding activities. On the contrary, the
decision to raise more small animals, such as goats (average of 6 per household) and
chicken (16) in Ordos is clearly a pragmatic response to government initiatives that
stimulate less fodder consumption to prevent the continued degradation of the local
semi-desert steppe. Dry dung from livestock was an important biofuel and was widely
used in all three areas, but especially in Hulun Buir, where the annual per capita use
was 2878.kg. The high consumption of dried dung can be attributed to the higher
numbers of sheep and cattle. Herders used biofuel to support the needs of daily life,
including cooking, heating and heating bath water. Due to the great reduction in the
number of livestock in response to government policies to reduce grazing pressure on
the ecosystem, with especially severe reductions in Xilin Gol and Ordos, dry dung
cannot satisfy the household demand anymore so households use more new forms of
energy (e.g. coal, electricity) instead of dung.
Soil water retention services: In Hulun Buir, non-use grasslands shows the highest
value of soil water content (12%), the intensively used grasslands received the lowest
value of soil water content (7%). Similar to Hulun Buir, with the increase of
intensively used grasslands, soil-water content gradually reduced in Xilin Gol and
Ordos. The soil-water contents will likely be recover grasslands use is stopped,
initially in the recovery sites.
Soil nutrition regulating services: I measured soil nutrition contents (organic matter,
available N, available P and available K) to trace nutrition regulation services. The
results show a decreasing trend of soil nutrients along a gradient with increasing
intensification of grasslands. Organic matter and available N, P & K contents are
highest in Xilin Gol with non-used grasslands and did not show much difference
between light used and moderate used grasslands. Ordos has little used grassland with
the highest value of organic matter and available N and K contents after the earliest
demonstration site of grassland restoration in IMAR started two decades ago.
Primary production (Biomass) services: In general, total above-ground biomass
decreases with the intensity of grassland utilization. The ratio of edible grass and
above-ground biomass increases with the increasing intensity of grassland utilization.
The highest values of total above ground biomass were found in moderately used
grasslands in Hulun Buir and lightly used grasslands in Xilin Gol. The lowest total
above-ground biomass is found in the intensively used grasslands. The edible grass
ratio in the recovery projects is rather low, only 34% in Xilin Gol and 43% in Ordos.
Habitat services: Under the different utilization patterns, grasslands in Hulun Buir
shows the highest Shannon-Index value in lightly used grasslands, followed by
moderately used grasslands and a sharp reduction in the more intensively used
grasslands. However, the Margalef index and the Pielou index in Hulun Buir are both
the highest in moderately used grasslands. This is even slightly higher than in lightly
used grasslands. Unlike in Hulun Buir, the Shannon and Pielou index in Xilin Gol
clearly decease when lightly used grasslands are changed into moderately used
grasslands. This means that the typical steppe (Xilin Gol) is more vulnerable than the
meadow steppe with lower tolerance for intensive grassland utilization. In Ordos, the
grazing activities in most areas are restricted and prohibited. The results only show
132
small differences among non-used grasslands, lightly used grasslands and recovered
grasslands.
(b) Trade-offs between ecosystem services under different utilization patterns
The results of trade-offs between ESs under different utilization patterns show the
large spatial variation among the three study areas (Figure 7.1). In Hulun Buir,
moderately used grasslands have the highest rank score. This indicates that the sum of
total selected provision, regulating and supporting services is the highest. These
grasslands are followed by non-use, lightly used and intensively used grasslands. In
Xinlin Gol, lightly used and non-use grasslands also received the highest rank score,
followed by the moderately use used grasslands and recovery sites. In Ordos,
however, recovery sites have a higher rank score than lightly used grasslands. This
differs from Xinlin Gol‘s scores.
Thus, aggregated results for ESs are analysed with reference to the five different
utilization patterns of grazing (i.e. non-use, light use, moderate use, intensive use and
recovery). My data suggests that conservation of grasslands (i.e. non-use and light
use) should be encouraged because it delivers most ESs. Eigenbrod et al. (2010) also
found that protected areas in England have high levels of biodiversity and carbon
storage but only few recreation and agriculture services. Burkhard et al. (2012)
correlated the European demand for ESs and different CORINE land-cover classes
(http://ec.europa.eu/agriculture/publi/landscape/ about.htm) and found that habitat
classes that were important for conservation (e.g. such as peat bogs and natural
grassland), ranked high for their regulating services supply, but ranked low in their
provisioning services supply.
Increasing herd densities have increased grassland utilization beyond its threshold of
natural resilience, resulting in grassland degradation, the appearance of uncovered
land surface, and a respective increase in soil erosion (Feng & Zhao 2011, Li et al.
2011). To alleviate grassland degradation, my results also indicate that suitable
grassland utilisation can be achieved by considering the different grassland types (e.g.
meadow steppe, typical steppe and semi-desert steppe), thereby offering more
effective ways to protect the grassland ecosystems. For instance, the meadow steppe
has high resilience and tolerance to human activities, so a moderately use of these
grasslands is appropriate in this region. In contrast, fragile ecosystems, such as the
semi-desert steppe in Ordos, should be protected against anything more than light use.
I therefore conclude that light utilization of grasslands for exclusively livestock
grazing had several positive effects on vegetation. This also includes improved
environmental conditions by increasing primary production and supporting habitats.
Soil-retention and nutrient-regulating services were improved after the recovery
following prohibiting the use of grasslands by establishing fences. Nevertheless, long-
term intensively used grasslands (over grazing) showed negative effects on all
selected supporting and regulation services.

133
Table 7.1 Scores for ranking ecosystem services in the study areas as a function of the grassland utilization patterns
ESs
Utilization patterns in Hulun Buir Utilization patterns in Xilin Gol Utilization patterns in Ordos
No use Light use Moderate
use
Intensive
use No use Light use
Moderate
use Recovery No use Light use Recovery
Provisioning 0 1.0 2.0 3.0 0 1.0 2.0 0 0 1.0 0
Supporting Primary production 3.5 2.5 3.0 1.0 3.5 3.5 2.0 1.0 3.0 2.0 1.0
Habitat 2 3.3 3.7 1.0 1.3 3.0 2.7 3.0 1.7 2.0 2.3
Regulating Soil retention 4.0 1.5 3.0 1.5 4.0 2.5 1.0 2.5 3.0 1.5 1.5
Soil nutrients 4 2.8 2.3 1.0 3.3 2.0 2.0 2.8 2.3 1.0 2.8
Sum of rank scores for all services 13.5 11.1 14.0 7.5 12.1 12.0 9.7 9.3 10 7.5 7.6
Note: Values represent the rank score for each service for the amount of ecosystem services provided. The scores are based on the ranking of ecosystem services, and
higher scores represent higher provision of services. The detail of the score refers to Chapter 5.
134
7.2.6 What recommendations can be given to design feasible strategies and incentives
for sustainable management of IMAR’s grassland ecosystems (RQ 6)?
By combining household analysis (RQs 2, 3 and 4) and ecosystem-services analysis
(RQ5), China‘s ecological restoration projects have brought mostly positive effects to
the environment (e.g. water conservation and restoring ESs) and local participants
(changed production and consumption activities). However, the current too-low
payments will likely lead some herders to expand their grazing into restricted
grassland or increase their number of animals (over grazing), particularly if the
payment program ends (Box 7.3).
Box 7.3 Herders’ willingness to accept versus the public sector’s willingness
to pay for grassland restoration
Based on results of interviews of households and government officials, household‘s
income, willingness to accept (WTA) and the government officials‘ willingness to pay
(WTP) for grassland conservation was quantified. Such quantification aims to reveal
the factors that influenced their WTA or WTP preferences. The main ecological
conservation projects that are implemented in IMAR, included the Sloping Land
Conversion Project (SLCP) and the Grazing Prohibition Project (GPP). After
implementing these projects, the areas of cultivated land and grazing land both
decreased. As a result, herders‘ income from cultivation and animal husbandry
decreased, although income from sheep increased under the GPP because the high
compensation payment allowed herders to purchase enough fodder to maintain large
herds. In contrast, income from government compensation payments and off-farm
activities increased and became an important and stable income source for the herders.
Most of the herders want to continue the related payment for ecosystem services
(PES) projects to improve grassland conditions and they were willing to accept PES to
mitigate their economic losses. The average annual WTA of the herders was 625 CNY
ha-1
, which is much higher than the maximum amount that they receive now (270
CNY ha-1
). On the other hand, government officials acceptable an annual WTP of 528
CNY ha-1
to the herders. Although this amount is much higher than the current annual
payment of 270 CNY ha-1
, it is still less than the herders‘ desired WTA. The gap
between the herders‘ desired WTA and the government‘s acceptable WTP is about 97
CNY ha-1
year-1
.
The results of my study reflect a gap between herders‘ desired WTA and government‘s
acceptable WTP of 97 CNY ha-1
year-1
(Box 7.3). This indicates the conflicting
perspectives between government officials and herders. The government officials
considered the PES from both economic and ecological perspectives, whereas the
herders emphasized their income losses and basic cost of living. Thus, they related
their compensation standard to their reliance on grasslands and their willingness to
continue PES projects. Most of the herders and officials believed that China‘s central
and provincial governments should take responsibility for the compensation payments
and these payments should be paid in cash rather than in grain or training to obtain
skills that would enhance their off-farm income or permit additional farm activities
(e.g. the production of greenhouse vegetables). My findings have large implications
for designing an operational PES scheme for my study area. The herders have clearly
been experiencing economic losses from conservation activities, but, although they
wanted to participate in conservation activities, they also expected sufficient
compensation payments to mitigate their losses. Unfortunately, they want more

135
money than the government is willing to provide and the gap between WTA and WTP,
and the currently very low payments, likely lead some herders to expand grazing into
restricted grasslands or increase their number of animals.
My study confirms Bennett‘s (2008) results that some participants probably resist the
GPP and SLCP because they feel that they are not appropriately compensated to
participate and have no incentives to continue participating if the payments end. This
potentially jeopardizes the success of the GPP and SLCP. My results show that a
suitable design of compensation mechanisms for ecological restoration is essential to
encourage more sustainable use of grasslands. The PES approach has been applied
increasingly in both developed and developing countries (Engel et al 2008; Zhen and
Zhang 2011; Ren et al 2006; Wu et al 2012). However, little attention has been given
to the people to compensate those affected by PES projects based on the actual
changes in their livelihood caused by the project (in terms of their preferences,
perceptions and WTA, a PES scheme for protecting grasslands and the public
sector‘s WTP), to compensate those affected by PES projects based on the actual
changes in their livelihood caused by the project. Further research on these PES
complexities need to be encouraged.
7.3 Discussion of research methods and comparison with literature
My thesis most importantly aimed to integrative analyse the effects of conservation
policies on the livelihood of the people in IMAR and the interactions with the
grassland ecosystems. I especially focused on the different utilization patterns of ESs
and the dependence of the livelihood of local herders and other stakeholders on these
services. My thesis demonstrates a grassland management analysis that can be used to
bridge the gap between ecological and socio-economic analysis.
Integration of ecological and socio-economic research
In previous research in IMAR, the use of ESs was primarily analysed from the
perspective of engineering (management) science or natural science focusing on
interactions with geophysical processes (Lichtfouse et al. 2010). My research has also
integrated the socio-economic and ecological aspects of an ESs analysis to better
restore grasslands because only such multidisciplinary research fully addresses the
complexities of the land-use challenges and the human-nature interactions behind
these complexities.
Combination of field measurements and surveys
To analyse trade-offs between different grassland ESs, I focused on the mechanisms
of soil formation and vegetation dynamics that drive these trade-offs. In previous
studies, most investigators used remotely sensed data, such as Net Primary
Productivity (NPP) or NPP-based calculations of Soil Organic Carbon (SOC) (e.g.
Erb et al. 2009; Haberl et al. 2007) to approximate these processes. ‗Imperfect‘
proxies to estimate and quantify ESs (e.g. soil carbon stocks for climate regulation)
are thus often relied upon and it limits the findings and their applicability. I used field-
survey data that are more realistic and closer to the actual ‗on the ground‘ situation.
Stakeholder participation
I also emphasise the importance of stakeholder participation. I aimed to identify
research gaps by contrasting local sustainability issues (i.e. needs and constraints).
The primary focus was on the decision makers‘ side and mainly considered the
administrative level to gather information from ‗key players‘, who were responsible
136
for decisions and its implementation (Xu 2004). I regarded the framework of my PhD
research as specifically relevant for China since the state -and thus political decisions-
strongly affects land properties and land management even today. When including
participatory aspects in a research approach, understanding the strengths and
limitations of the stakeholder participation is essential (Reed et al. 2009). The role of
stakeholders in Inner-Mongolian-grassland management has thus far been poorly
discussed in international studies. Taylor (2006) indicated that the need to concentrate
on the role of humans in grassland management. In his words: ―grassland science
should be partnered with sound local pastoral knowledge.‖ Therefore, my research
approach specifically addressed the nexus of regional to local in the household
questionnaire and stakeholder workshops. I thus involved stakeholders at multiple
levels (e.g. grassland management officials and village headmen) and reflected on the
local interests and needs. Based on my transdisciplinary methodology the selected
stakeholders group enabled me to obtain a ‗good picture‘ of specific regions in IMAR.
This picture helped to identify the relevant social-ecological problems and to better
understand important regional sustainability constraints. My results are a starting
point to better understand the science-policy-interface between local needs and
internationally relevant results. My research framework can probably be transferred to
other regions in Inner Mongolia and to other grassland regions in the world.
Limitations and weaknesses
Due to my limited time and financial budget, my research also has some limitations
and weaknesses. For instance, 1) my ESs analysis excluded cultural services.
However, some studies show that, for example, ecotourism can have positive effects
on local livelihoods (e.g. König et al. 2015; Dou et al. 2016). Inner Mongolia
probably has high potential for ecotourism or cultural tourism. This will most likely
increase in the future as the result of growing Chinese incomes; 2) Primary
information on food consumption was collected through my household survey.
Although to increase the sampling‘s randomness and reduce the selection bias, I
interviewed key informants, who were familiar with the situation in each village and
who had conducted annual socioeconomic surveys to identify the criteria for the
village selection within each county. Household sampling is difficult to do without
introducing some form of selection bias when the sampling is not strictly random (Jill
et al. 1996, Hashimoto et al. 2005); 3). My field survey was conducted from 2011 to
2015 and provided ample data. However, greater accuracy and confidence in the
evidence could be achieved by including more field-survey data (from different areas)
and involving more stakeholders in the assessment. To quote de Groot et al. (2010)
―Empirical information on the quantitative relationship between land use and
ecosystem management and the provision of ESs at local and regional scales,
however, is still scarce.‖ My study partly fills this gap for IMAR.
7.4 Synthesis and management recommendations
(a) Changes in land-covers due to the Restoration program
Approximately half of IMAR‘s grassland area has suffered degradation due to over-
grazing during the past three decades (Zhang et al. 2013). Comparing remote sensing
data (from 1995, 2000, 2005 and 2010) and statistical data (Inner Mongolia Statistics
Bureau 2015b), I estimate that 70% of the grasslands in Inner Mongolia suffers from
overgrazing to varying degrees. This strongly alters the local social-economic
structure (livelihood of indigenous communities) and grassland ecosystem
functioning. My results show that grassland ecosystems are the basic natural resource
137
in the Inner Mongolia Autonomous Region, but are becoming increasingly sensitive to
human intervention. Suitable use of grasslands is an effective way to reduce
deterioration of these fragile ecosystems.
(b) Effects on livelihoods
The present grassland-conservation policy has led to adaptive changes in basic
household-consumption patterns of food, fuel and water, and their spatial distribution
by grassland types (i.e. meadow steppe, typical steppe and semi-desert steppe) in
IMAR. From 1995 to 2010, people increasingly switched diet from high meat
consumption to agricultural crops (e.g. staple foods, vegetables and fruits) in all three
surveyed grassland types. Fuel consumption patterns changed from being dominated
by bio-fuels (dung) to being dominated mainly by electricity and gas. However, bio-
fuel remains a major energy source for daily life in the meadow-steppe ecosystems.
Due to its geographic location in arid and semi-arid areas, IMAR faces growing
pressures on limited water resources. Fortunately, the changed household food
consumption pattern helped to decrease water consumption, both direct water use and
indirect water use.
The grassland conservation policy also affected the household dependence on local
grasslands. My findings show that affected households changed the use of their land
and this resulted in a fundamental transformation of their lifestyles: their farming and
grazing activities and consumption behaviours have changed. Most households
developed adaptation measures (e.g. seeking off-farm work, leasing pasture land,
increasing purchases of fodder for stall-fed animals and altering their diet and fuel
consumption) to compensate for the lower dependence on local grasslands.
(c) Effects on ecosystem services
My thesis research revealed that, as increasing numbers of residents abandon the
grasslands, few remain to use or manage the grasslands in the future. Since the
grasslands have coevolved with nomadic herders for millennia, this could lead to
considerable negative ecological effects. Although grasslands are likely to recover in
response to reduced human pressure, I found that light use generally provided higher
levels of ESs than intensive use and no-use in the meadow steppe and typical steppe,
with the main differences in habitat and supporting ESs. Surprisingly, I found no
consistently positive effects of strict conservation activities across the sites because
the results varied spatially and with respect to differences in the land-use patterns.
(d) Management recommendations
To improve grassland management, my study suggests that appropriate grassland-
utilization patterns can enhance the supply of ESs and reduce negative effects on both
people‘s livelihoods and the environment. Appropriate grassland-utilization patterns
depend on many factors, such as geographic location (grassland types, access ability),
economic development (purchasing ability) and traditional culture. To encourage
community-based grassland management, implementing agencies need to be more
aware of these alternative options and have the willingness and capacity to adopt a
flexible and participatory approach to grassland policy implementation.
The design of suitable financial compensation mechanisms could encourage more
efficient use of grasslands. My results show that the present grassland conservation
policy has decreased the trend of grasslands degradation but a key challenge now is to
sustain the livelihood of local residents, who earn most of their income from
traditional animal husbandry. The herders were most concerned about their economic

138
loss, whereas the government considered both grassland restoration and income
protection to be important. To create an improved and sustainable PES scheme, I
recommend to increase the amount of PES that will let the herders sustain their
livelihoods, while conserving the grasslands.
The focus of land management should shift from solely agricultural production to
include a broader range of ecological and environmental objectives. Beneficial
changes in integrated grassland management resulted thus far from more extensive
management, but at the cost of reduction in total animal output and, in some cases, a
reduction in individual animal performance.
To achieve many of these changes is clearly a long-term process and this must be
recognized by policy makers. Future grassland management should focus more on
policy instruments (e.g. PES, grassland laws and legislation), other livestock systems
and technologies (grassland utilization patterns by changing feed and breeding
systems), new institutional arrangements (tenure and administration), new production
and marketing structures, better prices and marketing, and social aspects (education
and poverty alleviation), rather than single purpose measures of grazing prohibition,
migration and resettlement.
7.5 Future research directions
Firstly, future research should address how to manage potential conflicts that arise
from intensified use of IMAR‘s grasslands and related household sustainability, while
simultaneously protecting grassland biodiversity and ESs. Appropriate grassland-
utilization patterns and suitable design of ecological and financial compensation
mechanisms can enhance the supply of ESs and reduce environmental and livelihood
impacts. Thus, more integrated research at household level is needed to develop and
implement appropriate ecological compensation mechanisms.
Secondly, future studies should focus on longer-term in-situ observations to better
understand ecological restoration processes. To develop better science-based
grassland restoration strategies, ecological research on the policy effects on grassland
plant diversity, soil seed banks and other ecological processes should be strengthened,
by means of combined method of plot survey and remote sensing monitoring. The
timing of excluding grazing under different degrees of grassland degradation and
grassland adaptability or resilience to climate change, including extreme weather and
climate events, should be studied. Finding ways to scientifically assess the necessary
key factors (e.g. soil, climate, management and their interactions) that determine the
dynamics of ecosystems and their ESs, help the development of better management
plans.
Thirdly, I only included five ESs in my study. Although my conclusions are robust for
these ESs and they can probably extrapolated to other services, more complete or
robust conclusions on the overall effects of different land-utilization patterns on ES
trade-offs and synergies, future studies should include the full suite of cultural,
provisioning, regulation and supporting services.
Finally, methods, such as difference in indicator selection for an ESs assessment or
household analysis and their sensitivity tests should be applied to identify or account
for possible hidden biases that are caused by currently ignored factors. An example is
the sampling bias on household consumption and ES use, which can be reduced by
adding more surveys at the village level (e.g. to select all households in a village or
obtain a more robust random sample).
139
My research demonstrates that an integrated approach, combining field measurements
and household surveys can assess ESs trade-offs and synergies in a practical way
across a diverse range of ecosystem types, management regimes and grassland-
utilization patterns. This is of particular benefit to evaluate national or regional
conservation policies and provide evidence to support policy decisions. My research
identified several relevant social-ecological problems in IMAR and helped to better
understand important regional sustainability constraints. My results could serve as a
model to better understand the effects of policies on local communities‘ livelihoods
and the interactions with their environment in grassland ecosystems.

140

141
APPENDIXES
Appendixes

142

143
Appendix 1: Implementation Measures of the Returning Grazing Land to Grassland Program
Year Major Measures Details
2003 Improve the household
responsibility system.
Divide grazing land with individual household as the basic
unit of grazing land management, issue grassland use right
licenses to herders who participate in the program and
define their rights and obligations.
Determine livestock numbers
based on the area of grassland
and control stocking rates.
Control the No. of livestock grazing on areas where grazing
is banned temporarily or rotational according pasture‘s
carrying capacity, to prevent overgrazing and achieve the
grassland-livestock balance.
The program is a joint effort of
the central government, local
governments and individual
farmers and herders, and
government subsidies for the
program include a cash
subsidy and a subsidy in the
form of forage. Provincial
governments may adjust the
amount of subsidies according
to the actual situation as long
as it is within the specified
total amount of government
subsidies.
The forage subsidy will not be offered to herders who
choose rotational grazing; herders who let grassland rest for
a whole year will get forage of 5.5 kg mu-1
year-1
; for
seasonal rest (at least 40–60 days), the central government
will offer a subsidy of 1.4 kg mu-1
year-1
; herders who build
fence around the grassland assigned to them will receive a
subsidy of 16.5 CNY mu
-1, 70% of which is provided by the
central government and the other 30% of which is paid by
local governments and individuals; the subsidy for forage
provided by the government is 0.9 CNY kg-1
without
interest, and it will be distributed to provincial governments
which are responsible for procurement of forage; the
transport expenses of forage shall be borne by local finance
departments and included in local government budgets. The
forage subsidy will be offered for a continuous period of
five years.
Provincial governments have
the full responsibility for
management of the grassland
restoration program.
The central government will assign tasks, allocate funds and
distribute forage to provincial governments. Provinces
(IMAR) shall then assign tasks and allocate funds to
governments at municipal, county (banner) and township
levels and build accountability in local governments.
2011 Rationally plan the layout of
grassland fence.
Put the construction of fence for rotational grazing and
seasonal rest at top of the program agenda. Expand the
scope of grassland management in Karst areas.
Build covered livestock pens
and stables and cultivate
artificial grassland.
Build an 80m2 livestock pen for each participating
household that does not have one. Plant grass in areas
(within the implementation scope of the program) which
have stable surface water sources to solve feed shortages.
Increase the proportion of
investment and subsidy
standards of the central
government.
The proportion of the central investment subsidy for fence
construction is raised from 70% to 80% and accordingly the
proportion of the fence construction subsidy from local
governments is lowered from 30% to 20%. For fence
constructions in IMAR, the subsidy that is offered by the
central government, is raised from 14 to 16 CNY mu-1
. The
seedling subsidy for grassland restoration from the central
government is raised from 10 to 20 CNY mu-1
. The subsidy
for artificial grassland construction from the central
government is 160 CNY mu-1
and the central government
subsidy for livestock pen construction is 3000 CNY per
household.
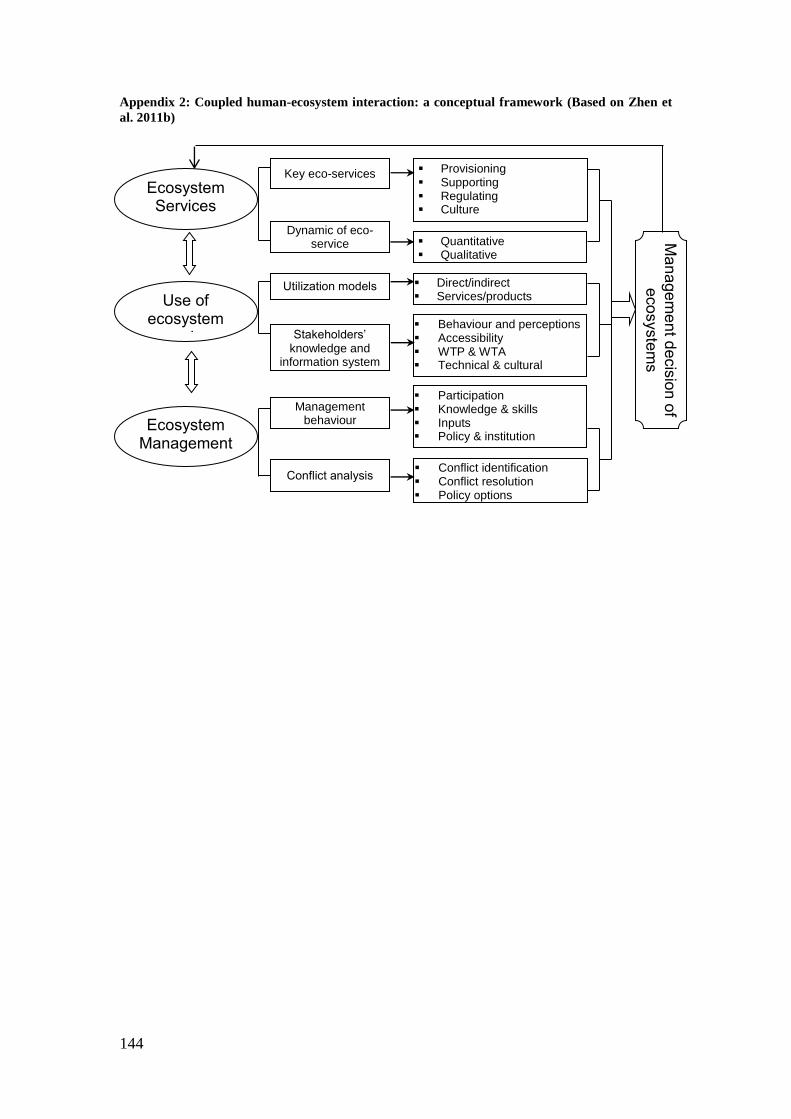
144
Appendix 2: Coupled human-ecosystem interaction: a conceptual framework (Based on Zhen et
al. 2011b)
Key eco-services
Dynamic of eco-service
Utilization models
Ecosystem Management
Use of ecosystem
service
Management behaviour
Conflict analysis
Behaviour and perceptions Accessibility WTP & WTA Technical & cultural
Stakeholders’ knowledge and
information system
Direct/indirect Services/products
Quantitative Qualitative
Participation Knowledge & skills Inputs Policy & institution
Conflict identification Conflict resolution Policy options
Ma
na
ge
me
nt d
ecis
ion
of
eco
syste
ms
Ecosystem Services
Provisioning Supporting Regulating Culture

145
Appendix 3a: The human-ecological system in the Inner Mongolia Autonomous Region in 1950s
Note: Green line is the boundary line of local social-ecological system.
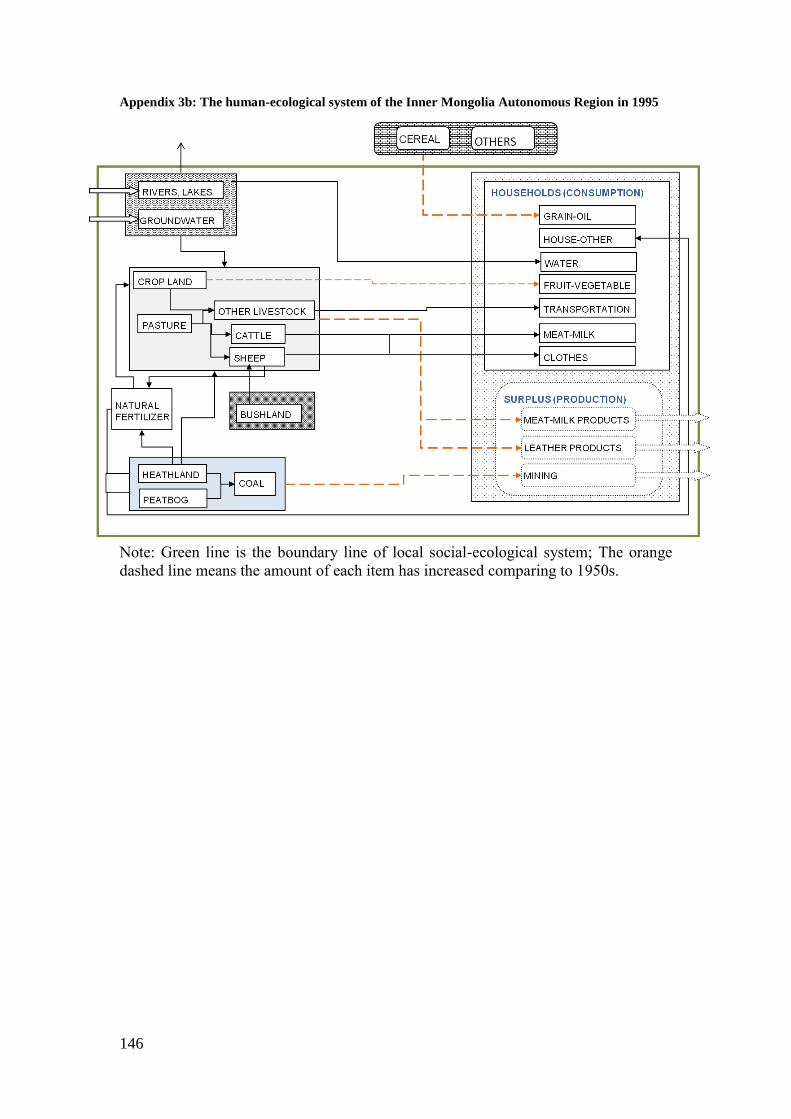
146
Appendix 3b: The human-ecological system of the Inner Mongolia Autonomous Region in 1995
Note: Green line is the boundary line of local social-ecological system; The orange
dashed line means the amount of each item has increased comparing to 1950s.

147
Appendix 3c: The human–ecological system of the Inner Mongolia Autonomous Region in 2010
Note: Green line is the boundary line of local social-ecological system;
The red dashed line means the amount of each item has greatly increased; and
The blue line means s the amount of each item has sharply decreased comparing to
1995.

148
Appendix 4: Detailed Research Framework for PhD project
Ecol.
Step 1. Natural resources mapping (RQ1)
Step 2. Changes of ecosystem services (RQ 2&4)
Ecosystem
services
Biophysical
structure or
process
Step 3. Changes of livelihood (RQ 3)
Specification ecosystem area, stakeholders,
management projects & policy
Step 4. Trade-offs effects of changes in management (spatial and temporal ) (RQ 5)
Goal: Sustainable management of the Inner Mongolian grasslands (RQ 6)
Second hand
data field plot sampling
Household survey
and stakeholder workshop
Provision service
Virtual Water Content Method
Flow of research steps
Flow of information
Main steps for each RQ Supported tools
Source of information Goal
Socio- Econ.
Livelihood Dependency
Analysis
Health &
well-being
Income
& lifestylePopulationWater regulating service
Nursery habitat service
Soil conservation service Comparison analysis
under different use of grassland
Ecological and
social-economic intervention
•Domestic consumption
•Asset compositions and income•Cultivation activity

149
Appendix 5: Questionnaire for household investigation - grasslands’ use-patterns at the community level
No. of questionnaire:________ Date:___D___ M__ ___ Y GPS coordinates:N____________,E___________,Elevation ___________
Household investigation on grasslands’ use-patterns at the community level
Address: League City Banner (county) Township (Sumu) Village (Community) Name of respondent Tel.
1. Basic information
1.1 HOUSEHOLD INFORMATION
Gender Age Ethnic group Education level Main occupation Please indicate where your family lives now:
Distance to highway (km);
Distance to center of banner (km); How long do you live? (years) ;
If less than 15 years, where did you move
from?
Respondent
Adults
Children
Note: 1-Male
2-Female
1-Han, 2-Mongolian, 3-Hui, 4-Manchu and 5-Other (Oroqen/Daur/Ewenki/Xibo)
1-None, 2-Preliminary school (number of years), 3-Middle school, 4-High school, 5-College, 6-university and above
1-Famer, 2-Herder, 3- Enterprise, 4- Service Industry (Medical and Health, Catering, Government, Organization, etc.), 5-Student, 6-part time job in outside, 7-Others
1.2 LAND USE CHANGE
Type of vegetation
Current (after 2010)
Before (before1995) Distance to
house(km) Area(mu) Area(mu)
Arable land
Gra
ssla
nd
s
Total
Seasonal grazing
Grazing prohibition
Rotational grazing
Reconvert grain-land to grasslands
Mow grasslands
Forest
Mining
Others:_____
2. Household income and expenditure
Types (Unite: CNY/Yr)
Current (after 2010) Before (before1995)
Income Expenditure Net
income Income Expenditure
Net income
Crop production
Livestock
Compensation, subside
Self-employ
Employ (job)
Others: _____
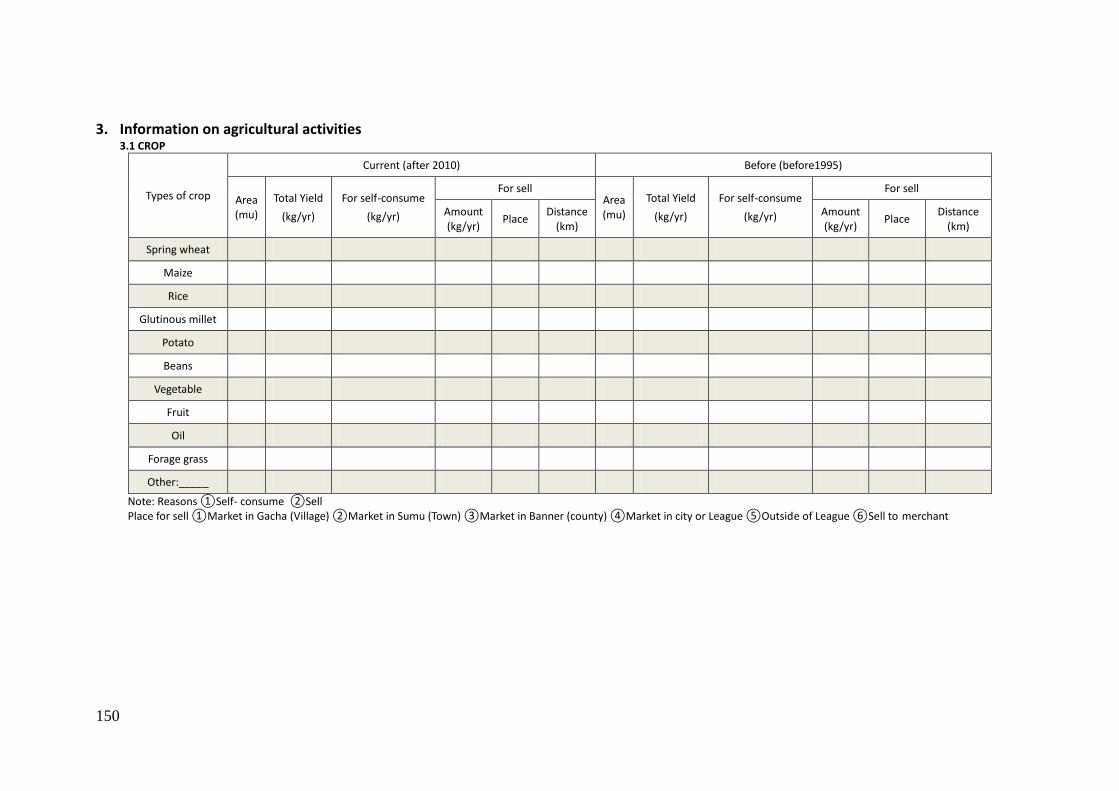
150
3. Information on agricultural activities 3.1 CROP
Types of crop
Current (after 2010) Before (before1995)
Area (mu)
Total Yield
(kg/yr)
For self-consume
(kg/yr)
For sell Area (mu)
Total Yield
(kg/yr)
For self-consume
(kg/yr)
For sell
Amount (kg/yr)
Place Distance
(km) Amount (kg/yr)
Place Distance
(km)
Spring wheat
Maize
Rice
Glutinous millet
Potato
Beans
Vegetable
Fruit
Oil
Forage grass
Other:_____
Note: Reasons ①Self- consume ②Sell Place for sell ①Market in Gacha (Village) ②Market in Sumu (Town) ③Market in Banner (county) ④Market in city or League ⑤Outside of League ⑥Sell to merchant
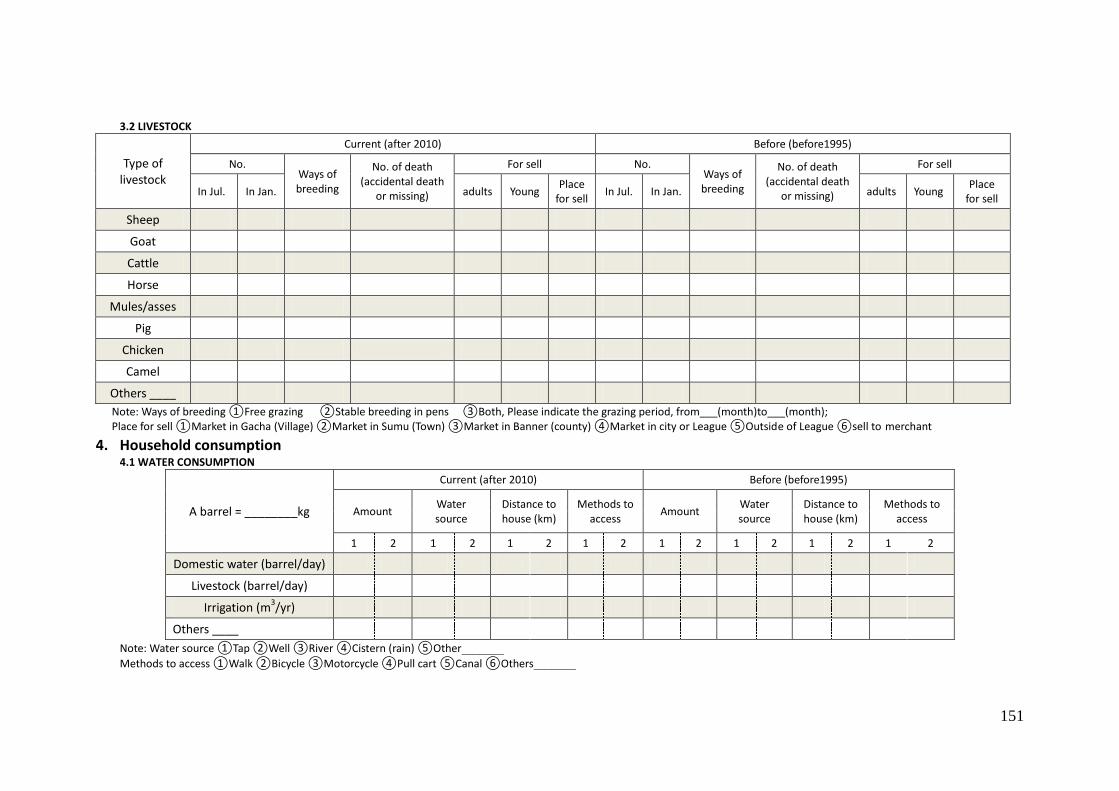
151
3.2 LIVESTOCK
Type of livestock
Current (after 2010) Before (before1995)
No. Ways of breeding
No. of death (accidental death
or missing)
For sell No. Ways of breeding
No. of death (accidental death
or missing)
For sell
In Jul. In Jan. adults Young Place
for sell In Jul. In Jan. adults Young
Place for sell
Sheep
Goat
Cattle
Horse
Mules/asses
Pig
Chicken
Camel
Others ____
Note: Ways of breeding ①Free grazing ②Stable breeding in pens ③Both, Please indicate the grazing period, from___(month)to___(month); Place for sell ①Market in Gacha (Village) ②Market in Sumu (Town) ③Market in Banner (county) ④Market in city or League ⑤Outside of League ⑥sell to merchant
4. Household consumption 4.1 WATER CONSUMPTION
A barrel = ________kg
Current (after 2010) Before (before1995)
Amount Water source
Distance to house (km)
Methods to access
Amount Water source
Distance to house (km)
Methods to access
1 2 1 2 1 2 1 2 1 2 1 2 1 2 1 2
Domestic water (barrel/day)
Livestock (barrel/day)
Irrigation (m3/yr)
Others ____
Note: Water source ①Tap ②Well ③River ④Cistern (rain) ⑤Other
Methods to access ①Walk ②Bicycle ③Motorcycle ④Pull cart ⑤Canal ⑥Others
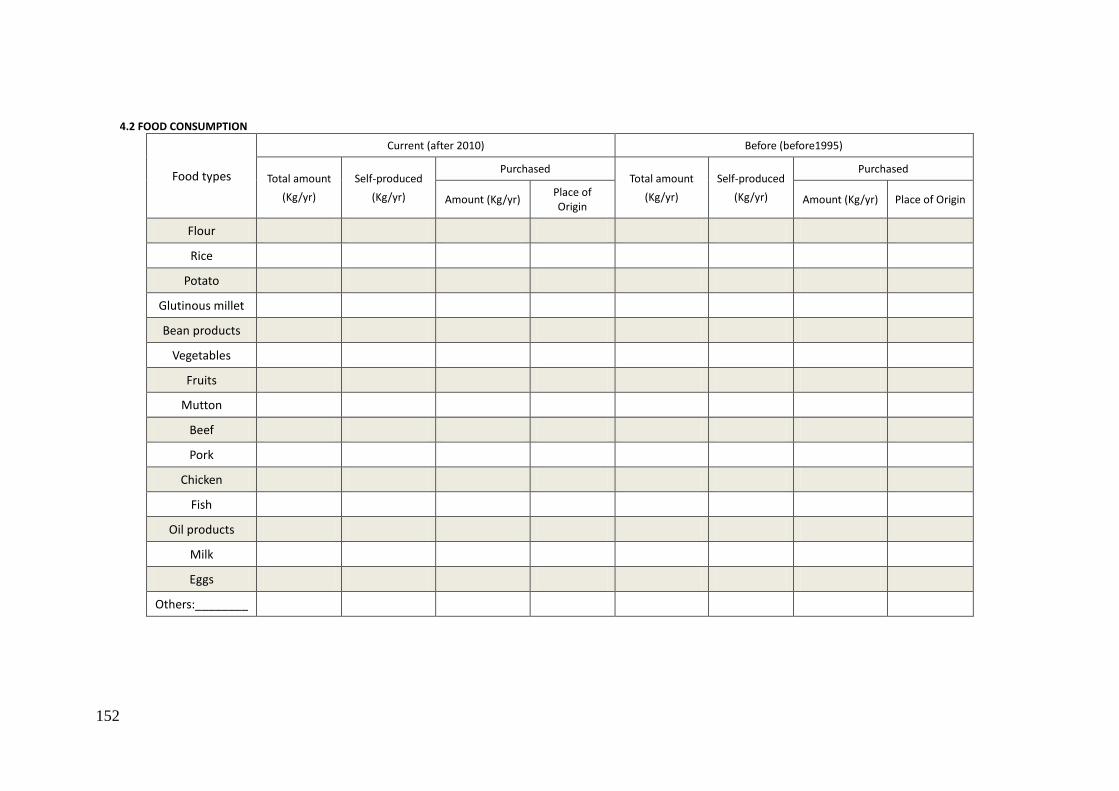
152
4.2 FOOD CONSUMPTION
Food types
Current (after 2010) Before (before1995)
Total amount
(Kg/yr)
Self-produced
(Kg/yr)
Purchased Total amount
(Kg/yr)
Self-produced
(Kg/yr)
Purchased
Amount (Kg/yr) Place of Origin
Amount (Kg/yr) Place of Origin
Flour
Rice
Potato
Glutinous millet
Bean products
Vegetables
Fruits
Mutton
Beef
Pork
Chicken
Fish
Oil products
Milk
Eggs
Others:________

153
4.3 FORAGE CONSUMPTION
Type of livestock
Current (after 2010) Before (before1995)
Total amount
(Kg/yr)
Purchased Total amount
(Kg/yr)
Purchased Total amount
(Kg/yr)
Purchased Total amount
(Kg/yr)
Purchased
Amount
(Kg/yr)
Place of Origin
Amount
(Kg/yr)
Place of Origin
Amount Place of Origin
Amount(Kg/yr)
Place of Origin
Sheep
Goat
Cattle
Horse
Mules/asses
Pig
Chicken
Camel
Others:_____
Major composition of crop forage (1) name:, % of total crop forage; (2) name:, % of total crop forage;
(3) name:, % of total crop forage; (4) name:, % of total crop forage. Note: ①Corn straw ②Corn ③wheat bran ④Soybean ⑤Cottonseed ⑥Additive ⑦Others
Major composition of grass forage (1) name:, % of total grass forage; (2) name:, % of total grass forage;
(3) name:, % of total grass forage; (4) name:, % of total grass forage. Note: ①Carex ②Caragana ③Stipa ④Splendid Achnatherum ⑤Leymus chinensis ⑥Potentilla ⑦Artemisia frigida ⑧Cleistogenes squarrosa ⑨Allium mongolicum ⑩Others

154
4.4 FUEL CONSUMPTION
Type of bio-fuel
Current (after 2010) Before (before1995)
Total amount
Purchased Gathered Total
amount
Purchased Gathered
Amount Place of Origin
Amount Place Distance to house(km)
Amount Place of Origin
Amount Place Distance to house(km)
Dry dung (k
g/y
r)
Hay
Straw
Core-wood
Other________
Type of other fuel
Current (after 2010) Before (before1995)
Total amount
Purchased Gathered Total
amount
Purchased Gathered
Amount Place of Origin
Amount Place Distance to house(km)
Amount Place of Origin
Amount Place Distance to house(km)
Coal
(CN
Y/yr
)
Gas
None
None Electricity
Solar energy
Other_______

155
5. Perception on local ecosystem and willing to pay for ESs of grasslands Does the local grassland bring you cultural and landscape aesthetic enjoyment while providing basic means of productions for living? (What do you think of the unique
grassland culture and natural scenery?) ①Yes ②No If yes → If the local grassland is destroyed, are you willing to pay for the protection of the grassland from your personal income?
(1) YES, How much? CNY/yr/capita ①5 ②10 ③20 ④30 ⑤40 ⑥50 ⑦70 ⑧100 ⑨150 ⑩200
(2) NO, Why? .
How has the condition (environment) of grasslands changed in general? ①Better, why? .
② Worse, why? . ③No changes, why?.
Are you willingness to move outside of grasslands ①Yes ②No, why? . Perception of the next generation’s probable career choices ①Grazing with part time job in city, ②Business, ③Immigrate to city, ④Crop cultivation, ⑤Animal
husbandry, ⑥Others.

156
Appendix 6: List of potential ecosystem services for assessment based on the results of our
literature review.
Service/functions Services de Groot et al.
(2002)
Millennium Ecosystem
Assessment (2005)
Production
function/service
Food X X
Raw material X
Genetic resources X
Fresh water X
Fuel X
Habitat/supporting
service
Refugium functions X
Nursery X
Primary production X
Maintenance of
genetic diversity
X
Regulating
function/service
Gas regulation X X
Climate regulation X X
Pollination X
Water regulation X
Water supply X
Soil retention X
Nutrient regulation X
Disturbance
prevention
X
Biological control X X
Water purification X
Information/
cultural service
Aesthetic
information
X X
Recreation X X
Spiritual and historic
information
X X
Cultural and artistic
information
X
Science and
education
X X
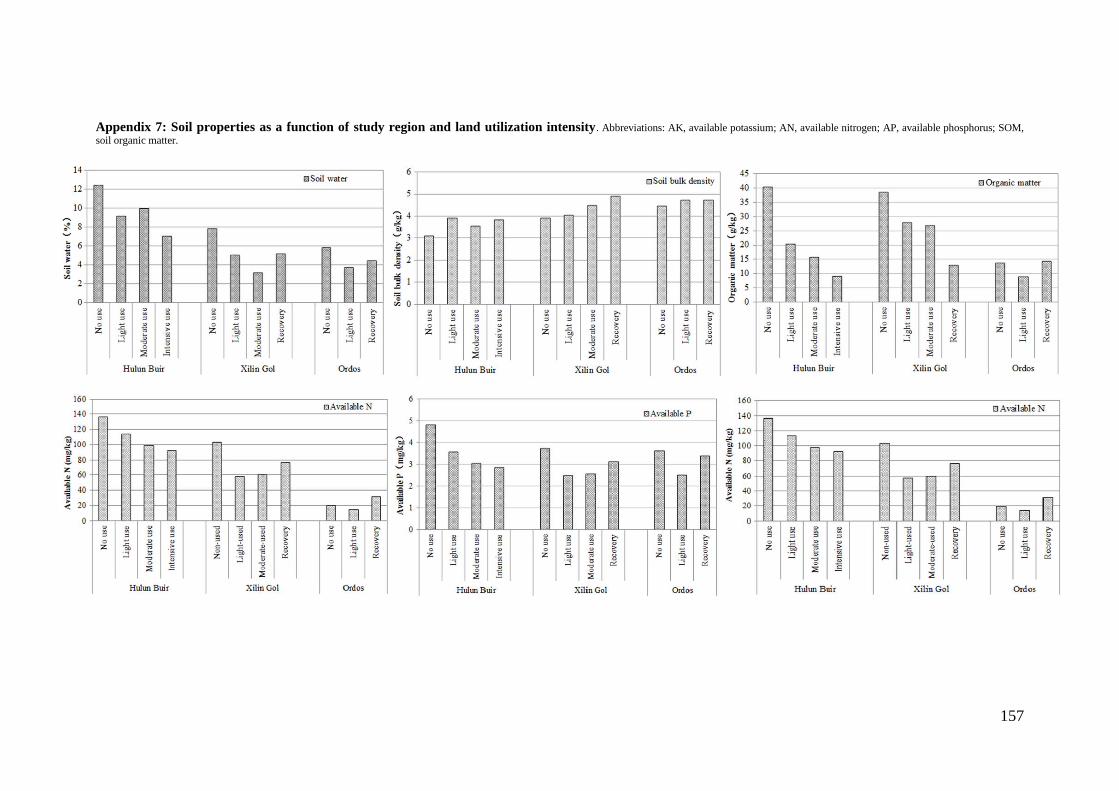
157
Appendix 7: Soil properties as a function of study region and land utilization intensity. Abbreviations: AK, available potassium; AN, available nitrogen; AP, available phosphorus; SOM,
soil organic matter.
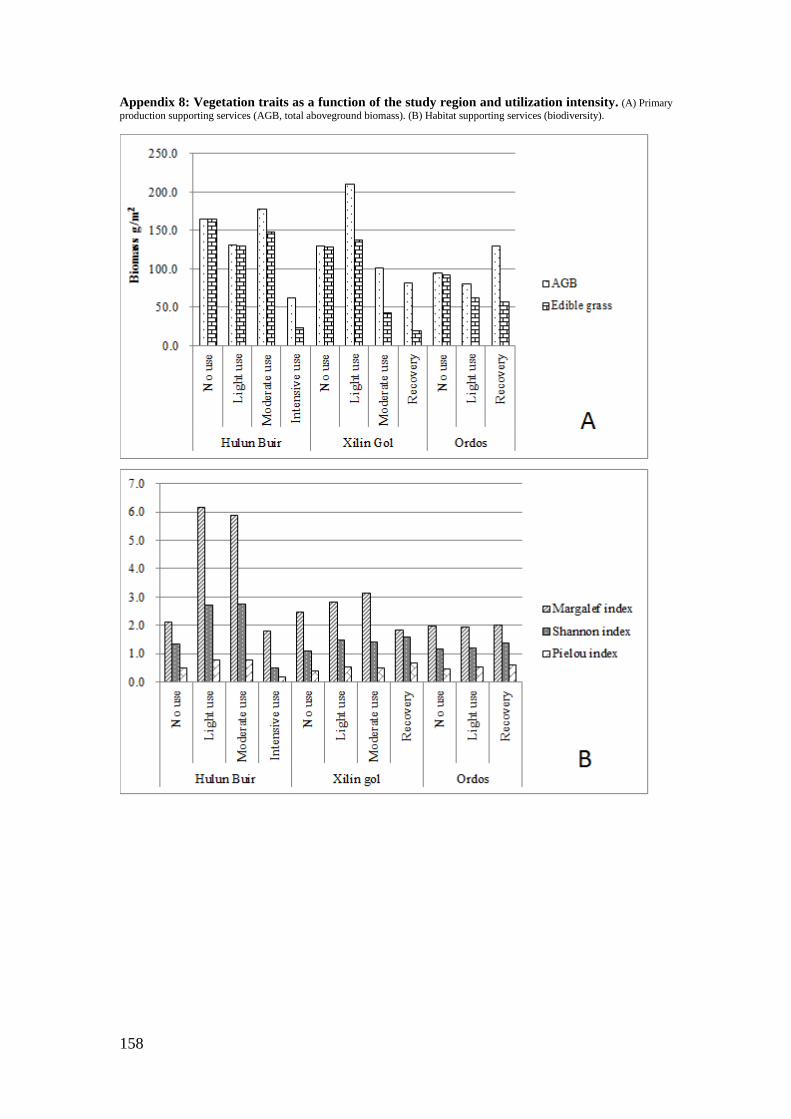
158
Appendix 8: Vegetation traits as a function of the study region and utilization intensity. (A) Primary
production supporting services (AGB, total aboveground biomass). (B) Habitat supporting services (biodiversity).
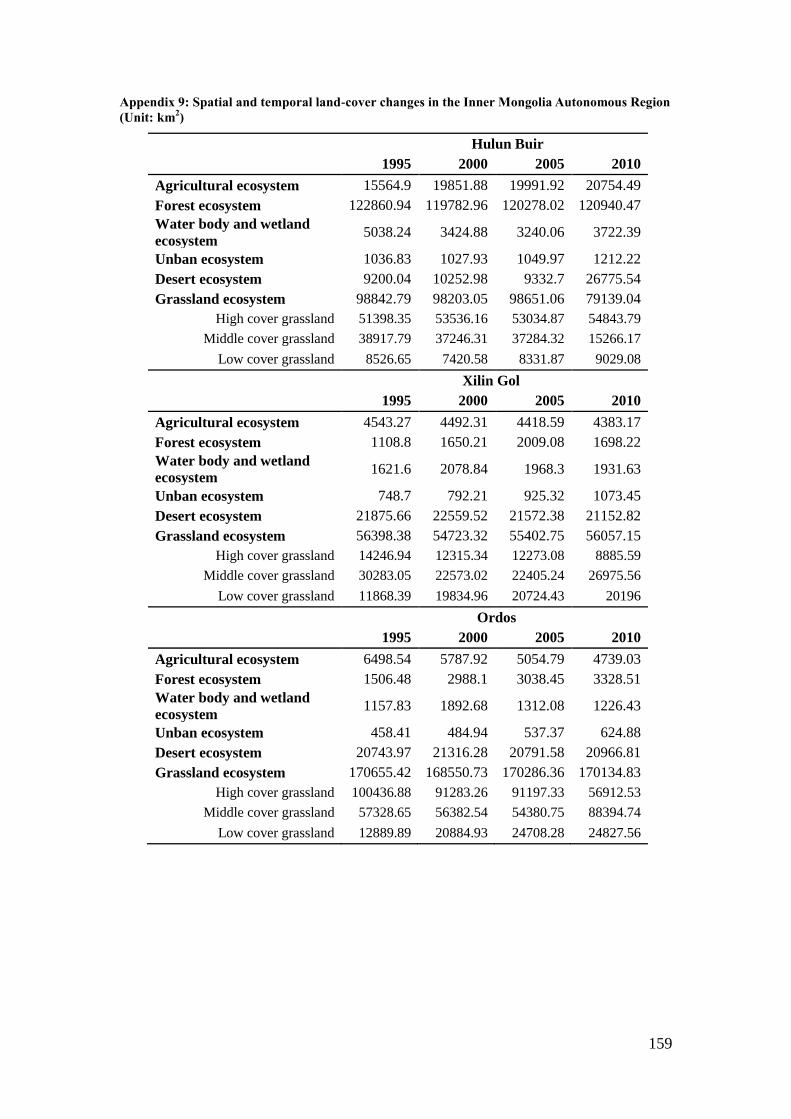
159
Appendix 9: Spatial and temporal land-cover changes in the Inner Mongolia Autonomous Region
(Unit: km2)
Hulun Buir
1995 2000 2005 2010
Agricultural ecosystem 15564.9 19851.88 19991.92 20754.49
Forest ecosystem 122860.94 119782.96 120278.02 120940.47
Water body and wetland
ecosystem 5038.24 3424.88 3240.06 3722.39
Unban ecosystem 1036.83 1027.93 1049.97 1212.22
Desert ecosystem 9200.04 10252.98 9332.7 26775.54
Grassland ecosystem 98842.79 98203.05 98651.06 79139.04
High cover grassland 51398.35 53536.16 53034.87 54843.79
Middle cover grassland 38917.79 37246.31 37284.32 15266.17
Low cover grassland 8526.65 7420.58 8331.87 9029.08
Xilin Gol
1995 2000 2005 2010
Agricultural ecosystem 4543.27 4492.31 4418.59 4383.17
Forest ecosystem 1108.8 1650.21 2009.08 1698.22
Water body and wetland
ecosystem 1621.6 2078.84 1968.3 1931.63
Unban ecosystem 748.7 792.21 925.32 1073.45
Desert ecosystem 21875.66 22559.52 21572.38 21152.82
Grassland ecosystem 56398.38 54723.32 55402.75 56057.15
High cover grassland 14246.94 12315.34 12273.08 8885.59
Middle cover grassland 30283.05 22573.02 22405.24 26975.56
Low cover grassland 11868.39 19834.96 20724.43 20196
Ordos
1995 2000 2005 2010
Agricultural ecosystem 6498.54 5787.92 5054.79 4739.03
Forest ecosystem 1506.48 2988.1 3038.45 3328.51
Water body and wetland
ecosystem 1157.83 1892.68 1312.08 1226.43
Unban ecosystem 458.41 484.94 537.37 624.88
Desert ecosystem 20743.97 21316.28 20791.58 20966.81
Grassland ecosystem 170655.42 168550.73 170286.36 170134.83
High cover grassland 100436.88 91283.26 91197.33 56912.53
Middle cover grassland 57328.65 56382.54 54380.75 88394.74
Low cover grassland 12889.89 20884.93 24708.28 24827.56

160
Appendix 10: Spatial and temporal variation of overall habitat quality of grasslands in the Inner
Mongolia Autonomous Region
Hulun Buir
Hulun Buir Hulun Buir
Hulun Buir
Xilin Gol Xilin Gol
Ordos Ordos
Xilin Gol Xilin Gol
Ordos Ordos

161
REFERENCES
References

162
163
Ayensu E., Claasen D.V., Collins M., Dearing A., Fresco L., Gadgil M., Gitay H., Glaser G.,
Juma C., Krebs J., Lenton R., Lubchenco J., McNeely J.A., Mooney H.A., Pinstrup-
Andersen P., Ramos M., Raven P., Reid W.V., Samper C., Sarukhán J., Schei P.,
Tundisi J.G., Watson R.T., Guanhua X., Zakri A.H. 1999. International ecosystem
assessment. Science 286: 685–686.
Abubakar S.M. 1997. Monitoring land degradation in the semiarid tropics using an inferential
approach: the Kabomo Basin case study, Nigeria. Land Degradation Development 8:
311–323.
Abson D.J. and Termansen M. 2011. Valuing ecosystem services in terms of ecological risks
and returns. Conservation Biology 25: 250–258.
Allison E.H., Horemans B.P. 2006. Putting the principles of the sustainable livelihoods
approach into fisheries development policy and practice. Marine Policy 30: 757–766.
Alxa Right Banner Statistics Bureau (ARBSB). 2010. Annual Social and Economic Reports
of Alxa Right Banner in 2010. Alxa Right Banner Statistics Bureau: Alxa league,
China.
Akiyama T., Kawamura K. 2007. Grassland degradation in China: methods of monitoring,
management and restoration. Grassland Science 53, 1–17.
Arrow K., Daily G., Dasgupta P., Levin S., M¨aler K., Maskin E., Starrett D., Sterner T.,
Tietenberg T. 2000. Managing ecosystem resources. Environmental Science &
Technology 34: 1401–1406.
Babatunde R.O., and Qaim, M. 2010. Impact of off-farm income on food security and
nutrition in Nigeria. Food Policy 35, 303–311
Bai Y., Wu J., Clark C.M., Naeemz S., Pan Q., Huang J., Hang L., Han X., 2010. Tradeoffs
and thresholds in the effects of nitrogen addition on biodiversity and ecosystem
functioning: Evidence from inner Mongolia Grasslands. Global Change Biology 16:
358–372.
Bakelaar R.G., Odum E.P. 1978. Community and population level responses to fertilization in
an old-field ecosystem. Ecology 59: 660–665.
Balmford A., Bruner A., Cooper P., Costanza R., Farber S., Green R.E. et al. 2002. Economic
reasons for conserving wild nature. Science 297: 950–953.
Bai Y., Han X., Wu J., Chen Z., Li L. 2004. Ecosystem stability and compensatory effects in
the Inner Mongolia grassland. Nature 431: 181–184.
Bao S.D. 2000. Soil Chemical Analysis of Agriculture. Chinese Agriculture Press: Beijing,
China. (in Chinese).
Bao L. 2006. Review of Literature on China's Returning Grazing Land to Grassland Policy.
Issues in Agricultural Economy 8: 62–65.
Bao X.J.R. 2009. An Empirical Research on Grassland Use Patterns in Xilingol League: A
Case Study in Xilinhaote and Abage Inner Mongolia. Inner Mongolia Agricultural
University: Hohhot, China. (in Chinese with English summary)
Barbier E.B. 2005. Natural Resources and Economic Development. Cambridge: Cambridge
University Press.
Barthold F.K., Wiesmeier M., Breuer L., Frede H.G., Wu J., Blank F.B. 2013. Land use and
climate control the spatial distribution of soil types in the grasslands of Inner
Mongolia. Journal of Arid Environments 88: 194–205.
Bennett M.T. 2008. China‘s sloping land conversion program: institutional innovation or
business as usual? Ecological Economics 65: 699–711.
164
Bennett E.M., Peterson G.D., Gordon L.J. 2009. Understanding relationships among multiple
ecosystem services. Ecology Letters 12: 1394–1404.
Benjamin B., Kroll F., Nedkov S., Müller F., 2012. Mapping ecosystem service supply,
demand and budgets. Ecological Indicators 21: 17–29.
Bernard F., de Groot R.S., Campos J.J. 2009. Valuation of tropical forest services and
mechanisms to finance their conservation and sustainable use: a case study of
Tapant´ı National Park, Costa Rica. Forest Policy & Economic 11:174–183.
Bessembinder J.J.E., Leffelaar P.A., Dhindwal A.S., Ponsioen T. 2005. Which crop and which
drop, and the scope for improvement of water productivity. Agricultural Water
Management 73: 113–130.
Bhatt B.P. and Sachan M.S. 2004. Firewood consumption patterns of different tribal
communities in Northeast India. Energy Policy 32: 1–6.
Bjornstad D.J. and Kahn J.R. 1996. Structuring a research agenda to estimate environmental
value The Contingent Valuation of Environmental Resources—Methodological Issues
and Research Needs. Eds Bjornstad D.J. and Kahn J.R. (Cheltenham: Edward Elga):
263–274.
Blamey R., Bennett J. and Morrison M. 1999. Yea-saying in contingent valuation surveys.
Land Economics 75: 126–141.
Blumenschein K., Johannesson M., Blomquist G.C., Liljas B. and O‘Conor R.M. 1997.
Hypothetical versus real payments in Vickrey auctions. Economics Letters 56: 177–
180.
Bolortsetseg B. and Tuvaansuren G. 1996. Potential impacts of climate change on pasture and
cattle production in Mongolia. Water Air Soil Pollution 92: 95–105.
Burkhard B., Kroll F., Nedkov S., Müller F. 2012. Mapping ecosystem service supply,
demand and budgets. Ecological Indicators 21: 17–29.
Brogaard S. and Xueyong Z. 2002. Rural reforms and changes in land management and
attitudes: a case study from Inner Mongolia, China. Ambio 31: 219–225.
Brogaard S., Runnstrom M., Seaquist J.W. 2005. Primary production of Inner Mongolia,
China, between 1982 and 1999 estimated by a satellite data-driven light-use
efficiency model. Global and Planetary Change 45: 313–332.
Brouwer I.D., Hoorweg J.C., van Liere M.J. 1997. When households run out of fuel:
Responses of rural households to decreasing fuelwood availability, Ntcheu District,
Malawi. World Development 25: 255–266.
Brown A.J. 1993. A review of soil sampling for chemical analysis. Australian Journal of
Experimental Agriculture 33(8): 983–1006.
Cao L., Tian W., Ni B., Zhang Y., Wang P. 2002. Preliminary study of airborne particulate
matter in a Beijing sampling station by instrumental neutron activation analysis.
Atmospheric Environment 36: 1951–1956.
Carney D. (Ed.) 1998. Sustainable Rural Livelihoods; Department of International
Development: London, UK.
Carney K.M., Sydeman W.J. 1999. A review of human disturbance effects on nesting colonial
waterbirds. Waterbirds 22(1): 68-79.
Carson R.T. 2000. Contingent valuation: a user‘s guide. Environmental Science &
Technology 34 1413–1418.
Castro A.J., Martin-Lopez B., Lopez E., Plieninger T., Alcaraz-Segura D., Vaughn C.C.,
Cabello J. 2015. Do protected areas networks ensure the supply of ecosystem services?
165
Spatial patterns of two nature reserve systems in semi-arid Spain. Applied Geography
60: 1–9.
Cavaliere A., Ricci E.C., Solesin M., Banterle A. 2014. Can Health and Environmental
Concerns Meet in Food Choices? Sustainability 6: 9494–9509.
CBD (Convention on Biological Diversity) 2000. Fifth Ordinary Meeting of the Conference
of the Parties to the Convention on Biological Diversity, Nairobi, Kenya, Decision
Report V/6: paragraphs 4–5.
CCICED. 2007. Eco-compensation mechanisms and policies in China, China Council for
International Cooperation on the Environment and Development. Science Press:
Beijing, China.
Chaolun B., He B., Gao R., Wang L. 2008. Pumping decisions for sustainable development of
groundwater resources in areas of grassland degradation: A case study in Lanqi
Banner, Inner Mongolia, China. Hydrogeology Journal 16: 1101–1111.
Chen J., Huang D., Shiyomi M., Hori Y., Yamamura Y. 2007. Spatial heterogeneity and
diversity of vegetation at the landscape level in Inner Mongolia, China, with special
reference to water resources. Landscape & Urban Planning 82: 222–232.
Chen J. and Su Y.L. 2008. Effects of grazing prohibition policies on rural household‘s
livelihood in agro-pastoral transition area. Issues in Agricultural Economy 6: 73–79
(in Chinese with English summary).
Chen S.P., Bai Y.F., Lin G.H., Liang Y., Han X.G. 2005. Effects of grazing on photosynthetic
characteristics of major steppe species in the Xilin River Basin, Inner Mongolia,
China. Photosynthetica 43: 559–565.
Cheng X.L., An S.Q., Li G.Q., Chen X.L., Wang Y.J., Li. J. 2001. The correlation between the
desertification of grass-land and the change of vegetation characteristics in Ordos.
Journal of Nanjing University 37: 230−239.
Chinese Nutrition Society (CNS). 2010. ‗Chinese Dietary Guidelines.‘(Tibet People‘s Press:
Lhasa, Tibet, China.)
Cinner J.E. and Bodin O. 2010. Livelihood diversification in tropical coastal communities: A
network-based approach to analyzing livelihood landscapes. PLoS ONE 5: e11999.
Costanza R., d‘Arge R., de Groot R.S., Farber S., Grasso M., Hannon B., Limburg K., Naeem
S., O‘Neill R.V., Paruelo J., Raskin R.G., Sutton P., van den BeltM.1998. The value
of ecosystem services: putting the issues in perspective. Ecological Economics 25:
67–72.
Costanza R., d'Arge R., de Groot R.S., G Farber S., Grasso M., Hannon B., Hanon B. et al.
1997. The value of the world‘s ecosystem services and natural capital. Nature 387:
253–260.
Crossman N.D., Burkhard B., Nedkov S., Willemen L., Petz K., Palomo I., Drakou E.G.
Martín-Lopez B., McPhearson T., Boyanova K., Alkemade R., Egoh B., Dunbar M.B.,
Maes J. 2013. A blueprint for mapping and modelling ecosystem services. Ecosystem
Services 4: 4–14.
Cummings R.G., Harrison G.W., Rutstrom E.E. 1995. Homegrown values and hypothetical
surveys: is the dichotomous choice approach incentive-compatible? American
Economic Review 85: 260–266.
Cummings R.G., Elliot S., Harrison G.W., Murphy J. 1997. Are hypothetical referenda
incentive compatible? Journal of Political Economy 105: 609–21.
Dai X.G., Xu Y., Jia G., Fu C. 2009. Climate change impact and adaptation in Inner Mongolia.
IOP Conference Series: Earth and Environmental Science 6: 342018.
166
Daily G (Ed.), 1997. Nature's Services. Societal Dependence on Natural Ecosystems. Island
Press: Washington DC, USA.
de Groot R.S., Wilson M.A., Bouman R.M.J.A. 2002. Typology for the Classification,
Description and Valuation of Ecosystem Services, Goods and Services. Ecological
Economics 41: 393–408.
de Groot R.S. and Hein L. 2007. Concept and valuation of landscape functions at different
scales. In: Mander U, H Wiggering, K Helming (Eds.). Multifunctional Land Use:
Meeting Future Demand for landscape Goods and Services (pp. 15–36). Springer:
New York, USA.
Deng X.Z., Li Z.H., Gibson J. 2016. A review on trade-off analysis of ecosystem services for
sustainable land-use management. Journal of Geographical Sciences 26: 953–968.
Deutsch L. and Folke C. 2005. Ecosystem subsidies to Swedish food consumption from 1962
to 1994. Ecosystems 8: 512–528.
DFID 2001. Integrating Trade into National Development Strategies' in Ministerial Round
Table on Trade and Poverty in Least Developed Countries: Capturing the Gains from
Trade. Department for International Development: London, UK.
Dong J., Liu J., Zhang G., Basara J. B., Greene S., Xiao X. 2013. Climate change affecting
temperature and aridity zones: a case study in Eastern Inner Mongolia, China from
1960-2008. Theoretical and Applied Climatology 113: 561–572.
Dong J., Tao F., Zhang G. 2011. Trends and variation in vegetation greenness related to
geographic controls in middle and eastern Inner Mongolia, China. Environmental
Earth Sciences 62: 245–256.
Dong S.K., Gao H.W., Xu G.C., Hou X.Y., Long R.J., Kang M.Y., Lassoie J.P. 2007. Farmer
and professional attitudes to the large-scale ban on livestock grazing of grasslands in
China. Environmental Conservation 34: 246–254.
Du B.Z., Zhen L., de Groot R., Goulden C.E., Long X., Cao X.C., Wu R.Z., Sun C.Z. 2014.
Changing patterns of basic household consumption in the Inner Mongolian grasslands
a case study of policy-oriented adoptive changes in the use of grasslands. The
Rangeland Journal 36(5): 505–517.
Du B.Z., Zhen L., de Groot R., Long X., Cao X.C., Wu R. 2015. Changing Food
Consumption Patterns and Impact on Water Resources in the Fragile Grassland of
Northern China. Sustainability 7: 5628–5647.
Dula, J. 2005. Discriminate analysis for dust storm prediction in the Gobi and steppe regions
in Mongolia. Water, Air and Soil Pollution Focus 5, 37–49.
Dudley N. and Stolton S. 2003. Running pure: The importance of forest protected areas to
drinking water. In Alliance for Forest Conservation and Sustainable Use. World
Bank/World Wildlife Fund: London, UK.
Eastwood A., Nijnik M., Brooker R., Pakeman R.J., Artz R., Norton L., Ross L., Bullock J.M.,
Vellinga N., Albon S., Fielding D., Irvine R.J., Ramsay S., Cooksley S. 2013. Nature
Conservation and Ecosystem Service Delivery. JNCC Report No. 492. JNCC:
Peterborough, UK.
Ellis F. 1998. Household strategies and rural livelihood diversification. The Journal of
Development Studies 35: 1–38.
Ellis F. 2000. Rural Livelihood Diversity in Developing Countries: Evidence and Policy
Implications; Oxford University Press: Oxford, UK.
167
Eigenbrod F., Armsworth P.R., Anderson B.J., Heinemeyer A., Gillings S., Roy D.B.,
Thomas C.D., Gaston K.J. 2010. The impac/t of proxy-based methods on mapping the
distribution of ecosystem services. Journal of Applied Ecology 47: 377–385.
Engel S., Pagiola S., Wunder S. 2008. Designing payments for environmental services in
theory and practice: an overview of the issues. Ecological Economics 65: 663–674.
Evans C.R.W., Krzic M., Broersma K., Thompson D.J. 2012. Long-term grazing effects on
grassland soil properties in southern British Columbia. Canadian Journal of Soil
Science 92: 685–693.
Fan G. 2003. Analysis on the Ecological Environment Management System. Northwest
Agriculture and Forestry University Press 2003: 4.
Fan M.M., Li W.J., Zhang C.C., Li L.H. 2013. Impacts of nomad sedentarization on social
and ecological systems at multiple scales in Xinjiang Uyghur Autonomous Region,
China. AMBIO: 43: 673–686.
Food and Agriculture Organization (FAO). 2003. ‗World Agriculture. Towards 2015/2030.
An FAO Perspective‘ (Ed. J. Bruinsma). Earthscan Publications: London, UK.
Food and Agriculture Organization (FAO). 2009. Supply and Utilization Accounts of
FAOSTAT, FAOSTAT Data Base; Food and Agriculture Organization: Rome, Italy.
Feng Z.M. and Shi D.F. 2006. Chinese food consumption and nourishment in the latest 20
years. Resources Science 28: 2–8 (in Chinese with English abstract).
Feng X.M. and Zhao Y.S. 2011. Grazing intensity monitoring in Northern China steppe:
integrating CENTURY model and MODIS data. Ecological Indicators 11: 175–182.
Fogel R.W. Helmchen L.A. 2002. Economic and technological development and their
relationships to body size and productivity. In: ‗The nutrition transition – diet and
disease in the developing world‘ (Eds. B. Caballero and B. M. Popkin), pp. 9–24.
Academic Press: London, UK.
Gao C., Li Z., Cao J. 2013. Study of the Returning Grazing Land to Grassland Program and
the Change in the Management Style of Grassland Animal Husbandry - Based on
Empirical Analysis of Six Villages in Uxin Banner. Modernization of Management
01: 37–39.
Gerbens-Leenes P.W. Nonhebel S. 2002. Consumption patterns and their effects on land
required for food. Ecological Economics 42: 185–199.
Gibson D.J. 2009. Grasses and grassland ecology. Oxford University Press, Oxford, UK
Grigg D. 1995. The nutrition transitionin Western Europe. Journal of Historical Geography
22: 247–261.
Gu Z.H., Shi P.J., Chen J. 2008. Estimation of grassland degradation based on historical
maximum growth model using with remote sensing data, The International Archives
of the Photogrammetry, Remote Sensing and Spatial Information Sciences XXXVII
(B8): 895–900.
Gunderson L.H., and Holling C.S. 2001. Panarchy: Understanding Transformations in Human
and Natural Systems. Island Press: Washington DC, USA.
Hadker N., Sharma S., David A., Muraleedharan T.R. 1997. Willingness to pay for Borivli
National Park: evidence from a contingent valuation. Ecological Economics 21: 105–
122.
Haftay H., Yayneshet T., Animut G., Treydte A.C. 2013. Rangeland vegetation responses to
traditional enclosure management in eastern Ethiopia. The Rangeland Journal 35, 29–
36.
168
Hanemann W.M. 1984. Welfare evaluations in contingent valuation experiments with discrete
responses. American Agricultural Economics Association 166: 332–341.
Hanemann W.M. 1989. Welfare evaluations in contingent valuation experiments with discrete
response data: reply. American Agricultural Economics Association 71: 1057–1061.
Hanemann W.M. 1994. Valuing the environment through contingent valuation. Journal of
Economic Perspectives 8: 19–25.
Hawksworth D.L. and Bull A.T. (ed) 2008. Biodiversity and Conservation in Europe.
Springer: Dordrecht, the Netherland.
Hanguan Q., Jia N., Niu H. 2003. Report on Grassland Degradation and Restoration in Golok
Prefecture. Ascent: 4: 82–85.
Hashimoto S., Kawado M., Seko R., Kato M., Okabe N. 2005. Bias of vaccination coverage
in a household questionnaire survey in Japan. J. Epidemiol. 15: 15–19.
Hoehn J.P. and Randall A. 1987. A satisfactory benefit cost indicator from contingent
valuation. Journal of Environmental Economics & Management 14: 1226–1247.
Hoekstra A.Y. and Chapagain A.K. 2008. ‗Globalization of water. Sharing the planet‘s
freshwater resources. Blackwell Publishing: London, UK.
Hoffmann C., Funk R., Li Y., Sommer M. 2008. Effect of grazing on wind driven carbon and
nitrogen ratios in the grasslands of Inner Mongolia. Catena 75: 182–190.
Hoffmann C., Funk R., Reiche M., Li Y. 2011. Assessment of extreme wind erosion and its
impacts in Inner Mongolia, China. Aeolian Research 3: 343–351.
Hulun Buir Statistics Bureau. 2012. Statistics of 2010 yearbook in Evenk Banner. Hulun Buir
Statistic Bureau: Hulun Buir, China.
Inner Mongolia Statistics Bureau. 2015a. Statistical Bulletin of the Economic and Social
Development of Inner Mongolia in 2015. Inner Mongolia Statistics Bureau: Hohhot,
China.
Inner Mongolia Statistics Bureau. 2013. ‗Rural Statistics Yearbook of Inner Mongolia
Autonomous Region in 2010.‘ Inner Mongolia Statistics Bureau: Hohhot, China.
Inner Mongolia Statistics Bureau. 1997. Inner Mongolia Statistics Yearbook, China Statistics
Press: Inner Mongolia Statistics Bureau, Hohhot, China (in Chinese).
Inner Mongolia Statistics Bureau. 2014. Inner Mongolia Statistics Yearbook, China Statistics
Press: Inner Mongolia Statistics Bureau, Hohhot, China (in Chinese).
Inner Mongolia Statistics Bureau. 2015b. Inner Mongolia Statistics Yearbook, China
Statistics Press: Inner Mongolia Statistics Bureau, Hohhot, China (in Chinese).
Inner Mongolia Statistics Bureau. 1996. Rural statistics yearbook of Inner Mongolia
Autonomous Region in 1995. Inner Mongolia Statistic Bureau: Hohhot, China.
Inner Mongolia Statistics Bureau. 2011. Rural statistics yearbook of IMAR in 2010. Inner
Mongolia Statistic Bureau: Hohhot, China.
IPBES (The Intergovernmental Platform on Biodiversity and Ecosystem Services). 2018.
Conference report: Global Land Degradation Status and Restoration Assessment
Ji S.J., Geng Y., Li D.F., Wang G.H. 2009. Plant coverage is more important than species
richness in enhancing aboveground biomass in a premature grassland, northern China.
Agriculture, Ecosystems and Environment 129: 491–496.
Jiang A. 2003. Historical Change of China' Land Policies (1949-1978). Journal of Yuxi
Normal College 10: 25–31.

169
Jiang G., Han X., Wu J. 2006. Restoration and management of the Inner Mongolia grassland
require a sustainable strategy. AMBIO 35: 269–270.
Jill M., Montaquila J., Michael B., Shelley P. National Center for Education Statistics.
Undercoverage Bias in Estimates of Characteristics of Households and Adults in the
1996 National Household Education Survey; Working Paper No. 97–39; U.S.
Department of Education: Washington, DC, USA, 1997.
John R., Chen J.Q., Lu N., Guo K., Liang C.Z., Wei Y.F., Noormets A., Ma K.P., Han X.G.
2008. Predicting plant diversity based on remote sensing products in the semi-arid
region of Inner Mongolia. Remote Sensing of Environment 112: 2018–2032.
Jugder D. 2005. Discriminate analysis for dust storm prediction in the Gobi and steppe
regions in Mongolia. Water, Air, & Soil Pollution: Focus 5: 37–49.
Jun L. W., Ali S. H., Zhang Q. 2007. Property rights and grassland degradation: a study of the
Xilingol Pasture, Inner Mongolia, China. Journal of Environmental Management 85:
461–470.
Katoh K., Takeuchi K., Jiang D., Nan Y., Kou Z. 1998. Vegetation restoration by seasonal
exclosure in the Kerqin Sandy Land, Inner Mongolia. Plant Ecology 139: 133–144.
Kang L., Han X., Zhang Z., Sun O.J. 2007. Grassland ecosystems in China: review of current
knowledge and research advancement. Philosophical Transactions of the Royal
Society of London B: Biological Sciences 362(1482): 997–1008.
Kang M., Dai C., Ji W., Jiang Y., Yuan Z., Chen H.Y. H. 2013. Biomass and its allocation in
relation to temperature, precipitation, and soil nutrients in Inner Mongolia grasslands,
China. PLOS ONE, 8 (7): e76561.
Kaplowitz M.D., Hoehn J.P. 2001. Do focus groups and individual interviews reveal the same
information for natural resource valuation? Ecological Economics 36: 237–247.
Kareiva P., Tallis H., Ricketts T.H., Daily G.C., Polasky S., 2011. Natural Capital. Theory
and Practice of Mapping Ecosystem Services. Oxford University Press: Oxford, U.K.
Kawamura K., Akiyama T., Yokota H.O., Tsutsumi M., Yasuda T., Watanabe O., Wang S.P.
2005. Quantifying grazing intensities using geographic information systems and
satellite remote sensing in the Xilingol steppe region, Inner Mongolia, China.
Agriculture Ecosystems & Environment. 107: 83–93.
Kim J.Y., Mjelde J.W., Kim T.K., Lee C.K. Ahn K.M. 2012. Comparing willingness to pay
between residents and nonresidents when correcting hypothetical bias: case of
endangered spotted seal in South Korea. Ecological Economics 78: 123–131.
Kling C.L., Feng H.L., Kurkalova L.A., Secchi S. Gassmand P.W. 2005. The conservation
reserve program in the presence of a working land alternative: implications for
environmental quality, program participation, and income transfer. American Journal
of Agricultural Economics 87: 1231–1238.
König H.J., Zhen L., Helming K., Uthes S., Yang L., Cao X., Wiggering H. 2012. Assessing
the impact of the sloping land conversion programme on rural sustainability in
Guyuan, western China. Land Degradation and Development 2014, 25(4):385-396
König H.J., Zhen L., Helming K., Uthes S., Yang L., Cao X., Wiggering H. 2014a. Assessing
the Impact of the Sloping Land Conversion Programme on Rural Sustainability in
Guyuan, Western China. Land Degradation & Development 25: 385–396.
König H.J., Podhora A., Helming K., Zhen L., Wang C., Wübbeke J., Baumeister T., Du B.Z.,
Yan H. M. 2014b. Confronting international research topics with stakeholders on
multifunctional land use: the case of Inner Mongolia, China. iForest – Biogeosciences
and Forestry 7: 403–413.
170
König H.J., Podhora A., Zhen L., Helming K., Yan H., Du B.Z., Wunneke J., Wang C.,
Klinger J., Chen C., Uthes S. 2015. Knowledge Brokerage for Impact Assessment of
Land Use Scenarios in Inner Mongolia, China Extending and Testing the FoPIA
Approach. Sustainability 7: 5027–5049.
Krawczyk M. 2012. Testing for hypothetical bias in willingness to support a reforestation
program. Journal of Forest Economics 18: 282–289.
Kumar P. (Ed.) 2010. The Economics of Ecosystems and Biodiversity. The Ecological and
Economic Foundation, Earthscan Publications: Geneva, Switzerland.
Levin S.A. 1999. Fragile Dominion: Complexity and the Commons. Massachusetts: Perseus
Books.
Li A., Wu J., Huang J. 2012. Distinguishing between human-induced and climate-driven
vegetation changes: A critical application of RESTREND in inner Mongolia.
Landscape Ecology 27: 969–982.
Li C., Hao X., Zhao M., Han G., Willms W.D. 2008. Influence of historic sheep grazing on
vegetation and soil properties of a Desert Steppe in Inner Mongolia. Agriculture,
Ecosystems and Environment 128: 109–116.
Li F. 2010. Eco-Compensation Mechanism in Ecologically Vulnerable Regions Based on
Stakeholder‘s Analysis Chinese Academy of Sciences: Beijing, China (in Chinese
with English summary)
Li F.R., Zhang H., Zhao L.Y., Shirato Y., Wang X.Z. 2003. Pedoecological effects of a sand-
fixing poplar (Populus simonii Carr.) forest in a desertified sandy land of Inner
Mongolia, China. Plant and Soil 256: 431–442.
Li J. and Li S.Z. 2010. An attitudes and perceptions based investigation on types of rural
residents and their willingness to accept eco-compensation in western China: a case
on Zhouzhi County in Xi‘an city. Resources Science 32: 1505–1512 (in Chinese with
English summary)
Li J., Feldman M.W., Li S., Daily G.C. 2011. Rural household income and inequality under
the sloping land conversion program in western China. Proceedings of the National
Academy of Sciences of the United States of America 108: 7721–7726.
Li K., Liu X., Song L., Gong Y., Lu C., Yue P., Tian C., Zhang F. 2015. Response of alpine
grassland to elevated nitrogen deposition and water supply in China. Oecologia. 177:
65–72.
Li L. and Wu X. 2008. Analysis and Policy on Virtual Water Condition of Agricultural
Products in Heilongjiang Province. Science Economy Society 26: 41–46.
Li S., Zhang R., Buman A. 2005. Thinking about the effect of replacing cropland with pasture
on farmers‘ income. Pratacultural Science 22: 69–71.
Li W.J., Ali S.H., Zhang Q. 2007. Property rights and grassland degradation: A study of the
Xilingol Pasture, Inner Mongolia, China. Journal of Environmental Management 85:
461–470.
Li W. and Huntsinger L. 2011. China‘s grassland contract policy and its impacts on herder
ability to benefit in Inner Mongolia: tragic feedbacks. Ecology and Society 16: 1–14.
Li Y., Zhao H., Zhao X., Zhang T., Li Y., Cui J. 2011. Effects of grazing and livestock
exclusion on soil physical and chemical properties in desertified sandy grassland,
Inner Mongolia, northern China. Environmental Earth Sciences 63: 771–783.
Li Z.H., Bao Y.J., Wang H.M., Xu T., Cheng Y., Gao J.X. 2008. Grasslands desertification
and driving forces in Xilingol of Inner Mongolia. Ecology and Environmental
Sciences 17: 2312–2318 (in Chinese with English abstract)

171
Li Z.X., Shao L., Mingpei L.I., et al. 2014. Analysis of shale gas resource exploration
potential of Yan'an Formation in northern Huangling mining area of Ordos basin.
Coal Geology & Exploration 186(2):869.
Lim B., Spanger-Siegfried E., Burton I., Malone E., Huq S. 2005. Adaptation Policy
Frameworks for Climate Change: Developing Strategies, Policies, and Measures.
Cambridge University Press: Cambridge, UK.
Liu W.Q., Ba L., Tian Y.P. 1998. The food consumption of urban and rural residents in Inner
Mongolia. Journal of Inner Mongolia Finance and Economics College 3: 1–6 (in
Chinese).
Liu J.G., Linderman M., Ouyang Z.Y., An L., Yang J., Zhang H. 2001. Ecological
degradation in protected areas: The case of Wolong Nature Reserve for giant pandas.
Science 292: 98–101.
Liu J.G., Daily G.C., Ehrlich P.R., Luck G.W. 2003. Effects of household dynamics on
resource consumption and biodiversity. Nature 421: 530–533.
Liu J.G., Dietz T., Carpenter S.R., Alberti M., Folke C., Moran E., Pell A.N., Deadman
P., Kratz T., Lubchenco J., Ostrom E., Ouyang Z., Provencher W., Redman C.L.,
Schneider S.H., Taylor W.W. 2007. Complexity of coupled human and natural
systems. Science 317: 1513–1516.
Liu X.L. and Zhen L. 2007. Stakeholders‘ consumption of ecosystem services and willingness
to accept: a case study in Jinghe Watershed. Resources Science 29: 103–108 (in
Chinese with English summary)
Liu R. 2010. Grazing Ban, Grassland Rest and Rotational Grazing Measures Implemented
under the Returning Grazing Land to Grassland Program Lead to Fast Recovery of
Grassland Ecosystem. Inner Mongolia Prataculture 22 (4): 14–17.
Lu N., Chen S., Wilske B., Sun G., Chen J. 2011. Evapotranspiration and soil water
relationships in a range of disturbed and undisturbed ecosystems in the semi-arid
Inner Mongolia, China. Journal of Plant Ecology 4: 49-60.
Liu J., Wu J. G., Liu F. Q., Ha X.G.n. 2012. Quantitative assessment of bio-energy from crop
stalk resources in Inner Mongolia, China. Applied Energy 93: 305–318.
Liu X., Wang Y., Peng J., Braimoh A. K. Yin H. 2013. Assessing vulnerability to drought
based on exposure, sensitivity and adaptive capacity: a case study in middle Inner
Mongolia of China. Chinese Geographical Science 23: 13–25.
Liu Z. and Lan J. 2015. The Sloping Land Conversion Program in China: Effect on the
Livelihood Diversification of Rural Households. World Development 70: 147–161.
Loomis J., Traynor K., Brown T. 1999. Trichotomous choice: a possible solution to dual
response objectives in dichotomous choice contingent valuation questions. Journal of
Agricultural & Resource Economics 24: 572–83.
Loomis J.B. and Walsh R.G. 1997. Recreation Economic Decisions: Comparing Benefits and
Costs. Venture Publishing, Inc.: State College, PA.
Millennium Ecosystem Assessment. 2003. Ecosystems and Human Well-Being: A
Framework for Assessment. Island Press: Washington DC, USA.
Millennium Ecosystem Assessment. 2005. Ecosystems and Human Well-being: Current State
and Trends. Island Press: Washington DC, USA.
Millennium Ecosystem Assessment. 2005. Millennium Ecosystem Assessment Synthesis
Report. Island Press: Washington DC, USA.
172
Madubansi M., and Shackleton C.M. 2007. Changes in fuelwood use and selection following
electrification in the Bushbuckridge lowveld, South Africa. Journal of Environmental
Management 83: 416–426.
Medina-Roldan E., Paz-Ferreiro J., Bardgett R.D. 2012. Grazing exclusion affects soil and
plant communities, but has no impact on soil carbon storage in an upland grassland.
Agriculture, Ecosystems and Environment 149: 118–123.
Mennell S., Murcott A., van Otterloo A.H. 1992. The sociology of food: eating, diet and
culture. Sage Publications: London, UK.
McCartney M.P., Acreman M.C., Bergkamp G. 2000. Freshwater ecosystem management and
environmental security, Final Version of the Discussion Paper prepared for the
Freshwater Ecosystem Management and Environmental Security Workshop held by
the IUCN in San Jose, Costa Rica, June, 1999.
Mjelde J.W., Jin Y.H., Lee C.K., Kim T.K., Han S.Y. 2012. Development of a bias ratio to
examine factors influencing hypothetical bias. Journal of Environmental Management
95: 39–48.
Min Q., Liu S., Yang X. 2004. Evaluation of the Ecosystem Services of the Inner Mongolia
Steppe, Acta Agrestia Sinica 12: 165–169.
Munksgaard J., Wier M., Lenzen M., Dey C. 2005. Using input–output analysis to measure
the environmental pressure of consumption at different spatial levels. Journal of
Industrial Ecology 9: 169–185.
Munkhtsetseg E., Kimura R., Wang J. Shinoda M. 2007. Pasture yield response to
precipitation and high temperature in Mongolia. Journal of Arid Environments 70:
94–110.
Murphy J., Allen P., Stevens T., Weatherhead D. 2005. A meta-analysis of hypothetical bias
in stated preference valuation. Environmental and Resource Economics 30: 313–325.
Murphy J., Stevens T., Yadav L. 2010. A comparison of induced value and homegrown value
experiments to test for hypothetical bias in contingent valuation. Environmental and
Resource Economics 47: 111–123.
Molden D., Frenken K., Barker R., de Fraiture C., Mati B., Svendsen M., Sadoff C.,
Finlayson C.M. 2007.Trends in Water and Agricultural Development Pages 57–89 in
Water for Food, Water for Life: A Comprehensive Assessment of Water Management in
Agriculture. Molden D., Ed. International Water Management Institute: London, UK.
Earthscan and Colombo, Srilanka.
National Statistics Bureau. 2015. National Annual Statistic Reports of China. National Bureau
of Statistics of the People‘s Republic of China: Beijing, China.
NDRC. 2014. ―Opinions on improving the policy of returning grazing to grassland‖ is the
latest guidance to implementing the policy of ―returning grazing to grassland‖, which
Joint release by the National Development and Reform Commission, National
Ministry of Finance and National Ministry of Agriculture (in Chinese)
NSBC. 2006. The Fifth Census in China. National Bureau of Statistics: Beijing, China.
Nie X. 2008. Performance Evaluation and Countermeasures to Problems in the
Implementation of the Returning Grazing Land to Grassland Program in the Yellow
River Basin. Dissertation, Gansu Agricultural University, Lanzhou, China
NSBC. 2006. The fifth census in China. National Bureau of Statistics: Beijing, China.
Nuñez D., Nahuelhual L., Oyarzún C. 2006. Forests and water: The value of native temperate
forests in supplying water for human consumption. Ecological Economics 58: 606–
616.

173
Ohte N., Koba K., Yoshikawa K., Sugimoto A., Matsuo N., Kabeya N., Wang L. 2003. Water
utilization of natural and planted trees in the semiarid desert of Inner Mongolia, China.
Ecological Applications 13: 337–351.
Ordos Statistics Bureau. 2011a. Statistics of 2010 yearbook in Dongsheng District. Ordos
Statistics Bureau: Ordos, China.
Ordos Statistics Bureau. 2011b. Statistics of 2010 yearbook in Ejin Horo Banner. Ordos
Statistics Bureau: Ordos, China.
Ostrom E. 2009. A General Framework for Analyzing Sustainability of Social-Ecological
Systems. Science 325 (5939): 419-422.
Pagiola S., Arcenas A., Platais G. 2005. Can payments for environmental services help reduce
poverty? An exploration of the issues and evidence to date from Latin America.
World Development 33: 237–253.
Pahl-Wostl C.A. 2009. Conceptual framework for analysing adaptive capacity and multi-level
learning processes in resource governance regimes. Global Environmental Change
19: 354–365.
Pan Y., Xu Z., Wu J. 2013. Spatial differences of the supply of multiple ecosystem services
and the environmental and land use factors affecting them. Ecosystem Services 5: e4–
e10.
Popkin B.M. 2002. The dynamics of the dietary transition in the developing world. In The
Nutrition Transition: Diet and Disease in the Developing World, Food Science and
Technology International Series (pp. 111–129). Caballero B., Popkin B.M., Eds.
Academic Press: London, UK.
Power A.G. 2010. Ecosystem services and agriculture: tradeoffs and synergies. Philosophical
Transactions of the Royal Society B: Biological Sciences 365: 2959–2971.
Pricope N.G., Husak G., Lopez-Carr D., Funk C., Michaelsen J. 2013. The climate-population
nexus in the East African Horn: Emerging degradation trends in rangeland and
pastoral livelihood zones. Global Environmental Change 23: 1525–1541.
Prishchepov A.V., Radeloff V.C., Baumann M., Kuemmerle T., M uller D. 2012. Effects of
institutional changes on land use: agricultural land abandonment during the transition
from state-command to market-driven economies in post-Soviet Eastern Europe.
Environmental Research Letters 7: 024021
Prober S.M., Thiele K.R., Rundel P.W., Watson A. 2012. Climate adaptation in intact
landscapes: a framework for managing change and resilience applied to the world's
largest temperate woodland. Climatic Change 110: 227–248.
Qiu G.Y., Xie F., Feng Y.C., Tian F. 2011. Experimental studies on the effects of the "
Conversion of Cropland to Grassland Program" on the water budget and
evapotranspiration in a semi-arid steppe in Inner Mongolia, China. Journal of
Hydrology 411: 120–129.
Qu F., Kuyvenhoven A., Shi X., Heerink N. 2011. Sustainable natural resource use in rural
China: Recent trends and policies. China Economic Review 22: 444–460.
Raudsepp-Hearne C., Peterson G.D., Bennett E.M. 2010. Ecosystem service bundles for
analyzing tradeoffs in diverse landscapes. Proceedings of the National Academy of
Sciences of the United States 107: 5242–5247.
Receveur O., Boulay M., Kuhnlein H.V. 1997. Decreasing traditional food use affects diet
quality for adult men in 16 Communities of the Canadian North-west Territories.
Community and International Nutrition 127: 2179–2186.

174
Reed M.S., Graves A., Dandy N., Posthumus H., Hubacek K., Morris J., Prell C., Quinn C.H.,
Stringer L.C. 2009. Who‘s in and why? A typology of stakeholder analysis methods
for natural resource management. Journal of Environmental Management 90: 1933-
1949.
Ren J.Z., Hu Z.Z., Zhao J., Zhang D.G., Hou F. J., Lin H. L., Mu X.D. 2008. A grassland
classification system and its application in China. The Rangeland Journal 30(2): 199-
209.
Ren Y., Yu H., Feng D.F. 2006. The establishment of strategies for ecological compensation
mechanism and policy framework. Environmental protection 10A: 18–23 (in Chinese
with English summary)
Renault D. and Wallender W. 2000. Nutritional water productivity and diets. Agricultural
Water Management 45: 275–296.
Robertson, G.P., Swinton, S.M. 2005. Reconciling agricultural productivity and
environmental integrity: a grand challenge for agriculture. Frontiers in Ecology and
the Environment, 3:38–46.Sievanen L., Crawford B., Pollnac R., Lowe C. 2005.
Weeding through assumptions of livelihood approaches in ICM: Seaweed farming in
the Philippines and Indonesia. Ocean & Coastal Management 48: 297–313.
Rook A.J., Dumont B., Isselstein J., Osoro K., Wallis DeVries M.F., Parente G., Mills J. 2004.
Matching type of livestock to desired biodiversity outcomes in pastures—a review.
Biological Conservation 119: 137–150.
Sala O.E., Chapin F.S., Armesto J.J., Berlow E., Bloomfield J., Dirzo R., Huber-Sanwald E.,
Huenneke, L.F., Jackson R.B., Kinzig A., Leemans R., Lodge D.M., Mooney H.A.,
Oesterheld M., Poff N.L., Sykes M.T., Walker B.H., Walker M., Wall D.H. 2000.
Global biodiversity scenarios for the year 2100. Science 287:1770-1774.
Schiborra A., Gierus M., Wan H.W., Bai Y.F., Taube F. 2009. Short-term responses of a Stipa
grandis/Leymus chinensis community to frequent defoliation in the semi-arid
grasslands of Inner Mongolia, China. Agriculture Ecosystems & Environment 132:
82–90.
Schultz L., Folke C., Olsson P. 2007. Enhancing ecosystem management through social-
ecological inventories: lessons from Kristianstads Vattenrike, Sweden. Environmental
Conservation 34: 140–152.
Spash C.L. and Hanley N. 1995. Preferences, information and biodiversity preservation.
Ecological Economics 12: 191–208.
Spash C.L., Urama K., Burton R., Kenyon W., Shannon P., Hill G. 2009. Motives behind
willingness to pay for improving biodiversity in a water ecosystem: economics, ethics
and social psychology Ecological Economics 68: 955–964
Sternberg T., Thomas D., Middleton N. 2010. Drought dynamics on the Mongolian steppe,
1970–2006, International Journal of Climatology 31 (12): 1823–183.
Shi Z., Gao J., Yang X., Jia Z., Shang J., Feng C., Lü S. 2012. Response of Mongolian pine
radial growth to climate in Hulunbuir Sand Land, Inner Mongolia, China. Journal of
Food, Agriculture and Environment 10: 884–890.
Sun C., Ouyang X., Cai H., Luo Z., Li A. 2014. Household pathway selection of energy
consumption during urbanization process in China. Energy Conversion and
Management 84: 295–304.
Suškevics M. 2012. Legitimacy analysis of multi-level governance of biodiversity: evidence
from 11 case studies across the EU. Environmental Policy and Governance 22: 217–
237.

175
Swinton S.M., Lupi F., Robertson G.P., Hamilton S.K. 2007. Ecosystem services and
agriculture: cultivating agricultural ecosystems for diverse benefits. Ecological
Economics 64: 245–252.
Tabachnick B.G. and Fidell L.S. 2007. ‗Using Multivariate Statistics.‘ 5th edn. Pearson Allyn
and Bacon: Upper Saddle River, NJ.
Tallis H., and Polasky S. 2009. Mapping and valuing ecosystem services as an approach for
conservation and natural-resource management. Annals of the New York Academy of
Sciences 1162: 265–283.
Tallis H.T., Ricketts T., Guerry A.D., et al. 2013. InVEST 2.5.3 User‘s Guide. The Natural
Capital Project, Stanford.
TEEB, 2010. ‗The Economics of Ecosystems and Biodiversity: An Interim Report‘, European
Commission, Brussels.
Thornley M. 1998. Grassland Dynamics: An Ecosystem Simulation Model. Wallingford:
CAB International.
Tian X.Y. 2011. Effect of the Returning Grazing Land to Grassland Program on the Lives of
Herders in China. Chinese Journal of Grassland 33 (4): 1–4.
Turner R.K., Paavola J., Cooper P., Farber S., Jessamy V., Georgiou S. 2003. Valuing nature:
lessons learned and future research directions. Ecological Economics 46(2):493–510.
Uchida E., Xu J.T., Rozelle S. 2005. Grain for Green: cost-effectiveness and sustainability of
China‘s conservation set-aside program. Land Economics 81: 247–264.
van Noordwijk M. and Leimona B. 2010. Principles for fairness and efficiency in enhancing
environmental services in Asia: payments, compensation, or co-investment. Ecology
& Society 15: 17.
Vermaat J.E., Goosen H., Omtzigt N. 2008. Do biodiversity patterns in Dutch wetland
complexes relate to variation in urbanization, intensity of agricultural land use or
fragmentation? Biodiversity and Conservation in Europe. Hawksworth D.L. and A.T.
Bull ed. Springer: Dordrecht, the Netherlands.
Wackernagel M., Schulz N.B., Deumling D., Linares A.C., Jenkins M., Kapos V., Monfreda
C., Loh J., Myers N., Norgaard R., Randers J. 2002. Tracking the ecological
overshoot of the human economy. National Academy of Sciences 99(14): 9266–9271.
Wan J.J., Wang J.A., Liu Z., et al. 2008. Drought resilience in view of income diversity of
peasant household: A case study on Xinghe County, Inner Mongolia. Journal of
Natural Disasters 17(1): 122-126.
Wang G. and Cheng G. 1999. The ecological features and significance of hydrology within
arid inland river basins of China. Environmental Geology 37(3): 218–222.
Wang J.N., Wan J., Zhang H.Y. 2006. Relating knowledge for ecological compensation
mechanics and policies in China. Environmental protection 10A: 24–8 (in Chinese
with English summary).
Wang P.P. 2010. Protein functionality in food systems. Meat Research 135: 62–70 (in
Chinese with English abstract).
Wang X.Y. 2009. Pastoral Communities under Environmental Pressure. Beijing: Social
Sciences Academic Press, pp. 4–12 (In Chinese).
Wang Y.M. 2006. Mid-Term Benefit Analysis of the Returning Grazing Land to Grassland
Program in Inner Mongolia. Animal Husbandry and Feed Science (Cows) 05: 44–47.
176
Wang Z.G. 2011. Analysis of the dynamic relationship between Inner Mongolia's economic
growth and energy production and consumption. Economic Forum 487: 83–88 (in
Chinese).
Weber K.E. and Tiwari I.P. 1992. Research and Survey Format Design: An Introduction
(Bangkok: Asian Institute of Technology), Bangkok, Thailand.
West Ujimqin Right Banner Statistics Bureau (WURBSB). 2010. Annual Social and
Economic Reports of West Ujimqin Right Banner in 2010. West Ujimqin Right Banner
Statistics Bureau: Xilin Gol League, China.
Werger M.J. and van Staalduinen M.A. 2010. Eurasian Steppes. Ecological Problems and
Livelihoods in a Changing World. Springer Science & Business Media: Berlin,
Germany.
Whitehead J.C.and Cherry T.L. 2007. Willingness to pay for a green energy program: a
comparison of ex-ante and ex-post hypothetical bias mitigation approaches. Resource
& Energy Economics 29: 247–261.
Wilske B., Lu N., Wei L., Chen S., Zha T., Liu C., Xu W., Noormets A., Huang J., Wei Y.,
Chen J., Zhang Z., Ni J., Sun G., Guo K., McNulty S., John R., Han X., Lin G., Chen
J. 2009. Poplar plantation has the potential to alter the water balance in semiarid Inner
Mongolia. Journal of Environmental Management 90: 2762–2770.
Wilson J.B., Peet R.K., Dengler J. Partel M. 2012. Plant species richness: the world records.
Journal of Vegetation Science 23: 796–802.
Wu H., Aruhan, Guo T., Sun Z. 2011. Impacts of Land Use Change on Ecosystem Services
Value in Duolun County of Inner Mongolia Based on RS and GIS. Scientia
Georaphica Sinica 30: 110–116.
Wu R.Z., Zhen L, Du B.Z., Hu Y.F., Yan H.M., Cao X.C., Long X. 2012. Impact of
ecological restoration project on livelihood of the herders in Inner Mongolia.
Resources Science 34: 989–997 (in Chinese with English summary)
Wunder S. 2005. Payments for Environmental Services: Some Nuts and BoltsCIFOR (Center
for International Forestry Research) Occasional Paper No. 42 (Bogor: CIFOR)
Wunder S. 2008. Payments for environmental services and the poor: concepts and preliminary
evidence Environment and Development Economics13: 279–297.
World Wildlife Fund for Nature (WWF). 2006. Living Planet Report 2006. Gland
Switzerland: WWF.
World Wildlife Fund for Nature (WWF). 2007. ‗Allocating scarce water. A primer on water
allocation, water rights and water markets.‘ WWF-UK: Godalming, UK.
Xilin Gol Ecological Monitoring Station. 2008. Annual Report on Ecological Restoration
Projects. Xilingol, Inner Mongolia: Xilingol Ecological Monitoring Station (in
Chinese with English summary).
Xilin Gol Statistics Bureau. 2012. Statistics of 2010 yearbook in Zhengxiangbai Banner. Xilin
Gol Statistic Bureau: Xilin Gol, China.
Xiao L. B., Fang X. Q., Ye Y. 2013. Reclamation and revolt: social responses in eastern Inner
Mongolia to flood/drought-induced refugees from the north China plain 1644–1911.
Journal of Arid Environments 88: 9-16.
Xiao L., Ren G.Z., Zhao X.G., Xiao Q.Y. 2007. Analysis on the Spatial and Temporal Variety
of Virtual Water of Agricultural Products in Shaanxi. Journal of Arid Land Resources &
Environment 21: 104–108.

177
Xie C., Zhao J.C., Liang D., Bennett J., Zhang L., Dai G.C., Wang X.H. 2006. Livelihood
impacts of the conversion of cropland to forest and grassland program. Journal of
Environmental Planning and Management 49: 555–570.
XLGLDRC. 2011. Report on ecosystem restoration programs in wind and sand source regions
of Beijing-Tianjin. Xilin Gol Development and Reform Council: Xilingol, China (in
Chinese)
Xu J.Y., Chen L.D., Lu Y.H. et al. 2006a. Local people‘s perceptions as decision support for
protected area management in Wolong Biosphere Reserve, China. Journal of
Environmental Management, 78(4):362–372. (in Chinese)
Xu Z., Long A., Zhang Z. 2003. Virtual water consumption calculation and analysis of Gansu
Province in 2000. Acta of Geographica Sinica 58: 861–869.
Xu J.Y., Chen L.D., Lu Y.H., Fu B.J. 2007. Sustainability evaluation of the grain for green
project: From local people's responses to ecological effectiveness in Wolong nature
reserve. Environmental Management 40(1): 113–122.
Wu Z., Du W. 2008. Pastoral Nomad Rights in Inner Mongolia. Nomadic Peoples
12(2):13-33.
Xu Z.Q., Min Q.W., Wang Y.S., Li W.H. Xu Q. 2006b. Impact of human disturbances on soil
nutrient contents of typical grasslands. Journal of Soil & Water Conservation 20: 38–
42.
Xu J.T., Tao R., Xu Z.G., Bennett M.T. 2010. China‘s sloping land conversion program: does
expansion equal success? Land Economics 86: 219–244.
Xu X., Duan X., Sun H., Sun Q. 2011. Green space changes and planning in the capital region
of China. Environmental Management 47: 456-467.
Xu G.C., Kang M.Y., Jiang Y. 2012. Adaptation to the Policy-oriented Livelihood Change in
Xilingol Grassland, Northern China. Procedia Environmental Sciences 13: 1668–
1683.
Xu Z., Cheng S., Zhen L., Pan Y., Zhang X., Wu J., Zou X., Bijaya D. 2013. Impacts of dung
combustion on the carbon cycle of alpine grassland of the north Tibetan plateau.
Environmental Management 52: 441–449.
Xu W., Khoshroo N., Bjornlund H., Yin Y. 2014. Effects of "Grain for Green" reforestation
program on rural sustainability in China: an AHP approach to peasant consensus of
public land use policies. Stochastic Environmental Research and Risk Assessment
28(4): 867–880.
Yan L., Zhou G., Zhang F., Sui X., Ping X. 2012. Spatial heterogeneity of vegetation
coverage and its temporal dynamics in desert steppe, Inner Mongolia. Acta Ecologica
Sinica 32: 4017–4024.
Yan H., Zhan J., Liu B.. Yuan Y. 2014. Model Estimation of Water Use Efficiency for Soil
Conservation in the Lower Heihe River Basin, Northwest China during 2000–2008.
Sustainability 6: 6250–6266.
Yan Y., Hu Y., Yue L., Yu G., Biligejifu. 2012. Plant diversity change with different land use
type and land use intensity: take Zhengxiangbai Banner as case study. Resources
Science 34: 1032–1038.
Yang G.M. 2007. Theoretical Analysis and Case Study of Ecological Compensation Based on
Ecosystem Services Assessment—Taking Xilingol Steppe as an Example Chinese
Academy of Sciences: Beijing, China (in Chinese with English summary).
178
Yao Z.Y., Wang T., Han Z.W., Zhang W.M., Zhao A.G. 2007. Migration of sand dunes on
the northern Alxa Plateau, Inner Mongolia, China. Journal of Arid Environments 70:
80–93.
Yin R.S. and Yin G.P. 2010. China's Primary Programs of Terrestrial Ecosystem Restoration:
Initiation, Implementation, and Challenges. Environmental Management 45: 429–441.
Yu F. F., Price K. P., Ellis J., Shi P. 2003. Response of seasonal vegetation development to
climatic variations in eastern central Asia. Remote Sensing of Environment 87: 42−54.
Yue G., Zhao H., Zhang T., Zhao X., Niu L., Drake S. 2008. Evaluation of water use of
Caragana microphylla with the stem heat-balance method in Horqin Sandy Land,
Inner Mongolia, China. Agricultural and Forest Meteorology 148: 1668–1678.
Zhai G.F. and Suzuki T. 2008. Public willingness to pay for environmental management, risk
reduction and economic development: evidence from Tianjin, China. China Economic
Review 19: 551–566 (in Chinese with English summary).
Zhang W. 1998. Changes in species diversity and canopy cover in steppe vegetation in Inner
Mongolia under protection from grazing. Biodiversity and Conservation 7: 1365-1381
Zhang B., Li W., Xie G., Xiao Y. 2010. Water conservation of forest ecosystem in Beijing
and its value. Ecological Economics 69: 1416–1426.
Zhang Q., Wang X. 2012. Climate Variability, Change of Land Use and Vulnerability in
Pastoral Society: A Case from Inner Mongolia. Nomadic Peoples, 16(1): 68-87.
Zhao C.L., Sun Y.Z., Xiao L., et al. 2014. The occurrence of barium in a Jurassic coal in the
Huangling Mine, Ordos Basin, northern China. Fuel 128: 428-432.
Zhang C.M., Ma Z.X., Zhai L.L., et al. 2014. The Evaluation of Comprehensive
Transportation System in Inner Mongolia Based on Principal Component Analysis.
Applied Mechanics & Materials 505-506: 782-786.
Zhang M.D.A., Borjigin E., Zhang H.P. 2007. Mongolian nomadic culture and ecological
culture: on the ecological reconstruction in the agro-pastoral mosaic zone in Northern
China. Ecological Economics 62: 19–26.
Zhang Q.Y., Wu X.H., Zhao D.S., Dai E.F. 2013. Temporal-spatial changes in Inner
Mongolian grassland degradation during past three decades. Agricultural Science &
Technology 14: 676–683.
Zhang Q. 2004. Residential energy consumption in China and its comparison with Japan,
Canada, and USA. Energy Build 36: 1217–1225.
Zhao H.I., Zhao X.Y., Zhang T.H., Li Y.S., Han F.L., Zhou R.L. 1999. The time-space
variation of groundwater and its causes in central decertified area in Naiman Banner
of Mongolia in the past 20 Years. Journal of Desert Research 19: 7–11. (in Chinese
with English abstract).
Zhao H.L., Yi X.Y., Zhou R.L., Zhao X.Y., Zhang T.H. Drake S. 2006. Wind erosion and
sand accumulation effects on soil properties in Horqin Sandy Farmland, Inner
Mongolia. Catena: 65 71–6579.
Zhao H.L., Li S.G., Zhang T.H., Ohkuro T., Zhou R.L. 2004. Sheep gain and species diversity:
In sandy grassland, Inner Mongolia. Journal of Range Management 57: 187–190.
Zhao R., Huang X., Zhong T., Peng J, 2011. Carbon footprint of different industrial spaces
based on energy consumption in China. Journal of Geographical Science 21: 285–
300.
Zhao Y., Peth S., Horn R., Kummelbein J., Ketzer B., Gao Y., Doerner J., Bernhofer C., Peng
X. 2010. Modelling grazing effects on coupled water and heat fluxes in Inner
Mongolia grassland. Soil & Tillage Research 109: 75–86.
179
Zhao Y., Peth S., Krümmelbein J., Horn R., Wang Z., Steffens M., Hoffmann C., Peng X.,
2007. Spatial variability of soil properties affected by grazing intensity in Inner
Mongolia grassland. Ecological Modelling 205: 241–254.
Zhen L., Liu X.L., Wei Y.J. 2008. Consumption of ecosystem services: models, measurement
and management framework. Resources Science 30: 100–106.
Zhen L., Ochirbat B., Lv Y., Wei Y.J., Liu X.L., Chen J.Q., Yao Z.J., Li F. 2010a. Comparing
patterns of ecosystem service consumption and perceptions of range management
between ethnic herders in Inner Mongolia and Mongolia. Environmental Research
Letters 5: 1–11.
Zhen L., Cao S. Y., Cheng S. K., Xie G. D., Wei Y. J., Liu X. L., Li F. 2010b. Arable land
requirements based on food consumption patterns: case study in rural Guyuan District,
Western China. Ecological Economics 69: 1443–1453.
Zhen L., Li F., Huang H.Q., Dilly O., Liu J.Y., Wei Y.J., Yang L. Cao X.C. 2011a.
Households‘ willingness to reduce pollution threats in the Poyang Lake region,
southern China. Journal of Geochemical Exploration 110: 15–22.
Zhen L., Liu X.L., Wei Y.J., Yang L., Long X., Du B.Z., Li F., Cao X. 2011b. Consumption of
Ecosystem Services: A Conceptual Framework and Case Study in Jinghe Watershed,
Journal of Resources and Ecology 2: 298–306.
Zhen L. and Zhang H.Y. 2011. Payment for ecosystem services in China: an overview. Living
Reviews in Landscape Research 5: 5–21.
Zhen L., Deng X.Z., Wei Y.J., Jiang Q.O., Lin Y.Z., Helming K., Wang C., König H.J. 2014.
Future land use and food security scenarios for the Guyuan district of remote western
China. iForest - Biogeosciences and Forestry 7: 372–384.
Zheng H., Robinson B.E., Liang Y.C., Polasky S, Ma D.C., Wang F.C., Ruckelshaus M.,
Ouyang Z.Y. Daily G.C. 2013. Benefits, costs, and livelihood implications of a
regional payment for ecosystem service program. Proceedings of the National
Academy of Sciences of the United States of America 110: 16681–16686.
Zheng S., Li W., Lan Z., Ren H., Wang K. 2015. Functional trait responses to grazing are
mediated by soil moisture and plant functional group identity. Scientific Reports 5:
18163.
Zhengxiangbai Banner Statistics Bureau (ZBSB). 2010. Annual Social and Economic Reports
of Zhengxiangbai Banner in 2010. Zhengxiangbai Banner Statistics Bureau: Xilin
Gol, China.
Zhou Z.C., Gan Z.T., Shangguan Z.P, Dong Z.B. 2010. Effects of grazing on soil physical
properties and soil erodibility in semiarid grassland of the northern Loess Plateau
(China). Catena 82: 87–91.
Zhou Z., Sun O.J., Huang J., Gao, Y.; Han, X. 2006. Land use affects the relationship between
species diversity and productivity at the local scale in a semi-arid steppe ecosystem.
Functional Ecology 20: 753–762.
Zimmer D. and Renault D. 2003. Virtual water in food production and global trade: Review of
methodological issues and preliminary results. In Virtual Water Trade (No.12).
Hoekstra A.Y., Ed. IHE: Delft, the Netherland.
Zwart S.J. and Bastiaanssen W.M.G. 2004. Review of measured crop water productivity
values for irrigated wheat, rice, cotton and maize. Agricultural Water Management
69: 115–133.

180
181
Summary:
Grassland degradation has become a major challenge in many parts of the world,
especially in arid or semi-arid areas, such as the Chinese Inner Mongolian
Autonomous Region (IMAR). Previous studies of the grassland ecosystems in IMAR
focused on climate change and its environmental consequences or on the land-use
conflicts between agrarian communities and nomads. For better planning and
management, a more integrated analysis of the consequences of land-use change for
the livelihood dependence and other benefits (services) of the grasslands in IMAR is
needed.
Studies on ecosystem services of IMAR‘s grasslands are usually based on remote
sensing data (TM images) to assess the total value of the grassland ecosystem services
using benefit transfer. Thus far, to my knowledge no study collected original data on
the detailed use of ecosystem services by pastoralists on the Mongolian Plateau or on
their livelihood dependence on these services at the household level. Also, no data is
available on the changes over time in contrasting situations for different grassland
types (like meadow, steppe and desert steppe). I therefore aim to analyse the
interactions between the people and the ecosystems in IMAR in an integrated manner,
and especially focus on analysing the different utilization patterns of ecosystem
services and the livelihood dependence of local herders and other stakeholders in
selected study sites. The ultimate goal of my study is to contribute to sustainable
management of the IMAR‘s ecosystems.
To achieve the goal of my PhD study, six research questions on the changes in land
use, household consumption patterns and their impacts have been addressed and
investigated for four selected study sites: Hulun Buir, Xilin Gol, Ordos and Alxa
Right. These sites are in a ‗transect‘ from southwest to northeast to capture the
gradient in use of ecosystem services in IMAR.
After introducing the changes in national land-use policies and local socio- ecological
systems in IMAR, Chapter 1 presents a methodological framework that combines
quantitative and qualitative tools to analyse ecosystem services. It specifies an
integrative approach in specific spatial and temporal contexts to evaluate trade-offs
between human activities, use of ecosystem services and human well-being. This
framework enables to analyse the effects of multiple factors (e.g. policies or climate
and geographic conditions) on utilization patterns of ecosystem services and the
influence on society. The data used to apply the framework stems from a bottom-up
approach by using household surveys and other local field data. The framework was
tested for IMAR to ensure its practical applicability in a data-poor environment and to
illustrate that it enhances understanding of the causes and effects of changing land use
patterns and dynamic processes that underlie the provision of ecosystem services. The
framework should not only be applicable for IMAR‘s grasslands but also for other
areas with similar conditions (e.g. livestock-production dominated grassland
ecosystems).
Chapter 2 describes the changes in basic household utilization patterns of food, fuel
and water in response to the restoration policies and their spatial distribution by
grassland types in IMAR. Basic household consumption data were collected in the
meadow steppe (Hulun Buir), typical steppe (Xilin Gol) and semi-desert steppe
(Ordos) ecosystems using structured questionnaires administered to 209 herders and

182
farmers. The results and their analysis show that the householders‘ intake comprised a
low amount of crops, including staple foods, vegetables and fruit with a high amount
of meat. This still dominated the food consumption patterns in 2010. However, the
number of households that prefer this pattern is decreasing and now more crops and
less meat are increasingly preferred. From 1995 to 2010, fuel consumption patterns
changed from bio-fuels (especially dung) to mainly electricity and gas. However, bio-
fuel remains a major energy source in the meadow steppe ecosystems. In all three
surveyed grassland types, the use of coal, electricity and gas increased from 1995 to
2010. Beside the influences of different environmental conditions and economic
development, the grassland restoration policy measures changed grazing activities and
basic household consumption patterns. Grazing activities were less affected by the
policy measures that aimed at seasonal grazing and rotational grazing than other
policy measures. In those cases more herders preferred to maintain most of their basic
consumption patterns (e.g. in Hulun Buir). However, when grazing was prohibited,
immigration and livestock rearing control policy measures (e.g. in Xilin Gol and
Ordos) fundamentally changed the basic household consumption patterns (especially
for food and fuel).
Chapter 3 links livelihood‘s food-consumption responses to potential water
consumption by using a Virtual Water Content (VWC) analysis. This chapter analysed
water-resources use and its relation with changes in livelihoods and household-
consumption patterns (Chapter 2). The results show that compared to the direct water
consumption, the indirect water consumption through food production was a major
share of total water consumption. From 1995 to 2010, indirect water consumption
decreased in Xilin Gol and Ordos because meat consumption decreased and fruit and
vegetable consumption increased. When considering the amount of land per
household, the grassland ecosystems in Ordos are still threatened by high water-
consumption pressures. This affects both water conservation and grassland
productivity. The grassland ecosystem degradation in IMAR leads to a shortage of
meat production and this causes people to purchase food from outside the region to
reduce dependency on local ecosystems. This trend resulted in more diversified
consumption, especially increased vegetable and fruit consumption, but the ability to
purchase food also depends on income levels. Ordos‘ high income level thus reduced
direct water consumption through adoption of diversified food-consumption patterns.
Changing diet behaviour is therefore an important option to more sustainably use
water.
Chapter 4 evaluates the effects of the government grassland-conservation policies on
household livelihoods and their dependence on local grasslands. To ease the impact on
the residents‘ livelihoods, national and regional governments have offered a series of
top-down arrangements to stimulate sustainable use of the IMAR grasslands.
Simultaneously, local households spontaneously developed bottom-up counter-
measures. To analyse the effects of all these measures, I interviewed members of 135
households using a mix of qualitative and quantitative methods. The findings show
that the implementation of the grassland conservation policies significantly affected
household livelihoods and this in turn, affected household use of natural assets
(primarily the land), their agricultural assets (farming and grazing activities) and their
financial assets (income and consumption). The policy implementation thus resulted
in fundamental transformation of their lifestyles. The households developed
adaptation measures to account for the dependence of their livelihoods on local
ecosystems by initializing strategies (e.g. seeking off-farm work, leasing pasture land,

183
increasing purchases of fodder for stall-fed animals and altering their diet and fuel
consumption) to compensate for their changing livelihoods. Before the policy-
implementation, the annual household income and employment based on agricultural
land still depended heavily on local grasslands and most households owned some
livestock, which they raised to sell for income or for personal consumption, especially
in the West Ujimqin and Zhengxiangbai Banners. However, from 1995 to 2010, the
household dependence on local grasslands generally decreased. This indicates a
transition from traditional pastoral grazing to control grazing, rising of modern dairy
cattle (intensive animal husbandry), diversification of income sources and decreases
in land-based employment and in the household food and fuel consumption. These
changes increased the diversity of livelihoods, household resilience and
environmental sustainability.
Chapter 5 presents the impact of conservation measures (changes in grassland-
utilization patterns) on the provision of selected ecosystem services at the three study
sites in IMAR. I examined five utilization patterns: no use (natural grasslands), light
use, moderate use, intensive use and recovery sites (degraded sites protected from
further use). Through household surveys and vegetation and soil surveys the
differences in ecosystem services among the different grassland-utilization patterns
were measured. I also identified spatial factors that confounded the quantification of
ecosystem services in the different grassland types. The results show that light use
generally provided higher levels of ecosystem services than intensive use and no use.
Only supporting ecosystem services differed. Surprisingly, I found no consistently
positive effects of the strict conservation activities across the sites, since the results
varied spatially and with respect to differences in the land-use patterns. My results
suggest that appropriate grassland-utilization patterns likely enhance the supply of
ecosystem services and reduce negative effects on both household livelihoods and the
environment. For example, in the Hulun Buir grasslands, the precipitation is 50%
higher than in the other areas. Therefore the area tolerates a higher grazing intensity
before degradation occurs and its grasslands provide more provisioning services but at
the cost of decreased regulating and supporting services.
Chapter 6 describes two eco-compensation programs to restore grassland ecosystems
in Inner Mongolia in Northern China: the Land Conversion Project (SLCP) and the
Grazing Prohibition Project (GPP). A key challenge is to sustain the livelihood of
residents, who earn most of their income from traditional animal husbandry. I
surveyed 240 herders and 36 government representatives and used contingent
valuation and logistic regression to analyse the resulting data. After implementing the
financing programs, income from cultivation and animal grazing decreased, whereas
income from compensation and off-farm activities increased. The herders preferred an
annual payment of 99.2 US$ ha-1
for participating in conservation activities, but the
government prefers to provide only 83.8 US$ ha-1
, resulting in an annual gap of 15.4
US$ ha-1
. These currently too low payments probably lead some herders to expand
their grazing into restricted grasslands or increase their number of animals,
particularly if such payment program ends. The herders were most concerned about
their economic loss, whereas the government considered both grassland restoration
and income protection equally important. To create an improved and sustainable
payment scheme, solutions are needed that enable the herders to sustain their
livelihood, while conserving the grasslands. My findings can help to establish more
effective payment schemes for the grasslands of IMAR and similar regions.
184
Chapter 7 discusses the contribution of my PhD thesis to understanding interactions
between grassland ecosystems and people in the IMAR by structurally and
consistently analysing the relation between ecosystem services to livelihoods. The
possible grassland-management strategies in the selected study sites were explored.
By comparing remote-sensing data (1995, 2000, 2005 and 2010) with statistical data
(field surveys and Inner Mongolia Statistics Bureau 2015b), 70% of the grasslands in
IMAR is estimated to suffer from grazing or overgrazing. This degradation greatly
alters the local social-economic structure (livelihood of indigenous people) and
grassland ecosystem functioning. To reduce the stress from grasslands degradation,
my thesis provides solutions to more appropriate grassland utilization patterns. These
solutions enhance the supply of ecosystem services and reduce the negative effects on
both household livelihoods and the environment. Moreover, the design of suitable
eco-compensation mechanisms could encourage more efficient grassland uses. My
results show that the present grassland-conservation policy has decreased the trend of
grasslands degradation, but the other key challenge to sustain the livelihood of
herders, who earn most of their income from traditional animal husbandry, was not
solved. They are still concerned about their economic losses, whereas the government
considered both grassland restoration and income protection to be important. To create
an improved and sustainable payment scheme, I recommend to implement solutions
that enable the herders to sustain their livelihoods, while conserving the grasslands.
The Chinese government has implemented many environmental protection projects
and policies since 1998. These policies should reduce ecosystem degradation and
stimulate sustainable management in these grasslands. The implemented grassland
conservation policies have decreased the trend of grasslands degradation. However,
these policies mainly focus on single issues. The grassland-conservation policies
therefore must become more integrated and their positive effects (in terms of
providing social, economic and environmental benefits) should be better clarified and
communicated to all involved stakeholders. Implementing sustainable grassland
management not only requires appropriate policies but also increased participation of
local stakeholders, and suitable financial compensation mechanisms to encourage
efficient grassland uses. My thesis shows that appropriate grassland utilization likely
enhances the supply of ecosystem services and reduces negative effects on both
household livelihoods and the environment.
185
Acknowledgements
I would like to thank my PhD committee: Prof. Dr. Rik leemans, Dr. Rudolf de Groot,
Prof. Dr. Lin Zhen and Prof. Dr. Heqing Huang for their insightful ideas and
continuous support to improve this PhD thesis.
I am thankful to Dr. Huimin Yan, Dr Yunfeng Hu, Dr Chunxia Lu and Prof. Dr. Gaodi
Xie for their advice and guidance during my PhD journey. This thesis would not have
been possible without the hearty friendship and support from Ruizi Wu, Yuehan Dou,
Xiaochang Cao, Haolyn Shang, Chao Wang, Jie Hu, Yunjie Wei, Zhichao Xue and
Wanni Yang, all the IGSNRR and ESA colleagues and friends.
I owe my deepest gratitude to my family: my father Dr. Guanhua Du, mother Zhugai
Wang, grandfather Xuezhen Du, grandmother Shulian Hou, husband An An and aunt
Zhaosheng Du & Zhonghui Du for their unconditional love and support.
The research reported in this thesis was financed in part by a grant from the
Knowledge Innovation Program of the Chinese Academy of Sciences (KZCX2-EW-
306), the National Basic Research Programme of China (No. 2009CB421106), the
National Key Project for Basic Research (973) (No. 2014CB954302), the National
Natural Science Foundation of China (No. 41671517) and the National key Research
and Development Program of China (No. 2016YFC0503700).

186
About the author
Bingzhen Du commenced her PhD with the Environmental System Analysis Group of
Wageningen University and Research (WUR) in 2013. Her PhD project is a joint
doctoral program between the Graduate School for Socio-Economic and Natural
Sciences of the Environment (SENSE, Wageningen) and the Institute of Geographic
Science and Natural Resources Research (IGSNRR, Beijing). This PhD research is
also part of an International Geosphere-Biosphere Programme (IGBP) project, which
is led by IGSNRR.
Before Bingzhen Du started her PhD research, she has worked at IGSNRR since
2010. She participated in many rural household surveys in poorly developed area of
China (e. g. Inner Mongolia, Gansu, Ningxia and Qinghai) under the leadership of
Prof. Lin Zhen. During this time, Bingzhen became interested in the interaction
between people and ecosystems and for her PhD she developed a conceptual
framework and especially focused on analysing the different utilization patterns of
ecosystem services and the livelihood dependence of local stakeholders.
In addition to her PhD work, she participated in several research projects on
international cooperation and national issues related to eco-compensation (i.e.
Payment for Ecosystem Services), which aim to help establish a Chinese eco-
compensation mechanism to conserve natural resources (including grassland, forest
and river basin). During her work with IGSNRR, she was also involved in several
collaborative publications on related topics. `

187
List of publications
Published papers related to thesis
1. Chapter 2: Du B., Zhen L., de Groot R., Goulden C.E., Long X., Cao X., Wu R.,
Sun C. 2014. Changing patterns of basic household consumption in the Inner
Mongolian grasslands a case study of policy-oriented adoptive changes in the use
of grasslands. The Rangeland Journal 36: 505-517.
2. Chapter 3: Du B., Zhen L., de Groot R., Long X., Cao X., Wu R. 2015.
Changing Food Consumption Patterns and Impact on Water Resources in the
Fragile Grassland of Northern China, Sustainability 7(5): 5628-5647.
3. Chapter 4: Du B., Zhen L., Yan H., de Groot R. 2016. Effects of government
grassland conservation policy on household livelihoods and dependence on local
grasslands: evidence from Inner Mongolia, China. Sustainability 8:13-14.
4. Chapter 5: Du B., Zhen L., Hu Y., Yan H., De Groot R., Leemans R. 2018.
Comparison of ecosystem services provided by grasslands with different
utilization patterns in China‘s Inner Mongolia Autonomous Region. Journal of
Geographical Sciences 28(10): 1398-1414.
5. Chapter 6: Zhen L., Li F., Yan H., Liu G., Liu J., Zhang H., Du B., Wu R., Sun
C., Wang C. 2014. Herders‘ willingness to accept versus the public sector‘s
willingness to pay for grassland restoration. Environmental research letters 9:
045003.
Other published papers
6. König H.J., Podhora A., Helming K., Zhen L., Wang C., Wubbeke J., Baumeister
T., Du B., Yan H. 2014. Confronting international research topics with
stakeholders on multifunctional land use the case of Inner Mongolia, China.
IForest-Biogeosciences and Forestry 7:403-413.
7. König H.J., Podhora A., Zhen L., Helming K., Yan H., DU B., Wubbeke J., Wang
C., Klinger J., Chen C., Uthes S. 2015. Knowledge Brokerage for Impact
Assessment of land use scenarios in Inner Mongolia, China: extending and testing
the FoPIA approach. Sustainability 7: 5027-5049.
8. Zhen L., Hu J., Du B., Liu J., Sun C., Wu R., Long X., Zhang Q. 2015.
International experience of green development in Western China: an overall
review of policy and practice. Chinese Journal of population Resources and
Environments 13(4): 281-290.
9. Zhen L. & Du B. 2017. Ecological footprint analysis based on changing food
consumption in a poorly developed area of China. Sustainability 9: 13-23.
10. Zhen L., Du B., Wei Y., Xiao Y., Sheng W. 2018. Assessing the effects of ecological
restoration approaches in the alpine rangelands of the Qinghai-Tibetan Plateau.
Environmental Research Letters 13(9): 1-19.
11. Dou Y., Zhen L., de Groot R., Du B., Yu X. 2017. Assessing the Importance of
the Cultural Ecosystem Services in Urban Areas of Beijing Municipality.
Ecosystem Services 24: 79-90.
12. Cao X., Zhen L., Yang L., Long X., Du B., Wei Y., Li F. 2011. Stakeholder
Perceptions of Changing Ecosystem Services Consumption in the Jinghe
Watershed: A Household Survey and PRA. Journal of Resources and Ecology
2(4): 345-352.

188
13. Zhen L., Liu X., Wei Y., Yang L., Long X., Du B., Li F., Cao X. 2011.
Consumption of Ecosystem Services: A Conceptual Framework and Case Study
in Jinghe Watershed. Journal of Resources and Ecology 2(4): 298-306.
14. Wang C., Zhen L., Du B. 2016. Assessment of the impact of China's Sloping
Land Conservation Program on regional development in a typical hilly region of
the loess plateau — A case study in Guyuan, Environmental Development 21: 66–
76.
15. Hu J., Zhen L., Sun C., Du B., Wang C. 2015. Ecological footprint of biological
resource consumption in a typical area of the Grain for Green Project in north-
western China. Environments 2: 44-60.
189
190
191
The research described in this thesis was financed in part by a grant from the
Knowledge Innovation Program of the Chinese Academy of Sciences (KZCX2-EW-
306), the National Basic Research Programme of China (No. 2009CB421106), the
National Key Project for Basic Research (973) (No. 2014CB954302), the National
Natural Science Foundation of China (No. 41671517) and the National key Research
and Development Program of China (No. 2016YFC0503700).
Financial support from Wageningen University for printing this thesis is gratefully
acknowledged.
Cover materials: http: //www/58pic.com/
Cover design: Bingzhen Du
Printed by: ProefschriftMaken.nl | Digiforce