Wageningen The Hetherlands - WUR eDepot
212
' ' i V, f 4 Wageningen The Hetherlands
-
Upload
khangminh22 -
Category
Documents
-
view
0 -
download
0
Transcript of Wageningen The Hetherlands - WUR eDepot

' ' i V,
f4
Wageningen The Hetherlands

Scanned from original by ISRIC - World Soil Information, as ICSU World Data Centre for Soils. The purpose is to make a safe depository for endangered documents and to make the accrued information available for consultation, following Fair Use Guidelines. Every effort is taken to respect Copyright of the materials within the archives where the identification of the Copyright holder is clear and, where feasible, to contact the originators. For questions please contact [email protected] indicating the item reference number concerned.
ISRIC LIBRARY
&E-&&>.o3 1
Wageningen, The Netherlands
CHARACTERISATION OF SOIL SEQUENCES DERIVED FROM VOLCANIC TUFF IN THE LOITA PLAINS (SOUTHWEST OF KENYA) WITH A VIEW TO THEIR GENESIS, CLASSIFICATION AND MANAGEMENT.
BY P.F. OKOTH
APRIL, 1988
INTERNATIONAL INSTITUTE FOR AEROSPACE SURVEY AND EARTH SCIENCES (ITC)
LAND RESOURCE SURVEY AND RURAL DEVELOPMENT
SOILS GROUP
ENSCHEDE, THE NETHERLANDS
IIMJ.&

Dedicated to my late father Mr. George Onyango.

- I -
Preface
This thesis was submitted in partial fullfilment for the requirements for the award of the degree of Master of Science in Soil Survey using Aerial Photography and other Remote Sensing techniques.
Presented to Examination Board consisting of:
Prof. Dr. Ir. J. Bouma, external examiner, Agricultural University of Wageningen
Prof. Dr. Ir. A Zinck, (Supervisor, ITC)
Dr. Ir. V.V. Elbersen (Director of Studies, ITC)
Ir. E. Niuewenhuis (ITC)

TABLE OF CONTENTS
Preface
Table of contents
List of tables
List of figures
Abstract
Acknowledgements
INTRODUCTION
CHAPTER 1 INTRODUCTION 1.1 Formulation of the problem 1.2 Aims of the study
CHAPTER 2 DESCRIPTION OF THE STUDY AREA 2.1 LOCATION OF THE STUDY AREA 2.2 ACCESSIBILITY, POPULATION AND LAND
2.2.1 Communication 2.2.2 Its People 2.2.3 Population and Land
2.3 ATMOSPHERIC CLIMATE 2.3.1 Rainfall
2.3.1.1 Methodology for rainfall data analysis
2.3.1.2 Rainfall distribution 2.3.1.3 Rainfall Variability
2.3.2 Temperature 2.3.3 Evapotranspiration 2.3.A Other climatic parameters 2.3.5 The growing period
2.4 GEOLOGY 2.4.1 Geological history
2.4.1.1 Precambrian 2.4.1.2 Miocene 2.4.1.3 Pliocene 2.4.1.4 Pleistocene
2.4.2 Lithology 2.4.2.1 Metamorphosed psammitic sediments 2.4.2.2 The pyroclastic rocks 2.4.2.3 River deposits
2.4.3 Rock composition and soil parent material 2.4.3.1 Soils developed on quartzitic parent
material "• 2.4.3.2 Soil developed on colluvial material
originated from quartzites 2.4.3.3 Soils developed on pyroclastic parent
material 2.4.3.4 Soils developed on river deposits

- Ill -
2.5 GEOMORPHOLOGY 2.5.1 Regional relief structure 2.5.2 Geomorphic landscape evolution
2.5.1.1 The hogback ridges 2.5.1.2 The higher level plateau 2.5.1.3 The lower level plateua 2.5.1.4 The plain 2.5.1.5 The piedmonts
HYDROLOGY 2.6.1 Hydrography 2.6.2 surface water avalability 2.6.3 Ground water
7 NATURAL VEGETATION 8 LAND USE
2.8.1 Pastrolism 2.8.2 Large scale wheat cultivation
2.6
26 26
'26 Z7 17 28 28 29 29 29 29 30 31 31 31 33
CHAPTER 3 LITERATURE REVIEW 3.1 INTRODUCTION 3.2 SOILS DERIVED FROH VOLCANIC PARENT MATERIAL
3.2.1 The influence of parent materials on soil development
3.2.2 Correlation and classification 3.2.3 Properties of soils developed on volcanic
ash parent materials. 3.2.4 Clay minerals associated with volcanic ash
soils 3.3 PLANOSOL FORMATION
3.3.1 Formation conditions and properties 3.3.2 The polycyclic theory
3.4 DEFINITION OF BASIC TERMINOLOGY AND CONCEPTS 3.4.1 Weathering and clay formation 3.4.2 The movement of substances withinsoils
3.5 SYSTEM OF HYPOTHESIS 3.5.1 Research hypothesis 3.5.2 Operational hypothesis 3.5.3 Hypothesis testing
CHAPTER 4 METHODOLOGY 4.1 PREPARATION FOR THE FIELDWORK.
4.1.1 Acquisition of materials and equipment 4.1.2 Air photo-interprtation
4.2 FILEDWORK. 4.2.1 Survey methodology 4.2.2 Collection of soil data 4.2.3 Choice of transects 4.2.4 Soil sampling procedures 4.2.5 Compilation of geomorphic soil map
4.3 POST FIELDWORK STAGE 4.3.1 Laboratory determinations 4.3.2 Compilation of final geomorphic map and report 4.3.3 Reliability of procedures
CHAPTER 5 DESCRIPTION AND CHARACTERIZATION OF THE TRANSECTS 5.1 BAR KITABU TOPOSEQUENCE 5.2 LOMANERA TOPOSEQUNCE
34 34-34
34
36
3d
38 44 44 4 4 46 47 50 6Z 6Z 53 54-55 55 55 55 55 5 5 5& 56 51 51 51 51 5& 5S> 60 60 66

- I V -
5.3 MASAI LOMANERA TOPOSEQUENCE 5.4 MAJI MOTO TOPOSEQUENCE 5.5 ANGATA LOITA TOPOSEQUENCE 5.6 SAROVA TOPOSEQUENCE
CHAPTER 6 COMPARISON OF SOIL TOPOSEQUENCES 6.1 SOME SOIL PROPERTIES
6.1.1 physical properties 6.1.2 Chemical properties 6.1.3 mineralogical properties
6.2 INFLUENCE OF SOIL FORMING FACTORS 6.2.1 Parent material 6.2.2 Climate 6.2.3 Vegetation 6.2.A Topography 6.2.5 Time
6.3 MAIN ASPECTS ON PEDOGENESIS: GENETIC/DIAGNOSTIC HORIZONS FORMATION 6.3.1 Mollic epipedons 6.3.2 The eluvial horizons 6.3.3 The argillic horizons
6.4 SOIL CLASSIFICATION 6.4.1 Soil classification according to FAO-UNESCO
system MQ> 6.4.2 Soil classification according to USDA soil taxonomy
system 6.4.3 Comparison of the two systems
CHAPTER 7 INFLUENCE OF SOIL PROPERTIES ON SOIL MANAGEMENT 7.1 EROSION
7.1.1 Carbon content of the topsoil 7.1.2 Management practises 7.1.3 Land tenure
7.2 STRUCTURAL STABILITY 7.2.1 Aggregate stability 7.2.2 Management practises
.7.3 COMPACTED SUBSOILS 7.3.1 Plano-argillic subsoils 7.3.2 Natro-argillic subsoils 7.3.3 Abrupto-argillic horizons 7.3.4 Luvo-argillic horizons
7.4 FERTILITY 7.4.1 Soil acidity 7.4.2 Nitrogen 7.4.3 Phosphorous 7.4.4 Potasium 7.4.5 Ion exchange
CONCLUSION BIBLIOGRAPHY APPENDIX (Soil profile descriptions).
75 82 88 96
104 104 104 104 106 113 113 117 120 121 122
122 122 123 124
128
130 137
138 138 140 140
140 -145
146 146 150 150
150 151 152 153 153 156 159 170

- V -
List of tables
Table 1. Population of the study area. 6 Table 2. The 75% and 50% probability rainfall distribution
at four stations within 50 km of the study area. 9 Table 3. The distribution of wet and dry months. 10 Table 4. Air temperatures data (Narok Met. Station). 10 Table 5. Evaporation and potential évapotranspiration at
Narok Met. Station. 12 Table 6. Daily radiation, sunshine, wind speed and relative
humidity 12 Table 7. Mean annual and monthly rainfall and its variability
at four stations within 50 km of the study area. 14 Table 8. Mean monthly rainfall, evaporation and reference
potential évapotranspiration for Narok Met. Station. 17 Table 9. Development stages for a wheat crop and its
corresponding Kc values 17 Table 10. Input file for WTRBLN program (wheat crop) 18 Table 11. Input file for WTRBLN program (grassland) 18 Table. 12. Long term average monthly water balance (grassland) 19 Table 13. Long term average monthly water balane (wheat) 20 Table 14. Geochemical composition of volcanic ashes. 25 Table 15. Water discharge 29 Table 16. Water quality 30 Table 17. X-ray analysis, profile 146/1-371 107 Table 18. X-ray analysis, profile 146/1-372 109 Table 19. X-ray analysis, profile 146/3-366 108 Table 20. X-ray analysis, profile 146/3-367 108 Table 21. X-ray analysis, profile 146/3-368 108 Table 22. Extractions on selected profiles using sodium
dithionite, ammonim oxalate, sodium pyrophosphate methods
Table 23. Dissolution of AI, Fe and Si in various clay constituents and organic complexes by treatment with different reagents
Table 24. Geochemical composition, profile 146/1-370 Table 25. Molar ratio of the sesquioxides In table 24 Table 26. Geochemical composition, profile 146/3-367 Table 27. Molar ratio of th* sesquioxides in table 27 Table 28. Geochemical composition, profile 146/1-350 Table 29. Molar ratio of the sesquioxides in table 28 Table 30. Geochemical composition, profile 146/1-393 Table 31. Molar ratio of the sesquioxides in table 30 Table 32. Soil temperature data (Narok Met. Station) Table 33. Statistical correlation tables Table 34. Monogram showing at which values r is significant Table 35. ESP and EC values for the northern region Table 36. ESP and EC values for the southern region Table 37. Amounts of gypsum and sulphur required to replace
indicated amounts of exchangeable sodium Table 38. Properties related with soil acidity for selected
samples Table 39. Charge characteristics of clay minerals of some
soils in Kenya (meq/lOOg)
111
112 113 113 113 113 113 113 114 114 131 141 144 147 148
148a
151
155

- VI
List of figures
Flg. 1. Location map of the study area. 5 Fig. 2. Rainfall iso-lines within the study area 8 Fig. 3. Ombrothermic diagram Narok Met. Station 11 Fig. 4. Cummulative frequency diagram (narok Met. Station) 13 Fig. 5. Mean monthly rainfall at four stations within 50 km
of the study area 15 Fig. 6. Water balance for wheat and grassland (computer
program) 21 Fig. 7. Major landtypes and location of the transects 59 Fig. 8. Variations of the percentage exchangeable cations
within the Bar Kitabu toposequence 64 Fig. 9. Textural variation within the Bar Kitabu
toposequence 64 Fig. 10. Soil sequences of the Bar Kitabu tposequence 65 Fig. 11. Photograph showing profile 146/3-359 69 Fig. 12. Distribution trend of exchangeable Ca/ Mg, K and
Na down the toposequence 72 Fig. 13. Textural variation within the lomanera toposequence 73 Fig. 14. Soil sequences of the Lomanera toposequence 74 Fig. 15. Photograph showing profile 146/3-359 69 Fig. 16. Lateral variation of the percentage exchangeable -
cations of the Masai Lomanera toposequence 80 Fig. '17. Textural variation within the Masai Lomanera
toposequence • 80 Fig. 18. Soil sequence of the Masai Lomanera toposequence 81 Fig. 19. Lateral and vertical variations of the exchangeable
cations of the Majl Moto toposequence 86 Fig. 20. Textural variations within the Majl Moto
toposequence 86 Fig. 21. Soil sequence of the Maji Moto toposequence 87 Fig. 22. Photograph showing dwarf shrub grassland on the •
summit of the Angata Loita toposequence 89 Fig. 23. Photograph showing profile 146/1-370 92 Fig. 24. Lateral and vertical variation of the exchangeable
cations within the>Angata Loita toposequence 94 Fig. 25. Soil sequence of the Angata Loita toposequence 95 Fig. 26. Textural variation within the Angata Loita
toposequence 96 Fig. 27. Photograph showing profile 146/3-366 98 Fig. 28. Vertical and lateral trend in the distribution
of the exchangeable cations 101 Fig. 29. Textural variation within the Sarova toposequence 101 Fig. 30. Soil sequence of the Sarova toposequence 102 Fig. 31. Comparison of the percentage carbon within the
six toposequences . • 104 Fig. 32. Comparison of pH within the six toposequences 104 Fig. 33. Comparison of CEC within the six toposequences 106 Fig. 34. X-ray diffractogram showing air dried unheated,
Mg saturated sample 109 Fig. 35. X-ray diffractogram showing K saturated sample
heated to 550 C 109

- VII -
Flg. 36. Photograph showing translocation of clay by lateral seepage 125
Fig. 36a Graphical presentation of the relationship between structural stability and ESP 145
Fig. 37. Graphical presentation of the ralationship between pH and ESP 148
Fig. 38. Sequence of determinations for the diagnosis and treatment of saline and sodic soils 149
Fig. 39. Graphical presentation of the relationship between CEC and pH I 5 4

ABSTRACT
This study has characterized six soil sequences derived from volcanic tuff in the Loita Plains, Southwest Kenya and explored their genesis, classification and management problems.
The Loita Plains falls in a semi-arid to subhumid climate with an average annual precipitation of 664-737mm. The mean minimum temperatures range between 7.2 and 11.3 C with an absolute minimum night temperature of 0.3 C. The mean maximum temperatures range between 21.4 and 26.9 C. The mean annual temperature is 16.5 C. The mean annual evaporation and évapotranspiration are 129 and 102 mm respectively. The area is on Quarternary volcanic ash and tuffs except on hills where quarzitic rocks of the Pre-cambrian age stick out. Most of the area is under grassland or bushed grassland except the northern part with extensive wheat cultivations.
From the characterization of the soils, most andic properties are lacking in the soils. The bulk density ranges between 1.1 and 1.7 and moisture rention capacity has a mean value of 56.8 vtX. The carbon contents range between 0.01 to 2.63%. The pH for the topsoils is an average of 6.6 and 8.2 for the subsoils due to their high sodium contents. Though X-ray analysis find the soils amorphous, Very little active Al and Fe oxides is obtained by dissolution analysis. Kaolinite, halloysite, mica and or illite are the dominant crystalline clay minerals with traces of quartz and feldspars identified by X-ray analysis.
Out of the six toposequences described, three soil association groups are identified according to soil distribution within the landscape. They include, Bar Kitabu Lomanera group, the Maji Moto group and the Angata Loita group. Mostly they are comprised of Alfisols in the midslope and footslope positions and Mollisols on the summit position.
Management problems connected with erosion, structural instability, compacted subsoils and fertility have been identified and possible management practises suggested.

^
ACKNOWLEDGEMENTS
I would like to thank, everybody whose physical or moral participation helped me carry out this work to completion. First I would like to express my sincere gratitude to my supervisor Professor A. Zinck for his continued support and guidance during all the execution stages of this work. It is not however possible to mention everybody and every institution that contributed, but the following people and institutions have been singled out.
First, the government of the Republic of Kenya, for granting me the chance and study leave to follow the MSc course abroad and the Kenya Soil Survey Project through DGIS for the financial support during my stay in the Netherlands.
I would like to thant ITC for giving me the chance to follow the course and and at the same time provide a good environment for my study. The International Soil Reference and Information Centre (ISRIC) is thanked for allowing us to follow a three weeks course in laboratory methods for soil analysis and accepting to analyse our samples.
The National Agricultural Laboratories (Nairobi, Kenya) for their tireless efforts to analyse a part of our samples during the period of study.
My appreciation and gratitude goes to the following:
Dr. W. Sideriuos, for his assistance and contacts with KSSP during mu study.
Dr. W.W. Elbersen, Director of studies for the MSc course for his support and organization of the course.
Professor Dr. Ir. J. Bouma for accepting to be my external examiner and to be in the examination board.
Drs. Donker for help in statistical analysis.
All staff members of the soils group whose encouragement and assistance helped me complete this course.
Messrs V.V. Aore and E.M. Situma, who contributed to some of the data acquisition and interpretation.
P.M. Mainga, P.W. Kimotho, R. Senoga, K.M. Htay, T.T. Pule and B. Yuogha for helping me with the text figures.
Mrs. Marga Koelen and all staff of the ITC library for their assistance during literature search.
My classmates, Ndjib, Tchienkoua, Aore, Olowolafe, Nyiauw, Lutfi, Tricatsula, Mambo and Vamunyima for being such good working mates.
Miss Marlene Lewis for all her encouragement from the beginning.
Finally my family members who might have suffered physically or mentaly during my stay in the Netherlands.

CHAPTER 1 INTRODUCTION - 1 -
1.1 FORMULATION OF THE PROBLEM
Of Kenya's 582,646 sq km of land only 17% can be used for arable dry farming, the rest being either semi-arid, arid or area of land occupied by water (Ojany and Ogendo, 1974).
Agriculture may be described as the mainstay of Kenya's economy. In order to develop this sector a diligent and precarious use of the scarce resources is stressed (Sessional Paper No 4 of 1981, and Nol of 1986). It is therefore necessary to understand and underline the major constraints of agricultural production namely: finance, soil resources, crop varieties, pests, climate and land tenure, before a meaningful development plan can be drawn for the sector.
Due to little acreage of farmland, and a high population increase rate of 4% (Sessional Paper No. 1, 1986), Kenya is currently facing a scarcity of land. The high rate of population increase is causing a pressure on land especially in the high rainfall areas. As a consequence people migrate from wetter to drier areas transferring farming technology without the appropriate adjustments to the new environment. This often leads to land degradation and crop failure caused by unreliable rainfall and bad soil conditions. In order to attain self-sufficiency in national food requirements, the Kenya government drew up a national food policy in the Sessional Paper No.4 of 1981, outlining the objectives, constraints and strategies of maintaining a position of broad self-sufficiency in production of the main foodstuffs in order to enable the nation be fed without using scarce foreign exchange on food imports.
In order to fulfill this, the ministries of Agriculture and Livestock Development were assigned the duties of promoting increase in national food production in order to keep pace with population and income growth through the remainder of the decade. This they were to achieve through institutions of research, agricultural extension and intensification of agricultural production.
Kenya Soil Survey under the ministry of Agriculture is one of such institutions that carries out soil surveys in the country both for national planning and for land utilization. Among the many duties assigned to the Kenya Soil Survey, priority in soils research with a view to the identification of constraints for optimal agricultural production is currently a matter of national importance and priority. Constraints include soil parameters such as, acidity, toxicity, salinity, sodicity, erodibility, lack of foot hold, unavailability of moisture and soil nutrients, and unfavourable soil mechanical characteristics.
Recently, the Kenya Soil Survey has selected Narok district (southwest of Kenya) for a reconnaisance soil survey starting in the Loita Plains, an area formerly under extensive grazing and currently being rapidly converted to commercial wheat production without proper knowledge on the soil conditions. The Loita Plains are important in the national context in that they form one of the grounds for cattle grazing which provide protein to the diet of most Kenyans. Similarly, the area contributes significantly to the total wheat produced in Kenya, saving the country a lot of foreign exchange which would have otherwise been used in the importation of this comodity. Tourism which is a main revenue generator, is an expanding activity in the Masai Mara Game Reserve, located a few kilometres from the study area. At most times the animals use the Loita Plains as a dispersal zone. There is an urgent need for soil information in this

low rainfall area, in order to asses the hazard of land degradation and at the same time introduce appropriate technologies and management practises for sustained agricultural production.
Several issues requiring attention have been identified, namely: soil, climate and socio-economic issues.
1) Soil issues
Soil related issues in the area are associated with: information, management and erosion.
a) Information
The existing soil map of the area is of very small scale, failing to come out with the actual soil variations in the landscape. The Exploratory Soil Map of Kenya (Sombroek et al., 1982) maps the whole area as consisting of Planosols while in actual fact the planosols only occupy the level terrains and footslopes of the mesa reliefs (Okoth and Aore, 1988). As a result, a review of the soil distribution and their classification is necessary. Apart from Planosols, other soils classifying as Solonetz, Cambisols, Phaeozems and Luvisols also occur in the area (Okoth and Aore, 1988).
b) Inherent soil properties.
Soil properties hindering agricultural production are related to the presence of slowly permeable horizons which deter both root growth and uptake of water due to their compactness and high clay contents. High percentages of exchangeable sodium within the subsoil and high sealing indices within the surface also pose problems. The high sodium contents makes them highly dispersable, leading to structural collapse caused by easy slaking on the introcdution of water. The exposure therefore of the B horizons to the surface gives way to easy water erosion due to their vulnerability. The high sealing indices and the slowly permeable layers easily conduce surface runoff, allowing the development of rills and micro-erosional steps.
c) Improper management.
Some of the degradation aspects are conditioned by the topography, cover, and tillage. Most farmers disregarding the influence of slope on water erosion, plough the land against the contour. This kind of ploughing results in enormous soil loss just before planting, after the field preparation on the beginning of the rains. Mulching of the land, excavation of ditches or the construction of terraces could help reduce the erosion hazard in the area. Minimizing the stock and the employment of better animal husbandry might help aleviate the problem of over grazing now so grave in the area.
2) climate issue
The Loita Plains fall within a subhumid climate to the north and a semi-arid climate to the southeast. This does not only affect the type of agriculture that can be successfully practised in the area but also poses a problem on soil conditions. The high temperatures favours rapid decomposition of organic matter when the soil is ploughed. Removal of vegetative cover exposes the soil to high

- i -
évapotranspiration rates removing some of the water that would have been used by the plants. Solution to these problems require management methods appropriately designed for them.
3) Other issues
Socio-ecomonic and institutional problems related to the Loita Plains need to be looked into in order to develop a good land tenure in the area with a view to the improvement of agricultural technology and animal husbandry.
1.2 AIMS OF THE STUDY
) To characterise the morphological, physical, chemical and mineralogical roperties of soils of the Loita Plains as a basis for their differentiation.
1 proper
2) To study the influence of soil forming factors such as organic matter, climate, topography, drainage, parent material and time on the soils characteristics.
3) To determine genetical relationships, in space and time, of the soil associa
tions.
4) To analyse the incidence of properties and forming factors on the appropriate
management of the soils.
Relationship Model
Genesis
\ Properties
+ Forming factors
\ t Properties
+ Forming factors
Properties +
Forming factors
The study therefore aims at characterizing the soils of the area with the main obiective of getting a good understanding of their genesis, classification, and potential management problems. The results obtained from this study may be extrapolated to other parts of the district and could be used to predict the nature of soils in other parts of the country with similar conditions.
The study describes the general location of the area, its accessibility and environment, the methodology, literature review on soils developed on volcanic ash, setting of the toposequences, characterization of the the soils, their genesis, classification and management.

- 4 -
CHAPTER 2. DESCRIPTION OF THE STUDY AREA
2.1 LOCATION OF THE STUDY AREA
The study area is situated in the southwestern part of Kenya, west of the Rift Valley. It is lies 35 km west of Narok, between Lemek and Ololulunga. Barkitabu binds it to the south and Ngore Ngore to the north. The area forms part of Narok District which belongs to the Rift Valley Province.
The area is bound by latitudes 1 00 and 1 24 South of the Equator and longitudes 35 29 and 35 42 East of the Greenwich. It covers about 800 sq km and has an altitude range of 1880 to 1900m in the central parts and 2030m towards the north and the extreme southern parts.
The area is in Loi ta Division which is subdivided into Lemek, Ololulunga, Loita and Lomanera locations. The locations are governed by Assistant Chiefs, while the Division is governed by a Chief stationed in Lemek. All the chiefs of the Narok District are under the District Officer in Narok.
2.2 ACCESSIBILITY, POPULATION AND LAND
2.2.1 Communication
The area is served by earth roads, normally used for tourism to the Masai Mara Game Reserve. The main road serving the study area connects Ewaso Ngiro and Mara Bridge through Lemek and Ai tong. This road is motorable during dry seasons but is almost impassable in the rainy seasons. The Narok-Keekorok road passing on the eastern and southern fringes of the area is partly on ashphalt upto Maji Moto, the rest being a gravelled earth road to Keekorok. From Lemek to Osilalei area is a motorable track in the dry season, which can hardly be used by four wheel drive vehicles in the wet season. A similar road traverses the area from Ngore Ngore southwards through the wheat fields in the Maji Moto direction.
2.2.2 Its People
The Loita Plains are mainly inhabited by the Masai ethnic group whose main occupation is cattle grazing. The northern parts are inhabited by other ethnic groups whose main occupation is large scale wheat production. These people are normally land leasers of Asiatic and European origin. Their labour force normally comprises of peolpe from different Kenyan ethnic groups namely the Kikuyu, the Luo, the Luhya, and dominantly the Kalenjin.
The Masai have a long history of cattle grazing. For them cattle possession signifies social status and wealth. In time they have intermarried with the Kikuyu who are normally incorporated into their life styles. The family's subsistence is normally raised from cattle sales and any other financial matter is settled from these funds. Masai live in "bornas" comprised of ten to fifteen "manyattas" (a manyatta being a dwelling which holds one family unit). Each borna has a head who is normally the oldest person in the generation of elders and who has the highest number of cattle. The head of a family is the husband of the household.
The Masai mostly feed on cattle products of milk, beef and blood. Starch in their diets is very low, contributing to make the Masai a lean and tall person with a small bodybuild. Due to dedication to their cattle herds, and the limited

- 5 -
34 38 38' 40'
c ( \ s , E T H I O P l A r* -* > ƒ 4* c ( \ s , E T H I O P l A r* -* > ƒ
S * t /*' /
1 UGANOAV
7' -
4<Ç • Killt« K E N'Y A SOMALI
-X-—--i *' 0 '
g ' umu ^ Mt K Nahuru -
Mt K Nahuru
Y ) .-"' l« Li> _*. arak t
<\jï N . - r o b . * . \ • / • ' « • * - * ^ 5 « . \ \ / T * N Z A N t * > v v . '•• \ ; . *••"".'' y
?' / ^\, " * * • ••- • î 'i « y -KEY / » M I * » * . - * •> ^ r
^oid » M I * » * . - * •> ^ r
/ int«rn»t>ona • f lo-n ^v. , >-o^ _^ i
)~—.„'».>>- f V ^ " * * ^ . . . "**»ƒ INDIAN OCEAN
4 r >v Wombas»W/ ^
/ i
0 SO 100 S50 *m >*,. / ^ v
/ i 1 1 \ ^ * 1 / 3'
/ / •
Ngore Ngo
Lene- • — *
. * » • • Aiiöng J
i •y \ .
J..,-
Y > •>
/
1 1 1—
' 1
'-' / r-.
1
X"
- ; ' . / • - •
" '~4 • .' °y' " V .-' /
y \ . --
1 V ' <* KeeHoroK
Fig 1. Location map of the study a r ea .

- 6 -
pastures, the Maasai often lead a nomadic life looking for areas where grass is still able to support the cattle. During extreme droughts, the Masai may lose part or all their means of subsistence.
2.2.3 Population and Land
According to the 1979 population census, a total of 210,306 were living in an area of 1,608,700 ha in Narok District. Of this land 1,350,100 ha are suitable for ranching and a small part (258,000 ha) is suited for agriculture. The total population of the district rely mainly (95%) on livestock grazing, and a few depend on agriculture. Most of the agricultural land is leased from the Masai, who are in need of extra income.
On the whole the population density ranges between 4 and 20 people per a sq km. of land.
Table 1. Population of the study area.
Location/Division Male Female Total No of sq km Density Households
1. Ololulunga 11,228 11,411 22,639 4,113 1095 20
2. Lemek 8,544 8,284 16,828 3,004 2613 6
3. Loita 3,336 3,031 6,367 1048 1307 4
Source: Central Bureau of Statistics (1979)
2.3 ATMOSPHERIC CLIMATE
Climate has an important influence on the nature of the natural vegetation, the characteristics and evolution of the soils, the crops that can be grown and the type of farming that can be practiced in any region. Each zone dominated by a given regional type of climate also shows local variations due to changes in relief.
2.3.1 Rainfall
2.3.1.1 Methodology for rainfall data analysis
The analysis of rainfall data was carried out on an ITC developed software program. The program used tests if a sample distribution corresponds to a certain mathematical distribution. It consists of the following steps:
- The data is entered by keyboard and stored on disk for later use.
- A cumulative probability curve is produced as follows: observations are ranked in decreasing order and the cumulative probability (P) is calculated by the relation labelled as EDF1 (empirical distribution function):
R p = x 100 where R = rank of each observation
N+l N = no. of years of rainfall data

- 7 -
- The return period or recurrence interval (T) is calculated by the relation 1
T = 1-P
The results are presented in the form of a table, and then plotted on a graph showing a linear partition along the Y-axis and a normal probability partition along the X-axis
- Regression is then applied to obtain a best line of fit through the distribution.
- A 95% confidence interval for point prediction is calculated and plotted. The results are presented in figure
2.3.1.2 Rainfall distribution
The study area is located in a region over which the pressure and wind systems migrate with the apparent movement of the overhead sun, leading to an alternation of a wet season controlled by intertropical convergence zone conditions at a time of high sun, with a dry season controlled by continental tropical air masses at a time of low sun (Webster et al., 1978).
The occurrence of a dry season limits the production of many crops to only part of the year. The duration of the wet season, the amount of rain, its distribution and reliability restrict the type of crops that can be grown and the yields that can be obtained.
The average annual rainfall for Narok station with a 73 year record is 737mm. During this period, it varied in individual years from 300 mm to 1360 mm (appendix...). Other stations located within 50 km of the study area are: Lemek (667mm), Naikarra (693mm), and Ai tong' (1029mm). table 3 shows the mean annual and monthly rainfalls at these four stations.
The rain season starts in November and lasts for seven months, while the dry season begins in June and lasts for five months. The rain season (Narok station) accumulates about 80-85% of the total annual rainfall.
Based on fieldwork and rainfall data, the following additional observations were made: a) There is a general increase of rainfall from east to west (towards Aitong')
and northwards (towards Bomet). b) There is a general decrease southwards (towards Maji Moto area), but with an
increase again in the Loi ta hills. c) Rainfall occurs in heavy downpours with limited infiltration into the soil.
2.3.1.3 Rainfall variability
The year to year variations of the annual totals and the wet season totals are larger than those of the dry season totals (30%, 28% and 20% respectively).
The cumulative frequency distribution of annual rainfall totals is nearly normal, for all the four stations (fig 5). The reliability of annual rainfall is expressed by calculating confidence limits for 95% confidence interval (fig ^ . From this cumulative frequency graph, it is possible to read off values of: (a) any required probability, (b) the return period and (c) the mean annual rainfall. Total rainfall may be adequate, but poor distribution or low

- 8 -
600 - 700
Fig 2. Rainfall iso-lines within the study area.

- 9 -
reliability in any one month may increase the chances of failure or reduce yields. The probability of getting a given amount of rainfall in any one given month at the 50% and 75% probability level has been calculated and is presented in table 4.
According to Gregory (1978), once the coefficient of variation (CV = standard deviation/mean monthly rainfall exceeds 35%, it becomes increasingly misleading to predict rainfall probabilities, because under such conditions the data do not fit the normal frequency curve. As an example, the rainfall for the month of August at Narok Met. Station is quoted. The coefficient of variation for a seventy three year period is approximately 123%. This means that rainfall during this month is very variable. In four of the years no rain at all fell in August, and in none of other twenty August months did it exceed 5.0 mm. The probability of getting a pattern of rainfall over, say, a seven month growing season however, can be calculated by multiplying the monthly probabilities together.
Table 2» The 75% and 50% probability rainfall distribution at four stations within 50 km of the study area.
STATION PROBABILITY MONTH
NOV DEC JAN FEB MAR APR MAY JUN JUL AUG SEP OCT
Narok (737mm)
75% 50%
29 64
36 72-
30 70-
44 - 80.
53 98
92 144
52 92
12 29
7 17
5 21
9 23
11 27
Lemek (667mm)
75% 50%
26 43
19 49
30 76
45 71
44 78
58 99
33 60
35 50
12 48
8 24
19 43
26 26
Naikarra (693mm)
75% 50%
21 63
27 70
33 71
52 77
30 74
55 101
42 65
33 52
9 28
16 30
16 46
8 16
Ai tong' (1029mm)
75% 50%
40 119
64 113
53 89
62 109
54 110
96 170
13 79
31 58
17 41
22 56
26 53
14 32
The classification of the months into moist, moderately dry, and dry is shown in table 5 (after Brown and Cocheme). The grouping is done by establishing the relationship between the monthly rainfall and évapotranspiration of a given station.

Table 3- The distribution of wet and dry months
Station Probability Class: Lfication
moist moderate ly dry dry
Narok (1890m)
50% 75%
7 2
0 4
5 6
Lemek (1980m)
50% 75%
7 1
5 10 1
Naikarra (2300m)
50% 75%
9 2
3 8 2
Ai tong' (1760m)
50% 75%
10 3
2 8 1
Definitions of the seasons:
Moist month: monthly rainfall is greater than 0.5ETo where ETo = évapotranspiration
Moderately dry month: monthly rainfall is less than 0.5ETo but greater than 0.25ETo
Dry month:
Very dry month:
2.3.2 Temperature
monthly rainfall is less than 0.25ETo but greater than O.lETo
monthly rainfall is less than O.lETo
(after Brown and Cocheme)
The mean annual air temperature is 16.5 C in Narok. The temperature regime follows the general trend for the tropics, diurnal changes being greater than the annual ones. The annual mean amplitude between the hottest month (17.6 C) and the coolest month (14.7 C) is of 2.9 C. The daily mean amplitude, however, is much higher, reaching 19.7 C. The range in mean monthly maxima temperatures is 5.3 C, while that of the minima is 4.1 C.
Table 4. Air temperature data (Narok Met. Station)
Name of Kind of Station records Jan Feb Mar Apr May Jun Jul Aug Sep Oct Nov Dec Year
NAROK Met Mean Max. 26.5 26.9 26.3 24.4 22.6 21.8 21.6 22.4 24.6 25.9 25.4 25.6 24.5 Station Mean temp. 17.1 17.4 17.5 17.6 16.9 15.4 14.7 15.0 15.9 16.7 16.6 16.7 16.5
Mean Min. 7.8 7.9 8.7 10.9 11.3 9.0 7.9 1.1 7.2 7.6 7.9 7.9 8.5
Abs. Min. 1.3 0.9 2.7 3.8 2.9 1.6 0.3 1.1 0.5 1.3 1.8 1.7 0.3

- 11 -
Mean monthly rainfall and teperature at Narok Meteorological Station
30
20
10
-l 160
140
4 120 P = 2T
\ H 100 \
/ ,
/ \
/
/ \
/ \ ]80
VT \ _| 60
/ \
- ' \ j 40
J«
J \ . * -I 20
0 I 1 1 i i I I i i i i i
NOV DEC JAN FEB MAR APR MAY JUN JUL AUG SEP OCT
* Precipitation in mm
__. . Temperature in degrees centigrade
Fig 3. Ombrothermic diagram (Narok Met. Station).

- 12 -
2.3.3 Evapotranspiration
Evaporation (Eo) is very high in this part of the country. The potential évapotranspiration (ETP) has been calculated using the Penman method. Results are presented in table .'.
Table 5. Evaporation and potential évapotranspiration at Narok Met. St.
Month Nov Dec Jan Feb Mar Apr May Jun Jul Aug Sep Oct Mean
Eo ETP
125 100
139 110
150 120
144 115
133 122
128 102
113 90
102 82
104 83
110 88
133 90
152 122
129 102
Potential évapotranspiration is highest in October, just before the the start of the long rains, and continues up to April. It is lower during the dry season.
2.3.4 Other climatic parameters
The variations in daily radiation, daily sunshine, humidity, are presented in table 8 for Narok Station.
vind speed and relative
Table 6. Daily radiation, sunshine, wind speed and relative humidity
Daily radiation Daily sunshine Wind speed Relative humidity
MEAN MEAN 9am 3pm 6am 9am 3pm
(LANGLEYS) (HOURS) (KNOTS) X % X
NOV 462 7.2 5 10 93 73 45 DEC 503 8.2 3 9 93 75 45 JAN 497 8.5 3 9 91 75 40 FEB 508 8.3 3 10 90 75 38 MAR 495 7.6 3 10 91 77 43 APR 454 7.0 4 11 94 84 53 MAY 420 6.7 5 10 95 87 60 JUN 414 7.2 4 9 94 83 56 JUL 386 6.2 5 9 92 81 53 AUG 421 6.4 5 9 91 80 50 SEP 483 7.7 6 10 92 75 43 OCT 504 8.3 7 11 92 70 39
AVE. 462 7.4 4 10 92 78 45
Wind speed measured in knots, viz. 1 knot = 1.15 miles = 1.85 km. 58 Langley (Ly) = 1.00 mm evaporation equivalent.
The difference between maximum and minimum daily radiation during the growing period is 78 Langley. Daily radiation is lowest in the month of July (driest month). Mean daily sunshine hours are never less than 6. The lower values in July and October reflect more cloudy conditions at that time. Relative humidity is more than 90% at midday throughout the year. At 3 o'clock it is equal to or more than 70%, while during evening hours the values are as low as 38%.

- 13 -
RETURN PERIOD
m m (S (S) (S (S S) (S (S OJ m in ^•4 ru
a v c
_ J
E x t r . v a l
—• 63 63 63 63 -* in 63 63 63 63 —
63 m 63 vtm 63 rum in
63 63 63 63 rv 63 63 in tn 63 63 in co 00 CO co (V" OD CT) en co co oo co
CUMULATIVE FREQUENCY (PROBABILITY)
Fig 4 . Cummulative frequency diagram (Narok Met. S t a t i o n ) .

- 14 -
- J U H N H D W Ê O O O W t ^ O - J
u iooj<oœtovoo>ui .bou3oooo
P-> *» <3\
< M Û I J I O U l - J O > - J O l O O a i U J N W
p-» P-- m -J
o \ o \ o o i o u i o * > ^ i p o w s ) * i m
O O > I O 0 \ U l N | l l ] U < 0 9 O O b M > 0
•—» I—» •—> P M N v I O W U 1 U 1 ^ Ü 1 ^ J > J P 0 0 3 P I - , ^ C D ( 0 K J W ( X P O ) > O O O t O l O l A i t O O l O t O
p- P-
* ->OJ<TiOOOO~4N)*»P- '~J[OVOUlUl -J
- 15 -
NAftOK A I T O N G '
-\ !
i i I T.Q7 Î Î C JA» FEB KAB 1P3 : U Ï JÜÏ JtJL lCC SE? OCT SOT TEC J A 5 . ~ 3 SAB AJ3 XAT „TJÏ ."UL ICC ZZ? OCT
LEMEK NAIKARRA
» 0 7 DEC JA» FEB HAH AFfl «AT JUH JUL AUO SEP OCT »OF DEC JAN FES U B ATB m r JUH JUL AUO SEP OCT
Fig 5. Mean monthly rainfall at four stations within 50 km of the study area.

- 16 -
2.3.5 The growing period
a) Definition
In the warm tropics, the major constraint limiting rainfed crop production is availability of water. The growing period is defined as the period in which moisture and temperature permit crop growth (FAO,1979).
The growing period is the time span in days during a year when precipitation exceeds half the potential évapotranspiration, plus the period required to evapotranspire an assumed 100 mm of water from excess precipitation stored in the soil profile (FAO, 1979). Determination of the beginning of the growing period is related to the start of the rainy season, due to its dependence on water availability. From table 9. it is apparent that the reliability of precipitation (in terms of frequency and amount) of the first rains increases considerably, once the monthly precipitation is equal to or exceeds half of the monthly potential évapotranspiration. Therefore it is safer to conclude that the beginning of the growing period (and start of the rainy season) is taken as the time when precipitation equals half the potential evapotransipiration (P = 0.5 ETP).
b) Method for water balance calculation
A computer program (WTRBLN) was used to calculate the water balance of selected points in the study area. Calcultion takes into account long term average monthly precipitation, potential évapotranspiration, and combined soil and vegetation characteristics, according to the method proposed by Thornthwaite and Mather (Donker, 1987).Three additions to the original method have been implemented:
1) Direct run-off has been taken into account. 2) Reference potential évapotranspiration (Er) can be adjusted to crop potential évapotranspiration (Ea) by Kc factors such as: Ea = Kc * Er. The Kc factor for any crop varies from one crop development stage to the next (table 10). The Kc factor values for the study area were obtained from Doorenbos and Kassam (1979).
c) Results of water balance calculation
Figure— shows a water balance diagram assuming an available water capacity (AWC) of 100 mm for wheat cultivation. During the dry season (Jun-0ct), precipitation is much less than ETP, and plants draw upon water stored in the soil. At the onset of the long rains in November and part of December, there is replenishment of the soil moisture deficit. From end of December up till end of April, the amount of water percolating through the soil and entering the ground water keeps the soil pores nearly saturated. This is the time of the year when soft, muddy ground conditions are found, and a water surplus exists. The growing period of wheat continues beyond the rain season and, at greater or lesser extent, the crop often matures on moisture reserves stored in the soil profile (May - June).

- 17 -
Table 8. Mean monthly rainfall, evaporation and reference potential évapotranspiration for Narok. Met. station
Rainfall Mean(mm) _
Evaporation (Pan A)
Reference ETP
0.5 ETP
ANNUAL TOTAL(NOV-OCTOBER) 737 1553 1225 613
NOVEMBER 64 125 100 50
DECEMBER 72 139 111 56
JANUARY 70 150 120 60
FEBRUARY 80 144 115 58
MARCH 98 153 122 61
APRIL 144 128 102 51
MAY 92 113 90 45
JUNE 29 102 82 41
JULY 17 104 83 42
AUGUST 21 110 88 44
SEPTEMBER 23 133 90 45
OCTOBER 27 152 122 61
MEAN MONTHLY 61 129 102 51
Table 9. Development stages for a wheat crop and its corresponding Kc values
0 I
15
jEstablishment | 0.35
35 I I
65
TilleringjHead (development
0.80 I 1.10
85
I 120 135 No. of days
to maturity
FloweringjYield j formation
0.80 j 0.70
Ripening
0.35
Stages
Kc Values
Source: Yield response to water (FA0,1979)

- 18 -
Table 10. Input file for WTRBLN program (wheat crop)
DIRECT REFERENCE CROP COEFFICIENTS WATER MONTH PRECIPT. RUNOFF: POT.EVAPT: (Kc): AVAILABILITY
1 70 2 120 0.25 38 2 80 3 115 0.25 48 3 98 5 122 0.35 50 4 144 7 102 0.80 55 5 92 6 90 1.10 0 6 29 1 82 0.80 0 7 17 0 83 0.70 0 8 21 0 88 0.35 0 9 23 0 90 0.30 0 10 27 0 122 0.25 0 11 64 0 100 0.25 0 12 72 0 111 0.25 16
Land Use: wheat. Water capacity of root zone 100mm.
Table 11. Input file for WTRBLN program (grassland)
MONTH PRECIPT. DIRECT RUNOFF:
REFERENCE POT.EVAPT:
CROP COEFFICIENTS (Kc):
WATER AVAILABILITY
1 70 2 120 2 80 3 115 3 98 5 122 4 144 7 102 5 92 6 90 6 29 1 82 7 17 0 83 8 21 0 88 9 23 0 90 10 27 0 122 11 64 0 100 12 72 0 111
0. 0. 0. 0. 0. 0. 0. 0, 0. 0. 0, 0.
20 31 32 55 14 0 0 0 0 0 0 17
Land Use: livestock, grazing (grassland) Water capacity of root zone = 100mm.
Note: column 1. monthly rainfall for Narok station column 2. hydrologie data measurements for Ewaso Ngiro river column 3. ETP values for Narok station column 4. Kc factor values for different development stages
and grass respectively. of wheat
- 19 -
Table12. LONG TERM AVERAGE MONTHLY UATER BALANCE FILE : PRG
Angata Loita, Narok District, South Western Kenya. Soil formed on Tuff and Volcanic Ashes (sandy clay loan - clay). Landuse: Grassland.
AVERAGE MONTHLY RUNOFF : 30 7. OF AVAILABLE WATER FOR RUNOFF. UATER CAPACITY OF R00TZ0NE : 100 mm.
mm.
P
JAN.
70
FEB.
80
MAR._
98
APR.
144
MAY.
92
JUNE,
29
JULY
17
AUG.
21
SEPT.
23
OCT.
27
NOV.
64
OEC. YEAR
72 737
DRO 2 3 5 7 6 1 0 0 0 e 0 0 24
P-DRO B6 77 93 137 86 28 17 21 23 27 64 72 713
REF POTEVP 120 115 122 102 90 82 83 88 90 122 100 1 1 1 1225
Kc .40 .40 .50 .80 .80 .80 .50 .30 .30 .30 .30 .30
CROPPOTEVP 48 46 61 82 72 66 42 26 27 37 30 33 570
P'-PET' 20 31 32 55 14 -38 -25 -5 -4 -ie 34 39 143
AC POT WLS -38 -63 -68 -72 -82
SM 100 100 100 100 100 68 53 51 49 44 78 100
dSM 0 0 0 0 0 -32 -15 - 7 _•? _c 34 n
AET 48 46 61 82 72 60 32 23 25 32 30 33 544
0 0 0 0 0 0 6 10 3 2 c 0 0 26
S 20 31 32 55 14 0 0 0 0 e 0 17 169
TL AVAIL 32 53 69 103 86 60 42 29 20 14 10 17
RO 10 16 21 31 26 18 13 9 6 4 3 5 162
OET 1? C il 37 48 72 60 42 29 20 14 If 7 12
ROTL 12 19 26 38 32 19 13 9 6 4 3 5 186
STANDARD METHOD. All values in the table are in millimeters. P = precipitation.
DRO - direct runoff. P-ORO = precipitation minus direct runoff-, REF POTEVP = reference potential évapotranspiration. Kc « crop coefficients. CROPPOTEVP - crop potential évapotranspiration. (Kc >: REF POTEVP). P'-PET' . = precipitation minus direct runoff minus crop potential
évapotranspiration. AC POT ULS = accumulated potential water loss. SM = soil moisture. dSM = change in soil moisture during the month indicated. AET - actual évapotranspiration. D - soil moisture deficit. S = moistur surplus. TL AVAIL = total water available for runoff. RO =-runoff without direct runoff. OET - detention. ROTL = runoff including djrcct runoff.
RUNOFF CALCULATION STARTED UITH MONTH: 12

- 20 -
Table13. LONG TERM AUERAGE MONTHLY UATER BALANCE FILE : UR3
Angata Loita, Narok District, South Western Kenya. Soil formed on Tuff and Vulcanic Ashes (clay loan-clay). Landuse: mainly uheat.
AUERA6E MONTHLY RUNOFF . . ' . . . . . : 30 I OF AVAILABLE UATER FOR RUNOFF. UATER CAPACITY OF ROOTZONE : 108 mn.
mn. JAN. FEB. MAR. APR. MAY.. JUNE JULY AUG. SEPT. OCT. NOU. OEC. YEAR
P 70 80 98 U4 92 29 17 21 23 27 64 72 737
ORO 2 3 5 7 S I 0 0 0 0 0 0 24
P-0RO B8 77 93 137 8G 29 17 21 23 27 64 72 713
REF POTEUP 120 115 122 102 90 82 83 38 90 122 100 111 1225
Kc .-5 .25 .35 .80 1.10 .80 .70 .35 .30 .25 .25 .25
CROPPOTEUP 30 29 43 82 99 66 53 31 27 31 25 28 549
P'-PET' 38 48 50 55 -13 -38 -41 -10 -4 -4 39 44 154
AC POT ULS -13 -51 -92 -102 -106 -110
SM 100 100 100 100 88 60 40 36 35 33 72 100
dSM 0 0 . 0 0 - 1 2 -28 -20 -4 -I -2 39 28
AET 30 29 43 82 98 SS 37 25 24 29 25 28 505
0 0 0 0 0 I I 0 2 I S 3 2 0 0 43
S 38 48 50 55 0 0 0 0 0 0 0 16 207
TL AUAIL 49 82 107 130 91 64 45 31 22 15 10 16
RO 15 25 32 39 27 19 14 9 7 5 3 5 200
OET 34 57 75 . 91 64 45 31 22 15 10 7 II
ROTL 17 28 37 4S 33 20 14 9 7 5 3 5 224
STANOARO METHOD. All values in the table are in millimeters. P = precioitation. ORO - direct runoff. P-ORO • precipitation minus direct runoff. REF POTEUP " reference potential évapotranspiration. Kc - crop coefficients. CROPPOTEUP = crop potential évapotranspiration. (Kc x REF POTEUP). P'-PET' = precipitation minus direct runoff minus crop potential
evapotranspirât ion. AC POT ULS = accumulated potential water loss. SM - soil moisture. dSM = change in soi 1* moi sture during the month indicated. AET » actual évapotranspiration. D a soil moisture deficit. S « moistur surplus. TL AUAIL » total water available for runoff.
"O = runoff without direct runoff. DET = detention. ROTL • runoff including direct runoff.
RUNOFF CALCULATION STARTED WITH MONTH: 12

- 21 -
2 0 0
1 5 0
D. 100 -\ UI Q X UI
K,m 0
uur mm
• - r , " " - " I
RO. : 3 0 5« J
WTR.CRP. : 100 mm
J J
MONTH
Rngata L o i t a , Narok D i s t r i c t , South Western Kenya. S o l l formed on T u f f
and V o l c a n i c Rshes (sandy c l a y loam — c l a y ) . Landuse: G r a s s l a n d .
2 0 0
1 5 0
I o. 100 H LI Q
a. u <L
z 50 -\
0
mix
j h—-
Mill
,i r r n i K » ,
•-V 1 •
RO. : 3 0 y. J
WTR.CRP. : 100 mm
1 1 1 1 1 I I F M P . M J J R S
MONTH
1 T
O N D
Bngata L o i t a , Narok D i s t r i c t . South Weste rn Kenya . S o i l formed on T u f f
and V u l c a n i c Rshes ( c l a y l o a m - c l a y ) . Landuse : m a i n l y u.he at .
• P-DRO
CROP POT.EVP.
RCT.EVP.
RUNOFF
MOISTURE SURPLUS
MOISTURE D E F I C I T
SOIL MOISTURE RECHARGE
SOIL MOISTURE U T I L I S A T I O N
Fig 6. Water balance for grassland and wheat (computer programe).

- 22 -
2.4 GEOLOGY
The geology of the area has been described by Wright (1967). Previous work in the area was done by Kitson (1934), the Mines and Geology Department (1942), and the Development Committee for 1946. Mineral exploration was performed by Ansurf ox Mining Co. Ltd (1957). Most of the area is covered by volcanic ashes and less than one third by alluvium and quartzites.
2.4.1 Geological history
2.4.1.1 Precambrian
The geological history dates back, to the late Precambrian age when old sedimentary rocks were deposited in an intra-mountanious basin. The stratigraphie succession has been described by Saggerson (1966) in the nearby Loita Hills area. Within the same era, the sedimentary rocks underwent a series of metamorphic episodes and folding to form anticlines and synclines of which the remains are seen as chains forming the Loita Hills.
Wright (1967) divided the rocks formed in this way into two classes:
a) Metamorphosed semi-pelitic sediments, comprising of garnetiferous biotite gneisses with amphibolites and associated calc-silicate rocks.
b) Metamorphosed psammitic sediments, comprising of coarse grained quartzites, laminated quartzites, muscovite quartzites and subordinate schists. This second group of rocks occurs mainly in the study area.
2.4.1.2 Miocene
After the formation of these rocks followed in the Miocene epoch a peneplanation process accompanied by extrusion of volcanic lavas outside the study area to form the phonolites and trachytes which flank the Ewaso Ngiro river.
2.4.1.3 Pliocene
A series of faultings affected the phonolites and trachytes adjacent to the Ewaso Ngiro river. The Naitiami fault was formed, controlling part of the flow direction of the Ewaso Ngiro river.
Within the study area, it is believed that movements at this time caused a minor faulting that makes the areas to the south of the 01 Doinyo Narasha and Lekanga hills be lower than the areas to the north. When this line is traced westwards, an actual fault scarp on the phonolites is seen which extends to the Mara river.
2.4.1.4 Pleistocene
The tuff and ashes were deposited in a series of episodes, running from early to late Pleistocene. The volcanic mantle has been later dissected into elongated low shoulder hills which form the present landscape.

- 23 -
Wright (1967) summarizes the geological history of the area as follows;
Time Events
Final ash phase Orthophyre type trachytes Second Oletugathi fault Alkali basalts of the Oletugathi plateau Tuffs and ashes, in part waterlain First Oletugathi fault Alkali basalts of the Enamankeon plateau Second Naitiami fault Enkora fault Tuffs and ashes, in part waterlain
Pleistocene
Pliocene Erosion of first Naitiami fault scarp Kirikiti basalts (in Magadi and Loita Hills areas) First Naitiami fault
Miocene Phonolites Kishadulga melanephelinite lavas Arching of sub-Miocene peneplain
Precambrian Metamorphism and folding of the sediments Deposition of the sediments
2.42 Lithology
The rocks within the study area can be divided into three groups namely, (1) metamorphosed psammitic sediments of the Precambrian, (2) pyroclastic rocks of the Pleistocene age, and (3) river deposits of the Quarternary.
2.4.2.1 Metamorphorsed psammitic sediments
The metamorphosed psammitic sediments are divided into three rock types namely: (a) coarse grained quartzites, (b) laminated quartzites, and (c) muscovite quarzites and subordinate schists.
(a) Coarse grained quartzites
These are made up of two varieties:
(i) Granular pink variety
These are typically pink due to iron oxide staining the surface of the quartz grains. They are granular and mica-poor. Most of the inselbergs juting out in the Loita Plains (i.e 01 Doinyo Narasha, Lekanga and the small adjacent hills) are all comprised of this rock variety.

- 24 -
(ii) Compact white variety
These are white in colour, compact and structureless. As in the granular rocks, flaggy and micaceous intercalations are common, and lenticular bands of massive and flaggy white quarzites occur. In thin section, both varieties of quartzites have large interlocking quartz grains, well oriented muscovite flakes and some inclusions of fresh microcline in the quartz grains. The hogback ridges to the south of the area around the Munterabi area are comprised of these rocks.
(b) Laminated quartzites
The coarse grained quartzites already described grade into medium to fine grained, laminated, frequently cross-bedded and ripple marked mica-poor quartzites. They are usually granular and stained pink by iron oxide on grain surfaces. In thin section, the texture resembles that of a metamorphosed arkose. The quartz grains are set in a brown iron-stained armophous base, mainly siliceous in composition.
(c) Muscovite quartzites and subordinate schists
Muscovite quartzites are widely developed in the south-western part of the Loita Hills. They grade northwards into the laminated quartzites, presumably as a result of lateral facies change. Like the other groups, the muscovite quartzites have variable lithology and frequently contain local bands and lenses of flaggy and massive pink and white quarzites.
2.4.2.2 The pyroclastic rocks
The pyroclastic rocks are divided into tuffs and ashes. If sufficiently friable to be cut with a knife or crumbled in the fingers, they have been termed ashes; otherwise they are called tuffs. The tuffs in this context are considered to be the products of hot ash falls welded together by their own heat (Wright, 1967).
a) Tuffs
The rocks are mostly medium to pale grey in colour, sometimes green, yellow, pink or purple, occasionally calcified, and brown when weathered. Within the study area, the welded tuff occurs as angular blocks littering the surface of the ground, especially the smaller outcrops on the valley sides of the Olomanera river. They have inclusions of irregular and often corroded feldspars (usually sanidine, anorthoclase, oligoclase), quartz, nepheline, brown biotite, pale green aegirine-augite, kataphorite, green-brown hornblende and olivine rimmed by iron ore. There are also rock fragments of trachytes and phonolites included in the groundmass. Locally, welded tuffs also have pale purple augite and augite-rich melanephelinite in their composition.
b) Ashes
The ashes are thick to the northeastern parts of the study area, towards Narok, where the deposits are 60 to 70m thick. They thin to the west and over the Loi ta Plains. They are about 15m thick along the Ngore Ngore road. The ashes are younger than the tuff and form the most extensive rocks in the study area, extending from the north down to the Munterabi area except where quartzitic inselbergs jute out. They are not protected by lava or tuff capping,

- 25 -
as may be the case in other parts. The ashes form gentle slopes and their weathering has been rapid. They all have a brownish colour, are sometimes flaggy and usually crowded with calcareous concretions which occur along irregular vertical cracks or more rarely along the deposition planes. In thin section it can be observed that the glassy constituents have been replaced by an armophous brown material. Some of the inclusions have been identified as sanidine and altered trachytes. Iron ores are also visible in thin section. From their geochemical composition, the rocks are rich in sodium and potassium with values of 1.93 and 2.99% respectively (table 13). Therefore they may be classified as per-alkaline volcanic ashes.
Table 13. Goechemical composition of volcanic ashes
Si02 A1203 Fe203 CaO MgO K20 Na20 Ti02 Mno P205 BaO Ign. total loss
60.55 16.20 8.43 0.94 0.96 2.99 1.93 0.67 0.13 0.20 0.07 6.58 99.65
Determinations by the International Soil Reference and Information Centre (ISRIC), 1987.
2.4.2.3 River deposits
Alluvial deposition has been widespread in the shallow, seasonal stream valleys. The alluvial deposits are usually comprised of a mixture of clay and ashes. The river sediments to the south of the area contain more bouldery material, derived from surrounding quartzites and tuff with ash admixture.
2.4.3 Rock composition and soil parent material
2.4.3.1 Soils developed on quartzitic parent material
From few observations made on quartzitic inselbergs, the soils were found to be shallow, sandy and reddish brown in colour.
2.4.3.2 Soils developed on colluvial material originated from quartzites
These parent materials give rise to soils which show clear evidence of clay movement to form argillic horizons. They differ from soils developed from quartzites in that they are normally moderately deep, well drained, dark reddish brown with quartzitic gravelly layers within the A horizon.
2.4.3.3 Soils developed on pyroclastic parent material
Kanno (1962) prepared the following scheme for the transformation of volcanic glasses and plagioclases into clay minerals.
Gibbsite Volcanic glass : Si(0H)4: > Allophane > Kaoline minerals
Plagioclases : A1(0H)3: > Smectites > Kaoline minerals (hydrated halloysite)
From this scheme it is seen that most soils developed on volcanic ash have high allophane contents and weather finally to gibbsite and Kaoline minerals.

- 26 -
The weathering of volcanic ashes is rapid and usually develops into soils with special features and
characteristics as described by Kanno (1962), Dudal (1964) and Wright (1964), many other authors.
The clay fraction is normally characterised by armophous material and traces of other clay minerals. Soils developed from this type of parent material in the study area have traces of badly crystallized mica and ill!te, traces of quartz and reasonable amounts of K-feldspar.
2.4.3.4 Soils developed on river deposits
From this parent material develop young soils with beddings of the original deposits still visible. On most occasions the soils are hydromorphic.
2.5 GEOMORPHOLOGY
2.5.1 Regional relief structure
The area can be divided into fourlandscape types namely: hiHand, piedmonts, plateau, (higher and lower levels), and plain (see geomorphic map).
The area to the north of 01 Doinyo Narasha and Lekanga hills is characterised by a higher level plateau landscape dissected by parallel rivers and streams running in a south east direction to join the Ewaso Ngiro to the East and outside the study area. Though this regional unit is in many maps referred to as part of the Loita Plains, it lacks the morphometric characteristics of a plain and for this study shall be referred to as a plateau.
The rounded hills between 01 Ooinyo Narasha and Lekanga, seperate this higher plateau landscape from a lower lying one to the south of the study area, which is dissected by dendritic rivers and streams running in south west and west directions. Juting out of this low lying plateau are hogback ridges with assymetric roof-like configuration and comprised of quartzitic beds dipping 50 to 70 degrees in a north-west direction and striking in north east - south west direction.
To the east of the study area is a nearly level plain drained by a smoothly incising stream. This plain forms the core of the Loita Plains and is bordered to the north west by the rolling higher level plateau landscape and to the south west by the low lying plateau. To the south are the Loita Hills.
Skirting the small quartzitic rounded hill remnants and the hogback ridges are moderately steep to gently sloping footslopes giving the hills a configuration of a pointed conical hat with smooth side shades forming piedmont areas.
Within the low lying plateau south of the Lekanga hills, is an isolated cuesta relief with a cliff, which follows the Lomanera river direction and smoothes out to the east where it again merges with the plateau landscape. The cuesta is on welded tuff and is younger than the hogback ridges but slightly older than the plateau and plain lanscapes.
2.5.2 Geomorphic landscape evolution

- 27 -
2.5.2.1 The hogback ridges
The hogback ridges occupy the southern parts of the survey area in the Munterabi region, above the river Shangalara. They rise to about 2050m above the mean sea level and are about 150m above the general terrain height at 1900m.
The summits of the ridges are sharp steep crests with slopes greater than 60%. Their midslopes are straight, moderately steep to steep with angles greater than 30%. They merge into gently sloping to moderately steep footslopes around the ridges.
The history of the ridges dates back to the Precambrian period, during the time of the formation of the fold systems of which the Loi ta Hills and the hogback ridges in the Munterabi region are erosional remnants. An ancient fold axis whose crest has been worn down forms the valley through which the Lomanera river now flows. The configuration of the ridges is controlled by uneroded limbs of the fold system whose strike direction is northeast- southwest and the dip direction is west and northwest. Like in the Loita Hills, the heights of the ridges are consequences of different denudational periods, some before the Cretaceous and some during the Cretaceous period. The existence of these different denudational periods has been postulated by Saggerson (1966) when describing the geology of the Loita Hills areas and the southern adjoining areas.
To the north of the ridges is a low lying area believed to have either been a zone with less resistant rocks or a zone which was down faulted by tectonism in the Miocene period after the sub-Miocene peneplanation process. From its structural configuration, the area also appears to be a joining zone between two main fold systems: one whose remnants comprise the 01 Doinyo Narasha and Lekanga hills and the other in the south which comprises the Munterabi hills. The joining area must have been weak and was easily eroded by the sub-Miocene denudational process before the deposition of the tuffs and ashes. Wright (1967) has given differences in rock lithologies as the cause of the differential erosion, and streams parallel to the chain of hogback ridges could be following less resistant rock strata.
2.5.2.2 The higher level plateau
This plateau occupies the northern part of the study area and is bordered to the north by the Ngore Ngore hills and to the extreme north west by the 01 Doinyo Olenabala hills. The southern boundary is marked by the 01 Doinyo Narasha and Lekanga hills. To the east and the south east is the core of the Loita Plains.
The plateau plunges to the south east, controlling the parallel river system incising the landscape. The north and north western parts rise to elevations higher than 2000m, while the south eastern part is at heights of 1880m. This rolling plateau landscape merges into the Loita Plains at elevations of 1860m.
The plunging configuration seems to have originated from the sub-Miocene denudational surface. The present plateau may have been the footslopes of older hills to the north which were gently smoothened towards the south east and the plain developed by the Ewaso Ngiro river. Features of this sub-Miocene surface have been mapped by Wright (1967). It is on such a surface that the volcanic

- 28 -
ashes must have been deposited hurrying the former denudational features. Further seasonal stream incision caused the present undulating to rolling plateau configuration.
The higher parts of the plateau to the north have rolling reliefs, where the parallel streams incising the plateau are separated by convex interfluves with relief intensities of 10 to 80m. Each of these convex, elongated mesa-like
relief elements is comprised transversely of convex summits and shoulders, straight backslopes and concave footslopes merging into shallow stream channels. The slopes range between 2 and 4% on the shoulders and backslopes, and between 0 and IX on the summits and footslopes. The tip of the channels starts in amphitheater-like catchment areas characterised by micro-stepped erosional features with relief intensities less than lm. These features have been obliterated in the wheat fields by tillage. The footslopes of the elongated mesa reliefs sometimes have similar erosional features, accompanied by mass wasting.
The lower parts of the plateau on the southeastern fringes have been more denudated, and as a consequence the soils are hardly 50 centimetres thick. The terrain is therefore now nearly level to very gently undulating. Places where intermittent streams pass are now large shallow depositional basins with very low sediment yields. This is the part of the plateau which merges into the Loita Plains.
2.5.2.3 The lower level plateau
The lower level plateau is separated from the higher one by the 01 Doinyo Narasha and Lekanga hills and occupies southern parts of the study area. The areas below Shangalara river are lower, having elevations between 1800 and 1850m. Around the Lomanera river, elevations range between 1880 and 1930m with a slope gradient of IX in a west and southwest direction. Like the higher lying plateau, this one is also comprised of elongated mesa-like reliefs with convex tops, straight backslopes and concave footslopes. In certain places, the backslopes show stepped erosional features with relief intensities less than lm. This unit merges with the Loita Plains to the northeast and the Munterabi hogback ridges to the central south west and southwest.
The present geomorphic configuration can be traced back to the Miocene epoch, when the sub-Miocene peneplanation took place, followed by the deposition of the tuffs and later the volcanic ashes. The ashes hardened and have undergone several erosional cycles. The tuffs were more resistant and have therefore been left as isolated cuesta reliefs juting out above the general landscape.
2.5.2.4 The plain
The plain occupies the eastern part of the study area and has an average elevation of 1860m. It evolves from the footslopes of the Loita Hills and tilts to the east, towards the Ewaso Ngiro river. The present terrain surface shows sheetwash features and truncated lenticular bench-like landforms, which are about 1km wide and separated from each other by swales and braided waterways. Some of these bench-like forms have convex slopes, while others have been worn down to nearly level surface features. The central part of the plain is slightly incised by an intermittent stream, accompanied by splay features in an east-west direction as opposed to the north-south erosional pattern of the

- 2y -
plain. The area is still geomorphologically active due to the gentle slopes originating from the Loi ta Hills in the south. Stepped erosional features and surface rills are evidences of this activity.
2.5.2.5 The piedmonts
All the hills and hogback, ridges within the study area are skirted by piedmonts with varying degrees of steepness and dissection. Normally the piedmonts have
straight to concave slopes, steepest towards the hills and gently sloping away from them. They gradually and smoothly merge with adjacent plateau or plain landscapes along their frontal rims.
The piedmonts formed by colluvial material from the quartzitic ridges and hills have undergone several erosional cycles as seen by the presence of gravelly stoneines. Similar cycles have aso been noted in piedmonts formed on the ashes, as evidenced by the occurence of bi- and trisequal profiles.
The piedmonts are still morphodynamically active as seen by the presence and dissection of stepped erosional features. The formation of erosion steps seems to be favoured by fine-textured, compact and slowly permeable B horizons, acting as slip zones especially when overlaid by a perched water table. Vater works as as a lubricant which favours sliding of the overlying soil mantle resulting into the stepped erosional sequences. This mostly occurs along the intersection lines between the lateral seepage and topography. Stepped erosion is always favoured by a sloping terrain.
2.6 HYDROLOGY
2.6.1 Hydrography
In the northern part, the streams flow in a southeast direction, have a parallel drainage pattern and a drainage density of one river per 25 sq km. The main rivers are Masandare and Olonkevin, having their headwaters around the Ngore Ngore hills, and the Ewaso Ngiro which has it's head waters at the footslopes of the Mau ranges.
While in the southern part, the streams flow westwards and southwestwards, and have à dendritic to sub-parallel pattern and a drainage density of three rivers per 25 sq km. The main rivers are Lomanera and it's tributaries, Shangalara and Kisheimarak. Lomanera river has it's head waters the beginning of the Loi ta Plains.
2.6.2 Surface water availability and quality
Wright (1967) has given flow rates of some of the rivers just before the beginning of the rains (Table 14). Also given is water quality for some of the streams present in the study area.
TABLE 14. Water Discharge
River Locality date Discharge Maximum (cusecs) Estimated
Discharge (cusecs)
1. Ewaso Ngiro Game Station 19-3-59 3.09 2,000
2. Maji Moto Maji Moto 14-3-59 0.26 ?

- 30 -
TABLE 16. Water Quality (values expressed in ppm.)
Compound Masandare Barkitabu
(Salt Spring) Loita Hills stream
Carbonate 2,435 nill
Bicarbonate 1,250 100
Chlorides (as CI) 210 10
Sulphates (as S04) 144 21
Nitrites (as N02) 0.9 nill
Calcium (as Ca) 9 15
Magnesium (as Mg) 1 5
Iron (as Fe) nill 0.2
Silica (as Si02) 130 30
Total hardness 25 60
Total Solids 4,700 220
Fluorides (as F) 11.8 2.8
pH >9.6 8.3
Source: Analysis by the Government Chemist.
2.6.3 Ground water
Wright (1967) has given a treatise on the ground water resources of the study area. The highly jointed quartzites of the Loita Hills make good aquifers, collecting rain and condensation water from the frequent mists which blanket the hills. The water trickles down joints cracks and fissures, collects underground in local reservoirs and emerges from perennial springs at different levels along many of the valleys. Two springs near Lolua and Maji Moto are unusually far from the quartzites, collecting water from sandy deposits and emerging where the sand grades into volcanic soils.
The hot spring of Maji Moto at the extreme northern tip of the Loita Hills provides excellent drinking water when cooled and is much used by the Maasai. The Water probably originates from an aquifer in the Loita Hills quartzites and must be of meteoric origin, for not only is it quite fresh but the major part of the gas which bubbles up in the spring has the composition of atmospheric air.
Elsewhere in the Loita Plains, water is obtained from wells dug either in grey clays found locally along seasonal stream channels or in sandy deposits near the quartzitic hills.
- 31 -
2.7 NATURAL VEGETATION (from Situma, 1988)
The Loita Plains, located to the southeastern part of the study area, are covered by dwarf shrub grasslands belonging to the Cynodon dactylon - Justicia elliotii community.
The southwestern parts (Lomanera area) and some parts around 01 Kinye are covered with Justicia elliotii - Digitaria abyssinica dwarf shrub grasslands. To the southwest, medium height grasses belonging to the Pennisetum schimperi community are frequent too.
In the western parts once covered with dwarf shrubs, the original vegetation has been replaced by bushed grasslands belonging to the Acacia drepanolobium -Pennisetum mezianum - Themeda triandria community, often with pockets of the Cynodon dactylon - Tribulus terrestris community. These Acacia bushed grasslands were also common to the eastern part but have now been reduced by cultivation.
In the northern parts (Ngore Ngore area), the most widespread grassland belongs to the Pennisetum schimperi - Cynodon dactylon community. This extends southwards into the wheat fields.
2.8 LAND USE
Two types of land use were identified: pastoralism and large scale rainfed agriculture.
2.8.1 Pastoralism
This is a semi-nomadic, small scale, unimproved extensive grazing. The products are milk, blood, hides, skins and meat for local consumption. Family income and capital investment per ha are very low. Labour inputs per ha is also low. Traditional technology is applied and veterinary inspections are scarce. The system of land ownership is communal and land is grazed communally.
The movements of the people (Maasai) and their stock are mainly dictated by the need to go where fodder and water are available and to avoid areas with disease hazards, such as those infested with tsetse or other biting flies. Individual or family ownership of livestock is normal. It is usual for each owner to aim at keeping as many animals as possible, irrespective of their quality or the availability of pasture. On the one hand, a man's social position and prestige depend on the number of stock he has rather than on money or other possessions. Cattle are also needed as payment of bride price. On the other hand, large numbers of stock are kept as insurance against years of drought and famine, on the assumption that the more cattle a man has the more are likely to survive a bad year. Drought periods in 1984 and 1986, in which a lot of livestock was lost, left some people with very few or none at all.
Heavy and uncontrolled grazing by livestock over a long period of time has conduced in some places, to permanent damage to the ecosystem. This is first manifested by loss of palatable plants, followed by a loss of vegetative cover and initiation of soil erosion.

- 33 -
Balanced proportions between crop and livestock productions are necessary in order to avoid endangering the pastoralism practiced by the indigenous population and insure the effective utilization of natural and economic resources. Further increase of cattle numbers should take account of the following factors: the output of coarse fodders and its influence on required numbers of grazing cattle; humus requirements for the soil; the effective utilization of arable land and the extent of cereal production.
2.8.2 Large scale rainfed wheat cultivation
History of wheat growing in Narok district dates back to 1965, when there was a shortage of wheat in the country due to drought. The government encouraged the Maasai to allow their land to be cultivated. At first, all the work was done by "share croppers" who were entirely responsible for the wheat growing and harvesting, and who gave the Maasai part of the profits in return for permission to use their land. At the moment, the farms are leased to individuals directly from group ranches.
The main purpose of having such a scheme in Maasailand was to use the crop as a means of developing the area and help the Maasai people. Another reason is that Kenya spends up to $200,000 a year to buy wheat and wheat flour from abroad. The main drawback of this modern cash crop economy is the loss of pastureland, which is no longer available for the traditional seasonal grazing.

- 34 -CHAPTER 3 LITERATURE REVIEW —
3.1 INTRODUCTION
Beek et al. (1980) observed that though the productivity of the better soils in the developing countries could still be improved substantially, and although enormous land reserves exist in most of the countries, much of the agriculture, especially the small scale one, is nevertheless practised on soils that are unsuitable or only marginally suitable.
Soils developed on volcanic ash present their own unique poblems towards agricultural production (Amano, 1981; Duchaufour, 1982; Sanchez, 1986). The presence of active aluminium and iron oxides condition the formation of complexes with phosphorous rendering it unavailable to crops. Mineralization of organic nitrogen is slowered by the amorphous material present in the soils, making it necessary to continuously apply mineral fertilizers containing nitrogen for a sustained crop production. Low bulk densities and thixotropic nature of the soils make their working difficult due to the risk of total structural collapse caused by compaction if heavy machinery is used, and the difficulty of transport of machinery especially during the rainy seasons.
Apart from the soils having properties related to volcanic ashes, Planosols and Luvisols with compacted slowly permeable layers are also kown to occur in the area (Okoth and Aore, 1988). The soils have been classified before as as solodic Planosols (Sombroek et al., 1982; Amuyunzu 1984). They are described as having a light coloured eluvial horizon, and natric or argillic (B) horizons which are sticky and plastic when wet, firm when moist and very hard to extremely hard when dry. The A and E horizons are slightly sticky and slightly plastic when wet, friable when moist, and hard when dry. The pH values range from 6 in the topsoil to 7.5 in the subsoil. They have high base satutration values and are sodic in places. From field observations the soils are not extremely hard when dry except for the E horizon which gets extremely hard when exposed.
The problems posed by the agricultural utilization of Planosols have been recognized by many soil scientists. Dudal (1973) pointed out that the growth of plants on Planosols is impeded by waterlogging in the wet season, severe drought in the dry season, limited rooting depth and lack of nutrients and micro-nutrients. Nyandat (1984) working in an area in Kenya with Planosols remarked that the major land constraint is imperfect soil drainage, consequentl-y, Planosols may be classified as problem soils. Beek et al. (1980) observed that the use of problem soils without caution has resulted into many unforeseen repercussions ön soil qualities and land use performance. Such repercussions include soil compaction, salinization, sodification, erosion, acidification, subsidence and inundation.
3.2 SOILS DERIVED FROM VOLCANIC PARENT MATERIALS
3.2.1 The influence of volcanic parent material on soil development
Work has been done nearly all over the world to classify, correlate and map soils for a general global understanding. Soils developed on volcanic ashes and on tuff are quite extensive and occur in regions with different climatic conditions ranging from semi-arid to humid conditions. Their distribution is governed by the presence of volcanic activities (present and past) within their areas of occurrence. Soils developed on volcanic ash and on tuff have been reported to occur in Japan, Colombia, Hawaii, Canada, Italy, Indonesia, Phillip-ines, Spain, Fiji, Chile, New Zealand, Nicaragua, United States of America and in many parts of Africa.

- 35 -
Fisher and Schmincke (1984) define volcanic ash as particles less than 2mm, composed of various proportions of vitric crystal and lithic particles of juvenile, cognate or accidental origin, forming 75% or more by volume of an aggregate. Tuff is the consolidated equivalent. Further classification is made according to environment of deposition (lacustrine tuff, submarine tuff, subaerial tuff) or manner of transport (fallout tuff, ash-flow tuff). Reworked ash is named according to the transporting agent (fluvial tuff, aeolian tuff).
Birrel (1964) described volcanic ash soils in New Zealand as originating from fine rock particles erupted from craters and vents. These particles may be either primary rock fragments or the products of hydrothermal weathering within the volcanic source. The ejectamenta forming the soil may be either sub-aerially deposited ashes or material deposited by subsequent wind action as loess. Vhether pumice avalanche material and- volcanic breccias may be considered as parent material of volcanic ash soils is open to question but these materials certainly form soils similar to the air-borne ashes.
Ohmasa (1964) considers volcanic ash soils in Japan to be soils derived from comparatively new eruptive material ejected from craters ( excluding lava and welded tuff). Soils derived from tuff and agglomerate formed in the Tertiary period are not included in volcanic ash soils. For instance, the soils formed from "shirasu" (recent tuff) which covers extensive areas in the Kagoshima Prefecture, are defined as volcanic ash soils, whereas those developed on the weathered products of the "Ooyaishi" (welded tuff) are not regarded as volcanic ash soils. Soils on parent material which have been transported are considered to be volcanic ash soils only when contamination with other materials is negligible. On the contrary, most of the soils which are derived from large flow-deposits, sedimented in both the alluvial and diluvial periods, containing abundant admixtures of different origin are not regarded as volcanic ash soils. This classification is not quite satisfactory for the distinction of volcanic ash soils since it was developed mainly for the ease of mapping of the Japanese volcanic ash derived soils.
Wright (1964) described the parent material of Andosols (volcanic ash soils) in South America as being unconsolidated tuffs rich in volcanic ash. Consolidated tuffs, according to him, slows down the penetration of the weathering agents and the soil environment becomes unsuited to the preservation of allophane in a relatively stable state. The weathering in this case is concentrated at the rock face and allophane is released slowly, instead of rapidly as part of a general process throughout a thick mass of soil.
Swindale (1964) described the sand fraction of volcanic ash soils as containing glass and other rock-forming minerals and seldomly mica.
Uchiyama, Masui, and Onikura (1960) reported the existence of volcanic ash soils in the central part of northeastern Japan which apart from the special features of volcanic ash soils, have montmorillonite type clays accompanied by some other minerals and only small or negligible amounts of allophane and halloysite. The subsurface layer of those soil at a depth of about 10 to 20cm had a high humus content and was very dense, compact and poor in non capillary pores. As a result they suggested that the soils be named a "humus clay-pan soil".
Andosols with hardpans have been reported elsewhere. Dudal (1960) reported the existence of some volcanic ash soils in Java.In this case the hardpans instead

- 36 -
of being clayey as the ones reported by Uchiyama, Masui, and Onikura, were pumecious, gritty and of coarser texture than the overlying soil. The cementing material though not so well known could be silica of geogenic or pedogenic origin, while the montmorillonite reported by Uchiyama, Masui, and Onikura could be a secondary mineral derived from the allophanes. This supports the fact that Andosols when given time result into more developed soils. Pumecious materials have been reported to form soils with similar properties (Wright, 1964)- W- W^j, Hardpans and especially duripans developed in the subs,urfa"ceTforizons of soils formed from volcanic tuffs have been reported by Hte.rner (19783 in soils of Pueblo-Taxcala areas in Mexico. The cementing material is believed to be silica (Si02) whose origin is not quite clear.
Andosols developed on basalts mantled by wind blown sediments and volcanic ash have been reported in Kenya and in other parts of East Africa (Frei,1978). These are mostly concentrated in high altitudes of mount Kenya and on mount Semien in Ethiopia. Soils lacking allophanic material but with embryonic halloysite developed on volcanic ash material in the southwestern part of Kenya have also been reported by Vada, Kakuto, and Muchena (1986).
Soils with andic properties but developed on material other than volcanic ash or tuff have been reported in the United States of America (Hunter, Frazier and Busacca, 1986). The Lytell series are soils developed on parent material composed of phyllosilicate clays, quartz, feldspar, and mica in a maritime climate. The soils are deep with thick, dark, organic matter enriched horizons and yellow brown cambic B horizons. Aluminium is present in humus complexes in the subsurface horizons while Fe-humus complexes are frequent in the A horizons. Although the mineralogy of the soil is largely crystalline, the chemical and physical properties such as bulk density, water retention, P retention, variable charge surfaces, and Na fluoride pH are chracteristic of soils dominated by amorphous material. These properties are derived from Al-humus complexes and Fe-humus complexes other than allophanic material.
3.2.2 Correlation and Classification
In order to correlate the soils it might be necessary to have a general review on the definitions and ideas held by different regions on the volcanic ash soils.
Though grouped for a long time with soils formed from other parent materials, (Andepts in the USDA Soil Taxonomy), soils developed on volcanic ash have been observed to differ in many ways with soils developed on other parent materials. In Japan these soils have very dark A-horizons rich in organic matter and high C/N ratios (Kanno, 1956). They also have high cation exchange capacities and low exchangeable base status. The soils contain considerably high amounts of exchangeable Al ions. The soils are characterised by allophane type clays, varrying amounts of gibbsite, hydrous oxides of iron, hydrated halloysite and very small amounts of montmorillonite type clays.
In New Zealand similar soils formed from rhyolitic tephra, develop allophane and halloysite under high rainfall conditions and imogolite and halloysite under low rainfall conditions. Ferrihydrite also occurs in the soils. In general, New Zealand volcanic ash soils have a dominance of amorphous clay in their fine fraction, high contents of humus in their top soil, high exchange base status, low bulk densities, and are smeary when wet.

- 37 -
In Kenya similar soils developed under lower rainfall conditions are dominated with embryonic halloysite, X-ray amorphous iron oxide, silica and high organic carbon percentages (Vada, Kakuto, and Muchena, 1986). The soils are rich in glass but differ from volcanic soils in other parts of the world due to their lack, of allophanes.
In the Archipelago of Indonesia similar soils developed on young volcanic material (youger than 5,000 years) have more than 60% of the unweathered pyroclastic material containing glass and microclites. The remaining fraction is dominated by amorphous or paracrystalline constituents like allophane and opal. The soils have high CECs and S102/A1203 ratios greater than 3.
Soils with these features have been termed And o soils, a name originating from Japanese language "An" meaning black and "do" meaning soils. This nomenclature was first introduced in 1947 during reconnaisance soil surveys in Japan by American soil scientists (Simonson, 1979). A publication with the name Ando soils first appeared in 1948 in the initial report of the reconnaisance soil survey of Japan by Austin. The following year, Thorp and Smith published a paper in which the name Ando soils was used. Later (1960-1970) the soil survey staff of America, when developing their new system of classification, defined a suborder Andepts in the order of Inceptisols. Andepts are more or less freely drained Inceptisols that have low bulk density and an appreciable amount of allophane that has a high exchange capacity, or that are mostly composed of pyroclastic material. The FAO-Unesco soil map of the"world also being prepared at the same time converted the term Ando soils to Andosols (Simonson, 1979). The same soils are referred to as "Koruboku" in Japan and as Al- humus soils in New Zealand.
The inclusion of Andosols in the USDA Soil Taxonomy at the order level was first suggested by Guy D. Smith (1978). He proposed the name Andisols be used instead of Andosols because the last one is currently being used elsewhere with other definitions and because the connecting vowel "o" is supposed to be restricted to Greek formative elements. His central concept was that Andisols are soils developing on volcanic ash, pumice, cinders, and other volcanic éjecta and volcanoclastic materials, with an exchange complex dominated by X-ray amorphous compounds of AI, Si, and humus, or a matrix dominated by glass and having one or more diagnostic horizons other than an ochric epipedon.
As a result of Smith's suggestion, the International Committee on the Classification of Andisols (IC0MAND) was formed. IC0MAND has tried to bring together findings by different pedologists on the existing information on soils with Andic properties. In their latest report (1986), they have given new definitions and the central concept on Andisols. This concept is not very different from that of Guy Smith except for a few inclusions. For example, they have removed the word amorphous compounds and replaced it with short-range-order materials and/or Al-humus complexes, where short-range-order materials include ferrihydri-te, allophane, and imogolite-type minerals.
The central concept of Andisol as held by IC0MAND is that an Andisol is a soil developing in volcanic éjecta (e.g volcanic ash, pumice, cinders, basalts, etc.) and/or in volcanoclastic materials, having weathered sufficiently to possess an appreciable exchange complex dominated by short-range-order materials and/or Al-humus complexes, but not yet possessing diagnostic features charactristic of more advanced stages of soil development.

- 38 -
At suborder level, ICOMAND has used criteria based on soil moisture regime (Torr-, Xer-, Ust-, Ud-,), water saturation together with colour (including mottling) or dipyrid reaction (Aq-), and mean annual soil temperature (Bor-,) At great group level, the criteria is based on root-limiting horizons (Plac-, Dur-), 15-bar water retention (Vitr-, Hydr-), colour and organic carbon (Melan-, Fulv-), KCl extractable Al (All-), and soil temperature regime (cry-). At subgroup level, the criteria are based on similar sets of parameters.
3.2.3 Properties of soils developed on volcanic ash materials
Volcanic ash soils with andic properties are separated from other soils developed on similar or different parent materials by their special features of low bulk, densities, high abundance of allophane and short range order minerals, high water retention capacities, weak structural aggregation, near lack of any degree of stickiness or plasticity, high CEC's, formation of intensly dark humic compounds in the top soil and inability to wet (Kanno, 1956, 1961; Taylor and Cox, 1956; Dudal, 1964; Tan, 1964; Wright, 1964; Eswaran et al. 1973; ICOMAND, 1986).
Wright (1964) has given features associated with volcanic ash soils as:
- deep soil profiles usually with distinct depositional stratification, and normally friable in the upper part;
- topsoils as thick as one meter, and dark brown to black in colour, containing humic compounds which are relatively resistant to microbial decomposition;
- prominent yellowish brown to reddish brown subsoil colours with a smeary feel when the soil is wet;
- very light and porous profiles with a low bulk density and high water holding capacity;
- rather weak structural aggregation, with easily destroyed porous peds lacking in cutans; and lack of horizontal differentiation in the subsoil except for the occurrence of duripans in some soils;
- almost no stickiness or plasticity when moist (except in older and deeper stratified layers), but on drying thoroughly the soil particles and fine peds are often very slow to rewet and may float on the surface of water.
The climatic conditions necessary for the development of the special features in the soils of South America have been described to be climates of high soil humidity (Wright, 1964). Though large areas of soils derived from volcanic ash also occur in dessert and semi-arid regions, Wright concludes that these soils don't develop the special features of Andosols. Swindale and Sherman (1964) when describing Hawaiian soils developed on volcanic ash classified soils in arid, semi-arid, and subhumid regions as Typic Vitrandepts, Oxic Mollandepts and Typic Mollandepts respectively. From their work the climatic influence slightly differs from that given by Wright.
3.2.4 Clay Minerals associated with volcanic ash soils
Most properties associated with soils developed on volcanic ash parent materials

- 39 -
have been discussed in the preceding chapters. However, clay minerals associated with volcanic ash soils have not been discussed. These minerals are important in the identification and characterisation of these soils and therefore a review of their properties is given below.
1) Allophane and Imogolite
a) Formation conditions
These are armorphous or non-crystalline clay minerals found in volcanic ash soils with originally high amounts of glass. Wada (1977) gives the soil environment which favours the formation of these minerals as soils with a pH range of 5-7, high Al activity in soil solution when not complexed with organic matter, and silica concentrations of 11-12, and 22 ppm for allophane .and imogolite with Si02/A1203 of 1.1 and for allophane with Si02/A1203 of 2.0, respectively. When Al is suppressed by complexing with organic matter, opaline silica formation is favoured. The silica concentration in the soil solution which favours the formation of allophane is normally intermediate between the concentrations required for imogolite and halloysite (Wada,1977). Imogolite is normally formed by the desilication of allophane while halloysite is formed by the resilication of allophane. Though so commonly found in volcanic ash soils of all compositions (basaltic, andesitic, dacitic or rhyollitic), their presence in desert and semi-desert conditions is not common (Flach, 1964; Wright, 1964).
b) X-ray diffraction
Allophane gives X-ray diffraction patterns characteristic of non-crystalline materials with maxima at 1.80, 3.00, 4.20, 5.20A and so on (Okada et al.,1975). Sieffermann gives this value at 3.5A. From their diffraction patterns Okada et al.(1975) concluded that networks of one-, two-, and three dimensional bonding of Si- tetrahedra and Al- octahedra existed for the allophanes. The Al- were assumed to have four and six bonds with oxygen while the Si- has a single bond. The resulting linkages between the tetrahedra and octahedra in allophanes were found most likely to be two-dimensional.
Imogolite gives X-ray difraction maxima at 12-20, 7.8-8.0, and 5.5-5.6A. These patterns are enhanced by a parallel orientation of the specimen (Wada and Yoshinaga, 1969). When heated to temperatures of 100-300 C a marked change in the 12-20A peak occurs and the resultant appears at the 18-19A peak. When the sample contains humified material or when it has dithionite-citrate extractable constituents or alkylammonium chloride then this property is not exhibited (Wada, 1977). Destruction of the imogolite structure occurs when it is heated to temperatures of 350-400 C.
c) Electron microscopy
Allophane and imogolite are visible in electron microscopy and have shapes that are recognizable. Imogolite appears as smooth curved threads varrying in diameter from 100 to 300A and extending several urn in length (Yoshinaga and Aomine, 1962). When cut normal to their axis the features indicate that imogolite consists of a tube unit with inner and outside diameters of 10 and 20A. This tube is very useful in the identification and detection of imogolite even in traces (Wada et al., 1977). The individual particles are normally ring shaped and aggregated. In three dimensions these rings could be hollow spherules or polyhedrons with diameters of 35-50A.

- 40 -
d) Differential Thermal Analysis
In Differential Thermal Analysis, allophane and imogolite show exothermic peaks at temperatures between 900- and 1000 C due to the formation of a Si-0-Al bond. Both minerals have large endothermic peaks at temperatures of 50-300 C. On this basis allophane would be differentiated from noncrystalline oxides and hydroxides of Si, Al, and Fe, and from their mixtures. Acid salt is added in this reaction to eliminate undesirable effects of exchangeable bases (Wada, 1977).
e) Other properties
Clay fractions of soils derived from volcanic ash and which have been pretreated with dithionite-citrate and 2% Na2C03 solutions to remove other amorphous materials have Si02/A1203 ratio in clays dominated by allophane in the range of 1.3 to 2.0 while those in which imogolite is dominating have a ratio in the range of 1.05-1.15 (Vada and Yoshinaga, 1969). Other soil properties attributed to these minerals are: increased CECs with increasing Si02/Al203 ratios and increasing soil salt concentrations adsorption of organic anions, low bulk densities, high water holding capacity, high liquid and plasticity limit values, slippery but non sticky and nonplastic behaviour.
2) Halloysite
a) Forming conditions
Formation of halloysite and sometimes metahalloysite in old and burried soils derived from volcanic ash has been reported by Fields (1955) and a number of subsequent investigators. There are indications that the formation of halloysite is favoured by silication of allophane when conditioned by a stagnant moisture regime (Mejia et al., 1968; Aomine & Mizota, 1973; Aomine and Vada, 1962; and Dudas & Harward, 1975).
b) Electron microscopy
Eswaran (1971) identified halloysite under the microscope to consist of short tubes of about 1-2 um long, with a diameter of 0.02-0.16 um, and a circular cross section. In contrast to imogolite, the halloysite tubes are always rigid and show no tendency to curl up. Tropical alteration of feldspars to halloysite show similar morphological features (Eswaran & De Coninck, 1971). This shape of halloysite is mostly due to the 2H20 hydrant of the crystal. When the hydrant is 4H20 the the resulting morphology is tri-clinic (Eswaran, 1971).
c) Structure
Halloysite like kaolinite is a 1:1 layer silicate with the Si-tetrahedra and the Al-octahedra held together by one oxygen on the tetrahedral sheet bonded to an Al- on the octahedral sheet. The tetrahedral and octahedral sheets constitute a single 7A layer in a triclinic unit cell (Brindley and Robinson, 1946). Two thirds of the octahedral positions are occupied by Al ions and the tetrahedral positions are occupied by Si ions. The hydroxy! ions bonding to the aluminium of the octahedral units form the outer basal plane of a single halloysite structural sheet, a morphology similar to that of kaolinite except that in halloysite some of the tetrahedra are rotated through an angle leaving gaps which allow in water molecules to give the hydrated state of halloysite.

- 41 -
Before it was believed that the layer units were held together by hydrogen bonding between the 0- of the tetrahedra and OH- of the octahedra. More recently (Giese, 1973) has shown that electrostatic bond between the oxygen in one of the corners of the tetrahedral units and an oxygen of the octahedral units could be the binding force between the layer units especially when the oxygen is bonded to other cations. Both kaolinite and halloysite have low surface areas and low cation and anion exchange capacities.
d) X-ray Properties
Sieffermann (1973) has given X-ray diffraction characteristics of halloysite after Hendricks (1942), Alexander et al. (1943), and Brindley and Robinson (1947). He observes that though the halloysite structure is close to that of kaolinite, it has a distinct X-ray diffraction peak at 10A. The afore mentioned people have shown that the rapid decrease in intensity of the peaks towards larger angles and the assymetry of the peak at 4.4A could be interpreted as a consequence of a great structural disorder by shifts of the structural sheets parallel to the b and a axes of the triclinic mineral. This structural disorder is normally more than that of disordered kaolinite. The X-ray characteristics of this mineral when oriented parallel to the basal plane and air dried at 40 C are as follows.
-) An intense symétrie peak at 10A. This peak can however extend asymmetrically till 7A if the mineral is partially dehydrated.
-) A very asymmetric and large peak with a decreasing intensity at 4.4A. This peak is often more intense than that at 10A.
-) A peak of 3.3A, large (3.20-3.45), symétrie, generally of half the intensity of the one at 4.4A.
-) A band of 2.55-2.50A often as intense as the peak at 3.33A.
-) A large band culminating at 2.36A and extending from 2.25-2.45A, generally less intense than the 2.55-2.50A band.
When halloysite is heated for one hour at 80 C it is dehydrated irreversibly (Mehel, 1935; and Alexander et al., 1943). When heated to 45 C it is dehydrated but not irreversibly. The following X-ray diffraction characteristics are given by the mineral when heated for one hour at 80 C (Sieffermann, 1973):
-) A peak at 7.4A in an asymmetric band which can extend to 9A.
-) A large very asymmetric peak from 4.4-4A, very intense before dehydration.
-) A peak at 3.64A (one third of the intensity at 4.40A) and asymmetric towards large angles.
-) A band at 2.55-2.5A, just as intense as the peak at 3.64A.
-) A band at 2.36A, often less marked than the hydrated one.
e) Thermal Differential Analysis
The thermal differential diagrams for halloysite, dis-ordered kaolinite and

- 42 -
metahalloysite between temperatures of 200-1,000 C are identical, and therefore not used in the identification or distinction of these minerals.
3) Metahalloysite
This is a naturally dehydrated halloysite whose chemical composition and structural configuration are identical to those of halloysite except the basal spacing which is at 7.3A. (Sieffermann, 1973). In X-ray diffraction the unoriented powder of the mineral shows characteristics that closely resemble those of disordered kaolinite and it is therefore not easy to identify the two minerals by X-ray diffraction. These characteristics are as follows:
-) A peak with an average value of 7i3A varrying between 7.15-7.5A, often large and asymmetric towards small angles.
-) Peak axis on 3.65A of the same intensity or slightly less.
-) A large and very asymmetric band between 4 and 4.40A, of equal or higher intensity than the 7.2 and 3.56A.
The oriented thin section diagram of metahalloysite under X-ray shows an important residual peak between 3.8 and 4.4 (Sieffermann, 1973).
4) Palygorskite
a) Formation conditions
Palygorskite is a name currently being used synonymously to include both palygorskite and attapulgite since both names refer to the same mineral (Zelazny and Calhoun, 1977). Palygorskite is a phyllosilicate belonging to the zeolite family. Though very rarely found in soils, its existence has been reported in Syrian desert soils (Muir, 1951), in the calcareous C horizons of a Paleargid soil in Mexico (Vanden Heuvel, 1966), and in the cambic and calcareous horizons of the Southern High Plains in west Texas and eastern New Mexico (Bingham, 1973; Mc Lean et al., 1972). Its occurence has also been reported in desert soils of Egypt, Israel, in the Mediterranean region, and in the C horizons of freely drained soils developed in the Miocene sediments of the Florida peninsula. Mill-ot et al. (1969) noted a close relationship between palygorskite occurrence and calcic horizons in Morocco.
Zelazny and Calhoun (1977) have concluded that palygorskite in soils appear to be largely inherited from parent material rather than being of pedological origin. They observe that the absence of this mineral or its degraded equivalent in the soil, even in soils developing from geologic material rich in the mineral, would suggest a rather high susceptibility to chemical and physical alteration by weathering processes.
Millot (1970) found that palygorskite and sepiolite are chemically precipitated and crystallized in alkaline sediments with significant quantities of Si and Mg. They observed that these minerals are only stable under these environments and are quite susceptible to decomposition under the leaching environment of most soils. These minerals are also very unstable in Vertisols and are quickly transformed into montmorillonite. The occurrence of palygorskite is closely associated with marine environments. Its precipitation is favoured by medium amounts of Al in the environment together with appreciable amounts of Mg. Excessive amounts of Mg favours the precipitation of sepiolite while excessive amounts of Al

- 43 -
favour the precipitation of montmorillonite. Millot (1970) noted a succession of montmorillonite, palygorskite, and sepiolite with distance from the coastline seaward.
b) Structure
Palygorskite and sepiolite are phyllosilicates with the formulae:-
(0H2)4(0H)2Mg5Si8020 4H20 for palygorskite and
(0H2)4(0H)4Mg8Sil2030 8H20 for sepiolite.
Palygorskite contains eight tetrahedral positions and five octahedral positions per unit cell. Aluminium occupies 1.13 to 2.34 of these five sites or between 28 to 59% of the occupied sites. For each of these minerals three oxygens of each tetrahedra bond with three oxygens of the adjacent tetrahedra to form continuous rings of eight tetrahedra binding with the five octahedra. Although the tetrahedra are continuous , the apices in adjacent bands point in opposite directions. This structure results in a continous plane of atoms with tetrahedral positions primarily filled with Mg or Al atoms alternating to form open channels of fixed dimensions running parallel to the chains. Palygorskite contains channels with a cross section of about 3.8 X 6.3A.
c) Morphology
Palygorskite has a fibrous morphology (Millot, 1970), resulting from bands elongated parallel to the c-axis and consisting of alternating ribbons with a 2:1 type structure. Under the electron microscope two types of palygorskite are identified, one with long, fibers and one with short fibers (Zelezny & Calhoun, 1977). The fibers which result from bundles of rods are relatively rigid and oriented at random. The shorter variety fibers may contain more Pe and is more common in soils.
d) X-ray characteristics
Palygorskite has a strong X-ray reflection peak at 10.5A, and moderate reflections at 6.44, 5.42, 4.5, 3.68, 3.24, and 2.15A. X-ray reflection peaks do not vary with changes in relative humidity or the addition of organic polar molecules (Zelazny and Calhoun, 1977).
Heating palygorskite at 210 C for one hour was found to decrease the intensity of the reflections at 10.5, 4.5, and 3.23A, but the 3.68A increased in intensity (Hayashi et al., 1969). New reflections due to this treatment appeared at 9.2 and 4.7A. Further heat treatment to 350 C markedly decreased the 10.5 and 3.23A reflections, while the reflections at 9.2 and 4.7A further increased. Heating to 600 C completely eliminated the 10.5A reflection, while the reflection at 9.2A decreased in intensity and the 6.4, 5.4, and 4.5A reflections increased in intensity. Rehydration after heating to 350 C resulted into an enhancement of the peaks which were lost on heating above 540 C.
e) Thermal Analysis
Thermogravimetric analysis of palygorskite and sepiolite proceed in four distinct steps (Hayashi et al., 1969). The first step is associated with the loss of hygroscopic water, the second step with the loss of water in the

- 44 -
zeolite structure channels, the third with the loss of structural water bound on edges of octahedral sheets, and the final step with the loss of hydroxy 1 groups associated with octahedral sheets.
Differential thermal analysis curves for palygorskite have four endotherms at 80-210 C (353-483K), 210-325 C (483-598K), 350-540 C (623-813K) and 690-770 C (963-1043K) with an exotherm at about 925 C (1198K).
Thermal gravimetric analyses indicate an initial rapid loss in weight in both palygorskite and sepiolite. Vith increase in temperature palygorskite losses more weight at lower temperatures than sepiolite.
f) Infrared Analysis
Palygorskite shows sharp bands in infrared spectra as follows (Zelanzy & Calhoun, 1977): 3609 cm-1 with shoulders at 3685 cm-1 and 3645 cm-1, 3533 cm-1 with a shoulder at 3573 cm-1, and 1650 cm-1 with a shoulder at 1665 cm-1. Three broad absorption bands also appear with maxima near 3350, 3260 and 3200 cm-1. An absorption band at 1198 cm-1 has been assigned to a Si-0 vibration and maybe characteristic of palygorskite.
g) Other properties
Cation exchange capacities (CEC) most characteristic of palygorskite range from 5 to 30 meq/100g (Weaver & Pollard, 1973). Higher values are sometimes reported but are thought to be due to montmorillonite contaminants. The CEC generally varies little with pH or particle size. Dissociation of K and Ca from palygorskite is reported to be some what greater than from any other clay minerals examined (Marshall & Caldwell, 1947). Due to its fibrous nature, palygorskite has a large external surface area.
3.3 PLAN0S0L FORMATION
Since when starting this research project it was believed that the soils in the area would be mostly Planosols and since they actually occur in the area, a synthesis on the theoretical bases on their formation is given.
3.3.1 Formation conditions and properties
Dudal (1973) has given a synthesis on the opinions held by different authors on Planosol formation. He points out that by the 1930's it was realized that certain soils, called "podzolic" on the basis of textural differentiation or of the occurrence of a bleached surface horizon, did not develop under the influence of podzolisation process as earlier believed. Georgievski (1888), Nikiforoff (1937), Kubiena (1953), Arnaud (1955), Gorshenin (1955), Liveroski and Roslikova (1962), Desaunettes (1964), D'Hoore (1964), Koinoff (1968), Bornand et al. (1968), and Ufimsteva (1968) supported this earlier belief by the nomenclature they gave to these soils. Terminologies such as clay podzols, pseudo-podzolic soils, salt earth podzols, podolized solodized soils and paleopodzols were used. As Dudal mentions, a process of "lessivage" or "argillu-viation" was later recognized to be responsible for the mechanical translocation, without destruction, of the fine clay and the ferric iron bound to it from the surface horizons to the argillic horizons below.
The presence of a slowly permeable layer seems to be a pre-requisite in Planosol formation. This may be the result of lessivage and formation of an argillic horizon or it may be conditioned by the nature of parent rock, the

- 45 -
presence of a fragipan or a permafrost layer below the soil surface. Non-mulching Vertisols could also provide such a condition. Dudal (1973) cites mechani sms described by Smith (1934), who suggested that the development of claypans was essentially due to the formation of colloidal material in place and to its flocculation in the presence of electrolytes from stagnant ground water.
After the provision of such a layer,different mechanisms on the formation of the albic E horizon so characteristic of Planosols have been suggested. Dudal (1973) cites the opinion held by Nikiforoff and Drosdoff (1943), who attributed the strong textural differentiation to the destruction of a large part of the clay minerals, especially the montmorillonite clays. They considered that the formation of the albic E horizon was originated by partial destruction of a claypan but did not elaborate on the mechanism of this degradation. More recently, Brinkman (1970) attributed clay degradation to "ferrolysis", a process involving iron depletion by repetitive reduction-oxidation cycles. Duchaufour (1982) for his part attributes the washing of the horizon above the slowly permeable layer to the lateral translocation of the fine clay particles by a process of selective erosion. According to Rojanev (1957) cited by Dudal (1973), the strong bleaching of surface horizons, accompanied by marked textural differentiation, takes place under the influence of.excess surface water rather
than through podzolisation. Finally Dolgova (1962) suggested that whitish surface horizons overlying heavy clays in the Smolensk area are related to binary alluvial deposits, in other words to lithological discontinuity. This diversity of hypotheses highlights that there is not yet a clear-cut opinion on the process involved in Planosol formation.
As to the occurrence of these soils, Dudal (1973) describes Planosols as mostly found on level topography, on heavy textured or compacted materials and under climatic conditions which cause surface wetting alternating with drought. He relates the occurrence of Planosols with other soil types namely Vertisols and Mollisols. He concludes that although overall climatic conditions in the regions where Planosols are found are different, the areas where Planosols develop have a common soil climate characterised by an alternation of strong wetting and drying. Dregne (1976) describes the occurrence of Planosols (Argiustolls) with other soil types namely, Paleustolls and Haplustolls on a nearly level to undulating topography in a grassland area, mostly in the middle of the Great Plains of the United States of America, which has a continental climate (precipitation throughout the year with marked seasonal temperature extremes). Conea et al. (1973) depict Planosol forming conditions in Romania as flat relief, slightly permeable subsurface horizon and a climate with wet and dry periods during the year, occurring especially in plains, piedmont plains and plateau regions with mean annual rainfall of 540-755mm and mean annual temperature of 7.5 to 10.8 degrees centigrade. Brinkman (1977) defines the environment of Planosols as characterised by seasonal wetting and low, nearly level landscapes. Duchaufour (1982) defines their environment as that of hot climates or at least continental climates. Nyandat (1984), while describing the soils of South Kinangop area in Kenya, mentions claypans as being found on the lower, nearly level to level plains.
3.3.2 The polycylic theory
From the above discussions it is clear that there are several views held by different people on the formation of Planosols. The theory of polycyclic formation of Planosols is proposed by Dudal (1973), Brinkman (1977), and

- 46 -
Duchaufour (1982). But there seems to be no agreement about the dominant process on the E horizon formation between Brinkman's hypothesis of clay degradation and Duchaufour's hypothesis of lateral clay translocation a view also held by Servat (1966), Roose (1970), Roose & Godefroy(1977) on the formation of Planosols and other mediterranean soils.
The polycylic theory envisages that before the formation of a Planosol there should initially exist a heavy clay condition in part of the profile or the whole profile as in the case of Vertisols or Luvisols (Brinkman, 1977). Brinkman in fact believes especially on the basis of experience in Bangladesh, that pre-existing Vertisols have been changed into Luvisols by clay eluviation and illuviation. This view is also held by Duchaufour (1982), who describes the first stage of Planosol formation as being identical to that of Pelosol formation, a situation which requires high abundance of clay (50% or more) with little profile differentiation and the presence of semi-swelling, interstratified type clays together with iron-, and magnesium-rich chlorites inherited from the parent material.
This stage is followed by a process of "impoverishment" of the topsoil by lateral movement of water above the slowly permeable subsurface horizon, giving way to the Planosol formation. Kornblum (1967) states that the presence of free iron is of little importance and does not play any part in the grey colouration of the clays. The process of impoverishment in the topsoil is also supported by Nguyen Kha (1976), who showed the importance of physical microdivision of the coarser clay particles occurring by wetting and drying after decarbonation of the C horizon. Brinkman (1977) is of the opinion that, after the Vertisol and Luvisol formation, a process called "ferrolysis" is the one responsible for the clay degradation. Ferrolysis would involve during the wet season: reduction producing ferrous iron, which displaces part of the exchangeable basic cations and aluminium; leaching of bases and part of the aluminium; and interlayer penetration by the remaining aluminium while some exchangeable ferrous iron is trapped also in the interlayers. In the dry season, oxidation of the exchangeable ferrous iron produces exchangeable hydrogen, part of which attacks the clay minerals and is neutralized by liberation of Al, Mg and other ions from the clay structure. Part of the silica remaining from the clay structure is leached out in the next wet season, part accumulates in amorphous form. Duchaufour (1982) though believes that there is ferrolysis, stresses that it comes after the impoverishment of the topsoil. He argues that, at the beginning, the environment is normally only slightly acid and rich in calcium, a condition which does not favour redox processes. He states that ferrolysis only starts when the environment is rich in dissolved oxygen, and this condition can only be presnt if there is room for waterlogging.
3.4 DEFINITION OF BASIC TERMINOLOGY AND CONCEPTS
This paragraph deals with a description of the terms and concepts used in the text. It shall deal first with the terminology associated with weathering and clay formation, then the terminology associated with the movement of materials within soils and finally the general terminology used in Planosol descriptions. Chemical reactions associated with the described processes if there are any shall also be mentioned.

- 47 -
3.4.1 Weathering and clay formation
1) Forms of Weathering
There are two forms of weathering: physical and chemical.
a) Physical Weathering
Physical weathering is favoured by temperature variations, alternating heating and freezing, erosion agents such as moving water and wind, and by the activities of man and other living organisms. This kind of weathering is dominant in cold or desert climates.
b) Chemical Weathering
Chemical weathering is conditioned by the presence of water which carries active agents such as oxygen, organic acids and carbon dioxide dissolved in it. It reaches a maximum intensity at sufficiently high temperatures, found mainly in humid tropial climates.
Chemical weathering gives rise to: (1) soluble materials that are generally salts able to release ions which either become exchangeable or are leached; (2) colloidal gels by hydration and polymerisation of free heavy cations of aluminium and iron. The insolubilisation of these heavy cations, which is rapid in most soils, decreases in acid conditions rich in soluble organic matter, which favours complex formation); (3) microcrystalline entities with sheet structure (clays) which fix to their surface iron and aluminium hydroxides.
2) Weathering Index
The weathering index of a soil requires an evaluation of the amount of secondary minerals (the weathering complex) as compared to its total (primary and secondary) mineral content. Generally, the more developed the soil, the higher the index.
In the determination of the index it is usual to use a particular element, such as iron or aluminium as a standard: the gross index of weathering of an horizon is then expressed by the ratio:
Al of weathering complex Fe of weathering complex or
total X Al total % Fe
For soils which have been subjected to relatively gentle weathering, such as those of temperate climates, the second index is higher than the first one,
for the ferromagnesian minerals release their iron more quickkly than some of the more resistant felsic minerals, such as orthoclase, release their aluminium. These differences decrease in hot climates.
3) General processes of rock weathering
Hydrolysis or the effect of water containing such active entities as hydrogen ions (H+), is the most important process of rock weathering. Other processes, which can be important in particular cases, will also be dealt with. They include: the simple dissolution of saline rocks; hydration, which consists of

water molecules combining with certain slightly hydrated rock minerals, such as ferric oxides, thus aiding in the process of rock, decomposition and disaggregation; and oxidation, which causes the release of ferrous ions (Fe2+) contained in certain primary minerals, so disrupting their crystal lattices. The process of reduction occur more rarely but, under hydromorphic and badly aerated conditions, it is responsible for the solution of ferruginous sandstone cements and hence for their breakdown.
4) Clay formation
Although hydrolysis is the fundamental mechanism of weathering of primary minerals, its action varies considerably depending on the enviromental conditions, and particularly on the climate. Temperature is an essential factor

- 49 -
of hydrolysis: any rise in soil water temperature increases the speed of chemical reactions, which enables two types of weathering to be distinguished: (1) geochemical weathering and (2) biochemical weathering.
Geochemical weathering results in the complete liberation of the mineral constituents: silica, aluminium, bases, etc. It is characteristic of tropical climates.
Biochemical weathering is gradual and gentle, and often incomplete, characteristic of temperate climate. This type of weathering generally preserves the initial crystalline structure, the insoluble residue always being particularly important.
In each case, the origin of the clay is different. In a hot climate, the clays are often of neoformation, i.e. formed at the expense of the parents from entities freed by complete weathering. In temperate climates, the clays are most often the result of a gradual transformation of the primary minerals (particularly of the phyllitic minerals).
The transformation of a primary mineral to a clay mineral varies in its intensity and amount as a function of the environment. If it is very slight, the term inheritance is often used. Degradation is the case where the change is considerable and when there is a gradual decrease in the degree of crystallinity and a loss of constituents. Aggradation is the case where there is an addition of elements to a badly crystallised lattice which causes an improvement in the crystal structure.
5) Geochemical weathering: total hydrolysis and neoformation of clay
This type of hydrolysis is specific to tropical soils. It occurs under neutral conditions, in the presence of circulating water in well drained environment, and in the absence of organic acid anions. In these conditions, the primary minerals are totally destroyed and their constituents, particularly silica and alumina are freed. This is the case for both phyllosilicates (micas) and tectosilicates (feldspars). It differs from temperate weathering in that there is a convergence of the process of weathering, no matter what type of primary mineral is involved. This total hydrolysis favours the elimination not only of basic cations (Ca2+, Mg2+, K+, Na+) but also of silica, which becomes mobile at low pH. On the other hand, iron and aluminium oxides are only slightly mobile and accumulate in situ. However when the elimination of silica slows down owing to poor drainage (impeded or semi-impeded environment), neoformation of clay becomes possible by recombination of silica and alumina.
6) Influence of the environment on the neoformation of clay
Neoformation clays resulting from this type of weathering are in fact very variable, both qualitatively and quantitatively. The variation is controlled by two fundamental factors: (1) natural drainage, and (2) the differential solubility of the constituents in the environment. The natural drainage removes the freed constituents at a very variable rate while the differential solubility is very much pH dependent. In fact, although the pH is evidently related to the richness in basic cations of the weathered materials, it also depends on the drainage conditions since basic cations are most mobile, and are always the first to be removed from the soil solution, particularly the

- 50 -
alkaline earths. Thus, it is normal that a well drained environment (sometimes called leaching) acidifies very quickly, which is the opposite of what happens in a semi-impeded or, to even greater extent in an impeded environment. This occurs whatever the initial reserve of bases in the original material.
In horizons of tropical soils where pH is around 5, and where most of the bases and a part the of silica have been previously removed by drainage to depth, only clays poor in silica, of the kaolinitic type, are able to form. When the environment is richer in bases and silica, which is the case in less well drained situations or where the original material is richer in alkaline earths, the phenomena observed are totally different. The combination of silica and alumina leads to the neoformation of clay types rich in silica, such as smectites (montmorillonite). This is the case in certain eutrophic soils and Vertisols (Leneuf, 1959). Mehlic (1967) has emphasized the role of the bivalent cations Ca2+ and Mg2+ in the formation of aluminosilicates rich in silica. The addition of a magnesium salt to a soil solution first led to the formation of an intermediate amorphous gel and then to the formation of clay rich in silica (smectite).
Fritz and Tardy (1976) showed that the formation of gibbsite occurs only in a special kind of environment: for instance, where the parent material is very poor in silica and very well drained. Kaolinite is the dominant clay of the ferrallitic soils, formed under reasonable to semi-impeded drainage conditions, most of the silica produced by weathering having been previously removed. In such an environment, gibbsite resulting from the weathering of primary minerals (primary gibbsite) is present always in small amounts and limited to steep sites with strong lateral drainage. Kaolinite is formed directly and immediately on acid parent materials such as acid granites (Blot et al., 1976). On basic materials such as calc-alkaline granites, dolerites and diorites for example, the processes are rather different. In these conditions, under slow drainage, the initial formation of montmorillonite appears to precede that of the kaolinite. Montmorrilonite is in fact present in the deep regolith still relatively rich in alkaline earths and soluble silica. Montmorillonite quickly changes into kaolinite by loss of silica. Kaolinite is dominant in the most acid zone situated immediately above the horizon of weathering.
Biochemical weathering shall not be described in this chapter since it mainly deals with the weathering process in temperate regions.
3.4.2 The movement of substances within soils
The water circulating in soil pores (gravitational water) carries with it certain substances either in solution or suspension, and is responsible for their general movement. A great amount of the material thus mobilised can be removed completely from the profile, and as such an overall loss can be
calculated using the method of mineralogical balance sheets. In contrast, another part of the mobilised material is deposited at lower levels in the profile, i.e. is redistributed enabling two main horizons to be differentiated: (a) A horizons that are in general impoverished-eluvial horizons; (b) B horizons that are in general enriched - illuvial horizons.
There is considerable confusion in the nomenclature used to describe the movement of materials in soils. For example, the word lessivage can be used in diffe-
- 51 -
rent ways, either very generally to mean the movement of all materials both in solution and in suspension or, on the contrary, in a more restricted sense as meaning the movement of particles (clays) in suspension only. In fact it is essential to use different names to distinguish between materials moving either as soluble salts or as pseudo-soluble organo-metal complexes or as suspended particles. It is also important to differentiate further according to the direction of movement and the importance of the process of redistribution.
1) Lixiviation: migration of soluble salts
Lixiviation is concerned mainly with the most mobile cations, those capable of forming soluble salts at the pH of the soil: essentially the alkali and alkaline earth cations (Na+, K+, Mg2+, Ca2+) which occur in soil solutions in equilibrium with the exchangeable cations retained by the adsorbent complex. The anions that migrate may be in the inorganic form, for example nitrates or carbonates, or organic such as lactates. The heavy polyvalent cations rarely migrate as salts, except Mn2+ and Fe2+ ions in reducing conditions and sometimes A13+ in very acid conditions.
The gradual movement of alkali and alkaline earth cations generally leads to in the their replacement on the adsorption complex by H+ or A13+ ions, which results in desaturation of the complex and soil acidification. The loss of cations by lixiviation affects not only the upper part of the profile (A horizon) but often the profile as a whole. Re-adsorption of cations in the B horizon can occur, but the general balance indicates a deficit, particularly in humid climates with a strong element of climatically controlled drainage (for example an atlantic climate).
Soils containing carbonates (calcareous and dolomitic) are subject to a particular kind of lixiviation - decarbonation - which generally (but not exclusively) occurs as a result of the action of dissolved carbon dioxide:
CaC03 + C02 + H20 Ca(HC03)2 soluble
Here again the loss by deep drainage is general in humid climate. Translocation also operates in drier climates, where precipitation of the calcium bicarbonate occurs at a certain depth as a particular kind of illuvial horizon (calcic horizon). More rarely, in rather more acid areas the loss of calcium from the A horizon occurs as gypsum (CaS04); then a gypsic horizon can form at a certain depth.
2) Cheluvition: movement of organometal complexes.
Cheluviation involves the movement of the heavy cations A13+, Fe3+ (occasionall-y also some alkaline earths derived from litter, such as Ca2+) as organometal complexes or chelates. This process is generally associated with strong weathering of primary (or secondary) minerals by complexing organic acid (such as oxalic, citric or phenolic acids). Both processes of weathering and mobilization of complexes are evidently strictly complementary.
The organomineral complexes are in a pseudo-soluble form and, in certain conditions, are almost as mobile as soluble salts, but their solubility is strictly dependent upon the environmental conditions such as Eh and pH, the ionic composition and the concentration of the soil solutions. As a result the complexes do not remain in solution for as long as the salts in true solutions.

- 52 -
In the majority of cases they are insolublized again in the B horizons. This restricts the overall losses from the profile by drainage, and increases the importance of redistribution of materials within the profile. In this way spodic horizons are formed in podsolic soils by the precipitation of aluminium and iron complexes. Such horizons are particularly enriched in amorphous materials, first as insoluble complexes which gradually become free hydroxides. Generally, the symbol Bs (or Bfe) is used for these horizons when they are rich in sesquioxides, particularly iron, and Bh if they contain a great deal of dark-coloured humic acids.
3) Pervection (lessivage): movement of particles in suspension
Pervection is a term used to describe the process of mechanical movement of clay size particles within the soil profile. When the movement is directed vertically, as is generally the case, the moving fine clay particles are deposited in the B horizon, on the walls of voids or around structural units, thus forming coverings of orientated clay platelets called cutans (here argiHans).These are clearly visible in micromorphological thin sections. The mechanism involves the mechanical movement of clay in the dispersed state - that is to say, as isolated particles. The inclusion of these particles within flocculated aggregates (generally of a reasonable size) prevents the process. Strong biological activity, responsible for a stable crumb structure (mull), restricts the process of pervection. In certain cases, such an accumulation of clay in the Bt horizons fills up the pores in the deeper layers. If the non-capillary porosity is insufficient the clogging of fine pores can gradually decrease the permeability of the Bt horizon which thus develops signs of waterlogging, such as segregation of iron concretions.
When Bt or Btg horizons get choked with clay, no longer allowing gravitational drainage, perched water tables form and lateral drainage occurs. In certain climates, characterised by seasonal torrential rainfalls, water cannot be removed by vertical drainage and water-logging of the surface horizon results. It may result to a selective erosion of the fine particles by surface run-off which leads to an impoverishment of the surficial horizons in tropical soils, planosols and certain mediterranean soils.
4) Movement of silica within the soil
Silica migrates in the soluble form (monosilicic acid). Its maximum solubility is low (about 100 ppm) and relatively independent of the pH. Any considerable increase in soil solution concentration, as a result of the profile drying out, causes silica precipitation as a polymerised gel. However when the profile is well provided with water, the silica concentration is much less than the maximum figure, and variations in this concentration are to a large extent related to the environmental factors, particularly pH. In addition, it depends also on the source of the silica which may be either biological (litter) or geochemical (weathering of silicates or even slow dissolution of quartz).
3.5 SYSTEM OF HYPOTHESES
3.5.1 Research hypothesis
1) Soil genesis hypothesis
The factors of soil formation were first cited by Dokuchaev (1846-1903) as being (1) local climate, (2) parent material (3) plant and animal organisms, (4)

- 53 -
relief and elevation, and (5) time. Though earlier works of Lomonsov (1711-1765) showed that there had been a recognition of the external and internal factors and processes of soil formation, most credit goes to Dokuchaev who explicitly showed that there was more to soil development than just the geology as might have been believed.
Later Jenny (1941) gave a mathematical approach to the soil forming factors and formulated five independent variables of climate (cl), organic matter (o), relief (r), parent material (p) and the time (t). He showed that the combination of these factors and the state of the soil system is fixed and may be equated as s= f'(cl' o' r' p' t). He also formulated an environmental equation of formative and variable factors where s= f(cl,o,r,p,t,...). This equation was left open for any discoveries of new variables. The first equation relates more to agronomy and soil chemistry while the second equation is more of interest to geographers and environmentalists.
This study hopes to explore the influence of the mentioned factors and their significance in the area. Some of the factors might be less or more of influence than others. Climate combined with parent material has been observed to have more influence on the development of features associated with volcanic soils (Kanno 1962} Wright 1964; Mizota 1987). Time may play a part especially when the soils have advanced to maturer stages of development. Topography has been observed to have influence on the distribution of soil units, and processes of soil formation differ depending on the configuration and position of the topography. Drainage which is significant in the moisture state of the soil and which plays a significant role in clay formation is a factor controlled by topography and therefore has a significant role to play. Vegetation though more complex provides organic material which complexes with soil minerals to give certain characteristics to the soil. This has led to delineation of bioclimatic zones of different soil units. The Chernozems for example are associated with temperate grasslands and Oxisols with tropical rain forets.
The results should therefore determine whether the soils in the area have followed the same mode of formation described elsewhere or if they have similar features as already described.
2) Land degradation hypothesis
The vulnerability of the soils to erosion as well as their sodicity and may be partially inherited from the nature of their parent material, especially where influxes of volcanic ash can be demonstrated. Wright (1967) points out the abundance of alkali feldspars in the volcanic ash admixture upon which the soils are developed. The weathering of the alkali feldspars results into high concentrations of sodium leading to soil dispersion. This condition contributes to weaken the structural stability and therefore favours erosion processes. Catalan (1984) relates the high dispersion propensity of these soils to the pH, the electrolyte concentration and the variable charge component.
OPERATIONAL HYPOTHESES
Using combinations of profile morphology, chemical properties and clay mineralogy» genetical relationships between Planosols, Vertisols and Luvisols will be explored. This is only meaningfull if it is done for soils belonging to the same toposequence and formed from the same parent material.
Investigations about the erosion problem may need more time than available

- 54 -
during the fieldwork period. Soil factors involved in erosion shall be dealt with individually in order to detect their particular significance. The kind of investigations to be developed shall mainly be the determination of the concentration of sodium as compared to calcium, the flocculation determinants, structural stability rates, and the speed of formation of an overland flow due to the presence of the impermeable layer.
The magnitude of évapotranspiration rates shall be calculated from the existing climatic data held by the Meteorological Department and their influence on the soil conditions determined. From this it shall be possible to tell whether climate has an influence on the soil properties.
3.5.3 hypothesis testing
The spatial funtion of the landscape and the individual soil characteristics shall be graphically represented and relationships established.
Quantifiable variables shall be statistically explored by correlation or regression analysis. Null or alternative hypotheses shall be considered.

- 55 -
CHAPTER 4 METHODOLOGY
The procedure followed for the collection of soil data, their treatment and intepretation can be subdivided into three sets of activities: office activities fieldwork and laboratory determinations.
Office activities included the collection of geological, topographic, and climatic information, the acqusition of aerial photos and, at a later stage, map compilation, survey reporting and thesis writing. Fieldwork consisted of describing and measuring soil properties at given sites in the landscape through soil augering, profile description and sampling in representative soil profile pits. Laboratory determinations provided basic data, in addition to field data, for the characterization of the soils.
4.1 PREPARATION FOR THE FIELDWORK
4.1.1 Acquisition of materials and equipment
The following materials were made available prior to the fieldwork: - 26 black and white aerial photographs (1965) at scale 1:50,000, on paper copies of reasonable quality.
- Three topographical maps prepared in 1965 but updated in 1978, at scale 1:50,000, obtained from Survey of Kenya.
- Soil map at scale 1:1,000,000 (1982) obtained from Kenya Soil Survey. - Geological survey reports with map of the study area at scale 1:125,000
(1956).
4.1.2 Air photo-interpretation
The air photo-interpretation for soil survey was based on the recognition of relevant phenomena on air photos, mainly related to the terrain physiography and strongly correlated with soil differences.
A photo-interpretation using a geomorphic approach was carried out on scale 1:50,000. The scales between runs varied considerably. Also the age of the photographs flown in 1965 gave rise to some confusion during the fieldwork due to changes in land use. Stereoscopic vision was possible over an area of about 800 sq.km.
During physiographic analysis, a hierarchical geomorphic classification system based on four categorical levels was followed (Zinck, 1974). The levels of subdivision or categories are: landscape, relief, lithology and lastly landform. Each category is in turn composed of a set of classes. Morphographic, morphometric and morphogenetic attributes were used for identifying and delineating the geomorphic units.
4.2 FIELDWORK
4.2.1 Survey methodology
At the beginning of the survey, field observations were carried out in representative parts of the area for studying the main soils, their differences and their transitions, and for checking the photo interpretation units. The essential aspect of this procedure was the continuous combination of fieldwork and photo interpretation during the survey. The interpretation was adjusted all the time to the results of the field observations.

- 56 -
A limited number of representative transects wes selected, traversing as many geomorphic units as possible. Along these transects, routine soil augerings and mini pit excavations were made at varying intervals. The transects run perpendicularly to expected boundaries between mapping units. In this way, the landscape-geology-soils correlations could be detected and used for inter- and extrapolation of data.
4.2.2 Collection of soil data
Based upon the field observations it was possible to correlate landscape elements with soil conditions. The different aspects involved at this stage were as follows:
- Description of the soil mapping units in terms of geomorphology, land use, vegetation and general environmental conditions.
- Determination of the relations and spatial correlations between the different landscape elements.
- Soil description.
Soil characteristics were described and measured in the field at two levels of detail: a) soil mini pit and augering descriptions; b) soil profile descriptions in soil pits. Field observations were located on aerial photographs in the field and later transferred on to the photo-intepretation map. The site characteristics measured or described at each observation point included: parent material, relief characteristics (macro, meso, and micro), rock outcrops and surface stoniness, slope gradient and position on the slope, exposure, drainage class, vegetation, soil fauna, erosion features, land use and human influences. The Guidelines for soil profile description (FAO, 1977) and the Soil Survey Manual (Soil Survey Staff, 1951) were adopted for the description and measurement of the soil characteristics.
4.2.3 Choice of transects
After photo-interpretation the information was transferred to base maps at the same scale covering an area of approximately 800 sq km. Using geological maps field observations and agro-climatic zone maps, sample areas representative of natural homogeneous zones were chosen. Six transects were identified, four in agro-climatic zone V with rainfall ranging between 450-600 millimetres, and two in agro-climatic zone IV with rainfall ranging between 600-800 millimetres.
By means of field inventory, transects having uniform geology with landform variations from summit, backslope and footslope positions were chosen.
Along each of the six transects, three profile pits were described. Their location was based on a combination of topographic conditions (upper, middle, and lower sequents of toposequences) and soil taxonomy criteria (presence of Planosols, Vertisols, Luvisols).
The type of information collected on each profile included:
1) Regular pit description as contained in the FA0 guidelines for soil profile description.
2) Classification according to the FA0-UNESC0 and USDA Soil Taxonomy.

- 57 -
4.2.4 Soil sampling procedures
Soil profile pits were dug down to the sub-surface C horizon along transects. These were described in detail and samples were taken from every horizon for physical, chemical, mineralogical and micromorphological analyses both at National Agricultural Laboratories, Nairobi, and at ISRIC, Wageningen. The method of genetic horizon sampling was followed, in order to characterize A, E, B or Bt, and C horizons separately. For each horizon, soil samples were taken from various points and mixed well, before being put into plastic bags.
For every profile pit, a composite sample was taken for mass analysis of available nutrients. This was done at five different locations round the pit and mixed as well. In addition, undisturbed samples for bulk density and pF determinations were collected. Three cores were taken from well distributed points throughout each of the A, E, and Bt horizons. In a few selected profiles, samples were taken in Kubiena metallic boxes for micromorphological analyses.
4.2.5 Compilation of geomorphic soil map
The legend of the photo-interpretation map was established mainly in geomorphic terms. During and after fieldwork, this initial map was transformed into a soil map, by the inclusion of the soil information.
4.3 POST FIELDWORK STAGE
4.3.1 Laboratory determinations
The soil samples collected from the field were submitted to both physical and chemical analyses. Procedures followed were those used at the National Agricultural Laboratories in Nairobi and the ones used at the International Soil Reference and Information Centre in Wageningen, the Netherlands. All the procedures are contained in "Physical and chemical methods of soil analysis" by G. Hinga et al. (1980), Nairobi, Kenya, and in "Procedures for soil analysis" by L.P. van Reeuwijk (1987), Wageningen, the Netherlands.
Part of the samples was analysed in Nairobi and the rest at ISRIC in the Netherlands. In both cases the samples were analysed for;
1) Physical determinations
- Particle size distribution (at ISRIC and in Kenya) - pF determinations (in Kenya) - Water dispersable clay (at ISRIC and in Kenya) - Surface area of the clay (at ISRIC) - Bulk densities (in Kenya)
2) Chemical determinations
- pH determinations (both in Kenya and at ISRIC) - EC determinations (both in Kenya and at ISRIC) - CEC ammonium acetate method pH 7.0 (at ISRIC) - CEC sodium acetate method pH 8.2 (in Kenya) - Exchangeable acidity for soils with pH < 5.5 (at ISRIC)

- 58 -
- % carbon by Walkley-Black method (both in Kenya and at ISRIC) - Equivalent carbonate (HCl method, for soils with pH>6.8) - Total chemical analysis by X ray fluorescence method (at ISRIC) - Extractable Fe, Al and Si by~dithionate, acid oxalate, and
pyrophosphate methods (at ISRIC) - Total nitrogen (at ISRIC) - Fertility determinations by Mehlich method (in Kenya)
3) Other determinations
-) Soil mineralogical determinations: X-ray diffractrometry (at ISRIC)
-) Micromorphological determinations: thin section analysis (at ISRIC)
4.3.2 Compilation of final geomorphic map and report
A new photo-interpretation at scale 1:50,000 was done after the fieldwork with a higher reference level of the field conditions. The boundaries were transferred onto transluscent base maps prepared by the Survey of Kenya at scale 1:50,000 using of optical pantograph and a vertical sketch-master. Observation points were also transferred onto the base maps covering the Angata Loita and the Maji Moto areas. The physiographic soil map was reduced to a scale 1:100,000 and the geomorphic map to a scale of 1:133,000.
4.3.3 Reliability of the procedures
The physiographic photo-interpretation boundaries had high coincidence with the soil boundaries, and therefore the physiographic map efficiently helped to select the observation points and the toposequences.
The use of aerial photographs for field orientation also proved invaluable due to the precise aid they gave in the exact location of the observation points, especially in relation to the geomorphic boundaries.
The laboratory determinations were useful in soil classification, grouping and management problems analysis.
The use of the optical pantograph and the vertical sketch-master helped reduce photo deformations and therefore minimize errors in boundary transfer.
The physiographic soil map is an invaluable tool both for land use management and planning and for the understanding of the behaviour of the soils under different geographic and topographic conditions.

- 59 -
lo
Ewaso Ngiro
to Natok
lo Maii Moto
WZ7Z7A Toposequences w i th their Nos
l°24'S
35*30'E
(H=Hilland, Pi=Piedmont, Pul=Higher level plateau, Pu2=Lower level plateau, Pa=Plain).
Fig 7. Major landtypes and location of the transects.

- 60 -
CHAPTER 5 DESCRIPTION AND CHARACTERIZATION OF THE TRANSECTS
TRANSECT 1: BAR KITABU TOPOSEQUENCE
1) Setting of the toposequence
a) Environment
The toposequence is located about 4.2km vestnorthvest of the junction to Naikara, on the main Narok to Keekorok road. The parent material is colluvium derived from quartzites, on a glacis within a piedmont landscape. The lover part of the transect is mostly on tuff and colluvio-alluvial mixture. The vegetation is grassland, mostly comprised of Pennisetum mezianum amd Themeda triandra. The transect falls within agroclimatic zone IV with rainfall of about 700mm. It is on a south facing slope and the total slope length from summit to footslope is 1,000 metres with a relief intensity of 10 metres.
b) Position of the profiles
There are three profile pits within the toposequence, one on the apex of the glacis, one on the midslope and one on the distal slopes of the same glacis.
2) Soil properties, classification and distribution
The soil profile occupying the apex position of the glacis is classified as Typic Haplustalf, the one the mid position as Typic Haplustalf and the lowest one as Vertic Haplustalf. The profile on the summit position is well drained and located on a convexing slope (0-2%) with top parts nearly level. The profile on the midslope position is located on a regular straight slope (2-3%) which merges with the summit through a smooth short shoulder slope. The profile on the lowest position is located on a nearly level footslope.
Profile 146/3-353
a) Morphology
The profile is located on the apex of the glacis. The A horizon is 10cm thick, very dark greyish brown (10YR 3/2), sandy clay, crumb structured and friable. The BA horizon is 13cm thick, dark reddish brown (5YR 2.5/2), clayey, prismatic and friable. The Bt horizon is 21cm thick, dark reddish brown, clayey, prismatic and friable with 5% CaC03 mycelium. The transitional BC horizon is 16 to 20cm thick, very dark greyish brown (10YR 3/2), clayey, prismatic and friable. The CB horizon is 17 to 21cm thick, reddish brown (7.5YR 4/6), clay loam, weakly structured and friable with CaCo3 nodules. Below this is a hard layer of weathering quartzitic material.

- 61 -
b) Chemical properties
Horizon Depth (cm)
X Exchangeable Ca Mg
Cations K Na
pH (H20)
pH (KCl)
CEC,meq XC /lOOgsoil
BS
A 0-10 BA 10-23 Bt 23-44 BCk 44-60/64 CB 60/64-81
56.9 50.7 55.0 61.8 57.0
20.3 24.9 24.3 14.7 6.4
21.5 23.3 20.1 22.2 33.4
1.1 8.7 4.3 1.3 2.7
6.6 7.2 7.6 8.1 8.4
5.7 6.1 6.6 7.0 7.0
15.5 24.0 22.2 24.6 15.5
1.17 0.63 0.58 0.63 0.37
79 90 100 100 100
c) Physical properties
Horizon Depth symbol (cm)
Clay silt — X —
Sand Texture Sand/ Silt ratio
Silt/ Clay ratio
SPSA clay (m)2/g
A 0-10 BA 10-23 Bt 23-44 BCk 44-60/64 CB 60/64-81
24 48 54 52 22
12 8 8 8 2
64 38 38 40 76
SCL C C C SCL
5.3 5.5 4.8 5.0 38.0
0.5 0.2 0.1 0.1 0.009
nd n n II
II
nd, not determined; SPSA (specific surface area)
d) Classification:
USDA - Typic Haplustalf FAO - Calcic Luvisol
Profile 146/3-350
a) Morphology
The profile is located on the middle part of the glacis. The A horizon is 7cm thick, black (10YR 2/1), sandy clay, crumb structured and friable. There are two Bt horizons which are 38cm thick, black (10YR 2/1), clayey, prismatic and friable to firm with cracks 1cm wide. The BC horizon is 7 to 13cm thick, very dark grey (10YR 3/1), clayey, subangular blocky, friable and slightly calcareous The CB horizon is 27 to 33cm thick, yellowish brown (10YR 5/4), sandy clay, massive, friable and calcareous.
b) Chemical properties
Horizon Depth X Exchangeable Cations pH pH CEC.meq XC BS (cm) Ca Mg K Na (H20) (KCl) /lOOgsoil
A 0-7 68.5 21.8 8.7 1.1 6.5 5.5 24.6 2.25 61 Btl 7-35 74.7 18.6 5.9 1.7 6.8 5.5 31.5 1.25 81 Bt2 35-45 78.5 17.0 3.1 3.8 7.8 6.6 30.3 0.99 97 BCk 45--52/58 79.9 12.4 1.8 5.7 8.2 7.0 27.5 0.85 100 CBk 52/58-85 87.3 3.9 2.7 6.0 8.5 7.1 21.7 0.29 100

- 62 -
c) Physical properties
Horizon Depth Clay Silt Sand Texture Sand/ Silt/ SPSA symbol (cm) X Silt
ratio Clay ratio
clay (m)2/g
A 0-7" 50 20 30 SCL 2.5 0.6 nd Btl 7-35 40 8 52 C 5.0 0.2 nd Bt2 35-45 38 10 52 C 3.8 0.2 nd BCk 45-52/58 42 8 50 C 5.3 0.2 nd CBk 52/58-85 56 6 38 SC 9.3 0.2 nd
nd, not determined; SPSA (specific surface area)
d) Classification:
USDA: Typic Haplustalf FAO : CalcicLuvisol
Profile 146/3-351
a) Morphology
The profile is located on the lower part of the glacis. The A horizon is 4cm thick, dark brown (10YR 3/3), sandy clay, crumb structured or subangular blocky and friable. The E horizon is 6cm thick, very dark greyish brown (10YR 3/2), sandy clay to sandy clay loam, subangular blocky and friable with few hard, small and concentric iron and manganese nodules. There are two Bt horizons which are 48cm thick, very dark brown to black (10YR 2/1), clayey, prismatic friable to firm with cracks not reaching the surface. The BC horizon is 35cm thick, dark brown (10YR 2/2), sandy clay loam, subangular blocky or porous massive, friable with few, hard, irregular, nodules of calcium carbonate. The CB horizon is 17 to 22cm thick, yellowish brown (10YR 5/6), sandy loam, massive and friable with clay cutans in pedotubules.
b) Chemical properties
Horizon Depth X Exchangeable Cations pH pH CEC,meq *C BS (cm) Ca Mg K Na (H20) (KCl) /lOOgsoil
A 0-4 61.0 18.2 16.8 1.5 6.5 5.4 14.8 1.23 54 Ec 4-10 62.6 19.2 11.5 6.8 6.6 4.9 12.6 0.86 62 Btl 10-39 70.7 11.8 5.0 12.2 7.7 6.2 33.0 0.77 90 Bt2 39-58 71.6 10.5 4.6 13.2 8.3 7.3 30.7 0.93 100 BCk 58-93 71.8 9.8 5.4 13.0 8.4 7.2 27.5 0.59 100 CBk 93-110 73.2 6.4 7.8 12.5 8.5 7.4 26.0 0.32 100

- 63 -
c) Physical properties
Horizon Depth Clay Silt Sand Texture Sand/ Silt/ SPSA symbol (cm) — % — Silt
ratio Clay ratio
clay (m)2/g
A 0-4 44 24 32 CL 1.8 0.8 nd Ec 4-10 48 20 32 SCL 2.4 0.6 nd Btl 10-39 28 8 64 C 3.5 0.1 nd Bt2 39-58 28 14 58 C 2.0 0.2 nd BCk 58-93 28 20 52 C 1.4 0.4 nd CBk 93-110 32 20 48 C 1.6 0.4 nd
nd, not determined; SPSA (specific surface area)
d) Classification:
USDA: Vertic Haplustalf FAO : Vertic Luvisol
3) General properties of the soil mantle
a) Morphology
The profile on the summit of the glacis and the one at the midslope has an A, B, and C sequence of horizons while the one on the footslope has a weakly developed E horizon. The A horizon reduces in thickness downslope from 10cm at the summit position, 7cm for the midslope position and 4cm for the lowest profile. The depth of the solum increses downslope from 81 for the summit position, 85cm for the midslope and 110 cm for the lowest one. The A horizon for all the positions is sandy clay, crumb structured or subangular blocky. The Bt horizon increases in thickness downslope with the highest profile having a thickness of 34cm, the second 38 and the lowest 48cm. In all the positions it is prismatic with varying colours and consistencies. The Bt horizon for the highest profile is dark reddish brown, the second one black and the lowest, very dark brown to black. The highest one is friable, the second very firm and the lowest friable to firm. The Bt horizons for the second and the lowest profiles have cracks 1cm wide but not reaching the surface.
b) Chemical
The pH increases regularly down each profile with depth. The lateral distribution is nearly the same for all the positions. An increase in the exchangeable calcium is noted for the midslope and footslope positions. Magnesium and potassium decrease slightly down the soil mantle while sodium shows a lateral increase down the soil mantle when the two lower profiles are considered. A general increase in CEC is observed for the lower profiles when compared to the higher one.

- 64 -
P r o f i l e 146/3-353
0 , so • • IQ"*
Profile 146/3-350
o so. , , , iqp%
no
Fig 8 Lateral distribution of the exchangeable cations from the summit to the footslope position of the toposequence.
c) Physical
The sand content in the A horizon decreases regularly downslope from 64% upslope 50% in the middle position and 44% in the lowest position. Silt in the same horizon increases from 12 in the highest profile, 20 in the middle and 24 in the lowest profile. The Bt horizons have equal silt contents though the clay contents increase regularly downslope from the upslope position. The sand contents decrease also regularly downslope. The silt to clay ratios decrease regularly with depth but increase downslope within the soil mantle.
Fig 9 Lateral textural variation from summit to the footslope of the toposequence.
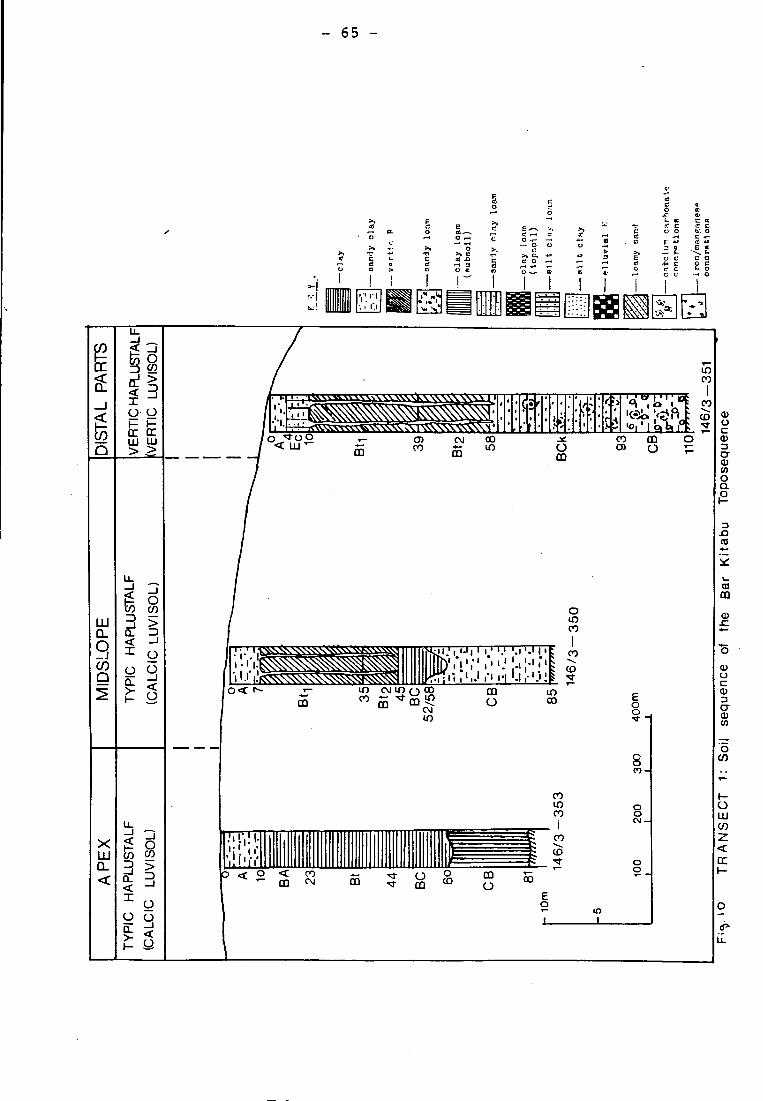
- 65 -

- 66 -
4) Interpretation
The irregularities observed on the chemical properties of the profile at the apex of the glacis could be as a result of materials of different ages translocated from the hilly and relief being deposited on the piedmont landscape. Such irregularities could indicate different erosional and depositio-nal cycles affecting the evolution of the landform.
Observed is a thickening of the Bt horizon at the expense of the A horizon downslope. Also observed is an increase in clay content from the highest profile dovnslope through the midslope profile both in the A and in the B horizons. Both calcium and sodium also migrate dovnslope letting potassium and magnesium accumulate upslope and in the surficial horizons. These movements result into the formation of thick, heavy textured Bt horizons dovnslope and light textured soils upslope. This gives the soils dovnslope an impeded drainage due to the choking of the Bt horizons vith clay. Impeded drainage dovnslope restricts further movement of the solutes and as a result a recombination of silica, aluminium and calcium occur to form smectite type clays. This leaves the better drained soils upslope and in the surficial horizons richer in kaolinite and mica/illite type clays.
The reduced thickness in the topsoils could result also from truncation of the sloping soils by vater erosion. This vould form receding concave slopes dovnslope vith convexing slopes upslope.
TRANSECT 2: LOMANERA TOPOSEQUENCE
1) Setting of the toposequence
a) Environment
The toposequence is located 200 metres vest of the Narok- Keekorok road, 10.5 km vestsouthvest of the Maji Moto trading centre. It is at an elevation of 1925 metres above mean sea level vith an annual precipitation of 500-600 mm. The parent material is volcanic tuff vith colluvio-alluvial material on the midslope position. The vegetation is medium grasslands dominated by Pennisetum Mezianum and Themeda triandra on erosion terraces. The total slope length from the summit to the svale position is 1,300 metres vith a relief intensity of 20 metres. The slope is vest facing vith a convex-straight-concave configuration.
b) Position of the profiles
Five profile pits are located on the toposequence. Profile 146/3-364 is located on the summit, profiles 146/3-358 and 146/3-359 on the backslope position, profile 146/3-360 on the footslope position and profile 146/3-363 on the svale position.
2) Soil properties, classification and distribution
Profile 146/3-364 on the summit position (slope 0-2%) classifies as a Typic Haplustalf, profiles 146/3-358 and 146/3-359 on the backslope position as Typic Haplustalfs, 146/3-360 on the footslope position as Vertic Haplustalf and profile 146/3-363 on the svale position also as a Vertic Haplustalf.

- 67 -
Profile 146/3-364
a) Morphology
The A horizon is 13 to 17cm thick, very dark greyish brown (10YR 3/2), clayey, sub angular blocky and crumb structured and friable. The Bt horizon is 27cm thick, very dark brown (10YR 2/2), clayey, prismatic and firm. There are transitional BC horizons with the deepest at 54cm having 30%, coarse, CaC03 nodules. The CB horizon is 14cm thick, dark yellowish brown (10YR 4/6), gravelly sandy clay loam. The Bt horizon is cracking but the cracks don't reach the surface.
b) Chemical
Horizon Depth X Exchangeable Cations pH (cm) Ca Mg K Na (H20)
"pH CEC,meq EC BS" (KCl) /lOOgsoil (%)
Ä 0-13/17 55.1 Bt 13/17-40/44 58.5 BC 40/44-50/54 61.2 BCk 50/54-89 60.9 CB 89-103 58.6
27.1 15.8 2.1 7.0 5.6 53.7 1.30 46 26.9 12.6 2.0 6.9 5.6 70.7 0.68 42 25.5 11.6 1.9 7.4 6.2 61.5 0.65 47 22.4 13.6 2.9 8.7 6.4 43.5 0.40 67 22.4 10.7 8.4 8.2 6.6 42.5 0.32 68
c) Physical
Horizon Depth Clay Silt Sand Texture Sand/ Silt/ SPSA symbol (cm) X - Silt Clay clay
ratio ratio (m)2/g
 0-13/17 46 22 ii C 0.7 Ô.Ô nd Bt 13/17-40/44 60 16 24 C 1.5 0.2 nd BC 40/44-50/54 50 26 24 C 0.9 0.5 nd BCk 50/54-89 34 18 48 SCL 2.7 0.5 nd CB 89-103 24 20 56 SCL 2.8 0.8 nd
nd, not determined; SPSA (specific surface area)
d) Classification:
USDA: Typic Haplustalf FA0 : Calcic Luvisol
Profile 146/3-358
a) Morphology
The profile is well drained, 140cm deep, with A, E, Btl, Bt2, BC1, BC2, and Btb sequence of horizons. The A horizon is 17cm thick, dark brown(10YR 3/3), clay loam, sub angular blocky and crumb structured and is friable. The E horizon is 8cm thick, weakly developed, thick, very dark greyish brown (10YR 3/2), clay loam, sub angular blocky and friable. The Bt horizon is 40cm thick, dark brown (10YR 3/2) to very dark greyish brown (10YR 3/2), clayey, prismatic and firm. It is divided into Btl and Bt2 horizons. There is a transitional BC horizon 13cm

- 68 -
thick and at 89cm a hurried Bt horizon 51cm thick, black (10YR 2/1), sandy clay loam to sandy loam. The textures don't really conform with a Bt horizon though the colour and general morphology resembles a Bt horizon. This could be an ancient alluvial deposit or ash deposit where clay pervection has taken place.
b) Chemical
Horizon Depth % Exchangeable Cations pH pH CEC meq XC BS (cm) Ca Mg K Na (H20) (KCl) /lOOgsoil (Z)
A 0-17 41.5 33.3 22.8 2.4 7.1 6 4 38.8 2.Ô7 32 E 17-25 41.5 37.4 17.9 2.8 6.6 5 0 31 0 1.17 39 Btl 25-48 46.1 32.7 10.3 10.9 7.0 5 2 29 5 1.02 56 Bt2 48-65 52.2 30.5 6.4 10.9 6.7 5 3 47 5 1.04 53 BC1 65-78 54.7 27.1 7.5 10.5 6.9 5 6 43 5 1.07 49 BC2 78-89 57.2 22.3 9.3 11.2 7.0 5 7 41 8 1.16 64 Btb 89-140 59.4 21.1 9.6 9.7 7.0 5 .9 38 7 0.70 78 C 140+ 69.9 14.3 5.9 9.9 7.7 6 3 38 3 1.09 53
c) Physi cal
Horizon Depth Clay Silt Sand Texture Sand/ Silt/ SPSA symbol (cm) % Silt
ratio Clay ratio
clay (m)2/g
A 0-17 42 34 24 C 0. 7 0. 8 nd E 17-25 42 34 24 C 0. 7 0 8 nd Btl 25-48 48 26 26 C 1. 0 0 5 nd Bt2 48-65 58 16 26 C 1. 6 0 3 nd BC1 65-78 52 24 24 C 1 0 0 5 nd BC2 78-89 48 26 26 C 1 0 0 5 nd Btb 89-140 48 24 28 C 1 2 0 5 nd C 140+ 44 18 38 C 2 1 0 4 nd
nd = not determined
d) Classification
USDA: Typic Haplustalf FAO : Eutric Luvisol
Profile 146/3-359
a) Morphology
The A horizon is 2cm thick, very dark greyish brown (10YR 3/2), clay loam, sub angular blocky or crumb structured and friable. The Bt horizon is 22cm thick, very dark greyish brown (10YR3/2), clayey, prismatic and firm. The transitional BC and CB horizons aire 34cm thick, dark brown (7.5YR 3/2) to very dark brown (10YR 2/2), clay to clay loam, prismatic and friable. The Btb and CBb horizons are 64cm thick, dark brown (10YR 3/3) to dark yellowish brown (10YR3/6) sandy clay to sandy clay loam, subangular blocky and friable. The Bt horizon has continous thick clay cutans, while the BC, CB, Btb and CBb have thin patchy clay cutans. Few, fine CaC03 nodules occur at 95cm.

- 69 -
Fig1 Photograph showing profile 146/3-359.
b) Chemical
Horizon Depth X Exchangeable Cations pH (cm) Ca Mg K Na (H20)
TC" pH CEC,meq (KCl) /lOOgsoil
BS
A 0-2 47.2 30.8 10.4 8.9 7.3 5.6 ëi.3 1.24 47 Bt 2-24 52.7 27.6 11.3 8.2 7.3 5.5 62.7 1.18 44 BC 24-36 52.8 25.3 8.7 13.1 7.3 5.9 53.5 1.05 43 CB 36-60 51.9 21.5 23.3 18.0 7.5 6.1 55.0 0.95 42 Btb 60-95 55.7 19.8 10.8 13.7 7.7 6.3 56.0 0.97 58 CBb 95-124 54.9 18.9 8.2 17.9 7.7 6.5 58.8 0.69 56 C 124+ 59.6 15.9 9.6 14.9 8.1 6.5 48.8 0.54 62


c) Physical
- 70 -
Horizon Depth Clay Silt Sand Texture Sand/ Silt/ SPSA symbol (cm) — % — Silt
ratio Clay ratio
clay (m)2/g
À 0-2 60 18 22 C 1.2 0.3 nd Bt 2-24 60 18 22 C 1.2 0.3 nd BC 24-36 50 24 26 C 1.0 0.5 nd CB 36-60 46 28 26 C 0.9 0.6 nd Btb 60-95 46 26 28 C 1.1 0.6 nd CBb 95-124 46 26 28 C 0.9 0.6 nd C 124+ 36 26 38 CL 1.5 0.7 nd
nd, not determined; SPSA (specific surface area)
d) Classification:
USDA: Typic Haplustalf FAO ; Calcic Luvisol
Profile 146/3-360
a) Morphology
The A horizon is 8cm thick, dark brown (lOyr 3/3), clay loam, sub angular blocky and friable. The Bt horizon is 50cm thick, very dark brown (10YR 2/2) to black (10YR2/1), clayey, prismatic and firm. The BC and CB transitional horizons are 49cm thick, dark yellowish brown (10YR 4/4) to dark brown (7.5YR 3/4), clay loam to sandy clay loam, weak angular blocky to massive and friable. The Bt horizon has continous, thick clay cutans. Cracks wider than 1cm are present within the Bt horizon at depths ranging from 8 to 65cm.
b) Chemical
Horizon Depth % Exchangeable Cations (cm) Ca Mg K Na
IC" pH pH CEC,meq (H20) (KCl) /lOOgsoil
BS (*)
"46T5" 53.8 53.3 52.3 51.7 60.2
"33T8" 13. 14. 14. 13.
8.
2. 5. 6. 8.
11.
7.3 "y 5. 6. 6. 6. 6.
39T8" T 1. 1. 0. 0. 0.
70" 22 37 31 09 06
A Btl Bt2 BC CB C
0-8 8-44
44-58 58-80
80-107 107+
30. 27. 26. 25. 18.8
7. 8. 8. 8.
63. 54. 30. 28.8 37.7
4y 41 37 63 70 51
c) Physical
Horizon Depth Clay Silt Sand Texture Sand/ Silt/ SPSA symbol (cm) X Silt
ratio Clay ratio
clay (m)2/g
A 0-8 48 26 26 C 1.0 0.5 nd Btl 8-44 66 8 26 C 3.3 0.1 nd Bt2 44-58 56 20 24 C 1.2 0.4 nd BC 58-80 42 32 26 C 0.8 0.8 nd CB 80-107 30 24 46 SCL 1.9 0.8 nd C 107+ 42 36 32 C 0.8 0.9 nd
nd, not determined; SPSA (specific surface area)

- 71 -
d) Classification:
USDA: Vertic Haplustalf FAO : Vertic Luvisol
Profile 146/3-363
a) Morphology
The A horizon is 15cm thick, very dark, greyish brown (10YR 3/2), clay to clay loam, sub angular blocky or crumb structured and friable. The Bt horizon is 30cm thick, very dark brown (10YR 2/2), clayey, prismatic and firm. The BCk and CB transitional horizons are 52cm thick, dark yellowish brown (10YR 3/4), sandy clay to sandy clay loam and friable. The Bt horizon has continous, moderately thick clay cutans and the BCk horizon thin patchy clay cutans. Few, fine, CaC03 nodules occur within 45cm in the BCk and CB horizons. Cracks starting at 17cm and going down to 45 cm and sometimes to 65 cm are present within the Bt and BCk horizon.
b) Chemical
Horizon Depth X Exchangeable Cations pH (cm) Ca Mg K Na (H20)
"~pH CEC,meq XC BS" (KCl) /lOOgsoil (X)
A 0-15 38.4 24.2 35.6 1.6 1.2 5.é 22.5 0.34 125 Bt 15-45 55.1 28.0 14.7 2.0 6.7 5.2 57.3 0.60 39 BCk 45-79 62.6 19.8 15.5 2.2 7.5 6.1 45.8 0.17 33 CB 79-95 59.1 20.1 18.1 2.6 7.6 6.2 31.6 0.25 47
c) Physical properties
Cliy" Horizon symbol
Depth (cm)
Sand Texture Sand/ Silt ratio
Silt/ Clay ratio
STTF - X -
TT 20 24 28
"O" 1.0 1.4 1.1
"^75" 0.3 0.6 0.6
SPSA clay (m)2/g
"nT nd nd nd
A Bt BCk CB
0-15 15-45 45-79 79-95
26 60 42 42
40 20 34 30
SCL C C C
nd, not determined; SPSA (specific surface area)
d) Classification:
USDA: Vertic Haplustalf FA0 : Vertic Luvisol
3) General properties of the soil mantle
a) Morphological
The soil mantle has the A horizon varying in thickness from the summit to the swale position. It is thickest at the summit (17cm), shallowest at the backslope

position (2cm) and thick again at the swale position. A weakly developed E horizon occurs at the upper backslope position and is not continous within the mantle. The Bt horizon is continous from the summit to the swale position each time prismatic with continous thick clay cutans. It is 27cm thick at the summit, 22-AOcm thick at the backslope, 50cm thick at the footslope and 30cm at the swale position. The transitional BC and CB horizons are also contionous throughout the mantle. The total thickness for the BC and CB horizons is 59 cm at summit, 13-34 cm at the backslope, 49 cm at the footslope and 52 cm at the swale position. The backslope position has burried Bt and CB horizons.
b) Chemical
Ca, Na, pH, and base saturation increase with depth vertically down each profile at all positions except the swale position where only Na shows a similar trend. Mg, K, and %C decrease with depth vertically down each profile at all positions except the swale position where the trend is irregular. The CEC in each case increase from the surface to a maximum in the Bt horizon and then decreases. The lateral pattern does not show a similar trend as the vertical one, Ca is highest at the summit position (58%) and about equal for the rest of the positions varying between 52 and 55%. Mg has an irregular lateral distribution, with 26% at the summit position, 27-32% at the backslope and footslope position and 28% at the swale position. K has a near uniform distribution within the summit and backslope positions and then increases at the footslope position. Na is low at the summit position (2%) increases at the backslope position (10%) and again decreases at the swale position. The pH increases regularly from the summit (6.9) to the footslope position (7.8) and then decreases at the swale position (6.7). %C shows a similar trend from the summit position (6.9) to the footslope position within the Bt horizon and then decreases at the swale position. The base saturation increases also in a simalar trend and decreses at the swale position.
P r o E i l e 146/3-364
9 2P 4P s n 8f> i p n ^
ProElle 146/3-359
l O O
O, 2C—*a KO qn p n v
20.
4 0-
7 0.
ICo .
•i
1.TO.
fng ƒ k Nq
P r o f i l e 146/3-360
O, 20 4P s n nn ipo?f
2 0
4 0 .
6 O
8 Q
I.V.
110
mg Na
i
Fig1?- Distribution trend of exchangeable Ca, Mg, K and Na down the toposequence

- 73 -
c) Physical
The clay increases vertically with depth within each profile at all positions. In each case the clay increases to a maximum in the Bt horizon then decreases in the CB horizon. The silt/clay ratio reduces from the surficial horizons to the Bt horizons where it attains minimum values then it increases again in the CB horizon. Laterally the dynamics within the Bt horizon shows a near equal distribution of clay throughout all the positions except the footslope positon where it increases to 66* from the normal trend of 60£. Sand contents decrease regularly within the CB horizon from the summit position to the swale position, sand/silt ratio has a similar trend down the toposequence.
TRANSECT 2
»««'3-36 . <«6''3-359 ».«'3 360
Fig13, Textural variation within the toposequence from the summit to the swale position.
4) Interpretation
The thinning of the A horizon at the backslope position in comparison to the summit position is due to steeper slopes and lateral truncation dominating over vertical soil forming processes. The thicker A horizon on the footslope and swale position is a result of material being removed from the higher backslope position and deposited at these positions. In fact profile 146/3-359 is located 10 metres below an erosional step supporting the observation on truncation at this topographic position.
The thickenning of the Bt horizon from the summit to the footslope position could be explained by translocation of clay within the soil mantle is both vertically and laterally. Therefore the lower positions receive clay both from the surface horizons and from the higher slope positions. The posibility of

- 74 -

neoformation of clay should be considered also. Though X-ray analysis does not show the presence of smectite type clays there is a clear indication of their presence from the cracking of the soil material.
The profile at the swale' position shows different due to instability of soil development caused by periodical influx of material from the higher positions and seasonal fluctuations of the water table.
TRANSECT 3: MASAI LOMANERA TOPOSEQUENCE
1) Setting of the toposequence
a) Environment
The toposequence is located 2.2 km southwestsouth of Lekanga Hill, 15.5 km westnorthwest of Maji Moto trading centre. Is is situated at an elevation of 1865 metres above mean sea level with an annual precipitation of 500-600mm. It located on a glacis relief within a piedmont landscape running from the apex to the distal parts. The slope is south facing and is 1,200 metres in length from the apex to the floodplain. The relief intensity is 4 metres and the slope gradient is 1:300. The configuration is generally straight-concave and the vegetation is short grassland consisting of Pennisetum mezianun and Digitaria milanjiana with isolated trees of Boscia augustifolia and Balanites aegyptiaca. The parent material consists of Quarternary volcanic tuff mixed with colluvial material from the hilly relief and with aluvial material on the lower slopes.
b) Position of the profiles
Three profile are located on the toposequence. Profile 146/3-354 occupies the higher apex position, profile 146/3-355, the midslope position and profile 146/3-356 the lower floodplain position.
2) Soil properties, classification and distribution
Profile 146/3-354 on the apex classifies as Typic Natrustalf, 146/3-355 on the lower midslope position as Aquic Natrustalf and the one on the floodplain as Typic Haplustalf.
Profile 146/3-354
a) Morphology
The A horizon is 22 cm thick, dark yellowish brown (7.5YR 3/4) to dark brown (10YR 4/3), silty clay to sandy clay loam, sub angular blocky and friable. The E horizon is 10 cm thick, dark brown (10YR 3/3) silty clay to loam, weak sub angular blocky and friable. The Bt horizon is 16 cm thick, dark reddish brown (5YR 2.5/2) i clayey, prismatic and friable. The transitional BC and CB horizon is 48 cm thick, dark yellowish brown (10YR 4/4) to dark brown (7.5YR 4/4), sandy clay loam to loamy sand, stratified and friable. The Ec horizon has few fine concretionary iron and manganese nodules. Horizons BC and CB have few, fine to medium CaC03 nodules.

b) Chemical
Horizon Depth X Exchangeable Cations pH (cm) Ca Mg K Na (H20)
~pH CEC,meq fC BS" (KCl) /lOOgsoil (%)
Al 0-12 33.3 30.9 30.9 4.8 6.7 5.0 23.5 1.17 18 A2 12-22 34.0 22.6 30.2 13.2 6.8 4.8 22.5 0.92 24 Ec 22-32 38.4 18.3 26.5 16.9 6.7 5.0 30.0 0.95 36 Bt 32-48 37.3 15.4 30.1 17.1 6.5 5.6 47.0 0.52 62 BC 48-59 33.3 14.4 29.5 22.8 7.7 6.2 34.8 0.96 92 CBk 59-96 34.5 13.9 29.5 22.1 8.6 6.4 32.5 0.52 104 C 96+ 33.3 11.1 30.2 25.2 8.5 6.5 31.3 0.52 103
c) Physical
Silt - X -
Sand Texture Sand/ Silt ratio
"sTTtT" Clay ratio
Horizon symbol
ÀT~ A2 Ec Bt BC CBk C
Depth (cm)
Clay
X" 8 .5 .3
SPSA clay (m)2/g
"nT nd nd nd nd nd nd
0-12 12-22 22-32 32-48 48-59 59-96 96+
30 32 42 42 20 12 12
34 28 20 12 16 10 10
36 40 38 46 64 78 78
CL CL C SC SCL/SL SL SL
0.8 0.8 0.8
nd, not determined; SPSA (specific surface area)
d) Classification:
USDA: Typic Natrustalf FAO : Gleyic Solonetz
Profile 146/3-355
a) Morphology
The A horizon is 8 cm thick, dark brown (10YR 3/3) clay loam, sub angular blocky and friable. The Eg horizon is 8 cm thick, dark brown (10YR 3/3), clay loam, sub angular blocky and friable. The Bt horizon is 14 cm thick, dominantly black (10YR 2/1) with dark brown (10YR 3/3) in ped colour, clayey, prismatic and friable. The BC horizon is 16 cm thick, dominantly dark brown (10YR 3/3), sandy clay loam, stratified with clay skins in pores and is friable. The burried Ecb, Btcb and CB horizons form an older peneplanation surface upon which ash was deposited and soil development started afresh. Though micromorphological information is not available, the Ecb horizon could actually be an ash layer mistaken for a genetic horizon for its colour semblance with an E horizon. Presence of clay within it indictes its relative porosity during clay pervection an indicator of different periods of soil formation. Iron and manganese nodules occur from a depth of 12 cm, within the Eg horizon to the remainder of the profile downwards.

- 77 -
Fig 15- Photograph showing profile 146/3-355
b) Chemical
H o r i z o n Depth z Exchangeable Cations pip (cm) Ca Mg K Na (H20)
lx pH CEC,meq (KCl) /lOOgsoil
BS (*)
A 0-12 50.3 25.8 20.2 4.3 6.3 4.7 25.3 2.38 42 Eg 12-20 53.6 18.2 20.9 7.2 6.6 4.6 23.0 1.02 29 Bt 20-34 52.6 14.2 17.4 15.7 7.4 5.5 30.5 1.02 75 BC 34-50 51.7 13.0 17.7 18.0 8.4 6.9 23.3 0.65 105 Ecb 50-67 52.4 13.4 17.2 17.2 8.2 6.9 21.5 0.67 99 Btcb 67-96 44.1 11.8 20.2 23.9 7.7 6.2 24.2 0.38 97 CB 96+ 35.8 8.8 28.4 27.4 8.3 6.6 11.6 0.09 111


^ T8 -
c) Physical
Horizon Depth Clay Silt Sand Texture Sand/ Silt/ SPSA symbol (cm) X - Silt
ratio Clay ratio
clay (m)2/g
A 0-12 kl 32 26 C 0.8 1.8 379 Eg 12-20 44 30 26 C 0.9 1.8 244 Bt 20-34 58 16 26 C 1.6 0.2 404 BC 34-50 36 30 34 CL 1.1 1.3 503 Ecb 50-67 38 30 32 CL 1.0 1.2 442 Btcb 67-96 48 24 28 C 1.2 0.5 480 CB 96+ 14 14 72 SL 5.1 1.2 967
nd, not determined; SPSA (specific surface area)
d) Classification:
USDA: Aquic Natrustalf FAO : Gleyic Solonetz
Profile 146/3-356
a) Morphology
The AB horizon is 14 cm thick, dark brown (10YR3/3), clay loam, sub angular blocky and friable. The Bt horizon is 17 cm thick, dark brown (10YR 3/3), clay loam and friable. The rest are layers of material deposited either from ash falls or fluviatile conditions in different episodes. The C2 horizon has very few, fine to medium CaC03 nodules.
b) Chemical
Horizon Depth % Exchangeable Cations pH (cm) Ca Mg K Na (H20)
pH CEC,meq %~C BS~ (KCl) /lOOgsoil (%)
AB 0-14 43.3 25.3 26.6 4.3 7.0 5.8 30.0 0.81 42 Bt 14-31 39.6 31.7 16.8 11.4 7.1 5.5 45.7 0.95 22 BC 31-48 40.0 25.0 16.9 18.1 7.6 5.8 29.9 0.97 54 2CB1 48-54/61 46.5 21.5 7.4 24.4 8.1 6.0 38.5 0.79 66 2CB2 54/61-75 37.7 15.2 18.1 28.8 8.4 6.4 35.0 0.71 79 3CB 75-82 35.8 13.2 21.2 29.6 8.8 6.4 32.5 0.67 97 CI 82-90 41.6 15.5 29.3 13.6 8.7 6.5 27.0 0.57 117 C2 90-98 35.3 13.5 22.1 29.2 8.9 6.6 28.8 0.31 137

_ 19 -
c) Physical
Horizon Depth Clay Silt Sand Texture Sand/ Silt/ SPSA symbol (cm) — X — Silt
ratio Clay ratio
clay (m)2/g
AB 0-14 34 42 24 CL 0.6 1.2 nd Bt 14-31 50 32 18 C 0.6 0.6 nd BC 31-48 34 20 46 SCL 2.3 0.6 nd 2CB1 48-54/61 40 28 32 C/CL 1.1 0.7 nd 2CB2 54/61-75 36 18 46 SL 2.6 0.5 nd 3CB 75-82 24 18 58 SCL 3.2 0.8 nd Cl 82-90 12 22 66 SL 3.0 1.8 nd C2 90-98 14 20 66 SL 3.0 1.4 nd
nd, not determined; SPSA (specific surface area)
d) Classification:
USDA: Typic Haplustalf FA0 : Orthic Luvisol
3) General properties of the soil mantle
a) Morphological
The soil mantle has the A horizon decreasing in thickness from the apex down to the lower slope positions. At the lowest position most ot the upper A horizon is truncated leaving an AB horizon. The E horizon only occurs within the upper and middle positions but lacks in the lowest position. The Bt horizon is continous from the higher positions to the lowest position. It is 16 cm at the apex, thins to 14 cm in the mid position and thickens again to 17 cm at the lower floodplain position. The lower topographic position has layers of sub aerial and fluviatile deposits. The upper position is mainly on tuff.
b) Chemical
Mg and Na show regular vertical distribution patterns within the profiles at each of the positions. Mg decreases down the profile while sodium shows an opposite trend. Ca has a near equal distribution through each of the profiles with maximum concentration at the midslope position. Generally Ca is more at the midslope position and lowest at the highest position. Mg is has the highest concentration at the summit position and nearly equal for the two lower positions. Na is more at the lowest position and less at the summit position. Carbon in the top soils is higher at the midslope position than the summit and the lower floodplain position. It decreases regularly with depth down each profile at the higher positions *nd irregularly at the floodplain position. The base saturation increases vertically with depth and laterally from the summit position to the floodplain position.

Profile 146/3-354 Profile 146/3-355
0 , K . '?
2 0 / /
Ca \ M g K /rta
4 O
/ /
6 O / /
B O
«to ; ]
( > . . « . ii
2 0 | j I
Ca Mg
\ Ala
4 0
6 O
BO
/ / i i n n I J /
Profile 146/3-356
Fig 16... Lateral variation of the percentage exchangeable cations from the apex to the floodplain position.
c) Physical
Clay increases from the apex to the midslope position and then decreases again at the floodplain position. Sand/silt ratio decreases regularly from the summit position to the floodplain position.
Fig 17. textural variation within each profile from the apex position to the lower floodplain position.

Û_ Q O O
LU CL
9 CO û
DC LU
Q
x LU û. <
CO 3 _ l CL < X
o CL
>
O CO
> 3
O X h-cc o
fï INI H
CO LU ~> ^ nr C) i— _1 5 o z CO
O o 3 O
>
< o
ï CO 3 CC
< z
LU
9 o co o
9. > LU _ l O
CL >-
E c
o o co
o o CNJ
o o
0) ü c d>
8 a o
2 CD C CO E o
CO co co
CU
s O r"
CU o c <u 3 CT CD W
5 CO
có h-
• • < * o ID LU co co e? z
< LX
co *— O l

_ 82 -
4) Interpretation
The lack, of uniformity in the parent material distribution along the 'toposequen-ce accompanied by little relief intensity makes the vertical and lateral variations difficult to interpret. However, there is migration of the more mobile cations down the soil mantle. The pattern given by Na in its vertical distribution suggests that percolating water is limited. Due to little relief intensity and limited soil moisture most processes of soil formation take place vertically and the lateral dynamics is minimal. From the depth of the A horizon at the apex to the lower position, truncation proceeds backwards from the river channel forming concave slopes.
TRANSECT 4: THE MAJI MOTO TOPOSEQUENCE
1) Setting of the toposequence
a) Environment
The transect is located 5.2 km northwest of Maji Moto trading centre at an elevation of 1900 metres above mean sea level. The slope configuration is convexo-straight, located on a glacis relief within the plain landscape. The slope is north facing with a total length of 2,000 metres from the summit to the footslope. The relief intensity is 15 metres and the parent material is mainly Quarternary tuff deposits. The vegetation is a dwarf shrub grassland which has degraded into mostly bare soil with patches of Justicia eliotii still littering the surface.
b) Position of the profiles
Three profile pits are located on the toposequence, one on the summit, one on the midslope and one on the footslope position. Profile 146/3-362 occupies the summit position, 146/3-361 the midslope position and 146/3-365 the footslope position.
2) Soil properties, classification and distribution
The profile on the summit position classifies as Ustic Torriorthent the one on the midslope as an Aquic Haplustalf and the one on the footslope position also as an Aquic Haplustalf.
Profile 146/3-362
a) Morphology
The A horizon is 12 cm thick, dark yellowish brown (10YR 3/4), clay loam, sub angular blocky and friable. The Bcw horizon varies in thickness between 3 and 11 cm, it is wavy, dark brown (7.5 YR 3/2), sandy clay, weakly structured with common, fine, concretionary, iron and manganese nodules. The C horizon is 62 to 70 cm in thickness, comprised mostly of dark yellowish brown (10YR 4/4), gravelly material.

- 83 -
b) Chemical
Horizon Depth X Exchangeable Cations pH pH CEC,meq £C BS (cm) Ca Mg K Na (H20) (KCl) /lOOgsoil (%
 0-12 40.8 5274 26"78 476 676 5~77 237? Ö763 3T Bcw 12-15/23 39.6 27.7 28.7 3.8 6.8 5.5 27.5 0.48 37 C 23-83 54.8 31.7 15.9 2.9 6.7 5.3 30.0 1.39 42
c) Physical
Horizon Depth Clay Silt Sand Texture Sand/ Silt/ SPSA symbol (cm) X Silt Clay clay
ratio ratio (m)2/g
Ä Ö^Ï2 2"8 2"6" 4*6 SUL O T75 nd" Bcw 12-15/23 32 26 42 CL 1.6 1.8 nd C 23-83 38 32 30 CL 0.9 1.6 nd
nd, not determined; SPSA (specific surface area)
d) Classification:
USDA: Ustic Torriorthent FA0 : Dystrie Cambisol
Profile 146/3-361
a) Morphology
The A horizon is 20 cm thick, dark brown (10YR 3/3) to dark yellowish brown (10YR 3/4), clay loam, sub angular blocky and friable. The Egc horizon is 15 cm thick, dark greyish brown (10YR 4/2), clay to sandy clay, weak prismatic to sub angular blocky and friable. The Bt horizon is 25 cm thick, very dark brown (10YR 2/2), clayey, prismatic and friable. The Be horizon is 7 cm thick, domina-ntly dark yellowish brown (10YR 3/6), sandy clay, stratified and friable. Concretionary iron and manganese nodules are present in the Al, Egc and the BC horizons.
b) Chemical
Horizon Depth X Exchangeable Cations pH pH CEC,meq XC BS (cm) Ca Mg K Na (H20) (KCl) /lOOgsoil (S)
Al 0-13 40.9 36.4 17.0 5.3 7.6 5.6 27.5 1.04 32 A2 13-20 42.4 32.9 20.0 4.2 7.6 5.2 31.5 0.66 27 Egc 20-35 55.6 27.8 9.3 8.1 7.4 5.0 26.8 0.38 20 Bt 35-60 51.9 23.1 20.5 4.7 7.0 5.5 51.1 0.43 53 BC 60-67 48.8 27.2 19.2 4.5 7.2 5.4 53.7 0.36 39 CB 67-87 44.6 21.6 26.7 7.4 6.8 5.7 42.0 0.10 88 C 87+ 47.4 20.0 25.0 7.8 7.0 6.1 38.0 0.05 100

- 84 -
c) Physi cal r.
Horizon Depth Clay Silt Sand Texture Sand/ Silt/ SPSA symbol (cm) — X — Silt
ratio Clay ratio
clay (m)2/g
Al 0-13 36 32 32 CL 1.0 0.9 nd A2 13-20 40 28 32 C/CL 1.1 0.7 nd Egc 20-35 38 26 36 CL 1.4 0.7 nd Bt 35-60 66 10 24 C 2.4 0.2 nd BC 60-67 46 28 26 C 0.9 0.6 nd CB 67-87 14 10 76 SL 7.6 0.7 nd C 87+ 6 8 86 LS 10.6 1.3 nd
nd, not determined; SPSA (specific surface area)
d) Classification:
USDA: Aquic Haplustalf FA0 : Solodic Planosol
Profile 146/3-365
a) Morphology
The A horizon is 22 cm thick, very dark brown (10YR 2/2) to very dark greyish brown (10YR 3/2), clay loam, sub angular blocky and friable. There is a transitional AE horizon 8 cm thick, dark brown (10YR 3/3), sub angular blocky and friable. The Egc horizon is 12 cm thick, dark greyish brown (10YR 4/2), silty clay loam, sub angular blocky and friable. The Bt horizon is 22 cm thick, dark brown (10YR 3/3), clayey-, prismatic and friable. The C horizon is yellowish brown and brittle. Concretionary iron and manganese nodules are present in the AE and Egc horizons.
b) Chemical
Horizon Depth % Exchangeable Cations pH (cm) Ca Mg K Na (H20)
pH CEC,meq (KCl) /lOOgsoil
%C BS (*>
Al 0-9 37.1 36.1 19.6 4.9 6.9 é.o 22.5 0.95 43 A2 9-22 41.8 30.4 20.3 7.6 7.3 5.4 24.0 0.40 33 AE 22-30 41.3 29.3 22.7 6.9 6.9 5.0 23.6 0.54 32 Egc 30-42 41.6 24.8 25.7 8.0 7.2 5.1 23.5 0.37 48 Bt 42-64 43.2 20.0 23.7 13.3 7.2 5.3 33.7 0.36 56 C 64+ 45.7 13.1 25.7 15.3 7.3 6.1 28.7 0.14 85

- 85 -
c) Physical
Horizon Depth • Clay Silt Sand Texture Sand/ Silt/ SPSA symbol (cm) — % — Silt
ratio Clay ratio
clay (m)2/g
Al 0-9 28 34 38 CL 1.1 1.2 nd A2 9-22 32 30 38 CL 1.3 0.9 nd AE 22-30 36 28 36 CL 1.3 0.7 nd Egc 30-42 30 32 38 CL 1.2 1.1 nd Bt 42-64 44 22 34 C 1.5 0.5 nd C 64+ 24 18 58 SCL 3.2 0.8 nd
nd, not determined; SPSA (specific surface area)
d) Classification:
USDA: Aquic Haplustalf FAO : Gleyic Luvisol
3) General properties of the soil mantle
a) Morphological
The A horizon is continous throughout the soil mantle having lighter colours at the higher slope positions and getting darker towards the lower positions. It is 12 cm thick at the summit, 20 cm thick at the midslope and 22 cm at the footslo-pe. The E horizon starts at the midslope position and continues through to the footslope position. The E horizon is lighter textured at the midslope position than at the footslope. The B horizon though continous, is cambic at the summit and abrupto-argillic at the midslope and footslope positions. There are transitinal horizons at the midslpe position which are lacking at the summit and footslope positions. Though the argillic horizons are prismatic with high clay contents they easily slake on the addition of water and are friable when moist.
b) Chemical
Ca at all positions show a vertical increase down the profile and decrease down the slope. Na has a vertical increase down the profiles except at the summit position where it has an irregular distribution. Laterally it increases downslope with the highest amounts at the footslope position. Mg decreases down each profile except the highest profile where it has an irregular distribution. Laterally it shows some increase downslope with the. highest amounts at the footslope position. K shows different distribution patterns at all the positions with the profile at the highest position showing an increase towards the surface the middle profile having an irregular distribution and the lowest profile having a regular increase down the profile. Laterally K has a near equal distribution at all the positions. The pH has uniform distribution patterns through each profile with only minor variations. Laterally the pH is higher at midslope position and the lowest position. Organic carbon has a regular distribution pattern in the two lower profiles each time decreasing with depth and an irregular distibution in the highest profile. Laterally it is highest in the topsoil at the midslope position being low at the two other postions. Base saturation in each case increases with depth at all the positions with no prefered lateral pattern. CEC like in the other profiles show a maximum in the Bt horizons decreasing each time after the Bt horizon.

- 86 -
Profile 146/3- 362
c J 20 4P 60 9P 100*
10
20-
30 Ca |M9 1 K V a
4& 1 \ 50
60 \
70 \ \
80
no 1 \ \
P r o f i l e 1 4 6 / 3 - 3 6 1
? 2ß— jù fiß pn »no%
P r o f i l e 1 4 6 / 3 - 3 6 5
9 ., 5(1 . , 1QQ%
9(>
Fig T. Lateral and vertical variations of the exchangeable cations from the summit to the footslope position.
c) Physical
Clay increases down each profile at all positions to a maximum in the Bt horizon except on the summit postion where the Bt horizon is lacking. It is strange that the highest percentage of clay at the summit position is in the C horizon a horizon also having the highest percentage carbon. Laterally the highest clay percentage is at the midslope position and silt is highest in the A and E horizons and lowest in the C horizons except the summit position where silt is highest in the C horizon. Sand in ecah case is highest in the CB and C horizons except on the summit position where it is highest in the A horizon.
TBA eECT *
W6/3 - 3«?
Fig 20. Textural variations within the toposequence from summit to footslope position.

- 87 -
0 } * - * ^ a —. C o -^ S>»
>, <c 03 -O 5 « o H
«i ^H * i o CC « O w C
I

- 88 -
4) Interpretation
Though the profile at the lowest position is shallower than the one at the midslope position, most topsoil development occurs at this point as shown by the thicker topsoils. This may be due to gentler slopes and higher moisture allowing for the incorporation of organic carbon at or material being brought from the upslope position to this point. Only Na is observed amongst the exchangeable cations to migrate downslope, the rest having relative accumulation upslope or are irregularly distributed. pH increases downslope due to the migration of Na. The vertical distribution of the cations shows a regular pattern because the vertical processes are dominant over the lateral ones. This is caused by climatic conditions with low effective precipitation. Lack of cracks within the toposequence suggests that no smectite clays are present or formed at the lower positions. The lowering of the depth of the Bt horizon downslope suggests that not enough clay material comes from the upslope position to build the Bt horizon towards the surface.
The midslope position seems to be the most stable point of the toposequence having the highest accumulation of clay in the Bt horizon. This conditions the formation of a Planosol, though the Egc horizon has a relatively high clay content when compared to the lower profile. Strong truncation at the summit results into shallow profiles. The material from this position collects at the midslope and as indicated by the thickness of the A horizon. The lowest position undergoes continuous truncation by interlacing water ways.
TRANSECT 5: ANGATA LOITA TOPOSEQUENCE
1) Setting of the toposequence
a) Environment
The toposequence is located 9.2 km northeast of 01 Doinyo Narasha Hill, on the left side of track connecting Ngore Ngore and Osilalei. It is located at 1920 metres above mean sea level in agroclimatic zone V with an annual precipitation of 500-600 mm. The slope configuration is convex-straight-concave, and the total length from the summit to the swale is 2,000 metres. It is a south facing slope with an intensity of 17 metres. It is covered by a dwarf shrub grassland on the summit currently being encroached by bushland due to selective grazing by domestic animals and wildlife. The dominant shrub species are Justicia eliotii, and the grass species are Digitaria milanjiana and „ Cynodon dactylon. The midslope is covered by bushed grassland of Acacia drepanolobium and Cynodon Dactylon with Justicia eliotii and Sida Cuneifolia as the shrub species. The lower slopes and the swale position is covered by grasslands dominated by Kyllinga bulbosa and Eragrostis exasperata (short grass). The parent material is Quarternary volcanic ash and tuff. The toposequence is located on a mesa relief.

Fig 22. Photograph showing dwarf shrub grassland covering the summit of the toposequence.
b) Position of the profiles
There are three profiles within the toposequence. One on the summit position, one on the backslope position and one on the swale postion. profile 146/1-371 occupies the summit position, 146/1-372 the backslope position and profile 146/1-370 the swale position.

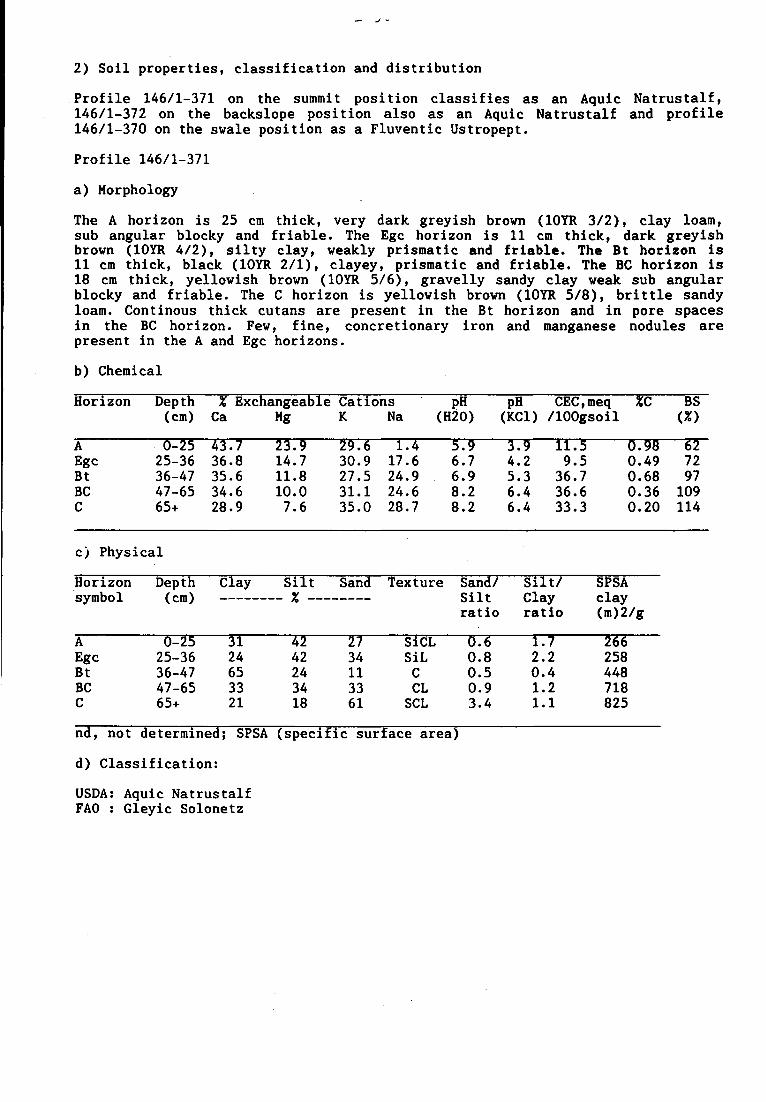
2) Soil properties, classification and distribution
Profile 146/1-371 on the summit position classifies as an Aquic Natrustalf, 146/1-372 on the backslope position also as an Aquic Natrustalf and profile 146/1-370 on the swale position as a Fluventic Ustropept.
Profile 146/1-371
a) Morphology
The A horizon is 25 cm thick, very dark greyish brown (10YR 3/2), clay loam, sub angular blocky and friable. The Egc horizon is 11 cm thick, dark greyish brown (10YR 4/2), silty clay, weakly prismatic and friable. The Bt horizon is 11 cm thick, black (10YR 2/1), clayey, prismatic and friable. The BC horizon is 18 cm thick, yellowish brown (10YR 5/6), gravelly sandy clay weak sub angular blocky and friable. The C horizon is yellowish brown (10YR 5/8), brittle sandy loam. Continous thick cutans are present in the Bt horizon and in pore spaces in the BC horizon. Few, fine, concretionary iron and manganese nodules are present in the A and Egc horizons.
b) Chemical
Horizon Depth % Exchangeable Cations pH (cm) Ca Mg K Na (H20)
pH CEC,meq (KCl) /lOOgsoil
XC BS (%)
A 0-25 43.7 23.9 29.é i.4 5.9 3.9 li.5 0.98 é2 Egc 25-36 36.8 14.7 30.9 17.6 6.7 4.2 9.5 0.49 72 Bt 36-47 35.6 11.8 27.5 24.9 6.9 5.3 36.7 0.68 97 BC 47-65 34.6 10.0 31.1 24.6 8.2 6.4 36.6 0.36 109 C 65+ 28.9 7.6 35.0 28.7 8.2 6.4 33.3 0.20 114
c) Physical
Depth (cm)
Clay Sand Texture Sand/ Silt/ SPSA Silt Clay clay ratio ratio (m)2/g
Horizon symbol
Silt - X -
3T 24 65 33 21
42 24 34 18
17" 34 11 33 61
SiCL SiL C CL SCL
"076~ 0.8 0.5 0.9 3.4
2.2 0.4 1.2 1.1
T6T 258 448 718 825
A Egc Bt BC C
0-25 25-36 36-47 47-65 65+
nd, not determined; SPSA (specific surface area)
d) Classification:
USDA: Aquic Natrustalf FA0 : Gleyic Solonetz

- 91 -
Profi le 146/1-372
a) Morphology
The A horizon is 22 cm thick, dark, brown (10YR 3/3), clay loam, sub angular blocky and friable. The Eg horizon is 9 cm thick, dominantly dark greyish brown (10YR 4/2), silty clay, weakly prismatic and friable. The Btl horizon is 11 cm thick, black (10YR 2/1), clayey, prismatic and friable. The Bt2 horizon is 10 cm thick, dark brown (7.5YR 3/2), prismatic and friable. The BC horizon is 24 cm thick, brown to dark brown (7.5YR 4/4), brittle sandy loam. The C horizon is dark brown (7.5YR 3/4) brittle loamy sand. The Btl and Bt2 horizons have continous moderately thick clay cutans. Concretionary iron and manganese nodules occur in the A, Eg and Btl horizons and are mostly abundant in the Eg horizon and few in the A and Btl horizons.
b) Chemical
Horizon Depth % Exchangeable Cations pH (cm) Ca Mg K Na (H20)
"~p CEC,meq EC BUT (KCl) /lOOgsoil (£)
A 0-22 45.3 21.1 29.3 2.7 5.9 4.1 12.1 1.4Ô 62 Eg 22-31 32.1 11.9 31.0 23.8 6.7 4.6 10.4 0.65 81 Btl 31-42 28.0 9.3 27.5 35.5 7.1 5.4 36.1 0.83 104 Bt2 42-52 31.9 9.5 26.0 32.7 7.7 5.8 42.2 0.63 109 BC 52-76 28.0 9.5 26.0 32.5 8.5 6.4 38.0 0.27 111 C 76+ 25.4 6.3 32.5 35.8 8.6 6.6 36.0 0.17 110
c) Physical
Clay TTTF - % -
Sand Texture Sand/ Silt ratio
Silt/ Clay ratio
Horizon symbol
Depth (cm)
SPSA clay (m)2/g
30" 39 13 8 25 45
SiCL SiL C C SiCL L
"DT 0. 0. 0. 0. 1.
T. 2. 0. 0. 0. 1.
"2W 311 443 516 619 791
A Eg Btl Bt2 BC C
0-22 22-31 31-42 42-52 52-76 76+
28 22 66 64 39 26
42 39 21 28 36 29
nd, not determined; SPSA (specific surface area)
d) Classification:
USDA: Aquic Natrustalf FA0 : Gleyic Solonetz
Profile pit 146/1-370
a) Morphology
The A horizon is 10 cm thick, very dark greyish brown (10YR 3/2), clay loam, sub angular blocky and friable. The Egc horizon is 18 cm thick, dark greyish

brown (ÏOYR 4/2), weakly prismatic and friable. The Bt horizon is 25 cm thick, dominantly very dark brown (10YR 2/2), clayey, prismatic and friable. The BC horizon is 26 cm thick, very dark brown (10YR 2/2), sandy clay, prismatic and friable. The Btb horizon is 18 cm thick, dominantly dark greyish brown (lOYr 4/2), sandy clay to sandy clay loam, sub angular blocky and friable. The Bt horizon has continous to moderately thick to thick clay cutans and BC horizon moderately thick patchy cutans. Horizons Egc, Bt, BC, and Btb have few, fine, concretionary iron and manganese concretions.
T -•* • - * f 4
_ • • -
pigZJ. photograph showing profile 146/1-370


- a J
b) Chemical
Horizon Depth X Exchangeable Cations pH (cm) Ca Mg K Na (H20)
pH CEC,meq fC BS~ (KCl) /lOOgsoil {%)
A 0-10 61.1 19.7 18.2 1.5 6.1 4.9 21.2 2.63 94 Egc 10-28 61.1 13.8 21.6 4.2 6.6 4.8 18.4 0.89 91 Bt 28-53 65.0 4.9 19.6 10.3 8.2 7.1 29.7 0.36 166 BC 53-79 60.5 8.2 21.4 10.0 7.3 5.7 25.6 0.75 110 Btb 79-97 52.8 5.6 25.8 15.5 7.9 6.6 27.2 0.37 118 C 97+ 39.7 4.5 32.6 23.3 8.0 6.4 41.7 0.01 126
c) Physical
Silt/ Clay ratio
Horizon symbol
Depth (cm)
Clay Silt - % -
Sand Texture Sand/ Silt ratio
0-1Ô 10-28 28-53 53-79 79-97
97+
TT 36 33 48 40 20
"43" 38 28 29 37 40
SiCL SiCL CL C SiCL SCL
TT. 0. 1. 0. 0. 1.
SPSA clay (m)2/g
~4"0T 354 608 455 480 1372
A Egc Bt BC Btb C
18 26 39 23 23 40
T. 1. 1. 0. 2. 0.
nd, not determined; SPSA (specific surface area)
d) Classification:
USDA: Fluventic Ustropept FAO : Gleyic Cambisol
3) Properties of the soil mantle
a) Morphological
The A horizon reduces in thickness from the summit position through the midslope position to the footslope position. The texture from the summit to the footslope position for the A horizon is clay loam. In all three positions there is an E horizon slightly thicker at the summit reducing in thickness at the midslope position and increasing in thickness again at the footslope position. The summit position and the footslope positions have higher clay contents in the E horizon than the midslope position. Also present is a continous Bt horizon with contino-us moderately thick to thick clay cutans. The Bt horizon is 11 cm thick at the summit position increases to 22 cm at the midslope position and further increases to 25 cm at the footslope position. Transitional BC horizon is also continous throughout the mantle with 18 cm at the summit, 24 cm at the midslope and 26 cm at the footslope position. The E horizon at all positions have concretionary iron and manganese nodules.

- 94 -
b) Chemical
Ca and Mg in each case decrease vertically with depth. Na and K inverse trend by increasing regularly with depth at each position, higher concentrations of Ca occur at the footslope than the two higher with almost an equal concentration. Na increases to a maximum at the and decreases again at the footslope position. The pH in each case vertically down with depth but shows no prefered lateral distribution, like on the other transects increase to a maximum in the Bt horizon decrease again in the subsoil. The base saturation also increases with depth and shows no prefered lateral distribution.
show an Laterally positions midslope increases , The CEC and then regularly
P r o f i l e 1 4 6 / 1 - 3 7 1
O 20 40 ra 8D on«;.
10
ca mg k , *a 3 0
/ / / 50
7 a h J
P r o f i l e 146 /1-372
P.O 4n fin Bfi ton?.
Profile 146/1-370
2D 40 6 1 Y1 nrrt«.
1 0
ca mç / k Na
3 0
5 0
)
[
7 0
9 0
s* I J Fig 24. The trend in lateral and vertical distribution of the exchangeable cations.
c) Physical
The A and E horizons are lighter in texture having lost most of the clay to the Bt horizon. The difference in clay contents between the E and the Bt horizon is an average of 42% for the two higher horizons and 12 for the lower lying profile. The clay contents in the Bt horizon in the summit and the midslope are about equal at an average of 65%. Silt : clay ratios are high in the topsoils increasing in the E horizons and reducing drastically in the Bt horizon. The ratios increases slightly in the transitional and the C horizon. The silt : clay distribution down the mantle is about uniform except in the lower position where there is an irregular distribution. The sand : silt ratio for the C horizons is highest at the summit position reducing at the midslope position and then increasing again at the footslope position.

- yb -

- 96 -
Fig 26. Vertical and lateral textural variation within the toposequence.
A) Interpretation
The reducing thickness of the A horizon downslope is due to a denudational process truncating the relief backwards from the swale position forming concave slopes at the lower positions. The thicker A horizon at the summit position is a result of more stable condition for soil development with little removal of material by erosion. The result is more leaching and eluviation of the surface horizons to form thick, lighter textured topsoils. The midslope though sloping is protected from truncation by dense vegetative cover and therefore only slight truncation of the topsoil occur. Less vegetation and frequent animal transit at the swale position makes it the most vulnerable to degradation and as a result shallower A horizons are formed. The thicker E horizon at the summit position is a result of lateral translocation of clay as conditioned by topography to the lower positions. A similar process occurs for the Bt horizon which shows a similar trend. Therefore the soils at the lower positions accumulate more clay at the expense of those at the higher positions. The high clay contents in the Bt horizons are results of pervection since silt is observed to concentrate in the eluvial horizons.
TRANSECT 6: SAROVA TOPOSEQUENCE
1) Setting of the toposequence
a) Environment
The toposequence is located across the Narok to Keekorok road 1 km south of the Shangalara river and 50 metres north of Kisheimaraak river. It is a south facing slope situated on a mesa relief with a convexo-straight slope. The total

slope length from the summit to the footslope is 1,000 metres with a relief intensity of 10 metres. The parent material is mainly an admixture of colluvio-aluvial material with Qurternary ash deposits. It is under agroclimatic zone IV with an annual precipitation of 600-700 mm. It is covered by a typical edaphic vegetation of medium grasslands dominated by Pennisetum mezianum and Themeda triandra. The absence of woody vegetation is due to poor soil drainage.
b) Position of the profiles
There are three profile located on the toposequence, one on the summit, one on the midslope and one on the footslope. Profile 146/3-366 is on the summit position, 146/3-367 on the midslope position and 146/3-368 on the footslope position.
2) Soil properties, classification and distribution
Profile 146/3-366 on the summit position classifies as a Typic Argiustoll, 146/3-367 on the midslope position as a Typic Haplustalf, and 146/3-368 on the footslope position as a Vertic Haplustalf.
Profile 146/3-366
a) Morphology
Horizon A is 18 cm thick, very dark brown (10YR 2.5/2), clay structured and friable. Horizon Btl is 11 cm thick, very dark brown clayey, weakly prismatic and friable. Horizon Bt2, is 17 to 21 cm dark brown (10YR 2/2), clayey, prismatic and firm. Horizon BCk is thick, dark brown (7.5YR 3/2), clayey, angular blocky and friable, is porous with a dark yellowish brown colour. Continous, thick occur in the Btl and Bt2 horizons. Soft powdery lime is present in CBk horizons.
loam, crumb (10YR 2/2), thick, very 20 to 24 cm Horizon CBk clay cutans the BCk and
b) Chemical properties
Horizon Depth % Exchangeable Cations pH (cm) Ca Mg K Na (H20)
pïï CEC,meq EU BS" (KCl) /lOOgsoil (%)
A 0-18 53.6 21.4 24.4 0 6.6 5.1 17.7 1.47 95 Btl 18-29 52.9 19.7 27.7 0 6.9 5.2 22.9 1.11 104 Bt2 29-46/50 49.7 17.5 31.4 5.5 7.2 5.4 36.9 0.88 98 BCk 46/50-70 58.4 13.3 28.5 5.8 8.1 6.7 40.7 0.84 128 CBk 70+ 72.4 7.8 19.3 5.3 8.5 7.3 29.8 0.41 254
c) Physical properties
Horizon symbol
Clay Silt Sand Texture "sTTtT" Clay ratio
Depth (cm)
Sand/ Silt ratio
SPSA clay (m)2/g
3" ,4 3 ,7 ,6
36T 387 450 489 773
A Btl Bt2 BCk CBk
0-18 18-29
29-46/50 46/50-70
70+
34 46 60 46 34
20 20 16 30 20
46 34 24 24 46
SCL C C C SCL
2.3 1.7 1.5 0.8 2.3
nd, not determined; SPSA (specific surface area)
d) Classification:
USDA: Typic Argiustoll FA0 : Luvic Chernozems

- 98 -
Fig. ?- Photograph shoving profile 146/3-366


- 99 -
Profi le 146/3-367
a) Morphology
The A horizon is 12 cm deep, dark, reddish brown (5YR 2.5/3), clay loam, sub angular blocky and friable. The Btl horizon is 30 cm thick, black (10YR 2/1), clayey, prismatic and firm. The Bt2 horizon is 18 cm thick, dominantly very dark brown (10YR 2/2), clayey, prismatic and firm. The BC horizon is 20 cm thick, dominantly dark yollowish brown (10YR 4/4), sandy clay loam, sub angular blocky or angular blocky and friable. The CBk horizon is dark yellowish brown (10YR 4/4), porous loamy sand. The Btl and Bt2 horizons have continous to broken moderately thick to thick clay cutans with striations of pressure faces. Common, fine to coarse CaC03 nodules are present within the CBk horizon.
b) Chemical
Horizon Depth % Exc hangeable Cations pH pH CEC,meq XC BS (cm) Ca Mg K Na (H20) (KCl) /lOOgsoil (%)
A 0-12 76.4 11.4 6.8 5.7 7.1 5 4 41. 9 1.31 109 Btl 12-42 67.7 17.7 14.1 5.2 6.6 5 6 18 5 1.8 104 Bt2 42-60 77.8 10.0 6.5 6.5 8.2 6 .4 45 8 1.12 . 113 BC 60-80 81.2 6.9 6.1 5.5 8.3 6 .7 45 4 0.72 156 CBk 80+ 81.9 5.4 7.1 5.6 8.4 6 .8 40 4 0.31 189
c) Physi cal
Horizon Depth Clay Silt Sand Texture Sand/ Silt/ SPSA symbol (cm) - % - Silt
ratio Clay ratio
clay (m)2/g
A 0-12 36 20 44 C 2.2 0.5 499 Btl 12-42 70 4 26 CL 6.5 0.06 426 Bt2 42-60 44 26 30 C 1.2 0.6 586 BC 60-80 38 24 38 C 1.6 0.6 751 CBk 80+ 24 16 60 L 3.6 0.7 1236
nd, not determined; SPSA (specific surface area)
d) Classification:
USDA: Typic Haplustalf FA0 : Calcic Luvisol
Profile 146/3-368
a) Morphology
The A horizon is 15 cm thick, dark brown (10YR 3/3), clayey sub angular blocky and friable. The Btl horizon is 26 cm thick, very dark brown (10YR 2/2), clayey strongly prismatic and firm. The Bt2 horizon is 11 cm thick, very dark greyish

brown (ÏOYR 2/2), clayey, prismatic and friable to firm. The BC horizon is 48 cm thick, dark yellowish brown 910YR 4/4), sandy clay loam, weakly prismatic and friable. Btl and Bt2 horizons are cracking upto 52 cm but not reaching the surface.
b) Chemical
Horizon Depth % Exchangeable Cations pH (cm) Ca Mg K Na (H20)
pH CEC,meq (KCl) /lOOgsoil
TT BS (*)
À 0-15 66.5 20.2 11.7 1.6 6.3 5.1 20.3 1.93 $i Btl 15-41 73.6 14.2 6.1 5.8 7.0 5.1 41.7 1.24 95 Bt2 41-52 76.4 12.9 4.8 6.0 7.7 5.9 43.8 1.17 96 BC 52-100 78.1 10.8 5.0 6.4 8.3 6.4 42.1 0.93 115
c) Physical
Horizon symbol
Clay "SÎTF - X -
Sand Texture Sand/ Silt/ SPSA Silt Clay clay ratio ratio (m)2/g
Depth (cm)
0-15 15-41 41-52
52-100
"4T" 68 62 48
T8~ 10 16 26
30" 22 22 26
TT 2.2 1.4 1.0
"ÖT7-0.1 0.3 0.5
1S6" 517 518 557
A Btl Bt2 BC
CL C C C
nd, not determined; SPSA (specific surface area)
d) Classification:
USDA: Vertic Haplustalf FA0 : Vertic Luvisol
3) Properties of the soil mantle
a) Morphology
The profile has a continous A horizon 18 cm thick at the summit, 12 cm thick at the midslope and 15 cm thick at the footslope. The Bt horizon is also continous throughout the mantle and is 28 to 32 cm thick at the summit, 48 cm at the midslope and 36 cm at the footslope. The grade of the structure increases down the mantle laterally and cracks start to appear in the midslope and footslope positions. The BC horizon increases in thickness down the mantle and is thickest at the footslope position.
b) Chemical
Ca and Na in each case increases vertically down with depth and laterally at the midslope and footslope positions. Mg and K decreases vertically down with depth in each profile with Mg having an irregular distribution downslope and K decreasing towards the footslope. pH in each case increases with depth down the profile with a uniform distribution downslope. Thé CECs increase to a maximum in each case in the Bt horizon reducing again at the lower horizons. They show no particular distribution down the mantle though there is a slight increase

_ llU -
from the summit to the increases down saturation very high values at each pos
P r o f i l e 1 4 6 / 3 - 3 6 6
9 22—4fl , • BO innOfc
Ha
P r o f i l e 1 4 6 / 3 - 3 6 7
$ 2£ 4fl 6n pn ,1P"°(,
Profile 146/3-369
jpoib
Fig-2ß, Vertical and lateral trend in the distribution of the exchangeable cations.
c) Physical
The topsoils have lighter textures than the Bt horizons with clay increases exceeding 15% when compared with the Bt having more than 60% clay. Clay increases from the summit position to the footslope especially in the A horizon with a similar trend in the Bt horizon. The silttclay ratio in the A horizon is about 0.5 reducing to values less than 0.1 in the Bt horizons and then increasing again to about 0.6 in the BC horizons. The sandtsilt ratios are high in the summit position increasing at the midslope position and then decreasing again at the fooslope position.
Fig2?. Vertical and lateral textural variations within the toposequence.

- 102 -
co
« ; i V i r i ^ " ^ Y \ \ \ \ v { f r ^ \ ^
- -J^ \T -~»^ \X \%\ \ \ \ \ \ \ \ \ \ „vs\\\%\ I
Ç*3 CD
m CQ ip O m
< en
X O
Ü O J
a. < > o
^ 2 LU
_J N _ l O O 7
»— CC LUI
o cc
I O
_> < ü to o CC
• t-£L 1) > I I I 1 -
? ! \ \ \ \ V v \ \ \ V M N N
m
I-
s co •
o o CM •
o o
E o
l

- 103 -
4) Interpretation
The thicker A horizon at the summit position is due to a more stable condition with vertical processes exceeding lateral ones. The midslope is more truncated due to slope and less vegetative cover. The downslope position gets thicker due to accumulation of material from the midslope position. The abundance of Ca in the subsoils is a factor of parent material and climate since tuff samples show the presence of calcite as a primary mineral. Climate plays a role by letting CaC03 be concentrated in the lower horizons. This means that the drainage water is not enough to completely leach the soil. Topography influences the migration of Ca and Na to the lower slope positions. A similar trend is shown by the distribution of clay down the toposequence. Backward truncation of the toposequ-ence from the swale position as seen in other toposequences is not observed in this case.
Conclusion
From the internal and external properties the toposequences can be separated or grouped according to their similarities or differences.
In general three groups exist in the area each having similar soil distribution patterns or characteristics with only minor differences. The groupings are mostly associated with climatic conditions and parent material variations.
The Bar Kitabu and Lomanera Group
This group consists of transects 1, 2, and 6. This group has higher clay contents in their Bt horizons when compared to the other groups. Apart from the topsoils, the midslopes are comprised of Typic Haplustalfs and the lower slopes of Vertic Haplustalfs. Transect 1, and 2 have Typic Haplustalfs on the summit position while transect 6 has a Typic Argiustoll at the summit position. They all have high CaCo3% and CECs when compared to the other transects.
The Maji Moto Group
This transect is on the plain landscape and is separated from the rest by its low carbon contents and the climatic environment. It falls within the driest part of the area and is the only transect where Planosols occur within the midslope position. The higher positions have Ustic Torriorthents and the lower positions have Aquic Haplustalfs.
The Angata Loi ta Group
This group occupies the higher level plateau landscape and the piedmonts of the Lekanga Hill. It is separated from the rest by high sodium contents in them. Two transects (3 and 5) comprise this group. The soil associtiations are Typic Natrustalfs on the summit position except on trasect 5, Aquic Natrustalfs on the midslope position and soils influenced by aluvial material on the lower slopes. These soil are very extensive in the area and morphologically resemble Planosols. They only differ in the amounts of exchangeable sodium which in all cases are more than 15* within the subsoil. In the FAO-UNESCO classification they classify as Gleyic Solonetz.

_ 1Ü4 -
CHAPTER 6 COMPARISON OF SOIL TOPOSEQUENCES
6.1 SOME SOIL PROPERTIES
6.1.1 Physical properties
a) Bulk density
From the few bulk density determinations made,, most soils have a bulk density ranging between 1.1 and 1.7. This removes them from Andisols or soils with andic properties (ICOMAND, 1987). Recomended are values of 0.9 or less measured at 1/3 bar water retention.
b) Soil moisture retention
The mean siol moisture retention expressed as vtX when the soil is oven dried overnight at 105 C is 53.8 when a total of 70 samples is analysed. The standard deviation is 26.8 and the range is between 16 and 108.
6.1.2 Chemical properties
a) Percentage Carbon
The percentage carbon in most cases show a regular decrease with depth except for some profiles in swale postions. From figure... the footslope position has higher carbon contents than the upslope positions especially for transects 5 and 6. In general transect 6 has higher X carbon mostly because of the high percentages of CaC03 and swelling clays which stabilize organic matter. Transects 1 and 3 at the midslope position have higher carbon contents than at the summit position. Transect 4 (Maji Moto) has generally lower carbon contents maybe due to scarce vegetative cover or rhizosphere to be transformed into humus, a fact controlled by climatic conditions and overgrazing.
Fig 31 Comparison of the percentage carbon within the toposequence.
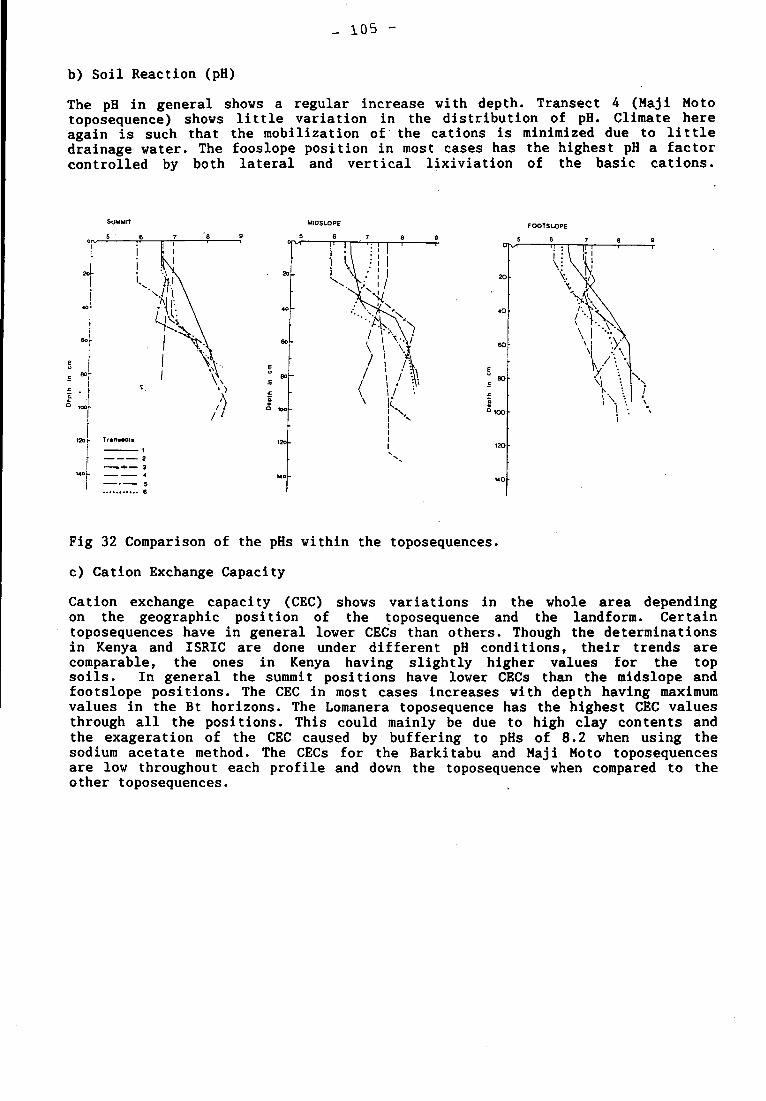
_ 105 -
b) Soil Reaction (pH)
The pH in general shows a regular increase with depth. Transect 4 (Maji Moto toposequence) shows little variation in the distribution of pH. Climate here again is such that the mobilization of the cations is minimized due to little drainage water. The fooslope position in most cases has the highest pH a factor controlled by both lateral and vertical lixiviation of the basic cations.
MIDSLOPE
5 6 •> e e
1 1 •:' I 1 '
[\ /! 1 V .' ! I
\ V.; / V
vi / i \ V
/1 \ ( \j v'
1 s. 1 V 1 1 1 1
Fig 32 Comparison of the pHs within the toposequences.
c) Cation Exchange Capacity
Cation exchange capacity (CEC) shows variations in the whole area depending on the geographic position of the toposequence and the landform. Certain toposequences have in general lower CECs than others. Though the determinations in Kenya and ISRIC are done under different pH conditions, their trends are comparable, the ones in Kenya having slightly higher values for the top soils. In general the summit positions have lower CECs than the midslope and footslope positions. The CEC in most cases increases with depth having maximum values in the Bt horizons. The Lomanera toposequence has the highest CEC values through all the positions. This could mainly be due to high clay contents and the exagération of the CEC caused by buffering to pHs of 8.2 when using the sodium acetate method. The CECs for the Barkitabu and Maji Moto toposequences are low throughout each profile and down the toposequence when compared to the other toposequences.

- 106 -
Fig 33 Comparison of the CECs within the toposequences.
d) Conclusion
From the distribution of some of the chemical elements it is possible to differentiate the transects especially according to climatic regions. Transect 4 shows separation from the other transects in the pattern and magnitude of both CEC and X carbon. It happens that transect 4 is located in the driest zone of the study area. If based on CEC alone transect 2 would also separate out since its values are very high compared to the rest. This has been attributed to the high clay contents.
6.1.3 Mineralogical properties
a) X-ray detected minerals
Determinations have been performed at ISRIC, Wageningen. The interpretation of results done by P. van Reeuwijk and is summarised as follows.
From X-ray analysis, most soils in the area are highly amorphous. Minerals detected are traces to appreciable amounts of kaolinite, halloysite, traces of badly crystallized mica or illite, traces of quartz and appreciable amounts of feldspars (Tables....). Lack of detected smectite type clays or vermiculite is striking especially for soils in the southern region whose Bt horizons are cracking.

_ 107 -
Though halloysite has been detected in the area (Table...)» the heated samples show an enhancement of the 10A peak on heating to 550 C (Fig..), a property which differs from the irreversible dehydration of halloysite when heated for one hour at temperatures of 80 C (Siefferman, 1973). When halloysite is heated for one hour at 600 C the 10A peak completely dissapears something not observed when the samples were heated to 550 C. This would mean that if halloysite is present it is either interstratified with mica/illite or the 10A peak is due to mica/illite or palygorskite.
Palygorskite has been identified in the samples analysed in Kenya since the diffractrogrammes have peaks at 10A and 6.4A. The only question to its presence is the enhancement of the 10A peak on heating. On heating palygorskite to 210 C the 10A peak is normaly reduced and a reflection appears at 9.2A. Further heating to temperatures of 350 C enhances the 9.2 peak. Heating palygorskite to temperatures higher than 540 C completely eliminates the 10A peak (Hayashi et al., 1969). The only arguments that can support the presence of palygorskite are the high surface areas of the clay minerals (Marshall and Caldwell, 1947) and the CECs which range between 5 and 30 meq/100g soil so characteristic for palygorskite. The high specific surface areas could also be due to the presence of allophane. The presence of quartz in the soils could be attributed to the presence of glass in the mineral composition of of the parent rock.
Wada, Kakuto and Muchena (1987) found embryonic halloysites with X-ray, amorphous iron oxide and silica under semi-arid to subhumid climatic conditions when working on soils around the Longonot and Suswa volcanoes in the central Rift Valley of Kenya. Therefore this together with the findings of Vielemaker and Vakatsuki (1984) could support the presence of halloysite in the soils of the area since some of their work was done in the southwest of the Rift Valley. Following are tables from selecteds profile where X-ray determinations have been done. From the tables there is no particular difference in mineralogical compositions between the soils in the northern area and those in the south. Thoug field observations show that soil in profiles 146/3-367 and 146/3-368 are cracking, no smectite or vermiculite clays were detected in them. The quartz present is derived from the parent material as shown in table Though it is mentioned that the soils are amorphous there is no identification of the amorphous constituents.
Table 17. (Profile 146/1-371, northern part)
Hoir Depth *Kaolinite Mica/illite Smectite Verm. Soil Mixed Quartz Feldspar cm (Halloysite) (badly X-t) Chlr layer
Ä 0^25 tr^+ tr = = - - ÊMtr X
Bt 36-47 t r - + t r , + - - t r -X
C 63+ tr^+ t r - - - - 0 - t r tFÖC

l U O
Table 1ft. (Profile 146/1-372, northern part)
Hor Depth *Kaolinite Mica/Illite Smectite cm (Halloysite) (badly X-t)
Verm. Soil Chi.
Mixed layer
Quartz Feldspars
A 0-22 tr-+ tr-+ — ~* — 0-tr X
C 76+ tr tr — *~ — 0-tr tr
Table 19. (Profile 146/1-366, southern part)
Hor Depth *Kaolinite Mica/Illite Smectite cm (Halloysite) (badly X-t)
Verm. Soil Chi.
Mixed layer
Quartz Feldspars
A 0-18 tr-+ tr — — — 0-tr tr-X
Bt2 29-46/50 + tr-+ — — — — tr
CBk 70+ tr-+ tr — — — — tr
Table ZO. (Profile 146/1-367, southern part)
Hor Depth *Kaolinite Mica/Illite Smectite cm (Halloysite) (badly X-t)
Verm. Soil Chi.
Mixed layer
Quartz Feldspars
A 0-12 + tr-+ — — — — tr
- - - -Bt2 42-60 tr-+ tr-+ - - - - tr
- - - -CBk tr-+ tr - - - - tr
Table.21. (Profile 146/1-368, southern part)
Hor Depth *Kaolinite Mica/Illite Smectite cm (Halloysite) (badly X-t)
Verm. Soil Chi.
Mixed layer
Quartz Feldspars
A 0-15 tr-+ tr-+ - - - tr tr-X
Bt2 41-52 tr-+ tr-+ - - - 0-+ tr-X
tr = trace +++ = estimate of relative abundance XXX = relative abundance of non clay minerals
* kaolinite and halloysite have peaks ranging between 7 and 10A. There is little or no effect on formanide treatment. The kaolinite or the halloysite is probably interstratified with illite/mica.

_ 109 -
Fig 34. Diffractogram showing unheated air dry sample saturated with Mg.
Fig.35u Diffractrogram showing same sample K saturated and heated to 550 C

- 1X0 -
b) Active and crystalline Fe, Al and silica
Selective dissolution of the non crystalline Al and Fe vas done using sodium dithionite buffered with citrate and bicarbonate to extract both active and stable Al and Fe oxides. The active Al and Fe were extracted using acid oxalate (pH 3), a mixture of oxalic acid and ammonium oxalate. The active Al compounds would be allophane if present, imogolite and organic-Al. The active Fe would be ferrihydrite and organic-Fe. To determine the amounts of organic Al and Fe present, sodium pyrophosphate was used. Table22 gives the results of the dissolutions.
From the tables, the total stable and active Fe is higher than Al ranging from 0.5-1.8%, while Al ranges from 0.1 to 0.2%. This is mainly because Al in most cases does not occur in a free state, being involved in the mineral lattice of the layer silicates. Active Fe is also higher than active Al meaning that the amorphous materials are more of iron oxides than aluminium oxides. It is surprising that organic-Al is higher than organic-Fe, something not expressed by the ammonium oxalate extractions. Aluminium is known to form complexes with organic compounds and this could be the reason for the higher values obtained by the pyrophosphate extractions. However the aluminium which forms organic complexes is normally free or active and its presence should be shown by the dithionite and oxalate extractions. This could raise a question regarding the efficiency of dithionite or acid oxalate in extractions involving active aluminium. The low values obtained by the acid oxalate on Al extractions indicate absence of allophane or imogolite within the non crystalline Al compounds. Active Fe and Si are present though in only small amounts as indicated by the oxalate extractions. In general only small amounts of non crystalline material is present in the clay fraction as shown by the oxalate extractions. This is in contradiction with X-ray findings and findings by Vielemaker and Wakatsuki (1984), Vada, Kakuto and Muchena (1987). If the findings are correct one may conclude that the major part of the clay minerals is dominated by crystalline minerals.
Vielemaker and Vakatsuki (1984), when working on soils derived from per-alkaline volcanic ash in central and western regions of the Rift Valley of Kenya, found no allophane in any of the soils which agrees with the present findings. According to them the fraction amorphous to X-ray in most of the studied soils was mainly consisting of siliceous Fe-oxides resembling hissingerite and siliceous ferrihydrite. Though the sodium dithionite, ammonium oxalate and pyrophosphate extractions show very little percentages of active silica, aluminium and iron (Table...), these could still be present. The above method of extractions has been critised for some shortcomings (Vada, 1977). Vada used successfully selective dissolutions of some noncrystalline clays with different reagents (Table...). Low active aluminium has also been recorded by Mizota (1987) for volcanic ash soils in Kenya using acid-oxalate extractions. According to him the development of active aluminium is favoured by high rainfall where the downward leaching of soluble elements is prevailing a condition not present in the area.

_ 111 -
Table 22. Extractions on selected profiles using sodium dithionite, ammonium oxalate, and sodium pyrophosphate methods
Profile no. 146/1-371
Depth Sodi urn Dithionit e 1 Ammoni um Oxalate | Sodium Pyrophosphate (cm) Fe Al Si Mn Fe Al
% Si Fe Al
0-25 1.1 0.1 n.a n.a 0.3 0.1 0.1 0.2 0.2 25-36 1.5 0.1 n.a n.a 0.2 0.0 . 0.1 0.0 0.0 36-47 1.0 0.1 n.a n.a 0.1 0.1 0.2 0.0 0.1 47-65 1.0 0.1 n.a n.a 0.1 0.1 0.1 0.0 0.1 65+ 1.0 0.1 n.a n.a 0.1 0.1 0.1 0.0 0.1
Profile n< >. 146/1-372
0-22 i.2 0.1 n.a n.a 0.3 Ô.l Ô.l 0.1 ô.i 22-31 1.8 0.1 n.a n.a 0.3 0.0 0.1 0.0 0.0 31-42 1.1 0.2 n.a n.a 0.1 0.1 0.2 0.0 0.1 42-52 0.8 0.1 n.a n.a 0.1 0.2 0.2 0.0 0.1 52-76 1.1 0.1 n.a n.a 0.1 0.2 0.1 0.0 0.0 76+ 1.3 0.1 n.a n.a 0.1 0.2 0.1 0.0 0.1
Profile n< 3. 146/1-370
0-10 1.0 0.1 n.a n.a 0.3 0.1 0.1 0.2 0.3 10-28 1.1 0.1 n.a n.a 0.2 0.1 0.1 0.3 0.4 28-53 1.3 0.1 n.a n.a 0.2 0.1 0.2 0.2 0.3 53-79 0.9 0.1 n.a n.a 0.1 0.1 0.2 0.5 0.8 79-97 1.0 0.1 n.a n.a 0.1 0.1 0.2 0.2 0.3 97+ 0.8 0.1 n.a n.a 0.0 0.1 0.1 0.1 0.1
Profile 1-*6/3-3 55
0-12 1.0 0.1 n.a n.a 0.4 0.1 0.0 0.1 0.1 12-20 0.9 0.1 n.a n.a 0.3 0.1 0.0 0.1 0.1 20-34 1.1 0.2 n.a n.a 0.2 0.1 0.1 0.1 0.2 34-50 1.2 0.1 n.a n.a 0.1 0.1 0.1 0.1 0.2 50-67 1.2 0.1 n.a n.a 0.1 0.1 0.1 0.1 0.2 82-96 1.1 0.1 n.a n.a 0.1 0.1 0.1 0.0 0.0 96+ 1.2 0.1 n.a n.a 0.1 0.1 0.1 0.0 0.0
Profile 1-46/3-366
0-18 0.9 0.1 n.a n.a 0.2 0.1 0.1 0.3 0.5 18-29 1.0 0.1 n.a n.a 0.2 0.1 0.1 0.1 0.1 29-46/50 1.2 0.2 n.a n.a 0.2 0.1 0.2 0.0 0.1 46/50-70 1.0 0.2 n.a n.a 0.2 0.2 0.3 0.3 0.5 70+ 0.6 0.1 n.a n.a 0.1 0.1 0.2 0.0 0.0

- 112 -
Profile 146/3-367
Depth 1 Sodium Dithionite | Ammonium Oxa late | Sodi urn Pyrophosphate (cm) | Fe Al Si Mn Fe Al
% Si Fe Al
0-12 1.2 0.2 n.a n.a 0.3 0.2 0.3 0.2 0.3 12-42 1.1 0.1 n.a n.a 0.3 0.1 0.1 0.3 0.5 42-60 0.8 0.1 n.a n.a 0.2 0.1 0.4 0.2 0.4 60-80 0.7 0.1 n.a n.a 0.1 0.2 0.5 0.2 0.3 80+ 0.5 0.1 n.a n.a 0.1 0.2 0.4 0.0 0.0
n.a = not analysed.
Table-23,. Dissolution of AI, Fe, and Si in various clay constituents and organic complexes by treatment with different reagents
271 Treatment with
0.15-0.2M* Element in: Oxalate-specified component 0.1M# Dithionite-$ 2%@ oxalic acid 0.5+ and complex Na4P207 citrate Na2C0 (pH 3.0-3.5) NaOH
Al in: Organic complexes good good good good good Hydrous oxid Noncrystalline poor good good good good Crystalline no poor poor no good
Fe in: Organic complexes good good no good no Hydrous oxid Noncrystalline poor good no good no Crystalline no good no no no
Si in: Opaline silica no no poor no good Crystalline silica no no no no poor
Al and Si in: Allophanelike poor good good good good Allophane poor poor poor good good Imogolite poor poor poor good-fair good Layer silicates no no no no poor-fair
# McKeague et al.*(1971); Wada and Higashi (1976), $ Mehra and Jackson (1965); Wada and Greenland (1970); Tokashiki and Wada (1975), @ Jackson (1956); Wada and Greenland (1970): Tokashiki and Wada (1975). * Schwertmann (1964); Higashi and Ikeda (1973); Wada and Wada (1976). + Hashimoto and Jackson (1960); Wada and Greenland (1970); Tokashiki and Wada
(1975).

- H i -
6.2 INFLUENCE OF SOIL FORMING FACTORS
6.2.1 Parent material
The influence of parent material is seen when comparing soils developed on pure volcanic ash or tuff and those developed on ash admixtures. In the northern part the parent material is dominantly volcanic ash while in the south the ash is mixed with colluvio-alluvial material (Okoth and Aore, 1988). For comparison of the two regions geochemical composition of soils developed in these two regions is given in the tables below.
Table.24 Profile 146/1-370 (volcanic ash, northern part)
Hor Depth S102 A1203 Fe203 CaO MgO K20 Na20 Ti02 MnO P205 BaO ign. sum cm loss
A 0-10 64.9 11.9 5.98 .58 .49 2.8 2.53 .56 .19 .19 .07 8.62 90. 64 Bt 28-53 59.9 13.3 8.91 2.9 .80 2.8 2.07 .60 .74 .20 .14 6.88 99. 31 C 97+ 60.6 16.2 8.43 .94 .96 2.9 1.93 .67 .13 .20 .07 6.58 99. 65
Table 2S.(Molar ratios for the sesquioxides and silica)
Hor Depth cm
Si02/ A1203
Si02/ Fe203
Si02/ R203
A1203/ Fe203
A Bt C
0-10 28-53 97+
9.2 7.7 6.3
28.9 17.9 19.1
7.0 5.4 4.8
3.1 2.3 3.0
Table 26. Profile 146/3-367 (southern part, ash vith colluvio-alluvial mixture)
""Hör Depth Si02 A1203 Fe203 CaO MgÖ K2Ö Na20 Ti02 MnO P205 BaO Tgiü sum cm loss
 0-12 58.1 17.86 9.33 1.11 1.21 2.11 .70 767 713 TTÜ .04 9.81 IÜTTT Bt2 42-60 57.9 16.46 8.43 1.84 1.42 2.22 .84 .64 .19 .14 .08 9.03 99.2 CBk 80+ 50.1 14.62 7.59 9.43 1.70 2.29 .62 .57 .18 .20 .13 12.00 99,3
Table27. (Molar ratios for the sesquioxides and silica)
"HOT Depth STÖ27 SÏÖ27 SÏÖ27 A1203/ cm A1203 Fe203 R203 Fe203
 Ô^YÎ 575 Ï675 47Ï 3~7Ö Bt2 42-60 6.0 18.3 4.5 3.1 CBk 80+ 5.8 17.5 4.4 3.0

- 114 -
Table.Z8. Profile 146/1-350 (northern part, ash vith alluvial material, svale position)
lor Depth Si02 A1203 Fe203 CaO MgÖ K2Ö Na20 Ti02 MnO P205 BaO Ign! sum cm loss
Âp 0-14 66.7 12.43 5.64 750 .28 2.84 3.14 .50 T2Ï 715 .05 8.02 IÜÖT4 Egc 64-77 64.4 14.02 7.70 .42 .29 2.67 3.13 .60 .23 .07 .06 5.85 99.5 Btc 77-88 58.5 16.75 9.79 .70 .47 2.04 2.10 .64 .30 .07 .08 7.46 98.9
Tabl? 29. (Molar ratios for the sesquioxides and silica)
Hor Depth cm
Si02/. A1203
Si02/ Fe203
Si02/ R203
A1203/ Fe203
Ap Egc Btc
0-14 64-77 77-88
9.1 2.7 5.9
31.4 22.2 15.5
7.1 2.4 4.3
3.5 8.3 2.7
Table.30. Profile 146/1-393 (northern part, ash vith alluvial material, svale position)
~Öör Depth Si02 A1203 Fe203 CaO MgÖ K20 Na20 Ti02 MnO P205 BaO Ign. sum cm loss
ÂÏ 0-12 69.4 11.76 4.72 3 1 .26 2.93 3.25 .46 TÏ4" TÏÖ .04 7.46 100.9 Egcl 42-58 72.3 11.09 4.70 .25 .19 3.03 3.66 .45 .15 .06 .04 3.78 99.7 Bt 72-94 56.8 19.02 9.30 .61 .81 2.19 1.50 .77 .10 .08 .04 8.63 99.8
Table 31. (Molar ratios for the sesquioxides and silica)
Hor Depth cm
Si02/ A1203
Si02/ Fe203
Si02/ R203
A1203/ Fe203
Al Egcl Bt
0-12 42-58 72-94
10.0 11.1 5.1
39\1 40.9 16.2
8.0 8.7 3.9
3.9 3.7 3.2
From the results obtained, the profiles to the north have higher a composition of Na20 (1.93-2.53) when compared to the one in the south with lower values (0.62-0.84). The K20 are nearly equal for both regions but the northern part still has slightly higher values. Other differences are seen in CaO contents which are higher in the southern part than in the north. Si02 content is higher for the profiles in the north than those in the south. Though there are high contents of Na20 and K20 the tuff cannot classify as peralkaline because the molar compositions of (Na20 + K20) are not in excess of A1203 (Wielemaker and Wakatsuki, 1984). The tuff can therefore be classified as alkaline as observed from the high contents of Na20 and K20. The difference is mainly due to the

_ 113 -
nature of the parent material in the two regions. The high NaO content in the tuff, is as a result of plagioclase forming the dominant primary mineral in the tuff as opposed to anorthite in the south, (see tables on X-ray sand diffraction analysis).
X-ray diffraction of the sand fraction for the parent material in both regions gives the following primary minerals:
Profile 146/1-370 (northern part)
mineral relative abundance
Anorthoclase (Na,K)AlSi308 +~ + Quartz (Si02) +
Profile 146/3-367 (southern part)
mineral relative abundance
Calcite(CaC03) T~l Anorthite (CaA12Si203) + Quartz (Si02) +
Fig... X-ray sand diffractrogram for the two regions
From these analyses it is clear that there is a mineralogical difference between the parent materials in the north and those in the south.
When exchangeable Ca, Mg, Na, and K are compared for the same profiles the following are the results obtained (meq/100g).
Profile 146/1-370 (northern part)
Hor Depth Ca Mg Na K CaC032
A 0-10 12.1 3.9 0.3 3.6 -Egc 10-28 10.2 2.3 0.7 3.6 -Bt 28-53 32.1 2.4 5.1 9.7 6.3 BC 53-79 17.0 2.3 2.8 6.0 4.3 Btb 79-97 17.0 1.8 5.0 8.3 5.8 C 97+ 20.9 2.4 12.3 17.2 5.4

_ 116 -
Profile 146/3-367 (southern part)
Hor Depth Ca Mg Na K CaC03%
A O-IZ 35.0 5.2 2.6 3.1 7.7 A 0-1Z Btl 12-42 Bt2 42-60 BC 60-80 CBk 80+
13.0 3.4 0.1 2.7 -40.4 5.2 3.2 4.3 8.2 57.7 4.9 3.9 4.3 10.9 62.5 4.1 4.3 5.4 14.4
- = not determined (both determinations done at ISRIC).
From these determinations it is clear that the soils developed on pure volcanic ash in the northern part have higher exchangeable sodium and potasium while the ones in the south have higher exchangeable calcium, magnesium and calcium carbonate percentages. These would have influence on the type of clay minerals developed on the two different materials. Minerals with K in their crystal lattice would develop on the pure volcanic ash while minerals rich in Ca and Mg would be more dominant in the south. Field observations indicate that the soils in the south are cracking while those in the north are not.
Kanno (1962) has given the following weathering scheme for the weathering of volcanic ash. e a d f Volcanic glasses} Si(0H)4 > Allophane ^ — — > Gibbsite / ( b jc ^ ^ ^ Kaolin minerals ) Plagioclases J A1(0H)3 > Montmorillonite
minerals Kaolin minerals (Hydrated Halloysite)
Reaction (a) is due to the characteristics of volcanic ash as parent rock in well drained conditions. Reaction (b) was observed in a closed crater lake under conditions inhibiting desilication and leaching of bases. The formation of montmorillonite from allophanes according to reaction (c) was observed in pumice beds in which drainage is intermittently imperfect and the addition of soluble silica and bases takes place. Reaction (d) was observed in some old members of humic allophane soils where gibbsite and hydrated halloysite increase with depth. The formation of gibbsite and kaolin minerals from allophane and their accumulation in the B horizon may be due to partial destruction of allophane by aggressive fulvic acids in the surface horizon. Reaction (e) was observed in the lower part of burried ash deposits. The formation of kaolin minerals is due to the influence of percolating water containing soluble silica and to the ageing of allophane.
Considering the clay mineralogy of the area and comparing it to to Kanno's scheme, a framework can be drawn for the area as follows:
a e Volcanic glasses)Si(0H)4 > Allophane
Plagioclases b d
A1(0H)3 > Mica/Illite —
-> Kaolin minerals c (Hydrated halloysite)
-> ^Montmorillonite clays

_ 11' -
Reactions (a), (c) and (e) would be exactly the same as those of Kanno while reactions (b) and (d) would be slightly different. Reaction (b) favoured by better drainage conditions and high potasium contents and reaction (d) favoured by impeded drainage and high concentrations of Ca and Mg. The mica/illite would act as the precursors of the montmorillonites.
6.2.2 Climate
Duchaufour (1982) has stressed the importance of climate in the weathering of volcanic ash. If the dry periods are long, or frequent, irreversible development in amorphous material occurs and Andosols change to other types of soils. This could be the case in the study area where most properties associated with volcanic ash soils are lacking. The soil moisture is at a deficit for five months (from June to October). The probability that the rainfall exceeds 600mm in any one year is about 40% (see Fig 5).
1) Effect on leaching
Though the rainfall is low and évapotranspiration high, there is an effective rainfall in the area which redistributes and leaches the bases and cations into the deeper subsoil as demonstrated by the drainage scheme developed by Duchaufour (1982). The scheme uses the water balance of an area to determine the amount of drainage water that is available to leach the soil. The drainage water is obtained by subtracting the monthly potential évapotranspiration and surface runoff from the monthly precipitation. Values are taken only for the months where precipitation exceeds potential évapotranspiration and surface runoff. From the total, a value of 100 mm is deducted, a figure assumed to be the total soil water reserve at the beginning of the rainy season. The scheme is defined by the following parameters:
D (monthly) = P - PET - surface runoff
D (annual) = sum of monthly drainage vlues - 100mm
Where P = Precipitation, PET = Potential Evapotranspiration, and D = Drainage
Using the water balance in table 12, from the chapter on climate, D annual for the area is 125mm.
For the influence of drainage water on soil formation and transport of material, Arkley (1967), quoted in Duchaufour (1982), made a detailed classification of soils in terms of climate by which it is possible to define the relationships that exist between climatically controlled drainage and the importance of the processes of transport, valid in well-drained conditions. A summary of his conclusion is as follows:
a) Arid climate is that with practically no drainage water (PET is always greater than P): no material, even the most mobile ion (Na+), can be removed from the profile.
b) Weak annual drainage is where there is removal of Na+ ions and incomplete decarbonation of the upper horizons: this should be under semi-arid conditions.
c) Climatically controlled drainage water is less than 150-200mm: here, complete decarbonation of the surface horizons occurs with accumulation of CaC03 within calcic horizons, but there is no pervection of clay nor

- l±ö -
transport of sesquioxides. This occurs under semi-arid to sub-humid conditions.
d) Climatically controlled drainage water is between 150-200 and 400mm: here there is moderate pervection of clays accompanied by a weak to moderate acidification of the absorbent complex; no calcic horizon is formed, the calcium being removed from the profile. This is under humid conditions.
e) Climatically controlled drainage where drainage water is greater than 400mm: here there is considerable pervection of clays accompanied in cold climate zones (or sites with particular characteristics) by a strong acidification with cheluviation; migration of Al and Fe as complexes.
From the above classification scheme the soils of the area would fall under climatically controlled drainage conditions where there is complete decarbonat-ion of the surface horizons, accumulation of CaC03 within calcic horizons, with no pervection of clays nor transport of sesquioxides (semi-arid to subhumid conditions). This means that the present Bt horizons would be relicts of ancient more humid climates. Similar conclusions have been made by Bocquier (1973) and Muchena (1987) when working under semi-arid conditions.
2) Effect on organic matter decomposition
Apart from precipitation, temperature also has an effect on the amounts of organic carbon in the soil. High temperatures condition high decomposition rates of organic carbon (Sanchez, 1976) and this explains the low topsoil carbon contents (mean 1.4%, range 0.38-2.25%). Though the soils to some extent have a stabilizing effect on the decomposition of organic carbon (Duchaufour, 1982) the influence of temperature seems to outweigh the chemical and mineralog-ical soil components. The result is lower organic carbon contents than would be found under cooler, more humid conditions (Kanno, 1962; Mizota, 1987).
3) Effect on oxidatio-reduction process
The fluctuating wetting and drying in the area conditioned by seasonal fluctuations in precipitation have an influence on soil pH and Eh. The reduction or oxidation of iron and manganese oxides and hydroxides depend on the partial pressures of oxygen and the soil pH since these determine the stabilities of the resulting oxides and hydroxides (van Schuylenborg, 1973). In general manganese (III, IV) oxides are reduced by higher partial pressures of oxygen than the stable and metastable ferric oxides. The alternating conditions of oxidation and reduction during the dry and wet periods respectively, will always favour seperation by diffusion when reduced, of iron and manganese if no interferring substances are present. Therefore the presence of iron and manganese nodules in the soils of the area is a fact attributed to climatic conditions.
4) Effect on weathering
The degree of weathering has been calculated for three profiles in the north and one in the south where data on total chemical composition exist. Parker's index (1970) has been used. The index is based on the exchange of Na, Ca, Mg and K for H in the mineral structure with (or without) loss of Si. Hydrolysis resulting in the physical disaggregation of rocks and removal of these mobile elements, is the most significant process of weathering in normal humid environments. Since there is a surplus of soil moisture for five months and hydrolysis

_ l l v -
being one of the modes of weathering (Duchaufour, 1982), the use of the index is justified.
When using the index, the bond strength of the elements with oxygen is used as weighting factor. The index measures both the degree to which a rock has been weathered with respect to parent material, and its susceptibility to further weathering. Higher values, closer to 100, are those of fresh rock while lower values, closer to 0 are for highly weathered materials. The oxygen strengths are measures of the energy needed to break the bonds, and hence of the relative likelihood of the elements being released in a weathering reaction. Assumption is made that the bonds are ionic. From ionic prcentages quoted by Krauskopf (1967), i.e 83% fo Na-O, 71% for K-0, and 79% for Ca-0, the values are high enough to make the assumption a reasonable approximation.
The index is defined by the following expression:
(Na)a (Mg)a
(Na-O)b (Mg-O)b
(K)a
(K-O)b
(Ca)a
(Ca-O)b * 100
Where (X)a indicates the atomic proportion of element X, defined as atomic percentage divided by atomic weight, and (X-O)b is the bond strength of element X with oxygen. Using Nicholl's (1963) values for the bond strength, the expression becomes:
(Na)a (Mg)a (K)a (Ca)a + + +
0.35 0.9 ÖT2T" 0.7 * 100
The weathering indices calculated using the above scheme are as follows:
(Northern part, on volcanic ash)
Profile 146/1--370 Prof
Hor
A Bt C
lie 146/1--350 Prof: Lie 146/ 1-393
Hor Depth cm
Parker's indexa
Prof
Hor
A Bt C
Depth cm
Parker's indexa
Hor Depth cm
Parker's index%
Ap 0-14 Egc 64-77 Btc 77-86
27.6 27.1 21.9
Prof
Hor
A Bt C
0-12 28-53 97+
26.3 31.0 26.6
Al Egel Bt
0-12 42-58 72-94
29.4 30.9 19.8
(Southern part on ash vith colluvio-alluvial admixture)
Profile 146/1-367
Hor Depth cm
Parker's index%
A 0-12 18.2 Bt2 42-60 21.2 CBk 80+ 41.2

- 12Ü -
In the norhtern part there is good consistence of the results with an average of 20-30% for the index which is nearly homogenous. Systematically lower values are obtained for the lower horizons where weathering is more active due to more soil moisture. The inversion of the results in the southern part could be partly due to lack of enough moisture to weather the subsoil and leach the CaC03 or the recombination of the exchangeable cations to form smectite minerals under impeded drainage present in the compacted subsoils.
5) Conclusion
The decarbonation of the upper horizons and the formation of calcium carbonate nodules in the lower ones may be attributed to the present climatic conditions, while the Bt horizons are relicts of older, more humid climates. The iron and manganese nodules are formed by seasonal water cycles which give different Eh conditions to different parts of the soil aggregates resulting into segregation and deposition of iron and manganese.
6.2.3 Vegetation
Most of the area is under natural grassland at places interspaced with acacia to form bushed grasslands. The influence of vegetation on soil formation and processes is normally caused by root action on the biogeochemical cycles and by litter deposition on the soil surface. In grass dominated vegetation, the mass of roots decomposing annually in situ can be more important than the aerial vegetative parts that decompose on the surface. The cycle is thus subterranean and transport of elements is reduced to a minimum. The nature of organic material that accumulates in the soil has been studied for well over a century (Valksman, 1938). The plant and animal residues added to the soil are composed of carbohydrates, proteins, lignins, fats, waxes and resins (Frinkl Jnr., 1979). Most organic matter incorporated in the soil is in the form of fulvic or humic acids and humin. The fulvic and humic acids are extractable and therefore easy to study. Humin which is non extractable accounts for 50 to 70% of organic matter in the soil (Duchaufour,1982), making its role in soil processes difficult to asses.
Humification is influenced by (i) soil climate, (ii) soil mineral material and (iii) litter composition (Duchaufour, 1982). All the above factors seem to act simultaneously in the area. The soil climate is that of alternating wetness and dryness with high soil temperatures which contribute to rapid biodégradation of organic matter, resulting into little accumulation of polycondensed phenolic compounds or complexing compounds. On the other hand amorphous material, swelling clays, calcium and magnesium have stabilizing effects on humus decomposition (Duchaufour, 1982). This would be the case in the area though not to the extent observed in areas with cooler climates and higher rainfall (Kanno, 1962). This fact is demonstrated by relatively low carbon contents of the topsoils. Low C:N ratios in the soil would be explained by either low contents of fresh organic matter or high mineralization of organic carbon compared to nitrogen. Exceptions to this would be in the lower positions and in the southern part of the study area where higher moisture and high concentrations of calcium and magnesium respectively condition humus stabilization. This would result in higher accumulation and stabilization of the humus as indicated by profiles on lower positions and in the southern part of the area.
Situma (1988) wrote for the same area that high potential growth in tropical

- 121 -
grasses coupled with the tendency to accumulate less nitrogen leads to lower nitrogen in the tissue. This occurs with increased biomass resulting into high C:N ratios for the grass tissues as they die and decompose. Variations of the C:N ratios as fresh organic material develops into humus has been studied by Viro 1956, Bocock et al. (1960) and Zottl (1960). When the C:N ratio of the litter is high, the decomposition slows down, as does the mineralisation of nitrogen compared to that of C02. This causes the C:N ratio of the humus formed to be lowered. When the soil is biologically active, the C:N ratio is normally very low often less than 10 (Stevenson et al., 1958) due to the fixation of non-exchangeable NH4 by the mineral horizons. This is the case in the cultivated fields where the activity of microflora is high (Sanchez, 1976). In the Maji Moto area where there is a low biomass cover, the soil C:N ratios vary between 8 and 10 while in the south where the biomass is higher the C:N ratios are higher ranging between 13 and 15.
From the above discussion, organic matter apart from the good crumb structure formed in the Mollisols, is rapidly mineralised with very little effects on the chemical properties of the soil except in soils with swelling clays, those having high contents of Ca and Mg, and soils containing aluminium and iron oxides where there is accumulation of humus. Therefore the role of organic matter in soil formation within the study area is seen in its participation in the formation of Mollisols and Vertisols as conditioned by climate, soil properties and the litter composition. Very dark, coloured A horizons characterized by Fe-humus and Al-humus complexes, as those formed on allophane rich-volcanic ashes, have not been identified in the area.
6.2.4 Topography
Topography influences soil formation by controlling the dynamics within and above the soil mantle. In general, the higher parts are better drained than the lower parts giving different environments for clay formation. The migration of silica, calcium, and magnesium salts is normally downslope resulting in neoformation of montmorillonitic clays on footslope positions. Aluminium is normally less mobile and its concentration reduces downslope.
Within the study area the influence of the topography is clearly seen by the systematic arrangement of different soil units from the summit of a relief down to the footslope. In the northern part within the higher level plateau, soil variations occur from Mollisols on the relief summits, well drained Alfiso-ls on the shoulder and backslopes, poorer drained Alfisols on the footslopes, and Inceptisols in the swale positions. Within the low lying plateau, Mollisols and sometimes Alfisols occupy the summit positions, Typic Alfisols occur in mid positions and vertic Alfisols in the lowest positions. The drainage is generally better on the higher parts than on the lower parts. Soil depth increases downslope, Bt horizons downslope are normally thicker.
On the Piedmonts, the higher glacis are normally well drained, the middle moderately well drained and the lower slopes poorly to imperfectly drained. The Bt horizons show structural variation from prismatic structure at the top of the piedmont, prismatic to columnar structure in the midslope positions and columnar structures downslope. The soil units vary from Typic Haplustalfs upslope, Aquic Natrustalfs midslope and Typic Haplustalfs down slope. Sodium and calcium levels increases towards the lower slopes and thickness of the Bt horizon is highest downslope lessening upslope.

- 122 -
Within the catenas in the southern part, erosion seems to cut the slope backwards with more truncation on the lower slopes and gradual truncation upslope. Deposition is minimal showing that there is very little movement of material from the upslope positions. In the northern parts and especially in the cultivated farms, erosion seems to progress down a slope where material is transported from the higher parts down to the lower parts. This is mainly caused by the reduced surface cover and reduced organic matter by cultivation as shall be demonstrated in the next chapter.
Topography influences soil formation in terms of spatial redistribution within the soil mantle of the bases, aluminium, iron and silica. The better drained summits have higher concentrations of Al than the lower slopes. The more mobile basic cations like sodium migrate to the downslope positions accompanied by calcium. Clay and silica are also translocated in the same way. due to impeded drainage on the lower positions, neoformation of smectite clays is favoured as seen in the soils within the southern region. Soils in the upper slope positions have kaolinite as the dominant clay mineral. The steeper midslope positions sometimes have shallower soils than the summit and footslope positions. This is a fact caused by truncation of the more steeper slopes by flowing surface water.
6.2.5 Time
Since no absolute dating was carried out for these soils, the only way to test the influence of time is through genetical relationships. When a single toposequence is taken as an example, the dynamics within the soil mantle can aid in deducing which soil unit is older than the other. The Barkitabu transect has a Typic Haplustalf on the summit, a Vertic Haplustalf on the mid position and a Vertic Haplustalf on the lower position. Since most of the time silica, calcium, sodium and clay are moving downslope and neoformation taking place downslope, the soils within the higher positions should be considered older than the ones downslope. The ages of these soils will however reduce slowly upslope as the lower slopes get completely choked up with clay and this clay starts to encroach upslope resulting into younger soils upslope. This is the same case when a Solonetz is found downslope and a Planosol above it. The Solonetz will be younger than the Planosol and the Planosol younger than the Luvisol from which it was developed.
From that argument Mollisols would appear to be the oldest soils followed by Luvisols, then Planosols, Vertisols or Solonetz.
6.3 MAIN ASPECTS ON PEDOGENESIS: GENETIC/DIAGNOSTIC HORIZONS FORMATION
6.3.1 Mollic epipedons
These are encountered mostly on the summits of the mesa reliefs on the plateau landscape. The formation of mollic epipedons is favoured by the presence of reasonable amounts of vegetative cover on the soil surface, and a rich rhizosph-ere which constantly adds humus to the mineral fraction of the soil. The clay particles participate by stabilizing the humus against decomposition through the formation of complexes. Volcanic material rich in aluminium and iron are good at forming complexes with organic matter (Kanno,1962; Tan, 1965; Wada and Igashi, 1978; Leamy et al., 1980). This could be one of the reasons causing the

- 123 -
accumulation of organic matter in the soils. From earlier observations this processs is not as active as observed under more humid conditions. Organic matter contents of the toposequences has been observed to increase towards the lower slope positions due to increasing soil moisture. Therefore the formation friable humic epipedons on the summit positions is best explained by more leaching of the finer clay material on the summit position as conditioned by gentler slopes.
6.3.2 The eluvial horizons
1) Types
Four different types of eluvial horizons occur in the study area designated as: E, Ec, Eg and Egc.
a) E horizons
These are horizons lying below the A horizon where appreciable amount of clay has migrated into the lower subsoils but still there is enough clay material to give them dark brown colours. Though there is clay migration, the textures are normally clay loam to silty clay loam with relative enrichment of sand and silt particles. The silt/clay ratios are in the order of 0.7 to 1.2. It can be said that this is the initial stage of the albic horizon formation.
b) Eg horizons
These are eluvial horizons whose colours are normally more grey than those of the E horizons. This colour difference is normally due to low Eh conditions in this part of the profile conditioned by stagnating, perched water tables above slowly permeable subsoils. This condition results in reduction of the ferric to ferrous ions, normally green to blue in colour. The textures are generally the same as those of the E horizons and the soil reaction is very slightly acidic. These could be more advanced stages of albic horizon formation.
c) Ec horizons
These are dark brown eluvial horizons (10YR 3/3) where mottling and segregation of iron and manganese has occurred. Their formation is conditioned by fluctuating moisture conditions in the soil. Alternating drying and wetting condition the formation of pseudogley (Duchaufour, 1982). Mostly these are advanced stages of albic horizon formation where the amounts of clay still give the horizons their colours as opposed to silt and sand grains dominating albic horizons. When lateral and vertical migration of clay occurs to a more advanced stage or when the clay particles are destroyed by ferrolysis these horizons become albic E horizons (Brinkman, 1970; Dudal, 1973).
d) Egc horizons
These are mature stages in the formation of an albic E horizon. These horizons are normally light grey (10YR 7/1) when dry and greyish brown (10YR 5/1 or 5/2) when moist. The textures are silty clay loam with silt to clay ratios ranging from 1.8 to 2.4. Iron and manganese nodules are frequent above a very slowly permeable horizon.

- 124 -
2) Formation
A synthesis on the formation of albic horizons has already been given in the literature review. As a summary and for this area, the formation of albic E horizons starts by pervection of clay to the deeper subsoils to form a compacted slowly permeable horizon. When this slowly permeable horizon is completely choked with clay, lateral migration of the clay dominates (see figure...). Vhen the B horizons were cleaned lateral seepage of water was clearly observed to directly translocate the clay particles. This agrees with observations by Rojanev (1957), Duchaufour (1982) and other authors. The iron and manganese nodules are formed by alternating cycles of wetting and drying as already discussed. Manganese segregation is favoured by higher redox potentials while iron is favoured by lower redox potentials. The alternating reducing and oxidising conditions could also favour the destruction of the clay minerals (Nikifo-roff and Drosdoff, 1943; Brinkman, 1970). Silt/clay ratios in the order of 1.8-2.4 for proper albic E horizons as compared to 0.7-1.2 for the weakly developed ones, and 0.1—0.6 for the underlying horizons, indicate relative accumulation of silt in the eluvial horizons and the migration of clay sized particles into deeper parts of the profiles to form the compacted Bt horizons. This is different from the view held by Smith (1934) who suggested that the formation of colloidal material in place and its flocculation in the presence of electrolytes from stagnated ground water would originate the compacted slowly permeable Bt horizons.
Some of the E horizons have a peculiar behaviour on addition of water. The' material flows when wet and hardens irreversibly on drying. This property has been associated with the thixotropic nature of volcanic ashes (Wright, 1964; Swindale, 1964; Maeda et al., 1977). Such horizons when exposed for long periods form indurated material which is impossible to work with normal agricultural implements. Infact they form hardpans with relicts of the E properties. In some soils these horizons lie directly on volcanic tuff which raises the question as to whether they are eluvial horizons or ash beds. Lack of micromorphological information makes it difficult to ascertain this.
6.3.3 The argillic horizons
These are horizons characterised by high amounts of clay as compared to overlying eluvial horizons. For classification purposes only the horizons with clay increase meeting the specifications in the USDA taxonomy (1975) are referred to as argillic ones. Horizons which don't fulfill this requirement are refer-

_ 125 -
c _k
Fig 36. Photograph showing the translocation of clay due to lateral seepage.


red to as neo-argillic (Sombroek, 1986). This study uses the nomenclature suggested by Sombroek (1986) to distinguish between the different types of argillic horizons occurring in the area. Five of the horizons have been identified namely: natro-argillic, plano-argillic, abrupto-argillic and luvo-argillic.
1) Natro-argillic horizons
These are argillic horizons which apart from accumulation of clay have high contents of exchangeable sodium within their exchange complex. The exchangeable sodium percentages (ESP) are always more than 15. In the field these horizons easily slake on the addition of water. They are normally dark brown to black (10YR 2/2,- 10YR 2/1), prismatic and prismatic to columnar, clayey with silt/ clay ratios ranging between 0.2-0.5. Iron and manganese nodules usually occur above these horizons. The horizons are devoid of cracking and allow stagnation of water above them. Lack of cracking indicates the absence of smectite type clays.
Mostly these horizons occur in the northern part of the study area suggesting that their presence is conditioned by the volcanic ash parent material as opposed to the southern part where they don't occur. The high concentrations of sodium in the lower horizons could have been due to earlier conditions of free drainage of the soil enabling the lixiviation of the very mobile sodium salts. The incomplete leching of these salts suggest low amounts of drainage water or high évapotranspiration rates removing the drainage water before it completely leaches the soil.
2) Plano-argillic horizons
These are argillic horizons with lower ESP values than the natro-argillic ones. Their ESP contents are normally in the order of 6-13. The clay increase between the eluvial horizons and the Bt horizon is normally more than 20%. They are mostly very dark brown (10YR 2/2), fine prismatic, clayey with silt/clay ratio in the order of 0.2-0.4. They are not cracking just like the natro-argillic ones.
Lack of cracks in these horizons suggests the absence of smectitic type clays. The lower amounts of exchangeable sodium within the exchange complex could be due to more leaching or lateral removal of the sodium salts from these soils occupy normally the swale positions in the landscape. The compacted, slowly permeable horizons are formed by clay pervection, a condition which must have proceeded under more humid conditions and at a stage when the permeability of the soil was still high. At the present this process has very little likelihood of occurrence.
3) Abrupto-argillic horizons
These are argillic horizons with vertic properties like the ones found in the southern part of the study area. The seasonal changes of soil moisture cause shrinkage and swelling of the clay minerals resulting into wide cracks formed in the dry season. Apart from the pervection of clay and neoformation of smectite type clays, there is also accumulation of carbonates of calcium or magnesium as shown by the reaction with dilute hydrochloric acid. Mostly they are black (10YR 2/1), clayey, strongly prismatic, and firm.

- 127 -
The abrupto-argillic horizons are in a continuous state of formation due to material migrating from upslope positions and by aggradation forming smectite type clays. They are slowly building up in thickness towards the surface and laterally towards the upslope positions. After some time, these horizons are expected to reach the surface and form Vertisols.
4) Luvo-argillic horizons
These are argillic horizons which are neither cracking, sodic nor planic. They are compacted with silt/clay ratios in the order of 0.1-0.5. The difference between these horizons and the planic ones is that the clay increase don't exceed 20%. Their mode of formation is by pervection of clay, after decarbonat-ion of the topsoils and redeposition and accumulation of carbonates and soft powdery lime in subsoil. The exchangeable sodium in them is low and the clay minerals are mostly kaolinitic in the topsoils and mica/illite in the argillic horizons. Like the rest of the Bt horizons, they are prismatic, very dark brown to black (10YR2/2 to 10YR 2/1), clayey with continuous clay cutans.
From the present climatic data, pervection is not favoured due to limited amount of effective drainage water. The formation of the argillic horizons must have occurred under conditions of higher rainfall and better profile drainage conditions. At present, the argillic horizons could still be building upwards towards the surface by pervection and upslope by aggradation and neoformation of clay minerals as suggested by Smith (1934). The most active process at present is the truncation of the topsoil especially where surface runoff is easily formed and at the midslope positions.
5) The neo-argillic horizons
These are Bt horizons where the clay increase between the eluvial horizons and the B horizons dont fulfill the requirements of an argillic horizon. At present, they are still permeable and have patchy, thin clay cutans. They represent an early stage of the argillic horizon formation. They occur frequently at swale positions of the reliefs. Their lack of maturity is due to continuous removal of fine clay by lateral drainage. For classification purposes they are classified as cambic horizons.
6.4 SOIL CLASSIFICATION
The USDA (1975) and FA0-UNESC0(1974,1987) systems of soil classification has been used. For classification purposes, the CEC values obtained by the ammonium acetate method at pH 7.0 are used. CEC determined by the sodium acetate method at pH 8.2 result in very high CEC values. Vhen this is used for base saturation calculations the resulting values are lower than expected except in the subsoils where the soil pH is about the same.
All the soil samples whose CECs were determined by the ammonium acetate method at pH 7.0 had CEC/100 gram clay values greater than 24 meq and all the base saturation values were greater than 50 percent.
The following soils were encountered in the study area as classified by the FA0 and USDA systems.

- 128 -
6.4.1 Soil classification according to FAO-UNESCO system
Seven broad classes have been identified in the area namely: Lithosols, Fluvisols, Planosols, Solonetz, Chernozems, Phaeozems Luvisols and Cambisols. Luvisols, Phaeozems, Solonetz and Planosols are the most extensive. The rest corresponds to inclusions occurring in only a few locations within the area.
1) LITHOSOLS
Lithosols are present on quartzitic hills. They are less than 10cm thick, sandy, with reddish brown colours.
2) FLUVISOLS
Fluvisols are mostly encountered in floodplain conditions along stream channels. They lack any diagnostic horizons except clay loam dark brown ochric epipedons, lying directly on reworked bedded volcanic ash material or on alluvium. They all have base saturation values greater than 50% and are sometimes sodic. The only type present in the area is the eutric one.
3) PLANOSOLS
All the Planosols classified in the area are solodic Planosols, having more than 6% exchangeable sodium within the B horizons. The argillic B horizon is overlain by an eluvial E one with a silt loam texture. Dry colour values of the E horizon are more than 5 with chromas of 2 or less, and moist colour values are 4 or more with chromas of 2 or less. The clay ratios between the topsoil or the eluvial horizon and the argillic B horizon are generally greater than 1.7, and the clay contents increase by values of 20 to 44%. The B horizon is slowly permeable, prismatic, with thick and continuous clay cutans. As for the Luvisols, these fine textured B horizons favour the occurrence of perched water tables, allowing for the segregation of iron and manganese oxides and the formation of concretions within the overlying eluvial horizons.
The Planosols are mostly encountered on the footslopes of the mesa reliefs covered with volcanic ash material on the piedmont landscape within the distal parts of the erosional glacis, and on the plain landscape within the nearly level parts of the erosional benches and in the swale positions.
4) SOLONETZ
Solonetz are similar to the Planosols, except that they have exchangeable sodium values (ESP) greater than 15% in parts or whole of the illuvial B horizon (natric B horizon). All have iron and manganese concretions above the natric B horizon, which is columnar or prismatic structured and friable when moist. On addition of water the soil material easily slacks due to sodium-caused dispersion. All Solonetz are of the gleyic type.
Solonetz occupy mostly the lower parts of the glacis within the piedmonts and the backslopes and footslopes of the mesa reliefs on the plateau landscape. They are also found on the interlacing waterways and on bench landforms within the plain landscape. They are mainly formed from volcanic ash parent material.

- 129 -
5) CHERNOZEMS
Chernozems are like Phaeozems except, that they have soft powdery lime or calcium carbonate nodules within 75 cm of the surface. They are mostly encountered in the southern part of the study area within the interfluves of the mesa reliefs.
6) PHAEOZEMS
The Phaeozems are marginal in relation to the requirements of the mollic  epipedon since dry colour values are generally high (dry value of 5). Moist color values are 3 with chromas of 2 or less. In most cases the mollic epipedon penetrates the upper part of the B horizon. The organic carbon content varies between 1.47 and 2.38%. The underlying B horizon may be an argillic and sometimes a cambic. Therefore two types of Phaeozem have been identified in the area: luvic and haplic. Luvic Phaeozems have argillic horizons with clay increase ratios between the eluvial and the underlying horizon in the range of 1.3 to 1.5.
Phaeozems mostly occupy the summits of the mesa reliefs on both the high lying and low lying plateau landscapes. On few occasions, they are found on the apex of the glacis within the piedmont landscapes.
7) LUVTSOLS
Most Luvisols encountered have an average of about 30% clay in the topsoil, overlying an argillic horizon with clay increase ratios of 1.3 to 1.7. Higher ratios are encountered but in soils classifying either as Planosols or Solonetz. The argillic horizons in most cases are firm and prismatic breaking into smaller prism aggregates or angular blocky structure. These slowly permeable layers greatly favour the occurrence of overlying perched water tables, resulting into the formation of iron and manganese concretions in the eluvial horizons. Some Luvisols are either cracking within the B horizons, or they have soft powdery lime or nodules of calcium carbonate. Due to these characteristics, three distinct types of Luvisols are classified: gleyic, calcic and vertic.
Luvisols occur mainly on the higher relief units such as proximal areas of glacis and summit or backslope facets of the mesas developed in volcanic tuffs.
8) CAMBISOLS
Cambisols are encountered especially when the eluvial horizon is directly lying on the volcanic ash material or when a cambic B horizon is present without overlying mollic A horizon. All Cambisols have base saturation values greater than 50%. Some show hydromorphic features. From these characteristics two types are present in the area namely: eutric and gleyic.
Cambisols occur mostly at the transition between the higher lying plateau and the plain landscape, occupying eroded mesas and fluvial mound deposits. They are found also on the backslopes of the mesa reliefs developed on volcanic ash.

9) The classification according to FAO-UNESCO amendment draft (1987)
From the draft copy of the FAO-UNESCO 1987 edition, some soils have to be reclassified as follows:
FAO-UNESCO (1974) FAO-UNESCO DRAFT COPY (1987)
1) Lithosols lithic Leptosols
2) solodic Planosols (some) gleyic Solonetz
6.4.3 Soil classification according to USDA soil taxonomy system (1975)
1) Determination of soil climate
a) Soil temperature regime
Soil temperature is one of the most important factors that control microbiological activity and the processes involved in the production of plants. The data on soil temperature for Narok Met. Station is contained in table 17... Temperature measurements are conducted two times a day at 5, 10, 20 and 30cm depths. By extrapolation, the mean annual soil temperature has been estimated to be less than 22 C at 50cm depth. The mean soil temperature for the hottest season (average of February, March and April) is 23.7 C and for the coolest season (June, July and August) is 20.1 C, at 30cm depth (9.00 am), giving a difference of 3.6 C. Therefore the study area has an isothermic temperature regime.
b) Soil moisture regime
The soils are dry in some parts or all in the moisture control section for five months in a year during the dry season. The rainy season is however long enough to grow a crop without supplementary irrigation. During this period of seven months, the moisture control section is completetely or partly moist without interruption (see table ) and the soil temperature more than 8 degrees centigrade. Therefore the soil moisture regime is ustic for the major part of the soils with exception of the poorly drained ones. According to van Wambeke (1982), this type of ustic moisture regime is termed typic tropustic.
2) Description of the soil classes
Applying the USDA taxonomy system, four orders are identified, namely: Alfisols, Entisols, Inceptisols and Mollisols. The dominant characteristics of each order are described. Subsequently, the variation ranges of the soil characteristics are analysed per genetic horizons of the main subgroups.
a) ALFISOLS
Alfisols are very extensive and mostly developed from tuff deposits on the plateau landscapes. They all have a slowly permeable argillic B horizon with thick and continuous clay cutans.
The epipedon is either too light in colour or too hard to qualify as a mollic one. They have a distinct grey eluvial horizon overlying the argillic B horizon, with dry colour values higher than 6, dry chromas of 3 or less, moist

- 131 -
Table32.. Soil temperature data (Narok Met. station)
8.00am 12.00 noon
50CM 10CM 20CM 30CM 5CM 10CM 20CM
JAN 14.8 17.8 20.7 21.3 23.9 2Ô.Ô 20.5
FEB 15.2 19.1 22.5 24.6 25.4 21.7 22.0
MAR 16.7 19.4 22.7 23.0 26.3 22.2 22.2
APR 17.6 19.9 22.5 23.0 25.4 22.3 22.2
MAY 16.2 17.5 19.8 21.2 21.8 19.7 19.3
JUN 15.5 17.8 20.1 20.6 21.9 16. $ 19.5
JUL 14.0 16.0 18.7 19.2 22.1 18.1 18.8
AUG 14.5 17.5 19.2 20.1 21.8 19.8 19.7
SEP 15.5 17.8 20.3 21.0 23.0 21.0 20.0
OCT 18.0 20.0 21.6 22.1 26.8 22.0 21.6
NOV 15.9 18.2 20.7 21.1 24.0 21.0 2Ô.5
DEC 16.5 17.9 20.3 20.9 23.5 2Ô.3 2Ô.7
MEAN 15.9 18.2 20.7 21.5 23.8 20.7 20.6
Mean maximum temperature = 24.6 degrees C at 30cm depth Mean minimum temperature = 19.2 degrees C at 30cm depth Mean soil temperature =21.5 degrees C at 30cm depth

_ 13A -
values of 4 or more and moist chromas of 2 or less. According to FAO classification, some of these soils classify as Planosols, while those lacking hydromorphic properties and albic E horizons classify as Luvisols. In most cases, the eluvial horizons have iron and manganese concretions. In the southern part of the study area, the argillic B horizons have cracks wider than lern but not reaching the surface nor going below 50cm from the surface. The same soils in the south have accumulations of soft powdery lime or nodules of calcium carbonate. In places, natric B horizons are encountered where ESP values in the B horizons are more than 15%.
In the Alfisols class, six sub-groups are identified: Typic Natrustalfs, Aquic Natrustalfs, Typic Haplustalfs, Aquic Haplustalfs, Lithic Haplustalfs and Vertic Haplustalfs.
TYPIC HATRUSTALFS
Typic Natrustalfs are well drained. The solum varies in depth between 70 and 90cm, resting on weathering volcanic ash or tuff parent material.
The A horizon is usually about 15 cm thick, dark brown (10YR 3/3), clayey to clay loam, weakly prismatic or subangular blocky and friable. Organic carbon contents vary between 1.17 and 1.29 %, and the soil reaction is acidic.
The Bt horizons are between 13 and 20 cm thick, with dark greyish brown to very dark brown (10YR 4/2, 10YR 2/2), clayey prismatic and friable. The soil reaction ranges between neutral and alkaline.
The Bt horizons usually overly transitional BC and CB horizons with variable depths, colours, textures, consistence, and alkaline soil reaction.
AQUIC NATRUSTALFS
Aquic Natrustalfs are normally moderately well drained, have natric horizons and eluvial horizons with reduction colours. The solum varies in depth between 65 and 97cm, resting on weathering volcanic ash or tuff parent material.
The A horizon is usually 10 to 20cm thick, dark brown (10YR 3/3), clay loam, sub angular blocky and friable. Organic carbon content varies between 0.98 and 2.38%. The soil reaction is slightly acidic to neutral. Exchangeable sodium content vary between 0.8 and 4.0%.
The A horizon overly eluvial or albic horizon, 8 to 20 cm thick, normally dark greyish brown (10YR 4/2), silty clay loam. The eluvial horizons frequently have segregation of iron and manganese oxides. They have a weak prismatic structure, and are friable. Soil raection is slightly acidic. The exchangeable sodium percentages vary between 8 and 19.
The eluvial horizon overly natric horizons between 16 and 25cm thick with dark reddish brown to black and clayey. They normally are prismatic or columnar in structure and friable. The material is neutral to alkaline. Moderately thick to thick, continuous clay cutans are present. Exchangeable sodium percentages vary between 18 and 39.
The natric horizons overly transitional BC and CB horizons of varying thicknes and colours. Mostly these are of sandy clay to sandy loam textures, weak structure and alkaline soil reaction.

- 133 -
TYPIC HAPLÜSTALFS
Typic Haplustalfs are normally well drained to moderately well drained soils, having an argillic horizon and base saturation values more than 50%. The solum rests on C material of weathering volcanic ash or tuff at varying depths between 67 and 140cm.
The A horizons are usually about 15 cm thick, dark brown (10YR 3/3), silty clay to clay loam, subangular blocky and friable. Organic carbon contents range between 1.17 and 1.29%. soil reaction is neutral.
The A horizons overly transitional eluvial horizons between 14 and 22 cm thick, dark reddish brown (5YR 2.5/2), clayey, subangular blocky and friable. The soil reaction is nearly neutral to slightly acid. Segregation of iron and manganese oxide is frequent.
The eluvial horizons overly Bt horizons 14 to 40 cm thick, dark reddish brown to black (5YR 3/2-10YR 2/1), clayey, prismatic, and friable to firm. The soil reaction is neutral to slightly alkaline, with base saturation percentages varying between 53 and 100.
The Bt horizons normally overly transitional BC and CB horizons between 30 and 100 cm thick, with varying textures, structure and consistence. The soil reaction is mostly alkaline.
AQUIC HAPLUSTALFS
Aquic Haplustalfs are moderately well drained to imperfectly drained and have argillic horizons overlain by eluvial horizons with hydromorphic properties. The solum is usually 58 to 110 cm thick, lying on volcanic ash parent material.
The A and Ap horizons are usually 10 to 15cm thick, dark brown (10YR 3/3), silty clay to clay loam, subangular blocky and friable. The soil reaction is usually slightly acidic.
They overly eluvial horizons between 8 and 10 cm thick, dark greyish brown (10YR 4/2), weakly subangular blocky and friable. The soil reaction is usually slightly acidic.
The eluvial horizons overly Bt horizons 13 to 15cm thick, clayey, prismatic, and friable to firm. The soil reaction is nearly neutral on the alkaline side.
The Bt horizons in places overly BC and CB horizons with varying depths, colours, textures, structure and consistency. The soil reaction is normally alkaline.
LITHIC HAPLUSTALFS
These soils are normally like the Typic Haplustalfs except that hardened tuff occurs at depths ranging between 38 and 45 cm.
VERTIC HAPLUSTALFS
Vertic Haplustalfs are moderately well drained to imperfectly drained, with

- 134 -
cracks wider than 1 cm within the Bt horizons. The solum has depths varying between 80 and 110 cm.
The A horizons are 5 to 15cm thick, very dark greyish brown (10YR 3/2), sandy clay and silty clay loam, subangular blocky and friable. The soil reaction is normally slightly acidic.
They overly Bt horizons 30 to 60cm, thick, very dark brown to black (10YR 2/2, 10YR 2/1), clayey prismatic, firm. The soil reaction is slightly alkaline to alkaline.
The Bt horizons overly BC and CB horizons with varying thicknes, colours, textures, and consistency. The soil reaction is normally alkaline.
b) ENTISOLS
Entisols are mostly found developed on alluvial material on the swales seperating the different mesa reliefs, and on convex slopes of the lenticular bench landforms of the plain. They have light coloured ochric A horizons with dry colour values more than 5.5.
Only two subgroup taxas are identified: Ustic Torriorthent and Typic Ustorthent
USTIC TORRIORTHENT
Ustic Torriorthents are well drained soils with a torric moisture regime, an ochric epipedon, and little or no soil development in the subtsratum. They overly stony strata 60 to 70cm thick.
The A horizons are 10 to 12cm thick, very dark greyish brown (10YR 3/2), sandy clay to silty clay loam, crumb structured or subangular blocky and friable. The soil reaction is normally slightly acidic and the organic carbon contents less than 1%.
These sometimes overly weakly developed B horizons 3 to 11 cm thick, dark brown colurs (7.5YR 3/2), sandy clay and friable, reaction is nearly neutral.
TYPIC USTORTHENT
Typic Ustorthents are well drained soils, having an ochric epipedon overlying C material of weathering volcanic tuff about 70cm thick.
The A horizons are 18 to 24cm thick, dark brown (10YR 3/3), clay and clay loam, mostly subangular blocky, friable and slightly acidic.
These horizons normally overly C horizons between 32 and 44cm thick, with textures ranging between silty clay loam and loam, weak stratified structure and friable consistence. The soil reaction is normally nearly neutral.
c) INCEPTISOLS
Inceptisols occur mostly within the plain landscape, but also on shoulders and backslopes of the mesa reliefs on the higher level plateau. The core of the Loita plains is mostly comprised of these soils especially at the transition between the higher plateau and the plain. They have cambic horizons lying directly on volcanic ash parent material.

- IJ-
Other inceptisols result from the truncation of more developed soils on the footslopes and backslopes of the mesa reliefs.
Only three subgroup taxas are identified: Typic Ustropepts, Fluventic Ustropepts and Lithic Ustropepts.
TYPIC USTROPEPTS
Typic Ustropepts are well drained to moderately well drained soils with cambic horizons and sometimes weak, eluvial horizons. The solum has depths ranging between 95 and 140 cm.
The A horizons are 11 to 27cm thick, dark brown to very dark brown (7.5YR 3/2, 10YR 2/2), silty clay loam and silty loam, crumb structured or subangular blocky and friable. The soil reaction is slightly to moderately acidic.
The A horizons overly B or very weakly developed Bt horizons varying in thickness between 13 and 35 cm thick, dark brown to black (10YR 3/3, 10YR 2/1), clay to sandy clay, subangular blocky and friable. The soil reaction is neutral to slightly alkaline.
FLUVENTIC USTROPEPTS
Fluventic Ustropepts are well to moderately well drained soils with organic carbon contents irregularly distributed within the profile. The solum has depths ranging between 95 and 115cm, lying on volcanic ash or colluvio-alluvial deposits.
The A horizons are 10 and 29cm thick, dark yellowish brown to dark brown (10YR 3/4, 10YR 3/3), silty clay loam and clay loam, subangular blocky and friable. The soil reaction is slightly acidic to nearly neutral.
The A horizons overly B or weakly developed Bt 30 to 80cm thick, greyish brown to dark brown (10YR 5/2, 10YR3/3), clay and silty clay loam, subangular blocky and friable. Segregation of iron and manganese oxides is frequent. The reaction is nearly neutral to alkaline soil reaction.
The B or Bt horizons overly BC and CB horizons of varying thicknes dark yellowish brown (10YR 4/6), sandy loam, stratified structure with friable consistence.
LITHIC USTROPEPTS
Lithic Ustropepts are normally like Typic Ustropepts except that the solum varies in depth between 45 and 50 cm.
d) MOLLISOLS
Mollisols mostly occupy summits of the mesa reliefs. The mollic epipedon frequently overlies an argillic horizon. Abundant and thick nodules of calcium carbonate are found in the southern part of the study area. Few times, iron and manganese concretions are present within 60cm of the surface, especially in profiles developed from volcanic ash parent material.
Five subgroup taxa are identified namely: Typic Argiustolls, Aquic Argiustolls, Typic Haplustolls, Aquic Haplustolls and Lithic Haplustolls.

- 136 -
TTPIC ARGIUSTOLLS
Typic Argiustolls are well drained to moderately well drained soils, having argillic horizon and raollic epipedon. The solum ranges in depth between 85 and 110cm.
The A horizons normally are between 15 and 32cm thick, dark brown to very dark brown (10YR 3/3-10YR 2/2), clay loam, crumb structured or subangular blocky and friable. The soil reaction is slightly acidic and organic carbon contents more than 1%.
The A horizons overly Bt horizons between 32 and 45cm thick, dark brown (10YR 3/3), clay, prismatic to angular blocky and friable to firm, soil reaction is nearly neutral to alkaline.
These Bt horizons overly dark yellowish brown to strong brown (10YR 4/6, 10YR 4/4) CB horizons with varying thicknes and friable sandy loam textures.
AQUIC ARGIUSTOLLS
Aquic Argiustolls are moderately well drained to imperfectly drained soils, with eluvial and argillic horizons underlying the mollic epipedon. The solum usually has depths ranging between 70 and 95 cm.
The A horizons are between 22 and 29cm thick, dark brown to very dark greyish brown (10YR 3/3, 10YR3/2), silty clay loam and clay loam, crumb structured or subangular blocky, and friable. The soil reaction is acidic and the organic carbon content range between 1.1 and 2.3.
The A horizons overly E horizons between 10 and 15 cm thick, dark greyish brown (10YR 4/2), silty clay loam and clay loam, weakly subangular blocky and friable. The soil reaction is slightly acidic.
The E horizons overly Bt horizons between 10 and 44cm thick, very dark brown (10YR 2/2), clay, weakly subangular blocky and friable. The soil reaction ranges between neutral and alkaline.
The Bt horizons overly dark yellowish brown (10YR 4/6) BC horizons of varying thicknes and sandy loam texture. The soil reaction is normally alkaline.
TTPIC HAPLUSTOLLS
Typic Haplustolls are well drained soils, with a mollic epipedon and a cambic horizon. The solum ranges in depth between 75 and 110 cm.
The A and Ap horizons are between 16 and 29cm thick, dark reddish brown (5YR 3/2), clay and clay loam, subangular blocky and friable. The soil reaction normally acidic.
The A horizons overly B or weakly developed Bt horizons, between 42 and 81cm thick, dark reddish brown to very dark brown (10YR 5/3, 10YR 2/2), clay to clay loam, prismatic to subangular blocky. The soil reaction is neutral to alkaline.

- 137 -
AQUIC HAPLUSTOLLS
Aquic Haplustolls are moderately well drained to imperfectly drained soils, with mpllic epipedons overlying eluvial and cambic horizons. The solum normally varies in depth between 85 and 95 cm.
The A horizons are between 30 and 32cm thick, dark reddish brown (5YR 3/2), silty clay, subangular blocky and friable. The soil reaction is acidic and the organic carbon content more than IX.
The A horizons overly eluvial horizons between 8 and 10cm thick, dark grey (10YR 4/1), mostly silty clay loam, weakly subangular blocky and friable. The soil reaction is normally acidic and the horizons frequently have segregation of iron and manganese oxides.
The eluvial horizons overly B horizons about 30 cm thick, dark brown (7.5YR 3/2), clay and sandy clay, angular blocky to subangular blocky and friable. The soil reaction is neutral to alkaline.
The B horizons overly dark yellowish brown (10YR 4/4) C horizons of sandy loam texture.
LITHIC HAPLUSTOLLS
Lithic Haplustolls are well drained, relatively shallow soils.
The A horizons are between 15 and 25cm thick, mostly very dark greyish brown, clayey, structure subangular blocky and friable. The soil reaction is nearly neutral.
These horizons normally overly weakly develpoed Bt horizons about 20 cm thick, very dark greyish brown to very dark brown (10YR 3/2, 10YR 2/2), clayey, prismatic to subangular blocky and friable.
The Bt horizons lie directly on yellowish brown (10YR 4/4) weathering rock.
6.4.3 Comparison between USDA and FAO classifications.
ÜSDA (1975) CLASSIFICATION FAO (1987) CLASSIFICATION
Typic Haplustalf Calcic Luvisol
Vertic Haplustalf Vertic Luvisol
Aquic Haplustalf Gleyic Luvisol, Gleyic Planosol
Aquic Natrustalf Gleyic Solonetz
Lithic Haplustalf Calcic Luvisol
Typic Haplustoll Haplic Phaeozem or Chernozem
Aquic Haplustoll Gleyic Phaeozem
Lithic Haplustoll Haplic Phaeozem
Typic Argiustoll Luvic Phaeozem
Aquic Argiustoll Gleyic Phaeozem
Fluventic Ustropept Eutric Cambisol
Typic Ustropept Eutric Cambisol
Lithic Ustropept Eutric Cambisol
Ustic Torriorthent Lithic Leptisol

_ 138 -
CHAPTER 7 INFLUENCE OF SOIL PROPERTIES ON SOIL MANAGEMENT
From the characterization of the soils, several management problems have been identified, namely: erosion, fertility, compactibility and sodicity.
7.1 Erosion
Erosion in the form of erosional steps and topsoil truncation has been observed in the area (Aore, 1988; Situma, 1988; Okoth and Aore, 1988).
Erosion hazard can be assesed by several methods. One of the methods uses carbon contents of the topsoil to assess the susceptibility of surface crust formation (FAO, 1979). Surface crusting enables the development of surface runoff especially when the cover is inadequate. The predictability of surface sealing helps to develop management practises which can lower or eliminate the hazard completely. This study looks at the influence of organic matter content in crust formation. Together with this, other problems associated with erosion hazard such as structural stability, and nature of the subsoil are also discussed.
7.1.1 Carbon content of the topsoil
FAO (1979) has given a procedure for assessing the physical degradation of the topsoil as is influenced by organic matter, percentage fine silt and percentage coarse silt. The procedure is used to calculate the crusting index of the topsoil, a factor which evaluates the hazard of surface runoff.
The crusting index is calculated by:
Ic = 1.5 Zf + 0.75 Zc
C + 10 0M
Where; Ic = crusting index Zf = fine silt X Zc = coarse silt X C = X clay 0M = organic matter
When Ic > 2.5 the soil is susceptible to intense crusting and therefore favours runoff even before saturation of the soil is reached.
When Ic = 1.5 - 2.5 the soil is slightly to moderately crusting.
When Ic < 1.5 the soil is non-crusting.
If organic matter is lacking, the index is calculated by:
Ic = Zf + Zc
C
Values between 0.2-0.5 are for noncrusting soils while values >2 are for very intensive crusting soils.

- 139 -
Crusting of the topsoil not only influences surface runoff, it also hinders seedling emergence with a consequence on the yields.
Following are crusting indices for topsoils where fine and coarse silt has been determined.
Profile X fine silt
X coarse silt
X clay X OM* Ic
146/3-366 21.1 7.6 31.1 2.94 0.62 146/3-367 8.0 1.7 80.0 2.62 0.13 146/3-368 23.7 21.1 31.3 3.86 0.73 146/1-370 45.1 6.6 37.1 5.26 0.80 146/1-371 42.5 9.9 30.5 1.96 1.42 146/1-372 41.7 11.8 27.8 2.80 1.20 146/3-355 36.0 21.5 31.3 4.76 0.89
* organic matter has been calculated from organic carbon by multiplying by 2 (Van Reeuwijk, 1987).
From these results, only the soils of the Angata Loita toposequence are slightly capable of crusting.
If the organic carbon is reduced by 50% the new crusting indices will be:
Profile X fine silt
X coarse silt
% clay X OM* Ic
146/3-366 21.1 7.6 31.1 1.47 0.81 146/3-367 8.0 1.7 80.0 1.31 0.14 146/3-368 23.7 21.1 31.3 1.84 1.03 146/1-370 45.1 6.6 37.1 2.63 1.15 146/1-371 42.5 9.9 30.5 0.98 1.77 146/1-372 41.7 11.8 27.8 1.40 1.70 146/3-355 36.0 21.5 31.3 2.38 1.27
Any activity on the soil which decreases the amount of organic matter content of the topsoil exposes it to the risk of crusting and as such raising the risk of surface runoff. The hazard of surface crusting is higher in soils developed on pure volcanic ash due higher fine silt contents, sanchez (1976) observed that the addition of fresh organic matter as litter, branches and dead roots in the tropical savannas is in the order of 0.5 to 1.5 tons/ha. The conversion of fresh organic matter into soil carbon (humus) is in the order of 30 to 50% per year. Annual burning of the savannas reduces the raw organic matter additions and is therefore undesirable. Exposure and ploughing of the tropical savannas results in a fourfold increase in the annual decomposition rate of soil organic carbon. If this is the case, and assuming that there are no conservation or management measures taken to maintain the organic matter in the soil, the resulting crusting indices would be:

- 140 -
P r o f i l e X f i n e X c o a r s e X clay X OM* ïc silt silt
146/3-366 21.1 1.6 146/3-367 8.0 1.7 146/3-368 23.7 21.1 146/1-370 45.1 6.6 146/1-371 42.5 9.9 146/1-372 41.7 11.8 146/3-355 36.0 21.5
31.1 0.74 0.94 80.0 0.66 0.15 31.3 0.97 1.25 37.1 1.32 1.44 30.5 0.49 2.01 27.8 0.70 2.05 31.3 1.19 1.61
From what is shown the crusting hazard is increased to levels which would favour surface runoff in the event of a storm. The maintenance and possible addition of organic matter is therefore necessary to reduce erosion hazard caused by surface crusting.
7.1.2 Management practises
In order to control erosion hazard caused by loss of organic carbon in the topsoil, it is necessary to use management practises which add or maintain organic matter in the soil. Mulching of the soil using undecomposed raw materials in the form of animal manure, compost or plant materials incorporated as green manure is recommended (Sanchez, 1976). Stubble incorporation is also an effective way of increasing organic matter contents of the soil (Mc Calla et al. 1962, quoted by Martson and Hird, 1978).
Land tenure
Some wheat farmers having their farms on a combination of slopes could prevent surface runoff by constructing terraces or cutting erosional ditches. This is however not done due to the kind of land tenure existing in the area where a farmer leases the land on an annual basis. High soil loses occur in farms where mulching or terracing is not practised when the first storm starts before planting the cleared soil. A land ownership policy which can sustain both cattle raising and large scale wheat production should be developed.
7.2 Structural Stability
7.2.1 Aggregate stability
Percentage aggregate stability has been calculated as flocculation index * 100, for soils in which water dispersable clay and clay using dispersing agents have been determined. The flocculation index obtained from:
(1 - water dispersable clay/clay determined using dispersing agents)
In order to determine which property of the soil had the highest influence on it, statistical correlation was applied using pH, CEC, XC, specific surface area, exchangeable sodium percentage, electrical conductivity and silt:clay ratio.

Correlation statistics for soils in the north
TabOî-33 BASIC STATISTICS
Variable # of observations # of missing values sum mean pH 23 0 171.5000 7.45652 CEC 23 0 613.5000 26.67391 XC 23 0 16.4800 0.71652 SPSA 23 0 12292.0000 534.43478 ESP 23 0 435.8000 18.94783 STAB 23 0 9.7900 0.42565 Ec 23 0 14.4100 0.62652 Silt/Clay 23 0 29.8000 1.29565
Coef of Coef of Variable Variance standard Deviation Skewness Kurtosis pH 0.70439 0.83928 -0.32758 -1.23406 CEC 100.65747 10.03282 -0.21504 -0.97631 XC 0.40643 0.63752 1.88660 3.25742 SPSA 67967.89328 260.70653 1.63695 2.79026 ESP 117.80443 10.85377 -0.13064 -1.10550 STAB 0.02442 0.15626 0.40743 -0.00457 Ec 0.16995 0.41225 -0.19144 -1.38782 Silt/Clay 0.47589 0.68985 0.36066 -0.53007
Standard Error 95% Confidence Inte srval on Mean Variable Coef Variation of the Mean Lover Limit Upper Limit pH 11.25562 0.17500 7.09350 7 .81954 CEC 37.61285 2.09199 22.33436 31 .01347 XC 88.97439 0.13293 0.44077 C (.99227 SPSA 48.78173 54.36107 421.66978 647 .19979 ESP 57.28243 2.26317 14.25318 22 1.64248 STAB 36.71028 0.03258 0.35806 C 1.49324 Ec 65.79997 0.08596 0.44821 C ). 80484 Silt/Clay 53.24325 0.14384 0.99727 1 .59404
CORRELATION MATRIX
CEC XC SPSA ESP STAB Ec SiIt/Clay PH 60.4733 *-0.7161 $0.6478 $0.6439 -0.1845 0.8604 -0.1550 CEC -0.2281 00.4790 (§0.5242 0.0323 0.6124 -0.3400 XC 8--0.5190 $0.6387 0.1931 0.6380 -0.0183 SPSA (§0.4740 0.1931 0.6191 0.1767 ESP -0.2460 0.6670 -0.2366 STAB -0.1639 0.0183 Ec -0.2861
0RDER STATISTICS
Variable Maximum Minimum Range Mi dränge pH 8.6000 5.9000 2.7000 7. 25000 CEC 42.2000 9.5000 32.7000 25. 85000 XC 2.6300 0.0100 2.6200 1. 32000 SPSA 1372.0000 244.0000 LI28.0000 808. 00000 ESP 35.8000 1.4000 34.4000 18. 00000 STAB 0.8000 0.1400 0.6600 0. 47000 Ec 1.2200 0.0600 1.1600 0. 64000 Silt/Clay 2.8000 0.2000 2.6000 1. 50000

Correlation statistics for soils in the south
"fatai5 Coat- BASIC STATISTICS
Variable # of observations # of missing values sum mean pH 14 0 105.200 7.51429 CEC 14 0 487.900 34.85000 XC 14 0 15.240 1.08857 SPSA 14 0 8036.000 574.00000 ESP 14 0 64.900 4.63571 STAB 14 0 8.140 0.58143 Ec 14 0 4.040 0.28857 Silt/Clay 14 0 9.100 0.65000
Coef of Coef of Variable Variance standard Deviation Skevness Kurtosis pH 0.60747 0.77941 -0. 10731 -1.54423 CEC 113.16731 10.63801 -0. 64227 -1.27562 XC 0.21327 0.46182 0. 13237 -0.47608 SPSA 50323.38462 224.32874 1. 98072 3.50206 ESP 5.20555 2.28157 -1. 38245 0.18250 STAB 0.00652 0.08075 -0. 03386 -0.00020 Ec 0.02558 0.15995 0. 31163 -1.20333 Silt/Clay 0.18731 0.43279 0. 50812 -1.14107
Standard Error 95% Confidence Interval on Mean Variable Coef Variation of the Mean Lover Limit Upper Limit pH 10.37231 0.20830 7.06416 7.96442 CEC 30.52514 2.84313 28.70623 40.99377 XC 42.42411 0.12343 0.82186 1.35528 SPSA 39.08166 59.95438 444.44353 703.55647 ESP 49.21717 0.60977 3.31804 5.95339 STAB 13.88854 0.02158 0.53479 0.62807 Ec 55.42650 0.04275 0.19620 0.38094 Silt/Clay 66.58317 0.11567 0.40005 0.89995
CORRELATION MATRIX
CEC XC SPSA ESP STAB Ec Silt/Clay PH $0.6964 *-0.8590 $0.6631 $0.6373 -0.2667 $0.6851 -0.0820 CEC (3-0.5451 0.3855 *0.7937 " -0.5096 0.434! ) (3-0.6052 XC S.-0.7128 -0.4167 0.4416 ' -0.4733 0.0411 SPSA 0.3795 -0.2809 $0.735£ 1 0.4239 ESP -0.3272 @0.586f ) -0.3937 STAB 0.090( ) 0.2927 Ec 0.2144
ORDER STATISTICS
Variable Maximum Minimum Range Midränge pH 8.500 6.300 2.2000 7.4000 CEC 45.800 17.700 28.1000 31.7500 XC 1.930 0.310 1.6200 1.1200 SPSA 1236.000 361.000 875.0000 798.5000 ESP 6.500 0.000 6.5000 3.2500 STAB 0.740 0.420» 0.3200 0.5800 Ec 0.560 0.080 0.4800 0.3200 Silt/Clay 1.400 0.100 1.3000 0.7500
SPSA = specific surface area; STAB = structural stability; Ec = electrical conductance; * = significant at 0.0005; $ = significant at 0.005; @ = significant at 0.01; " = significant at 0.25; & = significant at 0.05

Correlation s t a t i s t i c s for a l l so i l s combined
Tötete. 33 cortt. BASIC STATISTICS
Variable pH CEC XC SPSA ESP STAB Ec Silt/Clay
# of observations 37 37 37 37 37 37 37 37
# of missing values 0 0 0 0 0 0 0 0
sum 276.700 1101.400 31.720
20328.000 500.700 17.930 18.450 38.900
mean 7.47838 29.76757 0.85730
549.40541 13.53243 0.48459 0.49865 1.05135
Coef of Coef of Variable Variance standard Deviat ion Skewness Kurtosis pH 0.65063 0.80662 -0.26660 -1.29363 CEC 118.53892 10.88756 -0.24723 -1.11973 XC 0.35885 0.59904 1.17085 1.11973 SPSA 60086.69219 245.12587 1.69297 2.97993 ESP 123.38892 11.10806 0.62241 -0.97586 STAB 0.02314 0.15213 -0.23305 -0.40809 Ec 0.14071 0.37511 0.46440 -1.09459 Silt/Clay 0.45923 0.67767 0.65470 -0.18871
Standard Error 95% Confidence Interval on Mean Variable Coef Variation of the Mean Lower Limit Upper Limit pH 10.78599 0.13261 7.20938 7.74738 CEC 36.57524 1.77990 26.13663 33.39850 XC 69.87587 0.09848 0.65752 1.05707 SPSA 44.61657 40.29844 467.65741 631.15340 ESP 82.08470 1.82615 9.82796 17.23690 STAB 31.39234 0.02501 0.43386 0.53533 Ec 75.22503 0.06167 0.37355 0.62375 SiIt/Clay 64.45688 0.11141 0.82535 1.27735
CORRELATION MATRIX
CEC XC SPSA ESP STAB Ec SiIt/Clay PH *0 .5289 *-0.7049 *0 .6526 $0.4234 -0.1521 *0.6876 -0.1351 CEC -0.1722 $0.4406 0.1120 0.1091 "0.2808 $-0.5042 XC $-0.5164 *-0.6232 @0.3757 *-0.6475 0.1478 SPSA "0.2765 0.1195 $0.5107 0.1692 ESP -0.4827 *0.7369 0.1342 STAB (3-0.3287 -0.1882 Ec 0.0329
ORDER STATISTICS
Variable pH CEC XC SPSA ESP STAB Ec Silt/Clay
Maximum 8.6000 45.8000 2.6300
1372.0000 35.0000
8000 2200 8000
Minimum 5.9000 9.5000 0.0100
244.0000 0.0000 0.1400 0.0600 0.1000
Range 2.7000 36.3000 2.6200
1128.0000 35.0000 0.6600 1.1600 2.7000
Midrange 7.2500 27.6500 1.3200
808.0000 17.9000 0. 0. 1.
4700 6400 4500

_ 144 -
Table 3#. Monogram showing at which values r is significant
n-2 r0.95 r0.975 r0.99 r0.995 r0.9995 n-2
1 0.988 0.997 0.9995 0.9999 1.000 1 2 0.900 0.950 0.980 0.990 0.999 2 3 0.805 0.878 0.934 0.959 0.991 3 4 0.729 0.811 0.882 0.917 0.974 4 5 0.669 0.754 0.833 0.874 0.951 5
6 0.622 0.707 0.789 0.834 0.925 6 7 0.582 0.666 0.750 0.798 0.898 7 8 0.549 0.632 0.716 0.765 0.872 8 9 0.521 0.602 0.685 0.735 0.847 9 10 0.497 0.576 0.658 0.708 0.823 10
11 0.476 0.553 0.634 0.684 0.801 11 12 0.458 0.532 0.612 0.661 0.780 12 13 0.441 0.514 0.592 0.641 0.760 13 14 0.426 0.497 0.574 0.623 0.742 14 15 0.412 0.482 0.558 0.606 0.725 15
16 0.400 0.468 0.542 0.590 0.708 lé 17 0.389 0.456 0.528 0.575 0.693 17 18 0.378 0.444 0.516 0.561 0.679 18 19 0.369 0.433 0.503 0.549 0.665 19 20 0.360 0.423 0.492 0.537 0.652 20
22 0.344 0.404 0.472 0.515 0.629 22 24 0.330 0.388 0.453 0.496 0.607 24 25 0.323 0.381 0.445 0.487 0.597 25
30 0.296 0.349 0.409 0.449 0.554 30 35 0.275 0.325 0.381 0.418 0.519 35 40 0.257 0.304 0.358 0.393 0.490 40 45 0.243 0.288 0.338 0.372 0.465 45 50 0.231 0.273 0.322 0.354 0.443 50
55 0.220 0.261 0.307 0.338 0.424 55 60 0.211 0.250 0.295 0.325 0.408 60 65 0.203 0.240 0.284 0.312 0.393 65 70 0.195 0.232 0.274 0.302 0.380 70 75 0.189 0.224 0.264 0.292 0.368 75
80 0.183 0.217 0.256 0.283 0.357 80 85 0.178 0.211 0.249 0.275 0.347 85 90 0.173 0.205 0.242 0.267 0.338 90 95 0.168 0.200 0.236 0.260 0.329 95 100 0.164 0.195 0.230 0.254 0.321 100
125 0.147 0.174 0.206 0.228 0.288 125 150 0.134 0.159 0.189 0.208 0.264 150 175 0.124 0.148 0.174 0.194 0.248 175 200 0.116 0.138 0.164 0.181 0.235 200
300 0.095 0.113 0.134 0.148 0.188 300 500 0.074 0.088 0.104 0.115 0.148 500 1000 0.052 0.062 0.073 0.081 0.104 1000
2000 0.037 0.044 0.056 0.058 0.074 2000
-r0.05 -r0.025 -rO.01 -r0.005 -r0.0005
source: Walker and Lev (1953)'
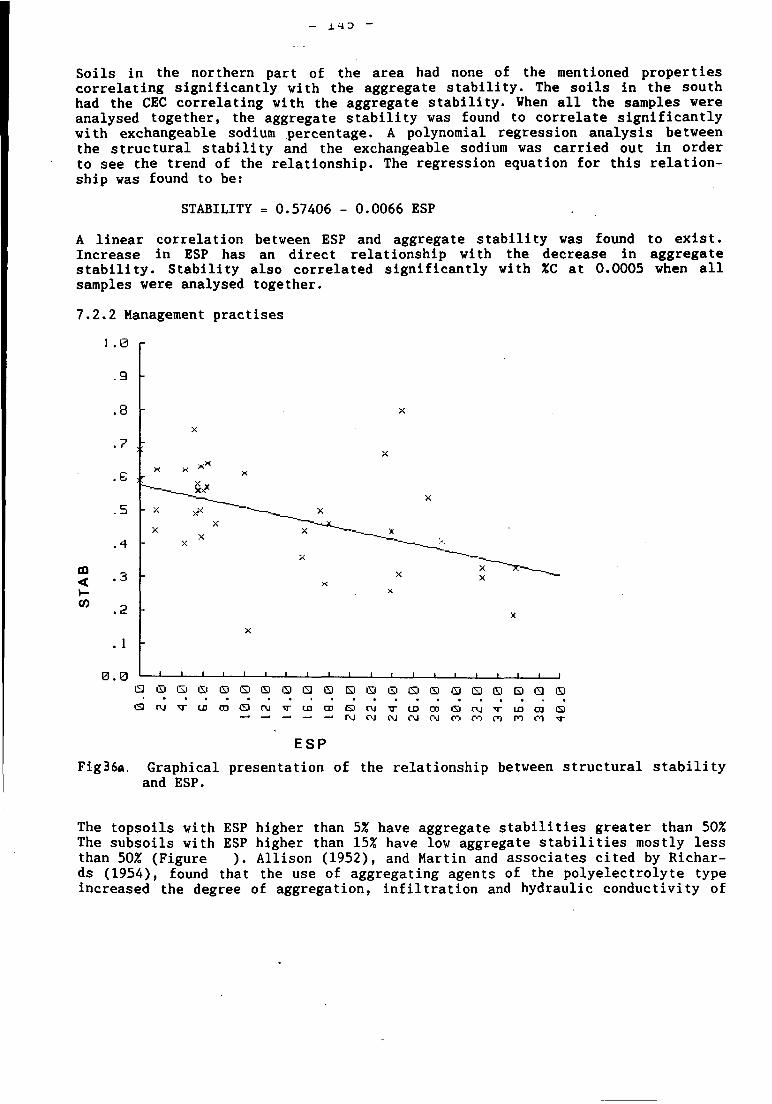
- J.4D -
Soils in the northern part of the area had none of the mentioned properties correlating significantly with the aggregate stability. The soils in the south had the CEC correlating with the aggregate stability. When all the samples were analysed together, the aggregate stability was found to correlate significantly with exchangeable sodium percentage. A polynomial regression analysis between the structural stability and the exchangeable sodium was carried out in order to see the trend of the relationship. The regression equation for this relationship was found to be:
STABILITY = 0.57406 - 0.0066 ESP
A linear correlation between ESP and aggregate stability was found to exist. Increase in ESP has an direct relationship with the decrease in aggregate stability. Stability also correlated significantly with %C at 0.0005 when all samples were analysed together.
7.2.2 Management practises
1 .0 r
.8
,? .
,G
.5
,4
CO <
0)
.3 h
,2
, 1
0.0
'"——-_ *
l 3 0 l 3 S O Q E i i 3 Q E I E S Q G i | 3 i 3 Q Q E I i 3 i s
Q t\i ^r u> CD i3 r\j T r i o c D Q n j T L D O o c 9 n j ^ ~ i o c n C 9 —« — —* pj <••] CM CM CM co co o ro 01 T
E S P
Fig36«. Graphical presentation of the relationship between structural stability and ESP.
The topsoils with ESP higher than 5% have aggregate stabilities greater than 50% The subsoils with ESP higher than 15% have low aggregate stabilities mostly less than 50% (Figure ). Allison (1952), and Martin and associates cited by Richards (1954), found that the use of aggregating agents of the polyelectrolyte type increased the degree of aggregation, infiltration and hydraulic conductivity of

- j.4b -
sodic soils. The aggregating agents are however expensive and not economically viable for agricultural use. Nath, Suneja and Agrawal (1978) also found that the use of farm yard manure and synthetic conditioners in combination improved the structural stability of a sodic soil. Earlier in 1954, the United States Salinity Laboratory had made observations that though organic matter additions were slower to give results, they have long been used in agriculture to give improvements in physical conditions that are sometimes unattainable by chemical aggregants. From these observations, the improvement of structural stability is best tackled using organic carbon incorporated into the soil as stubble or farm yard manure by deep ploughing.
7.3 Compacted subsoils
Management
The management of compacted, sometimes hydromorphic Bt horizons has posed a lot of problems (Brinkman, 1970). Experiments in several European countries, spanning a number of years after drainage and deep loosening of the subsoil, with and without placement of calcium carbonate, have failed to show conclusive economic results. Since the behaviour of the compact subsoils depend on their diagnostic properties each subhorizon shall be dealt with seperately according to Sombroek's nomenclature for the different Bt horizons.
7.3.1 Plano-argillic subsoils
These are Bt horizons associated with Planosols. Dudal (1973) pointed out that the management of these soils depend on the use to which they are to be put. Tile drainage according to him proved to be unsatisfactory because it only removes one impediment, namely, the surplus water during the wet season. Deep ploughing and subsoiling have been used to improve rooting depth and water retention. Nyandat (1984) when studying the problem of these compacted Bt horizons in Kenya found that open drainage ditches together with ripping had the best results on crop yields. Irrigation of these soils for crop production is not recommended (Dudal, 1973). It has a degradational effect especially when the soils are solodic. Structural collapse and blockage of pore spaces are caused by peptization of clay resulting from increase in sodium ions and dilution of the soil solution. Brinkman (1970) is of the opinion that strongly developed Planosols, whether with silty or with sandy surface horizons are probably best left in their present state without efforts at improvements. They are recommended for grasslands or wheat production with low yields.
7.3.2 Natro-argillic subsoils
These horizons apart from their low hydraulic conductivity have high percentages of exchangeable sodium and compact, fine textured Bt horizons. The low hydraulic conductivity is generally caused by low aggregate stabilities and the filling of the pore spaces with fine particles. The United States Salinity Laboratory (Richards, 1954) has classified the salt affected soils in three groups: saline, saline-sodic and sodic soils. Saline soils have a electrical conductivity of the saturation extract (ECe) greater than 4 millimhos per centimetre at 25 C and an exchangeable sodium percentage (ESP) less than 15. The pH reading of a saturated soil is usually less than 8.5. C. In Kenya the following salinity and sodicity classes are used (Muchena and Van der Pouw, 1981).

- 147 -
Salinity Class | ECe (mmhos/cm) | EC (1:2.5 mmhos/cm)
Non - saline 0 - 4 0 - 0.9 Slightly saline 4 - 8 0.9 - 2.0 Moderately saline 8-16 2.0 - 4.0 Strongly saline > 16 > 4.0
Sodicity Class I ESP
Non sodic 0 - 5 Slightly sodic 5 - 1 0 Moderately sodic 10 - 15 Strongly sodic > 15
To compare these with results obtained in the study area the following tables give the depth, ESP and Ec (electrical conductance).
Table .15. Northern part
Profile Depth ESP* Ec
146/1-370 0-10 1.4 0.17 10-28 3.8 0.09 28-53 17.1 1.13 53-79 10.9 0.56 79-97 18.3 0.84 97+ 29.5 0.86
146/1-371 0-25 Ô.O 0.06 25-36 12.6 0.08 36-47 24.3 0.71 47-65 26.8 1.01 65+ 32.7 1.22
146/1-372 0-22 1.7 0.12 22-31 19.2 0.16 31-42 36.8 0.76 42-52 35.5 0.81 52-76 38.9 0.87 76+ 39.4 1.21
146/3-355 0-12 3.7 0.05 12-20 5.0 0.07 20-34 17.1 0.24 34-50 19.8 0.80 50-67 20.0 0.80 67-96 23.7 1.15 96+ 29.3 0.72

Table. 6-, Southern part
- 148 -
Profile Depth ESP* Ec
146/3-366 0-18 0.0 0.13 18-29 0.0 0.08 29-46/50 0.5 0.12 46/50-70 0.7 0.26 70+ 1.3 0.39
146/3-367 0-12 6.2 0.30 12-42 0.5 0.40 42-60 6.9 0.50 60-80 8.5 0.50 80+ 10.6 0.56
146/3-368 0-15 1.5 0.12 15-41 5.5 0.15 41-52 5.7 0.26 52-110 12.4 0.27-
* ESP is calculated from (exchangeable Na/CEC)100
The two tables show that salinity is not a problem in the area as indicated by low electrical conductances. Therefore the problem requiring attention is the one due to sodicity. A polynomial regression analysis was carried out to find out the relationship between pH and ESP. The correlation between the two variables is significant at 0.005 with a correlation coefficient of 0.42344 (see Table...). The regression equation for the two variables is:
pH= 7.06227 + 0.3075 ESP
9 . 6 r
PH
8 . 5
3 . 0
7 . 5
7.13
6 . 0
5 . 0
X
—-x
C3 in G)
Ei
in E i
© in " i
Q
i n Gl
ESP
Fig 37. Graphical presentation of the relationship between pH and ESP.

- 148a-
This shows that changes in the pH would have an influence on the ESP (see figure ). Acidification would help precipitate the sodium ions. Several management
methods exist for decreasing the sodicity hazard. The United States Salinity Laboratory (Richards, 1954) recommends any of the soluble calcium salts, acids or acid formers for sodic soils containing any alkaline earth carbonates as is the case in the area. The soluble salts mentioned include calcium chloride and gypsum. The acid or acid formers include: sulphur, sulphuric acid, iron sulphate, aluminium sulphate and lime sulphur. For the acid formers it might not be wise to use iron or aluminium sulphate since the freed iron oxides might act as phosphorous fixers. Table from the United States Salinity Laboratory gives the amounts of gypsum and sulphur required to replace indicated amounts of exchangeable sodium. Figure also from the same source gives the sequences of determinations for the diagnosis and treatment of saline and sodic soils. Alternative methods of investigation are given under such conditions and possibilities of improvement measures. In order to improve the structure of these soils the use of organic matter is also recommended (Richards, 1954; Taylor et al., 1978). Leaching of the soils is not practical due to very low hydraulic conductivities.
Table 37. Amounts of gypsum and sulphur required to replace indicated amounts of échangeable sodium
Exchangeable Gypsum 1* Gypsum 1* Sulphur Sulphur Sodium (CaS04. (CaS04. (S) (S) (meq/100g soil) 2H20) 2H20)
Tons/acre- Tons/acre- Tons/acre- Tons/acre-foot 2* 6 inches 3* foot 2* 6 inches 3*
1.7 0.9 0.32 0.16 3.4 1.7 0.64 0.32 5.2 2.6 0.96 0.48 6.9 3.4 1.28 0.64 8.6 4.3 1.60 0.80 10.3 5.2 1.92 0.96 12.0 6.0 2.24 1.12 13.7 6.9 2.56 1.28 15.5 7.7 2.88 1.44 17.2 8.6 3.20 1.60
1* The amounts of gypsum are given to the nearest 0.1 ton. 2* 1 acre-foot of soil weighs approximately 4,000,000 pounds. 3* 1 acre-6 inches of soil weighs approximately 2,000,000 pounds. Source: US Salinity Laboratory (Richards, 1954).

_L SOIL SAMPLE
HYDRAULIC CONDUCTIVITY
r -
SAR
yi
SATURATED PASTE
H
NOT A PERMEABILITY
PROBLEM
/ POSSIBLE \ ' TOXICITY \
FROM '" \ H I G H E S P / ' / P O S S I B L E V
NOT A SALINITY
PROBLEM
TOTAL EXTRACTABLE
SODIUM
I
EXCH. POTAS- W
SIUM
^ E
— " \ TOXIC IONS /
N
H pH, SP
SATURATION EXTRACT
CONDUCTIVITY OF
SATURATION EXTRACT
EXCHANGEABLE SOOIUM
I H E S P M C E C I
i
I L NOT AN ALKALI PROBLEM ^t-
6YPSUM
H
ALKALI PROBLEM
/ POSSIBLE \ ,'UNFAVORABLE\ t PHYSICAL ' \ CONDITION /
\ /
ALKALINE EARTH
CARBONATES
LEACHING PROBLEM
H
Figure.- . Sequence of determinations for the diagnosis and treatment of saline and sodic soils: Hf High; L, Low; Rs, electrical resistance of soil paste; SAR, sodium-adsorption ratio; ESP, exchangeable-sodium-percentage; CEC, cation-exchange capacity. (SAR = Na+/ square root of the sum of Mg and Ca). Source: US Salinity Laboratory (Richards, 1954).

- xou -
7.3.3 Abrupto-argi l l ic horizons
These are argillic horizons with vertic properties like those found in the southern part of the study area. They normally have swelling type clays. Tables .35.. and.36. show that these horizons only have little amounts of exchangeable sodium and dont pose sodicity problems. The improvement of soils with vertic argillic horizons has been studied by several workers. Taylor et al. (1978), used CaS04, CaC03, K2S04, synthentic conditioner, and organic matter. They found that the use of 12.5 tons/ha of gypsum on cracking clays improved the hydraulic conductivity of the soils for each of the treatments compared to the control experiment without any treatment. This was attributed to large pore spaces formed and maintained by improved aggregation. Deep ploughing with or without the addition of gypsum also improved the water uptake of the soils. Sodic soils containing montmorillonitic clays are changed to micalike clays when dried in the presence of potassium silicate (Mortland and Gieseking, 1951).
7.3.4 Luvo-argillic horizons
These are argillic horizons of the Luvisols and Typic Haplustalfs. They are fine textured, compacted and slowly permeable. They lack high concentrations of exchangeable sodium and instead have appreciable amounts of exchangeable calcium and magnesium. Chisci et al. (1978) used Glotal, an acid mixture of ferric and calcium sulphates to improve the hydraulic conductivity of calcareous clay soils. This treatment is also appropriate for the abrupto-argillic horizons. The use of Glotal was adopted after Alinari (1948) and Alinari and Jacopozzi-Scotton (1954) formulated a model of micro-aggregate formation due to flocculation and cementation of the clay particles by the gel/sol hydrolysis products of the Fe 3+ salt. Though the extraction of iron oxides from aggregates of several soils does not reduce aggregate stability (Deshpande et al., 1964) some transitional iron forms, bonded to the organic matter are very important in relation to soil aggregate stability (Giovannini and Sequi, 1976). The composition of Glotal is:
Constituents | X by weight
Fe2(S04)3 53 CaS04 34 MgS04 2.5 Fe203 2.5 H2S04 3.0 Others 2.0 H20 13.0
Source (Chisci et al., 1978)
The resulting iron oxides if not complexed with organic matter would act as fixers of phoshorous causing phosphorous deficiency. The use of Glotal should therefore be accompanied by high applications of organic manure to form complexes with the iron oxides and block the fixation sites.
7.4 FERTILITY
7.4.1 Soil acidity
Soil acidity problems are associated with pH levels lower than 5.5 and the

presence of exchangeable aluminium (Sanchez, 1976). Before the late 1950s exchangeable hydrogen was believed to be the cause of soil acidity (Sanchez, 1976). Coleman (1959) proved that exchangeable aluminium is the dominant cation associated with soil acidity. Other aspects related to acid soil infertility include calcium or magnesium deficiency and in certain cases manganese toxicity. The issue of manganese is a little complicated since apart from its toxicity it is also a plant nutrient. Its control is therefore aimed at keeping it within a range between toxicity and deficiency. Sanchez gives these values as 4 and 1 ppm respectively.
From laboratory determinations, only samples collected from the cultivated wheat fields had pH values lower than 5.5. Determinations of exchangeable acidity and exchangeable aluminium were carried out for these soils in order to assess which of the elements was responsible for the acidity. Table gives pH (H20), exchangeable acidity, exchangeable Al, base saturation, exchangeable calcium and magnesium for representative soils. From the table exchangeable aluminium was not registered in any of the soils. Acidity is caused by hydrogen concentration after leaching of the bases. Compared to the southern part the exchangeable calcium in these soils is slightly low. Liming would neutralize any acid effect caused by fertilizers and condition yields of wheat which require pH levels of 6-7 for optimal performance (Landon, 1984). The calcium would also help to stabilize organic matter against decomposition.
Table 38. Properties related with soil acidity for selected samples.
Profile Depth (cm) |
PH H20
Exch. | H + Al meq/100g
Exch. Al |
meq/100g
Base Sat. (%)
Exch. 1. Ca meq/100g
Exch. Mg
meq/100g
146/1-348 0-12 12-32 0-30
5.1 5.4 5.3
0.19 0.24 0.22
-61 51 58
7.6 5.8 6.8
1.9 1.8 1.7
146/1-346 0-16 16-32 0-30
5.3 5.5 5.4
0.09 0.10 0.09 -
63 67 71
7.6 8.3 8.3
2.0 2.4 2.1
146/1-350 0-30 5.4 0.08 - 69 8.0 1.9
7.4.2 Nitrogen
The decomposition of soil organic nitrogen into inorganic compounds called mineralization, consists of three steps: aminization, the transformation of amines into ammonium (NH4+); and nitrification, the transformation of ammonium into (N03-) with a short intermediate stage of nitrite (N02-) formation. These processes are influenced by soil and climatic conditions (Sanchez, 1976; Duchau-four, 1982). Therefore the amount of nitrogen that will be mineralised depends a lot on the soil mineral and chemical properties. Amorphous soils stabilize humus against mineralization and therefore reduce nitrogen availabilty to plants.

± OéC —
Though nitrogen levels are generally high in the survey area (Aore, 1988), its depletion is recorded in the cultivated area by a factor of about 30%. The mean content of available nitrogen on the cultivated land is 0.105 meq/100g (15 ppm) with a range of 0.04-0.20 meq/100g (6-30 ppm) while on the uncultivated land the mean is 0.148 meq/100g (21 ppm) with a range of 0.11-0.21 (15-30 ppm). This indicates that there is a depletion of nitrogen induced by cultivation of crops .
Nitrogen requirements have been found to respond very well with the protein content of wheat. Rüssel (1964) found that if the protein content of unfertilized plants was more than 15.8% there was no response on yields. Contents ranging between 13.8-15.8 decreased in yields, those between 11.3-13.8% had little increase while those between 9.4-11.3 had high yield increases. Other studies by Bauer et al. (1965) found that wheat response to nitrogen was a factor controlled by available nitrate at the time of sowing, available moisture at the time of sowing, amount and distribution of rainfall during the growing-season, and the time of application of the fertilizer. The more stored moisture that was available at seedling, the less seasonal rainfall was required to produce profitable responses to nitrogen application. In the study area, about 220mm of moisture is available in the soil at the planting time (Table 12 ). Aman observed that in general, areas or seasons with less than 300mm rainfall, without reserves of pre-planting, moisture show little value in nitrogen application. Within the study area total available moisture from the pre-planting to harvesting is 274mm. High yields have been obtained with lower rainfall when higher amounts nitrogen is applied. From this observation it would be profitable to apply nitrogen to the wheat fields since at present this nutrient is not applied. Before such an application the protein content of the wheat should be determined.
For the pasture lands it might be necessary to study the responses of certain grass species towards the uptake of nitrogen through bacterial nodules. Studies on nitrogen uptake by different grasses and the relationships with certain micro-organisms have been done in Brazil by Dobereiner and Day (1974), quoted in Sanchez (1976). Some grass species have been found to have responses towards innoculation and nitrogen uptake by Spirillum (a microbacter). Digitaria decum-bens for instance has a symbiotic relationship with Spirrilum Lipoferum. Studies after Dobereiner and Day have been carried out in Florida by Smith et al., (1974) who also found increases in dry matter yields when two species of grasses were innoculated by the same micro-organisms.
7.4.3 Phosphorous
Phosphorous deficiencies are common in highly weathered Oxisols, Ultisols and in slightly weathered Andepts and Vertisols (Almeyda, 1967; Fassbender and Molina, 1967; Sanchez, 1976). This is due to fixation and immobilization of phosphorous by aluminium oxides, iron oxides, calcium and magnesium ions when present in large quantities. Volcanic ash soils normally have high contents of phosphorous (Arana, 1967). Its availability depends on rainfall conditions, where higher rainfall inhibits its release and low rainfall permits it. In the study area the release of phosphorous to plants could be inhibited due to fixation by the amorphous sequioxides present in the soils. Though many fertilizer trials in Kenya don't show it (Mizota, 1987), phosphorous deficiency has been noted in the area (Aore, 1988).
Studies on phosphorous uptake have been quite problematic since in most cases laboratory results are given in total phosphorous. Sanchez (1976) observed that

determination of total phosphorous was not a good tool to evaluate the availability of phosphorous to the plant. According to him, phosphorous in the soil solution determines the amount that is available for uptake by a plant. It is necessary to keep constant 0.07 ppm of phosphorous in the soil solution for clayey soils and 0.2 ppm for sandy soils in order to supply the 2,000 ppm phosphorous accumulated by plants in their tissue during growth. Therefore the relationship between the amount of inorganic phosphorous added to the soil and equilibrium concentration of phosphorous in the soil solution is a good parameter for determining how much phosphorous fertilizer should be added to arrive at a desired levels of soil solution phosphrous. These relationships are obtained in laboratory by adding various amounts of phosphorous to the soil, shaking for 6 days, and determining how much remains in solution.
Apart from determining the relationships between phosphorous in the soil solution and the added phosphorous, the release of fixed phosphorous needs to be observed when silicate fertilizers and lime are added to the soil. Sanchez observed that there was positive response towards the application of silicate fertilizer and lime on P release. This is explained by the fact that silica reacts with the aluminium and iron oxides to form siliceous Al- and Fe-oxides which block the fixation sites. Too much liming is not advisable since calcium also fixes phosphorous from the superphosphates when its contcentration is high.
7.A.4 Potasium
Potassium levels remain nearly the same for cultivated and uncultivated soils. On the cultivated soil the mean available content of this nutrient is 1.526 meq/100g (597ppm) with a range of 390-1091ppm. On the uncultivated soils the mean is (576ppm) with a range of 390-737ppm. Excess amounts of potassium result in magnesium deficiency (Flegman, 1975).
7.4.5 Ion exchange
Birrell and Gradwell (1956) when working on ion-exchange phenomena in soils containing amorphous material, concluded that physical adsorption of cations by such soils is responsible to a greater or lesser extent for the apparent high cation-exchange capacity shown. Apart from broken bonds and isomorphous substitutions in the lattice layers, specific surface area also has a relationship with the cation exchange capacity of the soil (van der Marel, 1966). The larger the surface area, the higher the ion exchange capacity. Cationic exchange is also related to the charge characteristics of the clay minerals involved (Sanchez, 1976). Most 2:1 layer silicates (i.e montmorillonite, vermiculite, illite), 2:2 layer silicates (chlorites) and to a lesser extent the 1:1 layer silicates (kaolinite, halloysite) have a permanent charge or constant charge. The other group of minerals i.e intergrade minerals (mixtures of 2:1 minerals with iron and aluminium hydroxides) and several species of iron and aluminium oxides have variable charge. The variable charge is normally pH dependent (Sanchez, 1976) and therefore can be regulated by changes in pH. Charge charac-terists of clay minerals from some soils in Kenya are given in Table

- 154 -
GO.e
50.0
U u
40.0
312.0
x , x
X X
X
X X
£0.0
10.0
_-.---*
0.0
in ID
IS CD en
DH
Fig 39. Graphical presentation of the relationship between CEC and pH.

- 155 -
Table 39. Charge characteristics of clay minerals from some soils in Kenya (meq/100g)
Cation Exchange Capacity Anion Exchange Exchange
Permanent Variable Total Capacity
Montmorillonite 112 6 118 1 Vermiculite 85 0 85 0 Illite 11 8 19 3 Halloysite 6 12 18 15 Kaolinite 1 3 4 2 Gibbsite 0 5 5 5 Goethite 0 4 4 4 Allophanic colloid 10 41 51 17 Peat 38 98 136 6
Source: Mehlich and Theisen (cited in Sanchez,1976)
In oxide systems the charge is entirely pH dependent. Oxide systems in soils may exhibit net negative charge (CEC), net positive charge (AEC) or no net charge at all (Sanchez, 1976). The charge status of an oxide system can easily be determined by measuring pH in water and a neutral salt such as normal KCl. Meharu Uehara (1972) defined *pH as the difference between pH in KCl and pH in water. If ~pH is positive, there is net positive charge and if it is negetive there is a net negative charge. Thus the sign of *pH corresponds to the sign of the colloidal charge.
According to samples analyses in the survey area, there is no anion exchange capacity.
Though CEC is not a problem in the area a relationship between it and the pH has been established using polynomial regression to see the changes which can take place on the alteration of the pH. The regression equation for this relationship is:
CEC = -23.627 + 7.139 pH
See figure 39 for a graphical presentation of this relationship. Low CECs especially in the E horizons may be raised to desired levels by raising the soil pH according to the equation.

- 156 -
CONCLUSIONS
Inspite of being formed from volcanic tuff, the soils in the Loita Plains don't have the usual andic properties. Their physical, chemical and mineralogical properties lack properties related to volcanic ash soils as shown by the following characteristics.
Physical
The soils in the area have higher bulk, densities (1.1-1.7) than Andosols or Andisols as indicated in the FAO or USDA taxonomies. They have good water holding capacities (mean 56.8 wt£).
Chemical
The carbon contents (0.01-2.63) though not as high as those found under more humid conditions are enough to classify the soils as humic. There is ah increase of carbon contents down each toposequence, a fact conditioned by higher soil moisture in the lower slope positions or accretion by downslope translocation.
The soil reaction is slightly acidic in the topsoils and becoming more basic in the subsoils. An average pH of 6.6 is recorded for the topsoils and increase with depth to values of 8.2 or more in the subsoil due to high exchangeable sodium percentage. Exceptions occur in the Maji Moto toposequence where the average pH from the topsoil to the subsoil is about 7.2.
The CECs are generally high (mean 29.7 meq/100g soil) except- in the E horizons where translocation or destruction of clay reduces the exchange sites. In all cases a maximum value is obtained in the Bt horizon.
The base saturation is high except in a few cases when values below 50% are obtained.
Mineralogical
From X-ray analysis most of the soils are found to be very amorphous though the nature of the amorphous material is not clearly understood. Kaolinite, halloys-ite, mica and or illite are the dominant crystalline clay minerals with traces of quartz and feldspars as primary minerals. Due to lack of allophanic material and low values of active silica, Al and Fe oxides obtained by dissolution, the soils cannot be grouped with volcanic ash soils.
GENESIS AND CLASSIFICATION
Climate, topography, parent material and vegetation influence soil formation in the area.
Most soils classify as Luvisols according to the FA0-UNESC0 classification and Alfisols in the USDA taxonomy. Planosols are only found in the plain landscape at the midslope position and on the swale position of the undulating plateau landscape. Three genetical groups, separated according to geographic position, soil distribution, climatic conditions, parent material and internal soil characteristics are identified in the area.

- 157 -
The Bar Kitabu Lomanera group
This group consists of transects 1, 2, and 6. The group has higher clay contents in the Bt horizons when compared to the other groups. Apart from the topsoils, the midslopes are comprised of Typic Haplustalfs and the lover slopes of Vertic Haplustalfs. Transects 1, and 2 have Typic Haplustalfs while transect 6 has a Typic Argiustoll at the summit position. They all have high CaC03% and CECs when compared to the other transects.
The Maji Moto Group
This transect is on the plain landscape and is separated from the rest by its low carbon contents and the climatic environment. It falls within the driest part of the area and is the only transect where Planosols occur within the lower midslope position. The higher positions have Ustic Torriorthents and the lower positions have Aquic Haplustalfs.
The Angata Loita Group
This group occupies the higher level plateau landscape and the piedmonts of the Lekanga Hill. It is separated from the rest by high sodium contents. Two transects (3 and 5) comprise this group. The soil associatiations are Typic Natrustalfs on the summit position except on trasect 5, Aquic Natrustalfs on the midslope position and soils influenced by aluvial material (Fluventic Ustropepts) on the lower slopes. Aquic Natrustalfs occupying lower backslope and footslope positions on the higher plateau landscape morphologically resemble Planosols. They differ in the amounts of exchangeable sodium which in all cases are more than 15% within the subsoil. In the FAO-UNESCO classification they classify as Gleyic Solonetz.
MANAGEMENT
Several soil related problems namely: erosion, low structural stability, compacted subsoils and in some cases low fertility have been identified in the area.
Erosion
In order to control erosion hazard caused by the loss of organic matter in the topsoil, it is necessary to use management practises which add or maintain organic matter in the soil. Mulching of the soil and stubble incorporation are some of the methods suggested.
Soil loss caused by improper management of the land and lack, of conservation measures can best be tackled by the development of a land ownership policy which can sustain both cattle raising and large scale wheat production.
Structural stability
The improvement of structural stability can best be obtained by additions of organic matter in the soil through addition of farm yard manure.

- 158 -
Compacted subsoils
These require different management practises depending on the internal characteristics of each soil but the most recommended is deep ploughing with the addition of gypsum or conditioners which increase the soil hydraulic conductivity. Ripping and open drainage ditches have been found to work in other parts of Kenya.
Fertility
Soil acidity
Though soil acidity is not a problem in the area, wheat cultivation seems to lower the soil pH. Liming to slightly higher pHs is recommended.
Nitrogen
The addition of nitrogen is necessary to compensate its depletion in the cultivated wheat fields.
Phosphorous
Phosphorous deficiency found to occur in the area can be improved either by the application of inorganic phosphate fertilizers or by mobilizing the fixed phosphorous using organic matter or silicate fertilizers.
Potasium
Potasium deficiency was not observed in the area.
Ion exchange
Though in most cases the ion exchange posed no problems, little liming is necessary to raise pHs especially in the E horizons where low pH and CEC have been observed. Since part of the soils is amorphous, they have pH dependent charge which can be improved by raising the pH.

- 159 -
BIBLIOGRAPHY
Alinari,E., 1948; Ann. chim. Appl., 38, 212-234.
Alinari,E. and Jacopozzi-Scottorn,G., 1954; Ann. Sper.,VIII, p899-917.
Allison,L.E., 1960; Wet combustion apparatus and procedure for organic and inorganic carbon in the soil. Soil sei. soc. Amer. Proc. 24:36-40.
Andrew Parker, 1970; An index of weathering in silicate rocks. Geo. Magazine (1970) Printed in Great Britain.
Aore W.W., An assessment of the effects of wheat cultivation on the land qualities in the Angata Loita plains, Kenya.
Baize D.,1981; Isoquartz Balance in a Planosol of the Paris Basin. Migrations organo-minerales dans les sols tempères, Paris, France; Centre National de la Recherche Scientific,p. 365-375.
Baker,J.,1977; the reaction of two luvisolic forest soils to phosphate fertilization.,Canadian Journal of soil science, 57 (4) 385-395. Northern Forest Research Service, Fisheries and Environment Canada, Edmonton, Alberta T6H 355,Canada.
Banarjee,G., 1956; temperature dependence of free energy change of exchange reactions in clays. J. Indian Soc. Soil Sei.4, p.221-223.
Beek,K.J., Blokhuis,V.A., Driessen,P.M., Breeman,N.Van, Brinkman,R.,Pons,L.J. 1980; Problem soils, their reclamation and management in land reclamation and management. International Institute for land reclamation and improvement, publication, ISBN 90-70-26061-1, Wageningen, Netherlands. ILRI,Vol 27, p.43-72.
Bennema,J. and Vettori,L., 1960; The influence of the carbon/clay and silica/sesquioxydes ratios on the Ph of Latosols. 7th intern, congress of soil sciences, Madison wise. U.S.A. U34.
Berg,W.A., Thomas,G.W., 1959;anion elution pattern from soils and clays. Soil Science Soc.America Proc. 23, 348-350 [N.C. St Coll., Raleigh; Va. Polytech. Inst.]
Bertrand,R., 1973.; contribution to the hydrological study of the grey hydromorphic soils of casamance (Senegal). Agronomie Tropical, Vol 28, no 12, 1973, p.1145-1192.
Besoain,E., 1964; Volcanic ash soils of Chile. Meeting on the classification.
Birrell,K.S.,and Fields,M., 1952; Allophane in volcanic Ash soils. Reprinted from Jour. Soil Sei. 3(2): 156-166.
Birrell,K.S.,Fields,M., and Williamson,K.I., 1955; Am. Mineral-40, unusual forms of Halloysite. 122-124pp.
Birrell,K.S.,and Gradwell,M., 1956; Ion-exchange phenomena in some soils containing amorphous mineral constituents. Journal of soil sciences (vol 7, No. 1 1956).

- 160 -
Birrell,K.S. 1964; Some properties of volcanic ash soils. Meeting on the classification and correlation of soils from volcanic ash. Tokyo, Japan, 11-27 June 1964. FAO, World Soil Resources Report No. 14.
Birrell,K.S., 1961; N.Z.J.Sei. 4, Ion fixation by Allophane. p393-414.
Birrell,K.S., 1964; FAO: World Soil Resour. Rep. 14; Some properties Of volcanic ash soils. p74-81.
Black, C.A., 1965; Methods of soil analysis. Agronomy no.9, American Society of Agronomy Inc., Madison, Wisconsin, USA. 2 vol 1572 pp.
Blakemore,L.C.,Searle,P.L. and Daly,B.K., 1981; Methods for chemical analysis of soils. N.Z. Soil Bur. Sei. Rep. 10A. Soil Bureau, Lover Hill, New Zealand.
Blakemore,L.C.,Seane,P.L. and Daly,B.K., 1987; Methods for chemical analysis of soils N.Z. Soil Bureau Sei. Rep. 80. Soil Bureau, Lover Hill, Nev Zealand.
Blanche,T.R., 1959; the energy of adsorption of mineral ions by soil colloids, and the mineral nutrition of plants. 2. application of energies adsorption to soil investigations. Ann. Agron. Paris 10, pp. 125-154 [F.e.g.r] [Sta. Cent. Agron..Versailles]
Bocquier G., 1973. Genese et evolution de deux toposequence de sols tropicaux du Tchad; Interpretation Biogeodynaque. Memoires Orstom No 62, 0RST0M Paris.
BornandjM., Callot, G., Favrot, J.C., 1968; La carte pedologique du Val d'Allier au 1/100.000. Bull Ass. franc. Etude Sol 6, 21-29.
Bover,C.A., Gardner,W.R., Goertzen,J.O. 1957; dynamics of cation exchange in soil columns. Soil Science Society of America. Proceeding 21, p. 20-24 [xx 764]
Brian T. Bunting, 1967; The geography of soil. Hutchinson & Co.(Pul.)LTD. 178-202, Great Portland Street, London, U.K.
Brindley,G.W. and Fancher,D. 1969; In L.Heller(ed); Kaolinite defective structures. Possible relation to Allophanes. Proc. Int. clay conf. 1969. (Tokyo, Japan) 2: p29-34.
Brinkman,R., 1977.; surface-vater gley soils in Bangladesh. Goederma, Vol 17, no.2, p. 111-144.
Buol,S.W., Hole,F.D. and Macracken,R.J., 1980; Soil genesis and classification. Iova state University Press-Ames.
Central Bureau of Statistics (1979) Nairobi,Kenya.
Catalan, R.L., 1984 clay mobility in some soils from Kenya and Sudan. Department of Soil Science and Geology. Agricultural University Wageningen, The Netherlands.

- 161 -
Charles, Amuyunzu Lwenya, 1983/84.; land resource inventory as a basis for land evaluation and rural development: the role of remote sensing techniques.( A case study from part of Narok district, Kenya ) M.Sc Thesis, Department of Rural and Land Ecology Survey, International Institute for Aerial Survey and Earth Sciences (ITC), The Netherlands.
Chisci, G. Lorenzi, G. and Piccolo, L. 1978. Effects of a ferric conditioner on 'clay soils. In Modifications of soil structure; edited by W.W. Emerson, R.D. Bond and A.R. Dexter; chapter 41.
Coleman, N.T., Weed, S.B. and McCraccen, R.J. 1959. Cation exchange capacity and exchangeable cations in piedmont soils of North Carolina. Soil Sei. Soc. Am. Proc. 23: 146-149.
Coleman, N.T. and Thomas G.W. 1967. The basic chemistry of soil acidity. Agron. monogr. 12: 1-41.
Curtis F.Marbut, 1934; Soil survey, Bureau of chemistry and soils. U.S. Dept. of Agric. Pedology as a science displine. Pedology publications, New Brunswick, New Jersey.
Desaunettes, J.R., 1964; Le paleopodzol de Xanthi. Sei. Sol 2
Deshpande, T.L., Greenland, O.J. and Quirk, J.P. 1964. In Nature, 201:107-108.
Development Committee, Colony and Protectorate of Kenya, 1964;Report vol 2
D'Hoore, J.L., 1964; Soil map of Africa, scale 1:5,000,000,Explanatory Monograph. CCTA 93, 205 p.,6 maps Lagos.
Dixon, J.B. and McKee, T.R. 1974. External morphology of tubular and spheroidal halloysite particles. Clays Clay Minerals 23.
Dobereiner, J., Day, J.M., and Dart, P.J. 1972 Nitrogenase activity in the rhizoshere of sugarcane and some other tropical grasses. Plant and Soil 37: 191-196.
Dobereiner, J. and Day, J.M. 1974. Associative symbiosis in tropical grasses: Characterization of microorganisms and dinitrogen fixing sites. Paper presented at the International Symposium on N2 fixation, Washington State University, Raleigh.
Donker,N.H.W. 1987. WTRBLN: A computer program to calculate water balance. Computers and geosciences Vol.13, No. 2, 95-122pp.
Doorenbos and Pruit, 1977; Crop water requirements: FA0: Irrigation and Drainage paper No. 24,FA0, Rome.
Doorenbos and Kassam, 1979; Yield response to water; FAO: Irrigation and Drainage paper 33, FA0, Rome.

- 162 -
Duchaufour, P.,1982; pseudogley, pedogesis, and classification. Translated from french to english by T.R Paton of french ed Pédologie. LONDON, ALLEN & UNVIN 1982. 448 pp.
Dudal,R., 1964; Correlation of soils derived from volcanic ash. Classification and correlation of soils from volcanic ash, Tokyo, Japan, World Soil Resources Report No 14.
Dudal} R., 1968; definitions of soil units for the soil map of the world Rome, FAO, 1968. 72 pp. World Soil Report no.33.
Dudal,R., 1973; "Pseudogley and gley" Transactions of Commissions 5 and 6 of the International Society of Soil Science., p. 275-285.
Dudal,R., 1965; Dark clay soils of tropical and subtropical regions. FAO AGRIC. DEV. Paper no. 83. 161 pgs.
During,C.,1964; The Amelioration of volcanic ash soils in New Zealand. Meeting n On classification.
Eduardo Besoain, 1968; Imogolite in volcanic soils of Chile. Reprinted from Geoderma 2(2) 151-169.
Egava Tomoji, 1977; Properties of soils derived from volcanic ash. Reprinted from pg 10-63 of soils derived from volcanic ash in Japan. Y.Ishizuka & C.A.Black eds, Centro Internacional de mejorameto de maizy Trigo, Mexico City 1977, 102p.
El- Swaify, S.A., Walker,J.S., Virmani,S.M., 1984.;dryland management alternatives and research needs for Alfisols in the Semi-Arid Tropics. 38 pgs.
Erwin Frei, 1978; Andepts in some high mountains of East Africa. Reprinted from Geoderma 21-119-131.
Eswaran H., 1972 Morphology of allophane, imogolite and halloysite. Reprinted from Clay Minerals.
Faivre, P., 1977.; planosolic soils with differentianted profile and black Bt horizos in Colombia (South America).Science du Sol, p. 95-110. Mission Fracaise de Cooperation Tech., Inst. Geog. A. Codazzi, Bogota Colombia.
Faivre, P.; Andreux, F, Duchaufour,P., 1975.; the organic matter of some planosols with a black Bt horizon in the Colombian Andes. Comples Rendus Hebdomadaires des Seance de l'Académie des Sciences, D, Vol. 281, no. 14, p. 981-984. In French, Summary in English.
FAO-UNESCO,1974; Approaches to Land Classification. Soils Bulletin No 22 FAO Rome.
FAO-UNESCO,1974; Soil map of the World; 1:5,000,000. Revised legend.World Soil Resources Report.FA0, Rome.

- 163 -
FAO, 1977; Guidelines for soil profile description, FAO, Rome.
FAO, 1979; Report on the Agro-Ecological zones project, vol 1. Methodology and results for Africa. Food and Agriculture Organization of the United Nations. World Soil Resources report no. 48.
FAO-UNESCO, 1987; Soil map of the World,Revised legend. Ammended Fourth Draft. World Soil Resourceseport. FAO, Rome.
Fields, M. 1955. Clay mineralogy of New Zealand soils. N.Z.J.Sei. Tech. 37B; Part 2:336-350.
Gebhardt,H. and Coleman,N.T.,1974; Anion adsorption by Allophanic Tropical soils. Reprinted by permission from soil sei. soc. of America. Proc. 38: 255-259.
Georgievski, A. 1888; Angaben über russische Bodenuntersuchungen. Kries Luga (Gvt.St. Petersburg ), IV.
Giovannini, G. and Sequi, P. 1976. In J. Soil Sei., 27:148-153.
Glatzel, G. 1982.; site studies to aid management of forest sites with heavy pseudogley soils in South-eastern Austria. "Centralblatt" fur das Gesamte Forstwesen (1982) 99(2) 65-88. Inst. Forstokol., Univ. Bodenkultur, Peter-Jordan-Str.82,A-1190 Vienna, Austria.
Gorshenin, K.P., 1955; Soils of Southern Siberia (from Urals to Baykal). Izv. An SSSR. In: Umfimtseva , K.A.,(85) , Moscow (1955).
Government of Kenya, 1986; Economic Management for Renewed Growth. Sessional Paper No.l. Government Printer Nairobi.
Guy D.Smith, 1978; A preliminary proposal in Reclassification of Andepts and some Andic subgroups. Reprinted from an unpublished paper -20p
H.E. Dregne, 1976.; soils of arid regions. Elsevier Scientific Publishing Company Amsterdam, Oxford, NewYork, 1976.
H. Eswaran, G.Stoops & P. de Paepe, 1973; a contribution to the study of soil formation on Isla Santa Cruz, Galapagos. Journal of Pédologie, XXIII, 2, p.100-122, Ghent.
Hinga, G., F.N. Muchena, CM. Njihia, (eds.); Physical and chemical methods of soil analysis. Internal Publication, National Agricultural Laboratories, Nairobi.
Hunter, C.R.; Frazier, B.E.; Busacca, A.J. Lytel series. A nonvolcanic Andisol, Soil Sei. Soc. Am. J 51: 376-383.
ICOMAND, 1986 ; Circular letter no. 8 30th may 1986.
ICOMAND, 1987; Circular letter no 9 1st may 1987.

- 164 -
ILCA, 1969. Panel on soils derived from volcanic ash in Latin America. Inter-American Institute of Agricultural Sciences. Turriabla, Costa Rica.
ILACO B.V. 1981. Agricultural Compedium for rural development in the tropics and subtropics; Elsevier Scientific Publishing Company, Amsterdam-Oxford - New York.
Jenny H., 1941; Factors of soil formation. McGraw-Hill.
Kanno, Ichiro, 1962; Genesis and Classification of humic allophane soil in Japan. Joint meeting of commissions IV and V. Transactions, International Society of Soil Science, New Zealand.
Kikuchi, K., 1981.; interpretative classification of the soils in Tokachi district it's mapping and application to practical uses of soil improvement. Report of the Hokkaido Prefuctural Agricultural Experimental Stations . no.34, 118 pp. Hokkaido Prefectural Tokachi Agri. Exp. Stations, Memuro, Hokkaido, 082 Japan.
Kishita,A., 1959.; effect of air drying on the dispersion of volcanic-ash soil and on it's maximum dispersion. Journal Sei. Soil, TOKYO 30, 75-78. [J] Soil and Plant Food, 43-44 [National Institute of Agricultural Science. Tokyo].
Koinoff, W., 1966; Soils with Mediterranean character in Bulgaria . Trans. Conf. Medit. Soils, Soc.Esp. Ciencia del Suelo, 156-162, Madrid.
Kub iena, V.L., 1953;The soils of Europe. Thomas Murby and Co.,317 p., London.
Laktinov, B.I., 1962.; the nature of the high dispersion of Solonestic soils and chemical methods for reclaiming Solonetse. Pochvovedenie no.6, p. 78-87 [R.e] ISkadov. Opyt.Stants]
Lenvef, N., 1959. L'altération des granites calcoalcalins et des granodiorites en Cote-d'ivoire forestière et les sol qui en sont derives. State Doctural Thesis , University Paris.
Liverovski, Yu. A. ; Rosilikova V.I.;1962; genesis of some meadow soils in the maritime territory. Soviet Soil Science 8, 814-823.
Markert,S., I960.; some experiments on the effects of K and Ca ions in single and mixed solutions on the state of soil dispersion. Albrecht-Thaer-Arch.4, 597-610. [G.r.e] [Inst. Landw. Verswes, Leipzig].
Matsumoto,S., Honna,T., Takata,H., 1977; volcanic ash soils in chugoku district, Japan. 4. some chemical properties of Hirusen volcanic ash soils. Journal of the Science of Soil and Manure, Japan 48(11-12) 497-501 [Ja].Faculty of Agriculture, Tohori University, Japan. From Soil Science and Paint Nutrition 24,170.
McBratney A.B., & Webster R., 1983.; How many observations are needed for Regional estimation of soil properties. The Journal of Soil Science Vol 135, pp 177-183. The Williams and Wilkins Company.

- 165 -
Meteorological Department, 1986; Summary of Rainfall in Kenya. Nairobi.
Mehlich, A., Pflanzener, Z.; 1967 Bodenk. 117 (3) ,193-204.
Misopolinos, 1985.; a new concept for reclaiming sodic soils Journal of Soil Science . Volume 140, no.l pages 69-74.
Mizota, C. 1987. Chemical and Mineralogical Characterization of soils derived from volcanic ashes. In Agriculture and Soils in Kenya. Edited by Shohei Hirose. College of Agriculture and Veterinary Medicine Ninon University, Tokyo, Japan.
Mohr,E.C.J., van Baren ;1953 Tropical Soils.
Morras, H.J.M.;1979.; discussion on soil formation mechanisms in the genesis of planosols and related soils. Science du Sol, nol, pp. 57-66. in French.
Moss,H. C. ; St; Arnaud,R.J.; 1955;grey wooded (podzolic) soils of Saskatschewan, Canada. Journal of Soil Science , VI, 2, 293-311.
Muchena, F.N.; 1987; Soils and irrigation of three areas in the Lower Tana Region, Kenya. Ph.D thesis, Vageningen, the Netherlands.
Munsell Soil Colour Charts, 1954. Munsell colour co., Baltimore, Md.
Murphy, C. P.,1984; the morphology and genesis of eight surface water gley soils developed in till in England and Vales. Journal of Soil Science, Vol.35, no.2 pp. 251-272.
Nikiforoff, C.C.; Drosdoff, M.;1943; genesis of a clay pan soil, II, Soil Science ,56. pp. 43-62.
Nyandat, N.N., 1984; A land evaluation for the soils of the South Kinangop area. Ph.D thesis, Agricultural University of Wageningen, Vageningen, the Netherlands.
Ojany and Ogendo, 1973; The Geography of Kenya. Nairobi, Kenya.
Oldeman Peter, 1985; a land evaluation for two types of agriculture in a part of Narok district Kenya . Scriptive voor het bijvak Landevaluatie . Fysish Geografisch en Bodemkundig Laboratorium Universiteit van Amsterdam.
Ohmasa, M. 1964. Genesis and Morphology of volcanic ash soils. Meeting on Classification and Correlation of soils from volcanic ash, Tokyo Japan, June 11-27, World Soil Resources. Report No. 14.
Okoth P.P. and Aore V.V. 1988; Reconnaisance Soil Survey of the Agata Loita-Lomanera area (Southwest Kenya). ITC, Enschede the Netherlands.

- 166 -
Patrick, W.H. Jr., 1981; bottomland soils in wetlands of bottomland hardwood forests, [edited by Clark, J.R.;Benforado, J.] Amsterdam, Netherlands; Elsevier Scientific Publishing Company, pp.177-185 [En] Laboratory for Wetland Soils and Sediments, Center for Wetland Resources,Louisiana State University, Baton Rouge, Louisiana 70803, USA.
Pons,L.J., 1980; problem soils, their reclamation and management in land reclamation and management. International Institute for Land Reclamation and Improvement,Publication, ISBN 90-70-26061-1, Wageningen, Netherlands.ILRI Vol 27, p.43-72.
Richards, L.A.(ed.), 1954; Diagnosis and improvement of saline and alkali soils. Agricultural Handbook 60. US. Department of Agriculture, Washington, DC.
Roose, E.J., 1970; Cah. Orstom. Ser. Ped. VIII (4),469-482.
Roose, E.J., Godefroy, J., 1977; Cah. Orstom, Ser. Ped. XV (4), 409-436.
Rüssel, J.S. 1964. Some observations on the influence of nitrogen fertilizer applied at seedling on the nitrogen content of the wheat grain; Aust. J. Exp. Agric. Anim. Husb.; 4:345-351
Sanchez F.E. 1976; Properties and Management of soils in the tropics. A Willey Interscience Publication.
Saggerson,E.P., 1966; Geology of the Loita Hills area. Ministry of Natural Resources, Wildlife and Tourism. Geological Survey of Kenya.
Schafer, R.L., Bailey, A.C., 1903; computer automation of soils dynamics research. Journal of Terramechanics (1980) 17 (4), pp.181-195 (En) National Tillage Machinery Laboratory, Agricultural Research, Science and Education Administration, US. Department of Agriculture, Auburn, Alabama 36830, USA.
Schouwenburg, J.Ch.van, Walinga I., 1978; Methods of analysis for plant material. MSc. course Soil Science and Water Management. Agricultural University of Wageningen,The Netherlands.
Servat, E., 1966; Conf. Pédologie Medit., Madrid, 406-411.
Siefermann, G. 1969. Sols de quelqus regions volcaniques du Cameroon. State Doct. Thesis. Fac. Sei. Strasbourg.
Silva Madeira Neto,J., de Macedo,J., Guimaraes de Azevedo, L.,1982; Brazilian problem soils: distribution characteristics and utilization. Tropical agriculture Research Series, no.15, p.1-20.
Situma,E.M., Grasslands of Loita-Aitong, Mara area: (Composition, Distribution, Ecology and Production). Msc Thesis, ITC, Enschede, The Netherlands.

- 167 -
Sloboda, A.V., 1935; differentiation within horizons and along the profile of a surficially gleyey loam in the low shrub tundra. Soviet Soil Science (1980), 12 (1) 29-40 (En, 21 ref Translated from Pochvovedenic 1980) no.1,33-43. Institute of Biology, Comi Branch, USSR Academy of Sciences,USSR.
Smith, R.L., Bouton, J.H., Schank, S.C. and Queensberry, K.H. 1975. Yield increases in tropical grain and forage grasses after innoculation with Spirillum Lipoferum in Florida. Paper presented at the conference on biological nitrogen fixation and farming systems of the humid tropics. International Institute for Tropical Agriculture, Ibadan, Nigeria.
Soil Survey Staff, 1951; Soil survey manual, with August 1961 supplement; USDA Handbook No. 18, Government printing office Washington D.C.
Soil Survey Staff, 1975; Soil Taxonomy. A basic system of soil classification for making and interpretating soil surveys. USDA Soil Conservation Services Agricultural Handbook 436. US Government printing office, Washington D.C.
Soil Survey Staff, 1986. Ammendments to Soil Taxonomy. A basic system of soil classification Part 615 (430-VI-NSTH, May 1986). INCOMLAC., Soil Conservation services, USDA, SMSS, US Agency for International Development.
Sombroek, W.G., H.M.H. Braun, B.J.A. van der Pouw, 1982; Exploratory soil map and agro-climatic zone map of Kenya, 1:1,000,000. Report El, Kenya Soil Survey, Nairobi.
Sombroek, W.G. 1986. Identification and use of subtypes of the argillic horizon. Proceedings of the International Symposium on Red Soils. Science Press, Elsevier, Amsterdam, 1986.
Stahlberg, S., 1959; Studies on the release of bases from minerals and soils. II. The release of calcium and magnesium from plagioclases, biotite, augite, and hornblende at contact with synthetic ion exchangers. Acta Agric. Scand.9, 448-456 (E) Royal Agric. Coll., Uppsala, Sweden; XXIII 489.
Stephan, S.; Petre, A.A.de, 1973; genesis of a planosol soil. II micromorphology. Revista de Investigaciones Agropecuarias,3, vol.10, no. 7, pp.237-257.
Stoops,G.,H.-J. Altemuller, F.B.A. Bisdom, J. Delvinge, V.V. Dobrovoslsky, Fritz,B., Tardy Y., 1976; Bulletin Soc.Geol. France(7) XVIII 7-12. E.A. Fitzpatrick, G. Paneque, J. Sleeman,; 1979.; guidelines for th
e description of mineral alterations in soil micromorphology. Journal of Pédologie, XXIX, 1, p. 121-135, 1 table 5 fig. Ghent.
Survey of Kenya, 1970; National Atlas of Kenya. 3rd edition; Nairobi, Kenya.

- 168 -
Takada, H., Matsumoto,S., Honna, T.,1977; (Volcanic ash soils in Chugoku District, Japan 3. Clay minerals in Hirusen volcanic ash soils) Journal of the Science of Soil and Manure, Japan 48 (11-12) 491-496. (Ja) Faculty of Agriculture, Tottori University, Japan. From soil and science nutrition 24, 169-170.
Tayler, H.B., Yates, W.J. and McGarity, J.W. 1978. IN Modification of Soil Structure; edited by Emerson, Bond and Dexter. Chapter 43:325-333. John Willey and Sons, New York.
Ufimtseva, K.A., 1968; present and relic properties of West Siberian Lowland soils. Soviet Soil Science 5 pp.586-594, Moscow.
Van Reeuwijk, L.P., 1987; Procedures for soil analysis. International Soil Reference and Information Center, (ISRIC). Wageningen, The Netherlands.
Webb, A. A., Dowling, A.J., Nugent, P.J., 1982; studies on solodic soils under acacia harpophylla- eucalyptus cambagaena forests in central Queensland. 1. Chemical characteristics. Queensland Journal of Agricultural and Animal Sciences,Vol 39, no.2, pp.109-123.
Wada, K. 1977. Allophane and Imogolite. In, Minerals in Soil Environments, pp 603-638. Eds. J.B. Dixon ans S.B. Weed, Soil Sei. Soc. Am. Madison.
Wada K., Kakuto Y., Muchena F.N., 1987. Clay minerals and humus complexes in five Kenyan soils derived from volcanic ash. Geoderma, 39 (1987) 307-321. Elsevier Science Publishers B.V., Amsterdam, the Netherlands.
Wakatsuki, T. and Wielemaker, W.G. 1985. Clay mineralogy of a soil formed in peralkaline volcanic ash in the Great Rift Valley in Kenya. Soil Sei. Plant Nutr., 31 475-480
Wielemaker, W.G. and Boxern, H.W. 1982. Soils of the Kisii Area. Centre for Agricultural Publishing and Documentation, Wagengen, the Nethrl-ands.
Wielemaker, W.G. and Wakatsuki, T. 1984. Properties, weathering and classification of some soils formed in peralkaline volcanic ash from the Great Rift Valley in Kenya. Soil Sei. Plant. Nutr., 31, 475-480.
Wolkewitz, H. 1960; Investigations on the effect of the cation saturation on the physical properties of the mineral soil. Z. Kulturtechnik 1, 162-179 (a) Technical University, Berlin.
Wright,A.C.S., The "Andosols" or "Humic Allophane" soils of south America. Classification and correlation of soils from Volcanic Ash. Tokyo, Japan, World resources report No. 14.
Wright, J.B., 1967; Geology of Mara Siana Area. Mines and Geology Department, Ministry of Environment and Natural Resources, Nairobi, Kenya.

- 169 -
Yoshida, M., 1956; (the absorptive capacity of the soil. 2.Absorption of calcium and ammonium ions).Journal of Soil Science Tokyo 27, 241-244. (J.E.) (XX,1522).
Yoshinaga Vaganor and Shigenori Aomine, 1962. Imogolite in some Ando soils.
Zinck, J.A., 1974; Definicion del ambinte geomorfologico con fines de description des suelos. Ministerio de Obras Publicas, Venezuela.

- 170 -
v, — • " — — ' — — m a — m a — •3 u
— •3 u
—
£ £ m
« •^ s •" « i sC o k ( V o ^ « i
i ï\ \ T \ ._
o *~ 5
> ^ »1 i V, » ri 5 u u
^ £ 4 U
O
o 3 < r- 5 S
* 4
U
O o
CM «ï , = z g
S
o
1 I z g
S Ê .
I
I ! s
£ E o
S i S
s
•
S 1 1 S
E E o ó o i !
E E <*» o b o a»
1 1 1
s
î
* z !
2 X
o
f ! ?
i
1 i u
c o ! 5 Ï 1 I u I | O
5 1 » Ï
I ' î
1
, :
I cö ! i 1 \ o 2
% 'S
o 5 1 t a. M
i
î
! I I 1 u
c
s
u
c
«
£ ïï
- o. "6 s
o. "6 JJ i r M o> o tr> » * i v>
5 *- s i f * 1 m _* ,A X "* 3 - *! u\ O 3
O s* *\ • \o o i r . **1 s **! * t o — a a m OT m r * \
\a
1 1 a i f » n
s s A A
f f M l i z o
a
• m m O
o
i
!
1 ! 1
z o
a
• m m O
o
Ç
ê
a
!
! f
Ê o
1 E
Ü u>
*
i o
u i* ï
z z
3 X a
8 O
1 O UI o
I
s ! 5
i
t
s
i t
Z Ô
1
*
j
ï >
!
1 1 \ i f I s 1
X o o 3
!
ï î
o u X t >
O en
I !
i I ! 1 1 1 I
F f
*
\
\
i
i f
i
1 < i
i
•ö
ih!
illïl
s:iu;
a SÜLL •21
u > , « " . >.• = i T) . * • C J( • -n
U t - » . U f O - * . * > O — _ . O M — o r « • - • 3 H M * . a s „s-?- * • E - O
s. « >, - s „s-?- • 3 O m > , • k . f - O 4C • = O k . — B • «
Ä - c • • L. - u . C M B U * » — > • £ « O M - •O « C O l ^ » O • * - B ~ • • ' • O C B ° î - • o ~ - < C I M mÄ— — O ~*A o c o t . « O > < • - O >"Z - . " I S S « u u B *•-*** ^ * i C O - . " I S S V O .« • * . - « > . m Or4 C « C B o x - ^ c > • *) • - ; U X » * 4 • O O 1 o O - 3 • - C rt— < O 3 . C U X * » M E I X £ > I <
•- w>* - a 3 C > « • * « "-
d e • « e C - * • * t O * *
« « • ••o o » • o i a • o - . O r t • * . . * * < O t> 3 - ^ - * «
*• on - o • *» - B » U - * • « • • O C W — — J ) « C • O - - Q, »4 • O B - « C O o - t . e c . * . 3 w * » — « C -T) • o B « « • • - • * J — » - 3 » * «i « V * . - . - .
3 C u • u • »T> « ^ — *> C «J • * > — - . -— «HJ*» a — C • • > T ) A * • e * u * > ^ n TJ > < w O O i o— e >.>** c i • « £ « o a N * >- U OU w B « u £ » ' « m - » » T J O C (-) B T ) > . " * •
\ o-o U X O T 3 O U « - » O • B — . * » * . - - M w B O t ) B <-
« O C * * B O
-» M v c a M « « B " • * * S - * - • > < u 3 B \ C » • O .» 3 — « - C o c —m m o C i «-O M O X - - . C — • » >.>.T) - k-— » c o « x** •»-*• — C C - *T> O •>«*>« — Q.M ô <-i c - > O
- • O « * B C c « T3X O" c — • * O C M M 6 > « B - *-*» » a t. c « •
> « » • S- - • « « . £ • >• 0 - 3 * - «
O - Ä - T > • u
-* •ft > . * • £ - I M * »
-t o c « Ä
k. * * . c w m
& — a a *> — o, — — o > ~^J J3 * * > , « . O • s — L. >.«.-D > • M 3 « C
« ^ » TJ —
« C U * — > c a c a f Ü • m £ U * > - C O • > - o * . « - • > •> * • — u m V J : C M « o - o . e c e o u • * > O u
- ^ J p . * « jz u > , B <7>« - O k. J3 « O . « > , 0 - r i X •- - * • Ä b - * x » • A > . « • * B * H * O • - * V O H > « O - J ( - H « ^ t . • Q . W > Ä *> M b £ M O Q.C O t r> - u o • — C O O I « s o -> > — B O - - « _ . - - a — « - H - O M J S
« « • 1 3 » « T3 N • * < O • O - . JJ c * » k . - b. • - o • O - W t » f • « M T j k, « M « O 3 « T ) • • «• C 3 « C •> £ * - - *
T ) * • - * • C O k . « - i * * — — - u « > . * > . U Q . B - » Jt O O . « - <Fi — « Jt > -
> - T ) 3 • * • ^ ^ a a K U S U * n ». C » - T l » u . C * . T 3 * * k, c o — > - .
Ï ! - S » R S S*~ " ^ Ç • . S 7*. = - • _ •
*> • • Â ~
> • > £ -k .
> C O -o^o -
* l
M TJ x: m* « *» o c - k.
• o o O • N.» £ — 6 T) *• O • B -• — > i .B *- > 3 • M k.
>• C c N. « O — £ e u • M > o > * f
< ^ £ *> e t x ç >*> C * >» o - 1 J t o • > -* > O « — « • • •" » O u
» * S^ Ä 3 « « u O k.
« • c • V Q. " a
~ « « 3 o o~ T) B T) a> « « C « * i N . O
-• « • * C » - l
»* c *« « &>.>. - u C B C
-.> ï * U u £ s e 0 C O T) •* o-^ — C o - XI <H J3 « « y
SI:
fil
• i l :
"13"
- < o c « -SS- . « • u a O " • *
*. c— *> 6
-•" « s o a • N. S B O « \ E » • B a • — > i O W •
-5 et» < >* « w ^, c u • • o<*> O * . O « « o - * — « *• o - « a o o c • * « ** 3 a e u x c o O L V C • • - " • T J - * T ) - O . O < C 0 < O t . C - C > i <T%e f — o & « * " e n « — • • » a « ft «
o u < ï ï 3 k . O f c U B J > j n n k O O <

- 1 7 1 -
S • " " — .._ i — i r ~ — — — — 5 - - - — •Ä
- - - — „1 JJ •
£ * * .r*
i t ?- •© % ü CD d c t A r>
s I - » % o 1— * -!
,!. " »••» « S •• î! ^
T> t>
8 ËÈ
.i I: »s
I—i
I 3
1 ! 8 ËÈ
.i I: »s
I—i
?. O Ol a ä
I 3
r—
O o E
IS 15
!
1 ;
8 ËÈ
.i I: »s
I—i s I O
o ö <n o o
*
!
S 5
!
1 i
S I 1 5 3 S
I 3
i o
o
•s ? 5
E E O
6 o i 1
1
I 9 ó «o « ó t
E E o 6 o
i
•
I I M i
!
I I 1
ï *
! o % « « o
ri S : \
î t
1—1
•9
i
a a) Ul
1
I I i
I S
1 2
- - - - - - - - - - - - - - -
S 5 — 5 £
£ M S , £ M g - °. î •^ tn O l
s S u 3 î ; • >
? s » 3? o £ î ": O ^ S ft ": ft t
» 5
U i— o
î Q K R o' O l »•*> "" — — —
î »
5 U i—
o »- i o o O l ">
— — —
t t a V, %i r - «o :> rn O J *~ a *n R U~l n » • • » "» R
-1_ -1_ --o
t t o
Ç • 1 1
:
8
o 2 ? ï ï i ! # • • M
i
! |
i
•
î
l u
i 1 f f u z z o
1 1 u UI o
1 1
:
8
I o
1
i
i
1
z
o
Ö
E to J
1
1
:
I *
\ 1 i
I I
I | I
_C U s
! 5
1 ï 8
1
5 *
! l i
! 5 1 i
o a
O
ï f
i ! •
i'
!
•
'
Uîl
~Sr,î
.SX H 9
ils: = iïîii
s = " „ s.- M > . c ; < ; - • " £ z - - » c s ; =1 t2 u >. • • >-T) J= « | £ ? - • "~ • s ; =1 t2 • l > £ u • • K » C M-H • a X-« c
I s
1 Kâ-» O > > • - • - S - u " - • >. » I M • * *
I s
1 Kâ- U--U-S£ u £ u u S. ÊS-2 t tSÏ . : s ? I s
1 I ïs S f î S " , ^••"c 'S s=ts?~* S ï o i I s
1 I ïs * • - 3 « - O - . u *. m m m Ü I D ^ O V -. - « !
s
1 I ïs • O J T *> • c • - •o a - H " >. *J S e — -*» !
s
1 Il«: - : S Ï ' = S -s»r ! . - ; - r £ S C Ï : S
s
1 Il«: ^ 3 T J - - . — k - \ > . u - - ^ » - . ^ & s
s
1 Il«: \ Ä w o • - C X u C « V - >,*»r-JT- » m o u tvc & s
s
1 Il«: « • C • • O « * * • "DO • « u *J • 5 b * . & s
s
1 Il«: - « U O — • >.-.** k. K O « • • £ £1 >,T3 —
I •
s
1 îft* S Ï J . J - S e ».ï: • •= °"S2 -âï ^ Ï 5 * I •
s
1 îft* O • O J( C M O JC u > • o ^ £ — M 0> K • -I i
s
1 îft* ~Z° " ï • c M u « o i t U ! M M — u a •
« • M >.*>
i I
1 i !i El | Siiil fi Mïlilî i ^
i::-i i I
1 m rfîïlî Pi ! I I ! î
Sïlî'î m s ! s
I ! 5=**
Ulli Si
— U *J > •
Si? ••"" ^£ î^£ f - - î a ,r.=l Si M » C > , 3 C « M — . - . « ^ •) r « « -D - Ö o a > - » -
! Si i=:i; i^n; :l&iï g 2 si M if
! Si = - î | ë u i = Ï Î S - - : ^ = : i ï - 3 i » i . "
,i. 1 iMii llürfl Ilïilï ! rilrfî! iliil i l f
ffi«! II! - •;.!
ïïîlîî

- 172 -
2
s — — — — — z - - A ^ _ — J_
~ » s i
OÎ ö A S X ' ~ * ° — — — 2 £ - O . „.
il s s ~ - ^ Ö
- - S _
5 » - *: o .
SA * * * " ^ ö ü _ . —
S S «.«> « , 5 S 3 I c* •o a — s » - — : : — ™ »
h -~ " s — — — s ... «î S j 5 5 S S O o 2 , _ , —
S Su mi i i î l l l l l -
i 1 i I • .' • •
. !" * •
™ P o îï S Su mi i i î l l l l l -
i 1 i I • .' • •
- -- m û
if. U * * *
s 5 : S ï ï
i 3 - i li
-= = =
—
Ï Ï Ï ÎMf? S 2 Ss! \ CM « 1
Os • §
, —1 -
£ ,, -ft „<* «> " Ï ' T Ï ' z : . , „ * . . - , » ? ' : " : ' ? ! > 4 - ^ S { S S A . V o J ° a -\ •*> — — ï « . . . -R , - » . O
à a s " . g
S ? » 7 - o ' a 3 5 5 » o r- S 2 -* Tri s - j 52 5 ' "5 "? s s 9 N N
S ~f
p.ri. IM-* s • •
' ' I 2 s
5i ! : . ! . 1 1 : 1 ! - ï
II ( 1
< E
•r
1 1
s \ s
3 »
ÏUi n i f Î 5 f S 88 J • * 2 -
' '1 S '
i ' Ii|ii|I i i i 5
» 5 ? 1 it ° S 5 8 ' I l il il Jili 1
t i
£ | 1 1—•—' ' •
su
r- o w ê - 3 • ' " 1» ^ • o o x - o . B J Z « J «= z « - O » 3 O D>>. u U C * * W 0 C j » 0 r- 0 > . * X 3
-• a C - — M w * • « -.,« ! c x • > « • ->JZ r- «
w f > . « * > T I C 0 >»> « . u * > ^ * - = . - , «i k-r- 0 0 - C • • a « U 3 • * * 0 > k. » >MC - « 3 « B 4>»*> K 0 » .
-*» • C 3 - * MM» - . V > .> . U 0 0 » 0 t >4 I f » X X X •** S -H > , 0 • 0 k..* « X I 0 0 £ •O 0 k* 0 k. c 0. • 0 * 0
« • • • **P * 0 C S 0 * •O 3 — 0 *> k. - £ k> 3 C 0 S • O 0 O - 1 « * N
c " Z £ - • O U t I C M t»k* M O O O — X i » 0 u O, X c — 0 « *J 0 0 - • C»» • k. • £ O O — C M 0 O U I * " W u x c« - * - 1 - t a
» • » • c • .O n > - - . O C» 0 T) k- 0 X» X - 3 > TJ - n x C X
-" C**J <- — £ v a 0 W • x - 0 c e « 0 k. c - « 0 X 0 - J u * 0 c *? •D k. %><" y c a W T ) 0 0 0 M O > .B 0 O •X B V U 0 04V * n - H 0 - 4 . 4
** s • • 0 £ O k. » k. * " < c * * * * *• (B 0 0 — J* — k. k4X
• J: a — 0 * V 0>B 0 U V « C « — 3 — 0 » ^ u o<H C X - * * 2 V B m ^ - , « ^ - -< £ C C C » - , * > * * £ 0 Y ) O M > , 0 b O
o « • X O m m O - t - 0 0 m ° C f * - C -H o«« e x - - • 0 0 0 • —• p. w •n • « t.-<.4J B >^C U .-• O«0 > > 6 0 —• u — 0 * 1 ^4
— -4 >.** •s o c 0 0 C - o*w m • 0 t . » *t — C Ä • U M ** - 0 0 . - u - • n m 0 k. 0 o - v ^ ; B - M Ch C - ** 0 0 - a - > c * . — - * c C B ~ ^ O 0 •>» - 0 1 m a-a * _
" • •*= ï W « w - 0 m 0 M > 0 0 3 g ï ^ ^ - c A * > 3 X T 3 U O C l C >tX 1
• » a e • • — «•> » - , * . k. g ï ^ ^ - c A c 0 - 4 C - * - 0 m > k. ) S »n >,C C«n 2 K a ^ • » J = - . >. - c w 1 O > . - V OJ3 0 0 « * 0 a+* • S U-O k. • £ k! N 0 « 0, X w * « n
•M C«J — b > r - O — m K 0 0 0 O 0 M k, 0 V f 0 g X 0 0 * * 0 * 1 « k. U « 0 0 X X •
* o « « - , 0 0 M%4 O • N . _ ^ « k. « u A . o . e u M * . 0 0 B - >. C 4 » X C - . « 4 » > f *t>
s « ü 0 « * C >TJ w C « ., . ^ 3 & - ï rs X 3 * > r - 4 X 0 * > * 4
*; c _ c u o > >. 0 •m M U 2 t t l 0 ., . ^ 3 & - ï M . (7 .0—»4*J - X 0 0 5 ? * >• 0«-M « *<o 0 • C C * » N.O Ü 3 M 0 k- m 0 ** - 0 C— 0 O ** * 0 - 0
* • 0 * «
^ C « « 0 u J« 0 « C *> " > * • S T i - r 0 B 0 0 »TJ-O • • » 4J 0 *J *J > O O 0 - . — * J 0 0
-o
« --- ** «• C C - t j * a « . c E - 0 V 0 » — C - . C 0
-* 0 0 0 « 0 B c - ^ a, C e *J P > c
-« H D -HO 0 » M.C O B — Q>-> > 0 e 0 - k. a U<M 0 0 k. *
• o ? _
• f i
:s « V * C . » - * i c **s ~ ** B — 0 3 4 - 0 B 0 > . 0 0 0
• ^ • 5 0 »
•• :s « 3 * - JJ T) « D O 0 — >. 0 k- O . 0 T Ï _ 0 ^ » • V « NT) - T ) M X - 0 - H
—-*; X
>.• e»o • « A M • « " I C O 0 « u a*jc » - •* 0 u C S J < 0 — > , O T I - 4 O 0 C Q. a a
• Q > > S * 0 a >. — C « % 0 fl « — JIM » f » > - 3 0 k, O 3 0 . î« B 0 O B 0 0 B H «4>-H C « B
ri • • , g - T ) • P» • M u O « X 0 a > ,U U H O N 0«> 0 «-O B N . Jt E E k. 0 x - * » a 0 0
* *: S c ° -
O.
* c > t * £ * • • 0 s c 0 B c-o 0 — 0 . •> 0 > , > k. 0 0 r * *. - -D O k- 0 w * i - 0 krt " C • • -?2 _ o h Ü - 2 O C - • 0 a •**•** « • > . 0 c e « » c - * * - 0 0 * • k, 3 Jt U u 0 0 > .o C C a 0 x — 0
«" 5 •t 5 ï •2 O N O J A «1 • — 0 « j ; - « c 0 0 0.O 0 0 0 a w u > o> « TJ 0 « 0 0 0 E 0>0 C K e t ) s
••- X J C i n v a * • — c w u — *t U<M n X ) » I X « M 0 0 1 — O * J — • - » -4 X 0-H > . — - 4 » u c a
>M zïï; ï u i • Ä •• •> — « P « U S l > £ *. - k. O U 0 * J » . ~ 1 0 O •0 O 0 > > C U O - * Y) <» <o 3 «
*-. * • y ^ O • * > B T> m o-O 0 m 3 O >.«- « « O U B 0 * * - 4 C c 0 — — 0 C 2 0 * w Z £ °c as: • s-* " «!> • 0 O u O u b — M m js - ^ 0 a n O >. - - J C 0 — • 0 C • - 0 — 0 > . - >--! m "s. _ > > as: E D Z U O U H 2 a « i t , s u 0 * . 0 0 0 > . 3 - — * . . * . 0 0 - ^ » 4 ^ 0 - * 0
> b 0 >^4 — " P»O c - -* u *> c - . C - 0 X * J >tX C B & . Ï 0 C B U — O 0 3 « U r'S-ï':! N. B O 0 0 • * » > * - . 0 3 k.4J > s * > e > 0 - 4 * 4 « C-* -H C r'S-ï':! « 3 - . - . * . 0 k. O 0 - 4 W 0 - 4 0 0 u 0 0 o*> — - * u 0 , 0 « *<— -Û C B » * ' — .O O 3 U - k- T) B * * k. > * K - 4 - 4 >4 k.^ 0 -
•M 3 B 0«N 3 « O « ^ e u u 0 X I 0<M ». x * j e - o X 0
• e k.<ci ß £ \ 0 £ U 1 C * • £ * • - ü — ^ k. u > * >40 0 c > C 0 -H » -** c o*« j c m » 0 0 e « c 0 • « M. W f l 0 »*i »-H • 0 0 6 « XTJ O «
_* „, î O . . . U - s.-.-.s« = .ISS".? S ü??s—: : s * s 8
c • C
** £> 0 >•>.-> « c - . 0 — » • o * * e r - s T ) B*J - O 5 ""Z m » 0 > 3 8 _£ ; » * J I 0 - K - £ T) 0 * c c _ — 0 B f f • 0 > x c 3 O « 4 . 8
-; • k. J< « ü U 00> > , > • < 0 m-* c O O 0 B*J | > X X 0 C C 0 • >.T) O«0 D - - 0 O
I * *; « • L.-C O— " O WO — C 0 0 « k- a k. c 0 k- O O 4J » — U k. C —*J -.:»—« I *> s 3 M a o - * * 0 • 0 ^ 0 k , - . - . h. ^ * J 3 — O X X 0 - - 4 c x x 0 u 0 • - 3 0 k. 0 0 I 1 s -* • W > < • î 0 S A m a o > - V M < M < U 4 J m 0 0 < M u o.*» > — y *><uM > • 0 O o- x-o E a
^ — C V
» • o « 0 O«-«
r o • • • H C u C C - B B •
* D . O 0 s a a u t * U
a - » • O O V O A • 5 e
s ST: • • -* « O a 0
:..* ô 0 1 a - 4
g > ** B «1 c • N » u m M 0 , -4 •
- D
• 5 • v e e 0 N ^ 1 1 - T 1 5
t «. c c a B
- « e >.« 1 O 0 > , o \ •A
« 5 ? ° < >» a *• M • - » 0 •i M «•» S o>
-* > c " t^*< 0 w 0 « 3 ^ H — à b
r* **"ï * Q O o c » • M ^ u C • O J : C 0 î ï « Q.0 ^ - « I D - T J e T3 O«- o 3 - x t o £ a
»»< 0 * c - C« » c * Z 0 a « S - N |
g 5 5 o -* » « a • « « 0 - * tl M 3 v * J . 0 m
o c -J X S k O k J K J > - J « t w w a h . O O < < u m a B 5

- 173 -
-
i 1 1
J
- -
_
O
o
1
- - - - -
-
i 1 1
J
- -
_
O
o
1
-
i
-
i 1 l ! i !
-
1
J
- -
_
O
o
S 2 ï
H
?
1
< t
1
—
Ï
S
s
1
1
§
I !
-
i 1 l ! i !
-
1
J
- -
_
O
o
S 2 ï
H
?
1
< t
1
—
Ï
S
s
1
1
§
I !
-
-
-'à
-
i 1 l ! i !
-
1
J
1 _
_
O
o
S 2 ï
H
?
1
< t
1
—
Ï
S
s
1
1
§
I !
-
-
-
I ? -
i 1 l ! i !
-
1
J
I S
I !
T E
>n
o
s
ö
f
1 T G
S ô b i
i
*
I J i
!
! i I
s
î
!
_
O
o
S 2 ï
ci o H 5
a o
?
1
< t
1
—
Ï
S
s
1
1
§
I !
I !
1 M
-
i 1 l ! i ! !
J
0
§
I f
J 1
J
I S
I !
T E
>n
o
s
ö
f
1 T G
S ô b i
i
*
I J i
!
! i I
s
î
!
_
O
o
S 2 ï
ci o H 5
a o
?
1
< t
1
—
Ï
S
s
1
1
§
I !
I !
1
-
i 1 l s
! i !
i i
\ s i
-
- -
1 1 i
-
-
I 5
-
-
-
s 5
! i !
i i
\ s i
-
- -
1 1 i
-
-
I 5
-
-
M
! i !
i i
\ s i
-
- -
1 1
4*
] i ! I i
i
- -
I 5
-t
-
;
-?
! i !
i i
\ s i 1 i f £ S
! S
~5~
X
o UI u
!
i
i
I V
i
i
I ô
1
3 i J
* 1 1
4*
] i ! I i
i
- -
I 5
-t
-
;
-;
! i !
i i
\ s i 1 i f £ S
! S
~5~
X
o UI u
!
i
i
I V
i
i
I ô
1
3 i J
* 1 1
4*
] i ! I i
i
«3 *•
1 Ö
1
-
1 ô
l l s
I 5
-t
-
;
-
! i !
i i
\ s i 1 i f £ S
! S
~5~
X
o UI u
!
i
i
I V
i
i
I ô
1
3 i J
* 1 1
4*
] i ! I i
i
«3 *•
1 Ö
1
-
1 ô
l l s
I 5
;
-
s
! i !
i i
\ s i 1 i f £ S
! S
~5~
X
o UI u
!
i
i
I V
i
i
I ô
1
3 i J
* 1 1
4*
] i ! I i
i
«3 *•
1 Ö
1
-
1 ô
l l s
I 5
I i o'
< o'
f ! t
£
1
<
1
S
i
\
<
i • ! i
!
i i
\ s i 1 i f £ S
! S
~5~
X
o UI u
!
i
i
I V
i
i
I ô
1
3 i J
* 1 1
4*
] i ! I i
i
«3 *•
1 Ö
1 î S
t t
G S'
1 ô
l l s
I 5
I i o'
< o'
f ! t
£
1
<
1
S
i
\
<
i •
5»M
' " S - ".-.
a " E a S U - 5 « s » ' ° Ä m to >»a.c*o V O S & - * O p; - -«o S. O •O » » CTJ - c * < u M C C*> a ç S. c a c >*a a o —-* s • * ; 2 • a - u « ta » > . c
vlsH •o a * - • • -V ta-**-. • vlsH ta*» C ta a « U M vlsH V - 3 a - , a — a*> o ° s * s ^ c >.w a«« a n 3 - a » U ta A ta£ £•£ 5 ta u - ^ •v o-- a.m •° s * c s «J > o •S 3 Q.C O M c * . » . J * . "* s a a - •> •* i ^u*^ S
=ha-B - C - • M a >.— a
" =ha- >. O > r - a « a a ta *J >. C ** a X a o « o w ta* a * - • ; -"g - 4 ta m >. u ** _ « * * U 1 S * * ï E a • o o M. >. - _ o« a — - o. ^. > a o Z **<
K UJ> - » C C - • - R - ja * j - a X 9 ». o u a • S = î ï . a 2 « • 5•— ï -• 3 m Z O M — a - «
S = î ï . a 2 •« — 3 w-o a a
a - t • JC « A « tar- «n o a > * taV
»»» g - 3 c « a
>* > c *• — a o o m » a 3 - « c 1 a-o** • «
-• S a — o ». a • 1 £ ta« c a a O r ï Ü ^ 1 " ü — U * j M a . * C a - o m £ ta a a —— s — a a >.a c c C »•o » - * » a N . M a r a « * *
« « „ ' • f • • •H <S£ •
•g D M Q O 3 a c • «a ta - x » ». — •» N o* ; u ta ,-. U M o> c c a a ta c * - - .
* a a & - a «** «•— g * a -.— a E A C 0<M u t) a ><u a C *> fr*<
* • - . o > r» o -1 U a • M a • • - . - J a • • > > • , . -• o > & sa
a a c • .fi » >»— aw c o « ô ** c,f S * s a s. & ^ sa a * — ** p c a - O ta M > a a O** c o - o . c M - > , a • 3 o>o a M a a » » . n c a O, a Ä f _ * - o~*—~
o.> « a c o a >. — ^
> - - o .e • — - • * • •? * 3 * a o • » ? « a a a O. » er— •a ** « ^,° S J c o > t • £ a O a * c «
- a ta A C O ç- E - 5 * \ J ta- 9
• a — o a <*—« «J a e • a • a * . ta 3-D - O a > • " a - o
u u c c > c
» .c- a a — - . « • a a** e • > . • • ° 1* " - f . - - * * a * • a - c » u u « " • M f i a x
« -4 o u ajt-o • *; * -2 £ * • **4J ta U .H U a » M V a a a a O U 3 u
fill»" ta ta « - . « C ~ o S • 3 1 V O m o - t- • ta > « m-a fill»" •1 * 3 O. * O— ta K > S o o o O 1- ** ta OT> 0+>M£ c ç •£ • S » • • • > > o > * • « U Z k l U M - n . O » J 5 . M & Ï
s - - « - s . r-5." -;
O C * * - N e >•*> >. -« **^2 w .*'•
!
i !
m lim
s
1 aiaa ISWn
Mr il
m r-a
: «
II! — M O" '
o a
• o o»
S». c e x a— •*
! • » ' • a • —
o • « - «
I! : i ;
[fia !HI
& < O O k
m' a 0< P=î, • O u U w O
-H a«a — «a o h e -4 c> 'ÏII

- X74 -
5 •
! 2 0
ON
S. S S S2 si S "1 o 2 S i o s> -, 3 " l -, 3
Ü Si , 3
Ü £ 2 S 8 ? " o s? 0
i « «o
£ s m £
3 £ o 3 s s o
* * <o " S s tï o S
^ ,_, <=>
1 °
1 1
- S
o i 1 1 i i *
1 S i j
!
I |
o
1 1
I o
o
1 n
1 •
t
! i
E E <n o 6 o 6 t
t
!
I *
n 5
I I
! i
ï
! O 5
* 2 0
M
ï
o ri
O t l . O
s ?
I
<
1
X
Cv
s t
t
1
!
i
!
i ï I
o ~W • •
_ - N <n n ** o
• t • t
T*
o* 3 à a «,• o d • K ^ ** S
t~
ITN
a s i a s i li"N
- "- »- r- " - N „N »- • *
s o
s V o s R ï v s «* » T N R N O
?: ON s H
i-l
s i r O N
G
O
* O
oï co e .
2 ~ f » <"-> I T N
<* 3 3 ^
t r >
'-" O o
J- S CO S 2 2
1 ! i I
1 !
g ! t
S i ? ' z !
1 Î 5 3 K
t
z ! Ô
1
5
1 ! 1 ! I !
I I !
1 ô
1 ! 1
I !
i I i !
t
o cc
7* o
1 o
1
1 * Ï
i
5
i
m
t
t
* ?
I 1 £ s y 5 Û O z ü ïï s z 1
! Ô
1
5
1 ! £ $ % à 1 X 5 ?
1 ô
1 R X ï»
I !
i ? s S • ï ' i
X-».
- 1 O I I
- w - *. Ö.V
i • I 5 : . * i o *> >.c t -
— _ l >- t l « t
• jy • •ox o u • 1 : s Bïl uta
* — 3~. « • o £ - v t n
î ï *« c •* i ï * ï <H .
S t *; o -* V D a • Ï . Ï 3
• > L . , *
s-* l
•; • « a i x s- o» c f • £
u £ c — o o S — • «f « > . C • •o
| ï fl -* • - 4 a
o ï . f £ « •3 • • X * X > • cw- o ™ ï 3 t * c M
-. <U JJ
S S * J
• — o o e - • u m g * s * • M. e 3 m M o ^ ï B * > O
- S > • C t->
S S -* ** J ( N . > • • > É ö c
>•£ ** S - H u • W
>•« C
« S • e >• o c ** •
X
-. K' C » A £ 5 9 o * s o> e»*o
• H
» « c •îiS K * . > 1 e O 3 — e i j = 2S o • « *
<OM
* -. -. U M
o » « n C U * J
• c > • C
• O • O
"T* z • -_ . C a * O • a * •
« B • M > , 0 i i •> c O
• o — o »
« • «i - B
55 u * * 0 e - « « cm u U • M
» ï » • Ä^ £ * U T J u • * • •
fc. o. O > 3
«-. « • • o * . 4 - 4 0 B T J - » • o O i - O . T3
M S O1 3 O
~> _ . — U K > 8 o o x T3 C
< o o > * • o s « Z S U U t - i r « • - 4 E • 5 «
' > - ^ - = ï
iffili
c c - - »• > - . - . » • c c O B «
> * 0
" X B • c
A X o o > « m *J M * J
.** M ~ *
« •w O X
- > B o>- * O W
• « c « * b . —
« — O - X
* « - 4 J < c • x x 0 -
< • c » **«» >.• •
X - r *
« « » « o » K » A 3
>• Ü u > . e • O
— - • - - > . • 3 *• » u C — * i m > H • - 4
« C C - . - 4
- » • a Q . « . «
« o >• O u ~
-.« *o W
t £ s->• o c :è * c o • :è — » T J
— « * < N i
**.-. « X > 1 h . »
N * — J ( O 1 -<n O . M O k. u Q . X O
X *t «
— C k * J
K * J « - 4
** « > C • 3 M 3 * 3 > . • n « K c o> - . - 4 b
• C X — c v * a r - - . t n •H « • « W — TJ — e • • H * 4 c
D r - >»x 3 C T J w - 3 O > - O
> • « B • 0 X
O - c > I H 4 J
* * J »
« C . o x
X « o * C
* * o** — t . .
*-.. X • t . O
X o x « < M
> • o • B
• » B B
"î— > O 0 3 «
*>. Ck—
OJ«- > . X T J - O
-* v > . u •
« • « C
- 4 -X • • c — C B S • u
> — -> . E 0> u u t i C i < o a M<*\*t
>.>. >.e s *. - L. , a f '
>. » B f
« f - • ' - « i • o x o—43 u > T ) ; > U 0
HSÜit I
mm urn* mû
M X ü O W K -
» •m
0 > one X • •om c C t ) M
*> >< — o o 0 b Je 0 O 0 * * C 4 J 0 X
** b • 3
* • V ft C C 0 b > 1 » V 3 » b X b c O
o x - * c - 4 X b > . »
> 0 M
X X 0 X X 3
* » ** X - 4 Ü
• m o 4JTS u * u » 4 o - < T J — ' 3 3
-« a » * > > b
*» ** m O
« « *J V 3 «
« t ) CM K b c • u — V *J 0 . 0 0 C a < 0
— - T > X
^ T l
S m
« > J C 0
O * J 6 0 0 t ) C K • c - 4
« J >
- o >. — u — c *•
+4 M - . m O . X u 0 \ B •
>• irt o r - b
« u X . ^ j _
• 0 w *> c - 4
> - c B 3
* K M > 3 ON*> a. « o - c > • i n — t . O 0 c o - O X u o 0 o
8
• « B
C O« c * — c » _ c O W o c 0 • * . \ L.
— X C M
X w * *
* 0
• *> X K o « • 3 1 0
• >-x *> 0 - 4 O
- * n * . X TJ • —
« 0
• O f » » c-o — • — • O
« o. U — ' 1 ' M
C r » * » X
>. o n 0 « N « * 1 >ïc 0 0 fc. .
• c b O - t
a x r * > — T ) y « M
?:n
WA - l > i 9 H
- ? Sï*i'
l i i?
I;III «•c— >»
Il'iSi
i«! I M I C - « b
!«•« - -
• V » , ? e x «
T l 0 C • Q. O 3 « O O O 0
u L - 4
0 - 4 C ** 0 m C P U 0 0 N fl fi o • • X B Q. B V e >.CMH 0 > . 0 - • « c O D > 0
. CF.** U O 0 3 - 4 O - -O O C « 0 U 0 C O . C c o
• - 4 0 - O T ) « V O * * - O < O b c C • enc u * ._ o • • 1 0 0 0 0
« 0 P » 3 • -
b O b J K J
> J * W » h . O O <

- 175
ï ?. ?. ** si si i —
« »-f \ l #" •» o •* V ) ITS «o en n '"
I T tM iX S "* "~ K K o o s s S I . J o r*
% % 7 « % 7 « % % I f i O
r*> ^1 n
° ^ m t -
a _ i r « IS m ,_ ,s S <o y. rl - r> o »' CJ c« » n o o m
i. * "* i. n ._ V _ _ CM i. s — • -* n - i ^ t v
" E
"' *"
I 1
I ! 5
" E
I
1 i o o o o o b
I j 5
1 J
S
|
!
j I 1
I o
o
*= c 01
i •
1 o
à ó
•
E E w o o o ó
1
e« o o
o 6 I
I S
l J
f 1
s ï
! % 5 'S
2 ft
o
u. o
5 'S
! f
; X
a. m U)
1 I ! i
Î
!
I I I
.
n
T n i _
R _ _ [
R * R R
O M r> Rï Rï »
T T <» f -
c rv **i
,_ N *» _ ._ _ ^ ï s ï s o (M
— s
O rT, * - t ,_ ,_ ,- ^ s s 8 >o o (Nf «M
> » £ 1 ir«
tr» o « £ ° S s ** \o ^ s £ „• o d o o
i * -f O «o & VO O f— o> o f » o • <* - ^ - o
v * -f O
vr.' &
^ t \ l f M O R o o o o o
" « *• *-R
^ f _ s ._ fM ( T , f _ * - l o »_ * t _ s f A o f A <o
!
1 i !
5.
i §
1 I
ü
5 I f o
Ô S
X z O
! s
O X
•
o
! Û
1 •
IC
1
; i
!
1 i J
l > 1
!
1 *
i I f I Û
1 2 X 5 s
I o z
t
ü
t
»
1 • 1
3 i f
i
o «F
S
!
f ! I
1
3
t !
1 5 0)
1
i!
'Il in II!- Î II ii MM , ,UJ.
c
l i IÎ
• 3 C > . U
l i3&:
« o • > •
;=|!B
U-«l!
Ü U*J >,£k
Q i f t J O t
-==^ss
snî'ls
Tl O M • - n e - i —
• • > , 3 O
IflP S
irlUii
a!Sff
> 9 O
TJA
nu
il lïSÜïl
3 -
i=:si_-
ril!«
ÖP.L
ilf
^:^!
ii I«!
si-£••:?
il V •
ir
; >.c
11
• « • » ; : ~ £
mm Klr.ih Irniil
, LTSfifs •-• o > o -i
ö ^ • c >•«> ** c £ c A
* £ C
c » • •o M £
— c
* »J >«T1 O « > — * >,*
W . Û • I
o ^ > x > • • T I £
> • >. » a s
• ( h
>• ? s j ; > O
"" V • * o « (T>C c >.T>
" iï' •o o • H . . . 5 - 5 Ü
• u i - u^ -
ïîi- IK
imuim
:ss s
S=f II

- 176 -
f r o O *t 6Î
^ 0 CM CM
N E?
CO <o
IM O W
<o «O £
1
s SI
, .« l
» o >»J) t
X a D t * 0 , > >
t l
ü\
w x ->» a
illlH
S!
JIJI ..i ï i ? . l i l SIS
mû mu •O »T> Ck» M O •»
«il
iïfcjl
ilfi.:
m — O — to
>-o *
iUI?
,:a?9
II U l i
S«-"
1 12
! « « » * !li O — - C M —.
•O Jt -v 0 £ CV— •v k. \ er. » >,
: o 7» » * •o • J:
•w o o -
ïszm
SSKIII
r; : umt
I55Ï51
S2H^
b -u « fi*< i M - m * J S
— -.« X • o ^ Of <o
• B o V
c « • u O > . C w c o » • 4
• — » M rt J f rt . O . a o C O « J • x o
!" 5 O U
lïlJ M!«:
— w h> O,
O H C -
ffl >. » >
lil
tl»*»
SU rt O
Mi ï l . # ! ? . n

171 -
UK
Ö H Ö S f t H M O M * M M « « • • c
ï z t i c a c— • 0» ï z t i c a 0 0 *
-u • 0 0 £
— • £
n a » — o
• • S £ Z o > f w «
O X 0 C * > M 1 É- « J A
- e - > o u • • 0 * 0 • ©
— *ï -- » E M t n e •3 0 • 0 J • m • O»
r « c -M U M 4 J « m C M * I * . N . 0 M M M — U tt«
— T-.Q * < Z M « M O U • C M » *• e • •* * i • > « M O M
• C X > * » • « « c X M M M
*• * » C • * * 3 O > . • O w M C 0 »
** * . M t .
< T > * > O 2
r o ï S O. * • D « — O - • 0 • • A m M « » M C U e > o * * c
> M
•* m • * - 0 c C M * « « tt M
• a c
1 S O U • U * C 0
• » c > .
• t . * - • » U M *J B c 0 0 0 N * • « D M * — >.>. TJ
» * C '
«» - - » 0 , « «
» M • •D M « J £
w • a v > — M > M . 3 0
* e 0 M • C M ~ , u « > > e . - H O C » n . i m i - M ï ü B ' '
• Z W 3
c *• M
u
Sliïi*.-
• > o o e • - * C A * c >. — o
Ï Ï *? : I !
m
B O +> C •2 a « • « >. •a c o c * , * « « • • M M M - c C > M 4 0 .
u c m s y j > u
• > . 0 > X tt • A O u M C a c c » x w a - M k . M * 4 M M
M - M » 0 0 X I 0 • * . 0 U M M U * - . & - . * ! M M • M M
a • u * ^ • u 3 > , ** 5 ** - t t - 4 M C > . - e t > « t . B •> > , k - - * . M O •- N fi C . U X I • • S k - J i • M - M « • 0 M a M M
> > • g b a * > * J - 3 M M M „ * _ > . » - • O M c • s » C * C B O - • * £ -• t 3 u • u 0 • M O . x !°, X * J 3 - D ^ C A » B < M C * i - B * » t n u >. c • O 3 » M M M O
. 3 « a * j u x X - O C C ï ï" m > . « e * • ^ T > ~ * « *J > * M • O M M M
et m >.* M O » 6 • m 3 S- J ( U E • B C M U 0 0 u - 0 C * - O - ü M M 0 « J - 0 M 4 N M M « . « — M M « C 0 * 0 X I X M U
e n e c c 1 - « • >.>--c a - * - e • • n c » « c » M * * > B m
*- * -O M • M e t *> > • • - > -U L . M M 3 C O . f > O > . M £ S P 2 X I 0 . 3 O M O S X M O » 0 * - 3 — 3 ° 5 tu E T I « u
<*> - e e f l o • O M M
- B C * M X ) -» 0 0 c C T ) •
- J 3 « c e « C *• * • C M " S " ^ M M « . M » * > * J « M H ï S M - O X X C « - O O M M X C * • - . £ • O • 3 » O O « C M » O • ' S. B S > E M ^ X I - 0 U X> C p ^ M tt E w O
• > . * * T J " * " E 5 — O B M O V O M X M C M - K £2 • n u 3 X 1 U X « a M M — « M O • B T 3
X M « O. B M U X « C- * n « - O - T l M •
« > . O» > £ " * ï — C » u c C m • - C - 2 • K M B < M • - M M M M « C
» • M TJ«w V M * » • "* * * - 2 0 0 - t t 1- - a 3 X - " S ? - • Ï - ^ ^ S - S - - 2 * - » f ses
Sida
« X « >. * M
*• 0 > . B
• B 5 : • > > *
C M •C *
O X >.« 9 m c 9
>• M O
K
-E M U
> - T J
» O
O O
»• M c * * O
* O . C
>, X C 0 C
* O M
S E
« T )
O - O E tt C
" 0 * J 9
X I O C X I
X 0 M
>.*> X -M
*• tt M
> .* > O
M
> O
K C
• • O" tt C M
T J X
-* « C
* • 0>*S
M
** c C
u C M 0 B M K
C
« O tt M
• O X M U
ë ô
> M 0
>.o • 3 fi 9 > M
• • > C T ) M ' T>
• C T J w C
X M M
fi
« > • • • • M
O » B C M
« M u M M
• O •
>• M
T> C C • *
• • • M 0»
> *» C T ) * O
> - * x 0
** C c M
M M a M « X fi * T I O
* m S X m T» e T » « 1 0
« a
* N . 3 X m c
M B ttX M
s-
> * J c >• O 3 0
*• M • U
« > U 3 M
• C
» » > — « • O a C c
%* * • S 0 ^ 1 B X M c r > <
c E c X 0 O
• M C O C T J E > C
> . « A T > a c
• C c 0 M
w C O M M O
>>c a 4 J
M > < 3
- o>u m o>
* M C
*• T )
> * J c M M 0 T»
> M >
• E
• C
- « c c E X a 3
» « 0 0 a s O
> > c u
• D * X
:-*ÏÏJ -Hirr s
; z c c X tt u Q>0> • c e
M M X > M *
2iH« 0 0 0 B — « f C O C c
• u 0 M M O 3
• a 0
-M T » * * O
» B M U e 0 M
* ~4
* J e > tt — C • M S .
» U
e s « e • E E O M S M e M - a a e «
> > M O»»«
• a O M 0> * > , e
»« • ^ c 0 S > M M C U • • 0 > M U
•* 0 e 3 U~> C
— a u
u M « D O O C M e «w
*-e C M T 1 X c 0
« e O O . X • - M W T ) TJ • T ) °* M X
i -«Q.CT»m « I O u C C « O« C U M u O O . e * J x 0 «
e e tt e
* • 3 • 0
- • - 3
O M < S X 3 k O 0 . - 1
« j > J W W t t w o D <
*H 1 1 1—' t—' — a i1 9 tt a>
^ » S t K •-%
U * ï> CO
* K p
0 ^ (C
Of Ja « U N
w c 8 CVi s
K CM
0 B
t ,_ [X m
S Ëc -•
E 1 J
c
S Ëc -•
E
• * a i
1 J
O S 0 < ç
w M
5 m
I 1
*
13
S Ëc -•
E
I
i i •0 0 0 0
0 0 * in
I
i 1
i
1
!
1 | 8
3 O
1 J
! S »t
I 1
1
1
I
f :
* I ! 5
* 1 !
î 1
s ! *
i 0 2 0
ri s ï
i i i
<
1
•i
i 0
1
L
i ! 1
i
1 I !
•
J "8 se O 0
— — _ — — — _
5* 5* « r - * ** r t^ ^ 0 » 0 t^ «Tt
M fT M O ai 0
•- 8, ^ *1 ^ *n 0 l T \ r- O 8, w
a a » a. » 1— 0 O M • " »
2 S3* ft VO S f -1 t r
u-s n *o * * 0 O 0 ^ ^ ^ * 4 r - s
«o u> S * S * tf\ " 0 N
* r** R * ï
R * ï ï »- O ^
i 3
O
ï a « a O 0
£
ï 0
j
Ê
I ï î
5
* i
t
i * *
( J
* z â
! s
I 1
1
s
! ! 5
1 s V Z
( ! ô
1 : I
S l *
1
!
] *
1 I î
I 1 2
! Ï
t
3 *
1 1
! 1
s 0 X
t
s I Î
i 3 i I
I
••
i
I
< *
i
1
« ia

- 178 -
s 1 — « I I s
5 „ „, c-
* o * H o 5 1 ... 1 1 fM ° o
* _ f • *" *~ f
f\l r* ^ i -
f i
s **
i "~ •"
! . s **
I o o b | i t
i !
i I 2 ! ! 1 e
E o ö o
* ! Î I
ï
*
I
1
< t
î 1 !
! f
i !
î i • 6 i o
i 1 ! 1 1 I • i
: 1
S
I I ! I Î I i o 5 2
•s
O ri r i
i t
-w
1 1 i
ï 1 _ — - —
1 - - - - - - - - - — - -
OJ fM . o «TN r>
î î » * " X » s S % \n *»
in * s y in * *o t \C o »
î o. *« i r Tf *« ; * ; " * VO
m r< m o. O ** r< v i tf-» + O i* K x*
" " > Ï K o -n o o*
i c ?
i c ?
ir- o o o CM
1 1 1
!
ç i
i i ° î o
i
:
! f f o l z s
! S
I :
S
!
1 3
1
tt
t
; i
!
1 j
5 î >
1
1 1 i I
f I !
2 X o !
i 1
! 8
O O X ö o*
0
!
i 1 1
!
i §
« o
o 5
î *
î 1
<
i
i
I
i
! 5
i
i
i:f
1 O « :•
m Hiïl-i
HHIgl :si5i?:
m » m = • D C
> -3 c •
C
« • < v
O
« c • e
* x
-• • • 3 8 f c o
• c IQ 3 o _ . a
« • u
> « u
« > l
3
- -u
>.> • u 1» •
a
« S • * — •* M
> B ttO * J JC 3 c c c
*• TJ
>• * o •
«*) e M •
^ a * j ) O e *
e e
« o a
>< >. n o •
*• o>—•. - -• c u o - o
> o O M O . S
•
l!i:.Jir ? ~ i - : ; :
C «ffl • *
1 » . 33-ÏU
^.lUi£ii!»!iis»iii u O « > « >,>,
Fi Silin
mm ^ Ï S S S « .
liïïiiif
Kllliiri
II»!: ! K » P
Ilfflî t UPI! s Vksss
f l
ü
So- i . g» . s; -H B >. c e t .
-. o-S . « * C - fc. c a î. • « • — U « M k. « B • o * * >.» o ^ — c a «Z N « > >> 3 • V.î JftflXI U . o V.î ^ • • • £ V.î W « W M > Di iic
•O >• HA k-Ä iic O « B >,« w -i i. • * ; - ^ 3— C « O -i o '
K - O " - « O s.ss 2 - £ * * e £5 s.ss fJiifli lî!
i ls
ïis îli « ffiîlll!! - Mllîlîfl
- o>*» t

_ 179 -
• ö f . c c m *>
N » d £ . 5 N O « O C j ^ « *J
t a u X « O • *>»
9
1 u *> c 1 - • O a c • o
». a • a « J •3 " O X « • ^ a w o u
• Ó - S Ü 8. & è O 3 - 4
• e
o ü S c fl
= . M 2 O Ó
* • • M N - - O
• -£ Z J > « V
« a 5 £ o • a I Tî ° . Ï . X > o
« S^* o o « o
-3 » "
U J f t H t/1 e O a j t f •
• *"2 C • «/» c
»* o « . M a
i r . v o -* •* • • S S *-> — ae a — O — c o a a -
*> *< o >
-* • -E C » a
• a £ • °^5
S • • 3 - ».
w O • - . o
-* > •-< - * a • — m o> O, 3 • • S • ™ S - a J C U •** ft— n " c . • u s 3 - o f l
1 • - M u • c a — — a
A a u a I M O , N • * o , CV—
- "•!*. 2" « o — • & — a a a u a
ï S o o i - 3 * • o T * £ 2 £
t:M;
SÏSSÏfixzl
i - I S Î S I - - • a « . » * - J 3 O ï * S?' K a e f l f l j a ï * S?' ssrss* I = K S : :
i - . - . . « 1 *• ' !?-I « i£S i ï s : ^ 1 • 0 » . U « M M a
—. » . » . » . f l S ' i S . S 1 • 0 » . U « M M a
—. » . » . » . f l C f . » e u ••> u C k. « C — C % — N e a a a a ~ ° ^ i * * 5
s * " > î > > - . S Ï - a J 2 oc t r » . » . 0 . * ; « . c - * » .
£ o ï S S 2 I » - ! 5 * 5 c — î. a 3 mn 8 *"•*. * ^ ï **
s - ï ^ . - ï S . Ï C Î ? > » . s £.x^:«7 s ~** °1!!»1' 0 £.x^:«7 f i t* * - • £ • E J!
S i * » S " 0 • ^ *"2 * ^ 2 ^ W — . C 0 •
« «1 u ï r ! i A » o > e t > o N . «1 u ï r ! i 1 . a — j e * v 5 sSïr îSJS
fl-5 u 0 a » a u 0 S **
i : 2 g - y = . e t ï 5 J S r ï £ i : D £ a - - . n c a u 0 . « a 0
SS • " 5 Ï Ï » X l -h*i! a £5tî " *x 0 . i: * • • • £ — 2 S à s 2 * ï " : ^ „ ^ l a S a •*= « • « • « • - «
S i . 5 ! ï l . ï — 5 - g ^ S -S o » . " " * - > w 2 * ' w &
° 2 ^ > i N • i ; - 0 • ; • ° - . S ï S - s."0. .s s s •is«:«
- « * J * . * > a
[ •is«:« J t r t - i t i v e •is«:« « \ 3 - O - -u u C O a « w o • _ w >
ï . 0 e > a - - S v - S B -!° - S S Ï - . * 5 I e H -i k. w & •— > C » O X . a O C
! « M C O î — S a — 3 £ k . o O
I 2 I « I « > ' *> > — a y . D t . t a
O V •O B - H 2 S c » ï-iT>.>.£5S
very dark grayish brown (lOYR 3/2) noisti clay; aodarata to
strong fine to aedlua prlsaatic structura braaking Into
Moderate to strong angular blocky structural hard whan dry,
friable
when nolat, sticky and plastic when weti patchy
thir
cutans possibly of clay Minerals poaalbly with Iron oildaa a
hydroxides on vtrtical pad facesi aany vary flna and very fa
fine
randoa paraaf
alightly calcareous, faw vary flna dead
rootsi field pH 6.0,
te 39i clear and aaooth boundary toi
a u - - £ «
H|«=.|i i l sais
IIA
1 s
!
very dark grayish brown (lOYR 3/2) noisti clay; aodarata to
strong fine to aedlua prlsaatic structura braaking Into
Moderate to strong angular blocky structural hard whan dry,
friable
when nolat, sticky and plastic when weti patchy
thir
cutans possibly of clay Minerals poaalbly with Iron oildaa a
hydroxides on vtrtical pad facesi aany vary flna and very fa
fine
randoa paraaf
alightly calcareous, faw vary flna dead
rootsi field pH 6.0,
te 39i clear and aaooth boundary toi
I |
f
Very dark greyish brown <10YB 3/2( nolsti clayi vary weak v
fine
prlsaatic structure breaking into weak aub angular bio
structure;
slightly hard whan dry,
friable
whan Moist, stlc
and plastic when watt
brokan Moderately thick cutans posslb
of clay Minerals with iron oxides and hydroxides, along the
facta and In ports; few to coMaon vary fin« and few fin* ra
poraai
few very fine dead rootsi field pH 6.1, lo 0.99| gra
and SMooth boundary toi
. m ZC - - ï ; M. > . o> a • > . * JC a n c - > . T ) a t» * . -• •O . n - o i . C » f l U - f l > c • a a a — » a «
- S J , " J - c *» 0—«
- S J , " J • a a a > . £ 0 C *J * « £ a — w i -a * *» a a a c 0 » — a 3
- a 0 - v - O . k . O K UT> C O fl a O .
^ Ï ; E ? ? S » . . . » . C f l
^ Ï ; E ? ? S T> a — — c f l • C - C # - a a a c c M i a —
c a > a j e a • » • M C T l a > . o * » . C -a u e 0 — - c — — a — « i
» m mm O * J - -
- > c > . . a * * j = a o • -*> » - . a i . u o> a a a - a - 0 a • - A « , a a
— a 0 - * a.m a — c o f l ».
lizzie • d 5 • * >.ü 8. lizzie «
5 • * >.ü 8. * * a 0 c a m - » — . O
— 0 a C v - — - m » . a J > J3 w • M 3 — • * • • > 1 « a. u - f l 0 N " 0 . a — 0
»»» — 3 — a » . f l
« « c » . * * - X O « * * a j = C a f l a a a — <a u a 0 a
K C w - . u
•» » • 3 ttfl *
» > > a 3 u a u O Jt U U M ^ w — a a a — U > . £ C 0 a a - c c — 0 - J . * . - . c a J = a a -
— 0 u — 0 . > . D < M a « « C £ - - i » • . a - j ( - O f l % » c 0 »
-M u — u - »
O u a w a < o a a 0 a « a * • a • c z • — — « 0 «
J O - - o - o « 0 , a O A - u 3 * J * i — w a • * • — a f l
JC 0 - a H T ) k, a c a c a e - . * 0 a — — a - * J a a
— « O O t , c • — - 0 c » . 1 a - T > - - S . s • a a a a JO j c > . — * . n o - 3 D > C " 3 C * * J = c c 0 c -0 < a a > . - B a a c • -
JC > . f l u a >• J = — • J « • » — c a « J 0 a » •*• » . ». 3 a a > 0 — C C f l t -a — • ^ 0 — — a 0 c a
• O T 3 - a a c •- • M — W • > M A i . a 0 JC Ü
» - a a a - o u v 0 » . a - c > . . » — fl— • a - a u — *< 0 c « o w O K o a c - a a- » . . a > . W M l O U t l i ' to > « » - •
tt sAh w
VU"*" M a a i» ä c o a s u — c —
• o
IR^liisl- SrK 1 o — a ta a
u ~ D
** M
« ï 3 S 0 O *> c
S ~ m OH
rS e *» <=» cr . s » 0
h 2 s 3 0 K ^ 0
< r -N ^ r - ^
^ * J u ^C
m u \
O
*» S
Ï CO tn
Jl » c> ^ 1 Jl O r - ^ u
a c a c 5 s * 3 s s .
O ^ -
*• 5 ° * *-*
g < 0
M M <
5
Ê
! ( 9
8
I. £
is !
1 i
!
i 1
1 J
••
1
I f i 3
J
I i
! s •<
I
! 1 1
! •
E E 0 ô 0
:
1 I to 5
!
I ! 1
Î
* \
0 2 « ï a
S %
4«
!
i
1
<
1
s
a.
s
1
1
!
I I
!
I f
î a 0 1 a • ?? "> CM 0 , N O
O * i fM ^ ?
i f
n O O i r . - .. 0
rw
" Cf>
«~ *-0 ^
S £ SC
» S A n ' T „; .A C4 r." 3 v/. r -
£ !—~ J S fSJ
— — !—~ J S — —
»- ,y » T 0 « u. ?-* K r— \ o
CM 1 ",' t ^ V »
3
* O • *
SO
„ *
^ M 0 SO »*1 * *
a n *» • "
*~ 3 0 CM . r . 0 O 3
,) t i eq ,) — — — a » — — — I V
•". *". ". ^1
k k s s v£ •*»
J t -
-» O ;Ï 0 £
• • J I I s s ï ï ï » 1 * ' * S. < (Ö
a U l •7) at O
0
O
Î O
i
Ê
c
I
i 1
1
1 *
f *
I ï i X S
Î I
8
! e» 3 X X
!
1
3 : j
i
1
1
:
1 4«
1 ! i 1 I Ü
I 1
u
1
s
! ô
1 î 1
s 1
G
1
0"
I ô
1 s ï
5
ï O < O M
O é' O M
!
f i 1
\
1

- 180 -
r J ! s s s é
CM S s
| j * * " « ' t*\ o %
äj s s * « t—l
O O 5
; J 8 S 3 ,. o**
S i J T S S ^
CM
s
• S S 5 S . J o l O . M
5 2 8 5 8 « WJ 5 2
yin. f î*Hï i illl£:: 1...! il; o
H.
r) ei
O
S S I
*
\ ?
i
< t
t CL
JU
s 1
1
f ! i
!
f i 1
I T _
*> la - •" a „ ? »F - - 5 ! 5 3 5 J . ir"» Î * ï
t—
O u-«
~ _£ L, -2 -
s s J : -: " a ? f, gU " "* o
O » O
î 2 R S »• r- o\ o
* * ? <*> O
O
/ O
I 5 S Î ^ 2 | i- o
* 2 2 * *- > -*3
-* SR 1 -
S f—
O
1*3*553 * 5 5 = o c o
C« • S*
îs*v*î * 2 s ' ; ™ c 8 7 *
B 3
^ s ^ - S 1 25? 2 s • r- I T *
< CM ir.
B 3
2 D <-* *o •*•' • *& S ? ^ c\
CM « *
1 i tiiiiii ? ? ï . S
:
X Z l! 1 j
ï * I. il ï
I f 3
i IC <3 f
1 1 I 8
O u X
1 t
- d
I 1
l i 1 i
t
f ii *
•f
!
i < vi
— i — t — J —
ï^wS^Ï > • - M O
m i « o i-o i s J T Ï Ï o +> O - D M — - o « c e > 2 > ; « 2 > , * M i . f - • m *•
*> B C B: a » u « u u *> ta • O o A M - f t e D» « u— ta ta « X > -O J ( \
- S — • S ï S S & S - ' g ft a - U * * Al • a C - f t * * — - c - - * j m 0 T ) > .T> • M
V z m C S <»> ft > . — S ï S S & S - ' g C » r ** — C - f t « M - * « - . * - • M ta N T ) » ta--*M > , m m r* c —
N C ta*J4i •J3 t • u a « - . C « M »
»• - * t . * . • • * > a - « « A O • w C • Al M C -
X * » l • « ^ — TÏ » a f - Ä « * • « M - - » O f t
-• - C « - 3 T J C • 3 • • > A • 9 - A A O > . « M
M» — • «4 a •< * s — « 3 - C > t a t a , •ta • <w
• - U - « ta u — ta - c Q . -U 0 e » ta e A>
O - H i t C ta ta • *» « o m >• ta c c TJ j f *u . M 0 > V A O A • U O M C A ' M > — C • O N o m • • •
S" > . • C Ä C 3 • * < C O . » ta > , 3 * O - C « > . C O C * * • a ta- M - o - - o > >.o * * A I > 3 • • o» o ta j ; ft « » * > £ - • 3 O ^ * ft ta**£ ta m 3 ft O ta— ta « C * 3 4 - 1 — • A — M m ta ta w o o - f t e a X c -H • » ^ O U * > O U S U > » U > - . V O * * » T J A < 0 fi— - - ta*. • TJ • * > — z w — e • o ta
-« — > > - ta 3 - • « o > 3 w A - > , 1 o m 3 U a A ta o O ta « ** « • • « • A t a » . k M V - ft ta U T J O - • C A C H t n • * - 3 - * < ft« 0 * i - o « m £ z £ • * » « • * * C U » C « * • • * * - . C O . A > c » >, o o • N u l . & — A C B
• -« - » •* m * m « - 4 ta j e m > . t i - - t j « ^ « " • " B
*» « — A A T ) taTJO X 3 * * » a ft
— e o • V o N * 0 » . C . i J 0 ta Ä £ X — ta . ta « ft B O — «M » y c — c m ta ftTJ - ta
Q t o . a 0 . o> O
• ta » M O . a u y * *> K o W ta > . « ft o 0 v M m « o *J C ft— T ) > , - . • — « - ta o
X e • c ta A > . « ^ ) — O O f t •O ft.* — - < T > B >.T> « • ta U a • > • • — — « c t ) * U A y 3 • A I j r « t a t > «
s •o - e tk m X — - • - * *>« e >ta c o 0 - D U O . « C
« 0 ta ta O . M - H > « * o c • O O ft ft s ** — • z . * * > Q . « - « A ta — T ) - M e o o ta « ** « • * s • . o y u X L . E —
». O H o c • • • • V - £ - . *> e - . * >^u E - T J • ta T ) > A - T ) O C - f t - - O ü « ftttay*
« * i ta o m — « * « m ) o ^ O 4J ft • W t M ^ f - A C C C o e • * " * • * * ; ; • T ) — * * - y c «
• z • - • M>
« 3 C
>• £ — — c — -»— • • k « A > . 0 ft— • a ftl
» a A — — > > . 9
« • 3 * 0 . > > • • » * T ) •ur > 1 •a o XX • ±> o » - « - *
O ta— . taT) ft •
« « ^ ta E C m m CE *• B • "-o m * , K - M M C
- * O O O u C ta
« o o S A « « o» E D . 3 > . • C M « m - C ft > . - 4
-* C l - f t - A > S m X M ta M <ta • ft m • * > * . • » • > , 3
O " Ä
— 3 < M r* J < • > . t a m » - • o a m U — - J ( >»*M ft 1 » A c c a.» Q, 1 O — • >> > ta — ft A C C C ta O
* *£ o « t n c • o — 3 - J * •
« — • C T ) O > . Œ 1 3 O « 3 m >• a-«- o M M M ta ta- . « > , o * c O D > « O « ftA
o . . * m >_< -• o o> • r . ta • u * * t •N • « e <• ta c n - » O - H » TJ X • O - A ta T> X A a , 3 * > - ta >. X B > — - ta e n >
r s • e c « • J -H • u C X N O ta-* C r \ ta c ft ft N . *> C C - U ft ft -ft - - - k — . T ) - w o>« y • c - »
M " 3 *> C > .
— o * o — «> *J c . 4 JJ ME <« 3 * t - < N m « * f t f t T 3 > - f l *© • B — a ft <u ta
* U C • T ) C • V *•c— > a « V - > u * u i c >
- < - i u > * c m O C O U • * * " - « O C £ 3 — — w — J* «H o> - W X - • - ta c • o * . B * " » 0 E ft ft
B i - o > •>-ft
* • c « 3 U • a u— ï o «T) • O • A - O - . - . — * > * M • — 1 B O - O X — - C - 1 « » Z A > . « V >
« * » t 7 > - h .
« taTJ
— > • • « 3 > . 0 » «ta C o c — « « 3 * * > o * J D>f t *J — £ • O « • » A ft > . 0 O C O * i — - C ta
• o « s > • • ta o o> * O « M O T 3 - H U O O T ) — « < M O ta ft ft > , * ft c ft C ta ft » c - C 3 C > . « . ta ta C « A t l O O T 9
- ft ta
> < . ta o> m c - i « * J * J C O — - O ta * * c C — A — - . U
*-— - 3 ft . — • O > . « » — U « S u — A . y ta Q . C
« x « c a a s • • •o a -— B M J C * c — - > « C O * - i>. T) 0 A « o •
D - K - t a - ft-*4-
• * * ta £ J j ft > ft » « O ft- ft
• n Z O a ^ c U JC a. c s > £ • a ( P t a E Ä O ta c ft
• X ft C E — • * . O
— fi « U & — - O - m * x — «- C - O - E S - w -" i B - S 3
« O ^ J B 3 a C ta C O * —
• e 3 ft u - - * *
— i N - « « j ta a ft 3 « « > , 0 a, c > c • • Ck - 3 A - * A I 1 •* S * 1 u « c « - • «
C > o • » * * J ( — •
~ * - c >, « o G . 3 e » T > s — ta ta-O ta E ta ta B X - ft - - D * < M m — O - C U T ) - — O . " l A f t u « * a •
C u o • O O t» c ç> O T J — ta ^ £ o • a— >.« o « a r M A * > c ft • « a O « « - — O f t « • C * * • V • A» 3
Xm*- > cv— « M a »' • G — ta * o - < • ta ft~ • « * > > , «
• > . O J C A D . O . • X « « c > • *
ta M A O . Û H - . > .
* c « A « a u — ta <A . * Ck—
« u «*-. « T» ' * -O Ä c — - • * -
« J ) E > ft— ta ~ • o 3 u r t • •ï « - X c - A W > « 3 ta x i x a - A>A V — - — - s >•«
3 o » •J4J — ta o i C « — a * * o > X * V w o — ta O ft c ta > , > , E ft > — . O X ta— • C t ) • O A C ta M «
— — o t>> o. f u o > C C M Z 0 6 U Z m Z Z 3 X & £ • * «• *+* £ O M - - > c * > — - - . ft c o ce a * * u c - * * • A « ta c O O > ta 3 ft - 0 • ta • ta— • • C ft ft C N — • A — ft ' 1 •
> « 4 J u u > . a M »,>"« a c A • — A. AT ft -
- J « « g « >. - . 0 > t a » - H > . * * > , C A * > - c m u o - n >.B > . * - ta ' *> . y C f t ' O . A . -
3 ffij fie ïimm *
ta « A C J O ta « - 0 « m • C A U — « > , * J ta
> 0 - 3 - » . f t - i t a A ta- ta • * . ta c > — ta > , . £ C «A a O 3 • — ft— O « > . U - * » t a ta -O ta*J t f O " U ft a y « A -o • ft ft ta U t ) ft «
T J - * - - ; < " £ T j v U > — n « - A •C Q . E - D C > . E A • C E A ft ft - A •O > » C > . B - > . > T ) - >. ~Zt-
• ta A ** M Q M - « M * * 3 ft A O E « — « M — M * l > • ftA M A > £ »
• o. * > > . « « >,o > . - o U p >,o > . • - C J ( 3 M • 1 C ft 3 • O > . T ) O M « C • i t j ( c B 0 > f t r ~
t o ** ta a c - ta c ta > , * > O T3 "O ta O ta C t ) ft 0 13 3 ta-a » a w ta o ta c u - o « O ta ta « « « t ) ta c
• - H a « . , - . — ta « m ft - c— c « * « a ft— « A ta c o ftta3£OftOOB « « C f t t a C t a O « • > £ — C f t — X
* s -* «• >•* > > 0 * H < t a » « > T J - « A « O D > > ft > < t a K k A ft U o o.« x o.a.e Q.M > « - A A « - a Q x x o.«-<w a * c — N c
ô o o o n M • •a ta u c C m • z 0 * i -* "2 S„2 ^ t )
0 s: • S Z 5 s — — •
V e • u e O u - * B u t o o m •N — C
> *.— C » N X vu P • » m
« 0> — « P •
« » - • • o M N l>4 r« 1 i e e o> B — > < • Otau * 1 «
•<!• w> o i n — D»
w >• « ta M ft • c o cr> O
<«* fM m t o OS - H C O e S U c « u-s •1 o o O C » » M « C T3 Ä C O O P , A » • o
« m> • o « O *.-£
». O . P » W < o C C ( • o> C ta o £ » . • * > A
o 2 5"S 5 • ' » « « 1 t J S2 « o ÄÄ ? £ y » 5 .• < C X 5 h . O C 4 . U K J o ce k o a <

181
3
I I . s T. K % « t- a j
S S • * * <o
C v
V
O "' •
« • ^ m •
u d!^ s ft IT«
i œ *~ i ^ ON
? S r u ? cl d S
S
| f
~1
i j
I I i
S
| f
~1
!
| o o o
o ó
!
! 1 i h p
!
!
i j
! 2
I I
•
1
E E w
S ô 6 i
J n
* ! I
ai
I 1
1 i Î I
s ï
! o
•o
5 N
ï
o 3 'S
! ?
< ï a. n tu
S 1
1
I
I
i !
I
: o .r.
-_
m S » r,
t— NO S *". _ A «!, N O n* ?
P? A P? A u M Ï M
_ I r„' i •v <*> ». i
f"J O o «> f0 I N O
»-3 m o » O N O ON i r - r * 3
s <* N O
*~ *~ i r f -
c s •*t
» ^ .'S > o
s * A i n
"* N D 33
o • < »
* S * S S o - o -
i
! S
t
1 I Ê
O
i * i
:
i * f 7 o V) u o z
z ! s
1
s
! s i
1
3
i
L.
t
: ! 5
I
5
1
>
I i i ! i
i i l
! * 5 ?
! ô
I ! 8 f 5
i
I 1 1
I ! S 1 S
t
f !
* •
<
J
3
t
O l
*sis
« g =!
I! :îh
XI « * l
!l il
c X E • » « -O T J «- o
u
** • >• 9 ^ C
» >. • u c > • V Q. * c
— 3 C 3 >.*>T) * O b u
T> 3 — £
>.-** *•» • Jt • O X V i- O «1 ; H — o s
*< a « (E U • > O >>o C
- * X ) . - « T > *
« c
S U
n!ïî fil! tm i I5sï
B - B ï . g - S a miu Ifïîlïl
« J a *
m ; glei=
m ï » ! îs!-:!«i
5 - - 1 ; a » > ~ - . c >.
>• • >-CL » 3 :
ffii û J) " Ckx: Cko
f fiiiilï
SI ifii - * C O CT>*J
l ï ï l !ISÏ

- 182 -
—. — — *~" ~— — —~ — • " ~"
•"
-
o i—
t ( T n . x> s 1 o
s
• -„ .. O u>
<1 <1
I CD
I - ! j s
1 § i i I I
I o
o ! ! !
E
l O
ó
o
* I f s
î
< X
S t
! •
o
I I .
i | I II i i 1 ! ] | 1 »e
| 01
1 i
i
i f : o « .1 I 1 î o 5 r i
o s •s
? Î
0. *> UI
1 | £
Ü U I
(> J
~ ^ — n n = ~ = — — — — — = =
RÎ :
_
j _ r
Ä
7
m
Î u 1^ O
S i r * _ .r* _ <n N S M M
r- M A »-I ry
« S 1 n
1 5; VO * n O ~ ?
^ I T n
•* * * **> • * é «- o O o K
!
î f Ë
1 Ë
o r t
:
1 f ! o * z
z
o
i 8
1 :
S
1 ! s
1
J
1
t
Z 1 s
1
i 1
°
> t
:
!
î ! I s
i î Î
X s ?
1 1
S O* U X Ü
o* «
I 1
I
f Ë 1 i
o
o
1 f ï
•
<
î
<
t
s
i
N . *
• o r t 2
1 IS E o - . U m « «J u r - t
V O ) < H — — 3
— — o v > a. -
II
ïl •U si
: | ! « l .
K-irï liîfi
«rHS
sïHI! >•><• a v o
n;i iiiu;-*
.%!
il [Hfî
> o— m ac » o - « I f l i *ll!3i ;ihï
«AAI ifiif S
PiSÏ*
— U c — *> —
gjp ä i l f ä i
ÜW ï î " .
V c — X N t c " o o ri O cr ) o « »• c U C c • z ri u o ri ri o 3 *
U J J r i
*• • o " •o *J o a c —.-. » * E u a O m «-o *J c > * • - c » m X cr>u
« 3 » « • e • o M N . » *J c E ri • e a 8 >•» CT « o — 17- «e
> > a " *> « * J « c
> — ri c u • • D> >*• U U O a 3 U — C — O — «i O O 0 C * o u
^ a C — T J . C C O O Q..C • • • r - D — TJ « •o u O - - J : L. u.(7>tA < O h. C - c « (7> C rM U o a n ^
.O o « « «> « tt a 5 « o « u s
O J < C I ? k . U « , J K J
> .3 m ( 0 « h . û û <

- 183 -
o **
I
I ! i 1
- -
I i
3
• ( •
a
I < o m
I
I ! i 1
- -
I i
3
• ( •
a
I < o m
I
I ! i 1
f t
à
r-
o*
o'
Ö
I i
iï
5 d
co
3
• ( •
a
I < o m
I
I ! i 1
3
5
g
s
f t
à
r-
o*
o'
Ö
I i
iï
5 d
co
u>
» • N
«j "- *» R a
S
5
ö
u
u
u
d
-d
d
o o w ™
B Ol H O
e s
I
I ! i 1
3
5
g
s
f t
à
r-
o*
o'
Ö
I i
iï
5 d
- i
ci
f »
CM
CM «o
w
r-
o
.A iTN
( O
M
O l
ru
a
S
5
ö
u
u
u
d
-
- -
d
d O d d B Ol H O
e s
I
I ! i 1
3
5
g
s
f t
à
r-
o*
o'
Ö
I i
iï
5 d
- i
ci
f »
CM
CM «o
w
r-
o
.A iTN
( O
M
O l
ru
a
S
5
ö
u
u
u
d
-
- -o
d O
tr
3 o
I
I ! i 1
3
5
g
s
f t
à
r-
o*
o'
Ö
I i
iï
5 d
- i
ci
f »
CM
CM «o
w
r-
o
.A iTN
( O
M
O l
ru
a
S
5
ö
u
u
u
d
d
d
O
o
- • O d
C I
I ! i 1
3
5
g
s
f t
à
r-
o*
o'
Ö
I i
! s •<
I
• 1
"j,
«o
w
r-
o
-O
r- R
ö
u
u
u
d
d
d
O
o *» O d CO
d
g « y
m M
< u C
I
I ! i 1 !
! s i â
I 1
e g Q
I i s
|
I i
! s •<
I
! •
i s Ö
s o
1
! i
>
i O
d o 6 i 1
s S I
S
! ! i
î
* !
o 5
'S
2 « ï
O
H ri
a
I i
< i
1
2 s
S
s 1
1
i f
î
!
S
I
J
1 1 i
S
1 1 i
S
S £
»
1 1 i
S
1 * IT» Si
d * O
o CO
R 3 5 O
t— ? »
1 1 i
S
d o d o ru
O
U z S a 1
t a '
ru
•o*
3
d
s
cO
O
**>. s o i N£>
« 1
O *
<M
O 5 s
1 1 i
S
o
o
«M
O
d
d
d
o '
o
o
ru
O
O
3
•o £
S
S
2
-<
t a '
ru
•o*
3
d
s O
o
si O s
NO s N£>
« 1
O *
<M
O 5 s
1 1 i
S
o
o
«M
O
d
d
d
o '
o
o
ru
O
O V 3
£
S
S
2
-<
t a '
ru
•o*
3
8 d S ^ 5
t -
« ON
(M 5 1 - 2 O
O a S 2
1 1
'
i S
O
ru
d
d
o '
o
o
ru
O
O
S
£
S
S
2
-<
t a '
ru
•o*
3 ?. d • > * s 5
CD
1 r -
z o
t
u
s
o *<t ü O
? Z s
1 1 !
2
i S
d o d o
3
O
S
i
O
3 a l u M o O
o I 1 I i t
! i * î S U u
2 s
CD
1 r -
z o
t
u
s
S 1
1
S 1
i 1
Z
!
5
2
ï
1 * 1 1 1 1
ï ! !
2 V U î
i 1 3 o
• 3 I é1 z
t
Ü
1
s"
!
1 i i i S
!
i o cT
n
I !
< 1
1 !
o
3
O
S
i
J 5
SÏK
Uil» - i l il —.*. « * A »
rsir
» 3 ><C >
m i c * o » I Üih.,:
0 > « - 4 t
Si«-.
c n — s « c
- O - m Fi , n i
l£i .-8=
m îiiiiaiii ïllPH
äiIHtä!
. - ï S « - 3
5 i.. ^ 5 : ^ « c » U— w
• - w O >.
>. *- ^ O & > b • U w • • c - — ) • » >- >.
A > < 0
•* C *""°^ V V C B c >. • •o • m O u C S C fc. w « •> O • fc« * i > £ c 5 • M » — • e •
+i • - . - * - e - o c - o - o > . o •- o _ flu« U « T > -
- * J £ o c * u m - m*i
*> C 0
- o £" » o • o ^ ü » » - c -M C >
""" — — C 'M • '
o - • T ) C • *m .e c > . -
c ^ V « J .1M — - 4 3
* « * 5 V » > » " v n u _ * 4 B r u « 3 *> S > —
M M m ». « I > M
K A * i 0 • • *
> • - i C T) O M ft— - C
• « • C Si" •o • * • U c >>u •
c u o « « « c > 3 - 4 _«_. O » J 3 > . U <M u w , ,M T) a m M • u»» g >•
, ^ O Q . ^ - V »
w - 3 M : * - . > 0 * 1 o» 'S * v « c "•° ü E
* . —— o > • « i ; : t s -ü . £ ; : t s -o o « o o > Q . 5 • Q . > U**
m m • ' - 1 - £ |
^:==?i
iHI=5l
^ » . o .
m M o
- Ü o - - 5 5 • U *J-H m o u ^ t J * * o • — — • « m «i U « O B 1- — - C > ** * - c ». - x tr U « 3 • m * B fi o * x * • ^ • C Q. M — « >. M tr-»- » „ - V < >. a * ** M t, W t> C O o»* — C *. • - o n ** u o • 3 O— C — 10 S U - . O O O C M t> •4 « « C - T Ï X c 2 O Q.X • • — • •D T> » D — * O * - — c » CLt>V)< O b C c * o-c k . - u o a *1 p . * - . . b « « * • «i « 3 « o - * *• 2 < I I 3 k . U a. J j > -1 trt W)K h. O o <

- 184 -
« M .
i 1
1
: 1
i 1
1
f O m D
M C
i 1
1
f O m D
M C
i
s v S E? r-
1
1
3 ON (O
ir
i n 5 m CM
in
se CM
J O
o o o
lT *
i r \ O
i -^ m
CM m
f O m D
M C *
i
s ••a Ö o ( M S
1
1
co
ft
r— 5 o \
»• «— CM
ü (M
o' o r -
cr>
i n
«o o-<7s
Os
:
7
i
s 3 » s
1
1
o so fM ° CM S <M IM (M
o- o o
o i n
(M r-
t
't 7
i s ^ S co o
1
1
o> CO
o 2
ox i n
IT-CM
O
e . o' o ox <*> O - •
co
O
< «*
i 3 1 £ 3
ON
o \ 2
1
1
o I M
• o
£M ^ <o 1 O
«0
o a CO
(M
o o co
o se 5 CM S z g
L
V,
< z
c
i * i
I
1 I <n o o o
o b
*
1 f I i
*
\ X o
1
j 1
1
i o
o
k l
E E
O
C)
ó
1
E E
o
s o
1
1
1
E E
o
o
o
ó
I
•
Î • *
5
1 I
! i
s
î
i « *
5 o r i
IL
: ï
0
Z
\ !
5
X
a «o UI
o
i
•
!
I
g O
Ê ô ai
1 !
1
1 1 1
S
1 1 1
S
g
1 1 1
S
z i t 1 :• CO
o 3 o
o CD o" S • « * S *» lé R ED
1 1 1
S
o 5 fM
O o
o z a a
s ? s °. i o CM
ir i Os 3 o\
1 2 IT«
1 1 1
S
o ô* rM
O o
3
i— s ! o' VO R «•
CM i r
«M
co
u- l (M
ir»
CM
^ /">
1 1 1
S
S o CM
o- o o
"l s ? s • O
i r S n
S O
CO -t S O 5 5 O
1 1
*
1 S
-• o 3 o o
i S • *
<M
I f £ s s o
ir>
<* o i r
o-
Ï tf*l ^ CM
CO
» s
1 1 1
S
-* o o o d
o < > a Ul
m O
o
1 1 I I I
! Ü
i ! f O ia o
2 U
2 z
z o
à X
f ï a o
o
ï 1
o o
Î Û
I
I
• >e
I
2 1 1 j
o
z
t »
1
1 1
*
! ï I ! !
X 3 f
! I
! g
ff o X ü
i
«
!
i S 5 1 S !
i
f ! I f
î
! 1
* i
i
1
<
1
n
i
t
J: Ï
Ö S o - . ï ' . = •
— > - «, •-. * « 9
k . - « « M S ** m** " B £ k.
-. -. • B « C « - H O — « o « ^ O M V O " O * « « û > -
« >« j t * * ° ï c • D S C O « • o*« c -. « ^ 0 -J< « > « £ - •
« C C
z « S 1 0 * * • 1 • £ u u « o> o «
• •0 O » « t l — o - * > e i. — > u *> « • u . ^ « C 3 — O.C » « o > • -H C r ^ i c a « • u - «
- . o o *•»*• o X « o u — " I O - O Z Î O > o C - * 0
£ T > O - O 3 > .o - « O E . A I " . >
ta «M r- s o w ) O. 3 a • o so o - — o o C ta -- 1 « • " - o Z ta S • « 3
1 « « H i o r * « M ta —
« <•» e - c c o . — rt *> M 3 ta
• . ^ Ä - - _ * . = ÏÏT-* -b S A Z Z O
> . > . : * A u « - u u o e > . o - am ta— 4J
e • O Ä • - • • 0 • c J t •o — u — -u ** • •n im*** • u c ta * -U "« •
C7>0 a ta o • H ta CE C E ta « ^
O • « >- m m > c o c * . >.
O
** « . O • C C ta
• \ c - H — 3 £ — o e •M D-
• • > B T - C o> » C E E C
—— • X • • O O 3 T ) *»
• >* O C - T o o
— « TJ
- ta-Ä C A — 3
• A » m « -> ta • *• — ta « X
U a - O t a - ti V O ta * > * i » - * m o c o — • • c > o « e T) — • — a E
C o O C » . M ta H C N . • • E - ta O» C O» x: • w t ) > , «
- c
^ 0 — ta M C M O *J »t > . c t>** • * ta
• N . ta * > ta
ta*.
• » •o - «ft « X * * •
V « o • * • > ï > , 3 D. 1 n E C ta r* C 0 - 3
• V - « - • O « ta
> o « c s.jt ta e - c a — • c • >• a c e • • o » — o - •A « £ — o c - 0 . 0 — £ — > *> c -SS- C M
-*. > . * 3 m SS- JE O — O c — » o * t X — — o C ta *>M * E .M ta o U N 2 2 2 3 a * O O « * C 0
ta O D > t . f l ta
•o !•£ = _
iiSif =^::i
l;lii
Suffi
^ïlrft
M C - »13 A t> C
> • « H •
• -o ta D U «
** a
• 3
• * T >
c si ta C T» •M V 1 > « > . C
* m • « X U
*> > > * Tî S
ïi
l O i a i V i
•a • v — —
O « T
«> - m
« •> • — • > N — c — •s • • o o ** o "O
O N . M • a ta c M z 2 —
O o 3 • U Ü H ta « O ta O
« - - • « S « U ta
-* • C >
** • c tr U O S » • • - E fi o E — - e Q. • •
OHM V - CK < > i • ta • M » C o O » « - C ta . . c* ** «
O
« 3 o — c -
« ta U - » O O o c <• »
«ta a c - •o-e C o O Q. .C • •
— * T3 "O « I ' D < - - jt o*> - X
ta a n > u < o ta C C « C * C ta- o o CL
«*< C K « - . . t>
« a « a s a o - 1
* ta 3
O - J < C X D h - c P. u ce J > J M U K k. D o <
•> O 3 « C T C
• ? - - = • " •
--iiH! Ilrffl
r«-:i: 5îii;tJ
ninn\
5 s;;.-:
iifrti fiiKfi
m
— -O O —
51 T
O ** ï
c c

- 185 -
I I â
u • •
*
o Cl ni
3 « o u E o CV. o* V > r- m -J r—
s ° *o O
r* ? ? iï *o CM d s {M «tf CM Ox VO ir o, S o °
"~ " *-* *~ •" I M ï 5! \o O - i
1 o ir ^ l f> \ o O o o V S i r s
o "~ « o . *" ** cv P o o ^ «- o K
o V »V ON
(S1 .
O*. o\ o» v> - c- ' t CM CM - o j i o «n O
-,
«
- °
1 £
s - « ! i s
E E o
i 1 *
S
• e
6 1 I 5
E E o
o
I m
o
à
I o 6
I
! ! J 1 f
I
ï i * X
s f ! f
I
1 •
i s H i * ü J o
5 | 1 •e
I —
i
t
i
i • 1 I 5 1 f I I % 'S 'S a
ei S 4 e
1
-
O.
UJ ' 1 I s I
" - y n
S
J J J
i?
y
o ^ •* fc >•*! i r . ^ ^ _ H fc t H 7 o o » * f
u 9 *" "" <o1 o o o o
; \o r_ ,_ _ "> ; s *~ *»* »
/•"l
** * » • f f t *-* <• s S V •A ". 4 ^ S ,r nï o o o
*> f t S f »
o r - i ICI rv " * * CM
<! * O o i - O
CM CM o *-
1 o o o o
1 . ]
I i r e
E
] £
1 O
01
O o z S
3 X
8 o
Ê
u
O
X
1
I
o UI
u
5 o
] 3
t
i
i t
ï !
3
2
5 3
1
2
S
*' *
1 i i
! 1
2 f
I 5 Î ff 8
X ü o*
I 1 ï 5
à 5
1 (
1
1
f 1 1 i
i
1
<
1
* i
i 3
•
M
? • • >.üw5 - i -O . — — C a * * > t X O k, .
> k. s a o - « — C a < M a - o -H a c
m O VM-4 C 3 • T ) k. a a a a a u « a B • - J3 > a • S r - v o • « w O • e W T ) ». — a c a O a a B B c S a M . o * ^ e J t o — a C M B O & — - H k - * * k . « o S " H C M * * J u J t * ^ o u *-• a a E - « a a - , o O J I W » - O
u « ** \ >. -- . a 3 •O * T J »« - a e c o
S • * • • k. u m « > , a T ) C C > , f l O - - O O - a - * O w * J > * . • « « l>
• v x • a a a « « E £ S m > . * 9N —
u - " * e • c •M a: o u k. 6 . C * * a k. a C a m M U * J a
ï " 5 o " • • • 3 o ** > . - - o » 3 > D> — C O k. ' o - o - a c
*i B - 4 c • o j a * > a c r o > . k . a k. o - u i J U k . -
**M o-*» c ». M a e s c - • — - & o C C a - k o u a « « • X O — w - ^ o k..* o a ^ o * • > ^ a a c
- « O T J » ^
»* » C • > a « — O E * i u - k . ^ : ^ •D £ - * a c
o u*> « e a -* c c - * * - * * > * - - . B O ^ . Ä « a >. C D > l b V D « o o D rt^ a * 3 a * * - M £ O O - M — — u :s,>.ga * B K k- » C o •o±>
* O O k - - o . * . O k. " t ) - » i « :s,>.ga
o — > c M - i a
• k. C o * » * *
- >. a * - — T> j ( M — o o
k- • — » o s
: — — 3 T ) A a E a > k . a o a - C ï i W C - a * * J u
« J Î T - U Î J O • « Ä
•* » *. •o X « > . a - o 3 * > c O a > - a s * / « £ f
s • » ^ « • a i •
• u • *
£ 3 c a u — o - . C £ a k. o a w O k « -- C O« o m
> « c a a a u a U C C » < M * c k. a A " ^ ~ÏTZ m . » t u s «
• e o
— - • J = e n a — a — a t î * . O a — a a
O * O u - 4 « c • > , « . * - c - - C « * * c M f l £ c c e B a " a " *> t > £ * 0 « c k- a c 3 s *J * c o J3 \ w > - _ * * > Z p •* o o x - x » >
>• 0 » N
« T ) - - * e o s s^s:t ( 0 " i « S o m — 3 ^ T 5 O &
E *J * ^ r - a - 1 c o- X O « « - O Ä M» s^s:t M> £. v B O S w i u c — IM S~* a H — c u A « m o k. a o m CE — Î K O E m s. u p a >—«
~ ° S è S a H O
« - o a c e 1 E a - T ) o t > . « * . « T 3 a « 3 k- - . a ~ ° S è S o > o •
a i -
• a - * . - B * J m J = * > -
« o a a - c m Z.+> > » J S -
E ' t ) „ M O 3 ^ ï * c *.*! * k.
» a k. k. o X — a K - X « - a o « T ) X K u a j t - «
£ C E - O >>o * i T < a o
• — « < H O W> r* > . » o a <o — 3 — k. c lO > a u a —
- * > O m r - Q.> <. *M
-» I Si B
>• o c a t
-» x k. a v *> o , « a •S o > — a u
e « o » i 0 3 • • O » i
^ ITS a B— - C B r * « C C k. e u O a - u J T * J o a
* o « o o . J C k. - . C^r« c > 0 C E
« >.- > a o O » 3 T J c * - - - Ï a t i k . « c c «o - o - 3 • « 3 O X
« - E m
*> — k , » M t ) O K .C k. û . D o » c > . — a * J O a
, *> «»•-» u u « i > M -
« - H a a o a " * >.^3 C c >. - *-.
C k . u a - * * a c c a-3 >.•*> i l IE * > « — M * * K 3 M a • C * D . O — M . JE X k. > , a o a - • - u a H — ) E i ) H ^ c X B • • - .
».-*.«, « a e E
« m a C k.
* - k. o £ a o a > . - > , o
" o S u c i US O o « < C - r . « E M U C • « D t •* 6 - • o o > a a k. _ 3 — « — * i
— X u * m k. ï - - x a • o w j = r - > s 3 T J - «J « O — - * K — — O o K £ > « - o. * > * J — *> o. » _ . u a « . - Q. JJ k. 0 CT>Ë E
- . — » - » X — B.
— > O O K E E H M Z Z U h > « M Z Z Z = > & i : 0 > - > a E C u a ï - . > . 6 _ . * ^ - o > a B
c o a > — a * 3 a * * k. a »•s*' °-- Î; a o — - ' • o c u a o k . - . a a « a a B a c o a a - p > » - c
! -*
» 1 ïiiff l=If îlïHl Ï S S . - S
•g H : £ * c «1 - X E - r O * " 3 **+> - s o * -
^ o - o - e » >, m u > - - o o > , - Ç U > . J t ^ - < C > • > !
— « « ** k" - s - , a c k . - , — «j c o - • o a — > k. w a - o a c k.
• *• - H Ck a a « - - J : ^ • i k . ^ ^ a B
»*"«;! a a Î £ a a
Ï S u
° S J t O u a » M > a a u k, a > s * •>*" > o ï e * e >
N â a
-e u e ë a
« O - - O 3 a
U U - H
" a O k. H U W o a
— — • a s a u a O a k. H
** c > u a « c • a x o> u « s a a
« B E O a x a
B - • 1 ^ • Q. s' — a > .a o w a — i y < >• a u u a a u « c C e»a - 1 C k. . . CK
** u « . o a 3 u - c — a u
O - » D O o C a a
>" u a e - - D £ e o
O Û . .C • • — a T ) — •a a t ) - M — j ( o u — e w u m » * 0
" C - . c > . t r . C k . _ u O Q . a u
o > « - • • • a a a a « c a a o — a k. 3 < E X 3 k O
& j a j > J t o c o o : * - û Q <

_ 186 -
f
Il < o «
•
- - - 1 J ï
-
Il < o «
•
- - -
1 -
Il < o «
•
-
-
i -
Il < o «
•
-
-
Il 3 s
\
i i ç
1 I
< o «
•
- - -* 0
S
d
d
S
s
î !
5
I 1
—
Il 3 Ö s
\
i i ç
1 I
< o «
•
-
-
-
- -
-* 0
S
d
d
S
s -
1
î !
5
I 1
—
Il 3 Ö s
\
i i ç
1 I
< o «
•
-
-
-
- -
-* 0
S
d
d
S
s -
1
î !
5
I 1
—
Il |
F O o ó m o o
/ 1
Ö s
\
i i ç
1 I
< o «
•
i o
o
i !
1 i
r-'
S
d
d 1
î !
5
I 1
—
Il |
F O o ó m o o
/ 1
1 I 1
I J
s
\
i i ç
1 I
< o «
•
i o
o
i !
1 i
£ E o
6
ö
E E o ö o o I !
1 3
1 I f I
: s
1 o
•h
5 « ï
o 5
*
i ?
• < I i
: S
t 1 f I
!
I f
I -
!
1 i 5
- --
-
!
1
-
i 5
- -
?
—
ï •<
!
1
-
!
1
-
i 5
1
—
ï •<
!
1
!
1 i 5
f r.
Ï
r
!
,_ *
—
ï •<
!
1 1 I
" s, o
1 £
O
s o
z
OD
"5
s If
o er •4 <*• O*
CO
O
*-i
5
K
!
1 i 5
- -S
S
r.
Ï
r
!
,_ *
—
ï •<
!
1 1 I
" s, o
1 £
O
s o
z
OD
"5
s If
o er •4 <*• O*
CO
O
*-i
5
K
!
1 i 5
- -r.
Ï
r
!
,_ *
—
ï •<
!
1 1 I
I T
° 1
O O
s o
z
OD
"5
s If
^ 0 0 s
O*
CO
O
*-i
5
K
!
1 i 5
s
r.
Ï
r
!
,_ *
—
ï •<
!
1 1 I
î -
G
i i 1
i
f î
!
I T *
«o O
u
O
s o
z
I -
z u
f 8
I
s
o r-
Î i
IM
f t
O
1
z !
J
s
i
°
t
:
!
1 i 5
î
1
1
< i'
J
ï 1
1
r.
Ï
r
!
,_ *
—
ï •<
!
1 1 I
î -
G
i i 1
i
f î
!
I T *
«o O
u
O
s o
z
I -
z u
f 8
I
s
o r-
Î i
3 -
f t
O
1
z !
J
s
i
°
t
:
!
1 *
1 ! I ! !
i
.3 f
i 1
î 8
O O X 5 10
I 1 ô
J I * i 5
!
i o
7 Ô E J O »M
î
1
1
< i'
J
ï 1
:!U i . « - - . c
X — * -
>,5 V W A* — rt •o V m *>N >• •
a 9 - ^x > . a C ^ > c D> — u m m j l 0 ** c • o c f » * > T ) • U - w - •
o J «
-\ « C U « o * < « O s u ï t 1 " * • & S S 5 - - •
« H • K J ( >. « o a ». * 4 J V < M > - U * H — u • u U « M m O O U ' a —a s *> 0 a u _-, — -. C-4 C k . «
• z C
• — J * J * > » 3 a a c a
J C O K a - * o c - e J : s a U • V C s : .s u C > 0 . 0 > •
o e « ©» s : .s Ä a a a • a 2 — e a 0 — * J H A a • •
2 - .£ • u u 3 « • - s-*-0 >. o
S 3 S « S •°rîs • " • S ! — 9 • a •«• - , - - « £ > ï » " • *J.O O a M
*; • g e 5 rS£g • ^ C * ï | C o * 4 o O £ « ^ T ) - O « g -. « c J C a a * C «•>>« ^ c c o c a a v a u ï « J
c •
» X
• — - , a 4. ••• m - D O «
« a u c o> £ » f c . - H « 0 o um S *f £ -ï - c M M X J3 * « * ** c _*
N . * J o o> N O V •n O a C o
« >• a 0 u
• t .
> C a u
• c 4 J - — f * «» a £ •< r CJ-Û £
-u M » u
^ -. « U M s. - t e » N . £ • ?
-g
>, m a 0 » « — o • M O >• a«M
>• «a — — * a
» 5 K k . m o 1 A • c £ e» c c V ^ • D a D S £ v.
« — T» • V
— — *-*> — — - o a C u « O o c a * > C > o • • • O o — *. >.«« » - a u f . i . » - i 1 • M C
>-m • w M c O O J*.* - g O - ? a • >. i a O * •o m
-O . T J O a C » a *• a C Ê c
« i ---« c . Û . O m K * - U £ •° S **ï R" - « fa. o - * u * * N
sa- c " M o a c £ a
* - » - • ° -^ * J B • C CL— - t « sa- _ • 4J J f o O •D « > a - -« • ^ * * _ " •s « S . * a . « o - K - — o c M C A . C " £ Q , a - Ä C a 9- u * £ - D Ó Ö > a - O O - Z Z O « « z z z D ChC * «
« » a ** • - >-0>«;w
« £ a * O a > . a - i x a a £ a a a * > O a f - , - , > -o a * ! - * > « c • M u a O •s * > a a a V o c ï -O -JS-C >,-— ° ï
• — E »-Q j ( T ) a *» • — c
- 1 - a >. e u c *. M a - J a J> a o ^ u a « a 3 a a
• o* ' >—.** — T» a *>-* c > . a
a e *> c u a « ^ S •
- * >.»« a > . - 3 » M S • • *> «•
k. a - a a w ^ - T l E t 2 —
O • •
a - « - * - * a U * J C a "** U o = = ä O u a D. u > t ) a a • O a
• a 5 Ö ^ o 1 ^ - -0 *o X « a
*• e u e C "• Z t ) u O - - O 3 • a o *. « - O » * o a
__ • • a v a o a u •-o o> a*5î ** « «•§ : x i * ^ u
2 c S D * - S S. • - . a > . a (7«M a
a o - o- < > , a
»• M a a v a C o » a
~ c - • • o> . « u o a 3 o * . c - a u o - a a o o c a a
*-*» a C - . - O X c o
a a o c e • • ^ » " D X» a - o » . - J Ï o w - £
a u M a DMA < o u C c • c *c ». - • o o o. a * .
U o i r o - • • a a a • a a a 3 a o - « a h. 3
O J 4 E X = > h . O f c - J Ä J > -JOTtólE fc. O o <

- 187
V , — " ~ —~ — — « u
s U J « o ."J _* S,
*t
ó S O * * • E? CO o S < „ ''.' "i v> • *
B a B a . r *
a. * s CD •-1 rf "". *"; n
^ o "" ö ö
*-
ï "*
I J
o s i < y w to
c c « 1 ; ï !
!
s E E o
i ó
#
i 1
1
I $ e
| ä
I J
I s »s
I I i • !
! t
i
E E
O Ö O ó t ! I
1»
5
1 I î 1
s
î
i % 5
•s M
s
o r i
1 « ï
*
\ i
<
:
« z
a. 01 u
S 1
1
! f I
!
i I 1
1—1 1—1
• n " • • » [ [
SR . -. o o ® o « w; - m - H s Ï-. ° ^ s Ï r— N-
•Y i r \ CM O •Y (V. Ä 5 o* o '4 *
( O o \ CM S
^ t t r \ ,_ » <* l T \
z » <* z
^ <* t r > O
r> h> . rx m
«s
^ u tf t r>
«o ft o ft à f l u . à o o CM o " 1 « i \ t _
^ IR SÎ • tf' o • o
O j * A C M -' &
- ._ "\ s C M r—
ë i ë S i r - o — O œ
ï o
- I I i ; ? ï } I ! * ' < M > I I
m o O
o
tu 1 !
I 1 1 I s
E
e
E E (J ut
2
f l
t ü
£ z S
f 8
: I 5 !
0
t
f
z
1
1 s
1
5 Ï j
i
ï
s
J ] I i
1 I ï I
X O *
1
E
<3
I 8
o u X
1
û o"
«
1 1
I i
! 8 1 1
*
I î 1
6 z
i
t i 1
I '
s«: i ffiîr! Ô - ^ . è - o * c « s a « z c
s •f e * - i- O • D*
o o " - o m • S *j e * . « b c O * J o * « « «T> - > *.-* û - « « a -H O «
« M O
I f - 2 S ïg»^ u « 0 0 3 « >. m
- 0 £ * 0 - - . C ï -» C * * • > « Q.O. • «> » 1 « e u "1 • « ' K O S U u - * J.1* ° ' ° r* Jt rfl -w u ? * % x m ** O — - . - o - S-I O N M t. « 3 - . «J- . Z ~ S5C5 . 7 . 0 3 0 ,
Ililli u
H * » Z > * - < M Ô > t i : 5 U 2 2 U Ù r
«S
S i s s :
|ï|;iiï « D W H « I .
1! i »
U-« *> o o o c O Q.X • - — i •- &CMIS < O k < C x D fc. o a
Js!
i:-ii!f tr-c k--. u o & « JJ

- 188 -
%4
3
« , «-, U
^ ri ? 3 - • •
< 11 : : ^ - i
^ Ä 2 C
ri o "; m
3
* $ d r*j o J,
ri ri "-* « « " la.
4 8 1
j
*" O
< y M
« C 1 i
8
! I 5
i o
i ü
1 1
0
î
I i ç
s
î 1
j
i o
o
»e
2 3
e S Ci O
1 !
i
i
! i
i
E E
o o o 6 t
i
1 I
1 1
î 1
s
ï
\ o 5
'S
o Pi 5
I I
i
t
X a
a. ca
S
I
1
! ! £
I
î S
S
I I _
CM
ru S + ' ^
j ~c — "7 - ~£ c* f \ l
.o*
u~ «o ?.
- — - - — — — O ,
r v rt
rn f -
3
« *4 '._ lr s, A s, A a "'
(M o
« n r* o »n •*» r-
y > n y O o CM o r -
** M 1
- £ '4 1 *; o n ** « n*
^ r* o I M m » i r
? ? o I \
o O E » a I
s
s 2 9 ï s I •; ! * • < Ô)
ΠUl
D O
O
U
i
!
?
o
1 s
E
o
i E
ä i f U
* z
z o
o
î u u
I
s
1 !
1
o 3 *T z
! 5
I I
ï i
! t
S
1 i 1 i
1 I 1
i
1
3
•
!
1 I 8 u
X 5
1 s
1 1 8
î ï !
Ï i
<
i i
ill;
- § - •
— C
« * m
> • D»0
f: iiiil MUnihiUlk
> - * T J • >- ——
Z 5 bC O
= « o i o B > • ri 3
• o>c « C
• c c n .C
• a > A
* C
o
*• m A
• J3 > r t ï
• Ç « — « > » a O
> «J C
** >«*• •
* e o C D o
o — • « t c
• • >. X
> e r* *•
* X » c m > • ©
• x >•
« • « > >• £.
o - t
>*— > ^ • c O C
« * e W—« o a k.
• X) s c c -< .e o M
• • r >.*>
i m m
=*n
? mi ;
îse
n:n
VHl
m
ttï.
=ï!l
512?
?iSs -115
i im; 2 -
c 'S o o • z . 3 5 S.
« a U O
• > . H •o • • m X — C N.
H g s « 2 K z ^ J u
m C u • • • O D> 2 C
> « 3 O • • e — • B a • w - a < >• • u
> — - c h. . . Btjj U<u O • • u * * u * Q O O M » M
»; * « o a.c • • o « O n ao>w < 0 C r i c
« JQ O o« • t a n « a. O J < E X 3 t 13 o. J tt -J
. >,m >.»* >. ail ru«!
1 8 min
IL m UiSSsl ri
ni Hilf Hill

- 189 -
* 4 ._. ~ —' —' — 1 ... i l
e m
Vi o
3 <ï
r j on u^ «d o «n _ _ *7 O *>
I » en o r
— ° — •" — t \
'V 'V » r O •*t o »
•* o O m o *1 _ - t
• ** s «
? x t O «, C7> t o v: SO -. O o va CM *-> 1 H •- o
U II - O" «TS «"N I M
1
Ê E
F
1 z o < y
0) to Î . Ê E
F
I o ó o
Î s
1 8 i
* ï
s e
1 1 2 i
!
E E O o
5
E E « o 6 o !
• i î i
: î
*• !
< i 1
! !
t i I
Ö en i o
! "?
c
«0
o
5 S
! 1 | Ô
3 8 I I i i
1 ü 1 1 S I
î i !
o
•il
o
r i
h.
5 % •s
i
=
• S 1
i s
J - — - =
S
- - -1
— - - - - - - - - - -
o •"» ._ ,_ _ ,_ z - 1
o O z - 1 O
o z
o _ ._ _ ._ o z -Y X, o z r*> -Y X, r> O
dS 4) • 4 o \ £ rl so i - ON
'" K -, -r\i o o r—
ft <* CM o ft
o o so o O
- tr\ as o* S CD V - f - - -, - -. -, « - -* CM A «rs o O *~ O r
Ï
o
O
5 cc
« m O o UI
Ä 1 ï 1 o o ï 9 Ï » ! ! # ' < m O
5 cc
« m O o UI
e
| , • O
z
z
e 1 f 7 o V)
o
5 5 Z s
{ 8 s
] m O s
UI
a
i
t
z
I
! ô
1
! 'z
1 > !
I i ! ! s
î 1
>", *
! ô
1 I s
O u ï Ü
: 8*
1 ô
1 s i 1 1
i o
o
I i
t ï
<
I
ï
I t i
ta.
UUL >> O j . • >,
- s - j
fJ!l ÎU,
- H O I \ > £ ~ < C3 C?> ft. •
i ls
ffl Siîlh
ill»
m S=ÏH
«5
5 çs;sï«
s--|?Zs1 ' Ô B Ot* U Z Z 3 D.*J K O
Jlj m m H m
J u — • Q o 0 O & £ • •
. _ j b o.o>ca < I -O o o » « — • • i O J « z: x D t*.
- . u
O f t J C J
L: ï
H liil?
fiîif!
Z, o - " J 5 5 U *J >.£*. • c *
— U « M • • >. • M - a m > Ä O te • *J * — c >-• • e «** • > - - ** > • s « • « « BT) *
— • - o « - • * « — o a > . O C ^ * o . » e » - •J= CM«
(h M • • C C > >.>.»... * • « • « W-H «
C t .J=*J - — **J • - C > 3 * Ü > Ä O * " - - * O • e>« o
•M «1 M >>--. &** • H J ( V » -N « ^ > ^ o U >, C te M >, C u « _ w * 3 B te O » - £ • • - >,te • ^ > te *J > O « OT) - <te ~< • • 3 U Û.C • - « - - r - *J te« g ^ W - 3 w O m " • - * • C O r-- c > . o « * • — m « - . j j •» >»0 te e x £ « te-o_« >, S e >.>. • >, - * * J «J M te « * - « c > X u « c c o c •* • — 0 * J « « w
WO V ;«p O J = * J » v - O.C u c c ' \ H t7>3 - Ü » o s O ( « £ - OTJ • C - te o C 1 -• c — — t > * » - « . o 1 « u « ^ « E O w * " !>• • u e c *« » . c e ' O - — , te " C.C +J*J a • - 3 ^ X 43
— — c — o • — t r > K M « a r>* >,*> » o 5 1 c - _ • X « te£ E m c a o >,u s * • • • * « t i I > ^ I H 5
"- > « • O 3 • ~ « A u « - o -' ï; « C ** m >. - , . u c '•a • « » o e « «J « « - J : te te •M te te « c -C « » •> O — 3 3 « - « « C TJ Ü
^ * * — B a — — •> O Jt O U O. 3 *<> - - . B a O 3 3 > , i ) O £ g •o u t--o « « — >,« . ~ « * j C - * te — » - - * > c co M M a o o> S ï i î ï
II
» ï
n

- 190 -
^ "'
I I
R a R c l a a O t r > r c [
CM u> *j *-> » C *
s* l0 ,_, • ^ r vo CM CO «/> O o H I T l
? t
r o O o O CM *" CM CO s o o H R O i
j
t
«/i o» „. m U~l • * CD Ü ^
f o f • ^
f > »* o try A A i n ™ s ni Z S s '
o * • *•* s Ï _ »_ ._ i r
«>
~ E
1 ! s # ~ E
i
1 i s
!
i i • o
s 1 I O
q ! ï j E E « o ó i • -f 1
I
s
î ï
1
<
ï 1 I I f
I !
rf I I 5!
•S 1 * J S o
8 1 »e
.3 • •
1 t
i s 5 )
1 I !
O S s
r i r* « Ï : : 1 I I I
- - - =
CM «M
-:
o
S s ° r— » • •i -i o s o»
S *~ o o O
.. - 1 R; ._ _ _ ,_ R; o O " 1 *»
? CM S CM * • : m o \ S CM r - • * » o o ?? CO - - CM c\
1 ^1
1 "- *-s CM M> ~, »o ^ ^ s f >
-* r - V
§ s 1 » i o O S *" ( M "" o Ü c
* * d o
I 1 1
5
o O c
1 ! !
Ê
i o
i 1
i I f O
u g o 2
z o
! 8
1 ! s
i
1
a
i
«
t
z
1
! Ö
1
2
i j
i
i
I 1
*
I i I I
l i I
<; s
1 s
1
I o u z
t
Ü s*
1 S
1 I 3 1 5 !
i
o
o
co
? o E E
o • !
S
<
I
* £
ï
J
< 5
i
i
ül II r 9-SI'
• v • W O
- ! ** • > - ! w c £ a o > . • b ^ u «
** o a i a u c u z u - a U O r * u • c « 0 - - J « • — >.w U W 3 « » - . «
Œ> — 3 C H 3 0 -S . > f c - < Ü O > t*
ï l = ï ï ,
• X EÄ • »z-zss •* c o* JC O M -- o e Q.» C « - • - > .o - H - — «.— O w — C - » " * » T>*>** C O M « • - >.• • ~. « • ^) • — X >*M M M > >. — > 3 * i l- T3 M
* - « B OTJ - O >. - > . « *« U U J C » C * * M c * * C U
TJ — O • C 3 » • K M C C P O - * * t e — o» C > X » E 3
« u c «-« « c * * O « O ü u t o - C - X
»**\ « S -OTJ IB « • • o « a
c • o« C £ t ) * • 0 * 1 w X * X — m c O - * «i 6 « -
«•>-.*. M £ O « X - . * o - M X 3 O
« > " « • u v « i x * * * OT3 O L. «4 « k- k- Û . » * > • T) >»— O E CUM * N O « O — O —*> C »
O 1 e &.>.>.£ O B *> *
. ; - s « —« E X S BT) . ; - s • - - * B K - C*— • C - A S -H C * O w — fi- CLC « • 3 A » ^ ^ « . - t •»— B c - w — O - « W.C \ 0 1 - D O -« C 6 — « e» . «.** ->~ c e « ÏS.B ,S = ! 5 - ? ï ' 5 - ^ r « s »
îifta
Pif! il Bid!
ml
m »
*iT3 3 « 0 w C C
TJX *J «i — jJ-O >
! « : «
;:il
Ï=iïï.-5S
— — ï « C M
ffi
ï ï ' " ï 5
i o> •» —
StH1
K M >• > u c -.— « E a. o» I
vm
m-m • l l l l !

- 191 -
—1 • " — — v.
o
•» c + — •» c + — *m o ( -1 fM IM O _ _ _ • t ' — — — >
r -* * î S o <n I / * •i * m d ri -; s - R
c. "~ •" *" s <M
c. r m
o 3
o 3 Si «O o 3
s n CO „., i r (^ *M O B c
SI N
-* ITt
SI p , " 1 (M O t r i v i o on * » i ,_ SI
o ,yl CTs o r- ^ i r f \
o TT — o TT — v i ' M * t ~ o
< o
< s o o
< s z o < y
S.
<
c 1 I 1 ï
z o < y
S.
<
c
ï
S
1—1 1 !
I <n o o 6 o ö at
M
n S
i 1
s 1 ä
n
1
1 I 1
o
I n
!
E E •A
O
S
o
1
1—1
! i
E E o 6 o ô
i
1 §
I 1 1
1 i
î 1
s
ï M*
! % •s
M
^ i 11
l i
< t
_ a . cr>
iii n
o
t !
! i
!
!
i !
I J - - - - -
~ - - - -
" m
" a; ^ o (M
« a; CM t r»
a • o o * VO £ fT> _ _ T T I N r > 3
O Z
* M 3
O Z »*> , o _ „ ^ _ 3
O Z y
3
O Z y i r .
a.
« (M
*" a.
« r- +» '". *; " w>* m » ^ ^ " -rvj
-CM
» ft O
" s ft -. «
• * t 1 — t—
^ ' - -CM
- -? ? O - _ f l _ r M ._ „
z o
H tu M m O
o
<J *» d cO o' • *
s w *" ï
ï *~
C O o O
z o
H tu M m O
o
t— «3 "ï : i
o
z o
•
a u
3 2 9 ï i Ê ! * ' •* t
S
z o
H tu M m O
o
6
5
1 o
i 1 I I 0
5 !
5
i t o M U
£ z
z o
f o
z o
•
a u
1 3
1 *
1
; i 1
3 1
•
1 î ! i
! i 1
2
t
te 5
t
3
i ô
1 I
O U X S
i
o*
ô E
I ï !
O a
O m
! m Z
< Ü
!
i
ai 3s-S il
*; ft c " ï
i ls:
f=l-»
Istfî - ^ . i g .
S«?5=
«ni s Jiil
s; • - • » H I
siïrl
Pili
*KÏ
s î ! " - â =°
Si II 8'
:=Ii!f rf!3|
- o . " â>.o
»
Ä « - : Z — c
J« u • c * n £ » « a > . * B * i
TJT3
>.— a • -»
** - . «. o
• U - i * . > 0
» 3
i . — <M« >. £ » O O 1-* i > . * . c m -* • S* >• v * - ^ * i
* — • c
U U XI H 3 — 3 u — ft O r< > ,u « CXI \ T 3 * . M « ^ C • O cr»x
• Q . C * . B N » * « O > jr a « e o o - u c \ a -Ht3 O-D « c a
" S ^ C *J O
V s u " - . c o
fisr SI '•r:=! iiJ"i' x: a
: it rmn
3 m
m„ nm Hi?"*£-ä HiSil Hi
c o

- 192 -
I
1
r "
1
1 i
I
3
1 i
I
s
1 i
I
!
1 i
I
j
1 i
I
1 f
1 s. • - » a
i
I
t—
Ol IN
r-
o ?
? 3
1 s % s Ö
i
I
1
i I
I • 1 1 j
! 4*
% 1 !
i 1
!
I i
J i
I
!
1
I o »o ó o
! :
!
I
î I
1
I !
** I
* !
1 1
S 1
s ï
1 o S o
iL
ri
S.
\
i
< •n
X
a. » ut
1
1
I ! i
î
!
I !
p
!
I
1 1
! I
!
I ! I
?
!
I ! I
i i
!
I ! I
— i i
!
I ! I
!
I ! I
? s « 5 o \ cv 5 Ü : i P
!
I ! I
"i I s 5 ^ 5 o I % 5 ITk
CM 5 o
! î S
!
I ! I
1 , I j
Î I
:
1 *
! ! o * z s
3 X a
g o
| o u
1 Î 3
1
1
i :
!
1 1
S i I
:
!
I *
1 ! i ! I l
I K s ?
I J
î 8
o u X Ü
o*
I i i
I ! I
I s
t
o
o
î i
ï
I
< s
i
I
3
i
ai
m m
iiiï
1 ix m >
» W T J
IffiyfiiliyiEilJl
UM
•o -c ü v » C 0 • - x K D C
> ? I >«• ' >. u k. a -O - > . o — v • k * T ) O k. » , H Ü • > . •
J 3 » * J T J ». — * J ( H
• • e >-u e £ • C > > , • . » £ — a
* o c • * - U " — * ; - £ > , t - ». o * • * «4 » C o > o — I o
o • • X - T J H C » Ï • M E M C
Ä 3 ». « m o » — • > - « ».
- . • o - o — « 3 E •
E cr> c W D H *> - c c -
* • o e • • » • v x
* • O t r u c M
— • * >. O T > * > - » « J O O • C w t - o e — - o m B C — * «
Ü B - » U C r- - . . k . - . > - 3 m — <M JJ
. * W - * . O 1 »4 JT « . *J 6 C * n A
« \ - « - >. • « - ». « N. • • j t « ». e - O * 3 — J=
« 0 * * 4 ( 0 - .
O « M * * & * » v et * E O E «• O O » » O • M
S * . - 3 T > O O M > . > , - « ü f C B o « - c ». ». c < n — v a « c — e —v « o \ U » Ï « >-. "> »- > • «
• c o o > c M
> . 3 > . « C
- * _ c • — • * « « * O 4) a O — « M a > - < t ï U - . e ». > . ^ * « c o — a o * i —
« .O • » * «
- " " - • • > • - . « t J ».
- " f l 3 JC O L- * c * >
- • .-o »> X « • c > . i - ~ • » — > . £ £ Ä > ». O « • • * > . M f ) > * > O T J — — — O« * — k. > o ». V 3 O k . — 3 - u O
. O — « D > E -- n Ê C *
* \ « • C « t - k / i — J 3 • « ». > , L . » . « t ) * • « 3 . C O « k - ^ j ^ - , c
o»r> au» > O. o-o •» «• & •
il
P>9>>
IsSlI : « ç r-
o r- . " i m f i f £*ö?i
" ?• *r "o -o 3
2 ^ S . • s ï •
s O O — — O 3 •
u*>-^ B O i . H T , * » 0
• = ï' --- • •) • * U « O •»
». - H
o er. *J c >
• - c • « ^ e> V
'Z > • 3 • C ( • E B O » N •
** c E — • E Q. H — tv > , «
• « o - tf <
>-k- M « »éJ V c t*m
— e ». • • D > * t y
•-O « 3 O — C s » .
ï~ U - « . D O O C a
» -M C C - • o x c o
S ? 0 Q..C . . i «••D T3 « i - a * . - ^ o - J =
S Ü M & 0 > « l < O l . c C « O - C - H U o Q. « M
öS »«— . . » •0 B
» • *> • 3 O O
«• ». 3
< E X S h . O f t . J K • J > J W O T «
** Q o <

- , - s - • , - . - : ! p - ! •--.'*;=*'.-:' ••' - - Ï J , - . - \ .v.V.v--. - .f. ' . . • . • £ • • • •• -' ;" X •;*..;-.V> '-."<.. ">.;•»-•*-• •• , - ' - : ' ' t ' - - J - ' - " • ' • " . ' ï ^ ï ' . ; - ' "• -••:*•..'.•!:• •:•-•-. v »-•,*--.r':-'V'-.-•..-•: . • - . . ; •
Sfe;V. I ; ,
**:*i^Ù*£\V 'tÄ^.' :» ^*>r .-,^LiiÄ"..i;,i.-,.-;
^^Äi»;;:fcÄMA piiisi^ÄÄÄfii. ! :« •'
m
K T : ' ' - • -V-"! • ' ••*•>- -»." î.i-,. ".-n.-;;.£-,$,- . •' : ."--^ï ' ".V. " * — • •
» :
•"<;,:-?.-
. - . > • • A- . " . , - "
**"-T'/-:-. ,-•
• • ^ ; » i " : " . ^ - - ï - • " - : • ' .
ÇO
r>T^-s-^!"'«-«-v'>^;;^w-:^v\^---"V :••.
mmmm^ mm » f i » - ^ - . • • ; # & V . : " . J ; ; i : * ^ f ' * " - » ' i ; W - ' * ' ' , * ; 1 V . - : « . , ' ï ' r t ' . • & - ' V r . : \ i - v f c - ' ^ ï t 6 - ; ; - " . y * - • •''"• IS.'-'fy.-Z-iZ V »-"t.- • t' '. _
mm
l#V. •'• w*t -w >•-•-'• . • ; - ' •''<• : '• * ."•>- » • . " " " ' . - ' ' ^ v ' v . '•"•'• ^ - ' i - ' ,».<-'; 'Vs.:t-> - . , - " , : • ; . . _ a ü ' - w •-^•- -, > ••. .•A" r . i -. : ;? '••;-• - ^ 1 - • • • • • • ••.; - ".* . • --~. -, ^ » - f l f ' • • • « t v v f ••'•.•.•-
• i ; ' . " _ • - z.-:[ ' . ^ - > , r ,- _ ^ . .• -"T :. -,T VV^^ ;^ ; _--:=^ ••*:•/•-•:. ;. " > - ' - • Ï V - ^ =*• '•^ if ' ' 'L'•' " / ^ ' ' "- -~ '> %"^—. . — . J ^ ^ "' " V ^ . !'A ." ^ät1- ''-• tf " "^4 ^ 'f ' ^ ^ ; . ^ - ' V i^

p
f".
i. 4 ,
f IJ?'
4 ^ '
- < s * u
ï * ^ |
t ^ V
si).».« < *'
'' i Iß 'u-d ? ' ' - ' k ' c L » f . " *•{
1 i -d*v^°i r '-Li""* < i ''i
i
1 - y i .
»\-;
*" •- ƒ
;;!{#
'tâàsaŒfflt Ï " V : lié
p / îf<st«f.«l«swt@fti!.I u\$wm îSrw*»"» ,mzn
-«•*• «i V«^^J?*!BsiHE^ j.JilPwlifflaeâi» Ä«Tfc»JJfe'<»*.'tÄs?»
"B " "" ""