Thesis O'keeffe - WUR eDepot
216
Alternative Use of Grassland Biomass for Biorefinery in Ireland: A Scoping Study Sinéad M. O’ Keeffe
-
Upload
khangminh22 -
Category
Documents
-
view
0 -
download
0
Transcript of Thesis O'keeffe - WUR eDepot

Alternative Use of Grassland Biomass for Biorefinery
in Ireland: A Scoping Study
Sinéad M. O’ Keeffe

Thesis committee Thesis supervisors Prof. dr. ir. P.C. Struik Professor of Crop Physiology Wageningen University Thesis co-supervisors Dr. Rogier Schulte Head of Environmental Research Department Teagasc, Johnstown Castle, Wexford Ireland Dr. Padraig O’ Kiely Research Scientist Teagasc, Grange, Co. Meath, Ireland Other members Prof.dr. J.P.M. Sanders, Wageningen University Prof.dr.ir. A.G. J.M. Oude Lansink, Wageningen University Prof.dr.ir. S.W.F. Omta, Wageningen University Dr J. Finnan, Teagasc, Oak Park, Carlow, Ireland This research was conducted under the auspices of the Graduate School of Production Ecology and Resource Conservation

Alternative Use of Grassland Biomass for Biorefinery
in Ireland: A Scoping Study
Sinéad M. O’ Keeffe
Thesis
Submitted in fulfilment of the requirements for the degree of doctor at Wageningen University
by the authority of the Rector Magnificus Prof. dr. M.J. Kropff, in the presence of the
Thesis Committee appointed by the Academic Board to be defended in public
on Wednesday 8 December 2010 at 1:30 p.m. in the Aula.

O’Keeffe, S.M. (2010) Alternative Use of Grassland Biomass for Biorefinery in Ireland: A Scoping Study PhD Thesis, Wageningen University, Wageningen, the Netherlands, 202 pp. With summaries in English and Dutch. ISBN: 978-90-8585-809-6

Dedicated to my parents, brother and the footsteps of my family.


Abstract O’Keeffe, S.M., Alternative use of Grassland Biomass for Biorefinery in Ireland : A Scoping study. PhD thesis, Wageningen University, Wageningen, The Netherlands. With references – With summaries in English and Dutch, 202 pp. The need to reduce greenhouse gas emissions and dependency on fossil fuels has been one of the main driving forces to use renewable resources for energy and chemicals. The integrated use of grassland biomass for the production of chemicals and energy, also known as Green Biorefinery (GBR), has received much attention and several European countries have developed GBR systems, including Austria, Denmark and Germany. In Ireland, approximately 90% of the 4.3 million hectares used for agriculture is under grassland and used in livestock production systems. Recently livestock numbers have declined and a surplus of grass biomass is predicted. GBR has potential to provide supplementary income from this surplus grass. As part of a scoping study, I assessed the economic, technical and environmental feasibility of a GBR in an Irish context, and developed a blueprint for a first generation GBR. Scenario analyses suggested that the ideal catchment area for a GBR was 700-800 ha depending on biomass availability within the catchment area, and the availability should be in excess of 30% in order to contain transport costs. An added benefit of a decentralised GBR facility processing approx. 0.8 t of dry matter per hour is that it allows for ease of operation, and better knowledge of the source and quality of the herbage being supplied.
The viability of a GBR will be highest in areas which experience declining numbers of livestock and lower farm income, particularly, but not exclusively, occurs in areas with many beef farms. These areas have a high potential availability of surplus grass biomass and in such a situation the GBR would not have to compete with traditional agricultural commodities, but rather would provide potential supplementary income to farmers. The transitional development of a GBR system is likely to be most successful if current harvesting practices (i.e. a two-cut silage system) are adopted. The quality of the biomass from such a harvesting system is compatible with the basic GBR technologies used to produce insulation materials and proteinaceous products for animal feed. In the longer-term, higher value products could be produced by retro-fitting the GBR facility. Analyses also showed that feedstock quality can be best controlled by operating a silage-only system, with on-site ensiling of the grass material at the GBR facility. The use of silage as a feedstock also facilitates year-round operation of the GBR facility. Biorefinery processes are energy intensive. Therefore, the viability of the GBR largely

depends on self–sufficiency for energy. This can be achieved by anaerobic digestion of the slurries that remain after processing.
The residual material remaining after the anaerobic digestion can be used as fertiliser on the farm supplying the biomass, as part of a “waste management strategy” that aims to maintain nutrient balance between the GBR and the source farms. This recycling will reduce direct costs of the supplying farms. The blueprint outlined in this thesis provides a framework for the development of a first generation GBR. The blueprint has also identified key areas that require further research: improved ensiling techniques, integration of livestock farming systems and GBR systems, and nutrient budgeting of the GBR system.

Contents
Chapter 1 General introduction 1 Chapter 2 Alternative use of grassland biomass in Ireland:
Grass for Biorefinery 7
Chapter 3 Grass biomass scenarios for an Irish Green Biorefinery
Blueprint, under a two-cut silage system 27 Chapter 4 Scenarios for an Irish Green Biorefinery - Development of a blueprint 51 Chapter 5 Green Biorefinery (GBR) scenarios for a two-cut silage system: Investigating the impacts of sward botanical composition and N fertilisation rate on GBR profitability and price offered to farmers 87 Chapter 6 Farm case study scenarios to assess the effect of biomass availability
on the profitability of the Green Biorefinery and impacts for the farmer 125 Chapter 7 General discussion 153 References 175 Summary 189 Samenvatting 193 Acknowledgements 197 CV 201 Education plan 202


1 General introduction
S.M. O’Keeffe

Chapter 1
2
1.1 General introduction
This chapter provides a general introduction to the topic of this thesis and a general outline. A more comprehensive introduction to the topic of the thesis and a literature review are provided in Chapter 2.
1.2 Context
Grassland covers approximately 25% of the world area (FAO, 2007). The decisions relating to grassland use and management have important implications for resource stability, biodiversity and global change, as they are the nexus between agronomic production and environmental impacts of land use strategies (Lemaire et al., 2005). Of the 4.3 million hectares used for agriculture in Ireland, approximately 3.8 million hectares is under grassland, the majority of which is permanent pasture. 1.3 Problem statement
The predominant usage of grassland herbage has traditionally been used to provide feed for livestock production (Buxton, 1996). In Ireland approximately 90% of the agricultural area is devoted to grassland farming and animal production systems (O' Mara, 2008). Substantial destocking of grassland is forecasted for Ireland over the coming decade (Styles et al., 2008) due to the combination of the Nitrates directive (91/676/EEC) and recent full decoupling of EU agricultural subsidy payments from production. This will result in generating a potentially large surplus of grass biomass, which could be used for energy or other purposes (McGrath, 1991). The EU Biofuel Directive (2003/30/EEC) promoting a “biobased economy” has triggered investigations into the alternative uses of grasslands (EU Commission, 2010).
“Green biorefinery” is a concept to utilise green (grassland) biomass as raw material for the production of biobased products like proteins, lactic acids, fibres and energy (via biogas) (Kromus et al., 2004). The pasture is split into two fractions: the solid fraction or “press cake” and the liquid fraction or “press juice”, by applying technologies to chemically and physically separate or fractionate the biomass. The press cake can be utilised for products such as insulation materials for building. The press juice can be used to produce high value products which could be used as substitutes for mineral oil derived products such as lactic acid for plastic and
General introduction
5
polylactide (PLA) production, proteins for the animal feed and cosmetics industries (Kromus et al., 2004). The Green biorefinery concept has been successfully demonstrated in Germany (Geveke, 2009), Austria (Van Den Berg and Rademakers, 2007), Switzerland (Grass, 2004) and Denmark (Thomsen et al., 2004).
1.4 Objectives
The objectives of this research were:
• To assess the quantity and quality of grass biomass under a two-cut silage system and to assess whether the grass biomass is suitable for Green biorefinery (GBR) technologies.
• To assess which feedstock system is most viable in an Irish context; grass/silage system or silage only.
• To determine the most appropriate economy of scale. • To determine whether Green biorefinery is a feasible option for Ireland and for
Irish farmers using scenario analysis. • To investigate potential catchment areas or “hot spots” for green biorefinery
facilities to locate. 1.5 Methodological framework
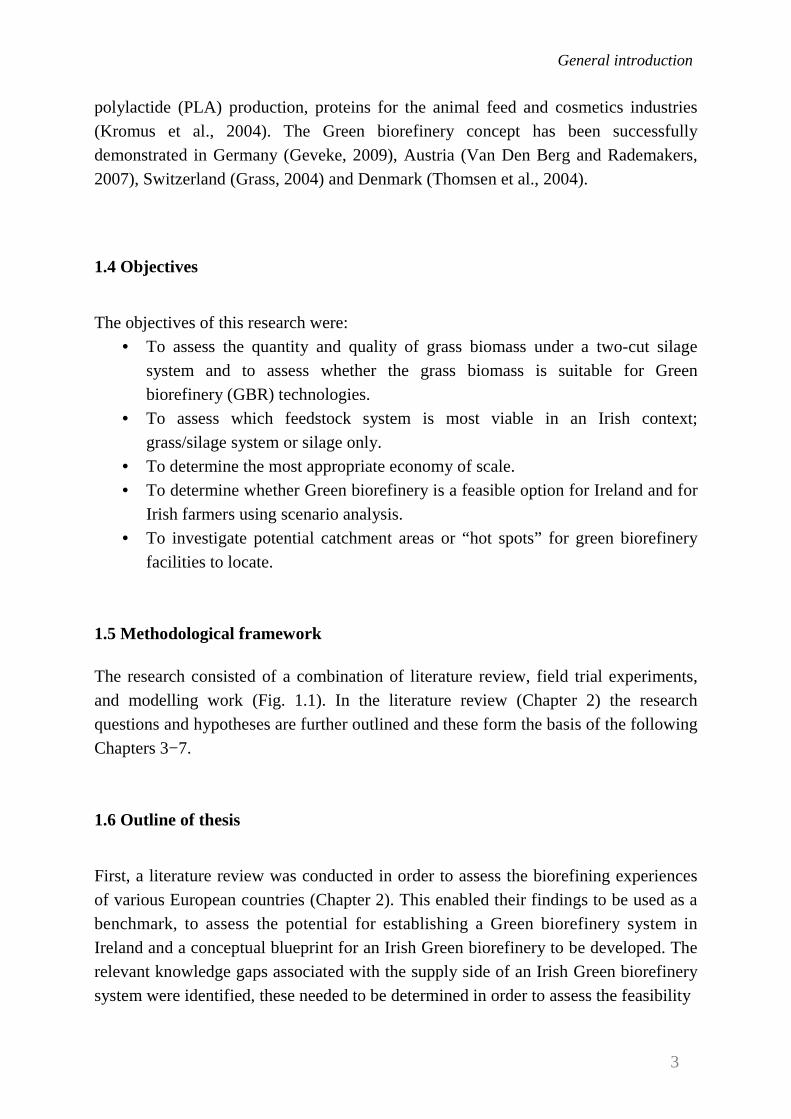
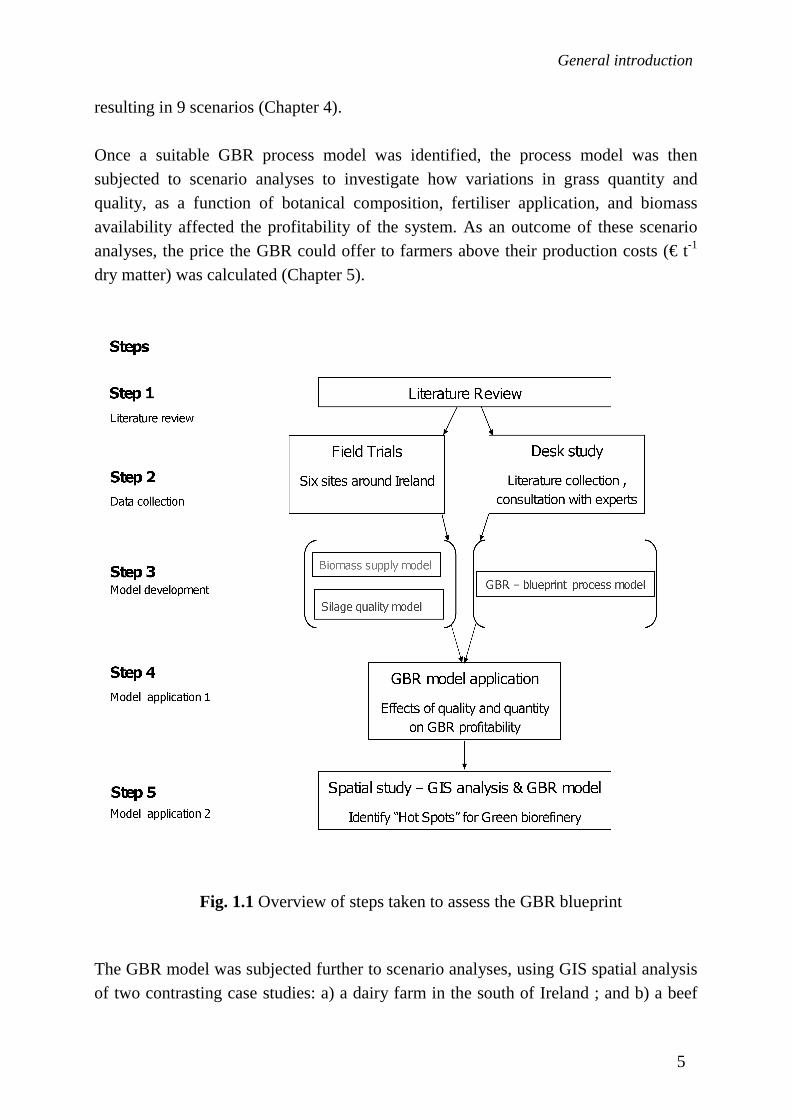
The research consisted of a combination of literature review, field trial experiments, and modelling work (Fig. 1.1). In the literature review (Chapter 2) the research questions and hypotheses are further outlined and these form the basis of the following Chapters 3−7. 1.6 Outline of thesis
First, a literature review was conducted in order to assess the biorefining experiences of various European countries (Chapter 2). This enabled their findings to be used as a benchmark, to assess the potential for establishing a Green biorefinery system in Ireland and a conceptual blueprint for an Irish Green biorefinery to be developed. The relevant knowledge gaps associated with the supply side of an Irish Green biorefinery system were identified, these needed to be determined in order to assess the feasibility
3

Chapter 1
4
of the conceptual GBR blueprint.
1.6.1 Field trials
Grass (2004) suggested that price schemes for grass delivered to a Green biorefinery should be established with respect to the raw material characteristics required to achieve the desired end product yield and quality parameters. Two of the most important quality parameters for assessing grass feedstock for the GBR outlined in the blueprint were the fibre and crude protein contents (Grass, 2004). Therefore, field trials were established to assess the yields of dry matter (DM), fibre and crude protein of grass swards on six contrasting Irish farms. These farms differed in geographical location, soil type, weather, previous management and sward botanical composition. They were all subjected to a two-cut silage management system and assessed under three annual input rates of inorganic N fertiliser (45, 90, 225 kg N ha-1 a-1) in two successive years. The grass harvested from these sites was also ensiled in the laboratory silos at Teagasc Grange. This allowed the silage quality produced from these pastures, under the controlled conditions of laboratory silos, to be assessed. The field trial data was then used to develop biomass supply models to predict the DM yields, fibre and crude protein yields of grass being supplied to a GBR (Chapters 3 and 4). Data from laboratory silo experiment was also used to develop silage models to predict the ensiled grass quality or silage (Chapter 3). These models were then used to provide insight into how the quality and quantity of grass biomass coming from permanent pastures under a two-cut system could potentially affect the profitability of the GBR blueprint system outlined in O’Keeffe et al. (2009) (Chapter 5). 1.6.2 Desk study
The objective of the desk study was to develop a GBR blueprint processing model, which could generate the most appropriate GBR scenario for Ireland. Therefore, three biorefinery process models were developed which were combinations of feedstocks (i.e. grass and silage or just silage) and technologies (i.e. basic technologies or low-tech to manufacture products from the fibres and proteinaceous fraction and future technologies high-tech used to extract high value compounds from silage e.g. lactic acid). The scenarios generated were defined as: 1) Low tech / grass and silage, 2) Low tech / silage, and 3) High tech / silage (also producing LA). Each of these three scenarios was then evaluated at three economies of scale (small, medium or large),
General introduction
5
resulting in 9 scenarios (Chapter 4). Once a suitable GBR process model was identified, the process model was then subjected to scenario analyses to investigate how variations in grass quantity and quality, as a function of botanical composition, fertiliser application, and biomass availability affected the profitability of the system. As an outcome of these scenario analyses, the price the GBR could offer to farmers above their production costs (€ t-1 dry matter) was calculated (Chapter 5). The GBR model was subjected further to scenario analyses, using GIS spatial analysis of two contrasting case studies: a) a dairy farm in the south of Ireland ; and b) a beef
Fig. 1.1 Overview of steps taken to assess the GBR blueprint
Chapter 1
6
farm in the mid-west of Ireland. This was carried out to investigate the extent to which the geographical constraints of total biomass availability and surplus biomass availability would impact on the profitability of the GBR system. The extent to which socio-economic factors of each case study govern the attractiveness of GBR for both the farmer and green biorefinery operators was also investigated using partial budget analysis (Chapter 6). This thesis contributes to the knowledge base for alternative uses of Ireland’s grass biomass resources. It provides a framework or blueprint which has identified specific key areas which require further detailed research, in order to make green biorefinery operations in Ireland an eventuality.

7
2 Alternative use of grassland biomass in Ireland: Grass for Biorefinery
S. O' Keeffe, R. P. O. Schulte and Struik, P. C. (2009) In Grassland Science in
Europe, Vol. 14 (Eds, Cagaš, B., Macháč, R. and Nedělník J.), pp. 297-313.

Chapter 2
8
Abstract
In Ireland approximately 3.8 million hectares are devoted to grassland (silage, hay and pasture). With maximum yields ranging between 10−15 t DM ha−1, grass has the potential for energy production or other purposes (McGrath, 191). An alternative use of grassland could be ‘Green Biorefinery’ (GBR). GBR involves applying technology to chemically and physically fractionate grass and grass silage into two streams: press cake (the solid fibre fraction) and press juice (the liquid fraction). The press cake can be utilised for products such as insulation materials for building. The press juice can be used to produce high value products which could be used as substitutes for mineral oil derived products such as lactic acid for plastic and polylactide (PLA) production, proteins for the animal feed and cosmetics industries. Using the biorefining experiences of various European countries as a benchmark, the potential for establishing a Green biorefinery system in Ireland was reviewed and a conceptual blueprint for an Irish Green biorefinery was developed. The relevant knowledge gaps associated with the supply side of an Irish Green biorefinery system which need to be determined in order to assess the feasibility of the conceptual GBR blueprint were also identified. Keywords: Grass, Ireland, Green Biorefinery, grasslands, Europe
1 Introduction
For the last ten years in Europe and worldwide, the need to reduce atmospheric CO2 emissions has been one of the main driving forces to use renewable resources for energy and chemicals (Danner and Braun, 1999). Biomass can be used to replace fossil based raw materials for applications such as heat, electricity, transport fuels and chemicals; together, these four uses comprise the bulk of the western world’s total fossil consumption (Sanders, 2005). ‘Green Biorefinery’ (GBR) could theoretically be used for all four. It is an integrated refinery concept using green biomass (pasture) as raw material. High value biochemicals can be extracted from the grass liquid fraction (press juice). These could be potential substitutes for mineral oil derived products, such as lactic acid, which can be used as a building block for plastic production in the form of polylactic acid (PLA). Proteins and amino acids can be extracted for applications such as animal feed or cosmetics. The grass fibre fraction can be utilised for lower value products such as building materials (Kromus et al., 2004).

Literature review
9
The residual grass slurries or ‘side streams’ remaining after processing the green biomass, can then be fed into an anaerobic digester (AD) to produce biomethane gas, and used to produce biomethane gas, which can be used in electricity and heat generation (Grass, 2004). During the last ten years the activities in the field of biorefinery systems have grown, particularly the Green biorefinery concept, which is currently in an advanced stage in many EU countries. Many European countries have successfully demonstrated the Green biorefinery concept. In Germany (Geveke, 2009), Austria (Van Den Berg and Rademakers, 2007), Switzerland (Grass, 2004) and Denmark (Thomsen et al., 2004). Table 2.1 provides an overview of the available literature on the conceptual and technological advancements made by the predominant European countries interested in Green biorefinery (GBR). 2 A review: European countries and the driving forces which led to the Green biorefinery concept
2.1 Denmark: Green crop drying industry
In 1990, the Green biorefinery initiative began in Denmark (Kromus, 2002). The green crop drying industries were generating large quantities of ‘Brown juice’ or waste plant juices, during green pellet production. This brown juice was being used as a fertiliser (high potassium and nitrogen); however land application was restricted to autumn (Thomsen, 2004). The rising disposal costs and environmental restrictions catalyzed the research into alternative solutions for ‘Brown juice’. The high protein content of the juice gave it the potential to be used as a substrate for fermentations and this is what catalysed the advancement of the Green biorefinery concept in Denmark. The aim was to convert a simple drying industry to a whole crop utilization factory, with lysine being produced from the plant juice streams (Kromus, 2002). The related research is outlined in more detail in Table 2.1. In 2002, Agro Ferm A/S developed a facility in Esbjerg using the waste brown juice from the pellet generation as a growth medium for lysine production (Van Den Berg and Rademakers, 2007). The Danish Green biorefinery encountered two problems that required research. The first was quality control due to the variability (seasonal, weather) of the plant juice and the second was the storage of the plant juice as it was only available in the growing season of grass, i.e. from May to November. .

Chapter 2
10
Ta
ble
2.1.
Sum
mar
y of
Eur
opea
n re
sear
ch a
ctiv
ity o
n G
reen
bio
refin
ery.
C
ount
ry
Focu
s
Raw
mat
eria
l use
d
Fres
h
/Ens
iled
Raw
mat
eria
l of
inte
rest
Po
tent
ial
prod
uct
Proc
essi
ng te
chno
logi
es
Proc
ess
stag
e Sc
ale
In
for
mat
ion
sour
ce:
Aust
ria
PJ
1st /2nd
cut
gra
ss
sila
ge fr
om lo
cal
farm
s
Ensi
led
& in
ocul
ated
wi
th L
A ba
cter
ia
Lact
ic a
cid
(L
A)
Poly
lact
ic
acid
(P
LA)
Elec
trodi
alys
is
Purif
icat
ion
Lab
(Dan
ner e
t al.,
20
00)
PJ
N
/a
N/a
La
ctic
aci
d PL
A El
ectro
dial
ysis
Pu
rific
atio
n La
b (M
adzin
gaid
o et
al.,
200
2)
PJ
N
/a
N/a
La
ctic
aci
d PL
A In
tegr
ated
mem
bran
e bi
orea
ctor
sys
tem
s co
uple
d wi
th
elec
trodi
alys
is
Purif
icat
ion
Lab/
pilo
t (D
anne
r et a
l., 2
002)
PJ
L.
per
enne
M
edic
ago
sativ
a su
bsp.
sat
iva
Fres
h Pr
otei
n co
ncen
trate
Anim
al
feed
Hea
t coa
gula
tion/
ce
ntrif
ugat
ion
Ultra
filtr
atio
n
Purif
icat
ion
Lab
(Kos
chuh
et a
l., 2
004)
PJ
Si
lage
col
lect
ed
from
loca
l far
ms
Ensi
led
Lact
ic a
cid,
Am
ino
acid
s:
Isol
euci
ne,
Alan
ine,
lysi
ne.
(PLA
) An
imal
fe
eds
Elec
trodi
alys
is
Purif
icat
ion
Lab
(Tha
ng e
t al.,
200
4)
PC
G
rass
/clo
ver m
ix
D. g
lom
erat
a Pe
rman
ent p
astu
re
Both
(E
nsile
d in
lab)
Hem
icel
lulo
se,
Sug
ar fr
actio
ns:
Glu
cose
, Xyl
ose,
Ar
abin
ose.
Ferm
enta
tion
med
ium
PL
A
Dilu
te a
cid
hydr
olys
is
Extra
ctio
n pr
oces
s
Lab
(Neu
reite
r et a
l., 2
004)
PJ
Si
lage
col
lect
ed
from
loca
l far
ms
com
pose
d of
T.
repe
ns
L. p
eren
ne
Ensi
led
(in la
b)
Lact
ic a
cid,
Am
ino
acid
s:
Aspa
rtate
, As
para
gine
, Al
anan
ine,
Ph
enyla
llani
ne
Leuc
ine,
Lys
ine.
PLA
Anim
al
feed
Nan
ofilt
ratio
n Fi
ne-u
ltraf
iltra
tion
Purif
icat
ion
Lab
(Kos
chuh
et a
l., 2
005)

Literature review
11
Table
2.1
. (co
ntin
ued)
Sum
mar
y of
Eur
opea
n re
sear
ch a
ctivi
ty o
n G
reen
bio
refin
ery.
Coun
try
Focu
s
Raw
mat
eria
l use
d
Fres
h /E
nsile
d Ra
w m
ater
ial
of in
tere
st
Pote
ntia
l pr
oduc
t Pr
oces
sing
tech
nolo
gies
Pr
oces
s st
age
Scal
e
Inf
Info
rmat
ion s
ourc
e
Aust
ria
PJ
Sila
ge c
olle
cted
from
lo
cal f
arm
s co
mpo
sed
of T
. rep
ens
L. p
eren
ne
Ensil
ed
Lact
ic ac
id
PLA
Chro
mot
ogra
phy -
se
para
tions
usin
g ne
utra
l pol
ymer
re
sins
Purif
icatio
n
Lab
(Tha
ng a
nd N
oval
in,
2008
)
*P
roce
ss su
pply
ch
ain
- -
Sila
ge
Fibr
es
Lact
ic ac
id
Amin
o ac
ids
Frac
tiona
tion
& pu
rifica
tion
Full
syst
em
Indu
stria
l
(Hal
asz
et a
l., 2
005)
PJ
G
reen
and
bro
wn ju
ice
from
: L.
mul
tiflo
rum
L.
per
enne
M
edica
go s
ativ
a
Fres
h La
ctic
acid
Ca
rboh
ydra
te
Org
anic
acid
s
Ferm
enta
tion
- m
ediu
m
PLA
Ferm
enta
tion
Prod
uctio
n /e
xtra
ction
s La
b
(And
erse
n an
d Ki
el,
2000
)
PJ
Brow
n ju
ice o
f gre
en
crop
dry
ing
indu
strie
s
Fres
h L-
Lysin
e Fi
ne c
hem
icals
Ferm
enta
tion
Prod
uctio
n Pi
lot
Lab
(Tho
mse
n et
al.,
20
04)
Denm
ark
PJ
Brow
n ju
ice o
f gre
en
Fres
h La
ctic
acid
PL
A Fe
rmen
tatio
n wi
th
bac
teria
and
en
zym
es
Prod
uctio
n La
b (T
hom
sen
and
Guy
out,
2007
)
Ger
man
y PJ
G
reen
juice
from
wild
gr
ass
mix
Med
icago
sat
iva
Fres
h Ca
rboh
ydra
tes
Subs
trate
s fo
r gre
en
chem
istry
Q
uality
ass
essm
ent
Qua
lity
ass
essm
ent
Lab
(Sta
rke
et a
l., 2
000)

Chapter 2
12
Tabl
e 2.
1. (c
ontin
ued)
Sum
mar
y of
Eur
opea
n re
sear
ch a
ctiv
ity o
n G
reen
bio
refin
ery.
C
ount
ry
Focu
s
Raw
mat
eria
l use
d
Fres
h /E
nsile
d R
aw m
ater
ial
of in
tere
st
Pote
ntia
l pr
oduc
t Pr
oces
sing
te
chno
logi
es
Pro
cess
sta
ge
Scal
e
Info
rmat
ion
sour
ce:
Ger
man
y
Who
le c
rop
1st c
ut
L. p
eren
ne
D. g
lom
erat
a A
. pre
tens
is
2nd c
ut s
ilage
mix
Fres
h /e
nsile
d C
arbo
hydr
ate
Biog
as
Anae
robi
c di
gest
ers
- La
b s
scal
e (M
ähne
rt et
al.,
200
5)
Switz
erla
nd
PC
/PJ
Gra
ss fr
om
past
ure
Fres
h Fi
bres
Insu
latio
n m
ater
ials
Pa
per
Com
bust
ion
pelle
ts
Nat
ural
fibr
e re
-en
forc
ed p
last
ic
Full
bior
efin
ery
chai
n Fu
ll Pr
oces
s c
hain
Pl
ant
sca
le
(Gra
ss, 2
004)
Prot
ein
Anim
al fe
ed
Car
bohy
drat
es
Biog
as g
ener
atio
n
Li
quid
re
sidu
es
Res
idue
s fro
m
bior
efin
ing
of g
rass
&
sila
ge
Fres
h /e
nsile
d
Car
bohy
drat
e (C
:N)
Biog
as g
ener
atio
n U
pwar
d flo
w
anae
robi
c bl
anke
t rea
ctor
s (U
SAB)
Trea
tmen
t of
resi
dues
(w
aste
st
ream
s)
Pilo
t sca
le
(Bai
er a
nd D
elav
y., 2
005)
The
Net
herla
nds
PJ/
PC
L. p
eren
ne
P. p
rate
nsis
L.
mul
tiflo
rum
D
. glo
mer
ata
F. p
rate
nsis
Fres
h Fi
bres
Pr
otei
n
Soft
boar
d H
ardb
oard
C
hipb
oard
M
DF
HD
F C
ompo
site
s In
sula
tion
Soil
cond
ition
er
Def
iber
izin
g -
appl
ying
te
chno
logi
es
use
d by
the
pulp
and
pap
er
indu
stry
Mec
hani
cal
fract
iona
tion
of p
ress
juic
e fro
m p
ress
ca
ke
(H
ulst
et a
l., 2
004)
(S
ande
rs, 2
005)
PJ
= Pr
ess
Juic
e. P
C =
Pre
ss C
ake

Literature review
13
A conservation process was developed which used the untreated fresh brown juice directly as a lactic acid fermentation medium (Andersen and Kiel, 2000).
2.2 The Netherlands: Combining potato and grass refining
The desire to enhance the viability of the potato refining industry for starch production was the driving force for the Netherlands development of GBR. Potato refining was restricted to potato availability (August to March); therefore processing grass from April to August meant the plant could be in operation all year (Sanders, 2005). The Dutch ‘Prograss consortium’ fractionated grass into three process streams of protein, fibres and grass juice, at their pilot plant in Foxhol (Groningen). Four tonnes of fresh grass material were processed per hour with the central part of the process being a mechanical refiner as used in the pulp and paper industry. The Dutch consortium was interested in extracting the protein content of the grass. However, they found grass fibres contributed the biggest bulk of the grass feedstock and high-fibre grass presented greater technical challenges for extracting plant protein. They focused on advancing macerating or primary separation technologies as outlined in detail in Table 2.1. They concluded that grass input should only cost the factory about 50-80 Euro per tonne grass DM to make the processes economically viable (Sanders, 2005). 2.3 Germany and Austria: Biogas production
An Austrian study noted the dependency of ‘biorefineries on biogas and determined that provided the situation remained positive for green energy then the opportunities for development of a Green biorefinery was good (Popa-CTDA, 2005). Both Germany and Austria have state-of-the-art biogas technologies already in place accredited to The German Renewable Energy Sources Act (2000) and the Austrian Eco-Power Act (2003). These policies proved to be crucial for supporting the development of technologies as they assured a fixed income for biogas producers connected to the grid for a specified period. The guaranteed fixed incomes from electricity sales encouraged farmers to start producing biogas and in addition, to become familiar with the related technologies; expansion into other biomass technologies was the next progressive step. Both countries have examples of ‘Green biorefineries’, at various stages of technological implementation. An example from Austria is the biomethane gas station for cars in Eugendorf. The vehicle gas fuel is a blend of 20% CO2-neutral biogas and

Chapter 2
14
80% natural gas. The biogas is generated from the fermenting of smooth meadow-grass (Poa pratensis) and all the grass is converted into a useable fuel and organic fertiliser (Van Den Berg and Rademakers, 2007). The establishment of the basic biorefining infrastructures (biogas plants) in Austria and Germany has allowed researchers from both countries to focus on the more advanced down streaming technologies for processing the press juice, as outlined in Table 2.1. These technologies will determine the success of a Green biorefinery, as they will determine the capital investments needed for a Green biorefinery (Kamm et al., 2000; Reimann, 2006). The heterogeneous nature of the green feedstock requires delicate unit operations in order to produce an end product of acceptable quality, which is expensive. Without such processing, the products will be restricted to low-grade (and lower value) applications such as animal feeds and lactate salts used as road de-icers during the winter months. On the supply side, both countries noted the need to improve the technical and economic attributes of silage production, for it to be used as a potential substrate for industrial chemicals (Danner et al., 2000). Mähnert et al. (2005) noted that the quality of biogas produced was also influenced by quality of the silage.
2.4 Switzerland: A unique example
The Swiss biorefinery model is of interest to Ireland, as the Swiss biorefinery plant was built in 2000 without the advantage of pre-existing green industry and in conditions comparable to Ireland’s current day situation (at time of writing). Switzerland - with a high dependency on fossil fuels for energy production and renewable electricity generated from hydropower or nuclear power - had a minimum emphasis on generating biogas from biomass (Jegen and Wustenhagen, 2001). The Swiss researcher Grass (2004) noted that, as Switzerland is a country which did not have many biomass to biogas plants, it therefore appeared to be lacking the policy framework to support a biorefinery initiative. The full scale industrial pilot plant demonstrated the practical application of grass biorefinery and managed the issues of handling grass (summer-autumn) and silage (winter-spring) (Grass, 2004). The main products included technical fibres and biogas from grass, which was used in a combined heat and power (CHP) plant. In 2003, the biorefinery plant ceased operations, as it was not economically viable, predominantly due to the fact that production of biogas and power required high investment and generated a low return selling to the grid. Despite this, the Swiss have imparted many valuable insights into the Green biorefining process. These include:

Literature review
15
• Small-scale operations were more advantageous than large-scale operations, as
a smaller plant means lower levels of initial investment and enables easier organisation of plant operation and management of system, obtaining biomass from a cost-effective catchment area (i.e. lower transport costs);
• Determining the value added of a potential product from a biorefinery and having an adequate plant design is crucial for success. The related yield per tonne of raw material and the marketability of the product on a large scale are also vital parameters to be considered (Grass, 2004).
3 Ireland’s current scenario relative to Europe: Challenges for an Irish
Green biorefinery
Unlike in other European countries, there has been a historic under-investment in energy networks and an absence of a coherent energy policy in Ireland. The result has been the slow development of the biofuels industry, predominantly attributable to the lack of fiscal incentives and lack of transparency in grid access to boost the commercial viability of biofuels (EU and Irish Regions Office, 2006). In comparison to continental Europe, Ireland currently lacks the basic technological infrastructures which have allowed for the European advancements in Green Biorefinery. These include green crop drying factories (there is only one Irish operation) and anaerobic digesters for biogas production. Digester technologies are facing major stumbling blocks in Ireland and have been reported as having a much lower potential for development than other renewable energy technologies in the country. However, in an attempt to adhere to the guidelines of the Kyoto protocol (2005) and the EU Biofuel Directive (2003/30/EEC), the Irish government introduced the REFIT (Renewable Energy Feed in Tariff) scheme in 2006. This is a policy framework similar to the policies in Germany and Austria outlined above, with the aim to provide financial incentives for alternative energy sources (EU and Irish Regions Office, 2006) and move Ireland in line with the European expertise of biomass to bioenergy. Another issue for Ireland is the societal acceptance and support for these new bioenergy technologies as they have not been widely demonstrated, or proven to be viable in the long-term for Ireland. This lack of knowledge could have an impact on market confidence, as well as farmer’s willingness to supply biorefineries. With livestock reductions due to CAP (Common Agricultural Policy) reforms potentially generating a large surplus of grass (EU Commission, 2010), and farmers already familiar with the techniques and equipment of grass husbandry, grass could be

Chapter 2
16
one of Ireland’s most valuable biomass resources for the future. The most efficient and sustainable means of utilising grass needs to be investigated and this includes assessing the feasibility of ‘Green biorefinery (GBR)’. Ireland is currently in an advantageous position to assess its green biomass options. Using the key findings of Europe as a benchmark, a GBR blueprint for Ireland can be developed and investigated to assess the feasibility of GBR as an alternative use of Irish grassland. 3.1 European Biorefinery findings for Ireland to consider
The two key European findings which could hold significance for an Irish Green biorefinery concept are:
1) Knowledge of the quality (i.e. proportion of fibre, protein, sugars) and quantity (yields) of the green feedstock available and the marketability of the biorefinery products was a guiding principle of the Swiss biorefinery model, as this helped to develop and design a viable biorefinery concept (Grass, 2004).
2) Socio-economics and sustainable agriculture were the foundation of the Austrian biorefinery approach in order to create an efficient and cooperative supply chain management. The Austrians highlighted the need to identify potential catchment areas, where conditions are optimal to support a biorefinery system. Such areas should have good grassland and farmers interested in guaranteeing a supply of green biomass (grass or silage) to a biorefinery (Kromus et al., 2004).
The rest of this paper will outline the approach taken to develop a conceptual blueprint for a Green biorefinery system in Ireland. The relevant knowledge gaps associated with the supply side of an Irish Green biorefinery will also be identified. 3.2 Available data and existing knowledge
3.2.1 Knowledge of green biomass (pasture) – quantity
Agricultural land is approximately 61% of the total land mass of the Republic of Ireland and approximately 90% of the agricultural area is devoted to grassland farming (O' Mara, 2008), which is dominated by dairy and beef systems, as grass is the cheapest feed available (O' Riordan et al., 1998). The large extent of grassland area is due mainly to climatic conditions (Keane, 1986) and national soil characteristics

Literature review
17
(Gardiner and Ryan, 1969). Total annual grass dry matter (DM) production is predicted to vary from approx 15 t ha-1 in the south-west to 11 t ha-1 in the north-east in an average year (Brereton, 1995). Theses high yields give grass the potential for energy production or other purposes (McGrath, 1991), such as Green biorefinery. In Ireland pasture growth begins in February or March depending on location and accelerating rapidly up to peak growth rates in May (longer day length). Growth then declines gradually over the summer and autumn, sometimes with a second peak in August (O' Mara, 2008). Just over one million ha is harvested for silage (O' Kiely et al., 2004 ), with the first cut harvested around the peak of the growth curve (May/June) and the second cut taken at the tail end of the growth curve (July/August). 3.2.2 Knowledge of green biomass (pasture) – quality
Grassland species vary in their ontogeny (e.g. changes in components of leaves or stem during ageing) and ontogeny has a dramatic effect on quality, both in grass species and in herbs (Bruinenberg et al., 2002). Permanent pasture is the predominant pasture type in Ireland and also for use in silage cutting systems (Fositt, 2000; O' Connell, 2005; O' Kiely et al., 2000). Intensive management (reseeding, high cutting frequency) and high nitrogen (N) application rates result in high DM yielding swards, sometimes entirely dominated by Lolium perenne (High quality swards-Class:
Molinio-Arrhenatheretea; association Lolio-Cynosuretum) (Fositt, 2000). With less intensive management moderate quality swards (Molinio-Arrhenatheretea; association Centaureo-Cynosuretum) associated with secondary grass species, such as meadow-grasses (Poa spp.), Yorkshire-fog (Holcus lanatus), bent grasses (Agrostis spp.) and herbaceous species including docks (Rumex spp.) are dominant in the sward (Fositt, 2000). For Green Biorefinery, there needs to be a thorough understanding of the relationship between the quality of the end product and the raw material (green biomass) (Grass, 2004). Table 2.2 provides an insight into the potential grass fractions or quality parameters from a range of selected grass species and herbs associated with Irish permanent grasslands and silage fields. For the Swiss biorefinery model which produced insulation board and protein feed pellets for animals, Grass (2004) determined that two of the most important quality parameters for assessing a grass feedstock, are the fibre and protein contents.
Forage quality outlined in the literature in general is a nutritional evaluation, used in livestock production systems (Buxton, 1996). Although these analyses are limited with respect to the raw material requirements of a GBR, they still provide valuable insight

Chapter 2
18
into the composition of the biomass (grass or silage) feedstock. In the case of the Green biorefinery the press cake comprises of c. 800 g fibre and 200 g other products (e.g. proteins, amino acids, ash, sugars) per 1 kg DM (Hulst et al., 2004; Ketelaars and
Table 2.2. Overview of potential yields and grass fractions of botanical species common to silage pastures
Yield
t DM-1 ha
1NDF kg t-1 DM
1CP kg t-1 DM
1WSC kg t-1 DM
Species Lolium perenne 2.38-11.94
Fr ,H, M, P 348-548.6
C, Dm, T, Wl, Wr 120.6-244.37
Fr, C, H, T, Wc, Wr
114-179.36 M, Wc ,Wr
Agrostis spp. 2.63-10.05 Fr , P, S
137.5-218.75 Fr ,H, Wc
87 Wc
Poa spp. 1.49-10.16 Fr, H, P
433-716 B , HL ,Wr, Z
135-227.5 Fr , H, Hl, Wc
,Wr
92-149 Wc, Wr
Holcus lanatus 3.68-10.56 Fr , H
426-593.6 C, Hr, Wr
124-220.06 C, Fr , H, Wc,
Wr
114-142 Wc, Wr
Trifolium repens
229 Wr
272.52-275 Fr2, Wr
83 Wr
Rumex sp. obtusifolius
0.71-8.8 Dm, Hu
128.9-286 Dm, Fb, Hp, Wr
193.-298.13
Fb, Hp, Wr
76-208 Wr, Hp
Ranunculus sp. bulbosus
152.8 Fb
250.06 Fb
1. NDF = Neutral Detergent Fibre, CP = Crude protein, WSC = Water Soluble Carbohydrates Subscript refers to the peer reviewed literature, from which the ranges of values were sourced.
Figures reported in this table have been modified to kg t-1 DM Brief description of experimental background for results referred to above: B (Baron et al., 2004) three year mean, regrowths harvested mid April, mid Sept (Poa spp. = P. pratensis). C (Chaves et al., 2006) the averaged sum of the individual plant parts, summer harvest (leaf, stem, flower). Dm (Derrick et al., 1993) samples harvested on the 28th Oct. Lolium perenne was leafy (results were reported in %
DM). Fb (Fairbairn and Brynmor, 1959) Rumex sp. = flowering stage. Ranunculus sp. at pre-flowering stage. Figure refers
to crude fibre content calculated from absolute dry matter. Fr (Frame, 1991) three years meaned at an annual rate of 0, 120, 240, 360 kg N /ha respectively. Monoculture plots
(L. perenne cv. Perma, Agrostis spp. = commercial, Poa = P. pratensis. Fr2 (Frame et al., 1998) figures for CP derived from N content (N × 6.25). H (Haggar, 1976) primary growth yields. CP derived from N content (N × 6.25), Monoculture plots (Poa spp. = Poa
trivialis, Agrostis spp. = A. stolonifera, L. perenne = S23) fertiliser rate 400 kg N ha-1 a-1. Hl (Holman, 2007) mean of two years, P. pratensis in R0 (booting stage), R4 (anthesis) pooled across cvs. Hp (Hejduk and Doležal, 2004) crude fibre content of 2nd cut forage (6 weeks after first). Hr (Haper et al., 1999) mean values from one growing season (results reported as %DM). Hu (Humphreys, 1995) under a three cut silage system. M (McGrath, 1991), mean of three years of medium heading L. perenne cvs., First cut in early May. Monoculture
plots P (Peeters and Decamps, 1994) yield values for the 24 April, 27 May, 9 June respectively, at a rate of 100 kg N ha-1
during the first growth cycle in spring. (Poa spp. = Poa trivialis). S (Sheldrick et al., 1990) annual dry matter production for three consecutive years, at an N rate of 200 kg N ha-1. T (Turner et al., 2006), mean values of L. perenne at three leafy stage. Wc (Wilson and Collins, 1980) results three years meaned. Wl (Wilman et al., 1996) to the mean result of three cuts over three years. Wr (Wilman and Riley, 1993) meaned pot results (n=4) (Poa spp. = P. annua). Z (Zenmenchik et al., 2002) values the mean of three years (three cut system) fertilised at two rates of 56 kg N ha-1
and 224 kg N ha-1.

Literature review
19
Rutgers, 2002). Although underestimating the potential quantity of press cake available from the grass biomass, the cell wall or solid fibre fraction can be used to approximate quantity of press cake (Brehmer, 2008; Neureiter et al., 2004) available from the grass biomass. This can be estimated using the detergent system, i.e. Neutral Detergent Fibre (NDF) (Cellulose, Hemicellulose, and Lignin) (Van Soest, 1963). The crude protein (CP) content is used to describe all forms of N present in a plant. The amino acids in a plant usually contain on average 160 g N kg-1 DM; therefore the CP content is calculated as 6.25 × N content value (g kg-1) (Ferguson and Terry, 1957). This analysis can be used to indicate the initial crude protein quantity available for extraction from the feedstock products mentioned above (Brehmer, 2008). 3.3 Identification of potential location for a GBR: Socio-economic drivers
The different supply chains and process structures for a Green biorefinery system will depend on the natural and agricultural setting (e.g. biomass availability, DM yields) of the biorefinery catchment region. This also introduces regional economical factors influencing the overall process structure (Halasz et al., 2005) i.e. in areas where current farming systems are profitable, supplying grass to a GBR may not necessarily provide any additional financial benefits to farmers interested in supplying a GBR. Hynes et al. (2006) used the Simulation Model for the Irish Local Economy (SMILE) to statistically match the more detailed data from the National Farm Survey (NFS) to the Census of Agriculture. The result is a geographical output which enables the socio-economic development and policy changes in farming enterprises at a local level, electoral division (ED) across Ireland to be analysed. These SMILE simulations highlight Irish farm income to show a very distinctive northwest/southeast divide (Fig. 2.1). The broad division of farming in Ireland into marginal farming areas in the north and west and more commercial farming in the south and east has also been illustrated in the geographic study by Crowley et al. (2007). Their detailed empirical analysis of the geographic of farm structures, farming systems, agricultural measures and part-time farming were synthesised into a typology of five farming zones or five different agro-geo-climatic zones within Ireland (Fig. 2.2). The three zones in the north and west of Ireland include: the Purple zone with main characteristics of high nature value farmland, Blue and Green zones with main characteristics of agricultural sustainability through part-time farming The two zones in the south and east are the Orange zone of commercial agriculture and the Red zone

Chapter 2
20
of threats to agricultural sustainability as the main characteristics (Crowley et al., 2007). The impacts of CAP reforms and reduced livestock numbers within these regions will be a very important factor for GBR locations, as a GBR facility needs to be located in an area with adequate grass available to be supplied. 4 Conceptual Blueprint for an Irish Green biorefinery
From the literature review a blueprint for an Irish Green biorefinery was developed, available technologies, green biomass and socio-economics were used as the framework to describe the most suitable GBR system in-the-short term for Ireland. 4.1 Technologies
The most available European literature, peer reviewed literature and discussion with biorefinery experts was used to assess the availability and robustness of current and emerging biorefinery technologies. The Swiss biorefinery model adopted a gradual approach, implementing the basic extraction technologies or “crude technologies” first, with the aim of retrofitting to produce other products when commercially viable to do so. The model was also an example of a biorefinery at an industrial level, successfully producing fibre for insulation material, protein to be used as an animal feed and biogas to produce electricity and heat. The implementation of the basic GBR technology would be a good starting point for a nascent Irish Green biorefinery in the short-to-medium term, with the longer-term goal of retrofitting the GBR facility to produce higher value products. Therefore an adapted version of the Swiss GBR model was used to develop aspects of the Irish GBR model. Developing and appraising the Swiss GBR model in an Irish context will help identify problems and potential solutions or areas for further research. The prices obtained in Ireland for biomass to energy (ca 0.12 €) (at time of writing) are relatively low (approx. 0.07 €c lower than in mainland Europe) to be a viable option for a GBR to sell the electricity generated on site and buy in the required energy. Unlike the Swiss model which sold the energy to the grid, the energy generated by the anaerobic digester would be used for the energy intensive Green biorefinery processes (i.e. fiberization, drying).

Literature review
21
4.2 Green biomass
Farmers decisions to adopt new technologies can vary extensively for a number of different factors (i.e. demographics, farm size) (MackenWalsh, 2002; Mathijs, 2003). With both Irish farmers and specialised agri-contractors (who harvest the grass) skilled in grass husbandry, particularly a two-cut silage system, putting this knowledge to use, would be beneficial for the GBR and the farmer. Therefore the initial transition to farming for a GBR system could potentially be smoother if “current harvesting practices” were adopted. The Swiss GBR model operated using a grass/silage system, with grass processed in the biorefinery for 4-5 months of the year and silage for the remainder of the year. The Austrian GBR, proposed (grass) silage only as the best feedstock for GBR (Kromus et al., 2004). Therefore, as both feedstocks could be viable in an Irish context, both contrasting feedstock systems will need to be assessed to determine their feasibility for an Irish GBR system, using the current herbage cutting regimes as the bench mark for grass availability.
Fig. 2.1 Farmer’s Gross margins (€ a-1), GIS output of SMILE simulation.
Farmers Gross Margins

Chapter 2
22
4.3 Socio – economics - centralised or decentralised?
Most European studies emphasise the importance of a decentralised approach, because of the decentralised nature of the raw material. The aim of a decentralised concept is to have a direct impact on the economic structure of rural regions, supporting the sustainable development of such areas (Grass, 2004; Kromus et al., 2004). Therefore we hypothesise that the Irish biorefinery should be decentralised and based in the centre of a rural catchment using small-scale operations and which were deemed as more advantageous by Grass (2004) for a number of reasons, the main one being ease of operation and flexibility.
Fig. 2.2 Agro-geographical zones defined by Crowley et al. (2007)
Literature review
23
Blueprint:
To summarise:
“the optimum conceptualised Green biorefinery system in Ireland should be a small-
scale decentralised plant located in a catchment area which is experiencing declining
livestock numbers and hence increased surplus of green biomass (pasture), with low
farm income. The GBR will operate using a grass/silage system, or silage only system.
The processing plant should be situated in reasonable proximity to rural settlements,
so that there is potential to supply local amenities with heat or electricity from the
plant. The products potentially produced by this processing plant will include
insulation products and protein pellets for animal feed, produced from the
proteinaceous fraction of the press juice. The waste streams or stillages from the
biorefinery will be used to generate biogas produced from anaerobic digestion of the
fibre slurries. The biogas produced will be used to supply the biorefinery plant with its
own electricity, and heat for drying the press cake. The residual material remaining
after the anaerobic digestion will then be used as fertiliser and supplied back to the
associated farmers as a part of a “waste management strategy” and to maintain an
adequate nutrient cycle within the supply chain”.
4.4 Knowledge gaps and actions required to assess the GBR blueprint
4.4.1 Green biomass quality
Grass (2004) suggested that price schemes for grass delivered to a Green biorefinery should be established with respect to the raw material characteristics required to achieve the desired end product yield and quality parameters. Variations in grass quality harvested from Irish permanent pastures will depend on, inter alia, botanical composition, geographical location, local climate, fertiliser management, and growth stage at time of harvesting (Van Soest et al., 1978; Buxton, 1996). Therefore the suitability of green biomass under current harvesting regimes in Ireland, i.e. two-cut silage system, for supplying a GBR facility described in the blueprint needs to be assessed. The fundamental objective of grassland management for conventional pasture-based systems is to match herbage supply to herbage demands. However, with the potential variability of grass quality from Irish permanent pastures, the application of modelling (Barrett et al., 2004) and scenarios to predict biomass yields and quality from permanent pastures could be a useful approach to begin identifying the potential of permanent pastures as a feedstock for a GBR application.

Chapter 2
24
4.4.2 Socio-economical data used to identify the optimum locations
It is important for Ireland to identify suitable regions with adequate grass supply and the ‘socio-economic’ factors, which would support a Green Biorefinery. A list of criteria has been identified from the literature, which need to be considered when determining the potential location of a GBR. These include: 1) identifying regions with declining livestock numbers resulting in a potential excess of grass, which could be supplied to a biorefinery; 2) identifying regions where the gross margins (Fig. 2.1) of livestock farming systems are currently low; 3) locations with higher percentages of part time farmers as these farmers would have less time to devote to livestock production and may prefer the less labour intensive option of supplying a Green Biorefinery; 4) the logistics involved in a supply chain management will also be considered.
5 Conclusions
• Despite the specific local reasons for each European country to pursue the
concept of Green Biorefinery, it is very clear that policy is one of the major impetuses providing the foundations and support for such advancements. Without the political infrastructure the basic physical infrastructures, such as the green pellet industries, starch refining or biogas technologies would not have been likely to materialise or given the opportunity to advance towards a Green biorefinery concept.
• In the last decade, the Irish government has began establishing a policy
framework to move Ireland in line with the European expertise of biomass to bioenergy, putting Ireland in the advantageous position to assess its green biomass options using key findings of Europe.
• The conceptual blueprint for an Irish Green biorefinery is envisaged to be a
small scale decentralised plant, located in a catchment area which has a
surplus of green biomass (pasture) and farmers willing to supply the processing
plant. The idealised products include from the grass fibre fraction: insulation
materials, heat and energy from anaerobic digestion of fibre slurries. From the

Literature review
25
grass juice fraction: protein pellets for animal feed. • However relevant knowledge gaps associated with the supply side of an Irish
Green biorefinery system haven been identified. These need to be determined in order to assess the feasibility of the conceptual GBR blueprint and include:
o The quantity and quality of grass biomass under a two cut silage system and its suitability for the GBR model outlined in the blueprint;
o Which feedstock system is most viable in an Irish context, grass/silage system or silage only?
o Is a decentralized Green biorefinery the most appropriate economy of scale?
o How will grass/silage quality impact the profitability of the GBR system?
o Where are the potential catchments for the GBR described in the blueprint and what factors will determine the optimised locations?

26

27
3 Grass biomass scenarios for an Irish Green Biorefinery blueprint, under a two-cut silage system
S. M. O' Keeffe, R.P.O. Schulte, P. O' Kiely, and P.C. Struik. Grass biomass scenarios for an Irish Green Biorefinery blueprint; under a two cut silage system.Submitted for publication.

Chapter 3
28
Abstract
It has previously been established that Green biorefineries (GBR) could be operated using Irish grasslands, and a blueprint for a sustainable GBR industry in Ireland has been developed. The objective of this study was to 1) investigate if the quantity and quality of biomass available from permanent grassland swards on six contrasting farms across Ireland and managed under a two cut silage system were suitable for a GBR producing fibre products such as insulation material and protein for animal feed, and 2) to develop dry matter (DM), fibre and crude protein (CP) biomass supply models as a function of the combined effects of botanical composition of pastures, phenological growth stage (GS) at time of cutting, nitrogen fertiliser application rate and weather, and to subject the biomass supply models to scenario analysis to investigate system trends. Fibre was determined to contribute c. 500 g kg-1 pasture biomass DM or greater and CP fractions contributed greater than 100 g kg-1 pasture biomass DM. It is concluded that permanent pastures under a two-cut silage system are compatible with a GBR blueprint model. All of the biomass supply models displayed satisfactory goodness of fit and the sensitivity analyses suggested that some secondary grass species may have potential to be used in a GBR system. Keywords: Grass, Ireland, Green Biorefinery, permanent pasture, scenarios
1 Introduction
Grasslands are one of the world’s most important biomes covering approximately 69% of the agricultural area or 26% of total land area (FAOSTAT, 2008). In Ireland, approximately 90% of the agricultural area is devoted to grassland farming (O' Mara, 2008) and reforms in the Common Agricultural Policy of the EU (CAP) have reduced livestock numbers resulting in surpluses of grass in some areas. ‘Green Biorefinery’ (GBR) is a potential alternative use of Irish grass biomass. It involves chemically and physically fractionating grass and/or grass silage (Kiel, 1998) into two streams: press cake (the solid fibre fraction) and press juice (the liquid fraction). A “Blueprint for an Irish GBR” has been proposed by O’Keeffe et al. (2009), based on an adapted Swiss GBR model producing methane from an anaerobic digester, insulation materials from the press cake and a proteinaceous product for animal feed from the press juice. They also proposed the adoption of “conventional” farming practices (i.e. a two-cut silage system) for the initial transition to a GBR system. Knowledge gaps associated with the feedstock supply side of an Irish GBR system include an assessment of the quantity

Feedstock scenarios
29
and quality of grass biomass available from Irish permanent pastures under a two-cut silage system and its suitability for the GBR model outlined above. The grass quality harvested from Irish permanent pastures will depend on, inter alia, botanical composition, geographical location, local weather, fertiliser management, and growth stage at time of harvesting (Fositt, 2000). In Ireland permanent pasture is the predominant pasture type (O' Kiely et al., 2004 ; O’Connell et al., 2004). Intensive management of permanent pasture results in swards sometimes entirely dominated by Lolium perenne. Less intense management, e.g. reduced cutting frequency, lower animal stock rates, lower rates of fertiliser application, results in more species or secondary grass species in the sward, such as meadow-grasses (Poa spp.), Yorkshire-fog (Holcus lanatus), bent grasses (Agrostis spp.) and herbaceous species e.g. docks (Rumex spp.), creeping buttercup (Ranunculus repens) (Fositt, 2000). Grass (2004) suggested that price schemes for grass delivered to a GBR should be established with respect to the characteristics required to achieve the desired end product yield and quality. With the range of these characteristics outlined above, models (Barrett et al., 2004) and scenario analyses are required to estimate grass biomass quantity and quality from permanent pastures when identifying the potential of permanent pastures as a feedstock for a GBR. Therefore, the aims of this paper are: 1) To assess the yields of dry matter (DM), fibre (neutral detergent fibre - NDF) and crude protein (CP) of grass swards on six contrasting Irish farms. These farms differed in geographical location, soil type, weather, previous management and sward botanical composition. They were all subjected to a two-cut silage management system (with the grass produced between March/August and the end of the growing season not being included in the system) and assessed under three annual input rates of inorganic N fertiliser (45, 90, 225 kg N ha-1 a-1) in two successive years. 2) To use the data from the same six contrasting farms to:
a. Develop biomass supply models to predict DM, fibre and CP yields as a function of the combined effects of botanical composition of pastures, phenological growth stage at time of cutting, nitrogen fertiliser rate and weather.
b. Subject the biomass supply models to scenario analyses to investigate the combination of botanical composition and management which maximises DM, fibre and CP yields, and apply sensitivity analyses to the optimised scenario to examine trends in the feedstock options for a GBR.

Chapter 3
30
2 Materials and methods
2.1 Harvesting of grass biomass
Site selection was based on the five farming zones or agro-climatic regions identified by (Crowley et al., 2007b) (Table 3.1). In early March 2007, plot areas were fenced to prohibit further animal grazing. Herbage was removed to a 5 cm stubble height to ensure a similar sward state when spring growth commenced. Herbage was similarly removed in late autumn to ensure a satisfactory quality of the grass biomass for the following harvest season. At each of the six sites, three annual nitrogen treatments of 45, 90, 225 kg N ha-1, respectively, were applied as calcium ammonium nitrate (275 g N kg-1) to the plots (2.5 m × 2.0 m), each treatment with four replications in a completely randomised design. Fertiliser was applied to the plots annually in two applications, 125 kg N ha-1 March (for the primary growth) and 100 kg N ha-1
May/June (after first cut). Annually, 30 kg phosphorus ha-1 and 120 kg potassium ha-1
was also applied, at the same time as the nitrogen applications, 20 kg P ha-1 ,120 kg K ha-1 for primary growth and 10 kg P ha-1 35 kg K ha-1 after 1st cut . All six sites were fertilised in the same week. Simulating the national silage harvesting campaigns in Ireland, grass was harvested from the plots in two annual cuts (late May / early June and late July/ early August). All sites were harvested within approximately one week; except for the most Northern site (Fermanagh), which had only one annual cut, in late July (harvesting regime of region). In 2008, the second harvest from site B could not be included in the analysis. A strip (1.03 m × 2.5 m) was harvested from each plot using a finger bar mower (Agria, Haag, Germany) to determine plot yield above a 5 cm stubble. Representative core samples of the harvested grass were taken for chemical analyses; and five to ten grab samples per plot were sorted into individual grass species to establish their relative abundance. The most common species found in the harvested biomass included: Lolium perenne (Lp), Agrostis spp. (As), Poa spp. (Poa), Holcus lanatus
(Hl), Trifolium repens (Tr), Ranunculus repens (Rr) and Rumex obtusifolius (Rumex). The GS of approximately 400 to 500 tillers per plot was also assessed for the individual species, using the mean stage count (MSC) of Moore et al., (1991) (Table 3.2).

Feedstock scenarios
31
T
able
3.1
. D
etai
ls o
f far
m t
ype,
so
il a
nd g
rass
land
fro
m t
he f
ield
tria
l plo
ts.
Fie
ld t
rial s
ite
loca
tions
1
Long
itude
an
d la
titud
e
Far
m/p
revi
ou
s m
ana
gem
ent
ty
pe
Sw
ard
age
(yea
rs)
So
il ty
pe/t
extu
re
Dra
inag
e ty
pe
So
il nu
trie
nts
stat
us
pH2
P3
K3
m
g L
-1
mg
L-1
Co
rk (
A)
52º1
3'N
; 8º4
2'W
(S
out
h)
Da
iry
5 -
10
Loa
my
soil
typ
e M
od
erat
ely
– w
ell
dra
ined
6.
30
13.5
1
52
Ro
sco
mm
on
(B)
53
º30'
N; 8
º2'W
(M
idla
nds)
B
eef
5 -
10
San
dy
cla
y lo
am
Mo
der
atel
y d
rain
ed
5.3
7 3.
2
96
Offa
ly (
C)
53º2
0'N
; 7º8
'W
(Eas
t)
Mix
ed t
illag
e &
liv
esto
ck
(she
ep)
> 1
0
San
dy
cla
y lo
am
Mo
der
atel
y d
rain
ed
6.1
6 10
.5
129
We
xfo
rd
(D)
52
º18'
N; 6
º30'
W
(So
uth
Eas
t)
Bee
f 5
- 10
Lo
am
y so
il ty
pe
M
od
erat
ely
dra
ined
5
.29
8.8
1
05
Mo
nag
han
(E)
53º5
9'N
; 6º4
4'W
(M
idla
nds)
B
eef
> 1
0
San
dy
cla
y lo
am
(h
eavy
cla
y)
Mo
der
atel
y d
rain
ed
6.0
0 5.
2
75
Fer
ma
nag
h (F
) 52
º2
6' N
; 8º7
'W
(Nor
ther
n)
She
ep
5 -
10
Org
anic
sa
ndy
loa
m
Poo
rly d
rain
ed
5.1
3 5.
9
92
1.
Site
co
des
are
in p
are
nthe
ses
2
. pH
1:2
So
il w
ater
rat
io
3.
Mo
rgan
’s e
xtra
ctab
le s
olu
tion
(Mo
rgan
, 1
941
)

Chapter 3
32
2.2 Chemical analysis
In addition to DM content, two of the most important quality parameters for assessing grass feedstock for GBR are the fibre and CP contents (Grass, 2004). In the case of the GBR the press cake comprises of c. 800 g fibre and 200 g other products (e.g. proteins, amino acids, ash, sugars) per 1 kg DM (Hulst et al., 2004; Ketelaars and Rutgers, 2002). Although underestimating the potential quantity of press cake available from the grass biomass, for this study the neutral detergent fibre (NDF) (Van Soest, 1963) content was used to estimate the quantity of press cake in the grass biomass in a consistent and objective manner. The CP content (total N x 6.25) of the grass was estimated using a LECO FP 428 nitrogen analyser (AOAC 1990, method 990-03) and was used to calculate the yield of
Table 3.2. Botanical composition of swards at the six sites, species relative abundance, meaned across 2 years for 1st and 2nd cut, at 3 rates of N 45, 90, 225 kg ha-1 a-1 (sample no = 251) Site1 Botanical composition2 Growth stage3 Cut 1 Lp Poa As Hl Tr Rumex Rr Min Max A 91 8 0 1 0 0 0 2.60 3.37 B 74 4 6 15 1 0 0 2.29 3.20 C 63 13 22 0 2 0 0 2.42 2.93 D 95 3 1 0 0 1 0 1.90 3.36 E 61 17 11 11 0 0 0 2.70 3.29 F 14 1 49 26 6 2 2 2.65 3.37 Cut 2 A 94 2 2 2 0 0 0 0.98 2.58 B 68 2 14 14 2 0 0 2.17 2.58 C 49 2 41 0 7 0 1 1.44 2.94 D 90 5 1 0 0 4 0 1.01 3.04 E 50 4 29 16 0 1 0 2.13 2.64
1. For site codes refer to Table 1 2. Relative abundance of species (%); Lp = Lolium perenne, Poa = Poa spp. As =
Agrostis spp., Hl = Holcus lanatus, Tr = Trifolium repens, Rumex = Rumex obtusifolius, Rr = Ranunculus repens
3. Growth stage at time of cutting; Vegetative stage 1.9, Elongation stages 1.9 - 3, Booting stage 3.0 - 3.1, Inflorescence /1st spikelet visible 3.1- 3.3, Spikelets fully emerged/ peduncle not emerged 3.3 - 3.5, Inflorescence emerged /peduncle fully elongated 3.5 - 3.7, Anther emergence/anthesis 3.7 - 3.9, Post anthesis ≥ 3.9 (Moore et al., 1991).

Feedstock scenarios
33
CP of the fresh biomass. As some of the CP will remain in the presscake, the CP yields can only provide a rough estimation of press juice CP yields. he mass fractions (g kg-1 DM) of fibre and CP and DM yields (t ha-1) were multiplied to calculate fibre and CP yields. 2.3 Weather data
Meteorological data from the nearest synoptic weather stations were used. The climatic variables used (Table 3.3) were average daily air temperature (°C), solar radiation (J cm-2 day-1), rainfall (mm day-1) and soil moisture deficit (SMD) (mm) calculated using the SMD model outlined in Schulte et al. (2005).
Table 3.3. Silage cutting dates and mean daily weather characteristics during each growing period for field trial plots during 2007 and 2008
Year & cutting dates Growing period1
Weather2
Management of sites
2007 Year 1
2008 Year 2
Days of growth
(d)
Radiation
(J cm-2 day-1)
Air
Temperature (ºC)
Rainfall (mm d-1)
SMD (mm)
First cut silage Cork (A) 29th May 75 1452 10.22 1.02 32.01 27th May 62 1376 9.79 1.88 11.56 Roscommon (B) 6th June 72 1622 10.82 1.26 31.68 3rd June 70 1543 10.33 1.32 30.49 Offaly (C) 28th May 76 1527 9.18 0.89 33.77 29th May 66 1502 9.22 1.20 16.78 Wexford (D) 28th May 74 1429 10.38 1.26 47.18 26th May 61 1407 9.78 2.48 8.92 Monagahan (E) 7th June 87 1360 9.57 1.61 20.49 5th June 72 1491 9.90 1.94 16.15 Fermanagh (F) 9th July 116 1664 11.38 2.30 12.44 25th June 92 1723 10.98 2.13 21.97 Second cut silage Cork (A) 24th July 57 1521 13.14 3.65 16.50 30th July 65 1490 13.41 3.28 17.70 Roscommon (B) 30th July 56 1567 14.45 3.16 13.09 M/D3 - - - - - Offaly (C) 25th July 58 1539 13.40 3.65 17.22 5th Aug 69 1480 13.88 3.38 21.99 Wexford (D) 23rd July 57 1520 13.05 3.81 6.87 28th July 64 1625 14.08 3.47 11.62 Monagahan (E) 31st July 55 1421 13.91 3.90 11.71 6th Aug 63 1394 13.98 2.53 27.05
1. Growing period = period between fertilizer application and harvest 2. Radiation = average daily radiation (J cm-2 day -1), Temperature = average daily temperature (ºC), Rainfall = average daily
rainfall (mm day-1), Soil Moisture Deficit (SMD) = average soil moisture deficit (mm); all were averaged over the growing period
3. M/D = Missing harvest data

Chapter 3
34
2.4 Statistical analysis
Analysis of site data
ANOVA was used to test for significance between site, year, and harvest, across N application rate (45, 90 and 225 kg N ha-1 a-1), significance between N rate and site was tested across two annual harvests and two years. The least significant difference (LSD; P<0.05) test was used to separate means within site, year, and harvest across N fertiliser application rate. Means for N fertiliser application rate and site were separated after averaging across two annual harvests and two years. 2.5 Biomass supply model
2.5.1 Model generation
The diversity-interaction effects model of Kirwan et al. (2009) was the statistical approach taken with the field trial data to develop the GBR biomass supply models for DM, fibre and CP yields. This statistical modelling framework was developed to quantify the direction and magnitude of the species interactions that produce diversity effects (performance of a mixture of species over and above that expected from the component species performances in monoculture). The fixed effects included botanical composition (the proportions Pi of the i th species), species interactions (specified as PiPj among the i th and j th species), N fertiliser application rate (N), soil and weather variables (C) and growth stage at cutting (GS). The form of the fixed effects model for each fraction yield (FY) was:
GSCNPPPFY kk
s
jiji
jiij
s
iii φλαδβ ++++= ∑∑
<== 1,1
where the effects of species within a functional group [grass (Lp, Poa, As, Hl) and forbs (Tr, Rumex, Rr)] were found to perform in a similar manner the species coefficients were combined to give a composite functional group coefficient. A linear mixed model was fitted to account for repeated measures. Model fitting was conducted for both the fixed effects (botanical composition, species interactions, N rate, phenological GS, weather variables) and random effects (site, year, harvest) and the model of best fit was determined for each chemical component using Akaike’s

Feedstock scenarios
35
Information Criterion (AIC). The compound symmetric random structure was the best fit for the random model of the DM and fibre yields, while a variance components structure was the fit best for the press juice CP yields. The final biomass supply models presented are those that gave the lowest AIC value. All models were fitted using MIXED procedure in SAS (v. 9.1). 2.5.2 Validation of model predictions
The DM and CP biomass yield models were estimated for accuracy of prediction using data from field trials on old permanent grassland (Keating and O’Kiely, 2000). The relevant fertiliser rate (kg N ha-1), weather data and botanical composition were used with the DM and CP biomass supply models to generate predicted values for the field trial plots described by Keating and O’Kiely (2000b). The predicted DM yields were compared with the observed DM yields over three years; the CP yields were compared with one year’s data.
2.5.3 Scenario analysis
2.5.3.1 Optimised maximum scenario models
The coefficients of the final linear mixed models (Table 3.5) were used to generate scenarios which predicted the maximum DM yields (t ha-1) or maximum fraction yields (t ha-1) as a function of botanical composition and grassland management (i.e. N fertiliser application rate, GS at time of cutting). Optimised scenarios for maximum yields were carried out using the Microsoft Excel 2003 solver function (Microsoft Corp., Seattle, WA). The optimisation process was constrained to realistic values, i.e. the ranges that were observed during the two-year experiment, in order to prevent untested extrapolation of results. The nitrogen fertiliser was constrained to the advised annual application rates for two successive silage harvests of 225 kg ha-1 a-1 (Coulter and Lalor, 2008). The relative abundance for the legume proportions were constrained to less than or equal to 5% of the biomass and Lp was constrained to greater than or equal to 50% relative abundance, as this was the predominant range observed in the field trials. The relative abundances of Rumex and Rr were constrained to zero as the aim of the optimisation process was to determine the optimum pasture species of grasses and legume in the

Chapter 3
36
mixtures. The GS parameters were constrained to the range 1.9-3.3 (Moore et al., 1991). For the press juice fractions GS was constrained to < 3.0 (before inflorescence emergence). The reason for this was to simultaneously optimise for high DM yield and high CP content, which is usually associated with more vegetative swards (GS < 3.0) (Heath and King, 1976). Average daily rainfall and air temperature were constrained to the average daily values obtained from the field trial data of 2.4 mm day-1 and 13.14 ºC, respectively. 2.5.3.2 Scenario sensitivity analysis
Sensitivity analyses were carried out for each of the optimised scenarios to investigate the sensitivity trends of the maximum values to changes in the relative species proportion, N fertiliser application rate and GS. These combinations of variables were chosen as it was thought they would provide insight into management considerations for farmers and for the GBR. The sensitivity analysis was carried out as follows, e.g. the DM model predicted Lp at a relative abundance of the sward to be 50%. The effects of Lp proportion on DM yields were examined by changing the relative abundance of Lp to 15, 25, 5, 75, 85 and 90%. The remaining relative proportion of the sward was partitioned across the other species predicted by the models, in the same ratio predicted by the model (i.e. Poa (0.45) + Tr (0.05) = 0.5, Poa = (0.45/0.5)*remainder and Tr (0.05/0.5)*remainder). The sensitivity analysis was maintained within the model constraints outlined above. The sensitivity of the optimised scenario to changes in N fertiliser application rate and GS was investigated by reducing the optimised predicted values to 25 % and 50% of the value predicted. 3 Results
3.1 Observed yields across six contrasting sites
3.1.1 Yield of DM (t DM ha-1)
The mean DM yields for each site, cut and year are shown in Table 3.4. Between-site differences for first cut in Year 1 were greater than in Year 2. There was relatively little between-site differences for second cut, however for both years site C produced the highest DM yields for the second cut (P<0.001). The between-year differences for

Feedstock scenarios
37
first cut showed both sites D and B (P<0.001) to have higher yields in Year 1 and lower yields in Year 2 (Table 3.4). The DM yields were higher for sites C and F in Year 2 (P<0.01). The between-year differences for the second cut was only significant for site C (P<0.001). The biggest difference was shown between cuts, with first cut always having the higher DM (P<0.001) yields for both years. For all sites, the annual DM yields significantly increased with increasing rates of N fertiliser application, site B was the only exception. There was relatively little difference between site annual mean DM yields (Fig. 3.1). The mean DM yields from site F were for only a single annual cut and, therefore, significantly lower than those of the other sites. The average response to increasing rates of N fertiliser application rate for all the sites ranged from 15-32 kg DM kg-1 N.
Fig. 3.1 Dry matter yields for six field trial sites at three rates of nitrogen (45, 90, 225 kg N ha-1 a-1) averaged across two years and two annual harvests. The sites codes on top of a column (site x N) denote those sites which had significantly different mean DM yields to that site at that N application rate. Differences between N application rate means are denoted as significant with a capital letter (in white) placed between the treatment columns. The 45N and 225N application rates were significantly different for all sites, except D. *P<0.05;**P <0.01;*** P <0.001. (Site × treatment, P < 0.001).

Chapter 3
38
3.1.2 Press cake component - Yields of fibre (t ha-1)
The fibre yields equated to approximately 500 g kg-1 pasture biomass DM, under the prevailing harvesting regime (Table 3.4), and had trends similar to the DM yields. However, fibre yields had greater between-site differences for the first cut. There was relatively little between-site difference for the second cut; however, for both years site
Table 3.4. Effects of site, year and cut on DM (dry matter) (t ha-1), fibre (NDF) (t ha-1) and CP (t ha-1) yields averaged across three N fertiliser application rates Site1 Year DM S2 Y3 C4 NDF S2 Y3 C4 CP S2 Y3 C4 Cut 1
A 1 8.19 be 4.10 ef 0.98 bcef B 1 8.69 ae 4.72 e 1.12 ac C 1 7.20 ef 3.57 0.98 abef D 1 9.81 5.43 1.29 b E 1 7.90 a-c,f 4.37 abf 0.86 acf F 1 7.14 c,e 4.28 abe 0.89 ace A 2 8.26 bcef ns 4.20 bcdf ns 0.88 bf ns
B 2 7.45 ae ** 4.10 acef * 0.77 adf ***
C 2 8.86 af ** 4.39 abf ** 0.96 af ns D 2 5.02 *** 2.43 *** 0.75 abef *** E 2 7.40 ab ns 3.82 ab * 0.74 abdf ns F 2 8.39 ac ** 4.48 a-c ns 0.80 a-e ns Cut 2 A 1 3.29 bde *** 1.53 bde *** 0.49 bde *** B 1 3.79 ade *** 1.80 ad *** 0.63 a,c-e *** C 1 4.84 *** 2.35 *** 0.77 b *** D 1 3.94 abe *** 1.82 abe *** 0.59 abe *** E 1 3.60 abd *** 1.72 abd *** 0.52 abd *** A 2 4.07 de ns *** 1.93 de ns *** 0.52 de ns *** B 2 M5 M * M C 2 6.61 ad *** *** 3.53 *** *** 0.87 ns ns D 2 4.25 ae ns * 2.07 ae ns ns 0.50 ae ns *** E 2 3.62 ad ns *** 1.96 ad ns *** 0.52 ad ns * Model : Site × year × harvest ;*** P<0.001
1. Site list: see Table 1 2. S = Least significant of difference (LSD) for between–site means. Site means are denoted as not significantly different (at
P<0.05) from site codes listed; if no site code follows, sites are significantly different from every other site. 3. Y = LSD for between–year means. ns, non significant, *P<0.05;**P <0.01;*** P <0.001 4. C = LSD for between–harvest means, Cut 1 and Cut 2 for individual years of field trials 5. M = Data missing for this harvest

Feedstock scenarios
39
C produced the greater fibre yields (P<0.001). Site D had the significantly higher fibre yields for Year 1 (P<0.001), site F had the highest fibre yields in Year 2. For both years, site C produced the highest fibre yields for the second cut (P<0.001). The biggest difference observed for fibre yields under this cutting system was also between cuts; with first cut having the significantly higher fibre yields for both years. 3.1.3 Press juice component: Yields of CP (t ha-1)
The CP fractions ranged from 110-130 g kg-1 of the pasture biomass DM for the first cut, and 110-160 g kg-1 DM of pasture biomass for the second cut. There was relatively little between-site differences in either year for first or second cuts (Table 3.4). The between-year differences showed the highest CP yields for the first cut in Year 1 , with site B and D having significantly (P<0.001) higher CP yields in Year 1 compared with Year 2. The between-year difference for the second cut was not found to be significant for this study. The biggest difference observed for CP yields was again between-cuts, particularly for Year 1, with all sites showing significantly higher CP yields for the first cut. In Year 2, all sites had significantly lower second cut (P<0.001) CP yields, except site C. 3.2 Biomass supply models and optimised scenario analyses
3.2.1 DM Yields
3.2.1.1 Model generation
The individual pasture species contributed significantly to DM yields of the sward (Table 3.5). The GS of As at cutting (P = 0.0002) and the interaction of average nitrogen application rate with the functional groups grass (P<0.0001) and forbs (P = 0.0227) were significant for increased DM yields. The interaction of average rain with both functional groups grass (P<0.0001) and forbs, (P = 0.2733) had a negative effect on DM yields. Overall, the model displayed a satisfactory goodness of fit (R2 = 0.78) (Fig 3.2a).
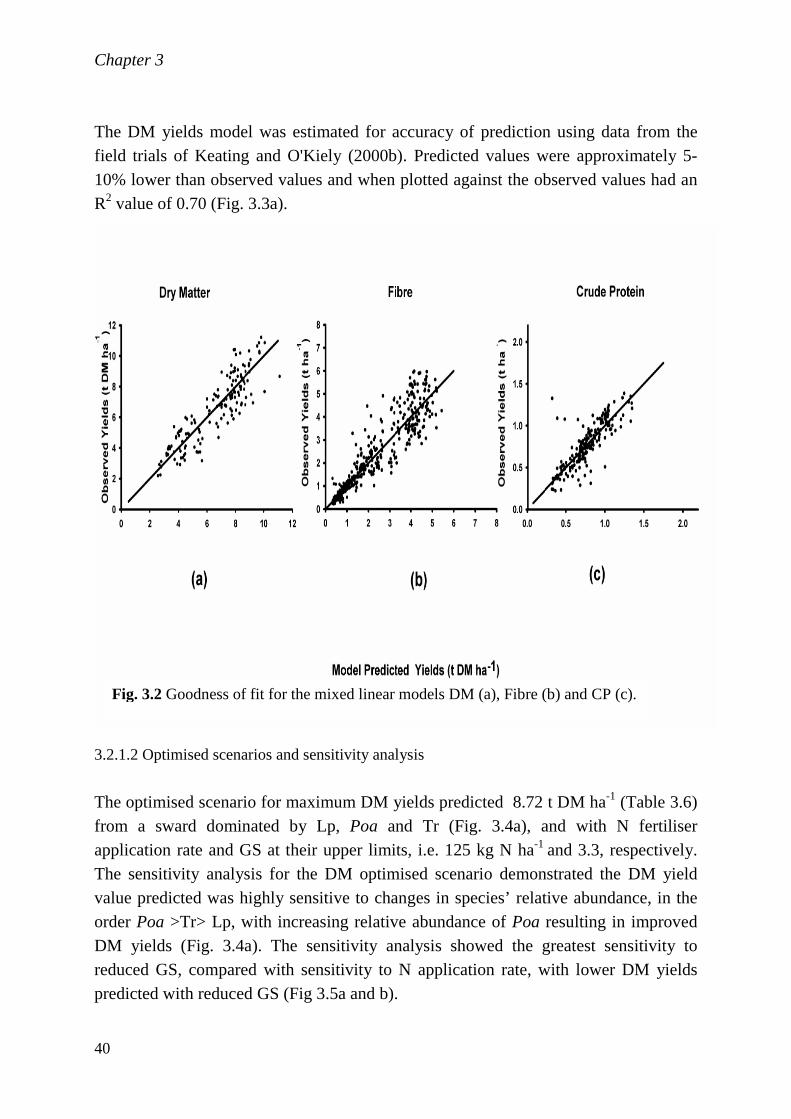
Chapter 3
40
The DM yields model was estimated for accuracy of prediction using data from the field trials of Keating and O'Kiely (2000b). Predicted values were approximately 5-10% lower than observed values and when plotted against the observed values had an R2 value of 0.70 (Fig. 3.3a).
3.2.1.2 Optimised scenarios and sensitivity analysis
The optimised scenario for maximum DM yields predicted 8.72 t DM ha-1 (Table 3.6) from a sward dominated by Lp, Poa and Tr (Fig. 3.4a), and with N fertiliser application rate and GS at their upper limits, i.e. 125 kg N ha-1 and 3.3, respectively. The sensitivity analysis for the DM optimised scenario demonstrated the DM yield value predicted was highly sensitive to changes in species’ relative abundance, in the order Poa >Tr> Lp, with increasing relative abundance of Poa resulting in improved DM yields (Fig. 3.4a). The sensitivity analysis showed the greatest sensitivity to reduced GS, compared with sensitivity to N application rate, with lower DM yields predicted with reduced GS (Fig 3.5a and b).
Fig. 3.2 Goodness of fit for the mixed linear models DM (a), Fibre (b) and CP (c).

Feedstock scenarios
41
T
ab
le 3
.5. B
iom
ass s
up
ply
mo
dels
- e
stim
ate
s f
or
dry
matt
er
(D
M),
fib
re a
nd
cru
de p
rote
in (
CP
) yie
lds.
D
M y
ield
(t
ha-1
) F
ibre
yie
ld
(t
ha-1
) C
P y
ield
(t
ha-1
)
Va
ria
ble
s
DM
E
stim
ate
E
rro
r t
va
lue
P
r >
|t|
Fib
re
Estim
ate
E
rro
r t
va
lue
P
r >
|t|
CP
E
stim
ate
E
rro
r t
va
lue
P
r >
|t|
Lp
5
.95
0
.25
2
3.7
6
***
2.9
5
0.1
6
18
.39
**
* 0
.75
0
.03
23
.08
**
* P
oa
7
.15
1
.44
4
.95
**
* 3
.51
0
.53
6
.63
**
* 0
.85
0
.14
6
.29
**
* A
s
4.2
3
0.9
5
4.4
5
***
2.3
5
0.6
1
3.8
4
**
0.8
7
0.0
7
11
.80
**
* H
l 5
.85
0
.76
7
.67
**
* 3
.53
0
.43
8
.19
**
* 0
.71
0
.11
6
.38
**
* T
r 2
2.6
1
15
.40
1
.47
N
S
0.6
9
2.1
1
0.3
3
NS
1
.40
0
.26
5
.34
**
* R
um
ex
13
.19
1
6.9
6
0.7
8
NS
-1
.51
2
.44
-0
.62
N
S
0.6
0
0.3
1
1.9
5
NS
R
r 8
.16
1
6.6
5
0.4
9
NS
-7
.13
3
.62
-1
.97
N
S
0.1
1
0.7
7
0.1
4
NS
A
s inte
ractio
ns
2.7
8
1.2
2
2.2
8
*
Lp
inte
ractio
ns
Gra
ss*F
orb
s
-8.4
1
17
.40
-0
.48
N
S
4.0
5
3.2
9
1.2
3
NS
Lp
*GS
-0
.01
0
.69
-0
.02
N
S
0.5
9
0.3
2
1.8
6
NS
0
.18
0
.0
8
2.2
1
* P
oa
*GS
4
.91
2
.71
1
.81
N
S
As*G
S
5.7
1
1.5
1
3.7
9
**
N
0.0
0
0.0
0
22
.09
**
* G
rass*N
0
.01
0
.00
6
.74
**
* 0
.00
5
0.0
0
10
.34
**
*
F
orb
s*N
0
.11
0
.05
2
.31
*
0.0
2
0.0
1
1.5
5
NS
T
r*N
A
s*N
R
ain
-0
.12
0
.03
-3
.75
**
T
em
pe
ratu
re
Gra
ss*r
ain
-1
.72
0
.24
-7
.23
**
* -0
.52
0
.20
-2
.53
*
Fo
rbs*r
ain
-2
.78
2
.53
-1
.10
N
S
0.5
7
1.9
6
0.2
9
NS
G
rass*t
em
p.
-0.2
5
0.1
2
-2.1
7
*
Fo
rbs*t
em
p.
-0.8
2
0.9
8
-0.8
4
NS
NS
, non
sig
nific
ant,
*P<
0.0
5;**
P<
0.0
1;***
P<
0.0
01
S
pe
cie
s p
rop
ort
ion
s:
Lp =
L
olium
pe
renn
e, P
oa =
Po
a s
pp. ,
As =
Ag
rostis spp.,
Hl =
Ho
lcus la
natu
s, T
r =
Tri
folium
repens,
Rum
ex =
Ru
mex
obtu
sifo
liu
s, R
r =
Ranun
culu
s r
epe
ns
GS =
Gro
wth
sta
ge
at
tim
e o
f cutt
ing
; V
egeta
tive s
tage
> 1
.9 , E
lon
ga
tio
n s
tage
s 1
.9-
3,
Bo
oting s
tage 3
.0 -
3.1
, In
flore
scence /1
st s
pik
ele
t vis
ible
3
.1-
3.3
, S
pik
ele
t’s fu
lly e
merg
ed/
pedu
ncle
not
em
erg
ed 3
.3 -
3.5
, In
flore
scen
ce e
me
rged
/ped
un
cle
fu
lly e
longate
d 3
.5 -
3.7
, A
nth
er
em
erg
en
ce/a
nth
esis
3.7
- 3
.9,
Po
st an
thesis
> 3
.9.
Gra
ss =
(L
p +
Poa
+A
s +
Hl)
Forb
s =
(T
r+ R
um
ex+
Rr)
The G
rass× F
orb
in
tera
ction f
or
the fib
re f
raction d
oes n
ot in
clu
de A
s in
the g
rass fu
nctional gro
up a
s the e
ffects
of
As
are
mod
elled b
y t
he
A
s_in
t covari
able
. As_
int =
Lp*A
s +
Poa*
As +
As*H
l +
As*T
r +
As*D
ocs +
As*R
r.
N =
N r
ate
(centr
ed a
roun
d it’s a
ve
rage
)
Tem
p =
avera
ge d
aily t
em
pe
ratu
re (
ºC).
Rain
= a
vera
ge d
aily r
ain
fall o
f perio
d (
mm
da
y-1).

Chapter 3
42
3.2.2 Presscake: fibre yields
3.2.2.1 Model generation
The individual species contributed significantly to fibre yields of the biomass (Table 3.5). Grass species As interacted significantly (P <0.0233) with the other species present in the sward. The grass functional group interaction with average N fertiliser application rate (grass × N) was highly significant (P < 0.0001) for increasing the fibre yields. The functional groups interaction with average daily rainfall (grass × rain) significantly reduced the yields for fibre (P = 0.0121). Overall, the model displayed a satisfactory goodness of fit (R2 = 0.69), but with reduced accuracy with increasing fibre (Fig. 3.2b). The field trials experiments of Keating and O'Kiely (2000b) used to validate DM yields and the CP model did not measure the fibre value and, therefore, the fibre prediction model was not assessed for accuracy of prediction.
Fig. 3.3 The predicted DM (a) and CP (b) yields of the botanical model and the observed
values obtained in the field trials outlined.

Feedstock scenarios
43
Tabl
e 3.
6. O
ptim
ised
max
imum
sce
nario
s pr
edic
ted
for d
ry m
atte
r (D
M),
fibre
and
cru
de p
rote
in (C
P) y
ield
s (t
ha-1
cut-1
)
Opt
imis
ed p
aram
eter
var
iabl
es
W
eath
er 1
Man
agem
ent2
Bot
anic
al c
ompo
sitio
n3
Frac
tions
R
ain
Tem
p G
S
N ra
te
Lp
Poa
A
s H
l Tr
R
umex
R
r
Yie
ld 4
t ha-1
D
M
2.4
-
3.3
125
0.5
0.45
0
0 0.
05
0 0
8.72
Fi
bre
2.4
13.1
4 3.
3 12
5 0.
50
0 0.
29
0.21
0
0 0
3.35
C
P
2.4
13.1
4 3.
0 12
5 0.
5 0
0.45
0
0.05
0
0 0.
89
1. R
ain
= av
erag
e da
ily ra
infa
ll (m
m d
ay-1),
tem
p =
aver
age
daily
tem
pera
ture
(ºC
), th
ese
wer
e co
nstra
ined
in th
e m
odel
to 2
.4 m
m a
nd 1
3.14
ºC
2.
Age
= G
row
th s
tage
at c
uttin
g (E
long
atio
n st
ages
1.
9 -
3, In
flore
scen
ce e
mer
ged
/ped
uncl
e fu
lly e
long
ated
3.5
- 3.
7, N
rate
= n
itrog
en a
pplic
atio
n ra
te
(kg
N h
a-1 a
-1),
3.
Bot
anic
al c
ompo
sitio
n: L
p = Lo
lium
per
enne,
Poa
= Poa
spp
., As
= A
gros
tis s
pp., H
l = H
olcu
s la
natu
s, Tr =
Trif
oliu
m re
pens,
Rum
ex =
Rum
ex o
btus
ifoliu
s, Rr =
Ran
uncu
lus
repe
ns.
4. D
M F
ibre
and
CP
yie
lds,
uni
ts a
re t
ha
-1

Chapter 3
44
3.2.2.2 Optimised scenario and sensitivity analysis
The optimised maximum scenarios for fibre yields predicted 3.35 t fibre ha-1 from a sward dominated by grasses, Lp, As, Hl, with relative abundances of 50, 21, 29% respectively (Table 3.6). N fertiliser application rate and GS predicted at their upper limits, i.e. 125 kg N ha-1 and 3.3, respectively. The sensitivity analysis showed a pronounced reduction in fibre yields when the relative abundance of Lp was increased and relatively lower reduction when the relative abundance of Lp was decreased. A similar trend was observed for As and Hl (Fig. 3.4b). The sensitivity analysis for the optimised fibre yield scenarios showed relatively little effect when N fertiliser application rate, rainfall and GS were altered from the values predicted for the fibre yields (Fig. 3.5a and b.)
Fig. 3.4 Results of the sensitivity analysis for the optimised maximum models, DM (a) yields
and fraction yields fibre (b), CP (c), plotted.

Feedstock scenarios
45
3.3.3 Press juice fraction: CP yields
3.3.3.1 Model generation
Overall, the CP model displayed a satisfactory goodness of fit (R2 = 0.78) (Fig. 3.2c). All species made a positive and significant contribution to the CP yields of the mixed sward, except Rumex and Poa, which were non-significant. The effect of N fertiliser application rate significantly increased the CP yields of the sward (P < 0.0001). The GS of Lp at time of cutting had a positive effect on the CP yields (P = 0.028). Rain had a significant negative effect on the CP yields (P = 0.0002). The CP yields model was estimated for accuracy of prediction using data from the field trials of Keating and O'Kiely (2000b). Predicted values were approximately 20% lower than observed values and when plotted against the observed value had an R2 value of 0.47 (Fig.3.3b).
Fig. 3.5 Results of the sensitivity analysis for the optimised maximum models, DM yields
and fraction yields (NDF, CP) plotted against the % deviation from optimised model
predicted N application rate (a) and GS (b).

Chapter 3
46
3.3.3.2 Optimised CP scenario and sensitivity analysis
The optimised maximum CP yields scenarios predicted 0.89 t CP ha-1 (Table 3.5) from a sward consisting of Lp at its lower limit (50%), As (45%) and Tr at its upper limit (5%) and with N fertiliser application rate and Gs at the upper limits of 125 kg N ha-1 and 3.0, respectively. This was a lower Gs than the Gs predicted for maximum DM and fibre yields., i.e. DM yields and fibre were predicted at 3.3, which refers to the Gs when spikelets are fully emerged, stage 3.0 refers to the Gs when the grass is booting, and there is more leafy material present in the sward. Increasing the relative abundance of Lp resulted in a reduction in the predicted CP yields (Fig. 3.4c). The model was highly sensitive to changes in species proportion in the order Lp >Tr> As. Changes in N fertiliser application rate, rainfall and GS had relatively little effect on the CP yields (Fig. 3.5a and b). 4 Discussion
4.1 Year effects and cutting on biomass yield and quality
The temporal differences (between year and cut) in the biomass quantity and quality was greater than the between site differences. The DM yields were comparable to the ranges (6.72 - 9.92 t ha-1 and 2.40 - 5.89 t ha-1 for first and second cut respectively) reported by Keating and O'Kiely (2000b). However, the DM production on site C differed significantly from other sites, particularly for the second cut. One explanation could be the greater relative abundance of Agrostis spp. in the sward of site C. Agrostis species in general produce a higher proportion of their annual yield later in the year (summer growth- July/August) relative to Lp, which would result in higher biomass yields for the second cut (Cowling and Lockyer, 1965; Haggar, 1976; Henderson et al., 1962; Peeters, 2004). The fibre yields were also comparable to the literature at 2.08 - 4.80 t ha-1 (Keady and O'Kiely, 1996; Mc Eniry et al., 2007) and this was the prevalent fraction at 500 g kg-1 DM, or greater. The yield of CP were comparable to the lower ranges found in the literature, at 0.40 – 1.52 t ha-1 (Keating and O'Kiely, 2000b). These low CP yields are likely related to the low CP content of pasture biomass, cut at a mature GS (Heath and King, 1976), particularly for the first cut. The biomass from the first cut would have greater plant stem (greater fibre fraction) content than leaf content, hence the lower CP

Feedstock scenarios
47
yields. However despite these low yields, the fraction of CP present in the permanent pasture biomass still contributed more than 100 g kg-1 DM pasture biomass cut, which could still make it a potential product option for a GBR system. However, the feasibility of this would need to be investigated further. The results of these field trials suggest that biomass from permanent pastures under a two-cut silage system was compatible with a GBR focused on producing fibre products such as insulation materials and protein products for animal feed. 4.2 Farm effects
All sites received the same fertiliser management and were cut within approximately one week of each other, resulting in relatively similar growth periods for all farms. Under the controlled conditions of this experiment, with the exception of site F, there were no large differences observed in pasture yields and quality between sites. A potential explanation could be related to the removal of grazing animals from the pasture. The grazing animal modifies the botanical composition of a pasture by selective grazing (i.e. eating species of preference), uneven re-distribution of ingested nutrients via urine and faeces and treading or poaching (Rook et al., 2004). Therefore mown and grazed swards will differ due to the variations introduced by the grazing animal, which can have a positive or negative effect on the pastures yields (Lantinga et al., 1999) and quality (Dumont et al., 2007; Mosquera-Losada et al., 2000). These results would suggest that understanding the effects of the grazing animal on the quality of the pasture biomass could be an important requirement for GBRs supplied with surplus pasture biomass (i.e. pasture biomass in excess of the requirements of livestock on the farm). 4.3 Model development and validation
A second purpose of this study was to develop a model which could be used to generate biomass supply scenarios from Irish permanent pastures under a two-cut system for a GBR. Botanical composition and the benefits of species diversity has been recognized as an important consideration for pasture biomass quality (Duru et al., 2008; Nyfeler et al., 2009) and for the sustainability (e.g. carbon sequestration, increased yields with low input) of alternative grassland use (Prochnow et al., 2009; Tilman et al., 2006; Tonn et al., 2010). Therefore, the diversity-interaction effects model was used to develop the biomass supply models for a GBR system. It takes into

Chapter 3
48
account botanical species interactions (e.g., niche partitioning and facilitation) leading to a diversity effect, which is the excess of mixture performance (i.e. increased DM, fibre, CP yields) over that expected from component species’ monoculture performances (Kirwan et al., 2009). The model can also account for the combination of weather (rain, SMD, air temperature, solar radiation) and management (N fertiliser application rate and GS at time of cutting) factors on botanical species effects, species interactions effects and functional groups effects (grass and forbs) on the pasture DM, fibre and CP yields. The N application rates interaction with the functional groups, GS interaction with Lp, Poa and As were the management factors determined to produce the best model fits. The functional groups interaction with rain and temperature were the weather effects which resulted in the best model fit. It was the combination of both these environmental and management factors with functional groups effects and botanical species effects which resulted in models with the lowest AIC (Akaike’s Information Criterion) and therefore were included in the biomass supply models. The fibre model was the only biomass supply model to include a species interaction effect in the final model. The final CP model had no functional group interaction effects and therefore the main effects of N and rain were fitted and produced the model with the lowest AIC. All of the final models displayed satisfactory goodness of fit. When validating with an independent data set from a field trial reported by Keating and O’Kiely, the model accounted for 70% of the variance in DM yield and for only 47% of the variance in CP yield. This could be explained by the relatively low CP yields and small range found in the original data set used to develop the model and this limitation of the models must be considered when assessing the outcomes of the optimized maximum scenario. However, despite these limitations of the biomass supply models, they can be employed to investigate feedstock trends for a GBR system, rather than predict absolute values. This would provide valuable insight into how the quality and quantity of grass biomass coming from permanent pastures under a two cut system could potentially affect the profitability of the GBR blueprint outlined in O’ Keeffe et al. (2009). 4.4 Scenario Analysis – Implications for Irish GBR model
The optimised DM yield value predicted was realistic and comparable to the literature

Feedstock scenarios
49
range (2.40 - 9.92 t ha-1) reported by Keating and O'Kiely (2000b). The sensitivity analysis for the optimised DM yields scenario suggested that increasing the Poa
content of the sward can increase the DM yield. This finding was a little unexpected as it is Lp, in general, which is considered the higher yielding species (Frame, 1989; Peeters, 2004). However Poa pratensis is being used in Europe as a feedstock in the production of vehicle fuel in the form of compressed natural gas (CNG) (Van Den Berg and Rademakers, 2007). Therefore there could be potential for Poa pratensis as a species suitable for an Irish GBR; however this would need more detailed research. The optimised fibre yield predicted was also comparable to the ranges found in the literature, 2.08-4.80 t ha-1 (Keady and O'Kiely, 1996; Mc Eniry et al., 2007). The sensitivity analysis suggests that both nitrogen and secondary species (common to the pasture swards assessed) such as As and Hl, which have a lower agricultural value (Frame, 1989; Peeters, 2004; Sheldrick et al., 1990) could benefit a GBR system producing fibrous products such as insulation materials (Grass, 2004). The optimised scenario predicted relatively low CP yields, and therefore the sensitivity analysis showed relatively little deviation from the CP yields predicted in the optimised maximum model. The model predicted a sward combination of Lp, As and Tr and cutting the grass biomass at an earlier GS relative to the fibre model. The important consideration to be taken from this scenario analysis is the modifications required to conventional cutting systems to increase CP yields for a GBR facility producing proteinaceous products as a main or co-product. These scenarios suggest that grass would have to be cut at a relatively early GS for high CP yields. This would require a GBR producing both fibre and proteinaceous products from the CP fraction, to optimise between high DM yields and CP content. 5 Conclusions
The findings of these field trials suggest that biomass from permanent grassland pastures under a two-cut silage system is compatible with a GBR focused on producing fibre products such as insulation and CP for animal feed. All of the final models displayed satisfactory goodness of fit, with the DM model demonstrating the greatest power predicting DM yields with a R2 value of 0.70. The CP model had relatively lower R2 value of 0.47. The optimised models and scenario analyses demonstrate the significance of permanent pastures species for the quality of the biomass and suggest that some secondary grass species have the potential to be used for industrial applications in a GBR.

Chapter 4
50

51
4 Scenarios for an Irish Green Biorefinery -
Development of a blueprint
S.M. O' Keeffe, R.P.O. Schulte, J. Sanders, and P.C. Struik. Scenarios for an Irish Green Biorefinery - Development of a blueprint. Submitted for publication.

Chapter 4
52
Abstract
The aim of this paper is to review the potential for a Green Biorefinery (GBR) initiative in Ireland and to identify the most appropriate base case scenario for an Irish GBR blue print. Three biorefinery process models, which were quantitative conservative mass and energy balances, were derived from the literature and consultation with various biorefinery experts. The models were combinations of feedstock (grass/silage or silage only) and process technologies (manufacturing products: fibres, protein or lactic acid). The findings of this study show the most appropriate scale (from those analysed in this study) for an Irish GBR blueprint is the medium scale, with a minimum government subsidy of c.10%, using a silage feedstock. Two possible production scenarios were identified; the first was to produce fibre products alone as insulation material (“No Prot” scenario), and the second was to include a secondary proteinaceous product as an animal feed (“Prot” scenario). The technologies are still developing for lactic acid production; and therefore it was included as a potential retrofit for an established biorefinery plant. The current Irish silage harvesting practices may require adaptations for a biorefinery application more interested in crude protein production e.g. increasing the frequency of cutting would lead to a biomass feedstock with greater crude protein content, as it would be cut at a more vegetative stage. Keywords: Green biorefinery, grasslands, silage, energy, fibre, biomass
1 Introduction
Background of grassland as an important land use
1.1 Overview of grasslands
Grass covers about 3.4 billion ha, which is approximately 69% of the world’s agricultural area or 26% of total land area (2008). Grassland (e.g., rangeland, agricultural land, semi-natural grassland) biomes contribute significantly to global land use. The traditional use of grasslands has been as feed for animal production systems, particularly in Ireland where approximately 90% of the agricultural area (3.8 million ha) is devoted to grassland farming and animal production systems (O' Mara, 2008).

GBR scenarios
53
These production systems are facing many environmental and socio-economic pressures. The Common Agricultural Policy (CAP) reforms coupled with the Nitrates Directive (91/676/EEC) have led to declining livestock numbers and a potential surplus of (Connolly et al., 2009; Teagasc, 2009) grassland biomass. These negative pressures combined with a low family farm income, and the EU Biofuel Directive (2003/30/EEC) promoting a “biobased economy” has led farmers to begin investigating alternative uses of their grasslands (Irish Farmers Monthly, 2008). The production of biogas for energy or transport fuel (Lenehan, 2004; Murphy and Power, 2008; Nizami et al., 2009; Smyth et al., 2009) is one such use, another option for grasslands is producing feedstock for a “Green biorefinery” (GBR). 1.2 The Green biorefinery concept: technologies and potential products
GBR involves applying technology to chemically and physically fractionate (split) biomass such as grass and grass silage (Kiel, 1998) into two streams, press cake (the solid fibre fraction) and press juice (the liquid fraction). The press cake can be utilised for products such as insulation materials for building (Kromus et al., 2004). From the press juice proteins and amino acids can be extracted for applications such as animal feed or cosmetics. There is also great potential for extracting high value biochemicals such as lactic acid, which can be used as a building block for plastic production (polylactic acid (PLA)). After extracting the desired fractions from the biomass the residual grass/silage slurries or ‘stillage’ can then be fed into an anaerobic digester to produce biomethane gas, which is converted into electricity and heat (Grass, 2004). The technology used in a GBR depends upon several factors, including the desired end products, the required yield and quality, the stage of development and availability of the technology, the efficiency and cost of processing (Thang Vu et al., 2005). The technological advancements described in the literature, which have been made by the European countries interested in GBR has already been summarized (O' Keeffe et al., 2009). The down-streaming (purification) technologies such as electrodialysis, chromatography and ultrafiltration, required to produce high-value chemicals such as lactic acid (LA) from the grass juice streams, are still in medium stages of development (Kromus et al., 2004) and yet to be scaled up to industrial level. The more fundamental technologies – separation into press cake (fibre) and press juice for protein − have been successfully demonstrated (Grass, 2004; Wiedemann, 2008). A “Blueprint for an Irish GBR” has been proposed by O’Keeffe et al. (2009), based on a modified Swiss GBR model, producing insulation materials from the grass fibre fraction and from the grass juice fraction a proteinaceous product for animal feed.

Chapter 4
54
However, this blueprint has yet to be assessed for viability.
1.3 Focus of chapter
In order to develop a blueprint for a successful Irish GBR and to assess the proposed blueprint a number of key factors must first be analysed. These are: feedstock systems which are applicable to Irish agriculture; economies of scale; process technologies and energy balances. 1) Feedstock systems: O’Keeffe et al. (2009) summarised the various GBR feedstock models in operation in Europe, of which there are two main models: a) The Swiss GBR model described by Grass (2004), which was a grass/silage system, where grass was processed in the biorefinery for 4-5 months of the year and silage for the remainder of the year. The products this biorefinery produced included fibre for insulation material, protein feed for animals and electricity. b) The Austrian GBR, outlined by Kromus et al. (2004), proposed (grass) silage only as the best feedstock for GBR (Kromus et al., 2004; Mandel, 2003). 2) Economies of scale: The economies of scale of a biorefinery plant – defined by the throughput – determines: i) the size of the catchment area, ii) the investment required, and iii) the profitability of the system. On consultation with experts and from the literature, three economies of scale were considered to be potentially applicable in Ireland: 1) High volume, with a throughput of 5 t DM h-1 ( J. Sanders, unpublished), 2) (decentralised) medium volume, with a throughput of 0.8 t D h-1 (Grass, 2004), and 3) pilot scale - low volume, with a throughput of 0.2 t DM h-1 (Steinmüller, 2007). 3) Process technologies: Previous work by O’ Keeffe et al. (2009) suggests that the basic or cruder more established technologies, would be the most applicable to an Irish GBR system. The products of these GBRs include fibre for insulation material, protein to be used as animal feed and energy from the waste streams. Technologies for extracting higher value chemicals are advancing towards pilot scale levels (at time of writing). Therefore advanced technological extraction systems, to produce products such as lactic acid (LA), with down streaming technologies such as ultra filtration and bipolar electrodialysis (Kamm et al., 2009), should be considered as a potential future

GBR scenarios
55
scenario for an Irish GBR. 4) Energy balance: Biorefinery operations such as fiberising the green feedstock, drying the fibre and protein cake have a high energy demand. The dependency of biorefineries on combined heat and power plants (CHP) has been noted (Kamm et al., 2009; Popa-CTDA, 2005). In developing a blueprint for GBR the energy balance between supply and demand is critical in determining the economic viability of the system (Kamm et al., 2009). The aim of this chapter is to identify the characteristics of a first generation of GBR, using three, fully integrated technical and economic models, to generate nine scenarios, which are combinations of the key factors, Feedstock type, Economies of scale, Process technologies and Energy balance in order to: 1) Identify the most appropriate base case scenario for an Irish biorefinery blueprint, and; 2) Identify by means of a sensitivity analysis, factors which will be important determinants of the economic sustainability of this blueprint. 2 Development of the base models - materials and methods
The biorefinery process models, which were quantitative conservative mass and energy balances, were derived from the literature and consultation with various biorefinery experts. The models were combinations of different types of feedstocks and technologies and were defined as: 1) Low tech / grass and silage, 2) Low tech / silage, and 3) High tech / silage (also producing LA). Nine scenarios were then generated by altering the economies of scale (small, medium, large) for each of the three models. The energy balances were calculated for the biorefinery processes which had the greatest energy demands. For geometrical simplicity the biorefinery plant is assumed to be at the centre of a circle of radius x (Fig. 4.1), the size of circular catchment area was defined by the throughput of the biorefinery system (Overend, 1982).

Chapter 4
56
2.1 Feedstock variables
2.1 Feedstock variables
2.1.1 Feedstock type
The duration of operation (weeks) depends on biomass availability. Biomass processing was assumed to run for approximately 46 weeks, 6 weeks (late autumn/winter) will be needed for maintenance and repair of the system and annual holidays ( J. Sanders, unpublished). In Ireland pasture growth begins in February or
Fig. 4.1 Economies of scale assessed for feasibility. The biorefinery plants were
assumed to be at the centre of a circle of radius x, the size of circular catchment area
was defined by the throughput of the biorefinery system. Values in parenthesis refer to
results for the silage only feedstock system.

GBR scenarios
57
March depending on location and accelerates rapidly up to peak growth rates in May. Growth then declines gradually over the summer and autumn, sometimes with a second peak in August (O' Connell, 2005). The conventional harvesting practices for livestock systems have a two-cut silage system, the first cut at the end of the May-June period and the second cut at the end of the July-August period (O' Kiely et al., 2004). The harvesting of the green feedstock for the biorefinery scenarios follows these conventional trends, with approximately two thirds of the annual harvest taken in by the first cut and one third taken in by the second cut. The grass/silage biorefinery model processes fresh grass for approx. 12 weeks during the harvesting periods (Grass, 2004) (May – September) and silage for the rest of the year. The silage only system uses silage for the full year of production, with all the grass harvested being ensiled directly after cutting. The quality (proportion of desirable fractions) of both grass and silage feed stocks will vary depending on a combination of many factors, including geographical location, botanical composition, climate, and growth stage at time of harvesting (Buxton, 1996; Van Soest et al., 1978). However, for the models presented here it was assumed that the grass feedstock came from a “typical silage” field (L. perenne dominated) under long term grassland, with a sward age of 7-10 years, on a loamy soil with moderate drainage and managed by a cutting system. The average annual grass/silage qualities used in the model are outlined in Table 4.1. The dry matter yields were estimated at 10.2 t DM ha-1 a-1 using the NCYCLE Ireland model (for full description see del Prado et al. (2006)). 2.1.2 Transport of harvested feedstock – catchment area calculations
The amount of annual biomass required for each scale of biorefinery was calculated from the throughput volume. The catchment area (Fig. 4.1) for each of the biorefineries was calculated using equation (i) where Q (t DM a-1) is the feedstock quantity required for the 46 weeks of biorefinery operation. As grasslands occupy approx. 90% of agricultural area in Ireland an optimal availability factor, a, of 0.9 was assumed, for the smaller scale and medium biorefineries. However, as the larger scaled operations would require a substantially larger area, the probability of inclusion of non-grassland farm areas (i.e. arable land, forestry, peat land) and urban areas increases (EPA, 2008a). Therefore, grass availability was assumed to be 0.55 (as pasture occupies approx. 55% of Irelands’ overall land area). Y (t DM ha-1a-1) was the average grass yields (10.2 t DM ha-1a-1).

Chapter 4
58
The correction factor, c, was included in both models to account for dry matter losses in the supply chain, from field to ensiling within GBR facility, in order to allow for processing to be carried out for the full year of operation (46 weeks). Areas where losses were accounted for included transport to the biorefinery (3%), for the grass/silage system potential losses were assumed to be approximately 1-2% (Pizarro and James, 1972), accounting for respiration losses due to potential delays in processing. In the silage-only system losses due to the ensiling process (10%), and feed out losses (7.5%) were taken into account. In the grass/silage system, c was determined to be 0.2. In the silage only system all the grass harvested was ensiled and as a result a greater correction factor was required to account for the greater losses (through effluent released during ensiling) (Gordon, 1967; Holmes and Muck, 2000) in comparison to the grass (Fig.4.1), so the c value was set to 0.25
Eqn 1 The radius, x, was determined using the area, A, calculated from Eqn 1. . The average haul distance (
___
X) between the biorefinery plant at the centre of a circle radius of silage fields was calculated using the formula outlined by (Overend, 1982) (Eqn 2). The tortuosity factor (τ) was taken into account; defined as the ratio of actual distance travelled to line of sight distance = r (assuming a 'pie slice') this factor is a function of the terrain. It can range from 1.27 for a rectangular road grid superimposed over a flat terrain or to in excess of 3 for a complex or hilly terrain constrained geographically. The tortuosity value taken here (τ = 1.33) was assumed to be similar to that taken by Walla and Schneeberger (2005). Eqn 2
2.1.3 Grass feedstock storage - Ensiling process
In the grass/silage system it was assumed that the fresh grass will be processed within 1-3 days of harvesting, it was also assumed to be preserved in a series of pre-washing troughs, containing a weak acid solution (mostly water) until processing (Ketelaars and Rutgers, 2002). There is a great diversity in how silage is made and stored in Ireland, given the wide variation in conditions on farms (e.g., soil, geographic location,
τxX3
2__
=
aY
QQcA
+=
πA
x=

GBR scenarios
59
management). The same scale of diversity is also seen in the chemical compositions of silages (O' Kiely et al., 1993).
Table 4.1. Feedstock parameters modelled in Green Biorefinery Scenarios Fraction
Range (g kg-1 DM)
Value taken (g kg-1 DM)
Source
Grass
DM1 160-200 200 (Haigh, 1998; Holliday et al., 2005; Hopkins, 2000; Mc Eniry et al., 2007; Smyth et al., 2009)
Fibre2 500-600 550 (Haigh, 1998; Hopkins, 2000; Mc Eniry et al., 2007; Neureiter et al., 2004)
Ash 80-120 100 (Hopkins, 2000; Sanders, 2005)
CP3 150-20 1683 (Haigh, 1998; Hopkins, 2000; Keady and O'Kiely, 1996; Ketelaars and Rutgers, 2002; Patterson and Walker, 1979)
ODM4 80-270 182 (Halasz et al., 2005; Ketelaars and Rutgers, 2002)
Silage
DM1 16-30 220 (Haigh, 1998; Keady and O'Kiely, 1996; O' Kiely et al., 1993)
Fibre2 50-60 500 (Haigh, 1999; Nizami et al., 2009)
Ash 70-120 100 (Keady and O'Kiely, 1996; Haigh, 1998, 1999)
CP3 120-150 150 (Haigh, 1998, 1999; Nizami et al., 2009)
LA 70-110 70 (Haigh, 1998, 1999; Nizami et al., 2009)
ODM4 20-240 120 (Keady and O'Kiely, 1996; Haigh, 1998; Nizami et al., 2009)
1. DM units are g kg-1 Fresh Matter 2. Fibre = NDF (Neutral Detergent Fibre) fraction. 3. CP (Crude protein) = Nitrogen value taken from NCYCLE Ireland (CP= N × 6.25) (del Prado et al.,
2006). 4. ODM (Organic Dry Mater) = a term to group compounds such as water soluble components e.g.
sugars, VFA (butyric acid, acetic acid, propionic acid), as well as insoluble components fats, oils and smaller fibre fractions.
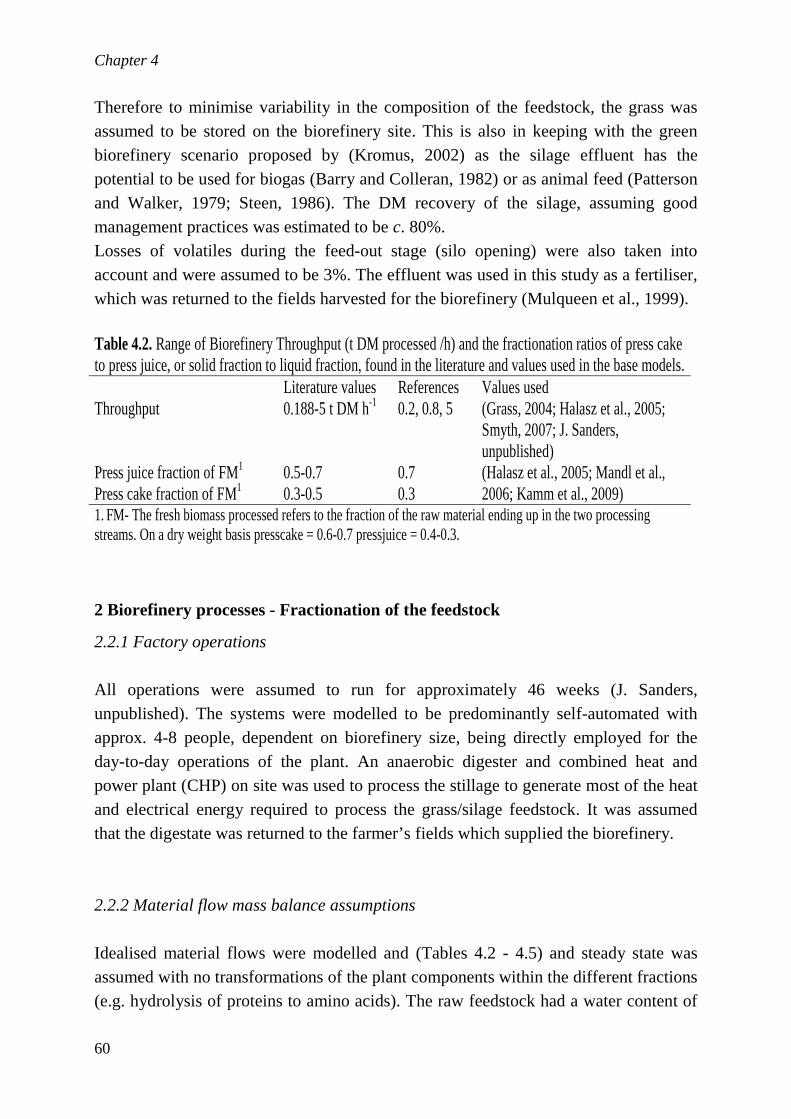
Chapter 4
60
Therefore to minimise variability in the composition of the feedstock, the grass was assumed to be stored on the biorefinery site. This is also in keeping with the green biorefinery scenario proposed by (Kromus, 2002) as the silage effluent has the potential to be used for biogas (Barry and Colleran, 1982) or as animal feed (Patterson and Walker, 1979; Steen, 1986). The DM recovery of the silage, assuming good management practices was estimated to be c. 80%. Losses of volatiles during the feed-out stage (silo opening) were also taken into account and were assumed to be 3%. The effluent was used in this study as a fertiliser, which was returned to the fields harvested for the biorefinery (Mulqueen et al., 1999). 2 Biorefinery processes - Fractionation of the feedstock
2.2.1 Factory operations
All operations were assumed to run for approximately 46 weeks (J. Sanders, unpublished). The systems were modelled to be predominantly self-automated with approx. 4-8 people, dependent on biorefinery size, being directly employed for the day-to-day operations of the plant. An anaerobic digester and combined heat and power plant (CHP) on site was used to process the stillage to generate most of the heat and electrical energy required to process the grass/silage feedstock. It was assumed that the digestate was returned to the farmer’s fields which supplied the biorefinery. 2.2.2 Material flow mass balance assumptions
Idealised material flows were modelled and (Tables 4.2 - 4.5) and steady state was assumed with no transformations of the plant components within the different fractions (e.g. hydrolysis of proteins to amino acids). The raw feedstock had a water content of
Table 4.2. Range of Biorefinery Throughput (t DM processed /h) and the fractionation ratios of press cake to press juice, or solid fraction to liquid fraction, found in the literature and values used in the base models. Literature values References Values used Throughput 0.188-5 t DM h-1 0.2, 0.8, 5 (Grass, 2004; Halasz et al., 2005;
Smyth, 2007; J. Sanders, unpublished)
Press juice fraction of FM1 Press cake fraction of FM1
0.5-0.7 0.3-0.5
0.7 0.3
(Halasz et al., 2005; Mandl et al., 2006; Kamm et al., 2009)
1. FM- The fresh biomass processed refers to the fraction of the raw material ending up in the two processing streams. On a dry weight basis presscake = 0.6-0.7 pressjuice = 0.4-0.3.

GBR scenarios
61
approx. 80%. In order to reduce overheating of the fiberising plates additional water was added to the system (Hansen and Grass, 1999) in the ratio 0.55:1 (grass: water) (Keijsers, 2003). Fig. 4.2 Mass and energy flow diagram of the green biorefinery model

Chapter 4
62
Table 4.3. Material flows – mass balance of the biorefinery fractionation process. The chemical constituents of the various fractionation steps are presented as the % DM of the associated fraction, i.e. press cake or press juice, unless otherwise stated. Process step
Fraction constituents
Ranges (% DM)
References
Values taken (% DM)
Press cake composition (after 2nd pressing -before drying)
DM 28-48 (Favati et al., 1989; Hansen and Grass, 1999; Ketelaars and Rutgers, 2002; Keijsers, 2003; Hulst et al., 2004; Halasz et al., 2005)
42
Fibre
42-90 (70-99)1
(Favati et al., 1989; Hansen and Grass, 1999; Ketelaars and Rutgers, 2002; Keijsers, 2003; Watcher et al., 2003; Hulst et al., 2004; Halasz et al., 2005)
80
Protein content
5-29 (Ricci et al., 1989b; Hansen and Grass, 1999; Ketelaars and Rutgers, 2002; Keijsers, 2003)
11
Ash in press cake
2.5-6 (Favati . et al., 1989; Hansen and Grass, 1999; Keijsers, 2003)
6
Lactic acid 3 2-3 (Halasz et al., 2005) 2
Press juice composition (before washing)
DM 3.6-32 (Favati et al., 1989; Hansen and Grass, 1999; Ketelaars and Rutgers, 2002; Keijsers, 2003; Hulst et al., 2004; Halasz et al., 2005)
6
Fibre content
1-12 (Favati . et al., 1989; Hansen and Grass, 1999; Keijsers, 2003)
10
Protein 19.4-38.3
(Favati et al., 1989; Hansen and Grass, 1999; Ketelaars and Rutgers, 2002; Keijsers, 2003; Hulst et al., 2004; Halasz et al., 2005)
31
Ash content on a DM basis
14-20 (Favati et al., 1989; Hansen and Grass, 1999; Keijsers, 2003)
19
Rest fraction in juice 4
7.36-78 (Hansen and Grass, 1999; Keijsers, 2003; Halasz et al., 2005)
25

GBR scenarios
63
The composition of the material being fiberised consisted of approximately 14% DM and 86% water. Water was circulated within the various processes in order to meet the plant’s water demands and optimise the system’s mass balance (Fig. 4.2). After a double pressing and washing the press cake was assumed to have a dry matter content of 42% (Table 4.3), before drying and processing into technical fibres for insulation material. After a double pressing and washing the press cake was assumed to have a dry matter content of 42% (Table 4.3), before drying and processing into technical fibres for insulation material.
Table 4.3. (Continued) Material flows – mass balance of the biorefinery fractionation process. The chemical constituents of the various fractionation steps are presented as the % DM of the associated fraction, i.e. press cake or press juice, unless otherwise stated Process step
Fraction constituents
Ranges (% DM)
References
Values taken (% DM)
Press juice silage
LA 2
extraction
2.53-24 (45-90)1
(Danner et al., 2000; Halasz et al., 2005; Thang Vu Hong et al., 2005; Steinmüller, 2007)
16 (70)1
Products
Protein cake (pre drying)
DM 23-29 (Ketelaars and Rutgers, 2002) 27
CP 18-80 (28-96)1
(Hulst et al., 2004; Kamm et al., 2009)
66-67 (28-32)1
Fibre 7-13 (Ketelaars and Rutgers, 2002) 12 Ash 7-17 (Ketelaars and Rutgers, 2002) 12 ODM3 2-10 (Ketelaars and Rutgers, 2002;
Grass, 2004) 9
LA (in
silage) 0.0045 (Halasz et al., 2005) 0.004
1. Extraction efficiencies are in parenthesis. 2. Lactic acid refers to the composition of the presscake from the silage feedstock system 3. Rest fraction and ODM (organic dry matter) is a term to group compounds such as water soluble
components e.g. sugars, VFA (butyric acid, acetic acid, propionic acid), as well as insoluble components fats, oils and smaller fibber fractions, the additional mass fractions which are modelled as sum components.

Chapter 4
64
It was estimated that approximately 8-10% of the fibrous material (finer fibres) was assumed to be lost to the juice stream during the washing step (Table 4.3). The press juice was assumed to have a dry matter content of 7%, with approximately 35% of the original biomass dry matter ending up in the final press juice (contains press cake washings) (Table 4.3). The protein content was estimated to be c 31% of the juice dry matter.
Table 4.4. Parameters assumed for anaerobic digester and CHP (combined heat and power plant) and on site energy generation derived from the literature and consultation with bioenergy experts Decanted juice – biogas feedstock
Range
Source
Value taken
Fraction of original DM
12.5-44 (Favati et al., 1989; Hansen and Grass., 1999; Kamm et al., 2009)
26%
DM 2-22.8 (Favati et al., 1989; Hansen and Grass, 1999; Ketelaars and Rutgers, 2002; Keijsers, 2003; Baier and Delavy, 2005)
6%
VS1 72-89 (Baier and Delavy, 2005)
79-81% (grass/silage- silage)
Biogas
VS Rate of destruction
60% (Nizami et al., 2009; Smyth et al., 2009)
60%
Biogas (m3)/VS 0.89 m3/kg VS
(Nizami et al., 2009; Smyth et al., 2009)
0.89 m3/kg VS
CHP efficiencies >90 % (Al Seadi et al., 2008)
85%
Boiler efficiency 85% (Smyth et al., 2009) 85%
Heat loss of digester
15% (Smyth et al., 2009) 15%
Electrical efficiencies
30-43% (Braun, 2007; Knitter, 2009)
40%
Thermal efficiencies
25-50% (Knitter, 2009) 45%
1. VS = represents the organic matter in the sample (minus ash), that is readily used during anaerobic digestion
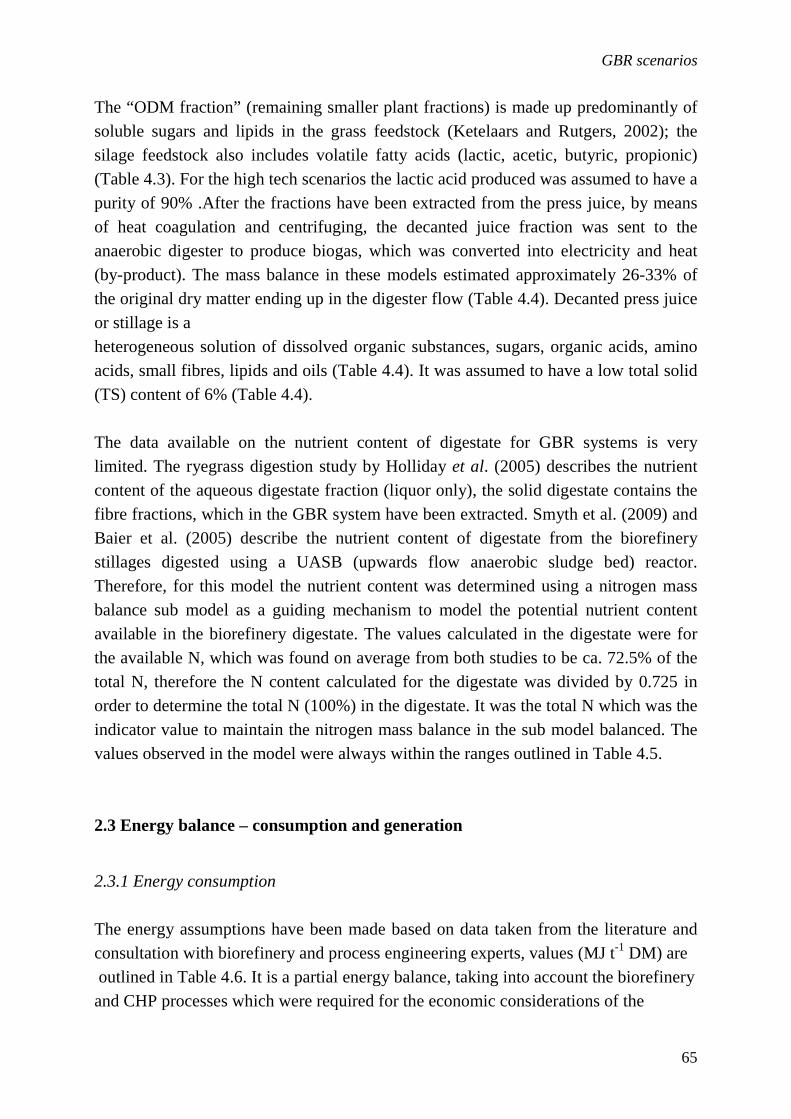
GBR scenarios
65
The “ODM fraction” (remaining smaller plant fractions) is made up predominantly of soluble sugars and lipids in the grass feedstock (Ketelaars and Rutgers, 2002); the silage feedstock also includes volatile fatty acids (lactic, acetic, butyric, propionic) (Table 4.3). For the high tech scenarios the lactic acid produced was assumed to have a purity of 90% .After the fractions have been extracted from the press juice, by means of heat coagulation and centrifuging, the decanted juice fraction was sent to the anaerobic digester to produce biogas, which was converted into electricity and heat (by-product). The mass balance in these models estimated approximately 26-33% of the original dry matter ending up in the digester flow (Table 4.4). Decanted press juice or stillage is a heterogeneous solution of dissolved organic substances, sugars, organic acids, amino acids, small fibres, lipids and oils (Table 4.4). It was assumed to have a low total solid (TS) content of 6% (Table 4.4). The data available on the nutrient content of digestate for GBR systems is very limited. The ryegrass digestion study by Holliday et al. (2005) describes the nutrient content of the aqueous digestate fraction (liquor only), the solid digestate contains the fibre fractions, which in the GBR system have been extracted. Smyth et al. (2009) and Baier et al. (2005) describe the nutrient content of digestate from the biorefinery stillages digested using a UASB (upwards flow anaerobic sludge bed) reactor. Therefore, for this model the nutrient content was determined using a nitrogen mass balance sub model as a guiding mechanism to model the potential nutrient content available in the biorefinery digestate. The values calculated in the digestate were for the available N, which was found on average from both studies to be ca. 72.5% of the total N, therefore the N content calculated for the digestate was divided by 0.725 in order to determine the total N (100%) in the digestate. It was the total N which was the indicator value to maintain the nitrogen mass balance in the sub model balanced. The values observed in the model were always within the ranges outlined in Table 4.5. 2.3 Energy balance – consumption and generation
2.3.1 Energy consumption
The energy assumptions have been made based on data taken from the literature and consultation with biorefinery and process engineering experts, values (MJ t-1 DM) are outlined in Table 4.6. It is a partial energy balance, taking into account the biorefinery and CHP processes which were required for the economic considerations of the

Chapter 4
66
Table 4.5. Potential fertiliser composition of digestate and silage effluent and fertiliser quality of combined waste streams
Range
Source
Value taken
Digestate
DM 2.5-6% (Holliday et al., 2005; Smyth et al., 2009)
3
N (kgm-3)1 0.76-2.63 (Baier and Delavy, 2005; Holliday et al., 2005)2
0.9 -1.652
P (kgm-3) 0.19 (Baier and Delavy, 2005; Holliday et al., 2005) 2
0.19
K (kgm-3) 3.08 (Baier and Delavy, 2005; Holliday et al., 2005) 2
3.08
Silage effluent
DM losses of original material
2-14 % (Gordon, 1967; Steen, 1986 ; Haigh, 1999)
10%
Effluent produced in L per t ensiled
80–290 L t-1 ensiled
(Jones and Jones, 1995) 182 L
DM content in effluent 5-20% (Deans and Svoboda1992 )(Patterson and Walker, 1979; Galanos et al., 1995) (Barry and Colleran, 1982) (Haigh, 1998)
11%
pH 4.1-4.5 (Deans and. Svoboda 1992 ) (Galanos et al., 1995) (Barry and Colleran, 1982)
N N total 2-3gL-1of effluent (ammonia-4% of total N)
(Deans and. Svoboda, 1992 ) (Galanos E. et al., 1995) (Haigh, 1998) (Steen, 1986 ) (Binne and Frost 1995)
2.6 gL-1
P
0.5-0.6 gL-1
(Mulqueen et al., 1999) (Binne and Frost 1995)
0.55 gL-1
K
3-6 gL-1
(Mulqueen et al., 1999) (Binne and Frost 1995)
5.0 gL-1
Assumed composition of combined slurries
DM 4-5% From models N 0.77-0.88 gL-1
(1.38-1.6 gL-1)3 From models
P 0.24-0.28 gL-1
(0.24-0.26 gL-1)3 From models
K 3.38-3.55 gL-1 (3.33-3.46 gL-1)3
From models
1. Plant available N 2. Range of N values produced by the models, to maintain the nitrogen mass balance in the sub model
balanced for the different scenarios modelled 3. Values in parenthesis refer to the scenarios without protein extraction; the variation in values is due
to the varying volumes of digestate being produced in each scenario.

GBR scenarios
67
biorefinery scenarios. Minor operational energies, such as computers, lights, etc. have not been taken into account. It is a partial energy balance, taking into account the biorefinery and CHP processes which were required for the economic considerations of the biorefinery scenarios.
2.3.2 Energy generation
It was assumed that the decanted juice (stillage) remaining from the biorefinery system was sent to the CHP to produce biogas. The dry matter content of the stillage has been reported to range from 12.5% of the original DM content (Favati et al., 1989) to approximately 44% of the original material (Hansen and Grass, 1999; Kamm et al., 2009). The mass balances of the GBR models were as follows: 22% (high tech) - 27 % (grass/silage and silage only) of the original material ending up in the digester flow (Table 4.4), depending on the system modelled. Readily available data on biogas production and energy balances from biorefinery wastes or stillages is also limited, therefore the assumptions for the CHP plant processing the biorefinery wastes or stillages were taken from the model outlined by Smyth et al. (2009), with some modifications. Biogas was produced using a continuous stirred tank reactor (CSTR) system, operating at a DS (dry solid) content <10%. There were two digestion stages in the process, with two tanks working in series. The total retention time for the digester was assumed to be between 70 and 80 days, with an operating temperature of 38 °C (mesophilic), with the substrate (stillage) spending approximately half of the time in each tank. The stillage streams remaining from the biorefinery processes were fed into the first tank everyday, e.g., for the medium scale model, 3.93- 4.41 t VDS day-1, silage only and grass/silage respectively, was supplied to the digester at a loading rate of 1.44 kg VDS (m3 day-1). For a full description of the reactor set up we refer to Smyth et al. (2009) and Nizami et al. (2009). Modifications were made in relation to the volatile solid content of the feedstock. Smyth et al. (2009) determined that the grass silage feedstock had a VDS content of approx. 90%, however the stillage coming from a biorefinery will not have the fibrous fraction and only some of the crude protein remaining and therefore the quantity of VDS in the biorefinery stillage will be relatively lower. There was very little data on the differences between the two feedstocks or the effects these changes in substrate composition would have on biogas production from a CSTR. For this model the mass

Chapter 4
68
Table 4.6. Process energy for the biorefinery plant Process
Source
Energy MJt-1 DM
Pre-treatment and pressing Receiving and feeding (Ricci et al., 1989a) 2.16
Feeding of grass from bunkers (Smyth et al., 2009) 2.51
Water addition for cleaning (pumping) (Smyth et al., 2009) 2.51
Pressing and chopping (Keijsers, 2003; J. Sanders, unpublished)
540
Drying
(Hansen and Grass, 1999; Keijsers, 2003; J. Sanders, unpublished)
23002 (2300-2382)
Protein extraction
Steam coagulation (Keijsers, 2003; Kamm et al., 2009)
270 (126-270)3
Skimming (Kamm et al., 2009) 4.73
Centrifuging (Kamm et al., 2009) 12.28
Decanting (J. Sanders, unpublished) 3.70
Downstream technologies Ultrafiltration (Kamm et al., 2009) 17.464 Bipolar electrodialysis (Kamm et al., 2009) 118.84 Distillation (Kamm et al., 2009) 4.754 Biogas energy Feeding of stillage to digesters (Ricci et al., 1989a) 2.51 Specific heat capacity of water (Smyth et al., 2009) 4.185 Scrubbing of biomethane (Smyth et al., 2009) 1.26 1. Tonne of fresh weight 2. Per tonne of H2O evaporated – (MJ t-1 H2O removed) latent heat of water, range of values
in parenthesis 3. Ranges from the literature in parenthesis 4. The values here refer to a liquid feed going through the ultra filtration unit(s) (DM = 1%) 5. The specific heat capacity of water (MJt-1 °C) – in this case a 28°C rise in temperature was
required for the digester contents (stillage wastes from GBR facility)
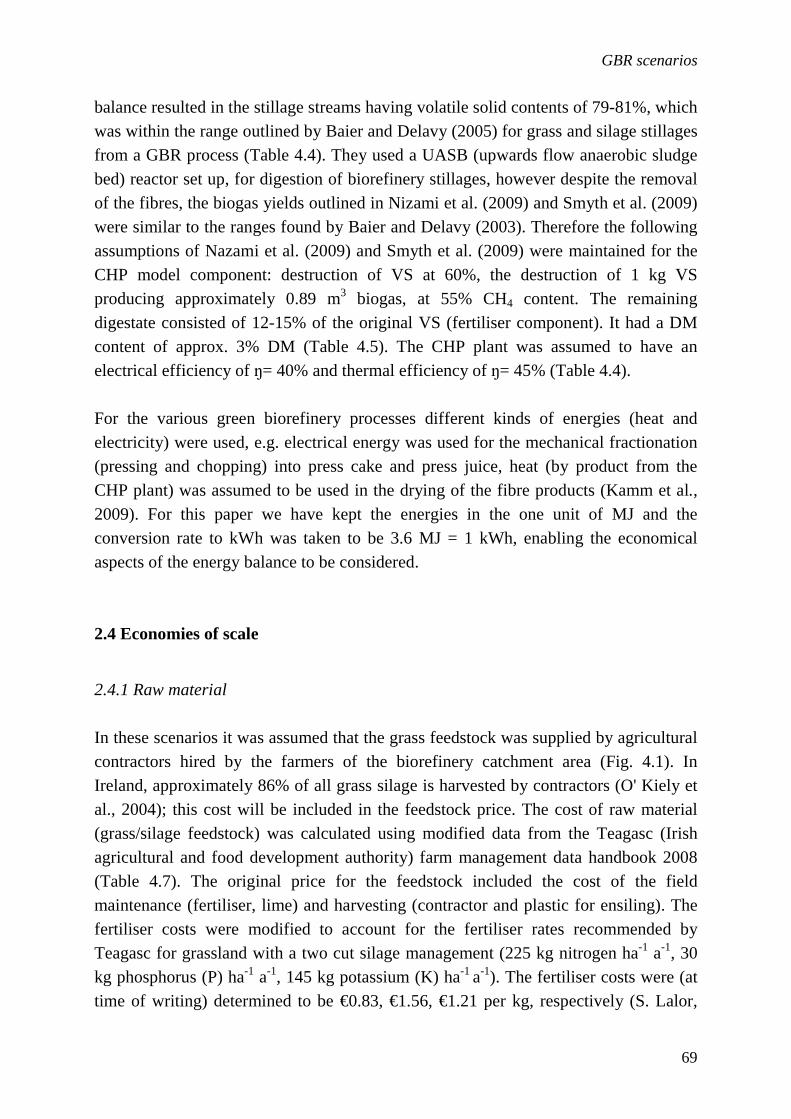
GBR scenarios
69
balance resulted in the stillage streams having volatile solid contents of 79-81%, which was within the range outlined by Baier and Delavy (2005) for grass and silage stillages from a GBR process (Table 4.4). They used a UASB (upwards flow anaerobic sludge bed) reactor set up, for digestion of biorefinery stillages, however despite the removal of the fibres, the biogas yields outlined in Nizami et al. (2009) and Smyth et al. (2009) were similar to the ranges found by Baier and Delavy (2003). Therefore the following assumptions of Nazami et al. (2009) and Smyth et al. (2009) were maintained for the CHP model component: destruction of VS at 60%, the destruction of 1 kg VS producing approximately 0.89 m3 biogas, at 55% CH4 content. The remaining digestate consisted of 12-15% of the original VS (fertiliser component). It had a DM content of approx. 3% DM (Table 4.5). The CHP plant was assumed to have an electrical efficiency of ŋ= 40% and thermal efficiency of ŋ= 45% (Table 4.4). For the various green biorefinery processes different kinds of energies (heat and electricity) were used, e.g. electrical energy was used for the mechanical fractionation (pressing and chopping) into press cake and press juice, heat (by product from the CHP plant) was assumed to be used in the drying of the fibre products (Kamm et al., 2009). For this paper we have kept the energies in the one unit of MJ and the conversion rate to kWh was taken to be 3.6 MJ = 1 kWh, enabling the economical aspects of the energy balance to be considered. 2.4 Economies of scale
2.4.1 Raw material
In these scenarios it was assumed that the grass feedstock was supplied by agricultural contractors hired by the farmers of the biorefinery catchment area (Fig. 4.1). In Ireland, approximately 86% of all grass silage is harvested by contractors (O' Kiely et al., 2004); this cost will be included in the feedstock price. The cost of raw material (grass/silage feedstock) was calculated using modified data from the Teagasc (Irish agricultural and food development authority) farm management data handbook 2008 (Table 4.7). The original price for the feedstock included the cost of the field maintenance (fertiliser, lime) and harvesting (contractor and plastic for ensiling). The fertiliser costs were modified to account for the fertiliser rates recommended by Teagasc for grassland with a two cut silage management (225 kg nitrogen ha-1 a-1, 30 kg phosphorus (P) ha-1 a-1, 145 kg potassium (K) ha-1 a-1). The fertiliser costs were (at time of writing) determined to be €0.83, €1.56, €1.21 per kg, respectively (S. Lalor,

Chapter 4
70
pers. comm.). The price for the harvested biomass was modified further to account for the nutrient replacement value of the returned slurry comprising of the biorefinery digestate and silage effluent (Table 4.5). The cost of the green biomass was then calculated using only the cost of the fertiliser deficit, which was required to meet the recommended fertilisation rates outlined by Teagasc. The savings arising from the recycling of the digestate and subsequent reduction in chemical fertilisers were assumed to be transferred onto the biorefinery through reduced feedstock prices (Table 4.7). There was also an additional operation cost for additives to preserve fresh grass for 1-3 days storage prior to processing in the grass/silage models.
2.4.2 Transport costs
Transport costs were calculated for both the transport of grass and slurry returned. Transport costs were estimated per tonne of grass harvested following consultation with silage experts and contractors. Transport costs were assumed to be included in the contractor price outlined in Table 4.7, provided the average haul distance travelled to the silos remained under 2 km; for each additional km outside this zone a transport cost was applied. It was assumed that when the average distance (
___
X ) to the biorefinery exceeded 2 km, the additional transport costs were calculated according to Eqn 3 outlined in Walla and Schneeberger (2005). The analysis assumed two tractor trailers for the small /medium scale and four for the large scale (S. Lalor, pers comm.). Total transport costs for herbage (T) comprised of unloading (L) costs €1.07 (€2.14 for large scale) t-1 DM silage, distance dependent costs (d) per tonne of dry matter (double the average field distance, given travelled to and from the plant), €2.13 t-1, multiplied by the quantity of forage required by each economy of scale (t DM a-1):
T = Q (L+2(___
X -2) d) Eqn 3 The transport costs for the slurry of digestate and effluent were assumed to be paid for by the biorefinery, as part of a “waste management strategy”. The mixture of silage effluent and digestate was assumed to have similar spreading requirements to that of slurry (Table 4.5) and costings were estimated on this basis (S. Lalor, pers. comm.). Transport costs for the slurry did not take the 2 km “free” zone into consideration and

GBR scenarios
71
Table 4.7. Estimated costs of raw material - grass/silage production from Teagasc (Irish Agricultural and Food Development Authority) 2008 modified costs generated from the medium model output.
1st cut silage € ha-1
2nd cut silage € ha-1
Prices quoted by Teagasc Roads and fencing 43 34 Reseeding 20 16 Fertiliser 1 280.1 141 Lime 20 16
Plastic 15 (0)3
12 (0)3
Contractor € ha-1 247 227
€ ha-1 (Teagasc estimate)2 625 (610)3
446 (434)3
Modified prices used in model Cost of fertiliser deficits after digestate application Fertiliser costs after returned slurry4 (grass/silage) – Fresh grass
133 (92)5
89 (68)5
Fertiliser costs after returned slurry4 (silage/low-tech) 128 (94)
86 (69)
Fertiliser costs after returned slurry4 (silage/high-tech) 149 (110)
94 (74)
6Total costs used for estimating biomass price Total cost of biomass€ha-1 (grass/silage) – grass processed fresh
464 (422)
382 (361)
Total cost of biomass € ha-1 (grass/silage) – grass ensiled7 478 (437)
394 (373)
Total cost of biomass € ha-1(silage/low tech) 473 (439)
391 (374)
Total cost of biomass € ha-1 (silage/high tech) 494 (455)
399 (379)
Yields used in model7 tonnes/DM ha (NCYCLE Annual yields = 10.2 t DM) 6.7 3.5 1. These values based on the recommended fertiliser rates for a two cut grass/silage system
(225 kg N ha-1 a-1, 30 P kg ha-1 a-1 145 K kg ha-1 a-1). Fertiliser costs were at time of writing determined to be €0.83, €1.56, €1.21 (Lalor, 2010).
2. The values are modified due to the change of fertiliser costs described in foot note 1. 3. It was assumed that the only difference between the grass harvested and the grass ensiled was the cost of the
plastic. Values in parenthesis refer to the costs for the grass processed fresh. 4. Slurry refers to the combined slurry of the digestate and silage effluent which is returned back to the farmer. 5. Values in parenthesis for modified prices in model, refer to the estimated prices for the non protein
scenarios. 6. Total costs = Σ (Roads & Fencing + Reseeding + Fertiliser costs after returned slurry + Lime + contractor +
Plastic for the silage system, it was assumed the contractor would also ensile on site ), calculated per ha. 7. Yields predicted from NCYCLE model, the annual yields were estimated to be proportioned into 2/3 for 1st
cut and 1/3 for 2nd cut. *No land charge has been included.
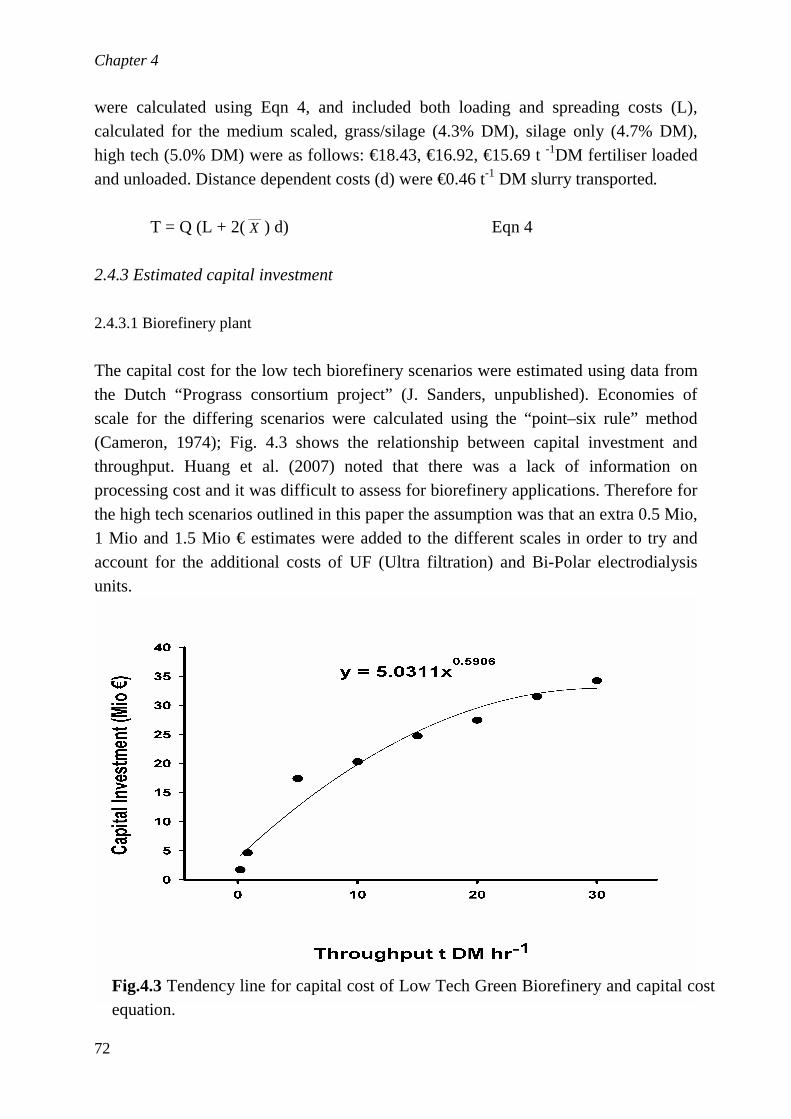
Chapter 4
72
were calculated using Eqn 4, and included both loading and spreading costs (L), calculated for the medium scaled, grass/silage (4.3% DM), silage only (4.7% DM), high tech (5.0% DM) were as follows: €18.43, €16.92, €15.69 t -1DM fertiliser loaded and unloaded. Distance dependent costs (d) were €0.46 t-1 DM slurry transported.
T = Q (L + 2(___
X ) d) Eqn 4 2.4.3 Estimated capital investment
2.4.3.1 Biorefinery plant
The capital cost for the low tech biorefinery scenarios were estimated using data from the Dutch “Prograss consortium project” (J. Sanders, unpublished). Economies of scale for the differing scenarios were calculated using the “point–six rule” method (Cameron, 1974); Fig. 4.3 shows the relationship between capital investment and throughput. Huang et al. (2007) noted that there was a lack of information on processing cost and it was difficult to assess for biorefinery applications. Therefore for the high tech scenarios outlined in this paper the assumption was that an extra 0.5 Mio, 1 Mio and 1.5 Mio € estimates were added to the different scales in order to try and account for the additional costs of UF (Ultra filtration) and Bi-Polar electrodialysis units.
Fig.4.3 Tendency line for capital cost of Low Tech Green Biorefinery and capital cost equation.

GBR scenarios
73
2.4.3.2 The capital cost of a CHP plant
It was assumed that specifications of an anaerobic digester and CHP plant designed for a slurry feedstock would be comparable (to an extent) with the requirements for digesting stillages from a biorefinery, as both influent streams had a DM content less than 10%. Therefore the capital cost for CHP plants designed for a slurry feedstock were calculated using the capital cost equation (y = 6.6892x0.5863) outlined by Poliafiaco and Murphy (2007). This equation was derived from various Danish CHP plants. Capital cost (y) was estimated as a function of (x) annual biomass digested in cubic meters (m3 a-1) in the CHP plants. The total capital costs for the biorefinery scenarios included the capital investments for the Green biorefinery plant, plus the additional costs of the CHP plants. The loan repayment for the total capital investment was assumed to be 7%, to be paid over 10 years; depreciation was calculated using the straight line method over the same period. Indirect capital costs (approx. 10% of capital investment) are also included in the model and refer to the expense of research, engineering and developmental costs. 2.4.4 Operating costs
Operational costs for the CHP were assumed to be 10% of the capital investment made (Keijsers, 2009; J. Sanders, unpublished; Smyth, 2007). Operational costs for the biorefinery were estimated at 3% of the initial investment capital. The cost for utilities includes the electricity deficit bought in and the water required for the processing of the grass. The cost of water supply in Ireland is dependent on the location of the plant and what local government jurisdiction it falls under. For this analysis, the water costs from several local authorities were averaged and used to estimated water supply to the plant at 1.40 € m-3 (Department for the Environment Heritage and Local Government, 2009). Storage costs were also included and were estimated to be approx. € 10 t-1 DM month-1 for the protein product and € 2.77 t-1 DM month-1 for the shed storage of the fibre products (Styles et al., 2008). Cost of purchasing electricity is dependent on annual usage. Electrical prices were determined by the industrial end user estimations reported in “Understanding Electricity
& Gas Prices in Ireland” (SEI, 2008). The larger and medium biorefinery scenarios were in the category band with a cost of 0.11 € kWh-1 purchased and the smaller biorefinery scenarios with a lower energy demand were within the category of 0.12 € kWh-1

Chapter 4
74
purchased. The assumption was made that the CHP plant covered its own energy costs (i.e. heating of digester and circulation of substrate) and contributed significantly to cover the costs associated with the high energy demands of refining the grass/silage feedstocks. It was assumed that, as the water and material flows were being re-circulated, no waste streams were produced, other than the digestate from the biogas plant and the silage effluent, which were land spread as a fertiliser as outlined above. Sales costs were also calculated at 3% of the initial investment capital (Ketelaars and Rutgers, 2002). Labour costs were calculated (min. industrial wage €575/week) (Central statistic office, 2009) for each economy of scale. In the large, medium and small scale, it was assumed that approximately 8, 6, 4 people were estimated to be directly employed respectively, with a minimum of 2-3 people assumed per 12 hour shift. 2.4.5 Revenue assumptions
The fibre insulation material was assumed to be of the same specifications as outlined by Grass (2004), with approx. 60 kg m-3 density and a heat conductivity of 0.04 W m-1 K-1 (Watts per meter Kelvin) comparable to the average mineral wool insulation on the market. The revenue generated from the fibre insulation material was estimated based on the literature and from consultation with members of the insulation industry. The selling prices ex factory were estimated between 0.80 - 1.20 € kg-1 (Grass, 2004). The cost of the protein as an additive for animal feed products was obtained from the CSO (Central statistic office et al., 2008) data relating to the amount of comparable protein feed additives (alfalfa pellets, soya derivatives) purchased in Ireland between 2004 and 2008. It was calculated to be € 271.95 t-1 of protein additive. For the high tech production as assumed in the literature, the purity of the lactic acid product was at 90% - with a higher energy demand (Kamm et al., 2009). The price for the Lactic acid product was estimated to be valued at € 300 t-1, after consultation with the biorefinery experts (Food Navigator, 2005).
2.4.6 The profitability indicators
Net present value (NPV) Eqn 5, was used as a measurement of cash flow (CF) in the GBR system and as a financial indicator of viability. NPV was calculated using Eqn 4, with the Net Cash Flow (CF) calculated as profit after tax + depreciation. The time period of investment was estimated to be 10 years with time zero equal the first year of start up, with time 10 corresponding to the final year in the 10-year period. For the

GBR scenarios
75
GBR model, the (NPV) was calculated over a 10-year period. The discount rates for biomass to bioenergy systems range in the literature from 4-20%. Studies in Ireland have used ir values of 5% for Miscanthus bioenergy systems (Clancy et al., 2008; Styles et al., 2008) and 8% for anaerobic digestion of slurries (Poliafiaco and Murphy, 2007). However in a previous study for GBR feasibility, an ir value of 12% was estimated (consultation with industry experts), as GBR is relatively more advanced biomass system then bioenergy or anaerobic digestion, a higher risk factor for the invested capital was decided upon, but still within the literature ranges. Therefore, a discount rate (risk factor) (ir ) of 10% (Gebrezgabhera et al., 2010). A positive NPV indicates a potentially positive cash flow (profit) for the period in question and would suggest that the project has economic potential. A negative NPV indicates the project to be unviable and needs to be modified in order to have potential. The Internal Rate of Return (IRR) is the ir interest rate which results in an NPV of zero, indicating that the present value of the projects’ cash flow is equal to the initial investment. For the model scenarios in this study, the ir was fixed at the same rate as the hurdle rate. This was done in order to determine the minimum subsidy required which would allow the biorefinery system to financially break even, i.e. what was invested would be equal to what was returned. The reason for taking this approach, as opposed to using the NPV and IRR as the main financial indicators, is because the establishment of such technology applications will need governmental support (Popa-CTDA, 2005), particularly in relation to subsidies towards the capital investment. The minimum subsidies for each scenario were determined using the Microsoft Excel 2003 solver function (Microsoft Corp., Seattle, WA) to return an NPV value of zero, or the financial break even point of the GBR scenario. Below this minimum level of subsidy the biorefinery systems have a negative NPV, indicating lack of profitability where:
CF = net cash flow at time t (€/a)
T = period of operation (a)
t = year of operation (a)
ir = interest (discount) rate for the cost of buying the capital (%)
5Eqn )1(0
tt
T
t ir
CFNPV
+=∑
=

Chapter 4
76
3 Scenario results
3.1 Feedstock systems
Of the two feedstock systems analysed, the silage only system appeared to be marginally better, with the lowest level of subsidy required, indicating that it had greater financial return (higher NPV). In general there was relatively little difference between both systems with regards financial feasibility. However, due to the smaller catchment area of the grass/silage system, gross profit per ha supplied to the GBR facility were marginally bigger than (Table 4.9) the silage system. Differences in transport costs were negligible as both catchments were with the 2 km zone. When modelling both feedstock systems the aim was to account for realistic system losses, the data available on potential losses in the silage system was more readily available than those for the grass/silage system. Therefore, the losses modelled for the grass/silage system are a more conservative estimation of the true losses. The grass/silage GBR model has been shown to work successfully under Swiss conditions, however, the issue with storage and spoilage of grass quality due to time delays in processing was an issue for the Austrian GBR model. The Austrian model solved the issue with grass storage, by ensiling the grass and used silage as the starting raw material thus avoiding the loss of quality associated with processing grass feedstock (Kromus et al., 2004; Mandel et al., 2006; Steinmüller, 2007). Ensiling the grass also had many operational advantages: 1) it ensured year round availability of the raw material, allowing the factory and downstream processes to operate continuously; 2) ensiling the grass also provided the opportunities to improve the feedstock quality through the manipulation of the fermentation process occurring while it was ensiled (Danner et al., 2000); 3) during ensiling the grass also allowed for the conversion of carbohydrates in the green biomass to lactic acid (Halasz et al., 2005) removing the need for energy intensive fermentation processes required for its production (Danner et al., 2000). The future scenarios modelled in this study also focused on the production of lactic acid, produced as a result of ensiling the grass (Halasz et al., 2005; Kromus et al., 2004), and showed the silage system to have potential for future biorefinery technologies coming online. However, it must be noted that these models are based on feedstock with an expected average quality. Changes in biomass quality (proportion of fractions), could result in differing scenario predictions. The models’ sensitivity to potential variability in the feedstock’s chemical composition was not included in this analysis.

GBR scenarios
77
Overall the silage only system appears to be the feedstock system which has the greatest potential in Ireland, with the greatest operational feasibility and a lower subsidy requirement.
3.2 Economies of scale
The most suitable economies of scale will be determined by:1) the size of catchment area needed and the availability of feedstock, which will in turn determine the transport costs associated with such an area;2) the number of farmers required to supply the biorefinery and the organisational structure of the biorefinery operator, whether it will be a private limited company or a cooperative of farmers. The most favourable scale in this analysis was that of the medium scaled (decentralised) models. The throughput at 0.8 t DM h-1 resulted in a still relatively small catchment area (size), with biomass availability to be assumed at 90% and hence lower average transport distance than the larger biorefinery. The average distance calculated to the biorefinery plant was 1.6 (1.64) km, which was within the 2 km zone and therefore feedstock transport costs were not a factor. This was not the case for the larger scale operation with a throughput of 5 t DM h-1; a disproportionately larger catchment area was required to supply it, this needs also to be considered when assessing the scenario outcomes. This additional area led to reduced biomass availability to 55% (Fig. 4.1). The average transport distance increased by a factor of three to 5.15 (5.23) km, which led to significantly greater transport costs (Table 4.9). The average size of an Irish farm is approximately 32 ha (Connolly et al., 2008), from this the number of farmers supplying a biorefinery or the potential size of the farmers’ coop can be estimated. For the small, medium and large scale biorefinery a minimum of 6, 25 and 258 farmers respectively would be required as stakeholders (Fig. 4.1). Biorefinery facilities and AD CHP plants are substantial capital investments (Kamm et al., 2009; J. Sanders, unpublished) and financial assistance and government support will be required, in the initial stages of development (Popa-CTDA, 2005). The venture capital for each scenario is outlined in Table 4.9 on a per hectare basis. For a small scale Green biorefinery investments were estimated c. € 3 million or 15-16 k€ ha-1
Indicators for the biorefineries at the small scale demonstrate that this would not be a wise investment, as they required government subsidies c. 80%, to get an NPV value

Chapter 4
78
Table 4.8. Scenario results for biorefinery products and various operational parameters. Values are calculated per ha of catchment area supplied to the GBR. Grass/silage Silage only High tech Biorefinery biomass streams Small/Medium Scale Qty of fibre product (t ha-1) 4.95 4.77 4.77 Qty of protein (t ha-1) 0.51 0.46 0.46 Qty of LA (t ha-1) - 0.00 0.31 Qty of VS going to the digester (t ha-1) 1.60
(2.05) 1.51
(1.91) 1.16
(1.57) Energy parameters Methane from stillage m3 CH4 ha-1 471
(602) 443
(562) 342
(461) Total energy produced (GJ ha-1)1 15.53
19.88 14.59
(18.51) 11.27
(15.19) Total energy demand (GJ ha-1) 31.18
(28.20) 29.25
(26.37) 34.03
(30.71) Recycled waste streams Digestate (t ha-1) @ 3% DM2 32.49
(40.62) 30.60
(38.06) 24.52
(31.98) Effluent (t ha-1) @ 11% DM 6.20 8.01 8.01 Biorefinery biomass streams - Large scale Qty of fibre product (t ha-1) 3.03 2.91 2.91 Qty of protein (t ha-1) 0.31 0.28 0.28 Qty of LA (t ha-1) - 0.00 0.19 Qty of VS going to the digester (t ha-1) 0.98
(1.25) 0.92
(1.17) 0.71
(0.96) Energy Annual methane from stillage m3 CH4 ha-1 288
(368.4) 270
(343.15) 209
(281.68) Total energy produced (GJ ha-1) 9.49
(12.15) 8.92
(11.31) 6.89
(9.29) Total energy demand (GJ ha-1) 19.05
(17.24) 17.88
(16.11) 20.17
(18.76) Recycled waste streams Digestate (t ha-1) @ 3% DM 19.85
(24.82) 18.70
(23.26) 14.99
(19.55) Effluent (t ha-1) @ 11% DM 3.79 4.90 4.90 1. AD CHP plant efficiencies are assumed to be 85% 2. Digestate includes ash, for which mass into digester was equal to mass out of digester. Approx
50% of ash in original feedstock, the rest removed during biorefinery processes Note: values have been rounded to the nearest decimal place.

GBR scenarios
79
of zero. At this economy of scale the large energy demand related to the biomass processing makes the small-scale operations modelled in this study unviable. A potentially viable operation at this scale could be biogas generation (Geveke, 2009). For the larger scale biorefineries an investment, c. € 21 million (€ 2,407- € 2,681 ha-1) was estimated. At this scale, a private limited company would be the likely GBR business structure, which could successfully raise such large capital. At this scale of production, no government subsidies were required and the economic indicators showed very favorable returns with large NPV values. However, these should be considered with some degree of caution. The models tried to take into account reduced system efficiencies at this scale of operation; however, this was more then likely conservative as larger distances to the facility would lead to greater system losses, such as reduced quality of delivered biomass (delay between storage and harvest). Increased scale would also result in a reduced knowledge of biomass quality supplied (258 farmers supplying), as relationships with the suppliers may not be as strong as it would be at smaller scale. The downtime and maintenance for equipment would be longer due to the increased capacity, size of the machinery and number of units in operation. These inefficiencies could have implications for the profitability indicators and which are not taken into account by the model. The high tech scenarios modelled here could also have significant error margins, due to the assumptions made for the investments as outlined above. The medium scale biorefinery model scenarios were determined to have an investment capital of approx. € 7 million (€ 8,365- € 9,663 ha-1) and demonstrated profit potential with relatively low government subsidies, approx. 9-11% of the required capital investment (Table 4.9). The relatively smaller catchment area would also allow for a better management of feedstock quality as the biorefinery operator will have a better communication with the supplier. Knowledge of the feedstock is crucial for the success of a GBR as this will determine the quality of the end product (Grass, 2004). This size of an operation would have the potential to be run by a cooperative of farmers, approx. 25 farmers in the catchment area, small enough for practical decisions making. Therefore, from the scales investigated here, the most advantageous one appears to be the medium scale with its positive financial indicators and the potentially more practically sized supply chain management.

Chapter 4
80
Table 4.9. Scenario results for biorefinery products and various operational parameters. Values are calculated per ha of catchment area supplied to the GBR.
Grass/silage Silage only High tech
Small scale Total cost of feedstock € ha-1 753
(699) 1 745
(699) 770
(718) 2Transport costs digestate € ha-1 33
(40) 33
(39) 28
(34) Energy deficit costs € ha-1 539
(322) 505
(303) 769
(534) Total proceeds € ha-1 4,634
(4,646) 4,441
(4,451) 4,420
(4429) 3Total production costs € ha-1 3,392
(3228) 3,227
(3089) 3,506
(3143)) Gross profit € ha-1 1,241
(1418) 1,214
(1362) 913
(1286)) Minimum investment c. € ha-1 15,452
(16,269) 14,788
(15,546) 16,262
(17,054) Minimum subsidy for economies of scale (%)
>50 >50 >50 Medium scale Total cost of feedstock € ha-1 753
(611) 745
(699) 770
(718) Transport costs digestate € ha-1 34
(49) 34
(41) 29
(35) Energy deficit costs € ha-1 474
(287) 444
(271) 676
(470) Total proceeds € ha-1 4,569
(4,563) 4,381
(4,374) 4,373
(4,366) Total production costs € ha-1 2,377
(2,196) 2,257
(2,103) 2,523
(2,237) Gross profit € ha-1 2,192
(2,367) 2,124
(2,271) 1850
(2,129) Minimum investment ca € ha-1 8,740
(9,201) 8,365
(8,792) 9,217
(9,663) Minimum subsidy for economies of scale (%) 10.48
(7.97) 9.4
(7.66) 31
(24) Large scale Total cost of feedstock € ha-1 560
(488) 558
(502) 615
(548) Transport costs € ha-1 85
(89) 84
(89) 81
(85) Transport costs raw material € ha-1 61
(61) 60
(60) 61
(108) Transport costs digestate € ha-1 24
(29) 24
(29) 21
(25) Energy deficit costs € ha-1 289
(154) 271
(145) 413
(287) Total proceeds € ha-1 2,792
(2,789) 2,677
(2,673) 2,672
(2,668) Total production costs € ha-1 1,223
(1,085) 1,166
(1,006) 1,326
(1,194) Gross profit € ha-1 1568
(1,703) 1,511
(1,677) 1,346
(1,474) Minimum investment c. € ha-1 2,515
(2,647) 2,407
(2,529) 2,553
(2,681) Minimum subsidy for economies of scale (%) 0 0 0 1 Figures in parenthesis are the values predicted for scenarios without protein as a product. 2 Transport costs refers to transport of raw material + transport of slurry (digestate & silage effluent), the transport
costs for the smaller scales were zero due to the average radial distance being smaller than 2 km. 3 Total proceeds, also includes savings made due to the energy generated from AD CHP plant *Note: figures have been rounded to integers

GBR scenarios
81
3.3 Processing technologies
The values outlined in Tables 4.8 and 4.9 show the values relating to the biorefinery scenarios where protein is extracted “Prot scenarios” and the scenarios (in parenthesis) where the protein fraction is retained in the stillage being sent to the digester “No Prot” scenarios. In the process of developing the models it became clear that the energy demand associated with drying the fibres (the largest bulk of the biomass) was quite high under current conditions modelled and there was relatively little additional value generated through protein extraction (Fig. 4.4). This was also related to the lower price obtained for the proteinaceous product. The high fibre content can be related to the current management and cutting systems in Ireland producing a feedstock which is mostly comprised of fibre (500 g kg-1DM), unlike the European cutting systems, where biomass is harvested more frequently (Bruinenberg et al., 2002). Increasing the frequency of cutting would lead to a biomass feedstock with greater crude protein content, as it would be cut at a more vegetative stage (Buxton, 1996; Hoekstra et al., 2007), hence processing the juice stream for protein products could be more beneficial than the Irish scenarios (current harvesting practices) being predicted here. The “No Prot” scenarios, could be viable in the short to medium term due to the current Irish governments “Greener home scheme” (SEAI, 2010), which promotes the insulation of older houses to improve their heat energy rating. However, with the economic down turn (at time of writing), the construction industry is facing many obstacles (DKM Economic Consultants, Feburary 2010), which could have implications for a fibre-only system. The production of other non-related products could help to buffer price changes with the fibres, which is one of the key concepts of biorefinery, to enhance profitability and sustainability through the production of a multitude of products from the one feedstock (Kromus et al., 2004). On the other hand, redirecting the protein fraction to the digester increases the fertiliser value, which has a positive feedback for reducing the costs of the raw material (see Tables 4.8 and 4.9). However, one key issue which was not examined here, and which could be very relevant for improving the profitability of a biorefinery and the digester performance, is the addition of animal slurries for co-digestion (Jagadabhi et al., 2008; Singh et al., 2010). The potential increases of biogas and hence increased energy available for processing could see the outcomes of these predicted scenarios change and the “benefits” for not extracting protein would no longer be an issue and this would ultimately make the “Prot” scenarios more sustainable. The crude protein installations could be constructed with the initial development or retrofitted when conditions (technologies, grass husbandry) become more favourable for protein

Chapter 4
82
extraction. It is the liquid stream where most of the potentially high value products are to be extracted (Danner and Braun, 1999), the benefits of starting operations with protein extraction provides the opportunity for biorefinery stakeholders to become familiar with processing the juice and increasing the potential to upgrading to more advanced process technologies, such as lactic acid products as outlined in the future scenarios predicted in this paper. Therefore, because both systems have potential, they will both be considered in the development of a blueprints for an Irish GBR. The high tech scenarios or future scenarios were generated to show the true potential of product diversification and the future potential of systems supplied with adequate juice streams and technologies for exploiting them. The primary reason for not selecting such systems for the short to mid term biorefinery blueprint is due to these technologies still being in the developmental stage, the efficiencies and purities outlined in these futuristic scenarios are idealised and in reality could be more conservative. The level of investment required for the more advance technology system can also be seen in Table 4.9, in comparison to the more established extraction technologies, the subsidies required were substantially larger. The second reason is the harvesting regimes currently in operation in Ireland have a lower juice stream available for exploitation, as it predominantly comprises of a solid press cake or fibre fraction and therefore technologies for manufacturing from this solid fraction appear to be the more viable option on the short-mid-term. 3.4 Energy balance
It is clear from the results that the energy balances between processing the green biomass and that produced by the CHP will be a key driving force of a successful green biorefinery project, which corresponds to the views of other biorefinery studies (Kamm et al., 2009; Popa-CTDA, 2005). In the European Union energy charges are grouped into different charge categories according to energy consumption (€c MW-1), with the largest energy consumers receiving their energy at a cheaper cost price per kWh used. The intense energy demands of Green biorefineries processes (i.e. fiberization, drying) would result in the energy being provided at the cheaper rate, if electrical energy was supplied to the facility from an external source (c. € 0.10). The potentially low energy costs has allowed Austria and Germany to optimise their energy markets to allow bioprocessing facilities to sell the energy generated on site for a profit to the grid and buy energy at a lower rate from the grid (Geveke, 2009). Under current conditions (at time of modeling), the prices obtained in Ireland for biomass to energy
GBR scenarios
83
(c. 0.12 €) are still much too low to be a viable option (approx. 0.07 €c lower than in mainland Europe), for a GBR to sell the electricity generated on site and buy in the required energy. From the sensitivity analysis of the models an estimated price of c. € 0.26 was required to equilibrate the financial indicators of the base case scenarios (own supply of energy and deficit bought in), to the scenarios where all electrical energy was sold to the grid and the energy needed for processing was bought from the grid. The modelled conditions in these scenarios determined the energy demand of the systems to be much greater than the energy generated from the stillage (Table 4.8) and therefore, unless the energy production for the systems are modified i.e. co-digestion, the demand of the system will be too great to generate any surplus energy to sell to the grid, as was the case with these scenarios. Considering the obstacles outlined in O’ Keeffe et al. (2009) for supplying to the national grid, such as planning permission, potential cost for additional grid transformer capacity, etc. in the short-term it would be more advantageous for a biorefinery to use the energy generated for its own biomass processing. However, when conditions become more favourable i.e. increased price for electricity sold to the grid, or sufficient additional energy can be generated, then it maybe more profitable to to sell to the grid. 4 Selection of base case scenario – GBR blue print
It is clear from the results presented here that the most appropriate scale (from those analysed in this study) for an Irish GBR blueprint is the medium scale. Under the current cutting systems and average quality biomass assumed, the selection of feedstock system is not so clear, as both appear to be economically viable; however from an operational point of view the silage-only has been noted by many biorefinery experts to be a more viable option (Danner and Braun, 1999; Danner et al., 2000; Halasz et al., 2005; Kromus et al., 2004). There is also the additional issue of whether, under the Irish conditions modelled here, protein extraction would be a viable option. Therefore the most appropriate models which need to be considered in the development of an Irish GBR blueprint are the medium scaled, silage biorefinery model, with and without protein as a secondary product. 4.1 Sensitivity analysis of base case
There is very little difference between the minimum subsidies predicted for both the

Chapter 4
84
“Prot” and “No Prot” scenarios (Table 4.9). The net present value or cash flow (NPV) is based on projections or expectations of future cash flows. In order to estimate the sensitivity of the base cases to the potential future uncertainties, a sensitivity analysis was carried out for both. This was done by systematically varying from the base case, each parameter relevant for the profitability (Fig. 4.4). When graphed, the steeper the slope of the line the greater the sensitivity of the GBR profitability to the variable in question. This helps to point out primary areas which require attention for continued research and development. The parameters with the potentially greatest impact on NPV or potential cash flow (profitability) will be discussed here. As fibre constitutes the greater proportion of the feedstock it is not surprising that the profitability indicator NPV is sensitive to selling price of fibre products, Seven percent reduction in selling price (€ 0.75 kg-1) leads to a negative NPV.
Fig. 4.4 Investment sensitivity analysis for silage only blueprint (incl. protein products),
percentage change from base case scenario against change in NPV (€ Mio)

GBR scenarios
85
The unit changes in the GBR NPVs (€, 000) per unit change in, price for fibre (€ kg-1), price for proteinaceous products (€ kg-1), costs of raw feedstock (€ t-1) and Government subsidies (percentage of capital invested) were 15.10, 0.47, -2.87, 0.86, respectively for the “Prot” scenarios. For the “No Prot” scenarios unit of change in the GBR NPVs were 15.07, -2.7, and 0.73. A unit of change in the revenue from fibre generated the largest unit of change in the NPV, having the largest slope as shown in Fig. 4.4. The model was not as sensitive to other model parameters, raw materials and subsidies. As fibre makes up the greatest bulk of the raw material, its selling price therefore will contribute more significantly to the profit of the biorefinery then the crude protein product; hence the price of the protein had little overall effect on the system. 5 Conclusions of the study
The findings of this study suggest that the blueprint in the short-to-medium term for an Irish GBR is envisioned to be a decentralised facility (medium scaled), using a silage feedstock and processing energies supported through on site energy generation in an AD CHP plant run on the biorefinery stillage. The energy balance between processing energies and the energy generated by the CHP plant will be crucial in the success of a biorefinery model in Ireland and needs to be researched further. The current harvesting systems may require adapting e.g. increased cuts in the year in order to enhance the profitability of a biorefinery manufacturing crude protein products, however the trade off between increased harvesting costs and increased energy consumption for this type of system will also need to be determined viable or not. The models presented here, although restricted to the most available data (at time of modelling), show that green biorefinery requires government support in the order of approximately 9-11% to be established successfully in Ireland. To enhance the profitability and hence the sustainability of these biorefinery systems requires more in-depth and detailed research.

Chapter 4
86

87
5 Green Biorefinery (GBR) scenarios for a two-cut
silage system: Investigating the impacts of sward
botanical composition and N fertilisation rate on
GBR profitability and price offered to farmers
S.M. O' Keeffe, R.P.O. Schulte, S. Lalor, P. O’ Kiely, and P.C. Struik. submitted to Biomass and Bioenergy. Green biorefinery (GBR) scenarios for a two cut silage system: Investigating the impacts of sward botanical composition and N fertilisation rate on GBR profitability and price offered to farmers. Submitted for publication.

Chapter 5
88
Abstract
In Ireland, grass is a readily available bioresource. It has previously been established that Green biorefinery (GBR) could become a potential use of Irish grasslands, and a blueprint for a sustainable GBR industry in Ireland has been developed. The objective of this paper is to use scenario analysis to investigate the sensitivity of the profitability of the GBR blueprint to variations in grass quantity and quality as a function of botanical composition, fertiliser application, and biomass availability. As an outcome of these scenario analyses, the price the GBR can offer to farmers above their production costs (€ t-1 dry matter) was calculated. GBR systems located in a catchment area of permanent pasture with grass yields in the range of 9-12 t dry matter ha-1, and supplied with grass biomass with a fibre content of 500 - 555 g kg-1 dry matter and a protein content of 110-130 g kg-1 dry matter, were viable under this scenario analysis. Reducing grass biomass availability below 30% resulted in a financial loss for both the GBR and the farmers in most cases, due to increased transport costs. Within the scenario assumptions adopted in this study, grass feedstock was valued at €4 - €28 per tonne dry matter above production costs. However, this value depended on the yields and biomass availability of the catchment area supplying the GBR.
Keywords: grass, silage, green biorefinery, fibre, protein
1 Introduction
1.1 Agricultural systems in Ireland and Green biorefinery (GBR)
For the last decade in Europe, there has been increasing interest in using grass biomass for energy and chemicals (Danner and Braun, 1999). Grass is a bioresource that is readily available in Ireland. Approximately 90% of the agricultural area (3.8 million ha) is devoted to grassland farming and animal production systems (O' Mara, 2008). Environmental restrictions such as the Nitrate Directive (91/676/EEC) and economic pressure from Common Agricultural Policy reforms have led to declining livestock numbers (EU Commission, 2010) and a potential for surplus grassland biomass. These issues combined with a low family farm income (Connolly et al., 2008; Teagasc, 2009); have led Irish farmers to begin investigating alternative uses of their grasslands (Irish Farmers Monthly, 2008).

GBR feedstock quality scenarios
89
Green biorefinery (GBR) has been suggested as a potential use of Irish grasslands (O' Keeffe et al., 2009). GBR involves applying technology to chemically and physically fractionate green biomass (grass and grass silage) (Kiel, 1998) into two streams: press cake (the solid fibre fraction) and press juice (the liquid fraction). The press cake can be utilised for low value products such as insulation materials for building (Grass, 2004; Kromus et al., 2004). The press juice can be used to produce high value products which could be used as substitutes for mineral oil derived products such as lactic acid for plastic and polylactide (PLA) production, proteins for the animal feed and cosmetics industries, and ethanol for biofuel. After extracting the desired fractions from the biomass, the residual grass/silage slurries or ‘stillage’ can then be fed into an anaerobic digester to produce biomethane gas, which can be used in electricity and heat generation (Grass, 2004). 1.2 Overview of an Irish GBR blueprint
O’Keeffe et al. (2009) suggested that the adoption of “conventional” farming practices for GBR in Ireland could promote a smooth transition to farming practices for GBR in Ireland. They developed a “Blueprint for an Irish GBR” based on the best available technologies for processing the highest yielding grass silage fractions, such as fibre and protein, based on the current harvesting regime in Ireland, i.e. a two-cut silage system. Two possible production scenarios were identified; the first was to produce fibre products alone as insulation material (“No Prot” scenario), and the second was to include a secondary proteinaceous product as an animal feed (“Prot” scenario). The short-to-medium term blueprint for an Irish GBR was defined as a decentralised biorefining plant, processing 6,182 t dry matter (DM) grass silage per annum, from a catchment area of approximately 840 ha. The facility was located in an area with approximately 90% grassland and was supplied by all the farmers in the area (90% biomass availability). The grass feedstock supplied was assumed to have an optimised quality or fraction yields of 550 kg fibre (NDF) t-1 DM and 170 kg crude protein (CP) t-1 DM (see O’ Keeffe et al., submitted a). In all blueprint scenarios, the farmer hired agricultural contractors to harvest and deliver the fresh grass to the biorefinery and the grass was ensiled on site to ensure controlled and uniform ensiling conditions. These blueprints are discussed in greater detail below.

Chapter 5
90
1.3 Additional considerations for a GBR blueprint – Grass biomass supply
It was assumed that the grass feedstock supplied to the biorefinery was from permanent pastures, as the majority of grass silage in Ireland is made from these pastures (O' Kiely et al., 1993). The quality or yields of desirable fractions such as fibre (NDF) and crude protein (CP) of grass (and hence silage) from these permanent pastures will vary depending on, inter alia, botanical composition, geographical location, local climate, Fertiliser management, and growth stage at time of harvesting (Van Soest et al., 1978; Buxton, 1996). Intensive management (reseeding, high cutting frequency) and high nitrogen (N) application rates result in high DM yielding swards, sometimes entirely dominated by perennial ryegrass (Lolium perenne) (Fositt, 2000). With less intensive management, secondary grass species, such as meadow-grasses (Poa spp.), Yorkshire-fog (Holcus lanatus), bent grasses (Agrostis spp.) and herbaceous species including docks (Rumex spp.) enter the sward mix (Fositt, 2000). Permanent pasture with a greater abundance of secondary species can have yields comparable to L. perenne dominated swards, however they may not always be agronomically optimal, i.e. might have lower quality than L. perenne dominated swards (Frame, 1990; Keating and O'Kiely, 2000b; Peeters, 2004). Low DM yields will reduce biomass availability within the catchment area of a GBR. Other possible causes of low availability are reduced pasture area, or economic reluctance by farmers to supply a biorefinery. The original GBR scenarios assumed a constant and readily available supply of biomass (90% availability). In reality, the sensitivity of the GBR blueprint scenarios to the variation in botanical composition and biomass availability needs to be considered when supplying grass biomass to a GBR plant, as this will impact on the profitability of the entire system and the potential price that can be offered to farmers (Kromus et al., 2004). Therefore the objectives of this study are to subject the GBR blueprints to scenario analyses, to investigate the impact of variation in:
1) botanical composition of the grass feedstock (the ratio of abundance of L. perenne to secondary grass species ranging from 90:10 to 60:40);
2) N fertiliser application rates (45, 90, or 225 kg ha-1 a-1) on:
1) GBR profitability; 2) biomass production costs; and 3) the price the GBR can offer to the farmers above their production costs
(€ t-1 DM).

GBR feedstock quality scenarios
91
The scenarios in this study were generated using a combination of field trial data and desk study modelling. The data from field trials were used to develop a “biomass supply model” and an “ensiling model” The latter was used to integrate the supply model with the desk study GBR model. The integrated models were then used to determine the profitability for each scenario analysed. 2 Materials and methods
2.1 Field trials - Experimental data generation for biomass supply and silage models
2.1.1 Harvesting and ensiling grass biomass
Field trials, described in O’Keeffe et al. (submitted a), were established on six commercial farms around the country (see appendix 1 for full site descriptions and climatic data). Three annual N Fertiliser application rate treatments (45, 90, and 225 kg N ha-1) were applied as calcium ammonium nitrate (275 g N kg-1) to 2.5 m x 2.0 m plots with adequate P and K based on soil tests. Each treatment had four replications. Simulating the national silage harvesting campaigns in Ireland, silage was cut from the plots twice yearly (late May / early June and late July / early August); except for the most northern site (Fermanagh), where there was one single annual cut in late July. Harvested grass from each of the plots was laid out in a strip and chopped with a lawn mower to simulate a “precision chop” silage cut. The chopped grass was then packed into plastic bags. As much of the air as was possible was expelled from the bags before sealing them, effectively ensiling them onsite before transport to the Teagasc at Grange (53º 6’ N; 6º 45’ W). Grass was stored at 4 ºC overnight, prior to transfer into laboratory silos, as per (O' Kiely and Wilson, 1991). Laboratory silos were stored at 15 ºC for approximately 120 days. Effluent (if any) was collected and weighed when silos were re-opened, and the final weight of the silage was recorded. After thorough aseptic mixing, samples were taken from each silo and stored in a freezer at -18 ºC prior to chemical analyses. 2.1.2 Chemical analyses for biomass quality
Samples of grass and silage were dried at 100 °C (overnight) to estimate DM content.

Chapter 5
92
Samples dried at 40 ºC for 48 h were milled through a sieve with a 1 mm aperture prior to analysis for fibrous components or total cell wall content (cellulose, lignin and hemicellulose), using neutral detergent fibre (NDF) (Van Soest, 1963). This was used to estimate the potential press cake proportion of the biomass. CP (total N x 6.25; LECO FP 428 nitrogen analyser – AOAC, method 990-03), was measured to indicate the proportion of the proteinaceous fraction (e.g. amino acids, proteins, peptides, nitrate), extractable from the biomass in the press juice. Water soluble carbohydrates (WSC) (Thomas, 1961), volatile fatty acids (VFA), lactic acid, ethanol and ammonia-N were measured as indicators of silage quality. Both VFAs and ethanol were measured by gas chromatography using the method of (Ranfft, 1973). Lactic acid was measured using the Boehringer method for the determination of lactic acid in foodstuffs and other materials (cat. no. 139084), while N in ammonia (NH3-N) was measured using the Sigma Diagnostics method for plasma ammonia (Procedure no. 171-UV). 2.2 Desk study
2.2.1 Overview of modelling steps
The scenario outputs generated for this study were developed through the integration of the various component models derived from experimental field data and desk study analysis (Fig. 5.1).
Fig. 5.1 Overview of the integration steps taken with the various component models
derived from experimental field data and desk study analysis.

GBR feedstock quality scenarios
93
Step 1 - Farm step: The biomass supply model of O’Keeffe et al. (submitted a) was used to predict the quantity (DM yields (t ha-1 a-1)) and quality (NDF and CP (kg t-1 DM)) of the pasture biomass as a function of nitrogen fertiliser (45, 90, 225 kg N ha-1 a-1), growth stage at time of harvesting, and sward botanical composition Step 2 – Ensiling/Storage step at biorefinery: Good quality silage was assumed to be produced from the grass biomass ensiled in the GBR silos. The silage quality of the different feedstock types was predicted by substituting the biomass supply model outputs (Table 5.1) from Step 1 into the linear models generated from the laboratory silos experiment described in this paper. Effluent losses were estimated using the model outlined by Bastiman and Altman (1985).
Fig. 5.2 Mass and energy flow diagram from O’Keeffe et al. (submitted b) blue print
scenarios for an Irish GBR in the short-to-medium term.

Chapter 5
94
Step 3 - Bio-processing at biorefinery: The GBR processing model consists of three fully integrated mass, energy, and economic models (Fig. 5.2). The silage quality predicted from Step 2 and the DM yields predicted in Step 1 were used for the mass and energy sub models in the biorefinery processing model (O' Keeffe et al., 2009). This was then used to determine the effects of the different silage feedstocks on the economic performance indicator of the GBR systems. Step 4 - A sensitivity analysis was carried out to determine the gross profit per ton of DM, for each of the different scenario combinations of sward composition and N rate. From this, we established the price of feedstock, over and above the production costs, payable to farmers supplying the GBR.
2.2.2 Modelling of grass feedstock quality and quantity – STEP 1- On-farm conditions
The biomass supply model of O’Keeffe et al. (submitted a) was used to determine the quantity and quality of ensiled herbage from pastures with contrasting sward composition i.e. with the ratio of Lp to secondary grass species ranging from 90:10 to 60:40. The Microsoft Excel 2003 solver function (Microsoft Corp., Seattle, WA) was used to predict the maximum DM yields and fraction yields of NDF and CP (both expressed in t ha-1 a-1) for each of the contrasting sward types. The resulting NDF and CP mass fractions (kg t-1 DM) were then used as input variables for the GBR blueprint mass balance (Table 5.1). The original model constraints were maintained as per O’Keeffe et al. (submitted a), however new constraints were introduced in order to predict annual DM yields (Table 5.2). The relative abundance constraints for Lp: secondary grass species ranged from 0.90 to 0.60. The models predicted maximum yields for a mixture of Lp with a secondary grass mix of Agrostis spp. (As) and H.
lanatus (Hl) (Table 5.1). 2.2.3 Modelling of silage quality - Step 2- storage/ensiling of grass
The objective of step two was to predict the fractions (NDF, WSC, CP, LA) or quality of the silage removed from the GBR silos, as a function of grass quality going into the silos and N rate. It was assumed that good quality silage could be produced, with minimal losses to the biomass quality (Table 5.3).
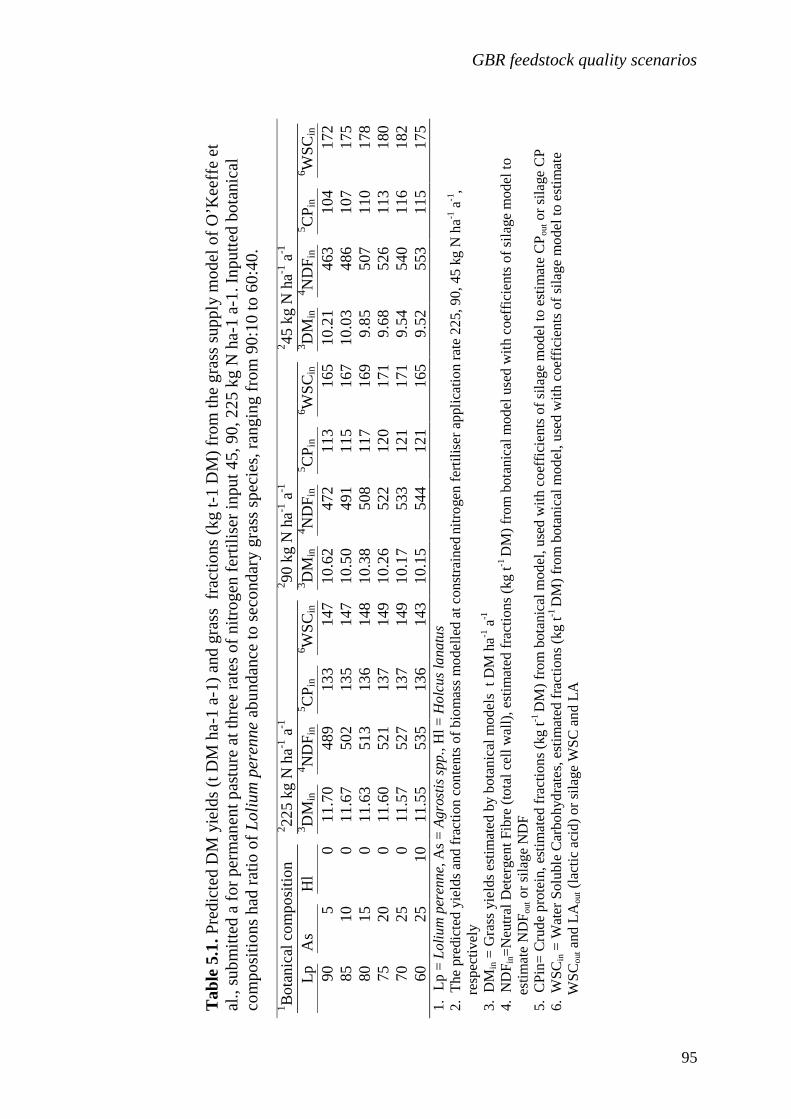
GBR feedstock quality scenarios
95
Tab
le 5
.1. P
redi
cted
DM
yie
lds
(t D
M h
a-1
a-1
) an
d gr
ass
frac
tions
(kg
t-1
DM
) fr
om t
he g
rass
sup
ply
mod
el o
f O’K
eeff
e et
al
., su
bm
itted
a f
or p
erm
anen
t pas
ture
at
thre
e r
ates
of
nit
roge
n fe
rtili
ser
inpu
t 4
5, 9
0, 2
25
kg N
ha-
1 a-
1. I
npu
tted
bot
anic
al
com
posi
tions
had
rat
io o
f Loliu
m p
ere
nn
e ab
und
ance
to s
eco
ndar
y gr
ass
spec
ies,
ran
ging
from
90
:10
to 6
0:40
. 1 B
ota
nic
al c
om
po
sitio
n
2 22
5 kg
N h
a-1 a
-1
2 90
kg N
ha-1
a-1
2 4
5 kg
N h
a-1 a
-1
Lp
As
Hl
3 DM
in
4 ND
F in
5 CP i
n
6 WS
C in
3 DM
in
4 ND
F in
5 CP i
n
6 WS
C in
3 DM
in
4 ND
F in
5 CP i
n
6 WS
Cin
90
5 0
11
.70
48
9 13
3 1
47
10
.62
472
1
13
165
1
0.2
1 4
63
10
4 1
72
85
10
0 1
1.6
7 5
02
135
147
1
0.5
0 4
91
11
5 1
67
10
.03
486
1
07
175
80
1
5 0
11
.63
51
3 13
6 1
48
10
.38
508
1
17
169
9
.85
507
1
10
178
75
2
0 0
11
.60
52
1 13
7 1
49
10
.26
522
1
20
171
9
.68
526
1
13
180
70
2
5 0
11
.57
52
7 13
7 1
49
10
.17
533
1
21
171
9
.54
540
1
16
182
60
2
5 10
1
1.5
5 5
35
136
143
1
0.1
5 5
44
12
1 1
65
9.5
2 5
53
11
5 1
75
1.
Lp =
Loliu
m p
ere
nne, A
s =
Agro
stis
spp
., H
l = H
olc
us
lanatu
s 2.
The
pre
dict
ed y
ield
s an
d fr
actio
n co
nte
nts
of b
iom
ass
mo
delle
d at
con
stra
ined
nitr
oge
n fe
rtili
ser
appl
icat
ion
rate
225
, 90,
45
kg N
ha-1
a-1,
re
spec
tivel
y 3.
DM
in =
Gra
ss y
ield
s es
timat
ed b
y b
otan
ical
mod
els
t D
M h
a-1 a
-1
4. N
DF in
=N
eutr
al D
eter
gen
t F
ibre
(to
tal c
ell w
all),
est
imat
ed fr
actio
ns (
kg t-1
DM
) fr
om b
otan
ical
mod
el u
sed
with
coe
ffici
ents
of
sila
ge m
odel
to
estim
ate
ND
F out o
r si
lage
ND
F
5. C
Pin
= C
rud
e p
rote
in,
estim
ated
frac
tion
s (k
g t
-1 D
M)
from
bot
anic
al m
odel
, use
d w
ith c
oef
ficie
nts
of s
ilage
mod
el t
o e
stim
ate
CP
out o
r si
lage
CP
6.
W
SC i
n =
Wat
er S
olub
le C
arbo
hyd
rate
s, e
stim
ated
frac
tion
s (
kg t-1
DM
) fr
om b
otan
ical
mod
el, u
sed
with
coe
ffici
ents
of
sila
ge m
ode
l to
estim
ate
WS
C out a
nd L
A out (
lact
ic a
cid)
or
sila
ge W
SC
an
d LA

Chapter 5
96
Data from the laboratory silo experiment were analysed as repeated measures using generalised linear mixed models, implemented using Proc GLIMMIX in SAS (SAS Institute, 2003).
Ch
ap
ter 5
Table 5.2. Constraints of grass supply model, modified to account for 1st and 2nd cut of a two-cut silage system O’Keeffe et al. submitted a Constraints Annual 1st cut 2nd cut 1GS Lolium improved 2.8 - 3.1 2.2- 2.4 2Nrate high 225 125 100 Nrate med 90 45 45 Nrate low 45 25 20 1. GS= Growth stage at time of cutting; Vegetative stage < 1.9, Elongation stages 1.9 - 3, Booting
stage 3.0 - 3.1, Inflorescence / 1st spikelet visible 3.1- 3.3, Spikelets fully emerged / peduncle not emerged 3.3 - 3.5, Inflorescence emerged / peduncle fully elongated 3.5 - 3.7, Anther emergence / anthesis 3.7 - 3.9, Post anthesis > 3.9 (Moore et al., 1991).
2. Nrate = Nitrogen fertiliser rate kg ha-1 yr-1
Table 5.3. Fermentation quality of silage for laboratory silo experiment, meaned across 6 sites, 2 years (1st and 2nd cut) and 3 rates of N 45, 90, 225 kg ha-1 a-1 (sample no = 230) (Variables in g kg-1 DM unless otherwise stated) Mean S.E.M pH grass 6.1 0.0 pH silage 3.7 0.0 Buffering capacity of grass (m Eq kg-1 grass DM) 340.3 5.3 NH3N (g kg-1 total N) 49.9 1.9 Lactic acid 80.1 2.1 Acetic acid 37.6 2.9 Propionic acid 2.0 0.5 Butyric acid 1.6 0.3 Ethanol 19.9 0.7 1 Total fermentation acids 121.2 3.9 2 Total fermentation products 141.1 4.1 1. Sum total of fatty acids, (lactic acid + acetic acid + propionic acid + butyric acid) 2. Sum total of fermentation products (total fermentation acids + ethanol)

GBR feedstock quality scenarios
97
T
abl
e 5
.4.
Est
ima
tes
for
sila
ge
qu
alit
y o
utp
ut
1 (g
kg-1
sila
ge
DM
) fr
om
Gra
ss q
ua
lity
inp
ut
2 (g k
g-1 g
rass
DM
) e
nsi
led
in la
bo
rato
ry s
ilos
and
3 nitr
oge
n f
ert
ilise
r a
pp
lica
tion r
ate
.
Pa
ram
ete
rs
Est
ima
te
Err
or
t va
lue
P
r >
|t|
1 ND
Fou
t
In
terc
ep
t 1
59
.98
3
0.2
7
5.2
9
***
2 ND
Fin
0.7
5
0.0
5
16
.09
**
* 3 N
rate
0.1
4
0.0
4
3.6
5
**
1 CP o
ut
Inte
rce
pt
41
.82
5
.04
8
.3
***
2 CP i
n
0.5
1
0.0
4
14
.62
**
* 3 N
rate
0.0
6
0.0
11
5
.47
**
* 1 W
SC
ou
t
In
terc
ep
t 3
2.2
9
8.9
8
3.6
**
2 W
SC i
n
0.1
5
0.0
30
4
.95
**
* 3 N
rate
-0.1
5
0.0
17
-9
.03
**
* 1 L
Ao
ut
Inte
rce
pt
57
.36
1
1.8
3
4.8
5
***
2 WS
Cin
0.1
1
0.0
45
2
.52
*
3 Nra
te
0.1
2
0.0
25
4
.84
**
* 1
. O
utp
ut: W
eig
ht o
f si
lage
re
mo
ved
fro
m la
bo
rato
ry s
ilo
s D
Mo
ut =
([F
resh
we
ight
(FW
) si
lag
e (
kg)]
*[D
M s
ilage
g/k
g
FW
])
rem
ove
d f
rom
silo
s. N
DF ou
t, C
P out,
WS
C ou
t, L
a ou
t = (
DM
ou
t)*([
fra
ctio
n c
om
po
ne
nt, N
DF
, W
SC
, C
P,
LA
g/k
g D
M s
ila
ge
*0.0
01
])
rem
ove
d f
rom
the
silo
s.
2.
Inp
ut:
We
ight o
f gra
ss e
nsi
led
DM in =
([F
resh
we
ight
(FW
) e
nsi
led
gra
ss (
kg)]
*[D
M g
/kg
FW
]) e
nsi
led
in t
he
min
i silo
s.
ND
Fin,
CP i
n,
WS
C in =
[(D
Min)*
([fr
act
ion c
om
po
ne
nt
ND
F,
CP
, W
SC
g k
g-1 D
M e
nsi
led
*0.0
01])
3
. N
rate
= N
itro
ge
n f
ert
ilise
r a
pp
lica
tion r
ate
22
5,
90
, 45
kg N
ha-1 a
-1.
4.
ND
F =
Ne
utr
al d
ete
rge
nt
fibre
, C
P =
cru
de
pro
tein
(N
*6.2
5),
WS
C =
wa
ter
solu
ble
ca
rbo
hyd
rate
s, L
A =
lact
ic a
cid
5
. S
ignifi
can
ce le
vel o
f th
e c
ova
ria
tes
for
the
va
ria
ble
s D
Mo
ut,
ND
F ou
t, C
P ou
t, W
SC o
ut r
esp
ect
ive
ly;
*P<
0.0
5;**
P<
0.0
1;**
* P
<0
.001
.

Chapter 5
98
Models were fitted separately for each fraction of interest e.g. for the fibre model, the quantity of fibre [(g fibre kg-1 DM*0.001) x kg grass DM ensiled = NDFin] and the nitrogen fertiliser application rate (Nrate) were included in the model as fixed effects to predict the quantity of fibre in the silage, which was removed from silo [(g fibre kg-1 DM*0.001) x kg silage DM = NDFout]. Harvest, site and year were included as random effects. Model fitting was conducted for the random effects and the model of best fit was determined for each silage fraction using Akaike’s Information Criterion (AIC). The compound symmetric random structure was the best fit for the random model. Model estimates for the mass balances are shown in Table 5.4. The silage quality used for the scenarios analysis in this paper were estimated as a function of the grass feedstock fractions (output from the biomass supply model (STEP 1)) and model coefficients (b and c) from the Proc GLIMMIX procedure (Table 5.4), e.g.
NDFout = a + bNDFin + cNrate Eqn 1
The grass DM yields and resulting silage mass fractions NDFout, CPout, WSCout, LAout were then used as input variables for the mass balance of the GBR processing model of STEP 3. 2.2.4 Biorefinery models –STEP 3- Bioprocess
The GBR processing model was used to investigate the effects of the different silage feedstocks (STEP 2) on the economic performance indicators of the GBR systems. 2.2.4.1 Biorefinery factory steps – description
This GBR blueprint of O’Keeffe et al. (submitted a) predicted a GBR facility to be: • A plant at the centre of a circle of radius 1.64 km, with annual DM yields within
the catchment area assumed to be 10.2 t DM ha-1 a-1. • The biorefinery operated for approximately 46 weeks annually, with a
throughput of 0.8 t DM hour-1 and processed 6,182 t silage DM. • A catchment area of c. 840 ha was calculated to ensure adequate biomass was
supplied to the GBR facility to account for biomass availability (90%) and system losses, which were assumed to be as follows; field losses (3%), DM loss in effluent (10%) and feed out losses (7.5%).

GBR feedstock quality scenarios
99
• An anaerobic digester (AD) and combined heat and power (CHP) plant on site were used to process the stillage (waste streams) and produce heat and electrical energy. GBRs, particularly those producing fibre products are energy intensive (due to drying of fibre) (Kamm et al., 2009). Therefore, it was assumed the energy was used for processing the silage into fibre and proteinaceous products. Energy saving made as a result of the CHP plant were calculated at €0.11 per kWh produced by the CHP plant. The additional energy required to process the silage was assumed to be bought from the national grid.
• The blueprint generated two scenario outcomes; these were:
o “Prot”, which has two biorefinery products: fibre and crude protein. o “No Prot” where the proteinaceous fraction is redirected to the digester
to increase on-site energy generation and to reduce costs of purchasing energy.
� Optimum revenue generation was assumed, the fibre insulation material was estimated at €0.80 kg-1 (Grass, 2004) and € 0.27 kg-1 was estimated for the proteinaceous product (Calculated from Central Statistic Office data, four years meaned data, 2005-2008).
• The capital investment costs for the GBR plant included the costs for: silos; factory intake areas; storage; refiners; centrifuges; equipment for coagulation and for separation; and driers (J. Sanders, unpublished). Annual operational costs for the biorefinery were estimated at 3% of the initial investment capital.
• Capital investment costs for the CHP facility included the costs of the anaerobic digester, CHP units and storage tanks. Annual operational costs for the CHP were assumed to be 10% of the capital investment made (Poliafiaco and Murphy, 2007; Smyth, 2007). Total capital costs were depreciated over 10 years.
• It was assumed a government financial subsidy would be required to establish a GBR plant (O’Keeffe et al., submitted b). A minimum financial subsidy of approx. 9.4% of the capital costs was calculated for the break even point, where NPV = 0.
2.2.4.2 Description of GBR blue prints – Farm boundary (Fig. 5.2)
� A biomass availability of 90% was assumed; i.e. the majority of land in the catchment is under grassland and all farmers in the catchment are supplying grass feedstock. It was also assumed the farmer delivers fresh grass to the

Chapter 5
100
biorefinery and that the grass is ensiled on site to ensure controlled and uniform ensiling conditions.
� The farmers’ overhead costs for producing the grass included the cost of the field maintenance (roads, fences), management (fertiliser, lime) and harvesting (contractor and plastic for ensiling).
� The base price paid to the farmer in the GBR model was assumed to be the break even price.
� It was assumed that the farmers follow standard fertiliser rate recommendations for grassland cut twice for silage, i.e. 225 kg nitrogen (N) ha-1 a-1, 30 kg phosphorus (P) ha-1 a-1, 155 kg potassium (K) ha-1 a-1 (Coulter and Lalor, 2008).
� The fertiliser costs for applied N, P, K, were calculated using the current farm-gate prices (at time of writing) of €0.83, €1.56, €1.21 per kg, respectively.
� It was assumed that the waste streams from the biorefinery processing (silage effluent and digestate from the AD plant) are returned as slurries to the fields harvested. The scenario output calculated that c. 34 kg ha-1 a-1 of N, 10 kg ha-1 a-1 of P, and 134 kg ha-1 a-1 of K was returned in the stillage, thereby reducing fertiliser costs for the farmer.
� The transport and spreading costs for the returned “slurry” were assumed to be paid by the biorefinery.
2.2.5 Modification to blueprint models
2.2.5.1 Effluent production and nutrient losses – New model assumption
In the original model the dry matter losses in effluent were estimated from the literature and taken to be at the higher rate of 10%, due to the high N rate of 225 kg N ha-1 a-1 assumed used by the farmer. However to take into account the effects of changing N rate on the dry matter losses in effluent, the model outlined by Bastiman and Altman (1985) (Eqn 2) was used. The model describes the curvilinear relationship between percentage DM content of the grass ensiled (x) and dry matter loss in effluent (DMeff). Effluent fresh weight losses (l t-1 grass ensiled) (Eff) were also predicted using the Bastiman and Altman equation (Eqn.3). The DM of the fresh grass delivered to the biorefinery at the three fertiliser N rates (45, 90, 225 kg N ha-1 a-1), was estimated using the meaned DM data from the 6 field trials over 2 years and 4 harvests outlined in section 2.1.1. The corresponding mean silage DM contents were also used in the biorefinery model (Table 5.5).
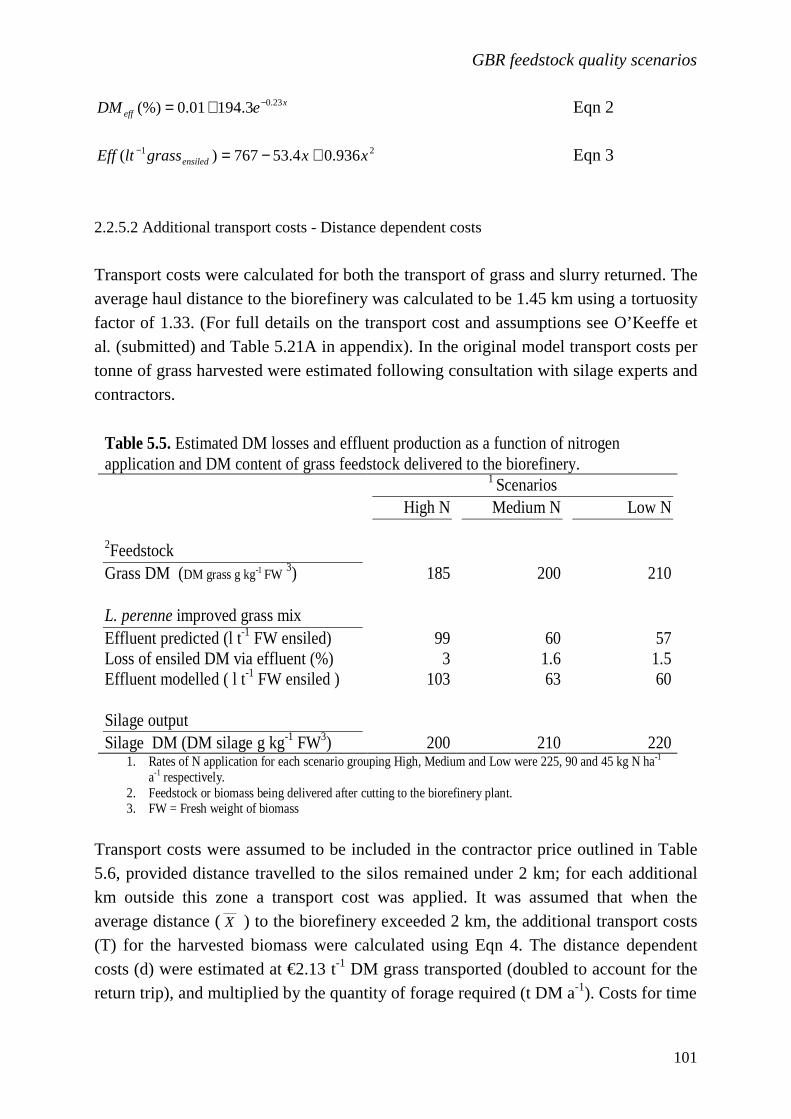
GBR feedstock quality scenarios
101
xeff eDM 23.03.19401.0(%) −+= Eqn 2
21 936.04.53767)( xxgrassltEff ensiled +−=− Eqn 3
2.2.5.2 Additional transport costs - Distance dependent costs
Transport costs were calculated for both the transport of grass and slurry returned. The average haul distance to the biorefinery was calculated to be 1.45 km using a tortuosity factor of 1.33. (For full details on the transport cost and assumptions see O’Keeffe et al. (submitted) and Table 5.21A in appendix). In the original model transport costs per tonne of grass harvested were estimated following consultation with silage experts and contractors. Transport costs were assumed to be included in the contractor price outlined in Table 5.6, provided distance travelled to the silos remained under 2 km; for each additional km outside this zone a transport cost was applied. It was assumed that when the average distance (
___
X ) to the biorefinery exceeded 2 km, the additional transport costs (T) for the harvested biomass were calculated using Eqn 4. The distance dependent costs (d) were estimated at €2.13 t-1 DM grass transported (doubled to account for the return trip), and multiplied by the quantity of forage required (t DM a-1). Costs for time
Table 5.5. Estimated DM losses and effluent production as a function of nitrogen application and DM content of grass feedstock delivered to the biorefinery. 1 Scenarios High N Medium N Low N 2Feedstock
Grass DM (DM grass g kg-1 FW 3) 185 200 210
L. perenne improved grass mix
Effluent predicted (l t-1 FW ensiled) 99 60 57 Loss of ensiled DM via effluent (%) 3 1.6 1.5 Effluent modelled ( l t-1 FW ensiled ) 103 63 60
Silage output
Silage DM (DM silage g kg-1 FW3) 200 210 220 1. Rates of N application for each scenario grouping High, Medium and Low were 225, 90 and 45 kg N ha-1
a-1 respectively. 2. Feedstock or biomass being delivered after cutting to the biorefinery plant. 3. FW = Fresh weight of biomass

Chapter 5
102
Table 5.6. Estimated costs of raw material – grass silage production (Source: (Teagasc and Agricultural and Food Development Authority, 2008) 1st cut silage €/ha 2nd cut silage €/ha Over head costs for farmers
Maintenance costs (m) Roads and fencing 43 34 Reseeding 20 16 Management costs (M) Fertiliser 1 280 141 Lime 20 16 Harvesting costs (H) 2Plastic 15 12 3Contractor €ha-1 247 227 4Total costs €ha-1 625 446 Equation for estimating Total production costs farmer Cg = Σ m + M + H
Cg = Cost of grass feedstock (€ t-1 DM) m=maintenance costs – roads fencing M = management costs H = harvesting costs – contractor price
M = L + Fert
L = cost of Liming (€ t-1 ) Fert = cost of fertilisers N , P , K (kg ha-1 a-1)
5Fert = Σ [a (Nr – RN) + b(Pr- Rp) + C (Kr - Rk)]
a = replacement cost of nitrogen fertiliser (€ kg-1) Nr = required rate of N (45, 90, 225 kg ha-1 a-1) RN = returned nitrogen from waste of GBR (kg ha-1 a-1) b = replacement cost of nitrogen fertiliser (€ kg-1) Pr = required rate of phosphorus (30 kg ha-1 a-1) Rp =returned phosphorus from waste of GBR (kg ha-1 a-1) c = replacement cost of nitrogen fertiliser (€ kg-1) Kr= required rate of K (155 kg ha-1 a-1) Rk =returned potassium from waste of GBR (kg ha-1 a-1)
Yields used in model (Table 1 and 2 ) t DM ha-1 2/3 annual DM harvested 1/3 annual DM harvested 1. These values based on the recommended fertiliser rates for a two cut grass/silage system (225 kg N ha-1 a-1, 30 P kg ha-1 a-1,
145 kg K ha-1 a-1). Fertiliser costs were estimated to be €0.83, €1.56, and €1.21 for N, P, K, respectively. 2. It was assumed that the farmer covered the contractor costs that used the plastic on the biorefinery site, as the most accurate
costing available. 3. Contractor refers to the agricultural contractor hired to harvest grass by farmer and deliver to GBR facility. 4. Total costs = Σ (Roads & Fencing + Reseeding + Fertiliser costs after returned slurry + Lime + Plastic + contractor). The
values are modified due to the change of fertiliser costs described in foot note 1. 5. Fertiliser in scenarios refers the combined slurry of the digestate and silage effluent which is returned back to the farmer.

GBR feedstock quality scenarios
103
spent unloading (L) was estimated at €1.07 t-1 DM silage. (O’Keeffe et al., submitted b):
T = Q (L + 2(
___
X -2) d) Eqn 4 Transport costs for the slurry did not take the 2 km “free” zone into consideration and were calculated using Eqn 5, and included both loading and spreading costs (L), calculated to be € 16.92 t-1 DM. Distance dependent costs (d) were €0.46 t-1 DM slurry (c. 5% DM) transported.
T = Q (L + 2(
___
X ) d) Eqn 5
2.3 Economic modelling
2.3.1 Profitability indicators
Net present value (NPV) was used as a measurement of cash flow in the GBR system and as a financial indicator of viability. A positive NPV indicates a potentially positive cash flow (profit) for the period in question and would suggest that the project has economic potential. A negative NPV indicates the project to be unviable and needs to be modified in order to have potential. For the GBR model, the (NPV) was calculated over a 10-year period at a discount rate (risk factor) (ir ) of 10% (O' Keeffe et al., submitted b).
2.3.2 Sensitivity analysis for biomass price delivered
The GBR profitability was determined as a function of biomass availability, DM yields and yields of desirable grass fractions. For the production system to be optimised there is a need to have an adequate volume of juice fraction to generate sufficient energy to process the fibre fraction. Therefore, a press cake content of 500-600 kg t-1 DM (i.e. mostly fibre) and press juice content between 400 – 500 kg t-1 DM (i.e. the energy fractions, CP and other soluble fractions) were the desirable feedstock qualities predicted by this study. The potential income for farmers above their production costs depends on the overall GBR system’s profitability. A sensitivity analysis was carried out assessing the change in profitability of the biorefinery against the potential price that the biorefinery could offer the farmers, for each scenario. The price offered, above the farmers production costs was increased from the base case
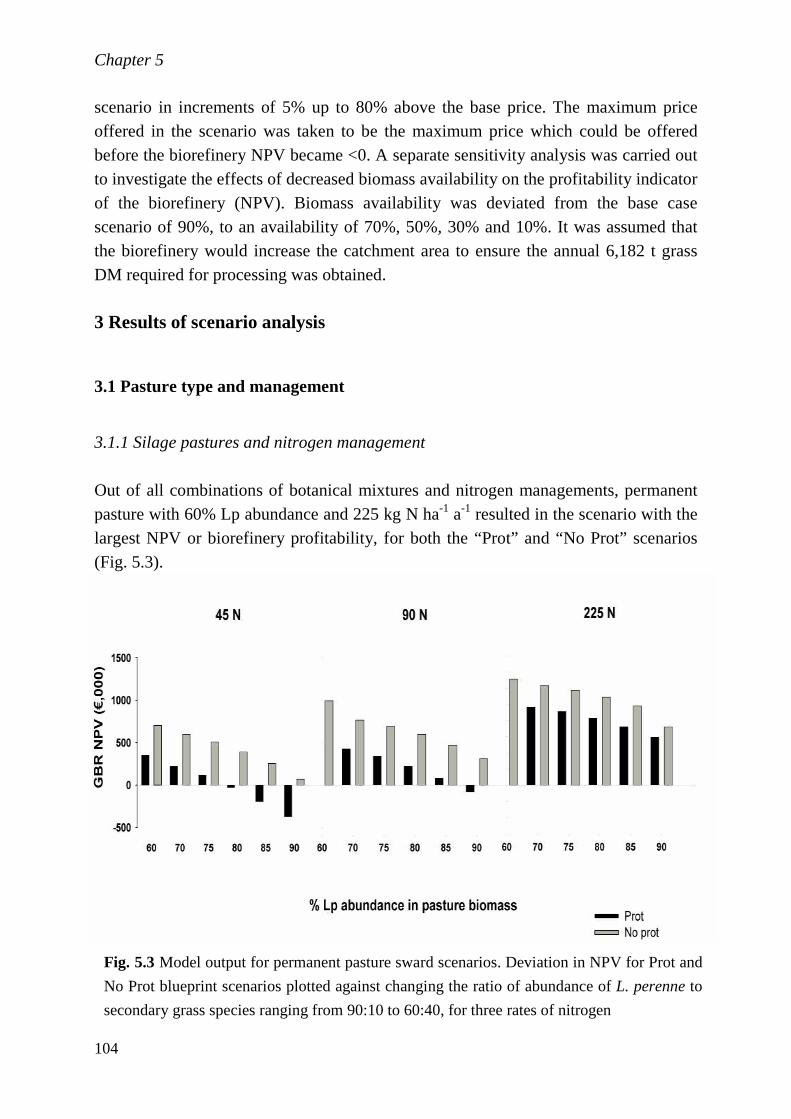
Chapter 5
104
scenario in increments of 5% up to 80% above the base price. The maximum price offered in the scenario was taken to be the maximum price which could be offered before the biorefinery NPV became <0. A separate sensitivity analysis was carried out to investigate the effects of decreased biomass availability on the profitability indicator of the biorefinery (NPV). Biomass availability was deviated from the base case scenario of 90%, to an availability of 70%, 50%, 30% and 10%. It was assumed that the biorefinery would increase the catchment area to ensure the annual 6,182 t grass DM required for processing was obtained. 3 Results of scenario analysis
3.1 Pasture type and management
3.1.1 Silage pastures and nitrogen management
Out of all combinations of botanical mixtures and nitrogen managements, permanent pasture with 60% Lp abundance and 225 kg N ha-1 a-1 resulted in the scenario with the largest NPV or biorefinery profitability, for both the “Prot” and “No Prot” scenarios (Fig. 5.3).
Fig. 5.3 Model output for permanent pasture sward scenarios. Deviation in NPV for Prot and
No Prot blueprint scenarios plotted against changing the ratio of abundance of L. perenne to
secondary grass species ranging from 90:10 to 60:40, for three rates of nitrogen

GBR feedstock quality scenarios
105
The “No Prot” scenarios always had a greater profitability than the “Prot” scenarios. The same abundance of Lp at the lower N rates of 45 and 90 kg N ha-1 a-1 rates was predicted to have the relatively better profitability in comparison to the other mixtures at the same nitrogen rate. The highest grass DM yields did not necessarily return the most profitable scenario (Fig. 5.4a); instead, this arose from the combination of relatively high grass yields and fraction proportions. The higher 225N rate resulted in grass DM yields greater than 11 t ha-1 a-1, and higher crude protein content greater than 130 kg t-1 DM, which buffered the GBR profitability against the low fibre fractions predicted with the high abundance of Lp (489 - 502 kg t-1 DM) (Table 5.1). Therefore, this high N management resulted in profitable outcomes for all scenarios. The lower N rate (45N and 90N) scenario, with a high Lp abundance in the biomass, resulted in the least profitable scenarios (NPV< 0), due to the combination of reduced DM yields (< 9 t DM ha-1 a-1) and lower fibre content (463 - 491 kg t-1 DM). The linear relationship between GBR NPV and the fraction proportion of fibre and protein are shown in Fig. 5.4b and 5.4c. 3.2 Implications of sensitivity analysis for on- farm scenarios
3.2.1 Sensitivity of GBR price offered to farmer
It was assumed that the base price offered to the farmer by the GBR was the break-even price for their production costs. For the set of scenarios (biomass availability 90%), at the 225N rate, farm production costs ranged from € 59 - € 62 t-1 DM for the “Prot” scenarios and €57- €62 for the “No Prot” 1st cut scenarios, depending on DM yields and biomass quality delivered to the biorefinery. The “No Prot” scenarios resulted in lower production costs for the farmer, because of the CP (proteinaceous) fraction being redirected to the digester. This resulted in a greater volume of digestate to be returned as fertiliser and a smaller chemical fertiliser requirement for the farmer to meet the nutrient management specified for each scenario. At the lowest N rate, 45N, farm production costs of €57 - €64 and € 54 - 59 t-1 DM, for “No Prot” and “Prot” scenarios, respectively Table 5.6 outlines farm production costs; however, for more in-depth information on calculations see Appendix 2. The analysis for the second cut silage predicted production costs at the high N rate to be € 98 - € 100 t-1 DM and € 94 - 95 for “Prot” and “No Prot” scenarios, respectively. At the low N rate, the costs increased to €114 - € 125 t-1 DM and €91 - 100, for the “No Prot” and “Prot” scenarios, respectively.

Chapter 5
106
The higher costs for the second cut silage were due to the lower yields in comparison to the first cut. The sensitivity of the GBR profitability (NPV) to changes in the price offered to the farmer for both the 1st and 2nd cut silage was analysed for each scenario (Fig. 5.5a and 5.5b). The unit changes in the GBR NPVs (€, 000) per unit change in price to the farmer (€ t-1 DM) at the different N rates (taken at 75% Lp abundance) of 225, 90, 45 kg N ha-1 a-1 rate were -37.99, -39.74, and -43.47 (€, 000), respectively.
Fig. 5.4 Model predicted (a) DM yields (at 75% Lp content only) (t a-1), (b) fibre fraction
and (c) crude protein fraction (kg t-1) against deviation in GBR NPV for protein and non
protein blueprint scenarios, at three rates of nitrogen application 225, 90, 45 kg N ha-1 a-1,
for protein and non protein blueprint scenario.

GBR feedstock quality scenarios
107
The GBR NPVs were less sensitive to increased prices offered to farmers for the second cut silage at the different N rates, with lower corresponding values of -23.58, -21.70 and -21.33(€,000) . The trends remained similar for the “No Prot” scenarios, being -38.46, -39.39, -30.10 (€,000) for 1st cut and -23.35, -21.89, and -20.41 t for 2nd cut, for N application rates of 225, 90, 45 kg N ha-1 a-1, respectively. 3.2.2 Reduced biomass availability – GBR NPV vs. farmer profitability
It was assumed that with reduced biomass availability, a larger catchment area was required to supply adequate biomass for 46 weeks of operations. Increased transport distances translated into increased transport costs and a reduced GBR profitability for all nitrogen and botanical composition combinations (Fig. 5.6). When biomass availability declined to 30%, the transport distances increases (the same for both “Prot” and “No Prot” scenarios) to 2.25 – 2.5 km, equating to 0.25 – 0.5 km above the “non charge zone” of 2 km. This increased biomass transport costs from zero to c. €2.20 - €3.15 t-1 DM transported (DM yield dependent). At a biomass availability of 10%, transport distances increased to 3.9 - 4.3 km. This increased transport costs by c. €9.25 - €10.9. The transport and spreading costs for the returned digestate for the biorefinery ranged between €26 - €29 t-1 DM for all scenarios. The greater average haul distances to the biorefinery resulted in a lower price offered to farmers above their production costs (profit). For the scenarios at the lower N rate, this led to a financial loss for the farmer. Fig. 5.6 shows these trends for a sward containing 75% Lp, for N application rates of 45, 90, and 225 kg N ha-1 a-1. When a catchment area has 90% biomass available to be supplied to the biorefinery, the highest price could be offered to the farmers and hence a higher profit above their production costs, ranging from €21.60 t-1 DM for the scenario with 225 N and 75% Lp, to €9.37 for the scenario with 90N and 75 % Lp. For the 45 N rate scenarios, the farmers were predicted to make a loss. The “No Prot” scenarios predicted higher prices offered to farmers above production costs of €28.61 for the 225 kg ha-1 N and 75% Lp scenario, €17.25 for the 90 kg N ha-1 a-1 and 75% Lp scenario, and €11.97 for the low N and 75% Lp scenario. Higher N rates (with 60-75 % Lp), returned the greater profitability for the farmer, even when biomass availability was reduced to 30%.

Chapter 5
108
Fig. 5.5 Deviation in biorefineries profitability (NPV, €000) plotted against increasing price
offered to farmer above production costs of grass (a and c) 1st cut (€ t-1DM) and (b and d)
second cut for “Prot” and “No Prot” scenarios, respectively. Graph shows change in NPV for
Prot and No Prot blueprint scenarios plotted against changing the ratio of abundance of L.
perenne to secondary grass species for 90:10, 75:25 and 60:40, for three rates of nitrogen
application: 225, 90, 45 kg N ha-1 a-1.
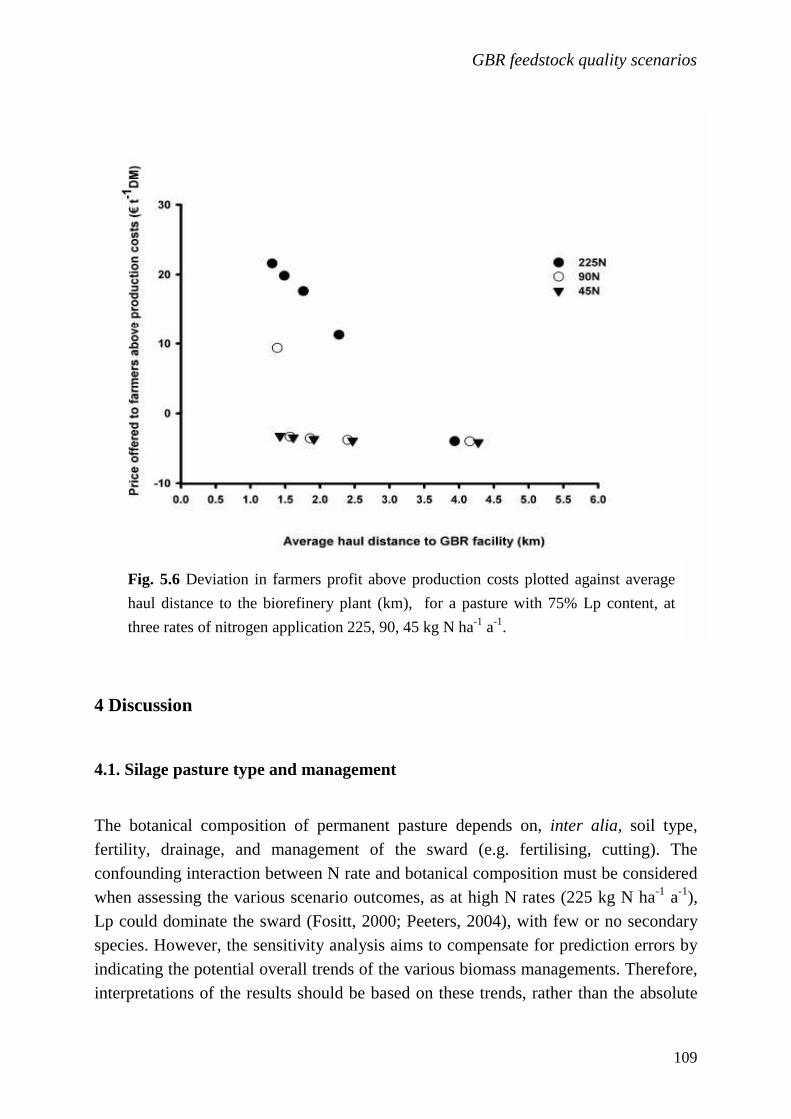
GBR feedstock quality scenarios
109
4 Discussion
4.1. Silage pasture type and management
The botanical composition of permanent pasture depends on, inter alia, soil type, fertility, drainage, and management of the sward (e.g. fertilising, cutting). The confounding interaction between N rate and botanical composition must be considered when assessing the various scenario outcomes, as at high N rates (225 kg N ha-1 a-1), Lp could dominate the sward (Fositt, 2000; Peeters, 2004), with few or no secondary species. However, the sensitivity analysis aims to compensate for prediction errors by indicating the potential overall trends of the various biomass managements. Therefore, interpretations of the results should be based on these trends, rather than the absolute
Fig. 5.6 Deviation in farmers profit above production costs plotted against average
haul distance to the biorefinery plant (km), for a pasture with 75% Lp content, at
three rates of nitrogen application 225, 90, 45 kg N ha-1 a-1.

Chapter 5
110
values. Overall, the higher DM yields with higher N rates resulted in GBR scenarios with greater profitability. The botanical models predicted higher annual DM yields with greater Lp abundance and high N rate (Frame, 1989; Peeters, 2004). However, the higher DM yields did not result in GBR scenarios with the highest profitability indicators, as the scenarios with a lower Lp content and greater secondary species content gave higher GBR profitability within each N rate. The botanical models predicted these swards to have the higher fibre fraction (Table 5.1). This higher fibre content was expected, as secondary species, such as the two examples in this study, Agrostis spp. and Holcus lanatus, are known to have a higher fibre content (Haggar, 1976; Haggar et al., 1989), lower WSC and CP contents (Bruinenberg et al., 2002; Keating and O'Kiely, 2000a). However, it should be noted that permanent pastures with a high abundance of secondary grass species contributing to the biomass (>60%), have a lower sugar content and are less likely to ensile as well as pure Lp swards (Frame, 1989; Keating and O'Kiely, 2000b); therefore having a mixture with ensilable grasses such as Lp may be more favourable overall, but this will need further detailed research. For biorefineries producing fibre and protein based products, the scenario outputs suggest that a balance between high DM yields, fibre and protein fractions was required to make the system financially viable. The balance between CP proportion and fibre was also very important for the GBR profitability, i.e. the NPV. In the “No Prot” scenarios, the CP fraction was assumed to be added to the juice fraction and to be sent to an anaerobic digester to produce energy from the biogas generated. This energy was then used in the system for drying the fibre. The scenarios with low fibre and low CP content resulted in negative NPVs for the “Prot” scenarios; however, for the “No Prot” scenarios they had positive NPVs. In the “No Prot” scenarios, the energy generated by the CHP plant was greater, due to the addition of the entire CP fraction. The greater energy production resulted in lower production costs and hence the “No Prot” scenarios were predicted to be more profitable. The results also suggest that the “No Prot” scenarios, with greater NPV values, were more resilient to changes in the biorefinery system than the “Prot” scenarios. This can be attributed to the lower production costs of the “No Prot” system and to the higher value obtained for the fibre products in these scenarios. The overall outcomes of this scenario analysis suggest that grass yields in the range of 9-12 t ha-1 of DM, with a fibre content ranging from 500-550 g kg-1 DM and a protein content of 110-130 g kg-1 DM result in a viable GBR system. The results also suggest that GBRs supplied with a biomass feedstock from permanent pasture with a relatively

GBR feedstock quality scenarios
111
high Lp content (greater than 60%), and high N fertilisation, were suitable to supply a GBR system producing fibre fraction products and/or crude protein products and using waste streams as a fertiliser.
4.2. On- farm scenario results
The value of the grass feedstock, over and above production costs, depends on the profitability of the GBR. It was assumed that the GBR system remained constant and operated under ideal conditions, i.e. continuous operation and profitable marketing of all products manufactured. The resilience of the GBR to external economic factors has not been assessed in this study. However, this study has illustrated the GBR’s resilience to variation in the supply of biomass and has shown how deviations in supply can affect the overall profitability of the GBR system, including the income of farmers supplying such a system.
4.2.1 On-farm production costs and price offered by GBR
It was assumed that the waste streams from the biorefinery processing, silage effluent and digestate from the CHP facility were returned as combined slurries to the fields harvested. The return of nutrients resulted in reduced production costs for the farmer, due to the nutrient replacement value of the returned slurry. It was assumed that the effects of returned slurry on factors such as soil pH and plant scorch were negligible. The higher costs for farmers to apply a high rate of fertiliser of 225 kg N ha-1 a-1 were compensated by increased DM yields. The scenarios with higher Lp abundance in the sward and lower N rates (45N and 90N) resulted in lower production costs for the farmer. However, the lower fibre yields associated with these swards resulted in the GBR of these scenarios having a lower NPV and therefore a lower price offered to the farmer. The quantity of returned slurry to the harvested grasslands varied between the two scenario systems modelled, “Prot” and “No Prot”. In the “No Prot” scenario it was assumed that the crude protein is diverted to the digester to generate additional processing energy. This resulted in an increased quantity of digestate being returned to the farmer and hence cheaper production costs, as the slurry reduced the requirement to purchase chemical fertiliser. The lower base production costs of the feedstock meant lower input costs for the biorefinery, combined with reduced energy costs and

Chapter 5
112
relatively low price obtained for CP, resulted in higher NPV values for the “No Prot” scenarios and higher price offered to the farmer. The sensitivity analysis to assess unit changes in the GBR NPVs (€,000) per unit change in price to the farmer (€ t-1 DM) was carried out simultaneously for both first and second cuts, i.e. both prices offered for first and second cut were simultaneously increased by increments of 5%, above the base price applied in the model. The larger quantity of grass harvested in the first cut meant that the total cost for the first cut were higher than those for the second cut. Therefore, increasing the price for the first cut offered to farmers had a greater effect (steeper slope) on the biorefineries’ NPV than increasing the price for the second cut.
4.2.2 Sensitivity of price offered to farmer above production costs - biomass
availability
In the original, idealised model, the biorefinery was located in a predominantly rural grassland area, and supplied by all farmers in the catchment area; as a result, biomass availability was assumed to be 90%. However, in reality, reduced biomass availability may impact on the profitability of the entire system and the potential price offered to farmers (Kromus et al., 2004). The reduced biomass availability was associated with greater distance-dependent costs, as the model automatically adjusts the catchment area size to the area needed to supply the 6,182 t DM a-1 required annually. The outcomes of this sensitivity analysis suggest that the profits made by farmers will greatly depend on biomass availability. The price differences ranged from a loss of € 4 t-1 DM for 10% biomass availability, to a profit of € 26 - 28 t-1 DM with a biomass availability of 90%, depending on the scenario conditions. Therefore, it is essential for both the GBR and the farmers that GBRs are located in areas with a guaranteed supply of biomass, which requires high DM yields, distance to biorefinery and a high participation rate of farmers in the catchment to supply the biorefinery plant. These results suggest that, in order to assure a guaranteed supply of grass biomass, renting of land in the catchment area from the farmer may be a prudent option for the GBR. 5 Conclusions
The profitability of the GBR system had a large dependency on the DM yields of the grass feedstock, as well as on the yields of the grass fractions. These yields were

GBR feedstock quality scenarios
113
directly linked to application of N fertiliser and botanical composition. The availability of biomass within the immediate catchment of the GBR was crucial for the GBR system to be profitable. In most cases reduced biomass availability, below 30% resulted in a loss for both the GBR and farmer due to increased transport costs. The overall outcomes of this scenario analysis indicated that grass yields in the range of 9 - 12 t DM ha-1, with a fibre content ranging from 550 - 500 g kg-1 DM and a protein content of 110 - 130 g kg-1 DM, had the potential to result in a viable GBR system. The results of these scenarios indicated that GBRs supplied with a biomass feedstock from permanent pasture with an Lp content of at least 60%, with relatively high N fertilisation (225 kg N ha-1 a-1), was suitable to supply a GBR system producing fibre fraction products and crude protein products. Under the scenario assumptions modelled in this study, farmers could be offered in the range of €4 - €28 t DM-1 above their production costs, which were dependent on the scenario conditions analysed. However this will depend on the DM yields and biomass availability of the catchment area supplying the GBR. It has also been shown in this study that the “No Prot” scenario, with the greater NPV indicators, appears to be more resilient to changes in the biorefinery system than the “Prot” scenario.

114

115
Appendix 5.1

Appendix 5.1
116
Table 5.1A. Silage harvest dates and mean daily weather characteristics during each growing period for field trial plots during 2007 and 2008
Year & Harvest Dates
Weather1
Management of sites 2007 2008
Radiation
(J cm-2 day-1)
Temperature
(ºC d-1)
Rainfall
(mm d-1)
SMD (mm)
First cut silage Wexford 28th May 1429 10.38 1.26 47.18 26th May 1407 9.78 2.48 8.92 Cork 29th May 1452 10.22 1.02 32.01 27th May 1376 9.79 1.88 11.56 Offally 28th May 1527 9.18 0.89 33.77 29th May 1502 9.22 1.20 16.78 Roscommon 6th June 1622 10.82 1.26 31.68 3rd June 1543 10.33 1.32 30.49 Monagahan 7th June 1360 9.57 1.61 20.49 5th June 1491 9.90 1.94 16.15 Fermanagh 9th July 1664 11.38 2.30 12.44 25th June 1723 10.98 2.13 21.97 Second cut silage Wexford 23rd July 1520 13.05 3.81 6.87 28th July 1625 14.08 3.47 11.62 Cork 24th July 1521 13.14 3.65 16.50 30th July 1490 13.41 3.28 17.70 Offally 25th July 1539 13.40 3.65 17.22 5th Aug 1480 13.88 3.38 21.99 Roscommon 30th July 1567 14.45 3.16 13.09 M/D2 - - - - Monagahan 31st July 1421 13.91 3.90 11.71 6th Aug 1394 13.98 2.53 27.05 1. Soil Moisture Deficit (SMD) = average soil moisture deficit (mm) 2. M/D = Missing harvest data

Appendix 5.1
117
Tabl
e 5.
1B. D
etai
ls o
f far
m ty
pe, s
oil a
nd g
rass
lan
d fro
m th
e fie
ld tr
ial p
lots
Li
st o
f site
s
Site
coo
rdin
ates
Farm
man
agem
ent /
type
Sw
ard
age
(yea
rs)
G
rass
land
type
Soi
l typ
e/te
xtur
e
Dra
inag
e ty
pe
N
utrie
nts
stat
us
pH1
P2
K
2
m
g L-1
m
g L-1
Wex
ford
52
º18'
N; 6
º30'
W
Inte
nsiv
e be
ef
5
- 10
Loliu
m Im
prov
ed
Loam
y so
il ty
pe
Mod
erat
ely
drai
ned
5.29
8.
8 10
5
Cor
k 52
º13'
N; 8
º42'
W
Ext
ensi
ve d
airy
5
- 10
Lo
lium
Impr
oved
Lo
amy
soil
type
M
oder
atel
y –
wel
l dra
ined
6.30
18
.4
133
Offa
lly
53º2
0'N
; 7º8
'W
Mix
ed ti
llage
&
lives
tock
(she
ep)
> 10
M
ixed
sw
ard
San
dy c
lay
loam
Mod
erat
ely
drai
ned
6.16
10
.5
129
Ros
com
mon
53
º30'
N; 8
º2'W
E
xten
sive
mix
ed li
vest
ock
5 - 1
0 M
ixed
sw
ard
San
dy c
lay
loam
Mod
erat
ely
drai
ned
5.37
3.
2 96
Mon
agha
n 53
º59'
N; 6
º44'
W
Ext
ensi
ve b
eef
>
10
Mix
ed s
war
d S
andy
cla
y lo
am
(hea
vy c
lay)
M
oder
atel
y dr
aine
d 6.
00
5.2
75
Ferm
anag
h 52
º26
' N; 8
º7'W
S
heep
5 - 1
0 M
ixed
sw
ard
Org
anic
san
dy
loam
P
oorly
dra
ined
5.
13
5.9
92
1.
pH 1
:2 S
oil w
ater
ratio
2.
M
orga
n’s
extra
ctab
le s
olut
ion
(Mor
gan,
194
1)
Appendix 5.1
118
Appendix 5.2

Appendix 5.2
119
Table 5.2A Logistic equations 1Catchment area sizing
aY
cQQA
+=
πA
x=
A = catchment area of biorefinery (ha) Y= DM yields of feedstock (t DM ha-1) Q = quantity of feedstock required for the 46 weeks of
biorefinery operation (t DM a-1) a = biomass availability factor (%) c= correction factor for additional biomass required to
compensate for system losses e.g. field losses, ensiling losses x = radius of circular catchment (km)
τxX3
2__
= τ = tortuosity factor - the ratio of actual distance travelled to line of sight distance (τ = 1.33)
=___
X average haul distance between the biorefinery plant at the centre of a circle radius of silage fields (km)
Transport costs 2T = Q (L+2
___
X d) 3T = Q (L + 2(
___
X -2)d)
T = total transport costs (€ t-1 DM) L = unloading costs only for raw material/inc spreading for slurry (€ t-1 DM) d = distance dependent costs (€ t-1 DM) (not considered if distance < 2 km)
Vt = Tfd + Tdig Vt = total variable transport costs (€ a-1) Tfd = transport costs of feedstock (if distance <2 = 0 ) (€ t-1 DM) Tdig = transport costs of digestate (€ t-1 DM)
1 . (Overend, 1982) 2. (Walla and Schneeberger, 2005) 3. Modified to account for the 2 Km free zone

Appendix 5.2
120
Table 5.2B - Mass Balances Raw material quality (Silage ) Btot = Σ Fi + Fj +…. Fn Fi = BDM × α i Fn = BDM × α n
Btot = total quantity of the feedstock DM (t a-1) (i.e. fibre + crude protein + ash + lactic acid, etc.) Fi = fraction yield of i component (t a-1) Fn = fraction yield of nth component (t a-1) α i = fraction of i in feedstock (kg t-1) α n = fraction of n in feedstock (kg t-1) BDM = DM yield of feedstock (t a-1)
Press cake (before washing)
PCT = Σ PCi + PCj +…. PCn PCi = Bi × Fji
PCn = Bn × Fjn
PCT = total quantity of press cake DM(t a-1) (i.e. fibre + Crude protein + ash + lactic acid, etc.) PCi = press cake content of i component (t a-1) PCn = press cake content of nth component (t a-1) Fji = content of desired fraction (i.e. fibre) in press cake (kg t-1) (0.95) Fjn = content of nth fraction impurity left in press cake (kg t-1)
Press juice (before addition of washings from fibre)
PJT = Σ PJi + PJj +…. PJn PJi = Bi ×Fki
PJn = Bn × Fkn
PJT = total quantity of press cake DM (t a-1) (i.e. fibre + crude protein + ash + lactic acid, etc.) PJi = press juice content of i component (t a-1) PJn = press juice content of nth component (t a-1) Fki = content of desired fraction (i.e. CP) in press juice ( kg t-1) Fkj = content of nth fraction impurity left in press juice ( kg t-1)
Product fibre
Prod xT = Σ Prod xi + Prod xj +…. Prod xn Prod xi = Bi × Fli
Prod xn = Bn × Fln
ProdxT = total quantity of fibre product (t a-1) (i.e. fibre + impurities (crude protein + ash + lactic acid, etc.) Prodxi = content of i component in final fibre product (t a-1) Prodxn = content of nth component in final fibre product (t a-1) Fli = content of desired fraction (i.e. fibre) in press juice (kg t-1) Flj = content of nth fraction impurity left in press juice (kg t-1)
CP Product
Prod ytot = Σ Prod yi + Prod yj +…. Prod yn Prod yi = Bi × Fqi
Prod yn= Bn × Fqn
ProdyT = total quantity of protein product (t a-1) (i.e. crude protein + impurities (fibre + ash + lactic acid, etc.) ) Prodyi = content of i component in final fibre product (t a-1) Prodyn = content of nth component in final fibre product (t a-1) Fqi = content of desired fraction (i.e. fibre) in press juice (kg t-1) Fqn = content of nth fraction impurity left in press juice (kg t-1)
Stillage stream – Digester feedstock
SST = Σ SSi + SSj +…..SSn
SSi = (Fi – (Prodxi + Prodyi) SSn = (Fn – (Prodxj + Prodyj)
Ss T = total quantity of stillage stream after bio-processing (t a-1) Ssi = content of i component remaining in stillage (t a-1) Ssn = content of nth component remaining in stillage (t a-1)
VDS = SSi +SSj + …..SSn VDS = volatile dry solids (t a-1) (fibre, crude protein, lactic acid and ODM, excluding ash) (ODM (organic dry matter) is a term to group compounds such as water soluble components e.g. sugars, VFA (butyric acid, acetic acid, propionic acid), as well as insoluble components fats, oils and smaller fibre fractions.

Appendix 5.2
121
Table 5.2B (continued) - Mass Balances Digestate - Fertiliser
VDS fert = Fdig × VDS Fdig= fraction of VDS remaining after digestion process (0.4) Ash = Fash× SSash Fash = ash fraction remaining in digestate Nutrient replacement value of slurry 1Silage Effluent
2936.0)(4.53767 xDMEff grass +−= Eff = effluent production in litre per tonne herbage ensiled (l t-1)
xeff eDM 23.03.19401.0 −+= DMeff = percent dry matter lost in the effluent
Nitrogen
RN= SNavail + DigNavail RN= returned nitrogen – replacement for chemical fertiliser SNavail= plant available N, values from the literature suggest 2-4% of total N (see O’ Keeffe et al., submitted b) DigNavail = total amount of available Nitrogen from digestate annually (ta-1)
effluentgeffN DMNS *=
SN availT =SeffN × EffN SNavil = SN availT / A
SeffN = nitrogen lost in the effluent dry matter (kg N m-3 effluent a-1) Ng = nitrogen content in grass biomass harvested SN availT = total amount of Nitrogen available annually from silage effluent (t a-1) Eff N = fraction of plant available N (0.3) A = catchment area of biorefinery (ha)
CPprodfibreext CPCPCP +=
Next = CPext /6.25
CPext = CP extracted during the biorefinery process (t CP a-1) CPfibre= crude protein removed in the fibre fraction or presscake fraction (t CP a-1) CPcpprod = CP fraction removed for production of animal feed (t CP a-1) Next = N extracted during the biorefinery process (t N a-1)
25.6extN
N
NBDig
−= BN = initial N content in raw feedstock (N= CP/6.25) DigN = nitrogen content of the digestate (t N a-1) (N= CP/6.25)
NfnTavailN DigDigDig *=
Dig Navail = Dig NavailT /A
Dig NavailT = total amount of nitrogen available annually from digestate (t a-1) Digfn = the average from the literature was found to be ca. 72.5% of the total N (estimations from original model) (see O’ Keeffe et al., submitted b)
Phosphorus Rp = SP + DigP
Rp = RN= returned phosphorus – replacement for chemical fertiliser (kg ha-1 a-1) SP = phosphorus returned from silage effluent (kg ha-1 a-1) DigP = phosphorus returned from digestate (kg ha-1 a-1)
effluentgeffP VolPS *=
Sp = Seffp /A
Seffp = annual yield of Phosphorus from silage effluent (t a-1) Pg = phosphorus content of silage effluent (kg m-3) Vol effluent = annual volume of silage effluent produced (t a-1) (m-3 ≈ t)
DigpT = Digfp × DigVol
Dig P = DigpT /A
DigpT = annual yield of Phosphorus from digestate (t a-1) DigFp = phosphorus content of digestate literature value suggests 0.19 (kg m-3) Dig vol = annual volume of silage effluent produced (t a-1)

Appendix 5.2
122
Table 5.2B (continued) - Mass Balances Potassium
RK = SK + DigK Rk = RN= returned potassium – replacement for chemical fertiliser (kg ha-1 a-1) Sk = potassium returned from silage effluent (kg ha-1 a-1) DigP = potassium returned from digestate (kg ha-1 a-1)
effluentgeffK VolKS *=
SK = SeffK /A
SeffK = annual yield of Potassium from silage effluent (t a-1) Pg = potassium content of silage effluent (kg m-3)
Vol effluent = annual volume of silage effluent produced (t a-1) (m-3 ~ t)
DigKT = DigfK × DigVol
Dig K = DigKT /A DigKT = annual yield of Potassium from digestate (t a-1) DigFK = potassium content of digestate literature value suggests 3.08 (kg m-3) Digvol = annual volume of silage effluent produced (t a-1)

Appendix 5.2
123
Table 5.2C Economic variables and equations Profitability of biorefinery All variables are € a-1 BGp= (P-SC-CE-ISC-V)
BGp = Biorefinery Gross profit (€ a-1) P = Profit (€ a-1) SC = Total specific costs, i.e. engineering, silos (€ a-1) CE= Equipment maintenance (€ a-1) V = Total variable costs (€ a-1) ISC = Indirect sales costs i.e. marketing costs (€ a-1)
P = Sf + Sp +Se P = proceeds (€ a-1) Sf = sale of fibre products (€ a-1) Sp = sale of crude protein products (€ a-1) Se = savings made from CHP plant – energy returned (€ a-1)
Variable costs V = Vfd + V r + Ve + Vst+Vt
Vfd = feedstock costs (€ t-1 DM) Vr = variable costs of refining silage (excluding energy) Ve = energy deficit costs (€ kW a-1) Vst = staff salaries (€ per a-1) Vt = transport costs (€ t-1 DM)
V fd = Pf × Qt Pf = price paid to farmer (€/t DM) Qt = quantity of biomass processed in a year (7,000 t DM a-1)
Ve = [EAD – Σ Er + Ep + EAdd] × € kW-1 EAD = energy from digester (heat and electrical) (kW a-1) Er = energy required for fibre production (kW a-1) Ep = energy required for protein production (kW a-1) EAdd = parasitic energy of the AD plant (kW a-1)
Vs = Stp + Stf Stp = storage costs protein (t-1 DM) Stf = storage costs fibre (t-1 DM)
Vr = Wadd
Wadd = costs of additional water for processing (€ m-3)
Cash flow PbT = (BGp- D- INT)
PbT = profit before tax (€ a-1) D = depreciation (€ a-1) Int = interest on loan repayments (€ a-1)
CF = (PaT + D – INV + SSD) CF = cash flow (€ a-1) PaT = profit after tax (€ a-1) INV = investment (€ a-1) SSD = subsidies (government)(€ a-1)
)1(0t
tT
t ir
CFNPV
+=∑
=
NPV = Net Present Valueir = interest rate for investment weighted by risk (€1) T = year of operation (t= 1, 2, 3…10)(T = 10)

Appendix5.2
124
Table 5.2 D - Farmers Equations Farmers profit Fp= Fd – Cg
Fp = Farmers profit (€ t-1 DM ) Fd = Sale of grass to biorefinery – base costing of production (€ t-1 DM ) Cg = overhead costs (€ t-1 DM )
Production cost Cg = Σ m + M + H
m = maintenance costs – roads fencing (€ t-1 DM ) M = management costs (€ t-1 DM ) H = harvesting costs – contractor price (€ t-1 DM )
M = L + Fert L = cost of liming (€ t-1 DM ) Fert = cost of fertilisers N , P , K (kg ha-1 a-1)
Fert = Σ a (Nr – RN) + b(Pr-Rp) + C(Kr-Rk) a = replacement cost of nitrogen fertiliser (€ kg-1) Nr = required rate of N (45, 90, 225, kg ha-1 a-1) RN = returned nitrogen from waste of GBR (kg ha-1 a-1) b = replacement cost of nitrogen fertiliser (€ kg-1) Pr = required rate of phosphorus (30 kg ha-1 a-1) Rp = returned phosphorus from waste of GBR (kg ha-1 a-1) C = replacement cost of Nitrogen fertiliser (€ kg-1) Kr= required rate of K (155 kg ha-1 a-1) Rk =returned potassium from waste of GBR (kg ha-1 a-1)

Appendix 5.2
125
6 Farmer case study scenarios to assess the effect of
biomass availability on the profitability of the Green
Biorefinery and impacts for the farmer
S. M. O’Keeffe, R.P.O. Schulte, C. O Donoghue, and P.C. Struik. To be submitted

Chapter 6
126
ABSTRACT
In Ireland, grass is a readily available bioresource. It has previously been established that Green biorefinery (GBR) is a potential use of Irish grasslands, and a blueprint for a sustainable GBR industry in Ireland has been developed. The objective of this paper is to investigate the sensitivity of the GBR blueprint profitability to variations in the geographical constraints of total and surplus biomass availability, using a spatial scenario analysis of two contrasting case studies; (i) a dairy farm in the south (Farm A); and (ii) a beef farm in the mid-west (Farm B). As an outcome of these scenario analyses, the price the GBR can offer to farmers above their production costs (€ t-1 dry matter) was calculated. A partial budget analysis was carried out to determine the viability for both case study farms to supply a GBR. The results of the partial budget analysis for the different scenarios showed that switching to a GBR system was not a viable option for the dairy farmer and depending on the scenario analysed was an option for the beef farmer. The scenarios analysed demonstrated that providing a GBR with surplus grass biomass would be financially viable for both farmers. However, establishing a GBR in an area typical of Farm A, dominated by dairy farm systems and high livestock numbers, in the mid-short-term, would not be a viable option for a GBR, as it would have to compete for grass biomass. Establishing a GBR facility in an area typical of Farm B, dominated by beef farming would be an option for a GBR system, due to the lower livestock units, and low farm income. The results of the scenarios suggest that the GBR may not necessarily need to compete with beef production to gain an adequate supply of grass. There is also the benefit for the farmer for locating a GBR in such a region, as should the farmer desire to destock further, then they have the potential to supply a GBR. Keywords: Green biorefinery, grasslands, silage, energy, fibre, biomass
1 Introduction
Recent full decoupling of EU agricultural subsidy payments from production in Ireland is forecasted to result in substantial destocking of grassland over the coming decade (Styles et al., 2008) potentially generating a large surplus of grass, both in Europe, grass biomass could become one of the most valuable future biomass resources. Exploitation of grass for use as a bioenergy crop (Ceotto, 2008; Murphy and Power, 2006) and as a raw material for “Green biorefinery” (GBR) have been shown to have potential (Grass, 2004; O' Keeffe et al., 2009). Green biorefinery involves applying technology to chemically and physically fractionate grass and grass silage

Case studies
127
(Kiel, 1998) into two streams: press cake (the solid fibre fraction) and press juice (the liquid fraction). O’ Keeffe et al. (submitted b) developed an Irish GBR blueprint model, for the production of insulation material from the press cake and the extraction of the proteinaceous fraction from the press juice, with a view to producing animal feed, or alternatively using the press juice for energy generation to reduce GBR processing costs. This blueprint was based on a feedstock of grass-silage from a two-cut silage system. Subsequent scenario analysis identified three important geographical constraints, which determined the profitability of the GBR and hence influence the optimal location of a GBR. These were:
• the availability of grass biomass in the GBR catchment area, • the dry matter (DM) yields of the region and, • indirectly, the quality of the biomass (fibre and crude protein content).
For this study grass biomass availability was determined by the area under grassland in the GBR catchment and the number of livestock (dairy cows, beef cattle, and sheep) supported by the available grassland (i.e. using it as fodder). DM yields are also influenced by geographical location, as total annual grass DM production varies from approx. 15 t ha-1 in the southwest to 11 t ha-1 in the northeast in an average year (Brereton, 1995). One of the key factors determining grass quality is the botanical composition of the sward, which depends on, inter alia, soil type, fertility, drainage and management of the sward (i.e. cutting, grazing, fertilising) (Fositt, 2000). The natural and agricultural setting of the biorefinery catchment region introduces regional economical factors, which will influence the overall process structure (Halasz et al., 2005). Hence, this introduces a further socio-economic constraint for the development of a GBR, i.e. in areas where current farming systems are profitable, supplying grass to a GBR may not necessarily provide any additional financial benefits to farmers potentially supplying a GBR. Three spatial studies have been identified as geographical data sources for determining the potential geographical constraints and social-economic factors which could influence the location of a GBR. These are: 1. The CORINE 2006 data map of the Irish environmental landscape, which contains data on the grassland cover of a region. 2. The geographical output from the Simulation Model for the Irish Local Economy

Chapter 6
128
(SMILE), which enables the socio-economic aspects of simulated farming enterprises at a local level, electoral division (ED) across Ireland to be analysed (Hynes et al., 2006). This model can be queried to determine farm gross margins and livestock units of a particular region.
3. The detailed empirical analysis of the geographic of farm structures and farming systems by Crowley et al. (2007), synthesised into a typology of five farming zones, or five different farming zones within Ireland; this typology can be used as an indicator of potential farming type in a particular region (Fig. 6.1, refer to text below).
The objectives of this paper are to assess: 1. The extent to which the geographical constraints of total biomass availability and
surplus biomass availability impacts on the: I. GBR profitability;
II. Profitability of the farmer supplying all or surplus grass to the GBR. 2. The extent to which socio-economic factors of each case study govern the
attractiveness of GBR for both the farmer and green biorefinery operators, using partial budget analysis.
In this paper, we subject the GBR blueprint model of O’Keeffe et al. (submitted c) to scenario analyses, using GIS spatial analysis of two contrasting case studies: (i) a dairy farm in the south of Ireland, and (ii) a beef farm in the mid-west of Ireland.
2 Development of the base models - materials and methods
The modelling system had five main steps (Fig. 6.2): Step 1 – Field trials/Map generation: O’Keeffe et al. (submitted a) established field trials sites around Ireland in the agricultural zones outlined by Crowley et al. (2007). The coordinates of the field trial farms were used as a proxy location for the biorefinery plant, in order to conduct the GIS analysis in step 3. Step 2 – A grassland map: The CORINE 2006 map was used to calculate the percentage grassland area per electoral division (EPA, 2007) . Step 3 – Calculation of biomass availability. The proximity buffer analysis tool in Arc GIS was used to generate the catchment area of the GBR (ha). The buffer layer was

Case studies
129
then overlaid with the percentage grassland map, from step 2 and the initial “total biomass availability was calculated.
Step 4 – Economic modelling (Fig. 6.3): The biomass availability factor calculated from step three was used in the GBR process model of O’Keeffe et al. (submitted, b) was then subjected to scenario analyses to calculate the price the GBR can offer farmer A and farmer B above their production costs (€ t-1 dry matter).
Fig. 6.1 Agroclimatic regions outlined in Crowley et al. (2007) and the locations of the field trial sites and case studies A and B.

Chapter 6
130
Step 5 – Partial budget analysis (Fig. 6.4): The maximum price which can be offered to the farmer above their production costs calculated in step 4 was used in a partial budget analysis, to determine the feasibility for both the farmer to supply all or surplus biomass to the GBR. A comparison was then made between businesses as usual scenarios and the GBR scenario predictions. 2.1 Step 1 - Case study selection and map generation
The scenario analysis in this study will focus on two of the main agricultural systems in Ireland, dairy and beef (Table 6.1). Crowley et al. (2007) made a detailed empirical analysis of the geographic of farm structures, farming systems, agricultural measures and the extent of part-time farming, which was synthesised into a typology of five farming zones, within Ireland (Fig. 6.1). Fig. 6.2 Schematic of modelling steps. Grey boxes are to highlight the models relevant to each step. (Acronyms are as follows: National Farm Survey (NFS), Central Statistics Office (CSO)).

Case studies
131
Tab
le 6
.1. C
ase
stud
y so
cio
-eco
no
mic
, bo
tan
ica
l, ge
ogr
aphi
cal
des
crip
tion
s an
d d
ata
so
urce
s
Ca
se s
tud
y A
C
ase
stu
dy
B
Da
ta s
ou
rce
S
oci
o-eco
nom
ic
Zon
e
Ora
nge
G
reen
(C
row
ley
et
al.,
200
7)
Fa
rm t
ype
D
iary
C
attl
e r
ear
ing
(C
row
ley
et
al.,
200
7)
Gro
ss m
argi
ns fa
rms
in r
egio
n (
€ h
a-1 )
1
,093
8
38
SM
ILE
out
put
S
ize
cate
gory
of
farm
(h
a)
48
3
6
SM
ILE
out
put
S
wa
rd d
ata
Sw
ard
typ
e
Inte
nse
ly m
ana
ged
(L
. pe
ren
ne ~
90%
) Le
ss in
ten
sive
ly m
ana
ged
(L
. pere
nne
~ 7
5%)
Fie
ld t
rial d
ata
A
ge o
f sw
ard
(a
nnum
) 7
-11
7-1
1 (O
' Ke
effe
et
al.,
Sub
mitt
ed
a)
So
il ty
pe/te
xtu
re
Loam
y so
il ty
pe
San
dy c
lay
loam
(h
eavy
cla
y)
(O' K
eef
fe e
t al
., S
ubm
itte
d a)
Dra
inag
e w
ell d
rain
ed
Mod
– d
rain
ed
(O' K
eef
fe e
t al
., S
ubm
itte
d a)
D
M y
ield
s (t
a-1)
11.
6 1
0.7
(de
l Pra
do
et
al.,
20
06)
G
eo
grap
hica
l – C
atch
ment
are
a
Are
a (
ha)1
920
9
09
Ou
tpu
t G
BR
mod
el
Po
tent
ial g
rass
lan
d in
cat
chm
ent
(h
a)
615
6
71
Co
rine
laye
r T
otal
bio
ma
ss a
vaila
bili
ty
0.6
7 0
.74
GIS
ana
lysi
s
Su
rplu
s bi
om
ass
ava
ilab
ility
0
.39
0.5
4 G
IS a
naly
sis
1.
GB
R A
rea
cal
cula
ted
usin
g th
e b
iom
ass
ava
ilabi
lity
an
d D
M y
ield
s to
ens
ure
6,1
82 t
DM
a-1

Chapter 6
132
Although the geography of these zones is crude, their boundaries fluid, and differentiation occurs within them, they do provide a generalised synopsis of a detailed empirical farming geographical analysis.
Therefore the main farm category (described in Fig. 6.1), of each region was used as the basis for the six field trial site locations described in O’Keeffe et al. (submitted a). The primary aim of these field trials was to assess the yields of DM, fibre and crude protein of grass swards on six contrasting Irish farms. The field trial data was also used to develop biomass supply models to predict the DM yields, fibre and crude protein yields of grass being supplied to a GBR. However, this case study scenario analysis will only focus on two of the field sites, they will now be referred to as Farm A and Farm B. Farm A is a dairy farm in the south of Ireland, in the region Crowley et al. (2007) described to be characterised by commercial and intensive agriculture (orange zone). Farm B is a beef farm (cattle rearing) located in a region Crowley et al. (2007) described as having is part-time and extensive (low stocking rates) farming types as the main agricultural characteristics. The coordinates of the field trial farms were used as a proxy location for the biorefinery plant, in order to conduct the GIS analysis in step three. 2.2 Step 2 –Calculation of percentage grassland area
The CORINE dataset 2006 was part of a Pan-European project, which used a standard scheme of 44 land cover types. The CLC2006 map of Ireland is a map of the Irish environmental landscape, based on the visual interpretation of LANDSAT TM images from 2006 (Cruickshank et al., 1998; EPA, 2007). The CORINE land cover types are divided into three levels of classification, the first level indicates the major categories of which there are five (artificial (manmade) surfaces, agricultural areas, forest and semi natural areas, wetlands and water), the second level are subclasses of level one and the third level defines subclass of level two (EPA, 2007) (Table 6.2). An important point to consider when using CORINE data for analysis is that some impurities can occur in polygons of “pure classification,” as the minimum mappable area is 25 hectares. For example (refer to Table 6.2), a polygon of arable land (2.1.1) can include scattered fields of pasture (2.3.1) (Cruickshank et al., 1998). Therefore, it was thought that using the CORINE pasture classification (2.1) for predicting area under pasture at an electoral division level (local level) would not be sufficiently accurate (S. Green, pers. comm.). The percentage area under grass was calculated instead by combining the area classes 2.3.1, 2.4.2, and 2.4.4 (Table 6.2). The summed area (ha) of these classes was then divided by the total area of ED, to find the fraction

Case studies
133
of grassland in the ED.
2.3 Step 3 - Calculation of biomass availability
2.3.1 Total biomass availability
The size of the GBR catchment area is determined by the throughput of the biorefinery i.e. how much grass will be processed in the year. The GBR outlined in O Keeffe et al.
(submitted b) had a throughput of 0.8 t DM hour-1 and processed 6,168 t DM grass silage per annum, supplied by a circular catchment area of 840 ha. For their blueprint, O’Keeffe et al. (submitted b) assumed that the GBR was located in an area with 90% biomass availability, i.e. 90% of the land area was grass and all of this grass was used exclusively to supply the GBR. In this paper, the proximity buffer analysis tool in Arc GIS was used to generate a catchment area of 840 ha. The buffer layer was then overlaid with the percentage grassland map and the initial “total biomass availability factor” a (percentage of grassland in an area), was calculated as follows: The initial biomass availability and DM yields predicted from the NCYCLE model (del Prado et al., 2006) (Table 6.1) were inputted into the GBR process model. The model automatically adjusts the catchment area size to the area needed to supply the
Table 6.2. Classifications of CORINE land cover types (EPA, 2007) Level 1 1
Level 22
Level 33
1. Artificial surfaces 2. Agricultural areas 2.1 Arable land 2.1.1 Non irrigated arable land 2.3 Pastures 2.3.1 Pastures
2.4 Heterogeneous
agricultural areas 2.4.1 Annual crops associated with permanent crops
2.4.2 complex cultivation patterns 2.4.4 land principally occupied by agriculture,
with significant areas of natural vegetation 3 Forest and semi natural areas - 4.Wetlands 5. Water - The CORINE land cover nomenclature, comprises of three levels: 1. Indicates the major categories of which there are five (artificial (manmade) surfaces, agricultural areas, forest
and semi natural areas, wetlands and water) 2. The second level (15 items) is for use on scales of 1:500 000 and 1: 1 000 000; 3. The third level (44 items) will be used for the project on a scale of 1: 100 000. (Commission of the European
Union, 1998), these were the classifications added in order to determine grassland coverage in an ED (electoral district).

Chapter 6
134
6,181 t DM a-1 required annually. Therefore, the original buffer zone generated in the Arc GIS analysis was adjusted to take into account the additional area required for the GBR model. An iterative optimisation procedure was carried out until the output from the GIS analysis and GBR blueprint were equalised, ensuring a biomass supply of 6,181 t DM a-1, to the GBR.
2.3.2. Surplus biomass availability
The Simulated Model for the Irish Local Economy (SMILE) is an object-oriented, spatial micro-simulation model, developed by the Rural Economy Research Centre of Teagasc (the Irish Agriculture and Food Development Authority). Spatial micro-simulation provides geographic information that links micro-units with location and therefore allows for a regional or local approach to policy analysis (Ballas et al., 2006). The SMILE model also contains a farm level module that creates a base farm population and assigns census attributes to individual farms, which can then be assigned to a geographically referenced area. The simulated farm dataset created by SMILE is constructed using a combinational optimisation technique called simulated annealing. The process selects a set of farms (for each ED) from the NFS that can best reproduce the census of Irish Agriculture small area population statistics (SAPS) tables of the number of farms, by size, system and soil type. For further details on the SMILE model refer to Hynes et al. (2009). The SMILE model attribute tables were queried to determine the number of livestock units per ED. The livestock units in the catchment areas were calculated as follows;
GA = Grassland area (ha) (CLC, 2006)
i = fraction of EDi contained in buffer zone
Gi = Grassland area (ha) contained within EDi
n = fraction of nth EDn contained in the buffer
zone
Gn = Grassland area (ha) contained within nth
EDn
a = Biomass availability (%)
CA = Catchment area of case study (ha)
LuA, B = Total number of livestock units (Lu), sheep,
beef cattle, dairy cows in catchment area A and B
i = fraction of EDi contained in buffer zone
Lui = Livestock units sheep, beef cattle, dairy cows
in EDi
n = fraction of nth EDn contained in buffer zone
Lun = Livestock units sheep, beef cattle, dairy cows
in EDi
LuA, B = )..(∑ ++ nji nLujLuiLu Eqn 3
GA = )..(∑ ++ nji nGjGiG Eqn.1 a = CA/GA × 100 Eqn. 2

Case studies
135
The total annual feed demand (assuming fresh grass only) for the total Lu in the catchment area was then calculated (Table 6.3).The grass production of the catchment area was calculated using the predicted DM yields (t ha-1 a-1) of the NCYCLE model. The surplus grass was then calculated by subtracting the total annual feed demands (t a-1) from the total annual grass produced (t DM catchment area-1). The amount of surplus biomass was then divided by the catchment area to calculate the biomass availability factor (Table 6.3).
Table 6.3 Calculation of surplus biomass availability factor from GIS analysis
Case study A Case study B Units
Dairy cattle Total number of dairy cows in catchment 158 44 cows Total daily requirement @ 14.50 kg/head 1 2292 640 kg DM day-1 Beef cattle Total number of cattle in catchment 466 379 cows Total daily requirement @ 12.00 kg/head 2 5598 4546 kg DM day-1 Sheep Total number of sheep in catchment 77 136 sheep Total daily requirement @ 0.90 kg/head 3 73 129 kg DM day-1 Total amount of DM required per year 2,906,599 1,939,848 kg DM a-1 Average annual yields 4 11,600 10,700 kg DM ha-1 a-1 Area under grassland 615 672 ha Annual grass production of area 7,131,612 7,186,156 kg DM a-1 Total surplus grass 4,225,013 5,246,308 kg DM a-1 Total biomass available 4,225 5,246 t DM a-1 Total area surplus grass 364 490 ha Surplus biomass availability factor 0.37 0.54 -
1. Value taken from the literature ranges for dairy cow 10.2-17 kg DM day-1 (Fitzgerald and Murphy, 1999; Prendiville, 2009)
2. Value taken from the literature ranges for beef cow 9.8-12.46 kg DM day-1 (Crowley et al., 2010; French et al., 2003)
3. Value taken from the literature ranges for a sheep 0.5-1.5 kg DM day-1 (Cordova et al., 1978; Murdoch, 1964)
4. Values taken from NCYCLE Ireland (del Prado et al., 2006) and are in Table 1. Note: Figures are rounded to integers

Chapter 6
136
2.4 Step 4 – Overview of economic assumptions and modeling considerations for GBR scenarios
2.4.1. GBR economic considerations
The GBR processing model consisted of quantitative conservative mass and energy and economic balances derived from the literature, best available data, and consultation with European GBR experts, biogas experts, agronomists, and biomass systems economists (Fig. 6.3). The capital investment costs and running costs for the GBR plant and CHP plant (which produced heat and electrical energy for processing the silage into GBR products) are outlined in O ‘Keeffe et al. (submitted b). Two product scenario outcomes were predicted; these were:
o “Prot”, which has two biorefinery products: fibre for insulation materials and a proteinaceous product to be used in animal feed.
o “No Prot”, where the proteinaceous fraction is redirected to the digester to increase on-site energy generation and hence reduce costs of purchasing energy.
Optimum revenue generation was assumed, and estimated at € 0.80 kg-1 for the fibre insulation material (Grass, 2004) and € 0.27 kg-1 for the proteinaceous product (data sourced from the Irish Central Statistics Office, four years meaned data, 2005-2008), (externalities were not taken into account). Net present value (NPV) and the internal rate of return (IRR) were used as measurements of cash flow in the GBR system and financial indicators.
Fig. 6.3 Flow diagram of the GBR model

Case studies
137
For the GBR model, the NPV was calculated over a 10-year period at a discount rate (ir ) of 10% (O 'Keeffe et al., submitted b).
2.4.2 Farmer considerations
A positive NPV indicates a potentially positive cash flow (profit) for the period in question and would suggest that the project has economic potential. A negative NPV indicates the project to be unviable. The ir value (interest rate or discount rate) reflects the risk associated with the investment, which determines the cost of buying the capital needed for an investment. If the IRR is greater than the ir value then the project can be considered. The farmers’ overhead costs for producing the grass included the cost of the field maintenance (roads, fences), management (fertiliser, lime) and harvesting (contractor labour and plastic for ensiling) (Table 6.4). It was assumed that the farmers followed standard fertiliser rate recommendations for grassland cut twice for silage, i.e. 225 kg nitrogen (N) ha-1 a-1, 30 kg phosphorus (P) ha-1 a-1, 155 kg potassium (K) ha-1 a-1 (Coulter and Lalor, 2008). It was assumed that the waste streams from the biorefinery processing (silage effluent and digestate from the anaerobic digester) were returned as slurries to the fields harvested, thereby reducing fertiliser costs for the farmer. The transport costs for the returned “slurry” were assumed to be paid by the biorefinery as part of a waste management scheme. Under these scenario conditions, it was assumed the contractors, hired by the farmer to harvest the grass, delivered the fresh grass to the biorefinery, and that the grass was ensiled on site to ensure controlled and uniform ensiling conditions. The price paid to the farmer in the GBR model was assumed to be the break-even price for grass production i.e. the biorefinery only covered the cost of grass production, the farmer made no profit. 2.4.3 Transport considerations
Transport costs were calculated for both the transport of feedstock material and slurry returned. The average haul distance to the biorefinery was calculated using a tortuosity factor of 1.33 (Table 6.5). In the original model, transport costs per tonne of grass harvested were estimated from consultation with silage experts and contractors. For more details on transport cost calculations, refer to O’Keeffe et al. (submitted b).

Chapter 6
138
Table 6.4. Estimated base costs for raw material – grass/silage production from Teagasc (Irish Agricultural and Food Development Authority) 2008 and modified costs generated in each case study from the GBR model 1st cut silage € 2nd cut silage € Prices quoted by Teagasc Roads and fencing 43 34 Reseeding 20 16 Fertiliser 1 A280.1 207.4 Lime 20 16 Plastic 15 12 Contractor € ha-1 247 227 € ha-1 (original Teagasc estimate)2 625 438 Modified prices calculated output of GBR Model Cost of fertiliser deficits after digestate application Case study A
Fertiliser costs after returned slurry3 € ha-1 – total availability
A159 (129)4
99 (89)
Fertiliser costs after returned slurry € ha-1– surplus availability
A212 (196)
117 (109)
Case study B
Fertiliser costs after returned slurry € ha-1 – total availability
A164 (134)
100 (85)
Fertiliser costs after returned slurry € ha-1– surplus availability
A197 (175)
112 (101)
5Total costs used for estimating biomass price Case study A
Total cost of biomass € t-1 – total availability
B65 (62)
102 (98)
Total cost of biomass € t-1 – surplus availability
B72 (70)
107 (105)
Yields used in model6 tonnes/DM ha (NCYCLE Annual yields = 11.6 t DM) 7.7 4.4 Case study B
Total cost of biomass € t-1 – total availability
B 72 (68)
111 (107)
Total cost of biomass € t-1 – surplus availability
B 77 (73)
115 (112)
Yields used in model6 tonnes/DM ha (NCYCLE Annual yields = 10.7 t DM) 7.1 3.6 1. These values are based on the recommended fertiliser rates for a two cut grass/silage system (225 kg N ha-1 a-1, 30 kg P
ha-1 a-1, 145 kg K ha-1 a-1). Fertiliser costs were at time of writing determined to be €0.83, €1.56, €1.21.(pers comm. S. Lalor)
2. The values are modified due to the change of fertiliser costs described in foot note 1. 3. Slurry refers to the combined slurry of the digestate and silage effluent which is returned back to the farmer. 4. Values in parenthesis for modified prices in model, refer to the estimated prices for the “No prot” scenarios 5.Total costs = Σ (Roads & Fencing + Reseeding + Fertiliser costs after returned slurry + Lime + Plastic + contractor ) 6. Yields predicted from NCYCLE model, the annual yields were estimated to be proportioned into 2/3 for 1st cut and 1/3
for 2nd cut A Fertiliser costs outlined in the Teagasc production costs are replaced n the GBR models by those values indicated with
A B These values are the base price offered to the farmer by the GBR and are used in the sensitivity analysis to calculate the
maximum price which could be offered to the farmer above their production costs
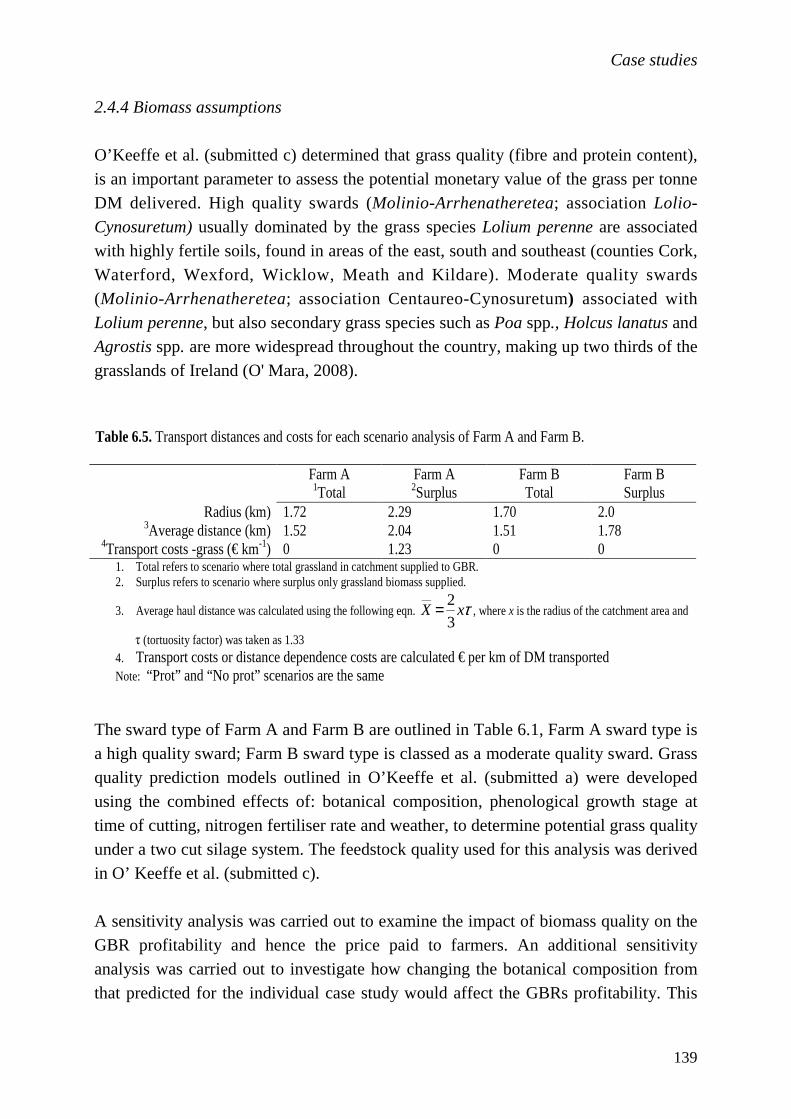
Case studies
139
2.4.4 Biomass assumptions
O’Keeffe et al. (submitted c) determined that grass quality (fibre and protein content), is an important parameter to assess the potential monetary value of the grass per tonne DM delivered. High quality swards (Molinio-Arrhenatheretea; association Lolio-
Cynosuretum) usually dominated by the grass species Lolium perenne are associated with highly fertile soils, found in areas of the east, south and southeast (counties Cork, Waterford, Wexford, Wicklow, Meath and Kildare). Moderate quality swards (Molinio-Arrhenatheretea; association Centaureo-Cynosuretum) associated with Lolium perenne, but also secondary grass species such as Poa spp., Holcus lanatus and Agrostis spp. are more widespread throughout the country, making up two thirds of the grasslands of Ireland (O' Mara, 2008).
The sward type of Farm A and Farm B are outlined in Table 6.1, Farm A sward type is a high quality sward; Farm B sward type is classed as a moderate quality sward. Grass quality prediction models outlined in O’Keeffe et al. (submitted a) were developed using the combined effects of: botanical composition, phenological growth stage at time of cutting, nitrogen fertiliser rate and weather, to determine potential grass quality under a two cut silage system. The feedstock quality used for this analysis was derived in O’ Keeffe et al. (submitted c). A sensitivity analysis was carried out to examine the impact of biomass quality on the GBR profitability and hence the price paid to farmers. An additional sensitivity analysis was carried out to investigate how changing the botanical composition from that predicted for the individual case study would affect the GBRs profitability. This
Table 6.5. Transport distances and costs for each scenario analysis of Farm A and Farm B. Farm A
1Total Farm A 2Surplus
Farm B Total
Farm B Surplus
Radius (km) 1.72 2.29 1.70 2.0 3Average distance (km) 1.52 2.04 1.51 1.78
4Transport costs -grass (€ km-1) 0 1.23 0 0 1. Total refers to scenario where total grassland in catchment supplied to GBR. 2. Surplus refers to scenario where surplus only grassland biomass supplied.
3. Average haul distance was calculated using the following eqn. τxX3
2__
= , where x is the radius of the catchment area and
τ (tortuosity factor) was taken as 1.33 4. Transport costs or distance dependence costs are calculated € per km of DM transported Note: “Prot” and “No prot” scenarios are the same

Chapter 6
140
was done by analysing Farm A with the quality parameters determined for Farm B and vice versa, however, the original DM yields predicted by the. NCYCLE Ireland model were maintained, as these DM estimates were specific to the region of the particular farm sites (del Prado et al., 2006). 2.4.5 GBR inputs and sensitivity analysis for famer’s profit above production costs
The final total biomass availability factors, DM yields (Tables 6.1 and 6.3) and silage quality (refer to O’ Keeffe et al. (submitted c), were inputted into the GBR model (silage system losses c. 20%), to determine the potential profitability of the GBR. The same procedure was repeated with the surplus biomass availability factors. A sensitivity analysis was then carried out for all scenarios to assess the change in profitability of the biorefinery against the potential price that the biorefinery could offer the farmers. The price offered above the farmers’ production costs was increased from the base case scenario in increments of 5% above the base price (Table 6.4), until the GBR showed an NPV < 0. The maximum price offered to the farmer for each case study scenario was taken to be the maximum price, which could be offered before the biorefinery NPV became < 0.
Table 6.6. Calculation of “Reduced costs” on a per ha basis, which have been defined as farm labour costs for the farmer under BAU scenario conditions (Dairy /Beef)
Dairy Beef units
1Labour units 1.43 1.06
Total hours worked 2574 1908 hrs a-1
2Minimum wage for agricultural worker 9.33 9.33 €hr-1
Total labour costs for farmer 24015 17802 €a-1
Labour costs per ha 5003 4944 €ha-1a-1 1. Labour units: one labour unit is defined as at least 1800 hours worked on the farm by a person
over 18 years of age (NFS 2009). 2. Value taken from (Agricultural Workers Joint Labour Committee, 2010) 3. Labour costs for dairy farmer of farm size category 48 ha (SMILE output) 4. Labour costs for beef cattle rearing farmer of farm size category 36 ha (SMILE output) Note: Values rounded to integers
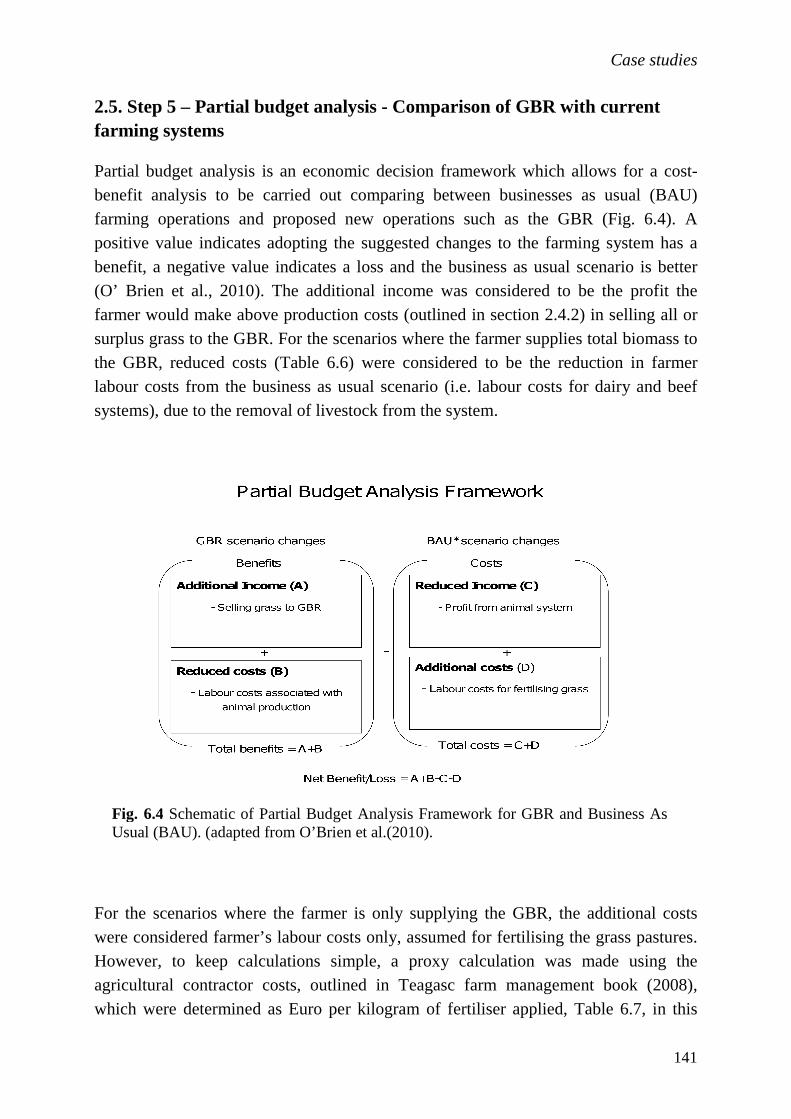
Case studies
141
2.5. Step 5 – Partial budget analysis - Comparison of GBR with current farming systems
Partial budget analysis is an economic decision framework which allows for a cost-benefit analysis to be carried out comparing between businesses as usual (BAU) farming operations and proposed new operations such as the GBR (Fig. 6.4). A positive value indicates adopting the suggested changes to the farming system has a benefit, a negative value indicates a loss and the business as usual scenario is better (O’ Brien et al., 2010). The additional income was considered to be the profit the farmer would make above production costs (outlined in section 2.4.2) in selling all or surplus grass to the GBR. For the scenarios where the farmer supplies total biomass to the GBR, reduced costs (Table 6.6) were considered to be the reduction in farmer labour costs from the business as usual scenario (i.e. labour costs for dairy and beef systems), due to the removal of livestock from the system.
For the scenarios where the farmer is only supplying the GBR, the additional costs were considered farmer’s labour costs only, assumed for fertilising the grass pastures. However, to keep calculations simple, a proxy calculation was made using the agricultural contractor costs, outlined in Teagasc farm management book (2008), which were determined as Euro per kilogram of fertiliser applied, Table 6.7, in this
Fig. 6.4 Schematic of Partial Budget Analysis Framework for GBR and Business As Usual (BAU). (adapted from O’Brien et al.(2010).

Chapter 6
142
way there was no need for machinery cost estimates. It was assumed an agricultural contractor will harvest the grass in both scenarios and therefore, grass harvesting was not considered a labour cost of the farmer in these scenarios. The SMILE model was used to determine the average farm size and farm gross margins (GM) (reduced income) margins in the catchment area (Table 6.1). Therefore, knowing the average farm size and the gross margins enabled the calculation of the farmer’s gross margins per hectare to be calculated. The cost-benefit analysis was carried out in this study on a per hectare basis, as this was the common denominator unit for the calculations made for all levels (national, regional, farm). At the regional level, the percentage grassland area and ED areas were determined on a hectare basis. The DM yields determined by the NCYCLE Ireland model for the two regions were predicted as tonnes of dry matter per hectare. The GBR calculated the price paid to farmers above their production costs per tonne of dry matter supplied. Therefore assuming the farmers provided at minimum, one hectare unit of grass to the GBR, the cost per hectare for production and harvested could be calculated, as well as the profit, using the DM yields from the NCYCLE model.
Table 6.7 Calculation of “additional costs” on a per ha basis, which have been defined as farm labour costs for the farmer under the GBR scenario conditions. Labour costs were assumed to be for fertilizing the grassland only.
Total fertilizer product required Costs Units
2CAN 818
30-7-30 429
Total wt. of fertilizer required 1247 kg of fertiliser ha-1
4Contractor cost @ €28 tonne-1 34.92 € ha-1 1. Costs were calculated using agricultural contractor price as a proxy, for farmer labour
costs related to fertiliser spreading and harvesting. 2. CAN ; Calcium Ammonium Nitrate (225 N kg ha-1 = 818 kg ha-1 of CAN) 3. 0-7-30; refers to the ratio of combined fertilizers, Nitrogen:Phosphorous:Potassium 4. Contractor the agricultural specialist with farm equipment costing outlined in Teagasc
data for farm management planning calculated contractor costs per tonne of fertiliser used, calculated in this table to € ha-1

Case studies
143
3. Results 3.1. Geographical constraints
3.1.1 GBR profitability- case study effects
All scenarios analysed had positive NPVs and IRR values above 10%, regardless of biomass availability, DM yields or biomass quality (Table 6.8). For the total biomass availability scenarios, Farm A had the lower biomass availability factor, 0.67, compared to 0.73 for Farm B. The higher area under grassland and higher fibre content predicted for the biomass composition of Farm B (L. perenne, c. 75%), compensated for the lower DM yields; this resulted in the GBR scenarios for Farm B to be more profitable than Farm A scenarios. Identical trends were observed for the surplus biomass scenarios. Farm B had the lower livestock units and higher total grassland availability and therefore, had the substantially higher NPV values (Table 6.8). Farm A surplus biomass scenarios, although having the substantially lower a, compared with Farm B, were still profitable (NPV > 0). The sensitivity analysis investigating the effects of grass quality on the scenario outcomes, demonstrated that for Farm A the combination of high DM yields and increased fibre content would have resulted in Farm A scenarios to have significantly greater profitability then the Farm B scenarios. The lower DM yields combined with the alternatively low fibre content would have reduced the NPV of the Farm B scenarios substantially from the original predicted outcomes. For all scenarios, the “No Prot” scenarios predicted the greatest profitability for all cases (Tables 6.8 and 6.9). 3.1.2 Scenario outcomes for farmer’s profitability
There was relatively little difference between the base grass production costs of Farm A and Farm B (Table 6.4). However, there was a noticeable difference between the surplus biomass scenarios and total biomass scenarios. The lower base price offered in the Farm A scenarios can be attributed to the greater volume of returned “slurry” in these scenarios, resulting in a lower base production price, due to the lower costs of fertiliser. However, the price, which could be paid to the farmer above the base production costs, varied substantially depending on the profitability of the GBR scenario (Fig. 6.5). Therefore, as the GBR scenarios for Farm B had greater profitability than the GBR for Farm A, Farmer B received a higher price for grass than

Chapter 6
144
Table 6.8. Details of input and GBR output and profitability per hectare supplied to the GBR (t DM ha-1 harvested)
Scenario A Scenario B
1Total 2Surplus Total Surplus 3DM yields of area ( t DM ha-1) 11.7 11.7 10.7 10.7 4DM harvested (t DM ha-1 harvested) (i.e. Biomass availability factor × DM yields of area)
7.75 4.59 7.9 5.68
5Input into biorefinery process
Silage yields (Recovery) 6.68 3.96 6.8 4.90 Fibre 3.71 2.20 3.94 2.84 CP 0.83 0.49 0.85 0.61 6ODM 1.27 0.75 1.12 0.81 GBR outputs 7Fibre product 4.33 2.56 4.57 3.29 Crude protein 0.37 0.22 0.38 0.27 8Biogas generation in CHP
VS t ha-1 a -1 1.43 (1.74)
0.85 (1.03)
1.3 (1.62)
0.94 (1.16)
CH4 – methane from CHP plant (m3 ha-1 harvested) 420 (512)
249 (303)
382 (479)
248 (342)
Costs and revenues Energy deficit costs 383
(247) 227
(146) 436
(269) 313
(194) Total proceeds 3983
(3980) 2360
(2357) 4138
(4136) 2978
(2975) Total production costs 1942
(1824) 1176
(1113) 2060
(1911) 1505
(1404) Gross profit 2041
9(2155) 1183
(1244) 2079
(2224) 1473
(1571) 10Financial indicators NPV (€, 000) 415.5
(556.6) 232.3
(323.2) 565.4
(819.1) 434.72 (650)
IRR 11.55 (11.99)
10.87 (11.16)
12.14 (12.95)
11.65 (12.36)
1. Total refers to scenario where total grassland in catchment supplied to GBR. 2. Surplus refers to scenario where surplus only grassland biomass was supplied to the GBR, after fodder requirements met. 3. DM yields of region predicted by NCYCLE Ireland 4. DM yields from catchment area harvested, yields per ha decline due to biomass availability factor; Farm A 0.69, 0.39,
Farm B 0.74. 0.54, for total and surplus scenarios respectively. 5. Silage yields in general system losses, field losses (3%), in silo losses (3%) , feed out losses (7.5%) recovery rate of
silage calculated to be approx 86%. 6. ODM , organic dry matter is a term to group compounds such as water soluble components e.g. sugars, VFA (lactic acid,
butyric acid, acetic acid, propionic acid), as well as insoluble components fats, oils and smaller fibre fractions. Indicates the potential for biogas production and hence energy generation.
7. Fibre product contained other fraction components also, for detail on composition refer to (O’Keeffe et al, submitted b). 8. Biogas generation required to produce heat and electrical energy for process operations in the GBR facility, VS (Volatile
solids e.g. small organic fractions) the substrate used to produce energy. Assumed rate of destruction 60%, Biogas generation 0.89 m3 kg-1 VS , methane content of biogas assumed 55% (O’Keeffe et al., submitted b)
9. Values in parenthesis refer to the estimated prices for the “No Prot” scenarios. 10. Financial indicators NPV (Net Present Value) estimated over 10 year period at ir of 10%. NPV >0 project can be
considered. If IRR, (Internal rate of return) is greater then the risk factor (ir = 10), then the project can be considered.

Case studies
145
Farmer A. For Farm A scenarios there was relatively little difference between the “Prot” and “No Prot” scenarios outcomes, (Table 6.10 ) for Farm B scenarios the difference was much greater. The difference in price offered to farmers, between surplus and total biomass scenarios were substantially larger for Farm A than for Farm B. Table 6.10 outlines the prices offered to the farmers above their base costs for the different scenarios. 3.2 Socio-economic factors
The partial budget analysis for Farm A or the dairy farmer in the South, predicted substantial losses for both “ Prot” and “No Prot” scenarios, if the farmer opted to switch to a GBR system (total biomass scenarios) (Table 6.11).
Table 6.9. Outcome of biomass quality sensitivity analysis (i.e. scenarios where biomass quality of Farm A is used in the modelling for Farm B and vice versa)
1AT AS
BT
BS
2NPV 791.1 (1006)3
618.7 (784.2)
217.6 (371.6)
78.48 (194.4)
3IRR 12.97 (13.61)
12.34 (12.83)
10.81 (11.33)
10.3 (10.70)
1. Scenarios: AT = Farm A total biomass supplied, AS = Farm A, surplus biomass supplied. BT =Farm B total
biomass supplied, BS = Farm B surplus biomass supplied only. Prot = GBR scenarios with protein and fibre as products. No Prot = GBR scenarios with fibre products only
2. Financial indicators Net Present Value estimated over 10 year period at interest rate of 10%.). NPV >0 = profitable
3. Internal rate of return (IRR. The greater the IRR is above 10, then the better the profitability of the scenario system modelled
4. Values in parenthesis for modified prices in model, refer to the estimated prices for the “No Prot” scenarios
Table 6.10. Price offered to farmers above production costs – Gross margins for farmers for GBR scenarios. Prices in € t-1 DM
2Prot 2No Prot 1Scenarios 31st cut 32nd cut 3Annual 1st cut 2nd cut Annual AT 9.88 15.36 25.24 9.29 14.79 24.08 AS 3.62 5.34 8.95 7.00 10.45 17.45 BT 14.43 22.28 36.71 20.35 32.15 52.50 BS 11.51 17.18 28.69 14.73 22.30 37.03
1. Scenarios: AT = Farm A, total biomass supplied; AS = Famr A, surplus biomass supplied; BT = Farm B, total biomass supplied; BS = Farm B, surplus biomass supplied only.
2. Prot = GBR scenarios with protein and fibre as products. No Prot = GBR scenarios with fibre products only.
3. 1st cut refers to price paid for first cut grass taken in May/June. 2nd cut refers to the price paid per t DM second cut silage taken 6-9 weeks after 1st cut at end of July/August period. Annual refers to the total price paid t-1 DM for grass biomass from the two annual harvests.
4. Scenario which production costs of grass broke even with price offered.

Chapter 6
146
The partial budget analysis for Farm B “Prot” scenario showed a marginally better profit than BAU; however, the “No Prot Scenario” showed a benefit of switching to GBR than the BAU of cattle rearing (Table 6.11). The surplus biomass scenarios had the financially better outcomes and presented the more viable option for both case studies. Farm B had the significantly larger benefit per ha for both the “Prot” and “No Prot” scenarios. The sensitivity analysis testing the effects of botanical composition and biomass quality resulted however, in the Farm A “No Prot” scenario to have a marginally better profit than the BAU scenario, however in general even with increased fibre content, the dairying systems in the south appear to be the more viable option, than supplying a GBR.
Fig. 6.5 Deviation in biorefineries profitability plotted against increasing price offered to farmer above production costs of grass for first cut silage (€ t-1 DM). a) “Prot” scenarios; b) “No Prot” scenarios and second cut silage; c) “Prot” scenarios; d) “No Prot” scenarios. Graph shows change in NPV for Prot and No Prot blueprint scenarios plotted for each scenario. AT = case study A total biomass supplied; AS = case study A, surplus biomass supplied; BT = case study B, total biomass supplied; BS = case study B, surplus biomass supplied only.
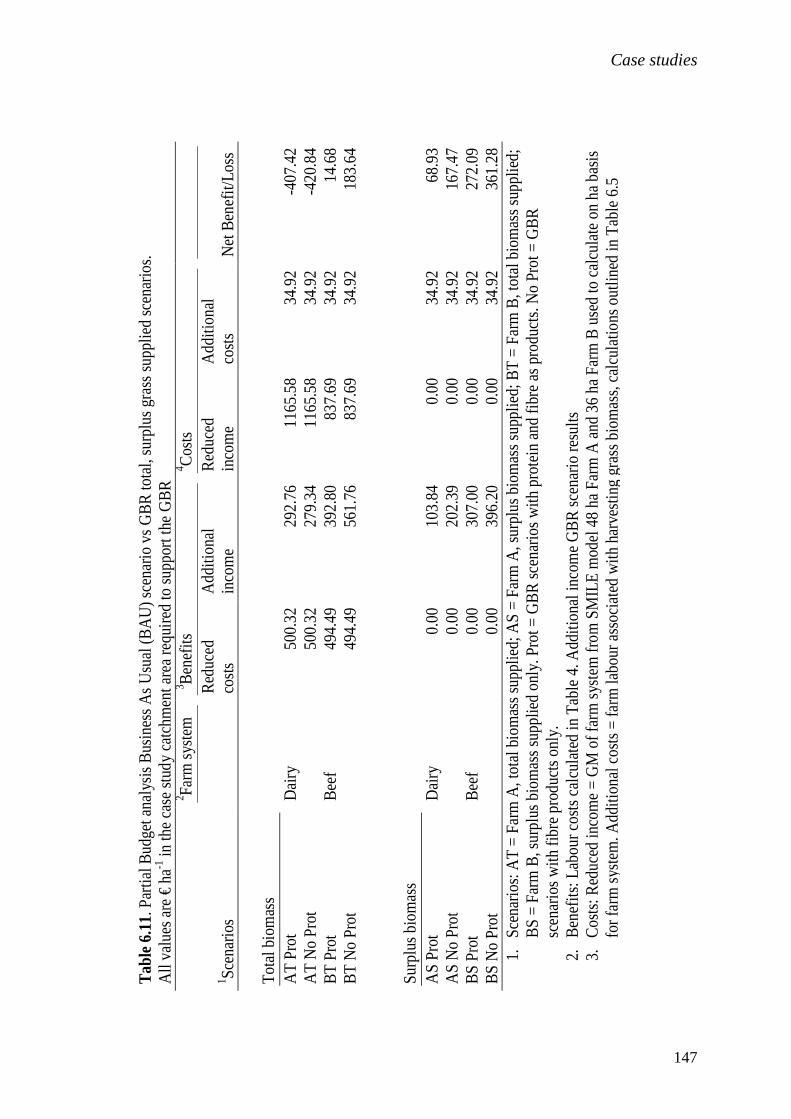
Case studies
147
Tabl
e 6.
11. P
artia
l Bud
get a
naly
sis
Bus
ines
s A
s U
sual
(BA
U) s
cena
rio v
s G
BR
tota
l, su
rplu
s gr
ass
supp
lied
scen
ario
s.
All
valu
es a
re €
ha-1 in
the
case
stu
dy c
atch
men
t are
a re
quire
d to
sup
port
the
GB
R
2 Fa
rm s
yste
m
3 Ben
efits
4 C
osts
1 Sce
nario
s
R
educ
ed
cost
s
Add
ition
al
inco
me
R
educ
ed
inco
me
A
dditi
onal
co
sts
N
et B
enef
it/Lo
ss
Tota
l bio
mas
s
AT
Pro
t D
airy
50
0.32
292.
76
1165
.58
34.9
2 -4
07.4
2 A
T N
o P
rot
50
0.32
279.
34
1165
.58
34.9
2 -4
20.8
4 B
T P
rot
Bee
f 49
4.49
392.
80
837.
69
34.9
2 14
.68
BT
No
Pro
t
494.
49 56
1.76
83
7.69
34
.92
183.
64
S
urpl
us b
iom
ass
AS
Pro
t D
airy
0.
00 10
3.84
0.
00
34.9
2 68
.93
AS
No
Pro
t
0.00
202.
39
0.00
34
.92
167.
47
BS
Pro
t B
eef
0.00
307.
00
0.00
34
.92
272.
09
BS
No
Pro
t
0.00
396.
20
0.00
34
.92
361.
28
1.
Sce
nario
s: A
T =
Farm
A, t
otal
bio
mas
s su
pplie
d; A
S
= Fa
rm A
, sur
plus
bio
mas
s su
pplie
d; B
T =
Farm
B, t
ota
l bio
mas
s su
pplie
d;
BS
= F
arm
B, s
urpl
us b
iom
ass
supp
lied
only
. Pro
t =
GB
R s
cena
rios
with
pro
tein
and
fibr
e as
pro
duct
s. N
o P
rot =
GB
R
scen
ario
s w
ith fi
bre
prod
ucts
onl
y.
2.
Ben
efits
: Lab
our c
osts
cal
cula
ted
in T
able
4. A
ddit
iona
l inc
ome
GB
R s
cena
rio re
sults
3.
C
osts
: Red
uced
inco
me
= G
M o
f far
m s
yste
m fr
om S
MIL
E m
odel
48
ha F
arm
A a
nd 3
6 ha
Far
m B
use
d to
cal
cula
te o
n ha
bas
is
for f
arm
sys
tem
. Add
ition
al c
osts
= fa
rm la
bour
ass
ocia
ted
with
har
vest
ing
gras
s bi
omas
s, c
alcu
latio
ns o
utlin
ed in
Tab
le 6.5
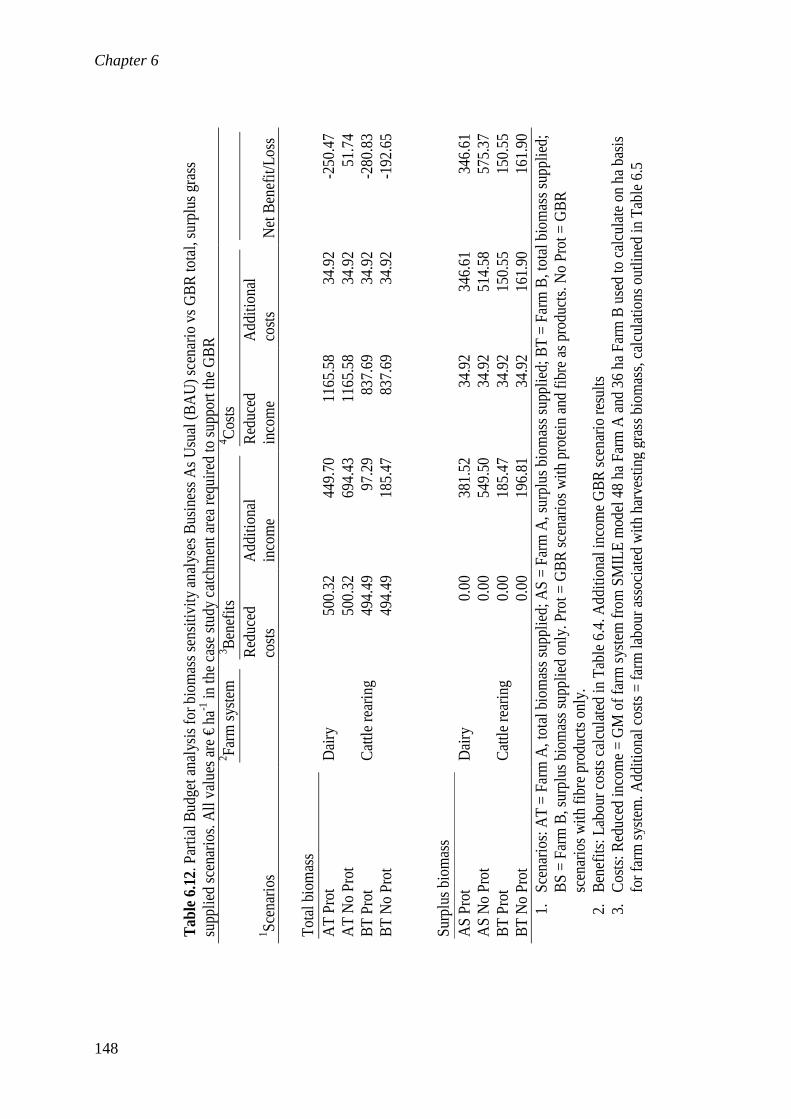
Chapter 6
148
Tabl
e 6.
12. P
artia
l Bud
get a
naly
sis
for b
iom
ass
sens
itivi
ty a
naly
ses
Bus
ines
s A
s U
sual
(BA
U) s
cena
rio v
s G
BR
tot
al, s
urpl
us g
rass
su
pplie
d sc
enar
ios.
All
valu
es a
re €
ha
-1 in
the
case
stu
dy c
atch
men
t are
a re
quire
d to
sup
port
the
GB
R
2 Fa
rm s
yste
m
3 Ben
efits
4 C
osts
1 Sce
nario
s
R
educ
ed
cost
s
Add
ition
al
inco
me
R
educ
ed
inco
me
A
dditi
onal
co
sts
N
et B
enef
it/Lo
ss
Tota
l bio
mas
s
AT
Pro
t D
airy
50
0.32
449.
70
1165
.58
34.9
2 -2
50.4
7 A
T N
o P
rot
50
0.32
694.
43
1165
.58
34.9
2 51
.74
BT
Pro
t C
attle
rear
ing
49
4.49
97.2
9 83
7.69
34
.92
-280
.83
BT
No
Pro
t
494.
49 18
5.47
83
7.69
34
.92
-192
.65
S
urpl
us b
iom
ass
AS
Pro
t D
airy
0.
00 38
1.52
34
.92
346.
61
346.
61
AS
No
Pro
t
0.00
549.
50
34.9
2 51
4.58
57
5.37
B
T P
rot
Cat
tle re
arin
g
0.00
185.
47
34.9
2 15
0.55
15
0.55
B
T N
o P
rot
0.
00 19
6.81
34
.92
161.
90
161.
90
1.
Sce
nario
s: A
T =
Farm
A, t
otal
bio
mas
s su
pplie
d; A
S
= Fa
rm A
, sur
plus
bio
mas
s su
pplie
d; B
T =
Farm
B, t
ota
l bio
mas
s su
pplie
d;
BS
= F
arm
B, s
urpl
us b
iom
ass
supp
lied
only
. Pro
t =
GB
R s
cena
rios
with
pro
tein
and
fibr
e as
pro
duct
s. N
o P
rot =
GB
R
scen
ario
s w
ith fi
bre
prod
ucts
onl
y.
2.
Ben
efits
: Lab
our c
osts
cal
cula
ted
in T
able
6.4
. Add
ition
al in
com
e G
BR
sce
nario
resu
lts
3.
Cos
ts: R
educ
ed in
com
e =
GM
of f
arm
sys
tem
from
SM
ILE
mod
el 4
8 ha
Far
m A
and
36
ha F
arm
B u
sed
to c
alcu
late
on
ha b
asis
fo
r far
m s
yste
m. A
dditi
onal
cos
ts =
farm
labo
ur a
ssoc
iate
d w
ith h
arve
stin
g gr
ass
biom
ass,
cal
cula
tions
out
lined
in T
able
6.5

Case studies
149
4 Discussion
4.1 Geographical constraints
4.1.1 GBR profitability
Biomass availability is case study specific and will vary dramatically between any multitudes of case studies all over the country. It must also be noted that biomass availability was calculated based on the assumption that grass biomass not conusmed by livestock was delivered to the GBR, therefore this study presents idealised biomass availabilty conditions. The lower surplus biomass associated with the Farm A in the South of the country was not surprising. Farming activities in the Southern areas are considered more intensive in nature than other more extensively run farming enterprises in the West and Northwest of the country (Hynes et al., 2009). Another important consideration when assessing these scenario outcomes is the model’s sensitivity to revenues generated from the fibre fraction products, as the largest bulk of the grass biomass consists of fibre. Therefore, the model will be more sensitive to the grass fibre content rather than the grass protein content predicted for the biomass supplied in the different farm case studies. Due to this limitation of the model, sensitivity analyses were conducted to investigate the potential effects of grass quality on the profitability outcome for each case study scenario. O’Keeffe et al. (submitted c) determined that DM yields greater than 9 t ha-1 a-1 and a biomass availability greater than 30% were required for a profitable GBR system. For all case study scenarios, the basic requirements for biomass availability and DM yields were met, and this enabled the sensitivity analyses to show that it is the quality of the biomass, which will determine the level of profitability for the system. High DM yields and fibre content can buffer the GBR profitability against lower biomass availability. Similarly, if the catchment area has a high biomass availability and biomass with a high fibre content (> 500 g kg-1), relatively lower DM yields will not necessarily impede the financial viability of the GBR. However, a combination of low DM yields and low fibre contents will reduce the profitability of the GBR substantially. The outcome of this analysis suggests that biomass availability and DM yields, while crucial, are not necessarily the most important factor to be considered when identifying potential locations for a GBR. Biomass quality also needs to be an important consideration when identifying potential locations. For example, GBR’s
Ch
ap
ter 6
Ch
ap
ter 6

Chapter 6
150
interested in producing products from the juice fraction (protein, biogas), would be looking for high quality swards that are normally associated, albeit not exclusively, with the highly fertile soils of the south (O' Mara, 2008). The fibre content of the grass was the grass quality of interest in the GBR scenarios in this paper. Therefore, moderate quality swards (Molinio-Arrhenatheretea; association Centaureo-Cynosuretum) produced the most profitable scenario outcomes, due to the higher fibre fraction associated with secondary grass species found in these swards such as Agrostis spp. and Holcus lanatus (Haggar, 1976; Haggar et al., 1989). 4.1.2 Price offered to farmer above production costs.
In the GBR “No Prot” scenarios, the entire juice and waste streams were sent to an anaerobic digester (AD), in the “Prot” scenarios it was the waste stream only. AD is a process, which converts, using microorganisms, the volatile components (e.g. sugars, volatile fatty acids, proteins) of the juice/waste streams into biogas, which was used in a combined heat and power plant (CHP) to generate most of the heat and electrical energy required to process the silage feedstock. Another output of this process was the generation of digestate (high nutrient slurry); this was assumed to be used as a fertiliser on the farms supplying the GBR, resulting in reduced fertiliser costs for the farmer. The greater the amount of press juice going to the digester, the greater the volume of fertiliser returned to the farmer, hence a greater cost saving and lower grass production costs. L. perenne is favoured for livestock systems, due to its high nutrient value (Peeters, 2004), or higher digestible cell content, which to some extent can be compared with the press juice of a GBR. Pasture with a high L. perenne content is commonly associated with the intensive farm management practices of dairy farming systems in Ireland, as was the case with Farm A presented here. Therefore the scenarios for Farm A with the greater L. perenne content in the sward had the greater press juice content, resulting in these scenarios to have the lower grass production costs. However overall, the maximum price offered to the farmer was dependent on the GBR profitability, which was dependent on the combination of factors, DM yields, biomass availability, or biomass quality.
4.2 Socio- economic scenario outcomes – GBR potential for case studies now or in the future?
The case study approach was taken to reflect the predominant agricultural systems in

Case studies
151
the zones defined by Crowley et al. (2007), and due to the specificity of the case studies geographical locations, they do not represent every possible example of the associated agricultural zones or farm systems. Although the individual spatial data sets have been tested and proven adequate for predictability (EPA, 2007; Hynes et al., 2006), an important consideration when assessing the scenario outcomes, is the potential spatial errors associated with combining the various spatial data sets, CORINE, SMILE, Crowley et al. (2007) with the models of O’Keeffe et al. (submitted a, b). However, despite the limitations of these scenarios, they still provide valuable insight into future considerations for the establishment of a GBR facility. . 4.2.1. Farm A – Dairy farmer in the south
The results of the partial budget analysis for the majority of scenarios showed that switching to a GBR system was not a viable option for the dairy farmer. The scenarios analysed demonstrated that providing a GBR with surplus grass biomass would be financially viable for the diary farmer. However, establishing a GBR in an area typical of Farm A, dominated by dairy farm systems and high livestock numbers, in the mid-short-term, would not be a viable option for a GBR, as it would have to compete for grass biomass, with the most profitable and well established farming systems in Ireland, dairy farming (Dillion et al., 2008). The predicted increase in dairy cows, due to the abolishment of the milk quota by 2015, would mean a greater demand for grass biomass. This could result in an even lower biomass available (< 30%) for the GBR, making it unprofitable for both the GBR and farmer. 4.2.2. Case study B – Beef farmer in the mid-west
The results of the partial budget for the beef farmer, show that under these scenario conditions it was profitable for the beef farmer to supply grass to a GBR, as it was marginally better than the business as usual scenario for the “Prot” and profitable for the “No Prot”. This is not surprising as in general extensive beef farming systems are one of the least profitable agricultural systems in Ireland (Connolly et al., 2009). The greater surplus biomass was also not surprising as Farm B was located in a predominantly beef farming zone in the mid-west. The effects of CAP reforms on livestock numbers within a region will be a very important factor for GBR locations. A study by Shrestha et al. (2007) predicted that beef production in Ireland is likely to decline and that beef farms in the Border and

Chapter 6
152
Midland regions are likely to reduce cattle numbers by up to 66%. They also predicted that beef farmers in the mid-west and west may completely destock their beef animals and that the beef grassland may not be used for other farm activity and therefore be available for alternative uses. Although destocking has occurred in this region, it has not been to the extent that was predicted (C. O’Donoghue, pers. comm.). However, the scenarios predicted in this study under optimized conditions indicated that for Farm B, the beef farm there was no need to change farm practices or destock any further, as the GBR system was already viable for both the farmer and the GBR, even under surplus grass supply, provided the biomass availability, was greater than 30%. This could potentially mean that the GBR does not necessarily need to compete with beef production. However if the farmer desired to destock further, then they have the potential to supply a GBR. Therefore, the results of these scenarios suggest that areas which support a high density of beef farmers, such as the mid-west, which have experienced declining livestock numbers, could be a viable location. 5 Conclusions
Within the scenario assumptions adopted in this study, the outcomes suggest that:
1) Biomass availability and DM yields, while crucial, are not necessarily the most important factors to be considered when identifying potential locations for a GBR. Biomass quality is an important consideration when identify potential locations.
2) The results of the partial budget analysis for the different scenarios showed that
switching to a GBR system was not a viable option for the dairy farmer. Establishing a GBR in an area typical of Farm A, dominated by dairy farm systems and high livestock numbers, in the mid-short-term, would not be a viable option for a GBR, as it would have to compete for grass biomass.
3) The results of the partial budget indicated that for Farm B, the beef farmer,
there was no need to change farm practices or destock any further, as the GBR system was already viable for both the farmer and the GBR, even under surplus grass supply, provided the biomass availability is greater than 30%. If the farmer desired to destock further, then they have the potential to supply a GBR.

153
7 General discussion:
Green Biorefinery for an Alternative use of Irish
grassland: SWOT analysis
S.M. O’Keeffe

Chapter 7
154
1 Introduction
Approximately 61% of the total land mass of the Republic of Ireland is devoted to agriculture (4.3 million ha), around 90% of which (3.8 million ha) is devoted to grassland farming (O' Mara, 2008). Dairy and beef systems dominate grassland farming systems in Ireland, as grass is the cheapest feed available (O' Riordan et al., 1998). However, these production systems are experiencing increasing environmental and social pressures. Subsidy reforms of the Common Agricultural Policy (CAP) (removal of EU subsidies from production) coupled with the Nitrates Directive (91/676/EEC), has led to declining livestock numbers and a potential surplus of grassland biomass. These negative pressures, low family farm incomes.(Connolly et al., 2009; Teagasc, 2009), and the positive incentives of the EU Biofuel Directive (2003/30/EEC), which promotes a “biobased economy”, has stimulated interest into the alternative uses of their grasslands (EU Commission, 2010). One such alternative use is “Green biorefinery” (GBR). 1.1 Green biorefinery
The Green biorefinery concept is the utilisation of green biomass (grass/silage) as raw material for the production of biobased products like protein, lactic acid, fibre and energy (via biogas) (Kromus et al., 2004). Refining technologies (e.g. acid hydrolysis, fiberising, centrifuging) are applied to the green biomass to physically and chemically fractionated into two streams, press cake (the solid fibre fraction), and press juice (liquid fraction). The press juice is of particular interest as high value biochemicals, or substitutes for petroleum-based products could be essentially extracted. These include lactic acid, which can be used as a building block for plastic production in the form of polylactic acid (PLA). Proteins and amino acids (depending on feedstock) can also be extracted to use for applications such as animal feed or higher value products such as additives for the cosmetic industry. Technologies for extracting these high value compounds are still being developed (Kromus et al., 2004; Mandel, 2010; O' Keeffe et al., 2009). The grass fibre fraction can be utilised for products such as building materials (Kromus et al., 2004). The residual grass slurries or ‘side streams’ remaining after processing the green biomass, can then be fed into an anaerobic digester (AD) to produce biomethane gas, and which can be used in electricity and heat generation (Grass, 2004).
General discussion
155
1.2 Green biorefinery blueprint original hypothesis
The manufacturing of a particular product is dependent on the availability and robustness of current and emerging biorefinery technologies. A blueprint for an Irish Green biorefinery was developed after a review of the literature and consultation with EU GBR experts. Available technologies, green biomass (pasture) yields and quality (composition, i.e. fibre, crude protein), and socio-economics were used to describe the most suitable GBR system in the short term for Ireland. We hypothesised that an Irish Green biorefinery blueprint was a small scale
decentralised facility, located in a catchment area, with adequate supply of surplus
green biomass (pasture) and farmers willing to supply the processing facility. The
idealised products from the grass include insulation material from the grass fibre
fraction, and from the press juice, a proteinaceous extract to be used in animal feed.
Heat and energy will be generated from anaerobic digestion of waste process slurries
or stillage. The residual material remaining after the anaerobic digestion will then be
used as fertiliser and supplied back to the associated farmers as a part of a “waste
management strategy” and to maintain an adequate nutrient cycle within the supply
chain.
Over the past four years, through the combination of field trial work and desk studies we tested the feasibility of the GBR blueprint. This assessment was also used as a framework to address the knowledge gaps identified in the supply side of an Irish GBR system. These included:
o Are the quantity and quality of grass biomass, under the current harvesting regime in Ireland (i.e. a two-cut silage system) suitable for the GBR model outlined in the blueprint?
o To what extent is the profitability of the GBR system affected by variability of grass/silage quality?
o Which feedstock system is most viable in an Irish context: a grass/silage system (where grass would be processed for 4 months and silage the rest of the year) or a silage only system?
o What is the most appropriate economy of scale for a GBR facility: centralised or decentralised?
o Where are the potential catchments for the GBR described in the blueprint and what factors will determine the optimised locations?
Therefore, the aim of this chapter is to use a SWOT analysis (Strengths, Weaknesses,

Chapter 7
156
Opportunities, and Threats) to review the approach we have taken and the conclusions derived from the scoping study “Alternative Use of Grassland Biomass for Biorefinery in Ireland”. 2 Approach taken
The overall objective of the study was to assess the potential for GBR systems, i.e. we set out to determine if these systems were practical to implement (i.e. no major alteration of established farming systems) and financially feasible (i.e. profitable for GBR and farmer). In an attempt to achieve this, the study structure encompassed three levels (Fig. 7.1):
• Field level: where we investigated the grass quality and yields from 6 representative farms around Ireland to develop a base line of raw feedstock available for a GBR system
• Farm level: we aimed to determine the profitability for the farmer to supply grass to a GBR, and to identify what farming system in Ireland would be more inclined to supply a GBR.
• “National level”: to identify potential “hot spots” or areas which may have potential to support a GBR, i.e. high biomass availability, low farm income.
The reasoning for the approach and different steps taken are outlined below and in Fig. 7.1. 2.1 Field work summary
The quality of grass (i.e. how much of the desired component it contains) delivered to a Green biorefinery will determine the end quality of the products and, therefore, Grass (2004) suggested that price schemes should be established with respect to the characteristics of the raw material delivered. Two of the most important quality parameters for assessing grass feedstock for the GBR outlined in the blueprint were the fibre and crude protein contents (Grass, 2004). Therefore, in order to determine if the quantity and quality of grass biomass, under the current harvesting regime in Ireland (i.e. a two-cut silage system) was suitable for the GBR blueprint, we established field trials to assess the yields of dry matter (DM), fibre and crude protein of grass swards on six contrasting Irish farms (step 1). These farms differed in geographical location, soil type, weather, previous management and sward botanical

General discussion
157
composition. We managed the field trials under a two-cut silage system and assessed them using three annual input rates of inorganic N fertiliser (45, 90, 225 kg N ha-1 a-1), in two successive years. The grass harvested from these sites was also ensiled in the laboratory silos at Teagasc Grange, in order to assess the potential silage quality produced from these pastures. Thus, step 2 determined if pastures under conventional farming systems were compatible with the GBR blueprint of O’ Keeffe et al. (2009). Findings from the field trials were:
• Grass quality under the current cutting systems was suitable for the GBR blueprint.
• There was no immediate requirement for farmers to reseed grassland for biorefinery purposes, as permanent pasture, containing secondary grass species, (species with low agricultural value e.g. Poa spp., Agrostis spp., and H.
lanatus) was adequate for the basic refinery facility producing fibre and proteinaceous products.
• For more advanced technologies, the cutting systems would have to be modified, i.e. increasing the frequency of cuts in order to produce more press juice fraction (i.e. the current cutting systems had a greater volume press cake).
We then used the field trial data to develop biomass supply models to predict the DM yields, fibre and crude protein yields of grass being supplied to a GBR (step 3). The model inputs included the botanical composition of pastures, the phenological growth stage at which the grass was harvested, nitrogen fertiliser application rate and weather (rain, temperature, radiation, soil moisture deficit). We used data from the laboratory silo experiment to develop silage models to predict the ensiled grass quality or silage. The integrated supply and silage models were then used to generate a number of feedstock scenarios (Steps 3 and 4), to provide insight into how the quality and quantity of grass biomass from permanent pastures under a two-cut system could potentially affect the profitability of the GBR blueprint system outlined in O’Keeffe et al. (2009). The results of these findings will be discussed in further below. 2.2 Desk study - Modelling summary
The models generated in the second step of the scoping study were quantitative conservative mass and energy balances derived from the literature, best available data, and consultation with European GBR experts, biogas experts, agronomists, and biomass systems economists (Fig. 7.3). The third step in the scoping study was to test the feasibility of the GBR blueprint proposed by O’Keeffe et al. (2009), to determine

Chapter 7
158
Fig
. 7.1
Ove
rvie
w o
f ste
ps ta
ken
to a
sses
s th
e G
BR
blu
eprin
t

General discussion
159
the optimum process model, which could generate the most appropriate GBR scenario for Ireland. Therefore, we developed three biorefinery process models which were combinations of feedstocks (i.e. grass and silage or just silage) and technologies (i.e. basic technologies or low-tech to manufacture products from the fibres and proteinaceous fraction and future technologies high-tech used to extract high value compounds from silage biomass e.g. lactic acid). The scenarios generated were defined as: 1) Low tech / grass and silage, 2) Low tech / silage, and 3) High tech / silage (also producing LA from silage). Each of these three scenarios was then evaluated at three economies of scale (small, medium or large), resulting in 9 scenarios. The GBR process model determined to be the most suitable was a medium scale (decentralised) facility, processing silage only, and using the basic technologies for fibre and proteinaceous products. The fourth step of the study was to investigate the sensitivity of the GBR system’s profitability to biomass quality and quantity. We subjected the GBR process model to scenario analyses, to investigate how variations in grass quantity and quality, as a function of botanical composition, fertiliser application and biomass availability affected the profitability of the GBR. The outcomes of the scenario analyses were then used to calculate the price which the GBR could offer to farmers above their production costs (€ t-1 dry matter). This step was the foundation of the analysis to begin investigating the potential of GBR at farm level and hence national level. In the fifth step we used spatial scenario analyses of two contrasting farm case studies to investigate the sensitivity of the GBR profitability to variations in the geographical constraints of total biomass availability and surplus biomass availability. These sites were a dairy farm in the South of Ireland (Co. Cork); and a beef farm in the Mid-west Ireland (Co. Roscommon). Applying the aforementioned methods, we calculated the price which the GBR could offer each case study farmer. We then carried out a partial budget analysis which enabled us to determine the viability for both case study farms to supply to a GBR. The results of the partial budget and GIS analysis then allowed for the identification of potential regions which could support a GBR. The results from the field supply models and the desk study modelling outlined above are summarised in the finalised GBR blueprint below.

Chapter 7
160
2.3 Characteristics of a first generation GBR system
The finalised blueprint for an Irish GBR in the short-to-mid term was determined to be as follows:
• A small-scale decentralized facility, processing 0.8 t DM hour-1; • It should be located in a catchment area of approx. 700-800 ha, depending on
biomass availability. Biomass availability should be in excess of 30%, to avoid financial losses for both the GBR and farmers due to increased transport costs;
• In general, the viability of GBR will be highest in areas which have experienced declining livestock numbers and low farm income, particularly, but not exclusively, areas which supported a high proportion of beef farmers, such as the mid–west;
• In the start up period (short-term), the GBR can be integrated with the current harvesting practices, a two-cut silage system, as the quality of the biomass from such silage systems is compatible with the basic GBR technologies. The longer-term goal could then be to retrofit the GBR facility to produce higher value products;
• The GBR should operate using a silage only system, with ensiling of the grass material on the GBR facility site;
• The products initially produced should be based on those of the Swiss GBR facility, which were insulation materials (insulation boards) and proteinaceous products, used for animal feed;
• The waste streams remaining after the processing of the grass from the biorefinery should be used to generate biogas produced from the anaerobic digestion of the fibre slurries;
• The biogas produced should be used to supply the biorefinery plant with its own electricity, and heat for drying the press cake, as this was the more viable option at time of writing;
• The residual material remaining after the anaerobic digestion should then be used as fertiliser and supplied back to the associated farmers as part of a “waste management strategy” and to maintain the nutrient balance in the system;
• For these scenarios, the capital costs of such a GBR were estimated at c. seven million euro and the results of the scenario analyses suggest a minimum government subsidy of 9-11% would be required to establish this GBR operation.
It is the integration of field work with desk study analysis which delivers overall strength to this study as it has allowed for scenarios to be developed, to investigate how the quality of the raw biomass can affect the profitably of the whole GBR system,

General discussion
161
including the farmer providing the grass feedstock. This approach has helped to identify a number of strengths, weaknesses and opportunities for developing a GBR system in Ireland.
3 Strengths
3.1 Grass farming culture – Ireland’s greatest driving force for GBR development
Ireland already has an established culture of grassland farming (O' Mara, 2008). With a long growing season, i.e. from March to October, depending on location (O' Mara, 2008), and average DM yields ranging from approx. 15 t ha-1 in the Southwest to 11 t ha-1 in the Northeast (Brereton, 1995), grass has already been recognized as having potential for bioenergy or other uses (McGrath, 1991). Teagasc (the Irish Agricultural and Food Development Authority), is an authority on grassland production systems in Ireland and has developed a diverse spectrum of expertise and data relating to Irish grasslands and their production potential. This knowledge will be a very important resource for the development of alternative grassland uses such as GBR. The combination of a potentially large biomass supply, the presence of research institutes with high level of grassland expertise, and the large number of farmers and highly
Fig. 7.2 Flow diagram of the GBR model

Chapter 7
162
specialised agri-contractors familiar with grass husbandry (O' Kiely et al., 2004), make the supply side of a GBR system Ireland’s strongest asset and driving force for the development of green biorefinery.
4 Weaknesses
The technological aspect of the Green biorefinery and the processing technologies are currently Ireland’s Achilles’ heel for the development of such an industry. In comparison to continental Europe, Ireland currently lacks the basic technological infrastructures which have allowed for the European advancements in Green Biorefinery (O' Keeffe et al., 2009). These include green crop drying factories (there is only one Irish operation) and anaerobic digesters for biogas production. The limiting factors which will influence GBR development in Ireland; include (i) available technologies, their related extraction energy and the marketability of products generated by these technologies and (ii) capital investment required for such GBR systems.
4.1 Technologies and marketability
The implementation of the basic GBR technology was determined in this study to be a good starting point for a nascent Irish Green Biorefinery in the short-to- medium term. The longer-term goal could be retrofitting the GBR facility to produce higher value product. The basic biorefinery technology involves the separation of the feedstocks into two simple fractions of press cake (PC) and press juice (PJ). Marketable products have been successfully manufactured from these fractions in Europe. The press cake (PC) or fibre fraction can be used to produce insulation material, the functionality of which is comparable to the average mineral wool insulation on the market, with approx. 60 kg m-3 density and a heat conductivity of 0.04 W m-1 K-1 (Watts per meter Kelvin). From the press juice (PJ), proteinaceous fraction can be used as an additive for animal feed (Grass, 2004).
General discussion
163
4.1.1 Fibre product
The potential revenue generated from the fibre insulation material was estimated based on the literature and from consultation with members of the insulation industry. The selling prices ex factory was estimated in this study to be 0.80 €/kg (Grass, 2004). Net present value (NPV) was used as a measurement of cash flow in the GBR system and as a financial indicator of viability. A positive NPV indicates a potentially positive cash flow (profit) for the period in question and would suggest that the project has economic potential. A negative NPV indicates the project to be unviable and needs to be modified in order to have potential. As fibre constituted the greater proportion of the feedstock (500 g kg-1 DM) it is not surprising that the profitability indicator NPV (net present value) is sensitive to selling price of fibre products. However, the combination of high volume and assumed high value could be a potential area of weakness in the GBR model, as a seven percent reduction in selling price (€ 0.75/kg) will lead to a negative NPV. The profitability of the GBR system in relation to market volatility and fluctuations in energy and oil costs is and area which will need to be explored further. 4.1.2 Proteinaceous product
Silage was identified as the feedstock, which was financially and operationally feasible. However, during the ensiling process protein is broken down into peptides and amino acids, which leads to reduced efficiencies for extracting protein (Kromus et al., 2004; Thomsen, 2005). Therefore, due to a combination of low extraction efficiency due to and market factors (lower revenue determined at 0.27 € kg-1), the proteinaceous product has very little impact on the profitability of the predicted scenarios. The low value obtained for the proteinaceous extract is also an area of weakness, which needs to be considered for the short-term GBR. However, silage press juice contains valuable amino acids (e.g. Arginine, Methionine, Leucine, Lysine) and there is potential for extracting these using more advanced technologies, such as ultra-filtration (Danner et al., 2000; Kamm et al., 2009). However, these GBR extraction systems are still developing (Kromus et al., 2004; Mandel, 2010) and therefore this study focused on the conventional methods of coagulation and centrifuging.

Chapter 7
164
4.1.3 Product scenarios and energy
In the process of developing the models it became clear that the energy demand associated with drying the fibres (the largest bulk of the biomass) was considerable and there was relatively little additional value generated through protein extraction. Therefore, two possible production scenarios were identified; the first was to produce fibre products alone as insulation material (“No Prot” scenario), and the second was to include a secondary proteinaceous product as an animal feed (“Prot” scenario). The scenario which produces fibre only “No Prot” scenarios, could be viable in the short to medium term, due to the current Irish Government’s “Greener home scheme” (SEAI, 2010), which promotes the insulation of older houses to improve their heat energy rating. However, with the economic downturn (at time of writing), the construction industry is facing many obstacles (DKM Economic Consultants, Feburary 2010), which could have implications for a fibre-only system. The production of other non-related products therefore could help to buffer price changes with the fibre product. This is one of the key concepts of biorefinery, to enhance profitability and sustainability through the production of a multitude of products from the one feedstock (Kromus et al., 2004). One key issue which was not examined here, and which could be very relevant for improving the profitability of a biorefinery and the anaerobic digester performance, is the addition of animal slurries for co-digestion (Jagadabhi et al., 2008; Singh et al., 2010). Such additions potentially increase biogas production and hence increase energy available for processing. This would change the outcomes of these predicted scenarios and negate the need to use the protein fraction for energy generations. The crude protein installations could be constructed with the initial development, or retrofitted when conditions (technologies, grass husbandry) become more favourable for protein extraction. It is the liquid stream where most of the potentially high value products are to be extracted (Danner and Braun, 1999), therefore, the benefits of starting operations with protein extraction, provides the opportunity for biorefinery stakeholders to become familiar with processing the juice and increasing the potential to upgrading to more advanced process technologies, such as lactic acid production. Therefore, because both systems have potential, they were both considered in the development of the blueprint for an Irish GBR.

General discussion
165
4.2 Capital investment and associated risk factors
The capital involved in setting up a GBR is substantial (Kamm et al., 2009; Mandel, 2010) and therefore the investment risk involved in constructing a facility from the foundations, would be significantly higher in Ireland than in Europe, where the basic technologies are already commonplace. In the research and development stage of new bio-industries, profitability analysis tools are used to determine if a proposed system has potential or not. Even if not all the relevant information is known, and there are large error margins associated with the quantitative models, the profitability tools highlight in a quantitative way those factors which need to be modified to make the system more viable.
Discounted cash flow (DCF) is the most widely used instrument for measuring venture investment profitability. An important component for calculating DCF is the ir value (interest rate or discount rate). This is the cost of buying the capital needed for an investment and reflects the risk associated with the investment, the higher the ir value, the greater the risk assumed for return on investment capital.
For the scenarios presented here, a conservative risk factor of 10% was applied. This value was assumed from the literature and from consultation with biomass economist experts (O' Keeffe et al., submitted b). In Ireland, the level of risk associated with establishing a GBR system may be higher or lower than that estimated here. The decentralised scenarios, with a required capital investment of c. €7 million, showed economic potential with relatively low government subsidies, at c. 9-11% of the required capital investment. However if the level of risk was assumed to be higher, then the risk factor would increase, reducing the profitability of the scenarios predicted. This would lead to an increase in the level of subsidy required to support such an industry. Fig.7.4 shows the extent to which the associated risk of starting a GBR industry could change the subsidies required. This is an important consideration when assessing the results of these scenarios. Although the risk involved will change the potential profit of the system, the overall trends shown in the scenario analysis, will ultimately remain the same. An important consideration to note is that the scenarios were generated under idealized conditions, which sometimes may not truly reflect the real life situation.

Chapter 7
166
5 Opportunities
Although Ireland has been slower than most countries in mainland Europe in adopting new biomass crops for bioenergy or biorefinery systems (Sustainable Energy Ireland, 2004), this also presents many opportunities to assess its green biomass options. This study capitalised on, and benefited from, the key findings from the advancements made in the European GBR concepts; these were used as a benchmark, for developing the Irish GBR blueprint. Components and aspects which worked in other countries were combined to provide a framework to approach the potential of alternative grassland uses. Knowledge gaps associated with the supply side of an Irish Green Biorefinery system were identified at the start of this study, and associated opportunities to improve on the European models have been identified.
Fig. 7.3 Changes in subsidies with increasing risk factor ir

General discussion
167
5.1 Basic technologies combined with the quantity and quality of grass biomass
The study showed that grass harvested under current regimes predominantly comprises of a solid press cake or fibre fraction and therefore technologies for manufacturing from this solid fraction appear to be the more viable option in the short-to-mid-term, as it accommodates a better integration with current farming systems. However, higher value products, which could be used as substitutes for mineral oil derived products such as lactic acid for plastic and polylactide (PLA) production, proteins for the animal feed and cosmetics industries, can potentially be produced from the press juice fraction. Therefore, these scenarios also highlight that for the longer term, current harvesting systems may require adapting e.g. increased cuts in the year in order to enhance the profitability of a biorefinery. However, the trade-off between increased harvesting costs and increased energy consumption for this type of system will also need to be determined whether it is viable or not. During the last ten years the activities in the field of biorefinery systems have grown, particularly in the Green Biorefinery concept, which is currently in advanced stages in many EU countries and have reached pilot scale. Therefore this could provide Ireland with the opportunity to introduce technologies in phases. Once a biomass supply system has been established, further research could be carried out to determine optimum time of cutting, grass species etc. that would be aligned to more advanced extraction technologies and the juice fraction. 5.2. The impact of grass/silage quality on the profitability of the GBR system
The scenario analyses in step four indicated that GBRs supplied with a biomass feedstock from permanent pasture with a perennial rye grass (Lolium perenne) content of at least 60%, with relatively high N fertilisation (225 kg N ha-1 a-1), was suitable to supply a GBR system producing fibre fraction products and crude protein products. Therefore, there was no immediate requirement for the farmer to resow. The analyses in step four also suggested that grass yields in the range of 9 - 12 t DM ha-1a-1, with a fibre content ranging from 550 - 500 g kg-1 DM and a protein content of 110-130 g kg-1 DM, had the potential to result in a viable GBR system. The scenarios generated also demonstrated the significance of sward botanical composition for the quality of the pasture biomass and suggest that some secondary grass species (grasses which might not be optimal for livestock systems, i.e. might have lower feed quality than L.
perenne dominated swards (Peeters, 2004)) have the potential to be used for industrial applications in a GBR.

Chapter 7
168
Much of the research focus was on the grass raw feedstock and harvesting conditions and assumed optimum ensiling conditions. Silage was identified as the optimum feedstock. Danner et al. (2000) noted the need to improve the technical and economic attributes of silage production, for it to be used as a potential substrate for industrial chemicals. Therefore, this is an area which requires further research. It is also clear from the scenario analyses conducted in this study that it is not only biomass availability and DM yields that are crucial factors to be considered when identifying potential locations for a GBR; biomass quality also needs to be an important consideration. The field data from this study can only offer a “snap shot” of the potential feedstock available throughout the season and nationwide, as it was limited both spatially (six national sites) and temporally (only two annual cuts in two years). Therefore, a modelling approach was necessary to assess the supply side of a GBR system. The prediction errors in the biomass supply models will to some extent result in error in the GBR models. To assess the severity of these prediction errors, sensitivity analyses were conducted for every scenario generated. The interpretations of the results should therefore, be based on these trends, rather than on the absolute values.
5.3 Economy of scale
Economies of scale will be determined by two factors. The first is the size of catchment area needed and the availability of feedstock, which will in turn determine the associated transport costs. The second is the number of farmers required to supply the biorefinery and the organisational structure of the biorefinery operation, i.e. whether it will be a private limited company or a cooperative of farmers. The decentralised biorefinery model scenarios were found to be the most viable option. The relatively smaller catchment area would allow for a better management of feedstock quality as the biorefinery operator will have a better communication with the supplier and therefore knowledge of the feedstock quality. This size of an operation would have the potential to be run by a cooperative of farmers, approx. 25 farmers in the catchment area, small enough for practical decisions making. In this study, we focused on assessing the feasibility of a stand-alone operation, i.e. a self contained facility; grass is delivered and processed on site. There are a number of aalternative operational structures being investigated in Europe; for example a combination of combined centralised and decentralised GBR units (Kromus et al.,

General discussion
169
2004). In process structures such as these systems a particular component of the grass/silage which would degrade rapidly after harvesting/opening of silo would be extracted in a small decentralised facility and stored until further processing in a centralised facility. However, these systems are highly complex and therefore, the GBR blueprint was relatively simple and therefore it could potentially be used as a foundation to begin developing the concept of centralized, decentralized units for Ireland. 5.4 Potential catchments or “hot spots” for a GBR facility
Field site selection was based on the five farming zones or agro-geo-climatic regions identified by (Crowley et al., 2007a) (See Fig. 2.2 in Chapter 2). The reason for this approach was the ability at the later stages of the study (step four) to develop a case study scenario or the farm level potential for GBR. The final scenario-modelling step, step five, presented the opportunity to asses GBR on a farm and national level. The use of the case studies to assess two contrasting farm systems gives valuable insight into the potential economic feasibility for farmers to supply either all or surplus biomass (i.e. the grass available after livestock fodder requirements have been met) to the GBR. The results of these scenarios suggest that areas which support a high proportion of beef farmers, such as the mid-west, which have experienced declining livestock numbers and low farm incomes, could be the most viable locations. The scenarios were predicted as profitable under optimized conditions and indicated that there was no need to change farm practices or destock any further, as the GBR system was already viable for both the farmer and the GBR, even under surplus grass supply, provided the biomass availability is greater than 30%. This means the GBR would be guaranteed a supply of grass from approximately 30% of the total catchment area i.e. 252 hectares of grassland would supply the GBR out of 840 hectares. The ability of GBR systems to operate using surplus biomass could mean this GBR system may not necessarily compete with beef production However, should farmers choose to destock further, then they have the potential to supply a GBR. 5.5 Synergies with policy
The use of permanent pastures as a feedstock, and the establishment of a decentralized facility located in a rural catchment area is synergistic with targets set out in a number

Chapter 7
170
of key policy areas, such as the protection of biodiversity and prevention of land abandonment and promotion of rural employment. It is aligned with axes two, three, and four of Ireland’s National Sustainable Development Plan 2007-2013. Development of GBR systems also has duel benefits for achieving the targets set out in the National Climate Change Strategy (NCCS), which aims to try and reduce greenhouse gas (GHG) emissions below those of 1990 (the baseline date for the Kyoto Agreement). The use of grassland for GBR could contribute to reducing agricultural GHG emissions in three different ways: 1. Maintenance of permanent pastures with associated net carbon sequestration
(EPA, 2008b; Tilman et al., 2006). 2. Potential reductions in methane emissions through the potential displacement of
livestock by alternative or supplementary income. 3. Fossil fuel displacement in the manufacturing of end products. 6. Threats
Unlike some other European countries, there has been a historic under-investment in energy networks, and an absence of a coherent energy policy in Ireland. This has resulted in a slow development of the biofuels industry, predominantly attributable to the lack of fiscal incentives and lack of transparency in grid access required to boost the commercial viability of biofuels (EU and Irish Regions Office, 2006). There are a number of areas where developing GBR systems as viable rural industries will require adequate policy support and government assistance. A European study identified that different goal conflicts such as cost effectiveness and environmental protection need to optimised in order to assure the sustainability of the GBR system (Popa-CTDA, 2005). This will be the case for Ireland also. Due to time constraints, a full environmental assessment was not carried out as part of this study. This is an area which will require detailed research in the next 5-10 years, in order to establish the policy infrastructure, to provide for clear planning and stability to the system. Some examples of policy “grey areas” are highlight below. 6.1 Example of policies to be addressed
6.1.1. Nitrates directive
The grass harvesting system we assumed for the GBR system (i.e. two-cut silage

General discussion
171
system) involved no livestock (cattle) production and assumed the fertiliser rates recommended by Teagasc (Coulter and Lalor, 2008). However, the final scenario analyses suggested that it was profitable for farmers to supply surplus grass to a GBR. This system could potentially lead to a conflict with Ireland’s NAP (Nitrates Action Plan). Currently, the extra fertiliser inputs and the nutrients in the digestate will be counted as nutrient inputs under the Nitrates Directive, but the nutrients in the biomass will not be counted as nutrient outputs. This will result in a “virtual” nutrient surplus and hence this type of GBR system would be in breach with Nitrates Regulations. In addition, under the current NAP, maximum chemical fertilisation rates are related to animal stocking rates. In a “full supply” GBR scenario (in which no animals are present), this would result in allowable fertilisation rates well below crop requirements. These are anomalies of the NAP that would have to be addressed before any farm can supply to a GBR.
6.1.2. IPPC licensing
The GBR facility in this blueprint may require an IPPC (Integrated Pollution Prevention Control) licence, due to the production of insulation materials from the fibre fraction (under section 6 of the EC directive 2008/1/EC). If this is the case then the land spreading of the digestate from the anaerobic digester would have to seek approval from the EPA (Environmental protection agency) (N. Hayes, pers. comm.). This could result in time delays and potential storage difficulties while waiting on approval for spreading. The area of waste permits is an area which will need clarification for both the GBR operators and the agricultural contractors/famers transporting the digestate. In the longer term scenario, the production classification of GBRs producing higher value biochemicals will also need to be considered as this will determine the level of waste legislation compliance and environmental management systems required for such facilities. This will be of particular importance for GBRs located in rural and decentralised locations.
6.1.3. Planning legislation
GBRs are designed to be located in rural catchment areas, therefore obtaining planning to build a facility may be difficult, particularly if local communities are concerned

Chapter 7
172
about the development and object to the construction (Department of Communications Marine and Natural Resources, 2005). Planning can be the slowest part of a project development and can result in high costs, which may be a potential deterrent for development of the GBR. However, this issue has been recognised and a “Consultation Paper on proposed planning exemptions for certain Renewable Energy Technologies” has been published to address this issue. 6.2 Fiscal policy – Government financial support subsidies
Each European country had a particular motivation to pursue the concept of Green biorefinery (O' Keeffe et al., 2009), however it is apparent from the findings of the literature review that policy is one of the major impetuses providing the foundations and support for such advancements. Without the political support, the basic physical infrastructures, such as the green pellet industries (Denmark), starch refining (Holland) or biogas technologies (Germany/Austria) would never have materialised, or allowed for the development of the Green biorefinery concept. The idealised decentralised model scenarios presented here, show that green biorefinery requires minimum government support of at least 9-11%, to be established successfully in Ireland, with rates in excess of this reducing risk and adding to the economic sustainability of the venture. 6.3 Farmers’ willingness to sell and social acceptance of new technologies Farmers’ decisions to adopt new technologies can vary extensively for a number of different factors (i.e. demographics, farm size) (MackenWalsh, 2002; Mathijs, 2003). The initial transition to farming for a GBR system could potentially be smoother if “current harvesting practices” were adopted, with a view to modification in the long term. However, as this type of industry has yet to be shown as successful, farmers might not be willing to sell their grass to a GBR facility. Thus the potential to develop a GBR facility on surplus grass from livestock systems could be beneficial for the initiation of such an industry.

General discussion
173
7 Recommendations for future research
7.1 Management of grasslands
• Modifications to conventional grassland harvesting systems will be required for a GBR interested in other grass/silage fractions, particularly the higher value fractions required for energy production (high sugar), lactic acid;
• The grass species/hybrids most suitable for the different GBR systems, including future technologies and those outlined in the blueprint need to be identified;
• For the supply chain, detailed research is required to determine the best means of integrating GBR farming practices with conventional farming practices (i.e. livestock systems) in order to determine how both systems could be modified to enhance the performance of each other.
7.2 GBR operations
• There is a need to establish quality analysis for determining the feedstock quality coming into the GBR facility;
• Determination of the nutrient content of the GBR digestate and methodologies for assessment in order to allow for nutrient budgeting and compliance with the NAP;
• The impacts of GBR digestate on grassland productivity also needs to be determined in order to determine the Nitrogen Fertiliser Replacement Value and phosphorus availability value.
7.3 Technologies and sustainability
• A total LCA energy balance would be required as well as a carbon foot print to establish if the GBR is energy efficient and carbon neutral;
• Since writing, technologies investigating amino acid extraction and lactic acid extraction have been upgraded to pilot scale; therefore the longer-term integration of such technologies with an established GBR needs to be assessed.
7.4 Policy infrastructure and social acceptance
• More detailed economic analysis is required, taking market and global trade factors into account to determine the level of risk involved in establishing a GBR in Ireland;

Chapter 7
174
• A clearer definition of the biorefinery/bioenergy industries in relation to IPPC licensing and the requirements for waste permits to land spreading.
• A bottom up approach would be the best means of integrating such an alternative farming system and industry into a rural community. This would involve the development of a consultative processes and stakeholder interaction to facilitate the communication of the requirements of both the farmer, community and the GBR.
8 Concluding remarks
The blueprint was designed to be a benchmark for establishing an initial facility with the aim of retrofitting the facility when the technologies become more readily available. In this way a supply chain can potentially be established and operational, before higher investment costs are required. The approach, to phase the development of the GBR in stages, will give these industries the time to gain the support of the farmers within the catchment regions and gain public approval.

175
References
References
176
References
Agricultural Workers Joint Labour Committee. 2010. Conditions of employment for agricultural workers. [Accessed June 2010] http://www.labourcourt.ie/Labour/Information.nsf/447a09a9deaa452280256a1b0052dc2e/9e9d066a6aeaf803802569e0003d99b7?OpenDocument Al Seadi, T., D. Rutz, H. Prassl, M. Knöttner, T. Finisterwalder, S. Volk, and R.
Janssen. 2008. Biogas Handbook. University of Southern Denmark, Esbjerg. Andersen, M., and P. Kiel. 2000. Integrated utilisation of green biorefinery. Industrial
Crops and Products. 11:129-137. Baier, U., and P. Delavy. 2003. Bioenergie, Protein & Fasern aus Gras Monitoring des
Biogasprozesses. In Im Auftrag der BIOENERGIE SCHAFFHAUSEN AG und der 2B Biorefineries AG.
Baier, U., and P. Delavy. 2005. UASB treatment of liquid residues from Grass Bioreffination. Water Science & Technology. 52:405-411.
Baron, V.S., A.C. Dick, M. Bjorge, and G. Lastiwka. 2004. Stockpiling potential of perennial forage species adapted to the Canadian Western Prairie Parkland. Agronomy Journal. 96:1545-1552.
Barrett, P.D., A.S. Laidlaw, and C.S. Mayne. 2004. An evaluation of selected perennial ryegrass growth models for development and integration into a pasture management decision support system. Journal of Agricultural Science (Camb.). 142:327-334.
Barry, M., and E. Colleran. 1982. Anaerobic digestion of silage effluent using an upflow fixed bed reactor Agricultural Waste. 4: 231-239.
Bastiman, B., and J.F.B. Altman. 1985. Losses at various stages in silage making. Research and Development in Agriculture. 2:19-25.
Binne, R.C., and J.P. Frost. 1995. Some effects of applying undiluted silage effluent to grassland. Grass and Forage Science. 50:272-285.
Braun, R. 2007. Anaerobic digestion: a multi-faceted process for energy, environmental management and rural development. In: Ranalli, P. (ed.). Improvement of crop plants for industrial end-uses. Berlin: Springer, pp. 335-416.
Brehmer, B. 2008. Chemical biorefinery perspectives: The valorisation of functionalised chemicals from biomass resources compared to the conventional fossil fuel production route. PhD thesis. Wageningen University, Wageningen, The Netherlands. 181 pp. (ISBN: 978-90-8504-987-6).
Brereton, J. 1995. Regional and year-to-year variation in production In: . D.W. Jeffrey, M.B. Jones, and J.H. McAdam, (ed.). Irish Grassland- their biology and management. Dublin Royal Irish Acedemy, Dublin Royal Irish Academy, pp 12-22.

References
177
Bruinenberg, M.H., H. Valk, H. Korevaar, and P.C. Struik. 2002. Factors affecting digestibility of temperate forages from semi natural grasslands: A review. Grass
and Forage Science. 57:292-301. Buxton, D.R. 1996. Quality-related characteristics of forages as influenced by plant
environment and agronomic factors. Animal Feed Science and Technology. 59:37-49.
Cameron, D. 1974. Three simple steps to determine optimum plant capacity. Long
Term Planning. 6:40-44. Central statistic office, (CSO), and Ireland. 2008. http://www.cso.ie/ Central statistic office, (CSO) Ireland, 2009. Average earnings per week (Euro) by sex,
year and broad industrial sector. http://www.cso.ie/quicktables/GetQuickTables.aspx?FileName=QIJA.asp&TableName=Industrial+Earnings&StatisticalProduct=DB_QI. Ceotto, E. 2008. Grasslands for bioenergy production. A review. Agronomy for
Sustainable Development. 28:47-55. Chaves, V.A., J.L. Burke, G.C. Waghorn, and I.M. Brookes. 2006. Digestion kinetics
of leaf, stem and infloresence from five species of mature grasses. Journal of the
Science of Food and Agriculture. 86:816-825. Clancy, D., J. Breen, A.M. Butler, F. Thorne, and M. Wallace. 2008. A Discounted
Cash Flow Analysis of Financial Returns from Biomass Crops in Ireland. Working Paper 08-WP-RE-08. Rural Economy Research Centre, Teagasc.
Connolly, L., A. Kinsella, G. Quinlan, and B. Moran. 2009. Irish National Farm Survey Teagasc, Farm Survey Department, Athenry, Co. Galway.
Connolly, L., A. Kinsella, G. Quinlan, and B. Moran. 2008. Irish National Farm Survey Teagasc, Farm Survey Department, Athenry, Co. Galway.
Coulter, B., and S. Lalor. 2008. Major and micro nutrient advice for productive agricultural crops, 3rd Ed.Johnstown Castle, Wexford.
Cowling, D.W., and D.R. Lockyer. 1965. A comparison of the reaction of different grass species to fertiliser nitrogen and to growth in association with white clover I. Yield of dry matter. Journal of the British Grassland Society. 20:197-204.
Crowley, C., D. Meredith, and J. Walsh. 2007a. A spatial analysis of agriculture in the Republic of Ireland, 1991 to 2000. Teagasc end of project reports.
Crowley, C., J. Walsh, and D. Meredith. 2007b. Irish agriculture at the millennium: a census atlas. RERC, Teagasc and National University of Ireland, Maynooth, Ireland.
Danner, H., and R. Braun. 1999. Biotechnology for the production of commodity chemicals from biomass. The Royal Society of Chemistry. 28:395-405.

References
178
Danner, H., L. Madzingaidzo, M. Holzer, L. Mayrhuber, and R. Braun. 2000. Extraction and purification of lactic acid from silages. Bioresource Technology. 75:181-187.
Danner, H., L. Madzingaidzo, C. Thomasser, M. Neureiter, and R. Braun. 2002. Thermopilic production of lactic acid using integrated membrane bioreactor systems coupled with monopolar electrodialysis. Applied Microbiology
Biotechnology. 59:160-169. Deans, E.A., and I.F. Svoboda. 1992 Aerobic treatment of silage effluent experiments
laboratory. Bioresource Technology. 40:23-27. del Prado, A., L. Brown, R. Schulte, M. Ryan, and D. Scholefield. 2006. Principles of
a mass balance N cycle model for temperate grasslands:an Irish case study. Nutrient Cycling in Agroecosystems. 74:115-131.
Department for the Environment Heritage and Local Government. 2009. Local Authority budgets.
Department of Communications Marine and Natural Resources. 2005. Bioenergy Action Plan for Ireland.
Derrick, R.W., G. Moseley, and D. Wilman. 1993. Intake by sheep, and digestibility of chickweed, dandelion, dock, ribwort and spurrey, compared with perennial ryegrass. Journal of Agricultural Science (Camb.). 120:51-61.
DKM Economic Consultants. Feburary 2010. Construction industry indicators. Prepared for the Department of the Environment, Heritage, and.Local Government.
Dumont, B., J.P. Garel, C. Ginane, F. Decuq, A. Farruggia, P. Pradel, C. Rigolot, and M. Petit. 2007. Effect of cattle grazing a species-rich mountain pasture under different stocking rates on the dynamics of diet selection and sward structure. The
Animal Consortium. 1:1042–1052. Duru, M., P.P. Cruz , R. Al Haj Khaled, C.D. Ducourtieux, and J.P. Theau. 2008.
Relevance of plant functional types based on leaf dry matter content for assessing digestibility of native grass species and species-rich grassland communities in spring. Agronomy Journal. 100:1622-1630.
EPA. 2008a. Environmental Protection Agency. The state of the Irish Environment Chapter 11 Land Use Change (ed.). Environmental Protection Agency.
EPA. 2008b. Ireland’s National Greenhouse Gas Emissions Projections to 2020. Includes comparison with Ireland’s Kyoto Limit for 2008-2012 and with Proposed EU Target for 2020. In: Ireland’s National Greenhouse Gas Emissions Projections to 2020. Environmental Protection Agency, Johnstown Castle, Wexford, Ireland.
EU, and Irish Regions Office. 2006. EU Policy and Initiatives for Renewable Energy and Energy Efficiency: An Irish Perspective. In Policy Briefing, Brussels.
EU Commission. 2010. Commission staff working document on implementation of

References
179
Council Directive 91/676/EEC concerning the protection of waters against pollution caused by nitrates from agricultural sources based on Member State reports for the period 2004-2007. Accompanying document to the Report from the Commission to the Council and the European Parliament {COM(2010) 47}. In SEC(2010) 118 final Brussels.
Fairbairn, C.B., and T. Brynmor. 1959. The potential nutritive value of some weeds common to North- Eastern England. Journal of the British Grassland Society. 14:36-46.
FAOSTAT. 2008. http://faostat.fao.org/site/291/default.aspx. Favati F., R. Ricci, R. Fiorentini, L. Massignan, and A. Tuci. 1989. Energy evaluation
of simplified wet green crop fractionation processes In F. Favati, (ed.). 3rd International Conference on Leaf Protein Reserach LEAF-PRO LEAF-PRO Special Issue Italian Journal of Food Science, Pisa, Perugia, Viterbo, Italy.
Ferguson, W.S., and R.A. Terry. 1957. The effect of nitrogenous fertiliser on the non-protein nitrogenous fraction of grassland herbage. Journal of Agricultural Science
(Camb.). 48:149-152. Food Navigator.com (2005). Lactic acid price rise at Purac. In Financial & Industry. http://www.foodnavigator.com/Financial-Industry/Lactic-acid-price-rise-at-Purac. Fositt, J.A. 2000. A guide to habitats in Irelands. In The Heritage Council of Ireland
Series. The Heritage Council of Ireland. Frame, J. 1989. Herbage productivity of a range of grass species under a silage cutting
regime with high fertiliser nitrogen application. Grass and Forage Science. 44:267-276.
Frame, J. 1991. Herbage production and quality of a range of secondary grass species at 5 different rates of fertiliser application. Grass and Forage Science. 46:139-151.
Frame, J., J.F.L. Charlton, and A.S. Laidlaw. 1998. Temperate Forage Legumes. Wallingford. CAB International
Frame J. 1990. Herbage productivity of a range of species in association with white clover. Grass and Forage Science. 45:57-64.
Galanos, E., K.R. Gray, A.J. Biddlestone, and K. Thayanithy. 1995. The aerobic treatment of silage effluent: characterisitisation and fermentation Journal of
Agricultural Engineering Research. 62:271-27. Gardiner, M.J., and P. Ryan. 1969. A new generalised soil map of Ireland and its land-
use interpretation. Irish Journal of Agricultural Research. 8:95-109. Gebrezgabher, S.A., M.P.M. Meuwissen, B.A.M. Prins, and A.G.J.M. Oude Lansink.
2010. Economic analysis of anaerobic digestion—A case of Green power biogas plant in The Netherlands. NJAS-Wageningen Journal of Life Sciences 57:109-115.
Geveke, J. 2009. Power and heat from Grass: Three years experience in Germany.

References
180
Presentation at "Bioenergy Fuelling Ireland's Future", IrBEA Conference. Gordon, C.H. 1967. Storage losses in silage as affected by moisture content and
structure. Journal of Diary Science. 50:397-403. Grass, S. 2004. Utilisation of grass for the production of fibres, protein and energy. In
Biomass and Agriculture: Sustainability, Markets and Policies. OECD Paris pp167-177.
Haggar, R.J. 1976. The seasonal productivity, quality and response to nitrogen of four indigenous grasses compared with Lolium perenne. Journal of the British
Grassland Society. 31:197-207. Haggar, R.J., S.P. Isaac, and C.J. Standell. 1989. Modifying growth patterns in nine
grasses with mefluidide. Grass and Forage Science. 44:85-90. Haigh, P.M. 1998. Effect of additives on grass silage fermentation and effluent
production and on intake and liveweight change of young cattle. Journal of
Agricultural Engineering Research. 69:141-148. Halasz, L., G. Povoden, and M. Nardodoslawsky. 2005. Sustainable process synthesis
for renewable resources. Resources Conservation and Recycling. 44:293-307. Hansen, G., and S. Grass. 1999. A method of continuous separation of vegetable
biomass into a fluid phase and a solid containing phase of pulpy consistance. EU patent, EP 1 110 461 A1.
Harper, L.A., O.T. Denmead, J.R. Freaney, and F.M. Byers. 1999. Direct measurements and methane emissions from grazing and feedlot cattle. Journal of
Animal Science. 77:1392-1401. Heath, S.B., and M.W. King. 1976. The production of crops for green crop
fractionation. In: R.J., Wilkins (ed.). Green Crop Fractionation Occasional Symposium No. 9 British Grassland Society.
Hejduk, S., and P. Doležal. 2004. Nutritive value of broad-leaved dock (Rumex obtusifolius L.) and its effect on the quality of grass silages. Czech Journal of
Agricultural Science. 49:144-150. Henderson, J.L., R.S. Edwards, and J.L. Hammerton. 1962. The productivity of five
grass species at six levels of compound fertiliser application I. Dry-matter production. The Journal of Agricultural Science. 59:5-11.
Hoekstra, N.J., P.C. Struik, E.A. Lantinga, and R.P.O. Schulte. 2007. Chemical composition of lamina and sheath of Lolium perenne as affected by herbage management. NJAS-Wageningen Journal of Life Sciences. 55:55-73.
Holliday, L., M. Chessire, and R. Mulliner. 2005. Rye grass as an energy crop using biogas technology. UK Department of Trade and Industry.
Holman, J.D. 2007. Structural composition Growth stage, and Cultivar Affects on Kentucky Bluegrass forage yield and nutrient composition Agronomy Journal.

References
181
99:195-202. Holmes, B.J., and R.E. Muck. 2000. Preventing Silage Storage Losses. University of
Wisconsin-Madison. [Accessed on line July 2009] http://www.uwex.edu/ces/crops/uwforage/prevent-silage-storage7.PDF Hopkins, A. 2000. Grass: its production and utilization. British Grassland Society.
Blackwell Science. Huang C., T. Xu, Y. Zhang, Y. Xue, and G. Chen. 2007. Application of electrodialysis
to the production of organic acids: State-of-the-art and recent developments. Journal of Membrane Science. 288:1–12.
Hulst, A.C., J.J.M.H. Ketelaars, and J.P. Sanders. 2004. Accessing leaf protein and/or stem parts of plants U.S. Patent, US 6,800,319 B1.
Humphreys, M.O. 1995. Investigations into aspects of the dynamics of Rumex obtusifolius L. (Broad-leaf dock) populations in grassland. Dept. of Crop Science, Horticulture and Forestry. PhD. University of Dublin, Dublin.
Hynes, S., K. Morrissey, and C. O’Donoghue. 2006. Building a static farm level spatial microsimulation model: Statistically matching the Irish National Farm Survey to the Irish Census of Agriculture. In Teagasc Working Paper 05-WP-RE-06
Irish Farmers Monthly. 2008 Alternative energy guide. Accessed May 2008. http://www.irishfarmersmonthly.com/Links/PDF's/Energy.pdf. Jagadabhi, P.S., A. Lehtomäki, and J. Rintala. 2008. Co-digestion of grass silage and
cow manure in a CSTR by re-circulation of alkali treated solids of the digestate. Environmental Technology. 29:1083-1093.
Jegen, M., and R. Wustenhagen. 2001. Modernise it, sustainablise it! Swiss energy policy on the eve of electricity market liberalisation. Energy Policy. 29:45-54.
Kamm, B., M. Kamm, S. Kromus, and N. Narodoslwsky. 2000. Green Biorefinery European network for the implementation of biorefineries (NIB). Brandenburgische Umwelt Berichte (BUB) 8:251-259.
Kamm, B., P. Schönicke, and M. Kamme. 2009. Communication biorefining of green biomass - technical and energetic considerations. Clean, Soil, Air, Water. 37:27-30.
Keady, T.W.J., and P. O'Kiely. 1996. An evaluation of the effects of rate of nitrogen fertilisation of grassland on silage fermentation, in-silo losses, effluent production and aerobic stability. Grass and Forage Science. 51:360-362.
Keane, T. 1986. Climate, Weather and Irish Agriculture. In AgMET. (ed.)., Dublin. 329 pp.
Keating, T., and P. O'Kiely. 2000a. Comparison of old permanent grassland, Lolium
perenne and Lolium multiflorum swards grown for silage. 1 Effects on beef production per hectare. Irish Journal of Agricultural and Food Research. 39:1-24.

References
182
Keating, T., and P. O'Kiely. 2000b. Comparison of old permanent grassland, Lolium
perenne and Lolium multiflorum swards grown for silage. 4. Effects of varying harvesting date. Irish Journal of Agricultural and Food Research. 39:55-71.
Keijsers, E.R.P. 2003. Kleinschalige bioraffinage gras: Praktijkproeven en massa-balans. Agrotechnology and Food Sciences Group, lid van Wageningen UR.
Ketelaars, J.J.M.H., and B. Rutgers. 2002. Bio-raffinage van gras een verkenning van mogelikheden en perspectieven Vertrouweliijk. In Nota 159. Plant Research International B.V., Wageningen.
Kiel, Bioconversion of agricultural residues In: K. Soyez and A. Moser, Editors, Ecologic Bioprocessing––Challenges in Practice, Beiträge zur ökologischen
Technologie vol. 1, Verlag Gesellschaft für ökologische Technologie und Systemanalyse e.V., Berlin, Germany (1993), pp. 147–152.
Kirwan, L., J. Connolly, J.A. Finn, C. Brophy, A. Luscher, D. Nyfeler, and M.T. Sebastia. 2009. Diversity - interaction modelling: estimating contributions of species identities and interactions to ecosystem function. Ecology. 90:2032-2038.
Knitter, T. 2009. Personal communication to the author. CHP from biogas . Koschuh, W., V. Hong Thang, S. Krasteva, S. Novalin, and K.D. Kulbe. 2005. Flux
and retention behaviour of nanofiltration and fine ultrafiltration membranes in filtration juice from a green biorefinery: A membrane screening. Journal of
Membrane Science: 261:121-128. Koschuh, W., G. Povoden, V. Thang Hong , S. Kromus, K.D. Kulbe, S. Novalin, and
C. Krotscheck. 2004. Production of leaf protein concentration from ryegrass (Lolium perenne x multiflorum) and alfalfa (Medicago sativa subsp. sativa). Comparison between heat coagulation/centrifugation and ultrafiltration. Desalination. 163:253-259.
Kromus, S. 2002. Grüne Bioraffinerie Österreich - Entwicklung einer integrierten System zur Nutzung von Grünlandbiomasse PhD. University of Technology, Graz.
Kromus, S., B. Wachter, W. Koschuh, M. Mandl, C. Krotscheck, and M. Nardoslawsky. 2004. The green biorefinery Austria-Development of an integrated system for green biomass utilisation. Chemical and Biochemical Engineering
Quarterly. 18:7-12. Lantinga, E.A., P.J.A.G. Deenen, and H. Van Keulen. 1999. Herbage and animal
production responses to fertiliser nitrogen in perennial ryegrass swards. II. Rotational grazing and cutting. Netherlands Journal of Agricultural Sciences. 47:243-261.
Lemaire, G., R. Wilkins , and J. Hodgson. 2005. Challenges for grassland science: managing research priorities. Agriculture, Ecosystems and Environment. 108:99-108.

References
183
Lenehan, J.J. 2004. Potential of grass as a feedstock for anaerobic digestion unpublished. Teagasc.
MackenWalsh, A. 2002. A Review of the Social Benefits of Joint Farming Ventures. In Working Paper Series 10-WP-RE-02. Rural Economy Research Centre, Teagasc, Athenry, Galway, Ireland.
Madzingaido, L., H. Danner, and R. Braun. 2002. Process development and optimisation of lactic acid purification using electrodialysis. Journal of
Biotechnology. 96:223-239. Mähnert, P., M. Heiermann, and B. Linke. 2005. Batch and semi-continuous biogas
production from different grass species. Agricultural Engineering International:
the CIGR Ejournal. VII:Manuscript EE 05 010 Mandl, M. 2003. Green Biorefinery Austria. A Report: An integrated decentralised
and sustainable technological system for the utilisation of green biomass. Joanneum Research Institute of Energy Research. Vienna. http://www.joanneum.at/
Mandl, M. 2010. Status of green biorefining in Europe. Biofuels, Bioproducts and
Biorefining. 4:268-274. Mathijs, E. 2003. Social capital and farmers’ willingness to adopt countryside
stewardship schemes. Outlook on Agriculture. 32:13–16 Mc Eniry, J., P. O'Kiely, N.J. Clipson, P.D. Forristal, and E.m. Doyle. 2007. The
relative impacts of wilting, chopping, compaction and air infiltration on the conservation characteristics of ensiled grass. Grass and Forage Science,. 62:470–484.
McGrath, D. 1991. Grass as a source of fermentable carbohydrate for ethanol production. Irish Journal of Agricultural Research. 30:121-128.
Moore, K.J., L.E. Moser, K.P. Vogel, S.S. Waller, B.E. Johnson, and J.F. Pedersen. 1991. Describing and quantifying growth stages of perennial forage grasses. Agronomy Journal. 83:1073-1077.
Morgan, M.F. 1941. Chemical soil diagnosis by the Universal Soil P Testing System. Bull. 450. Connecticut Agric. Exp. Stn., NewHaven.
Mosquera-Losada, M.R., A. Gonzalez-Rodriguez, and A. Rigeiro-Rodriguez. 2000. Sward quality affected by different grazing pressures on dairy systems. Journal of
Range Management. 53:603-611. Mulqueen, J., M. Rodgers, and H. Bouchier. 1999. Land Application of Organic
Manures and Silage Effluent In: End of Project Reports Project No. 4025. Teagasc Research Centre, Athenry, Co. Galway.
Murphy, J.D., and N.M. Power. 2008. An argument for using biomethane generated from grass as a biofuel in Ireland. Biomass and Bioenergy. 33:504-512.

References
184
Neureiter, M., H. Danner, S. Fruhauf, S. Kromus, C. Thomasser, R. Braun, and Nardoslawsky M. 2004. Dilute acid hydrolysis of presscake from silage and grass to recover hemicellulose-derived sugars. Bioresource-Technology. 92:21-29.
Nizami, A.S., N.E. Korres, and J.D. Murphy. 2009. Review of the integrated process for the production of grass biomethane. Environmental Science and Technology . 43:8496-8508.
Nyfeler, D., O. Huguenin-Elie, M. Suter, E. Frossard, J. Connolly, and A. Lüscher. 2009. Strong mixture effects among four species in fertilized agricultural grassland led to persistent and consistent transgressive over yielding. Journal of Applied
Ecology. 46:683–691. O’ Connell, K. 2005. Environmentally sustainable fertiliser nitrogen management
practices for pasture production. Faculty of Science and Agriculture, School of Agriculture and Food Science. PhD. The Queens University, Belfast.
O’ Connell, K., J. Humphreys, and C.J. Watson. 2004. Quantification of Nitrogen Sources for Grassland. Winter Scientific Meeting, The Fertiliser Association of Ireland. 40;15–28.
O’ Keeffe, S., R.P.O. Schulte, S. Lalor, P. O’Kiely, and P.C. Struik. submitted c. Green biorefinery (GBR) scenarios for a two cut silage system: Investigating the impacts of sward botanical composition and N fertilisation rate on GBR profitability and price offered to farmers.
O’ Keeffe, S., R.P.O. Schulte, P. O'Kiely, and P.C. Struik. submitted a. Grass biomass scenarios for an Irish Green Biorefinery blueprint; under a two-cut silage system.
O’ Keeffe, S., R.P.O. Schulte, Sanders J., and P.C. Struik. submitted b. Scenarios for an Irish Green Biorefinery - Development of a blueprint.
O’ Keeffe, S., R.P.O. Schulte, and P.C. Struik. 2009. Alternative use of grassland biomass in Ireland: Grass for biorefinery. In:B. Cagaš, R. Macháč, and Nedělník J (ed.).Grassland Science in Europe.14: 297-313.
O’ Kiely, P., D. Forristal, and B. Hamilton. 2004 Grass and maize silages in Ireland. unpublished. Teagasc, Beef Research Centre,Grange, Dunsany, Co. Meath.
O’ Kiely, P., K. McNamara, P.D. Forristal, and J. Lenehan. 2000. Grass silage in Ireland Farm and Food Winter. 33:8.
O’ Kiely, P., R. Power, and C.O. Donnell. 1993. Grass conservation, storage and feeding in Ireland Farm and Food. 3(1):4-7.
O’ Kiely, P., and R.K. Wilson. 1991. Comparison of three silo types used to study in-silo processes. Irish Journal of Agricultural Research,. 30:53–60.
O’ Kiely P., Power R., and C.O. Donnell. 1993. Grass conservation, storage and feeding in Ireland. Farm and Food. 3 January/March:4-8.
O’ Mara, F. 2008. Country Pasture/ Forage resource profile, Ireland. Teagasc. http://www.fao.org/ag/AGP/AGPC/doc/Counprof/Ireland/Ireland.htm

References
185
O’ Riordan, E.G., P. O'Kiely, and M.G. Keane. 1998. Efficient beef production from grazed pasture. In Teagasc End of Project Reports. Project no. 4281. Teagasc.
Overend, R.P. 1982. The average haul distance and transportation work factors for biomass delivered to a central plant. Biomass. 2:75-79.
Patterson, D.C., and N. Walker. 1979. The use of effluent from grass silage in the diet of finishing pigs II. Assesment of nutritive value of fresh and stored effluent. Animal Feed Science and Technology. 4: 275--293.
Peeters, A. 2004. Wild and Sown Grasses. Profiles of a temperate species selection: ecology, biodiversity and use. Food and Agriculture organisation of the United Nations. Blackwell publishing, Rome.
Peeters, A., and C. Decamps. 1994. Yield and quality of secondary grasses compared to ryegrass and timothy (1991-1993). In Rapport d'essais, p. 20: Laboratoire d'Ecologie des Prairies,. Université Catholique de Louvain, Louvain la Neuve, Belgium.
Pizarro, E.A., and D.B. James. 1972. Estimates of repiratory rates and losses in cut swards of Lolium perenne (S321) under simulated hay making conditions. Journal
of British Grassland Society. 27:17-21. Poliafiaco, M., and J. Murphy. 2007. Anaerobic Digestion: Decision Support
Software. Dept of Civil, Strucutural and Environmental Engineering Institute of Technology, Cork. Masters Degree in Engineering.
Popa-CTDA. 2005. Policy pathways to promote the development and adoption of cleaner technologies, Instrument: STREP. Thematic Priority 8.1, policy-oriented research (SSP), FP6-2002-SSP-1. Deliverable WP2: Barriers and drivers to innovation. Case study "Biorefinery combined with biogas" Austrian Academy of Sciences.
Prochnow, A., M. Heiermann, M. Plöchl, B. Linke, C. Idler ,T. Amonb, and P.J. Hobbs. 2009. Bioenergy from permanent grassland – A review: 1. Biogas. Bioresource Technology. 100:4931-4944.
Ranfft, K. 1973. Determination by gas chromatography of short chain fatty acids in ruminal fluids. Archives Tierernahrung. 23:343-352.
Reimann, W. 2006. Downstreaming of Lactic acid from hydrolysate of rye after fermentation. Agricultural Engineering International: the CIGR EJournal. VIII:Manuscript FP 06 003.
Ricci, A., F. Favati, R. Fiorentini, L. Massignan, and G. Andrich. 1989a. Energy evaluation of squeezing pretreatment in wet green crop dehydration. In: F. Favati, (ed.). 3rd International Conference on Leaf Protein Reserach LEAF-PRO Special Issue Italian Journal of Food Science, Pisa, Perugia, Viterbo, Italy.
Ricci, A., F. Favati, L. Massignan, R. Fiorentini, and R. Ficcanterri. 1989b. Energy

References
186
evaluation of a conventional wet green crop fractionation process. In: F. Favati, (ed.). 3rd International Conference on Leaf Protein Reserach LEAF-PRO Special Issue Italian Journal of Food Science, Pisa, Perugia, Viterbo, Italy.
Rook, A.J., B. Dumont, J. Isselstein, K. Osoro, M.F. WallisDeVries, G. Parente, and J. Mills. 2004. Matching type of livestock to desired biodiversity outcomes in pastures – a review. Biological Conservation. 119:137-150
Sanders, J. 2005. Biorefinery, the Bridge between agriculture and chemistry. In: Abstracts of the Proceedings of the 14th European Biomass Conference, Paris, France.
Sanders, J. (Unpublished). Large scale industrial biorefining of leave materials, An economic review. Wageningen UR.
Schulte, R.P.O., J. Diamond, K. Finkele, N.M. Holden, and A.J. Breereton. 2005. Predicting the soil moisture conditions of Irish grasslands. Irish journal of
Agricultural and Food Research 44:95-110. SEAI (Sustainable Energy Authority Ireland). 2010. Greener home scheme. Accessed
03/ 2010, http://www.seai.ie/Grants/GreenerHomes/ SEI (Sustainable Energy Ireland). 2008. Understanding Electricity & Gas Prices in
Ireland. Energy Policy Stastical Support Unit. Sheldrick, R.D., R.H. Lavender, and T.M. Martyn. 1990. Dry matter yield and
response to nitrogen of an Agrostis stolonifera-dominant sward. Grass and Forage
Science. 45:203-213. Shrestha, S., T. Hennessy, and S. Hynes. 2007. The effect of decoupling on farming in
Ireland: A regional analysis. Irish Journal of Agricultural and Food Research.
46:1–13. Singh, A., B.M. Smyth, and J. Murphy. 2010. A biofuel strategy for Ireland with an
emphasis on production of biomethane and minimization of land-take. Renewable
and Sustainable Energy Reviews. 14:277-288. Smyth B. 2007. Optimal biomass technology for the production of heat and power.
Sustainable Energy.Department of Civil and Environmental Engineering. National University of Ireland, Cork. Masters in Engineering science in sustainable energy.
Smyth M. B., J.D. Murphy, and O' Brien C.M. 2009. What is the energy balance of grass biomethane in Ireland and other temperate northern European climates? Renewable and Sustainable Energy Reviews. 13:2349-2360.
Starke, I., A. Holzberger, B. Kamm, and E. Kleinpeter. 2000. Qualitative and quantitative analysis of carbohydrates in green juices (wild mix grass and alfalfa) from a green biorefinery by gas chromotography/ mass spectrometry. Journal of
Analytical Chemistry. 367:65-72. Steen, R.W.J. 1986 An evaluation of effluent from grass silage as a feed for beef cattle
References
187
offered silage-based diets. Grass and Forage Scienc. 41 39-45. Steinmüller, H. 2007. The Austrian Green Biorefinery. In Presentation at the
Energieinstitut at the Johannes Kepler Universität Linz. Styles, D., F. Thorne, and M.B. Jones. 2008. Energy crops in Ireland: An economic
comparison of Willow and Miscanthus production with conventional farming systems. Biomass and Bioenergy. 32;407–421.
Sustainable Energy Ireland, S.E.I. 2004. Bioenergy in Ireland. A Strategic Report of the Bioenergy Group for the Depart for the Department of Communications, Marine and Natural Resources.
Teagasc. 2009. Situation and Outlook in Irish Agriculture Mid Year Update. Rural Economy Research Centre(RERC), Teagasc, Athenry, Co. Galway.
Thang, V.H., W. Koschuh, K.D. Kulbe, S. Kromus, C. Krotscheck, and S. Novalin. 2004. Desalination of high salt content mixture by two- stage electrodialysis as the first step of seperating valuable substances from grass silage. Desalination.
162:343-353. Thang, V.H., and S. Novalin. 2008. Green Biorefinery:Seperation of lactic acid from
grass silage juice by chromatography using neutral polymeric resin. Bioresource
Technology. 99:4368-4379. Thang, VH.., W. Koschuh, and S. Novalin. 2005. Electrodialysis versus
chromatography for desalting silage juice: Comparison of both processes with regard to energy consumption. Journal of Membrane Science. 256:78–88.
Thomas, T.A. 1977. An automated procedure for the determination of soluble carbohydrates in herbage. Journal of the Science of Food Agriculture. 12:639-642
Thomsen M. H. 2005. Complex media from processing of agricultural crops for microbial fermentation. Applied Microbiology and Biotechnology. 68:598-606.
Thomsen, M.H. 2004. Lactic acid fermentation of brown juice in the green crop drying factory. PhD. Department of Biochemistry and Molecular Biology University of Southern Denmark.
Thomsen, M.H., D. Bech, and P. Kiel. 2004. Manufacturing of stabilised brown juice for L- lysine production- from university lab scale over pilot scale to industrial production. Chemical and Biochemical Engineering Quaterly. 18:37-46.
Thomsen, M.H., and J.P. Guyout. 2007. Batch fermentations on synthetic mixed sugar and starch medium with amylolytic lactic acid bacteria. Applied Microbiology
Biotechnology. 74:540-546. Tilman, D., J. Hill, and Lehman C. 2006. Carbon-negative biofuels from low-input
high-diversity grassland biomass. Science. 314:1598-1600. Tonn, B., U. Thumm and W. Claupein. 2010. Semi-natural grassland biomass for
combustion: influence of botanical composition, harvest date and site conditions on

References
188
fuel composition. Grass and Forage Science. In press: DOI:10.1111/j.1365-2494.2010.00758.x.
Turner LB, Humphreys MO, Cairns AJ, Pollock CJ. 2002. Carbon assimilation and partitioning into non-structural carbohydrate in contrasting varieties of Lolium perenne. Journal of Plant Physiology 159, 257-263.
Van Den Berg, J., and L. Rademakers. 2007. Salzburg AG opens biomethane gas stations in Austria: driving on pure grass. Biopact.com http://biopact.com/2007/11/salzburg-ag-opens-biomethane-gas.html.
Van Soest, P.J. 1963. Use of detergents in the analysis of fibrous feeds II. A rapid method for the determination of fiber and lignin. Journal of Association of Official
Analytical Chemists. 46:829-835. Van Soest, P.J., D.R. Mertens, and B. Deinum. 1978. Preharvest factors influencing
quality of conserved forage. Journal of Animal Science. 47:712-720. Walla, C., and W. Schneeberger. 2005. Farm biogas plants in Austria –An economic
analysis. In Raum. M., Hofreither, K. Pistrich, F., Sinabell, O. Tamme, and H.K. Wytrzens, (ed.). Dokumentation der 13. ÖGA-Jahrestagung. Europäische Integration-Chancen und Risiken für den Ländlichen., Ljubljana/Domzale (Slovenia) Facultas Verlag, Vienna pp. 107-120.
Watcher, B., M. Mandel, H. Boechzelt, H. Schnitzer, S. Kromus, and M. Nardoslawsky. 2003. Report: Green Biorefinery Austria, An Integrated and sustainable technology system for utilisation of green biomass. Joanneum Institute of Sustainable Techniques and Systems.
Wiedemann, K. 2008. Grass instead of Oil. In Neue Energie: Das Magazine für erneurbare energien. Vol. 2. http://www.newenergy.info/index.php?id=1690
Wilman, D., and J.A. Riley. 1993. Potential nutritive value of a wide range of grassland species. Journal of Agricultural Science (Camb.). 120:43-49.
Wilman, D., Y. Gao, and M.A.K. & Altimimi. 1996. Differences between related grasses, times of year and plant parts in digestibility and chemical composition. Journal of Agricultural Science (Camb.). 127:311-318
Wilson, R.K., and D.P. Collins. 1980. Chemical composition of silages made from different grass genera. Irish Journal of Agricultural Research. 19:75-84.
Zemenchik, R.A., K.A. Albreacht, and R.D. Shaver. 2002. Improved nutritive value of Kura clover- and Birdsfoot Trefoil-grass mixtures compared with grass monocultures. Agronomy Journal. 94:1131-1138.

189
Summary

Summary
190
Summary
Grass is Ireland’s most readily available biomass and to date has been predominantly used as forage for animal production systems. However, substantial destocking of grasslands has been predicted in the next decade, due to pressures from both Common Agricultural Policy reforms (decoupling EU agricultural subsidies from production systems) and the Nitrates directive (91/676/EEC). This will potentially result in surplus grass biomass and unutilised grasslands. With the EU promoting a “biobased economy” under the Biofuel Directive (2003/30/EEC), the focus has been diverted from traditional uses of biomass and triggered investigations into the alternative uses. In Ireland, due to the potential of surplus and readily available grass biomass, investigations have been focused on alternative grassland uses. The potential of grass as a “bioresource” to be used in a Green biorefinery system to produce industrial type products was the focus of this research study. The basic principals of Green biorefinery are to separate the green biomass (grass and silage) into its constituent parts, the solid fraction (press cake) and the liquid fraction (press juice). The press cake contains the solid fibre parts or the low value, high volume fraction. The press juice essentially contains all the high-value products, but in low volumes; for this reason, these high-value products, such as amino acids and lactic acids, are difficult to isolate; however, extraction methods and technologies are still developing. The overall objectives of this study were to assess if Green biorefinery could be an alternative use of Irish grasslands. The initial phase of the project was to assess what robust and basic technologies were available to make products from grass or silage in the short-mid-term (5-10 years). This allowed for the development of a Green biorefinery blueprint, which was then used as an investigative framework to address the data gaps which were identified as part of the literature review, for the supply side of an Irish Green biorefinery (GBR) system. These included determining:
• The quality of grass biomass under current harvesting systems compatible with GBR technologies and that of the blueprint?
• Which feedstock system should be implemented, grass for four months of the year and silage for the rest, or silage all year round?
• How would the quality affect the profitability of the system? • Which economy of scale, decentralised or centralised? • Where would likely “hot spots” be for locating a GBR facility
The study successfully managed to provide answers for all questions.
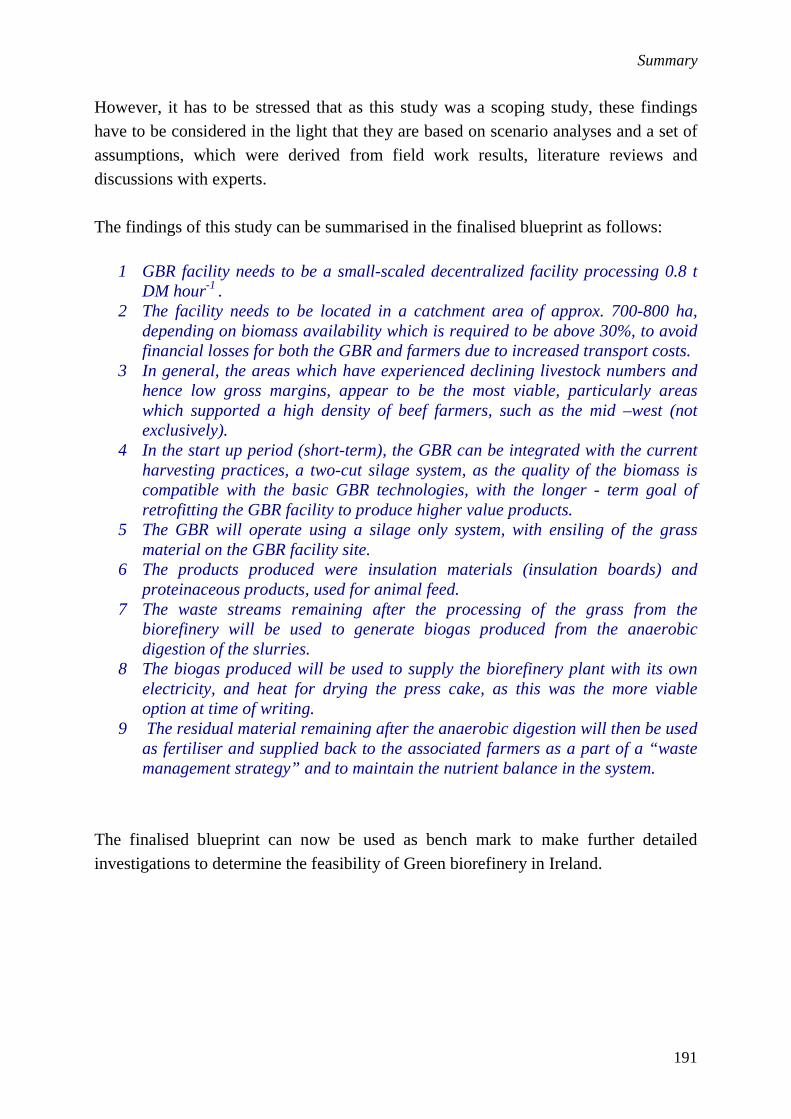
Summary
191
However, it has to be stressed that as this study was a scoping study, these findings have to be considered in the light that they are based on scenario analyses and a set of assumptions, which were derived from field work results, literature reviews and discussions with experts. The findings of this study can be summarised in the finalised blueprint as follows:
1 GBR facility needs to be a small-scaled decentralized facility processing 0.8 t DM hour-1 .
2 The facility needs to be located in a catchment area of approx. 700-800 ha, depending on biomass availability which is required to be above 30%, to avoid financial losses for both the GBR and farmers due to increased transport costs.
3 In general, the areas which have experienced declining livestock numbers and hence low gross margins, appear to be the most viable, particularly areas which supported a high density of beef farmers, such as the mid –west (not exclusively).
4 In the start up period (short-term), the GBR can be integrated with the current harvesting practices, a two-cut silage system, as the quality of the biomass is compatible with the basic GBR technologies, with the longer - term goal of retrofitting the GBR facility to produce higher value products.
5 The GBR will operate using a silage only system, with ensiling of the grass material on the GBR facility site.
6 The products produced were insulation materials (insulation boards) and proteinaceous products, used for animal feed.
7 The waste streams remaining after the processing of the grass from the biorefinery will be used to generate biogas produced from the anaerobic digestion of the slurries.
8 The biogas produced will be used to supply the biorefinery plant with its own electricity, and heat for drying the press cake, as this was the more viable option at time of writing.
9 The residual material remaining after the anaerobic digestion will then be used as fertiliser and supplied back to the associated farmers as a part of a “waste management strategy” and to maintain the nutrient balance in the system.
The finalised blueprint can now be used as bench mark to make further detailed investigations to determine the feasibility of Green biorefinery in Ireland.

192

Summary
193
Samenvatting

Samenvatting
194
Samenvatting
In Ierland is grasland de belangrijkste vorm van bodemgebruik in de landbouw en gras is een vorm van biomassa die in ruime mate voorradig is. Tot nu toe is gras vooral benut als ruwvoer voor de veehouderij. Het lijkt er echter op dat de veedichtheden in het komende decennium aanzienlijk zullen afnemen, onder druk van de hervormingen van het landbouwbeleid van de EU (vooral de ontkoppeling van landbouwsubsidies en productie) en de Nitraatrichtlijn (EU-directive 91/676/EEC). Mogelijk gaat dit leiden tot een overschot aan biomassa uit gras en extensiever gebruik van grasland. Nu de EU met zijn biobrandstofrichtlijn (EU-directive 2003/30/EEC) sterk inzet op een economie gebaseerd op groene grondstoffen verschuift de aandacht van de traditionele benutting van biomassa naar mogelijkheden van alternatief gebruik en wordt het onderzoek naar deze mogelijkheden gestimuleerd. Voor Ierland betekent dit vooral onderzoek naar alternatieve vormen van graslandbenutting aangezien voor biomassa uit gras mogelijk een overschot gaat ontstaan en gezien het feit dat deze vorm van biomassa eenvoudig beschikbaar is. Dit onderzoek richtte zich op de potentie van gras als een bron van biomassa voor een “Groene Bioraffinage” waarbij industriële producten worden gemaakt. Bij Groene Bioraffinage wordt in een cascade groene biomassa (in de vorm van vers gras of silage) gescheiden in een vaste fractie (de perskoek) en een vloeibare fractie (het perssap). In de perskoek zitten de vaste componenten (voornamelijk vezel); het gaat hier om een groot aandeel van de oorspronkelijke biomassa maar ook om een component van relatief geringe waarde. In het perssap zitten, in kleine hoeveelheden, de meest waardevolle bestanddelen, zoals aminozuren en melkzuur. Vanwege hun geringe hoeveelheden is het niet eenvoudig deze componenten te winnen, maar de daarvoor benodigde extractiemethoden en technologieën zijn nog steeds in ontwikkeling. Het uiteindelijke doel van deze studie was vast te stellen of bioraffinage van gras een alternatieve vorm van graslandbenutting in Ierland kon zijn. In de eerste fase van het onderzoek werd nagegaan welke robuuste en basale technologieën er beschikbaar waren om op de korte tot middellange termijn (5-10 jaar) producten te maken uit gras of silage. Deze onderzoeksfase maakte het mogelijk om tot een blauwdruk te komen voor Groene Bioraffinage (GBR). Deze blauwdruk werd vervolgens gebruikt als een raamwerk voor het verdere onderzoek naar de grondstofproductie voor een Ierse Groene Bioraffinage dat er op gericht was de kennisleemten die op basis van literatuuronderzoek aan de dag waren gekomen, op te vullen. De kennisleemten omvatten ondermeer:

Samenvatting
195
• Is de kwaliteit van het gras bij huidige oogstregimes verenigbaar met de GBR technologieën en in overeenstemming met de kwaliteit zoals aangenomen in de blauwdruk?
• Hoe dient het gras aangevoerd te worden? Als vers gras gedurende het oogstseizoen en als silage gedurende de rest van het jaar, of gedurende het gehele jaar als silage?
• Wat is het verband tussen de kwaliteit van het gras en de rentabiliteit van de GBR?
• Voor welke operationele schaal moet worden gekozen? Moet de verwerking decentraal of centraal?
• Wat zijn de beste locaties voor GBR installaties? Het proefschrift weet op al deze vragen een bevredigend antwoord te leveren. Het dient echter benadrukt te worden dat deze studie vooral verkennend was. De resultaten zijn immers gebaseerd op scenarioanalyses en dus op een verzameling van aannames gebaseerd op veldonderzoek, literatuurstudie en discussies met deskundigen. De resultaten van deze studie kunnen worden samengevat in de bewerkstelligde blauwdruk. De meest saillante punten daaruit zijn:
1. Een GBR installatie moet kleinschalig en decentraal zijn met een
verwerkingscapaciteit van 0,8 ton droge stof per uur.
2. De installatie moet worden geplaatst in een voedingsgebied van 700-800 ha,
afhankelijk van de beschikbaarheid van biomassa. Deze beschikbaarheid dient
meer dan 30% te zijn omdat anders zowel de afnemer als de boeren verlies
gaan leiden door te hoge transportkosten.
3. De beste locaties zijn gelegen in die gebieden waar de veedichtheid aan het
afnemen is en waar de marges in de veehouderij klein zijn. Het gaat hier
vooral (maar niet uitsluitend) om gebieden met een lage dichtheid aan
melkveehouderijen, zoals in het mid-westen van Ierland.
4. Op de korte termijn (in de opstartfase) kan de GBR geïntegreerd worden met
de huidige oogstpraktijken. Het betreft een systeem met twee keer maaien per
jaar. Dergelijke systemen leveren biomassa van een kwaliteit die past bij de
basale GBR technologie. Op de lange termijn moet dan de GBR installatie
zodanig verfijnd kunnen worden dat er ook meer hoogwaardige producten mee
gecoproduceerd kunnen worden.
5. De bioraffinage vindt plaats op basis van silage. Inkuilen gebeurt op de locatie

Samenvatting
196
van de GBR installatie.
6. De productie bestaat uit isolatiematerialen en eiwitproducten voor de
veehouderij.
7. De afvalstromen die overblijven na het verwerken van het gras in de GBR
zullen worden gebruikt om biogas te generen op basis van anaerobe afbraak
van de slurries.
8. Het geproduceerde biogas zal worden benut om de bioraffinaderij van zijn
eigen elektriciteit te voorzien en warmte te leveren voor het drogen van de
perskoek. Op het moment van schijven van dit proefschrift was dat de meest
levensvatbare optie.
9. Het restmateriaal dat overblijft na de anaerobe afbraak zal dan worden benut
als meststof en worden teruggeleverd aan de betrokken boeren als onderdeel
van een afvalstoffenbeheersysteem, maar ook om de nutriëntenbalans van het
systeem te handhaven .
10. De kapitaalkosten van een dergelijke GBR worden geschat op ongeveer 7
miljoen euro. De scenarioanalyses geven daarbij aan dat voor het opzetten van
een dergelijke GBR installatie minimaal 9-11% overheidssteun nodig is.
De voltooide blauwdruk kan nu worden gebruikt als een referentiepunt om verder gedetailleerd onderzoek te verrichten naar de haalbaarheid van Groene Biorafinnage in Ierland.

Samenvatting
197
Acknowledgements

Samenvatting
198
Acknowledgements
A road walked alone can seem like an endless journey, one walked with company, passes much quicker, “giorraíonn beirt bother”. This is the way with PhDs and I am glad of the company I was so fortunate to have kept during my journey. First I would like to thank all my supervisors, for their support, kindness and their belief in my capabilities to accomplish this PhD, although sometimes this may have been truly tested. Rogier, thank you for granting me the opportunity to research in Johnstown Castle, it has been an amazing and challenging experience. I also want to thank you for being so relaxed, upbeat and helping me to focus when required, gain strength as a modeller and when necessary phrase my ramblings that bit more eloquently. The “fluffy hippy” thoughts I think are a bit more scientific now, Thank you☺! Padraig a big thank you for all your advice and for your help to overcome some initial hiccups, you were always ready to provide help whenever needed and through your often quite challenging feedback, I have learnt a great deal -Thank you ☺! Paul, a sincere and heartfelt thank you ☺!! You have always been so understanding and had so much patience with me, you were able to take the barrage of questions and you were particularly patient in waiting for my ideas to take constructive form. You always made the time to help me with whatever questions I had, particularly in the last six weeks and most importantly, you always knew when to deliver a reassuring smile. To all three supervisors, I have learnt a lot and grown not just as a researcher, but as person too and for this I am indebted to you all. THANK YOU!!! ☺ Furthermore, I would like to thank the many people in Teagasc, without their help this thesis would never have been completed. Thank you to the staff in Grange, Nora, Paddy, Noel, Michael and Anne, who instantly made me feel at home, when I took up residency in the Grange labs. Thanks a million to Belinda, Gabby and Pascal, who made filling and emptying the lab silos that little bit easier. A great big thank you to all the staff of Johnstown Castle, whose great support, help and encouragement often gave me a well needed lifeline, what a truly great and colourful place to work, too many to mention you all, but thanks to each and everyone of you. But I would particularly like to thank John Murphy for all the endless driving, cutting and craziness of the “Irish tours” in the summers 2007 and 2008. I thankfully now remember to turn off the radio when the car is stopped! To the summer students who helped with the craziness, Tom Wallace and Kevin Murphy, who made travelling the countryside much more fun! To Liam Gaul and Nick Kinsella, who always helped

Samenvatting
199
me process the numerous sample loads so rapidly. To Eddie, for always being so patient with me and helping me with the GIS stuff! To Joe Caesar, thank you, for always looking out for us “Brats,” you made those long evenings seem much shorter and saved us from being “depressed and broken”! I would like to also thank Cathal O’ Donoghue, Teagasc Athenry and Stephen Hynes, NUIG, for their help with the socio-economic aspects of the project and for tolerating the multitude of questions I had. I would also like to thank Stuart Green of Teagasc, Kinsealy, who provided me with GIS data files and was so helpful. Further, I would like to acknowledge the people in the Department of Plant Sciences of Wageningen University. Thank you Wampie and Sjanie, Gijsbertje, Sjaak and Sander for all your help and making my stay in Wageningen that bit easier, you are life savers! I would also like to thank Edwin Keijsers and Johan Sanders for their time and help on a number of biorefinery issues. To the many friends, I have made along the way and will hopefully keep well into the future: I could not have finished this journey without your friendship! Stan, you pulled me out of my jumper from day one and you kept my head above water ever since, thanks “Ted”. Laura, for your amazing combination of high powered statistics and girlie gossips, a very interesting combination and one I am thankful for. I want to thank all the lads for the much needed hugs, tea breaks and for listening to my crazy grass rants and for always making me laugh at my ridiculousness, during these past few years. Gaelene and Norma for your little wisdoms, Alina for your craziness, Rochelle for your positiveness and wine dinners, Xiaoyun for your amazing cooking, Conor for being so relaxed all the time, Anne Bailey for your enthusiasm. Niamh for your contagious laugh and dramatic spirit, Sarah Mcmusic for just being you, young Selbie of equal mind set, Dominika, Mairead and Fred for all the craic and mayhem, St Paddy’s day will never be the same again!. Alberto and Peter for your insights and hilarious expressions. Alvaro, Yael, Coen Alex and Momo my Holland lifeline, whose friendship meant so much, particularly in the last month, thank you all! Fiona, you have been my rock, your never ending support, encouragement, little surprises and your unfortunate Mullingar birthright got me through so many times! Niki your support, surprises, thoughtfulness and generally just being you, were just what the doctor ordered! To the old crew, Fin and Maria, thank you for the

Samenvatting
200
sidesplitting laughter and for listening to my rants. To my “Dutch” mother Anne, I will never be able to repay the kindness you have shown me over these last four years and for always being so warm, vibrant, welcoming, supportive and for housing me more then once .Thank you from the bottom of my heart!! Brian, thank you for all the Utrecht excursions and for being a good friend! To my family, my cousin Deirdre, who allowed me invade her humble abode for several months, thank you so much for your hugs and support boss! (and for not killing me when the boiler blew up!). To my uncle Tom and aunty Brenda, who always made me feel welcome during my tours. To my aunty Marie, who made one long road trip particularly interesting, thank you for coming (the shops didn’t know what hit them)! Last, but most of all never least, to the most important people in my life, to those who have walked every step of the way with me, my family. Jane, Charlie and Cormac, with your warmth, fun, craziness (which always made me feel saner, that will tell you how crazy ye are lads!), laughter, love and encouragement, I always found the strength and courage to face and solve whatever problems arose. Thank you for holding my hand and lifting my heart!
“Ní heolas go haontios”
Go raibh mile maith agaibh

Samenvatting
201
Curriculum Vitae Sinéad M. O’ Keeffe was born in Cork, Ireland, on the 11th of August 1982 in Cork, Ireland. She attended the Mallow convent of Mercy sister’s primary and secondary schools, St. Mary’s, from 1987-1995. She obtained her bachelor in environmental science with first class honours from the University of Limerick in 2005. In September 2006 she was employed as a Walsh Fellow at the Johnstown Castle Research centre in Wexford, Ireland where she carried out PhD research within the framework of the C.T. de Wit Graduate School for Production Ecology and Resource Conservation of Wageningen University, Wageningen, the Netherlands.

Samenvatting
202
PE&RC PhD Education Certificate With the educational activities listed below the PhD candidate has complied with the educational requirements set by the C.T. de Wit Graduate School for Production Ecology and Resource Conservation (PE&RC) which comprises of a minimum total of 32 ECTS (= 22 weeks of activities) Review of literature (6 ECTS) Alternative use of grassland biomass in Ireland: Grass for Biorefinery; In Grassland
Science in Europe (2009) Writing of project proposal (4.5 ECTS) Alternative use of grassland biomass in Ireland: Grass for Biorefinery Laboratory training and working visits (4.5 ECTS) Forage quality analysis; 4 months; Grange Animal & Grassland Research and Innovation Centre (2008) Deficiency, refresh, brush-up courses (3 ECTS) Basic statistics and SAS (2008) 1 Day writing course (2009) Presentation skills (2009) Competence strengthening / skills courses (3.5 ECTS) GIS Programme, online course; University of Limerick, Ireland (2006/2007) Mixed linear model course; WUR (2009) Economics of process engineering; WUR (2009) Discussion groups / local seminars / other scientific meetings (7.5 ECTS) Scientific discussion seminars; Teagasc Johnstown Castle (2007-2010) Agricultural Research Forum; Tullamore and Belfast (2008, 2010) Journal Club (discussing scientific papers); Johnstown Castle (2008-2010) International symposia, workshops and conferences (4 ECTS) European Biorefinery symposium; Flensburg, Germany (2008) European Grassland Federation; Bruno, Czech Republic (2009)

Samenvatting
203

Samenvatting
204

Samenvatting
205

Samenvatting
206